Attached files
| file | filename |
|---|---|
| 8-K - FORM 8-K - Veritiv Corp | v388824_8k.htm |

Veritiv Corporation KeyBanc Capital Markets Basic Materials & Packaging Conference September 10, 2014 Exhibit 99.1

Veritiv Corporation UBS Global Paper & Forest Products Conference September 11, 2014

Safe Harbor Provision Certain statements contained in this presentation regarding Veritiv Corporation’s (the “Company”) future operating results, performance, business plans, prospects, guidance and any other statements not constituting historical fact are “forward - looking statements” subject to the safe harbor created by the Private Securities Litigation Reform Act of 1995 . Where possible, the words “believe,” “expect,” “anticipate,” “intend,” “should,” “will,” “would,” “planned,” “estimated,” “potential,” “goal,” “outlook,” “may,” “predicts,” “could,” or the negative of such terms, or other comparable expressions, as they relate to the Company or its management, have been used to identify such forward - looking statements . All forward - looking statements reflect only the Company’s current beliefs and assumptions with respect to future operating results, performance, business plans, prospects, guidance and other matters, and are based on information currently available to the Company . Accordingly, the statements are subject to significant risks, uncertainties and contingencies, which could cause the Company’s actual operating results, performance or business plans or prospects to differ materially from those expressed in, or implied by, these statements . Factors that could cause actual results to differ materially from current expectations include risks and other factors described in the Company’s publicly available reports filed with the SEC, which contain a discussion of various factors that may affect the Company’s business or financial results . Such risks and other factors, which in some instances are beyond the Company’s control, include : the industry - wide decline in demand for paper and related products ; procurement and other risks in obtaining packaging, paper and facility products from our suppliers for resale to our customers ; increased competition, from existing and non - traditional sources ; loss of significant customers ; successful integration of the Unisource and xpedx businesses and realization and timing of the expected synergy and other cost savings from the merger ; our ability to collect trade receivables from customers to whom we extend credit ; fuel cost increases ; inclement weather, anti - terrorism measures and other disruptions to the transportation network ; our ability to generate sufficient cash to service our debt ; our ability to comply with the covenants contained in our debt agreements ; our ability to refinance or restructure our debt on reasonable terms and conditions as might be necessary from time to time ; increasing interest rates ; foreign currency fluctuations ; changes in accounting standards and methodologies ; regulatory changes and judicial rulings impacting our business ; adverse results from litigation, governmental investigations or tax related proceedings or audits ; the effects of work stoppages, union negotiations and union disputes ; our reliance on third - party vendors for various services ; and other events of which we are presently unaware or that we currently deem immaterial that may result in unexpected adverse operating results . The Company is not responsible for updating the information contained in this presentation beyond the published date, or for changes made to this document by wire services or Internet service providers . This presentation is being furnished to the SEC through a Form 8 - K . We reference non - GAAP financial measures in this presentation . Please see the appendix for reconciliations of non - GAAP measures to the most comparable GAAP measures . 3

Mary Laschinger 4
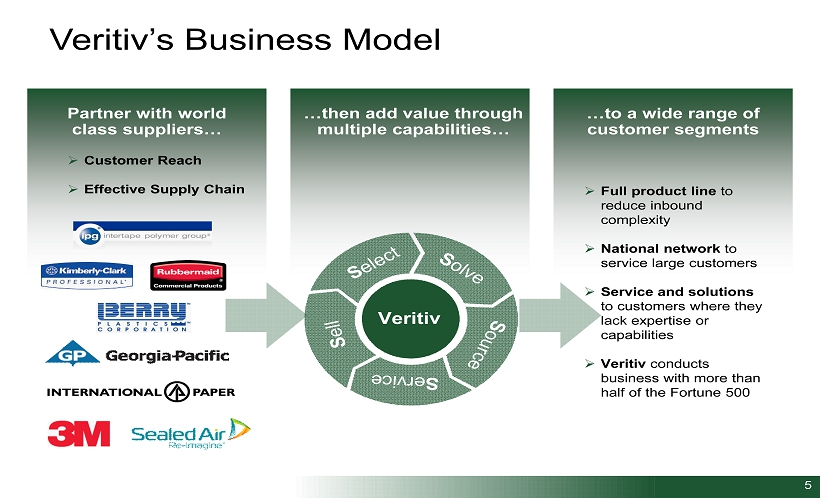
5 Veritiv’s Business Model Partner with world class suppliers… …then add value through multiple capabilities… …to a wide range of customer segments » Customer Reach » Effective Supply Chain » Full product line to reduce inbound complexity » National network to service large customers » Service and solutions to customers where they lack expertise or capabilities » Veritiv conducts business with more than half of the Fortune 500 Veritiv
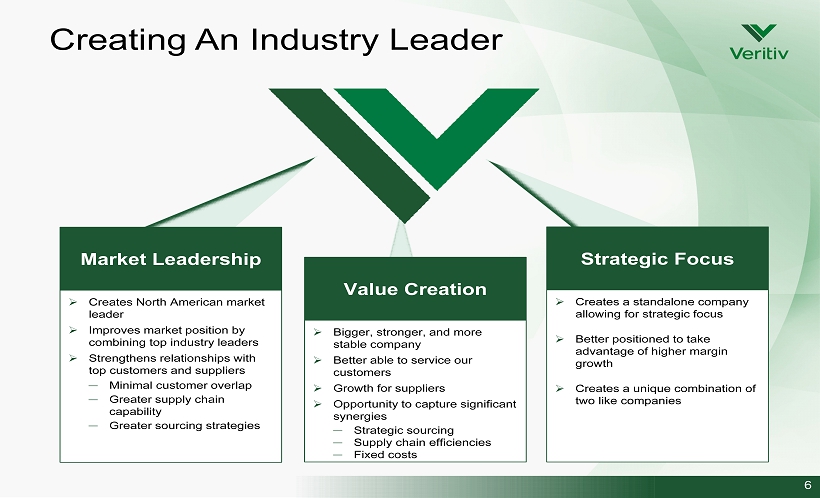
Creating An Industry Leader Market Leadership » Creates North American market leader » Improves market position by combining top industry leaders » Strengthens relationships with top customers and suppliers ─ Minimal customer overlap ─ Greater supply chain capability ─ Greater sourcing strategies 6 Strategic Focus » Creates a standalone company allowing for strategic focus » Better positioned to take advantage of higher margin growth » Creates a unique combination of two like companies Value Creation » Bigger, stronger, and more stable company » Better able to service our customers » Growth for suppliers » Opportunity to capture significant synergies ─ Strategic sourcing ─ Supply chain efficiencies ─ Fixed costs

Print Packaging Facility Solutions 7 Segments Publishing & Print Mgmt.
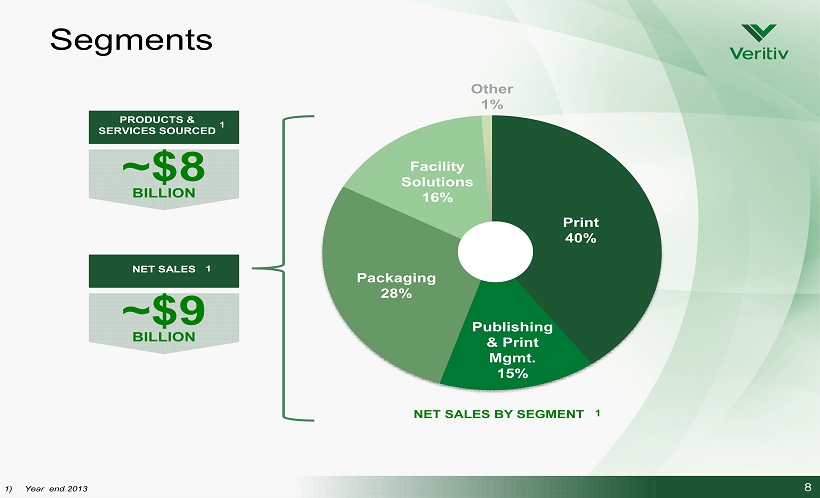
8 Segments Print 40% Publishing & Print Mgmt. 15% Packaging 28% Facility Solutions 16% Other 1% NET SALES BY SEGMENT 1 1) Year end 2013 PRODUCTS & SERVICES SOURCED ~$8 BILLION 1 NET SALES ~$9 BILLION 1 ~
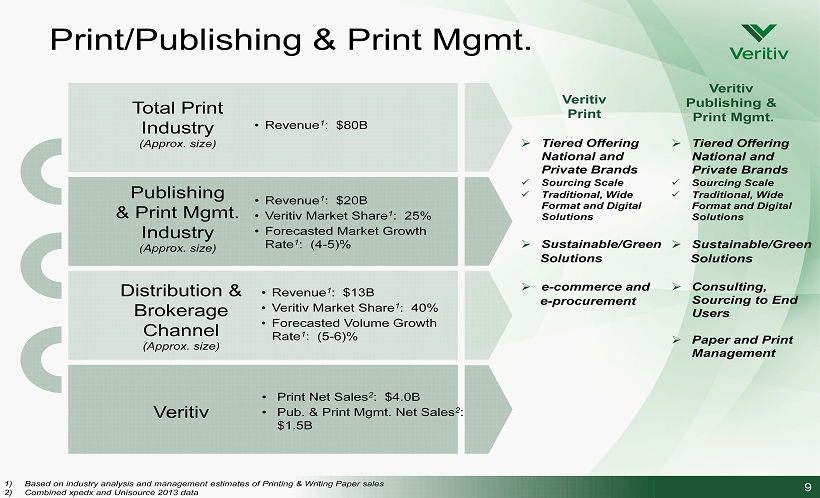
9 1) Based on industry analysis and management estimates of Printing & Writing Paper sales 2) Combined xpedx and Unisource 2013 data Print/Publishing & Print Mgmt. » Tiered Offering National and Private Brands x Sourcing Scale x Traditional, Wide Format and Digital Solutions » Sustainable/Green Solutions » e - commerce and e - procurement » Consulting, Sourcing to End Users » Paper and Print Management Veritiv Publishing & Print Mgmt. Veritiv Print • Print Net Sales 2 : $4.0B • Pub. & Print Mgmt. Net Sales 2 : $1.5B Publishing & Print Mgmt. Industry (Approx. size) • Revenue 1 : $20B • Veritiv Market Share 1 : 25% • Forecasted Market Growth Rate 1 : (4 - 5)% Distribution & Brokerage Channel (Approx. size) Veritiv • Revenue 1 : $13B • Veritiv Market Share 1 : 40% • Forecasted Volume Growth Rate 1 : (5 - 6)% Total Print Industry (Approx. size) • Revenue 1 : $80B » Tiered Offering National and Private Brands x Sourcing Scale x Traditional, Wide Format and Digital Solutions » Sustainable/Green Solutions
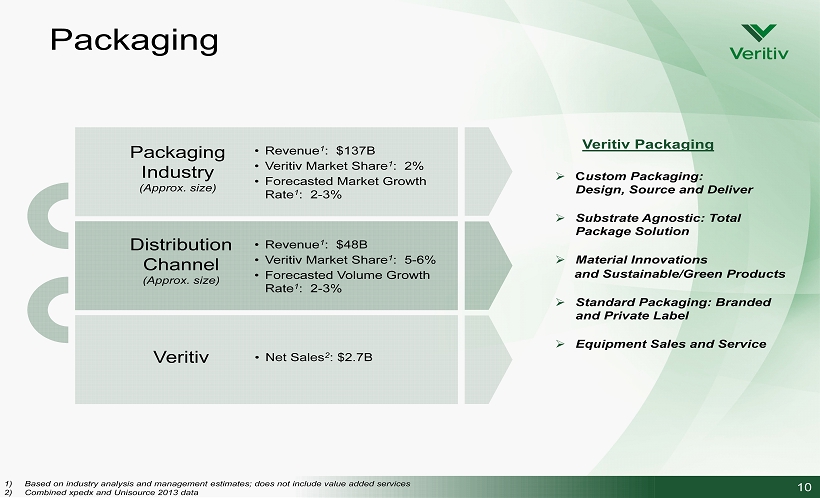
10 1) Based on industry analysis and management estimates; does not include value added services 2) Combined xpedx and Unisource 2013 data Packaging » C ustom Packaging: Design, Source and Deliver » Substrate Agnostic: Total Package Solution » Material Innovations and Sustainable/Green Products » Standard Packaging: Branded and Private Label » Equipment Sales and Service Veritiv Packaging Packaging Industry (Approx. size) Veritiv Distribution Channel (Approx. size) • Revenue 1 : $137B • Veritiv Market Share 1 : 2% • Forecasted Market Growth Rate 1 : 2 - 3% • Revenue 1 : $48B • Veritiv Market Share 1 : 5 - 6% • Forecasted Volume Growth Rate 1 : 2 - 3% • Net Sales 2 : $2.7B

11 1) Based on industry analysis and management estimates for the cleaning & mtc . (Jan/San) away from home market 2) Combined xpedx and Unisource 2013 data Facility Solutions Veritiv Facility Solutions Facility Solutions Industry (Approx. size) Veritiv Distribution Channel (Approx. size) • Revenue 1 : $61.4B • Forecasted Market Growth Rate 1 : 2 - 3% • Revenue 1 : $24B • Veritiv Market Share 1 : 4% • Forecasted Volume Growth Rate 1 : 2 - 3% • Net Sales 2 : $1.5B » Large regional / National customers supported through a multi - location supply chain » Support small businesses through redistribution » Expertise across multiple verticals » Manage and optimize spend for customers
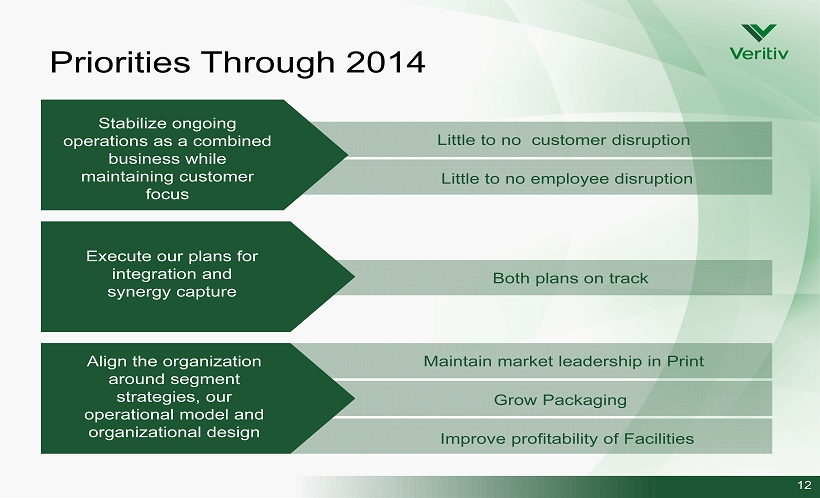
Priorities Through 2014 12 No customer disruption No customer disruption Stabilize ongoing operations as a combined business while maintaining customer focus Execute our plans for integration and synergy capture Align the organization around segment strategies, our operational model and organizational design Little to no employee disruption Both plans on track Improve profitability of Facilities Grow Packaging Maintain market leadership in Print Little to no customer disruption

Steve Smith 13

14 Limited Financial Results Veritiv Pro Forma Results • SEC registration was effective in 2Q14, but the merger occurred after the June 2Q14 end. • For accounting purposes, the merger is treated as a subsequent event in Veritiv’s 2Q14 Form 10 - Q. • 3Q14 Form 10 - Q, which we currently anticipate filing in mid - November, will include consolidated financial results for the combined company. Veritiv 2Q14 Results* • Pro Forma results for the second quarter ended June 30, 2014 : » Net sales were $2.3 billion. − Sales performed as expected − Roughly 8% decline in Print and Facility Solutions segments − Partially offset by an increase of approximately 4% in Packaging segment » Adjusted EBITDA was $37.8 million. − Results on track with our expectations − For the full year 2014, continue to expect adjusted EBITDA range of $135 million to $145 million *Please see the appendix for reconciliations of non - GAAP measures to the most comparable GAAP measures.
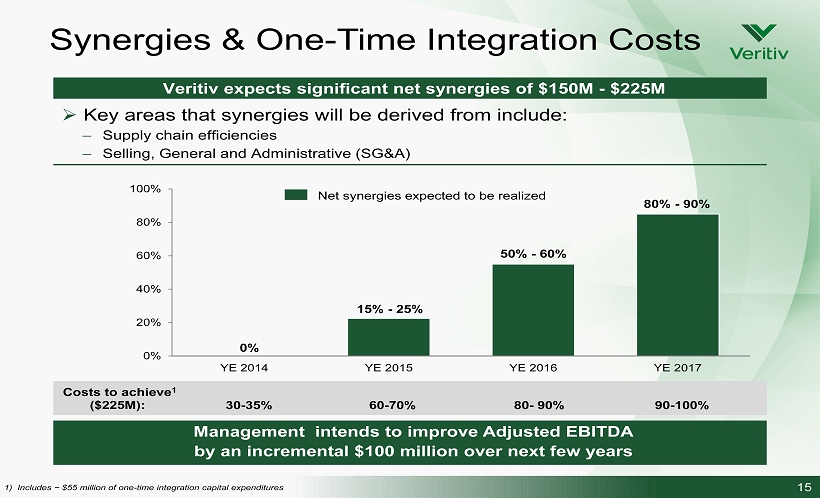
15 30 - 35% 60 - 70% 80 - 90% 90 - 100% Veritiv expects significant net synergies of $150M - $225M » Key areas that synergies will be derived from include: – Supply chain efficiencies – Selling, General and Administrative (SG&A) 0% 20% 40% 60% 80% 100% YE 2014 YE 2015 YE 2016 YE 2017 Net synergies expected to be realized 1) Includes ~ $55 million of one - time integration capital expenditures Synergies & One - Time Integration Costs 15% - 25% 50% - 60% 80% - 90% 0% Costs to achieve 1 ( $ 225M ): Management intends to improve Adjusted EBITDA by an incremental $100 million over next few years
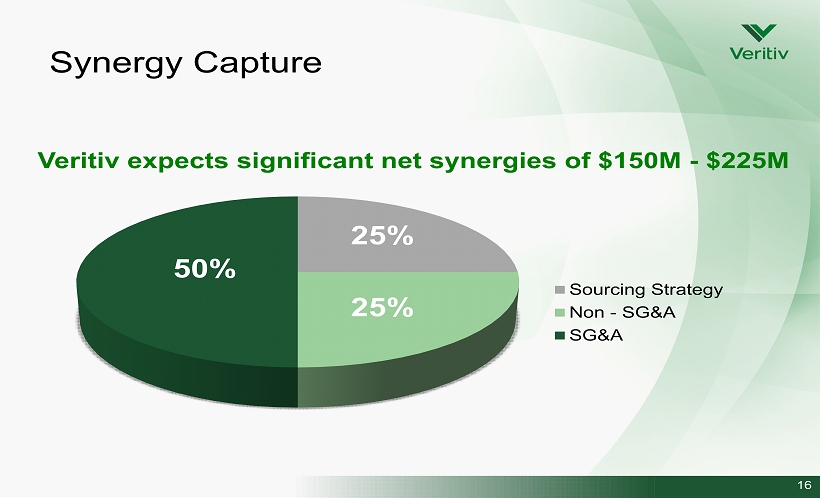
Synergy Capture 16 Veritiv expects significant net synergies of $150M - $225M Sourcing Strategy Non - SG&A SG&A 50% 25% 25%
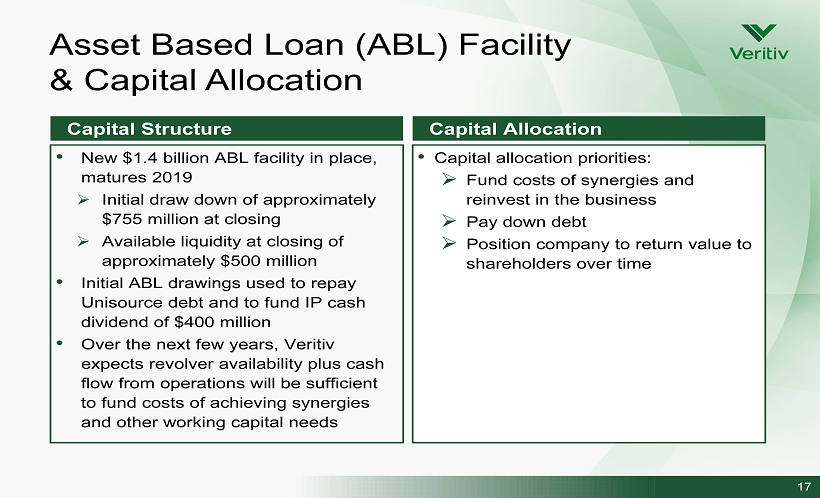
17 Capital Structure Capital Allocation • Capital a llocation p riorities : » Fund costs of synergies and reinvest in the business » Pay down debt » Position company to return value to shareholders over time • New $1.4 billion A BL facility in place, matures 2019 » Initial draw down of approximately $755 million at closing » Available liquidity at closing of approximately $500 million • Initial ABL drawings used to repay Unisource debt and to fund IP cash dividend of $400 million • Over the next few years, Veritiv expects revolver availability plus cash flow from operations will be sufficient to fund costs of achieving synergies and other working capital needs Asset Based Loan (ABL) Facility & Capital Allocation
Appendix: Non - GAAP Measures 18 We supplement our financial information prepared in accordance with GAAP with Adjusted EBITDA (earnings before interest, income taxes, depreciation and amortization, cash and non - cash restructuring (income) charges, stock - based compensation expense, LIFO (income) expense, asset impairment charges, (gain) loss on sale of joint venture, non - restructuring severance charges, merger and integration costs, income (loss) from discontinued operations, net of income taxes and certain other costs) because we believe investors commonly use Adjusted EBITDA as a main component of valuing companies such as ours. In addition, the credit agreement governing our ABL Facility permits us to exclude these and other charges and expenses in calculating “Consolidated EBITDA” pursuant to such credit agreement. Adjusted EBITDA is not a measurement of financial performance under GAAP. Non - GAAP measures do not have definitions under GAAP and may be defined differently by and not be comparable to, similarly titled measures used by other companies. As a result, we consider and evaluate non - GAAP measures in connection with a review of the most directly comparable measure calculated in accordance with GAAP. We caution investors not to place undue reliance on such non - GAAP measures, but also to consider them with the most directly comparable GAAP measure. Adjusted EBITDA has limitations as an analytical tool and should not be considered in isolation or as a substitute for analyzing our results as reported under GAAP. Please see the following schedules and related footnotes for reconciliations of these non - GAAP measures to the most comparable GAAP measures.
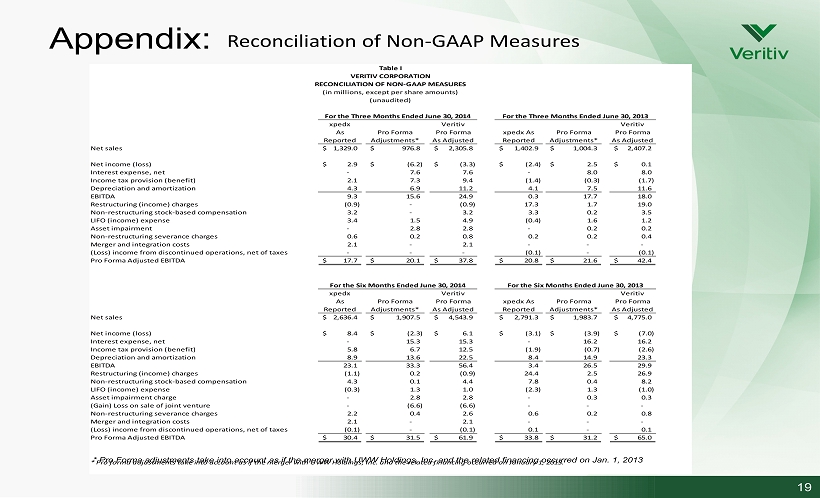
Appendix: 19 Table I VERITIV CORPORATION RECONCILIATION OF NON-GAAP MEASURES (in millions, except per share amounts) (unaudited) xpedx As Reported Pro Forma Adjustments* Veritiv Pro Forma As Adjusted xpedx As Reported Pro Forma Adjustments* Veritiv Pro Forma As Adjusted Net sales 1,329.0$ 976.8$ 2,305.8$ 1,402.9$ 1,004.3$ 2,407.2$ Net income (loss) 2.9$ (6.2)$ (3.3)$ (2.4)$ 2.5$ 0.1$ Interest expense, net - 7.6 7.6 - 8.0 8.0 Income tax provision (benefit) 2.1 7.3 9.4 (1.4) (0.3) (1.7) Depreciation and amortization 4.3 6.9 11.2 4.1 7.5 11.6 EBITDA 9.3 15.6 24.9 0.3 17.7 18.0 Restructuring (income) charges (0.9) - (0.9) 17.3 1.7 19.0 Non-restructuring stock-based compensation 3.2 - 3.2 3.3 0.2 3.5 LIFO (income) expense 3.4 1.5 4.9 (0.4) 1.6 1.2 Asset impairment - 2.8 2.8 - 0.2 0.2 Non-restructuring severance charges 0.6 0.2 0.8 0.2 0.2 0.4 Merger and integration costs 2.1 - 2.1 - - - (Loss) income from discontinued operations, net of taxes - - - (0.1) - (0.1) Pro Forma Adjusted EBITDA 17.7$ 20.1$ 37.8$ 20.8$ 21.6$ 42.4$ xpedx As Reported Pro Forma Adjustments* Veritiv Pro Forma As Adjusted xpedx As Reported Pro Forma Adjustments* Veritiv Pro Forma As Adjusted Net sales 2,636.4$ 1,907.5$ 4,543.9$ 2,791.3$ 1,983.7$ 4,775.0$ Net income (loss) 8.4$ (2.3)$ 6.1$ (3.1)$ (3.9)$ (7.0)$ Interest expense, net - 15.3 15.3 - 16.2 16.2 Income tax provision (benefit) 5.8 6.7 12.5 (1.9) (0.7) (2.6) Depreciation and amortization 8.9 13.6 22.5 8.4 14.9 23.3 EBITDA 23.1 33.3 56.4 3.4 26.5 29.9 Restructuring (income) charges (1.1) 0.2 (0.9) 24.4 2.5 26.9 Non-restructuring stock-based compensation 4.3 0.1 4.4 7.8 0.4 8.2 LIFO (income) expense (0.3) 1.3 1.0 (2.3) 1.3 (1.0) Asset impairment charge - 2.8 2.8 - 0.3 0.3 (Gain) Loss on sale of joint venture - (6.6) (6.6) - - - Non-restructuring severance charges 2.2 0.4 2.6 0.6 0.2 0.8 Merger and integration costs 2.1 - 2.1 - - - (Loss) income from discontinued operations, net of taxes (0.1) - (0.1) 0.1 - 0.1 Pro Forma Adjusted EBITDA 30.4$ 31.5$ 61.9$ 33.8$ 31.2$ 65.0$ * Pro forma adjustments take into account as if the merger with UWW Holdings, Inc. and the related financing occurred on January 1, 2013. For the Three Months Ended June 30, 2014 For the Three Months Ended June 30, 2013 For the Six Months Ended June 30, 2014 For the Six Months Ended June 30, 2013 * Pro Forma adjustments take into account as if the merger with UWW Holdings, Inc. and the related financing occurred on Jan. 1, 2013 Reconciliation of Non - GAAP Measures

20