Attached files
| file | filename |
|---|---|
| 8-K - FORM 8-K - Virtu KCG Holdings LLC | d786650d8k.htm |
 KCG Holdings, Inc. (NYSE: KCG)
Barclays Global Financial Services Conference
September 10, 2014
Exhibit 99.1 |
 Safe Harbor
Certain statements contained herein may constitute “forward-looking
statements” within the meaning of the safe harbor provisions of the U.S.
Private Securities Litigation Reform Act of 1995. Forward-looking statements
are typically identified by words such as “believe,” “expect,”
“anticipate,” “intend,” “target,”
“estimate,” “continue,” “positions,” “prospects” or “potential,” by future conditional verbs such as “will,” “would,”
“should,” “could” or “may,” or by variations of
such words or by similar expressions. These “forward-looking statements” are not historical facts
and are based on current expectations, estimates and projections about KCG’s
industry, management’s beliefs and certain assumptions made by
management, many of which, by their nature, are inherently uncertain and beyond
our control. Any forward-looking statement contained herein speaks
only as of the date on which it is made. Accordingly, readers are cautioned that any such forward-looking statements are not guarantees of
future performance and are subject to certain risks, uncertainties and
assumptions that are difficult to predict including, without limitation, risks
associated with: (i) the strategic business combination (the “Mergers”)
of Knight Capital Group, Inc. (“Knight”) and GETCO Holding Company,
LLC (“GETCO”), including, among other things, (a) difficulties and
delays in integrating the Knight and GETCO businesses or fully realizing cost
savings and other benefits, (b) the inability to sustain revenue and earnings
growth, and (c) customer and client reactions to the Mergers; (ii) the
August 1, 2012 technology issue that resulted in Knight’s broker-dealer
subsidiary sending numerous erroneous orders in NYSE-listed and NYSE
Arca securities into the market and the impact to Knight’s business as well
as actions taken in response thereto and consequences thereof; (iii) the
sale of KCG’s reverse mortgage origination and securitization business and
the departure of the managers of KCG’s listed derivatives group; (iv)
changes in market structure, legislative, regulatory or financial reporting
rules, including the increased focus by regulators, the New York Attorney
General, Congress and the media on market structure issues, and in particular,
the scrutiny of high frequency trading, alternative trading systems,
market fragmentation, colocation, access to market data feeds, and remuneration
arrangements such as payment for order flow and exchange fee structures;
(v) past or future changes to organizational structure and management; (vi) KCG’s ability to develop competitive new products and
services in a timely manner and the acceptance of such products and services by
KCG’s customers and potential customers; (vii) KCG’s ability to
keep up with technological changes; (viii) KCG’s ability to effectively
identify and manage market risk, operational and technology risk, legal risk,
liquidity risk, reputational risk, counterparty and credit risk, international
risk, regulatory risk, and compliance risk; (ix) the cost and other effects
of material contingencies, including litigation contingencies, and any adverse
judicial, administrative or arbitral rulings or proceedings; and (x) the
effects of increased competition and KCG’s ability to maintain and expand
market share. The list above is not exhaustive. Readers should carefully
review the risks and uncertainties disclosed in KCG’s reports with the SEC,
including, without limitation, those detailed under “Risk Factors” in
KCG’s Annual Report on Form 10-K for the year-ended December 31,
2013, under “Certain Factors Affecting Results of Operations” in KCG’s
Quarterly Report on Form 10-Q for the period ended June 30, 2014, and other
reports or documents KCG files with, or furnishes to, the SEC from time to
time. For additional disclosures, please see
https://www.kcg.com/legal/global-disclosures. |
 Investment Rationale
1.
A better model for the emerging competitive landscape –
agile, scalable,
pure-play, execution-only, non-bank
2.
A developer of advanced technologies driving the shift in trading from analog
to digital across asset classes
3.
Additional integration-related synergies yet to be realized
4.
Prospects for multiyear organic growth direct from core capabilities
5.
Long-term growth opportunities from the implementation of regulations
instituted in response to the global financial crisis of 2008
1 |
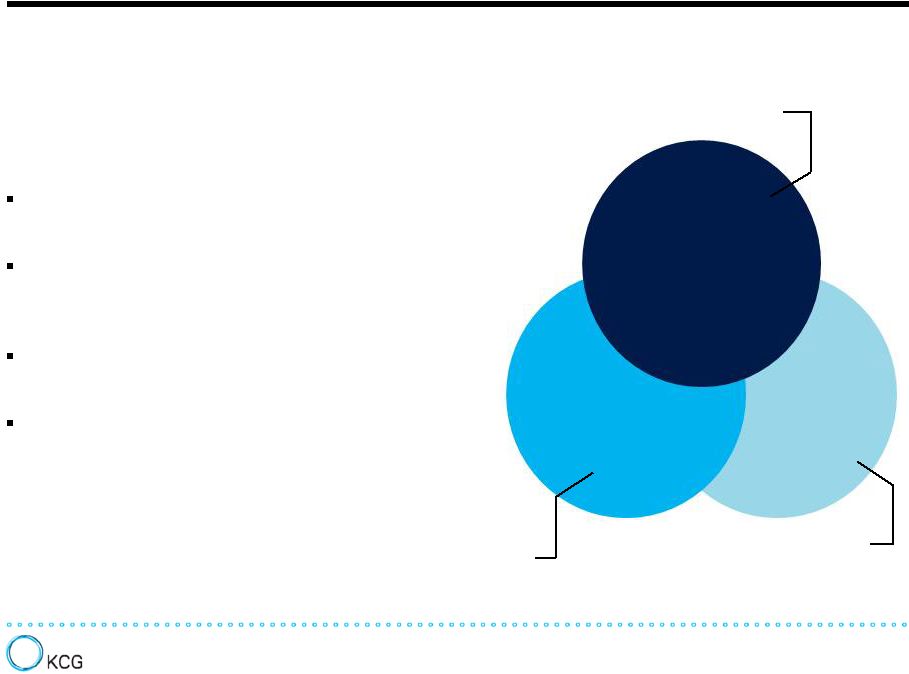 KCG helps retail and institutional investors
efficiently deploy capital in the secondary
market.
The KCG Model
Trading
Venues
Agency
Execution
Market
Making
Direct-to-client and non-client,
exchange-based market making
Agency-based trading
on behalf of clients
Agency-based trading between
principals to transactions
2
A leading, independent global securities firm
specializing in trading
Develops and applies advanced technologies to
market making, agency execution and trading
venues in multiple asset classes
Consistently delivers executions to sell-
and buy-
side clients that drive trading performance
Contributes to better price discovery, deeper
liquidity, tighter spreads and lower costs for all
market participants |
 3Q14 Intra-Quarter Updates
Market conditions remain weak across asset classes
Avg. daily consolidated U.S. equity volume of 5.5 billion QTD through August
(-8.5% QoQ) and “retail”
SEC Rule 605 shares traded of approximately 673 million (-2.5% QoQ)
Avg. realized volatility for the S&P 500 of 9.3 QTD through August (9.2 in
2Q14) KCG actions to further reconfigure the client offering
Announced the sale of futures commission merchant (FCM) KCG Futures
Completed the integration of GETMatched ATS in the U.S. into other products
Discontinued corporate access
services to concentrate on the execution only institutional market
Aggressive capital return to KCG stockholders continues
Repurchased approximately 2.9 million shares from the close of 2Q14 to the
publication of the Quarterly Report on Form 10-Q
New direction provided on regulatory initiatives
Public comment period on SEC pilot program to widen tick sizes for stocks of
smaller companies Additional SEC initiatives on U.S. equity market
structure to focus on stability, fairness and transparency as well as
eliminating broker conflicts 3
†
The number of shares outstanding of KCG Class A Common Stock was 118.1 million
including restricted stock units at August 7, 2014 compared to 121.1 million including RSUs at June 30, 2014.
† |
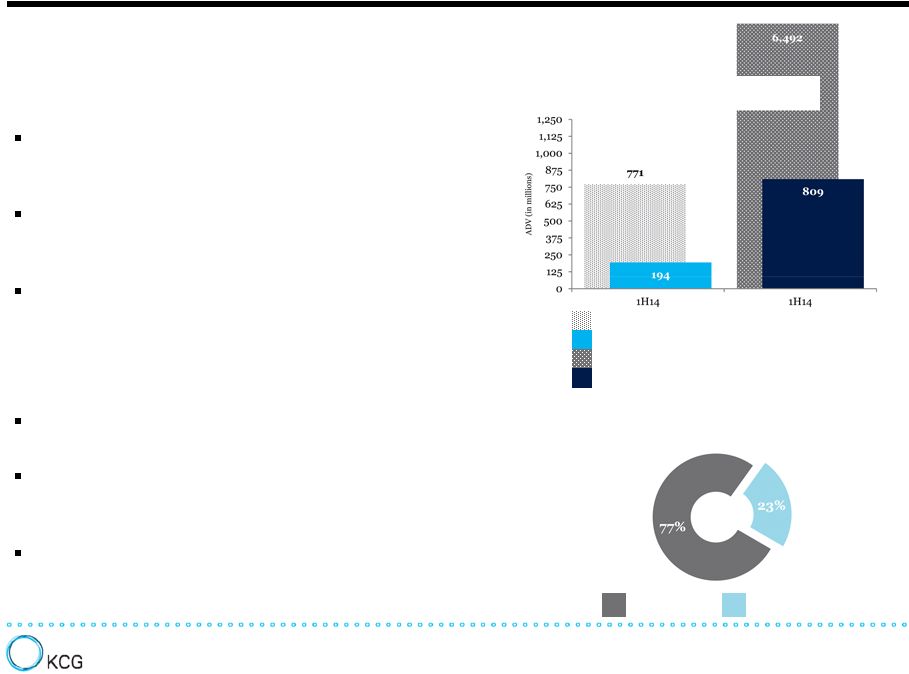 The Market Making Segment
Market Making revenue distribution
1H14
U.S. equities
Non-U.S. equities
Direct-to-client market making
A leading direct-to-client market maker serving
the sell side globally in an expanding number of
asset classes
A scale operation with competition based on
client relationships, market coverage, speed, fill
rates and execution quality
Currently offer liquidity in U.S. equities, listed
U.S. options, European equities, U.S.
Treasuries and FX (beta testing)
Non-client, exchange-based market making
A provider of best prices for buy and sell orders
on market centers
Active globally in select asset classes that are
largely electronic, fairly liquid and centrally
cleared
Anticipated future growth from the
modernization of markets for global equities,
fixed income, currencies and commodities
4
Sources: KCG, VistaOne Solutions, BATS Global Markets
ADV overall "retail" SEC Rule 605-eligible shares traded
KCG market making ADV of "retail" SEC Rule 605-eligible shares
traded ADV consolidated U.S. equity shares traded
KCG market making ADV of exchange-listed shares traded
KCG market making’s presence
in the U.S. equity market |
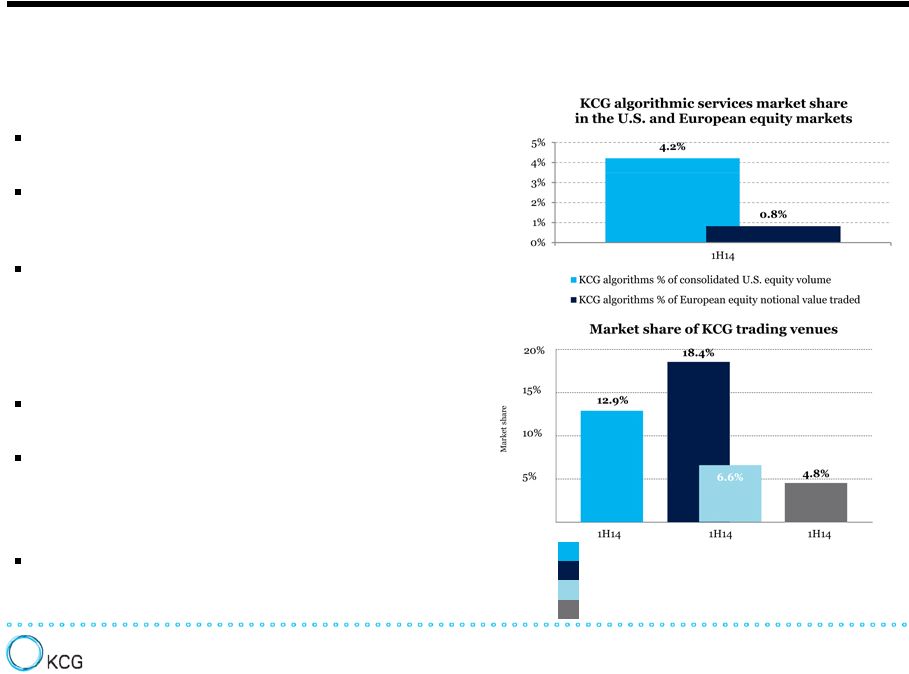 The Global Execution Services Segment
Agency execution
A leading execution-only broker serving the buy
side in global equities
Offer algorithmic trading and an order routing
as well as access to sales traders for complex
trades
Anticipated future growth from increasing
penetration of KCG algorithms among the
leading asset managers
Trading venues
A developer and operator of marketplaces in
strategic asset classes
Anticipated future growth from the
modernization of markets –
in particular FX
and fixed income –
that remain manual, non-
transparent and illiquid
A 16.7% stake in global exchange BATS
KCG Hotspot % of institutional spot FX notional dollar volume among reporting
venues KCG BondPoint % of interdealer corporate bond transactions
under 250 bonds
KCG BondPoint % of interdealer muni bond transactions under 250 bonds
Knight Match ATS % of dark U.S. equity liquidity
Sources:
KCG,
BATS
Global
Markets,
Bloomberg,
Reuters,
EBS,
TRACE,
MSRB,
Rosenblatt;
†
KCG’s
strategic
investment
in
BATS
Global
Markets,
Inc.
is
contained
in
the
Corporate
and
Other
segment
5
† |
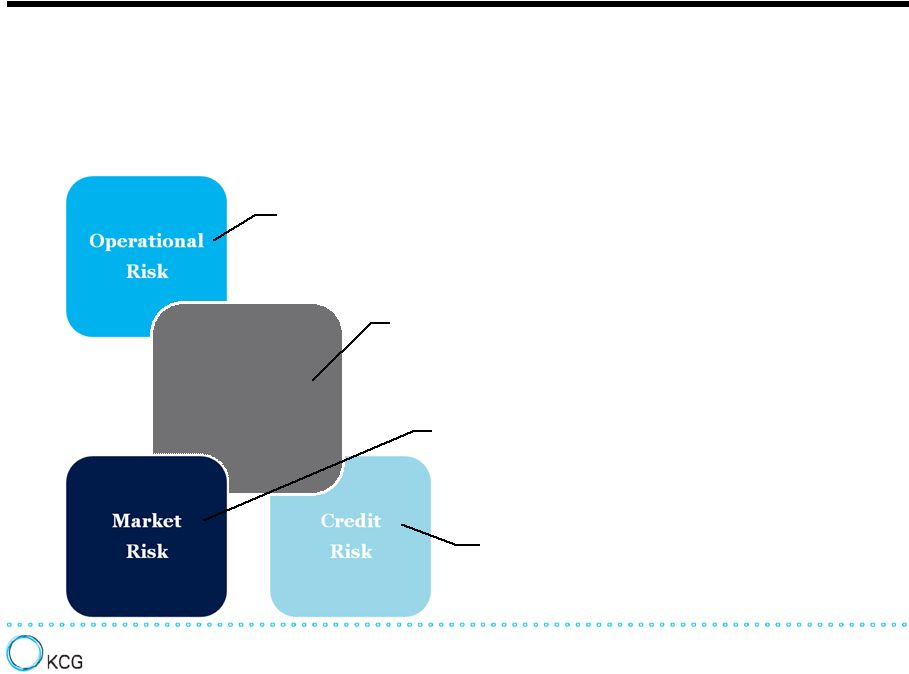 KCG Risk Management
KCG’s risk management framework provides comprehensive controls and
processes for ongoing management and monitoring of the major risks
associated with the firm's daily business activities.
Risk of loss resulting from inadequate or failed internal
processes, systems, human error or external events
Real-Time
Risk
Risk of loss resulting from high-speed intra-day
activities managed by real-time risk processes and
controls
Financial or other loss derived through failure,
non-performance or underperformance of a
counterparty
Adverse change in the market value of portfolios and
financial instruments caused by a change in market
prices, spread, or rates
6 |
 Strategic Imperatives
1.
Get the integration right.
2.
Concentrate on technology-based, scalable, non-capital intensive
businesses. 3.
Foster KCG’s intellectual capital, technology development and
collaborative culture.
4.
Strengthen the offering and expand the client network.
5.
Focus on generating cash and maintaining a liquid balance sheet.
7 |
 Primary Year One Activities
1.
Get the integration right.
–
Integrated direct-to-client and non-client, exchange-
based U.S. equity market making
–
Consolidated institutional U.S. equity sales
–
Combined overlapping units including algorithmic
services, options market making, DMM and LMM
–
Consolidated broker dealers in the U.S. and U.K.
–
Reorganized KCG Europe
–
Consolidated support functions including Technology,
Finance, Legal, Compliance, Risk, HR and Facilities
2.
Concentrate on technology-based,
scalable, non capital-intensive
businesses.
–
Restructured the institutional ETF desk
–
Sold subsidiary Urban Financial of America
3.
Foster KCG’s intellectual capital,
technology development and
collaborative vulture.
–
More than 15% of all KCG employees joined since the
merger close
–
Began integrating the legacy technology platforms
–
Consolidated offices in Chicago and London
4.
Strengthen the offering and expand the
client network.
–
Began beta testing direct-to-client market making in FX
–
Introduced a new algorithm offering institutional clients
access to retail order flow
–
Added quantitative-based trading strategy and analysis to
the client offering
5.
Focus on generating cash and
maintaining a liquid balance sheet.
–
Generated $186 million in free cash flow from operating
income
–
Released $200 million in trapped excess liquidity
–
Maintain a liquidity buffer of $350 million to support
day-to-day operations
–
Substantially all financial instruments held as assets and
liabilities are Level 1
–
Reduced debt by $793 million and lowered the debt-to-
tangible equity ratio to 0.32
8 |
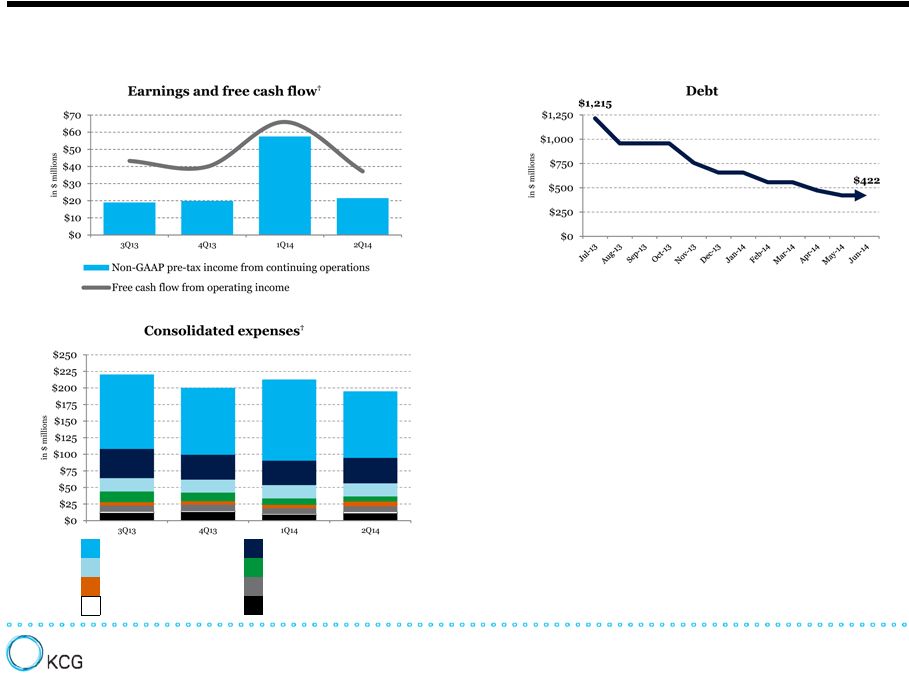 Consolidated Financials
†
See addendum for a reconciliation of GAAP to non-GAAP financial results. Free
cash flow represents income from continuing operations less capital expenditures plus non-cash items such as
depreciation and amortization, stock-based compensation and non-GAAP
adjustments included in the Regulation G tables. Expenses exclude items contained in the Regulation G tables.
KCG balance sheet
(in $ millions)
As of June 30, 2014
Cash and cash equivalents
600.9
Debt
422.3
Stockholders’
equity
1,533.7
—
—
—
Debt-to-tangible equity ratio
0.32
—
—
—
Book value per share
$12.66
Tangible book value per share
$11.04
Compensation and benefits
Communications and data processing
Depreciation and amortization
Debt interest expense
Professional fees
Occupancy and equipment rentals
Business development
Other
9 |
 Potential Catalysts
Improvement in market conditions across asset classes
Growth from organic initiatives already underway
Realization of additional integration-related synergies
Further clarity on SEC market structure initiatives
Continued capital return through share repurchases
Long-term secular shifts in trading driven by regulation, technology and
competition
10 |
 |
 3
months ended June 30, 2014 Market Making
Global Execution
Services
Corporate and
Other
Consolidated
Reconciliation of GAAP pre-tax to non-GAAP pre-tax:
GAAP income (loss) from continuing operations before income taxes
$ 36,004
$ 736
$ (22,233)
$ 14,507
Writedown of capitalized debt costs
-
-
1,995
1,995
Compensation related to reduction in workforce
383
1,886
800
3,069
Writedown of assets and lease loss accrual, net
452
-
1,489
1,941
Non-GAAP income (loss) from continuing operations before income taxes
$ 36,839
$ 2,622
$ (17,949)
$ 21,512
Regulation G Reconciliation of Non-GAAP
Financial Measures (Continuing Operations)
3 months ended March 31, 2014
Market Making
Global Execution
Services
Corporate and
Other
Consolidated
Reconciliation of GAAP pre-tax to non-GAAP pre-tax:
GAAP income (loss) from continuing operations before income taxes
$ 76,032
$ 2,016
$ (18,664)
$ 59,384
Writedown of capitalized debt costs
-
-
7,557
7,557
Income resulting from the merger of BATS and Direct Edge, net
-
-
(9,644)
(9,644)
Writedown of assets and lease loss accrual, net
359
-
(93)
266
Non-GAAP income (loss) from continuing operations before income taxes
$ 76,391
$ 2,016
$ (20,844)
$ 57,563
11 |
 3
months ended September 30, 2013 Market Making
Global Execution
Services
Corporate and
Other
Consolidated
Reconciliation of GAAP pre-tax to non-GAAP pre-tax:
GAAP income (loss) from continuing operations before income taxes
$ 47,853
$ (16,354)
$ 89,874
$ 121,373
Gain on investment in Knight Capital Group, Inc.
-
-
(127,972)
(127,972)
Compensation and other expenses related to reduction in workforce
2,309
15,132
-
17,441
Professional
and
other
fees
related
to
Mergers
and
August
1
technology
issue
-
-
7,269
7,269
Writedown of assets and lease loss accrual, net
108
-
828
936
Non-GAAP income (loss) from continuing operations before income taxes
$ 50,270
$ (1,222)
$ (30,001)
$ 19,048
Regulation G Reconciliation of Non-GAAP
Financial Measures (Continuing Operations)
3 months ended December 31, 2013
Market Making
Global Execution
Services
Corporate and
Other
Consolidated
Reconciliation of GAAP pre-tax to non-GAAP pre-tax:
GAAP income (loss) from continuing operations before income taxes
$ 47,951
$ (4,491)
$ (60,159)
$ (16,699)
Compensation and other expenses related to reduction in workforce
5,254
5,447
708
11,409
Professional
and
other
fees
related
to
Mergers
and
August
1
technology
issue
-
-
2,785
2,785
Writedown of capitalized debt costs
-
-
13,209
13,209
Gain on strategic asset
-
-
(1,359)
(1,359)
Writedown of assets and lease loss accrual
-
1,681
8,819
10,500
Non-GAAP income (loss) from continuing operations before income taxes
$ 53,205
$ 2,637
$ (35,997)
$ 19,845
12
st
st |
 3
months ended June 30, 2014 GAAP
Adjustments for
non-GAAP presentation
KCG adjusted, normalized
expenses
Reconciliation of GAAP expenses to normalized non-GAAP expenses:
Employee compensation and benefits
103,430
3,069
100,361
Communications and data processing
38,279
-
38,279
Depreciation and amortization
19,823
-
19,823
Debt interest expense
7,497
-
7,497
Professional fees
7,337
-
7,337
Occupancy and equipment rentals
8,235
-
8,235
Business development
2,609
-
2,609
Writedown of assets, lease loss accrual and capitalized debt costs
3,936
3,936
-
Other
10,767
-
10,767
Total expenses
$ 201,913
$ 7,005
$ 194,908
Regulation G Reconciliation of Non-GAAP
Financial Measures (Continuing Operations)
13 |
 3
months ended March 31, 2014 GAAP
Adjustments for
non-GAAP presentation
KCG adjusted, normalized
expenses
Reconciliation of GAAP expenses to normalized non-GAAP expenses:
Employee compensation and benefits
122,319
-
122,319
Communications and data processing
36,796
-
36,796
Depreciation and amortization
20,103
-
20,103
Debt interest expense
9,524
-
9,524
Professional fees
5,402
-
5,402
Occupancy and equipment rentals
8,285
-
8,285
Business development
1,683
-
1,683
Writedown of assets, lease loss accrual and capitalized debt costs
7,823
7,823
-
Other
8,643
-
8,643
Total expenses
$ 220,578
$ 7,823
$ 212,755
Regulation G Reconciliation of Non-GAAP
Financial Measures (Continuing Operations)
14 |
 Regulation G Reconciliation of Non-GAAP
Financial Measures (Continuing Operations)
3 months ended December 31, 2013
GAAP
Adjustments for
non-GAAP presentation
KCG adjusted, normalized
expenses
Reconciliation of GAAP expenses to normalized non-GAAP expenses:
Employee compensation and benefits
112,209
11,409
100,800
Communications and data processing
37,512
-
37,512
Depreciation and amortization
19,566
-
19,566
Debt interest expense
12,943
-
12,943
Professional fees
7,734
2,491
5,243
Occupancy and equipment rentals
9,358
-
9,358
Business development
1,923
-
1,923
Writedown of assets, lease loss accrual and capitalized debt costs
23,709
23,709
-
Other
13,066
294
12,772
Total expenses
$ 238,020
$ 37,903
$ 200,117
15 |
 Regulation G Reconciliation of Non-GAAP
Financial Measures (Continuing Operations)
3 months ended September 30, 2013
GAAP
Adjustments for
non-GAAP presentation
KCG adjusted, normalized
expenses
Reconciliation of GAAP expenses to normalized non-GAAP expenses:
Employee compensation and benefits
129,631
17,441
112,190
Communications and data processing
44,046
-
44,046
Depreciation and amortization
20,091
-
20,091
Debt interest expense
19,350
2,982
16,368
Professional fees
9,077
4,087
4,990
Occupancy and equipment rentals
8,898
-
8,898
Business development
2,644
200
2,444
Writedown of assets and lease loss accrual, net
936
936
-
Other
11,318
-
11,318
Total expenses
$ 245,991
$ 25,647
$ 220,345
16 |
 |