Attached files
| file | filename |
|---|---|
| 8-K - 8-K - INLAND REAL ESTATE CORP | a14-20633_18k.htm |
Exhibit 99.1
|
|
Investor Presentation 2Q14 (September 2014) |

|
|
IRC SNAPSHOT Inception 1994 Self advised/managed as of 2000 Listed on NYSE June 2004 Properties in which IRC has ownership interest: 1351 SF of assets in which IRC has ownership interest: 15 million1 Total assets under management2: $2.9 billion $2.2 billion total market capitalization3 Monthly dividend/common share $0.0475 ($0.57 annual)4 Dividend yield 5.4%4 Total Return Trailing 24 Months4: 42.7%; outperformed Morgan Stanley REIT (23.6%) & SNL US REIT Shopping Centers (30.4%) Central United States Commanding position in 2 top U.S. markets: Chicago & Minneapolis-St. Paul Expanding in other Midwest markets and into the Southeastern U.S. History: Geographic Footprint: Portfolio: Market/Stock Information: As of 6/30/14; includes consolidated assets & unconsolidated assets at 100%; excludes development JVs & non-owned IPCC JV properties. As of 6/30/14; includes consolidated assets , unconsolidated assets at 100% & assets IRC does not have an ownership interest in, but that we manage on behalf of a third party. Includes pro rata share of debt related to unconsolidated joint ventures as of 6/30/14; (4) Dividend rate, yield, total return as of 6/30/14. 2 |
|
|
INVESTMENT HIGHLIGHTS High-Quality, Diversified Portfolio Strong asset quality driven by high occupancy (95.8% leased)1 and consistent cash flows Diverse tenant base includes a mix of national retailers across a variety of categories Impressive portfolio demographics: dense populations, high incomes, diverse economies Exposure to resilient markets with high barriers to entry and attractive growth prospects; dominant position in core markets Compelling Internal & External Growth Opportunities Solid same-store net operating income (NOI) growth Continued positive leasing spreads on new leases and renewals within the total portfolio Successful redevelopment track record with a robust pipeline in process Strong Liquidity / Debt Maturity Profile Multiple sources of capital to support business plan / strategic growth initiatives Initiatives have improved credit metrics and enhanced balance sheet flexibility Well-laddered debt maturity schedule with minimal near-term refinancing risk Experienced Management Team Fully integrated team with deep experience and successful track record operating within the retail sector and public capital markets Note: (1) Total portfolio as of 6/30/14; includes properties in unconsolidated joint ventures at 100%. 3 |
|
|
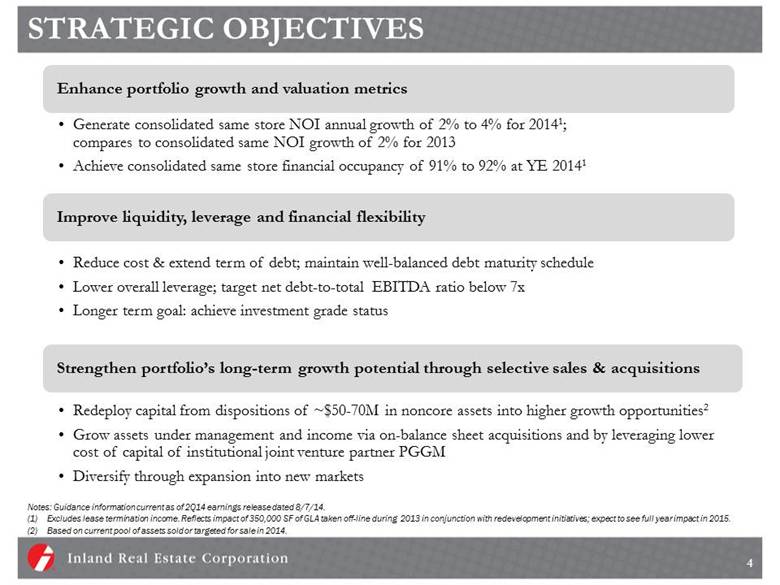
STRATEGIC OBJECTIVES Generate consolidated same store NOI annual growth of 2% to 4% for 20141; compares to consolidated same NOI growth of 2% for 2013 Achieve consolidated same store financial occupancy of 91% to 92% at YE 20141 Enhance portfolio growth and valuation metrics Reduce cost & extend term of debt; maintain well-balanced debt maturity schedule Lower overall leverage; target net debt-to-total EBITDA ratio below 7x Longer term goal: achieve investment grade status Improve liquidity, leverage and financial flexibility Redeploy capital from dispositions of ~$50-70M in noncore assets into higher growth opportunities2 Grow assets under management and income via on-balance sheet acquisitions and by leveraging lower cost of capital of institutional joint venture partner PGGM Diversify through expansion into new markets Strengthen portfolio’s long-term growth potential through selective sales & acquisitions Notes: Guidance information current as of 2Q14 earnings release dated 8/7/14. Excludes lease termination income. Reflects impact of 350,000 SF of GLA taken off-line during 2013 in conjunction with redevelopment initiatives; expect to see full year impact in 2015. Based on current pool of assets sold or targeted for sale in 2014. 4 |
|
|
HIGH QUALITY, STABLE PORTFOLIO Ownership strategy based on premise that well-located retail providing everyday goods & services likely to perform and hold value through economic cycles Over 50% of properties in the total portfolio have a grocery component Solid tenant mix strengthened by national/regional exposure: 78% of total portfolio annual base rent Focus on necessity & value retail / high quality national & local tenants Total Portfolio GLA by Property Type Total Portfolio Annual Base Rent by Retailer Type Notes: Data based on total retail portfolio as of 6/30/14. Excludes properties held in the joint venture with IPCC. 5 Community 24% Neighborhood 25% Power 43% Lifestyle 4% Single User 4% National Retailers 74% Regional Retailers 4% Local Retailers 22% |
|
|
DIVERSIFIED TENANT BASE No single tenant more than 3.9% of total portfolio annual base rent In demand, diversified tenant base provides stability (1) Mariano’s-1, Metro Market-1, Rainbow-4, Pick ‘N Save-2, Super Pick ‘N Save-1 (2) TJ Maxx-7, Marshalls-12, Home Goods-1 (3) Bed Bath & Beyond-8, BuyBuy Baby-3, World Market-1 (4) Kroger-1, Food 4 Less-4 (5) Justice-5, Dress Barn-10, Maurice’s-7, Lane Bryant-7, Catherine’s-2 (6) Office Depot-5, OfficeMax-6 (7) Dick’s Sporting Goods-4, Golf Galaxy-1 (8) Old Navy-10,The GAP-1, The Gap Factory-1 Notes: Based on total portfolio including JV partners’ pro rata share, excluding assets held in IPCC JV; major tenants include tenants representing 1% or more of annual base rent. Ratings source: crmz.com as of 7/2014. 6 Tenant Name # Stores % of Annual Base Rent Long-term S&P Rating Long-term Moody's Rating Roundy's (1) 9 3.9% B- B2 TJX Companies (2) 20 3.3% A+ A3 AB Acquisitions (Jewel) 9 3.1% N/A N/A Supervalu (Cub Foods) 8 3.1% B+ B2 Best Buy 7 2.5% BB Baa2 Carmax 2 2.1% N/A N/A Safeway (Dominick's Finer Foods) 4 2.0% BBB Baa3 PetSmart 13 1.9% BB+ N/A Michaels 12 1.8% B B3 Bed Bath & Beyond (3) 12 1.8% BBB+ (P)Baa1 Kroger (4) 5 1.7% BBB Baa2 Ascena Retail Group (5) 31 1.6% N/A N/A Office Depot (6) 11 1.4% B- B2 Dick's Sporting Goods (7) 5 1.4% N/A N/A The Gap (8) 12 1.3% BBB- Baa3 Ross Dress for Less 9 1.3% A- N/A Retail Ventures (DSW) 5 1.2% N/A N/A Ulta 10 1.1% N/A N/A Petco 9 1.0% B B3 The Sports Authority 3 1.0% N/A N/A Dollar Tree 19 1.0% N/A N/A Party City 11 1.0% B B3 Total 226 40.5% Major Tenant Summary – Total Portfolio as of 6/30/14 |
|
|
STRONG MARKET DEMOGRAPHICS 7 IRC’s retail centers are supported by strong demographics / high barriers to entry 4th highest amongst peers for 3-mile median household income; rank at median of peer group for 3-mile population Notes: Property information from SNL as of 8/2014; properties for which address/latitude-longitude and/or SF were not available are excluded; demographics from ESRI (most recent available 2013 census data), weighted by SF as reported by SNL; IRC data Includes total portfolio properties as of 6/30/14, excluding IPCC JV properties. Median Household Income 3-Mile Radius Population 3-Mile Radius 127,287 118,814 112,995 102,853 100,595 96,484 87,184 86,759 74,826 71,221 70,852 66,845 56,815 AKR EQY FRT KIM WRI REG IRC CDR RPAI DDR BRX RPT KRG |
|
|
PRIMARY MARKETS Primary markets include Greater Chicago and Minneapolis-St. Paul Metro Areas Two of the top 20 U.S. markets out of 381 MSAs Markets’ resiliency, diverse economies, dense populations & healthy incomes support stable cash flows Notes: (1) Based on total portfolio, excluding IPCC JV as of 6/30/14. Chicago MSA includes 2 assets located in Indiana. (2) Chicago MSA and Minneapolis/St. Paul MSA average occupancy from CBRE’s Second Quarter 2014 Retail MarketView reports. (3) NOI based on total portfolio as of 6/30/14, excluding properties held through JV w/IPCC. IRC’s portfolio in Chicago MSA1: 74 assets, 8.4 million SF 58.3% of total retail portfolio SF 95.2% leased, 530 bps higher than MSA average2 63.0% of total portfolio NOI from IL3 IRC’s portfolio in Minneapolis-St. Paul MSA1: 24 assets, 2.6 million SF 17.8% of total retail portfolio SF 97.7% leased, 440 bps higher than MSA average2 16.1% of total portfolio NOI from MN3 Chicago MSA: 3rd largest U.S. metro area; pop. 9.5 million Twin Cities MSA: 16th largest U.S. metro area; pop. 3.1 million 8 |
|
|
DOMINANT REIT IN PRIMARY MARKETS IRC is the largest shopping center REIT operating in the Chicago & Minneapolis metro areas1 Substantial presence positions IRC as “the retail play” in these markets Minneapolis-St. Paul MSA Note: (1) Based on retail SF and number of assets. Data includes shopping centers plus single tenant retail properties with JVs at 100%. IRC data based on total portfolio excluding IPCC JV as of 6/30/14. Peer data sources: SNL & company websites as of Nov. 2013, data includes owned retail GLA with JVs reflected at 100% regardless of REIT’s actual ownership percentage. 9 8,396 3,371 2,368 1,863 1,070 942 751 240 2,570 1,369 1,188 676 IRC 74 KIM 30 DDR 7 REG 14 RPAI 6 RPT 5 FRT 4 KRG 3 IRC 24 DDR 3 KIM 5 REG 5 Gross Leasable Area (SF in Thousands) |
|
|
OPERATING STRATEGY IN PRIMARY MARKETS Schaumburg Promenade Woodfield Plaza Woodfield Commons Nantucket Square Example: IRC Assets in Schaumburg, IL (1 of 5 Top Submarkets In Chicago MSA) 10 Schaumburg Plaza Acquire critical mass of properties in target markets Market concertration facilitates multiple lease signings for retailer market launches, expansions and relocations Cluster assets within key submarkets Provides leasing flexibility & management efficiencies, including pricing power with vendors Locate on the best corner Premier locations within primary markets make IRC assets highly attractive to retailers |
|
|
INTERNAL GROWTH Positive Rent Spreads Fourteen consecutive quarters of positive spreads on new leases 1Q11 through 2Q14 & continued positive leasing spreads on renewals in the total portfolio Reflects strength of locations & more level playing field with regard to lease negotiations + 8.2% + 4.2% + 5.2% + 25.8% + 21.0% + 7.0% + 19.8% + 4.8% Total Portfolio Rent Spreads On New And Renewal Leases (Average Base Rents) + 10.8% + 14.8% 11 $12.22 $10.74 $14.43 $15.63 $11.71 $13.17 $13.84 $16.63 $10.92 $11.62 $12.86 $13.52 $15.62 $16.29 $12.53 $15.93 $14.50 $19.92 $12.11 $13.35 2Q13 Renewals 2Q13 New 3Q13 Renewals 3Q13 New 4Q13 Renewals 4Q13 New 1Q14 Renewals 1Q14 New 2Q14 Renewals 2Q14 New Former Average Base Rent Per SF New Average Base Rent Per SF |
|
|
VALUE CREATION Repositioning/Redevelopment Track Record Case Studies -- Asset Redevelopment Projects: Cost ROC 1 Before After Rivertree Court Vernon Hills, IL Theater converted to Gordmans (Phase 1); repositioned Office Depot with Ross, Old Country Buffet with Pier One, Ulta with Shoe Carnival (Phase 2) Completed 2011/2013 $11.0 M 15.4% Crystal Point Crystal Lake, IL Replaced vacant restaurant with multi-tenant outlot building;100% leased to Five Guys, Pot Belly’s & Starbucks Completed 2012 $ 1.6 M 12.2% Salem Square Countryside, IL Repositioning & multi-tenant outlot addition Completed 2011 $ 2.9 M 25.5% Notes: (1) Return on cost (ROC) is based on new capital and related leasing 12 Invested $48.9 M in CLA expansion projects completed 2005 through 2013 Added 320,000 SF of gross leasable area (GLA) Generated average annual net rental revenue of 8.1 M Annual return on cost (ROC) of completed projects: 16.6%1 |
|
|
VALUE CREATION Market Demand Driving Increased Repositioning/Redevelopment Activity Notes: (1) Return on cost (ROC) is based on projected new capital and related leasing 13 Projects completed in 2013: University Center, St. Paul, MN (repositioned former Bally’s for two tenants: charter school and swim school) and Rivertree Court, Vernon Hills, IL Two projects repositioned total of ~188,000 SF of GLA Total cost for both projects: $12.4 M; combined average annual return on cost (ROC): 15.4% 1 In 2014 plan to invest ~$9.8 M in 5 projects for anticipated annual ROC of 14.2% 1 ~ 350,000 SF taken out of service in 2013 – all expected to come back on line by YE 2014 Projects in Process Value-Add Initiative Cost ROC 1 Est. Completion Diffley Marketplace, Eagan, MN Add multi-tenant outlot and single-tenant outlot $ 2.9 M 12.0% 2014 Dunkirk Square, Maple Grove, MN Add multi-tenant outlot $ 1.8 M 12.7% 2014 Lansing Square, Lansing, IL Sold portion of property in December 2013 to Walmart for development of super store; plan to redevelop remainder of property to add 30K SF for junior anchor $ 1.5 M 13.8% 2014 Aurora Commons, Aurora, IL Reposition Jewel store for multi-tenant apparel/discount retailers $ 2.6 M 19.0% 2014 Schaumburg Plaza, Schaumburg, IL Demolish existing restaurant and develop new building for Starbucks, Which Wich $1.0 M 11.7% 2014 TOTAL ASSET IMPROVEMENT PROJECTS IN PROCESS: $9.8 M 14.2% |
|
|
DISCIPLINED INVESTMENT STRATEGY Pursue grocery, value & necessity-based multi-anchor retail centers primarily in Central and Southeastern U.S. markets Target Class A assets in trade areas with strong demographics & high barriers to entry Focus on market-leading grocers and in-demand national retailers Westgate (Fairview Park, OH) Stone Creek (Cincinnati, OH) 14 Point at Clark (Chicago, IL) Balance acquisitions in primary markets with purchase of market-dominant assets in strong secondary markets and development to achieve higher returns Established population bases; equally compelling demographics Same high-quality national retailer rent rolls Investment goals Improve diversification of portfolio by market, tenant concentration and type of center to provide predictable, sustainable cash flows Achieve above market returns on investments to enhance net asset value |
|
|
ACQUISITION OF NYSTRS INTEREST IN JV June 2013: Acquired New York State Teachers' Retirement System’s (NYSTRS) 50% ownership interest in the IN Retail Fund for purchase price of $121.1M in cash IRC now owns 100% of IN Retail Fund IN Retail: 13 shopping centers, 2.3 million SF of GLA, 97.5% leased at 3/31/13 Gross value of ~$395.6M (agreed upon by NYSTRS and IRC for purposes of the transaction) Total outstanding mortgage debt of ~$152.2M at closing, plus other related assets/liabilities Acquisition advanced IRC’s strategic goals: Simplified our ownership structure Increased scale: grew consolidated portfolio to $1.6B from $1.2B Balance sheet metrics improved post acquisition: Debt to total gross assets (pro-rata consolidation): 48.1% at 6/30/13, improved 290 bps over 3/31/13 & 50 bps over 6/30/12 Net debt/EBITDA (pro-rata consolidation): 6.6x for 2Q13, vs 7.3x for 1Q13 and 7.2x for 2Q12 NYSTRS JV Formed 2004 Leveraged institutional capital to acquire high quality assets while enhancing yield on investment via fee income Added $312M(1) gross value with acquisitions completed 2005-2006 Monetized equity value of contributed assets; reinvested gains on sales into new acquisitions Note: (1) Includes Algonquin Commons which was consolidated in 2010. 15 |

|
|
JOINT VENTURE GROWTH STRATEGIES Diversify Capital Resources + Expand Platform + Drive Growth Joffco Square (Chicago, IL) Walgreens (Somerset, MA) 16 Note: (1) Stabilized properties only; does not include assets contributed to the JV by IRC, developments in process or land purchases. Grocery- Anchored Ctrs (Southeastern U.S.) PGGM Formed 2010; upsized 2012 Acquire premier retail assets using institutional capital: added $444.8M gross value as of 6/30/141 Capital pipeline of future acquisitions Monetized equity value of contributed assets while retaining operating control; recycled gains on sales into new acquisitions Enhance yield via fee income Potential total JV asset value at full investment $900M IRC 55% ownership IPCC Established 2006 Fee structure emphasizing recurring management fees over one-time transaction fee provides more value to IRC Recurring property management fee income $1.8M for 2013; expect will grow as assets added to JV Target annual acquisitions of $100M in asset value; IRC equity investment limited to $20-30M at any one time to preserve liquidity IRC ownership reduced to 0% as interests in assets are completely sold to TIC investors MAB American Retail Partners Formed 2013 Develop up to 20 grocery-anchored centers over 5 yrs with est. total market value of $325M Opportunity to efficiently expand our portfolio in the Southeastern U.S. while diversifying grocer tenant base; target markets in the Carolinas, Georgia, Florida, Virginia, & Washington DC Opportunity to acquire new grocery-anchored centers upon stabilization at a discount to market value |
|
|
JOINT VENTURE FEE INCOME Total joint venture fee income compound annual growth rate 23% (2006-2013) IPCC venture: generated ~$20.9M of acquisition & property management fee income 2006-20131 NYSTRS JV: provided ~$8.7M of fee income 2006-20131 ; JV concluded June 2013 PGGM JV: provided ~$5.4 M of fee income 2010-20131 $3.5M $3.3M $1.5M $4.5M $3.5M $6.0M $1.0M $1.2M $1.7M $1.9M $2.8M $2.0M Total JV Fee Income Property Management JV Fee Income Only $37.6 M $5.7M $4.2M $6.9M $4.4M Notes: Amounts may not foot due to rounding issues (1) Property management JV fee income includes asset management and leasing commissions. (2) Not included in this analysis are immaterial fees earned from managing development joint ventures. 17 PGGM IPCC NYSTRS $21.5 M $2.6M $2.3M $1.3 $1.0 $1.4 $1.2 $1.2 $1.1 $1.1 $0.4 $1.0 $1.0 $1.4 $1.2 $1.2 $1.1 $1.1 $0.4 $0.2 $2.4 $3.2 $2.1 $2.1 $4.0 $2.6 $4.1 $1.3 $0.2 $0.3 $0.7 $0.6 $0.9 $1.1 $1.8 $1.1 $0.2 $0.8 $2.0 $2.3 $1.3 $0.2 $0.7 $1.9 $2.3 $1.2 2006 2007 2008 2009 2010 2011 2012 2013 YTD 2Q14 2006 2007 2008 2009 2010 2011 2012 2013 YTD 2Q14 |
|
|
TRANSACTION HISTORY Consolidated and Core Asset Based Joint Ventures Over half of core asset acquisitions have been principal to principal; typically get best pricing in private deals Increased capital recycling activity in 2013/2014; proceeds from sale of non-core assets invested in properties with greater growth potential IRC/Core Asset-Based JV Acquisitions Dispositions As of 6/30/2014; acquisitions are shown on positive axis & include sold core properties and properties acquired through unconsolidated joint ventures at 100 percent; acquisitions exclude land purchases; dispositions are shown on negative axis. 2013 does not include assets acquired as result of consolidation of NYSTRS’ JV properties, as acquisitions are included in prior year totals. Acquisition value represents full purchase price, including potential earn-outs. 18 $17.8 $77.4 $181.8 $365.8 $298.3 $43.3 $3.3 $207.2 $78.0 $75.3 $143.8 $251.4 $61.4 $138.6 $186.9 $120.4 $57.0 $2.4 $8.4 $12.0 $24.6 $6.2 $15.7 $29.6 $14.8 $6.6 $17.7 $8.2 $19.7 $72.7 $65.2 ($80) ($55) ($30) ($5) $20 $45 $70 $95 $120 $145 $170 $195 $220 $245 $270 $295 $320 $345 $370 1995 1996 1997 1998 1999 2000 2001 2002 2003 2004 2005 2006 2007 2008 2009 2010 2011 2012 2013 YTD 2Q14 Dispositions / Acquisitions ($MM) |
|
|
BALANCE SHEET INITIATIVES Substantial Progress in 2013 and YTD 2014 Simplified Structure & Increased Market Capitalization Acquired and consolidated NYSTRS’ 50% interest in the IN Retail entity June 2013 In 2013 sold nearly 10 million shares for net proceeds of $101.5 M used for accretive acquisitions, including purchase of NYSTRS JV portfolio Market capitalization increased to $2.2 B @ 6/30/14 from $1.8 B @ YE 2012, due to equity issuances and stock price appreciation Decreased Cost of Debt & Extended Debt Maturity Profile Amended unsecured credit facilities July 2014: Increased capacity by $115 M to $475 M Lowered rates on leverage-based pricing grids by 5 to 15 bps for line of credit (LOC) and by 10 to 20 bps for term loan Extended terms by one year: LOC to August 2018, term loan to August 2019 Expanded lending group from 6 to 8 banks Reduced Leverage & Enhanced Financial Flexibility Debt / Total Market Cap1: 47.2% @ 6/30/14, improvement of 20 bps over 1 yr ago Debt / Total Gross Assets1,2: 49.8% for 2Q14 compared to 50.0% for 1Q14 and 48.0% for 2Q13 Net Debt / Recurring EBITDA1,3: 7.0x for 2Q14 vs 7.2x for 2Q13 Unsecured Debt to Total Debt1: 38.5% for 2Q14, improvement of 700 bps over 2Q13 Fixed Charge Coverage Ratio1,4: 2.6x for 2Q14 vs 2.4x for 2Q13 19 Notes: (1) Based on IRC leverage levels at 6/30/14; includes IRC’s pro rata share of unconsolidated joint ventures. (2) Total Gross Assets includes total assets plus accumulated depreciation & less acquired below market intangibles. (3) Reconciliation on EBITDA & Recurring EBITDA to net income attributable to Inland Real Estate Corporation is provided in appendix at the end of this presentation. (4) Quarterly fixed charges includes interest expense, distributions to non-controlling members, dividends on preferred shares, and principal amortization. |

|
|
CONSOLIDATED DEBT MATURITIES Well-Balanced Debt Maturity Profile Consolidated Debt as of 6/30/14 Notes: Secured debt includes principal amortization through maturity. Includes $90.2M of secured debt for Algonquin Commons in 2014. $230.0 $194.7 $130.8 20 Secured Debt Term Loan – Wells Fargo Term Loan – Bank Group $101.6 $34.7 $42.9 $49.7 $40.3 $70.3 $42.1 $64.2 $11.9 $28.1 $29.2 $180.0 $50.0 $145.0 2014 2015 2016 2017 2018 2019 2020 2021 2022 2023 2024 |
|
|
INVESTMENT SUMMARY Assets repositioned with best-in-class retailers Portfolio positioned to provide consistent & dependable income growth Redeveloping assets to meet retailer appetite for new stores Reinvigorated portfolio primed for growth Provides enhanced liquidity & flexibility Progress on reducing cost of debt & extending maturity profile Long term goals: lower overall leverage & secure investment grade status Executing long term capital plan Selling non-core assets & investing proceeds in acquisitions with greater growth potential Leveraging capital-efficient joint ventures to grow portfolio & income Improving portfolio diversification metrics by expanding geographic footprint Implementing effective growth strategy 21 |
|
|
EXPERIENCED LEADERSHIP TEAM Management Inland Tenure Background / Experience Mark Zalatoris President & CEO 28 yrs. Appointed president & CEO April 2008; EVP & COO 2004-2008; SVP & CFO 1994-2004; extensive knowledge of portfolio Brett Brown Executive Vice President & Chief Financial Officer 10 yrs. (15 yrs. at Great Lakes REIT) Extensive capital markets & public company reporting experience; former Great Lakes REIT SVP, Financial Reporting Scott Carr EVP & Chief Investment Officer, IRC; President, Inland Commercial Property Management Inc. (IRC subsidiary) 26 yrs. Has overseen property management operations since 1994; strong retailer relationships William Anderson Senior Vice President, Transactions 26 yrs. Skilled at analyzing, negotiating retail center acquisitions & dispositions Senior Management Team Averages 25+ Years Real Estate Experience 22 |
|
|
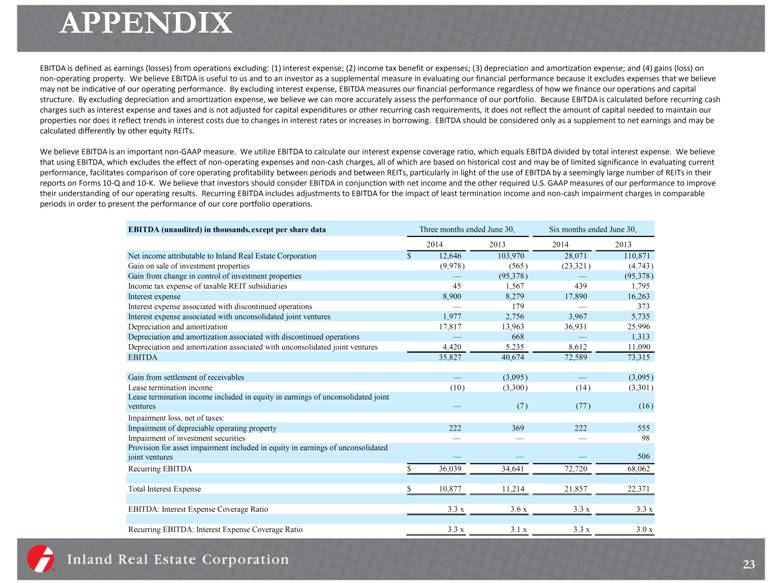
APPENDIX 23 EBITDA is defined as earnings (losses) from operations excluding: (1) interest expense; (2) income tax benefit or expenses; (3) depreciation and amortization expense; and (4) gains (loss) on non-operating property. We believe EBITDA is useful to us and to an investor as a supplemental measure in evaluating our financial performance because it excludes expenses that we believe may not be indicative of our operating performance. By excluding interest expense, EBITDA measures our financial performance regardless of how we finance our operations and capital structure. By excluding depreciation and amortization expense, we believe we can more accurately assess the performance of our portfolio. Because EBITDA is calculated before recurring cash charges such as interest expense and taxes and is not adjusted for capital expenditures or other recurring cash requirements, it does not reflect the amount of capital needed to maintain our properties nor does it reflect trends in interest costs due to changes in interest rates or increases in borrowing. EBITDA should be considered only as a supplement to net earnings and may be calculated differently by other equity REITs. We believe EBITDA is an important non-GAAP measure. We utilize EBITDA to calculate our interest expense coverage ratio, which equals EBITDA divided by total interest expense. We believe that using EBITDA, which excludes the effect of non-operating expenses and non-cash charges, all of which are based on historical cost and may be of limited significance in evaluating current performance, facilitates comparison of core operating profitability between periods and between REITs, particularly in light of the use of EBITDA by a seemingly large number of REITs in their reports on Forms 10-Q and 10-K. We believe that investors should consider EBITDA in conjunction with net income and the other required U.S. GAAP measures of our performance to improve their understanding of our operating results. Recurring EBITDA includes adjustments to EBITDA for the impact of least termination income and non-cash impairment charges in comparable periods in order to present the performance of our core portfolio operations. EBITDA (unaudited) in thousands, except per share data Three months ended June 30, Six months ended June 30, 2014 2013 2014 2013 Net income attributable to Inland Real Estate Corporation $ 12,646 103,970 28,071 110,871 Gain on sale of investment properties (9,978 ) (565 ) (23,321 ) (4,743 ) Gain from change in control of investment properties — (95,378 ) — (95,378 ) Income tax expense of taxable REIT subsidiaries 45 1,567 439 1,795 Interest expense 8,900 8,279 17,890 16,263 Interest expense associated with discontinued operations — 179 — 373 Interest expense associated with unconsolidated joint ventures 1,977 2,756 3,967 5,735 Depreciation and amortization 17,817 13,963 36,931 25,996 Depreciation and amortization associated with discontinued operations — 668 — 1,313 Depreciation and amortization associated with unconsolidated joint ventures 4,420 5,235 8,612 11,090 EBITDA 35,827 40,674 72,589 73,315 Gain from settlement of receivables — (3,095 ) — (3,095 ) Lease termination income (10 ) (3,300 ) (14 ) (3,301 ) Lease termination income included in equity in earnings of unconsolidated joint ventures — (7 ) (77 ) (16 ) Impairment loss, net of taxes: Impairment of depreciable operating property 222 369 222 555 Impairment of investment securities — — — 98 Provision for asset impairment included in equity in earnings of unconsolidated joint ventures — — — 506 Recurring EBITDA $ 36,039 34,641 72,720 68,062 Total Interest Expense $ 10,877 11,214 21,857 22,371 EBITDA: Interest Expense Coverage Ratio 3.3 x 3.6 x 3.3 x 3.3 x Recurring EBITDA: Interest Expense Coverage Ratio 3.3 x 3.1 x 3.3 x 3.0 x |
|
|
FORWARD-LOOKING STATEMENTS Certain statements in this presentation constitute "forward-looking statements" within the meaning of the Federal Private Securities Litigation Reform Act of 1995. These forward-looking statements are not historical facts but are the intent, belief or current expectations of our management based on their knowledge and understanding of the business and industry, the economy and other future conditions. These statements are not guarantees of future performance, and investors should not place undue reliance on forward-looking statements. Actual results may differ materially from those expressed or forecasted in the forward-looking statements due to a variety of risks, uncertainties and other factors, including but not limited to the factors listed and described under “Risk Factors” in our Annual Report on Form 10-K for the year ended December 31, 2013 as may be updated or supplemented by our Form 10-Q filings. These factors include, but are not limited to: market and economic challenges experienced by the U.S. economy or real estate industry as a whole, including dislocations and liquidity disruptions in the credit markets; the inability of tenants to continue paying their rent obligations due to bankruptcy, insolvency or a general downturn in their business; competition for real estate assets and tenants; impairment charges; the availability of cash flow from operating activities for distributions and capital expenditures; our ability to refinance maturing debt or to obtain new financing on attractive terms; future increases in interest rates; actions or failures by our joint venture partners, including development partners; and other factors that could affect our ability to qualify as a real estate investment trust. We undertake no obligation to update or revise forward-looking statements to reflect changed assumptions, the occurrence of unanticipated events or changes to future operating results. 24 |