Attached files
| file | filename |
|---|---|
| 8-K - 8-K - Capital Bank Financial Corp. | d787213d8k.htm |
Exhibit 99.1
CB CAPITAL BANK FINANCIAL CORP Barclays Capital Global Financial Services Conference September 10, 2014
CB Safe Harbor Statement Forward-Looking Statements Information in this presentation contains forward-looking statements. Any statements about our expectations, beliefs, plans, predictions, forecasts, objectives, assumptions or future events or performance are not historical facts and may be forward- looking. These statements are often, but not always, made through the use of words or phrases such as “anticipate,” “believes,” “can,” “could,” “may,” “predicts,” “potential,” “should,” “will,” “estimate,” “plans,” “projects,” “continuing,” “ongoing,” “expects,” “intends” and similar words or phrases. Accordingly, these statements are only predictions and involve estimates, known and unknown risks, assumptions and uncertainties that could cause actual results to differ materially from those expressed in them. Our actual results could differ materially from those anticipated in such forward-looking statements as a result of several factors more fully described under the caption “Risk Factors” in the annual report on Form 10-K and other periodic reports filed by us with the Securities and Exchange Commission. Any or all of our forward-looking statements in this presentation may turn out to be inaccurate. The inclusion of this forward-looking information should not be regarded as a representation by us or any other person that the future plans, estimates or expectations contemplated by us will be achieved. We have based these forward- looking statements largely on our current expectations and projections about future events and financial trends that we believe may affect our financial condition, results of operations, business strategy and financial needs. There are important factors that could cause our actual results, level of activity, performance or achievements to differ materially from the results, level of activity,performance or achievements expressed or implied by the forward looking statements including, but not limited to: (1) changes in general economic and financial market conditions; (2) changes in the regulatory environment; (3) economic conditions generally and in the financial services industry; (4) changes in the economy affecting real estate values; (5) our ability to achieve loan and deposit growth; (6) the completion of future acquisitions or business combinations and our ability to integrate any acquired businesses into our business model; (7) projected population and income growth in our targeted market areas; (8) competitive pressures in our markets and industry; (9) our ability to attract and retain key personnel; (10) changes in accounting policies or judgments; and (11) volatility and direction of market interest rates and a weakening of the economy which could materially impact credit quality trends and the ability to generate loans. All forward-looking statements are necessarily only estimates of future results and actual results may differ materially from expectations. You are, therefore, cautioned not to place undue reliance on such statements which should be read in conjunction with the other cautionary statements that are included elsewhere in this presentation. Further, any forward-looking statement speaks only as of the date on which it is made and we undertake no obligation to update or revise any forward-looking statement to reflect events or circumstances after the date on which the statement is made or to reflect the occurrence of unanticipated events. 9/10/2014 2
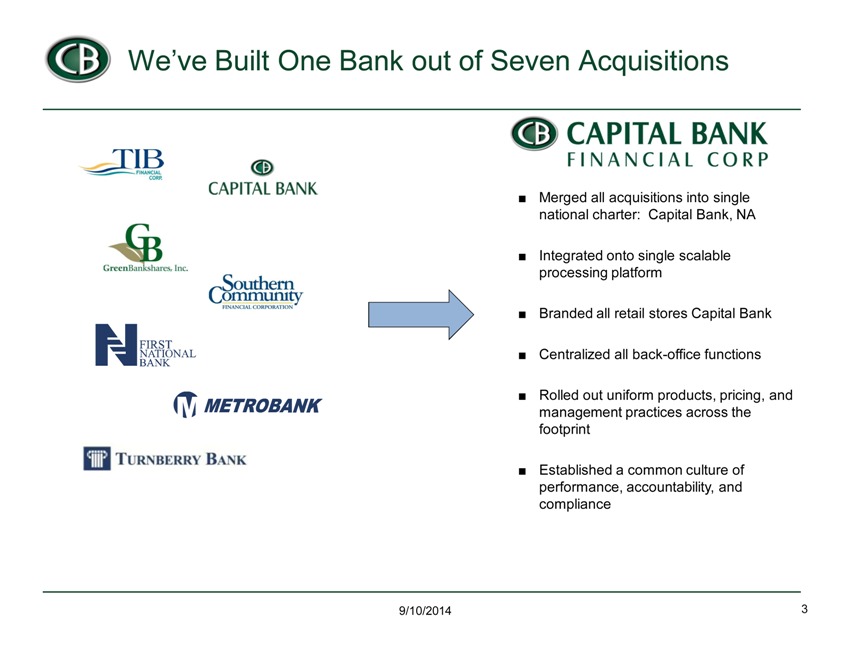
CB We’ve Built One Bank out of Seven Acquisitions TIB FINANCIAL CORP. CB CAPITAL BANK GB GreenBankshares, Inc. Southern Community FINANCIAL CORPORATION N FIRST NATIONAL BANK M METROBANK TURNBERRY BANK Merged all acquisitions into single national charter: Capital Bank, NA Integrated onto single scalable processing platform Branded all retail stores Capital Bank Centralized all back-office functions Rolled out uniform products, pricing, and management practices across the footprint Established a common culture of performance, accountability, and compliance 9/10/2014 3
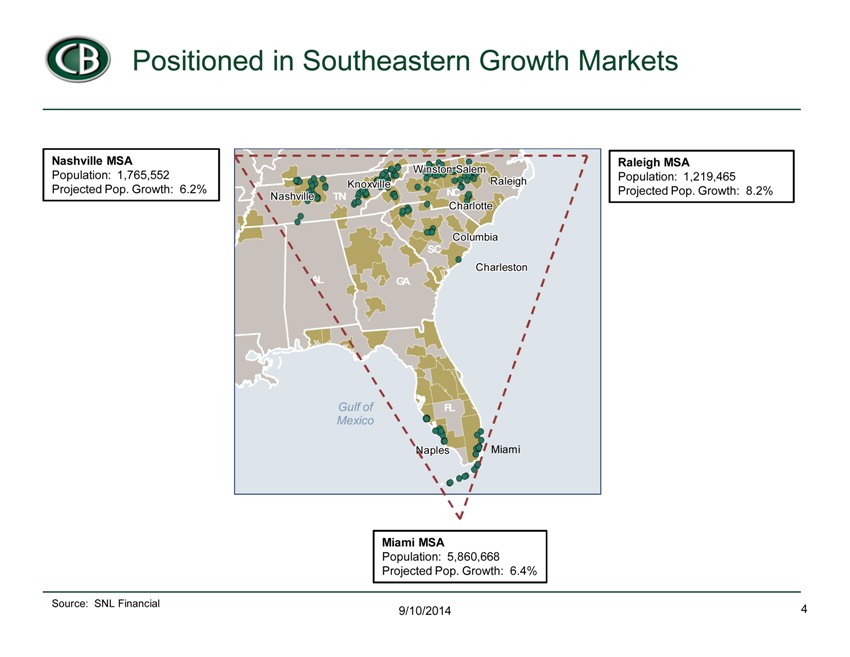
Positioned in Southeastern Growth Markets Source: SNL Financial 4 9/10/2014 Nashville MSA Population: 1,765,552
Projected Pop. Growth: 6.2% Miami MSA Population: 5,860,668 Projected Pop. Growth: 6.4% Raleigh MSA Population: 1,219,465 TN Projected Pop. Growth: 8.2% KY NC GA SC AL Gulf of FL Mexico
NNNaaaaaaaaassssssssshhhhhhhhhvvvvvvvvviiiiiiiiilllllllllllllllllleeeeeeeeeWWWiiiiiiiiinnnnnnnnnssssssssstttttttttooooooooonnn
nnnnnn————SSSaaaaaaaaallllllllleeeeeeeeemmmKKKnnnnnnnnnoooooooooxxxxxxxxxvvvvvvvvviiiiiiiiilllllllllllllllllleeeeeeeee
NNNaaaaaaaaapppppppppllllllllleeeeeeeeesssssssss MiamiCCChhhhhhhhhaaaaaaaaarrrrrrrrrllllllllloooooooootttttttttttttttttteeeeeeeeeRRRRRRaaaaaaaaallllllllleeeeeeeeeiiiiiiiiiggggggggg
hhhhhhhhhCCChhhhhhhhhaaaaaaaaarrrrrrrrrllllllllleeeeeeeeessssssssstttttttttooooooooonnnnnnnnn CCCooooooooollllllllluuuuuuuuummmbbbbbbbbbiiiiiiiiiaaaaaaaaa
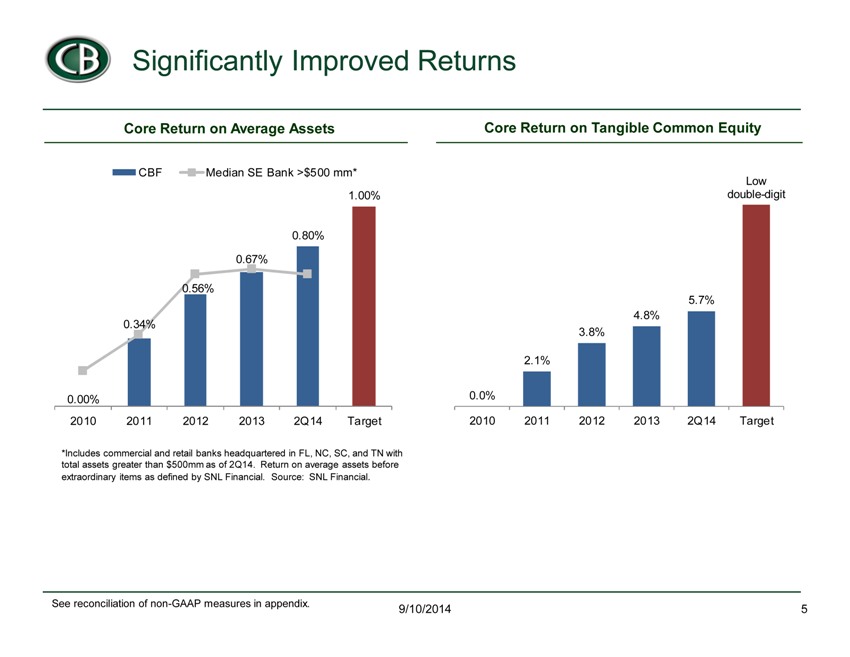
CB Significantly Improved Returns 9/10/2014 5 Core Return on Average Assets Core Return on Tangible Common Equity 0.00% 0.34% 0.56% 0.67% 0.80% 1.00% 2010 2011 2012 2013 2Q14 Target CBF Median SE Bank >$500 mm* 0.0% 2.1% 3.8% 4.8% 5.7% Low double-digit 2010 2011 2012 2013 2Q14 Target See reconciliation of non-GAAP measures in appendix. *Includes commercial and retail banks headquartered in FL, NC, SC, and TN with total assets greater than $500mm as of 2Q14. Return on average assets before extraordinary items as defined by SNL Financial. Source: SNL Financial.
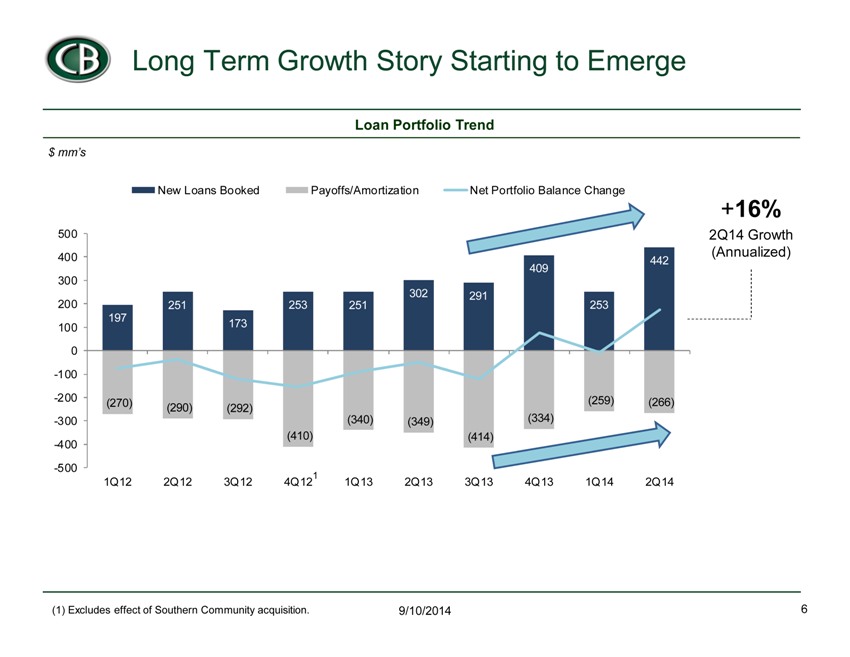
CB 197 251 173 253 251 302 291 409 253 442 (270) (290) (292) (410) (340) (349) (414) (334) (259) (266) -500 -400 -300 -200 -100 0 100 200 300 400 500 1Q12 2Q12 3Q12 4Q12 1Q13 2Q13 3Q13 4Q13 1Q14 2Q14 New Loans Booked Payoffs/Amortization Net Portfolio Balance Change 1 Long Term Growth Story Starting to Emerge 9/10/2014 6 +16% 2Q14 Growth (Annualized) Loan Portfolio Trend $ mm’s (1) Excludes effect of Southern Community acquisition.
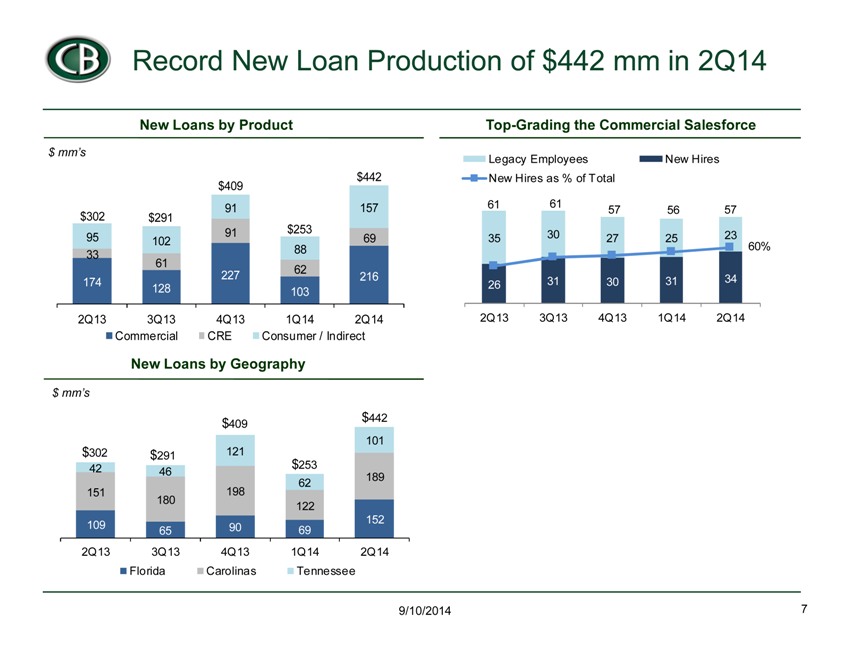
CB Record New Loan Production of $442 mm in 2Q14 9/10/2014 7 New Loans by Geography New Loans by Product $ mm’s $ mm’s Top-Grading the Commercial Salesforce 174 128 227 103 216 33 61 91 62 95 102 69 91 88 157 2Q13 3Q13 4Q13 1Q14 2Q14 Commercial CRE Consumer / Indirect $442 $302 $291 $409 $253 109 65 90 69 152 151 180 198 122 189 42 46 121 62 101 2Q13 3Q13 4Q13 1Q14 2Q14 Florida Carolinas Tennessee $302 $253 $291 $409 $442 26 31 30 31 34 35 30 27 25 23 60% 0% 20% 40% 60% 80% 100% -5 5 15 25 35 45 55 65 2Q13 3Q13 4Q13 1Q14 2Q14 Legacy Employees New Hires New Hires as % of Total 61 61 57 56 57
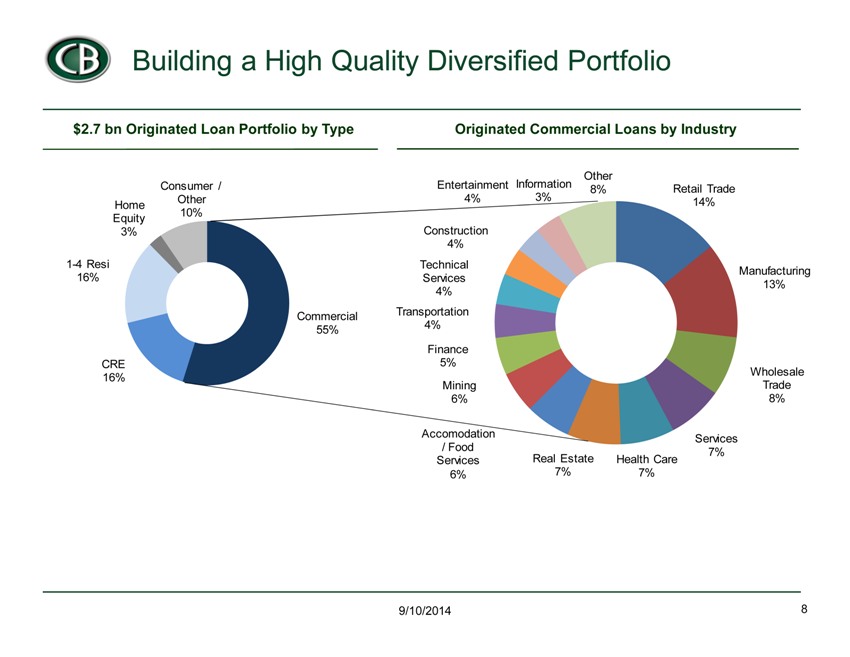
CB Building a High Quality Diversified Portfolio 9/10/2014 8 Originated Commercial Loans by Industry Retail Trade 14% Manufacturing 13% Wholesale Trade 8% Services Health Care 7% 7% Real Estate 7% Accomodation / Food Services 6% Mining 6% Finance 5% Transportation 4% Technical Services 4% Construction 4% Entertainment 4% Information 3% Other 8% $2.7 bn Originated Loan Portfolio by Type Commercial 55% CRE 16% 1-4 Resi 16% Home Equity 3% Consumer / Other 10%
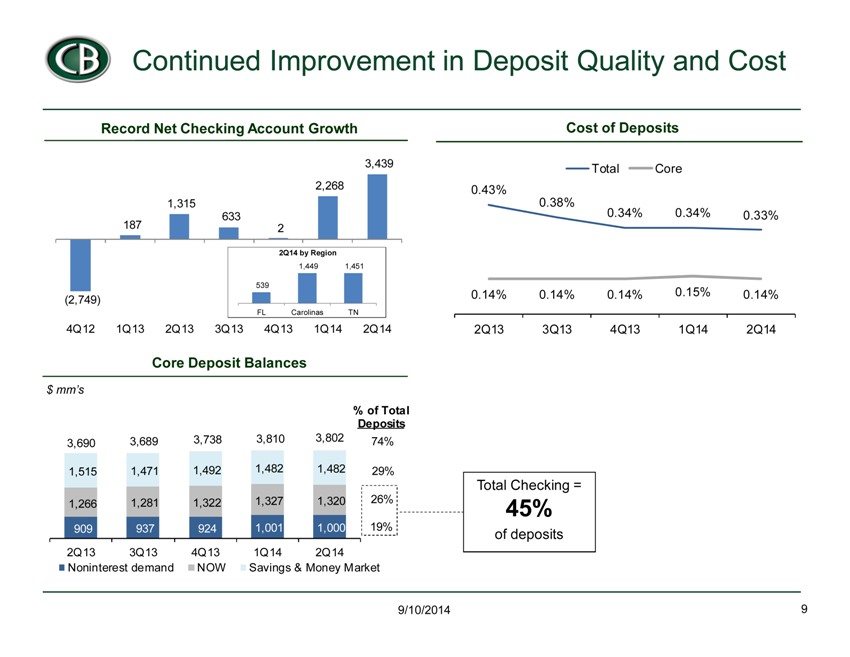
CB Continued Improvement in Deposit Quality and Cost 9/10/2014 9 Cost of Deposits Core Deposit Balances $ mm’s Record Net Checking Account Growth (2,749) 187 1,315 633 2 2,268 3,439 4Q12 1Q13 2Q13 3Q13 4Q13 1Q14 2Q14 0.43% 0.38% 0.34% 0.34% 0.33% 0.14% 0.14% 0.14% 0.15% 0.14% 2Q13 3Q13 4Q13 1Q14 2Q14 Total Core 909 937 924 1,001 1,000 1,266 1,281 1,322 1,327 1,320 1,515 1,471 1,492 1,482 1,482 2Q13 3Q13 4Q13 1Q14 2Q14 Noninterest demand NOW Savings & Money Market 3,690 3,689 3,738 3,810 3,802 % of Total Deposits 74% 29% 26% 19% 539 1,449 1,451 FL Carolinas TN 2Q14 by Region Total Checking = 45% of deposits
CB Second Quarter Highlights 9/10/2014 10 ? GAAP net income of $12.4 mm, or $0.25 per diluted share, up 47% y/y ? Core net income of $13.1 mm, or $0.26 per diluted share, up 30% y/y ? Core ROA improved to 0.80%, up from 0.61% in 2Q13 ? Record net checking account growth, non-interest bearing deposits up 10% y/y ? Legacy credit expenses down 33% q/q, record REO sales of $29 mm ? TBV per share improved by $0.16 to $18.85 ? Strongly capitalized with consolidated tier 1 leverage of 14.6% See reconciliation of non-GAAP measures in appendix.
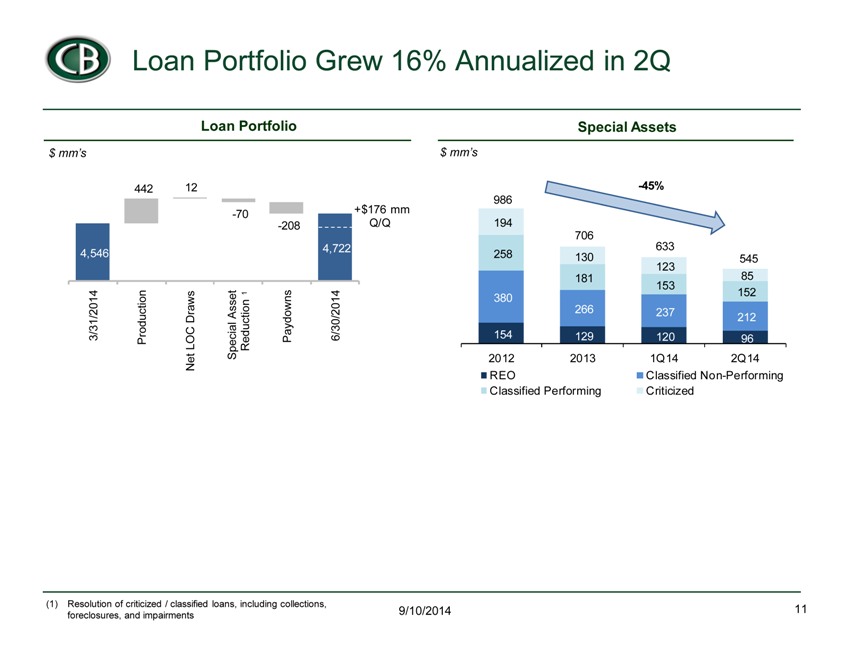
CB Loan Portfolio Grew 16% Annualized in 2Q 9/10/2014 11 Loan Portfolio (1) Resolution of criticized / classified loans, including collections, foreclosures, and impairments $ mm’s Special Assets $ mm’s 4,546 4,722 3/31/2014 Production Net LOC Draws Special Asset Reduction Paydowns 6/30/2014 442 -70 -208 1 12 +$176 mm Q/Q 154 129 120 96 380 266 237 212 258 181 153 152 194 130 123 85 2012 2013 1Q14 2Q14 REO Classified Non-Performing Classified Performing Criticized 986 -45% 706 633 545
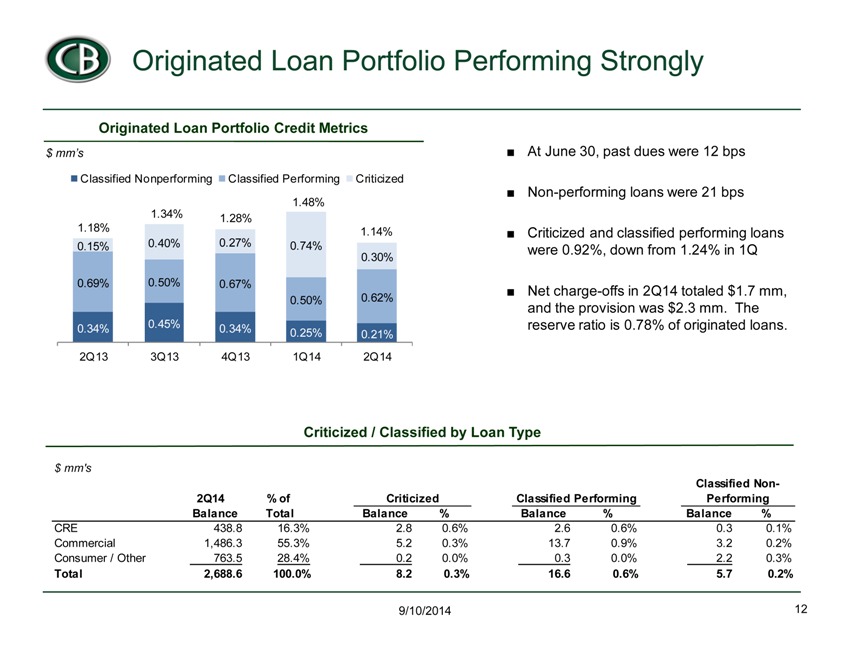
CB Originated Loan Portfolio Performing Strongly 9/10/2014 12 ? At June 30, past dues were 12 bps ? Non-performing loans were 21 bps ? Criticized and classified performing loans were 0.92%, down from 1.24% in 1Q ? Net charge-offs in 2Q14 totaled $1.7 mm, and the provision was $2.3 mm. The reserve ratio is 0.78% of originated loans. Originated Loan Portfolio Credit Metrics $ mm’s Criticized / Classified by Loan Type 0.34% 0.45% 0.34% 0.25% 0.21% 0.69% 0.50% 0.67% 0.50% 0.62% 0.15% 0.40% 0.27% 0.74% 0.30% 2Q13 3Q13 4Q13 1Q14 2Q14 Classified Nonperforming Classified Performing Criticized 1.18% 1.34% 1.28% 1.48% 1.14% $ mm’s 2Q14 % of Balance Total Balance % Balance % Balance % CRE 438.8 16.3% 2.8 0.6% 2.6 0.6% 0.3 0.1% Commercial 1,486.3 55.3% 5.2 0.3% 13.7 0.9% 3.2 0.2% Consumer / Other 763.5 28.4% 0.2 0.0% 0.3 0.0% 2.2 0.3% Total 2,688.6 100.0% 8.2 0.3% 16.6 0.6% 5.7 0.2% Criticized Classified Performing Classified Non- Performing
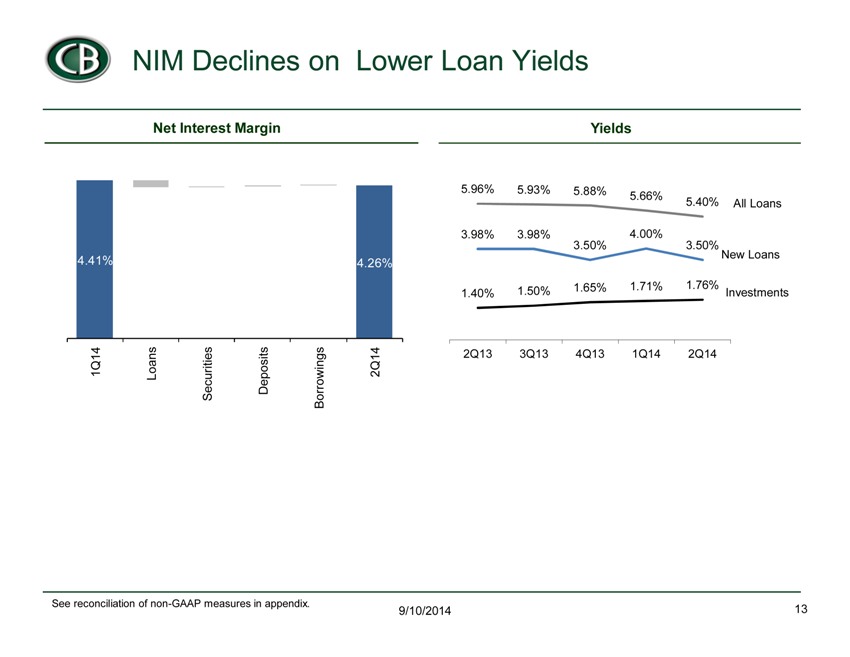
CB NIM Declines on Lower Loan Yields 9/10/2014 13 Net Interest Margin Yields See reconciliation of non-GAAP measures in appendix. 4.41% 4.26% 1Q14 Loans Securities Deposits Borrowings 2Q14 5.96% 5.93% 5.88% 5.66% 5.40% 1.40% 1.50% 1.65% 1.71% 1.76% 3.98% 3.98% 3.50% 4.00% 3.50% 2Q13 3Q13 4Q13 1Q14 2Q14 All Loans Investments New Loans

CB Core Non-interest Income Stronger Sequentially 9/10/2014 14 Core Non-interest Income $ mm’s See reconciliation of non-GAAP measures in appendix. 14.4 15.9 15.0 13.4 14.0 -4 -2 0 2 4 6 8 10 12 14 16 18 2Q13 3Q13 4Q13 1Q14 2Q14 FDIC indemnification asset (IA) Core noninterest income, ex FDIC IA $ mm’s 2Q13 1Q14 2Q14 Services charges on deposits 6.3 5.4 5.7 Debit card income 3.0 2.8 3.1 Fees on mortgage loans sold 1.6 0.8 1.1 Investment advisory and trust fees 0.4 1.3 0.9 Other 3.1 3.1 3.2 Total 14.4 13.4 14.0 FDIC indemnification asset (1.1) (2.2) (2.1) Total core non-interest income 13.3 11.2 11.9 Core fee ratio 16.9% 15.2% 16.4%
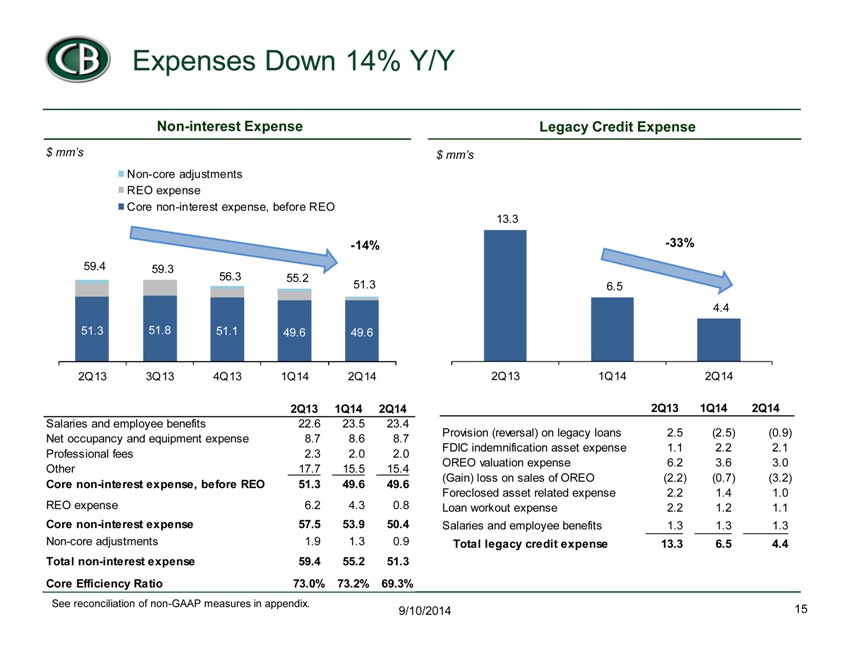
51.3 51.8 51.1 49.6 49.6 2Q13 3Q13 4Q13 1Q14 2Q14 Non-core adjustments REO expense Core non-interest expense, before REO 51.3 59.3 56.3 59.4 55.2 -14% Expenses Down 14% Y/Y 9/10/2014 15 Non-interest Expense $ mm’s See reconciliation of non-GAAP measures in appendix. Legacy Credit Expense $ mm’s 13.3 6.5 4.4 2Q13 1Q14 2Q14 -33% 2Q13 1Q14 2Q14 Salaries and employee benefits 22.6 23.5 23.4 Net occupancy and equipment expense 8.7 8.6 8.7 Professional fees 2.3 2.0 2.0 Other 17.7 15.5 15.4 Core non-interest expense, before REO 51.3 49.6 49.6 REO expense 6.2 4.3 0.8 Core non-interest expense 57.5 53.9 50.4 Non-core adjustments 1.9 1.3 0.9 Total non-interest expense 59.4 55.2 51.3 Core Efficiency Ratio 73.0% 73.2% 69.3% 2Q13 1Q14 2Q14 Provision (reversal) on legacy loans 2.5 (2.5) (0.9) FDIC indemnification asset expense 1.1 2.2 2.1 OREO valuation expense 6.2 3.6 3.0 (Gain) loss on sales of OREO (2.2) (0.7) (3.2) Foreclosed asset related expense 2.2 1.4 1.0 Loan workout expense 2.2 1.2 1.1 Salaries and employee benefits 1.3 1.3 1.3 Total legacy credit expense 13.3 6.5 4.4
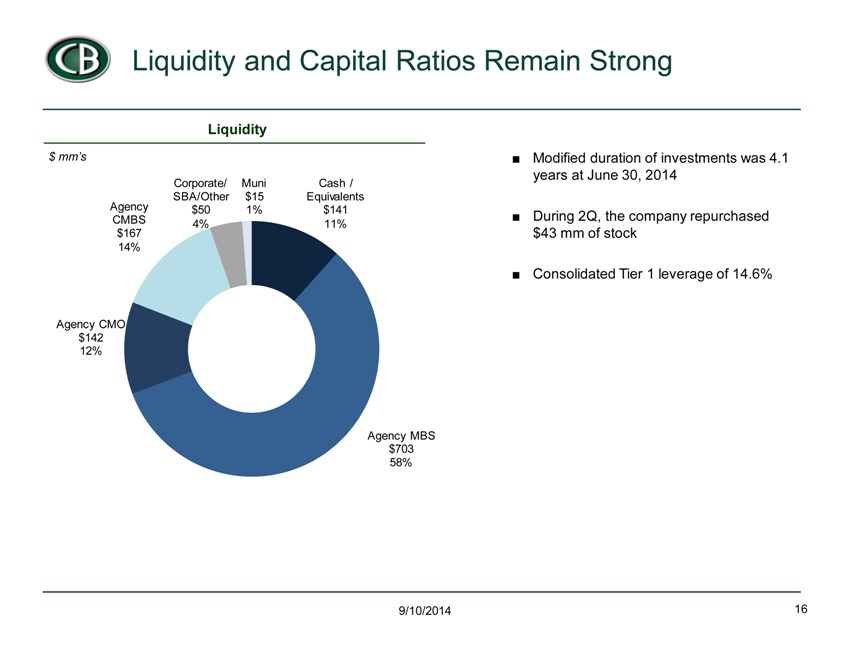
Liquidity and Capital Ratios Remain Strong 9/10/2014 16 ? Modified duration of investments was 4.1 years at June 30, 2014 ? During 2Q, the company repurchased $43 mm of stock ? Consolidated Tier 1 leverage of 14.6% Liquidity $ mm’s Cash / Equivalents $141 11% Agency MBS $703 58% Agency CMO $142 12% Agency CMBS $167 14% Corporate/ SBA/Other $50 4% Muni $15 1%
CB 17 Capital Bank Investment Highlights ? Experienced management team with institutional track record ; ? Positioned in Southeastern growth markets ? Long-term, disciplined, sustainable growth story ? Focused on deploying capital and improving profitability ? Attractive valuation 9/10/2014
Appendix 9/10/2014 18
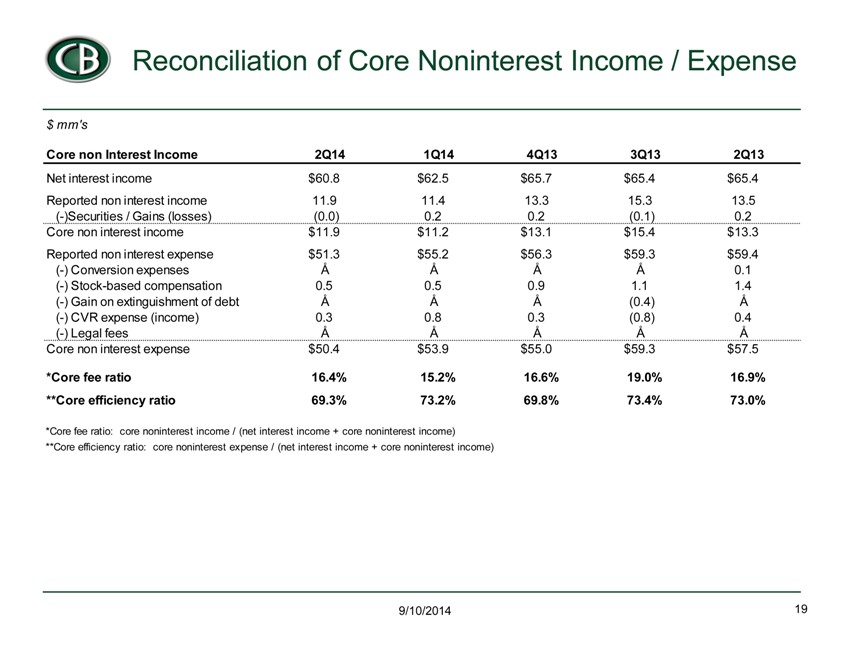
Reconciliation of Core Noninterest Income / Expense $ mm’s Core non Interest Income 2Q14 1Q14 4Q13 3Q13 2Q13 Net interest income $60.8 $62.5 $65.7 $65.4 $65.4 Reported non interest income 11.9 11.4 13.3 15.3 13.5 (-)Securities / Gains (losses) (0.0) 0.2 0.2 (0.1) 0.2 Core non interest income $11.9 $11.2 $13.1 $15.4 $13.3 Reported non interest expense $51.3 $55.2 $56.3 $59.3 $59.4 (-) Conversion expenses – – – – 0.1 (-) Stock-based compensation 0.5 0.5 0.9 1.1 1.4 (-) Gain on extinguishment of debt – – – (0.4) – (-) CVR expense (income) 0.3 0.8 0.3 (0.8) 0.4 (-) Legal fees – – – – – Core non interest expense $50.4 $53.9 $55.0 $59.3 $57.5 *Core fee ratio 16.4% 15.2% 16.6% 19.0% 16.9% **Core efficiency ratio 69.3% 73.2% 69.8% 73.4% 73.0% *Core fee ratio: core noninterest income / (net interest income + core noninterest income) **Core efficiency ratio: core noninterest expense / (net interest income + core noninterest income) 9/10/2014 19
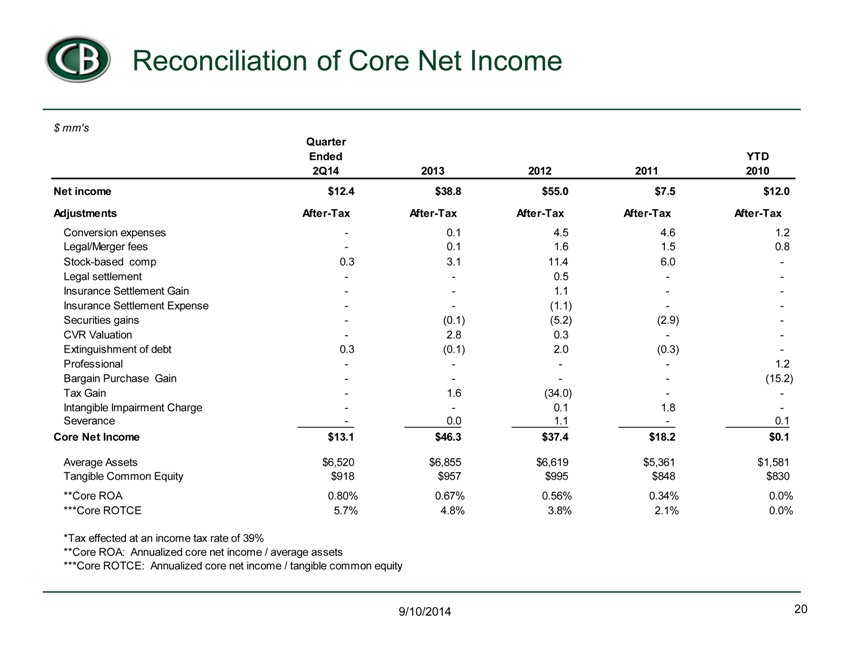
Reconciliation of Core Net Income $ mm’s Quarter Ended YTD 2Q14 2013 2012 2011 2010 Net income $12.4 $38.8 $55.0 $7.5 $12.0 Adjustments After-Tax After-Tax After-Tax After-Tax After-Tax Conversion expenses—0.1 4.5 4.6 1.2 Legal/Merger fees—0.1 1.6 1.5 0.8 Stock-based comp 0.3 3.1 11.4 6.0—Legal settlement — 0.5 — Insurance Settlement Gain — 1.1 — Insurance Settlement Expense — (1.1) — Securities gains—(0.1) (5.2) (2.9)—CVR Valuation—2.8 0.3 — Extinguishment of debt 0.3 (0.1) 2.0 (0.3)—Professional — — 1.2 Bargain Purchase Gain — — (15.2) Tax Gain—1.6 (34.0) — Intangible Impairment Charge — 0.1 1.8—Severance—0.0 1.1—0.1 Core Net Income $13.1 $46.3 $37.4 $18.2 $0.1 Average Assets $6,520 $6,855 $6,619 $5,361 $1,581 Tangible Common Equity $918 $957 $995 $848 $830 **Core ROA 0.80% 0.67% 0.56% 0.34% 0.0% ***Core ROTCE 5.7% 4.8% 3.8% 2.1% 0.0% *Tax effected at an income tax rate of 39% **Core ROA: Annualized core net income / average assets ***Core ROTCE: Annualized core net income / tangible common equity 9/10/2014 20
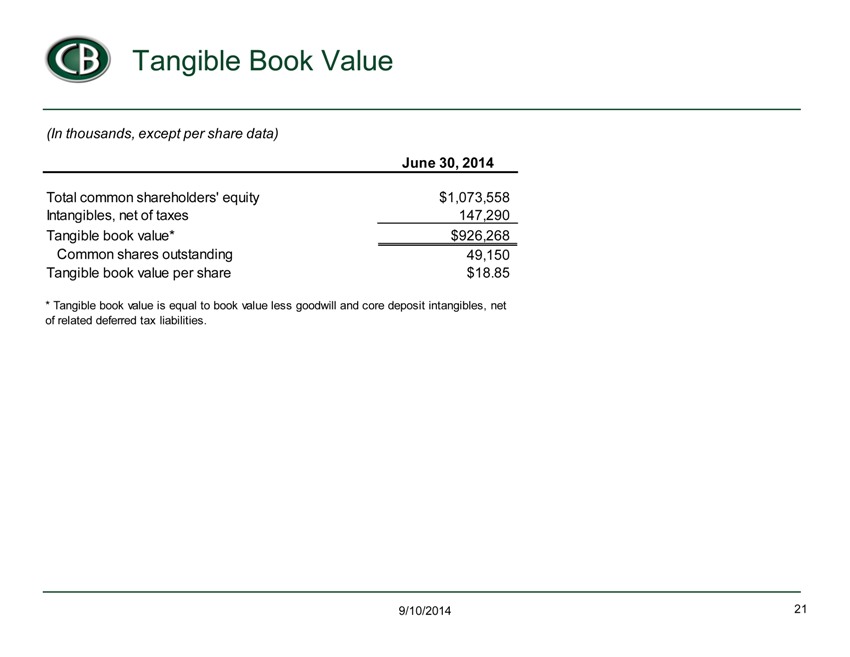
CB Tangible Book Value (In thousands, except per share data) June 30, 2014 Total common shareholders’ equity $1,073,558 Intangibles, net of taxes 147,290 Tangible book value* $926,268 Common shares outstanding 49,150 Tangible book value per share $18.85 * Tangible book value is equal to book value less goodwill and core deposit intangibles, net of related deferred tax liabilities. 9/10/2014 21