Attached files
| file | filename |
|---|---|
| 8-K - 8-K - SUNTRUST BANKS INC | a8kbody992014barclays.htm |

B l Fi i l S i C farc ays nanc a erv ces on erence William H. Rogers, Jr., Chairman and Chief Executive Officer, SunTrust Banks, Inc. September 9, 2014
Important Cautionary Statement The following should be read in conjunction with the financial statements notes and other information contained in the Company’s 2013 Annual Report on Form 10‐K Quarterly Reports on Form 10‐Q and Current Reports on Form Disclaimer , , , 8‐K. This presentation includes non‐GAAP financial measures to describe SunTrust’s performance. The reconciliations of those measures to GAAP measures are provided within or in the appendix of this presentation. In this presentation, the Company presents net interest income and net interest margin on a fully taxable‐equivalent (“FTE”) basis, and ratios on an annualized basis. The FTE basis adjusts for the tax‐favored status of income from certain loans and investments. The Company believes this measure to be the preferred industry measurement of net interest income and provides relevant comparison between taxable and non‐taxable amounts. This presentation contains forward‐looking statements. Statements regarding future efficiency improvement are forward looking statements. Also, any statement that does not describe historical or current facts is a forward‐looking statement. These statements often include the words “believes,” “expects,” “anticipates,” “estimates,” “intends,” “plans,” “targets,” “initiatives,” “potentially,” “probably,” “projects,” “outlook” or similar expressions or future l b h “ ” “ ll ” “ h l ” “ l ” “ l " h b h b l f f f l l bl hconditiona ver s suc as may, wi , s ou d, wou d, and cou d ; suc statements are ased upon t e current e ie s and expectations o management and on in ormation current y avai a e to management. Suc statements speak as of the date hereof, and we do not assume any obligation to update the statements made herein or to update the reasons why actual results could differ from those contained in such statements in light of new information or future events. Forward‐looking statements are subject to significant risks and uncertainties. Investors are cautioned against placing undue reliance on such statements. Actual results may differ materially from those set forth in the forward‐ looking statements. Factors that could cause actual results to differ materially from those described in the forward‐looking statements can be found in Part I, “Item 1A. Risk Factors” in our Annual Report on Form 10‐K for the year ended December 31, 2013 and in other periodic reports that we file with the SEC. Those factors include: as one of the largest lenders in the Southeast and Mid‐Atlantic U.S. and a provider of financial products and services to consumers and businesses across the U.S., our financial results have been, and may continue to be, materially affected by general economic conditions, particularly unemployment levels and home prices in the U.S., and a deterioration of economic conditions or of the financial markets may materially adversely affect our lending and other businesses and our financial results and condition; legislation and regulation, including the Dodd‐Frank Act, as well as future legislation and/or regulation, could require us to change certain of our business practices, reduce our revenue, impose additional costs on us, or otherwise adversely affect our business operations and/or competitive position; we are subject to capital adequacy and liquidity guidelines and, if we fail to meet these guidelines, our financial condition would be adversely affected; loss of customer deposits and market illiquidity could increase our funding costs; we rely on the mortgage secondary market and GSEs for some of our liquidity; our framework for managing risks may not be effective in mitigating risk and loss to us; we are subject to credit risk; our ALLL may not be adequate to cover our eventual losses; we may have more credit risk and higher credit losses to the extent that our loans are concentrated by loan type, industry segment, borrower type, or location of the borrower or collateral; we will realize future losses if the proceeds we receive upon liquidation of NPAs are less than the carrying value of such assets; a downgrade in the U.S. government's sovereign credit rating, or in the credit ratings of instruments issued, insured or guaranteed by related institutions, agencies or instrumentalities, could result in risks to us and general economic conditions that we are not able to predict; weakness in the real estate market, including the secondary residential mortgage loan markets, has adversely affected us and may continue to adversely affect us; we are subject to certain risks related to originating and selling mortgages, and may be required to repurchase mortgage loans or indemnify mortgage loan purchasers as a result of breaches of representations and warranties, borrower fraud, or certain breaches of our servicing agreements, and this could harm our liquidity, results of ti d fi i l diti f t i i k i f l d b t i t d i t i b i d t h t l i b i t f dit lopera ons, an nanc a con on; we ace cer a n r s s as a serv cer o oans, an may e erm na e as a serv cer or mas er serv cer, e requ re o repurc ase a mor gage oan or re m urse nves ors or cre osses on a mortgage loan, or incur costs, liabilities, fines and other sanctions if we fail to satisfy our servicing obligations, including our obligations with respect to mortgage loan foreclosure actions; financial difficulties or credit downgrades of mortgage and bond insurers may adversely affect our servicing and investment portfolios; we are subject to risks related to delays in the foreclosure process; we face risks related to recent mortgage settlements; we may continue to suffer increased losses in our loan portfolio despite enhancement of our underwriting policies and practices; our mortgage production and servicing revenue can be volatile; changes in market interest rates or capital markets could adversely affect our revenue and expense, the value of assets and obligations, and the availability and cost of capital and liquidity; changes in interest rates could also reduce the value of our MSRs and mortgages held for sale, reducing our earnings; the fiscal and monetary policies of the federal government and its agencies could have a material adverse effect on our earnings; clients could pursue alternatives to bank deposits, causing us to lose a relatively inexpensive source of funding; consumers may decide not to use banks to complete their financial transactions, which could affect net income; we have businesses other than banking which subject us to a variety of risks; hurricanes and other disasters may adversely affect loan portfolios and operations and increase the cost of doing business; negative public opinion could damage our reputation and adversely impact business and revenues; we rely on other companies to provide key components of our business infrastructure; a failure in or breach of our operational or security systems or infrastructure, or those of our third party vendors and other service providers, including as a result of cyber attacks, could disrupt our businesses, result in the disclosure or misuse of confidential or proprietary information, damage our reputation, increase our costs and cause losses; the soundness of other financial institutions could adversely affect us; we depend on the accuracy and completeness of information about clients and counterparties; competition in the financial services industry is intense and could result in losing business or margin declines; maintaining or increasing market share depends on market acceptance and regulatory approval of new products and services; we might not pay dividends on our common stock; our ability to receive dividends from our subsidiaries could affect our liquidity and ability to pay dividends; disruptions in our ability to access global capital markets may adversely affect our capital resources and liquidity; any reduction in our credit rating could increase the cost of our funding from the capital markets; we have in the past and may in the future pursue acquisitions, which could affect costs and from which we may not be able to realize anticipated benefits; we are subject to certain litigation, and our expenses related to this litigation may adversely affect our results; we may incur fines, penalties and other negative consequences from regulatory violations, possibly even inadvertent or unintentional violations; we depend on the expertise of key personnel, and if these individuals leave or change their roles without effective replacements, operations may suffer; we may not be able to hire or retain additional qualified personnel and recruiting and compensation costs may increase as a result of turnover, both of which may increase costs and reduce profitability and may adversely impact our ability to implement our business strategies; our accounting policies and processes are critical to how we report our financial condition and results of operations and require management to make estimates about matters that are uncertain; changes in our accounting policies or in 2 , accounting standards could materially affect how we report our financial results and condition; our stock price can be volatile; our disclosure controls and procedures may not prevent or detect all errors or acts of fraud; our financial instruments carried at fair value expose us to certain market risks; our revenues derived from our investment securities may be volatile and subject to a variety of risks; and we may enter into transactions with off‐balance sheet affiliates or our subsidiaries.
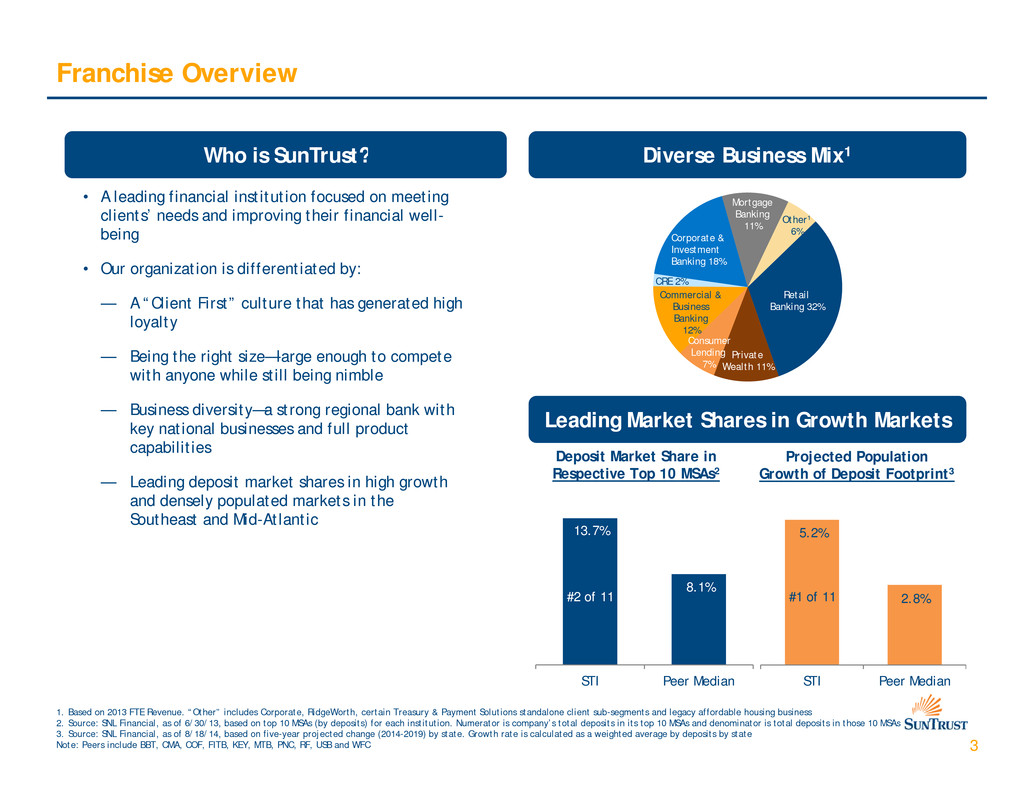
Franchise Overview Wh i S T ? Di B i Mi 1o s un rust verse us ness x • A leading financial institution focused on meeting clients’ needs and improving their financial well- being Other1 6% Mortgage Banking 11% Corporate & Investment • Our organization is differentiated by: — A “Client First” culture that has generated high loyalty Retail Banking 32% Banking 18% CRE 2% Commercial & Business Banking 12% Consumer L di— Being the right size—large enough to compete with anyone while still being nimble — Business diversity—a strong regional bank with key national businesses and full product capabilities Leading Market Shares in Growth Markets en ng 7% Private Wealth 11% — Leading deposit market shares in high growth and densely populated markets in the Southeast and Mid-Atlantic Deposit Market Share in Respective Top 10 MSAs2 Projected Population Growth of Deposit Footprint3 13.7% 5.2% #2 of 11 8.1% #1 of 11 2.8% 3 1. Based on 2013 FTE Revenue. “Other” includes Corporate, RidgeWorth, certain Treasury & Payment Solutions standalone client sub-segments and legacy affordable housing business 2. Source: SNL Financial, as of 6/30/13, based on top 10 MSAs (by deposits) for each institution. Numerator is company’s total deposits in its top 10 MSAs and denominator is total deposits in those 10 MSAs 3. Source: SNL Financial, as of 8/18/14, based on five-year projected change (2014-2019) by state. Growth rate is calculated as a weighted average by deposits by state Note: Peers include BBT, CMA, COF, FITB, KEY, MTB, PNC, RF, USB and WFC STI Peer Median STI Peer Median
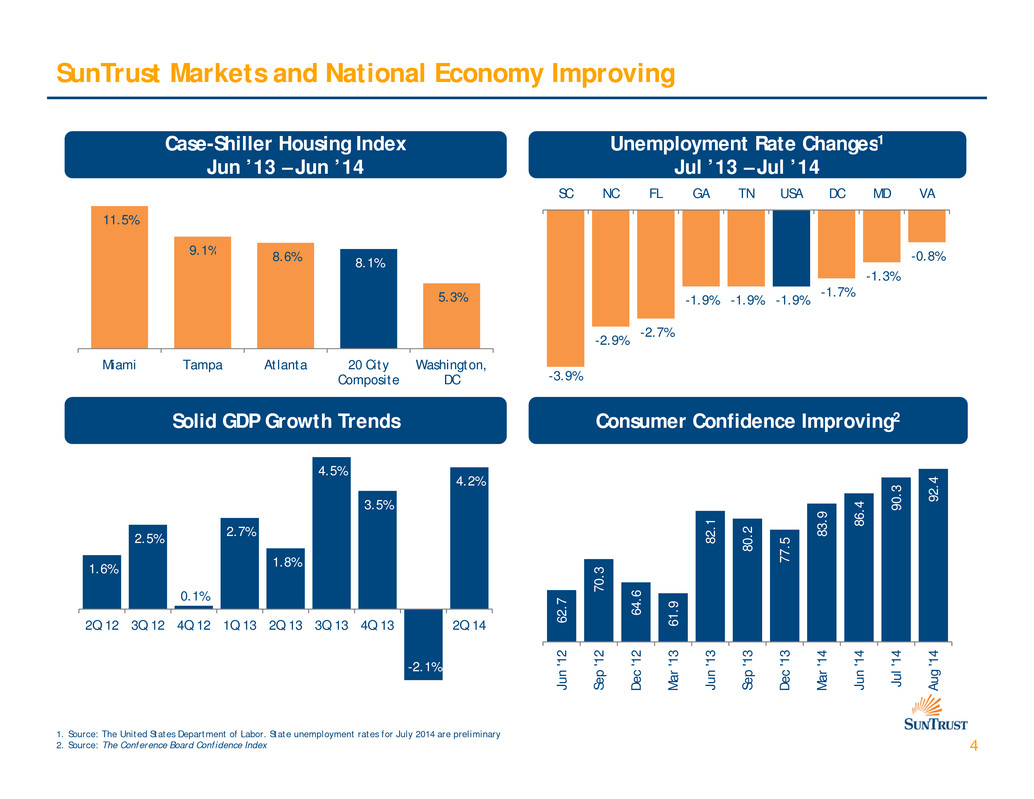
SunTrust Markets and National Economy Improving Case-Shiller Housing Index Unemployment Rate Changes1 Jun ’13 – Jun ’14 Jul ’13 – Jul ’14 11.5% 9 1% SC NC FL GA TN USA DC MD VA . 8.6% 8.1% 5.3% -2.9% -2.7% -1.9% -1.9% -1.9% -1.7% -1.3% -0.8% Consumer Confidence Improving2Solid GDP Growth Trends Miami Tampa Atlanta 20 City Composite Washington, DC -3.9% 2.5% 2.7% 4.5% 3.5% 4.2% 8 2 . 1 8 0 . 2 7 . 5 8 3 . 9 8 6 . 4 9 0 . 3 9 2 . 4 1.6% 0.1% 1.8% 2Q 12 3Q 12 4Q 12 1Q 13 2Q 13 3Q 13 4Q 13 1Q 14 2Q 14 6 2 . 7 7 0 . 3 6 4 . 6 6 1 . 9 8 7 7 2 2 2 3 3 3 4 4 4 4 4 1. Source: The United States Department of Labor. State unemployment rates for July 2014 are preliminary 2. Source: The Conference Board Confidence Index -2.1% J u n ' 1 2 S e p ' 1 2 D e c ' 1 2 M a r ' 1 3 J u n ' 1 3 S e p ' 1 3 D e c ' 1 3 M a r ' 1 4 J u n ' 1 4 J u l ' 1 4 A u g ' 1 4
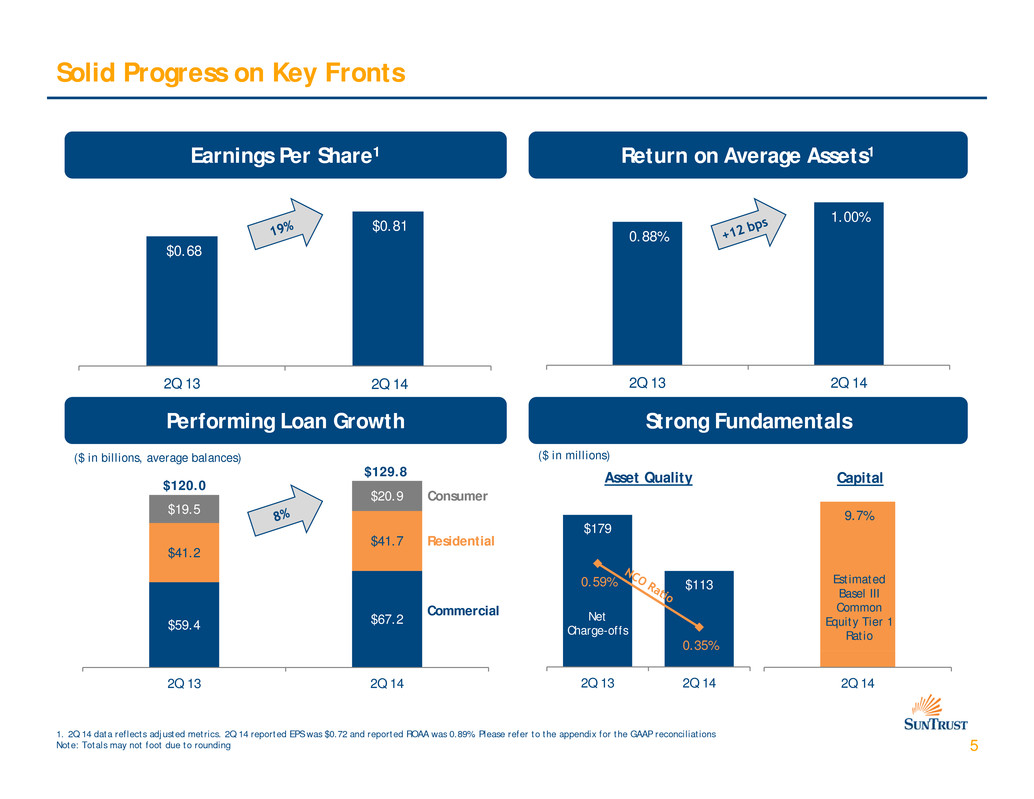
Solid Progress on Key Fronts i Sh 1 A A 1 0.88% 1.00% $0 68 $0.81 Earn ngs Per are Return on verage ssets . 2Q 13 2Q 142Q 13 Strong FundamentalsPerforming Loan Growth 2Q 14 $41 2 $41.7 $19.5 $20.9 9.7% $179 ($ in millions) $120.0 $129.8 ($ in billions, average balances) Asset Quality Capital Consumer Residential $59.4 $67.2 . $1130.59% 0.35% Net Charge-offs Estimated Basel III Common Equity Tier 1 Ratio Commercial 5 2Q 13 2Q 14 2Q 142Q 13 2Q 14 1. 2Q 14 data reflects adjusted metrics. 2Q 14 reported EPS was $0.72 and reported ROAA was 0.89%. Please refer to the appendix for the GAAP reconciliations Note: Totals may not foot due to rounding
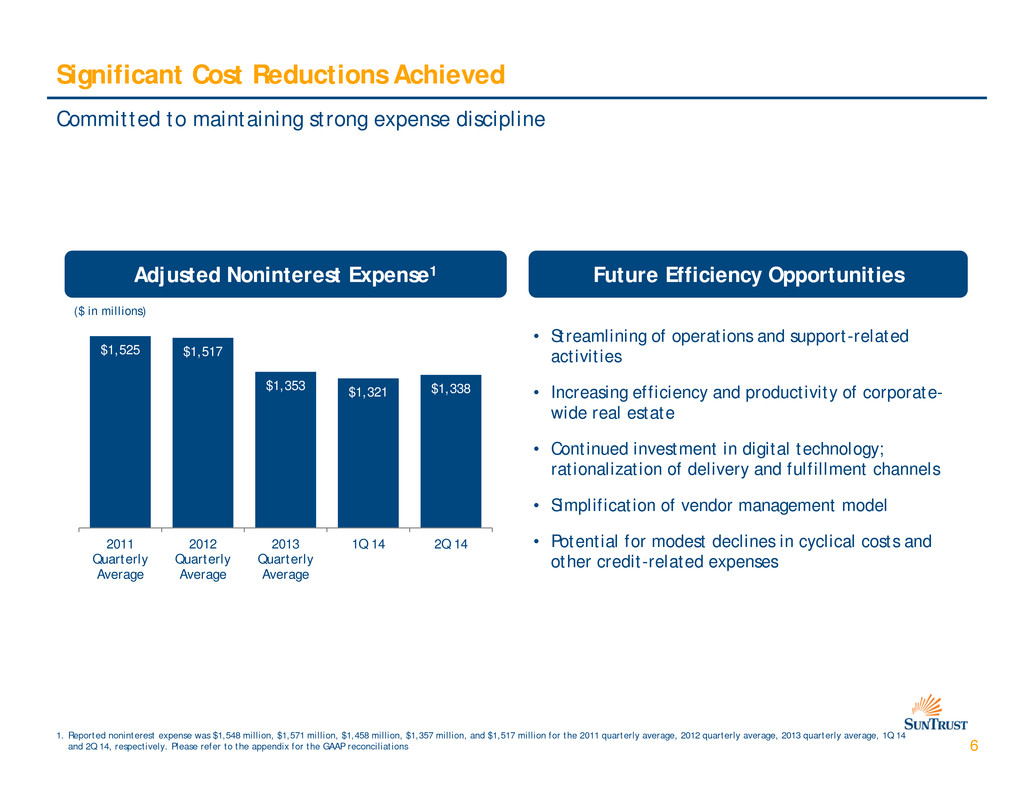
Significant Cost Reductions Achieved Committed to maintaining strong expense discipline $1 525 $1 517 ($ in millions) Future Efficiency Opportunities • Streamlining of operations and support-related Adjusted Noninterest Expense1 , , $1,353 $1,321 $1,338 activities • Increasing efficiency and productivity of corporate- wide real estate • Continued investment in digital technology; 2011 2012 2013 1Q 14 2Q 14 rationalization of delivery and fulfillment channels • Simplification of vendor management model • Potential for modest declines in cyclical costs and Quarterly Average Quarterly Average Quarterly Average other credit-related expenses 6 1. Reported noninterest expense was $1,548 million, $1,571 million, $1,458 million, $1,357 million, and $1,517 million for the 2011 quarterly average, 2012 quarterly average, 2013 quarterly average, 1Q 14 and 2Q 14, respectively. Please refer to the appendix for the GAAP reconciliations
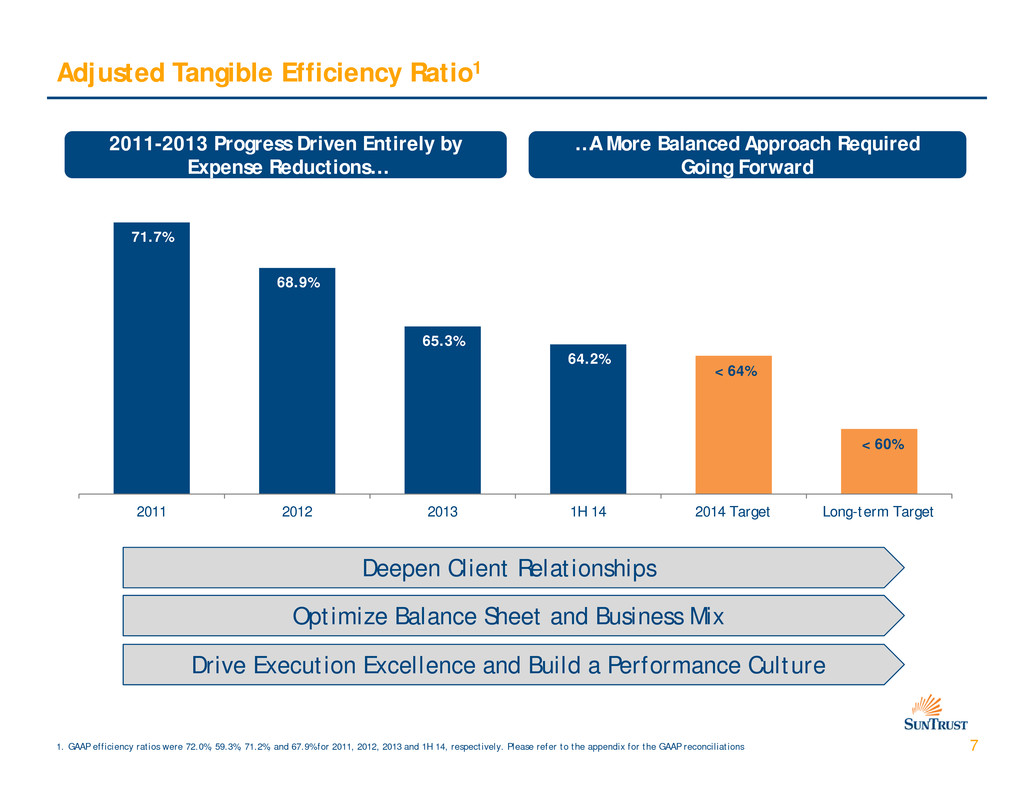
Adjusted Tangible Efficiency Ratio1 2011-2013 Progress Driven Entirely by …A More Balanced Approach Required Expense Reductions… Going Forward 71.7% 68.9% 65.3% 64.2% < 64% < 60% 2011 2012 2013 1H 14 2014 Target Long-term Target Deepen Client Relationships Optimize Balance Sheet and Business Mix 71. GAAP efficiency ratios were 72.0%, 59.3%, 71.2%, and 67.9% for 2011, 2012, 2013 and 1H 14, respectively. Please refer to the appendix for the GAAP reconciliations Drive Execution Excellence and Build a Performance Culture

Focus Areas by Segment 2014 Focus 1H 14 Adjusted Tangible Key Focus Areas Wholesale Efficiency 51 6%1 R CIB and CRE expansion R Improve Commercial and Business Banking productivity R E h T d P t S l ti Revenue Focus Expense Focus R Revenue Initiative E Expense Initiative Banking Consumer Banking . n ance reasury an aymen o u ons capabilities E Consolidate certain operations locations R Deepen client relationships via wealth i & di d and Private Wealth Management 68.8%1 management, nvestments, cre t car R Grow consumer lending E Continue digital investments and optimize delivery model R D i i d h i i ti i Mortgage Banking 76.4%2 r ve ncrease purc ase or g na on v a an improved client experience and higher cross-sell E Further reduce legacy assets and associated costs E Reduce cost to originate R Continue recent loan growth momentum R Meet more client needs E Streamline operations and support costs E Maintain broader expense discipline 64.2%3Consolidated 8 1. Reported efficiency ratios were 54.9% and 70.9% for Wholesale Banking and Consumer Banking and Private Wealth Management. The Wholesale Banking adjusted tangible efficiency ratio excludes a $36 million legacy affordable housing impairment charge in noninterest expense. The impacts from excluding the amortization and associated funding cost of intangible assets, alongside the aforementioned $36 million impairment charge, were -3.3% and -2.0% for Wholesale Banking and Consumer Banking and Private Wealth Management, respectively 2. Mortgage Banking reported efficiency ratio was 112.6%. The adjusted tangible efficiency ratio excludes $179 million of operating losses related to specific legacy mortgage matters. The impact from excluding the aforementioned $179 million of operating losses was -36.2%. 3. Calculated on a tangible basis and excluding certain items that are material and/or potentially nonrecurring. The reported efficiency ratio was 67.9%. Please refer to the appendix for the GAAP reconciliations
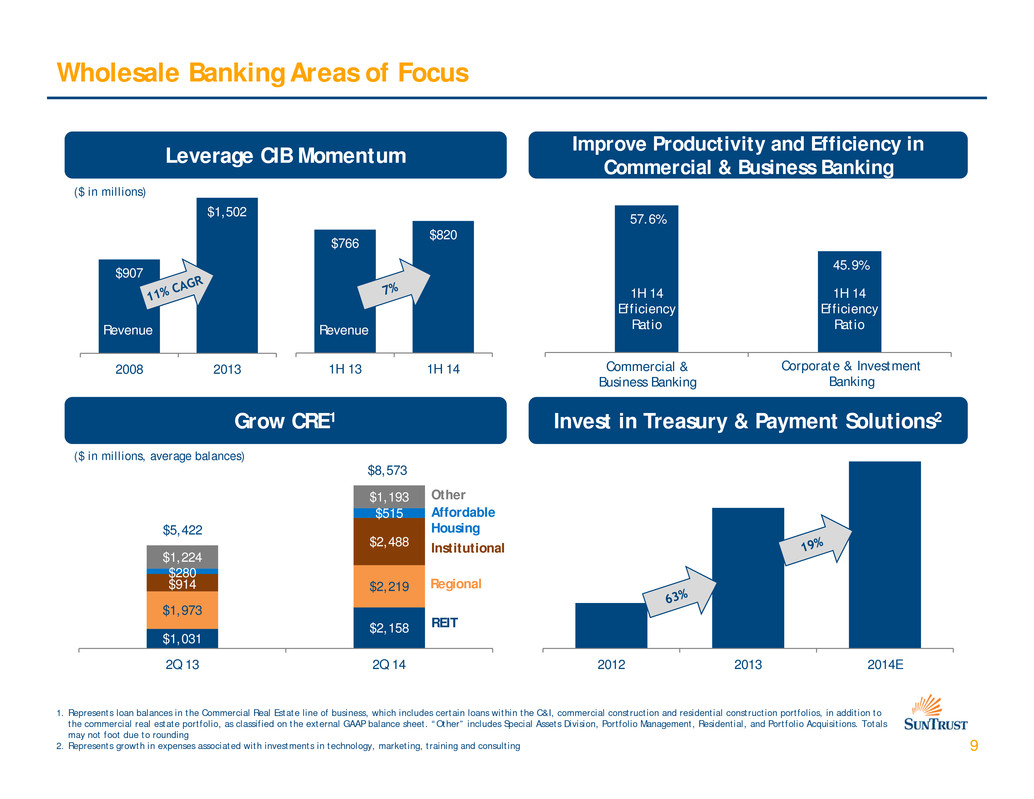
Wholesale Banking Areas of Focus C Improve Productivity and Efficiency in $766 $820 57.6% Leverage IB Momentum Commercial & Business Banking ($ in millions) $1,502 $907 45.9% 1H 14 Efficiency RatioRevenue Revenue 1H 14 Efficiency Ratio 2008 2013 1H 13 1H 14 Commercial & Business Banking Grow CRE1 Corporate & Investment Banking Invest in Treasury & Payment Solutions2 $2,488 $515 $1,193 ($ in millions, average balances) Affordable Housing Institutional Other $5,422 $8,573 $1,031 $2,158 $1,973 $2,219$914 $280 $1,224 REIT Regional 9 2Q 13 2Q 14 1. Represents loan balances in the Commercial Real Estate line of business, which includes certain loans within the C&I, commercial construction and residential construction portfolios, in addition to the commercial real estate portfolio, as classified on the external GAAP balance sheet. “Other” includes Special Assets Division, Portfolio Management, Residential, and Portfolio Acquisitions. Totals may not foot due to rounding 2. Represents growth in expenses associated with investments in technology, marketing, training and consulting 2012 2013 2014E
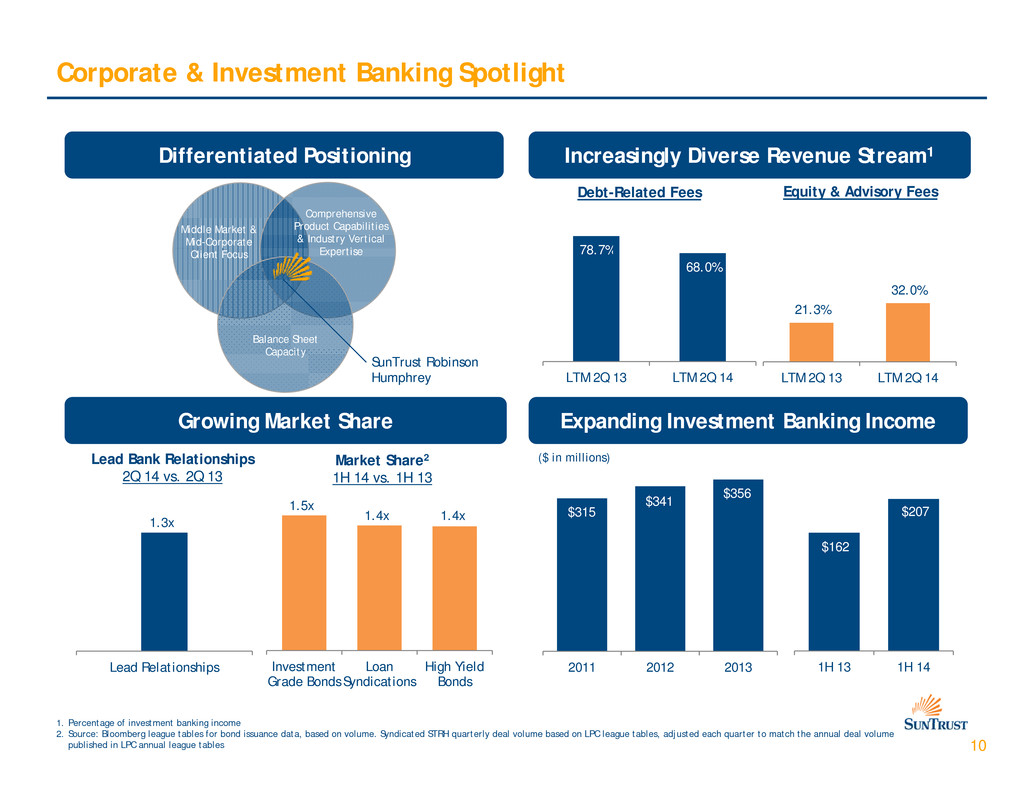
Corporate & Investment Banking Spotlight iff i d i i i i l i S 1D erent ate Pos t on ng Middle Market & Mid-Corporate Comprehensive Product Capabilities & Industry Vertical E ti Increas ng y D verse Revenue tream Debt-Related Fees Equity & Advisory Fees 78 7%Client Focus xper se Balance Sheet C it 21.3% 32.0% . 68.0% Expanding Investment Banking IncomeGrowing Market Share apac y SunTrust Robinson Humphrey LTM 2Q 13 LTM 2Q 14LTM 2Q 13 LTM 2Q 14 Market Share2 1H 14 vs. 1H 13 1.5x 1.4x 1.4x Lead Bank Relationships 2Q 14 vs. 2Q 13 1.3x ($ in millions) $315 $341 $356 $162 $207 10 2011 2012 2013 1. Percentage of investment banking income 2. Source: Bloomberg league tables for bond issuance data, based on volume. Syndicated STRH quarterly deal volume based on LPC league tables, adjusted each quarter to match the annual deal volume published in LPC annual league tables Investment Grade Bonds Loan Syndications High Yield Bonds Lead Relationships 1H 13 1H 14
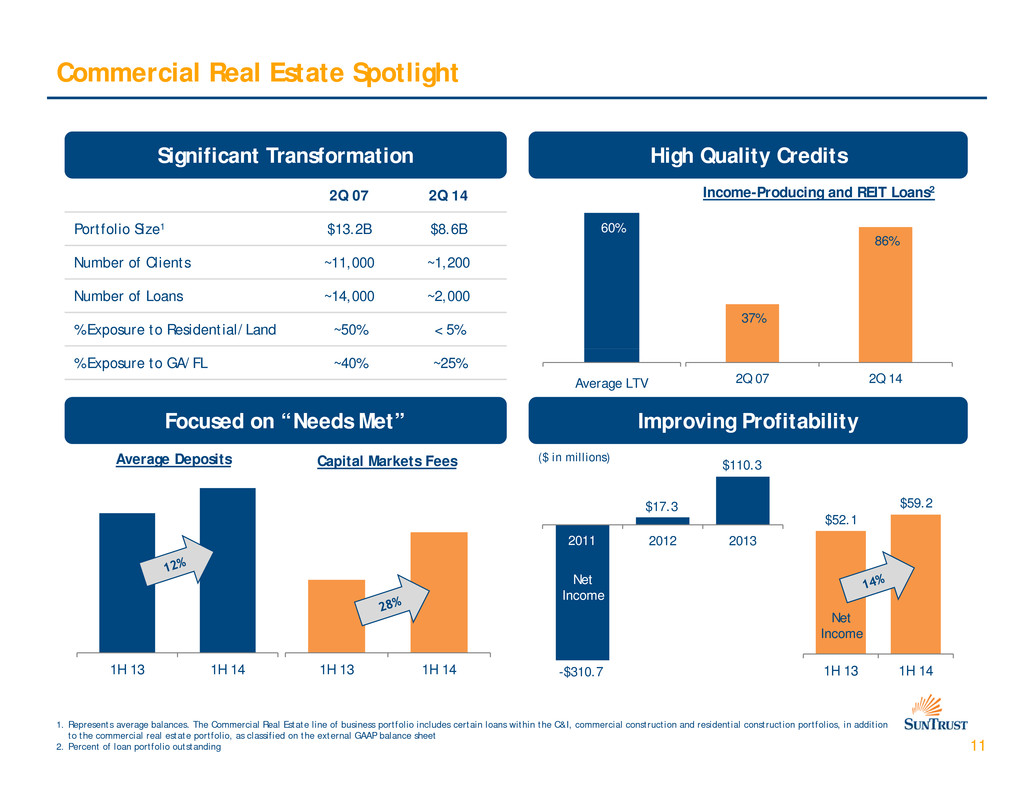
Commercial Real Estate Spotlight Si ifi f i i h Q li C di 60% gn cant Trans ormat on H g ua ty re ts 2Q 07 2Q 14 Portfolio Size1 $13.2B $8.6B 86% Income-Producing and REIT Loans2 Number of Clients ~11,000 ~1,200 Number of Loans ~14,000 ~2,000 % Exposure to Residential/Land ~50% < 5% 37% Focused on “Needs Met” Improving Profitability Average LTV % Exposure to GA/FL ~40% ~25% 2Q 07 2Q 14 2012 2013 ($ in millions)Average Deposits Capital Markets Fees $52.1 $59.2 $110.3 $17.3 2011 $8.9 $11.4 Net Income Net Income 11 1H 13 1H 14 1H 13 1H 14-$310.71H 13 1H 14 1. Represents average balances. The Commercial Real Estate line of business portfolio includes certain loans within the C&I, commercial construction and residential construction portfolios, in addition to the commercial real estate portfolio, as classified on the external GAAP balance sheet 2. Percent of loan portfolio outstanding
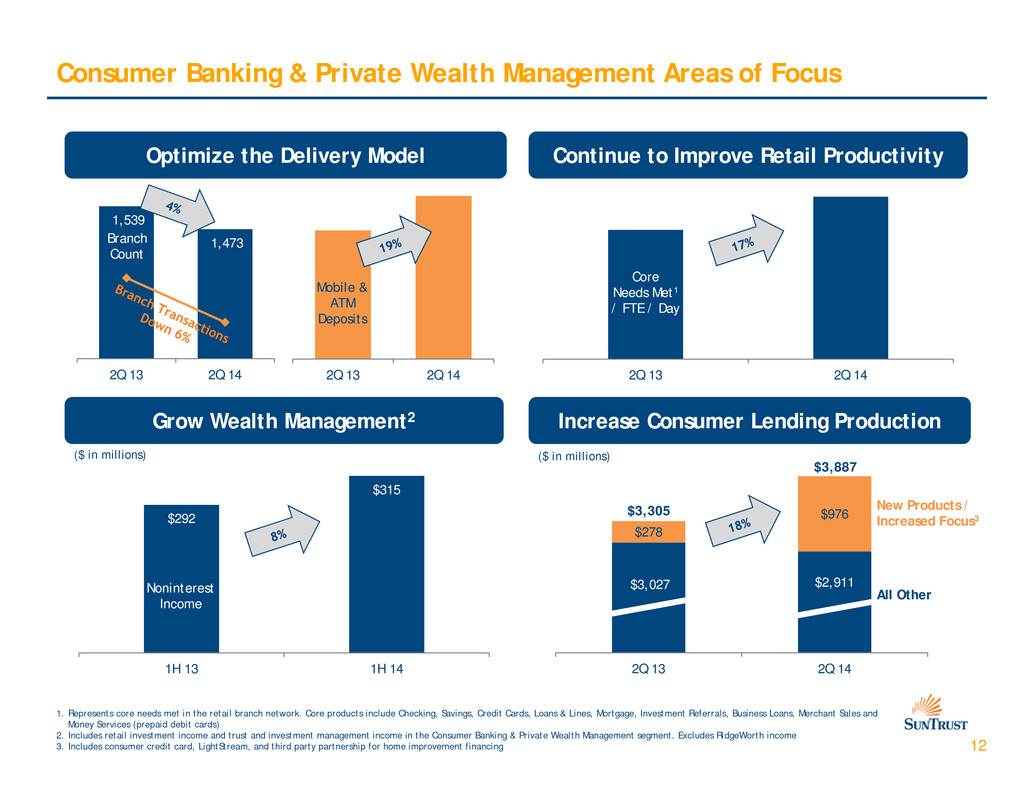
O i i h li d l Consumer Banking & Private Wealth Management Areas of Focus C i il d i i 1,539 1,473 pt m ze t e De very Mo e Branch ont nue to Improve Reta Pro uct v ty Count Mobile & ATM Deposits Core Needs Met1 / FTE / Day 2Q 13 2Q 142Q 13 2Q 142Q 13 2Q 14 Increase Consumer Lending ProductionGrow Wealth Management2 $ $278 $976 ($ in millions) $3,305 $3,887 New Products / Increased Focus3$292 $315 ( in millions) $3,027 $2,911 All OtherNoninterest Income 12 1. Represents core needs met in the retail branch network. Core products include Checking, Savings, Credit Cards, Loans & Lines, Mortgage, Investment Referrals, Business Loans, Merchant Sales and Money Services (prepaid debit cards) 2. Includes retail investment income and trust and investment management income in the Consumer Banking & Private Wealth Management segment. Excludes RidgeWorth income 3. Includes consumer credit card, LightStream, and third party partnership for home improvement financing 2Q 13 2Q 141H 13 1H 14
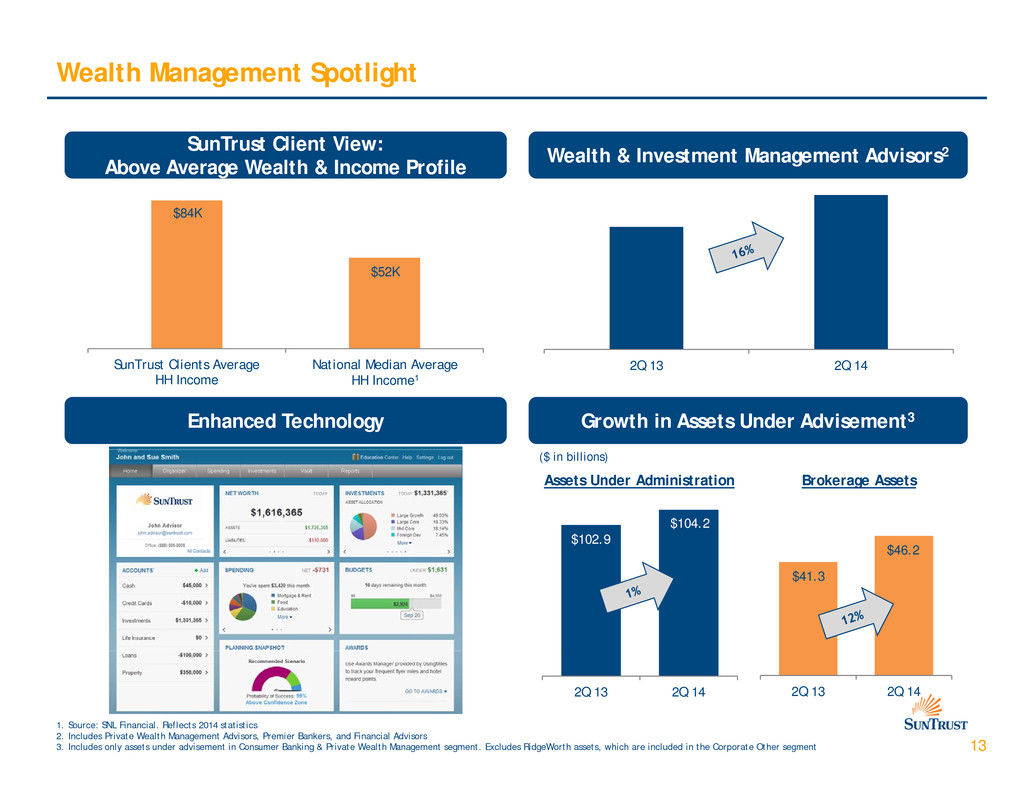
Wealth Management Spotlight SunTrust Client View: 2 $84K Above Average Wealth & Income Profile Wealth & Investment Management Advisors $52K SunTrust Clients Average HH Income Enhanced Technology Growth in Assets Under Advisement3 2Q 13 2Q 14National Median Average HH Income1 i i Real Estate/ Other 9% Assets Under Administration Brokerage Assets ($ in billions) $102.9 $104.2 $46 2Equ t es 49% Fixed Income 26% $41.3 . 13 2Q 13 2Q 14 2Q 13 2Q 14 1. Source: SNL Financial. Reflects 2014 statistics 2. Includes Private Wealth Management Advisors, Premier Bankers, and Financial Advisors 3. Includes only assets under advisement in Consumer Banking & Private Wealth Management segment. Excludes RidgeWorth assets, which are included in the Corporate Other segment
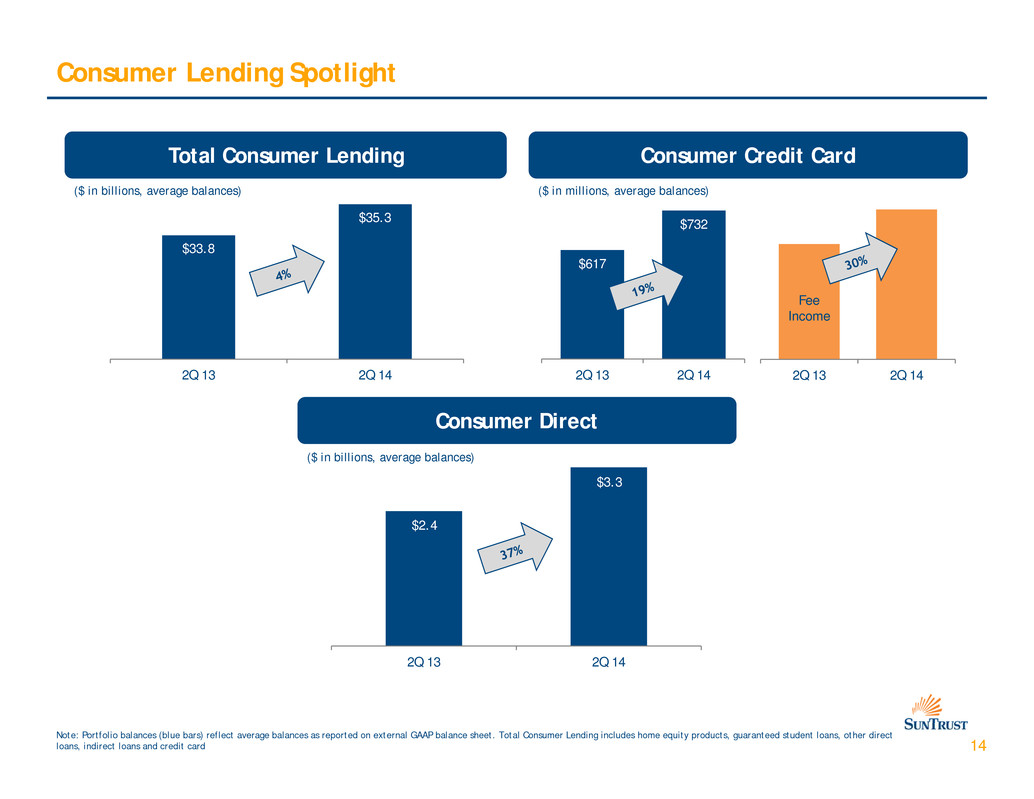
Consumer Lending Spotlight l C di C C di C d $732 ($ in millions, average balances)($ in billions, average balances) Tota onsumer Len ng onsumer re t ar $33 8 $35.3 $617 Fee Income . 2Q 13 2Q 142Q 13 2Q 14 Consumer Direct 2Q 13 2Q 14 ($ in billions, average balances) $3.3 $2.4 14 2Q 13 2Q 14 Note: Portfolio balances (blue bars) reflect average balances as reported on external GAAP balance sheet. Total Consumer Lending includes home equity products, guaranteed student loans, other direct loans, indirect loans and credit card
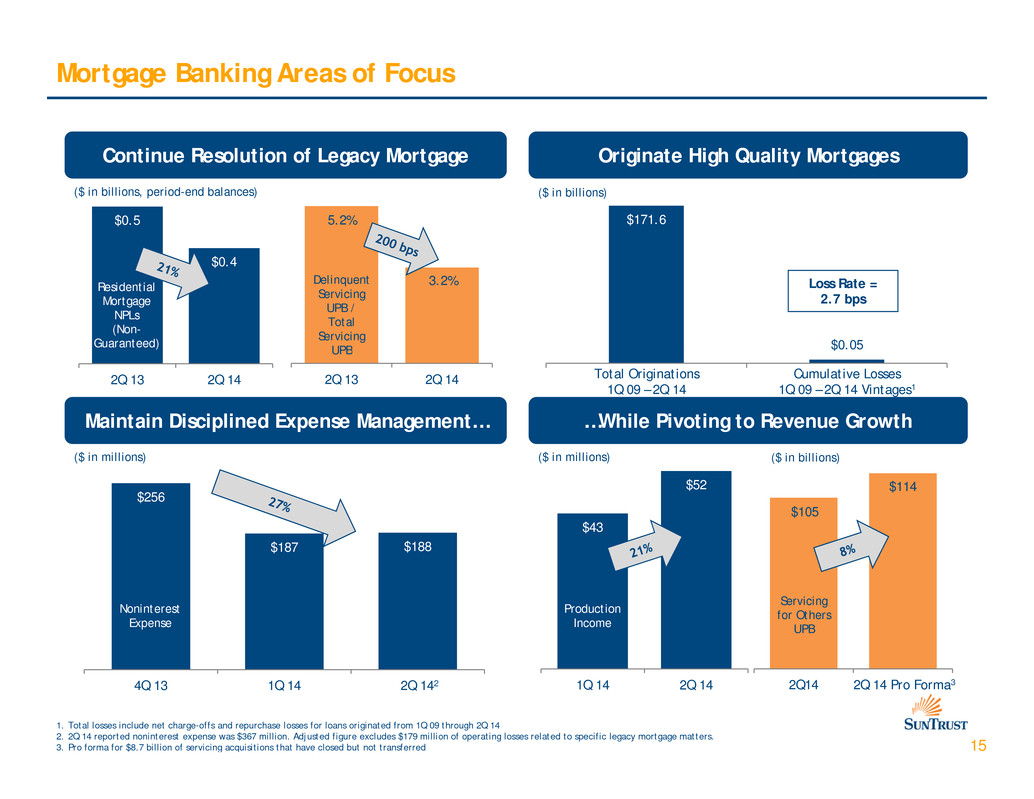
Mortgage Banking Areas of Focus $171.6$0.5 ($ in billions)($ in billions, period-end balances) Continue Resolution of Legacy Mortgage Originate High Quality Mortgages 5.2% $0.4 Residential Mortgage NPLs (Non- Guaranteed) Loss Rate = 2.7 bps Delinquent Servicing UPB / Total Servicing UPB $0.05 3.2% 2Q 13 2Q 142Q 13 2Q 14 Maintain Disciplined Expense Management… …While Pivoting to Revenue Growth Total Originations 1Q 09 – 2Q 14 Cumulative Losses 1Q 09 – 2Q 14 Vintages1 $43 $52 $256 $187 $188 ($ in millions) ($ in billions)($ in millions) $105 $114 Servicing for Others UPB Noninterest Expense Production Income 15 2Q141Q 14 2Q 144Q 13 1Q 14 1. Total losses include net charge-offs and repurchase losses for loans originated from 1Q 09 through 2Q 14 2. 2Q 14 reported noninterest expense was $367 million. Adjusted figure excludes $179 million of operating losses related to specific legacy mortgage matters. 3. Pro forma for $8.7 billion of servicing acquisitions that have closed but not transferred 2Q 142 2Q 14 Pro Forma3
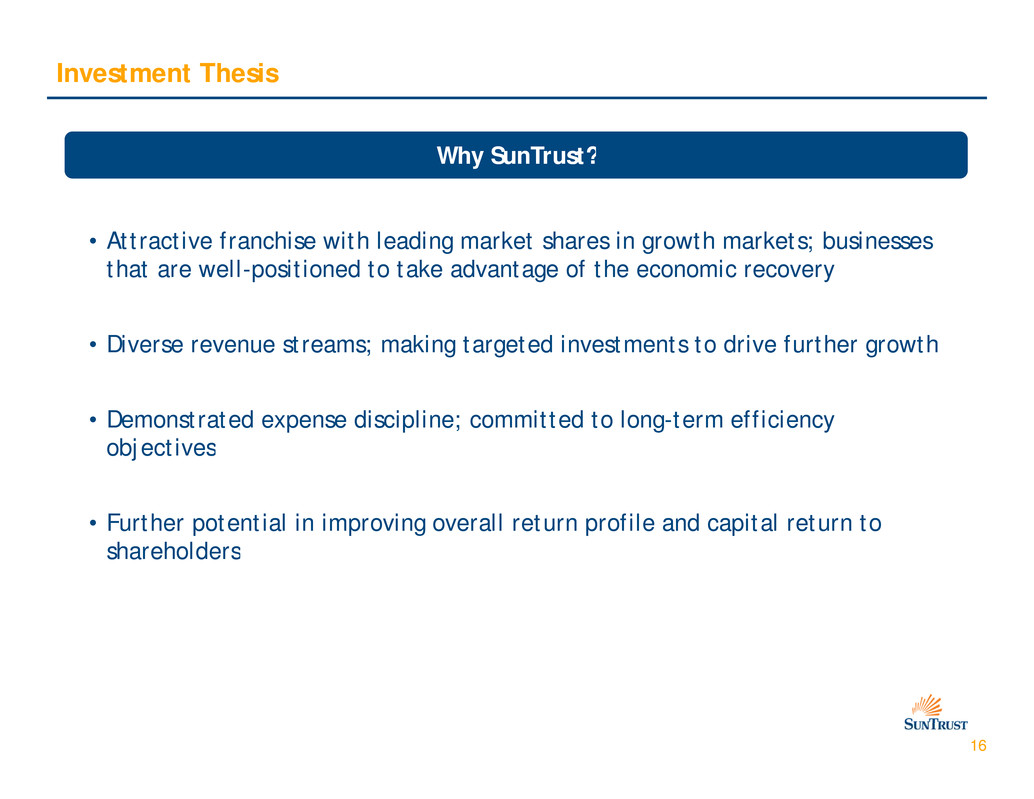
Investment Thesis Wh S T ?y un rust • Attractive franchise with leading market shares in growth markets; businesses that are well-positioned to take advantage of the economic recovery • Diverse revenue streams; making targeted investments to drive further growth • Demonstrated expense discipline; committed to long-term efficiency objectives • Further potential in improving overall return profile and capital return to shareholders 16
Appendix
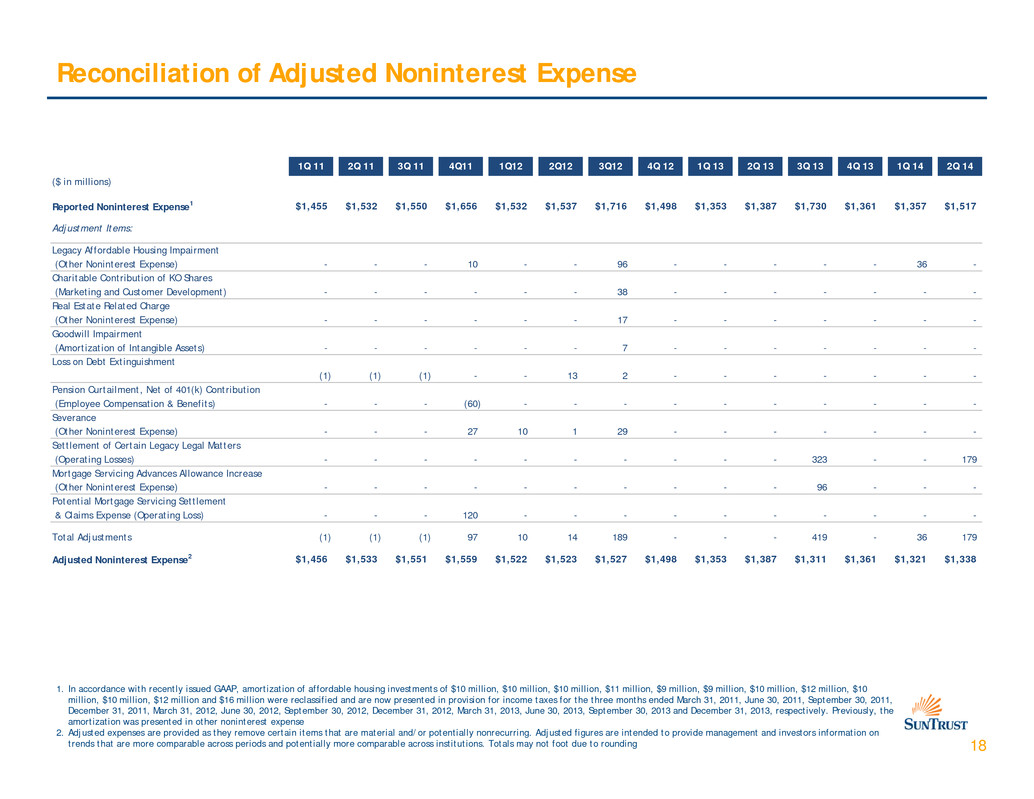
Reconciliation of Adjusted Noninterest Expense 1Q 11 2Q 11 3Q 11 4Q11 1Q12 2Q12 3Q12 4Q 12 1Q 13 2Q 13 3Q 13 4Q 13 1Q 14 2Q 14 ($ in millions) Reported Noninterest Expense1 $1,455 $1,532 $1,550 $1,656 $1,532 $1,537 $1,716 $1,498 $1,353 $1,387 $1,730 $1,361 $1,357 $1,517 Adjustment Items: L g Aff d bl H i g I i te acy or a e ous n mpa rmen (Other Noninterest Expense) - - - 10 - - 96 - - - - - 36 - Charitable Contribution of KO Shares (Marketing and Customer Development) - - - - - - 38 - - - - - - - Real Estate Related Charge (Other Noninterest Expense) - - - - - - 17 - - - - - - - Goodwill Impairment (Amortization of Intangible Assets) - - - - - - 7 - - - - - - - Loss on Debt Extinguishment (1) (1) (1) - - 13 2 - - - - - - - Pension Curtailment, Net of 401(k) Contribution (Employee Compensation & Benefits) - - - (60) - - - - - - - - - - Severance (Other Noninterest Expense) - - - 27 10 1 29 - - - - - - - Settlement of Certain Legacy Legal Matters (Operating Losses) - - - - - - - - - - 323 - - 179 Mortgage Servicing Advances Allowance Increase (Other Noninterest Expense) - - - - - - - - - - 96 - - - Potential Mortgage Servicing Settlement & Claims Expense (Operating Loss) - - - 120 - - - - - - - - - - Total Adjustments (1) (1) (1) 97 10 14 189 - - - 419 - 36 179 Adjusted Noninterest Expense2 $1,456 $1,533 $1,551 $1,559 $1,522 $1,523 $1,527 $1,498 $1,353 $1,387 $1,311 $1,361 $1,321 $1,338 18 1. In accordance with recently issued GAAP, amortization of affordable housing investments of $10 million, $10 million, $10 million, $11 million, $9 million, $9 million, $10 million, $12 million, $10 million, $10 million, $12 million and $16 million were reclassified and are now presented in provision for income taxes for the three months ended March 31, 2011, June 30, 2011, September 30, 2011, December 31, 2011, March 31, 2012, June 30, 2012, September 30, 2012, December 31, 2012, March 31, 2013, June 30, 2013, September 30, 2013 and December 31, 2013, respectively. Previously, the amortization was presented in other noninterest expense 2. Adjusted expenses are provided as they remove certain items that are material and/or potentially nonrecurring. Adjusted figures are intended to provide management and investors information on trends that are more comparable across periods and potentially more comparable across institutions. Totals may not foot due to rounding
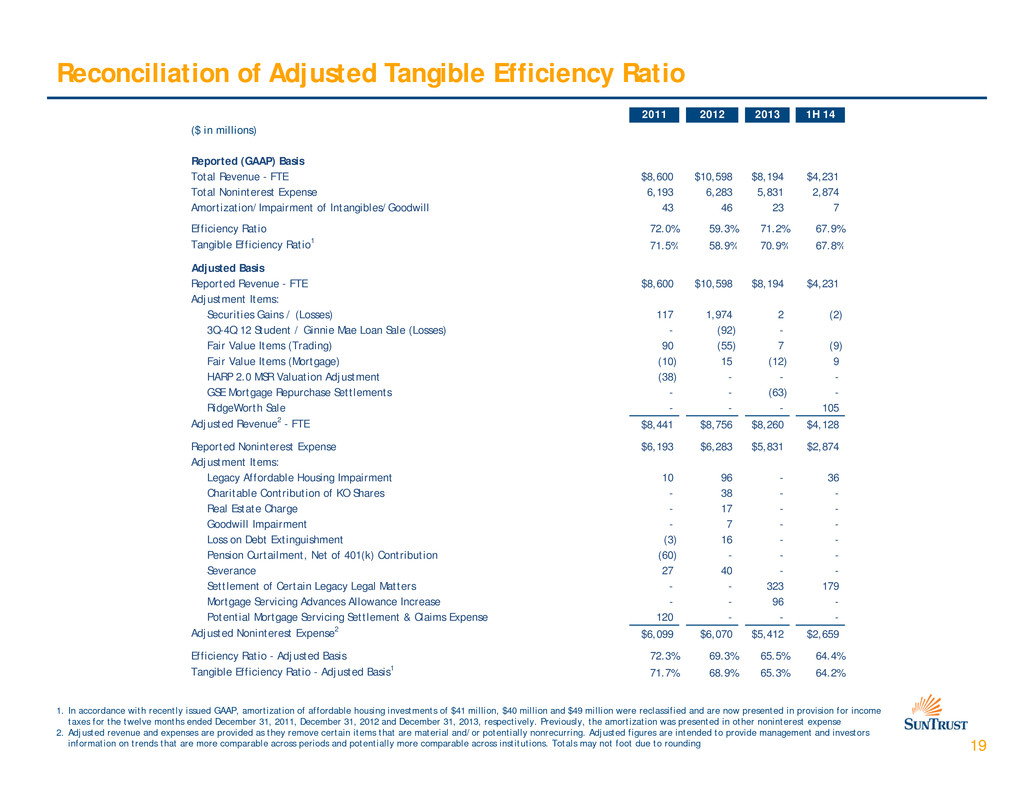
Reconciliation of Adjusted Tangible Efficiency Ratio 2011 2012 2013 1H 14 ($ in millions) Reported (GAAP) Basis Total Revenue - FTE $8,600 $10,598 $8,194 $4,231 Total Noninterest Expense 6,193 6,283 5,831 2,874 Amortization/Impairment of Intangibles/Goodwill 43 46 23 7 Efficiency Ratio 72.0% 59.3% 71.2% 67.9% Tangible Efficiency Ratio1 71.5% 58.9% 70.9% 67.8% Adjusted Basis Reported Revenue - FTE $8,600 $10,598 $8,194 $4,231 Adjustment Items: Securities Gains / (Losses) 117 1,974 2 (2) 3Q-4Q 12 Student / Ginnie Mae Loan Sale (Losses) - (92) - Fair Value Items (Trading) 90 (55) 7 (9) Fair Value Items (Mortgage) (10) 15 (12) 9 HARP 2.0 MSR Valuation Adjustment (38) - - - GSE Mortgage Repurchase Settlements - - (63) - RidgeWorth Sale - - - 105 Adjusted Revenue2 - FTE $8,441 $8,756 $8,260 $4,128 Reported Noninterest Expense $6,193 $6,283 $5,831 $2,874 Adjustment Items: Legacy Affordable Housing Impairment 10 96 - 36 Charitable Contribution of KO Shares - 38 - - Real Estate Charge - 17 - - Goodwill Impairment - 7 - - Loss on Debt Extinguishment (3) 16 - - Pension Curtailment, Net of 401(k) Contribution (60) - - - Severance 27 40 - - Settlement of Certain Legacy Legal Matters - - 323 179 Mortgage Servicing Advances Allowance Increase - - 96 - Potential Mortgage Servicing Settlement & Claims Expense 120 - - - Adjusted Noninterest Expense2 $6,099 $6,070 $5,412 $2,659 19 1. In accordance with recently issued GAAP, amortization of affordable housing investments of $41 million, $40 million and $49 million were reclassified and are now presented in provision for income taxes for the twelve months ended December 31, 2011, December 31, 2012 and December 31, 2013, respectively. Previously, the amortization was presented in other noninterest expense 2. Adjusted revenue and expenses are provided as they remove certain items that are material and/or potentially nonrecurring. Adjusted figures are intended to provide management and investors information on trends that are more comparable across periods and potentially more comparable across institutions. Totals may not foot due to rounding Efficiency Ratio - Adjusted Basis 72.3% 69.3% 65.5% 64.4% Tangible Efficiency Ratio - Adjusted Basis1 71.7% 68.9% 65.3% 64.2%
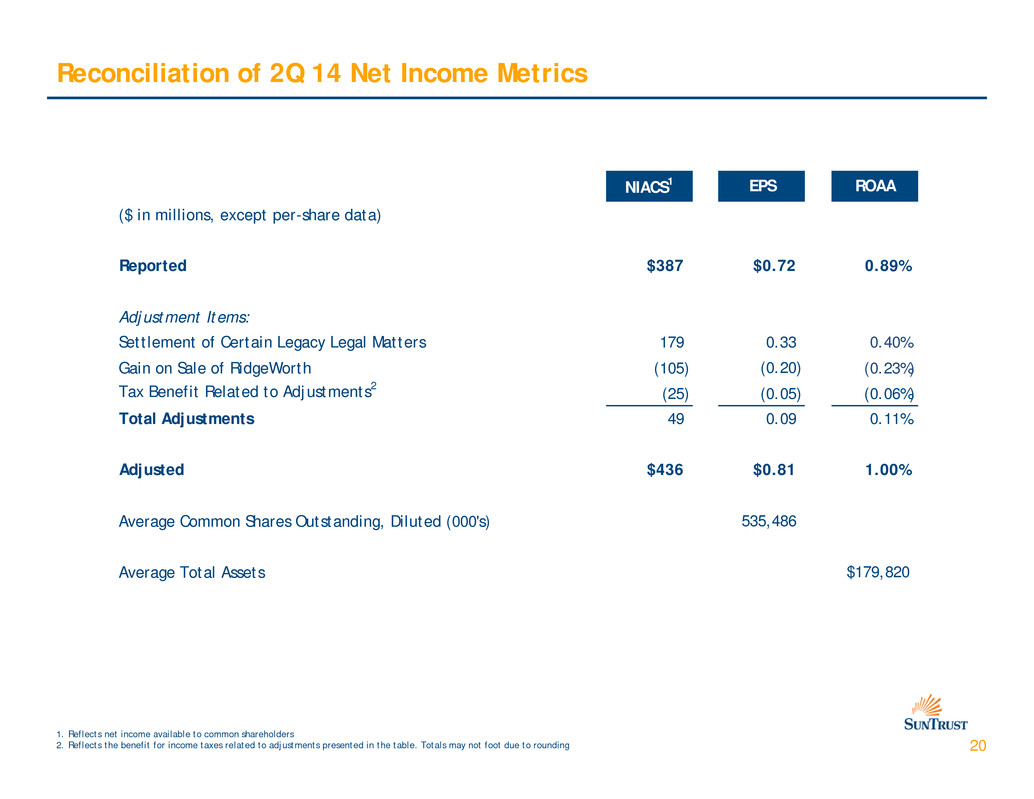
Reconciliation of 2Q 14 Net Income Metrics NIACS1 EPS ROAA ($ in millions, except per-share data) Reported $387 $0.72 0.89% Adjustment Items: Settlement of Certain Legacy Legal Matters 179 0.33 0.40% Gain on Sale of RidgeWorth (105) (0.20) (0.23%) Tax Benefit Related to Adjustments2 (25) (0.05) (0.06%) Total Adjustments 49 0.09 0.11% Adjusted $436 $0.81 1.00% Average Common Shares Outstanding, Diluted (000's) 535,486 Average Total Assets $179,820 20 1. Reflects net income available to common shareholders 2. Reflects the benefit for income taxes related to adjustments presented in the table. Totals may not foot due to rounding
