Attached files
| file | filename |
|---|---|
| EX-10.1 - EX-10.1 - Performance Food Group Co | d781110dex101.htm |
| EX-10.2 - EX-10.2 - Performance Food Group Co | d781110dex102.htm |
| EX-10.8 - EX-10.8 - Performance Food Group Co | d781110dex108.htm |
| EX-23.1 - EX-23.1 - Performance Food Group Co | d781110dex231.htm |
| EX-10.3 - EX-10.3 - Performance Food Group Co | d781110dex103.htm |
| EX-21.1 - EX-21.1 - Performance Food Group Co | d781110dex211.htm |
Table of Contents
As filed with the Securities and Exchange Commission on September 9, 2014.
Registration No. 333-
UNITED STATES
SECURITIES AND EXCHANGE COMMISSION
Washington, D.C. 20549
FORM S-1
REGISTRATION STATEMENT
UNDER
THE SECURITIES ACT OF 1933
Performance Food Group Company
(Exact Name of Registrant as Specified in its Charter)
| Delaware | 5141 | 43-1983182 | ||
| (State or other jurisdiction of incorporation or organization) |
(Primary Standard Industrial Classification Code Number) |
(I.R.S. Employer Identification No.) |
12500 West Creek Parkway
Richmond, Virginia 23238
(804) 484-7700
(Address, including zip code, and telephone number, including area code, of Registrant’s principal executive offices)
Michael L. Miller, Esq.
Senior Vice President, General Counsel, and Secretary
Performance Food Group Company
12500 West Creek Parkway
Richmond, Virginia 23238
(804) 484-7700
(Name, address, including zip code, and telephone number, including area code, of agent for service)
Copies to:
| Igor Fert, Esq. Simpson Thacher & Bartlett LLP 425 Lexington Avenue New York, NY 10017 Telephone: (212) 455-2000 Facsimile: (212) 455-2502 |
Marc Jaffe, Esq. Cathy Birkeland, Esq. Latham & Watkins LLP 885 Third Avenue New York, NY 10017 Telephone: (212) 906-1200 Facsimile: (212) 751-4864 |
Approximate date of commencement of the proposed sale of the securities to the public: As soon as practicable after the Registration Statement is declared effective.
If any of the securities being registered on this form are to be offered on a delayed or continuous basis pursuant to Rule 415 under the Securities Act of 1933, check the following box. ¨
If this form is filed to register additional securities for an offering pursuant to Rule 462(b) under the Securities Act, check the following box and list the Securities Act registration statement number of the earlier effective registration statement for the same offering. ¨
If this form is a post-effective amendment filed pursuant to Rule 462(c) under the Securities Act, check the following box and list the Securities Act registration statement number of the earlier effective registration statement for the same offering. ¨
If this form is a post-effective amendment filed pursuant to Rule 462(d) under the Securities Act, check the following box and list the Securities Act registration statement number of the earlier effective registration statement for the same offering. ¨
Indicate by check mark whether the registrant is a large accelerated filer, an accelerated filer, a non-accelerated filer, or a smaller reporting company. See the definitions of “large accelerated filer,” “accelerated filer” and “smaller reporting company” in Rule 12b-2 of the Exchange Act.
| Large accelerated filer | ¨ | Accelerated filer | ¨ | |||
| Non-accelerated filer | x (Do not check if a smaller reporting company) | Smaller reporting company | ¨ |
CALCULATION OF REGISTRATION FEE
|
| ||||
| Title Of Each Class Of Securities To Be Registered |
Proposed Offering Price(1)(2) |
Amount of Registration Fee | ||
| Common Stock, par value $0.01 per share |
$100,000,000 | $12,880 | ||
|
| ||||
|
| ||||
| (1) | Estimated solely for the purpose of determining the amount of the registration fee in accordance with Rule 457(o) under the Securities Act of 1933. |
| (2) | Includes shares of common stock subject to the underwriters’ option to purchase additional shares of common stock. |
The Registrant hereby amends this Registration Statement on such date or dates as may be necessary to delay its effective date until the Registrant shall file a further amendment which specifically states that this Registration Statement shall thereafter become effective in accordance with Section 8(a) of the Securities Act of 1933 or until the Registration Statement shall become effective on such date as the Commission, acting pursuant to said Section 8(a), may determine.
Table of Contents
The information in this prospectus is not complete and may be changed. We and the selling stockholders may not sell these securities until the registration statement filed with the Securities and Exchange Commission is effective. This prospectus is not an offer to sell these securities and it is not soliciting an offer to buy these securities in any jurisdiction where the offer or sale is not permitted.
Subject to Completion. Dated September 9, 2014.
PROSPECTUS
Shares

Performance Food Group Company
Common Stock
This is an initial public offering of shares of common stock of Performance Food Group Company.
We are selling of the shares to be sold in the offering, and the selling stockholders identified in this prospectus are selling shares. Performance Food Group Company will not receive any of the proceeds from the sale of the shares being sold by the selling stockholders.
Prior to this offering, there has been no public market for the common stock. It is currently estimated that the initial public offering price per share will be between $ and $ . We intend to list our common stock on under the symbol “ .”
After the completion of this offering, affiliates of The Blackstone Group L.P. will continue to own a majority of the voting power of all outstanding shares of the common stock. As a result, we will be a “controlled company” within the meaning of the corporate governance standards of the . See “Principal and Selling Stockholders.”
have granted the underwriters a 30-day option to purchase up to additional shares at the initial public offering price less the underwriting discount and commissions.
Investing in our common stock involves risk. See “Risk Factors” beginning on page 16 to read about factors you should consider before buying shares of our common stock.
Neither the Securities and Exchange Commission nor any other regulatory body has approved or disapproved of these securities or passed upon the accuracy or adequacy of this prospectus. Any representation to the contrary is a criminal offense.
| Per Share |
Total | |||
| Initial public offering price |
$ | $ | ||
| Underwriting discounts and commissions(1) |
$ | $ | ||
| Proceeds, before expenses, to us |
$ | $ | ||
| Proceeds, before expenses, to the selling stockholders |
$ | $ |
| (1) | See “Underwriting” for additional information regarding underwriting compensation. |
Delivery of the shares of common stock will be made on or about .
| Credit Suisse |
Barclays |
| Wells Fargo Securities |
Morgan Stanley |
Prospectus dated ,
Table of Contents
| Page | ||||
| ii | ||||
| ii | ||||
| ii | ||||
| 1 | ||||
| 16 | ||||
| 34 | ||||
| 36 | ||||
| 37 | ||||
| 38 | ||||
| 40 | ||||
| 42 | ||||
| MANAGEMENT’S DISCUSSION AND ANALYSIS OF FINANCIAL CONDITION AND RESULTS OF OPERATIONS |
44 | |||
| 67 | ||||
| Page | ||||
| 68 | ||||
| 84 | ||||
| 114 | ||||
| 117 | ||||
| 119 | ||||
| 124 | ||||
| 132 | ||||
| MATERIAL U.S. FEDERAL INCOME AND ESTATE TAX CONSEQUENCES TO NON-U.S. HOLDERS OF OUR COMMON STOCK |
134 | |||
| 137 | ||||
| 141 | ||||
| 141 | ||||
| 141 | ||||
| F-1 | ||||
Through and including (the 25th day after the date of this prospectus), all dealers effecting transactions in these securities, whether or not participating in this offering, may be required to deliver a prospectus. This is in addition to a dealer’s obligation to deliver a prospectus when acting as an underwriter and with respect to an unsold allotment or subscription.
Unless otherwise indicated or the context otherwise requires, financial data in this prospectus reflects the consolidated business and operations of Performance Food Group Company and its consolidated subsidiaries.
We have not authorized anyone to provide any information or to make any representations other than those contained in this prospectus or in any free writing prospectuses we have prepared. We take no responsibility for, and can provide no assurance as to the reliability of, any other information that others may give you. This prospectus is an offer to sell only the shares offered hereby, but only under circumstances and in jurisdictions where it is lawful to do so. The information contained in this prospectus is current only as of its date.
i
Table of Contents
Market data and industry statistics and forecasts used throughout this prospectus are based on the good faith estimates of management, which in turn are based upon management’s reviews of independent industry publications, reports by market research firms, and other independent and publicly available sources. Although we believe that these third-party sources are reliable, we do not guarantee the accuracy or completeness of this information and have not independently verified this information. Similarly, internal Company surveys, while believed by us to be reliable, have not been verified by any independent sources. Unless we indicate otherwise, market data and industry statistics used throughout this prospectus are for the year ended December 31, 2013. All references to our industry share refer to our net sales as compared to aggregate revenues for the U.S. foodservice distribution industry.
Although we are not aware of any misstatements regarding the industry data that we present in this prospectus, our estimates involve risks and uncertainties and are subject to change based on various factors, including those discussed under “Risk Factors,” “Forward-Looking Statements,” and “Management’s Discussion and Analysis of Financial Condition and Results of Operations” in this prospectus.
TRADEMARKS, SERVICE MARKS AND TRADENAMES
This prospectus contains some of our trademarks, trade names, and service marks, including the following: Performance Foodservice, PFG Customized, Vistar, West Creek, Silver Source, Braveheart 100% Black Angus, Empire’s Treasure, Brilliance, Heritage Ovens, Village Garden, Guest House, Piancone, Luigi’s, Ultimo, Corazo, and Assoluti. Each one of these trademarks, trade names, or service marks is either (i) our registered trademark, (ii) a trademark for which we have a pending application, (iii) a trade name or service mark for which we claim common law rights, or (iv) a registered trademark or application for registration which we have been licensed by a third party to use.
Solely for convenience, the trademarks, service marks, and trade names referred to in this prospectus are without the ® and ™ symbols, but such references are not intended to indicate, in any way, that we will not assert, to the fullest extent under applicable law, our rights or the rights of the applicable licensors to these trademarks, service marks, and trade names. This prospectus contains additional trademarks, service marks, and trade names of others, which are the property of their respective owners. All trademarks, service marks, and trade names appearing in this prospectus are, to our knowledge, the property of their respective owners.
As used in this prospectus, unless otherwise noted or the context otherwise requires, (i) references to the “Company,” “we,” “our,” or “us” refer to Performance Food Group Company and its consolidated subsidiaries; (ii) references to the “Issuer” refer to Performance Food Group Company exclusive of its subsidiaries; (iii) references to “Blackstone” refer to certain investment funds affiliated with The Blackstone Group L.P.; (iv) references to “Wellspring Capital” are to Wellspring Capital Management LLC; (v) references to the “Sponsors” are to Blackstone and Wellspring Capital; (vi) references to the “Investor Group” are, collectively, to the Sponsors, certain other investors, and certain members of our management; (vii) references to the “Advisory Agreement” refer to the Transaction and Advisory Fee Agreement among the Issuer (f/k/a Wellspring Distribution Corp.) and affiliates of Blackstone and Wellspring Capital; and (viii) references to the “underwriters” are to the firms listed on the cover page of this prospectus.
References to “fiscal 2014” are to the 52-week period ending June 28, 2014, references to “fiscal 2013” are to the 52-week period ended June 29, 2013, references to “fiscal 2012” are to the 52-week period ended June 30, 2012, references to “fiscal 2011” are to the 52-week period ended July 2, 2011, and references to “fiscal 2010” are to the 53-week period ended July 3, 2010.
ii
Table of Contents
This summary highlights certain significant aspects of our business and this offering. This is a summary of information contained elsewhere in this prospectus, is not complete, and does not contain all of the information that you should consider before making your investment decision. You should carefully read the entire prospectus, including the information presented under the section entitled “Risk Factors” and the consolidated financial statements and the notes thereto, before making an investment decision. This summary contains forward-looking statements that involve risks and uncertainties. Our actual results may differ significantly from future results contemplated in the forward-looking statements as a result of certain factors such as those set forth in “Risk Factors” and “Forward-Looking Statements.” When making an investment decision, you should also read the discussion under “Basis of Presentation” for the definition of certain terms used in this prospectus and other matters described in this prospectus.
Our Company
We are the third largest player in the growing $231 billion U.S. foodservice distribution industry, which supplies the diverse $611 billion U.S. “food-away-from-home” industry. We market and distribute approximately 150,000 food and food-related products from 67 distribution centers to over 150,000 customer locations across the United States. We serve a diverse mix of customers, from independent and chain restaurants to schools, business and industry locations, hospitals, vending distributors, office coffee service distributors, big box retailers, and theaters. We source our products from over 5,000 suppliers and serve as an important partner to our suppliers by providing them access to our broad customer base. In addition to the products we offer to our customers, we provide value-added services by allowing our customers to benefit from our industry knowledge, scale, and expertise in the areas of product selection and procurement, menu development, and operational strategy. Our more than 11,000 employees work across three segments: Performance Foodservice, PFG Customized, and Vistar.
We plan to continue executing the strategies that have successfully delivered net sales, industry share, and profit growth. In the fiscal year ended June 28, 2014, we generated $13.7 billion in net sales and $286.1 million in Adjusted EBITDA, representing compound annual growth rates of 8% and 10%, respectively, since fiscal 2010. In calendar year 2013 we had an estimated industry share of 5.8% and our sales growth rate since calendar year 2010 is approximately three times the growth rate of the foodservice distribution industry in that same time frame. We believe that our current industry share, the large size of the U.S. foodservice distribution industry, and our track record of growing industry share provide us a significant opportunity for continued sales growth. See “—Summary Historical Consolidated Financial Data” for our definition of “Adjusted EBITDA” and a reconciliation of Adjusted EBITDA to net income, which we believe is the most directly comparable financial measure calculated in accordance with GAAP.
We attribute our sales growth primarily to our customer-centric business model. For us, that means understanding our customers’ business operations and economics so that we can help them be successful; placing our decision-making on how best to serve customers at the local level; and partnering with our suppliers to develop our high quality proprietary brands, which are a key driver for us in winning, retaining, and developing customers. We believe that our customer-centric business model differentiates us from our competitors who make customer-facing decisions outside of the local market and also from competitors who often do not have the scale to develop proprietary brands, provide value-added services, and distribute as effectively as we do.
Since fiscal 2010, our profit growth has outpaced our sales growth as a result of shifting towards a more profitable mix of products and customers, capturing operating efficiencies from our sales growth, and delivering productivity initiatives. Our mix shift is primarily attributable to increased sales of our proprietary brands and sales to independent restaurants, which represent our highest margin products and customers, respectively. In addition, we recently established a new set of productivity initiatives in the areas of procurement and operations called Winning Together, which we believe will continue to drive our profit growth.
1
Table of Contents
Our Segments
We believe that we are well positioned to serve our customers from our three business segments, which are distinguished by their diverse distribution models, the inventory they carry, and the customers they serve: Performance Foodservice, PFG Customized, and Vistar.
Performance Food Group: Fiscal 2014
| Net sales mix by operating segment
|
Key statistics | |||
|
|
Net sales |
$13.7 billion | ||
| Adjusted EBITDA |
$286.1 million | |||
| Distribution Centers |
67 | |||
| Customer Locations |
150,000+ | |||
| Products |
150,000+ | |||
| Suppliers |
5,000+ | |||
| Vehicles |
2,500+ | |||
| Employees
|
11,000+
| |||
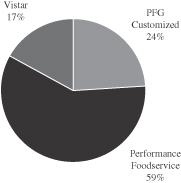
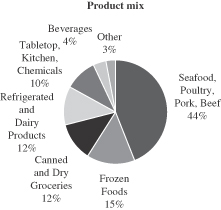
Performance Foodservice. Performance Foodservice is a leading U.S. foodservice distributor with substantial scale along the Eastern Seaboard and in the Southeast. Performance Foodservice operates a network of 24 broadline distribution centers, which supply a “broad line” of products, and 10 Roma distribution centers, which specialize in supplying independent pizzerias and other Italian-themed restaurants. Each of these distribution centers, which we refer to as operating companies or “OpCos,” is run by a business team who understands the local markets and the needs of its particular customers and who is empowered to make decisions on how best to serve them. For fiscal 2014, Performance Foodservice generated $8.1 billion in net sales, over three quarters of which was to restaurants. This segment serves over 85,000 customer locations with over 125,000 food and food-related products.
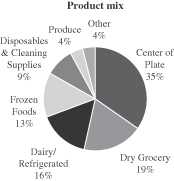
We offer our customers a broad product assortment that ranges from “center-of-the-plate” items (such as beef, pork, poultry, and seafood), frozen foods, refrigerated products, and dry groceries to disposables, cleaning and kitchen supplies, and related products used by our customers. In addition to the products we offer, we provide value-added services by enabling our customers to benefit from our industry knowledge, scale, and expertise in the areas of product selection and procurement, menu development, and operational strategy.
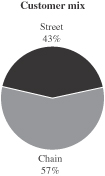
We classify our customers under two major categories: “Street” and multi-unit “Chain.” Street customers predominantly consist of independent restaurants. Chain customers are multi-unit restaurants with five or more locations, which include fine dining, family and casual dining, fast casual, and quick serve restaurants, as well as hotels, healthcare facilities, and other multi-unit institutional customers. Street customers utilize more of our value-added services, particularly in the areas of product selection and procurement, market trends, menu development, and operational strategy. Street customer purchases typically generate greater gross profit per case compared to sales to Chain customers. Sales to Street customers in fiscal 2014 accounted for 43% of Performance Foodservice sales compared to 37% in fiscal 2010.
Our products consist of our proprietary-branded products, or “Performance Brands,” as well as nationally- branded products and products bearing our customers’ brands. Our Performance Brands typically generate higher gross profit per case than other brands. In fiscal 2014, Performance Brands accounted for 39% of the case volume sold to Street customers, up from 37% in fiscal 2010.
2
Table of Contents
Performance Foodservice net sales for fiscal 2014 and fiscal 2013 were $8.1 billion and $7.5 billion, respectively, representing year-over-year growth of 8.0%. Performance Foodservice segment EBITDA for the same time period was $207.5 million and $173.9 million, representing year-over-year growth of 19.3%.
| Performance Foodservice: Fiscal 2014 Net Sales | ||
|
|
|
PFG Customized. PFG Customized is a leading national distributor to the family and casual dining channel. We serve over 5,000 customer locations across the United States from nine distribution centers that provide tailored supply chain solutions to our customers. Our network of distribution centers was developed around our customers and is strategically positioned to provide an efficient supply chain across both inbound and outbound logistics. PFG Customized’s product offerings are determined by each of our customers’ specific menu requirements. We also provide customers with value-added services, such as expertise in fresh product distribution, logistics management, procurement management, and information system interfaces, which enable our customers to run their businesses efficiently.
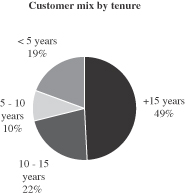
We serve many of the most recognizable family and casual dining restaurant chains, including Bonefish Grill, Carrabba’s Italian Grill, Cracker Barrel, Joe’s Crab Shack, Logan’s Roadhouse, Max and Erma’s, Macaroni Grill, O’Charley’s, Outback Steakhouse, Ruby Tuesday, and TGI Friday’s. PFG Customized’s five largest family and casual dining customers have been with us for an average of more than 15 years. Cracker Barrel was PFG Customized’s first customer and grew from a substantial regional account served by Performance Foodservice to an account whose needs are best served by customized distribution. PFG Customized recently began to utilize its distribution platform to serve fast casual chains such as Fuzzy’s Taco Shop, PDQ, and Zaxby’s, as well quick serve chains including Church’s Chicken, Wendy’s, and Yum! Brands.
PFG Customized net sales for fiscal 2014 and fiscal 2013 were $3.3 billion and $3.2 billion, respectively, representing year-over-year growth of 4.3%. PFG Customized segment EBITDA for the same time period was $37.5 million and $37.3 million, representing year-over-year growth of 0.5%.
3
Table of Contents
| PFG Customized: Fiscal 2014 Net Sales | ||
|
|
|
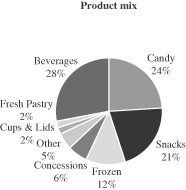
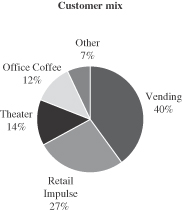
Vistar. Vistar is a leading national distributor of candy, snacks, and beverages to vending and office coffee service distributors, big box retailers, and theaters. The segment provides national distribution of approximately 20,000 different SKUs of candy, snacks, beverages, and other items to approximately 60,000 customer locations from our network of 24 Vistar OpCos and 11 Merchant’s Marts locations. Merchant’s Marts are cash-and-carry operators where customers generally pick up orders rather than having them delivered. Vistar’s scale in these channels enhances our ability to procure a broad variety of products for our customers. Vistar OpCos deliver to vending and office coffee service distributors and directly to most theaters and some other locations. The distribution model also includes a “pick and pack” capability, which utilizes third-party carriers and Vistar’s SKU variety to sell to customers whose order sizes are too small to be served effectively by our distribution network. We believe these capabilities, in conjunction with the breadth of our inventory, are differentiating and allow us to serve many distinct customer types. Vistar has successfully built upon our national platform to broaden the channels we serve to include hospitality venues, concessionaires, airport gift shops, college book stores, corrections facilities, and impulse locations in big box retailers such as Lowe’s, Home Depot, Dollar Tree, Staples, and others.
Vistar net sales for fiscal 2014 and fiscal 2013 were $2.3 billion and $2.1 billion, respectively, representing year-over-year growth of 6.0%. Vistar segment EBITDA for the same time period was $88.3 million and $81.4 million, respectively, representing year-over-year growth of 8.5%.
4
Table of Contents
| Vistar: Fiscal 2014 Net Sales | ||
|
|
|
Our Industry
We distribute to the food-away-from-home industry, a large industry with attractive underlying growth trends. According to the U.S. Department of Commerce, consumer spending on food-away-from-home in the United States totaled $611 billion in 2013, making it one of the largest industries in the country. The industry grew from $331 billion in sales in 1999 to $611 billion in sales in 2013, representing a compound annual growth rate of approximately 4.5%. Macroeconomic drivers of growth include increases in U.S. gross domestic product, employment levels, and personal consumption expenditures. Microeconomic drivers include increases in the number of restaurants, a continued shift toward value-added products and desire for convenience, smaller sized households, an aging population that spends more per capita at food-away-from-home establishments, and a rebound in the number of dual income households.
We operate in the U.S. foodservice distribution industry, which supplies the food-away-from-home industry and which totaled $231 billion in sales in 2013 according to Technomic. The U.S. foodservice distribution industry consists of four categories of distributors:
| • | Broadline distributors carry a “broad line” of products to serve the needs of many different types of food-away-from-home establishments; |
| • | System distributors carry products that are typically specified by large national and regional chains; |
| • | Specialized distributors carry a variety of products within specific categories, such as produce, meats, or seafood, or they focus on particular customer types, such as schools, vending operations, or fine dining; and |
| • | Cash-and-carry centers where customers come to pick-up their orders. |
We are distinguished from most of our competitors by operating in each of the four categories of distributors mentioned above.
Broadline distribution is the largest segment in the U.S. foodservice distribution industry. According to Technomic, the “Power Distributors,” which they define as the 21 companies with annual sales greater than $250 million, grew sales by 6% from 2012 to 2013, or approximately twice the growth rate for the overall foodservice distribution industry, which we believe is representative of the benefits of scale.
5
Table of Contents
We benefit from being one of the leading companies in the U.S. foodservice distribution industry and had an estimated 5.8% industry share during calendar 2013. We believe that our current industry share, the large size of the U.S. foodservice distribution industry, and our track record of growing industry share provide us a significant opportunity for continued sales growth.
Our Strengths
Leading Market Positions
We believe that our leading market positions within each of our business segments allow us to compete effectively in attracting new customers, to attract and retain industry talent, and to drive our growth as we execute our business strategy. We have a diverse business model that operates in three segments, allowing us to capitalize on the growth in food-away-from-home consumption. We believe our leading market positions are exhibited in the following way:
| • | Performance Foodservice. We are the third largest broadline distributor in the United States after Sysco Corporation (“Sysco”) and US Foods, Inc. (“US Foods”). We have significant scale in markets along the Eastern Seaboard and in the Southeast. Within Performance Foodservice, we believe that our Roma products make us the leading distributor to independent pizzerias in the United States. |
| • | PFG Customized. PFG Customized is a leading national distributor to family and casual dining restaurants, and we believe benefits from longstanding relationships with our customers, strong customer loyalty, and a network that is optimized to serve our customer base efficiently. |
| • | Vistar. Vistar is a leading national distributor of candy, snacks, and beverages to vending and office coffee service distributors, big box retailers, and theater customers, whom we believe benefit from substantial product variety sold at competitive prices. |
Scale Distribution Platforms
We believe we have a competitive advantage over smaller regional and local broadline distributors through economies of scale in purchasing and procurement, which allow us to offer a broad variety of products (including our proprietary Performance Brands) at competitive prices to our customers. Our customers benefit from our ability to provide them with extensive geographic coverage as they continue to grow. We believe we also benefit from supply chain efficiency, including a growing inbound logistics backhaul network that uses our collective distribution network to deliver inbound products across business segments; best practices in warehousing, transportation, and risk management; the ability to benefit from the scale of our purchases of items not for resale, such as trucks, construction materials, insurance, banking relationships, healthcare, and material handling equipment; and the ability to optimize our networks so that customers are served from the most efficient OpCo, which minimizes the cost of delivery. We believe these efficiencies and economies of scale will lead to continued improvements in our operating margins when combined with incremental fixed-cost advantage.
Customer-Centric Business Model
Our customer-centric business model is based on understanding our customers’ business operations and economics so that we can help them be successful, partnering with our suppliers to develop high quality proprietary brands specifically tailored to our customers’ needs, and placing our decision making on how best to serve customers at the local level so that we remain nimble at the point of transaction. The model embodies how we organize the Company, how our business processes work, and how we design our information systems. Over 11,000 PFG employees share our mission to grow sales by providing excellent service that is locally tailored to each customer. Approximately 4,500 of our employees interact with customers daily, either in sales or in making deliveries. Our sales associates receive extensive and ongoing product training and earn incentives primarily based on how effectively they
6
Table of Contents
grow our business with customers. Our customer-facing employees are supported by hundreds of employees who develop, source, and market over 150,000 food and related products from over 5,000 suppliers and by several thousand warehouse workers focused on filling customer orders accurately, efficiently, and in a timely manner. We believe that our customer-centric business model differentiates us from our competitors who make customer-facing decisions outside the local market and also from competitors who often do not have the scale to develop proprietary brands, provide value-added services, and distribute as effectively as we do.
Proven Ability to Increase Sales to Street Customers and Market our Proprietary Brands
We maintain a strong focus on growing sales to Street customers (our highest profit margin customers), growing sales of Performance Brands (our highest profit margin products), and attracting, retaining, and developing a more effective Street sales force. We believe that offering our Performance Brands enhances customer loyalty and attracts new customers, particularly Street customers. These Performance Brands include exclusive products offered across a wide variety of approximately 10,000 SKUs, which are developed in partnership with our suppliers and customers in order to satisfy the specific needs of our customer base.
Since fiscal 2010, we have grown the number of Street customers, case sales to Street customers, and case sales of Performance Brands to Street customers at compound annual growth rates of over 8%, 11%, and 12%, respectively. In fiscal 2014, Performance Brands accounted for 39% of the case volume sold to Street customers, up from 37% in fiscal 2010.
Disciplined and Proven Acquirer
We have made 12 acquisitions over the past six years, beginning with the merger of PFG and Vistar in 2008, when management integrated the two companies with significant synergies. Acquisitions have typically been completed at attractive valuation multiples and have been accretive to our Adjusted EBITDA margins on both a pre- and post-synergy basis.
In recent years, we have made four acquisitions in our Performance Foodservice business, which expanded our footprint in North and South Carolina, Kentucky, Illinois, and northern coastal California. Synergies from these acquisitions typically include introducing Performance Brands to the customers of the acquired company, reducing network mileage, implementing operational best practices, and achieving cost savings, such as expenses associated with insurance and benefit programs.
In our Vistar segment, we entered the hotel pantry business through an acquisition, which we are using as a platform to expand further into the hospitality channel. Vistar also used an acquisition to better develop our small drop fulfillment technology to serve big box retailers with candy, snacks, beverages, and other items, a capability that we believe has application in other channels.
Experienced and Invested Management Team
Our senior management team has extensive experience and proven success in the foodservice industry. With over 250 years of combined experience (over 20 years on average for the executive leadership team), we believe that our senior management team’s experience in all parts of the industry has enabled us to grow and diversify our business while improving operational efficiency. Members of management have previous experience at other leading foodservice distributors, including Sysco, US Foods, PYA Monarch, and Alliant Foodservice. Other management team members have experience elsewhere in the food industry, ranging from manufacturers and marketers to retailers and contract feeders. Management has invested over $28 million in the equity of the Company and substantially all of management’s incentive compensation is tied to our financial performance. We believe management’s investment and incentive structure align its interests with those of our stockholders.
7
Table of Contents
Our Strategy
We intend to continue to expand our industry share and to grow sales and profits by executing on the following key elements of our strategy.
Continue to Grow Street and Performance Brand Sales
We believe that there is a significant and ongoing opportunity to grow sales to Street customers (our highest profit margin customers) and to expand sales of our Performance Brands (our highest profit margin products). We believe that providing customers with proprietary distributor brands such as Performance Brands has been a key driver for us in winning, retaining, and developing customers, especially Street customers. In addition, we believe that our ability to build and retain an increasingly effective sales force has complemented these results. Street business momentum facilitates further development of our Performance Brand portfolio, which in turn enables us to win and develop more Street customers. Smaller regional competitors often do not have the scale to develop their own distinctive brands, and we believe this is a key reason why our Performance Foodservice segment has increased its sales to Street customers. By continuing to focus on increasing sales to our Street customers and sales of our Performance Brands, we believe that we can continue to drive profitable growth.
Continue to Grow our Customers and Channels
We intend to increase penetration within our existing channels, enter new channels, and continue to win new customers in all three business segments by using our scale, operational excellence, geographic presence, and customer-centric business model.
| • | Performance Foodservice. In addition to our success in growing our Street business, we believe significant opportunity remains to expand our customer base. For example, in the past two years we have won the fast-growing distribution business of Chuy’s, Flying Foods, Habit Burger, and Taco Cabana. We believe significant opportunity remains to continue expanding our customer base through new multi-unit restaurant chains and other channels such as schools, hospitals, and commercial locations. |
| • | PFG Customized. We intend to continue to grow our traditional customer base and to expand sales to new customer channels. For example, we have successfully won customers such as Macaroni Grill and Max and Erma’s in our traditional family and casual dining business. We have recently expanded our customer base to include select fast casual customers including Fuzzy’s Taco Shop and PDQ and quick serve customers including Wendy’s and Yum! Brands. |
| • | Vistar. We have utilized Vistar’s combination of inventory variety, distribution methods, and national scale to diversify our channel mix. This has enabled Vistar to serve new customers and channels including concessionaires (such as Minor League Baseball), corrections facilities, college bookstores, and hospitality, among others. Additionally, Vistar continues to grow within vending and office coffee service distribution, big box retailers, and theaters. |
Expand Margins through Continuous Productivity Improvements
We are committed to expanding margins through operating efficiencies and specific productivity programs, which will complement the effect of selling a more profitable mix of customers and brands. We recently established a program called Winning Together, which complements our sales growth with ongoing initiatives that take advantage of our scale and drive productivity in non-customer facing areas. Winning Together is led by teams whose primary responsibility is to improve our business processes, capture best practices, and maintain a continuous improvement culture in our procurement and operations functions.
8
Table of Contents
The two key components of Winning Together are Winning Together Through Procurement and Winning Together Through Operations. Winning Together Through Procurement uses structured negotiations with selected national, regional, and local suppliers to develop the mutual profitability of the relationship and to encourage suppliers to invest in our growth. Winning Together Through Operations seeks to accelerate efficiencies in our warehouses and our inbound and outbound logistics functions. This program leverages best practices and scale, implements new productivity software, and establishes a model OpCo as a proving ground for new technologies and business processes.
We have begun to recognize some of the cost-saving benefits of the Winning Together program and believe that we will see larger benefits in this and later fiscal years.
Continue to Pursue Opportunistic Acquisitions
We have a strong track record of sourcing, executing, and integrating accretive acquisitions. We intend to continue pursuing selective acquisitions in order to further our competitive position in the industry and to allow us both to enter into new geographies and channels as well as to expand in existing ones.
Over the past six years, we have made 12 acquisitions, including acquiring five broadline locations in Kentucky, North and South Carolina, Illinois, and northern coastal California. These acquisitions have expanded our broadline geographic reach, and we believe further meaningful opportunities exist that would enable us to reach additional customers. In Vistar, our acquisition focus remains on companies in adjacent channels that can benefit from the strength of our inventory and delivery method variety or that can add capabilities or technologies to our portfolio. We believe that there are a number of attractive potential acquisition opportunities in our industry.
Risks Related to Our Business and Our Industry
Investing in our common stock involves substantial risks, and our ability to successfully operate our business and execute our growth plan is subject to numerous risks, including those that are generally associated with operating in the foodservice distribution industry. Some of the more significant challenges and risks include the following:
| • | competition in our industry is intense, and we may not be able to compete successfully; |
| • | our industry has low margins, which may increase the volatility of our results of operations; |
| • | we may not realize anticipated benefits from our operating cost reduction and productivity improvement efforts, including Winning Together; |
| • | our profitability is directly affected by cost inflation or deflation and other factors; |
| • | many of our customers are not obligated to continue purchasing products from us; |
| • | group purchasing organizations may become more active in our industry and increase their efforts to add our customers as members of these organizations; |
| • | changes in consumer eating habits could materially and adversely affect our business, financial condition, or results of operations; |
| • | extreme weather conditions and natural disasters may interrupt our business, or our customers’ businesses, which could have a material adverse effect on our business, financial condition or results of operations; and |
| • | other factors set forth under “Risk Factors” in this prospectus. |
9
Table of Contents
Before you participate in this offering, you should carefully consider all of the information in this prospectus, including matters set forth under the heading “Risk Factors.”
Corporate History and Information
The issuer was formed under the laws of the state of Delaware on September 23, 2002. Our principal executive office is located at 12500 West Creek Parkway, Richmond VA 23238. Our main telephone number is 804-484-7700.
Our Sponsors
The Blackstone Group, one of the world’s leading global investment and advisory firms, was founded in 1985. Blackstone’s alternate asset management businesses include the management of corporate private equity funds, real estate funds, funds of hedge funds, credit-oriented funds, collateralized obligation vehicles, and closed-end mutual funds. Blackstone also provides various financial advisory services, including mergers and acquisitions advisory, restructuring and reorganization advisory, and fund placement services. Through its different businesses, as of June 30, 2014, Blackstone had total fee-earning assets under management of approximately $279 billion.
Wellspring Capital Management, a leading middle-market private equity firm, was founded in 1995. By teaming with strong management, Wellspring unlocks underlying value and pursues new growth opportunities through strategic initiatives, operating improvements and add-on acquisitions. The firm functions as a strategic rather than tactical partner, providing management teams with top-line support, M&A experience, and financial expertise. Wellspring has approximately $3 billion of private equity capital under management.
10
Table of Contents
THE OFFERING
| Common stock offered by us |
shares. |
| Common stock offered by the selling stockholders |
shares. |
| Option to purchase additional shares |
The underwriters have an option to purchase up to additional shares of our common stock from . The underwriters can exercise this option at any time within 30 days from the date of this prospectus. |
| Common stock outstanding after giving effect to this offering |
shares ( shares if the underwriters exercise their option to purchase additional shares in full). |
| Use of proceeds |
We estimate that the net proceeds to us from this offering, after deducting estimated underwriting discounts and commissions and estimated offering expenses payable by us, will be approximately $ , based on an assumed initial public offering price of $ per share, which is the midpoint of the price range set forth on the cover page of this prospectus. |
| We intend to use the net proceeds from this offering to repay $ million of our outstanding indebtedness and to pay a $ million one-time Advisory Agreement termination fee to our Sponsors, with any remaining balance to be used for general corporate purposes. See “Use of Proceeds.” |
| We will not receive any proceeds from the sale of shares of common stock offered by the selling stockholders, including upon the sale of shares if the underwriters exercise their option to purchase additional shares from the selling stockholders in this offering. See “Use of Proceeds.” |
| Dividend policy |
We have no current plans to pay dividends on our common stock. Any decision to declare and pay dividends in the future will be made at the sole discretion of our board of directors and will depend on, among other things, our results of operations, cash requirements, financial condition, contractual restrictions in our ABL and term loan facilities, and other factors that our Board of Directors may deem relevant. |
| Risk factors |
See “Risk Factors” beginning on page 16 for a discussion of risks you should carefully consider before deciding to invest in our common stock. |
| Proposed trading symbol |
“ ” |
The number of shares of our common stock to be outstanding immediately after the consummation of this offering is based on shares of common stock outstanding as of June 28, 2014, and does not give effect to shares of common stock, with a weighted average exercise price of $ per share outstanding under our 2007 Management Option Plan (the “2007 Stock Option Plan”) or shares of common stock reserved for future issuance under the Performance Food Group Company 2014 Omnibus Incentive Plan (the “2014 Omnibus Incentive Plan”).
11
Table of Contents
Unless we indicate otherwise or the context otherwise requires, all information in this prospectus:
| • | assumes (1) no exercise of the underwriters’ option to purchase additional shares and (2) an initial public offering price of $ per share, which is the mid-point of the range set forth on the cover page of this prospectus; |
| • | reflects a for one stock split of our common stock, to be effected prior to the consummation of this offering; and |
| • | assumes the filing and effectiveness of our amended and restated certificate of incorporation immediately prior to the consummation of this offering, which will give effect to a reclassification of our Class A common stock and our Class B common stock into a single class. |
12
Table of Contents
SUMMARY HISTORICAL CONSOLIDATED FINANCIAL DATA
The following tables set forth our summary historical consolidated financial data for the periods and as of the dates indicated.
We derived the summary consolidated statement of operations data and the summary consolidated statement of cash flows data for the years ended June 28, 2014, June 29, 2013, and June 30, 2012 and the summary consolidated balance sheet data as of June 28, 2014 and June 29, 2013 from our audited consolidated financial statements included elsewhere in this prospectus. We derived the consolidated balance sheet data as of June 30, 2012 from our unaudited financial statements not included in this prospectus. Our historical results are not necessarily indicative of the results expected for any future period.
The consolidated balance sheet data as of June 28, 2014 is presented:
| • | on an actual basis; and |
| • | on an as adjusted basis to reflect the issuance and sale of shares of our common stock by us in this offering based on the assumed initial public offering price of $ per share, which is the mid-point of the range set forth on the cover page of this prospectus, after deducting underwriting discounts and commissions and estimated offering expenses payable by us and the application of the net proceeds from this offering as described under “Use of Proceeds.” |
The summary historical consolidated financial data set forth below should be read in conjunction with “Capitalization,” “Management’s Discussion and Analysis of Financial Condition and Results of Operations,” and the consolidated financial statements and the notes thereto included elsewhere in this prospectus.
| For the fiscal year ended | ||||||||||||
| June 28, 2014 | June 29, 2013 | June 30, 2012 | ||||||||||
| (dollars in millions, except per share data) | ||||||||||||
| Statement of Operations Data: |
||||||||||||
| Net sales |
$ | 13,685.7 | $ | 12,826.5 | $ | 11,505.9 | ||||||
| Cost of goods sold |
11,988.5 | 11,243.8 | 10,101.9 | |||||||||
|
|
|
|
|
|
|
|||||||
| Gross profit |
1,697.2 | 1,582.7 | 1,404.0 | |||||||||
| Operating expenses |
1,581.6 | 1,468.0 | 1,293.1 | |||||||||
|
|
|
|
|
|
|
|||||||
| Operating profit |
115.6 | 114.7 | 110.9 | |||||||||
| Interest expense, net(1) |
86.1 | 93.9 | 76.3 | |||||||||
| Loss on extinguishment of debt |
— | 2.0 | — | |||||||||
| Other, net |
(0.7 | ) | (0.7 | ) | 0.7 | |||||||
|
|
|
|
|
|
|
|||||||
| Other expense, net |
85.4 | 95.2 | 77.0 | |||||||||
| Income before taxes |
30.2 | 19.5 | 33.9 | |||||||||
| Income tax expense(2) |
14.7 | 11.1 | 12.9 | |||||||||
|
|
|
|
|
|
|
|||||||
| Net income |
$ | 15.5 | $ | 8.4 | $ | 21.0 | ||||||
| Per Share Data: |
||||||||||||
| Basic net income per share |
$ | 0.09 | $ | 0.05 | $ | 0.12 | ||||||
| Diluted net income per share |
0.09 | 0.05 | 0.12 | |||||||||
| Pro forma basic earnings per share |
||||||||||||
| Pro forma diluted earnings per share |
||||||||||||
| Weighted-average number of shares used in per share amounts |
||||||||||||
| Basic |
179,110,211 | 179,102,280 | 179,025,738 | |||||||||
| Diluted |
180,481,081 | 180,326,867 | 179,881,094 | |||||||||
| Other Financial Data: |
||||||||||||
| EBITDA(3) |
$ | 249.0 | $ | 233.4 | $ | 212.5 | ||||||
| Adjusted EBITDA(3) |
286.1 | 271.3 | 240.9 | |||||||||
| Capital expenditures |
90.6 | 66.5 | 68.9 | |||||||||
| Summary Statement of Cash Flows Data: |
||||||||||||
| Net cash provided by (used in) continuing operations: |
||||||||||||
| Operating activities |
$ | 119.8 | $ | 140.7 | $ | 97.6 | ||||||
| Investing activities |
(93.4 | ) | (150.0 | ) | (388.2 | ) | ||||||
| Financing activities |
(35.1 | ) | 12.3 | 286.7 | ||||||||
13
Table of Contents
| As of | ||||||||||||||||
| June 28, 2014 | June 29, 2013 |
June 30, 2012 |
||||||||||||||
| Actual | As adjusted (unaudited) |
|||||||||||||||
| (dollars in millions) | ||||||||||||||||
| Balance Sheet Data: |
||||||||||||||||
| Cash and cash equivalents |
$ | 5.3 | $ | $ | 14.1 | $ | 11.1 | |||||||||
| Total assets |
3,239.8 | 3,055.4 | 2,946.6 | |||||||||||||
| Total debt |
1,459.5 | 1,483.0 | 1,208.3 | |||||||||||||
| Total shareholders’ equity |
434.1 | 420.0 | 625.1 | |||||||||||||
| (1) | Interest expense, net includes $6.6 million, $11.1 million, and $12.5 million of reclassification adjustments for changes in fair value of interest rate swaps for fiscal 2014, fiscal 2013, and fiscal 2012, respectively. |
| (2) | Income tax expense includes $2.6 million, $4.3 million, and $4.9 million tax benefit from reclassification adjustments for fiscal 2014, fiscal 2013, and fiscal 2012, respectively, related to the reclassification adjustments for changes in fair value of interest rate swaps referred to in note (1). |
| (3) | Management measures operating performance based on our EBITDA, defined as net income (loss) before interest expense (net of interest income), income taxes, and depreciation and amortization. EBITDA is not defined under U.S. GAAP and is not a measure of operating income, operating performance, or liquidity presented in accordance with U.S. GAAP and is subject to important limitations. Our definition of EBITDA may not be the same as similarly titled measures used by other companies. |
We believe that the presentation of EBITDA enhances an investor’s understanding of our performance. We believe this measure is a useful metric to assess our operating performance from period to period by excluding certain items that we believe are not representative of our core business. We use this measure to evaluate the performance of our segments and for business planning purposes. We believe that EBITDA will provide investors with a useful tool for assessing the comparability between periods of our ability to generate cash from operations sufficient to pay taxes, to service debt, and to undertake capital expenditures because it eliminates depreciation and amortization expense. We present EBITDA in order to provide supplemental information that we consider relevant for the readers of our consolidated financial statements included elsewhere in this prospectus, and such information is not meant to replace or supersede U.S. GAAP measures.
In addition, our management uses Adjusted EBITDA, defined as net income (loss) before interest expense (net of interest income), income and franchise taxes, and depreciation and amortization, further adjusted to exclude certain unusual, non-cash, non-recurring, cost reduction, and other adjustment items permitted in calculating covenant compliance under our credit agreements (other than certain pro forma adjustments permitted under our credit agreements relating to the Adjusted EBITDA contribution of acquired entities or businesses prior to the acquisition date). Under our credit agreements, our ability to engage in certain activities such as incurring certain additional indebtedness, making certain investments, and making restricted payments is tied to ratios based on Adjusted EBITDA (as defined in the credit agreements). Our definition of Adjusted EBITDA may not be the same as similarly titled measures used by other companies.
Adjusted EBITDA is not defined under U.S. GAAP, and is subject to important limitations. We believe that the presentation of Adjusted EBITDA is useful to investors because it is frequently used by securities analysts, investors, and other interested parties in their evaluation of the operating performance of companies in industries similar to ours. In addition, targets based on Adjusted EBITDA are among the measures we use to evaluate our management’s performance for purposes of determining their compensation under our incentive plans as further described under “Management—Executive Compensation.”
We believe that the most directly comparable GAAP measure to Adjusted EBITDA is net income (loss). The following table reconciles net income to EBITDA and Adjusted EBITDA for the periods presented:
| For the fiscal year ended | ||||||||||||||||||||
| June 28, 2014 |
June 29, 2013 |
June 30, 2012 |
July 2, 2011 |
July 3, 2010 |
||||||||||||||||
| (dollars in millions) | ||||||||||||||||||||
| Net income |
$ | 15.5 | $ | 8.4 | $ | 21.0 | $ | 13.7 | $ | 0.9 | ||||||||||
| Interest expense, net |
86.1 | 93.9 | 76.3 | 78.9 | 84.7 | |||||||||||||||
| Income tax expense |
14.7 | 11.0 | 12.9 | 10.9 | 8.1 | |||||||||||||||
| Depreciation |
73.5 | 58.8 | 46.4 | 43.2 | 44.4 | |||||||||||||||
| Amortization of intangible assets |
59.2 | 61.3 | 55.9 | 55.8 | 55.2 | |||||||||||||||
|
|
|
|
|
|
|
|
|
|
|
|||||||||||
| EBITDA |
249.0 | 233.4 | 212.5 | 202.5 | 193.3 | |||||||||||||||
| Non-cash items(i) |
4.8 | 1.8 | 3.8 | 0.3 | (2.0 | ) | ||||||||||||||
| Acquisition, integration and reorganization(ii) |
11.3 | 22.9 | 12.9 | 8.2 | 2.4 | |||||||||||||||
| Non-recurring items(iii) |
0.4 | 0.4 | 1.5 | 4.5 | (1.4 | ) | ||||||||||||||
| Productivity initiatives(iv) |
16.3 | 3.1 | 1.5 | — | — | |||||||||||||||
| Multiemployer plan withdrawal(v) |
0.4 | 3.9 | (0.1 | ) | 0.8 | — | ||||||||||||||
| Other adjustment items(vi) |
3.9 | 5.8 | 8.8 | 3.7 | 1.0 | |||||||||||||||
|
|
|
|
|
|
|
|
|
|
|
|||||||||||
| Adjusted EBITDA |
$ | 286.1 | $ | 271.3 | $ | 240.9 | $ | 220.0 | $ | 193.3 | ||||||||||
|
|
|
|
|
|
|
|
|
|
|
|||||||||||
14
Table of Contents
| (i) | Includes adjustments for interest rate swap hedge ineffectiveness, adjustments to reflect certain assets held for sale to their net realizable value, non-cash charges arising from employee stock options, and changes in fair value of fuel collar instruments. In addition, for fiscal 2014 and fiscal 2013, this includes increases in the LIFO reserve of $3.0 million and $0.8 million, respectively. |
| (ii) | Includes professional fees and other costs related to completed and abandoned acquisitions, costs of integrating certain of our facilities, facility closing costs, legal fees related to our legal entity reorganization, and advisory fees paid to the Sponsors. For fiscal 2013, this also includes $11.2 million for the impact of the initial fair value of inventory that was acquired as part of acquisitions. |
| (iii) | Consists primarily of transition costs related to IT outsourcing, certain severance costs, and the impact of business interruption due to hurricane and other weather related events. |
| (iv) | Consists primarily of professional fees and related expenses associated with the Winning Together program. |
| (v) | Includes amounts related to the withdrawal from multiemployer pension plans. For fiscal 2014 and fiscal 2013, this amount includes $0.4 million and $3.7 million, respectively, for the expense related to the withdrawal from the Central States Southeast and Southwest Areas Pension Fund. See Note 15 to the audited consolidated financial statements included in this prospectus. |
| (vi) | Consists primarily of costs related to certain financing transactions, lease amendments, and franchise tax expense and other adjustments permitted by our credit agreements. |
15
Table of Contents
Investing in our common stock involves a high degree of risk. You should consider carefully the risks and uncertainties described below and the other information contained in this prospectus, including our consolidated financial statements and the related notes, before you decide whether to purchase our common stock.
Risks Relating to Our Business and Industry
Competition in our industry is intense, and we may not be able to compete successfully.
The foodservice distribution industry is highly competitive. Certain of our competitors have greater financial and other resources than we do. Furthermore, there are two larger broadline distributors, Sysco and US Foods, with national footprints. On December 8, 2013, these competitors entered into an agreement and plan of merger; this transaction is subject to ongoing federal and state regulatory review. In addition, there are numerous smaller regional, local, and specialty distributors. These smaller distributors often align themselves with other smaller distributors through purchasing cooperatives and marketing groups to enhance their geographic reach, private label offerings, overall purchasing power, cost efficiencies, and ability to try to meet customer requirements for national or multi-regional distribution. We often do not have exclusive service agreements with our customers and our customers may switch to other distributors if those distributors can offer lower prices, differentiated products, or customer service that is perceived to be superior. We believe that most purchasing decisions in the foodservice business are based on the quality and price of the product and a distributor’s ability to completely and accurately fill orders and provide timely deliveries. We cannot assure you that our current or potential competitors will not provide products or services that are comparable or superior to those provided by us or adapt more quickly than we do to evolving trends or changing market requirements. Accordingly, we cannot assure you that we will be able to compete effectively against current and future competitors, and increased competition may result in price reductions, reduced gross margins, and loss of market share, any of which could materially adversely affect our business, financial condition, or results of operations.
We operate in a low margin industry, which could increase the volatility of our results of operations.
Similar to other resale-based industries, the foodservice distribution industry is characterized by relatively low profit margins. These low profit margins tend to increase the volatility of our reported net income since any decline in our net sales or increase in our costs that is small relative to our total net sales or costs may have a large impact on our net income (loss).
We may not realize anticipated benefits from our cost reduction and productivity improvement efforts, including our Winning Together program.
We have implemented a number of cost reduction and productivity improvement initiatives that we believe are necessary to position our business for future success and growth, including our Winning Together program. Our future success and earnings growth depend upon our ability to achieve a lower cost structure and operate efficiently in the highly competitive foodservice distribution industry, particularly in an environment of increased competitive activity and reduced profitability. A variety of factors could cause us not to realize some of the expected cost savings and productivity enhancements, including, among other things, difficulties in implementation, delays in the anticipated timing of activities related to our cost savings initiatives, lack of sustainability in cost savings over time, and unexpected costs associated with operating our business. If we are unable to realize the anticipated benefits from our cost cutting and productivity improvement efforts, including our Winning Together program, we could become cost disadvantaged in the marketplace, which could adversely affect our competitiveness and our profitability. Furthermore, even if we realize the anticipated benefits of our cost reduction and productivity improvement efforts, we may experience an adverse impact on our employees and customers which could adversely affect our sales and profits.
16
Table of Contents
Cost inflation or deflation could affect the value of our inventory and our financial results.
We make a significant portion of our sales at prices that are based on the cost of products we sell, plus a percentage markup. As a result, volatile food costs may have a direct impact upon our profitability. Our profit levels may be negatively affected during periods of product cost deflation, even though our gross profit percentage may remain relatively constant. Prolonged periods of product cost inflation also may have a negative impact on our profit margins and earnings to the extent such product cost increases are not passed on to customers because of their resistance to higher prices. Furthermore, our business model requires us to maintain an inventory of products, and changes in price levels between the time that we acquire inventory from our suppliers and the time we sell the inventory to our customers could lead to unexpected shifts in demand for our products or could require us to sell inventory at a loss. In addition, product cost inflation may negatively impact consumer discretionary spending decisions within our customers’ establishments, which could impact our sales. Our inability to quickly respond to inflationary and deflationary cost pressures could have a material adverse impact on our business, financial condition, or results of operations.
Many of our customers are not obligated to continue purchasing products from us.
Many of our customers buy from us pursuant to individual purchase orders, and we often do not enter into long-term agreements with these customers. Because such customers are not obligated to continue purchasing products from us, we cannot assure you that the volume and/or number of our customers’ purchase orders will remain constant or increase or that we will be able to maintain our existing customer base. Significant decreases in the volume and/or number of our customers’ purchase orders or our inability to retain or grow our current customer base may have a material adverse effect on our business, financial condition, or results of operations.
Group purchasing organizations may become more active in our industry and increase their efforts to add our customers as members of these organizations.
Some of our customers, particularly our larger customers, purchase their products from us through group purchasing organizations, or “GPOs,” in an effort to lower the prices paid by these customers on their foodservice orders, and we have experienced some pricing pressure from these purchasers. These GPOs have recently increased their efforts to include smaller, independent restaurants. If these GPOs are able to add a significant number of our customers as members, we may be forced to lower the prices we charge these customers in order to retain the business, which would negatively affect our business, financial condition, or results of operations. Additionally, if we were unable or unwilling to lower the prices we charge for our products to a level that was satisfactory to the GPOs, we may lose the business of those of our customers that are members of these organizations, which could have a material adverse impact on our business, financial condition, or results of operations
Changes in consumer eating habits could materially and adversely affect our business, financial condition, or results of operations.
Changes in consumer eating habits (such as a decline in consuming food away from home, a decline in portion sizes, or a shift in preferences toward restaurants that are not our customers) could reduce demand for our products. Consumer eating habits could be affected by a number of factors, including changes in attitudes regarding diet and health or new information regarding the health effects of consuming certain foods. If consumer eating habits change significantly, we may be required to modify or discontinue sales of certain items in our product portfolio, and we may experience higher costs associated with the implementation of those changes. Changing consumer eating habits may reduce the frequency with which consumers purchase meals outside of the home. Additionally, changes in consumer eating habits may result in the enactment of laws and regulations that impact the ingredients and nutritional content of our food products, or laws and regulations requiring us to disclose the nutritional content of our food products. Compliance with these laws and regulations, as well as others regarding the ingredients and nutritional content of our food products, may be costly and time-
17
Table of Contents
consuming. We cannot make any assurances regarding our ability to effectively respond to changes in consumer health perceptions or resulting new laws or regulations or to adapt our menu offerings to trends in eating habits.
Extreme weather conditions and natural disasters may interrupt our business, or our customers’ businesses, which could have a material adverse effect on our business, financial condition, or results of operations.
Many of our facilities and our customers’ facilities are located in areas that may be subject to extreme, and occasionally prolonged, weather conditions, including, but not limited to, hurricanes, blizzards, and extreme cold. Such extreme weather conditions may interrupt our operations and reduce the number of consumers who visit our customers’ facilities in such areas. For example, unusually severe winter weather in our third quarter of fiscal 2014 negatively affected both our net sales and our transportation costs in that quarter. Furthermore, such extreme weather conditions may interrupt or impede access to our customers’ facilities, all of which could have a material adverse effect on our business, financial condition, or results of operations.
We rely on third-party suppliers, and our business may be affected by interruption of supplies or increases in product costs.
We obtain substantially all of our foodservice and related products from third-party suppliers. We typically do not have long-term contracts with our suppliers. Although our purchasing volume can sometimes provide an advantage when dealing with suppliers, suppliers may not provide the foodservice products and supplies needed by us in the quantities and at the prices requested. Our suppliers may also be affected by higher costs to source or produce and transport food products, as well as by other related expenses that they pass through to their customers, which could result in higher costs for the products they supply to us. Because we do not control the actual production of most of the products we sell, we are also subject to material supply chain interruptions, delays caused by interruption in production, and increases in product costs, including those resulting from product recalls or a need to find alternate materials or suppliers, based on conditions outside our control. These conditions include work slowdowns, work interruptions, strikes, or other job actions by employees of suppliers, weather conditions or more prolonged climate change, crop conditions, water shortages, transportation interruptions, unavailability of fuel or increases in fuel costs, competitive demands, contamination with mold, bacteria or other contaminants, and natural disasters or other catastrophic events, including, but not limited to, the outbreak of e. coli or similar food borne illnesses or bioterrorism in the United States. Our inability to obtain adequate supplies of foodservice and related products as a result of any of the foregoing factors or otherwise could mean that we could not fulfill our obligations to our customers and, as a result, our customers may turn to other distributors. Our inability to anticipate and react to changing food costs through our sourcing and purchasing practices in the future could have a material adverse effect on our business, financial condition, or results of operations.
We face risks relating to labor relations, labor costs, and the availability of qualified labor.
As of June 28, 2014, we had more than 11,000 employees of whom approximately 680 were members of local unions associated with the International Brotherhood of Teamsters or other unions. Although our labor contract negotiations have in the past generally taken place with the local union representatives, we may be subject to increased efforts to engage us in multi-unit bargaining that could subject us to the risk of multi-location labor disputes or work stoppages that would place us at greater risk of being materially adversely affected by labor disputes. In addition, labor organizing activities could result in additional employees becoming unionized, which could result in higher labor costs. Although we have not experienced any significant labor disputes or work stoppages in recent history, and we believe we have satisfactory relationships with our employees, including those who are union members, increased unionization or a work stoppage because of our failure to renegotiate union contracts could have a material adverse effect on us.
Further, potential changes in labor legislation, including the Employee Free Choice Act, or “EFCA,” could result in portions of our workforce, such as our delivery personnel, being subjected to greater organized labor
18
Table of Contents
influence. The EFCA could impact the nature of labor relations in the United States and how union elections and contract negotiations are conducted. The EFCA aims to facilitate unionization, and employers of unionized employees may face mandatory, binding arbitration of labor scheduling, costs, and standards, which could increase the costs of doing business. EFCA or similar labor legislation could have an adverse effect on our business, financial condition, or results of operations by imposing requirements that could potentially increase costs and reduce our operating flexibility.
We are subject to a wide range of labor costs. Because our labor costs are, as a percentage of net sales, higher than many other industries, we may be significantly harmed by labor cost increases. In addition, labor is a significant cost of many of our customers in the U.S. food-away-from-home industry. Any increase in their labor costs, including any increases in costs as a result of increases in minimum wage requirements, could reduce the profitability of our customers and reduce demand for our products.
We rely heavily on our employees, particularly drivers, and any shortage of qualified labor could significantly affect our business. Our recruiting and retention efforts and efforts to increase productivity may not be successful and we could encounter a shortage of qualified drivers in future periods. Any such shortage would decrease our ability to serve our customers effectively. Such a shortage would also likely lead to higher wages for employees and a corresponding reduction in our profitability.
Further, we continue to assess our healthcare benefit costs. Despite our efforts to control costs while still providing competitive healthcare benefits to our staff members, significant increases in healthcare costs continue to occur, and we can provide no assurance that our cost containment efforts in this area will be effective. Due to the breadth and complexity of federal healthcare legislation and the staggered implementation of its provisions and corresponding regulations, it is difficult to predict the overall impact of the healthcare legislation on our business over the coming years. These changes may require us to change the health benefits that we offer to our employees or may increase the cost of healthcare in general. If we are unable to raise our prices or cut other costs to cover this expense, such increases in expenses could materially reduce our operating profit. Our distributors and suppliers also may be affected by higher minimum wage and benefit standards, which could result in higher costs for goods and services supplied to us.
Fluctuations in fuel costs and other transportation costs could harm our business.
The high cost of fuel can negatively affect consumer confidence and discretionary spending and, as a result, reduce the frequency and amount spent by consumers within our customers’ establishments for food away from home. The high cost of fuel and other transportation related costs, such as tolls, fuel taxes, and license and registration fees, can also increase the price we pay for products as well as the costs incurred by us to deliver products to our customers. Furthermore, both the price and supply of fuel are unpredictable and fluctuate based on events outside our control, including geopolitical developments, supply and demand for oil and gas, actions by the Organization of Petroleum Exporting Countries and other oil and gas producers, war and unrest in oil producing countries and regions, regional production patterns, and environmental concerns. These factors in turn could have a material adverse effect on our sales, margins, operating expenses, or results of operations.
From time to time, we may enter into arrangements to hedge our exposure to fuel costs. Such hedges, however, may not be effective and may result in us paying higher than market costs for a portion of our fuel. In addition, while we have been successful in the past in implementing fuel surcharges to offset fuel cost increases, we may not be able to do so in the future.
In addition, compliance with current and future environmental laws and regulations relating to carbon emissions and the effects of global warming can be expected to have a significant impact on our transportation costs and could have a material adverse effect on our business, financial condition, or results of operations.
19
Table of Contents
If one or more of our competitors implements a lower cost structure, they may be able to offer lower prices to customers and we may be unable to adjust our cost structure in order to compete profitably.
Over the last several decades, the retail food industry has undergone significant change as companies such as Wal-Mart and Costco have developed a lower cost structure to provide their customer base with an everyday low-cost product offering. As a large-scale foodservice distributor, we have similar strategies to remain competitive in the marketplace by reducing our cost structure. However, if one or more of our competitors in the foodservice distribution industry adopted an everyday low price strategy, we would potentially be pressured to lower prices to our customers and would need to achieve additional cost savings to offset these reductions. We may be unable to change our cost structure and pricing practices rapidly enough to successfully compete in such an environment.
If we fail to increase our sales in the highest margin portions of our business, our profitability may suffer.
Foodservice distribution is a relatively low margin industry. The most profitable customers within the foodservice distribution industry are Street customers. In addition, our most profitable products are our Performance Brands. We typically provide a higher level of services to our Street customers and are able to earn a higher operating margin on sales to Street customers. Street customers are also more likely to purchase our Performance Brands. Our ability to continue to penetrate this key customer type is critical to achieving increased operating profits. Changes in the buying practices of Street customers or decreases in our sales to Street customers or a decrease in the sales of our Performance Brands could have a material adverse effect on our business, financial condition, or results of operations.
Changes in pricing practices of our suppliers could negatively affect our profitability.
Foodservice distributors have traditionally generated a significant percentage of their gross margins from promotional allowances paid by their suppliers. Promotional allowances are payments from suppliers based upon the efficiencies that the distributor provides to its suppliers through purchasing scale and through marketing and merchandising expertise. Promotional allowances are a standard practice among suppliers to foodservice distributors and represent a significant source of profitability for us and our competitors. Any change in such practices that results in the reduction or elimination of promotional allowances could be disruptive to us and the industry as a whole and could have a material adverse effect on our business, financial condition, or results of operations.
Our growth strategy may not achieve the anticipated results.
Our future success will depend on our ability to grow our business, including through increasing our Street sales, expanding our Performance Brands, making strategic acquisitions, and achieving improved operating efficiencies as we continue to expand our customer base. Our growth and innovation strategies require significant commitments of management resources and capital investments and may not grow our net sales at the rate we expect or at all. As a result, we may not be able to recover the costs incurred in developing our new projects and initiatives or to realize their intended or projected benefits, which could have a material adverse effect on our business, financial condition, or results of operations.
We may not be able to realize benefits of acquisitions or successfully integrate the businesses we acquire.
From time to time, we opportunistically pursue acquisitions that broaden our customer base and/or geographic reach. If we are unable to integrate acquired businesses successfully or to realize anticipated economic, operational, and other benefits and synergies in a timely manner, our profitability could be adversely affected. Integration of an acquired business may be more difficult when we acquire a business in a market in which we have limited expertise, or with a company culture different from ours. A significant expansion of our business and operations, in terms of geography or magnitude, could strain our administrative and operational resources. Additionally, we may be unable to retain qualified management and other key personnel employed by
20
Table of Contents
acquired companies and may fail to build a network of acquired companies in new markets. We could face significantly greater competition from broadline foodservice distributors in these markets than we face in our existing markets.
We also regularly evaluate opportunities to acquire other companies. To the extent our future growth includes acquisitions, we cannot assure you that we will be able to obtain any necessary financing for such acquisitions, consummate such potential acquisitions effectively, effectively and efficiently integrate any acquired entities, or successfully expand into new markets.
Our business is subject to significant governmental regulation, and costs or claims related to these requirements could adversely affect our business.
Our operations are subject to regulation by state and local health departments, the U.S. Department of Agriculture, and the Food and Drug Administration, or the “FDA,” which generally impose standards for product quality and sanitation and are responsible for the administration of recent bioterrorism legislation affecting the foodservice industry. These government authorities regulate, among other things, the processing, packaging, storage, distribution, advertising, and labeling of our products. In late 2010, the FDA Food Safety Modernization Act, or the “FSMA,” was enacted. The FSMA represents a significant expansion of food safety requirements and FDA food safety authorities and, among other things, requires that the FDA impose comprehensive, prevention-based controls across the food supply, further regulates food products imported into the United States, and provides the FDA with mandatory recall authority. Our seafood operations are also specifically regulated by federal and state laws, including those administered by the National Marine Fisheries Service, established for the preservation of certain species of marine life, including fish and shellfish. Our processing and distribution facilities must be registered with the FDA biennially and are subject to periodic government agency inspections. State and/or federal authorities generally inspect our facilities at least annually. The Federal Perishable Agricultural Commodities Act, which specifies standards for the sale, shipment, inspection, and rejection of agricultural products, governs our relationships with our fresh food suppliers with respect to the grading and commercial acceptance of product shipments. We are also subject to regulation by state authorities for the accuracy of our weighing and measuring devices. Additionally, the Surface Transportation Board and the Federal Highway Administration regulate our trucking operations, and interstate motor carrier operations are subject to safety requirements prescribed by the U.S. Department of Transportation and other relevant federal and state agencies. Our suppliers are also subject to similar regulatory requirements and oversight. The failure to comply with applicable regulatory requirements could result in, among other things, administrative, civil, or criminal penalties or fines; mandatory or voluntary product recalls; warning or untitled letters; cease and desist orders against operations that are not in compliance; closure of facilities or operations; the loss, revocation, or modification of any existing licenses, permits, registrations, or approvals; or the failure to obtain additional licenses, permits, registrations, or approvals in new jurisdictions where we intend to do business, any of which could have a material adverse effect on our business, financial condition, or results of operations. These laws and regulations may change in the future and we may incur material costs in our efforts to comply with current or future laws and regulations or in any required product recalls.
In addition, our operations are subject to various federal, state, and local laws and regulations relating to the protection of the environment, including those governing the discharge of pollutants into the air, soil, and water; the management and disposal of solid and hazardous materials and wastes; employee exposure to hazards in the workplace; and the investigation and remediation of contamination resulting from releases of petroleum products and other regulated materials. In the course of our operations, we operate, maintain, and fuel fleet vehicles; store fuel in on-site above and underground storage tanks; operate refrigeration systems, and use and dispose of hazardous substances and food wastes. We could incur substantial costs, including fines or penalties and third-party claims for property damage or personal injury, as a result of any violations of environmental or workplace safety laws and regulations or releases of regulated materials into the environment. In addition, we could incur investigation, remediation, or other costs related to environmental conditions at our currently or formerly owned or operated properties. Additionally, concern over climate change, including the impact of global warming, has
21
Table of Contents
led to significant U.S. and international legislative and regulatory efforts to limit greenhouse gas emissions. Increased regulation regarding greenhouse gas emissions, especially diesel engine emissions, could impose substantial costs upon us. These costs include an increase in the cost of the fuel and other energy we purchase and capital costs associated with updating or replacing our vehicles prematurely.
If the products we distribute are alleged to cause injury or illness or fail to comply with governmental regulations, we may need to recall our products and may experience product liability claims.
The products we distribute may be subject to product recalls, including voluntary recalls or withdrawals, if they are alleged to cause injury or illness or if they are alleged to have been mislabeled, misbranded, or adulterated or to otherwise be in violation of governmental regulations. We may also voluntarily recall or withdraw products that we consider do not meet our quality standards, whether for taste, appearance, or otherwise, in order to protect our brand and reputation. If there is any future product withdrawal that could result in substantial and unexpected expenditures, destruction of product inventory, damage to our reputation, and lost sales due to the unavailability of the product for a period of time, our business, financial condition, or results of operations may be materially adversely affected.
We also may be subject to product liability claims if the consumption or use of our products is alleged to cause injury or illness. While we carry product liability insurance, our insurance may not be adequate to cover all liabilities we may incur in connection with product liability claims. For example, punitive damages may not covered by insurance. In addition, we may not be able to continue to maintain our existing insurance, obtain comparable insurance at a reasonable cost, if at all, or secure additional coverage, which may result in future product liability claims being uninsured. If there is a product liability judgment against us or a settlement agreement related to a product liability claim, our business, financial condition, or results of operations may be materially adversely affected.
We rely heavily on technology in our business and any technology disruption or delay in implementing new technology could adversely affect our business.
The foodservice distribution industry is transaction intensive. Our ability to control costs and to maximize profits, as well as to serve customers effectively, depends on the reliability of our information technology systems and related data entry processes. We rely on software and other technology systems, some of which are managed by third-party service providers, to manage significant aspects of our business, including making purchases, processing orders, managing our warehouses, loading trucks in the most efficient manner, and optimizing the use of storage space. The failure of our information technology systems to perform as we anticipate could disrupt our business and could result in transaction errors, processing inefficiencies, and the loss of sales and customers, causing our business and results of operations to suffer. In addition, our information technology systems may be vulnerable to damage or interruption from circumstances beyond our control, including fire, natural disasters, power outages, systems failures, security breaches, cyber attacks, and viruses. While we have invested and continue to invest in technology security initiatives and disaster recovery plans, these measures cannot fully insulate us from technology disruption that could result in adverse effects on our operations and profits.
Information technology systems evolve rapidly and in order to compete effectively we are required to integrate new technologies in a timely and cost effective manner. If competitors implement new technologies before we do, allowing such competitors to provide lower priced or enhanced services of superior quality compared to those we provide, this could have an adverse effect on our operations and profits.
A cyber-security incident and other technology disruptions could negatively affect our business and our relationships with customers.
We rely upon information technology networks and systems to process, transmit, and store electronic information, and to manage or support virtually all of our business processes and activities. We also use mobile
22
Table of Contents
devices, social networking, and other online activities to connect with our employees, suppliers, business partners, and customers. These uses give rise to cybersecurity risks, including security breach, espionage, system disruption, theft, and inadvertent release of information. Our business involves the storage and transmission of numerous classes of sensitive and/or confidential information and intellectual property, including customers’ and suppliers’ personal information, private information about employees, and financial and strategic information about us and our business partners. Additionally, while we have implemented measures to prevent security breaches and cyber incidents, our preventative measures and incident response efforts may not be entirely effective. The theft, destruction, loss, misappropriation, or release of sensitive and/or confidential information or intellectual property, or interference with our information technology systems or the technology systems of third parties on which we rely, could result in business disruption, negative publicity, brand damage, violation of privacy laws, loss of customers, potential liability, and competitive disadvantage.
We may be subject to or affected by product liability claims relating to products we distribute.
We, like any other seller of food, may be exposed to product liability claims in the event that the use of products we sell causes injury or illness. We believe we have sufficient primary and excess umbrella liability insurance with respect to product liability claims. However, we cannot assure you that we will be able to obtain replacement insurance on comparable terms, and any replacement insurance or our current insurance may not continue to be available at a reasonable cost, or, if available, may not be adequate to cover all of our liabilities. We generally seek contractual indemnification and insurance coverage from parties supplying products to us, but this indemnification or insurance coverage is limited, as a practical matter, to the creditworthiness of the indemnifying party and the insured limits of any insurance provided by suppliers. If we do not have adequate insurance or contractual indemnification available, product liability relating to defective products could adversely affect our profitability.
Adverse judgments or settlements resulting from legal proceedings in which we may be involved in the normal course of our business could reduce our profits or limit our ability to operate our business.
In the normal course of our business, we are involved in various legal proceedings. The outcome of these proceedings cannot be predicted. If any of these proceedings were to be determined adversely to us or a settlement involving a payment of a material sum of money were to occur, it could materially and adversely affect our profits or ability to operate our business. Additionally, we could become the subject of future claims by third parties, including our employees, our investors, or regulators. Any significant adverse judgments or settlements would reduce our profits and could limit our ability to operate our business. Further, we may incur costs related to claims for which we have appropriate third-party indemnity, but such third parties fail to fulfill their contractual obligations.
Adverse publicity about us, lack of confidence in our products, and other risks could negatively affect our reputation and affect our business.
Maintaining a good reputation and public confidence in the safety of the products we distribute is critical to our business, particularly to selling our Performance Brands products. Anything that damages our reputation, or the public’s confidence in our products, whether or not justified, including adverse publicity about the quality, safety, or integrity of our products, could quickly affect our net sales and profits. Reports, whether true or not, of food-borne illnesses or harmful bacteria (such as e. coli, bovine spongiform encephalopathy, hepatitis A, trichinosis, listeria, or salmonella) and injuries caused by food tampering could also severely injure our reputation or negatively affect the public’s confidence in our products. We may need to recall our products if they become adulterated. If patrons of our restaurant customers become ill from food-borne illnesses, our customers could be forced to temporarily close restaurant locations and our sales would be correspondingly decreased. In addition, instances of food-borne illnesses, food tampering, or other health concerns, such as flu epidemics or other pandemics, even those unrelated to the use of our products, or public concern regarding the safety of our products, can result in negative publicity about the foodservice distribution industry and cause our
23
Table of Contents
sales to decrease dramatically. In addition, a widespread health epidemic or food-borne illness, whether or not related to the use of our products, may cause consumers to avoid public gathering places, like restaurants, or otherwise change their eating behaviors. Health concerns and negative publicity may harm our results of operations and damage the reputation of, or result in a lack of acceptance of, our products or the brands that we carry.
Our participation in a “multiemployer” pension plan could give rise to significant expenses and liabilities in the future.
We participate in a “multiemployer” pension plan administered by a labor union representing some of our employees. We make periodic contributions to the plan to allow the plan to meet its pension benefit obligations to its participants. In the ordinary course of our renegotiation of collective bargaining agreements with the labor union that maintains the plan, we could decide to discontinue participation in the plan, and in that event we could face withdrawal liability. We could be treated as withdrawing from participation in the plan if the number of our employees participating in the plan is reduced to a certain degree over certain periods of time. Such reductions in the number of our employees participating in the plan could occur as a result of changes in our business operations, such as facility closures or consolidations. In the event that we withdraw from participation in the plan, applicable law could require us to make withdrawal liability contributions to the plan, and we would have to reflect that on our balance sheet. Our withdrawal liability for the multiemployer plan would depend on the extent of the plan’s funding of vested benefits. If the multiemployer pension plan in which we participate has significant underfunded liabilities, such underfunding will increase the size of our potential withdrawal liability.
Our earnings will be reduced by amortization charges associated with any future acquisitions.
After we complete an acquisition, we must amortize any identifiable intangible assets associated with the acquired company over future periods. We also must amortize any identifiable intangible assets that we acquire directly. Our amortization of these amounts reduce our future earnings in the affected periods.
We have experienced losses due to the inability to collect accounts receivable in the past and could experience increases in such losses in the future if our customers are unable to timely pay their debts to us.
Certain of our customers have from time to time experienced bankruptcy, insolvency and/or an inability to pay their debts to us as they come due. If our customers suffer significant financial difficulty, they may be unable to pay their debts to us timely or at all, which could have a material adverse effect on our results of operations. It is possible that customers may contest their contractual obligations to us under bankruptcy laws or otherwise. Significant customer bankruptcies could further adversely affect our net sales and increase our operating expenses by requiring larger provisions for bad debt expense. In addition, even when our contracts with these customers are not contested, if customers are unable to meet their obligations on a timely basis, it could adversely affect our ability to collect receivables. Further, we may have to negotiate significant discounts and/or extended financing terms with these customers in such a situation. If we are unable to collect upon our accounts receivable as they come due in an efficient and timely manner, our business, financial condition, or results of operations may be materially and adversely affected.
Periods of difficult economic conditions and heightened uncertainty in the financial markets affect consumer confidence, which can adversely affect our business.
The foodservice industry is sensitive to national and regional economic conditions. From 2008 through the beginning of 2010, deteriorating economic conditions and heightened uncertainty in the financial markets negatively affected consumer confidence and discretionary spending. This led to reductions in the frequency of dining out and the amount spent by consumers for food-away-from-home purchases. These conditions, in turn, negatively affected our results during these periods. The development of similar economic conditions in the future or permanent changes in consumer dining habits as a result of such conditions would likely negatively
24
Table of Contents
affect our operating results. In addition, the vending portion of our Vistar business is sensitive to, and closely correlated with, the level of employment in the U.S. domestic manufacturing sector, which has experienced significant declines in employment over the past several years. Any declines in the level of employment, and any related declines in Vistar sales to the vending channel, could have a material adverse effect on our business, financial condition, or results of operations.
We are highly dependent upon senior management. Our failure to attract and retain key members of senior management could have a material adverse effect on us.
We are highly dependent on the performance and continued efforts of our senior management team. Our future success depends on our ability to continue to attract and retain qualified executive officers and senior management. Any inability to manage our operations effectively could have a material adverse effect on our business, financial condition, or results of operations. Although we have an employment agreement with our Chief Executive Officer, we cannot prevent him from terminating employment with us. Our other executives are not bound by employment agreements with us. Losing the services of any of these individuals could adversely affect our business, financial condition, and results of operations, and it may be difficult to replace them quickly with executives of equal experience and capabilities.
Federal, state, and local tax rules may adversely impact our business, financial condition, or results of operations.
We are subject to federal, state, and local taxes in the United States. Although we believe that our tax estimates are reasonable, if the Internal Revenue Service (“IRS”) or any other taxing authority disagrees with the positions we have taken on our tax returns, we could face additional tax liability, including interest and penalties. If material, payment of such additional amounts upon final adjudication of any disputes could have a material impact upon our business, financial condition, or results of operations. In addition, complying with new tax rules, laws, or regulations could impact our business, financial condition, or results of operations, and increases to federal or state statutory tax rates and other changes in tax laws, rules, or regulations may increase our effective tax rate. Any increase in our effective tax rate could have a material impact on our business, financial condition, or results of operations.
Insurance and claims expenses could significantly reduce our profitability.
Our future insurance and claims expenses might exceed historic levels, which could reduce our profitability. We maintain high-deductible insurance programs covering portions of general and vehicle liability and workers’ compensation. The amount in excess of the deductibles is insured by third-party insurance carriers, subject to certain limitations and exclusions. We also maintain self-funded group medical insurance.
We reserve for anticipated losses and expenses and periodically evaluate and adjust our claims reserves to reflect our experience. However, ultimate results may differ from our estimates, which could result in losses over our reserved amounts.
Although we believe our aggregate insurance limits should be sufficient to cover reasonably expected claims costs, it is possible that the amount of one or more claims could exceed our aggregate coverage limits. Insurance carriers have raised premiums for many businesses in our industry, including ours. As a result, our insurance and claims expense could increase. Our results of operations and financial condition could be materially and adversely affected if (1) total claims costs significantly exceed our coverage limits, (2) we experience a claim in excess of our coverage limits, (3) our insurance carriers fail to pay on our insurance claims, or (4) we experience a claim for which coverage is not provided.
25
Table of Contents
Risks Relating to Our Indebtedness
Our substantial leverage could adversely affect our ability to raise additional capital to fund our operations, limit our ability to react to changes in the economy or in our industry, expose us to interest rate risk to the extent of our variable rate debt, and prevent us from meeting our obligations under our indebtedness.
Following this offering, we will continue to be highly leveraged. As of June 28, 2014, on an as adjusted basis giving effect to this offering, the use of proceeds therefrom as described under “Use of Proceeds,” we would have had $ million of indebtedness. In addition, we would have had $ million of availability under our ABL facility after giving effect to $108.7 million of outstanding letters of credit. See “Use of Proceeds.”
Our high degree of leverage could have important consequences for us, including:
| • | requiring us to utilize a substantial portion of our cash flows from operations to make payments on our indebtedness, reducing the availability of our cash flows to fund working capital, capital expenditures, development activity, and other general corporate purposes; |
| • | increasing our vulnerability to adverse economic, industry, or competitive developments; |
| • | exposing us to the risk of increased interest rates because substantially all of our borrowings are at variable rates of interest; |
| • | making it more difficult for us to satisfy our obligations with respect to our indebtedness, and any failure to comply with the obligations of any of our debt instruments, including restrictive covenants and borrowing conditions, could result in an event of default under the agreements governing our indebtedness; |
| • | restricting us from making strategic acquisitions or causing us to make non-strategic divestitures; |
| • | limiting our ability to obtain additional financing for working capital, capital expenditures, product development, debt service requirements, acquisitions, and general corporate or other purposes; and |
| • | limiting our flexibility in planning for, or reacting to, changes in our business or market conditions and placing us at a competitive disadvantage compared to our competitors who are less highly leveraged and who, therefore, may be able to take advantage of opportunities that our leverage prevents us from exploiting. |
Our total interest expense, net was $86.1 million, $93.9 million, and $76.3 million for fiscal 2014, fiscal 2013, and fiscal 2012, respectively.
Substantially all of our indebtedness is floating rate debt. We may elect to enter into swaps to reduce our exposure to floating interest rates as described under “—We may utilize derivative financial instruments to reduce our exposure to market risks from changes in interest rates on our variable rate indebtedness and we will be exposed to risks related to counterparty creditworthiness or non-performance of these instruments.”
Servicing our indebtedness will require a significant amount of cash. Our ability to generate sufficient cash depends on many factors, some of which are not within our control.
Our ability to make payments on our indebtedness and to fund planned capital expenditures will depend on our ability to generate cash in the future. To a certain extent, this is subject to general economic, financial, competitive, legislative, regulatory, and other factors that are beyond our control. If we are unable to generate sufficient cash flow to service our debt and meet our other commitments, we may need to restructure or refinance all or a portion of our debt, sell material assets or operations, or raise additional debt or equity capital. We may not be able to effect any of these actions on a timely basis, on commercially reasonable terms, or at all, and these
26
Table of Contents
actions may not be sufficient to meet our capital requirements. In addition, any refinancing of our indebtedness could be at a higher interest rate, and the terms of our existing or future debt arrangements may restrict us from effecting any of these alternatives. Our failure to make the required interest and principal payments on our indebtedness would result in an event of default under the agreement governing such indebtedness, which may result in the acceleration of some or all of our outstanding indebtedness.
Despite our high indebtedness level, we and our subsidiaries will still be able to incur significant additional amounts of debt, which could further exacerbate the risks associated with our substantial indebtedness.
We and our subsidiaries may be able to incur substantial additional indebtedness in the future. Although the agreements governing our indebtedness contain restrictions on the incurrence of additional indebtedness, these restrictions are subject to a number of significant qualifications and exceptions and, under certain circumstances, the amount of indebtedness that could be incurred in compliance with these restrictions could be substantial.
Our credit agreements contain restrictions that limit our flexibility in operating our business.
The agreements governing our outstanding indebtedness contain various covenants that limit our ability to engage in specified types of transactions. These covenants limit the ability of our subsidiaries to, among other things:
| • | incur, assume, or permit to exist additional indebtedness or guarantees; |
| • | incur liens; |
| • | make investments and loans; |
| • | pay dividends, make payments, or redeem or repurchase capital stock; |
| • | engage in mergers, liquidations, dissolutions, asset sales, and other dispositions (including sale leaseback transactions); |
| • | amend or otherwise alter terms of certain indebtedness; |
| • | enter into agreements limiting subsidiary distributions or containing negative pledge clauses; |
| • | engage in certain transactions with affiliates; |
| • | alter the business that we conduct; |
| • | change our fiscal year; or |
| • | engage in any activities other than permitted activities. |
A breach of any of these covenants could result in a default under one or more of these agreements, including as a result of cross default provisions, and, in the case of our ABL facility, permit the lenders to cease making loans to us.
We may utilize derivative financial instruments to reduce our exposure to market risks from changes in interest rates on our variable rate indebtedness and we will be exposed to risks related to counterparty credit worthiness or non-performance of these instruments.
We may enter into pay-fixed interest rate swaps to limit our exposure to changes in variable interest rates. Such instruments may result in economic losses should interest rates decline to a point lower than our fixed rate commitments. We will be exposed to credit-related losses, which could impact the results of operations in the event of fluctuations in the fair value of the interest rate swaps due to a change in the credit worthiness or non-performance by the counterparties to the interest rate swaps.
27
Table of Contents
Risks Related to this Offering and Ownership of Our Common Stock
No market currently exists for our common stock, and an active, liquid trading market for our common stock may not develop, which may cause our common stock to trade at a discount from the initial offering price and make it difficult for you to sell the common stock you purchase.
Prior to this offering, there has not been a public market for our common stock. We cannot predict the extent to which investor interest in the Company will lead to the development of an active trading market on the or otherwise or how active and liquid that market may become. If an active and liquid trading market does not develop or continue, you may have difficulty selling any of our common stock that you purchase. The initial public offering price for the shares will be determined by negotiations between us, the selling stockholders, and the underwriters and may not be indicative of prices that will prevail in the open market following this offering. The market price of our common stock may decline below the initial offering price, and you may not be able to sell your shares of our common stock at or above the price you paid in this offering, or at all.
You will incur immediate and substantial dilution in the net tangible book value of the shares you purchase in this offering.
Prior stockholders have paid substantially less per share of our common stock than the price in this offering. The initial public offering price of our common stock will be substantially higher than the net tangible book value per share of outstanding common stock prior to completion of the offering. Based on our net tangible book value as of June 28, 2014 and upon the issuance and sale of shares of common stock by us at an assumed initial public offering price of $ per share, which is the mid-point of the range set forth on the cover page of this prospectus, if you purchase our common stock in this offering, you will pay more for your shares than the amounts paid by our existing stockholders for their shares and you will suffer immediate dilution of approximately $ per share in net tangible book value. Dilution is the amount by which the offering price paid by purchasers of our common stock in this offering will exceed the pro forma net tangible book value per share of our common stock upon completion of this offering. A total of shares of common stock has been reserved for future issuance under the 2014 Omnibus Incentive Plan. A total of shares may be issued pursuant to stock options outstanding under the 2007 Stock Option Plan. If the underwriters exercise their option to purchase additional shares, you will experience additional dilution. You may experience additional dilution upon future equity issuances or the exercise of stock options to purchase common stock granted to our employees, executive officers, and directors under our current and future stock incentive plans, including our 2014 Omnibus Incentive Plan. See “Dilution.”
Our stock price may change significantly following the offering, and you may not be able to resell shares of our common stock at or above the price you paid or at all, and you could lose all or part of your investment as a result.
The trading price of our common stock is likely to be volatile. The stock market recently has experienced extreme volatility. This volatility often has been unrelated or disproportionate to the operating performance of particular companies. We, the selling stockholders and the underwriters will negotiate to determine the initial public offering price. You may not be able to resell your shares at or above the initial public offering price due to a number of factors such as those listed in “—Risks Related to Our Business and Industry” and the following:
| • | results of operations that vary from the expectations of securities analysts and investors; |
| • | results of operations that vary from those of our competitors; |
| • | changes in expectations as to our future financial performance, including financial estimates and investment recommendations by securities analysts and investors; |
| • | declines in the market prices of stocks generally, particularly those of foodservice distribution companies; |
| • | strategic actions by us or our competitors; |
28
Table of Contents
| • | announcements by us or our competitors of significant contracts, new products, acquisitions, joint marketing relationships, joint ventures, other strategic relationships, or capital commitments; |
| • | changes in general economic or market conditions or trends in our industry or markets; |
| • | changes in business or regulatory conditions; |
| • | future sales of our common stock or other securities; |
| • | investor perceptions or the investment opportunity associated with our common stock relative to other investment alternatives; |
| • | the public’s response to press releases or other public announcements by us or third parties, including our filings with the Securities and Exchange Commission (the “SEC”); |
| • | announcements relating to litigation; |
| • | guidance, if any, that we provide to the public, any changes in this guidance, or our failure to meet this guidance; |
| • | the development and sustainability of an active trading market for our stock; |
| • | changes in accounting principles; |
| • | occurrences of extreme or inclement weather; and |
| • | other events or factors, including those resulting from natural disasters, war, acts of terrorism, or responses to these events. |
These broad market and industry fluctuations may adversely affect the market price of our common stock, regardless of our actual operating performance. In addition, price volatility may be greater if the public float and trading volume of our common stock is low.
In the past, following periods of market volatility, stockholders have instituted securities class action litigation. If we were involved in securities litigation, it could have a substantial cost and divert resources and the attention of executive management from our business regardless of the outcome of such litigation.
Because we have no current plans to pay cash dividends on our common stock for the foreseeable future, you may not receive any return on investment unless you sell your common stock for a price greater than that which you paid for it.
We intend to retain future earnings, if any, for future operations, expansion, and debt repayment and have no current plans to pay any cash dividends for the foreseeable future. The declaration, amount, and payment of any future dividends on shares of common stock will be at the sole discretion of our Board of Directors. Our Board of Directors may take into account general and economic conditions, our financial condition, and results of operations, our available cash and current and anticipated cash needs, capital requirements, contractual, legal, tax, and regulatory restrictions, implications on the payment of dividends by us to our stockholders or by our subsidiaries to us, and such other factors as our Board of Directors may deem relevant. In addition, our ability to pay dividends is limited by covenants of our existing and outstanding indebtedness and may be limited by covenants of any future indebtedness we or our subsidiaries incur. As a result, you may not receive any return on an investment in our common stock unless you sell our common stock for a price greater than that which you paid for it.
If securities analysts do not publish research or reports about our business or if they downgrade our stock or our sector, our stock price and trading volume could decline.
The trading market for our common stock will rely in part on the research and reports that industry or financial analysts publish about us or our business. We do not control these analysts. Furthermore, if one or more
29
Table of Contents
of the analysts who do cover us downgrades our stock or our industry, or the stock of any of our competitors, or publish inaccurate or unfavorable research about our business, the price of our stock could decline. If one or more of these analysts ceases coverage of the Company or fails to publish reports on us regularly, we could lose visibility in the market, which in turn could cause our stock price or trading volume to decline.
Future sales, or the perception of future sales, by us or our existing stockholders in the public market following this offering could cause the market price for our common stock to decline.
After this offering, the sale of shares of our common stock in the public market, or the perception that such sales could occur, could harm the prevailing market price of shares of our common stock. These sales, or the possibility that these sales may occur, also might make it more difficult for us to sell equity securities in the future at a time and at a price that we deem appropriate.
Upon consummation of this offering we will have a total of shares of common stock outstanding. All shares sold in this offering will be freely tradable without registration under the Securities Act, and without restriction by persons other than our “affiliates” (as defined under Rule 144 of the Securities Act (“Rule 144”)), including our directors, executive officers, and other affiliates (including affiliates of Blackstone and Wellspring), whose shares may be sold only in compliance with the limitations described in “Shares Eligible for Future Sale.”
The remaining shares, representing % of our total outstanding shares of common stock following this offering based on the number of shares outstanding as of June 28, 2014, will be “restricted securities” within the meaning of Rule 144 and subject to certain restrictions on resale following the consummation of this offering. Restricted securities may be sold in the public market only if they are registered under the Securities Act or are sold pursuant to an exemption from registration such as Rule 144, as described in “Shares Eligible for Future Sale.”
In connection with this offering, we, our directors and executive officers, and holders of substantially all of our common stock have each agreed, subject to certain exceptions, not to dispose of or hedge any of our or their common stock or securities convertible into or exchangeable for shares of common stock during the period from the date of this prospectus continuing through the date 180 days after the date of this prospectus, except with the prior written consent of the representatives of the underwriters. See “Underwriting” for a description of these lock-up agreements.
Upon the expiration of the lock-up agreements described above, shares held by Blackstone, Wellspring, and certain of our directors, officers, and employees will be eligible for resale, subject to volume, manner of sale, and other limitations under Rule 144. In addition, pursuant to a registration rights agreement, Blackstone and Wellspring will have the right, subject to certain conditions, to require us to register the sale of their shares of our common stock under the Securities Act. By exercising their registration rights and selling a large number of shares, our existing owners could cause the prevailing market price of our common stock to decline. Following completion of this offering, the shares covered by registration rights would represent approximately % of our outstanding common stock (or %, if the underwriters exercise in full their option to purchase additional shares). Registration of any of these outstanding shares of common stock would result in such shares becoming freely tradable without compliance with Rule 144 upon effectiveness of the registration statement. See “Shares Eligible for Future Sale.”
As restrictions on resale end or if these stockholders exercise their registration rights, the market price of our shares of common stock could drop significantly if the holders of these shares sell them or are perceived by the market as intending to sell them. These factors could also make it more difficult for us to raise additional funds through future offerings of our shares of common stock or other securities.
In addition, shares of common stock will be eligible for sale upon exercise of options granted under 2007 Stock Option Plan. Furthermore, the shares of our common stock reserved for future issuance under the
30
Table of Contents
2014 Omnibus Incentive Plan will become eligible for sale in the public market once those shares are issued, subject to provisions relating to various vesting agreements, lock-up agreements, and Rule 144, as applicable. A total of shares of common stock has been reserved for future issuance under the 2014 Omnibus Incentive Plan.
In the future, we may also issue our securities in connection with investments or acquisitions. The amount of shares of our common stock issued in connection with an investment or acquisition could constitute a material portion of our then-outstanding shares of our common stock. Any issuance of additional securities in connection with investments or acquisitions may result in additional dilution to you.
Anti-takeover provisions in our organizational documents could delay or prevent a change of control.
Certain provisions of our amended and restated certificate of incorporation and amended and restated bylaws may have an anti-takeover effect and may delay, defer, or prevent a merger, acquisition, tender offer, takeover attempt, or other change of control transaction that a stockholder might consider in its best interest, including those attempts that might result in a premium over the market price for the shares held by our stockholders.
These provisions provide for, among other things:
| • | a classified Board of Directors with staggered three-year terms; |
| • | the ability of our Board of Directors to issue one or more series of preferred stock; |
| • | advance notice for nominations of directors by stockholders and for stockholders to include matters to be considered at our annual meetings; |
| • | certain limitations on convening special stockholder meetings; |
| • | the removal of directors only for cause and only upon the affirmative vote of holders of at least 66 2⁄3% of the shares of common stock entitled to vote generally in the election of directors if Blackstone and its affiliates hold less than 30% of our outstanding shares of common stock; and |
| • | that certain provisions may be amended only by the affirmative vote of at least 66 2⁄3% of the shares of common stock entitled to vote generally in the election of directors if Blackstone and its affiliates hold less than 30% of our outstanding shares of common stock. |
These anti-takeover provisions could make it more difficult for a third party to acquire us, even if the third-party’s offer may be considered beneficial by many of our stockholders. As a result, our stockholders may be limited in their ability to obtain a premium for their shares. See “Description of Capital Stock.”
Affiliates of the Sponsors control us and their interests may conflict with ours or yours in the future.
Immediately following this offering of common stock, affiliates of Blackstone and Wellspring will beneficially own approximately % and % of our common stock, respectively, or approximately % and %, respectively, if the underwriters exercise in full their option to purchase additional shares. As a result, investment funds associated with or designated by affiliates of the Sponsors will have the ability to elect all of the members of our Board of Directors and thereby control our policies and operations, including the appointment of management, future issuances of our common stock or other securities, the payment of dividends, if any, on our common stock, the incurrence or modification of debt by us, amendments to our amended and restated certificate of incorporation and amended and restated bylaws, and the entering into of extraordinary transactions, and their interests may not in all cases be aligned with your interests. In addition, the Sponsors may have an interest in pursuing acquisitions, divestitures, and other transactions that, in their respective judgment, could enhance their investment, even though such transactions might involve risks to you. For example, the Sponsors could cause us to make acquisitions that increase our indebtedness or cause us to sell revenue-
31
Table of Contents
generating assets. Additionally, in certain circumstances, acquisitions of debt at a discount by purchasers that are related to a debtor can give rise to cancellation of indebtedness income to such debtor for U.S. federal income tax purposes.
Blackstone and Wellspring are in the business of making investments in companies and may from time to time acquire and hold interests in businesses that compete directly or indirectly with us.
Our amended and restated certificate of incorporation will provide that none of Blackstone, Wellspring, any of their affiliates, or any director who is not employed by us (including any non-employee director who serves as one of our officers in both his director and officer capacities) or his or her affiliates will have any duty to refrain from engaging, directly or indirectly, in the same business activities or similar business activities or lines of business in which we operate. Our Sponsors also may pursue acquisition opportunities that may be complementary to our business, and, as a result, those acquisition opportunities may not be available to us. So long as either of our Sponsors continue to own a significant amount of our combined voting power, even if such amount is less than 50%, such Sponsor will continue to be able to strongly influence or effectively control our decisions and, so long as such Sponsor and its affiliates collectively own at least 5% of all outstanding shares of our stock entitled to vote generally in the election of directors, such Sponsor will be able to appoint individuals to our Board of Directors under a stockholders agreement which we expect to adopt in connection with this offering. In addition, our Sponsors will be able to determine the outcome of all matters requiring stockholder approval and will be able to cause or prevent a change of control of the Company or a change in the composition of our Board of Directors and could preclude any unsolicited acquisition of the Company. The concentration of ownership could deprive you of an opportunity to receive a premium for your shares of common stock as part of a sale of the Company and ultimately might affect the market price of our common stock.
We will be a “controlled company” within the meaning of the rules of the and the rules of the SEC. As a result, we will qualify for, and intend to rely on, exemptions from certain corporate governance requirements that would otherwise provide protection to stockholders of other companies.
After completion of this offering, Blackstone will continue to control a majority of the voting power of our outstanding common stock. As a result, we will be a “controlled company” within the meaning of the corporate governance standards of the . Under these rules, a company of which more than 50% of the voting power is held by an individual, group, or another company is a “controlled company” and may elect not to comply with certain corporate governance requirements, including:
| • | the requirement that a majority of our Board of Directors consist of “independent directors” as defined under the rules of the ; |
| • | the requirement that we have a compensation committee that is composed entirely of independent directors with a written charter addressing the committee’s purpose and responsibilities; |
| • | the requirement that we have a nominating and corporate governance committee that is composed entirely of independent directors with a written charter addressing the committee’s purpose and responsibilities; and |
| • | the requirement for an annual performance evaluation of the compensation and nominating and corporate governance committees. |
Following this offering, we intend to utilize these exemptions. As a result, we may not have a majority of independent directors, our nominating/corporate governance committee, if any, and compensation committee may not consist entirely of independent directors, and such committees will not be subject to annual performance evaluations. Accordingly, you may not have the same protections afforded to stockholders of companies that are subject to all of the corporate governance requirements of the .
32
Table of Contents
In addition, on June 20, 2012, the SEC passed final rules implementing provisions of the Dodd-Frank Wall Street Reform and Consumer Protection Act of 2010 pertaining to compensation committee independence and the role and disclosure of compensation consultants and other advisers to the compensation committee. The SEC’s rules direct each of the national securities exchanges (including the on which we intend to list our common stock) to develop listing standards requiring, among other things, that:
| • | compensation committees be composed of fully independent directors, as determined pursuant to new independence requirements; |
| • | compensation committees be explicitly charged with hiring and overseeing compensation consultants, legal counsel, and other committee advisors; and |
| • | compensation committees be required to consider, when engaging compensation consultants, legal counsel, or other advisors, certain independence factors, including factors that examine the relationship between the consultant or advisor’s employer and us. |
As a “controlled company,” we will not be subject to these compensation committee independence requirements.
We will incur increased costs and obligations as a result of being a public company.
As a public company, we will incur significant legal, accounting, insurance, and other expenses that we have not incurred as a private company, including costs associated with public company reporting requirements. We also will incur costs associated with complying with the requirements of the Sarbanes-Oxley Act of 2002 and related rules implemented by the SEC and . The expenses incurred by public companies generally for reporting and corporate governance purposes have been increasing. We expect these rules and regulations to increase our legal and financial compliance costs and to make certain activities more time-consuming and costly, although we are currently unable to estimate these costs with any degree of certainty. These laws and regulations could also make it more difficult or costly for us to obtain certain types of insurance, including director and officer liability insurance, and we may be forced to accept reduced policy limits and coverage or incur substantially higher costs to obtain the same or similar coverage. These laws and regulations could also make it more difficult for us to attract and retain qualified persons to serve on our Board of Directors, our board committees, or as our executive officers. Furthermore, if we are unable to satisfy our obligations as a public company, we could be subject to delisting of our common stock, fines, sanctions, other regulatory action, and potentially civil litigation.
We may be unsuccessful in implementing required internal controls over financial reporting.
We are not currently required to comply with the SEC’s rules implementing Section 404 of the Sarbanes-Oxley Act of 2002, and are therefore not required to make a formal assessment of the effectiveness of our internal controls over financial reporting for that purpose. Our auditors have identified two significant deficiencies in our internal controls over financial reporting relating to information technology controls and depreciable lives of fixed assets. We have taken measures to remediate these deficiencies, but these deficiencies have not been fully remediated. Upon becoming a public company, our management will be required to report on, and our independent registered public accounting firm to attest to, the effectiveness of our internal controls over financial reporting. If we are unable to remedy past deficiencies, or if we identify additional deficiencies in the future, we may be unable to conclude that our internal controls over financial reporting are effective.
33
Table of Contents
This prospectus contains “forward-looking statements” within the meaning of the federal securities laws. All statements, other than statements of historical facts included in this prospectus, including statements concerning our plans, objectives, goals, beliefs, business strategies, future events, business conditions, our results of operations, financial position and our business outlook, business trends and other information referred to under “Prospectus Summary,” “Risk Factors,” “Dividend Policy,” “Management’s Discussion and Analysis of Financial Condition and Results of Operations,” and “Business” are forward-looking statements. When used in this prospectus, the words “estimates,” “expects,” “contemplates,” “anticipates,” “projects,” “plans,” “intends,” “believes,” “forecasts,” “may,” “should,” and variations of such words or similar expressions are intended to identify forward-looking statements. The forward-looking statements are not historical facts, and are based upon our current expectations, beliefs, estimates, and projections, and various assumptions, many of which, by their nature, are inherently uncertain and beyond our control. Our expectations, beliefs and projections are expressed in good faith and we believe there is a reasonable basis for them. However, there can be no assurance that management’s expectations, beliefs, estimates, and projections will result or be achieved and actual results may vary materially from what is expressed in or indicated by the forward-looking statements.
There are a number of risks, uncertainties, and other important factors, many of which are beyond our control, that could cause our actual results to differ materially from the forward-looking statements contained in this prospectus. Such risks, uncertainties, and other important factors include, among others, the risks, uncertainties, and factors set forth above under “Risk Factors,” and the following risks, uncertainties, and factors:
| • | competition in our industry is intense, and we may not be able to compete successfully; |
| • | we operate in a low margin industry, which could increase the volatility of our results of operations; |
| • | we may not realize anticipated benefits from our operating cost reduction and productivity improvement efforts, including Winning Together; |
| • | our profitability is directly affected by cost inflation or deflation and other factors; |
| • | lack of long-term contracts with certain of our customers; |
| • | group purchasing organizations may become more active in our industry and increase their efforts to add our customers as members of these organizations; |
| • | changes in eating habits of consumers; |
| • | extreme weather conditions; |
| • | our reliance on third-party suppliers; |
| • | labor risks and availability of qualified labor; |
| • | volatility of fuel costs; |
| • | changes in pricing practices of our suppliers; |
| • | inability to adjust cost structure where one or more of our competitors successfully implement lower costs; |
| • | risks relating to any future acquisitions; |
| • | environmental, health, and safety costs; |
| • | reliance on technology and risks associated with disruption or delay in implementation of new technology; |
| • | difficult economic conditions affecting consumer confidence; |
34
Table of Contents
| • | product liability claims relating to the products we distribute and other litigation; |
| • | negative media exposure and other events that damage our reputation; |
| • | anticipated multiemployer pension related liabilities and contributions to our multiemployer pension plan; |
| • | impact of uncollectibility of accounts receivable; and |
| • | departure of key members of senior management. |
35
Table of Contents
We estimate that the net proceeds from our sale of shares of common stock in this offering based on an assumed initial public offering price of $ per share, which is the midpoint of the price range set forth on the cover page of this prospectus, after deducting estimated underwriting discounts and commissions and estimated offering expenses payable by us, will be approximately $ million (or $ million if the underwriters exercise in full their option to purchase additional shares). We will not receive any proceeds from the sale of shares of our common stock by the selling stockholders.
We intend to use a portion of the net proceeds received by us from this offering to repay $ million of our outstanding indebtedness.
In connection with this offering, we intend to terminate the Advisory Agreement in accordance with its terms. We will use approximately $ million of the net proceeds to us from this offering to pay a one-time termination fee to affiliates of the Sponsors in connection with the termination of the Advisory Agreement. See “Certain Relationships and Related Party Transactions—Transaction and Advisory Fee Agreement.”
We intend to use the remaining proceeds received by us from this offering for other general corporate purposes. A $1.00 increase or decrease in the assumed initial public offering price of $ per share would increase or decrease, as applicable, the net proceeds to us from this offering by approximately $ million (or $ million if the underwriters exercise in full their option to purchase additional shares), assuming the number of shares offered by us remains the same as set forth on the cover page of this prospectus and after deducting the estimated underwriting discounts and commissions and estimated offering expenses payable by us.
36
Table of Contents
We have no current plans to pay dividends on our common stock. Any decision to declare and pay dividends in the future will be made at the sole discretion of our Board of Directors and will depend on, among other things, our results of operations, cash requirements, financial condition, contractual restrictions, and other factors that our Board of Directors may deem relevant. Because we are a holding company and have no direct operations, we will only be able to pay dividends from funds we receive from our subsidiaries. In addition, our ability to pay dividends will be limited by covenants in our existing indebtedness and may be limited by the agreements governing other indebtedness we or our subsidiaries incur in the future. See “Description of Certain Indebtedness.”
In fiscal 2013, we paid dividends of $220.0 million to our stockholders. We did not pay any dividends in fiscal 2014.
37
Table of Contents
The following table sets forth our consolidated cash and cash equivalents and capitalization as of June 28, 2014:
| • | on an actual basis reflecting a -for-one stock split of our common stock and an increase in our authorized capital stock to 1,000,000,000 shares of common stock, par value $0.01 per share, effected on ; and |
| • | on an as adjusted basis to give effect to: |
| • | the sale by us of shares of common stock in this offering at an assumed initial public offering price of $ per share, which is the midpoint of the price range set forth on the cover page of this prospectus; and |
| • | the application of net proceeds from this offering as described under “Use of Proceeds,” as if this offering and the application of the net proceeds therefrom had occurred on June 28, 2014. |
You should read this table in conjunction with the information contained in “Use of Proceeds,” “Selected Historical Consolidated Financial Data,” “Management’s Discussion and Analysis of Financial Condition and Results of Operations” and “Description of Certain Indebtedness,” as well as our audited consolidated financial statements included elsewhere in this prospectus and the notes thereto included elsewhere in this prospectus.
| As of June 28, 2014 | ||||||||
| Actual | As Adjusted(1) | |||||||
| (In millions, except share and per share data) |
||||||||
| Cash and cash equivalents |
$ | 5.3 | $ | |||||
|
|
|
|
|
|||||
| Debt: |
||||||||
| ABL facility(2) |
$ | 679.6 | $ | |||||
| Term loan facility(3) |
741.3 | |||||||
| Capital lease obligations |
33.9 | |||||||
| Other(4) |
4.7 | |||||||
|
|
|
|
|
|||||
| Total debt |
1,459.5 | |||||||
| Shareholders’ equity: |
||||||||
| Class A common stock, $0.01 par value, 250,000,000 shares authorized, actual; 179,093,943 shares issued and outstanding, actual; none authorized, issued or outstanding, as adjusted(5) |
1.8 | |||||||
| Class B common stock, $0.01 par value, 25,000,000 shares authorized, actual; 27,914 shares issued and outstanding, actual; none authorized, issued or outstanding, as adjusted(5) |
— | — | ||||||
| Common stock, $0.01 par value, none authorized, issued, or outstanding, actual; shares authorized, as adjusted; and issued and outstanding, as adjusted(5) |
— | |||||||
| Additional paid-in capital |
592.0 | |||||||
| Accumulated other comprehensive loss, net of tax benefit |
(5.7 | ) | ||||||
| Accumulated deficit |
(154.0 | ) | ||||||
|
|
|
|
|
|||||
| Total shareholders’ equity |
434.1 | |||||||
|
|
|
|
|
|||||
| Total capitalization |
$ | 1,893.6 | $ | |||||
|
|
|
|
|
|||||
| (1) | Each $1.00 increase or decrease in the assumed initial public offering price of $ per share would increase or decrease, as applicable, cash and cash equivalents, additional paid-in capital, and total shareholders’ equity by approximately $ million, assuming the number of shares offered by us remains |
38
Table of Contents
| the same as set forth on the cover page of this prospectus and after deducting the estimated underwriting discounts and commissions and estimated offering expenses that we must pay. |
| (2) | Our ABL facility provides for aggregate borrowings of up to $1,400.0 million and the option to increase the amount available under our ABL facility by up to $400.0 million, subject to certain conditions. As of June 28, 2014, we had $679.6 million of outstanding borrowings under our ABL facility. As of the same date, there were also $108.7 million in letters of credit outstanding under the ABL facility and excess availability was $587.8 million, net of $19.9 million of lenders’ reserves, subject to compliance with customary borrowing conditions. See “Description of Other Indebtedness—Senior Secured Asset-Based Revolving Credit Facility.” |
| (3) | Does not reflect $3.1 million of unamortized original issue discount. |
| (4) | Does not reflect $1.3 million of fair value discount related to an unsecured subordinated promissory note. |
| (5) | The number of shares of our common stock to be outstanding immediately after the consummation of this offering is based on shares of common stock outstanding as of June 28, 2014, plus shares of common stock to be sold by the Company in this offering, and does not give effect to shares of common stock, with a weighted average exercise price of $ per share outstanding under the 2007 Stock Option Plan or shares of common stock reserved for future issuance under the 2014 Omnibus Incentive Plan or shares of common stock issued in connection with our long-term incentive compensation program after June 28, 2014. In connection with this offering, we intend to reclassify our shares of Class A common stock and Class B common stock into a single class. |
39
Table of Contents
If you invest in shares of our common stock in this offering, your investment will be immediately diluted to the extent of the difference between the initial public offering price per share of common stock and the net tangible book value per share of common stock after this offering. Dilution results from the fact that the per share offering price of the shares of common stock is substantially in excess of the net tangible book value per share attributable to the shares of common stock held by existing owners.
Our net tangible book value as of June 28, 2014 was approximately $ , or $ per share of common stock. We calculate net tangible book value per share by taking the amount of our total tangible assets, reduced by the amount of our total liabilities, and then dividing that amount by the total number of shares of common stock outstanding.
Dilution is determined by subtracting as adjusted net tangible book value per share of common stock, as adjusted to give effect to this offering, from the initial public offering price per share of common stock.
After giving effect to our sale of the shares in this offering at an assumed initial public offering price of $ per share, the midpoint range described on the cover of this prospectus, and after deducting estimated underwriting discounts and commissions and offering expenses payable by us, our net tangible book value as of June 28, 2014 would have been $ , or $ per share of common stock. This represents an immediate increase in net tangible book value of $ per share of common stock to our existing owners and an immediate and substantial dilution in net tangible book value of $ per share of common stock to investors in this offering at the assumed initial public offering price.
The following table illustrates this dilution on a per share of common stock basis assuming the underwriters do not exercise their option to purchase additional shares of common stock:
| Assumed initial public offering price per share of common stock |
$ | |||||||
| Net tangible book value per share of common stock as of June 28, 2014 |
$ | |||||||
| Increase in net tangible book value per share of common stock attributable to investors in this offering |
$ | |||||||
|
|
|
|||||||
| As adjusted net tangible book value per share of common stock after the offering |
$ | |||||||
|
|
|
|||||||
| Dilution per share of common stock to investors in this offering |
$ | |||||||
|
|
|
A $1.00 increase in the assumed initial public offering price of $ per share of our common stock would increase our net tangible book value after giving to the offering by $ million, or by $ per share of our common stock, assuming the number of shares offered by us remains the same and after deducting the underwriting discount and the estimated offering expenses payable by us. A $1.00 decrease in the assumed initial public offering price per share would result in equal changes in the opposite direction.
40
Table of Contents
The following table summarizes, as of June 28, 2014, the total number of shares of common stock purchased from us, the total cash consideration paid to us, and the average price per share paid by existing owners and by new investors. As the table shows, new investors purchasing shares in this offering will pay an average price per share substantially higher than our existing owners paid. The table below assumes an initial public offering price of $ per share, the midpoint of the range set forth on the cover of this prospectus, for shares purchased in this offering and excludes underwriting discounts and commissions and estimated offering expenses payable by us:
| Shares of Common Stock Purchased |
Total Consideration |
Average Price Per Share of Common Stock |
||||||||||||||||
| Number | Percent | Amount | Percent | |||||||||||||||
| (Dollar amounts in millions, except per share amounts) |
||||||||||||||||||
| Existing owners |
% | $ | % | $ | ||||||||||||||
| Investors in this offering |
% | $ | % | $ | ||||||||||||||
|
|
|
|
|
|
|
|
||||||||||||
| Total |
% | $ | % | $ | ||||||||||||||
|
|
|
|
|
|
|
|
||||||||||||
Each $1.00 increase in the assumed offering price of $ per share would increase total consideration paid by investors in this offering and total consideration paid by all stockholders by $ million, assuming the number of shares offered by us remains the same and after deducting the underwriting discount and the estimated offering expenses payable by us. A $1.00 decrease in the assumed initial public offering price per share would result in equal changes in the opposite direction.
The dilution information above is for illustration purposes only. Our as adjusted net tangible book value following the consummation of this offering is subject to adjustment based on the actual initial public offering price of our shares and other terms of this offering determined at pricing.
41
Table of Contents
SELECTED HISTORICAL CONSOLIDATED FINANCIAL DATA
We derived the selected statement of operations data for the years ended June 28, 2014, June 29, 2013, and June 30, 2012 and the selected balance sheet data as of June 28, 2014 and June 29, 2013 from our audited consolidated financial statements included elsewhere in this prospectus. We derived the selected statement of operations data for the years ended July 2, 2011 and July 3, 2010 and the selected balance sheet data as of June 30, 2012, July 2, 2011, and July 3, 2010 from our unaudited consolidated financial statements, which are not included in this prospectus. Our historical results are not necessarily indicative of the results expected for any future period.
You should read the selected consolidated financial data below together with our audited consolidated financial statements included elsewhere in this prospectus including the related notes thereto appearing elsewhere in this prospectus, as well as “Management’s Discussion and Analysis of Financial Condition and Results of Operations” and “Description of Certain Indebtedness,” and the other financial information included elsewhere in this prospectus.
| For the fiscal year ended(1) | ||||||||||||||||||||
| June 28, 2014 | June 29, 2013 | June 30, 2012 | July 2, 2011 | July 3, 2010 | ||||||||||||||||
| (dollars in millions, except per share data) | ||||||||||||||||||||
| Statement of Operations Data: |
||||||||||||||||||||
| Net sales |
$ | 13,685.7 | $ | 12,826.5 | $ | 11,505.9 | $ | 10,594.1 | $ | 10,057.7 | ||||||||||
| Cost of goods sold |
11,988.5 | 11,243.8 | 10,101.9 | 9,276.3 | 8,822.7 | |||||||||||||||
|
|
|
|
|
|
|
|
|
|
|
|||||||||||
| Gross profit |
1,697.2 | 1,582.7 | 1,404.0 | 1,317.8 | 1,235.0 | |||||||||||||||
| Operating expenses |
1,581.6 | 1,468.0 | 1,293.1 | 1,215.3 | 1,145.9 | |||||||||||||||
|
|
|
|
|
|
|
|
|
|
|
|||||||||||
| Operating profit |
115.6 | 114.7 | 110.9 | 102.5 | 89.1 | |||||||||||||||
| Interest expense, net(2) |
86.1 | 93.9 | 76.3 | 78.9 | 84.7 | |||||||||||||||
| Loss on extinguishment of debt |
— | 2.0 | — | — | — | |||||||||||||||
| Other, net |
(0.7 | ) | (0.7 | ) | 0.7 | (1.0 | ) | (4.6 | ) | |||||||||||
|
|
|
|
|
|
|
|
|
|
|
|||||||||||
| Other expense, net |
85.4 | 95.2 | 77.0 | 77.9 | 80.1 | |||||||||||||||
| Income before taxes |
30.2 | 19.5 | 33.9 | 24.6 | 9.0 | |||||||||||||||
| Income tax expense(3) |
14.7 | 11.1 | 12.9 | 10.9 | 8.1 | |||||||||||||||
|
|
|
|
|
|
|
|
|
|
|
|||||||||||
| Net income |
$ | 15.5 | $ | 8.4 | $ | 21.0 | $ | 13.7 | $ | 0.9 | ||||||||||
|
|
|
|
|
|
|
|
|
|
|
|||||||||||
| Per Share Data: |
||||||||||||||||||||
| Basic net income per share |
$ | 0.09 | $ | 0.05 | $ | 0.12 | $ | 0.08 | $ | 0.01 | ||||||||||
| Diluted net income per share |
0.09 | 0.05 | 0.12 | 0.08 | 0.01 | |||||||||||||||
| Weighted-average number of shares used in per share amounts |
||||||||||||||||||||
| Basic |
179,110,211 | 179,102,280 | 179,025,738 | 178,886,196 | 178,854,069 | |||||||||||||||
| Diluted |
180,481,081 | 180,326,867 | 179,881,094 | 179,325,447 | 180,344,318 | |||||||||||||||
| Other Financial Data: |
||||||||||||||||||||
| EBITDA(4) |
$ | 249.0 | $ | 233.4 | $ | 212.5 | $ | 202.5 | $ | 193.3 | ||||||||||
| Adjusted EBITDA(4) |
286.1 | 271.3 | 240.9 | 220.0 | 193.3 | |||||||||||||||
| Capital expenditures |
90.6 | 66.5 | 68.9 | 56.1 | 31.1 | |||||||||||||||
| Balance Sheet Data: |
||||||||||||||||||||
| Cash and cash equivalents |
$ | 5.3 | $ | 14.1 | $ | 11.1 | $ | 14.9 | $ | 21.0 | ||||||||||
| Total assets |
3,239.8 | 3,055.4 | 2,946.6 | 2,529.9 | 2,426.3 | |||||||||||||||
| Total debt |
1,459.5 | 1,483.0 | 1,208.3 | 800.2 | 847.8 | |||||||||||||||
| Total shareholders’ equity |
434.1 | 420.0 | 625.1 | 697.1 | 680.2 | |||||||||||||||
42
Table of Contents
| (1) | The fiscal year ended July 3, 2010 was a 53 week year consisting of 371 days. All other fiscal years contained 52 weeks consisting of 364 days. |
| (2) | Interest expense, net includes $6.6 million, $11.1 million, $12.5 million, $13.0 million, and $14.5 million of reclassification adjustments for changes in fair value of interest rate swaps for fiscal 2014, fiscal 2013, fiscal 2012, fiscal 2011, and fiscal 2010 respectively. |
| (3) | Income tax expense includes $2.6 million, $4.3 million, $4.9 million, $5.1 million, and $5.6 million tax benefit from reclassification adjustments for fiscal 2014, fiscal 2013, fiscal 2012, fiscal 2011, and fiscal 2010 respectively, related to the reclassification adjustments for change in fair value of interest rate swaps referred to in note (2). |
| (4) | See “Summary—Summary Historical Consolidated Financial Data” for our definitions of “EBITDA” and “Adjusted EBITDA” and a reconciliation of EBITDA and Adjusted EBITDA to net income, which we believe is the most directly comparable financial measure calculated in accordance with GAAP. |
43
Table of Contents
MANAGEMENT’S DISCUSSION AND ANALYSIS OF FINANCIAL CONDITION
AND RESULTS OF OPERATIONS
The following discussion and analysis of our financial condition and results of operations should be read together with “Summary—Summary Historical Consolidated Financial Data,” “Selected Historical Consolidated Financial Data,” and our historical consolidated financial statements and the notes thereto included elsewhere in this prospectus. In addition to historical consolidated financial information, this discussion contains forward-looking statements that reflect our plans, estimates, and beliefs and involve numerous risks and uncertainties, including but not limited to those described in the “Risk Factors” section of this prospectus. Actual results may differ materially from those contained in any forward-looking statements. Factors that could cause or contribute to these differences include those discussed below and elsewhere in this prospectus, particularly in “Risk Factors.”
Our Company
We market and distribute approximately 150,000 food and food-related products to customers across the United States from 67 distribution facilities. We serve over 150,000 customer locations in the “food-away-from-home” industry. We offer our customers a broad assortment of products including our proprietary-branded products, nationally-branded products, and products bearing our customers’ brands. Our product assortment ranges from “center-of-the-plate” items (such as beef, pork, poultry, and seafood), frozen foods, and groceries to candy, snacks, and beverages. We also sell disposables, cleaning and kitchen supplies, and related products used by our customers. In addition to the products we offer to our customers, we provide value-added services by allowing our customers to benefit from our industry knowledge, scale, and expertise in the areas of product selection and procurement, menu development, and operational strategy.
We have three reportable segments: Performance Foodservice, PFG Customized, and Vistar. Our Performance Foodservice segment distributes a broad line of our proprietary-branded food and food-related products, or “Performance Brands.” Performance Foodservice sells to independent, or “Street,” and multi-unit, or “Chain,” restaurants and other institutions such as schools, healthcare facilities, and business and industry locations. Our PFG Customized segment has provided longstanding service to some of the most recognizable family and casual dining restaurant chains and recently expanded service to fast casual and quick service restaurant chains. Our Vistar segment specializes in distributing candy, snacks, beverages, and other items nationally to the vending, office coffee service, theater, retail, hospitality, and other channels. We believe that there are substantial synergies across our segments. Cross-segment synergies include procurement, operational best practices such as the use of new productivity technologies, and supply chain and network optimization, as well as shared corporate functions such as accounting, treasury, tax, legal, information systems, and human resources.
Recent Trends and Initiatives
Our case volume grew in each quarter over the comparable prior fiscal year quarter, starting in the second quarter of fiscal 2010 and continuing through the most recent quarter. We believe that we gained industry share during fiscal 2014 given that we have grown our sales more rapidly than each of our two larger competitors. Our Adjusted EBITDA grew 5.5% from fiscal 2013 to fiscal 2014, driven by case growth of 5.2% and improved profit per case, primarily as a result of shifting our channel mix toward higher gross margin customers and shifting our product mix toward sales of Performance Brands. Our operating expenses compared to fiscal 2013 rose faster than sales, as a result of increased costs of serving higher gross margin channels, unusually severe weather in the fiscal third quarter, and other expenses partially offset by initiatives undertaken to reduce operating expenses.
Recently, we established a program called Winning Together, which complements our sales growth with specific initiatives to take advantage of our scale and drive productivity in non-customer facing areas on an
44
Table of Contents
ongoing basis. We have begun to recognize some of the cost-saving benefits from this program and believe that we will realize further benefits in this and later fiscal years. Winning Together is led by teams whose primary responsibility is to improve our business processes, capture best practices, and maintain a continuous improvement culture in our procurement and operations functions.
Key Factors Affecting Our Business
We believe that our performance is principally affected by the following key factors:
| • | Changing demographic and macroeconomic trends. The share of consumer spending captured by the food-away-from-home industry increased steadily for several decades and paused during the recession that began in 2008. Following the recession, the share has again increased as a result of increasing employment, rising disposable income, increases in the number of restaurants, and favorable demographic trends, such as smaller household sizes, an increasing number of dual income households, and an aging population base that spends more per capita at foodservice establishments. The foodservice distribution industry is also sensitive to national and regional economic conditions, such as changes in consumer spending, changes in consumer confidence, and changes in the prices of certain goods. |
| • | Food distribution market structure. We are the third largest foodservice distributer in the United States behind Sysco and US Foods, who are both national broadline distributors. The balance of the market consists of a wide spectrum of companies ranging from businesses selling a single category of product (e.g., produce) to large regional broadline distributors with many distribution centers and thousands of products across all categories. We believe our scale enables us to invest in our Performance Brands, to benefit from economies of scale in purchasing and procurement, and to drive supply chain efficiencies that enhance our customers’ satisfaction and profitability. We believe that the relative growth of larger foodservice distributors will continue to outpace that of smaller, independent players in our industry. |
| • | Our ability to successfully execute our segment strategies and implement our initiatives. Our performance will continue to depend on our ability to successfully execute our segment strategies and to implement our current and future initiatives, particularly our Winning Together program. The key strategies include focusing on Street sales and Performance Brands, pursuing new customers for all three of our business segments, utilizing our infrastructure to gain further operating and purchasing efficiencies, and making strategic acquisitions. |
How We Assess the Performance of Our Business
In assessing the performance of our business, we consider a variety of performance and financial measures. The key measures used by our management are discussed below.
Net Sales
Net sales is equal to gross sales minus sales returns as well as any sales incentives that we offer to our customers, such as rebates and discounts that are offsets to gross sales. Our net sales are driven by changes in case volumes, product inflation prior to pricing of our products, and mix of products sold.
Gross Profit
Gross profit is equal to our net sales minus our cost of goods sold. Cost of goods sold primarily includes inventory costs (net of supplier consideration) and inbound freight. Cost of goods sold generally changes as we incur higher or lower costs from our suppliers and as our customer and product mix changes.
EBITDA and Adjusted EBITDA
Management measures operating performance based on our EBITDA, defined as net income (loss) before interest expense (net of interest income), income taxes, and depreciation and amortization. EBITDA is not
45
Table of Contents
defined under U.S. GAAP and is not a measure of operating income, operating performance, or liquidity presented in accordance with U.S. GAAP and is subject to important limitations. Our definition of EBITDA may not be the same as similarly titled measures used by other companies.
We believe that the presentation of EBITDA enhances an investor’s understanding of our performance. We believe this measure is a useful metric to assess our operating performance from period to period by excluding certain items that we believe are not representative of our core business. We use this measure to evaluate the performance of our segments and for business planning purposes. We believe that EBITDA will provide investors with a useful tool for assessing the comparability between periods of our ability to generate cash from operations sufficient to pay taxes, to service debt and to undertake capital expenditures because it eliminates depreciation and amortization expense. We present EBITDA in order to provide supplemental information that we consider relevant for the readers of our consolidated financial statements included elsewhere in this prospectus, and such information is not meant to replace or supersede U.S. GAAP measures.
In addition, our management uses Adjusted EBITDA, defined as net income (loss) before interest expense (net of interest income), income and franchise taxes, and depreciation and amortization, further adjusted to exclude certain unusual, non-cash, non-recurring, cost reduction, and other adjustment items permitted in calculating covenant compliance under our credit agreements (other than certain pro forma adjustments permitted under our credit agreements relating to the Adjusted EBITDA contribution of acquired entities or businesses prior to the acquisition date). Under our credit agreements, our ability to engage in certain activities such as incurring certain additional indebtedness, making certain investments, and making restricted payments is tied to ratios based on Adjusted EBITDA (as defined in the credit agreements). Our definition of Adjusted EBITDA may not be the same as similarly titled measures used by other companies.
Adjusted EBITDA is not defined under U.S. GAAP and is subject to important limitations. We believe that the presentation of Adjusted EBITDA is useful to investors because it is frequently used by securities analysts, investors, and other interested parties in their evaluation of the operating performance of companies in industries similar to ours. In addition, targets based on Adjusted EBITDA are among the measures we use to evaluate our management’s performance for purposes of determining their compensation under our incentive plans as further described under “Management—Executive Compensation.”
EBITDA and Adjusted EBITDA have important limitations as analytical tools and you should not consider them in isolation or as substitutes for analysis of our results as reported under U.S. GAAP. For example, EBITDA and Adjusted EBITDA:
| • | exclude certain tax payments that may represent a reduction in cash available to us; |
| • | do not reflect any cash capital expenditure requirements for the assets being depreciated and amortized that may have to be replaced in the future; |
| • | do not reflect changes in, or cash requirements for, our working capital needs; and |
| • | do not reflect the significant interest expense, or the cash requirements, necessary to service our debt. |
In calculating Adjusted EBITDA, we add back certain non-cash, non-recurring, and other items that are included in EBITDA and net income as permitted or required by our credit agreements. Adjusted EBITDA among other things:
| • | does not include non-cash stock-based employee compensation expense and certain other non-cash charges; |
| • | does not include cash and non-cash restructuring, severance, and relocation costs incurred to realize future cost savings and enhance our operations; and |
| • | does not reflect management fees paid to the Sponsors. |
46
Table of Contents
We have included the calculations of Adjusted EBITDA for the periods presented.
Results of Operations, EBITDA, and Adjusted EBITDA
The following table sets forth a summary of our results of operations, EBITDA, and Adjusted EBITDA for the periods indicated (dollars in thousands, except per share data):
| Fiscal Year Ended | Fiscal 2014 | Fiscal 2013 | ||||||||||||||||||||||||||
| June 28, 2014 | June 29, 2013 | June 30, 2012 | Change | % | Change | % | ||||||||||||||||||||||
| Net sales |
$ | 13,685,704 | $ | 12,826,512 | $ | 11,505,892 | $ | 859,192 | 6.7 | $ | 1,320,620 | 11.5 | ||||||||||||||||
| Cost of goods sold |
11,988,485 | 11,243,809 | 10,101,919 | 744,676 | 6.6 | 1,141,890 | 11.3 | |||||||||||||||||||||
|
|
|
|
|
|
|
|
|
|
|
|
|
|
|
|||||||||||||||
| Gross profit |
1,697,219 | 1,582,703 | 1,403,973 | 114,516 | 7.2 | 178,730 | 12.7 | |||||||||||||||||||||
| Operating expenses |
1,581,639 | 1,468,036 | 1,293,091 | 113,603 | 7.7 | 174,945 | 13.5 | |||||||||||||||||||||
|
|
|
|
|
|
|
|
|
|
|
|
|
|
|
|||||||||||||||
| Operating profit |
115,580 | 114,667 | 110,882 | 913 | 0.8 | 3,785 | 3.4 | |||||||||||||||||||||
| Other expense (income) |
||||||||||||||||||||||||||||
| Interest expense, net |
86,096 | 93,871 | 76,330 | (7,775 | ) | (8.3 | ) | 17,541 | 23.0 | |||||||||||||||||||
| Loss on extinguishment of debt |
— | 2,039 | — | (2,039 | ) | N/A | 2,039 | N/A | ||||||||||||||||||||
| Other, net |
(731 | ) | (697 | ) | 664 | (34 | ) | 4.9 | (1,361 | ) | N/A | |||||||||||||||||
|
|
|
|
|
|
|
|
|
|
|
|
|
|
|
|||||||||||||||
| Other expense, net |
85,365 | 95,213 | 76,994 | (9,848 | ) | (10.3 | ) | 18,219 | 23.7 | |||||||||||||||||||
| Income before income taxes |
30,215 | 19,454 | 33,888 | 10,761 | 55.3 | (14,434 | ) | (42.6 | ) | |||||||||||||||||||
| Income tax expense |
14,711 | 11,059 | 12,869 | 3,652 | 33.0 | (1,810 | ) | (14.1 | ) | |||||||||||||||||||
|
|
|
|
|
|
|
|
|
|
|
|
|
|
|
|||||||||||||||
| Net income |
$ | 15,504 | $ | 8,395 | $ | 21,019 | $ | 7,109 | 84.7 | $ | (12,624 | ) | (60.1 | ) | ||||||||||||||
|
|
|
|
|
|
|
|
|
|
|
|
|
|
|
|||||||||||||||
| EBITDA |
$ | 249,011 | $ | 233,390 | $ | 212,520 | $ | 15,621 | 6.7 | $ | 20,870 | 9.8 | ||||||||||||||||
| Adjusted EBTIDA |
$ | 286,069 | $ | 271,270 | $ | 240,941 | $ | 14,799 | 5.5 | $ | 30,329 | 12.6 | ||||||||||||||||
| Weighted-average common shares outstanding: |
||||||||||||||||||||||||||||
| Basic |
179,110,211 | 179,102,280 | 179,025,738 | |||||||||||||||||||||||||
| Diluted |
180,481,081 | 180,326,867 | 179,881,094 | |||||||||||||||||||||||||
| Earnings per common share: |
||||||||||||||||||||||||||||
| Basic |
$ | 0.09 | $ | 0.05 | $ | 0.12 | ||||||||||||||||||||||
| Diluted |
$ | 0.09 | $ | 0.05 | $ | 0.12 | ||||||||||||||||||||||
47
Table of Contents
We believe that the most directly comparable GAAP measure to EBITDA and Adjusted EBITDA is net income (loss). The following table reconciles EBITDA and Adjusted EBITDA to net income for the periods presented:
| Fiscal Year Ended | ||||||||||||
| June 28, 2014 | June 29, 2013 | June 30, 2012 | ||||||||||
| (dollars in thousands) | ||||||||||||
| Net income |
$ | 15,504 | $ | 8,395 | $ | 21,019 | ||||||
| Interest expense, net |
86,096 | 93,871 | 76,330 | |||||||||
| Income tax expense |
14,711 | 11,059 | 12,869 | |||||||||
| Depreciation |
73,549 | 58,764 | 46,400 | |||||||||
| Amortization of intangible assets |
59,151 | 61,301 | 55,902 | |||||||||
|
|
|
|
|
|
|
|||||||
| EBITDA |
249,011 | 233,390 | 212,520 | |||||||||
| Non-cash items(1) |
4,754 | 1,802 | 3,784 | |||||||||
| Acquisition, integration and reorganization charges(2) |
11,279 | 22,928 | 12,952 | |||||||||
| Non-recurring items(3) |
430 | 378 | 1,470 | |||||||||
| Productivity initiatives(4) |
16,310 | 3,041 | 1,513 | |||||||||
| Multiemployer plan withdrawal(5) |
402 | 3,887 | (99 | ) | ||||||||
| Other adjustment items(6) |
3,883 | 5,844 | 8,801 | |||||||||
|
|
|
|
|
|
|
|||||||
| Adjusted EBITDA |
$ | 286,069 | $ | 271,270 | $ | 240,941 | ||||||
|
|
|
|
|
|
|
|||||||
| (1) | Includes adjustments for interest rate swap hedge ineffectiveness, adjustments to reflect certain assets held for sale to their net realizable value, non-cash charges arising from employee stock options, and changes in fair value of fuel collar instruments. In addition, for fiscal 2014 and fiscal 2013, this includes increases in the LIFO reserve of $3.0 million and $0.8 million, respectively. |
| (2) | Includes professional fees and other costs related to completed and abandoned acquisitions, costs of integrating certain of our facilities, facility closing costs, legal fees related to our legal entity reorganization, and advisory fees paid to the Sponsors. For fiscal 2013, this also includes $11.2 million for the impact of the initial fair value of inventory that was acquired as part of acquisitions. |
| (3) | Consists primarily of transition costs related to IT outsourcing, certain severance costs, and the impact of business interruption due to hurricane and other weather related events. |
| (4) | Consists primarily of professional fees and related expenses associated with the Winning Together program. |
| (5) | Includes amounts related to the withdrawal from multiemployer pension plans. For fiscal 2014 and fiscal 2013, this amount includes $0.4 million and $3.7 million, respectively, for the expense related to the withdrawal from the Central States Southeast and Southwest Areas Pension Fund. See Note 15 to the audited consolidated financial statements included in this prospectus. |
| (6) | Consists primarily of costs related to certain financing transactions, lease amendments, and franchise tax expense and other adjustments permitted under our credit agreements. |
Consolidated Results of Operations
Fiscal year ended June 28, 2014 compared to fiscal year ended June 29, 2013
Net Sales
Net sales increased $859.2 million, or 6.7%, for fiscal 2014 compared to fiscal 2013. This increase is primarily attributable to securing new Street customers, further penetrating existing customers, and the carryover impact of integrating new customers from acquisitions. We also secured new Chain customers. These increases were partially offset by the loss of some Chain customers and the effect on restaurant traffic from the severe weather in several parts of the country during the third quarter of fiscal 2014.
We grew case volume by 5.2% in fiscal 2014, which contributed to the increase in net sales. Inflation during fiscal 2014 increased at an estimated annual rate of 1.7% compared to an estimated annual rate of 1.3% in fiscal
48
Table of Contents
2013. We calculate inflation and deflation by reference to the weighted average of changes in prices experienced by our product classes over the same relevant periods. Net sales growth is a function of case growth, product inflation, and a changing mix of customers, channels, and product categories sold.
Gross Profit
Gross profit increased $114.5 million, or 7.2%, for fiscal 2014 compared to fiscal 2013. This increase in gross profit was the result of growth in cases sold and a higher gross profit per case. Net sales from Performance Foodservice increased as a percentage of total net sales from 58.5% for fiscal 2013 to 59.2% for fiscal 2014. Net sales from Vistar and PFG Customized decreased as a percentage of total net sales from 16.7% and 24.7%, respectively, for fiscal 2013 to 16.6% and 24.1%, respectively, for fiscal 2014. We earn higher gross profit per case in Performance Foodservice than Vistar and PFG Customized. Within Performance Foodservice, case growth to Street customers positively affected gross profit per case. Street customers typically receive more services from us, cost more to serve, and pay a higher gross profit per case than other customers. Also, within Performance Foodservice, we were able to grow our Performance Brand sales, which have higher gross profit per case compared to other brands, from fiscal 2013 to fiscal 2014. See “—Segment Results—Performance Foodservice” below for additional discussion. Gross profit for fiscal 2013 was negatively affected by $11.2 million because of the initial fair value placed on the acquired inventory from the two acquisitions that closed during the fourth quarter of fiscal 2012 and the acquisition that closed during the second quarter of fiscal 2013.
Operating Expenses
Operating expenses increased $113.6 million, or 7.7%, for fiscal 2014 compared to fiscal 2013. The increase in operating expenses was primarily caused by the addition of a distribution center resulting from the acquisition that closed during the second quarter of fiscal 2013, an increase in case volume and the resulting impact on variable costs, the severe weather in several parts of the country during the third quarter of fiscal 2014 that primarily affected delivery and warehouse costs, and an increase in professional fees and headcount largely associated with our Winning Together program, bonus expense, depreciation, and IT expenses, as discussed in the segment results below.
These increases were partially offset by a decrease in benefit costs related to withdrawal from a multiemployer pension plan. In fiscal 2013, we recorded an estimated withdrawal liability of $3.7 million for one of our multiemployer pension plans after it was determined that it was probable that we would withdraw from the plan. The estimated withdrawal liability for this multiemployer pension plan was increased by $0.4 million during fiscal 2014. All of these factors resulted in a net increase in operating expenses for fiscal 2014 compared to fiscal 2013.
Depreciation and amortization of intangible assets increased from $120.1 million in fiscal 2013 to $132.7 million in fiscal 2014, an increase of 10.5%. Increased depreciation in fixed assets resulting from larger capital outlays to support our growth more than offset decreases in amortization of intangible assets.
Net Income
Net income increased by $7.1 million to $15.5 million for fiscal 2014 compared to fiscal 2013. This increase in net income was attributable to a $0.9 million increase in operating profit and a $9.8 million decrease in other expense, partially offset by a $3.7 million increase in income tax expense. The increase in operating profit was a result of the increase in gross profit discussed above, partially offset by an increase in operating expenses. The decrease in other expense, net related primarily to lower interest expense in the amount of $7.8 million for fiscal 2014 and a $2.0 million loss on extinguishment of debt related to our senior notes in fiscal 2013. These were partially offset by $0.4 million less non-cash income related to the change in fair value of our derivatives for fiscal 2014 compared to fiscal 2013. The decrease in interest expense was primarily a result of lower average interest rates mainly attributable to the refinancing in May 2013 of our senior notes with a new term loan facility, partially offset by an increase in average borrowings during fiscal 2014 compared to fiscal 2013.
49
Table of Contents
The increase in income tax expense was primarily a result of the increase in income before taxes, partially offset by a decrease in the effective tax rate. The effective tax rate was 48.7% for fiscal 2014 compared to 56.8% for fiscal 2013. The decrease in the effective tax rate was a result of the reduction of non-deductible expenses and state income taxes as a percentage of income before taxes. Since non-deductible expenses tend to be relatively constant, there is a favorable rate impact as income before taxes increases.
Fiscal year ended June 29, 2013 compared to fiscal year ended June 30, 2012
Net Sales
Net sales increased $1.3 billion, or 11.5%, for fiscal 2013 compared to fiscal 2012. This increase is attributable to acquisitions, securing new Street and Chain customers, and further penetrating existing customers. These increases were partially offset by the loss of some Chain customers.
Case volume grew 9.8% from fiscal 2012 to fiscal 2013, which also contributed to the increase in net sales. Inflation during fiscal 2013 increased at an estimated annual rate of 1.3% compared to an estimated annual rate of 4.6% in fiscal 2012. Net sales growth is a function of case growth, product inflation, and a changing mix of customers, channels, and product categories sold.
Gross Profit
Gross profit increased $178.7 million, or 12.7%, for fiscal 2013 compared to fiscal 2012. This increase in gross profit was the result of growth in cases sold and a higher gross profit per case. Net sales from Performance Foodservice and Vistar increased as a percentage of total net sales from 58.3% and 16.3%, respectively, for fiscal 2012 and to 58.5% and 16.7%, respectively, for fiscal 2013. Net sales from PFG Customized decreased as a percentage of total net sales from 25.3% for fiscal 2012 to 24.7% for fiscal 2013. We earn higher gross margins and higher gross margins per case in Performance Foodservice and Vistar than PFG Customized. Within Performance Foodservice, case growth to Street customers positively affected gross profit per case. Street customers typically receive more services from us, cost more to serve, and pay a higher gross profit per case than other customers. Also, within Performance Foodservice, we were able to grow our Performance Brand sales, which have higher gross margins compared to other brands, from fiscal 2012 to the fiscal 2013. See “—Segment Results—Performance Foodservice” below for additional discussion. Gross profit for fiscal 2013 was negatively affected by $11.2 million because of the initial fair value placed on the inventory that was acquired as part of the two acquisitions that closed during the fourth quarter of fiscal 2012 and the acquisition that closed during the second quarter of fiscal 2013.
Operating Expenses
Operating expenses increased $174.9 million, or 13.5%, for fiscal 2013 compared to fiscal 2012. The increase in operating expenses was primarily caused by the addition of distribution centers resulting from recent acquisitions, the start-up of one distribution center and the conversion of a Performance Foodservice distribution center to a PFG Customized distribution center to handle a major new account, an increase in case volume and the resulting impact on variable costs, and an increase in fuel expense, as discussed in the segment results below. Also, during fiscal 2013, we recorded an estimated withdrawal liability of $3.7 million for one of our multiemployer pension plans after it was determined that it was probable that we would withdraw from the plan. These increases were partially offset by a decrease in bonus expense. These factors resulted in a net increase in operating expenses for fiscal 2013 compared to fiscal 2012.
Depreciation and amortization of intangible assets increased from $102.3 million in fiscal 2012 to $120.1 million in fiscal 2013, an increase of 17.4%, primarily due to capital expenditures, as well as our acquisitions.
Net Income
Net income decreased by $12.6 million to $8.4 million for fiscal 2013 compared to fiscal 2012. This decrease in net income was attributable to an $18.2 million increase in other expense, net for fiscal 2013,
50
Table of Contents
partially offset by a $3.8 million increase in operating profit and a $1.8 million decrease in income tax expense. The increase in other expense, net related primarily to higher interest expense in the amount of $17.5 million for fiscal 2013 and a $2.0 million loss on extinguishment of debt related to the senior notes in fiscal 2013 discussed below. These were partially offset by $1.3 million more non-cash income related to the change in fair value of our derivatives for fiscal 2013. The higher interest expense relates to the increase in debt levels from June 30, 2012 to June 29, 2013 to support recent acquisitions in the business.
The decrease in income tax expense was primarily because of the decrease in income before taxes, partially offset by an increase in the effective tax rate. The effective tax rate was 56.8% for fiscal 2013 compared to 38.0% for fiscal 2012. The increase in the effective tax rate was a result of favorable changes in uncertain tax positions in fiscal 2012 compared to fiscal 2013 and the increase in non-deductible expenses as a percentage of income before taxes in fiscal 2013.
Segment Results
We have three segments as described above—Performance Foodservice, PFG Customized, and Vistar. Management evaluates the performance of these segments based on their respective sales growth and EBITDA. For PFG Customized, EBITDA includes certain allocated corporate charges that are included in operating expenses. The allocated corporate charges are determined based on a percentage of total sales. This percentage is reviewed on a periodic basis to ensure that the allocation reflects a reasonable rate of corporate expenses based on their use of corporate services.
Corporate & All Other is comprised of corporate overhead and certain operations that are not considered separate reportable segments based on their size. This includes the operations of our internal logistics unit responsible for managing and allocating inbound logistics revenue and expense.
The following tables set forth net sales and EBITDA by segment for the periods indicated (dollars in thousands):
Net Sales
| Fiscal Year Ended | Fiscal 2014 | Fiscal 2013 | ||||||||||||||||||||||||||
| June 28, 2014 | June 29, 2013 | June 30, 2012 | Change | % | Change | % | ||||||||||||||||||||||
| Performance Foodservice |
$ | 8,103,812 | $ | 7,504,275 | $ | 6,703,255 | $ | 599,537 | 8.0 | $ | 801,020 | 11.9 | ||||||||||||||||
| PFG Customized |
3,300,980 | 3,164,429 | 2,912,989 | 136,551 | 4.3 | 251,440 | 8.6 | |||||||||||||||||||||
| Vistar |
2,269,014 | 2,141,122 | 1,876,877 | 127,892 | 6.0 | 264,245 | 14.1 | |||||||||||||||||||||
| Corporate & All Other |
157,511 | 145,937 | 111,249 | 11,574 | 7.9 | 34,688 | 31.2 | |||||||||||||||||||||
| Intersegment Eliminations |
(145,613 | ) | (129,251 | ) | (98,478 | ) | (16,362 | ) | (12.7 | ) | (30,773 | ) | (31.2 | ) | ||||||||||||||
|
|
|
|
|
|
|
|
|
|
|
|
|
|
|
|||||||||||||||
| Total net sales |
$ | 13,685,704 | $ | 12,826,512 | $ | 11,505,892 | $ | 859,192 | 6.7 | $ | 1,320,620 | 11.5 | ||||||||||||||||
|
|
|
|
|
|
|
|
|
|
|
|
|
|
|
|||||||||||||||
EBITDA
| Fiscal Year Ended | Fiscal 2014 | Fiscal 2013 | ||||||||||||||||||||||||||
| June 28, 2014 | June 29, 2013 | June 30, 2012 | Change | % | Change | % | ||||||||||||||||||||||
| Performance Foodservice |
$ | 207,538 | $ | 173,910 | $ | 178,419 | $ | 33,628 | 19.3 | $ | (4,509 | ) | (2.5 | ) | ||||||||||||||
| PFG Customized |
37,532 | 37,348 | 39,459 | 184 | 0.5 | (2,111 | ) | (5.3 | ) | |||||||||||||||||||
| Vistar |
88,304 | 81,421 | 57,924 | 6,883 | 8.5 | 23,497 | 40.6 | |||||||||||||||||||||
| Corporate & All Other |
(84,363 | ) | (59,289 | ) | (63,282 | ) | (25,074 | ) | (42.3 | ) | 3,993 | 6.3 | ||||||||||||||||
|
|
|
|
|
|
|
|
|
|
|
|
|
|
|
|||||||||||||||
| Total EBITDA |
$ | 249,011 | $ | 233,390 | $ | 212,520 | $ | 15,621 | 6.7 | $ | 20,870 | 9.8 | ||||||||||||||||
|
|
|
|
|
|
|
|
|
|
|
|
|
|
|
|||||||||||||||
51
Table of Contents
Segment Results—Performance Foodservice
Fiscal year ended June 28, 2014 compared to fiscal year ended June 29, 2013
Net Sales
Net sales for Performance Foodservice increased 8.0%, or $599.5 million, to $8.1 billion from fiscal 2013 to fiscal 2014. This increase in net sales was attributable primarily to the carryover impact of an acquisition, securing new Street and Chain customers, further penetrating existing customers, and inflation. These increases were partially offset by the loss of Chain customers and severe weather in several parts of the country during the third quarter of fiscal 2014.
EBITDA
EBITDA for Performance Foodservice increased $33.6 million, or 19.3%, from fiscal 2013 to fiscal 2014. This increase was the result of an increase in gross profit, partially offset by an increase in operating expenses excluding depreciation and amortization. Gross profit increased by 8.9% in fiscal 2014, compared to the prior fiscal year. The increase in gross profit is a result of increased net sales from the carryover impact of integrating new customers from a prior fiscal year acquisition and increased sales to Street customers. As a percentage of total segment sales, the business from Street customers increased from 41.3% in fiscal 2013 to 43.4% for fiscal 2014. Street business has higher gross margins than Chain customers within this segment. Also, sales of Performance Brands, which have higher gross margins compared to other brands, increased by 14.0% in fiscal 2014. Gross profit for fiscal 2013 was negatively affected by $10.0 million because of the initial fair value of inventory that was acquired as part of two acquisitions.
Operating expenses excluding depreciation and amortization for Performance Foodservice increased by 6.9% from fiscal 2013 to fiscal 2014. This increase in operating expenses was primarily related to the addition of a distribution center resulting from a recent acquisition. In addition, operating expenses increased as a result of the higher percentage of business from Street customers mentioned above, which cost more to serve, the severe weather in several parts of the country during the third quarter of fiscal 2014 that affected delivery and warehouse costs, and an increase in bonus expense. These increases were partially offset by the estimated withdrawal liability of $3.7 million recorded during fiscal 2013 for a multiemployer pension plan after we determined that it was probable that we would withdraw from the plan. The estimated withdrawal liability for this multiemployer pension plan increased by $0.4 million during fiscal 2014.
Depreciation and amortization of intangible assets recorded in this segment increased from $74.7 million in fiscal 2013 to $81.7 million in fiscal 2014, an increase of 9.3%. Increases of depreciation of fixed assets were partially offset by decreases in amortization of intangible assets.
Fiscal year ended June 29, 2013 compared to fiscal year ended June 30, 2012
Net Sales
Net sales for Performance Foodservice increased 11.9%, or $801.0 million, to $7.5 billion from fiscal 2012 to fiscal 2013. This increase in net sales was attributable to acquisitions, securing new Street and Chain customers, further penetrating existing customers, and inflation. These increases were partially offset by the loss of Chain customers.
EBITDA
EBITDA decreased $4.5 million, or 2.5%, from fiscal 2012 to fiscal 2013. This decrease was the result of an increase in operating expenses excluding depreciation and amortization partially offset by an increase in gross profit. Gross profit increased by 12.2% in fiscal 2013, compared to the prior year. The increase in gross profit is a result of an increase in net sales from the integration of new customers from our recent acquisitions and increased
52
Table of Contents
sales to Street customers. As a percentage of total segment sales, the business from Street customers increased from 38.2% in fiscal 2012 to 41.3% for fiscal 2013. Street business has higher gross margins than Chain customers within this segment. Also, sales of Performance Brands, which have higher gross margins compared to other brands, increased by 16.7% in fiscal 2013, compared to the prior year. Gross profit for fiscal 2013 was negatively affected by $10.0 million because of the initial fair value of inventory that was acquired as part of two acquisitions.
Operating expenses excluding depreciation and amortization for Performance Foodservice increased by 15.7% from fiscal 2012 to fiscal 2013. This increase in operating expenses was primarily related to the addition of distribution centers resulting from our recent acquisitions. In addition, operating expenses increased as a result of the higher percentage of business from Street customers mentioned above, which cost more to serve, as well as an increase in personnel costs related to benefits. Also, during the first quarter of fiscal 2013, we determined that it was probable that we would withdraw from one of our multiemployer plans and reserved for the estimated withdrawal liability. These increases were offset partially by a decrease in bonus expense. Operating expenses for fiscal 2012 also included expenses related to the transition associated with transferring business at a certain location from Vistar to Performance Foodservice.
Depreciation and amortization of intangible assets recorded in this segment increased from $65.2 million in fiscal 2012 to $74.7 million in fiscal 2013, an increase of 14.7%, primarily because of capital expenditures, as well as our recent acquisitions.
Segment Results—PFG Customized
Fiscal year ended June 28, 2014 compared to fiscal year ended June 29, 2013
Net Sales
Net sales for PFG Customized increased $136.6 million, or 4.3%, from fiscal 2014 to fiscal 2013. The increase in net sales over this period was driven by the addition of new customers and inflation, which was partially offset by the effect on restaurant traffic from the severe weather in several parts of the country during the third quarter of fiscal 2014.
EBITDA
EBITDA for PFG Customized increased $0.2 million, or 0.5%, from $37.3 million in fiscal 2013 to $37.5 million in fiscal 2014. This increase was primarily attributable to an increase in gross profit, partially offset by an increase in operating expenses excluding depreciation and amortization. Gross profit for PFG Customized increased 3.3% from fiscal 2013 to fiscal 2014. This increase in gross profit is primarily a result of increased sales.
Operating expenses, excluding depreciation and amortization, increased by 3.9% in fiscal 2014, compared to the prior year. The increase in operating expenses was primarily because of an increase in insurance related to workers compensation and auto liability, personnel costs, and allocated corporate charges, along with the severe weather experienced in several parts of the country during the third quarter of fiscal 2014 that affected delivery and warehouse costs. In addition, during the third quarter of fiscal 2014 a distribution center experienced a partial roof collapse when the facility was experiencing adverse weather, damaging the refrigeration systems and temporarily shutting that facility down. As a result, PFG Customized’s operating expenses increased as other, more remote distribution centers served the customers of the damaged facility. Insurance recoveries partially offset these added expenses.
These increases in operating expenses were partially offset by the absence of transition costs associated with a distribution facility that it had taken over from Performance Foodservice in fiscal 2012.
53
Table of Contents
Depreciation and amortization of intangible assets recorded in this segment increased from $15.0 million for fiscal 2013 to $15.1 million for fiscal 2014, an increase of 0.6%. Increases of depreciation in fixed assets were partially offset by decreases in amortization of intangible assets.
Fiscal year ended June 29, 2013 compared to fiscal year ended June 30, 2012
Net Sales
Net sales for PFG Customized increased $251.4 million, or 8.6%, from fiscal 2012 to fiscal 2013. The increase in net sales over this period was primarily driven by the addition of new customers. As of April 1, 2012, PFG Customized took over a distribution center previously operated by Performance Foodservice. This distribution center was primarily established to serve a new customer in the Southeast.
EBITDA
EBITDA for PFG Customized decreased 5.3% from $39.5 million in fiscal 2012 to $37.3 million in fiscal 2013. This decrease was attributable to a 12.6% increase in operating expenses excluding depreciation and amortization, partially offset by a 9.3% increase in gross profit. The increase in operating expenses excluding depreciation and amortization relates primarily to the transition of a Performance Foodservice distribution center to a PFG Customized distribution center and the costs associated with transitioning a new customer into that facility, as well as an increase in fuel expense, personnel costs related to benefits, and allocated corporate charges.
The increase in gross profit was primarily the result of adding new customers during the fourth quarter of fiscal 2012.
Depreciation and amortization of intangible assets recorded in this segment increased from $14.9 million for fiscal 2012 to $15.0 million for fiscal 2013, an increase of 0.5%.
Segment Results—Vistar
Fiscal year ended June 28, 2014 compared to fiscal year ended June 29, 2013
Net Sales
Net sales for Vistar increased 6.0%, or $127.9 million, from fiscal 2013 to fiscal 2014. This increase in sales related primarily to an increase in sales to the segment’s retail, theater, vending, and hospitality channels and inflation. This was partially offset by the impact of severe weather in several parts of the country during the third quarter of fiscal 2014.
EBITDA
EBITDA for Vistar increased $6.9 million, or 8.5%, from fiscal 2013 to fiscal 2014. This increase in EBITDA was the result of an increase in gross profit, partially offset by an increase in operating expenses excluding depreciation and amortization. Gross profit increased by 6.3% in fiscal 2014 compared to the prior year. The increase in gross profit relates primarily to increased sales plus a change in the mix of business generated by the various channels within the Vistar segment. Net sales from the retail and hospitality channels increased as a percentage of total Vistar net sales in fiscal 2014 compared to the prior year, while the percent of net sales from the vending channel, which represents the largest channel within Vistar, declined as a percentage of total Vistar net sales during the same time period. The retail and hospitality channels have a higher gross margin than the vending channel within this segment. Gross profit for fiscal 2013 was negatively affected by $1.2 million because of the initial fair value of inventory from the acquisition that closed during the fourth quarter of fiscal 2012.
54
Table of Contents
Operating expenses excluding depreciation and amortization increased 5.4% for fiscal 2014 compared to fiscal 2013. The increase in operating expenses was primarily the result of higher case sales and a channel mix shift toward the retail and hospitality channels, which cost more to serve. Operating expenses for fiscal 2014 were also affected by expenses related to the relocation of three facilities and additional expenses related to a prior acquisition.
Depreciation and amortization of intangible assets recorded in this segment decreased from $13.9 million for fiscal 2013 to $13.8 million for fiscal 2014, a decrease of less than 0.1%. Increases of depreciation in fixed assets were offset by decreases in amortization of intangible assets.
Fiscal year ended June 29, 2013 compared to fiscal year ended June 30, 2012
Net Sales
Net sales for Vistar increased 14.1%, or $264.2 million, from fiscal 2012 to fiscal 2013. This increase in sales related primarily to integrating new customers from an acquisition, securing new customers in the segment’s retail and vending businesses, further penetrating existing customers, and inflation.
EBITDA
EBITDA for Vistar increased $23.5 million, or 40.6%, from fiscal 2012 to fiscal 2013. This increase in EBITDA was the result of an increase in gross profit, partially offset by an increase in operating expenses excluding depreciation and amortization. Gross profit increased by 19.3% in fiscal 2013 compared to the prior fiscal year. The increase in gross profit relates primarily to increased sales, including sales from an acquisition that closed during the fourth quarter of fiscal 2012, plus a change in the mix of business generated by the various channels within the Vistar segment. Net sales from the retail channel increased as a percentage of total Vistar net sales in fiscal 2013 compared to the prior year, while the percent of net sales from the vending channel, which represents the largest channel within Vistar, declined as a percentage of total Vistar net sales during the same time period. The retail channel has a higher gross margin than the vending channel. Gross profit for fiscal 2013 was negatively affected by $1.2 million because of the initial fair value placed on the inventory that was acquired as part of the acquisition that closed during the fourth quarter of fiscal 2012.
Operating expenses excluding depreciation and amortization increased 12.3% for fiscal 2013 compared to fiscal 2012. The increase in operating expenses was primarily related to the addition of distribution centers resulting from the acquisition that closed during the fourth quarter of fiscal 2012. In addition, this increase was the result of higher sales and a channel mix shift toward the retail channel, which costs more to serve, and an increase in personnel costs related to benefits. Operating expenses for fiscal 2012 also included expenses related to the relocation of two of its facilities and the transfer of business at a certain location from Vistar to Performance Foodservice.
Depreciation and amortization of intangible assets recorded in this segment increased from $9.2 million for fiscal 2012 to $13.9 million for fiscal 2013, an increase of 50.5%, primarily because of the acquisition.
Segment Results—Corporate & All Other
Fiscal year ended June 28, 2014 compared to fiscal year ended June 29, 2013
Net Sales
Net sales for Corporate & All Other increased $11.6 million from fiscal 2013 to fiscal 2014. The increase in sales was primarily attributable to an increase in logistics services provided to our other segments.
55
Table of Contents
EBITDA
EBITDA for Corporate & All Other decreased from a negative $59.3 million for fiscal 2013 to a negative $84.4 million for fiscal 2014. The decreased EBITDA was primarily driven by increased headcount and an increase in professional and consulting fees primarily associated with Winning Together, along with an increase in IT expenses and bonus expense.
Depreciation and amortization of intangible assets recorded in this segment increased from $16.5 million in fiscal 2013 to $22.1 million in fiscal 2014. Increases in depreciation in fixed assets, primarily because of IT capital expenditures, were partially offset by a decrease in amortization of intangible assets.
Fiscal year ended June 29, 2013 compared to fiscal year ended June 30, 2012
Net Sales
Net sales for Corporate & All Other increased $34.7 million from fiscal 2012 to fiscal 2013. The increase in sales was primarily attributable to an increase in logistics services provided to our other segments.
EBITDA
EBITDA for Corporate & All Other increased from a negative $63.3 million for fiscal 2012 to a negative $59.3 million for fiscal 2013. The increased EBITDA was primarily driven by a decrease in bonus expense, lower corporate overhead related to personnel expenses, and a decrease in professional fees. These decreases were partially offset by an increase in IT expenses.
Depreciation and amortization of intangible assets recorded in this segment increased from $13.0 million in fiscal 2012 to $16.5 million in fiscal 2014. Increases in depreciation in fixed assets, primarily because of IT capital expenditures, were partially offset by a decrease in amortization of intangible assets.
56
Table of Contents
Quarterly Results and Seasonality
Historically, the food-away-from-home and foodservice distribution industries are seasonal, with lower profit in the first and third quarters of each calendar year. Consequently, we typically experience lower operating profit during our first and third fiscal quarters, depending on the timing of acquisitions.
Financial information for each quarter for fiscal 2014 and fiscal 2013 is set forth below:
| Fiscal Year Ended June 28, 2014 |
||||||||||||||||
| (dollars in thousands, except per share data) |
Q1 | Q2 | Q3 | Q4 | ||||||||||||
| Net sales |
$ | 3,342,709 | $ | 3,327,427 | $ | 3,373,128 | $ | 3,642,440 | ||||||||
| Cost of goods sold |
2,930,447 | 2,907,285 | 2,956,186 | 3,194,567 | ||||||||||||
|
|
|
|
|
|
|
|
|
|||||||||
| Gross profit |
412,262 | 420,142 | 416,942 | 447,873 | ||||||||||||
| Operating expenses |
391,666 | 389,133 | 398,612 | 402,228 | ||||||||||||
|
|
|
|
|
|
|
|
|
|||||||||
| Operating profit |
20,596 | 31,009 | 18,330 | 45,645 | ||||||||||||
|
|
|
|
|
|
|
|
|
|||||||||
| Other expense: |
||||||||||||||||
| Interest expense |
22,866 | 21,925 | 20,701 | 20,604 | ||||||||||||
| Other, net |
(312 | ) | (80 | ) | (138 | ) | (201 | ) | ||||||||
|
|
|
|
|
|
|
|
|
|||||||||
| Other expense, net |
22,554 | 21,845 | 20,563 | 20,403 | ||||||||||||
|
|
|
|
|
|
|
|
|
|||||||||
| Income (loss) before taxes |
(1,958 | ) | 9,164 | (2,233 | ) | 25,242 | ||||||||||
| Income tax (benefit) expense |
(717 | ) | 4,191 | (1,594 | ) | 12,831 | ||||||||||
|
|
|
|
|
|
|
|
|
|||||||||
| Net income (loss) |
$ | (1,241 | ) | $ | 4,973 | $ | (639 | ) | $ | 12,411 | ||||||
|
|
|
|
|
|
|
|
|
|||||||||
| Weighted-average common shares outstanding: |
||||||||||||||||
| Basic |
179,104,458 | 179,106,973 | 179,111,190 | 179,118,223 | ||||||||||||
| Diluted |
180,420,281 | 180,458,121 | 180,442,998 | 180,801,777 | ||||||||||||
| Earnings (loss) per common share: |
||||||||||||||||
| Basic |
$ | (0.01 | ) | $ | 0.03 | $ | 0.00 | $ | 0.07 | |||||||
| Diluted |
$ | (0.01 | ) | $ | 0.03 | $ | 0.00 | $ | 0.07 | |||||||
| Dividends declared per common share: |
— | — | — | — | ||||||||||||
57
Table of Contents
| Fiscal Year Ended June 29, 2013 |
||||||||||||||||
| (dollars in thousands, except per share) |
Q1 | Q2 | Q3 | Q4 | ||||||||||||
| Net sales |
$ | 3,109,301 | $ | 3,095,572 | $ | 3,245,152 | $ | 3,376,487 | ||||||||
| Cost of goods sold |
2,734,587 | 2,705,272 | 2,849,777 | 2,954,173 | ||||||||||||
|
|
|
|
|
|
|
|
|
|||||||||
| Gross profit |
374,714 | 390,300 | 395,375 | 422,314 | ||||||||||||
| Operating expenses |
365,407 | 357,465 | 368,640 | 376,524 | ||||||||||||
|
|
|
|
|
|
|
|
|
|||||||||
| Operating profit |
9,307 | 32,835 | 26,735 | 45,790 | ||||||||||||
|
|
|
|
|
|
|
|
|
|||||||||
| Other expense: |
||||||||||||||||
| Interest expense |
22,506 | 23,189 | 24,456 | 23,720 | ||||||||||||
| Loss on extinguishment of debt |
— | — | — | 2,039 | ||||||||||||
| Other, net |
(809 | ) | 116 | (89 | ) | 85 | ||||||||||
|
|
|
|
|
|
|
|
|
|||||||||
| Other expense, net |
21,697 | 23,305 | 24,367 | 25,844 | ||||||||||||
|
|
|
|
|
|
|
|
|
|||||||||
| Income (loss) before taxes |
(12,390 | ) | 9,530 | 2,368 | 19,946 | |||||||||||
| Income tax (benefit) expense |
(4,916 | ) | 3,930 | 1,125 | 10,920 | |||||||||||
|
|
|
|
|
|
|
|
|
|||||||||
| Net income (loss) |
$ | (7,474 | ) | $ | 5,600 | $ | 1,243 | $ | 9,026 | |||||||
|
|
|
|
|
|
|
|
|
|||||||||
| Weighted-average common shares outstanding: |
||||||||||||||||
| Basic |
179,101,958 | 179,101,958 | 179,101,958 | 179,103,249 | ||||||||||||
| Diluted |
180,155,862 | 180,254,328 | 180,306,550 | 180,347,335 | ||||||||||||
| Earnings (loss) per common share: |
||||||||||||||||
| Basic |
$ | (0.04 | ) | $ | 0.03 | $ | 0.01 | $ | 0.05 | |||||||
| Diluted |
$ | (0.04 | ) | $ | 0.03 | $ | 0.01 | $ | 0.05 | |||||||
| Dividends declared per common share: |
— | — | — | $ | 1.2283 | |||||||||||
Liquidity and Capital Resources
We have historically financed our operations and growth primarily with cash flows from operations, borrowings under our credit facilities, operating and capital leases, and normal trade credit terms. We have typically funded our acquisitions with additional borrowings under our credit facilities. During fiscal 2013, we increased the amount of indebtedness outstanding under our senior notes because of acquisition activity. The senior notes were redeemed in full in May 2013 with the proceeds from a new term loan facility. Proceeds from this new term loan facility were also used to pay a dividend to our stockholders. Our working capital and borrowing levels are subject to seasonal fluctuations, typically with the lowest borrowing levels in third and fourth fiscal quarters and the highest borrowing levels in the first and second fiscal quarters. We believe that our cash flows from operations and available borrowing capacity will be sufficient to meet our anticipated cash requirements over at least the next twelve months while maintaining sufficient liquidity for normal operating purposes.
At June 28, 2014, our cash balances totaled $5.3 million, while our cash balance totaled $14.1 million at June 29, 2013 and $11.1 million at June 30, 2012. This decrease in cash during fiscal 2014 was attributable to net cash used in investing activities and financing activities of $93.4 million and $35.1 million, respectively, partially offset by net cash provided by operating activities of $119.8 million. This increase in cash during fiscal 2013 was attributable to net cash provided by operating activities and financing activities of $140.7 million and $12.3 million, respectively, partially offset by net cash used in investing activities of $150.0 million. We borrow under our ABL facility or pay it down regularly based on our cash flows from operating and investing activities. Our practice is to minimize interest expense while maintaining reasonable liquidity.
58
Table of Contents
Operating Activities
Fiscal year ended June 28, 2014 compared to the fiscal year ended June 29, 2013
During fiscal 2014, our operating activities provided cash flow of $119.8 million, while during fiscal 2013 our operating activities provided cash flow of $140.7 million.
Cash flow from net earnings, excluding depreciation and amortization, totaled $158.4 million for fiscal 2014 and $137.3 million for fiscal 2013. For fiscal 2014, this cash flow was more than offset by investments made in inventories and increases in accounts receivable, which together increased by $241.8 million. The increase in inventory supported our sales growth. The increase in accounts receivable was primarily driven by the increase in sales versus the comparable period in the prior year.
This cash flow for fiscal 2014 was positively affected by a $148.4 million increase in trade accounts payable and outstanding checks in excess of deposits and a $52.2 million increase in accrued expenses and other liabilities. The increase in trade accounts payable and outstanding checks in excess of deposits resulted from the increase in inventory. The increase in accrued expenses and other liabilities was primarily related to an increase in accrued interest and accrued bonus.
The cash flow from net earnings, excluding non-cash depreciation and amortization, in the amount of $137.3 million for fiscal 2013 was partially offset by a $39.7 million increase in inventories and accounts receivables. The increases in inventory and accounts receivable in fiscal 2013 were primarily driven by the increase in sales versus the comparable period in the prior year, the two acquisitions that closed one week prior to the end of fiscal 2012, and the one acquisition that closed one week prior to the end of the second quarter of fiscal 2013. This cash flow was positively affected by a $52.4 million increase in trade accounts payable and outstanding checks in excess of deposits. The increase in trade accounts payable and outstanding checks resulted from the increase in inventory.
Fiscal year ended June 29, 2013 compared to the fiscal year ended June 30, 2012
During fiscal 2013, our operating activities provided cash flow of $140.7 million, while during fiscal 2012 our operating activities provided cash flow of $97.6 million.
Cash flow from net earnings, excluding depreciation and amortization, totaled $137.3 million for fiscal 2013 and $130.6 million for fiscal 2012. For fiscal 2013, this cash flow was partially offset by investments made in inventories and increases in accounts receivable, which together increased by $39.7 million. The increases in inventory and accounts receivable in fiscal 2013 were primarily driven by the increase in sales versus the comparable period in the prior year, the two acquisitions that closed one week prior to the end of fiscal 2012, and the one acquisition that closed one week prior to the end of the second quarter of fiscal 2013.
This cash flow for fiscal 2013 was positively affected by a $52.4 million increase in trade accounts payable and outstanding checks in excess of deposits. The increase in trade accounts payable and outstanding checks resulted from the increase in inventory.
The cash flow from net earnings, excluding non-cash depreciation and amortization, in the amount of $130.6 million for fiscal 2012 was partially offset by a $76.3 million increase in inventories and accounts receivables. The increase in inventory was from both inflation and the normal increase of inventory levels to support sales growth, while the increase in accounts receivable was a result of the increase in sales during this time period. This cash flow was positively affected by a $32.4 million increase in trade accounts payable and outstanding checks in excess of deposits. The increase in trade accounts payable and outstanding checks was mainly because of the increase in inventory.
59
Table of Contents
Investing Activities
Cash used in investing activities totaled $93.4 million in fiscal 2014 compared to $150.0 million in fiscal 2013 and $388.2 million in fiscal 2012. These investments consisted primarily of capital purchases of property, plant, and equipment of $90.6 million, $66.5 million, and $68.9 million for fiscal years 2014, 2013, and 2012, respectively, and new business acquisitions of $0.9 million, $86.0 million, and $319.8 million for fiscal years 2014, 2013, and 2012, respectively. In fiscal 2014, purchases of property, plant, and equipment primarily consisted of warehouse expansions and improvements, as well as the purchase of warehouse, transportation, and information technology. The following table presents the capital purchases of property, plant, and equipment by segment:
| (Dollars in thousands) |
Fiscal Year Ended | |||||||||||
| June 28, 2014 | June 29, 2013 | June 30, 2012 | ||||||||||
| Performance Foodservice |
$ | 38,782 | $ | 27,281 | $ | 34,718 | ||||||
| PFG Customized |
12,166 | 4,857 | 5,995 | |||||||||
| Vistar |
20,677 | 12,971 | 15,720 | |||||||||
| Other & Intersegment |
19,000 | 21,374 | 12,493 | |||||||||
|
|
|
|
|
|
|
|||||||
| Total capital purchases of property, plant and equipment |
$ | 90,625 | $ | 66,483 | $ | 68,926 | ||||||
|
|
|
|
|
|
|
|||||||
Financing Activities
During fiscal 2014, our financing activities used cash flow of $35.1 million, which consisted primarily of $21.2 million in net payments on our ABL facility, $5.6 million in payments on our term loan facility, $2.8 million in payments related to acquisitions, and $1.8 million in payments on financed property, plant, and equipment.
During fiscal 2013, our financing activities provided cash flow of $12.3 million, which consisted primarily of $746.3 million in net proceeds related to the inception of our term loan facility and the issuance of $50.0 million of additional senior notes, partially offset by a payment of $500.0 million to redeem the senior notes in full, a payment of a $220.0 million dividend to our stockholders, net payments on our ABL facility of $30.5 million, $5.1 million in payments related to acquisitions, and $27.2 million of fees associated with issuing, extinguishing, or modifying our debt.
During fiscal 2012, our financing activities provided cash flow of $286.7 million, which consisted primarily of $258.6 million in net borrowings on our ABL facility and the issuance of $150.0 million of additional senior notes, partially offset by a payment of a $100.0 million dividend to our stockholders, $4.1 million in payments related to acquisitions, $18.4 million of fees associated with modifying our debt, and $1.2 million in proceeds related to the issuance of stock.
The following describes our financing arrangements as of June 28, 2014:
ABL Facility. PFGC, Inc. (“PFGC”), our wholly-owned subsidiary, entered into an Asset Based Revolving Loan Credit Agreement (the “ABL facility”) on May 23, 2008, which was amended and restated on May 8, 2012. The $1.4 billion ABL facility matures in May 2017. The ABL facility is secured by the majority of the tangible assets of PFGC and its subsidiaries. Performance Food Group, Inc., a wholly-owned subsidiary of PFGC, is the lead borrower under the ABL facility, which is jointly and severally guaranteed by PFGC and all domestic direct and indirect wholly-owned subsidiaries of PFGC (other than captive insurance subsidiaries). Availability for loans and letters of credit under the ABL facility is governed by a borrowing base, determined by the application of specified advance rates against eligible assets, including trade accounts receivable, inventory, owned real properties, and owned transportation equipment. The borrowing base is reduced quarterly by a cumulative fraction of the real properties and transportation equipment values. Advances on accounts receivable and inventory are subject to change based on periodic commercial finance examinations and appraisals, and the real
60
Table of Contents
property and transportation equipment values included in the borrowing base are subject to change based on periodic appraisals. Audits and appraisals are conducted at the direction of the administrative agent for the benefit and on behalf of all lenders.
Borrowings under the ABL facility bear interest, at Performance Food Group, Inc.’s option, at (a) the Base Rate (defined as the greater of (1) the Federal Funds Rate in effect on such date plus 0.5%, (2) the Prime Rate on such day, or (3) one-month LIBOR plus 1.0%) plus a spread or (b) LIBOR plus a spread. The ABL facility also provides for an unused commitment fee ranging from 0.25% to 0.375%. As of June 28, 2014, aggregate borrowings outstanding were $679.6 million. There were also $108.7 million in letters of credit outstanding under the facility, and excess availability was $587.8 million, net of $19.9 million of lenders’ reserves, subject to compliance with customary borrowing conditions. As of June 29, 2013, aggregate borrowings outstanding were $700.8 million. There were also $111.2 million in letters of credit outstanding under the facility, and excess availability was $458.7 million, net of $14.7 million of lenders’ reserves, subject to compliance with customary borrowing conditions.
The ABL facility contains covenants requiring the maintenance of a minimum consolidated fixed charge coverage ratio if excess availability falls below (a) the greater of (1) $130.0 million and (2) 10% of the lesser of the borrowing base and the revolving credit facility amount for five consecutive business days or (b) 7.5% of the revolving credit facility amount at any time. The ABL facility also contains customary restrictive covenants that include, but are not limited to, restrictions on PFGC’s ability to incur additional indebtedness, pay dividends, create liens, make investments or specified payments, and dispose of assets. The ABL facility provides for customary events of default, including payment defaults and cross-defaults on other material indebtedness. If an event of default occurs and is continuing, amounts due under such agreement may be accelerated and the rights and remedies of the lenders under such agreement available under the ABL facility may be exercised, including rights with respect to the collateral securing the obligations under such agreement.
Term Loan Facility. Performance Food Group, Inc. entered into a new credit agreement providing for the term loan facility on May 14, 2013. Performance Food Group, Inc. borrowed an aggregate principal amount of $750.0 million under the term loan facility which is jointly and severally guaranteed by PFGC and all domestic direct and indirect wholly-owned subsidiaries of Performance Food Group, Inc. Net proceeds to Performance Food Group, Inc. were $746.3 million. The proceeds from the term loan facility were used to redeem all outstanding senior notes in full; to pay the fees, premiums, expenses, and other transaction costs incurred in connection with the term loan facility and the ABL amendment discussed above; and to pay the $220.0 million dividend. As discussed above, a portion of the term loan facility was considered a modification of the senior notes and resulted in a charge of $1.4 million and $0.3 million related to third-party fees paid for the modified debt, which was reported in operating expenses in fiscal 2013 and fiscal 2014, respectively.
The term loan facility matures in 2019 and bears interest, at Performance Food Group, Inc.’s option, at a rate equal to a margin over either (a) a base rate determined by reference to the higher of (1) the rate of interest published by Credit Suisse (AG), Cayman Islands Branch, as its “prime lending rate,” (2) the federal funds rate plus 0.50%, and (3) one-month LIBOR rate plus 1.00%, or (b) a LIBOR rate determined by reference to the service selected by Credit Suisse (AG), Cayman Islands Branch that has been nominated by the British Bankers’ Association (or any successor thereto). The applicable margin for the term loans under the term loan facility may be reduced subject to attaining a certain total net leverage ratio. The applicable margin for borrowings will be 5.25% for loans based on a LIBOR rate and 4.25% for loans based on the base rate, as of June 28, 2014. The LIBOR rate for term loans is subject to a 1.00% floor and the base rate for term loans is subject to a floor of 2.00%. Interest is payable quarterly in arrears in the case of Base Rate loans, and at the end of the applicable interest period (but no less frequently than quarterly) in the case of the LIBOR loans. Performance Food Group, Inc. can incur additional loans under the term loan facility with the aggregate amount of the incremental loans not exceeding the sum of (1) $140.0 million plus (2) additional amounts so long as the Consolidated Secured Net Leverage Ratio (as defined in the credit agreement governing the term loan facility) for PFGC does not exceed 5.90:1.00 and so long as the proceeds are not used to finance restricted payments that include any dividend or distribution payments. PFGC is required to repay an aggregate principal amount equal to 0.25% of the aggregate
61
Table of Contents
principal amount of $750.0 million on the last business day of each calendar quarter, beginning September 30, 2013. The term loan facility is prepayable at a redemption price of 102% if such prepayment occurs prior to the first anniversary of the closing date (through May 14, 2014) declining to par in 1% annual increments thereafter. As of June 28, 2014, aggregate borrowings outstanding were $744.4 million with unamortized original issue discount of $3.1 million. Original issue discount is being amortized as additional interest expense on a straight-lined basis over the life of the term loan facility. For fiscal 2014 and fiscal 2013, interest expense included $0.6 million and $0.1 million, respectively, related to the amortization of original issue discount.
As of June 28, 2014, we were in compliance with all of the covenants under the term loan facility and the ABL facility.
Unsecured Subordinated Promissory Note. In connection with an acquisition, Performance Food Group, Inc. issued a $6.0 million interest only, unsecured subordinated promissory note on December 21, 2012, bearing an interest rate of 3.5%. Interest is payable quarterly in arrears. The $6.0 million principal is due in a lump sum in December 2017. All amounts outstanding under this promissory note become immediately due and payable upon the occurrence of a change in control, which includes the sale, lease, or transfer of all or substantially all of the assets of PFGC and its subsidiaries. This promissory note was initially recorded at its fair value of $4.2 million. The difference between the principal and the initial fair value of the promissory note is being amortized as additional interest expense on a straight-lined basis over the life of the promissory note. For fiscal 2014 and fiscal 2013, interest expense included $0.3 million and $0.2 million, respectively, related to this amortization. As of June 28, 2014, the carrying value of the promissory note was $4.7 million.
Senior Notes. On May 14, 2013, PFGC redeemed its outstanding $500.0 million of senior notes in full, at a redemption price equal to 102% of the principal amount of the senior notes, using the proceeds from the term loan facility discussed above. A portion of this redemption was considered an extinguishment of indebtedness, resulting in a $2.0 million loss on extinguishment of debt, which is comprised of $1.0 million of redemption premium paid and $1.0 million to write off the pro-rata portion of the unamortized issuance costs related to the debt extinguishment recorded in the fourth quarter of fiscal 2013. The remaining portion of this redemption was considered a modification of indebtedness in accordance with FASB ASC 470-50, Debt-Modifications and Extinguishments, and as a result, $6.9 million of unamortized issuance costs for the senior notes and $9.0 million of the redemption premium are deferred as issuance costs of the term loan facility.
Contractual Cash Obligations
The following table sets forth our significant contractual cash obligations as of June 28, 2014. The years below represent our fiscal years.
| (Dollars in thousands) |
Payments Due by Period | |||||||||||||||||||
| Total | < 1 Year | 1-3 Years | 3-5 Years | More than 5 Years |
||||||||||||||||
| Long-term debt |
$ | 1,430,000 | $ | 7,500 | $ | 696,500 | $ | 21,000 | $ | 705,000 | ||||||||||
| Capital lease obligations(1) |
58,393 | 5,596 | 8,772 | 7,737 | 36,288 | |||||||||||||||
| Unrecognized tax benefits and interest(2) |
742 | — | — | — | — | |||||||||||||||
| Interest payments related to long-term debt(3) |
310,239 | 65,054 | 137,912 | 90,275 | 16,998 | |||||||||||||||
| Long-term operating leases |
411,622 | 78,770 | 137,165 | 102,607 | 93,080 | |||||||||||||||
| Purchase obligations(4) |
9,528 | 7,278 | 1,500 | 750 | — | |||||||||||||||
| Multiemployer pension plan(5) |
3,680 | 3,680 | — | — | — | |||||||||||||||
|
|
|
|
|
|
|
|
|
|
|
|||||||||||
| Total contractual cash obligations |
$ | 2,224,204 | $ | 167,878 | $ | 981,849 | $ | 222,369 | $ | 851,366 | ||||||||||
|
|
|
|
|
|
|
|
|
|
|
|||||||||||
| (1) | The amounts reflected in the table include the interest component of the lease payments. |
| (2) | Unrecognized tax benefits relate to uncertain tax positions recorded under accounting standards related to uncertain tax positions. As of June 28, 2014, we had a liability of $0.7 million for unrecognized tax benefits for all tax jurisdictions and less than $0.1 million for related interest that could result in cash payments. We |
62
Table of Contents
| are not able to reasonably estimate the timing of payments of the amount by which the liability will increase or decrease over time. Accordingly, the related balances have not been reflected in “Payments Due by Period” section of the table. |
| (3) | Includes payments on our floating rate debt based on rates as of June 28, 2014, assuming the amount remains unchanged until maturity. The impact of our outstanding floating-to-fixed interest rate swap on the floating rate debt interest payments is included as well based on the floating rates in effect as of June 28, 2014. |
| (4) | For purposes of this table, purchase obligations include agreements for purchases of non-inventory products or services in the normal course of business, for which all significant terms have been confirmed. The amounts included above are based on estimates. Purchase obligations also include amounts committed to various capital projects in process or scheduled to be completed in the coming year, as well a minimum amounts due for various Company meetings and conferences. |
| (5) | Represents the voluntary withdrawal liability recorded related to the withdrawal from the Central States Southeast and Southwest Areas Pension Fund (“Central States Pension Fund”) and excludes normal contributions required under our collective bargaining agreements. We have no final agreement with the Central States Pension Fund regarding our withdrawal liability and, as such, the amount of our withdrawal liability could differ from the amount recorded. See Note 15 to our audited consolidated financial statements included elsewhere in this prospectus for further discussion. |
Total Assets by Segment
Total assets by segment discussed below exclude intercompany receivables between segments.
Total assets for Performance Foodservice increased $72.2 million from $1,781.4 million as of June 29, 2013 to $1,853.6 million as of June 28, 2014. This segment increased its accounts receivable, inventory, and property, plant, and equipment during this time period, which was partially offset by a decline in goodwill and intangible assets.
Total assets for PFG Customized increased $68.5 million from $572.5 million at June 29, 2013 to $641.0 million at June 28, 2014. This segment increased its accounts receivable, inventory, and property, plant, and equipment during fiscal 2014, which was partially offset by declines in intangible assets.
Total assets for Vistar increased $45.2 million from $456.1 million as of June 29, 2013 to $501.3 million as of June 28, 2014. This segment increased its accounts receivable, inventory, and property, plant, and equipment during this time period, which was partially offset by a decline in intangible assets.
Quantitative and Qualitative Disclosures about Market Risk
We are exposed to interest rate risk related to changes in interest rates for borrowings under our ABL and term loan facilities. Although we hedge a portion of our interest rate risk through interest rate swaps, any borrowings under our credit facilities in excess of the notional amount of the swaps will be subject to floating interest rates.
As of June 28, 2014, our subsidiary, Performance Food Group, Inc., had five interest rate swaps with a combined value of $750 million notional amount that were designated as cash flow hedges of interest rate risk. See Note 9 to our audited consolidated financial statements included elsewhere in this prospectus.
Performance Food Group, Inc. enters into costless collar arrangements to hedge its exposure to variability in cash flows expected to be paid for forecasted purchases of diesel fuel. As of June 28, 2014, Performance Food Group, Inc. was a party to four such arrangements, with a combined 7.2 million gallon notional amount, to hedge its exposure to variability in cash flows expected to be paid for forecasted purchases of diesel fuel. See Note 9 to our audited consolidated financial statements included elsewhere in this prospectus.
63
Table of Contents
Critical Accounting Policies and Estimates
Critical accounting policies and estimates are those that are most important to portraying our financial position and results of operations. These policies require our most subjective or complex judgments, often employing the use of estimates about the effect of matters that are inherently uncertain. Our most critical accounting policies and estimates include those that pertain to the allowance for doubtful accounts receivable, inventory valuation, insurance programs, income taxes, vendor rebates and promotional incentives, and goodwill and other intangible assets.
Accounts Receivable
Accounts receivable are primarily comprised of trade receivables from customers in the ordinary course of business, are recorded at the invoiced amount, and primarily do not bear interest. Receivables are recorded net of the allowance for doubtful accounts on the accompanying consolidated balance sheets. We evaluate the collectability of our accounts receivable based on a combination of factors. We regularly analyze our significant customer accounts, and when we become aware of a specific customer’s inability to meet its financial obligations to us, such as a bankruptcy filing or a deterioration in the customer’s operating results or financial position, we record a specific reserve for bad debt to reduce the related receivable to the amount we reasonably believe is collectible. We also record reserves for bad debt for other customers based on a variety of factors, including the length of time the receivables are past due, macroeconomic considerations, and historical experience. If circumstances related to specific customers change, our estimates of the recoverability of receivables could be further adjusted.
Inventory Valuation
Our inventories consist primarily of food and non-food products. We primarily value inventories at the lower of cost or market using the first-in, first-out (“FIFO”) method. FIFO was used for approximately 93% of total inventories at June 28, 2014. The remainder of the inventory was valued using the last-in, first-out (“LIFO”) method using the link chain technique of the dollar value method. We adjust our inventory balances for slow-moving, excess, and obsolete inventories. These adjustments are based upon inventory category, inventory age, specifically identified items, and overall economic conditions.
Insurance Programs
We maintain high-deductible insurance programs covering portions of general and vehicle liability and workers’ compensation. The amounts in excess of the deductibles are insured by third-party insurance carriers, subject to certain limitations and exclusions. We also maintain self-funded group medical insurance. We accrue our estimated liability for these deductibles, including an estimate for incurred but not reported claims, based on known claims and past claims history. The estimated short-term portion of these accruals is included in Accrued expenses on our consolidated balance sheets, while the estimated long-term portion of the accruals is included in Other long-term liabilities. The provisions for insurance claims include estimates of the frequency and timing of claims occurrence, as well as the ultimate amounts to be paid. These insurance programs are managed by a third party, and the deductibles for general and vehicle liability and workers compensation are collateralized by letters of credit and restricted cash.
Income Taxes
We follow FASB ASC 740-10, Income Taxes—Overall, which requires the use of the asset and liability method of accounting for deferred income taxes. Deferred tax assets and liabilities are recognized for the expected future tax consequences of temporary differences between the tax bases of assets and liabilities and their reported amounts. Future tax benefits, including net operating loss carry-forwards, are recognized to the extent that realization of such benefits is more likely than not. Uncertain tax positions are reviewed on an
64
Table of Contents
ongoing basis and are adjusted in light of changing facts and circumstances, including progress of tax audits, developments in case law, and closing of statutes of limitations. Such adjustments are reflected in the tax provision as appropriate.
Vendor Rebates and Other Promotional Incentives
We participate in various rebate and promotional incentives with our suppliers, primarily including volume and growth rebates, annual and multi-year incentives, and promotional programs. Consideration received under these incentives is generally recorded as a reduction of cost of goods sold. However, in certain limited circumstances the consideration is recorded as a reduction of costs incurred by us. Consideration received may be in the form of cash and/or invoice deductions. Changes in the estimated amount of incentives to be received are treated as changes in estimates and are recognized in the period of change.
Consideration received for volume and growth rebates, annual incentives, and multi-year incentives are recorded as a reduction of cost of goods sold. We systematically and rationally allocate the consideration for these incentives to each of the underlying transactions that results in progress by the Company toward earning the incentives. If the incentives are not probable and reasonably estimable, we record the incentives as the underlying objectives or milestones are achieved. We record annual and multi-year incentives when earned, generally over the agreement period. We use current and historical purchasing data, forecasted purchasing volumes, and other factors in estimating whether the underlying objectives or milestones will be achieved. Consideration received to promote and sell the supplier’s products is typically a reimbursement of marketing costs incurred by the Company and is recorded as a reduction of our operating expenses. If the amount of consideration received from the suppliers exceeds our marketing costs, any excess is recorded as a reduction of cost of goods sold. We follow the requirements of FASB ASC 605-50-25-10, Revenue Recognition—Customer Payments and Incentives—Recognition—Customer’s Accounting for Certain Consideration Received from a Vendor and ASC 605-50-45-16, Revenue Recognition—Customer Payments and Incentives—Other Presentation Matters—Reseller’s Characterization of Sales Incentives Offered to Customers by Manufacturers.
Acquisitions, Goodwill, and Other Intangible Assets
We account for acquired businesses using the acquisition method of accounting. Our financial statements reflect the operations of an acquired business starting from the completion of the acquisition. Goodwill and other intangible assets represent the excess of cost of an acquired entity over the amounts specifically assigned to those tangible net assets acquired in a business combination. Other identifiable intangible assets typically include customer relationships, trade names, technology, non-compete agreements, and favorable lease assets. Goodwill and intangibles with indefinite lives are not amortized. Intangibles with definite lives are amortized on a straight-line basis over their useful lives, which generally range from two to eleven years. Certain assumptions, estimates, and judgments are used in determining the fair value of net assets acquired, including goodwill and other intangible assets, as well as determining the allocation of goodwill to the reporting units. Accordingly, we may obtain the assistance of third-party valuation specialists for significant tangible and intangible assets. The fair value estimates are based on available historical information and on future expectations and assumptions deemed reasonable by management, but are inherently uncertain. Significant estimates and assumptions inherent in the valuations reflect a consideration of other marketplace participants and include the amount and timing of future cash flows (including expected growth rates and profitability), economic barriers to entry, a brand’s relative market position, and the discount rate applied to the cash flows. Unanticipated market or macroeconomic events and circumstances may occur, which could affect the accuracy or validity of the estimates and assumptions.
We are required to test goodwill and other intangible assets with indefinite lives for impairment annually or more often if circumstances indicate. Indicators of goodwill impairment include, but are not limited to, significant declines in the markets and industries that buy our products, changes in the estimated future cash flows of its reporting units, changes in capital markets, and changes in its market capitalization.
65
Table of Contents
In fiscal 2013, we adopted FASB Accounting Standards Update (ASU) 2011-08 “Intangibles—Goodwill and Other—Testing Goodwill for Impairment,” which provides entities with an option to perform a qualitative assessment (commonly referred to as “step zero”) to determine whether further quantitative analysis for impairment of goodwill is necessary. In performing step zero for our goodwill impairment test, we are required to make assumptions and judgments, including but not limited to the following: the evaluation of macroeconomic conditions as related to our business, industry and market trends, and the overall future financial performance of our reporting units and future opportunities in the markets in which they operate. If impairment indicators are present after performing step zero, we would perform a quantitative impairment analysis to estimate the fair value of goodwill.
During fiscal 2013, we bypassed the step zero assessment for all reporting units and performed the first step of the two-step goodwill impairment test. During fiscal 2014, we performed the step zero analysis for our goodwill impairment test. As a result of our step zero analysis, no further quantitative impairment test was deemed necessary for fiscal 2014. There were no impairments of goodwill or intangible assets with indefinite lives for the fiscal 2014 and fiscal 2013.
66
Table of Contents
We distribute to the food-away-from-home industry, a large industry with attractive underlying growth trends. According to the U.S. Department of Commerce, consumer spending on food-away-from-home in the United States totaled $611 billion in 2013, making it one of the largest industries in the country. The industry grew from $331 billion in sales in 1999 to $611 billion in sales in 2013, representing a compound annual growth rate of approximately 4.5%. Macroeconomic drivers of growth include increases in U.S. gross domestic product, employment levels, and personal consumption expenditures. Microeconomic drivers include increases in the number of restaurants, a continued shift toward value-added products and desire for convenience, smaller sized households, an aging population that spends more per capita at food-away-from-home establishments, and a rebound in the number of dual income households.
We operate in the U.S. foodservice distribution industry, which supplies the food-away-from-home industry and which totaled $231 billion in sales in 2013 according to Technomic. The U.S. foodservice distribution industry consists of four categories of distributors:
| • | Broadline distributors carry a “broad line” of products to serve the needs of many different types of food-away-from-home establishments; |
| • | System distributors carry products that are typically specified by large national and regional chains; |
| • | Specialized distributors carry a variety of products within specific categories, such as produce, meats, or seafood, or they focus on particular customer types, such as schools, vending operations, or fine dining; and |
| • | Cash-and-carry centers where customers come to pick-up their orders. |
We are distinguished from most of our competitors by operating in each of the four categories of distributors mentioned above.
Broadline distribution is the largest segment in the U.S. foodservice distribution industry. According to Technomic, the “Power Distributors,” which they define as the 21 companies with annual sales greater than $250 million, grew sales by 6% from 2012 to 2013, or approximately twice the growth rate for the overall foodservice distribution industry, which we believe is representative of the benefits of scale.
We benefit from being one of the leading companies in the U.S. foodservice distribution industry and had an estimated 5.8% industry share during calendar 2013. We believe that our current industry share, the large size of the U.S. foodservice distribution industry, and our track record of growing industry share provide us a significant opportunity for continued sales growth.
67
Table of Contents
We are the third largest player in the growing $231 billion U.S. foodservice distribution industry, which supplies the diverse $611 billion U.S. “food-away-from-home” industry. We market and distribute approximately 150,000 food and food-related products from 67 distribution centers to over 150,000 customer locations across the United States. We serve a diverse mix of customers, from independent and chain restaurants to schools, business and industry locations, hospitals, vending distributors, office coffee service distributors, big box retailers, and theaters. We source our products from over 5,000 suppliers and serve as an important partner to our suppliers by providing them access to our broad customer base. In addition to the products we offer to our customers, we provide value-added services by allowing our customers to benefit from our industry knowledge, scale, and expertise in the areas of product selection and procurement, menu development, and operational strategy. Our more than 11,000 employees work across three segments: Performance Foodservice, PFG Customized, and Vistar.
We plan to continue executing the strategies that have successfully delivered net sales, industry share, and profit growth. In the fiscal year ended June 28, 2014, we generated $13.7 billion in net sales and $286.1 million in Adjusted EBITDA, representing compound annual growth rates of 8% and 10%, respectively, since fiscal 2010. In calendar year 2013 we had an estimated industry share of 5.8% and our sales growth rate since calendar year 2010 is approximately three times the growth rate of the foodservice distribution industry in that same time frame. We believe that our current industry share, the large size of the U.S. foodservice distribution industry, and our track record of growing industry share provide us a significant opportunity for continued sales growth. See “—Summary Historical Consolidated Financial Data” for our definition of “Adjusted EBITDA” and a reconciliation of Adjusted EBITDA to net income, which we believe is the most directly comparable financial measure calculated in accordance with GAAP.
We attribute our sales growth primarily to our customer-centric business model. For us, that means understanding our customers’ business operations and economics so that we can help them be successful; placing our decision-making on how best to serve customers at the local level; and partnering with our suppliers to develop our high quality proprietary brands, which are a key driver for us in winning, retaining, and developing customers. We believe that our customer-centric business model differentiates us from our competitors who make customer-facing decisions outside of the local market and also from competitors who often do not have the scale to develop proprietary brands, provide value-added services, and distribute as effectively as we do.
Since fiscal 2010, our profit growth has outpaced our sales growth as a result of shifting towards a more profitable mix of products and customers, capturing operating efficiencies from our sales growth, and delivering productivity initiatives. Our mix shift is primarily attributable to increased sales of our proprietary brands and sales to independent restaurants, which represent our highest margin products and customers, respectively. In addition, we recently established a new set of productivity initiatives in the areas of procurement and operations called Winning Together, which we believe will continue to drive our profit growth.
68
Table of Contents
Our Segments
We believe that we are well positioned to serve our customers from our three business segments, which are distinguished by their diverse distribution models, the inventory they carry, and the customers they serve: Performance Foodservice, PFG Customized, and Vistar.
Performance Food Group: Fiscal 2014
| Net sales mix by operating segment
|
Key statistics | |||
|
|
Net sales |
$13.7 billion | ||
| Adjusted EBITDA |
$286.1 million | |||
| Distribution Centers |
67 | |||
| Customer Locations |
150,000+ | |||
| Products |
150,000+ | |||
| Suppliers |
5,000+ | |||
| Vehicles |
2,500+ | |||
| Employees
|
11,000+
| |||
Performance Foodservice. Performance Foodservice is a leading U.S. foodservice distributor with substantial scale along the Eastern Seaboard and in the Southeast. Performance Foodservice operates a network of 24 broadline distribution centers, which supply a “broad line” of products, and 10 Roma distribution centers, which specialize in supplying independent pizzerias and other Italian-themed restaurants. Each of these distribution centers, which we refer to as operating companies or “OpCos,” is run by a business team who understands the local markets and the needs of its particular customers and who is empowered to make decisions on how best to serve them. For fiscal 2014, Performance Foodservice generated $8.1 billion in net sales, over three quarters of which was to restaurants. This segment serves over 85,000 customer locations with over 125,000 food and food-related products.
We offer our customers a broad product assortment that ranges from “center-of-the-plate” items (such as beef, pork, poultry, and seafood), frozen foods, refrigerated products, and dry groceries to disposables, cleaning and kitchen supplies, and related products used by our customers. In addition to the products we offer, we provide value-added services by enabling our customers to benefit from our industry knowledge, scale, and expertise in the areas of product selection and procurement, menu development, and operational strategy.
We classify our customers under two major categories: “Street” and multi-unit “Chain.” Street customers predominantly consist of independent restaurants. Chain customers are multi-unit restaurants with five or more locations, which include fine dining, family and casual dining, fast casual, and quick serve restaurants, as well as hotels, healthcare facilities, and other multi-unit institutional customers. Street customers utilize more of our value-added services, particularly in the areas of product selection and procurement, market trends, menu development, and operational strategy. Street customer purchases typically generate greater gross profit per case compared to sales to Chain customers. Sales to Street customers in fiscal 2014 accounted for 43% of Performance Foodservice sales compared to 37% in fiscal 2010.
Our products consist of our proprietary-branded products, or “Performance Brands,” as well as nationally-branded products and products bearing our customers’ brands. Our Performance Brands typically generate higher gross profit per case than other brands. In fiscal 2014, Performance Brands accounted for 39% of the case volume sold to Street customers, up from 37% in fiscal 2010.
69
Table of Contents
Performance Foodservice net sales for fiscal 2014 and fiscal 2013 were $8.1 billion and $7.5 billion, respectively, representing year-over-year growth of 8.0%. Performance Foodservice segment EBITDA for the same time period was $207.5 million and $173.9 million, representing year-over-year growth of 19.3%.
| Performance Foodservice: Fiscal 2014 Net Sales | ||
|
|
|
PFG Customized. PFG Customized is a leading national distributor to the family and casual dining channel. We serve over 5,000 customer locations across the United States from nine distribution centers that provide tailored supply chain solutions to our customers. Our network of distribution centers was developed around our customers and is strategically positioned to provide an efficient supply chain across both inbound and outbound logistics. PFG Customized’s product offerings are determined by each of our customers’ specific menu requirements. We also provide customers with value-added services, such as expertise in fresh product distribution, logistics management, procurement management, and information system interfaces, which enable our customers to run their businesses efficiently.
We serve many of the most recognizable family and casual dining restaurant chains, including Bonefish Grill, Carrabba’s Italian Grill, Cracker Barrel, Joe’s Crab Shack, Logan’s Roadhouse, Max and Erma’s, Macaroni Grill, O’Charley’s, Outback Steakhouse, Ruby Tuesday, and TGI Friday’s. PFG Customized’s five largest family and casual dining customers have been with us for an average of more than 15 years. Cracker Barrel was PFG Customized’s first customer and grew from a substantial regional account served by Performance Foodservice to an account whose needs are best served by customized distribution. PFG Customized recently began to utilize its distribution platform to serve fast casual chains such as Fuzzy’s Taco Shop, PDQ, and Zaxby’s, as well quick serve chains including Church’s Chicken, Wendy’s, and Yum! Brands.
PFG Customized net sales for fiscal 2014 and fiscal 2013 were $3.3 billion and $3.2 billion, respectively, representing year-over-year growth of 4.3%. PFG Customized segment EBITDA for the same time period was $37.5 million and $37.3 million, representing year-over-year growth of 0.5%.
70
Table of Contents
| PFG Customized: Fiscal 2014 Net Sales | ||
|
|
|
Vistar. Vistar is a leading national distributor of candy, snacks, and beverages to vending and office coffee service distributors, big box retailers, and theaters. The segment provides national distribution of approximately 20,000 different SKUs of candy, snacks, beverages, and other items to approximately 60,000 customer locations from our network of 24 Vistar OpCos and 11 Merchant’s Marts locations. Merchant’s Marts are cash-and-carry operators where customers generally pick up orders rather than having them delivered. Vistar’s scale in these channels enhances our ability to procure a broad variety of products for our customers. Vistar OpCos deliver to vending and office coffee service distributors and directly to most theaters and some other locations. The distribution model also includes a “pick and pack” capability, which utilizes third-party carriers and Vistar’s SKU variety to sell to customers whose order sizes are too small to be served effectively by our distribution network. We believe these capabilities, in conjunction with the breadth of our inventory, are differentiating and allow us to serve many distinct customer types. Vistar has successfully built upon our national platform to broaden the channels we serve to include hospitality venues, concessionaires, airport gift shops, college book stores, corrections facilities, and impulse locations in big box retailers such as Lowe’s, Home Depot, Dollar Tree, Staples, and others.
Vistar net sales for fiscal 2014 and fiscal 2013 were $2.3 billion and $2.1 billion, respectively, representing year-over-year growth of 6.0%. Vistar segment EBITDA for the same time period was $88.3 million and $81.4 million, respectively, representing year-over-year growth of 8.5%.
| Vistar: Fiscal 2014 Net Sales | ||
|
|
|
71
Table of Contents
Our Strengths
Leading Market Positions
We believe that our leading market positions within each of our business segments allow us to compete effectively in attracting new customers, to attract and retain industry talent, and to drive our growth as we execute our business strategy. We have a diverse business model that operates in three segments, allowing us to capitalize on the growth in food-away-from-home consumption. We believe our leading market positions are exhibited in the following way:
| • | Performance Foodservice. We are the third largest broadline distributor in the United States after Sysco and US Foods. We have significant scale in markets along the Eastern Seaboard and in the Southeast. Within Performance Foodservice, we believe that our Roma products make us the leading distributor to independent pizzerias in the United States. |
| • | PFG Customized. PFG Customized is a leading national distributor to family and casual dining restaurants, and we believe benefits from longstanding relationships with our customers, strong customer loyalty, and a network that is optimized to serve our customer base efficiently. |
| • | Vistar. Vistar is a leading national distributor of candy, snacks, and beverages to vending and office coffee service distributors, big box retailers, and theater customers, whom we believe benefit from substantial product variety sold at competitive prices. |
Scale Distribution Platforms
We believe we have a competitive advantage over smaller regional and local broadline distributors through economies of scale in purchasing and procurement, which allow us to offer a broad variety of products (including our proprietary Performance Brands) at competitive prices to our customers. Our customers benefit from our ability to provide them with extensive geographic coverage as they continue to grow. We believe we also benefit from supply chain efficiency, including a growing inbound logistics backhaul network that uses our collective distribution network to deliver inbound products across business segments; best practices in warehousing, transportation, and risk management; the ability to benefit from the scale of our purchases of items not for resale, such as trucks, construction materials, insurance, banking relationships, healthcare, and material handling equipment; and the ability to optimize our networks so that customers are served from the most efficient OpCo, which minimizes the cost of delivery. We believe these efficiencies and economies of scale will lead to continued improvements in our operating margins when combined with incremental fixed-cost advantage.
Customer-Centric Business Model
Our customer-centric business model is based on understanding our customers’ business operations and economics so that we can help them be successful, partnering with our suppliers to develop high quality proprietary brands specifically tailored to our customers’ needs, and placing our decision making on how best to serve customers at the local level so that we remain nimble at the point of transaction. The model embodies how we organize the Company, how our business processes work, and how we design our information systems. Over 11,000 PFG employees share our mission to grow sales by providing excellent service that is locally tailored to each customer. Approximately 4,500 of our employees interact with customers daily, either in sales or in making deliveries. Our sales associates receive extensive and ongoing product training and earn incentives primarily based on how effectively they grow our business with customers. Our customer-facing employees are supported by hundreds of employees who develop, source, and market over 150,000 food and related products from over 5,000 suppliers and by several thousand warehouse workers focused on filling customer orders accurately, efficiently, and in a timely manner. We believe that our customer-centric business model differentiates us from our competitors who make customer-facing decisions outside the local market and also from competitors who often do not have the scale to develop proprietary brands, provide value-added services, and distribute as effectively as we do.
72
Table of Contents
Our customer-centric business model spans all of our business units. The model embodies how we organize the company, how our business processes work, and how we design our information systems. Our organizational structure decentralizes customer-facing decisions to the OpCo level, where empowered managers are responsible for an extensive range of customer-facing tasks, ranging from designing delivery routes to determining which SKU variety best satisfies local consumer tastes and specific customer needs. We believe our information systems enhance our ability to serve customers with a best-in-class order management system and other information tools for employees and customers.
Proven Ability to Increase Sales to Street Customers and Market our Proprietary Brands
We maintain a strong focus on growing sales to Street customers (our highest profit margin customers), growing sales of Performance Brands (our highest profit margin products), and attracting, retaining, and developing a more effective Street sales force. We believe that offering our Performance Brands enhances customer loyalty and attracts new customers, particularly Street customers. These Performance Brands include exclusive products offered across a wide variety of approximately 10,000 SKUs, which are developed in partnership with our suppliers and customers in order to satisfy the specific needs of our customer base.
Since fiscal 2010, we have grown the number of Street customers, case sales to Street customers, and case sales of Performance Brands to Street customers at compound annual growth rates of over 8%, 11%, and 12%, respectively. In fiscal 2014, Performance Brands accounted for 39% of the case volume sold to Street customers, up from 37% in fiscal 2010.
Disciplined and Proven Acquirer
We have made 12 acquisitions over the past six years, beginning with the merger of PFG and Vistar in 2008, when management integrated the two companies with significant synergies. Acquisitions have typically been completed at attractive valuation multiples and have been accretive to our Adjusted EBITDA margins on both a pre- and post-synergy basis.
In recent years, we have made four acquisitions in our Performance Foodservice business, which expanded our footprint in North and South Carolina, Kentucky, Illinois, and northern coastal California. Synergies from these acquisitions typically include introducing Performance Brands to the customers of the acquired company, reducing network mileage, implementing operational best practices, and achieving cost savings, such as expenses associated with insurance and benefit programs.
In our Vistar segment, we entered the hotel pantry business through an acquisition, which we are using as a platform to expand further into the hospitality channel. Vistar also used an acquisition to better develop our small drop fulfillment technology to serve big box retailers with candy, snacks, beverages, and other items, a capability that we believe has application in other channels.
Experienced and Invested Management Team
Our senior management team has extensive experience and proven success in the foodservice industry. With over 250 years of combined experience (over 20 years on average for the executive leadership team), we believe that our senior management team’s experience in all parts of the industry has enabled us to grow and diversify our business while improving operational efficiency. Members of management have previous experience at other leading foodservice distributors, including Sysco, US Foods, PYA Monarch, and Alliant Foodservice. Other management team members have experience elsewhere in the food industry, ranging from manufacturers and marketers to retailers and contract feeders. Management has invested over $28 million in the equity of the Company and substantially all of management’s incentive compensation is tied to our financial performance. We believe management’s investment and incentive structure align its interests with those of our stockholders.
73
Table of Contents
Our Strategy
We intend to continue to expand our industry share and to grow sales and profits by executing on the following key elements of our strategy.
Continue to Grow Street and Performance Brand Sales
We believe that there is a significant and ongoing opportunity to grow sales to Street customers (our highest profit margin customers) and to expand sales of our Performance Brands (our highest profit margin products). We believe that providing customers with proprietary distributor brands such as Performance Brands has been a key driver for us in winning, retaining, and developing customers, especially Street customers. In addition, we believe that our ability to build and retain an increasingly effective sales force has complemented these results. Street business momentum facilitates further development of our Performance Brand portfolio, which in turn enables us to win and develop more Street customers. Smaller regional competitors often do not have the scale to develop their own distinctive brands, and we believe this is a key reason why our Performance Foodservice segment has increased its sales to Street customers. By continuing to focus on increasing sales to our Street customers and sales of our Performance Brands, we believe that we can continue to drive profitable growth.
Continue to Grow our Customers and Channels
We intend to increase penetration within our existing channels, enter new channels, and continue to win new customers in all three business segments by using our scale, operational excellence, geographic presence, and customer-centric business model.
| • | Performance Foodservice. In addition to our success in growing our Street business, we believe significant opportunity remains to expand our customer base. For example, in the past two years we have won the fast-growing distribution business of Chuy’s, Flying Foods, Habit Burger, and Taco Cabana. We believe significant opportunity remains to continue expanding our customer base through new multi-unit restaurant chains and other channels such as schools, hospitals, and commercial locations. |
| • | PFG Customized. We intend to continue to grow our traditional customer base and to expand sales to new customer channels. For example, we have successfully won customers such as Macaroni Grill and Max and Erma’s in our traditional family and casual dining business. We have recently expanded our customer base to include select fast casual customers including Fuzzy’s Taco Shop and PDQ and quick serve customers including Wendy’s and Yum! Brands. |
| • | Vistar. We have utilized Vistar’s combination of inventory variety, distribution methods, and national scale to diversify our channel mix. This has enabled Vistar to serve new customers and channels including concessionaires (such as Minor League Baseball), corrections facilities, college bookstores, and hospitality, among others. Additionally, Vistar continues to grow within vending and office coffee service distribution, big box retailers, and theaters. |
Expand Margins through Continuous Productivity Improvements
We are committed to expanding margins through operating efficiencies and specific productivity programs, which will complement the effect of selling a more profitable mix of customers and brands. We recently established a program called Winning Together, which complements our sales growth with ongoing initiatives that take advantage of our scale and drive productivity in non-customer facing areas. Winning Together is led by teams whose primary responsibility is to improve our business processes, capture best practices, and maintain a continuous improvement culture in our procurement and operations functions.
The two key components of Winning Together are Winning Together Through Procurement and Winning Together Through Operations. Winning Together Through Procurement uses structured negotiations with
74
Table of Contents
selected national, regional, and local suppliers to develop the mutual profitability of the relationship and to encourage suppliers to invest in our growth. Winning Together Through Operations seeks to accelerate efficiencies in our warehouses and our inbound and outbound logistics functions. This program leverages best practices and scale, implements new productivity software, and establishes a model OpCo as a proving ground for new technologies and business processes.
We have begun to recognize some of the cost-saving benefits of the Winning Together program and believe that we will see larger benefits in this and later fiscal years.
Continue to Pursue Opportunistic Acquisitions
We have a strong track record of sourcing, executing, and integrating accretive acquisitions. We intend to continue pursuing selective acquisitions in order to further our competitive position in the industry and to allow us both to enter into new geographies and channels as well as to expand in existing ones.
Over the past six years, we have made 12 acquisitions, including acquiring five broadline locations in Kentucky, North and South Carolina, Illinois, and northern coastal California. These acquisitions have expanded our broadline geographic reach, and we believe further meaningful opportunities exist that would enable us to reach additional customers. In Vistar, our acquisition focus remains on companies in adjacent channels that can benefit from the strength of our inventory and delivery method variety or that can add capabilities or technologies to our portfolio. We believe that there are a number of attractive potential acquisition opportunities in our industry.
Customers and Marketing
We serve different types of customers through each of our three business segments. Our Performance Foodservice segment serves two types of customers—Street customers and Chain customers. Our PFG Customized segment distributes to Chain customers, including family and casual dining, fast casual, and quick serve restaurants. Our Vistar segment distributes to vending and office coffee service distributors, big box retailers, and theaters, among others. We believe that customers select a distributor based on breadth of product offerings, consistent product quality, timely and accurate delivery of orders, value-added services, and price. In addition, we believe that some of our larger Street and Chain customers gain operational efficiencies by dealing with a limited number of foodservice distributors. No single customer accounted for more than 10% of our total net sales for the fiscal 2014.
Street Customers. Our Performance Foodservice segment serves our Street customers, which predominantly include independent restaurants, along with hotels, cafeterias, schools, healthcare facilities, and other institutional customers. We seek to increase the mix of our total sales to Street customers because they typically generate higher gross profit per case that more than offsets the generally higher supply chain costs that we incur in serving these customers. Street customers use more value-added services, particularly in the areas of product selection and procurement, market trends, menu development, and operational strategy. In addition, Street customers also use more of our Performance Brands, which are our highest margin products. Our Performance Foodservice segment supports sales to Street customers with a team of sales and marketing representatives, customer service representatives, and product specialists. Our sales representatives serve customers in person, by telephone, and through the internet, accepting and processing orders, reviewing inventory and account balances, disseminating new product information, and providing business assistance and advice where appropriate. These representatives typically use laptop computers to assist customers by entering orders, checking product availability, and pricing and developing menu-planning ideas on a real-time basis.
Chain Customers. Both our Performance Foodservice and PFG Customized segments serve Chain customers. Chain customers are multi-unit restaurants with five or more locations and include fine dining, family
75
Table of Contents
and casual dining, fast casual, and quick serve restaurants, as well as hotels, healthcare facilities, and other multi-unit institutional customers. Our Performance Foodservice segment Chain customers include various locations of Anthony’s Coal Fired Pizza, Chuy’s, Pollo Tropical, Subway, Zaxby’s, and many others. Our PFG Customized segment customers include many of the most recognizable family and casual dining restaurant chains including Bonefish Grill, Carrabba’s Italian Grill, Cracker Barrel, Joe’s Crab Shack, Logan’s Roadhouse, Macaroni Grill, Max and Erma’s, O’Charley’s, Outback Steakhouse, Ruby Tuesday, and TGI Friday’s. PFG Customized recently began to leverage its distribution platform to serve fast casual chains such as Fuzzy’s Taco Shop, PDQ, and Zaxby’s, as well as quick serve chains including Church’s Chicken, Wendy’s, and Yum! Brands. Sales to Chain customers are typically lower gross margin, but have larger deliveries than those to Street customers. Dedicated account representatives are responsible for managing the overall Chain customer relationship, including ensuring complete order fulfillment and customer satisfaction. Members of senior management assist in identifying potential new Chain customers and managing long-term account relationships.
Vistar Customers. Our Vistar segment distributes candy, snacks, beverages, and other products to a number of distinct channels. Vending operators are the largest Vistar channel. We distribute a broad selection of vending machine products to the operators’ depots, from which they distribute products and stock machines. We are a leading distributor of these products to theater chains, and Vistar’s customers include AMC, Cinemark, Galaxy Theaters, Regal Cinemas, and others. We typically deliver our orders directly to individual theater locations. We are a leading distributor to the office coffee service channel. Vistar also distributes to retailers, particularly for candy, snack, and beverage purchases in impulse buying locations. Our customers include retailers such as Dollar Tree, Lowe’s, Home Depot, Staples, and others. Vistar distributes to other channels with a heavy concentration of candy, snacks, and beverage products, including concessionaires, college book stores, hotel and airport gift shops, corrections facilities, and others. The distribution model also includes a “pick and pack” capability, which utilizes third-party carriers and Vistar’s SKU variety to sell to customers whose order sizes are too small to be served effectively by our distribution network. Vistar also operates Merchant’s Marts locations, which are cash-and-carry operators where customers generally pick up orders rather than having them delivered.
Products and Services
We distribute more than 150,000 food and food-related products. These products include a full line of frozen foods, such as meats, fully prepared appetizers and entrees, fruits, vegetables, and desserts; a full line of canned and dry foods; fresh meats; dairy products; beverage products; imported specialties; fresh produce; and candy, snack, and other products. We also supply a wide variety of non-food items including paper products such as pizza boxes, disposable napkins, plates and cups; tableware such as china and silverware; cookware such as pots, pans, and utensils; restaurant and kitchen equipment and supplies; and cleaning supplies. We also provide our customers with value-added services, as described below, in the normal course of providing full-service distribution services.
Performance Brands. We offer our customers an extensive line of proprietary-branded products. We provide umbrella brands for our broadline distribution operation. Ridgecrest provides discerning chefs with the highest levels of quality and consistency. West Creek provides a level of quality, consistency, and value that we believe meets or exceeds national brand offerings. Silver Source provides core products that are value priced while satisfying customers’ specifications. We also have a number of specialty brands, such as Braveheart 100% Black Angus beef, Empire’s Treasure seafood, Brilliance premium shortenings and oils, Heritage Ovens baked goods, Village Garden salad dressings, Guest House premium teas and cocoas, and others. We also have an extensive line of products for use in the pizzeria and Italian restaurant business under the names Piancone, Roma, and Assoluti. We believe that these products are a major source of competitive advantage. We intend to continue to enhance our product offerings based on supplier advice, customer preferences, and data analysis using our data warehouse. Our Performance Brands enable us to offer customers an alternative to comparable national brands across a wide range of products and price points, which we believe also promotes customer loyalty. Our Performance Brands products are manufactured for us according to specifications that have been developed by
76
Table of Contents
our quality assurance team. In addition, our quality assurance team certifies the manufacturing and processing plants where these products are packaged, enforces our quality control standards, and identifies supply sources that satisfy our requirements.
National Brands. We offer our customers a broad selection of national brand products. We believe that these brands are attractive to Chain, Street, and other customers seeking recognized national brands in their operations. We believe that distributing national brands has strengthened our relationships with many national suppliers who provide us with important sales and marketing support. These sales complement sales of our Performance Brand products.
Customer Brands. Some of our Chain customers, particularly those with national distribution, develop exclusive SKU specifications directly with suppliers and brand these SKUs. We purchase these SKUs directly from suppliers and receive them into our distribution centers, where they are mixed with other SKUs and delivered to the Chain customers’ locations.
Value-Added Services. We believe that prompt and accurate delivery of orders, close contact with customers, and the ability to provide a full array of products and services to assist customers in their foodservice operations are of primary importance in foodservice distribution. Our operating companies offer multiple deliveries per week to certain customer locations and have the capability of delivering special orders on short notice. Through our sales and marketing representatives and support staff, we monitor the needs of our customers and acquaint them with new products and services. Our operating companies also provide ancillary services relating to foodservice distribution, such as providing customers with various reports and other data, menu planning advice, food safety training, and assistance in inventory control, as well as access to various third-party services designed to add value to our customers’ businesses.
Suppliers
We purchase from over 5,000 suppliers, none of which accounted for more than 3% of our aggregate purchases in fiscal 2014. Many of our suppliers provide products to all three business segments, while others sell to only one segment. Our supplier base consists principally of large corporations that sell their national brands, our Performance Brands, and sometimes both. We also buy, particularly on a regional basis, from smaller suppliers, particularly those who specialize in produce and other perishable commodities. Many of our suppliers provide sales material and sales call support for the products that they sell us.
77
Table of Contents
Operations and Properties
As of June 28, 2014, we operated 67 distribution centers across our three business segments. Of our 67 facilities, we owned 29 facilities and leased the remaining 38 facilities. Our Performance Foodservice segment operated 34 distribution centers and had an average square footage of over 200,000 square feet per facility. Our PFG Customized segment operated nine distribution centers and had an average square footage of over 200,000 square feet per facility. Our Vistar segment operated 24 distribution centers and had an average square footage of over 110,000 square feet per facility.
| Performance Foodservice | Vistar | PFG Customized |
Total | |||||||||||||||||||||
| State |
Broadline | Roma | Total | |||||||||||||||||||||
| Arizona |
– | 1 | 1 | 2 | – | 3 | ||||||||||||||||||
| Arkansas |
1 | – | 1 | – | – | 1 | ||||||||||||||||||
| California |
1 | 2 | 3 | 2 | 1 | 6 | ||||||||||||||||||
| Colorado |
– | 1 | 1 | 1 | – | 2 | ||||||||||||||||||
| Connecticut |
– | – | – | 1 | – | 1 | ||||||||||||||||||
| Florida |
2 | 1 | 3 | 2 | 1 | 6 | ||||||||||||||||||
| Georgia |
2 | – | 2 | 1 | 1 | 4 | ||||||||||||||||||
| Illinois |
2 | – | 2 | 1 | – | 3 | ||||||||||||||||||
| Indiana |
– | – | – | – | 1 | 1 | ||||||||||||||||||
| Kentucky |
1 | – | 1 | 1 | – | 2 | ||||||||||||||||||
| Louisiana |
1 | – | 1 | – | – | 1 | ||||||||||||||||||
| Maine |
1 | – | 1 | – | – | 1 | ||||||||||||||||||
| Maryland |
1 | – | 1 | – | 1 | 2 | ||||||||||||||||||
| Massachusetts |
1 | – | 1 | – | – | 1 | ||||||||||||||||||
| Michigan |
– | – | – | 1 | – | 1 | ||||||||||||||||||
| Minnesota |
– | 1 | 1 | 1 | – | 2 | ||||||||||||||||||
| Mississippi |
1 | – | 1 | – | – | 1 | ||||||||||||||||||
| Missouri |
1 | 1 | 2 | 1 | – | 3 | ||||||||||||||||||
| New Jersey |
2 | – | 2 | 2 | 1 | 5 | ||||||||||||||||||
| North Carolina |
1 | – | 1 | 1 | – | 2 | ||||||||||||||||||
| Ohio |
– | – | – | 1 | – | 1 | ||||||||||||||||||
| Oregon |
– | 1 | 1 | 1 | – | 2 | ||||||||||||||||||
| Pennsylvania |
– | – | – | 1 | – | 1 | ||||||||||||||||||
| South Carolina |
1 | – | 1 | – | 1 | 2 | ||||||||||||||||||
| Tennessee |
2 | – | 2 | 2 | 1 | 5 | ||||||||||||||||||
| Texas |
2 | 2 | 4 | 2 | 1 | 7 | ||||||||||||||||||
| Virginia |
1 | – | 1 | – | – | 1 | ||||||||||||||||||
|
|
|
|
|
|
|
|
|
|
|
|
|
|||||||||||||
| Total |
24 | 10 | 34 | 24 | 9 | 67 | ||||||||||||||||||
Our Performance Foodservice customers are generally located no more than 200 miles from one of our distribution facilities. Of the 34 Performance Foodservice distribution centers, six have meat cutting operations that provide custom-cut meat products to our customers and one has a seafood processing operation that provides custom-cut and packed seafood to its customers and our other distribution centers. Our PFG Customized customers are generally located no more than 450 miles from one of our distribution facilities. In addition to the 24 distribution centers operated by Vistar, Vistar has 11 cash-and-carry Merchant’s Mart facilities. Customer orders in all three segments are typically assembled in our distribution facilities and then sorted, placed on pallets, and loaded onto trucks and trailers in delivery sequence. Deliveries are generally made in large tractor-trailers that we usually lease. We use integrated computer systems to design and track efficient route sequences for the delivery of our products.
78
Table of Contents
Our distribution center leases are on average 16.2 years in duration. Rent on our leases is typically set at a fixed annual rate, paid monthly.
Our properties also include a combined headquarters facility for our corporate offices and the Performance Foodservice segment that is located in Richmond, Virginia; a headquarters facility for PFG Customized that is located in Tennessee; and a headquarters facility for Vistar that is located in Colorado.
As of June 28, 2014, we operated a fleet of more than 2,500 vehicles of which approximately 75% are leased and 25% are owned. The fleet primarily consists of tractor and trailer combinations, most of which are either wholly or partially refrigerated for the transportation of frozen or perishable food.
Winning Together Program
We recently established a program called Winning Together, which complements our sales growth with specific initiatives that take advantage of our scale and drive productivity in non-customer facing areas on an ongoing basis. Winning Together is led by teams whose primary responsibility is to improve our business processes, capture best practices, and maintain a continuous improvement culture in our procurement and operations functions. The two key components of Winning Together are Winning Together Through Procurement and Winning Together Through Operations.
Winning Together Through Procurement comprises four interwoven programs, including:
| • | Structured supplier negotiations rely on a data driven process to develop the mutual profitability of the relationship and to encourage national and regional suppliers to invest in our growth. Where appropriate, the agreements span our segments and OpCos. |
| • | e-Sourcing is a program that uses electronic sourcing of selected categories and SKUs to obtain the most favorable price for products with specifications rigorously determined by our category managers and quality assurance managers. |
| • | Enhanced marketing support encourages suppliers to invest resources with us to increase sales of their products to our customers in the form of special programs, training, joint sales calls, and other means. |
| • | Improved group purchasing organization utilization leverages our relationship with UniPro, a group purchasing organization to which we belong and whose membership spans many regional and local foodservice providers. This program is focused on finding procurement opportunities that both we and other UniPro members find mutually beneficial. |
Winning Together Through Operations comprises four interwoven programs including:
| • | Inbound logistics lowers the cost of shipping products from suppliers to our warehouses by expanding our backhaul network across our three segments and better managing third-party carriers. |
| • | Best practices drive efficiencies in warehousing, transportation, and safety and risk management by gathering the operational practices and management routines from the best performing OpCos and deploying them in other facilities. |
| • | Not for resale leverages our purchasing scale to lower costs for items not resold to customers, including items such as trucks, material handling equipment, parts and supplies, construction materials, and services used in our operations. |
| • | Established a Model OpCo as a proving ground for operational best practices, technologies, and business processes that can be implemented across our entire organization. |
79
Table of Contents
Pricing
Our pricing to customers is either set by contract with the customer or is priced at the time of order. If the price is by contract, then it is either based on a percentage markup over cost or a fixed markup per unit, and the unit may be expressed either in cases or pounds of product. If the pricing is set at time of order, the pricing is agreed to between our sales associate and the customer and is typically based on a product cost that fluctuates weekly or more frequently.
If contracts are based on a fixed markup per unit or pound, then our customers bear the risk of cost fluctuations during the contract life. In the case of a fixed markup percentage, we typically bear the risk of cost deflation or the benefit of cost inflation. If pricing is set at the time of order, we have the current cost of goods in our inventory and typically pass cost increases or decreases to our customers. We generally do not lock in or otherwise hedge commodity costs or other costs of goods sold except within certain customer contracts where the customer bears the risk of cost fluctuation. We believe that our pricing mechanisms provide us with significant insulation from fluctuations in the cost of goods that we sell. Our inventory turns, on average, approximately every three-and-a-half weeks, which further protects us from cost fluctuations.
We seek to minimize the effect of higher diesel fuel costs by both reducing fuel usage and by taking action to offset higher fuel prices. We reduce usage by designing more efficient truck routes and by increasing miles per gallon through on-board computers that monitor and adjust idling time and maximum speeds and through other technologies. In our Performance Foodservice and Vistar segments, we seek to offset higher fuel prices through diesel fuel surcharges to our customers and through the use of costless collars. As of June 28, 2014, we had collars in place for approximately 20% of the gallons we expect to use in the remainder of fiscal 2015. These fuel collars do not qualify for hedge accounting treatment for reasons discussed in our financial statement footnotes. Therefore, these collars are recorded at fair value as either an asset or liability on the balance sheet. Any changes in fair value are recorded in the period of the change as unrealized gains or losses on fuel hedging instruments. In our PFG Customized segment, we have limited exposure to fuel costs since our sales contracts largely transfer fuel price volatility to our customers.
Competition
The foodservice distribution industry is highly competitive. Certain of our competitors have greater financial and other resources than we do. Furthermore, there are two larger broadline distributors with national footprints. On December 8, 2013, these competitors entered into an agreement and plan of merger; this transaction is subject to ongoing federal and state regulatory review. In addition, there are numerous smaller regional, local, and specialty distributors. These smaller distributors often align themselves with other smaller distributors through purchasing cooperatives and marketing groups to enhance their geographic reach, private label offerings, overall purchasing power, cost efficiencies, and ability to try to meet customer requirements for national or multi-regional distribution. We often do not have exclusive service agreements with our customers and our customers may switch to other distributors if those distributors can offer lower prices, differentiated products, or customer service that is perceived to be superior. We believe that most purchasing decisions in the foodservice business are based on the quality and price of the product and a distributor’s ability to completely and accurately fill orders and provide timely deliveries.
Information Systems
We operate three core mainframe systems that are customized versions of commercial products. These systems span operational functions including procurement, receiving, warehouse and inventory management, and order processing. All three core systems feed financial systems that differ by segment. These financial systems in turn feed into a single consolidation system for financial and managerial reporting. In addition, we continue to invest into what we believe are “best in breed” systems to optimize our business performance. These systems
80
Table of Contents
include our sales force laptops and order entry systems, inbound logistics, and our “pay for performance” systems in warehouse stock replenishment and order selection, delivery loading, routing, driver performance, and sales force productivity.
Employees
As of June 28, 2014, we had more than 11,000 full-time employees. As of June 28, 2014, unions represented approximately 680 of our employees. We have entered into nine collective bargaining and similar agreements with respect to our unionized employees. We believe that we have good relations with both union and non-union employees and we strive to be well regarded in the communities in which we operate. We have not had any material work stoppages or lockouts in the last five years. Our agreements with our union employees expire at various times from 2015 to 2022. See “Risk Factors—Risks Relating to Our Business and Industry—We face risks relating to labor relations and the availability of qualified labor.”
We have approximately 2,000 sales associates who are dedicated to serving our customers. Our typical sales representative calls on customers in their place of business on a periodic basis, usually weekly, to ascertain customer product needs, to help manage the customer’s inventory, and to discuss new products and other business. These sales representatives are supported by customer services representatives who work in the local market and assist customers in a variety of ways; business development managers, who help sales representatives prospect for new business; and category managers and specialists who asset sales representatives and customers with product specific knowledge. All of our segments have a multi-unit, or Chain, sales force who call on regional and national customers.
Insurance
We maintain high-deductible insurance programs covering portions of general and vehicle liability and workers’ compensation. The amounts in excess of the deductibles are insured by third-party insurance carriers, subject to certain limitations and exclusions. We also maintain self-funded group medical insurance. In addition, we maintain property, business and casualty insurance that we believe accords with customary foodservice industry practice. We cannot predict whether this insurance will be adequate to cover all potential hazards incidental to our business.
Regulation
Our operations are subject to regulation by state and local health departments, the USDA and the FDA, which generally impose standards for product quality and sanitation and are responsible for the administration of recent bioterrorism legislation affecting the foodservice industry. These government authorities regulate, among other things, the processing, packaging, storage, distribution, advertising, and labeling of our products. In late 2010, the FDA Food Safety Modernization Act, or the “FSMA,” was enacted. The FSMA represents a significant expansion of food safety requirements and FDA food safety authorities and, among other things, requires that the FDA impose comprehensive, prevention-based controls across the food supply chain, further regulates food products imported into the United States, and provides the FDA with mandatory recall authority. The FSMA requires the FDA to undertake numerous rulemakings and to issue numerous guidance documents, as well as reports, plans, standards, notices, and other tasks. As a result, implementation of the legislation is ongoing and likely to take several years. Our seafood operations are also specifically regulated by federal and state laws, including those administered by the National Marine Fisheries Service, established for the preservation of certain species of marine life, including fish and shellfish. Our processing and distribution facilities must be registered with the FDA biennially and are subject to periodic government agency inspections. State and/or federal authorities generally inspect our facilities at least annually. The Federal Perishable Agricultural Commodities Act, which specifies standards for the sale, shipment, inspection, and rejection of agricultural products, governs
81
Table of Contents
our relationships with our fresh food suppliers with respect to the grading and commercial acceptance of product shipments. We are also subject to regulation by state authorities for the accuracy of our weighing and measuring devices. Our suppliers are also subject to similar regulatory requirements and oversight.
The failure to comply with applicable regulatory requirements could result in, among other things, administrative, civil, or criminal penalties or fines, mandatory or voluntary product recalls, warning or untitled letters, cease and desist orders against operations that are not in compliance, closure of facilities or operations, the loss, revocation, or modification of any existing licenses, permits, registrations, or approvals, or the failure to obtain additional licenses, permits, registrations, or approvals in new jurisdictions where we intend to do business, any of which could have a material adverse effect on our business, financial condition, or results of operations. These laws and regulations may change in the future and we may incur material costs in our efforts to comply with current or future laws and regulations or in any required product recalls.
Our operations are subject to a variety of federal, state, and local laws and other requirements relating to the protection of the environment and the safety and health of personnel and the public. These include requirements regarding the use, storage, and disposal of solid and hazardous materials and petroleum products, including food processing wastes, the discharge of pollutants into the air and water, and worker safety and health practices and procedures. In order to comply with environmental, health, and safety requirements, we may be required to spend money to monitor, maintain, upgrade, or replace our equipment; plan for certain contingencies; acquire or maintain environmental permits; file periodic reports with regulatory authorities; or investigate and clean up contamination. We operate and maintain vehicle fleets, and some of our distribution centers have regulated underground and aboveground storage tanks for diesel fuel and other petroleum products. Some jurisdictions in which we operate have laws that affect the composition and operation of our truck fleet, such as limits on diesel emissions and engine idling. A number of our facilities have ammonia- or freon-based refrigeration systems, which could cause injury or environmental damage if accidentally released, and many of our distribution centers have propane or battery powered forklifts. Proposed or recently enacted legal requirements, such as those requiring the phase-out of certain ozone-depleting substances and proposals for the regulation of greenhouse gas emissions, may require us to upgrade or replace equipment, or may increase our transportation or other operating costs. To date, our cost of compliance with environmental, health, and safety requirements has not been material. The discovery of contamination for which we are responsible, any accidental release of regulated materials, the enactment of new laws and regulations, or changes in how existing requirements are enforced, could require us to incur additional costs or subject us to unexpected liabilities.
The Surface Transportation Board and the Federal Highway Administration regulate our trucking operations. In addition, interstate motor carrier operations are subject to safety requirements prescribed in the U.S. Department of Transportation and other relevant federal and state agencies. Such matters as weight and dimension of equipment are also subject to federal and state regulations. We believe that we are in substantial compliance with applicable regulatory requirements relating to our motor carrier operations. Failure to comply with the applicable motor carrier regulations could result in substantial fines or revocation of our operating permits.
Legal Proceedings
We are engaged in the defense of certain claims and lawsuits arising out of the ordinary course and conduct of our business. We have insurance policies covering certain potential losses where such coverage is cost effective. Although the outcomes of such matters (including the matter discussed below) are not determinable at this time, in our opinion, any liability that might be incurred by us upon the resolution of the claims and lawsuits (including those discussed below) will not, individually and in the aggregate, have a material adverse effect on our consolidated financial condition, results of operations, or cash flows.
U.S. Equal Employment Opportunity Commission Investigation. In March 2009, the Baltimore Equal Employment Opportunity Commission, or the “EEOC,” Field Office served us with company-wide (excluding,
82
Table of Contents
certain of our operations) subpoenas relating to alleged violations of the Equal Pay Act and Title VII of the Civil Rights Act, seeking certain information from January 1, 2004 to a point in time in the first fiscal quarter of 2009. In August 2009, the EEOC moved to enforce the subpoenas in federal court in Maryland, and we opposed the motion. In February 2010, the court ruled that the subpoena related to the Equal Pay Act investigation was enforceable company-wide but on a narrower scope of data than the original subpoena sought; the court ruled that the subpoena was applicable to the transportation, logistics, and warehouse functions of our broadline distribution centers only and not our PFG Customized distribution centers. We cooperated with the EEOC on the production of information. In September 2011, the EEOC notified us that the EEOC was terminating the investigation into alleged violations of the Equal Pay Act. In determinations issued in September 2012 by the EEOC with respect to the charges on which the EEOC had based its company-wide investigation, the EEOC concluded that we engaged in a pattern of denying hiring and promotion to a class of female applicants and employees into certain positions within the transportation, logistics, and warehouse functions within our broadline division and in June 2013, filed suit in federal court in Baltimore against us. The litigation concerns two issues: (1) whether we unlawfully engaged in an ongoing pattern and practice of failing to hire female applicants into operative positions; and (2) whether we unlawfully failed to promote one of the three individuals who filed charges with the EEOC due to her being female. We intend to vigorously defend ourselves.
Laumea v. Performance Food Group, Inc. In May 2014, a former employee of our Roma of Southern California distribution center filed a putative class action lawsuit in the San Bernardino County, California Superior Court against us. There are different counts for which the putative classes differ. The first class is proposed to be all former and current employees employed by us in California in non-exempt positions at any time during the period beginning May 30, 2010 to the present, or the “California Class.” With respect to the California Class, the lawsuit alleges that we (1) failed to pay overtime as required by California statute, (2) failed to provide meal periods and to pay compensation for such meal periods, (3) failed to provide accurate itemized wage statements, and (4) that we engaged in unfair trade practices. The lawsuit further alleges the plaintiff is entitled to penalties and attorney fees pursuant to the California Private Attorney General Act. The second putative class is proposed to be all members of the California Class who separated from employment at any time during the period beginning May 30, 2011, or the “California Subclass.” With respect to the California Subclass, the lawsuit alleges that we failed to pay all compensation within the period due at the time of termination of employment. The third putative class is proposed to be all current or former employees employed by us in the United States in non-exempt positions at any time during the period beginning May 30, 2011 to the present, or the “Nationwide Class.” With respect to the Nationwide Class, the lawsuit alleges we willfully failed to pay overtime compensation. We intend to vigorously defend ourselves.
Contreras v. Performance Food Group, Inc., et al. In June 2014, a former employee of our Roma of Southern California distribution center filed a putative class action lawsuit in the Alameda County, California Superior Court against us. The putative class is proposed to be all drivers employed in any of our California locations at any time during the period beginning June 17, 2010 to the present. The lawsuit alleges that we engaged in unfair trade practices and that we, with respect to the putative class, failed to (1) provide timely off-duty meal and rest breaks and to pay compensation for such breaks as required by California law, (2) pay compensation for all hours worked, (3) to pay overtime compensation, (4) to provide accurate itemized wage statements, (5) pay all compensation within the period due at the time of termination of employment, and (6) pay compensation in timely fashion. The lawsuit further alleges the plaintiff is entitled to penalties and attorney fees pursuant to the California Private Attorney General Act. We intend to vigorously defend ourselves.
83
Table of Contents
Directors and Executive Officers
The following table sets forth the names, ages, and positions of our directors and the executive officers of Performance Food Group Company, as of September 5, 2014. We expect to add additional independent directors prior to the completion of this offering.
| Name |
Age |
Position | ||||
| George L. Holm |
59 | President and Chief Executive Officer; Director | ||||
| William M. Pearce |
63 | Executive Vice President of the Company and President and Chief Executive Officer of Performance Foodservice | ||||
| James Hope |
54 | Executive Vice President, Operations | ||||
| Patrick T. Hagerty |
56 | Senior Vice President of the Company and President and Chief Executive Officer of Vistar | ||||
| Robert D. Evans |
55 | Senior Vice President and Chief Financial Officer | ||||
| Craig H. Hoskins |
53 | Senior Vice President of the Company and President and Chief Executive Officer of PFG Customized | ||||
| Carol A. Price |
54 | Senior Vice President and Chief Human Resources Officer | ||||
| Michael L. Miller |
55 | Senior Vice President, General Counsel, and Secretary | ||||
| Terry A. West |
57 | Senior Vice President andChief Information Officer | ||||
| Douglas M. Steenland |
63 | Chairman of the Board of Directors | ||||
| William F. Dawson Jr. |
47 | Director | ||||
| Thomas H. Hoffman |
75 | Director | ||||
| Bruce McEvoy |
37 | Director | ||||
| Prakash A. Melwani |
56 | Director | ||||
| Jeffrey Overly |
56 | Director | ||||
George L. Holm has served as our President and Chief Executive Officer since September 2002, when he founded the Company and subsequently led the Company through its expansion into the broadline foodservice distribution industry with the PFG acquisition in May 2008. Mr. Holm has also served as a Director since 2002. Prior to joining the Company, he held various senior executive positions with Sysco, Alliant Foodservice, and US Foods.
William M. Pearce has served as our Executive Vice President and Chief Executive Officer and President of Performance Foodservice since May 2008. From May 2005 to May 2008, he served as Chief Executive Officer of Spartan Foods of America. Prior to that, Mr. Pearce held various senior executive positions in the foodservice industry, including positions with Sara Lee Corporation, US Foods, FirstSource Distribution and PYA/Monarch. Mr. Pearce has recently announced his intention to retire during fiscal 2016.
James Hope has served as our Executive Vice President, Operations since July 2014. Prior to joining the Company, he was with Sysco for approximately 30 years. His last positions at Sysco were Executive Vice President, Business Transformation from January 2010 to June 2013, Senior Vice President, Business Transformation from January 2009 to December 2009, and Senior Vice President, Sales and Marketing from July 2007 to December 2008.
Patrick T. Hagerty has served as our Senior Vice President and President and Chief Executive Officer of Vistar since September 2008. From May 2006 to September 2008, he was Vice President and Chief Operating Officer of Vistar. From November 1994 to May 2006, he was Vice President, Merchandising with the Company and its predecessor.
Robert D. Evans has served as our Senior Vice President and Chief Financial Officer since May 2009. Prior to joining the Company, he was President of Black Diamond Holdings, a start-up manufacturer and retailer of
84
Table of Contents
eco-friendly cleaning services from July 2005 to February 2009. From December 2000 to December 2004, he was Chief Financial Officer and Executive Vice President, Finance and Development of Giant Foods, a retail supermarket chain in the Baltimore/Washington, D.C. area. He has served as Vice President of Strategy and Corporate Development, Senior Vice President and General Manager of U.S. Ready to Eat Cereal, and Chief Financial Officer and Senior Vice President of Kellogg North America and held a series of finance positions at the Frito-Lay division of PepsiCo.
Craig H. Hoskins has served as our Senior Vice President and Chief Executive Officer and President of PFG Customized since January 2012. He served as Senior Vice President and President and Chief Operating Officer of PFG Customized from September 2011 to December 2011. Prior to that, he served as PFG’s Senior Vice President, Sales from October 2007 to July 2011 and at its predecessor. Prior to that, he served in various operating and customer facing leadership roles with our predecessor since joining in August 1990 as Marketing Manager.
Carol A. Price has served as our Senior Vice President and Chief Human Resources Officer since October 2011. Prior to joining the Company, she was Senior Vice President of Global Talent Management for Aramark from February 2008 to October 2011 and Vice President of Human Resources for Aramark’s Business and Industry Group from April 2007 to February 2008. Prior to that, she held various HR leadership roles at General Electric Company from March 1989 to April 2007.
Michael L. Miller has served as our Senior Vice President, General Counsel and Secretary since August 2010. Prior to joining the Company, he was with Northwest Airlines, Inc. from October 1995 to November 2008, last serving as Vice President, Law and Secretary from January 2001 through November 2008. From December 2008 through July 2010, he provided legal and consulting services from time to time to a private equity firm.
Terry A. West has served as our Senior Vice President and Chief Information Officer since February 2011. Prior to joining the Company, he was with ConAgra Foods, Inc. from May 2000 to February 2011, serving as a Vice President, Information Technology from July 2006 to February 2011. Prior to that, Mr. West served in the United States Army for over 20 years.
Douglas M. Steenland has served as a Director and as Chairman of the Board of Directors since 2010. Mr. Steenland served as President and Chief Executive Officer of Northwest Airlines from 2004 until its merger with Delta on October 29, 2008. Prior to this, Mr. Steenland served in a number of executive positions after joining Northwest Airlines in 1991, including President from 2001 to 2004 and Executive Vice President and Chief Corporate Officer from 1999 to 2001. Mr. Steenland is a director of American International Group, Digital River, Travelport Limited and Hilton Worldwide Holdings. Mr. Steenland received a B.A. from Calvin College and is a graduate from The George Washington University Law School.
William F. Dawson Jr. has served as a Director since 2002. Mr. Dawson is Chief Executive Officer of Wellspring. Prior to joining Wellspring in 2001, Mr. Dawson spent one year at Whitney & Co., where he was head of the middle market buyout group. Prior to this, Mr. Dawson spent 14 years at Donaldson, Lufkin & Jenrette Securities Corporation where he was most recently a managing director at DLJ Merchant Banking. Mr. Dawson has been involved in numerous acquisitions and recapitalizations as well as leveraged financings and restructurings. Mr. Dawson received a Bachelor of Science degree from St. Francis College and an MBA from Harvard Business School.
Thomas H. Hoffman has served as a Director since 2012. Mr. Hoffman has served as our Executive Vice President since May 2008 and served as Chief Executive Officer and President of PFG Customized from 1995 to September 2011 and as Chief Executive Officer from September 2011 to December 2011. He also served as Senior Vice President of PFG Holdings, LLC from June 1995 to May 2008 and was President of one of our operating companies from 1989 to 1995. Prior to joining the Company, he served in executive capacities at Booth Fisheries Corporation, a subsidiary of Sara Lee Corporation, as well as C.F.S. Continental and International Foodservice. Mr. Hoffman has expressed an intention to retire from our Board of Directors upon the completion of this offering.
85
Table of Contents
Bruce McEvoy has served as a Director since 2007. Mr. McEvoy is a Managing Director at Blackstone. Before joining Blackstone in 2006, Mr. McEvoy worked as an Associate at General Atlantic from 2002 to 2004, and was a consultant at McKinsey & Company from 1999 to 2002. Mr. McEvoy graduated from Princeton University and received an MBA from Harvard Business School. Mr. McEvoy currently serves on the boards of directors of GCA Services, Catalent, RGIS Inventory Specialists, SeaWorld Entertainment, Vivint, and Vivint Solar.
Prakash A. Melwani has served as a Director since 2007. Mr. Melwani is a Senior Managing Director at Blackstone and is based in New York. He is the Chief Investment Officer of the Private Equity Group and chairs each of its Investment Committees. Since joining Blackstone in 2003, Mr. Melwani has led Blackstone’s investments in Kosmos Energy, Foundation Coal, Texas Genco, Ariel Re, Pinnacle Foods, RGIS Inventory Specialists, and Crocs. Before joining Blackstone, Mr. Melwani was a founding partner of Vestar Capital Partners and served as its Chief Investment Officer. Prior to that, he was with the management buyout group at The First Boston Corporation and with N.M. Rothschild & Sons in Hong Kong and London. Mr. Melwani received a First Class Honors degree in Economics from Cambridge University, England, and an MBA with High Distinction from the Harvard Business School, where he graduated as a Baker Scholar and a Loeb Rhodes Fellow. Mr. Melwani serves as a Director of Acushnet Company, Crocs, Kosmos Energy, Pinnacle Foods, RGIS Inventory Specialists, and Blackstone strategic partner, Patria.
Jeffrey Overly has served as our Director since 2013. Mr. Overly is an Operating Partner at The Blackstone Group. Before joining Blackstone in 2008, Mr. Overly was Vice President of Global Fixture Operations at Kohler Company. Prior to that, he served 25 years at General Motors Corporation and Delphi Corporation in numerous operations and engineering positions. Mr. Overly has a BS in Industrial Management from the University of Cincinnati and a Masters in Business from Central Michigan University. Mr. Overly current serves on the board of directors of Pinnacle Foods.
Our Corporate Governance
We have structured our corporate governance in a manner we believe closely aligns our interests with those of our stockholders. Notable features of our corporate governance include:
| • | Our Board of Directors will be divided into three classes of directors, with the classes to be as nearly equal in number as possible, and with the directors serving three-year terms; |
| • | We will have independent director representation on our Audit, Compensation, and Nominating and Corporate Governance Committees immediately at the time of the offering, and our independent directors will meet regularly in executive sessions without the presence of our corporate officers or non-independent directors; |
| • | We anticipate that at least one of our directors will qualify as an “audit committee financial expert” as defined by the SEC; and |
| • | We will implement a range of other corporate governance best practices, including placing limits on the number of directorships held by our directors to prevent “overboarding,” and implementing a robust director education program. |
Composition of the Board of Directors after this Offering
Prior to the completion of this offering, we expect that additional independent directors will be elected to our Board of Directors.
Our business and affairs are managed under the direction of our Board of Directors. In connection with this offering, we will amend and restate our certificate of incorporation to provide for a classified Board of Directors,
86
Table of Contents
with directors in Class I (expected to be ), directors in Class II (expected to be ) and directors in Class III (expected to be ). See “Description of Capital Stock—Anti-Takeover Effects of our Amended and Restated Certificate of Incorporation and Amended and Restated Bylaws and Certain Provisions of Delaware Law—Classified Board of Directors.” In addition, we intend to enter into a stockholders agreement with certain affiliates of our Sponsors and other stockholders in connection with this offering. This agreement will grant our Sponsors the right to designate nominees to our board of directors subject to the maintenance of certain ownership requirements in us. See “Certain Relationships and Related Party Transactions—Stockholders Agreement.”
Background and Experience of Directors
When considering whether directors and nominees have the experience, qualifications, attributes, or skills, taken as a whole, to enable our Board of Directors to satisfy its oversight responsibilities effectively in light of our business and structure, the Board of Directors focused primarily on each person’s background and experience as reflected in the information discussed in each of the directors’ individual biographies set forth above. We believe that our directors provide an appropriate mix of experience and skills relevant to the size and nature of our business. Once appointed, directors serve until they resign or are terminated by the stockholders. In particular, the members of our Board of Directors considered the following important characteristics, among others:
| • | Douglas M. Steenland—we considered Mr. Steenland’s experience in managing large, complex, institutions. |
| • | George L. Holm—we considered Mr. Holm’s experience as an executive in the U.S. foodservice distribution industry. Furthermore, we also considered how his additional role as our Chief Executive Officer and President would bring management perspective to board deliberations and provide valuable information about the status of our day-to-day operations. |
| • | William F. Dawson Jr.—we considered Mr. Dawson’s significant financial, investment, and operational experience from his involvement in Wellspring’s investments in numerous portfolio companies, as well as his twelve years of experience as a director of the Company and its predecessor. |
| • | Thomas H. Hoffman—we considered Mr. Hoffman’s long experience with PFG and in the U.S. foodservice distribution industry. |
| • | Bruce McEvoy—we considered Mr. McEvoy’s knowledge and expertise based on his experiences at Blackstone coupled with his experience as a director of several companies, as well as his management consulting experience. |
| • | Prakash A. Melwani—we considered Mr. Melwani’s significant financial, investment and operational experience from his involvement in Blackstone’s investments in numerous portfolio companies and have played active roles in overseeing those businesses. |
| • | Jeffrey Overly—we considered Mr. Overly’s significant financial, investment and operational experience from his involvement in Blackstone’s investments in numerous portfolio companies and have played active roles in overseeing those businesses. |
Role of Board in Risk Oversight
The Board of Directors has extensive involvement in the oversight of risk management related to us and our business and accomplishes this oversight through the regular reporting to the Board of Directors by the Audit Committee. The Audit Committee represents the Board of Directors by periodically reviewing our accounting, reporting and financial practices, including the integrity of our financial statements, the surveillance of administrative and financial controls, and our compliance with legal and regulatory requirements. Through its regular meetings with management, including the finance, legal, internal audit, and information technology
87
Table of Contents
functions, the Audit Committee reviews and discusses all significant areas of our business and summarizes for the Board of Directors all areas of risk and the appropriate mitigating factors. In addition, our Board of Directors receives periodic detailed operating performance reviews from management.
Controlled Company Exception
After the completion of this offering, affiliates of Blackstone will continue to beneficially own shares representing more than 50% of the voting power of our shares eligible to vote in the election of directors. As a result, we will be a “controlled company” within the meaning of corporate governance standards. Under these corporate governance standards, a company of which more than 50% of the voting power is held by an individual, group, or another company is a “controlled company” and may elect not to comply with certain corporate governance standards, including the requirements (1) that a majority of our board of directors consist of independent directors, (2) that our board of directors have a compensation committee that is comprised entirely of independent directors with a written charter addressing the committee’s purpose and responsibilities, and (3) that our board of directors have a Nominating and Corporate Governance Committee that is comprised entirely of independent directors with a written charter addressing the committee’s purpose and responsibilities. For at least some period following this offering, we may utilize these exemptions. As a result, although we will have a fully independent Audit Committee within one year following this offering and we will have independent director representation on our compensation and Nominating and Corporate Governance Committees upon the closing of this offering, immediately following this offering the majority of our directors may not be independent and our compensation committee or Nominating and Corporate Governance Committee may not be comprised entirely of independent directors. Accordingly, although we may have fully independent Compensation and Nominating and Corporate Governance Committees prior to the time we cease to be a “controlled company,” for such period of time you may not have the same protections afforded to stockholders of companies that are subject to all of these corporate governance requirements. In the event that we cease to be a “controlled company” and our shares continue to be listed on the , we will be required to comply with these provisions within the applicable transition periods.
Board Committees
After the completion of this offering, the standing committees of our Board of Directors will consist of an Audit Committee, a Compensation Committee, and a Nominating and Corporate Governance Committee.
Our president and chief executive officer and other executive officers will regularly report to the non-executive directors and the Audit, the Compensation, and the Nominating and Corporate Governance Committees to ensure effective and efficient oversight of our activities and to assist in proper risk management and the ongoing evaluation of management controls. The director of internal audit will report functionally and administratively to our chief financial officer and directly to the Audit Committee. We believe that the leadership structure of our Board of Directors provides appropriate risk oversight of our activities given the controlling interests held by Blackstone.
Audit Committee
Upon the completion of this offering, we expect to have an Audit Committee, consisting of , who will be serving as the Chair, and . qualifies as an independent director under the corporate governance standards and the independence requirements of Rule 10A-3 of the Securities Exchange Act of 1934, as amended (the “Exchange Act”). Following this offering, our Board of Directors will determine which member of our Audit Committee qualifies as an “audit committee financial expert” as such term is defined in Item 407(d)(5) of Regulation S-K.
The purpose of the Audit Committee will be to prepare the audit committee report required by the SEC to be included in our proxy statement and to assist our Board of Directors in overseeing and monitoring (1) the quality
88
Table of Contents
and integrity of our financial statements, (2) our compliance with legal and regulatory requirements, (3) our independent registered public accounting firm’s qualifications and independence, (4) the performance of our internal audit function, and (5) the performance of our independent registered public accounting firm.
Our Board of Directors will adopt a written charter for the Audit Committee, which will be available on our website upon the completion of this offering.
Compensation Committee
Upon the completion of this offering, we expect to have a Compensation Committee, consisting of , who will be serving as the Chair, and .
The purpose of the Compensation Committee is to assist our Board of Directors in discharging its responsibilities relating to (1) setting our compensation program and compensation of our executive officers and directors, (2) monitoring our incentive and equity-based compensation plans, and (3) preparing the compensation committee report required to be included in our proxy statement under the rules and regulations of the SEC.
Our Board of Directors will adopt a written charter for the Compensation Committee, which will be available on our website upon the completion of this offering.
Nominating and Corporate Governance Committee
Upon the completion of this offering, we expect to have a Nominating and Corporate Governance Committee, consisting of , who will be serving as the Chair, and . The purpose of our Nominating and Corporate Governance Committee will be to assist our Board of Directors in discharging its responsibilities relating to (1) identifying individuals qualified to become new Board of Directors members, consistent with criteria approved by the Board of Directors, subject to the stockholders agreement with our Sponsors; (2) reviewing the qualifications of incumbent directors to determine whether to recommend them for reelection and selecting, or recommending that the Board of Directors select, the director nominees for the next annual meeting of stockholders; (3) identifying Board of Directors members qualified to fill vacancies on any Board of Directors committee and recommending that the Board of Directors appoint the identified member or members to the applicable committee, subject to the stockholders agreement with our Sponsors; (4) reviewing and recommending to the Board of Directors corporate governance principles applicable to us; (5) overseeing the evaluation of the Board of Directors and management; and (6) handling such other matters that are specifically delegated to the committee by the Board of Directors from time to time.
Our Board of Directors will adopt a written charter for the Nominating and Corporate Governance Committee, which will be available on our website upon completion of this offering.
Compensation Committee Interlocks and Insider Participation
None of the members of our Compensation Committee has at any time been one of our executive officers or employees. None of our executive officers currently serves, or has served during the last completed fiscal year, on the compensation committee or board of directors of any other entity that has one or more executive officers serving as a member of our Board of Directors or Compensation Committee. We are parties to certain transactions with the Sponsors described in the “Certain Relationships and Related Party Transactions” section of this prospectus.
89
Table of Contents
Code of Ethics
We will adopt a new Code of Business Conduct that applies to all of our directors, officers, and employees, including our principal executive officer, principal financial officer, and principal accounting officer, which will be available on our website upon the completion of this offering. Our Code of Business Conduct is a “code of ethics,” as defined in Item 406(b) of Regulation S-K. Please note that our Internet website address is provided as an inactive textual reference only. We will make any legally required disclosures regarding amendments to, or waivers of, provisions of our code of ethics on our Internet website.
Executive Compensation
Compensation Discussion and Analysis
This section contains a discussion of the material elements of compensation awarded to, earned by or paid to our President and Chief Executive Officer, our Chief Financial Officer, and each of our three other most highly compensated executive officers who served in such capacities at the end of our fiscal year on June 29, 2014, collectively known as the “Named Executive Officers” or “NEOs.”
Our named executive officers for fiscal 2014 were:
| • | George L. Holm, our President and Chief Executive Officer; |
| • | Robert D. Evans, our Senior Vice President and Chief Financial Officer; |
| • | William M. Pearce, our Executive Vice President of the Company and President and Chief Executive Officer of Performance Foodservice; |
| • | Patrick T. Hagerty, our Senior Vice President of the Company and President and Chief Executive Officer of Vistar; and |
| • | Carol A. Price, our Senior Vice President and Chief Human Resources Officer. |
Executive Compensation Program Objectives and Overview
Our current executive compensation program is intended to achieve two fundamental objectives: (1) attract, motivate, and retain high caliber talent; and (2) align executive compensation with achievement of our overall business goals, adherence to our core values, and stockholder interests. In structuring our current executive compensation program, we are guided by the following basic philosophies:
Competitive Compensation. Our executive compensation program should provide a fair and competitive compensation opportunity that enables us to attract and retain high caliber executive talent. Executives should be appropriately rewarded for their contributions to our successful performance.
“Pay for Performance.” A significant portion of each executive’s compensation should be “at risk” and tied to overall company, business unit, and individual performance.
Alignment with Stockholder Interests. Executive compensation should be structured to include elements that link executives’ financial rewards to stockholder return.
90
Table of Contents
As described in more detail below, the material elements of our executive compensation program for NEOs include base salary, cash bonus opportunities, a long-term equity incentive opportunity, and broad-based employee benefits. The NEOs may also receive severance payments and other benefits in connection with certain terminations of employment or a change in control of the Company. We believe that each element of our executive compensation program helps us to achieve one or more of our compensation objectives, as illustrated by the table below.
| Compensation Element |
Compensation Objectives Designed to be Achieved | |
| Base Salary |
Attract, motivate, and retain high caliber talent | |
| Cash Bonus Opportunity |
Compensation “at risk” and tied to achievement of business goals | |
| Long-Term Equity Incentive Opportunity |
Align compensation with the creation of stockholder value, and achievement of business goals | |
| Benefits and Perquisites |
Attract, motivate, and retain high caliber talent | |
| Severance and other Benefits Potentially Payable Upon Certain Terminations of Employment or a Change in Control |
Attract, motivate and retain high caliber talent | |
These individual compensation elements are intended to create a total compensation package for each NEO that we believe achieves our compensation objectives and provides competitive compensation opportunities.
Compensation Determination Process
The Compensation Committee of our Board of Directors (the “Committee”) is responsible for establishing, maintaining, and administering our compensation and benefit policies. The Committee takes into account our President and Chief Executive Officer’s recommendations regarding the compensatory arrangements for our executive officers other than himself. For fiscal 2014, our President and Chief Executive Officer provided the final compensation recommendations for our Named Executive Officers to the Committee for review and approval. The other NEOs do not have any role in determining or recommending the form or amount of compensation paid to our NEOs. Our President and Chief Executive Officer is not a member of the Committee and does not participate in deliberations regarding his compensation.
The Committee did not use any compensation consultants in making its compensation determinations and has not benchmarked any of its compensation determinations against a peer group. In connection with this offering, we intend to review, and have engaged a compensation consultant to assist us in evaluating, the elements and levels of our executive compensation, including base salaries, annual cash incentive awards, and annual equity-based incentives for our named executive officers.
Employment Agreements
We do not have formal employment agreements with any of our NEOs other than Mr. Holm. However, we typically enter into offer letters with our executive officers. In connection with the commencement of their employment in 2009, 2008, 1994, and 2011, respectively, we entered into offer letters with Mr. Evans, Mr. Pearce, Mr. Hagerty, and Ms. Price setting forth their initial compensation and benefits. A full description of the material terms of Mr. Holm’s employment agreement is presented below in the narrative section following the Grants of Plan Based Awards in Fiscal 2014 table.
91
Table of Contents
Executive Compensation Program Elements
Base Salaries
Base salaries are an important element of compensation because they provide the Named Executive Officers with a base level of income. Generally our NEOs are eligible for an adjustment to their base salaries each year. Adjustments may occur earlier or later depending on performance and market competitiveness. During fiscal 2014, in recognition of their performance, we adjusted the salary of each of Mr. Holm (from $875,500 to $1,000,000, effective September 1, 2013), Mr. Evans (from $410,000 to $420,000, effective September 1, 2013), Mr. Pearce (from $412,000 to $422,000, effective September 1, 2013), Mr. Hagerty (from $300,000 to $315,000, effective September 1, 2013), and Ms. Price (from $309,000 to $320,000, effective September 1, 2013). The Summary Compensation Table below shows the base salary paid to each NEO along with base salary adjustments, in the corresponding footnotes, during fiscal 2014.
Cash Bonus Opportunities
Annual Cash Bonus Opportunity
We sponsor a management incentive plan (the “MIP”). All of our NEOs are eligible to participate in the MIP. The primary purpose of the MIP is to focus management on key measures that drive financial performance and provide competitive bonus opportunities tied to the achievement of our financial and strategic growth objectives.
Fiscal 2014 MIP
A target annual bonus, expressed as a percentage of base salary, is established within certain NEOs’ employment agreements or offer letters and may be adjusted from time to time by the Committee in connection with an NEO’s promotion or performance. The target annual bonus for fiscal 2014 for each of the NEOs was 100% of their respective base salary. For our NEOs at the corporate level, including Mr. Holm, Mr. Evans, and Ms. Price, the MIP award, which is a cash bonus, is tied to our overall financial results as measured by our Adjusted EBITDA (excluding certain adjustments). For our NEOs at the segment level, including Mr. Pearce and Mr. Hagerty, the MIP award is tied both to our overall financial results as measured by our Adjusted EBITDA and to Adjusted EBITDA for their respective segments (in each case, excluding certain adjustments). We believe that tying part or all of the NEOs’ bonuses to company-wide performance goals encourages collaboration across the executive leadership team while tying part of the bonuses of our NEOs at the segment level to Adjusted EBITDA for their respective segments also rewards these NEOs for achievements with respect to their business units. We use Adjusted EBITDA as a measure of financial performance because we believe that it provides a reliable indicator of our strategic growth and the strength of our cash flow and overall financial results.
Actual amounts paid to our NEOs at the corporate level under the fiscal 2014 MIP were calculated by multiplying each such NEO’s target annual bonus for 2014 (which was 100% of base salary over the previous twelve months) by a payout percentage based on our actual achievement relative to our overall Adjusted EBITDA performance objective.
The payout percentage was determined by calculating our actual achievement against the overall Adjusted EBITDA performance target based on the pre-established scale set forth in the following table:
| Performance Food Group—All Segments |
||||
| % Attainment of Performance Target |
Payout Percentage | |||
| Less than 92% |
0.0 | % | ||
| 92% |
15.0 | % | ||
| 95% |
33.3 | % | ||
| 100% |
100.0 | % | ||
| 105% |
133.0 | % | ||
92
Table of Contents
Based on the pre-established scale set forth above, no cash incentive award would have been paid to our NEOs at the corporate level unless our actual performance for fiscal 2014 was at or above 92% of our overall Adjusted EBITDA target. If our actual performance was 92% of target, they would have been entitled to 15% of their respective target bonus amounts. If our actual performance was 95% of target, they would have been entitled to 33.3% of their respective target bonus amounts. If our actual performance was 105% of target, they would have been entitled to 133.0% of their respective target bonus amounts. For performance percentages between these levels, the resulting payout percentage would be adjusted on a linear basis. For example, if our actual performance was between 92% and 95% of target Adjusted EBITDA, a $1 million increase in Adjusted EBITDA would have resulted in a 2.05% increase in the payout percentage. If our actual performance was above 95% and up to 105% of target Adjusted EBITDA, a $1 million increase in Adjusted EBITDA would have resulted in a 4.48% increase in payout percentage. In addition, an incentive payment may be adjusted downward by up to 20% for documented performance-related reasons. The maximum bonus potential for our NEOs at the corporate level was capped at 133.0% of their respective target bonus amounts. The overall Adjusted EBITDA performance target for 2014 was $297,712,043.
For fiscal 2014, the actual overall Adjusted EBITDA achieved was $284,530,760, or 95.6% of target, resulting in a payout percentage of 40.9% of the target bonus amounts of our NEOs at the corporate level under the fiscal 2014 MIP. The following table illustrates the calculation of the annual cash bonus payable to each of Messrs. Holm and Evans and Ms. Price under the fiscal 2014 MIP in light of these performance results.
| Name |
2014 Base Salary |
Target Bonus % |
Target Bonus Amount |
Overall Payout Percentage |
Actual Bonus Paid |
|||||||||||||||
| George L. Holm |
$ | 1,000,000 | 100 | % | $ | 1,000,000 | 40.9 | % | $ | 409,160 | ||||||||||
| Robert D. Evans |
$ | 420,000 | 100 | % | $ | 420,000 | 40.9 | % | $ | 171,847 | ||||||||||
| Carol A. Price |
$ | 320,000 | 100 | % | $ | 320,000 | 40.9 | % | $ | 130,931 | ||||||||||
Actual amounts paid to Messrs. Pearce and Hagerty under the fiscal 2014 MIP were calculated by multiplying each such NEO’s target annual bonus for 2014 (which was 100% of actual base salary) by a weighted achievement factor determined by the sum of (1) the applicable segment Adjusted EBITDA achievement factor (75% multiplied by the applicable segment Adjusted EBITDA payout percentage) and (2) the overall Adjusted EBITDA achievement factor (25% multiplied by the overall Adjusted EBITDA payout percentage).
The overall Adjusted EBITDA achievement factor was determined by calculating our actual achievement against the overall Adjusted EBITDA performance target based on the pre-established scale set forth in the table above. The Adjusted EBITDA achievement factor for our segments was determined by calculating the NEO’s segment achievement against the applicable segment Adjusted EBITDA performance target based on the pre-established scale set forth in the following tables:
| Performance Foodservice Segment (Mr. Pearce) | ||||
| % Attainment of Performance Target |
Payout Percentage | |||
| Less than 86.4% |
0.0 | % | ||
| 86.4% |
25.0 | % | ||
| 100.0% |
100.0 | % | ||
| Vistar Segment (Mr. Hagerty) | ||||
| % Attainment of Performance Target |
Payout Percentage | |||
| Less than 97.4% |
0.0 | % | ||
| 97.4% |
25.0 | % | ||
| 100.0% |
100.0 | % | ||
Based on the pre-established scales set forth above, no cash incentive award would have been paid to our NEOs at the segment level unless our actual performance for 2014 was at or above 92% of our overall Adjusted
93
Table of Contents
EBITDA target or, (1) in the case of Mr. Pearce, actual performance by our Performance Foodservice segment was at or above 86.4% of the target Adjusted EBITDA for our Performance Foodservice segment and (2) in the case of Mr. Hagerty, actual performance by our Vistar segment was at or above 97.4% of the target Adjusted EBITDA for our Vistar segment. For performance percentages between the levels set forth above, the resulting payout percentage would be adjusted on a linear basis. The maximum bonus potential for Mr. Hagerty was capped at 108.3% of his target bonus amount. An incentive payment may be adjusted downward by up to 20% for documented performance-related reasons. For 2014, the Adjusted EBITDA performance targets for our Performance Foodservice and Vistar segments were $235,892,054 and $88,983,000, respectively.
In addition, Mr. Pearce’s payout percentage would be increased as follows:
| • | one percentage increase for each percentage increase above a minimum threshold percentage growth rate of our sales to Street customers by volume and our sales of Performance Brands by volume; and |
| • | two percentage points increase for each percentage point increase when sales to Street customers by volume and sales of Performance Brands by volume exceeded the minimum threshold percentage growth rates by more than 10%. |
We set the performance thresholds for growth rates of our sales to Street customers by volume and sales of Performance Brands by volume at what we believe are challenging levels and in the two most recent fiscal years, the only two fiscal years in which this potential payout threshold increase was made available, the Performance Foodservice segment has met the minimum threshold levels but has not exceeded them by 10%. Since Mr. Pearce’s annual cash bonus may be increased for each percentage point increase above the minimum threshold percentage growth rates of (1) our sales to Street customers by volume and (2) sales of Performance Brands by volume, his potential annual cash bonus is uncapped.
For fiscal 2014, the actual Adjusted EBITDA achieved for our Performance Foodservice segment was $213,630,919, or 90.6% of target, resulting in a payout percentage of 48.0%, which payout percentage was increased to 59.0% as a result of the Performance Foodservice segment’s exceeding the independent Street case growth target and the PFS brand case growth target by 5% and 6%, respectively. This resulted in a weighted achievement factor of 54.3% when combined with the overall Adjusted EBITDA payout percentage of 40.9%. For fiscal 2014, the actual Adjusted EBITDA achieved for our Vistar segment was 90,073,900, or 101.2% of target, resulting in an achievement factor of 100% and a weighted achievement factor of 85.2% when combined with the overall Adjusted EBITDA payout percentage of 40.9%. The following table illustrates the calculation of the annual cash incentive awards payable to each of Messrs. Pearce and Hagerty under the fiscal 2014 MIP in light of these performance results.
| Name |
2014 Base Salary |
Target Bonus % |
Target Bonus Amount |
Segment Payout Percentage |
Overall Payout Percentage |
Weighted Achievement Factor |
Actual Bonus Paid |
|||||||||||||||||||||
| William M. Pearce |
$ | 422,000 | 100 | % | $ | 422,000 | 59.0 | % | 40.9 | % | 54.3 | % | $ | 229,251 | ||||||||||||||
| Patrick T. Hagerty |
$ | 315,000 | 100 | % | $ | 315,000 | 100.0 | % | 40.9 | % | 85.2 | % | $ | 268,459 | ||||||||||||||
Sign-on Bonuses
From time to time, the Committee may award sign-on bonuses in connection with the commencement of an NEO’s employment with us. Sign-on bonuses are used only when necessary to attract highly skilled officers to the Company. Generally they are used to provide an incentive to candidates to leave their current employers or may be used to offset the loss of unvested compensation that they may forfeit as a result of leaving their current employers. Sign-on bonuses are typically subject to a clawback obligation if the officer voluntarily terminates his employment with us within twelve months of the employment commencement date.
Long-Term Equity Incentive Awards
We believe that the NEOs’ long-term compensation should be directly linked to the value we deliver to our stockholders. Equity awards to the NEOs are designed to provide long-term incentive opportunities over a period
94
Table of Contents
of several years. Stock options have been our preferred equity award because the options will not have any value unless the underlying shares of common stock appreciate in value following the grant date. Accordingly, awarding stock options causes more compensation to be “at risk” and further aligns our executive compensation with our long-term profitability and the creation of shareholder value. Our 2007 Amended and Restated Management Option Plan (the “2007 Stock Option Plan”) does not permit us to grant any type of equity-based award other than nonqualified stock options. See “Description of Equity-Based Awards” below for a description of the options that we have granted to our NEOs pursuant to the 2007 Stock Option Plan.
Another key component of our long-term equity incentive program is that NEOs and other eligible employees have been provided with the opportunity to invest in our common stock on the same general terms as our existing owners. We consider this investment opportunity an important part of our equity program because it encourages stock ownership and aligns the NEOs’ financial interests with those of our stockholders. Each of our NEOs, when presented with the opportunity, chose to invest in our common stock.
The amounts of each NEO’s investment opportunity and stock option award, as applicable, were determined based on several factors, including: (1) each NEO’s position and expected contribution to our future growth; (2) dilution effects on our stockholders and the need to maintain the availability of an appropriate number of shares for option awards to less-senior employees; and (3) ensuring that the NEOs were provided with appropriate and competitive total long-term equity compensation and total compensation amounts.
In connection with this offering, we expect to adopt a new incentive plan pursuant to which we will grant any future long-term equity incentive awards. See “Equity Incentive Plans—2014 Omnibus Incentive Plan” below.
Benefits and Perquisites
We provide to all our employees, including our Named Executive Officers, broad-based benefits that are intended to attract and retain employees while providing them with retirement and health and welfare security. Broad-based employee benefits include:
| • | a 401(k) savings plan; |
| • | medical, dental, vision, life, and accident insurance, disability coverage, dependent care and healthcare flexible spending accounts; and |
| • | employee assistance program benefits. |
We maintain a qualified contributory retirement plan (the “401(k) plan”) that is intended to qualify as a profit sharing plan under Section 401(k) of the Internal Revenue Code of 1986, as amended (the “Code”). Eligible employees, including our named executive officers, may contribute up to 50% of their eligible compensation, subject to statutory limits imposed by the Code. We are also permitted to make profit sharing contributions and matching contributions, and currently provide for matching contributions equal to 100% of employee contributions up to 3.5% of eligible compensation. Our contributions to the plan are determined annually by the Board of Directors of the Company, subject to certain minimum requirements specified in the plan. All matching contributions by us become vested on the four-year anniversary of the participant’s hire date. As of January 1, 2009, the 401(k) plan merged with the Self-Directed Tax Advantaged Retirement (STAR) Plan of PFGC, Inc. Employees employed on or before December 31, 2008 are also eligible for an annual contribution based on the employee’s salary and years of service (a “STAR Contribution”). Messrs. Holm and Hagerty are eligible to receive the additional STAR Contributions.
In addition, at no cost to the employee, we provide an amount of basic life and accident insurance coverage valued at one times annual salary to a maximum of $1 million combined benefit.
95
Table of Contents
We also provide our executive officers with limited perquisites and personal benefits that are not generally available to all employees, such as an annual auto allowance, reimbursement of relocation expenses, and temporary housing allowances. We provide these limited perquisites and personal benefits in order to further our goal of attracting and retaining our executive officers. The benefits and perquisites not generally available to all employees provided to our NEOs in fiscal 2014 are reflected in the All Other Compensation column of the Summary Compensation Table and the accompanying footnote in accordance with SEC rules.
Severance and Other Benefits
We believe that severance protections can play a valuable role in attracting and retaining high caliber talent. In the competitive market for executive talent, we believe severance payments and other termination benefits are an effective way to offer executives financial security to offset the risk of foregoing an opportunity with another company. Consistent with our objective of using severance payments and benefits to attract and retain executives, our Senior Management Severance Plan (the “Severance Plan”) provides our executives with severance benefits that we believe will permit us to attract and/or continue to employ high caliber talent.
Each of our named executive officers, other than Mr. Holm, whose employment agreement contains separate severance terms, is eligible for the Severance Plan benefits under the terms of the Severance Plan, as modified by the severance letter agreements we have entered into with Messrs. Evans, Pearce, and Hagerty, and Ms. Price (the “Severance Letter Agreements”). Mr. Holm is eligible for severance benefits under the terms of his employment agreement. See “—Potential Payments Upon Termination or Change in Control” for descriptions of these arrangements.
Section 162(m) of the Internal Revenue Code
Following this offering, we expect to be able to claim the benefit of a special exemption rule that applies to compensation paid (or compensation in respect of equity awards such as stock options or restricted stock granted) during a specified transition period. This transition period may extend until the first annual stockholders meeting that occurs after the close of the third calendar year following the calendar year in which this offering occurs, unless the transition period is terminated earlier under the Section 162(m) of the Code post-offering transition rules. At such time as we are subject to the deduction limitations of Section 162(m) of the Code, we expect that the Committee will take the deductibility limitations of Section 162(m) of the Code into account in its compensation decisions; however, the Committee may, in its judgment, authorize compensation payments that are not exempt under Section 162(m) of the Code when it believes that such payments are appropriate to attract or retain talent.
96
Table of Contents
Summary Compensation Table
The following table provides summary information concerning the compensation of our Chief Executive Officer, our Chief Financial Officer, and each of our other NEOs.
| Name and Principal Position |
Year | Salary ($)(1) |
Non-Equity Incentive Plan Compensation ($)(2) |
All Other Compensation ($)(3) |
Total ($) |
|||||||||||||||
| George L. Holm |
2014 | 976,058 | 409,160 | 33,037 | 1,418,255 | |||||||||||||||
| President and Chief Executive Officer |
||||||||||||||||||||
| Robert D. Evans |
2014 | 418,077 | 171,847 | 27,697 | 617,621 | |||||||||||||||
| Senior Vice President and Chief Financial Officer |
||||||||||||||||||||
| William M. Pearce |
2014 | 420,077 | 229,251 | 27,699 | 677,027 | |||||||||||||||
| Executive Vice President of the Company and President and Chief Executive Officer, Performance Foodservice | ||||||||||||||||||||
| Patrick T. Hagerty |
2014 | 312,115 | 268,459 | 40,383 | 620,957 | |||||||||||||||
| Senior Vice President of the Company and President and Chief Executive Officer, Vistar | ||||||||||||||||||||
| Carol A. Price |
2014 | 317,885 | 130,931 | 27,571 | 476,387 | |||||||||||||||
| Senior Vice President and Chief Human Resources Officer | ||||||||||||||||||||
| (1) | Our practice is to review executive compensation in the first quarter of each year. As a result of our annual review, effective September 1, 2013, Mr. Holm’s base salary increased from $875,000 to $1,000,000, Mr. Evans’s base salary increased from $410,000 to $420,000, Mr. Pearce’s base salary increased from $412,000 to $422,000, Mr. Hagerty’s base salary increased from $300,000 to $315,000, and Ms. Price’s base salary increased from $309,000 to $320,000. |
| (2) | Reflects amounts earned under our fiscal 2014 MIP. |
| (3) | Amounts reported under All Other Compensation for fiscal 2014 include contributions to our 401(k) plan on behalf of our named executive officers, including annual STAR Contributions under our 401(k) plan, as follows: Mr. Holm, annual STAR Contribution of $7,650; Mr. Evans, matching contribution of $9,100; Mr. Pearce, matching contribution of $9,100; Mr. Hagerty, matching contribution of $9,188 and annual STAR Contribution of $12,750; and Ms. Price, matching contribution of $9,118. Amounts reported for each named executive officer also include annual auto allowances as well as amounts with respect to the payment of life insurance premiums. |
Grants of Plan-Based Awards in Fiscal 2014
The following table provides supplemental information relating to grants of plan-based awards made during fiscal 2014 to help explain information provided above in our Summary Compensation Table. This table presents information regarding all grants of plan-based awards occurring during fiscal 2014.
| Estimated Possible Payouts Under Non-equity Incentive Plan Awards(1) |
||||||||||||
| Name |
Threshold ($) | Target ($) | Maximum ($) | |||||||||
| George L. Holm |
$ | 150,000 | $ | 1,000,000 | $ | 1,330,000 | ||||||
| Robert D. Evans |
$ | 63,000 | $ | 420,000 | $ | 558,600 | ||||||
| William M. Pearce |
$ | 15,825 | $ | 422,000 | — | (2) | ||||||
| Patrick T. Hagerty |
$ | 11,813 | $ | 315,000 | $ | 340,988 | ||||||
| Carol A. Price |
$ | 48,000 | $ | 320,000 | $ | 425,600 | ||||||
97
Table of Contents
| (1) | Figures represent awards payable under our Management Incentive Plan (MIP). See “Compensation Discussion and Analysis— Executive Compensation Program Elements—Cash Bonus Opportunities—Annual Cash Bonus Opportunity” above for a description of our MIP. |
| (2) | Since Mr. Pearce’s annual cash bonus may be increased for each percentage point increase above the minimum threshold percentage growth rates of (1) our sales to Street customers by volume and (2) our sales of Performance Brands by volume, his potential annual cash bonus is uncapped. Accordingly, no maximum value is reported in this column for Mr. Pearce. |
Summary of Employment Agreement of Mr. Holm
This section describes the employment agreement in effect for Mr. Holm during fiscal 2014. In addition, the terms with respect to grants of stock options are described below for our NEOs in the section entitled “Description of Equity-Based Awards.” Severance agreements and arrangements are described below in the section entitled “Potential Payments upon Termination or Change in Control.”
Mr. Holm’s employment agreement, dated as of September 6, 2002, as amended effective January 2003, provides that he serves as President and Chief Executive Officer, for an initial term of three years that automatically extends for successive automatic one-year periods, unless we or Mr. Holm elect not to extend the term by providing 30 days’ advance notice.
Mr. Holm’s employment agreement establishes: (1) an initial base salary, subject to discretionary annual increases; (2) eligibility to receive an annual bonus, with a target amount equal to 100% of his base salary if performance targets set by the Committee are achieved, which he may elect to receive as shares of our common stock; and (3) a requirement that he purchase $2 million of our common stock. Mr. Holm is also entitled to participate in all employee benefit and fringe plans made available to our employees generally.
Mr. Holm’s employment agreement also contains restrictive covenants, including an indefinite covenant not to disclose confidential information and not to disparage us, and, during Mr. Holm’s employment and for the one-year period following the termination of his employment, covenants related to non-competition and non-solicitation of our employees, customers, or suppliers.
Mr. Holm’s letter agreement also provides for severance benefits following certain terminations of employment. See “Potential Payments Upon Termination or Change in Control” for a description of these provisions.
Description of Equity-Based Awards
Each NEO’s equity-based award was granted under, and is subject to the terms of, the 2007 Stock Option Plan. The material terms of the 2007 Stock Option Plan are described below under the heading “Equity Incentive Plans.”
One third of the options granted to each of our NEOs are subject solely to time-based vesting restrictions and two thirds of the options granted to each of our NEOs are subject to time and exit event-based criteria. The time-based options are scheduled to vest based on a five-year vesting schedule and, subject to continued employment with us through the applicable vesting dates, 20% of the options subject to time-based vesting will vest and become exercisable on each of the first five anniversaries of the date of grant. The time and exit-based options will only be deemed vested when they have both time vested and performance vested. The time and exit-based options time vest in the same manner as the time-based options. Subject to time vesting and continued employment with us through the date of the relevant event, these time and exit-based options will vest and become exercisable in two tiers upon a Change in Control (as defined in the 2007 Stock Option Plan) or an initial public offering of our common stock if, as of the relevant measurement date, the following specified internal rate of return and multiple of investment targets are achieved:
| • | One half of the shares subject to the time and exit event-vesting options will vest on the relevant measurement date, if any, if (1) the Sponsors have received a cash internal rate of return of at least 17.5% |
98
Table of Contents
| of their initial investment in us and (2) the Sponsors have received cash payments (excluding management and transaction fees and expense reimbursements) for equity securities (including securities which are convertible into equity securities) of the Company from August 24, 2007 until the relevant measurement date (“Sponsor Inflows”) aggregating in excess of 2.0 times the amount of their cash payments for equity securities (including securities which are convertible into equity securities) of the Company from August 24, 2007 until the relevant measurement date (“Sponsor Outflows”); and |
| • | One half of the shares subject to the time and exit event-vesting options will vest on the relevant measurement date, if any, if (1) the Sponsors have received a cash internal rate of return of at least 22.5% of their initial investment in us and (2) the Sponsors have received Sponsor Inflows aggregating in excess of 2.5 times Sponsor Outflows. |
If the measurement date is the date of consummation of a Change in Control, any equity securities (including securities which are convertible into equity securities) held by the Sponsors and not transferred in such Change in Control will be deemed to have been sold on such measurement date for the price per share for such equity securities implied by the Change in Control. After consummation of an initial public offering, the measurement date will be the last day of the 90 consecutive trading days following their initial public offering and any equity securities (including securities which are convertible into equity securities) held by the Sponsors will be deemed to have been sold as of such measurement date for a price equal to the weighted average (by dollar volume) of the closing trading price for each of the 90 consecutive trading days ending on such measurement date.
Any part of an NEO’s stock option award that is not vested and exercisable upon his termination of employment will be immediately cancelled. In addition, upon consummation of a Change in Control or an initial public offering of our common stock, all unvested time and exit-vesting options will be cancelled at the time of such consummation if they do not otherwise vest in connection with the Change in Control or initial public offering, in each case as of the relevant measurement date. Any part of an NEO’s stock option award that is vested upon termination of employment will generally remain outstanding and exercisable for 30 days after termination of employment, although this period is extended to 90 days if the termination of employment is due to disability and to 180 days if the termination of employment is due to death, and vested options will immediately terminate if the NEO’s employment is terminated by us for cause. Any vested options that are not exercised within the applicable post-termination exercise window will terminate. Please see “Potential Payments Upon Termination or Change in Control” below for a description of the potential vesting of the NEOs’ stock option awards that may occur in connection with certain terminations of employment.
Executives receiving awards under the 2007 Stock Option Plan are subject to restrictive covenants, including an indefinite covenant not to disclose confidential information, and, during the executive’s employment and for the one-year period following the termination of his or her employment, covenants related to non-competition and non-solicitation of our employees, customers, or suppliers.
Under the terms of the 2007 Stock Option Plan, exercise by each NEO of any options will constitute agreement by such NEO to be bound by all the terms and conditions of our stockholders agreement and registration rights agreement with respect to the shares received upon such exercise or any other shares of our common stock issuable to or held by such NEO. These agreements generally govern the NEOs’ rights with respect to any shares of our common stock acquired on exercise of vested stock options, to the extent applicable.
99
Table of Contents
The following table provides information regarding outstanding equity awards held by each NEO as of June 29, 2014.
Outstanding Equity Awards at 2014 Fiscal-Year End
| Option Awards | ||||||||||||||||||||||||
| Name |
Grant Date | Number Securities Underlying Unexercised Options (#) Exercisable(1) |
Number of Securities Underlying Unexercised Options (#) Unexercisable |
Equity Incentive Plan Awards: Number of Securities Underlying Unexercised Unearned Options (#) |
Option Exercise Price ($) |
Option Expiration Date(2) |
||||||||||||||||||
| George L. Holm |
12/11/2008 | 463,303.00 | 0 | 926,606.00 | 3.72 | 12/11/2018 | ||||||||||||||||||
| 8/24/2007 | 382,513.66 | 0 | 765,027.32 | 1.89 | 8/24/2017 | |||||||||||||||||||
| Robert D. Evans |
1/8/2010 | 72,859.73 | 18,214.93 | 182,149.33 | 3.72 | 1/8/2020 | ||||||||||||||||||
| William M. Pearce |
12/11/2008 | 133,566.67 | 0 | 267,133.33 | 3.72 | 12/11/2018 | ||||||||||||||||||
| Patrick T. Hagerty |
12/11/2008 | 16,666.67 | 0 | 33,333.33 | 3.72 | 12/11/2018 | ||||||||||||||||||
| 8/24/2007 | 109,289.62 | 0 | 218,579.23 | 1.89 | 8/24/2017 | |||||||||||||||||||
| Carol A. Price |
11/22/2011 | 30,400.00 | 45,600.00 | 152,000.00 | 5.03 | 11/22/2021 | ||||||||||||||||||
| (1) | The number of outstanding time-vesting options vested and exercisable are reported in column (b) above. Unvested outstanding time-vesting options are reported in column (c) above and ordinarily vest 20% a year over five years on each anniversary of the grant date, subject to continued employment through the applicable vesting dates as described in the “Description of Equity-Based Awards” section above. Unvested outstanding time and exit-vesting options are reported in column (d) above and ordinarily become vested pursuant to the vesting schedule for time and exit-vesting options described in the “Description of Equity-Based Awards” section above. None of the outstanding time and exit-vesting options have vested. As described in the “Potential Payments Upon Termination or Change in Control” section below, all or a portion of each option grant may vest earlier in connection with a change in control of the Company. |
| (2) | The expiration date shown is the normal expiration date occurring on the tenth anniversary of the grant date. Options may terminate earlier in certain circumstances, such as in connection with an NEO’s termination of employment or in connection with certain corporate transactions, including a change in control or initial public offering of the Company. |
Option Exercises and Stock Vested in Fiscal 2014
During fiscal 2014, the NEOs did not exercise any options or similar instruments or vest in any stock or similar instruments
Pension Benefits
We have no pension benefits for our executive officers.
Non-qualified Deferred Compensation-Fiscal 2014
We have no non-qualified defined contribution or other nonqualified deferred compensation plans for our executive officers.
100
Table of Contents
Potential Payments Upon Termination or Change in Control
The following table describes the potential payments and benefits that would have been payable to our Named Executive Officers under existing plans assuming an eligible termination (as described below under “—Severance Arrangements and Restrictive Covenants”) of their employment on June 27, 2014.
The amounts shown in the table do not include payments and benefits to the extent they are provided generally to all salaried employees upon termination of employment and do not discriminate in scope, terms, or operation in favor of the named executive officers. These include accrued but unpaid salary and distributions of vested plan balances under our 401(k) savings plan.
| Name |
Cash Severance Payment ($)(1) |
Continuation of Group Health Plans ($)(2) |
Value of Stock Option Acceleration ($)(3) |
Value of 401(k) Match Acceleration ($)(4) |
Total ($) |
|||||||||||||||
| George L. Holm |
||||||||||||||||||||
| Termination |
261,538 | 6,716 | — | — | 268,254 | |||||||||||||||
| Change in Control |
— | — | — | — | — | |||||||||||||||
| Robert D. Evans |
||||||||||||||||||||
| Termination |
444,231 | 4,785 | — | — | 449,016 | |||||||||||||||
| Change in Control |
— | — | 56,284 | — | 56,284 | |||||||||||||||
| William M. Pearce |
||||||||||||||||||||
| Termination |
446,346 | 16,023 | — | — | 462,369 | |||||||||||||||
| Change in Control |
— | — | — | — | — | |||||||||||||||
| Patrick T. Hagerty |
||||||||||||||||||||
| Termination |
339,231 | 17,643 | — | — | 356,874 | |||||||||||||||
| Change in Control |
— | — | — | — | — | |||||||||||||||
| Carol A. Price |
||||||||||||||||||||
| Termination |
338,462 | 7,758 | — | 9,118 | 355,338 | |||||||||||||||
| Change in Control |
— | — | 81,168 | — | 81,168 | |||||||||||||||
| (1) | Cash severance payment includes the following: |
| • | Mr. Holm—continued payment of his base salary through the expiration of his employment agreement ($203,846) plus the value of his accrued but unused vacation days ($57,692). |
| • | Mr. Evans—52 weeks’ base salary ($420,000) plus the value of his accrued but unused vacation days ($24,231). |
| • | Mr. Pearce—52 weeks’ base salary ($422,000) plus the value of his accrued but unused vacation days ($24,346). |
| • | Mr. Hagerty—52 weeks’ base salary ($315,000) plus the value of his accrued but unused vacation days ($24,231). |
| • | Ms. Price—52 weeks’ base salary ($320,000) plus the value of her accrued but unused vacation days ($18,462). |
The amount of cash severance does not include amounts payable under the MIP because these amounts are accrued and payable as of the last day of the fiscal year regardless of whether an employee is employed on the applicable payment date.
| (2) | With respect to Mr. Holm, reflects the cost of providing the executive officer with continued health, dental, vision, prescription drug, and mental health coverage as enrolled at the time of his termination through the expiration of his employment agreement. With respect to Messrs. Evans, Pearce, and Hagerty and Ms. Price, |
101
Table of Contents
| reflects the cost of providing continued group health coverage (on the same basis such coverage was received at the time of the executive’s termination), subject to the executive’s electing to receive benefits under COBRA, for a period of 52 weeks. |
| (3) | Upon a change in control, our Named Executive Officers’ unvested options subject solely to time-based vesting would become immediately vested. The amounts reported are based on the Company’s common stock having a value of $6.81 per share on June 29, 2014. The amounts reported reflect the “spread” value of the options of $3.09 per share for the options subject solely to time-based vesting granted on January 8, 2010 and $1.78 per share for the options subject solely to time-based vesting granted on November 22, 2011, in each case representing the difference between the value as of June 29, 2014 and the exercise price. Amounts reported assume that the time and exit-vesting options do not vest upon a change in control. |
| (4) | The Company’s contributions to our named executive officers’ 401(k) accounts would be accelerated only upon termination because of death or disability. Each of our Named Executive Officers other than Ms. Price is fully vested in his 401(k) plan account. |
Severance Arrangements and Restrictive Covenants
We have adopted the Severance Plan for the benefit of certain key employees. Each of the Named Executive Officers other than Mr. Holm, whose severance terms are contained in his employment agreement, is eligible for severance pay and benefits under the Severance Plan.
Mr. Holm
Under the terms of his employment agreement, if, prior to the expiration of the term of his employment agreement, (1) the Company terminates Mr. Holm’s employment other than for “cause” or other than by reason of his “disability” or (2) Mr. Holm terminates his employment for “good reason,” then, subject to his execution of a valid release and waiver of claims and his continued compliance with the restrictive and future cooperation covenants in his employment agreement, Mr. Holm will be entitled to receive:
| • | continued payment of his base salary for the remainder of the then-existing term of his employment agreement; |
| • | a lump sum payment equal to his annual bonus for the fiscal year in which the termination occurs, based on Company performance during such year through the date of his termination, prorated for the portion of the year actually worked; and |
| • | continued group health coverage (on the same basis such coverage was received at the time of his termination) for the remainder of the then-existing term of his employment agreement. |
For purposes of the severance provisions of Mr. Holm’s employment agreement:
| • | “cause” means a finding by the Company that he has (1) committed a felony or a crime involving moral turpitude, (2) committed any act of gross negligence or fraud, (3) failed, refused, or neglected to substantially perform his duties (other than by reason of a physical or mental impairment) or to implement the directives of the Company, or materially breached any provision of his employment agreement, where such failure, refusal, neglect, or breach continued for 30 days after he had received written notice thereof, or (4) engaged in conduct that is materially injurious to the Company, monetarily or otherwise. |
| • | “disability” means a finding by the Company that Mr. Holm has been unable to perform his job functions by reason of a physical or mental impairment for a period of 180 days within a period of 360 consecutive days. |
| • | “good reason” means (1) a material breach by the Company of any provision of Mr. Holm’s employment agreement that continues for 30 days after Mr. Holm has provided the Company with written notice thereof, or (2) the principal place of Mr. Holm’s employment is relocated more than 100 miles from his principal place of employment on the effective date of his employment agreement. |
102
Table of Contents
Messrs. Evans, Pearce, and Hagerty and Ms. Price
Under the terms of the Severance Plan, as modified by their Severance Letter Agreements, if any of Mr. Evans’s, Mr. Pearce’s, Mr. Hagerty’s, or Ms. Price’s employment terminates other than (1) for “cause”; (2) because of a layoff relating to which he or she has recall or rehire rights; (3) due to his or her voluntary retirement, voluntary resignation (other than for “good reason”), “disability,” or death; or (4) because of any cause beyond the reasonable control of the Company, including, but not limited to, inclement weather, war, riot, malicious or terrorist acts of damage, civil commotion, power failure, fire, or unforeseeable acts of third parties, upon proper execution and filing of a valid release agreement, the Named Executive Officer will be entitled to receive:
| • | continued payment of base salary at the level of the executive’s base salary immediately before his or her termination for 52 weeks; |
| • | the annual bonus, if any, that he or she would have been entitled to receive, if such termination of employment had not occurred, based on the Company’s achievement of the applicable performance targets, in respect of the year of such termination, prorated for the portion of the year actually worked and payable at such time as annual bonuses are paid to other executives of the Company, but no later than two and one-half months after the last day of the performance year to which such bonus relates; and |
| • | continued group health coverage (on the same basis such coverage was received at the time of the executive’s termination), subject to the executive’s electing to receive benefits under the Consolidated Omnibus Budget Reconciliation Act of 1985 (“COBRA”) until the earlier of (x) the last day of the month in which his or her severance pay ends (or if paid in a lump sum, when the pay would have ended if paid in equal installments); or (y) the date his or her coverage under the Company health plan ends for any other reason. |
Under the terms of the Severance Plan, if an executive is re-employed by the Company within six months of his or her termination, he or she must return any severance payments in excess of the base pay he or she would have been paid during the time of unemployment if he or she had not experienced a termination of employment.
In addition to the foregoing, if Ms. Price were to be terminated because of her death or disability, she would be entitled to acceleration of the vesting of our contributions to her 401(k) plan account. Each of our other NEOs is fully vested in our contributions to his account.
For purposes of the Severance plan:
| • | “cause” means termination for any of the following reasons: (1) failure to perform the executive’s assigned duties, including failure to comply with Company policies; (2) conviction (including any plea of nolo contendre) of any felony or crime involving dishonesty or moral turpitude; (3) act of personal dishonesty knowingly taken in connection with the executive’s responsibilities as an associate of the Company and which is intended to result in the executive’s personal enrichment or that of any other person; (4) bad faith conduct that is materially detrimental to the Company; (5) inability of the executive to perform his or her duties because of his or her alcohol or drug use; (6) failure to comply with any legal written directive of the Board of Directors of the Company; (7) any act or omission of substantial detriment to the Company because of the executive’s intentional failure to comply with any statute, rule, or regulation, except any act or omission the executive believes in good faith to have been in or not opposed to the best interest of the Company (without the executive’s intent to gain, directly or indirectly, a profit to which the executive is not legally entitled) or any act or omission resulting from the executive’s bad judgment or negligence other than habitual neglect of duty; or (8) insubordination or any other act, or failure to act, or other conduct which is determined by the Company, in its sole discretion, to be demonstrably and materially injurious to the Company monetarily or otherwise. |
| • | “disability” means a physical or mental condition which qualifies an executive for benefits under the Company’s long-term disability plan or, in the absence of such a plan, a physical or mental condition pursuant to which the executive has become entitled to a disability award under the U.S. Social Security Act. |
103
Table of Contents
For purposes of the Severance Plan, as modified by Messrs. Evans’s, Pearce’s, and Hagerty’s and Ms. Price’s Severance Letter Agreements:
| • | “good reason” means, provided that the Company has failed to cure such event within 30 days of receipt of written notice from the executive of such event and that such event occurred within fewer than 90 days of the executive’s resignation, (1) a diminution in the executive’s base salary or annual bonus opportunity; (2) any material diminution in the executive’s authority, duties, or responsibilities; (3) failure of the Company or its subsidiaries to pay or cause to be paid the executive’s base salary or annual bonus, when due; or (4) relocation of the executive’s principal place of employment more than 50 miles from the Richmond, Virginia metropolitan area in the cases of Messrs. Evans and Pearce and Ms. Price or 50 miles from its current location (Littleton, CO) in the case of Mr. Hagerty. |
In addition to the foregoing, we provide each of our Named Executive Officers with basic life and accident insurance coverage valued at one times annual salary to a maximum of $1 million combined benefit. Therefore, if the benefits were triggered on June 27, 2014 under our life insurance plans, the designated beneficiaries of our NEOs would have received the following amounts: Mr. Holm ($1,000,000), Mr. Evans ($420,000), Mr. Pearce ($422,000), Mr. Hagerty ($315,000), and Ms. Price ($320,000).
Equity Incentive Plans
2007 Stock Option Plan
Effective August 24, 2007, we adopted the 2007 Stock Option Plan. In connection with the transaction combining the businesses of Performance Food Group Company and Vistar Corp., we amended and restated the 2007 Stock Option Plan effective May 23, 2008.
Following the offering, we will no longer grant equity-based awards under the 2007 Stock Option Plan; however, any outstanding stock options granted under the 2007 Stock Option Plan prior to the offering will remain outstanding in accordance with the terms of the 2007 Stock Option Plan. New equity-based awards will be granted under the 2014 Omnibus Incentive Plan, which we intend to adopt in connection with this offering. The following description sets forth the material terms of the 2007 Stock Option Plan, which is incorporated herein by reference.
General Information
The purpose of the 2007 Stock Option Plan is to promote the long-term growth and profitability of the Company and its subsidiaries by providing individuals who are or will be involved in the Company’s and its subsidiaries’ growth with an opportunity to acquire an ownership interest in the Company. We expect that we will benefit from the added interest that such officers, directors, employees, consultants, or advisors will have in our welfare as a result of their proprietary interest in our success.
Administration
The 2007 Stock Option Plan is administered by our board of directors, or such duly authorized committee of our board of directors or any other persons to which our board of directors has, to the extent permissible by law, delegated power to act under or pursuant to the provisions of the 2007 Stock Option Plan (the “2007 Plan Committee”). The 2007 Plan Committee has the power to prescribe, amend, and rescind rules and procedures governing the administration of the 2007 Stock Option Plan, including, but not limited to the full power and authority to interpret the 2007 Stock Option Plan, the terms of any awards made under the 2007 Stock Option Plan, and the rules and procedures established by the 2007 Plan Committee; to determine the rights of any person under the 2007 Stock Option Plan, or the meaning of requirements imposed by the terms of the 2007 Stock
104
Table of Contents
Option Plan or any rule or procedure established by the 2007 Plan Committee; to select officers, directors, employees, consultants, and advisors of the Company or its subsidiaries for awards under the 2007 Stock Option Plan; to set the exercise price of any options granted under the 2007 Stock Option Plan; to establish performance and vesting standards; to impose such limitations, restrictions, and conditions upon such awards as it deems appropriate; to adopt, amend, and rescind administrative guidelines and other rules and regulations relating to the 2007 Stock Option Plan; to correct any defect or omission or reconcile any inconsistency in the 2007 Stock Option Plan; and to make all other determinations and to take all other actions necessary or advisable for the implementation and administration of the 2007 Stock Option Plan, subject to such limitations as may be imposed by the Code, or other applicable law. The Company will require payment, or deduction from payments under the 2007 Stock Option Plan, of any amount it may determine to be necessary to withhold for federal, state, local, or other taxes as a result of the exercise, grant, or vesting of an award issued pursuant to the 2007 Stock Option Plan. Unless otherwise expressly provided in an award agreement under the 2007 Stock Option Plan, the 2007 Plan Committee may, in its discretion permit a participant to satisfy his or her tax withholding obligation either by (i) surrendering shares received upon exercise of options awarded under the plan owned by the participant or (ii) having the Company withhold from shares otherwise deliverable to such participant upon exercise of an option.
Eligibility
The 2007 Stock Option Plan permits the grant of stock options to our and our subsidiaries’ present and future officers, directors, employees, consultants, and advisors. Participants are selected from time to time by the 2007 Plan Committee, in its sole discretion, from among those eligible to participate in the 2007 Stock Option Plan.
Stock Subject to the 2007 Stock Option Plan
Subject to adjustment as discussed below, a maximum of 13,290,684 shares of our Class B common stock may be reserved for issuance with respect to options awarded under the 2007 Stock Option Plan. The issuance of shares or the payment of cash upon the exercise of an award or in consideration of the cancellation or termination of an award will reduce the total number of shares available under the 2007 Stock Option Plan, as applicable. If any options awarded under the 2007 Stock Option Plan expire unexercised or unpaid or are canceled, terminated, or forfeited in any manner without the issuance of Class B common stock or payment thereunder, the shares with respect to which such options were granted shall again be available under the 2007 Stock Option Plan. Similarly, if any shares of Class B common stock issued under the 2007 Stock Option Plan are repurchased under the 2007 Stock Option Plan, such shares will again be available under the 2007 Stock Option Plan for reissuance. As of June 28, 2014, 11,984,007 stock options have been granted and are outstanding under the 2007 Stock Option Plan.
Awards
Awards granted under the 2007 Stock Option Plan will be in the form of non-qualified stock options, and will be subject to the foregoing and the following terms and conditions, evidenced by award agreements, and to such other terms and conditions that are not inconsistent therewith, as the 2007 Plan Committee determines:
(1) Price. The option price per share will be determined by the 2007 Plan Committee and will be consistent with the 2007 Stock Option Plan.
(2) Exercisability. Options granted under the 2007 Stock Option Plan will be exercisable only to the extent they are vested and at such time and upon such terms and conditions as may be determined by the 2007 Plan Committee, consistent with the 2007 Stock Option Plan.
(3) Exercise of Options. Except as otherwise provided in the 2007 Stock Option Plan or in an award agreement, an option may be exercised for all, or from time to time any part, of the shares for which it is then
105
Table of Contents
exercisable. The purchase price for the shares underlying the option being exercised will be paid to us by cashier’s, certified check, or wire transfer. In addition, at the discretion of the 2007 Plan Committee, which discretion will be exercised (among other considerations) in a manner intended (as determined in good faith by the 2007 Plan Committee) to cause such option not to be treated as deferred compensation within the meaning of the Code, a participant may exercise options without payment in cash therefor pursuant to a cashless exercise of such options. No participant has any rights to dividends or other rights of a stockholder with respect to shares subject to an option until the date on which a stock certificate is issued to such participant in respect of such shares.
Adjustments
In the event of any change in the outstanding shares by reason of any reorganization, recapitalization, stock split, stock dividend, combination of shares, merger, consolidation, or other change in the Class B common stock, the 2007 Plan Committee shall make such changes in the number and type of shares of Class B common stock covered by the outstanding awards and the terms thereof as the 2007 Plan Committee determines in its sole discretion are necessary to prevent dilution or enlargement of rights of participants under the Plan. In the event of any such transaction, the 2007 Plan Committee shall have the power to make such changes as it deems appropriate in the number and type of shares covered by outstanding awards, the prices specified therein, and the securities or other property to be received upon exercise (which may include providing for cash payment in exchange for cancellation of outstanding options (or no consideration in the case of unvested options)).
Change in Control
Under the 2007 Stock Option Plan, a change in control means: (i) prior to an Initial Public Offering, any transaction or series of related transactions that result in the Sponsors ceasing collectively to own shares of the Company’s Class A common stock, par value $.01 per share and Class B common stock, par value $0.01 per share (collectively, the “Common Stock”) which represent at least 50% of the total voting power or economic interest in the Company, (ii) at any time, any transaction or series of related transactions that result in an Independent Third Party (as defined in the 2007 Stock Option Plan) acquiring shares of Common Stock that represent more than 50% of the total voting power or economic interest in the Company, and (iii) at any time, a sale or disposition of all or substantially all of the assets of the Company and its subsidiaries on a consolidated basis; provided that, in the case of clauses (i) and (ii) above, such transactions shall only constitute a change in control if they result in the Sponsors ceasing to have the power (whether by ownership of voting securities, contractual right, or otherwise) collectively to elect a majority of our Board of Directors.
In the event of a change in control, all time-vesting options awarded under the 2007 Stock Option Plan shall be considered 100% vested.
Amendment and Termination
The 2007 Plan Committee may at any time suspend or terminate the 2007 Stock Option Plan and make such additions or amendments as it deems advisable under the 2007 Stock Option Plan. The 2007 Plan Committee may not, however, change any of the terms of an award agreement in a manner adverse to a participant without the prior written approval of such participant.
Non-Transferability
Unless otherwise determined by the 2007 Plan Committee, an award is not transferable or assignable by the participant otherwise than by will or by the laws of descent and distribution. An award issued pursuant to the 2007 Stock Option Plan exercisable after the death of a participant may be exercised by the estate, personal representatives, heirs, spouse, or descendants of the participant and any trust created solely for the benefit of the spouse and descendants of the participant and their spouses and each custodian or guardian of any property of
106
Table of Contents
such persons in his or her capacity as such custodian or guardian (such persons, collectively, “Permitted Transferees”). Any shares issued upon exercise of an option awarded pursuant to the 2007 Stock Option Plan to the participant or Permitted Transferee are not transferable except in accordance with the terms of the 2007 Stock Option Plan until the occurrence of a change in control.
No Right to Employment
The granting of an award under the 2007 Stock Option Plan imposes no obligation on us or any of our subsidiaries to continue the employment of a participant and does not lessen or affect our or our subsidiaries’ right to terminate the employment of such participant.
Restrictive Covenants
Executives receiving awards under the 2007 Stock Option Plan are subject to restrictive covenants, including an indefinite covenant not to disclose confidential information, and, during the executive’s employment and for the one-year period following the termination of his or her employment, covenants related to non-competition and non-solicitation of our employees, customers, or suppliers.
Repurchase of Shares
In the event that an executive is no longer employed by us or any of our subsidiaries for any reason, all Class B common stock issued or issuable to the executive upon his or her exercise of options granted under the 2007 Stock Option Plan (“Award Stock”) are subject to repurchase by us and the Sponsors (solely at our option) by delivering a repurchase notice within specified time periods. If an executive is no longer employed by us as a result of any reason other than termination for Cause (as defined in the 2007 Stock Option Plan) or other than resignation by the executive (other than for retirement), then on or after the date of such executive’s termination of employment, we may elect to purchase all or any portion of the Award Stock at a price per share equal to the fair market value, as determined in good faith by the 2007 Plan Committee (the “Fair Market Value”) of such shares of Award Stock, as of the anticipated date of the repurchase. In the event that an executive is no longer employed by us as a result of termination for Cause or resignation by the executive for any reason (other than for retirement), the repurchase price will be the lower of Fair Market Value and the exercise price paid by the executive (as adjusted) (the “Original Value”). In the event that an executive resigns because of retirement and subsequently breaches the non-competition or non-solicitation covenant within one year of such executive’s termination, the repurchase price will be the lower of the Fair Market Value and Original Value. The option to repurchase terminates upon a Change in Control or an Initial Public Offering.
2014 Omnibus Incentive Plan
In connection with this offering, our board of directors expects to adopt, and our stockholders expect to approve, the Performance Food Group Company 2014 Omnibus Incentive Plan (our “2014 Omnibus Incentive Plan”) prior to the completion of the offering.
Purpose. The purpose of our 2014 Omnibus Incentive Plan is to provide a means through which to attract and retain key personnel and to provide a means whereby our directors, officers, employees, consultants, and advisors (and prospective directors, officers, employees, consultants, and advisors) can acquire and maintain an equity interest in us, or be paid incentive compensation, including incentive compensation measured by reference to the value of our common stock, thereby strengthening their commitment to our welfare and aligning their interests with those of our stockholders.
Administration. Our 2014 Omnibus Incentive Plan will be administered by the Committee or such other committee of our board of directors to which it has delegated power, or if no such committee or subcommittee thereof exists, our board of directors (as applicable, the “2014 Plan Committee”). The 2014 Plan Committee has
107
Table of Contents
the sole and plenary authority to establish the terms and conditions of any award, consistent with the provisions of our 2014 Omnibus Incentive Plan. The 2014 Plan Committee is authorized to interpret, administer, reconcile any inconsistency in, correct any defect in, and/or supply any omission in our 2014 Omnibus Incentive Plan and any instrument or agreement relating to, or any award granted under, our 2014 Omnibus Incentive Plan; establish, amend, suspend, or waive any rules and regulations and appoint such agents as the 2014 Plan Committee deems appropriate for the proper administration of our 2014 Omnibus Incentive Plan; and to make any other determination and take any other action that the 2014 Plan Committee deems necessary or desirable for the administration of our 2014 Omnibus Incentive Plan. Except to the extent prohibited by applicable law or the applicable rules and regulations of any securities exchange or inter-dealer quotation system on which our securities are listed or traded, the 2014 Plan Committee may allocate all or any portion of its responsibilities and powers to any one or more of its members and may delegate all or any part of its responsibilities and powers to any person or persons selected by it in accordance with the terms of our 2014 Omnibus Incentive Plan. Any such allocation or delegation may be revoked by the 2014 Plan Committee at any time. Unless otherwise expressly provided in our 2014 Omnibus Incentive Plan, all designations, determinations, interpretations, and other decisions under or with respect to our 2014 Omnibus Incentive Plan or any award or any documents evidencing awards granted pursuant to our 2014 Omnibus Incentive Plan are within the sole discretion of the 2014 Plan Committee, may be made at any time and are final, conclusive, and binding upon all persons or entities, including, without limitation, us, any participant, any holder or beneficiary of any award, and any of our stockholders.
Shares Subject to our 2014 Omnibus Incentive Plan. Our 2014 Omnibus Incentive Plan provides that the total number of shares of common stock that may be issued under our 2014 Omnibus Incentive Plan is . Of this amount, the maximum number of shares for which incentive stock options may be granted is ; the maximum number of shares for which options or stock appreciation rights may be granted to any individual participant during any single fiscal year is ; the maximum number of shares for which performance compensation awards denominated in shares may be granted to any individual participant in respect of a single fiscal year is (or if any such awards are settled in cash, the maximum amount may not exceed the fair market value of such shares on the last day of the performance period to which such award relates); the maximum number of shares of common stock granted during a single fiscal year to any non-employee director, taken together with any cash fees paid to such non-employee director during the fiscal year, will not exceed $ in total value; and the maximum amount that may be paid to any individual participant for a single fiscal year under a performance compensation award denominated in cash is $ . Except for substitute awards (as described below), in the event any award expires or is canceled, forfeited, terminated, lapses, or otherwise settled without the delivery of the full number of shares subject to such award, including as a result of net settlement of the award or as a result of the award being settled in cash, the undelivered shares may be granted again under our 2014 Omnibus Incentive Plan, unless the shares are surrendered after the termination of our 2014 Omnibus Incentive Plan, and only if stockholder approval is not required under the then-applicable rules of the exchange on which the shares of common stock are listed. Awards may, in the sole discretion of the 2014 Plan Committee, be granted in assumption of, or in substitution for, outstanding awards previously granted by an entity directly or indirectly acquired by us or with which we combine (referred to as “substitute awards”), and such substitute awards will not be counted against the total number of shares that may be issued under our 2014 Omnibus Incentive Plan, except that substitute awards intended to qualify as “incentive stock options” will count against the limit on incentive stock options described above. No award may be granted under our 2014 Omnibus Incentive Plan after the tenth anniversary of the effective date of the plan, but awards theretofore granted may extend beyond that date.
Options. The 2014 Plan Committee may grant non-qualified stock options and incentive stock options, under our 2014 Omnibus Incentive Plan, with terms and conditions determined by the 2014 Plan Committee that are not inconsistent with our 2014 Omnibus Incentive Plan; provided, that all stock options granted under our 2014 Omnibus Incentive Plan are required to have a per share exercise price that is not less than 100% of the fair market value of our common stock underlying such stock options on the date such stock options are granted (other than in the case of options that are substitute awards), and all stock options that are intended to qualify as incentive stock options must be granted pursuant to an award agreement expressly stating that the options are
108
Table of Contents
intended to qualify as incentive stock options, and will be subject to the terms and conditions that comply with the rules as may be prescribed by Section 422 of the Code. The maximum term for stock options granted under our 2014 Omnibus Incentive Plan will be ten years from the initial date of grant, or with respect to any stock options intended to qualify as incentive stock options, such shorter period as prescribed by Section 422 of the Code. However, if a non-qualified stock option would expire at a time when trading of shares of common stock is prohibited by our insider trading policy (or “blackout period” imposed by us), the term will automatically be extended to the 30th day following the end of such period. The purchase price for the shares as to which a stock option is exercised may be paid to us, to the extent permitted by law, (i) in cash or its equivalent at the time the stock option is exercised; (ii) in shares having a fair market value equal to the aggregate exercise price for the shares being purchased and satisfying any requirements that may be imposed by the 2014 Plan Committee; or (iii) by such other method as the 2014 Plan Committee may permit in its sole discretion, including, without limitation, (A) in other property having a fair market value on the date of exercise equal to the exercise price, (B) if there is a public market for the shares at such time, through the delivery of irrevocable instructions to a broker to sell the shares being acquired upon the exercise of the stock option and to deliver to us the amount of the proceeds of such sale equal to the aggregate exercise price for the shares being purchased, or (C) through a “net exercise” procedure effected by withholding the minimum number of shares needed to pay the exercise price and all applicable required withholding taxes. Any fractional shares of common stock will be settled in cash.
Stock Appreciation Rights. The 2014 Plan Committee may grant stock appreciation rights, with terms and conditions determined by the 2014 Plan Committee that are not inconsistent with our 2014 Omnibus Incentive Plan. Generally, each stock appreciation right will entitle the participant upon exercise to an amount (in cash, shares, or a combination of cash and shares, as determined by the 2014 Plan Committee) equal to the product of (i) the excess of (A) the fair market value on the exercise date of one share of common stock, over (B) the strike price per share, times (ii) the number of shares of common stock covered by the stock appreciation right. The strike price per share of a stock appreciation right will be determined by the 2014 Plan Committee at the time of grant but in no event may such amount be less than the fair market value of a share of common stock on the date the stock appreciation right is granted (other than in the case of stock appreciation rights granted in substitution of previously granted awards). The 2014 Plan Committee may in its sole discretion, substitute, without the consent of the holder or beneficiary of such stock appreciation rights, stock appreciation rights settled in shares of our common stock (or settled in shares or cash in the sole discretion of the 2014 Plan Committee) for non-qualified stock options.
Restricted Shares and Restricted Stock Units. The 2014 Plan Committee may grant restricted shares of our common stock or restricted stock units, representing the right to receive, upon the expiration of the applicable restricted period, one share of common stock for each restricted stock unit, or, in the sole discretion of the 2014 Plan Committee, the cash value thereof (or any combination thereof). As to restricted shares of our common stock, subject to the other provisions of our 2014 Omnibus Incentive Plan, the holder will generally have the rights and privileges of a stockholder as to such restricted shares of common stock, including, without limitation, the right to vote such restricted shares of common stock (except, that if the lapsing of restrictions with respect to such restricted shares of common stock is contingent on satisfaction of performance conditions other than, or in addition to, the passage of time, any dividends payable on such restricted shares of common stock will be retained, and delivered without interest to the holder of such shares when the restrictions on such shares lapse). To the extent provided in the applicable award agreement, the holder of outstanding restricted stock units will be entitled to be credited with dividend equivalent payments (upon the payment by us of dividends on shares of common stock) either in cash or, at the sole discretion of the 2014 Plan Committee, in shares of common stock having a value equal to the amount of such dividends (and interest may, at the sole discretion of the 2014 Plan Committee, be credited on the amount of cash dividend equivalents at a rate and subject to such terms as determined by the 2014 Plan Committee), which will be payable at the same time as the underlying restricted stock units are settled following the release of restrictions on such restricted stock units.
Other Stock-Based Awards. The 2014 Plan Committee may issue unrestricted common stock, rights to receive grants of awards at a future date, or other awards denominated in shares of common stock (including,
109
Table of Contents
without limitation, performance shares or performance units) under our 2014 Omnibus Incentive Plan, including performance-based awards, with terms and conditions determined by the 2014 Plan Committee that are not inconsistent with our 2014 Omnibus Incentive Plan.
Performance Compensation Awards. The 2014 Plan Committee may also designate any award as a “performance compensation award” intended to qualify as “performance-based compensation” under Section 162(m) of the Code. The 2014 Plan Committee also has the authority to make an award of a cash bonus to any participant and to designate such award as a performance compensation award under our 2014 Omnibus Incentive Plan. The 2014 Plan Committee has the sole discretion to select the length of any applicable performance periods, the types of performance compensation awards to be issued, the applicable performance criteria and performance goals, and the kinds and/or levels of performance goals that are to apply. The performance criteria that will be used to establish the performance goals may be based on the attainment of specific levels of our performance (and/or one or more affiliates, divisions, or operational and/or business units, product lines, brands, business segments, administrative departments, or any combination of the foregoing) and are limited to the following: . Any one or more of the performance criteria may be stated as a percentage of another performance criteria, or used on an absolute or relative basis to measure our performance as a whole or any of our divisions or operational and/or business units, product lines, brands, business segments, administrative departments, or any combination thereof as the 2014 Plan Committee may deem appropriate, or any of the above performance criteria may be compared to the performance of a selected group of comparison companies or a published or special index that the 2014 Plan Committee, in its sole discretion, deems appropriate, or as compared to various stock market indices. Unless otherwise determined by the 2014 Plan Committee at the time a performance compensation award is granted, the 2014 Plan Committee will, during the first 90 days of a performance period (or, within any other maximum period allowed under Section 162(m) of the Code) or at any time thereafter to the extent the exercise of such authority at such time would not cause the performance compensation awards granted to any participant for such performance period to fail to qualify as “performance-based compensation” under Section 162(m) of the Code, specify adjustments or modifications to be made to the calculation of a performance goal for such performance period, based on and to appropriately reflect the following events: (1) asset write-downs; (2) litigation or claim judgments or settlements; (3) the effect of changes in tax laws, accounting principles, or other laws or regulatory rules affecting reported results; (4) any reorganization and restructuring programs; (5) extraordinary nonrecurring items as described in Accounting Standards Codification Topic 225-20 (or any successor pronouncement thereto) and/or in management’s discussion and analysis of financial condition and results of operations appearing in our annual report to stockholders for the applicable year; (6) acquisitions or divestitures; (7) any other specific, unusual or nonrecurring events, or objectively determinable category thereof; (8) foreign exchange gains and losses; (9) discontinued operations and nonrecurring charges; and (10) a change in our fiscal year.
Following the completion of a performance period, the 2014 Plan Committee will review and certify in writing whether, and to what extent, the performance goals for the performance period have been achieved and, if so, calculate and certify in writing that amount of the performance compensation awards earned for the period based upon the performance formula. In determining the actual amount of an individual participant’s performance compensation award for a performance period, the 2014 Plan Committee has the discretion to reduce or eliminate the amount of the performance compensation award consistent with Section 162(m) of the Code. Unless otherwise provided in the applicable award agreement, the 2014 Plan Committee does not have the discretion to (A) grant or provide payment in respect of performance compensation awards for a performance period if the performance goals for such performance period have not been attained; or (B) increase a performance compensation award above the applicable limitations set forth in the 2014 Omnibus Incentive Plan.
Effect of Certain Events on 2014 Omnibus Incentive Plan and Awards. In the event of (a) any dividend (other than regular cash dividends) or other distribution (whether in the form of cash, shares of common stock, other securities, or other property), recapitalization, stock split, reverse stock split, reorganization, merger, consolidation, split-up, split-off, spin-off, combination, repurchase, or exchange of our shares of common stock or other securities, issuance of warrants or other rights to acquire our shares of common stock or other securities,
110
Table of Contents
or other similar corporate transaction or event (including, without limitation, a change in control, as defined in our 2014 Omnibus Incentive Plan) that affects the shares of common stock, or (b) unusual or nonrecurring events (including, without limitation, a change in control) affecting us, any affiliate, or the financial statements of us or any affiliate, or changes in applicable rules, rulings, regulations or other requirements of any governmental body or securities exchange or inter-dealer quotation system, accounting principles or law, such that, in either case, an adjustment is determined by the 2014 Plan Committee in its sole discretion to be necessary or appropriate, then the 2014 Plan Committee must make any such adjustments in such manner as it may deem equitable, including, without limitation, any or all of: (i) adjusting any or all of (A) the share limits applicable under our 2014 Omnibus Incentive Plan with respect to the number of awards which may be granted thereunder; (B) the number of our shares of common stock or other securities which may be issued in respect of awards or with respect to which awards may be granted under our 2014 Omnibus Incentive Plan; and (C) the terms of any outstanding award, including, without limitation, (1) the number of shares of common stock or other securities subject to outstanding awards or to which outstanding awards relate (with any increase requiring the approval of our board of directors), (2) the exercise price or strike price with respect to any award, or (3) any applicable performance measures; (ii) providing for a substitution or assumption of awards, accelerating the exercisability of, lapse of restrictions on, or termination of, awards or providing for a period of time for participants to exercise outstanding awards prior to the occurrence of such event; and (iii) cancelling any one or more outstanding awards and causing to be paid to the holders holding vested awards (including any awards that would vest as a result of the occurrence of such event but for such cancellation) the value of such awards, if any, as determined by the 2014 Plan Committee (which if applicable may be based upon the price per share of common stock received or to be received by other stockholders in such event), including, without limitation, in the case of options and stock appreciation rights, a cash payment equal to the excess, if any, of the fair market value of the shares of common stock subject to the option or stock appreciation right over the aggregate exercise price or strike price thereof. For the avoidance of doubt, the 2014 Plan Committee may cancel any stock option or stock appreciation right for no consideration if the fair market value of the shares subject to such option or stock appreciation right is less than or equal to the aggregate exercise price or strike price of such stock option or stock appreciation right.
Nontransferability of Awards. An award will not be transferable or assignable by a participant other than by will or by the laws of descent and distribution and any such purported assignment, alienation, pledge, attachment, sale, transfer or encumbrance will be void and unenforceable against us or any affiliate. However, the 2014 Plan Committee may, in its sole discretion, permit awards (other than incentive stock options) to be transferred, including transfers to a participant’s family members, any trust established solely for the benefit of a participant or such participant’s family members, any partnership or limited liability company of which a participant or such participant and such participant’s family members, are the sole member(s), and a beneficiary to whom donations are eligible to be treated as “charitable contributions” for tax purposes.
Amendment and Termination. Our board of directors may amend, alter, suspend, discontinue, or terminate our 2014 Omnibus Incentive Plan or any portion thereof at any time; provided, that no such amendment, alteration, suspension, discontinuation, or termination may be made without stockholder approval if (i) such approval is necessary to comply with any regulatory requirement applicable to our 2014 Omnibus Incentive Plan or for changes in GAAP to new accounting standards; (ii) it would materially increase the number of securities that may be issued under our 2014 Omnibus Incentive Plan (except for adjustments in connection with certain corporate events); or (iii) it would materially modify the requirements for participation in our 2014 Omnibus Incentive Plan; provided, further, that any such amendment, alteration, suspension, discontinuance, or termination that would materially and adversely affect the rights of any participant or any holder or beneficiary of any award will not, to that extent, be effective without such individual’s consent.
The 2014 Plan Committee may also, to the extent consistent with the terms of any applicable award agreement, waive any conditions or rights under, amend any terms of, or alter, suspend, discontinue, cancel or terminate, any award granted or the associated award agreement, prospectively or retroactively, subject to the consent of the affected participant if any such waiver, amendment, alteration, suspension, discontinuance, cancellation, or termination would materially and adversely affect the rights of any participant with respect to
111
Table of Contents
such award; provided, that without stockholder approval, except as otherwise permitted in our 2014 Omnibus Incentive Plan, (i) no amendment or modification may reduce the exercise price of any option or the strike price of any stock appreciation right; (ii) the 2014 Plan Committee may not cancel any outstanding option or stock appreciation right and replace it with a new option or stock appreciation right (with a lower exercise price or strike price, as the case may be) or other award or cash payment that is greater than the intrinsic value (if any) of the cancelled option or stock appreciation right; and (iii) the 2014 Plan Committee may not take any other action that is considered a “repricing” for purposes of the stockholder approval rules of any securities exchange or inter-dealer quotation system on which our securities are listed or quoted.
Dividends and Dividend Equivalents. The 2014 Plan Committee, in its sole discretion, may provide part of an award with dividends or dividend equivalents, on such terms and conditions as may be determined by the 2014 Plan Committee in its sole discretion; provided, that no dividends or dividend equivalents will be payable in respect of outstanding (i) options or stock appreciation rights or (ii) unearned performance compensation awards or other unearned awards subject to performance conditions (other than or in addition to the passage of time) (although dividends or dividend equivalents may be accumulated in respect of unearned awards and paid within 15 days after such awards are earned and become payable or distributable).
Clawback/Forfeiture. An award agreement may provide that the 2014 Plan Committee may, in its sole discretion, cancel such award if the participant, while employed by or providing services to us or any affiliate or after termination of such employment or service, violates a non-competition, non-solicitation, or non-disclosure covenant or agreement or otherwise has engaged in or engages in other detrimental activity that is in conflict with or adverse to our interests or the interests of any affiliate, including fraud or conduct contributing to any financial restatements or irregularities, as determined by the 2014 Plan Committee in its sole discretion. The 2014 Plan Committee may also provide in an award agreement that if the participant otherwise has engaged in or engages in any activity referred to in the preceding sentence, such participant will forfeit any gain realized on the vesting or exercise of such award, and must repay the gain to the Company. Without limiting the foregoing, all awards will be subject to reduction, cancellation, forfeiture, or recoupment to the extent necessary to comply with applicable law.
Director Compensation
For fiscal 2014, we did not provide compensation to our directors other than Douglas Steenland, our Non-Executive Chairman, for their service. However, all of our directors are reimbursed for their reasonable out-of-pocket expenses related to their service as a member of the Board of Directors or one of its committees.
For his service as Non-Executive Chairman of the Board of Directors, Mr. Steenland receives an annual cash retainer of $250,000. In January 2014, in recognition of an increase in his responsibilities to our Board of Directors, we awarded Mr. Steenland an additional one-year cash retainer of $500,000 of which $250,000 was paid in fiscal 2014, in addition to his $250,000 annual retainer. As Non-Executive Chairman of the Board of Directors, Mr. Steenland was also eligible to receive a discretionary cash bonus. For fiscal 2014, Mr Steenland’s maximum bonus opportunity as a percentage of his cash compensation was 50% and was based on his annual cash retainer of $250,000 (excluding his one-time additional retainer). In recognition of his contributions, the Board determined to award him a discretionary bonus of $125,000.
In addition, in fiscal 2010, Mr. Steenland was granted 215,000 options as part of his compensation, which options are now fully vested. One third of the options granted to Mr. Steenland were subject solely to time-based vesting restrictions and two thirds of the options granted to Mr. Steenland were subject to time and performance-based criteria. The time-based options were scheduled to vest based on a three year vesting schedule and, subject to Mr. Steenland’s continued service on our Board through the applicable vesting dates, 33 and 1/3% of the options subject to time-based vesting vested and became exercisable on each of the first three anniversaries of the date of grant. The time and performance-based options would only be deemed vested when they had both time vested and performance vested. 33 and 1/3% of the time and performance-based options time vested the last day of each of the Company’s 2011, 2012 and 2013 fiscal years, subject to Mr. Steenland’s continued service on our
112
Table of Contents
Board through the applicable vesting dates. Subject to time vesting and continued service on our Board through the date of the relevant event, these time and performance-based options vested and became exercisable:
| • | with respect to 33 and 1/3% of the shares subject to the time and performance-vesting options, on the date that the audited financial statement for the Company and its consolidated subsidiaries in respect to the Company’s 2011 fiscal year was approved by the Board’s audit committee if the predetermined Adjusted EBITDA budget target established by the Board in respect of such fiscal year was satisfied; |
| • | with respect to 33 and 1/3% of the shares subject to the time and performance-vesting options, on the date that the audited financial statement for the Company and its consolidated subsidiaries in respect to the Company’s 2012 fiscal year was approved by the Board’s audit committee if Adjusted EBITDA (as calculated by the Board in good faith) was at least $240,000,000; and |
| • | with respect to 33 and 1/3% of the shares subject to the time and performance-vesting options, on the date that the audited financial statement for the Company and its consolidated subsidiaries in respect to the Company’s 2013 fiscal year was approved by the Board’s audit committee if Adjusted EBITDA (as calculated by the Board in good faith) was at least $270,000,000. |
For fiscal 2015, we anticipate that all non-employee directors will be entitled to compensation arrangements to be determined.
Director Compensation for Fiscal 2014
The following table sets forth information concerning the compensation of our directors (other than directors who are named executive officers) for fiscal 2014.
| Name |
Fees earned or paid in cash ($)(1) |
Bonus ($) |
Option Awards ($)(2) |
Total ($) |
||||||||||||
| Douglas M. Steenland |
500,000 | 125,000 | — | 625,000 | ||||||||||||
| William F. Dawson Jr. |
— | — | — | |||||||||||||
| Bruce McEvoy |
— | — | — | |||||||||||||
| Prakash A. Melwani |
— | — | — | |||||||||||||
| Jeffrey Overly |
— | — | — | |||||||||||||
| (1) | Amount reported reflects Mr. Steenland’s annual cash retainer plus the portion of his one-time additional cash retainer that was paid in fiscal 2014. |
| (2) | As of June 29, 2014, Mr. Steenland held 215,000 fully-vested options with an exercise price of $5.49. |
113
Table of Contents
CERTAIN RELATIONSHIPS AND RELATED PARTY TRANSACTIONS
Stockholders’ Agreement
In connection with our initial public offering, we expect to enter into a stockholders agreement with affiliates of our Sponsors. This agreement will grant Blackstone the right to nominate to our Board of Directors a number of designees equal to: (i) at least a majority of the total number of directors comprising our Board of Directors as long as Blackstone and its affiliates beneficially own at least 50% of the shares of our common stock entitled to vote generally in the election of our directors; (ii) at least 40% of the total number of directors comprising our Board of Directors at such time as long as Blackstone and its affiliates beneficially own at least 40% but less than 50% of the shares of our common stock entitled to vote generally in the election of our directors; (iii) at least 30% of the total number of directors comprising our Board of Directors at such time as long as Blackstone and its affiliates beneficially own at least 30% but less than 40% of the shares of our common stock entitled to vote generally in the election of our directors; (iv) at least 20% of the total number of directors comprising our board of directors at such time as long as Blackstone and its affiliates beneficially own at least 20% but less than 30% of the shares of our common stock entitled to vote generally in the election of our directors; and (v) at least 10% of the total number of directors comprising our Board of Directors at such time as long as Blackstone and its affiliates beneficially own at least 5% but less than 20% of the shares of our common stock entitled to vote generally in the election of our directors. For purposes of calculating the number of directors that Blackstone is entitled to nominate pursuant to the formula outlined above, any fractional amounts would be rounded up to the nearest whole number (e.g., one and one quarter directors shall equate to two directors) and the calculation would be made on a pro forma basis after taking into account any increase in the size of our Board of Directors.
In addition, the agreement will grant Wellspring the right to nominate to our Board of Directors a number of designees equal to: (i) at least 20% of the total number of directors comprising our Board of Directors at such time as long as Wellspring and its affiliates beneficially own at least 20% but less than 30% of the shares of our common stock entitled to vote generally in the election of our directors; and (ii) at least 10% of the total number of directors comprising our Board of Directors at such time as long as Wellspring and its affiliates beneficially own at least 5% but less than 20% of the shares of our common stock entitled to vote generally in the election of our directors. For purposes of calculating the number of directors that Wellspring is entitled to nominate pursuant to the formula outlined above, any fractional amounts would be rounded up to the nearest whole number (e.g., one and one quarter directors shall equate to two directors) and the calculation would be made on a pro forma basis after taking into account any increase in the size of our Board of Directors.
In the event a vacancy on the Board of Directors is caused by the death, retirement, or resignation of Blackstone’s director-designee, Blackstone shall, to the fullest extent permitted by law, have the right to have the vacancy filled by Blackstone’s new director-designee. Furthermore, in the event a vacancy on the Board of Directors is caused by the death, retirement, or resignation of Wellspring’s director-designee, Wellspring shall, to the fullest extent permitted by law, have the right to have the vacancy filled by Wellspring’s new director-designee.
Registration Rights Agreement
In connection with this offering, we intend to enter into a registration rights agreement that will provide Blackstone and Wellspring an unlimited number of “demand” registrations and customary “piggyback” registration rights. The registration rights agreement will also provide that we will pay certain expenses relating to such registrations and indemnify the registration rights holders against certain liabilities that may arise under the Securities Act.
114
Table of Contents
Transaction and Advisory Fee Agreement
We are a party to the Amended and Restated Transaction and Advisory Fee Agreement (the “Advisory Agreement”) with Blackstone Management Partners V L.L.C. (“BMP”) and Wellspring Capital Management, LLC (“WCM,” and together with BMP, the “Advisors”). Pursuant to this agreement, BMP, WCM or their affiliates provide certain strategic and structuring advice and assistance to us. In addition, under this agreement, BMP, WCM, or their affiliates provide certain monitoring, advisory, and consulting services to us for an aggregate annual management fee equal to the greater of $2.5 million or 1.5% of Consolidated EBITDA (as defined in the Credit Agreement). BMP, WCM, or their affiliates also receive reimbursement for out-of-pocket expenses incurred by them in connection with the provision of services pursuant to the Advisory Agreement.
Upon a change of control in our ownership, a sale of all of our assets, or an initial public offering of our equity, BMP may elect (on behalf of the Advisors) to receive, in lieu of annual payments of the management fee, a single lump sum cash payment calculated as provided in the Advisory Agreement.
In connection with this offering, the parties intend to terminate the Advisory Agreement, and in connection with such termination we will pay the Advisors total fees of approximately $ million.
Other Transactions
We lease a distribution facility from an entity owned by one of our officers. The lease generally provides that we will bear the cost of property taxes. Total rent and taxes paid to the officer’s company totaled $0.5 million for fiscal 2014, fiscal 2013, and fiscal 2012.
We do business with other affiliates of The Blackstone Group. In fiscal 2014, we recorded sales of $35.0 million to certain of these affiliate companies compared to sales of $40.1 million for fiscal 2013 and $40.0 million for fiscal 2012. We also recorded purchases of $1.8 million from certain of these affiliate companies in fiscal 2014, $2.9 million in fiscal 2013, and $3.8 million in fiscal 2012. We do not conduct a material amount of business with affiliates of Wellspring Capital Management.
As of June 28, 2014, an affiliate of Blackstone held $28.8 million of the outstanding $744.4 million term loan facility. We paid approximately $2.0 million in interest related to fiscal 2014 and $0.2 million related to fiscal 2013 to this affiliate pursuant to the terms of the term loan facility. See “Description of Certain Indebtedness—Term Loan Facility.” Affiliates of Blackstone and Wellspring Capital had held $218.1 million of our $500 million aggregate principal amount of senior notes, all of which were redeemed on May 14, 2013. We paid approximately $4.4 million in redemption premiums and $20.9 million in interest related to fiscal 2013 to these affiliates pursuant to the terms of the senior notes. We paid approximately $10.7 million in interest related to fiscal 2012 to these affiliates pursuant to the terms of the senior notes.
Repurchase of Securities
As market conditions warrant, we and our major stockholders, including our Sponsors, may from time to time, depending upon market conditions, seek to repurchase our securities or loans in privately negotiated or open market transactions, by tender offer or otherwise.
Equity Investment by Directors and Executive Officers
Our 2007 Management Option Plan allows for the granting of awards to employees, including directors and independent contractors, of the Company or its affiliates in the form of nonqualified stock options. The 2007 Management Option Plan is designed to attract able persons to us and our affiliates and to provide a means whereby those employees and consultants can acquire and maintain stock ownership, thereby promoting our long-term growth and profitability and increasing participants’ desire to remain in our employ or service. The terms and conditions of awards granted under the 2007 Management Option Plan are determined by our Board of Directors. All current awards have a contractual term of ten years.
115
Table of Contents
Equity Healthcare Program Agreement
Effective as of July 15, 2014, we entered into an employer health program agreement with Equity Healthcare LLC (“Equity Healthcare”), an affiliate of Blackstone, pursuant to which Equity Healthcare provides to us certain negotiating, monitoring, and other services in connection with our health benefit plans. Because of the combined purchasing power of its client participants, Equity Healthcare is able to negotiate pricing terms for providers that are believed to be more favorable than the companies could obtain for themselves on an individual basis.
In consideration for Equity Healthcare’s services, we paid Equity Healthcare a fee of $2.80 per eligible employee per month for benefit plans beginning on or after January 1, 2014 and we will pay a fee of $3.00 per eligible employee per month for plans beginning on or after January 1, 2016 and $3.00 per eligible employee per month for plans beginning on or after January 1, 2017. As of June 28, 2014, we had approximately 9,487 employees enrolled in Equity Healthcare health benefit plans.
Core Trust Purchasing Group Participation Agreement
Effective September 24, 2007, we entered into a five-year participation agreement with Core Trust Purchasing Group (“CPG”), which designates CPG as our exclusive “group purchasing organization” for the purchase of certain products and services from third-party vendors. CPG secures from vendors pricing terms for goods and services that are believed to be more favorable than participants in the group purchasing organization could obtain for themselves on an individual basis. Under the participation agreement, we must purchase 80% of the requirements of our participating locations for core categories of specified products and services from vendors participating in the group purchasing arrangement with CPG or CPG may terminate the contract.
We do not pay any fees to participate in this group arrangement, and we can terminate participation in any category of products and services at any time prior to the expiration of the agreement without penalty with a reasonable business justification, including if pricing under the agreement becomes uncompetitive or uneconomical, customer service is not satisfactory, or participation negatively affects our corporate governance or compliance policies.
In connection with purchases by its participants (including us), CPG receives a commission from the vendors in respect of such purchases. Additionally, Blackstone has entered into a separate agreement with CPG whereby Blackstone receives a portion of the gross fees vendors pay to CPG based on the volume of purchases made by us. CPG is not a Blackstone affiliate and Blackstone is not a party to our participation agreement with CPG. A portion of the fees CPG remits to Blackstone is intended to reimburse Blackstone for a portion of the costs it incurs in connection with facilitating our participation in CPG and monitoring the services CPG provides to us. Our purchases through CPG were approximately $23.2 million and $19.9 million for fiscal 2014 and fiscal 2013, respectively.
Statement of Policy Regarding Transactions with Related Persons
Prior to the completion of this offering, our Board of Directors will adopt a written statement of policy regarding transactions with related persons, which we refer to as our “related person policy.” Our related person policy requires that a “related person” (as defined as in paragraph (a) of Item 404 of Regulation S-K) must promptly disclose to our General Counsel any “related person transaction” (defined as any transaction that we anticipate would be reportable by us under Item 404(a) of Regulation S-K in which we were or are to be a participant and the amount involved exceeds $120,000 and in which any related person had or will have a direct or indirect material interest) and all material facts with respect thereto. The General Counsel will then promptly communicate that information to our Board of Directors. No related person transaction will be executed without the approval or ratification of our Board of Directors or a duly authorized committee of our Board of Directors. It is our policy that directors interested in a related person transaction will recuse themselves from any vote on a related person transaction in which they have an interest.
116
Table of Contents
PRINCIPAL AND SELLING STOCKHOLDERS
The following table and accompanying footnotes set forth information with respect to the beneficial ownership of our common stock, as of June 28, 2014, for:
| • | each person known by us to own beneficially more than 5% of our outstanding shares of common stock; |
| • | each of our directors; |
| • | each of our named executive officers; |
| • | all of our directors and executive officers as a group; and |
| • | each selling stockholder. |
For further information regarding material transactions between us and the selling stockholders, see “Certain Relationships and Related Party Transactions.”
The number of shares and percentages of beneficial ownership prior to this offering set forth below are based on the number of shares of our common stock to be issued and outstanding immediately prior to the consummation of this offering. The number of shares and percentages of beneficial ownership after this offering set forth below are based on the number of shares of our common stock to be issued and outstanding immediately after the consummation of this offering.
Beneficial ownership for the purposes of the following table is determined in accordance with the rules and regulations of the SEC. A person is a “beneficial owner” of a security if that person has or shares “voting power,” which includes the power to vote or to direct the voting of the security, or “investment power,” which includes the power to dispose of or to direct the disposition of the security or has the right to acquire such powers within 60 days.
Unless otherwise noted in the footnotes to the following table, and subject to applicable community property laws, the persons named in the table have sole voting and investment power with respect to their beneficially owned common stock.
Except as otherwise indicated in the footnotes below, the address of each beneficial owner is c/o Performance Food Group Company, 12500 West Creek Parkway, Richmond, Virginia, 23238.
| Common Stock Beneficially Owned Prior to this Offering |
Shares of Common Stock Offered |
Common Stock Beneficially Owned After this Offering | ||||||||||||||||
| Assuming the Underwriters’ Option is not Exercised |
Assuming the Underwriters’ Option is Exercised in Full | |||||||||||||||||
| Name of Beneficial Owner |
Number(1) | % | Number | % | Number | % | ||||||||||||
| Principal and Selling Stockholders: |
||||||||||||||||||
| Blackstone(2) |
129,907,971 | 72.5 | ||||||||||||||||
| Wellspring(3) |
34,468,413 | 19.3 | ||||||||||||||||
| Directors and Named Executive Officers: |
||||||||||||||||||
| George L. Holm |
3,004,828 | 1.7 | ||||||||||||||||
| Robert D. Evans |
40,000 | * | ||||||||||||||||
| William M. Pearce |
63,752 | * | ||||||||||||||||
| Patrick T. Hagerty |
195,766 | * | ||||||||||||||||
| Carol A. Price |
40,000 | * | ||||||||||||||||
| William F. Dawson Jr.(4) |
— | * | ||||||||||||||||
| Thomas H. Hoffman |
36,430 | * | ||||||||||||||||
| Bruce McEvoy(5) |
— | * | ||||||||||||||||
| Prakash A. Melwani(6) |
— | * | ||||||||||||||||
| Jeffrey Overly(7) |
— | * | ||||||||||||||||
| Douglas M. Steenland |
— | * | ||||||||||||||||
| Directors and executive officers as a group |
3,572,496 | 2.0 | ||||||||||||||||
117
Table of Contents
| * | Represents less than 1%. |
| (1) | Fractional shares beneficially owned have been rounded to the nearest whole share. |
| (2) | Includes 106,691,424 shares of our common stock directly owned by Blackstone Capital Partners V L.P. (“BCP V”), 17,090,717 shares of our common stock directly owned by Blackstone Capital Partners V-AC L.P. (“BCP V-AC”), 1,495,991 shares of our common stock directly owned by Blackstone Family Investment Partnership V-SMD L.P. (“Family-SMD”), 1,543,984 shares of our common stock directly owned by Blackstone Family Investment Partnership V L.P. (“Family”) and 273,371 shares of our common stock directly owned by Blackstone Participation Partnership V L.P. (“Participation”), 1,334,016 shares directly owned by Blackstone Mezzanine Partners II, L.P. and 32,104 shares directly owned by Blackstone Mezzanine Holdings II, L.P. (collectively, the “Blackstone Funds”). The general partner of BCP V and BCP V-AC is Blackstone Management Associates V L.L.C. BMA V L.L.C. is the sole member of Blackstone Management Associates V L.L.C. BCP V Side-by-Side GP L.L.C. is the general partner of Family and Participation. Blackstone Holdings III L.P. is the managing member and majority in interest owner of BMA V L.L.C. and the sole member of BCP V Side-by-Side GP L.L.C. The general partner of Blackstone Holdings III L.P. is Blackstone Holdings III GP L.P. The general partner of Blackstone Holdings III GP L.P. is Blackstone Holdings III GP Management L.L.C. Blackstone Mezzanine Associates II L.P. is the general partner of Blackstone Mezzanine Partners II L.P. and Blackstone Mezzanine Holdings II L.P. Blackstone Mezzanine Management Associates II L.L.C. is the general partner of Blackstone Mezzanine Associates II L.P. BMP Side-by-Side GP II L.L.C. is the general partner of Blackstone Mezzanine Holdings II L.P. Blackstone Holdings II L.P. is the managing member of Blackstone Mezzanine Management Associates II L.L.C. and the sole member of BMP Side-by-Side GP II L.L.C. Blackstone Holdings I/II GP Inc. is the general partner of Blackstone Holdings II L.P. The sole member of Blackstone Holdings III GP Management L.L.C. and the sole shareholder of Blackstone Holdings I/II GP Inc. is The Blackstone Group L.P. The general partner of The Blackstone Group L.P. is Blackstone Group Management L.L.C. Blackstone Group Management L.L.C. is wholly owned by Blackstone’s senior managing directors and controlled by its founder, Stephen A. Schwarzman. The general partner of Family-SMD is Blackstone Family GP L.L.C., which is controlled by its founder, Mr. Schwarzman. Each of such Blackstone entities and Mr. Schwarzman may be deemed to beneficially own the shares beneficially owned by the Blackstone Funds directly or indirectly controlled by it or him, but each (other than the Blackstone Funds to the extent of their direct holdings) disclaims beneficial ownership of such shares. The address for each of the Blackstone Funds, Blackstone Management Associates V L.L.C., BMA V. L.L.C., BCP V Side-by-Side GP L.L.C., Blackstone Holdings III L.P., Blackstone Holdings III GP L.P., Blackstone Holdings III GP Management L.L.C., The Blackstone Group L.P., Blackstone Group Management L.L.C., Blackstone Family GP L.L.C., and Mr. Schwarzman is c/o The Blackstone Group L.P., 345 Park Avenue, New York, New York, 10154. |
| (3) | Reflects 34,468,413 shares of our common stock held by Wellspring Capital Partners IV, L.P. (“WCP IV”). The General Partner of WCP IV is WCM GenPar IV, L.P. The address of each of the entities listed in this footnote is c/o Wellspring Capital Management LLC, 390 Park Avenue, New York, New York 10022. |
| (4) | Mr. Dawson is the Chief Executive Officer of Wellspring Capital Management, LLC, the management company of WCP IV. Mr. Dawson disclaims beneficial ownership of any shares owned directly or indirectly by WCP IV. Mr. Dawson’s address is c/o Wellspring Capital Management LLC, 390 Park Avenue, New York, New York 10022. |
| (5) | Mr. McEvoy is a Managing Director of Blackstone. Mr. McEvoy disclaims beneficial ownership of any shares owned directly or indirectly by Blackstone. Mr. McEvoy’s address is c/o The Blackstone Group L.P., 345 Park Avenue, New York, New York 10154. |
| (6) | Mr. Melwani is a Senior Managing Director of Blackstone. Mr. Melwani disclaims beneficial ownership of any shares owned directly or indirectly by Blackstone. Mr. Melwani’s address is c/o The Blackstone Group L.P., 345 Park Avenue, New York, New York 10154. |
| (7) | Mr. Overly is an Operating Partner of Blackstone. Mr. Overly disclaims beneficial ownership of any shares owned directly or indirectly by Blackstone. Mr. Overly’s address is c/o The Blackstone Group L.P., 345 Park Avenue, New York, New York 10154. |
118
Table of Contents
DESCRIPTION OF CERTAIN INDEBTEDNESS
Senior Secured Asset-Based Revolving Credit Facility
We summarize below the principal terms of the agreements that govern the ABL facility. This summary is not a complete description of all the terms of such agreements.
General
On May 8, 2012, our indirect wholly-owned subsidiary, Performance Food Group, Inc., amended and restated the ABL facility, with Wells Fargo Bank, National Association, as administrative agent and collateral agent, and a syndicate of financial institutions and institutional lenders.
The ABL facility provides for revolving credit financing of up to $1.4 billion, subject to borrowing base availability, with a maturity of five years, including both a letter of credit and swingline loan sub-facility. The ABL facility includes a “first-in, last-out” tranche (the “Last Out Tranche”) in an aggregate amount of $80.0 million; the portion of our ABL facility exclusive of the Last Out Tranche is referred to as the “First Out Tranche.”
The First Out Tranche borrowing base at any time is equal to the sum (subject to certain reserves and other adjustments) of:
| • | 85% of eligible receivables; |
| • | 90% of the net appraised recovery value of eligible inventory; |
| • | the lesser of (a) 75% of the most recently determined appraised value of eligible owned real property, and (b) 75% of the sum of (i) the appraised value of eligible real property as of the closing date of the ABL facility plus (ii) the appraised value of eligible real property added after the closing date of the ABL facility, reduced at the end of each fiscal quarter by an increasing amount over time (the “Real Estate Borrowing Base Amount”); and |
| • | the lesser of (a) 80% of the most recently determined appraised value of eligible rolling stock, and (b) 75% of the sum of (i) the appraised value of eligible rolling stock as of the closing date of the ABL facility plus (ii) the appraised value of eligible rolling stock added after the closing date of the ABL facility, reduced at the end of each fiscal quarter by an increasing amount over time (the “Rolling Stock Borrowing Base Amount”). |
The Last Out Tranche borrowing base at any time is equal to the sum (subject to certain reserves and other adjustments) of:
| • | 95% of eligible receivables; |
| • | 95% of the net appraised recovery value of eligible inventory; |
| • | if applicable, the Real Estate Borrowing Base Amount; and |
| • | if applicable, the Rolling Stock Borrowing Base Amount; |
provided that (1) the aggregate amount calculated with respect to real estate and rolling stock and included in the borrowing base shall not exceed 25% of the borrowing base, (2) the aggregate amount calculated with respect to rolling stock and included in the borrowing base shall not exceed the greater of (x) $130 million and (y) 10% of the lesser of (I) the aggregate borrowing base and total commitments under the ABL facility and (3) the aggregate amount, if any, of eligible receivables and eligible inventory entities organized in certain Caribbean territories included in the borrowing base shall not exceed $50 million.
Lenders under the First Out Tranche are not obligated to fund any loan under the First Out Tranche unless the borrower has borrowed the full amount of the lesser of (a) the Last Out Tranche commitments or (b) the difference between the Last Out Tranche borrowing base and the First Out Tranche borrowing base.
119
Table of Contents
The ABL facility includes borrowing capacity available for letters of credit and for borrowings on same-day notice, referred to as swingline loans. Letters of credit and swingline loans constitute extensions of credit under the First Out Tranche.
Borrowings under the ABL facility are subject to the satisfaction of customary conditions, including absence of a default and accuracy of representations and warranties.
Provided that no default or event of default is then existing or would arise therefrom, at the borrower’s option, it may request that the First Out Tranche under the ABL facility be increased by an amount not to exceed $400.0 million, subject to certain consent rights of the administrative agent with respect to the lenders providing commitments for such increase. The terms of such incremental revolving facility shall be as agreed between the borrower and the lenders providing the new commitments.
Interest Rate and Fees
Borrowings under the ABL facility bear interest at a rate per annum equal to, at the borrower’s option, either (a) a base rate determined by reference to the higher of (1) the prime rate of Wells Fargo Bank, National Association and (2) the federal funds effective rate plus 0.5%, plus an applicable margin (x) in the case of the First Out Tranche, equal to an amount ranging between 0.75% to 1.00% based on average excess availability under the ABL facility and (y) in the case of the Last Out Tranche, equal to 1.75% or (b) a LIBOR rate determined by reference to LIBOR, adjusted for statutory reserve requirements, plus an applicable margin (x) in the case of the First Out Tranche, equal to an amount ranging between 1.75% to 2.00% based on average excess availability under the ABL facility and (y) in the case of the Last Out Tranche, equal to 2.75%. In addition to paying interest on outstanding amounts under the ABL facility, the borrower is required to pay a commitment fee, in respect of the unutilized commitments thereunder, equal to an amount ranging between 0.25% and 0.375% per annum based on average excess availability under the ABL facility, which fee will be determined based on utilization of the ABL facility. The borrower must also pay customary letter of credit fees equal to (x) in the case of standby letters of credit, the applicable margin on LIBOR loans under the First Out Tranche and (y) in the case of commercial letters of credit, the applicable margin on LIBOR loans under the First Out Tranche minus 0.50%, as well as agency fees.
Mandatory Repayments
If at any time the aggregate amount of outstandings under the First Out Tranche of the ABL facility, including letter of credit outstandings and swingline loans, exceeds the lesser of (i) the aggregate commitments under the First Out Tranche of the ABL facility and (ii) the First Out Tranche borrowing base, the borrower will be required to repay outstanding First Out Tranche loans (including swingline loans) in an aggregate amount equal to such excess and, if a deficiency remains, cash collateralize letters of credit in an amount equal to 101.5% of the letters of credit outstanding. If the Last Out Tranche commitments are outstanding and the aggregate amount of outstandings under the ABL facility exceeds the Last Out Tranche borrowing base, the borrower will be required to repay outstanding loans (including swingline loans) under the First Out Tranche in an aggregate amount equal to such excess and, if after giving effect to the prepayment in full of all outstanding First Out Tranche extensions of credit the deficiency has not been eliminated, repay the Last Out Tranche loans in an aggregate amount equal to such excess and, if a deficiency remains, cash collateralize letters of credit in an amount equal to 101.5% of the letters of credit outstanding. If excess availability under the ABL facility is (x) $0 at any time or (y) less than the greater of (i) $130 million and (ii) 10% of the lesser of (A) the aggregate borrowing base and (B) total commitments under the ABL facility for five consecutive business days or certain events of default have occurred, the borrower will be required, upon the occurrence and during the continuance of such cash dominion event, to deposit cash (other than uncontrolled cash in an amount not to exceed $15.0 million) from deposit accounts daily in a core concentration account maintained with the administrative agent under the ABL facility, which will be used to repay outstanding loans and cash collateralize letters of credit.
120
Table of Contents
Voluntary Repayments
The borrower may voluntarily reduce the unutilized portion of the commitment amount and repay outstanding loans at any time (subject to minimum repayment amounts and customary notice periods) without premium or penalty other than customary “breakage” costs with respect to LIBOR loans. The commitments under the Last Out Tranche may be terminated or reduced only if there are no extensions of credit under the First Out Tranche then outstanding. If the First Out Tranche commitments are terminated in their entirety, the Last Out Tranche must be terminated contemporaneously. Voluntary repayments must be applied to repay First Out Tranche loans prior to repayment of Last Out Tranche loans.
Amortization and Final Maturity
There is no scheduled amortization under the ABL facility. All outstanding loans under the facility are due and payable in full on the fifth anniversary of the closing date.
Guarantees and Security
All obligations under the ABL facility, any interest rate protection or other hedging arrangements entered into with any lender in the syndicate or any of its affiliates, and cash management obligations owing to any lender in the syndicate or any of its affiliates are unconditionally guaranteed by PFGC, Inc. and substantially all of PFGC, Inc.’s existing and future, direct and indirect, wholly-owned domestic restricted subsidiaries (other than captive insurance subsidiaries). All obligations under the ABL facility, any interest rate protection or other hedging arrangements entered into with any lender in the syndicate or any of its affiliates, and cash management obligations owing to any lender in the syndicate or any of its affiliates, and the guarantees of those obligations, are secured, subject to certain exceptions, by substantially all of the borrower’s assets and the assets of the guarantors, including a first-priority security interest in substantially all personal property and material real property.
Restrictive Covenants and Other Matters
The ABL facility requires that if excess availability is less than (x) the greater of (i) $130 million and (ii) 10% of the lesser of (A) the aggregate borrowing base and (B) total commitments under the ABL facility for five consecutive business days or (y) 7.5% of total commitments under the ABL facility at any time, the borrower must comply with a minimum fixed charge coverage ratio test. In addition, the ABL facility includes negative covenants that, subject to significant exceptions, limit the borrower’s ability and the ability of PFGC, Inc. and its subsidiaries to, among other things:
| • | incur, assume, or permit to exist additional indebtedness or guarantees; |
| • | incur liens; |
| • | make investments and loans; |
| • | pay dividends, make payments, or redeem or repurchase capital stock; |
| • | engage in mergers, liquidations, dissolutions, asset sales, and other dispositions (including sale leaseback transactions); |
| • | amend or otherwise alter terms of certain indebtedness; |
| • | enter into agreements limiting subsidiary distributions or containing negative pledge clauses; |
| • | engage in certain transactions with affiliates; |
| • | alter the business conducted; |
| • | change its fiscal year; and |
| • | with respect to PFGC, Inc., engage in any activities not permitted. |
The ABL facility contains certain customary representations and warranties, affirmative covenants, and events of default, including among other things payment defaults, breach of representations and warranties,
121
Table of Contents
covenant defaults, cross-defaults to certain indebtedness, certain events of bankruptcy, certain events under ERISA, material judgments, failure of any guaranty or security document supporting the ABL facility to be in full force and effect, and change of control. If such an event of default occurs, the lenders under the ABL facility would be entitled to take various actions, including the acceleration of amounts due under the ABL facility and all actions permitted to be taken by a secured creditor.
As of June 28, 2014, there was $679.6 million of outstanding borrowings under the ABL facility, outstanding letters of credit totaled $108.7 million, and additional availability under the ABL facility, subject to the applicable borrowing base, was $587.8 million. As of June 28, 2014, the borrower was in compliance with all of the financial covenants required by the credit agreement governing the ABL facility.
Second Lien Term Loan
We summarize below the principal terms of the agreements that govern the term loan facility. This summary is not a complete description of all the terms of such agreements.
Overview
On May 14, 2013, Performance Food Group, Inc. entered into a new second lien term loan facility. The new second lien term loan facility provides for senior secured financing of $750 million consisting of a six and one-half-year second lien term loan.
Provided that no event of default is then existing or would arise therefrom (or, if the proceeds are being used for certain acquisitions, no payment event of default or event of default resulting from invalid loan documents), at the borrower’s option, it may request that the term loan facility be increased by an amount not to exceed the sum of (A) $140 million plus (B) additional amounts so long as the secured net leverage ratio, determined on a pro forma basis, does not exceed 5.90 to 1.00. The terms of such incremental term loans shall be as agreed between the borrower and the lenders providing the new term loans.
Interest Rate and Fees
Borrowings under the term loan facility bear interest, at the borrower’s option, at a rate equal to a margin over either (a) a base rate determined by reference to the higher of (1) the rate of interest published by Credit Suisse (AG), Cayman Islands Branch, as its “prime lending rate,” (2) the federal funds rate plus 0.50%, and (3) one-month LIBOR rate plus 1.00% or (b) a LIBOR rate determined by reference to the service selected by Credit Suisse (AG), Cayman Islands Branch that has been nominated by the British Bankers’ Association (or any successor thereto). The applicable margin for the term loans under the term loan facility may be reduced subject to attaining a certain total net leverage ratio. The applicable margin for borrowings will be 5.25% for loans based on a LIBOR rate and 4.25% for loans based on the base rate as of June 28, 2014. The LIBOR rate for term loans is subject to a 1.00% floor and the base rate for term loans is subject to a floor of 2.00%.
Prepayments
The credit agreement requires us to prepay term loans, subject to certain exceptions, with:
| • | 100% of the net cash proceeds of all non-ordinary course asset sales or other dispositions of property by the borrower and its restricted subsidiaries (including insurance and condemnation proceeds, subject to de minimis thresholds) that are not required to be applied to make prepayments pursuant to the ABL facility, (a) if the borrower does not reinvest those net cash proceeds in assets to be used in its business or to make certain other permitted investments, within 12 months of the receipt of such net cash proceeds or (b) if the borrower commits to reinvest such net cash proceeds within 12 months of the receipt thereof, within the later of 12 months of the receipt thereof or 180 days of the date of such commitment; and |
| • | 100% of the net proceeds of any issuance or incurrence of debt by the borrower or any of its restricted subsidiaries, other than permitted debt. |
122
Table of Contents
The borrower may voluntarily repay outstanding loans at any time without premium or penalty, other than a prepayment premium on voluntary prepayment of term loans on or prior to the date that is two years after the closing date of the term loan facility and customary “breakage” costs with respect to LIBOR loans.
Amortization and Maturity
The borrower is required to repay installments on the term loans in quarterly installments in aggregate annual amounts equal to 1.00% of their respective funded total principal amount, with the remaining amount payable on the maturity date. The maturity date of the term loans is the six and one-half year anniversary of the closing date of the term loan facility.
Guarantee and Security
All obligations under the term loan facility are unconditionally guaranteed by PFGC, Inc. and substantially all of PFGC, Inc.’s existing and future, direct and indirect, wholly-owned domestic restricted subsidiaries (other than captive insurance subsidiaries). All obligations under the term loan facility and the guarantees of those obligations are secured, subject to certain exceptions, on a second-priority basis by substantially all of the borrower’s assets and the assets of the guarantors, including a second-priority security interest in substantially all personal property and material real property.
Restrictive Covenants and Other Matters
The term loan facility includes negative covenants that, subject to significant exceptions, limit the borrower’s ability and the ability of PFGC, Inc. and its subsidiaries to, among other things:
| • | incur, assume, or permit to exist additional indebtedness or guarantees; |
| • | incur liens; |
| • | make investments and loans; |
| • | pay dividends, make payments, or redeem or repurchase capital stock; |
| • | engage in mergers, liquidations, dissolutions, asset sales, and other dispositions (including sale leaseback transactions); |
| • | amend or otherwise alter terms of certain indebtedness; |
| • | enter into agreements limiting subsidiary distributions or containing negative pledge clauses; |
| • | engage in certain transactions with affiliates; |
| • | alter the business conducted; |
| • | change its fiscal year; and |
| • | with respect to PFGC, Inc., engage in any activities not permitted. |
The term loan facility contains certain customary representations and warranties, affirmative covenants, and events of default, including among other things payment defaults, breach of representations and warranties, covenant defaults, cross-defaults to certain indebtedness, certain events of bankruptcy, certain events under ERISA, material judgments, failure of any guaranty or security document supporting the term loan facility to be in full force and effect, and change of control. If such an event of default occurs, the lenders under the term loan facility would be entitled to take various actions, including the acceleration of amounts due under the term loan facility and all actions permitted to be taken by a secured creditor.
As of June 28, 2014, there was $744.4 million of outstanding borrowings under the term loan facility.
As of June 28, 2014, we were in compliance with all covenants related to our term loan facility and ABL facility.
123
Table of Contents
In connection with this offering, we will amend and restate our certificate of incorporation and our bylaws. The following is a description of the material terms of, and is qualified in its entirety by, our amended and restated certificate of incorporation and amended and restated bylaws, each of which will be in effect upon the consummation of this offering, the forms of which are filed as exhibits to the registration statement of which this prospectus is a part.
Our purpose is to engage in any lawful act or activity for which corporations may now or hereafter be organized under the General Corporation Law of the State of Delaware (the “DGCL”). Upon the consummation of this offering, our authorized capital stock will consist of shares of common stock, par value $0.01 per share, and shares of preferred stock, par value $0.01 per share. No shares of preferred stock will be issued or outstanding immediately after the public offering contemplated by this prospectus. Unless our Board of Directors determines otherwise, we will issue all shares of our capital stock in uncertificated form.
Common Stock
Holders of our common stock are entitled to one vote for each share held of record on all matters submitted to a vote of stockholders, including the election or removal of directors. The holders of our common stock do not have cumulative voting rights in the election of directors. Upon our liquidation, dissolution, or winding up and after payment in full of all amounts required to be paid to creditors and to the holders of preferred stock having liquidation preferences, if any, the holders of our common stock will be entitled to receive pro rata our remaining assets available for distribution. Holders of our common stock do not have preemptive, subscription, redemption, or conversion rights. The common stock will not be subject to further calls or assessment by us. There will be no redemption or sinking fund provisions applicable to the common stock. All shares of our common stock that will be outstanding at the time of the completion of the offering will be fully paid and non-assessable. The rights, powers, preferences, and privileges of holders of our common stock will be subject to those of the holders of any shares of our preferred stock that we may authorize and issue in the future.
Preferred Stock
Our amended and restated certificate of incorporation authorizes our Board of Directors to establish one or more series of preferred stock (including convertible preferred stock). Unless required by law or by the , the authorized shares of preferred stock will be available for issuance without further action by you. Our Board of Directors may determine, with respect to any series of preferred stock, the powers, including preferences and relative participations, optional or other special rights, and the qualifications, limitations, or restrictions thereof, of that series, including, without limitation:
| • | the designation of the series; |
| • | the number of shares of the series, which our Board of Directors may, except where otherwise provided in the preferred stock designation, increase (but not above the total number of authorized shares of the class) or decrease (but not below the number of shares then outstanding); |
| • | whether dividends, if any, will be cumulative or non-cumulative and the dividend rate of the series; |
| • | the dates at which dividends, if any, will be payable; |
| • | the redemption rights and price or prices, if any, for shares of the series; |
| • | the terms and amounts of any sinking fund provided for the purchase or redemption of shares of the series; |
| • | the amounts payable on shares of the series in the event of any voluntary or involuntary liquidation, dissolution, or winding-up of our affairs; |
124
Table of Contents
| • | whether the shares of the series will be convertible into shares of any other class or series, or any other security, of us or any other corporation, and, if so, the specification of the other class or series or other security, the conversion price or prices or rate or rates, any rate adjustments, the date or dates as of which the shares will be convertible, and all other terms and conditions upon which the conversion may be made; |
| • | restrictions on the issuance of shares of the same series or of any other class or series; and |
| • | the voting rights, if any, of the holders of the series. |
We could issue a series of preferred stock that could, depending on the terms of the series, impede or discourage an acquisition attempt or other transaction that some, or a majority, of the holders of our common stock might believe to be in their best interests or in which the holders of our common stock might receive a premium for your common stock over the market price of the common stock. Additionally, the issuance of preferred stock may adversely affect the rights of holders of our common stock by restricting dividends on the common stock, diluting the voting power of the common stock, or subordinating the liquidation rights of the common stock. As a result of these or other factors, the issuance of preferred stock could have an adverse impact on the market price of our common stock.
Dividends
The DGCL permits a corporation to declare and pay dividends out of “surplus” or, if there is no “surplus,” out of its net profits for the fiscal year in which the dividend is declared and/or the preceding fiscal year. “Surplus” is defined as the excess of the net assets of the corporation over the amount determined to be the capital of the corporation by the Board of Directors. The capital of the corporation is typically calculated to be (and cannot be less than) the aggregate par value of all issued shares of capital stock. Net assets equal the fair value of the total assets minus total liabilities. The DGCL also provides that dividends may not be paid out of net profits if, after the payment of the dividend, capital is less than the capital represented by the outstanding stock of all classes having a preference upon the distribution of assets.
Declaration and payment of any dividend will be subject to the discretion of our Board of Directors. The time and amount of dividends will depend upon our financial condition, operations, cash requirements and availability, debt repayment obligations, capital expenditure needs, restrictions in our debt instruments, industry trends, the provisions of Delaware law affecting the payment of distributions to stockholders, and any other factors our Board of Directors may consider relevant.
We have no current plans to pay dividends on our common stock. Any decision to declare and pay dividends in the future will be made at the sole discretion of our Board of Directors and will depend on, among other things, our results of operations, cash requirements, financial condition, contractual restrictions, and other factors that our board of directors may deem relevant. Because we are a holding company and have no direct operations, we will only be able to pay dividends from funds we receive from our subsidiaries. In addition, our ability to pay dividends will be limited by covenants in our existing indebtedness and may be limited by the agreements governing other indebtedness that we or our subsidiaries incur in the future. See “Description of Certain Indebtedness.”
Annual Stockholder Meetings
Our amended and restated bylaws provide that annual stockholder meetings will be held at a date, time, and place, if any, as exclusively selected by our Board of Directors. To the extent permitted under applicable law, we may conduct meetings by remote communications, including by webcast.
125
Table of Contents
Anti-Takeover Effects of Our Amended and Restated Certificate of Incorporation and Amended and
Restated Bylaws and Certain Provisions of Delaware Law
Our amended and restated certificate of incorporation, amended and restated bylaws, and the DGCL contain provisions that are summarized in the following paragraphs and that are intended to enhance the likelihood of continuity and stability in the composition of our Board of Directors. These provisions are intended to avoid costly takeover battles, reduce our vulnerability to a hostile change of control, and enhance the ability of our Board of Directors to maximize stockholder value in connection with any unsolicited offer to acquire us. However, these provisions may have an anti-takeover effect and may delay, deter, or prevent a merger or acquisition of the Company by means of a tender offer, a proxy contest, or other takeover attempt that a stockholder might consider in its best interest, including those attempts that might result in a premium over the prevailing market price for the shares of common stock held by stockholders.
Authorized but Unissued Capital Stock
Delaware law does not require stockholder approval for any issuance of authorized shares. However, the listing requirements of the , which would apply if and so long as our common stock remains listed on the , require stockholder approval of certain issuances equal to or exceeding 20% of the then outstanding voting power or then outstanding number of shares of common stock. Additional shares that may be used in the future may be issued for a variety of corporate purposes, including future public offerings, to raise additional capital, or to facilitate acquisitions.
Our Board of Directors may generally issue preferred shares on terms calculated to discourage, delay, or prevent a change of control of the Company or the removal of our management. Moreover, our authorized but unissued shares of preferred stock will be available for future issuances without stockholder approval and could be utilized for a variety of corporate purposes, including future offerings to raise additional capital, to facilitate acquisitions, and employee benefit plans.
One of the effects of the existence of unissued and unreserved common stock or preferred stock may be to enable our Board of Directors to issue shares to persons friendly to current management, which issuance could render more difficult, or discourage an attempt to obtain control of the Company by means of a merger, tender offer, proxy contest, or otherwise, and thereby to protect the continuity of our management and possibly deprive our stockholders of opportunities to sell their shares of common stock at prices higher than prevailing market prices.
Classified Board of Directors
Our amended and restated certificate of incorporation provides that our Board of Directors will be divided into three classes of directors, with the classes to be as nearly equal in number as possible, and with the directors serving three-year terms. As a result, approximately one-third of our Board of Directors will be elected each year. The classification of directors will have the effect of making it more difficult for stockholders to change the composition of our Board of Directors. Our amended and restated certificate of incorporation and amended and restated bylaws provide that, subject to any rights of holders of preferred stock to elect additional directors under specified circumstances, the number of directors will be fixed from time to time exclusively pursuant to a resolution adopted by the Board of Directors.
Business Combinations
We have opted out of Section 203 of the DGCL; however, our amended and restated certificate of incorporation contains similar provisions providing that we may not engage in certain “business combinations” with any “interested stockholder” for a three-year period following the time that the stockholder became an interested stockholder, unless:
| • | prior to such time, our Board of Directors approved either the business combination or the transaction that resulted in the stockholder becoming an interested stockholder; |
126
Table of Contents
| • | upon consummation of the transaction that resulted in the stockholder becoming an interested stockholder, the interested stockholder owned at least 85% of our voting stock outstanding at the time the transaction commenced, excluding certain shares; or |
| • | at or subsequent to that time, the business combination is approved by our Board of Directors and by the affirmative vote of holders of at least 66 2⁄3% of our outstanding voting stock that is not owned by the interested stockholder. |
Generally, a “business combination” includes a merger, asset or stock sale, or other transaction resulting in a financial benefit to the interested stockholder. Subject to certain exceptions, an “interested stockholder” is a person who, together with that person’s affiliates and associates, owns, or within the previous three years owned, 15% or more of our outstanding voting stock. For purposes of this section only, “voting stock” has the meaning given to it in Section 203 of the DGCL.
Under certain circumstances, this provision will make it more difficult for a person who would be an “interested stockholder” to effect various business combinations with us for a three-year period. This provision may encourage companies interested in acquiring us to negotiate in advance with our Board of Directors because the stockholder approval requirement would be avoided if our Board of Directors approves either the business combination or the transaction that results in the stockholder becoming an interested stockholder. These provisions also may have the effect of preventing changes in our Board of Directors and may make it more difficult to accomplish transactions that stockholders may otherwise deem to be in their best interests.
Our amended and restated certificate of incorporation provides that our Sponsors and their respective affiliates, and any of their respective direct or indirect transferees, and any group as to which such persons are a party, do not constitute “interested stockholders” for purposes of this provision.
Removal of Directors; Vacancies
Under the DGCL, unless otherwise provided in our amended and restated certificate of incorporation, directors serving on a classified board may be removed by the stockholders only for cause. Our amended and restated certificate of incorporation provides that directors may be removed with or without cause upon the affirmative vote of a majority in voting power of all outstanding shares of stock entitled to vote generally in the election of directors, voting together as a single class; provided, however, at any time when Blackstone and its affiliates beneficially own in the aggregate, less than 30% of the voting power of all outstanding shares of our stock entitled to vote generally in the election of directors, directors may only be removed for cause, and only upon the affirmative vote of holders of at least 66 2⁄3% of the voting power of all the then outstanding shares of stock entitled to vote generally in the election of directors, voting together as a single class. In addition, our amended and restated certificate of incorporation also provides that, subject to the rights granted to one or more series of preferred stock then outstanding or the rights granted under the stockholders agreement with Blackstone, any newly created directorship on the Board of Directors that results from an increase in the number of directors and any vacancies on our Board of Directors will be filled only by the affirmative vote of a majority of the remaining directors, even if less than a quorum, by a sole remaining director or by the stockholders; provided, however, at any time when Blackstone and its affiliates beneficially own, in the aggregate, less than 30% of voting power of the stock of the Company entitled to vote generally in the election of directors, any newly created directorship on the Board of Directors that results from an increase in the number of directors and any vacancy occurring on the Board of Directors may only be filled by a majority of the directors then in office, although less than a quorum, or by a sole remaining director (and not by the stockholders).
127
Table of Contents
No Cumulative Voting
Under Delaware law, the right to vote cumulatively does not exist unless the certificate of incorporation specifically authorizes cumulative voting. Our amended and restated certificate of incorporation does not authorize cumulative voting. Therefore, stockholders holding a majority of the shares of our stock entitled to vote generally in the election of directors will be able to elect all our directors.
Special Stockholder Meetings
Our amended and restated certificate of incorporation provides that special meetings of our stockholders may be called at any time only by or at the direction of the Board of Directors or the chairman of the Board of Directors; provided, however, at any time when Blackstone and its affiliates beneficially own, in the aggregate, at least 30% in voting power of the stock entitled to vote generally in the election of directors, special meetings of our stockholders shall also be called by the Board of Directors or the chairman of the Board of Directors at the request of Blackstone and its affiliates. Our amended and restated bylaws prohibit the conduct of any business at a special meeting other than as specified in the notice for such meeting. These provisions may have the effect of deferring, delaying, or discouraging hostile takeovers, or changes in control or management of the Company.
Director Nominations and Stockholder Proposals
Our amended and restated bylaws establish advance notice procedures with respect to stockholder proposals and the nomination of candidates for election as directors, other than nominations made by or at the direction of the Board of Directors or a committee of the Board of Directors. In order for any matter to be “properly brought” before a meeting, a stockholder will have to comply with advance notice requirements and provide us with certain information. Generally, to be timely, a stockholder’s notice must be received at our principal executive offices not less than 90 days nor more than 120 days prior to the first anniversary date of the immediately preceding annual meeting of stockholders. Our amended and restated bylaws also specify requirements as to the form and content of a stockholder’s notice. These provisions will not apply to Blackstone and its affiliates so long as the stockholders agreement remains in effect. Our amended and restated bylaws allow the chairman of the meeting at a meeting of the stockholders to adopt rules and regulations for the conduct of meetings that may have the effect of precluding the conduct of certain business at a meeting if the rules and regulations are not followed. These provisions may also defer, delay, or discourage a potential acquirer from conducting a solicitation of proxies to elect the acquirer’s own slate of directors or otherwise attempting to influence or obtain control of the Company.
Stockholder Action by Written Consent
Pursuant to Section 228 of the DGCL, any action required to be taken at any annual or special meeting of the stockholders may be taken without a meeting, without prior notice, and without a vote if a consent or consents in writing, setting forth the action so taken, is or are signed by the holders of outstanding stock having not less than the minimum number of votes that would be necessary to authorize or take such action at a meeting at which all shares of our stock entitled to vote thereon were present and voted, unless our amended and restated certificate of incorporation provides otherwise. Our amended and restated certificate of incorporation will preclude stockholder action by written consent at any time when Blackstone and its affiliates own, in the aggregate, less than 30% in voting power of our stock entitled to vote generally in the election of directors.
Supermajority Provisions
Our amended and restated certificate of incorporation and amended and restated bylaws will provide that the Board of Directors is expressly authorized to make, alter, amend, change, add to, rescind, or repeal, in whole or in part, our bylaws without a stockholder vote in any matter not inconsistent with the laws of the State of
128
Table of Contents
Delaware or our amended and restated certificate of incorporation. For as long as Blackstone and its affiliates beneficially own, in the aggregate, at least 30% in voting power of our stock entitled to vote generally in the election of directors, any amendment, alteration, change, addition, or repeal of our bylaws by our stockholders requires the affirmative vote of a majority in voting power of the outstanding shares of our stock present in person or represented by proxy and entitled to vote on such amendment, alteration, rescission, or repeal. At any time when Blackstone and its affiliates beneficially own, in the aggregate, less than 30% in voting power of our stock entitled to vote generally in the election of directors, any amendment, alteration, rescission, or repeal of our bylaws by our stockholders requires the affirmative vote of the holders of at least 66 2⁄3% in voting power of all the then outstanding shares of stock entitled to vote thereon, voting together as a single class.
The DGCL provides generally that the affirmative vote of a majority of the outstanding shares entitled to vote thereon, voting together as a single class, is required to amend a corporation’s certificate of incorporation, unless the certificate of incorporation requires a greater percentage.
Our amended and restated certificate of incorporation provides that at any time when Blackstone and its affiliates beneficially own, in the aggregate, less than 30% in voting power of our stock entitled to vote generally in the election of directors, the following provisions in our amended and restated certificate of incorporation may be amended, altered, repealed, or rescinded only by the affirmative vote of the holders of at least 66 2⁄3% in voting power all the then outstanding shares of our stock entitled to vote thereon, voting together as a single class:
| • | the provision requiring a 66 2⁄3% supermajority vote for stockholders to amend our bylaws; |
| • | the provisions providing for a classified Board of Directors (the election and term of our directors); |
| • | the provisions regarding resignation and removal of directors; |
| • | the provisions regarding competition and corporate opportunities; |
| • | the provisions regarding entering into business combinations with interested stockholders; |
| • | the provisions regarding stockholder action by written consent; |
| • | the provisions regarding calling special meetings of stockholders; |
| • | the provisions regarding filling vacancies on our Board of Directors and newly created directorships; |
| • | the provisions eliminating monetary damages for breaches of fiduciary duty by a director; and |
| • | the amendment provision requiring that the above provisions be amended only with a 66 2⁄3% supermajority vote. |
The combination of the classification of our Board of Directors, the lack of cumulative voting, and the supermajority voting requirements will make it more difficult for our existing stockholders to replace our Board of Directors as well as for another party to obtain control of us by replacing our Board of Directors. Because our Board of Directors has the power to retain and discharge our officers, these provisions could also make it more difficult for existing stockholders or another party to effect a change in management.
These provisions may have the effect of deterring hostile takeovers or delaying or preventing changes in control of our management or the Company, such as a merger, reorganization, or tender offer. These provisions are intended to enhance the likelihood of continued stability in the composition of our Board of Directors and its policies and to discourage certain types of transactions that may involve an actual or threatened acquisition of the Company. These provisions are designed to reduce our vulnerability to an unsolicited acquisition proposal. The provisions are also intended to discourage certain tactics that may be used in proxy fights. However, such provisions could have the effect of discouraging others from making tender offers for our shares and, as a consequence, they also may inhibit fluctuations in the market price of our shares that could result from actual or rumored takeover attempts. Such provisions may also have the effect of preventing changes in management.
129
Table of Contents
Dissenters’ Rights of Appraisal and Payment
Under the DGCL, with certain exceptions, our stockholders will have appraisal rights in connection with a merger or consolidation of us. Pursuant to the DGCL, stockholders who properly request and perfect appraisal rights in connection with such merger or consolidation will have the right to receive payment of the fair value of their shares as determined by the Delaware Court of Chancery.
Stockholders’ Derivative Actions
Under the DGCL, any of our stockholders may bring an action in our name to procure a judgment in our favor, also known as a derivative action, provided that the stockholder bringing the action is a holder of our shares at the time of the transaction to which the action relates or such stockholder’s stock thereafter devolved by operation of law.
Exclusive Forum
Our amended and restated certificate of incorporation will provide that unless we consent to the selection of an alternative forum, the Court of Chancery of the State of Delaware shall, to the fullest extent permitted by law, be the sole and exclusive forum for any (i) derivative action or proceeding brought on behalf of our Company, (ii) action asserting a claim of breach of a fiduciary duty owed by any director or officer of our Company to the Company or the Company’s stockholders, creditors, or other constituents, (iii) action asserting a claim against the Company or any director or officer of the Company arising pursuant to any provision of the DGCL or our amended and restated certificate of incorporation or our amended and restated bylaws, or (iv) action asserting a claim against the Company or any director or officer of the Company governed by the internal affairs doctrine, in each such case subject to said Court of Chancery having personal jurisdiction over the indispensable parties named as defendants therein. Any person or entity purchasing or otherwise acquiring any interest in shares of capital stock of the Company shall be deemed to have notice of and consented to the forum provisions in our amended and restated certificate of incorporation. However, the enforceability of similar forum provisions in other companies’ certificates of incorporation has been challenged in legal proceedings, and it is possible that a court could find these types of provisions to be unenforceable.
Conflicts of Interest
Delaware law permits corporations to adopt provisions renouncing any interest or expectancy in certain opportunities that are presented to the corporation or its officers, directors, or stockholders. Our amended and restated certificate of incorporation will, to the maximum extent permitted from time to time by Delaware law, renounce any interest or expectancy that we have in, or right to be offered an opportunity to participate in, specified business opportunities that are from time to time presented to our officers, directors, or stockholders or their respective affiliates, other than those officers, directors, stockholders, or affiliates who are our or our subsidiaries’ employees. Our amended and restated certificate of incorporation will provide that, to the fullest extent permitted by law, none of our Sponsors or any of its affiliates or any director who is not employed by us (including any non-employee director who serves as one of our officers in both his director and officer capacities) or his or her affiliates will have any duty to refrain from (i) engaging in a corporate opportunity in the same or similar lines of business in which we or our affiliates now engage or propose to engage or (ii) otherwise competing with us or our affiliates. In addition, to the fullest extent permitted by law, in the event that any of our Sponsors or any non-employee director acquires knowledge of a potential transaction or other business opportunity which may be a corporate opportunity for itself or himself or its or his affiliates or for us or our affiliates, such person will have no duty to communicate or offer such transaction or business opportunity to us or any of our affiliates and they may take any such opportunity for themselves or offer it to another person or entity. Our amended and restated certificate of incorporation will not renounce our interest in any business opportunity that is expressly offered to a non-employee director solely in his or her capacity as a director or
130
Table of Contents
officer of the Company. To the fullest extent permitted by law, no business opportunity will be deemed to be a potential corporate opportunity for us unless we would be permitted to undertake the opportunity under our amended and restated certificate of incorporation, we have sufficient financial resources to undertake the opportunity, and the opportunity would be in line with our business.
Limitations on Liability and Indemnification of Officers and Directors
The DGCL authorizes corporations to limit or eliminate the personal liability of directors to corporations and their stockholders for monetary damages for breaches of directors’ fiduciary duties, subject to certain exceptions. Our amended and restated certificate of incorporation includes a provision that eliminates the personal liability of directors for monetary damages for any breach of fiduciary duty as a director, except to the extent such exemption from liability or limitation thereof is not permitted under the DGCL. The effect of these provisions is to eliminate the rights of us and our stockholders, through stockholders’ derivative suits on our behalf, to recover monetary damages from a director for breach of fiduciary duty as a director, including breaches resulting from grossly negligent behavior. However, exculpation does not apply to any director if the director has acted in bad faith, knowingly or intentionally violated the law, authorized illegal dividends or redemptions, or derived an improper benefit from his or her actions as a director.
Our amended and restated bylaws provide that we must indemnify and advance expenses to our directors and officers to the fullest extent authorized by the DGCL. We also are expressly authorized to carry directors’ and officers’ liability insurance providing indemnification for our directors, officers, and certain employees for some liabilities. We believe that these indemnification and advancement provisions and insurance are useful to attract and retain qualified directors and executive officers.
The limitation of liability, advancement, and indemnification provisions in our amended and restated certificate of incorporation and amended and restated bylaws may discourage stockholders from bringing a lawsuit against directors for breach of their fiduciary duty. These provisions also may have the effect of reducing the likelihood of derivative litigation against directors and officers, even though such an action, if successful, might otherwise benefit us and our stockholders. In addition, your investment may be adversely affected to the extent we pay the costs of settlement and damage awards against directors and officers pursuant to these indemnification provisions.
There is currently no pending material litigation or proceeding involving any of our directors, officers, or employees for which indemnification is sought.
Transfer Agent and Registrar
The transfer agent and registrar for our common stock is .
Listing
We intend to apply to have our common stock approved for listing on the under the symbol “ .”
131
Table of Contents
SHARES ELIGIBLE FOR FUTURE SALE
General
Prior to this offering, there has not been a public market for our common stock, and we cannot predict what effect, if any, market sales of shares of common stock or the availability of shares of common stock for sale will have on the market price of our common stock prevailing from time to time. Nevertheless, sales of substantial amounts of common stock, including shares issued upon the exercise of outstanding options, in the public market, or the perception that such sales could occur, could materially and adversely affect the market price of our common stock and could impair our future ability to raise capital through the sale of our equity or equity-related securities at a time and price that we deem appropriate. See “Risk Factors—Risks Related to this Offering and Ownership of Our Common Stock—Future sales, or the perception of future sales, by us or our existing stockholders in the public market following this offering could cause the market price for our common stock to decline.”
Upon the consummation of this offering, we will have shares of common stock outstanding. All shares sold in this offering will be freely tradable without registration under the Securities Act and without restriction by persons other than our “affiliates” (as defined under Rule 144). The shares of common stock held by Blackstone, Wellspring and certain of our directors and officers after this offering, based on the number of shares outstanding as of June 28, 2014, will be “restricted” securities under the meaning of Rule 144 and may not be sold in the absence of registration under the Securities Act, unless an exemption from registration is available, including the exemptions pursuant to Rule 144 under the Securities Act.
The restricted shares held by our affiliates will be available for sale in the public market at various times after the date of this prospectus pursuant to Rule 144 following the expiration of the applicable lock-up period.
In addition, shares of common stock will be eligible for sale upon exercise of options granted under our 2007 Stock Option Plan. Furthermore, a total of shares of our common stock has been reserved for issuance under our 2014 Omnibus Incentive Plan (subject to adjustments for stock splits, stock dividends, and similar events), which will equal approximately % shares of our common stock outstanding immediately following this offering. We intend to file one or more registration statements on Form S-8 under the Securities Act to register common stock issued or reserved for issuance under the 2014 Omnibus Incentive Plan and the 2007 Stock Option Plan. Any such Form S-8 registration statement will automatically become effective upon filing. Accordingly, shares registered under such registration statement will be available for sale in the open market, unless such shares are subject to vesting restrictions or the lock-up restrictions described below.
Rule 144
In general, under Rule 144, as currently in effect, a person (or persons whose shares are aggregated) who is not deemed to be or have been one of our affiliates for purposes of the Securities Act at any time during 90 days preceding a sale and who has beneficially owned the shares proposed to be sold for at least six months, including the holding period of any prior owner other than an affiliate, is entitled to sell such shares without registration, subject to compliance with the public information requirements of Rule 144. If such a person has beneficially owned the shares proposed to be sold for at least one year, including the holding period of a prior owner other than an affiliate, then such person is entitled to sell such shares without complying with any of the requirements of Rule 144.
In general, under Rule 144, as currently in effect, our affiliates or persons selling shares on behalf of our affiliates, who have met the six month holding period for beneficial ownership of “restricted shares” of our common stock, are entitled to sell within any three-month period, a number of shares that does not exceed the greater of:
| • | 1% of the number of shares of our common stock then outstanding, which will equal approximately shares immediately after this offering; or |
132
Table of Contents
| • | the average reported weekly trading volume of our common stock on the during the four calendar weeks preceding the filing of a notice on Form 144 with respect to such sale. |
Sales under Rule 144 by our affiliates or persons selling shares on behalf of our affiliates are also subject to certain manner of sale provisions and notice requirements and to the availability of current public information about us. The sale of these shares, or the perception that sales will be made, could adversely affect the price of our common stock after this offering because a great supply of shares would be, or would be perceived to be, available for sale in the public market.
Lock-Up Agreements
Our officers, directors, and holders of substantially all of our stock have agreed, subject to certain exceptions, that they will not offer, sell, contract to sell, pledge, or otherwise dispose of, directly or indirectly, any shares of our common stock or securities convertible into or exchangeable or exercisable for any shares of our common stock, enter into a transaction that would have the same effect, or enter into any swap, hedge, or other arrangement that transfers, in whole or in part, any of the economic consequences of ownership of our common stock, whether any of these transactions are to be settled by delivery of our common stock or such other securities, in cash or otherwise, or publicly disclose the intention to make any offer, sale, pledge, or disposition, or to enter into any such transaction, swap, hedge, or other arrangement, without, in each case, the prior written consent of for a period of days after the date of this prospectus.
, on behalf of the underwriters, in their sole discretion, may release our common stock and other securities subject to the lock-up agreements described above in whole or in part at any time with or without notice.
Registration Rights
In connection with this offering, we intend to enter into a registration rights agreement that will provide Blackstone and Wellspring an unlimited number of “demand” registrations and customary “piggyback” registration rights. The registration rights agreement will also provide that we will pay certain expenses relating to such registrations and indemnify the registration rights holders against certain liabilities that may arise under the Securities Act.
133
Table of Contents
MATERIAL U.S. FEDERAL INCOME AND ESTATE TAX CONSEQUENCES TO
NON-U.S. HOLDERS OF OUR COMMON STOCK
The following is a summary of the material U.S. federal income and estate tax consequences to a non-U.S. holder (as defined below) of the purchase, ownership and disposition of our common stock issued pursuant to this offering as of the date hereof. Except where noted, this summary deals only with common stock that is held as a capital asset.
A “non-U.S. holder” means a person (other than a partnership) that is not for U.S. federal income tax purposes any of the following:
| • | an individual citizen or resident of the United States; |
| • | a corporation (or any other entity treated as a corporation for U.S. federal income tax purposes) created or organized in or under the laws of the United States, any state thereof or the District of Columbia; |
| • | an estate the income of which is subject to U.S. federal income taxation regardless of its source; or |
| • | a trust if it (1) is subject to the primary supervision of a court within the United States and one or more United States persons have the authority to control all substantial decisions of the trust or (2) has a valid election in effect under applicable U.S. Treasury regulations to be treated as a United States person. |
This summary is based upon provisions of the Internal Revenue Code of 1986, as amended (the “Code”), and U.S. Treasury regulations, administrative rulings and judicial decisions as of the date hereof. Those authorities may be changed, perhaps retroactively, so as to result in U.S. federal income and estate tax consequences different from those summarized below. This summary does not address all aspects of U.S. federal income and estate taxes, such as the Medicare contribution tax on net investment income, and does not deal with foreign, state, local or other tax considerations that may be relevant to non-U.S. holders in light of their particular circumstances. In addition, it does not represent a detailed description of the U.S. federal income tax consequences applicable to you if you are subject to special treatment under the U.S. federal income tax laws (including if you are a U.S. expatriate, “controlled foreign corporation,” “passive foreign investment company,” a person who holds or receives our common stock pursuant to the exercise of an employee stock option or otherwise as compensation or a partnership or other pass-through entity for U.S. federal income tax purposes). We cannot assure you that a change in law will not alter significantly the tax considerations that we describe in this summary.
If a partnership holds our common stock, the tax treatment of a partner will generally depend upon the status of the partner and the activities of the partnership. If you are a partner of a partnership holding our common stock, you should consult your tax advisors.
If you are considering the purchase of our common stock, you should consult your own tax advisors concerning the particular U.S. federal income and estate tax consequences to you of the purchase, ownership or disposition of our common stock, as well as the consequences to you arising under the laws of any other taxing jurisdiction.
Dividends
Distributions on our common stock will constitute dividends for U.S. federal income tax purposes to the extent paid out of our current or accumulated earnings and profits, as determined under U.S. federal income tax principles. Amounts not treated as dividends for U.S. federal income tax purposes will constitute a return of capital and will first be applied against and reduce a holder’s adjusted tax basis in the common stock, but not below zero. Any remaining excess will be treated as capital gain subject to the rules discussed under “—Gain on Disposition of Common Stock.”
134
Table of Contents
Dividends paid to a non-U.S. holder of our common stock generally will be subject to withholding of U.S. federal income tax at a 30% rate or such lower rate as may be specified by an applicable income tax treaty. However, dividends that are effectively connected with the conduct of a trade or business by the non-U.S. holder within the United States (and, if required by an applicable income tax treaty, are attributable to a U.S. permanent establishment of the non-U.S. holder) are not subject to withholding, provided certain certification and disclosure requirements are satisfied. Instead, such dividends are subject to U.S. federal income tax on a net income basis in the same manner as if the non-U.S. holder were a United States person as defined under the Code. Any such effectively connected dividends received by a foreign corporation may be subject to an additional “branch profits tax” at a 30% rate or such lower rate as may be specified by an applicable income tax treaty.
A non-U.S. holder of our common stock who wishes to claim the benefit of an applicable income tax treaty rate and avoid backup withholding, as discussed below, for dividends will be required (a) to complete the applicable Internal Revenue Service (“IRS”) Form W-8 and certify under penalty of perjury that such holder is not a United States person as defined under the Code and is eligible for treaty benefits or (b) if our common stock is held through certain foreign intermediaries, to satisfy the relevant certification requirements of applicable U.S. Treasury regulations.
A non-U.S. holder of our common stock eligible for a reduced rate of U.S. withholding tax pursuant to an income tax treaty may obtain a refund of any excess amounts withheld by timely filing an appropriate claim for refund with the IRS.
Gain on Disposition of Common Stock
Any gain realized on the sale, exchange, or other taxable disposition of our common stock generally will not be subject to U.S. federal income tax unless:
| • | the gain is effectively connected with a trade or business of the non-U.S. holder in the United States (and, if required by an applicable income tax treaty, is attributable to a U.S. permanent establishment of the non-U.S. holder); |
| • | the non-U.S. holder is an individual who is present in the United States for 183 days or more in the taxable year of that disposition, and certain other conditions are met; or |
| • | we are or have been a “United States real property holding corporation” for U.S. federal income tax purposes. |
A non-U.S. holder described in the first bullet point immediately above will be subject to tax on the net gain derived from the sale under regular graduated U.S. federal income tax rates applicable to such holder as if it were a United States person as defined under the Code. In addition, if a non-U.S. holder described in the first bullet point immediately above is a corporation for U.S. federal income tax purposes, it may be subject to the branch profits tax equal to 30% of its effectively connected earnings and profits or at such lower rate as may be specified by an applicable income tax treaty.
An individual non-U.S. holder described in the second bullet point immediately above will be subject to a flat 30% tax on the gain derived from the sale, which may be offset by U.S. source capital losses, even though the individual is not considered a resident of the United States, provided such non-U.S. holder has timely filed U.S. federal income tax returns with respect to such losses.
We believe we are not and do not anticipate becoming a “United States real property holding corporation” for U.S. federal income tax purposes.
135
Table of Contents
Federal Estate Tax
Common stock held by an individual non-U.S. holder at the time of death will be included in such holder’s gross estate for U.S. federal estate tax purposes, unless an applicable estate tax treaty provides otherwise.
Information Reporting and Backup Withholding
We must report annually to the IRS and to each non-U.S. holder the amount of dividends paid to such holder and the tax withheld with respect to such dividends, regardless of whether withholding was required. Copies of the information returns reporting such dividends and withholding may also be made available to the tax authorities in the country in which the non-U.S. holder resides under the provisions of an applicable income tax treaty.
A non-U.S. holder will be subject to backup withholding for dividends paid to such holder unless such holder certifies under penalty of perjury that it is a non-U.S. holder (and the payor does not have actual knowledge or reason to know that such holder is a United States person as defined under the Code), or such holder otherwise establishes an exemption.
Information reporting and, depending on the circumstances, backup withholding will apply to the proceeds of a sale of our common stock within the United States or conducted through certain U.S.-related financial intermediaries, unless the beneficial owner certifies under penalty of perjury that it is a non-U.S. holder (and the payor does not have actual knowledge or reason to know that the beneficial owner is a United States person as defined under the Code), or such owner otherwise establishes an exemption.
Backup withholding is not an additional tax. Any amounts withheld under the backup withholding rules may be allowed as a refund or a credit against a non-U.S. holder’s U.S. federal income tax liability provided the required information is timely furnished to the IRS.
Additional Withholding Requirements
Under Sections 1471 through 1474 of the Code (such Sections commonly referred to as “FATCA”), a 30% U.S. federal withholding tax may apply to any dividends paid on our common stock, and, for a disposition of our common stock occurring after December 31, 2016, the gross proceeds from such disposition, in each case paid to (i) a “foreign financial institution” (as specifically defined in the Code) that does not provide sufficient documentation, typically on IRS Form W-8BEN-E, evidencing either (x) an exemption from FATCA or (y) its compliance (or deemed compliance) with FATCA (which may alternatively be in the form of compliance with an intergovernmental agreement with the United States) in a manner that avoids withholding, or (ii) a “non-financial foreign entity” (as specifically defined in the Code) that does not provide sufficient documentation, typically on IRS Form W-8BEN-E, evidencing either (x) an exemption from FATCA or (y) adequate information regarding certain substantial U.S. beneficial owners of such entity (if any). If a dividend payment is both subject to withholding under FATCA and subject to the withholding tax discussed above under “—Dividends,” the withholding under FATCA may be credited against, and therefore reduce, such other withholding tax. You should consult your own tax advisor regarding these requirements and whether they may be relevant to your ownership and disposition of our common stock.
136
Table of Contents
Under the terms and subject to the conditions contained in an underwriting agreement, we and the selling stockholders have agreed to sell to the underwriters named below, for whom Credit Suisse Securities (USA) LLC and Barclays Capital Inc. are acting as representatives, the following respective numbers of shares of common stock.
| Underwriter |
Number of Shares | |
| Credit Suisse Securities (USA) LLC |
||
| Barclays Capital Inc. |
||
| Wells Fargo Securities, LLC |
||
| Morgan Stanley & Co. LLC |
||
|
| ||
| Total |
||
|
|
The underwriting agreement provides that the underwriters are obligated to purchase all the shares of common stock in the offering if any are purchased, other than those shares covered by the over-allotment option described below. The underwriting agreement also provides that if an underwriter defaults, the purchase commitments of non-defaulting underwriters may be increased or the offering may be terminated.
have granted to the underwriters a 30-day option to purchase up to additional shares at the initial public offering price less the underwriting discounts and commissions.
The underwriters propose to offer the shares of common stock initially at the public offering price on the cover page of this prospectus and to selling group members at that price less a selling concession of $ per share. After the initial public offering the representatives may change the public offering price and concession.
The following table summarizes the compensation we and the selling stockholders will pay:
| Per Share | Total | |||||||||||||||
| Without Over-allotment |
With Over-allotment |
Without Over-allotment |
With Over-allotment |
|||||||||||||
| Underwriting Discounts and Commissions paid by us |
$ | $ | $ | $ | ||||||||||||
| Underwriting Discounts and Commissions paid by selling stockholders |
$ | $ | $ | $ | ||||||||||||
We estimate that our out-of-pocket expenses for this offering will be approximately $ .
We have agreed to reimburse the underwriters for expenses of approximately $ related to clearance of this offering with the Financial Industry Regulatory Authority, Inc., or FINRA.
The underwriters have informed us that they do not expect sales to accounts over which the underwriters have discretionary authority to exceed 5% of the shares of common stock being offered.
We have agreed, subject to certain, exceptions, that we will not, directly or indirectly, offer, sell, issue, contract to sell, pledge or otherwise dispose of or file with the SEC a registration statement under the Securities Act relating to, any shares of our common stock or securities convertible into or exchangeable or exercisable for any shares of our common stock, or publicly disclose the intention to take any such action, without the prior written consent of for a period of 180 days after the date of this prospectus.
137
Table of Contents
Our officers, directors and holders of substantially all of our stock have agreed, subject to certain exceptions, that they will not offer, sell, contract to sell, pledge or otherwise dispose of, directly or indirectly, any shares of our common stock or securities convertible into or exchangeable or exercisable for any shares of our common stock, enter into a transaction that would have the same effect, or enter into any swap, hedge or other arrangement that transfers, in whole or in part, any of the economic consequences of ownership of our common stock, whether any of these transactions are to be settled by delivery of our common stock or such other securities, in cash or otherwise, or publicly disclose the intention to make any offer, sale, pledge or disposition, or to enter into any such transaction, swap, hedge or other arrangement, without, in each case, the prior written consent of for a period of 180 days after the date of this prospectus.
, on behalf of the underwriters, in their sole discretion, may release our common stock and other securities subject to the lock-up agreements described above in whole or in part at any time with or without notice.
We and the selling stockholders have agreed to indemnify the underwriters against certain liabilities, including liabilities under the Securities Act, or to contribute to payments that the underwriters may be required to make in that respect.
We will apply to list the shares of common stock on under the symbol “ .”
In connection with the offering the underwriters may engage in stabilizing transactions, over-allotment transactions, syndicate covering transactions and penalty bids in accordance with Regulation M under the Exchange Act.
| • | Stabilizing transactions permit bids to purchase the underlying security so long as the stabilizing bids do not exceed a specified maximum. |
| • | Over-allotment involves sales by the underwriters of shares in excess of the number of shares the underwriters are obligated to purchase, which creates a syndicate short position. The short position may be either a covered short position or a naked short position. In a covered short position, the number of shares over-allotted by the underwriters is not greater than the number of shares that they may purchase in the over-allotment option. In a naked short position, the number of shares involved is greater than the number of shares in the over-allotment option. The underwriters may close out any covered short position by either exercising their over-allotment option and/or purchasing shares in the open market. |
| • | Syndicate covering transactions involve purchases of the common stock in the open market after the distribution has been completed in order to cover syndicate short positions. In determining the source of shares to close out the short position, the underwriters will consider, among other things, the price of shares available for purchase in the open market as compared to the price at which they may purchase shares through the over-allotment option. If the underwriters sell more shares than could be covered by the over-allotment option, a naked short position, the position can only be closed out by buying shares in the open market. A naked short position is more likely to be created if the underwriters are concerned that there could be downward pressure on the price of the shares in the open market after pricing that could adversely affect investors who purchase in the offering. |
| • | Penalty bids permit the representatives to reclaim a selling concession from a syndicate member when the common stock originally sold by the syndicate member is purchased in a stabilizing or syndicate covering transaction to cover syndicate short positions. |
These stabilizing transactions, syndicate covering transactions and penalty bids may have the effect of raising or maintaining the market price of our common stock or preventing or retarding a decline in the market price of the common stock. As a result the price of our common stock may be higher than the price that might otherwise exist in the open market. These transactions may be effected on or otherwise and, if commenced, may be discontinued at any time.
138
Table of Contents
Prior to this offering, there has been no public market for our common stock. The initial public offering price will be determined by negotiations between us and the representatives. In determining the initial public offering price, we and the representatives expect to consider a number of factors including:
| • | the information set forth in this prospectus and otherwise available to the representatives; |
| • | our prospects and the history and prospects for the industry in which we compete; |
| • | an assessment of our management; |
| • | our prospects for future earnings; |
| • | the general condition of the securities markets at the time of this offering; |
| • | the recent market prices of, and demand for, publicly traded common stock of generally comparable companies; and |
| • | other factors deemed relevant by the underwriters and us. |
A prospectus in electronic format may be made available on the websites maintained by one or more of the underwriters, or selling group members, if any, participating in this offering and one or more of the underwriters participating in this offering may distribute prospectuses electronically. The representatives may agree to allocate a number of shares to underwriters and selling group members for sale to their online brokerage account holders. Internet distributions will be allocated by the underwriters and selling group members that will make internet distributions on the same basis as other allocations.
Other Relationships
The underwriters and their respective affiliates are full-service financial institutions engaged in various activities, which may include securities trading, commercial and investment banking, financial advisory, investment management, investment research, principal investment, hedging, financing and brokerage activities.
We expect that the underwriters and their respective affiliates will continue to perform various financial advisory, investment banking and lending services for us or our affiliates, from time to time in the future, for which they may receive customary fees and commissions. In the ordinary course of their various business activities, the underwriters and their respective affiliates may also make or hold a broad array of investments and actively trade debt and equity securities (or related derivative securities) and financial instruments (including bank loans) for their own account and for the accounts of their customers and may at any time hold long and short positions in such securities and instruments. Such investment and securities activities may involve our securities and instruments (directly, as collateral securing other obligations or otherwise). The underwriters and their respective affiliates may also make investment recommendations and/or publish or express independent research views in respect of such securities or instruments and may at any time hold, or recommend to clients that they acquire, long and/or short positions in such securities and instruments. In addition, certain of the underwriters or their respective affiliates, including Barclays Bank PLC, an affiliate of Barclays Capital Inc., Wells Fargo Bank, N.A., an affiliate of Wells Fargo Securities, LLC, and Credit Suisse AG, Cayman Islands Branch, an affiliate of Credit Suisse Securities (USA) LLC, are lenders or agents or managers for the lenders under our ABL facility or our term loan facility.
Selling Restrictions
Notice to Investors in the European Economic Area
In relation to each Member State of the European Economic Area that has implemented the Prospectus Directive (each, a” Relevant Member State”), each underwriter represents and agrees that with effect from and including the date on which the Prospectus Directive is implemented in that Relevant Member State, or the Relevant Implementation Date, it has not made and will not make an offer of our common stock to the public in that Relevant Member State prior to the publication of a prospectus in relation to our common stock that has been
139
Table of Contents
approved by the competent authority in that Relevant Member State or, where appropriate, approved in another Relevant Member State and notified to the competent authority in that Relevant Member State, all in accordance with the Prospectus Directive, except that it may, with effect from and including the Relevant Implementation Date, make an offer of our common stock to the public in that Relevant Member State at any time:
| • | to any legal entity that is a qualified investor as defined in the Prospectus Directive; |
| • | to fewer than 100 or, if the Relevant Member State has implemented the relevant provision of the PD Amending Directive, 150, natural or legal persons (other than qualified investors as defined in the Prospectus Directive) subject to obtaining the prior consent of the manager for any such offer; or |
| • | in any other circumstances falling within Article 3(2) of the Prospectus Directive; |
provided that no such offer of our common stock shall require the publication by the Issuer or any underwriter of a prospectus pursuant to Article 3 of the Prospectus Directive.
For the purposes of this provision, the expression an “offer to the public” in relation to any shares of our common stock in any Relevant Member State means the communication in any form and by any means of sufficient information on the terms of the offer and our common stock to be offered so as to enable an investor to decide to purchase or subscribe our common stock, as the same may be varied in that Relevant Member State by any measure implementing the Prospectus Directive in that Member State and the expression Prospectus Directive means Directive 2003/71/EC and (and amendments thereto, including Directive 2010/73/EU, to the extent implemented in each Relevant Member State) includes any relevant implementing measure in each Relevant Member State.
Notice to Investors in the United Kingdom
Each underwriter:
| • | has only communicated or caused to be communicated and will only communicate or cause to be communicated any invitation or inducement to engage in investment activity (within the meaning of section 21 of FSMA) in connection with the sale or issue of common stock in circumstances in which section 21 of FSMA does not apply to such underwriter; and |
| • | has complied with, and will comply with all applicable provisions of FSMA with respect to anything done by it in relation to the shares of common stock in, from, or otherwise involving the United Kingdom. |
This prospectus is directed solely at persons who (i) are outside the United Kingdom or (ii) have professional experience in matters relating to investments or (iii) are persons falling within Article 49(2)(a) to (d) of The Financial Services and Markets Act (Financial Promotion) Order 2005 (all such persons together being referred to as “relevant persons”). This prospectus must not be acted on or relied on by persons who are not relevant persons. Any investment or investment activity to which this prospectus relates is available only to relevant persons and will be engaged in with relevant persons only.
140
Table of Contents
The validity of the shares of common stock offered by this prospectus will be passed upon for us by Simpson Thacher & Bartlett LLP, New York, New York. Certain legal matters in connection with the offering will be passed upon for the underwriters by Latham & Watkins LLP, New York, New York. An investment vehicle comprised of selected partners of Simpson Thacher & Bartlett LLP, members of their families, related persons and others owns an interest representing less than 1% of the capital commitments of funds affiliated with The Blackstone Group L.P.
The consolidated financial statements of Performance Food Group Company and subsidiaries as of June 28, 2014 and June 29, 2013 and the related consolidated Statements of Operations, Statements of Comprehensive Income, Shareholders’ Equity and Cash Flows for the periods ended June 28, 2014, June 29, 2013, and June 30, 2012 included in this Prospectus and the related financial statement schedule included elsewhere in this registration statement have been audited by Deloitte & Touche LLP, an independent registered public accounting firm, as set forth in their report appearing herein. Such consolidated financial statements and financial statement schedule have been so included in reliance upon the report of such firm given upon their authority as experts in accounting and auditing.
WHERE YOU CAN FIND MORE INFORMATION
We have filed with the SEC a registration statement on Form S-1 under the Securities Act with respect to the common stock offered by this prospectus. This prospectus is a part of the registration statement and does not contain all of the information set forth in the registration statement and its exhibits and schedules, portions of which have been omitted as permitted by the rules and regulations of the SEC. For further information about us and our common stock, you should refer to the registration statement and its exhibits and schedules.
We will file annual, quarterly, and special reports and other information with the SEC. Our filings with the SEC will be available to the public on the SEC’s website at http://www.sec.gov. Those filings will also be available to the public on, or accessible through, our website under the heading “Investor Relations” at www.pfgc.com. The information we file with the SEC or contained on or accessible through our corporate website or any other website that we may maintain is not part of this prospectus or the registration statement of which this prospectus is a part. You may also read and copy, at SEC prescribed rates, any document we file with the SEC, including the registration statement (and its exhibits) of which this prospectus is a part, at the SEC’s Public Reference Room located at 100 F Street, N.E., Washington D.C. 20549. You can call the SEC at 1-800-SEC-0330 to obtain information on the operation of the Public Reference Room.
We intend to make available to our common stockholders annual reports containing consolidated financial statements audited by an independent registered public accounting firm.
141
Table of Contents
Audited Consolidated Financial Statements as of June 28, 2014 and June 29, 2013 and for the fiscal years ended June 28, 2014, June 29, 2013 and June 30, 2012
| F-2 | ||||
| F-3 | ||||
| F-4 | ||||
| F-5 | ||||
| F-6 | ||||
| F-7 | ||||
| F-9 | ||||
| F-40 | ||||
F-1
Table of Contents
REPORT OF INDEPENDENT REGISTERED PUBLIC ACCOUNTING FIRM
To the Board of Directors and Shareholders of
Performance Food Group Company
Richmond, Virginia
We have audited the accompanying consolidated balance sheets of Performance Food Group Company and subsidiaries (the “Company”) as of June 28, 2014 and June 29, 2013, and the related consolidated statements of operations, comprehensive income, shareholders’ equity, and cash flows for each of the three years in the periods ended June 28, 2014, June 29, 2013 and June 30, 2012. Our audits also included the consolidated financial statement schedule listed in the Index at Page F-1. These financial statements and financial statement schedule are the responsibility of the Company’s management. Our responsibility is to express an opinion on these financial statements and financial statement schedule based on our audits.
We conducted our audits in accordance with the standards of the Public Company Accounting Oversight Board (United States). Those standards require that we plan and perform the audit to obtain reasonable assurance about whether the financial statements are free of material misstatement. The Company is not required to have, nor were we engaged to perform, an audit of its internal control over financial reporting. Our audits included consideration of internal control over financial reporting as a basis for designing audit procedures that are appropriate in the circumstances, but not for the purpose of expressing an opinion on the effectiveness of the Company’s internal control over financial reporting. Accordingly, we express no such opinion. An audit also includes examining, on a test basis, evidence supporting the amounts and disclosures in the financial statements, assessing the accounting principles used and significant estimates made by management, as well as evaluating the overall financial statement presentation. We believe that our audits provide a reasonable basis for our opinion.
In our opinion, such consolidated financial statements present fairly, in all material respects, the financial position of Performance Food Group Company and subsidiaries as of June 28, 2014 and June 29, 2013, and the results of their operations and their cash flows for each of the three years in the periods ended June 28, 2014, June 29, 2013 and June 30, 2012, in conformity with accounting principles generally accepted in the United States of America. Also, in our opinion, such financial statement schedule, when considered in relation to the basic consolidated financial statements taken as a whole, presents fairly, in all material respects, the information set forth therein.
/s/ Deloitte & Touche LLP
Richmond, VA
September 9, 2014
F-2
Table of Contents
PERFORMANCE FOOD GROUP COMPANY
| ($ in thousands) |
As of June 28, 2014 | As of June 29, 2013 | ||||||
| ASSETS |
||||||||
| Current assets: |
||||||||
| Cash |
$ | 5,310 | $ | 14,077 | ||||
| Accounts receivable, less allowances of $14,749 and $14,282 |
834,769 | 709,170 | ||||||
| Inventories, net |
848,995 | 741,375 | ||||||
| Prepaid expenses and other current assets |
22,441 | 19,221 | ||||||
| Deferred income tax asset, net |
15,806 | 20,939 | ||||||
|
|
|
|
|
|||||
| Total current assets |
1,727,321 | 1,504,782 | ||||||
| Goodwill |
663,868 | 665,781 | ||||||
| Other intangible assets, net |
241,281 | 308,349 | ||||||
| Property, plant and equipment, net |
569,909 | 548,586 | ||||||
| Restricted cash |
15,101 | 10,001 | ||||||
| Other assets |
21,371 | 16,725 | ||||||
| Assets held for sale |
936 | 1,175 | ||||||
|
|
|
|
|
|||||
| Total assets |
$ | 3,239,787 | $ | 3,055,399 | ||||
|
|
|
|
|
|||||
| LIABILITIES AND SHAREHOLDERS’ EQUITY |
||||||||
| Current liabilities: |
||||||||
| Outstanding checks in excess of deposits |
$ | 117,353 | $ | 71,287 | ||||
| Trade accounts payable |
826,790 | 724,432 | ||||||
| Accrued expenses |
208,700 | 173,914 | ||||||
| Long-term debt—current installments |
7,500 | 5,625 | ||||||
| Capital lease obligations—current installments |
3,014 | 2,034 | ||||||
| Derivative liabilities |
7,071 | 4,225 | ||||||
|
|
|
|
|
|||||
| Total current liabilities |
1,170,428 | 981,517 | ||||||
| Long-term debt |
1,418,110 | 1,445,843 | ||||||
| Deferred income tax liability, net |
103,847 | 108,386 | ||||||
| Long-term derivative liabilities |
3,008 | 1,507 | ||||||
| Capital lease obligations, excluding current installments |
30,909 | 29,506 | ||||||
| Other long-term liabilities |
79,377 | 68,631 | ||||||
|
|
|
|
|
|||||
| Total liabilities |
2,805,679 | 2,635,390 | ||||||
|
|
|
|
|
|||||
| Commitments and contingencies (Note 15) |
||||||||
| Shareholders’ equity: |
||||||||
| Common Stock |
||||||||
| Class A: $0.01 par value per share, 250,000,000 shares authorized; 179,093,943 shares issued and outstanding as of June 28, 2014 and June 29, 2013 |
1,791 | 1,791 | ||||||
| Class B: $0.01 par value per share, 25,000,000 shares authorized; 27,914 and 10,515 shares issued and outstanding as of June 28, 2014 and June 29, 2013, respectively |
— | — | ||||||
| Additional paid-in capital |
591,964 | 591,202 | ||||||
| Accumulated other comprehensive loss, net of tax benefit of $3,638 and $2,252 |
(5,691 | ) | (3,524 | ) | ||||
| Accumulated deficit |
(153,956 | ) | (169,460 | ) | ||||
|
|
|
|
|
|||||
| Total shareholders’ equity |
434,108 | 420,009 | ||||||
|
|
|
|
|
|||||
| Total liabilities and shareholders’ equity |
$ | 3,239,787 | $ | 3,055,399 | ||||
|
|
|
|
|
|||||
See accompanying notes to consolidated financial statements.
F-3
Table of Contents
PERFORMANCE FOOD GROUP COMPANY
CONSOLIDATED STATEMENTS OF OPERATIONS
| ($ in thousands, except per share data) |
Fiscal year ended June 28, 2014 |
Fiscal year ended June 29, 2013 |
Fiscal year ended June 30, 2012 |
|||||||||
| Net sales |
$ | 13,685,704 | $ | 12,826,512 | $ | 11,505,892 | ||||||
| Cost of goods sold |
11,988,485 | 11,243,809 | 10,101,919 | |||||||||
|
|
|
|
|
|
|
|||||||
| Gross profit |
1,697,219 | 1,582,703 | 1,403,973 | |||||||||
| Operating expenses |
1,581,639 | 1,468,036 | 1,293,091 | |||||||||
|
|
|
|
|
|
|
|||||||
| Operating profit |
115,580 | 114,667 | 110,882 | |||||||||
|
|
|
|
|
|
|
|||||||
| Other expense: |
||||||||||||
| Interest expense, net (includes $6,647, $11,081, and $12,545 of reclassification adjustments for changes in fair value of interest rate swaps) |
86,096 | 93,871 | 76,330 | |||||||||
| Loss on extinguishment of debt |
— | 2,039 | — | |||||||||
| Other, net |
(731 | ) | (697 | ) | 664 | |||||||
|
|
|
|
|
|
|
|||||||
| Other expense, net |
85,365 | 95,213 | 76,994 | |||||||||
|
|
|
|
|
|
|
|||||||
| Income before taxes |
30,215 | 19,454 | 33,888 | |||||||||
| Income tax expense (includes $2,592, $4,322, and $4,893 tax benefit from reclassification adjustments) |
14,711 | 11,059 | 12,869 | |||||||||
|
|
|
|
|
|
|
|||||||
| Net income |
$ | 15,504 | $ | 8,395 | $ | 21,019 | ||||||
|
|
|
|
|
|
|
|||||||
| Weighted-average common shares outstanding: |
||||||||||||
| Basic |
179,110,211 | 179,102,280 | 179,025,738 | |||||||||
| Diluted |
180,481,081 | 180,326,867 | 179,881,094 | |||||||||
| Earnings per common share: |
||||||||||||
| Basic |
$ | 0.09 | $ | 0.05 | $ | 0.12 | ||||||
| Diluted |
$ | 0.09 | $ | 0.05 | $ | 0.12 | ||||||
| Dividends declared per common share: |
— | $ | 1.2283 | $ | 0.5589 | |||||||
See accompanying notes to consolidated financial statements.
F-4
Table of Contents
PERFORMANCE FOOD GROUP COMPANY
CONSOLIDATED STATEMENTS OF COMPREHENSIVE INCOME
| ($ in thousands) |
Fiscal year ended June 28, 2014 |
Fiscal year ended June 29, 2013 |
Fiscal year ended June 30, 2012 |
|||||||||
| Net income |
$ | 15,504 | $ | 8,395 | $ | 21,019 | ||||||
| Other comprehensive income, net of tax: |
||||||||||||
| Foreign currency translation adjustments |
(6 | ) | (12 | ) | (14 | ) | ||||||
| Interest rate swaps: |
||||||||||||
| Change in fair value, net of tax benefit of $3,973, $877, and $1,795 |
(6,216 | ) | (1,371 | ) | (2,809 | ) | ||||||
| Reclassification adjustment, net of tax expense of $2,592, $4,322, and $4,893 |
4,055 | 6,759 | 7,652 | |||||||||
|
|
|
|
|
|
|
|||||||
| Other comprehensive (loss) income |
(2,167 | ) | 5,376 | 4,829 | ||||||||
|
|
|
|
|
|
|
|||||||
| Total comprehensive income |
$ | 13,337 | $ | 13,771 | $ | 25,848 | ||||||
|
|
|
|
|
|
|
|||||||
See accompanying notes to consolidated financial statements.
F-5
Table of Contents
PERFORMANCE FOOD GROUP COMPANY
CONSOLIDATED STATEMENTS OF SHAREHOLDERS’ EQUITY
| ($ in thousands) |
Common Stock | Additional Paid-in Capital |
Accumulated Other Comprehensive Income (Loss) |
Accumulated Deficit |
Total Shareholders’ Equity |
|||||||||||||||||||||||||||
| Class A | Class B | |||||||||||||||||||||||||||||||
| Shares | Amount | Shares | Amount | |||||||||||||||||||||||||||||
| Balance as of July 2, 2011 |
178,914,829 | $ | 1,789 | 8,015 | $ | — | $ | 907,875 | $ | (13,729 | ) | $ | (198,874 | ) | $ | 697,061 | ||||||||||||||||
| Issuance of common stock |
186,400 | 2 | — | — | 1,163 | — | — | 1,165 | ||||||||||||||||||||||||
| Repurchase of common stock |
(7,286 | ) | — | — | — | (45 | ) | — | — | (45 | ) | |||||||||||||||||||||
| Dividend to shareholders |
— | — | — | — | (100,000 | ) | — | — | (100,000 | ) | ||||||||||||||||||||||
| Net income |
— | — | — | — | — | — | 21,019 | 21,019 | ||||||||||||||||||||||||
| Interest rate swaps |
— | — | — | — | — | 4,843 | — | 4,843 | ||||||||||||||||||||||||
| Stock compensation expense |
— | — | — | — | 1,099 | — | — | 1,099 | ||||||||||||||||||||||||
| Other |
— | — | — | — | — | (14 | ) | — | (14 | ) | ||||||||||||||||||||||
|
|
|
|
|
|
|
|
|
|
|
|
|
|
|
|
|
|||||||||||||||||
| Balance as of June 30, 2012 |
179,093,943 | 1,791 | 8,015 | — | 810,092 | (8,900 | ) | (177,855 | ) | 625,128 | ||||||||||||||||||||||
| Issuance of common stock under 2007 Option Plan |
— | — | 2,500 | — | 12 | — | — | 12 | ||||||||||||||||||||||||
| Dividend to shareholders |
— | — | — | — | (220,000 | ) | — | — | (220,000 | ) | ||||||||||||||||||||||
| Net income |
— | — | — | — | — | — | 8,395 | 8,395 | ||||||||||||||||||||||||
| Interest rate swaps |
— | — | — | — | — | 5,388 | — | 5,388 | ||||||||||||||||||||||||
| Stock compensation expense |
— | — | — | — | 1,098 | — | — | 1,098 | ||||||||||||||||||||||||
| Other |
— | — | — | — | — | (12 | ) | — | (12 | ) | ||||||||||||||||||||||
|
|
|
|
|
|
|
|
|
|
|
|
|
|
|
|
|
|||||||||||||||||
| Balance as of June 29, 2013 |
179,093,943 | 1,791 | 10,515 | — | 591,202 | (3,524 | ) | (169,460 | ) | 420,009 | ||||||||||||||||||||||
| Issuance of common stock under 2007 Option Plan |
— | — | 17,399 | — | 60 | — | — | 60 | ||||||||||||||||||||||||
| Net income |
— | — | — | — | — | — | 15,504 | 15,504 | ||||||||||||||||||||||||
| Interest rate swaps |
— | — | — | — | — | (2,161 | ) | — | (2,161 | ) | ||||||||||||||||||||||
| Stock compensation expense |
— | — | — | — | 702 | — | — | 702 | ||||||||||||||||||||||||
| Other |
— | — | — | — | — | (6 | ) | — | (6 | ) | ||||||||||||||||||||||
|
|
|
|
|
|
|
|
|
|
|
|
|
|
|
|
|
|||||||||||||||||
| Balance as of June 28, 2014 |
179,093,943 | $ | 1,791 | 27,914 | $ | — | $ | 591,964 | $ | (5,691 | ) | $ | (153,956 | ) | $ | 434,108 | ||||||||||||||||
|
|
|
|
|
|
|
|
|
|
|
|
|
|
|
|
|
|||||||||||||||||
See accompanying notes to consolidated financial statements.
F-6
Table of Contents
PERFORMANCE FOOD GROUP COMPANY
CONSOLIDATED STATEMENTS OF CASH FLOWS
| ($ in thousands) |
Fiscal year ended June 28, 2014 |
Fiscal year ended June 29, 2013 |
Fiscal year ended June 30, 2012 |
|||||||||
| Cash flows from operating activities: |
||||||||||||
| Net income |
$ | 15,504 | $ | 8,395 | $ | 21,019 | ||||||
| Adjustments to reconcile net income to net cash provided by operating activities |
||||||||||||
| Depreciation |
73,549 | 58,764 | 46,400 | |||||||||
| Amortization of intangible assets |
59,151 | 61,301 | 55,902 | |||||||||
| Amortization of deferred financing costs and other |
10,244 | 8,883 | 7,317 | |||||||||
| Provision for losses on accounts receivables |
9,087 | 6,119 | 6,044 | |||||||||
| Expense related to modification of debt |
281 | 1,425 | 2,804 | |||||||||
| Stock compensation expense |
702 | 1,098 | 1,099 | |||||||||
| Deferred income tax benefit |
(1,425 | ) | (5,974 | ) | (3,423 | ) | ||||||
| Change in fair value of derivative assets and liabilities |
(127 | ) | (580 | ) | 825 | |||||||
| Loss on extinguishment of debt |
— | 2,039 | — | |||||||||
| Loss on assets held for sale |
590 | 427 | 1,350 | |||||||||
| Other |
220 | (124 | ) | 341 | ||||||||
| Changes in operating assets and liabilities, net |
||||||||||||
| Accounts receivable |
(134,435 | ) | (18,297 | ) | (28,294 | ) | ||||||
| Inventories |
(107,318 | ) | (21,442 | ) | (48,053 | ) | ||||||
| Prepaid expenses and other assets |
(6,934 | ) | 1,020 | (3,866 | ) | |||||||
| Trade accounts payable |
102,358 | 133,154 | (1,169 | ) | ||||||||
| Outstanding checks in excess of deposits |
46,066 | (80,800 | ) | 33,586 | ||||||||
| Accrued expenses and other liabilities |
52,237 | (14,733 | ) | 5,732 | ||||||||
|
|
|
|
|
|
|
|||||||
| Net cash provided by operating activities |
119,750 | 140,675 | 97,614 | |||||||||
|
|
|
|
|
|
|
|||||||
| Cash flows from investing activities: |
||||||||||||
| Purchases of property, plant and equipment |
(90,625 | ) | (66,483 | ) | (68,926 | ) | ||||||
| Cash paid for acquisitions, net of cash acquired |
(949 | ) | (85,974 | ) | (319,802 | ) | ||||||
| Increase in restricted cash |
(5,100 | ) | — | — | ||||||||
| Proceeds from sale of property, plant and equipment |
2,666 | 1,499 | 530 | |||||||||
| Proceeds from sale of assets held for sale |
585 | 998 | ||||||||||
|
|
|
|
|
|
|
|||||||
| Net cash used in investing activities |
(93,423 | ) | (149,960 | ) | (388,198 | ) | ||||||
|
|
|
|
|
|
|
|||||||
| Cash flows from financing activities: |
||||||||||||
| Net (payments) borrowings under ABL Facility |
(21,175 | ) | (30,500 | ) | 258,600 | |||||||
| Borrowings on Senior Notes |
— | 50,000 | 150,000 | |||||||||
| Payments on Senior Notes |
— | (500,000 | ) | — | ||||||||
| Borrowings on Term Facility |
— | 746,250 | — | |||||||||
| Payments on Term Facility |
(5,625 | ) | — | — | ||||||||
| Payment on financed property, plant and equipment |
(1,833 | ) | — | — | ||||||||
| Cash paid for debt issuance, extinguishment and modifications |
(1,527 | ) | (27,160 | ) | (18,414 | ) | ||||||
| Cash paid for acquisitions |
(2,769 | ) | (5,124 | ) | (4,057 | ) | ||||||
| Payments under capital lease |
(2,225 | ) | (1,193 | ) | (512 | ) | ||||||
| Proceeds from issuance of common stock |
— | — | 1,165 | |||||||||
| Repurchase of common stock |
— | — | (45 | ) | ||||||||
| Proceeds from exercise of stock options |
60 | 12 | — | |||||||||
| Dividend to shareholders |
— | (220,000 | ) | (100,000 | ) | |||||||
|
|
|
|
|
|
|
|||||||
| Net cash (used in) provided by financing activities |
(35,094 | ) | 12,285 | 286,737 | ||||||||
|
|
|
|
|
|
|
|||||||
| Net (decrease) increase in cash |
(8,767 | ) | 3,000 | (3,847 | ) | |||||||
| Cash, beginning of period |
14,077 | 11,077 | 14,924 | |||||||||
|
|
|
|
|
|
|
|||||||
| Cash, end of period |
$ | 5,310 | $ | 14,077 | $ | 11,077 | ||||||
|
|
|
|
|
|
|
|||||||
See accompanying notes to consolidated financial statements.
F-7
Table of Contents
Supplemental disclosures of non-cash transactions are as follows:
| (In thousands) |
Fiscal year ended June 28, 2014 |
Fiscal year ended June 29, 2013 |
Fiscal year ended June 30, 2012 |
|||||||||
| Initial fair value of promissory note related to acquisition |
$ | — | $ | 4,162 | $ | — | ||||||
| Debt assumed through new and amended capital lease obligations |
4,608 | 5,723 | — | |||||||||
| Purchases of property, plant and equipment, financed |
3,472 | — | — | |||||||||
Supplemental disclosures of cash flow information are as follows:
| (In thousands) |
Fiscal year ended June 28, 2014 |
Fiscal year ended June 29, 2013 |
Fiscal year ended June 30, 2012 |
|||||||||
| Cash paid during the year for: |
||||||||||||
| Interest |
$ | 63,264 | $ | 93,868 | $ | 58,501 | ||||||
| Income taxes, net of refunds |
15,857 | 17,589 | 20,493 | |||||||||
F-8
Table of Contents
PERFORMANCE FOOD GROUP COMPANY
NOTES TO CONSOLIDATED FINANCIAL STATEMENTS
1. Description of Business
Performance Food Group Company, through its subsidiaries (collectively, the “Company”), markets and distributes approximately 150,000 national and company-branded food and food-related products from 67 distribution centers to over 150,000 customer locations across the United States. The Company serves both of the major customer types in the restaurant industry: (i) independent, or “Street” customers, and (ii) multi-unit, or “Chain” customers, which include regional and national family and casual dining restaurants chains and quick-service restaurants. The Company also serves schools, healthcare facilities, business and industry locations, and other institutional customers. The Company is managed through three operating segments: Performance Foodservice, PFG Customized, and Vistar.
| • | Performance Foodservice is a national broadline foodservice distributor of approximately 125,000 national and company-branded food and food-related products to approximately 85,000 customer locations including Street restaurants, Chain restaurants, and other institutional “food-away-from-home” locations. |
| • | PFG Customized is a national distributor, principally to the family and casual dining channel, and serves approximately 5,000 restaurant locations. Substantially all of its customers are national or large regional chains or are affiliated with them. |
| • | Vistar is a leading national distributor of approximately 20,000 candy, snack, beverage, and other products to approximately 60,000 customer locations in the vending, office coffee service, theatre, retail, and other channels. |
The Company is owned by affiliates of The Blackstone Group and other co-investors, including an affiliate of Wellspring Capital Management. The accompanying consolidated financial statements include Performance Food Group Company and its direct and indirect subsidiaries.
The Company’s fiscal year ends on the Saturday nearest to June 30th. This resulted in a 52-week year for fiscal 2014, fiscal 2013, and fiscal 2012. References to “fiscal 2014” are to the 52-week period ending June 28, 2014, references to “fiscal 2013” are to the 52-week period ended June 29, 2013, and references to “fiscal 2012” are to the 52-week period ended June 30, 2012.
2. Summary of Significant Accounting Policies and Estimates
Principles of Consolidation
The consolidated financial statements include the accounts of the Company and its subsidiaries. All inter-company balances and transactions have been eliminated.
Use of Estimates
The preparation of the consolidated financial statements in conformity with accounting principles generally accepted in the United States of America requires management to make estimates and assumptions that affect the reported amounts of assets and liabilities and the disclosure of contingent assets and liabilities at the date of the financial statements and the reported amounts of revenue and expenses during the reporting period. The most significant estimates used by management are related to the accounting for the allowance for doubtful accounts, reserve for inventories, impairment testing of goodwill and other intangible assets, acquisition accounting, reserves for claims and recoveries under insurance programs, vendor rebates and other promotional incentives, bonus accruals, depreciation, amortization, determination of useful lives of tangible and intangible assets, and income taxes. Actual results could differ from these estimates.
F-9
Table of Contents
Cash
The Company maintains its cash primarily in institutions insured by the Federal Deposit Insurance Corporation (“FDIC”). At times, the Company’s cash balance may be in amounts that exceed the FDIC insurance limits.
Restricted Cash
The Company is required by its insurers to collateralize a part of the deductibles for its workers’ compensation and liability claims. The Company has chosen to satisfy these collateral requirements by depositing funds in insurance trusts or by issuing letters of credit. All amounts in restricted cash at June 28, 2014 and June 29, 2013 represent funds deposited in insurance trusts and $5.1 million represent Level 1 fair value measurements.
Accounts Receivable
Accounts receivable are primarily comprised of trade receivables from customers in the ordinary course of business, are recorded at the invoiced amount, and primarily do not bear interest. Receivables are recorded net of the allowance for doubtful accounts on the accompanying consolidated balance sheets. The Company evaluates the collectability of its accounts receivable based on a combination of factors. The Company regularly analyzes its significant customer accounts, and when it becomes aware of a specific customer’s inability to meet its financial obligations to the Company, such as bankruptcy filings or deterioration in the customer’s operating results or financial position, the Company records a specific reserve for bad debt to reduce the related receivable to the amount it reasonably believes is collectible. The Company also records reserves for bad debt for other customers based on a variety of factors, including the length of time the receivables are past due, macroeconomic considerations, and historical experience. If circumstances related to specific customers change, the Company’s estimates of the recoverability of receivables could be further adjusted. As of June 28, 2014 and June 29, 2013, the allowance for doubtful accounts related to trade receivables was approximately $10.3 million and $10.2 million, respectively, and $4.4 million and $4.1 million, respectively related to other receivables. The Company recorded $9.1 million, $6.1 million, and $6.0 million in provision for doubtful accounts in fiscal year ended June 28, 2014, June 29, 2013, and June 30, 2012, respectively.
Inventories
The Company’s inventories consist primarily of food and non-food products. The Company values inventories primarily at the lower of cost or market using the first-in, first-out (“FIFO”) method. At June 28, 2014, the Company’s inventory balance of $849.0 million consists primarily of finished goods, $789.7 million of which was valued at FIFO. As of June 28, 2014, $59.3 million of the inventory balance was valued at last-in, first-out (“LIFO”) using the link chain technique of the dollar value method. At June 28, 2014 and June 29, 2013, the LIFO balance sheet reserves were $3.8 million and $0.7 million, respectively. Costs in inventory include the purchase price of the product and freight charges to deliver the product to the Company’s warehouses and are net of certain consideration received from vendors in the amount of $14.2 million and $12.1 million as of June 28, 2014 and June 29, 2013, respectively. The Company adjusts its inventory balances for slow-moving, excess, and obsolete inventories. These adjustments are based upon inventory category, inventory age, specifically identified items, and overall economic conditions. As of June 28, 2014 and June 29, 2013, the Company had adjusted its inventories by approximately $6.6 million and $7.3 million, respectively.
Property, Plant, and Equipment
Property, plant, and equipment are stated at cost. Depreciation of property, plant and equipment, including capital lease assets, is calculated primarily using the straight-line method over the estimated useful lives of the assets, which range from two to 39 years, and is included in operating expenses on the consolidated statement of operations.
F-10
Table of Contents
Certain internal and external costs related to the development of internal use software are capitalized within property, plant, and equipment during the application development stage.
When assets are retired or otherwise disposed, the costs and related accumulated depreciation are removed from the accounts. The difference between the net book value of the asset and proceeds from disposition is recognized as a gain or loss. Routine maintenance and repairs are charged to expense as incurred, while costs of betterments and renewals are capitalized.
Assets Held for Sale
The Company classifies assets as held for sale and ceases depreciating the assets when there is a plan for disposal of assets and those assets meet the held for sale criteria as defined in FASB Accounting Standards Codification (“ASC”) 360-10-35, Property, Plant and Equipment—Subsequent Measurement—Impairment or Disposal of Long-Lived Assets. As of June 28, 2014 and June 29, 2013, the Company had approximately $0.9 million and $1.2 million, respectively, of assets classified as held for sale. The June 28, 2014 amount relates to a vacant facility at one of the Company’s Performance Foodservice locations that is currently being marketed for sale. The June 29, 2013 amount was related to one of the Company’s Performance Foodservice facilities. The Company sold that property in December 2013 for approximately $0.6 million in net proceeds.
Impairment of Long-Lived Assets
Long-lived assets held and used by the Company, including intangible assets with definite lives, are tested for recoverability whenever events or changes in circumstances indicate that the carrying amount of an asset may not be recoverable. For purposes of evaluating the recoverability of long-lived assets, the Company compares the carrying value of the asset or asset group to the projected, undiscounted future cash flows expected to be generated by the long-lived asset or asset group. Based on the Company’s assessments, no impairment losses were recorded in fiscal 2014 or fiscal 2013.
Acquisitions, Goodwill, and Other Intangible Assets
The Company accounts for acquired businesses using the acquisition method of accounting. The Company’s financial statements reflect the operations of an acquired business starting from the completion of the acquisition. Goodwill and other intangible assets represent the excess of cost of an acquired entity over the amounts specifically assigned to those tangible net assets acquired in a business combination. Other identifiable intangible assets typically include customer relationships, trade names, technology, non-compete agreements, and favorable lease assets. Goodwill and intangibles with indefinite lives are not amortized. Intangibles with definite lives are amortized on a straight-line basis over their useful lives, which generally range from two to eleven years. Certain assumptions, estimates, and judgments are used in determining the fair value of net assets acquired, including goodwill and other intangible assets, as well as determining the allocation of goodwill to the reporting units. Accordingly, the Company may obtain the assistance of third-party valuation specialists for the valuation of significant tangible and intangible assets. The fair value estimates are based on available historical information and on future expectations and assumptions deemed reasonable by management but are inherently uncertain. Significant estimates and assumptions inherent in the valuations reflect a consideration of other marketplace participants and include the amount and timing of future cash flows (including expected growth rates and profitability), economic barriers to entry, a brand’s relative market position, and the discount rate applied to the cash flows. Unanticipated market or macroeconomic events and circumstances may occur, which could affect the accuracy or validity of the estimates and assumptions.
The Company is required to test goodwill and other intangible assets with indefinite lives for impairment annually, or more often if circumstances indicate. Indicators of goodwill impairment include, but are not limited to, significant declines in the markets and industries that buy the Company’s products, changes in the estimated future cash flows of its reporting units, changes in capital markets, and changes in its market capitalization. For goodwill and indefinite-lived intangible assets, the Company’s policy is to assess for impairment at the end of each fiscal year.
F-11
Table of Contents
In fiscal 2013, the Company adopted FASB Accounting Standards Update (ASU) 2011-08 “Intangibles—Goodwill and Other—Testing Goodwill for Impairment,” which provides entities with an option to perform a qualitative assessment (commonly referred to as “step zero”) to determine whether further quantitative analysis for impairment of goodwill is necessary. In performing step zero for the Company’s goodwill impairment test, the Company is required to make assumptions and judgments including but not limited to the following: the evaluation of macroeconomic conditions as related to the Company’s business, industry and market trends, and the overall future financial performance of its reporting units and future opportunities in the markets in which they operate. If impairment indicators are present after performing step zero, the Company would perform a quantitative impairment analysis to estimate the fair value of goodwill.
During fiscal 2013, the Company had elected not to implement the step zero assessment for all reporting units and performed the first step of the two-step goodwill impairment test. During fiscal 2014, the Company performed the step zero analysis for its goodwill impairment test. As a result of the Company’s step zero analysis, no further quantitative impairment test was deemed necessary for fiscal 2014. There were no impairments of goodwill or intangible assets with indefinite lives for fiscal 2014, fiscal 2013, or fiscal 2012.
Insurance Program
The Company maintains high-deductible insurance programs covering portions of general and vehicle liability and workers’ compensation. The amounts in excess of the deductibles are fully insured by third-party insurance carriers, subject to certain limitations and exclusions. The Company also maintains self-funded group medical insurance. The Company accrues its estimated liability for these deductibles, including an estimate for incurred but not reported claims, based on known claims and past claims history. The estimated short-term portion of these accruals is included in Accrued expenses on the Company’s consolidated balance sheets, while the estimated long-term portion of the accruals is included in Other long-term liabilities. The provisions for insurance claims include estimates of the frequency and timing of claims occurrence, as well as the ultimate amounts to be paid. These insurance programs are managed by a third party, and the deductibles for general and vehicle liability and workers compensation are collateralized by letters of credit and restricted cash.
Other Comprehensive Income (Loss)
Other comprehensive income (loss) is defined as all changes in equity during each period except for those resulting from net income (loss) and investments by or distributions to shareholders. Other comprehensive income (loss) consists primarily of gains or losses from derivative financial instruments that are designated in a hedging relationship. For derivative instruments that qualify as cash flow hedges, the effective portion of the gain or loss on the derivative instrument is reported as a component of other comprehensive income and reclassified into earnings during the same period or periods during which the hedged transaction affects earnings.
Revenue Recognition
The Company recognizes sales when persuasive evidence of an arrangement exists, the price is fixed and determinable, the product has been delivered to the customer, and there is reasonable assurance of collection of the sales proceeds. Sales returns are recorded as reductions of sales.
The Company recognizes revenue in accordance with FASB ASC 605-45-45, Revenue Recognition—Principal Agent Considerations. FASB ASC 605-45-45 requires a company to evaluate whether it is the principal or is acting as an agent or broker. Factors that the Company evaluates include whether the Company acts as a primary obligor in the transaction; takes title to the product; bears the risks and rewards of inventory ownership, including proprietary customer inventory; incurs the risk of loss for collection, delivery, and returns; and whether compensation is on a commission or fee basis. While none of the indicators are considered presumptive or determinative, the relative strength of each indicator is considered in the Company’s evaluation. Based upon an evaluation of its food of food-related sales contracts and the above factors under FASB ASC 605-45-45, the Company has concluded that it is the primary obligor in its customer relationships and, thus, recognizes its revenue on a gross basis.
F-12
Table of Contents
Cost of Goods Sold
Cost of goods sold includes amounts paid to manufacturers for products sold, the cost of transportation necessary to bring the products to the Company’s facilities, plus depreciation related to processing facilities and equipment.
Operating Expenses
Operating expenses include warehouse, delivery, occupancy, insurance, depreciation, amortization, salaries and wages, and employee benefits expenses.
Vendor Rebates and Other Promotional Incentives
The Company participates in various rebate and promotional incentives with its suppliers, primarily including volume and growth rebates, annual and multi-year incentives, and promotional programs. Consideration received under these incentives is generally recorded as a reduction of cost of goods sold. However, as described below, in certain limited circumstances the consideration is recorded as a reduction of operating expenses incurred by the Company. Consideration received may be in the form of cash and/or invoice deductions. Changes in the estimated amount of incentives to be received are treated as changes in estimates and are recognized in the period of change.
Consideration received for incentives that contain volume and growth rebates and annual and multi-year incentives are recorded as a reduction of cost of goods sold. The Company systematically and rationally allocates the consideration for these incentives to each of the underlying transactions that results in progress by the Company toward earning the incentives. If the incentives are not probable and reasonably estimable, the Company records the incentives as the underlying objectives or milestones are achieved. The Company records annual and multi-year incentives when earned, generally over the agreement period. The Company uses current and historical purchasing data, forecasted purchasing volumes, and other factors in estimating whether the underlying objectives or milestones will be achieved. Consideration received to promote and sell the supplier’s products is typically a reimbursement of marketing costs incurred by the Company and is recorded as a reduction of the Company’s operating expenses. If the amount of consideration received from the suppliers exceeds the Company’s marketing costs, any excess is recorded as a reduction of cost of goods sold. The Company follows the requirements of FASB ASC 605-50-25-10, Revenue Recognition—Customer Payments and Incentives—Recognition—Customer’s Accounting for Certain Consideration Received from a Vendor and ASC 605-50-45-16, Revenue Recognition—Customer Payments and Incentives—Other Presentation Matters—Reseller’s Characterization of Sales Incentives Offered to Customers by Manufacturers.
Shipping and Handling Fees and Costs
Shipping and handling fees billed to customers are included in net sales. Estimated shipping and handling costs incurred by the Company of $682.4 million, $638.2 million, and $553.7 million are recorded in operating expenses in the consolidated statement of operations for fiscal 2014, fiscal 2013, and fiscal 2012, respectively.
Share Based Compensation
The Company participates in the 2007 Performance Food Group Company Management Option Plan (the “2007 Option Plan”) and follows the fair value recognition provisions of FASB ASC 718-10-25, Compensation—Stock Compensation—Overall—Recognition. This guidance requires that all stock-based compensation be recognized as an expense in the financial statements. Compensation expense is calculated and recorded at the Company based on the fair value of the awards of Performance Food Group Company that are granted and is recorded for awards for which the requisite service period is expected to be provided. The fair value of the stock options is estimated at the date of grant using the Black-Scholes option pricing model. Compensation cost is recognized ratably over the requisite service period.
F-13
Table of Contents
Income Taxes
The Company follows FASB ASC 740-10, Income Taxes—Overall, which requires the use of the asset and liability method of accounting for deferred income taxes. Deferred tax assets and liabilities are recognized for the expected future tax consequences of temporary differences between the tax bases of assets and liabilities and their reported amounts. Future tax benefits, including net operating loss carry-forwards, are recognized to the extent that realization of such benefits is more likely than not. Uncertain tax positions are reviewed on an ongoing basis and are adjusted in light of changing facts and circumstances, including progress of tax audits, developments in case law, and closings of statute of limitations. Such adjustments are reflected in the tax provision as appropriate.
Derivative Instruments and Hedging Activities
As required by FASB ASC 815-20, Derivatives and Hedging—Hedging—General, the Company records all derivatives on the balance sheet at fair value. The accounting for changes in the fair value of derivatives depends on the intended use of the derivative, whether the Company has elected to designate a derivative in a hedging relationship and apply hedge accounting, and whether the hedging relationship has satisfied the criteria necessary to apply hedge accounting. The Company primarily uses derivative contracts to hedge the exposure to variability in expected future cash flows. A portion of these derivatives are designated and qualify as cash flow hedges. Hedge accounting generally provides for the matching of the timing of gain or loss recognition on the hedging instrument with the recognition of the earnings effect of the hedged forecasted transactions in a cash flow hedge. The Company may enter into derivative contracts that are intended to economically hedge certain of its risks, even though hedge accounting does not apply or the Company elects not to apply hedge accounting under FASB ASC 815-20. In the event that the Company does not apply the provisions of hedge accounting, the derivative instruments are recorded as an asset or liability on the consolidated balance sheets at fair value, and any changes in fair value are recorded as unrealized gains or losses and included in Other expense in the accompanying consolidated statement of operations. See Note 9 for additional information on the Company’s use of derivative instruments.
The Company discloses derivative instruments and hedging activities in accordance with FASB ASC 815-10-50, Derivatives and Hedging—Overall—Disclosure. FASB ASC 815-10-50 sets forth the disclosure requirements with the intent to provide users of financial statements with an enhanced understanding of: (a) how and why an entity uses derivative instruments, (b) how derivative instruments and related hedged items are accounted for under FASB ASC 815-20, and (c) how derivative instruments and related hedged items affect an entity’s financial position, financial performance, and cash flows. FASB ASC 815-10-50 requires qualitative disclosures about objectives and strategies for using derivatives, quantitative disclosures about the fair value of and gains and losses on derivative instruments, and disclosures about credit-risk-related contingent features in derivative instruments.
Fair Value Measurements
Fair value is defined as an exit price, representing the price that would be received to sell an asset or paid to transfer a liability in an orderly transaction between market participants at the measurement date. The accounting guidance establishes a fair value hierarchy that prioritizes the inputs to valuation techniques used to measure fair value. The three levels of the fair value hierarchy are as follows:
| • | Level 1—Observable inputs such as quoted prices for identical assets or liabilities in active markets; |
| • | Level 2—Inputs, other than the quoted prices in active markets, that are observable either directly or indirectly for substantially the full term of the asset or liability; and |
| • | Level 3—Unobservable inputs in which there are little or no market data, which include management’s own assumption about the risk assumptions market participants would use in pricing an asset or liability. |
The Company’s derivative instruments are carried at fair value and are evaluated in accordance with this hierarchy.
F-14
Table of Contents
Contingent Liabilities
The Company records a liability related to contingencies when a loss is considered to be probable and a reasonable estimate of the loss can be made. This estimate would include legal fees, if applicable.
Recently Issued Accounting Pronouncements
In July 2012, the FASB issued Accounting Standards Update (ASU) 2012—02, Testing Indefinite-Lived Intangible Assets for Impairment. This Update was issued to reduce the cost and complexity of performing an impairment test for indefinite-lived intangible assets. Specifically, the update permits an entity to first assess qualitative factors in order to determine whether it is more likely than not that an indefinite-lived intangible asset is impaired as a basis for determining whether it is necessary to perform the quantitative impairment test in accordance with ASC 350-30. The more likely than not threshold is defined as having a likelihood of more than 50 percent. If, after assessing the events and circumstances, it is concluded that it is not more likely than not that the indefinite-lived intangible asset is impaired, then an entity is not required to take further action. This Update was effective for the annual and interim impairment tests performed for fiscal years beginning on or after September 15, 2012. The Company elected not to implement the qualitative assessment and has performed the impairment test on its indefinite-lived intangible assets.
In January 2013, the FASB issued Accounting Standards Update (ASU) 2013-01, Clarifying the Scope of Disclosures about Offsetting Assets and Liabilities. The amendments in this Update clarify that the scope of Update 2011-11 applies to derivatives accounted for in accordance with FASB 815, Derivatives and Hedging, that either offset or are subject to an enforceable master netting arrangement. The amendments in this Update were effective for fiscal years beginning on or after January 1, 2013. The Company included the additional disclosures required in Note 9, “Derivative and Hedging Activities.”
In February 2013, the FASB issued Accounting Standards Update (ASU) 2013-04, Liabilities—Obligations Resulting from Joint and Several Liability Arrangements for Which the Total Amount of the Obligation Is Fixed at the Reporting Date. This Update was issued to provide guidance for the recognition, measurement, and disclosure of obligations resulting from joint and several liability arrangements for which the total amount of the obligation is fixed at the reporting date. Examples include debt arrangements, other contractual obligations, and settled litigation and judicial rulings. This Update is effective for public entities for fiscal years, and interim periods within those years, beginning after December 15, 2013. The Company has not fully evaluated the impact on its financial statement disclosures but does not believe it will be material.
In July 2013, the FASB issued Accounting Standards Update (ASU) 2013-011, Presentation of an Unrecognized Tax Benefit When a Net Operating Loss Carryforward, a Similar Tax Loss, or a Tax Credit Carryforward Exists. This Update was issued to provide guidance on the financial statement presentation of an unrecognized tax benefit when a net operating loss carryforward, a similar tax loss, or a tax credit carryforward exists. This Update is effective for public entities for fiscal years, and interim periods within those years, beginning after December 15, 2013. The Company has evaluated the impact on its financial statement disclosures and it will not have a material impact on its financial statements.
In April 2014, the FASB issued Accounting Standards Update (ASU) 2014-08, Presentation of Financial Statements and Property, Plant and Equipment. This Update amends the requirements for reporting discontinued operations and requires additional disclosures about discontinued operations. Under this approach, only disposals representing a strategic shift in operations that has or will have a major effect on the Company’s operations and financial results should be presented as discontinued operations. This Update is effective for public entities for fiscal years, and interim periods within those years, beginning after December 15, 2014. The Company has not fully evaluated the impact on its financial statement disclosures but does not believe it will be material.
In May 2014, the FASB issued Accounting Standards Update (ASU) 2014-09, Revenue from Contracts with Customers. This Update is a comprehensive new revenue recognition model that requires a company to recognize
F-15
Table of Contents
revenue to depict the transfer of promised goods or services to a customer in an amount that reflects the consideration it expects to receive in exchange for those goods or services. Companies may use either a full retrospective or modified retrospective approach for adoption of this Update. This Update is effective for public entities for annual reporting periods beginning after December 15, 2016, including interim periods within that reporting period. The Company has not yet evaluated which transition approach to use or the impact this Update will have on its future financial statements.
In June 2014, the FASB issued Accounting Standards Update (ASU) 2014-12, Accounting for Share-Based Payments When the Terms of an Award Provide That a Performance Target Could Be Achieved after the Requisite Service Period. This Update requires that a performance target that affects vesting and could be achieved after the requisite service period be treated as a performance condition under the existing guidance in Topic 718. Companies may use either a prospective or retrospective approach for adoption of this Update. This Update is not effective until annual periods and interim periods within those annual periods beginning after December 15, 2015. Early adoption is permitted. The Company has not yet evaluated which approach to use or the impact this Update will have on its future financial statements.
3. Business Combinations
During the third quarter of fiscal 2014, the Company paid cash of $0.9 million for an acquisition. This acquisition was immaterial to the consolidated financial statements.
The Company completed the following acquisition in its Performance Foodservice segment during the second quarter of fiscal 2013 that was accounted for as a business combination in accordance with ASC 805:
Fox River Foods, Inc.
On December 21, 2012, the Company completed the purchase of Fox River Foods, Inc., along with three real estate entities, (collectively, “FRF”) for $99.2 million, which consisted of cash in the amount of $95.0 million and a $6.0 million promissory note with a fair value of $4.2 million. FRF is a broadline foodservice distributor based in Montgomery, Illinois. FRF serves more than 7,000 customers in seven states throughout the Upper Midwest. Customers range from fine dining establishments to family restaurants, schools, healthcare facilities, child care centers, hotels, and concessionaires. The Company performed a valuation of the net assets acquired to determine the purchase price allocation. This valuation resulted in the recognition of $19.4 million in identifiable intangible assets, including customer relationships and trade names. The Company also acquired property, plant, and equipment of $27.1 million, cash of $10.5 million, as well as working capital and other items in the amount of $36.5 million. The purchase price exceeded the fair value of the net assets acquired, resulting in Goodwill of $5.7 million. FRF values inventories at the lower of cost or market using the LIFO method, and the Company retained this method with respect to the valuation of FRF’s inventories. During fiscal 2014, goodwill related to FRF was reduced by $2.2 million as a result of a change in deferred tax liability.
Costs of approximately $1.0 million associated with this acquisition were recorded in Operating expenses during fiscal 2013. Goodwill recognized in connection with the acquisition is expected to be deductible for income tax purposes.
The Company completed three acquisitions during fiscal 2012 that were accounted for as business combinations in accordance with ASC 805 and are discussed by operating segment as follows:
Vistar
On September 23, 2011, the Company completed the purchase of certain assets of Vend Service, Inc. (“VSI”), a regional candy, snack, and beverage distributor, and an affiliated entity. VSI, located in Rome, Georgia, served vending operators in the Alabama, Arkansas, Florida, Georgia, Mississippi, Missouri, North Carolina, South Carolina, and Tennessee markets. On June 22, 2012, the Company completed the purchase of
F-16
Table of Contents
Liberty Distribution Company, LLC (“Liberty”), a national candy and snack distributor based in Chandler, Arizona, with additional locations in Mechanicsburg, Pennsylvania and Memphis, Tennessee, which serve national and regional non-food retailers. The aggregate purchase price for these two Vistar acquisitions was $97.6 million in cash and has resulted in preliminary goodwill of 20.8 million. The Company performed valuations of the net assets acquired to determine the purchase price allocations. These valuations resulted in the recognition of $48.9 million of identifiable intangible assets for both acquisitions, including customer relationships, trade names, technology, and non-compete agreements. The Company also acquired property, plant, and equipment of $1.1 million, as well as working capital and other items in the amount of $26.8 million related to the two acquisitions. These valuations and resulting goodwill are provisional amounts as of June 30, 2012 and represent management’s best estimates using all known facts and circumstances that existed as of the acquisition dates. During fiscal 2013, goodwill related to Liberty was reduced by $2.0 million due to a net working capital adjustment (see Note 4).
Performance Foodservice
On June 23, 2012, the Company completed the purchase of Institution Food House, Inc. (“IFH”) from Alex Lee, Inc. for $233.4 million in cash. IFH is a broadline foodservice distributor based in Hickory, North Carolina, with an additional location in Florence, South Carolina. IFH serves over 6,000 customers ranging from fine dining establishments to casual restaurants, hotels, schools, and healthcare providers. The Company performed a valuation of the net assets acquired to determine the purchase price allocation. This valuation resulted in the recognition of $52.3 million in identifiable intangible assets, including customer relationships and trade names. The Company also acquired property, plant and equipment of $54.4 million, as well as working capital and other items in the amount of $48.7 million. Preliminary goodwill resulting from the purchase price exceeding the fair value of the net assets acquired totaled $78.0 million. These valuations are provisional amounts as of June 30, 2012 and represent management’s best estimates using all known facts and circumstances that existed as of the acquisition dates. IFH values inventories at the lower of cost or market using the LIFO method and the Company plans to retain this method with respect to the valuation of IFH’s inventories going forward. During fiscal 2013, goodwill was reduced by $2.7 million primarily due to working capital adjustments (see Note 4).
4. Goodwill and Other Intangible Assets
The Company recorded additions to goodwill in connection with its acquisitions. The following table presents the changes in the carrying amount of goodwill:
| (In thousands) |
Performance Foodservice |
PFG Customized |
Vistar | Other | Total | |||||||||||||||
| Balance as of June 30, 2012 |
$ | 404,329 | $ | 166,473 | $ | 54,595 | $ | 39,203 | $ | 664,600 | ||||||||||
| Acquisitions—current year |
5,718 | — | 115 | — | 5,833 | |||||||||||||||
| Adjustments related to prior acquisitions |
(2,691 | ) | (1,961 | ) | — | (4,652 | ) | |||||||||||||
|
|
|
|
|
|
|
|
|
|
|
|||||||||||
| Balance as of June 29, 2013 |
407,356 | 166,473 | 52,749 | 39,203 | 665,781 | |||||||||||||||
| Acquisitions—current year |
— | — | 321 | — | 321 | |||||||||||||||
| Adjustments related to prior acquisitions |
(2,234 | ) | — | — | — | (2,234 | ) | |||||||||||||
|
|
|
|
|
|
|
|
|
|
|
|||||||||||
| Balance as of June 28, 2014 |
$ | 405,122 | $ | 166,473 | $ | 53,070 | $ | 39,203 | $ | 663,868 | ||||||||||
|
|
|
|
|
|
|
|
|
|
|
|||||||||||
The Company has recorded adjustments to goodwill within the permitted measurement period in accordance with ASC 805. The adjustment related to prior acquisitions for fiscal 2014 results from a change in deferred tax liability for the FRF acquisition. The adjustments related to prior acquisitions for fiscal 2013 are partially due to a net working capital adjustment recorded with respect to Vistar’s fourth quarter fiscal 2012 acquisition in the amount of $2.0 million. The remainder is primarily a working capital adjustment recorded in relation to Performance Foodservice’s fourth quarter fiscal 2012 acquisition.
F-17
Table of Contents
The following table presents the Company’s intangible assets by major category as of June 28, 2014 and June 29, 2013:
| As of June 28, 2014 | As of June 29, 2013 | |||||||||||||||||||||||||||
| (In thousands) |
Gross Carrying Amount |
Accumulated Amortization |
Net | Gross Carrying Amount |
Accumulated Amortization |
Net | Range of Lives |
|||||||||||||||||||||
| Intangible assets with definite lives: |
||||||||||||||||||||||||||||
| Customer relationships |
$ | 379,783 | $ | (265,893 | ) | $ | 113,890 | $ | 379,483 | $ | (224,197 | ) | $ | 155,286 | 4 –11 years | |||||||||||||
| Trade names and trademarks |
90,934 | (56,451 | ) | 34,483 | 90,934 | (44,513 | ) | 46,421 | 4 – 9 years | |||||||||||||||||||
| Deferred financing costs |
79,625 | (42,783 | ) | 36,842 | 78,378 | (33,986 | ) | 44,392 | Debt term | |||||||||||||||||||
| Non-compete |
11,925 | (7,317 | ) | 4,608 | 11,920 | (5,531 | ) | 6,389 | 2 – 5 years | |||||||||||||||||||
| Leases |
12,516 | (3,976 | ) | 8,540 | 12,516 | (3,305 | ) | 9,211 | Lease term | |||||||||||||||||||
| Technology |
26,100 | (22,642 | ) | 3,458 | 26,100 | (18,910 | ) | 7,190 | 5 – 7 years | |||||||||||||||||||
|
|
|
|
|
|
|
|
|
|
|
|
|
|
|
|||||||||||||||
| Total intangible assets with definite lives |
$ | 600,883 | $ | (399,062 | ) | $ | 201,821 | $ | 599,331 | $ | (330,442 | ) | $ | 268,889 | ||||||||||||||
|
|
|
|
|
|
|
|
|
|
|
|
|
|||||||||||||||||
| Intangible assets with indefinite lives: |
||||||||||||||||||||||||||||
| Goodwill |
$ | 663,868 | $ | — | $ | 663,868 | $ | 665,781 | $ | — | $ | 665,781 | Indefinite | |||||||||||||||
| Trade names |
39,460 | — | 39,460 | 39,460 | — | 39,460 | Indefinite | |||||||||||||||||||||
|
|
|
|
|
|
|
|
|
|
|
|
|
|
|
|||||||||||||||
| Total intangible assets with indefinite lives |
$ | 703,328 | $ | — | $ | 703,328 | $ | 705,241 | $ | — | $ | 705,241 | ||||||||||||||||
|
|
|
|
|
|
|
|
|
|
|
|
|
|||||||||||||||||
The change in the deferred financing costs results from fees paid related to the redemption of the Company’s 11% Senior Notes due 2015 (the “Senior Notes”) during the fourth quarter of fiscal 2013 and the related borrowings under the new second lien term loan facility (the “Term Facility”); the fees were paid in fiscal 2014 and increased deferred issuance costs by $1.2 million. See Note 7 for further discussion.
For the intangible assets with definite lives, the Company recorded amortization expense of $68.6 million for fiscal 2014, $70.2 million for fiscal 2013, and $63.5 million for fiscal 2012. For the next five fiscal periods and thereafter, the estimated future amortization expense on intangible assets with definite lives are as follows:
| (In thousands) |
||||
| 2015 |
$ | 54,488 | ||
| 2016 |
45,776 | |||
| 2017 |
34,128 | |||
| 2018 |
18,064 | |||
| 2019 |
17,032 | |||
| Thereafter |
32,333 | |||
|
|
|
|||
| Total amortization expense |
$ | 201,821 | ||
|
|
|
|||
5. Concentration of Sales and Credit Risk
The Company had no customers that comprised more than 10% of either consolidated net sales for fiscal 2014, fiscal 2013, and fiscal 2012 or accounts receivable at June 28, 2014 and June 29, 2013. The Company maintains an allowance for doubtful accounts for which details are disclosed in the accounts receivable portion of Note 2, Significant Accounting Policies—Accounts Receivable.
F-18
Table of Contents
Financial instruments that potentially expose the Company to concentrations of credit risk consist primarily of trade accounts receivable. The Company’s customer base includes a large number of individual restaurants, national and regional chain restaurants, and franchises and other institutional customers. The credit risk associated with accounts receivable is minimized by the Company’s large customer base and ongoing monitoring of customer creditworthiness.
6. Property, Plant, and Equipment
Property, plant and equipment as of June 28, 2014 and June 29, 2013 consisted of the following:
| (In thousands) |
As of June 28, 2014 |
As of June 29, 2013 |
Range of Lives | |||||||||
| Buildings and building improvements |
$ | 388,472 | $ | 380,934 | 10 – 39 years | |||||||
| Land |
37,702 | 38,430 | — | |||||||||
| Transportation equipment |
69,178 | 56,378 | 2 – 10 years | |||||||||
| Warehouse and plant equipment |
156,337 | 139,488 | 3 – 10 years | |||||||||
| Office equipment, furniture, and fixtures |
151,929 | 114,143 | 2 – 10 years | |||||||||
| Leasehold improvements |
61,728 | 42,259 | Lease term(1) | |||||||||
| Construction-in-process |
30,078 | 41,525 | ||||||||||
|
|
|
|
|
|||||||||
| 895,424 | 813,157 | |||||||||||
| Less: accumulated depreciation and amortization |
(325,515 | ) | (264,571 | ) | ||||||||
|
|
|
|
|
|||||||||
| Property, plant and equipment, net |
$ | 569,909 | $ | 548,586 | ||||||||
|
|
|
|
|
|||||||||
| (1) | Leasehold improvements are depreciated over the shorter of the useful life of the asset or the lease term. |
Total depreciation expense for the fiscal 2014, fiscal 2013, and fiscal 2012 was $73.5 million, $58.8 million, and $46.4 million, respectively, and is included in operating expenses on the consolidated statement of operations.
7. Debt
The Company is a holding company and conducts its operations through its subsidiaries, which have incurred or guaranteed indebtedness as described below.
Debt consisted of the following:
| (In thousands) |
As of June 28, 2014 |
As of June 29, 2013 |
||||||
| ABL |
$ | 679,625 | $ | 700,800 | ||||
| Term Facility |
741,273 | 746,323 | ||||||
| Promissory Note |
4,712 | 4,345 | ||||||
|
|
|
|
|
|||||
| Long-term debt |
1,425,610 | 1,451,468 | ||||||
| Capital lease obligations |
33,923 | 31,540 | ||||||
|
|
|
|
|
|||||
| Total debt |
1,459,533 | 1,483,008 | ||||||
| Less: current installments |
(10,514 | ) | (7,659 | ) | ||||
|
|
|
|
|
|||||
| Total debt, excluding current installments |
$ | 1,449,019 | $ | 1,475,349 | ||||
|
|
|
|
|
|||||
F-19
Table of Contents
ABL Facility
PFGC, Inc. (“PFGC”), a wholly-owned subsidiary of the Company, entered into an Asset Based Revolving Loan Credit Agreement (the “ABL Facility”) on May 23, 2008 which was amended and restated on May 8, 2012. The ABL Facility is secured by the majority of the tangible assets of PFGC and its subsidiaries. Performance Food Group, Inc., a wholly-owned subsidiary of PFGC, is the lead borrower under the ABL Facility, which is jointly and severally guaranteed by PFGC and all domestic direct and indirect wholly-owned subsidiaries of PFGC (other than captive insurance subsidiaries). Availability for loans and letters of credit under the ABL Facility is governed by a borrowing base, determined by the application of specified advance rates against eligible assets, including trade accounts receivable, inventory, owned real properties, and owned transportation equipment. The borrowing base is reduced quarterly by a cumulative fraction of the real properties and transportation equipment values. Advances on accounts receivable and inventory are subject to change based on periodic commercial finance examinations and appraisals, and the real property and transportation equipment values included in the borrowing base are subject to change based on periodic appraisals. Audits and appraisals are conducted at the direction of the administrative agent for the benefit and on behalf of all lenders.
PFGC amended its ABL Facility in August 2011 to allow for the payment of a dividend of $100 million, the exclusion of the dividend from the fixed charge coverage ratio calculation, and permitted PFGC to grant to the holders of the Senior Notes a second-priority lien in the underlying collateral. An amendment in May 2012 increased the size of the ABL Facility from $1.1 billion to $1.4 billion, lowered the interest rate grid for the LIBOR-based pricing option discussed below, and extended the maturity from May 2014 to May 2017. In addition, the May 2012 amendment expanded the borrowing base with respect to owned real estate and added transportation equipment as eligible assets in the borrowing base. Other provisions of the amendments included changes with respect to covenant calculations, restricted payments, and reporting requirements.
PFGC amended its ABL Facility in May 2013 to allow for the payment of a $220 million dividend, the exclusion of the dividend from the fixed charge coverage ratio calculation, and an increase in the amount of second lien debt that can be incurred.
Borrowings under the ABL Facility bear interest, at Performance Food Group, Inc.’s option, at (a) the Base Rate (defined as the greater of (i) the Federal Funds Rate in effect on such date plus 0.5%, (ii) the Prime Rate on such day, or (iii) one month LIBOR plus 1.0%) plus a spread or (b) LIBOR plus a spread. The ABL Facility also provides for an unused commitment fee ranging from 0.25% to 0.375%. As of June 28, 2014, aggregate borrowings outstanding were $679.6 million. There were also $108.7 million in letters of credit outstanding under the facility, and excess availability was $587.8 million, net of $19.9 million of lenders’ reserves, subject to compliance with customary borrowing conditions. The average interest rate for the ABL facility was 2.20% at June 28, 2014. As of June 29, 2013, aggregate borrowings outstanding were $700.8 million. There were also $111.2 million in letters of credit outstanding under the facility, and excess availability was $458.7 million, net of $14.7 million of lenders’ reserves, subject to compliance with customary borrowing conditions.
The ABL Facility contains covenants requiring the maintenance of a minimum consolidated fixed charge coverage ratio if excess availability falls below (a) the greater of (i) $130.0 million and (ii) 10% of the lesser of the borrowing base and the revolving credit facility amount for five consecutive business days or (b) 7.5% of the revolving credit facility amount at any time. The ABL Facility also contains customary restrictive covenants that include, but are not limited to, restrictions on PFGC’s ability to incur additional indebtedness, pay dividends, create liens, make investments or specified payments, and dispose of assets. The ABL Facility provides for customary events of default, including payment defaults and cross-defaults on other material indebtedness. If an event of default occurs and is continuing, amounts due under such agreement may be accelerated and the rights and remedies of the lenders under such agreement available under the ABL Facility may be exercised, including rights with respect to the collateral securing the obligations under such agreement.
F-20
Table of Contents
Senior Notes
On May 14, 2013, PFGC redeemed its outstanding $500 million of Senior Notes in full, at a redemption price equal to 102% of the principal amount of the Senior Notes, using the proceeds from the Term Facility discussed below. A portion of this redemption was considered an extinguishment of indebtedness, resulting in a $2.0 million loss on extinguishment of debt, which is comprised of $1.0 million of redemption premium paid and $1.0 million to write off the pro-rata portion of the unamortized issuance costs related to the debt extinguishment recorded in the fourth quarter of fiscal 2013. The remaining portion of this redemption was considered a modification of indebtedness in accordance with FASB ASC 470-50, Debt-Modifications and Extinguishments, and as a result, $6.9 million of unamortized issuance costs for the Senior Notes and $9.0 million of the redemption premium are deferred as issuance costs of the Term Facility.
Term Loan Facility
Performance Food Group, Inc. entered into a new Credit Agreement providing for the Term Facility on May 14, 2013. Performance Food Group, Inc. borrowed an aggregate principal amount of $750.0 million under the Term Facility which is jointly and severally guaranteed by PFGC and all domestic direct and indirect wholly-owned subsidiaries of Performance Food Group, Inc. Net proceeds to Performance Food Group, Inc. were $746.3 million. The proceeds from the Term Facility were used to redeem all outstanding Senior Notes in full; to pay the fees, premiums, expenses, and other transaction costs incurred in connection with the Term Facility and the ABL amendment discussed above; and to pay the dividend discussed in Note 8. As discussed above, a portion of the Term Facility was considered a modification of the Senior Notes and resulted in a charge of $1.4 million and $0.3 million related to third-party fees paid for the modified debt, which was reported in operating expenses in fiscal 2013 and fiscal 2014, respectively.
The Term Facility matures in 2019 and bears interest, at Performance Food Group, Inc.’s option, at a rate equal to a margin over either (a) a base rate determined by reference to the higher of (1) the rate of interest published by Credit Suisse (AG), Cayman Islands Branch, as its “prime lending rate,” (2) the federal funds rate plus 0.50% and (3) one-month LIBOR rate plus 1.00%, or (b) a LIBOR rate determined by reference to the service selected by Credit Suisse (AG), Cayman Islands Branch that has been nominated by the British Bankers’ Association (or any successor thereto). The applicable margin for the term loans under the Term Facility may be reduced subject to attaining a certain total net leverage ratio. The applicable margin for borrowings will be 5.25% for loans based on a LIBOR rate and 4.25% for loans based on the base rate, as of June 28, 2014. The LIBOR rate for term loans is subject to a 1.00% floor and the base rate for term loans is subject to a floor of 2.00%. Interest is payable quarterly in arrears in the case of Base Rate loans, and at the end of the applicable interest period (but no less frequently than quarterly) in the case of the LIBOR loans. Performance Food Group, Inc. can incur additional loans under the Term Facility with the aggregate amount of the incremental loans not exceeding the sum of (i) $140.0 million plus (ii) additional amounts so long as the Consolidated Secured Net Leverage Ratio for PFGC does not exceed 5.90:1.00 and so long as the proceeds are not used to finance restricted payments that include any dividend or distribution payments. PFGC is required to repay an aggregate principal amount equal to 0.25% of the aggregate principal amount of $750 million on the last business day of each calendar quarter, beginning September 30, 2013. The Term Facility is prepayable at a redemption price of 102% if such prepayment occurs prior to the first anniversary of the closing date (through May 14, 2014) declining to par in 1% annual increments thereafter. As of June 28, 2014, aggregate borrowings outstanding were $744.4 million with unamortized original issue discount of $3.1 million. Original issue discount is being amortized as additional interest expense on a straight-lined basis over the life of the Term Facility which approximates the effective yield method. For fiscal 2014 and fiscal 2013, interest expense included $0.6 million and $0.1 million, respectively, related to the amortization of original issue discount.
F-21
Table of Contents
Unsecured Subordinated Promissory Note
In connection with an acquisition, Performance Food Group, Inc. issued a $6.0 million interest only, unsecured subordinated promissory note on December 21, 2012, bearing an interest rate of 3.5%. Interest is payable quarterly in arrears. The $6.0 million principal is due in a lump sum in December 2017. All amounts outstanding under this promissory note become immediately due and payable upon the occurrence of a Change in Control of the Company or PFGC, which includes the sale, lease, or transfer of all or substantially all of the assets of PFGC. This promissory note was initially recorded at its fair value of $4.2 million. The difference between the principal and the initial fair value of the promissory note is being amortized as additional interest expense on a straight-lined basis over the life of the promissory note which approximates the effective yield method. For fiscal 2014 and fiscal 2013, interest expense included $0.3 million and $0.2 million, respectively, related to this amortization. As of June 28, 2014, the carrying value of the promissory note was $4.7 million.
Fiscal year maturities of long-term debt, excluding capital lease obligations, are as follows:
| (In thousands) |
||||
| 2015 |
$ | 7,500 | ||
| 2016 |
9,375 | |||
| 2017 |
687,125 | |||
| 2018 |
13,500 | |||
| 2019 |
7,500 | |||
| Thereafter |
705,000 | |||
|
|
|
|||
| Total long-term debt, excluding capital lease obligation |
$ | 1,430,000 | ||
|
|
|
|||
Capital Lease Obligations
Performance Food Group, Inc. is a party to facility leases at two Performance Foodservice distribution facilities and to five equipment leases that are accounted for as capital leases in accordance with FASB ASC 840-30, Leases—Capital Leases. The charge to income resulting from amortization of these leases is included with depreciation expense in the consolidated statement of operations. The gross and net book values on the balance sheet as of June 28, 2014 were $40.5 million and $29.8 million, respectively. The gross and net book values on the balance sheet as of June 29, 2013 were $35.9 million and $29.0 million, respectively.
Future minimum lease payments under non-cancelable capital leases were as follows as of June 28, 2014:
| (In thousands) |
||||
| 2015 |
$ | 5,596 | ||
| 2016 |
4,807 | |||
| 2017 |
3,965 | |||
| 2018 |
3,991 | |||
| 2019 |
3,746 | |||
| Thereafter |
36,288 | |||
|
|
|
|||
| Total future minimum lease payments |
58,393 | |||
| Less: interest |
24,470 | |||
|
|
|
|||
| Present value of future minimum lease payments |
$ | 33,923 | ||
|
|
|
|||
8. Payment of Dividends
On May 14, 2013, Performance Food Group Company paid a $220 million, or $1.2283 per share, dividend, to its Class A and Class B shareholders. On August 11, 2011, Performance Food Group Company paid a $100 million, or $0.5589 per share, dividend to its Class A and Class B shareholders.
F-22
Table of Contents
9. Derivatives and Hedging Activities
Risk Management Objective of Using Derivatives
The Company is exposed to certain risks arising from both its business operations and economic conditions. The Company principally manages its exposures to a wide variety of business and operational risks through management of its core business activities. The Company manages economic risks, including interest rate, liquidity, and credit risk primarily by managing the amount, sources, and duration of its debt funding and the use of derivative financial instruments. Specifically, the Company enters into derivative financial instruments to manage exposures that arise from business activities that result in the receipt or payment of future known and uncertain cash amounts, the value of which are determined by interest rates and diesel fuel costs. The Company’s derivative financial instruments are used to manage differences in the amount, timing, and duration of the Company’s known or expected cash receipts and payments related to the Company’s investments, borrowings, and diesel fuel purchases.
The effective portion of changes in the fair value of derivatives that are both designated and qualify as cash flow hedges is recorded in other comprehensive income and subsequently reclassified into earnings in the period that the hedged transaction occurs. The ineffective portion of the change in fair value of the derivatives is recognized directly in earnings. Hedges of Interest Rate Risk
The Company’s objectives in using interest rate derivatives are to add stability to interest expense and to manage its exposure to interest rate movements. Since the Company has a substantial portion of its debt in variable-rate instruments, it accomplishes this objective with interest rate swaps. These swaps are designated as cash flow hedges and involve the receipt of variable-rate amounts from a counterparty in exchange for the Company making fixed-rate payments over the life of the agreements without exchange of the underlying notional amount. All of the Company’s interest rate swaps are designated and qualify as cash flow hedges.
Amounts reported in other comprehensive income related to derivatives will be reclassified to interest expense as interest payments are made on the Company’s variable-rate debt. During the twelve months ending June 27, 2015, the Company estimates that an additional $7.8 million will be reclassified to earnings as an increase to interest expense.
As of June 28, 2014, Performance Food Group, Inc. had five interest rate swaps with a combined $750 million notional amount that were designated as cash flow hedges of interest rate risk. The following table summarizes the outstanding Swap Agreements as of June 28, 2014 (in thousands):
| Effective Date |
Maturity Date |
Notional Amount |
Fixed Rate Swapped |
|||||||
| June 30, 2014 |
June 30, 2017 | 200,000 | 1.52 | % | ||||||
| June 30, 2014 |
June 30, 2017 | 100,000 | 1.52 | % | ||||||
| August 9, 2013 |
August 9, 2018 | 200,000 | 1.51 | % | ||||||
| June 30, 2014 |
June 30, 2016 | 150,000 | 1.47 | % | ||||||
| June 30, 2014 |
June 30, 2016 | 100,000 | 1.47 | % | ||||||
Hedges of Forecasted Diesel Fuel Purchases
From time to time, Performance Food Group, Inc. enters into costless collar arrangements to hedge its exposure to variability in cash flows expected to be paid for forecasted purchases of diesel fuel. As of June 28, 2014, Performance Food Group, Inc. was a party to four such arrangements, with a 7.2 million gallon original notional amount in total, and a 7.2 million gallon notional amount remaining as of June 28, 2014. The remaining 7.2 million gallon forecasted purchases of diesel fuel are expected to be made between July 1, 2014 and December 31, 2015.
F-23
Table of Contents
The fuel collar instruments do not qualify for hedge accounting. Accordingly, the derivative instruments are recorded as an asset or liability on the balance sheet at fair value and any changes in fair value are recorded in the period of change as unrealized gains or losses on fuel hedging instruments and included in Other, net in the accompanying consolidated statement of operations. The Company recorded $0.1 million in unrealized gains and $0 in cash settlements related to these fuel collars for fiscal 2014, compared to $0.6 million in unrealized gains and $0 in cash settlements for fiscal 2013.
The Company does not currently have a payable or receivable related to cash collateral for its derivatives, and therefore it has not established an accounting policy for offsetting the fair value of its derivatives against such balances. The table below presents the fair value of the derivative financial instruments as well as their classification on the balance sheet as of June 28, 2014 and June 29, 2013:
| Fair Value of Derivative Instruments |
||||||||||||||||||||||||
| (in thousands) |
||||||||||||||||||||||||
| Asset Derivatives |
Liability Derivatives |
|||||||||||||||||||||||
| As of June 28, 2014 | As of June 29, 2013 | As of June 28, 2014 | As of June 29, 2013 | |||||||||||||||||||||
| Balance Sheet Location |
Fair Value |
Balance Sheet Location |
Fair Value |
Balance Sheet Location |
Fair Value |
Balance Sheet Location |
Fair Value |
|||||||||||||||||
| Derivatives designated as hedging instruments under ASC 815-20: |
| |||||||||||||||||||||||
| Interest rate swaps |
Prepaid expenses and other current assets |
$ | — | Prepaid expenses and other current assets |
$ | — | Current derivative liabilities |
$ | 7,071 | Current derivative liabilities |
$ | 4,182 | ||||||||||||
| Interest rate swaps |
Other assets |
857 | Other assets |
— | Long- term derivative liabilities |
3,008 | Long-term derivative liabilities |
1,478 | ||||||||||||||||
|
|
|
|
|
|
|
|
|
|||||||||||||||||
| Total |
$ | 857 | $ | — | $ | 10,079 | $ | 5,660 | ||||||||||||||||
|
|
|
|
|
|
|
|
|
|||||||||||||||||
| Derivatives not designated as hedging instruments under ASC 815-20: |
| |||||||||||||||||||||||
| Diesel fuel collars |
Prepaid expenses and other current assets |
$ | 64 | Prepaid expenses and other current assets |
$ | 9 | Current derivative liabilities |
$ | 0 | Current derivative liabilities |
$ | 43 | ||||||||||||
| Diesel fuel collars |
Other assets |
21 | Other assets |
— | Long- term derivative liabilities |
0 | Long-term derivative liabilities |
29 | ||||||||||||||||
|
|
|
|
|
|
|
|
|
|||||||||||||||||
| Total |
$ | 85 | $ | 9 | $ | 0 | $ | 72 | ||||||||||||||||
|
|
|
|
|
|
|
|
|
|||||||||||||||||
F-24
Table of Contents
The derivative contracts are subject to a master netting arrangement with the respective counterparties that provide for the net settlement of all derivative contracts in the event of default or upon the occurrence of certain termination events. Upon exercise of termination rights by the non-defaulting party (i) all transactions are terminated, (ii) all transactions are valued and the positive value or “in the money” transactions are netted against the negative value or “out of the money” transactions, and (iii) the only remaining payment obligation is of one of the parties to pay the netted termination amount.
The Company has elected to present the derivative assets and derivative liabilities on the balance sheet on a gross basis for fiscal 2014 and fiscal 2013. The tables below presents the derivative assets and liability balance by type of financial instrument, before and after the effects of offsetting, as of June 28, 2014 and June 29, 2013:
| As of June 28, 2014 |
||||||||||||||||||||||||
| Gross Amounts of Recognized Assets |
Gross Amounts Offset in the Consolidated Balance Sheet |
Net Amounts of Assets Presented in the Consolidated Balance Sheet |
Gross Amounts Not Offset in the Consolidated Balance Sheet |
|||||||||||||||||||||
| (In thousands) |
Financial Instruments |
Cash Collateral Pledged |
Net Amounts |
|||||||||||||||||||||
| Interest rate swaps: |
$ | 857 | $ | — | $ | 857 | $ | 857 | $ | — | $ | — | ||||||||||||
| Diesel fuel collars: |
85 | — | 85 | — | — | 85 | ||||||||||||||||||
|
|
|
|
|
|
|
|
|
|
|
|
|
|||||||||||||
| Total derivatives, subject to a master netting arrangement |
942 | — | 942 | 857 | — | 85 | ||||||||||||||||||
| Total derivatives, not subject to a master netting arrangement |
— | — | — | — | — | — | ||||||||||||||||||
|
|
|
|
|
|
|
|
|
|
|
|
|
|||||||||||||
| Total |
$ | 942 | $ | — | $ | 942 | $ | 857 | $ | — | $ | 85 | ||||||||||||
|
|
|
|
|
|
|
|
|
|
|
|
|
|||||||||||||
| As of June 28, 2014 |
||||||||||||||||||||||||
| Gross Amounts of Recognized Liabilities |
Gross Amounts Offset in the Consolidated Balance Sheet |
Net Amounts of Liabilities Presented in the Consolidated Balance Sheet |
Gross Amounts Not Offset in the Consolidated Balance Sheet |
|||||||||||||||||||||
| (In thousands) |
Financial Instruments |
Cash Collateral Pledged |
Net Amounts |
|||||||||||||||||||||
| Interest rate swaps: |
$ | 10,079 | $ | — | $ | 10,079 | $ | 857 | $ | — | $ | 9,222 | ||||||||||||
| Diesel fuel collars: |
— | — | — | — | — | — | ||||||||||||||||||
|
|
|
|
|
|
|
|
|
|
|
|
|
|||||||||||||
| Total derivatives, subject to a master netting arrangement |
10,079 | — | 10,079 | 857 | — | 9,222 | ||||||||||||||||||
| Total derivatives, not subject to a master netting arrangement |
— | — | — | — | — | — | ||||||||||||||||||
|
|
|
|
|
|
|
|
|
|
|
|
|
|||||||||||||
| Total |
$ | 10,079 | $ | — | $ | 10,079 | $ | 857 | $ | — | $ | 9,222 | ||||||||||||
|
|
|
|
|
|
|
|
|
|
|
|
|
|||||||||||||
F-25
Table of Contents
| As of June 29, 2013 |
||||||||||||||||||||||||
| Gross Amounts of Recognized Assets |
Gross Amounts Offset in the Consolidated Balance Sheet |
Net Amounts of Assets Presented in the Consolidated Balance Sheet |
Gross Amounts Not Offset in the Consolidated Balance Sheet |
|||||||||||||||||||||
| (In thousands) |
Financial Instruments |
Cash Collateral Pledged |
Net Amounts |
|||||||||||||||||||||
| Interest rate swaps: |
$ | — | $ | — | $ | — | $ | — | $ | — | $ | — | ||||||||||||
| Diesel fuel collars: |
9 | — | 9 | 9 | — | — | ||||||||||||||||||
|
|
|
|
|
|
|
|
|
|
|
|
|
|||||||||||||
| Total derivatives, subject to a master netting arrangement |
9 | — | 9 | 9 | — | — | ||||||||||||||||||
| Total derivatives, not subject to a master netting arrangement |
— | — | — | — | — | — | ||||||||||||||||||
|
|
|
|
|
|
|
|
|
|
|
|
|
|||||||||||||
| Total |
$ | 9 | $ | — | $ | 9 | $ | 9 | $ | — | $ | — | ||||||||||||
|
|
|
|
|
|
|
|
|
|
|
|
|
|||||||||||||
| As of June 29, 2013 |
||||||||||||||||||||||||
| Gross Amounts of Recognized Liabilities |
Gross Amounts Offset in the Consolidated Balance Sheet |
Net Amounts of Liabilities Presented in the Consolidated Balance Sheet |
Gross Amounts Not Offset in the Consolidated Balance Sheet |
|||||||||||||||||||||
| (In thousands) |
Financial Instruments |
Cash Collateral Pledged |
Net Amounts |
|||||||||||||||||||||
| Interest rate swaps: |
$ | 5,660 | $ | — | $ | 5,660 | $ | — | $ | — | $ | 5,660 | ||||||||||||
| Diesel fuel collars: |
72 | — | 72 | 9 | — | 63 | ||||||||||||||||||
|
|
|
|
|
|
|
|
|
|
|
|
|
|||||||||||||
| Total derivatives, subject to a master netting arrangement |
5,732 | — | 5,732 | 9 | — | 5,723 | ||||||||||||||||||
| Total derivatives, not subject to a master netting arrangement |
— | — | — | — | — | — | ||||||||||||||||||
|
|
|
|
|
|
|
|
|
|
|
|
|
|||||||||||||
| Total |
$ | 5,732 | $ | — | $ | 5,732 | $ | 9 | $ | — | $ | 5,723 | ||||||||||||
|
|
|
|
|
|
|
|
|
|
|
|
|
|||||||||||||
The tables below present the effect of the derivative financial instruments designated in hedging relationships on the consolidated statement of operations for fiscal 2014 and fiscal 2013:
| Tabular Disclosure of the Effect of Derivative Instruments on the Consolidated Statement of Operations for the Fiscal Year Ended June 28, 2014 (in thousands) |
||||||||||||||||||||
| Derivatives in FASB ASC 815-20 Cash Flow Hedging Relationships |
Amount of Loss (Gain) Recognized in OCI on Derivative (Effective Portion), including all tax effects |
Location of Loss Reclassified from OCI into Income (Effective Portion) |
Amount of (Loss) Gain Reclassified from OCI into Income (Effective Portion) |
Location of Loss Recognized in Income on Derivative (Ineffective Portion and Amount Excluded from Effectiveness Testing) |
Amount of Gain/ (Loss) Recognized in Income on Derivatives (Cumulative Ineffective Portion and Amount Excluded from Effectiveness Testing) |
|||||||||||||||
| Interest Rate Swaps |
$ | 8,808 | Interest expense | $ | (6,647 | ) | Other, net | $ | (4 | ) | ||||||||||
F-26
Table of Contents
| Tabular Disclosure of the Effect of Derivative Instruments on the Consolidated Statement of Operations for the Fiscal Year Ended June 29, 2013 (in thousands) |
||||||||||||||||||||
| Derivatives in FASB ASC 815-20 Cash Flow Hedging Relationships |
Amount of Loss (Gain) Recognized in OCI on Derivative (Effective Portion), including all tax effects |
Location of Loss Reclassified from OCI into Income (Effective Portion) |
Amount of (Loss) Gain Reclassified from OCI into Income (Effective Portion) |
Location of Loss Recognized in Income on Derivative (Ineffective Portion and Amount Excluded from Effectiveness Testing) |
Amount of Gain/ (Loss) Recognized in Income on Derivatives (Cumulative Ineffective Portion and Amount Excluded from Effectiveness Testing) |
|||||||||||||||
| Interest Rate Swaps |
$ | 5,237 | Interest expense | $ | (11,081 | ) | Other, net | $ | — | |||||||||||
| Tabular Disclosure of the Effect of Derivative Instruments on the Consolidated Statement of Operations for the Fiscal Year Ended June 30, 2012 (in thousands) |
||||||||||||||||||||
| Derivatives in FASB ASC 815-20 Cash Flow Hedging Relationships |
Amount of Loss (Gain) Recognized in OCI on Derivative (Effective Portion), including all tax effects |
Location of Loss Reclassified from OCI into Income (Effective Portion) |
Amount of (Loss) Gain Reclassified from OCI into Income (Effective Portion) |
Location of Loss Recognized in Income on Derivative (Ineffective Portion and Amount Excluded from Effectiveness Testing) |
Amount of Loss Recognized in Income on Derivatives (Cumulative Ineffective Portion and Amount Excluded from Effectiveness Testing) |
|||||||||||||||
| Interest Rate Swaps |
$ | 7,702 | Interest expense | $ | (12,545 | ) | Other, net | $ | — | |||||||||||
The derivative instruments are the only assets or liabilities that are recorded at fair value on a recurring basis. The fuel collars are exchange-traded commodities and their fair value is derived from valuation models based on certain assumptions regarding market conditions, some of which may be unobservable. Based on the lack of significance of these unobservable inputs, the Company has concluded that these instruments represent Level 2 on the hierarchy. The fair values of the Company’s interest rate swap agreements are determined using a valuation model with several inputs and assumptions, some of which may be unobservable. A specific unobservable input used by the Company in determining the fair value of its interest rate swaps is an estimation of both the unsecured borrowing spread to LIBOR for the Company as well as that of the derivative counterparties. Based on the lack of significance of this estimated spread component to the overall value of the Company’s interest rate swaps, the Company has concluded that these swaps represent Level 2 on the hierarchy.
There have been no transfers between levels in the hierarchy from June 29, 2013 to June 28, 2014.
Credit-risk-related Contingent Features
The Company has agreements with each of its derivative counterparties that provide that if the Company either defaults or is capable of being declared in default on any of its indebtedness, the Company can also be declared in default on its derivative obligations.
As of June 28, 2014, and June 29, 2013, the aggregate fair value amount of derivative instruments that contain contingent features was $9.1 million and $5.7 million, respectively. As of June 28, 2014, the Company has not been required to post any collateral related to these agreements. If the Company breached any of these provisions, it would be required to settle its obligations under the agreements at their termination value of $9.1 million.
F-27
Table of Contents
10. Insurance Program Liabilities
The Company maintains high-deductible programs covering portions of general and vehicle liability, workers’ compensation, and group medical insurance. The amounts in excess of the deductibles are fully insured by third-party insurance carriers, subject to certain limitations. A summary of the activity in all types of deductible liabilities appears below:
| (In thousands) |
||||
| Balance at July 2, 2011 |
$ | 69,344 | ||
| Charged to costs and expenses |
95,427 | |||
| Additional liabilities assumed in connection with an acquisition |
3,572 | |||
| Payments |
(98,840 | ) | ||
|
|
|
|||
| Net balance at June 30, 2012 |
69,503 | |||
| Charged to costs and expenses |
123,595 | |||
| Payments |
(114,921 | ) | ||
|
|
|
|||
| Net balance at June 29, 2013 |
78,177 | |||
| Charged to costs and expenses |
119,738 | |||
| Payments |
(115,151 | ) | ||
|
|
|
|||
| Net balance at June 28, 2014 |
$ | 82,764 | ||
|
|
|
|||
11. Fair Value of Financial Instruments
The carrying values of cash, accounts receivable, outstanding checks in excess of deposits, trade accounts payable, and accrued expenses approximate their fair values because of the relatively short maturities of those instruments. The derivative liabilities are recorded at fair value on the balance sheet. The fair value of long-term debt is $1.4 billion and $1.5 billion at June 28, 2014 and June 29, 2013, respectively, and is determined by reviewing current market pricing related to comparable debt issued at the time of the balance sheet date, and is considered a Level 2 measurement.
12. Leases
Subsidiaries of the Company lease various warehouse and office facilities and certain equipment under long-term operating lease agreements that expire at various dates. Rent expense for operating leases include any rent increases, rent holidays, or landlord concessions on a straight-line basis over the lease term. As of June 28, 2014, subsidiaries the Company are obligated under non-cancelable operating lease agreements to make future minimum lease payments as follows:
| (In thousands) |
||||
| 2015 |
$ | 78,770 | ||
| 2016 |
73,502 | |||
| 2017 |
63,663 | |||
| 2018 |
55,689 | |||
| 2019 |
46,918 | |||
| Thereafter |
93,080 | |||
|
|
|
|||
| Total minimum lease payments |
$ | 411,622 | ||
|
|
|
|||
Rent expense for operating leases was $91.1 million for fiscal 2014, $87.8 million for the fiscal 2013, and $84.1 million for fiscal 2012. A subsidiary of the Company has posted letters of credit as collateral supporting certain leases. These letters of credit are included in the total outstanding letters of credit under the ABL Facility as discussed in Note 7.
F-28
Table of Contents
Subsidiaries of the Company have residual value guarantees to its lessors under certain of its operating leases. These guarantees are discussed in Note 15. These residual value guarantees are not included in the above table of future minimum lease payments.
A subsidiary of the Company is a party to seven capital leases. See Note 7 for discussion of these leases.
13. Income Taxes
Income tax expense for fiscal 2014, fiscal 2013, and fiscal 2012 consisted of the following:
| (In thousands) |
For the fiscal year ended June 28, 2014 |
For the fiscal year ended June 29, 2013 |
For the fiscal year ended June 30, 2012 |
|||||||||
| Current income tax expense: |
||||||||||||
| Federal |
$ | 12,783 | $ | 16,097 | $ | 11,321 | ||||||
| State |
3,353 | 936 | 4,971 | |||||||||
|
|
|
|
|
|
|
|||||||
| Total current income tax expense |
16,136 | 17,033 | 16,292 | |||||||||
|
|
|
|
|
|
|
|||||||
| Deferred income tax expense (benefit): |
||||||||||||
| Federal |
(1,593 | ) | (8,161 | ) | (687 | ) | ||||||
| State |
168 | 2,187 | (2,736 | ) | ||||||||
|
|
|
|
|
|
|
|||||||
| Total deferred income tax benefit |
(1,425 | ) | (5,974 | ) | (3,423 | ) | ||||||
|
|
|
|
|
|
|
|||||||
| Total income tax expense, net |
$ | 14,711 | $ | 11,059 | $ | 12,869 | ||||||
|
|
|
|
|
|
|
|||||||
The Company’s effective income tax rate for continuing operations for fiscal 2014, fiscal 2013, and fiscal 2012 is 48.7%, 56.8%, and 38.0%, respectively. Actual income tax benefit differs from the amount computed by applying the applicable U.S. federal corporate income tax rate of 35% to earnings before income taxes as follows:
| (In thousands) |
For the fiscal year ended June 28, 2014 |
For the fiscal year ended June 29, 2013 |
For the fiscal year ended June 30, 2012 |
|||||||||
| Federal income tax expense computed at statutory rate |
$ | 10,575 | $ | 6,809 | $ | 11,861 | ||||||
| Increase (decrease) in income taxes resulting from: |
||||||||||||
| State income taxes, net of federal income tax benefit |
2,038 | 1,933 | 1,809 | |||||||||
| Non-deductible expenses |
2,358 | 2,250 | 2,350 | |||||||||
| Tax credits |
(149 | ) | (130 | ) | (240 | ) | ||||||
| Provision to return |
28 | 6 | (1,242 | ) | ||||||||
| Change in uncertain tax positions |
(431 | ) | 135 | (3,011 | ) | |||||||
| Change in valuation allowance for deferred tax assets |
253 | — | — | |||||||||
| Other, net |
39 | 56 | 1,342 | |||||||||
|
|
|
|
|
|
|
|||||||
| Total income tax expense, net |
$ | 14,711 | $ | 11,059 | $ | 12,869 | ||||||
|
|
|
|
|
|
|
|||||||
F-29
Table of Contents
Deferred income taxes are recorded based upon the tax effects of differences between the financial statement and tax bases of assets and liabilities and available tax loss and credit carry-forwards. Temporary differences and carry-forwards that created significant deferred tax assets and liabilities were as follows:
| (In thousands) |
As of June 28, 2014 |
As of June 29, 2013 |
||||||
| Deferred tax assets: |
||||||||
| Allowance for doubtful accounts |
$ | 3,674 | $ | 2,686 | ||||
| Inventories |
4,268 | 3,541 | ||||||
| Accrued employee benefits |
5,244 | 7,375 | ||||||
| Self-insurance reserves |
4,483 | 7,727 | ||||||
| Net operating loss carry-forwards |
8,105 | 8,171 | ||||||
| Tax credit carry-forwards |
101 | 149 | ||||||
| Stock options |
2,084 | 1,805 | ||||||
| Interest rate swap |
— | 10 | ||||||
| Deferred rent |
1,514 | 3,112 | ||||||
| Other comprehensive income |
3,638 | 2,252 | ||||||
| Other assets |
5,549 | 2,817 | ||||||
|
|
|
|
|
|||||
| Total gross deferred tax assets |
38,660 | 39,645 | ||||||
| Less: Valuation allowance |
253 | — | ||||||
|
|
|
|
|
|||||
| Total net deferred tax assets |
38,407 | 39,645 | ||||||
|
|
|
|
|
|||||
| Deferred tax liabilities: |
||||||||
| Property, plant, and equipment |
74,153 | 59,220 | ||||||
| Basis difference in intangible assets |
43,969 | 61,959 | ||||||
| Prepaid expenses |
5,983 | 5,213 | ||||||
| Other |
2,343 | 700 | ||||||
|
|
|
|
|
|||||
| Total deferred tax liabilities |
126,448 | 127,092 | ||||||
|
|
|
|
|
|||||
| Total net deferred income tax liability |
$ | 88,041 | $ | 87,447 | ||||
|
|
|
|
|
|||||
The state income tax credit carry-forwards expire in years 2021 through 2027. The state net operating loss carry-forwards expire in years 2014 through 2034. The Company has recorded a valuation allowance against state net operating loss carryforwards for $.3 million. The Company believes that it is more likely than not that all remaining deferred tax assets will be realized.
The Company records a liability for Uncertain Tax Positions in accordance with FASB ASC 740-10-25, Income Taxes—General—Recognition. The following table summarizes the activity related to unrecognized tax benefits:
| (In thousands) |
||||
| Balance as of July 2, 2011 |
$ | 10,829 | ||
| Increases due to current year positions |
— | |||
| Expiration of statutes of limitations |
(4,804 | ) | ||
|
|
|
|||
| Balance as of June 30, 2012 Increases due to current year positions |
|
6,025 275 |
| |
| Expiration of statutes of limitations |
(472 | ) | ||
|
|
|
|||
| Balance as of June 29, 2013 |
5,828 | |||
| Increases due to current year positions Expiration of statutes of limitations |
|
369 (5,510 |
) | |
|
|
|
|||
| Balance as of June 28, 2014 |
$ | 687 | ||
|
|
|
|||
F-30
Table of Contents
Included in the balance as of June 28, 2014 and June 29, 2013, is $0.6 million ($0.4 million net of federal tax benefit) and $0.6 million ($0.4 million net of federal tax benefit), respectively, of unrecognized tax benefits that could affect the effective tax rate for continuing operations. The balance in unrecognized tax benefits relates primarily to depreciable lives and methods, intercompany transactions, and the allocation of transaction costs.
As of June 28, 2014, substantially all federal, state and local, and foreign income tax matters have been concluded for years through 2007. It is reasonably possible that a decrease of less than $0.1 million in the balance of unrecognized tax benefits may occur within the next twelve months because of statute of limitations expirations, less than $0.1 million of which, if recognized, would affect the effective tax rate.
It is the Company’s practice to recognize interest and penalties related to uncertain tax positions in income tax expense. Less than $0.1 million (less than $0.1 million net of federal tax benefit) and $0.8 million ($0.5 million net of federal tax benefit) was accrued for interest related to uncertain tax positions as of June 28, 2014 and June 29, 2013, respectively. Net interest and penalty income of $0.7 million ($0.4 million net of federal benefit), expense of $0.3 million ($0.2 million net of federal benefit) and income of $0.8 million ($0.5 million net of federal benefit) was recognized in tax expense for fiscal 2014, fiscal 2013, and fiscal 2012, respectively.
14. Retirement Plans
Employee Savings Plans
The Company sponsors the Performance Food Group Employee Savings Plan (the “PFG Savings Plan”). The PFG Savings Plan consists of two components: a defined contribution plan covering substantially all employees (the “401(k) Plan”) and a profit sharing plan. Under the latter, the Company can make a discretionary contribution in a given year, although there is no requirement to do so, and no such contribution was made in fiscal years 2014 or 2013. As of January 1, 2009 the 401(k) plan merged with the Self-Directed Tax Advantaged Retirement (STAR) Plan of PFGC, Inc. (the “STAR Plan”). Employees participating in the 401(k) Plan may elect to contribute between 1% and 50% of their qualified compensation, up to a maximum dollar amount as specified by the provisions of the Internal Revenue Code. In fiscal 2014, the Company matched 100% of the first 3.5% of the employee contributions, resulting in matching contributions of $13.2 million for fiscal 2014, $12.6 million for fiscal 2013, and $11.1 million for fiscal 2012. Associates eligible for the annual STAR Plan contribution (an annual amount based on the employee’s salary and years of service) as of December 31, 2008 were grandfathered for that contribution under the merged PFG Savings Plan. STAR Plan contributions made by the Company were $3.8 million for fiscal 2014, $3.8 million for fiscal 2013, and $3.8 million for fiscal 2012, for total retirement plan contributions of $17.0 million for fiscal 2014, $16.4 million for fiscal 2013, and $14.9 million for fiscal 2012.
Multiemployer Pension Plans
The risks of participating in multiemployer pension plans are different from single-employer pension plans in the following aspects:
| • | Assets contributed to the multiemployer plan by one employer may be used to provide benefits to employees of other participating employers. |
| • | If a participating employer stops contributing to the plan, the unfunded obligations of the plan may be borne by the remaining participating employers. |
| • | If the Company chooses to stop participating in its multiemployer plans, the Company may be required to pay those plans an amount based on the underfunded status of the plan, referred to as a withdrawal liability. |
The Company currently participates in the United Food & Commercial Workers International Union-Industry Pension Fund that is administered by the United Food and Commercial Workers Union representing some of the Company’s employees. The Employer Identification Number and the plan number for
F-31
Table of Contents
this pension fund are 51-6055922 and 001, respectively. As of July 1, 2012, the plan’s funded percentage was 108.2%. The collective bargaining agreement requiring contribution to the plan will expire on April 24, 2015. The Company made contributions of $0.1 million to this plan for fiscal years ended June 28, 2014, June 29, 2013, and June 30, 2012.
Other Postretirement Benefit Plans
In addition to the contributions to the defined benefit pension plans described above, the Company also contributes to two multiemployer health and welfare plans based on obligations arising under collective bargaining agreements covering union-represented employees. The Company made contributions of $0.9 million, $0.7 million, and $0.7 million to these plans for fiscal 2014, fiscal 2013, and fiscal 2012, respectively.
15. Commitments and Contingencies
Purchase Obligations
The Company had outstanding contracts and purchase orders for capital projects totaling $9.5 million at June 28, 2014. Amounts due under these contracts were not included on the Company’s consolidated balance sheet as of June 28, 2014.
Withdrawn Multiemployer Pension Plans
Until recently, Performance Food Group, Inc. participated in the Central States Southeast and Southwest Areas Pension Fund (“Central States Pension Fund”), a multiemployer pension plan administered by the Teamsters Union, pursuant to which Performance Food Group, Inc. was required to make contributions on behalf of certain union employees. The Central States Pension Fund is underfunded and is in critical status. In connection with the recent renegotiation of the collective bargaining agreement that had previously required the Company’s participation in the Central States Pension Fund, the Company negotiated the termination of its participation in the Central States Pension Fund and the Company has withdrawn. The Company currently estimates that the likely withdrawal liability will range from $4.1 million to $6.9 million. The Company had previously recorded an initial estimated withdrawal liability of $3.7 million during fiscal 2013 and has increased the estimated withdrawal liability by $0.4 million during fiscal 2014. The Company has made total payments for voluntary withdrawal of this plan in the amount of $0.4 million. As of June 28, 2014, the estimated withdrawal liability totaled $3.7 million.
Guarantees
Subsidiaries of the Company have entered into numerous operating leases, including leases of buildings, equipment, tractors, and trailers. Certain of the leases for tractors, trailers, and other vehicles and equipment, provide for residual value guarantees to the lessors. Circumstances that would require the subsidiary to perform under the guarantees include either (1) default on the leases with the leased assets being sold for less than the specified residual values in the lease agreements, or (2) decisions not to purchase the assets at the end of the lease terms combined with the sale of the assets, with sales proceeds less than the residual value of the leased assets specified in the lease agreements. Residual value guarantees under these operating lease agreements typically range between 5% and 25% of the value of the leased assets at inception of the lease. These leases have original terms ranging from 5 to 7 years and expiration dates ranging from 2014 to 2021. As of June 28, 2014, the undiscounted maximum amount of potential future payments for lease guarantees totaled $15.7 million, which would be mitigated by the fair value of the leased assets at lease expiration. The assessment as to whether it is probable that subsidiaries of the Company will be required to make payments under the terms of the guarantees is based upon their actual and expected loss experience. Consistent with the requirements of FASB ASC 460-10-50, Guarantees-Overall-Disclosure, the Company has recorded $0.1 million of the potential future guarantee payments on its consolidated balance sheet as of June 28, 2014.
F-32
Table of Contents
In addition, the Company from time to time enters into certain types of contracts that contingently require it to indemnify various parties against claims from third parties. These contracts primarily relate to: (i) certain real estate leases under which subsidiaries of the Company may be required to indemnify property owners for environmental and other liabilities and other claims arising from their use of the applicable premises; (ii) certain agreements with the Company’s officers, directors, and employees under which the Company may be required to indemnify such persons for liabilities arising out of their employment relationship; and (iii) customer agreements under which the Company may be required to indemnify customers for certain claims brought against them with respect to the supplied products.
Generally, a maximum obligation under these contracts is not explicitly stated. Because the obligated amounts associated with these types of agreements are not explicitly stated, the overall maximum amount of the obligation cannot be reasonably estimated. Historically, the Company has not been required to make payments under these obligations and, therefore, no liabilities have been recorded for these obligations in the Company’s consolidated balance sheets.
Litigation
The Company is engaged in the defense of certain claims and lawsuits arising out of the ordinary course and conduct of its business. The Company has insurance policies covering certain potential losses where such coverage is cost effective. Although the outcomes of such matters (including the matter discussed below) are not determinable at this time, in the Company’s opinion, any liability that might be incurred by it upon the resolution of the claims and lawsuits (including those discussed below) will not, individually and in the aggregate, have a material adverse effect on the Company’s consolidated financial condition, results of operations, or cash flows.
U.S. Equal Employment Opportunity Commission Investigation. In March 2009, the Baltimore Equal Employment Opportunity Commission (“EEOC”) Field Office served the Company with company-wide (excluding, however, the Company’s Vistar and Roma Foodservice operations) subpoenas relating to alleged violations of the Equal Pay Act and Title VII of the Civil Rights Act, seeking certain information from January 1, 2004 to a point in time in the first fiscal quarter of 2009. In August 2009, the EEOC moved to enforce the subpoenas in federal court in Maryland, and the Company opposed the motion. In February 2010, the court ruled that the subpoena related to the Equal Pay Act investigation was enforceable company-wide but on a narrower scope of data than the original subpoena sought; the court ruled that the subpoena was applicable to the transportation, logistics, and warehouse functions of the Company’s Broadline distribution centers only and not the Customized distribution centers. The Company cooperated with the EEOC on the production of information. In September 2011, the EEOC notified the Company that the EEOC was terminating the investigation into alleged violations of the Equal Pay Act. In Determinations issued in September 2012 by the EEOC with respect to the charges on which the EEOC had based its company-wide investigation, the EEOC concluded that the Company engaged in a pattern of denying hiring and promotion to a class of female applicants and employees into certain positions within the transportation, logistics, and warehouse functions within the Company’s Broadline division and in June 2013, filed suit in federal court in Baltimore against the Company. The litigation concerns two issues: 1) whether the Company unlawfully engaged in an ongoing pattern and practice of failing to hire female applicants into operations positions; and 2) whether the Company unlawfully failed to promote one of the three individuals who filed charges with the EEOC due to her being female. The Company intends to vigorously defend itself.
Laumea v. Performance Food Group, Inc. In May 2014, a former employee of the Company’s Roma of Southern California distribution center filed a putative class action lawsuit in the San Bernardino County, California Superior Court against the Company. There are different counts for which the putative classes differ. The first class is proposed to be all former and current employees employed by the Company in California in non-exempt positions at any time during the period beginning May 30, 2010 to the present (the “California Class”). With respect to the California Class, the lawsuit alleges that the Company (i) failed to pay overtime as required by California statute, (ii) failed to provide meal periods and to pay compensation for such meal periods,
F-33
Table of Contents
(iii) failed to provide accurate itemized wage statements and (iv) that the Company engaged in unfair trade practices. The lawsuit further alleges Plaintiff is entitled to penalties and attorney fees pursuant to the California Private Attorney General Act. The second putative class is proposed to be all members of the California Class who separated from employment at any time during the period beginning May 30, 2011 (the “California Subclass”). With respect to the California Subclass, the lawsuit alleges that the Company failed to pay all compensation within the period due at the time of termination of employment. The third putative class is proposed to be all current or former employees employed by the Company in the United States in non-exempt positions at any time during the period beginning May 30, 2011 to the present (the “Nationwide Class”). With respect to the Nationwide Class, the lawsuit alleges the Company willfully failed to pay overtime compensation. The Company intends to vigorously defend itself.
Contreras v. Performance Food Group, Inc., et al. In June 2014, a former employee of the Company’s Roma of Southern California distribution center filed a putative class action lawsuit in the Alameda County, California Superior Court against the Company. The putative class is proposed to be all drivers employed in any of the Company’s California locations at any time during the period beginning June 17, 2010 to the present. The lawsuit alleges that the Company engaged in unfair trade practices and that the Company, with respect to the putative class, failed to (i) provide timely off-duty meal and rest breaks and to pay compensation for such breaks as required by California law, (ii) pay compensation for all hours worked, (iii) to pay overtime compensation, (iv) to provide accurate itemized wage statements, (v) pay all compensation within the period due at the time of termination of employment, and (vi) pay compensation in timely fashion. The lawsuit further alleges the plaintiff is entitled to penalties and attorney fees pursuant to the California Private Attorney General Act. The Company intends to vigorously defend itself.
16. Related-Party Transactions
Transaction and Advisory Fee Agreement
The Company is a party to a transaction and advisory fee agreement pursuant to which affiliates of The Blackstone Group and Wellspring Capital Management provide management advice and counsel for the development of the Company’s long-term strategic plans and other management, administrative, and operating activities. The transaction and advisory fee agreement generally provides for the payment by the Company of certain transaction fees, annual advisory fees, and the reimbursement of out of pocket expenses. The annual advisory fee is the greater of $2.5 million or 1.5% of the Company’s consolidated EBITDA (as defined in the transaction and advisory fee agreement) for the immediately preceding fiscal year. For the years ended June 28, 2014, June 29, 2013, and June 30, 2012, such payments to affiliates of the principal shareholders totaled $4.2 million, $4.2 million, and $3.3 million, respectively. The Company also paid $3.2 million in advisory expenses to the sponsors in July 2012 related to the completion of its acquisitions during fiscal 2012 and $0.9 million in advisory expenses to the principal sponsors in December 2012 related to the completion of the FRF acquisition.
At any time in connection with or in anticipation of a change of control of Performance Food Group Company, a sale of all or substantially all of Performance Food Group Company’s assets or an initial public offering of common equity of Performance Food Group Company or its successor, the Advisors may elect to receive, in consideration of their role in facilitating such transaction and in settlement of the termination of the services, a single lump sum cash payment calculated as set forth in this agreement.
Other
The Company leases a distribution facility from an entity owned by an officer of the Company. The lease generally provides that the Company will bear the cost of property taxes. Total rent and taxes paid to the officer’s company totaled $0.5 million for fiscal years ended June 28, 2014, June 29, 2013, and June 30, 2012.
F-34
Table of Contents
The Company does business with certain other affiliates of The Blackstone Group. In fiscal 2014, the Company recorded sales of $35.0 million to certain of these affiliate companies compared to sales of $40.1 million for fiscal 2013 and $40.0 million for fiscal 2012. The Company also recorded purchases of $1.8 million from certain of these affiliate companies in fiscal 2014 compared to purchases of $2.9 million for fiscal 2013 and $3.8 million for fiscal 2012. The Company does not conduct a material amount of business with affiliates of Wellspring Capital Management.
As of June 28, 2014, an affiliate of The Blackstone Group held $28.8 million of the outstanding $744.4 million Term Facility. The Company paid approximately $2.0 million and $0.2 million in interest related to fiscal 2014 and fiscal 2013, respectively, to this affiliate pursuant to the terms of the Term Facility. See Note 7 for a discussion of the Term Facility. Affiliates of The Blackstone Group and Wellspring Capital Management had held $218.1 million of the $500 million Senior Notes that were redeemed on May 14, 2013. The Company paid approximately $4.4 million in redemption premiums and $20.9 million in interest related to fiscal 2013 to these affiliates pursuant to the terms of the Senior Notes. The Company paid approximately $10.7 million in interest related to fiscal 2012 to these affiliates pursuant to the terms of the Senior Notes.
17. Earnings Per Share
Basic earnings per common share is computed by dividing net income available to common shareholders by the weighted-average number of common shares outstanding during the period. Diluted EPS is calculated using the weighted-average number of common shares and dilutive potential common shares outstanding during the period. In computing diluted EPS, the average stock price for the period is used in determining the number of shares assumed to be purchased with the proceeds from the exercise of stock options under the treasury stock method.
The Company’s calculation of weighted-average number of common shares includes Class A and Class B common stock. All shares of Class A and Class B common stock entitle the holders thereof to the same rights, preferences, and privileges in respect of dividends.
A reconciliation of the numerators and denominators for the basic and diluted EPS computations is as follows:
| (In thousands, except share and per share amounts) |
For the fiscal year ended June 28, 2014 |
For the fiscal year ended June 29, 2013 |
For the fiscal year ended June 30, 2012 |
|||||||||
| Numerator: |
||||||||||||
| Net Income |
$ | 15,504 | $ | 8,395 | $ | 21,019 | ||||||
|
|
|
|
|
|
|
|||||||
| Denominator: |
||||||||||||
| Weighted-average common shares outstanding |
179,110,211 | 179,102,280 | 179,025,738 | |||||||||
| Dilutive effect of share-based awards |
1,370,870 | 1,224,587 | 855,356 | |||||||||
|
|
|
|
|
|
|
|||||||
| Weighted-average dilutive shares outstanding |
180,481,081 | 180,326,867 | 179,881,094 | |||||||||
|
|
|
|
|
|
|
|||||||
| Basic earnings per share |
$ | 0.09 | $ | 0.05 | $ | 0.12 | ||||||
|
|
|
|
|
|
|
|||||||
| Diluted earnings per share |
$ | 0.09 | $ | 0.05 | $ | 0.12 | ||||||
|
|
|
|
|
|
|
|||||||
18. Stock Compensation
The Performance Food Group Company 2007 Management Option Plan (the “2007 Option Plan”) allows for the granting of awards to current and future employees, officers, directors, consultants, and advisors, of the Company or its affiliates in the form of nonqualified options. The 2007 Option Plan is designed to promote long-term growth and profitability of the Company by providing employees and consultants who are or will be involved in the Company’s growth with an opportunity to acquire an ownership interest in the Company, thereby encouraging them to contribute to and participate in the success of the Company. The terms and conditions of awards granted under the 2007 Option Plan are determined by the Board of Directors. All current awards have a contractual term of ten years.
F-35
Table of Contents
The 2007 Option Plan has repurchase rights that generally allow the Company to repurchase shares, at the current fair value following a participant’s retirement or a participant’s termination of employment by the Company other than for “cause” and at the lower of the original exercise price or current fair value following any termination of employment by the Company for “cause,” resignation of the participant, or in the event a participant resigns due to retirement and subsequently breaches the non-competition or non-solicitation covenant within one year of such participant’s termination. There are 13,290,684 shares of Class B non-voting stock reserved for issuance under the 2007 Option Plan and 1,278,141 options available for issuance as of June 28, 2014.
The compensation cost that has been charged against income for the Company’s 2007 Incentive Plan was $0.7 million, $1.1 million and $1.1 million for the years ended June 28, 2014, June 29, 2013, and June 30, 2012, respectively, and it is included within operating expenses in the consolidated statement of operations. These costs relate to the service condition component of the awards and are being recognized on a straight-line basis. The Company recorded no tax benefit nor incurred an impact on its cash flows related to compensation cost on share-based payment arrangements for the year ended June 28, 2014. The total remaining unrecognized compensation cost was $5.5 million as of June 28, 2014 and is expected to be recognized over a weighted average period of 11.62 years. Because of the existence of the repurchase rights, the weighted average service period exceeds the contractual term of the options.
The weighted average fair value of options granted during fiscal 2014, fiscal 2013, and fiscal 2012 was $1.65, $1.15, and $1.08, respectively. The weighted average fair value of all options granted for the life of the Plan was $2.90. The Black-Scholes option pricing model was used with the following weighted average assumptions:
| For the fiscal year ended June 28, 2014 |
For the fiscal year ended June 29, 2013 |
For the fiscal year ended June 30, 2012 |
||||||||||
| Risk-free interest rate |
2.76 | % | 1.74 | % | 1.97 | % | ||||||
| Dividend yield |
4.88 | % | 2.83 | % | 2.24 | % | ||||||
| Expected volatility factor |
38.00 | % | 29.70 | % | 18.11 | % | ||||||
| Expected option term (in years) |
10 | 10 | 10 | |||||||||
The risk-free rate for the expected term of the option is based on the U.S. Treasury yield curve in effect at the time of grant. The Company assumed a dividend yield for all current year grants based on the historical payment of its dividend over prior fiscal years. Expected volatility is based on the expected volatilities of comparable peer companies that are publicly traded for similar option terms. The expected term represents the period of time that options granted are expected to be outstanding. The expected option term for the 2007 Option Plan is the contractual term since the weighted average requisite service period exceeds the contractual term.
F-36
Table of Contents
A summary of the Company’s stock option activity for fiscal 2014, fiscal 2013, and fiscal 2012 is as follows:
| Number of Options |
Weighted Average Exercise Price(1) |
|||||||
| Options outstanding as of July 2, 2011 |
11,229,430 | $ | 3.05 | |||||
| Options granted |
593,000 | $ | 5.03 | |||||
| Options exercised |
— | — | ||||||
| Options forfeited |
(84,180 | ) | $ | 2.65 | ||||
|
|
|
|||||||
| Options outstanding as of June 30, 2012 |
11,738,250 | $ | 3.26 | |||||
|
|
|
|||||||
| Options granted |
560,000 | $ | 6.03 | |||||
| Options exercised |
(2,500 | ) | $ | 3.72 | ||||
| Options forfeited |
(299,571 | ) | $ | 3.59 | ||||
|
|
|
|||||||
| Options outstanding as of June 29, 2013 |
11,996,179 | $ | 3.38 | |||||
|
|
|
|||||||
| Options granted |
355,132 | $ | 6.81 | |||||
| Options exercised |
(17,399 | ) | $ | 3.43 | ||||
| Options forfeited |
(349,905 | ) | $ | 3.94 | ||||
|
|
|
|||||||
| Options outstanding as of June 28, 2014 |
11,984,007 | $ | 3.47 | |||||
|
|
|
|||||||
| (1) | Weighted average exercise price has been adjusted retroactively to reflect the reduction in the exercise price for dividends paid (see Note 8). |
There were 3.9 million options vested or expected to vest as of June 28, 2014 at a weighted average price of $3.47 per share. There were 3.4 million options exercisable as of June 28, 2014 at a weighted average price of $3.18 per share. The remaining contractual life of the options outstanding as of June 28, 2014 was 4.89 years.
19. Segment Information
The Company has three reportable segments, as defined by the accounting literature related to disclosures about segments of an enterprise. The Performance Foodservice segment markets and distributes food and food-related products to Street restaurants, Chain restaurants, and other institutional “food-away-from-home” locations. The PFG Customized segment principally serves the family and casual dining channel but also serves fine dining, fast casual, and quick serve restaurant chains. The Vistar segment distributes candy, snack, beverage, and other products to customers in the vending, office coffee services, theater, retail, and other channels. The accounting policies of the segments are the same as those described in Note 2. Intersegment sales represent sales between the segments, which are eliminated in consolidation. Management evaluates the performance of each operating segment based on various operating and financial metrics, including total sales and EBITDA. For PFG Customized, EBITDA includes certain allocated corporate charges that are included in operating expenses. The allocated corporate charges are determined based on a percentage of total sales. This percentage is reviewed on a periodic basis to ensure that the segment is allocated a reasonable rate of corporate expenses based on their use of corporate services.
Corporate & All Other is comprised of corporate overhead and certain operations that are not considered separate reportable segments based on their size. This includes the operations of the Company’s internal logistics unit responsible for managing and allocating inbound logistics revenue and expense.
F-37
Table of Contents
| (In thousands) |
PFS | PFG Customized |
Vistar | Corporate & All Other |
Eliminations | Consolidated | ||||||||||||||||||
| For fiscal year ended June 28, 2014 |
||||||||||||||||||||||||
| Net external sales |
$ | 8,098,281 | $ | 3,300,464 | $ | 2,266,375 | $ | 20,584 | $ | — | $ | 13,685,704 | ||||||||||||
| Inter-segment sales |
5,531 | 516 | 2,639 | 136,927 | (145,613 | ) | — | |||||||||||||||||
| Total sales |
8,103,812 | 3,300,980 | 2,269,014 | 157,511 | (145,613 | ) | 13,685,704 | |||||||||||||||||
| EBITDA |
207,538 | 37,532 | 88,304 | (84,363 | ) | — | 249,011 | |||||||||||||||||
| Depreciation and amortization |
81,702 | 15,097 | 13,849 | 22,052 | — | 132,700 | ||||||||||||||||||
| Capital expenditures |
38,782 | 12,166 | 20,677 | 19,000 | — | 90,625 | ||||||||||||||||||
|
|
|
|
|
|
|
|
|
|
|
|
|
|||||||||||||
| For fiscal year ended June 29, 2013 |
||||||||||||||||||||||||
| Net external sales |
$ | 7,498,692 | $ | 3,162,778 | $ | 2,138,708 | $ | 26,334 | $ | — | $ | 12,826,512 | ||||||||||||
| Inter-segment sales |
5,583 | 1,651 | 2,414 | 119,603 | (129,251 | ) | — | |||||||||||||||||
| Total sales |
7,504,275 | 3,164,429 | 2,141,122 | 145,937 | (129,251 | ) | 12,826,512 | |||||||||||||||||
| EBITDA |
173,910 | 37,348 | 81,421 | (59,289 | ) | — | 233,390 | |||||||||||||||||
| Depreciation and amortization |
74,744 | 15,007 | 13,854 | 16,460 | — | 120,065 | ||||||||||||||||||
| Capital expenditures |
27,281 | 4,857 | 12,971 | 21,374 | — | 66,483 | ||||||||||||||||||
|
|
|
|
|
|
|
|
|
|
|
|
|
|||||||||||||
| For fiscal year ended June 30, 2012 |
||||||||||||||||||||||||
| Net external sales |
$ | 6,696,809 | $ | 2,912,351 | $ | 1,871,174 | $ | 25,558 | $ | — | $ | 11,505,892 | ||||||||||||
| Inter-segment sales |
6,446 | 638 | 5,703 | 85,691 | (98,478 | ) | — | |||||||||||||||||
| Total sales |
6,703,255 | 2,912,989 | 1,876,877 | 111,249 | (98,478 | ) | 11,505,892 | |||||||||||||||||
| EBITDA |
178,419 | 39,459 | 57,924 | (63,282 | ) | — | 212,520 | |||||||||||||||||
| Depreciation and amortization |
65,150 | 14,935 | 9,206 | 13,011 | — | 102,302 | ||||||||||||||||||
| Capital expenditures |
34,718 | 5,995 | 15,720 | 12,493 | — | 68,926 | ||||||||||||||||||
|
|
|
|
|
|
|
|
|
|
|
|
|
|||||||||||||
Total assets by reportable segment, excluding intercompany receivables between segments, are as follows:
| (In thousands) |
As of June 28, 2014 |
As of June 29, 2013 |
||||||
| PFS |
$ | 1,853,647 | $ | 1,781,386 | ||||
| PFG Customized |
640,967 | 572,496 | ||||||
| Vistar |
501,301 | 456,131 | ||||||
| Corporate & All Other |
243,872 | 245,386 | ||||||
|
|
|
|
|
|||||
| Total assets |
$ | 3,239,787 | $ | 3,055,399 | ||||
|
|
|
|
|
|||||
F-38
Table of Contents
The sales mix for the Company’s principal product and service categories is as follows:
| (In millions) |
For the fiscal year ended June 28, 2014 |
For the fiscal year ended June 29,2013 |
For the fiscal year ended June 30, 2012 |
|||||||||
| Center of the plate |
$ | 4,226 | $ | 3,895 | $ | 3,479 | ||||||
| Canned and dry groceries |
1,953 | 1,890 | 1,718 | |||||||||
| Frozen foods |
1,795 | 1,724 | 1,507 | |||||||||
| Refrigerated and dairy products |
1,804 | 1,612 | 1,526 | |||||||||
| Paper products and cleaning supplies |
1,047 | 980 | 921 | |||||||||
| Beverage |
1,065 | 1,045 | 983 | |||||||||
| Candy |
601 | 552 | 454 | |||||||||
| Snack |
519 | 505 | 404 | |||||||||
| Produce |
449 | 411 | 333 | |||||||||
| Theater and concession |
129 | 121 | 123 | |||||||||
| Merchandising and other services |
98 | 92 | 58 | |||||||||
|
|
|
|
|
|
|
|||||||
| Total |
$ | 13,686 | $ | 12,827 | $ | 11,506 | ||||||
|
|
|
|
|
|
|
|||||||
20. Subsequent Events
No events have occurred subsequent to June 28, 2014 through September 9, 2014, the date the financial statements were available to be issued, requiring adjustment to or disclosure in the consolidated financial statements and accompanying notes.
F-39
Table of Contents
SCHEDULE 1 – Registrant’s Condensed Financial Statements
PERFORMANCE FOOD GROUP COMPANY
Parent Company Only
CONDENSED BALANCE SHEETS
|
|
||||||||
| ($ in thousands) | As of June 28, 2014 |
As of June 29, 2013 |
||||||
|
|
||||||||
| ASSETS |
||||||||
| Current assets: |
||||||||
| Cash |
$ | – | $ | – | ||||
| Income tax receivable |
4,796 | 3,139 | ||||||
|
|
||||||||
| Total current assets |
4,796 | 3,139 | ||||||
| Investment in wholly owned subsidiary |
444,884 | 428,699 | ||||||
|
|
||||||||
| Total assets |
$ | 449,680 | $ | 431,838 | ||||
|
|
||||||||
| LIABILITIES AND SHAREHOLDERS’ EQUITY |
||||||||
| Intercompany payable |
20,533 | 16,088 | ||||||
|
|
||||||||
| Total liabilities |
20,533 | 16,088 | ||||||
|
|
||||||||
| Commitments and contingencies |
||||||||
| Shareholders’ equity: |
||||||||
| Common Stock |
||||||||
| Class A: $0.01 par value per share, 250,000,000 shares authorized; 179,093,943 shares issued and outstanding as of June 28, 2014 and June 29, 2013 |
1,791 | 1,791 | ||||||
| Class B: $0.01 par value per share, 25,000,000 shares authorized; 27,914 and 10,515 shares issued and outstanding as of June 28, 2014 and June 29, 2013, respectively |
– | – | ||||||
| Additional paid-in capital |
587,360 | 587,300 | ||||||
| Accumulated deficit |
(160,004 | ) | (173,341 | ) | ||||
|
|
||||||||
| Total shareholders’ equity |
429,147 | 415,750 | ||||||
|
|
||||||||
| Total liabilities and shareholders’ equity |
$ | 449,680 | $ | 431,838 | ||||
|
|
||||||||
See accompanying notes to condensed financial statements.
F-40
Table of Contents
PERFORMANCE FOOD GROUP COMPANY
Parent Company Only
CONDENSED STATEMENTS OF OPERATIONS AND COMPREHENSIVE INCOME
|
|
||||||||||||
| ($ in thousands) | Fiscal year ended June 28, 2014 |
Fiscal year ended June 29, 2013 |
Fiscal year ended June 30, 2012 |
|||||||||
|
|
||||||||||||
|
Operating expenses |
$4,505 | $4,529 | $3,587 | |||||||||
|
|
||||||||||||
| Operating loss |
(4,505 | ) | (4,529 | ) | (3,587 | ) | ||||||
| Income tax (benefit) expense |
(1,657 | ) | (1,585 | ) | 328 | |||||||
|
|
||||||||||||
| Loss before equity in net income of subsidiary |
(2,848 | ) | (2,944 | ) | (3,915 | ) | ||||||
|
Equity in net income of subsidiary, net of tax |
$18,352 | $11,339 | $24,934 | |||||||||
|
|
||||||||||||
| Net income |
15,504 | 8,395 | 21,019 | |||||||||
|
Other comprehensive (loss) income |
(2,167 | ) | 5,376 | 4,829 | ||||||||
|
|
||||||||||||
|
Total comprehensive income |
$ 13,337 | $ 13,771 | $ 25,848 | |||||||||
|
|
||||||||||||
See accompanying notes to condensed financial statements.
F-41
Table of Contents
PERFORMANCE FOOD GROUP COMPANY
Parent Company Only
CONDENSED STATEMENTS OF CASH FLOWS
|
|
||||||||||||
| ($ in thousands) |
Fiscal year ended June 28, 2014 |
Fiscal year ended June 29, 2013 |
Fiscal year ended June 30, 2012 |
|||||||||
|
|
||||||||||||
| Cash flows from operating activities: |
||||||||||||
| Net income |
$ | 15,504 | $ | 8,395 | $ | 21,019 | ||||||
| Adjustments to reconcile net income to net cash used in operating activities |
||||||||||||
| Equity in net income of subsidiary |
(18,352 | ) | (11,339 | ) | (24,934 | ) | ||||||
| Dividend received from subsidiary (return on capital) |
– | 26,574 | 913 | |||||||||
| Changes in operating assets and liabilities, net |
||||||||||||
| Intercompany payables |
4,445 | 4,517 | 2,467 | |||||||||
| Income tax receivable |
(1,657 | ) | (1,585 | ) | 328 | |||||||
|
|
||||||||||||
| Net cash (used in) provided by operating activities |
(60 | ) | 26,562 | (207 | ) | |||||||
|
|
||||||||||||
| Cash flows from investing activities: |
||||||||||||
| Dividend received from subsidiary (return of capital) |
– | 193,426 | 99,087 | |||||||||
|
|
||||||||||||
| Net cash provided by investing activities |
– | 193,426 | 99,087 | |||||||||
|
|
||||||||||||
| Cash flows from financing activities: |
||||||||||||
| Proceeds from issuance of common stock |
– | – | 1,165 | |||||||||
| Repurchase of common stock |
– | – | (45 | ) | ||||||||
| Proceeds from exercise of stock options |
60 | 12 | – | |||||||||
| Dividend paid to shareholders |
– | (220,000 | ) | (100,000 | ) | |||||||
|
|
||||||||||||
| Net cash provided by (used in) financing activities |
60 | (219,988 | ) | (98,880 | ) | |||||||
|
|
||||||||||||
| Net (decrease) increase in cash |
– | – | – | |||||||||
| Cash, beginning of period |
– | – | – | |||||||||
|
|
||||||||||||
| Cash, end of period |
$ | – | $ | – | $ | – | ||||||
|
|
||||||||||||
See accompanying notes to condensed financial statements.
F-42
Table of Contents
Notes to Condensed Parent Company Only Financial Statements
1. Description of Performance Food Group Company
Performance Food Group Company (the “Parent”) was incorporated in Delaware on July 23, 2002 to effect the purchase of all the outstanding equity interests of PFGC, Inc. (“PFGC”). The Parent has no significant operations or significant assets or liabilities other than its investment in PFGC. Accordingly, the Parent is dependent upon distributions from PFGC to fund its obligations. However, under the terms of PFGC’s various debt agreements, PFGC’s ability to pay dividends or lend to the Parent is restricted, except that PFGC may pay specified amounts to the Parent to fund the payment of the Parent’s franchise and excise taxes and other fees, taxes, and expenses required to maintain its corporate existence.
2. Basis of Presentation
The accompanying condensed financial statements (parent company only) include the accounts of the Parent and its investment in PFGC, Inc. accounted for in accordance with the equity method, and do not present the financial statements of the Parent and its subsidiary on a consolidated basis. These parent company only financial statements should be read in conjunction with the Performance Food Group Company consolidated financial statements. The Parent is included in the consolidated federal and certain unitary, consolidated and combined state income tax returns with its subsidiaries. The Parent’s tax balances reflect its share of such filings, except for fiscal 2012, which also includes an expense related to provision to return adjustments primarily for net operating losses on a consolidated basis.
3. Dividends from Subsidiaries
The Parent received dividends (defined as a restricted payment in the Senior Secured Credit Facilities) in the amount of $220 million and $100 million from PFGC, Inc. on May 14, 2013 and August 11, 2011, respectively, which has been reflected as a reduction to investment in wholly owned subsidiary in the accompanying condensed financial statements. On those same dates, the Parent declared dividends of $200 million and $100 million to its Class A and Class B shareholders. This dividend has also been reflected as a return of capital in the accompanying condensed financial statements.
F-43
Table of Contents
Shares
Performance Food Group Company
Common Stock
PROSPECTUS
| Credit Suisse | Barclays | |
| Wells Fargo Securities | Morgan Stanley | |
, 2014
Table of Contents
PART II
INFORMATION NOT REQUIRED IN PROSPECTUS
| ITEM 13. | OTHER EXPENSES OF ISSUANCE AND DISTRIBUTION. |
The following table sets forth the expenses payable by the Registrant expected to be incurred in connection with the issuance and distribution of common stock being registered hereby (other than underwriting discounts and commissions). All of such expenses are estimates, except for the Securities and Exchange Commission (the “SEC”) registration fee, the Financial Industry Regulatory Authority Inc. (“FINRA”) filing fee and the filing fee and listing fee.
| SEC registration fee |
$ | 12,880 | ||
| FINRA filing fee |
$ | 15,500 | ||
| filing fee and listing fee |
* | |||
| Printing fees and expenses |
* | |||
| Legal fees and expenses |
* | |||
| Registrar and transfer agent fees |
* | |||
| Accounting fees and expenses |
* | |||
| Miscellaneous expenses |
* | |||
|
|
|
|||
| Total |
* | |||
|
|
|
| * | To be provided by amendment. |
| ITEM 14. | INDEMNIFICATION OF DIRECTORS AND OFFICERS. |
Section 102(b)(7) of the Delaware General Corporation Law (the “DGCL”) allows a corporation to provide in its certificate of incorporation that a director of the corporation will not be personally liable to the corporation or its stockholders for monetary damages for breach of fiduciary duty as a director, except where the director breached the duty of loyalty, failed to act in good faith, engaged in intentional misconduct or knowingly violated a law, authorized the payment of a dividend or approved a stock repurchase in violation of Delaware corporate law or obtained an improper personal benefit. Our amended and restated certificate of incorporation will provide for this limitation of liability.
Section 145 of the DGCL (“Section 145”), provides, among other things, that a Delaware corporation may indemnify any person who was, is or is threatened to be made, party to any threatened, pending or completed action, suit or proceeding, whether civil, criminal, administrative or investigative (other than an action by or in the right of such corporation), by reason of the fact that such person is or was an officer, director, employee or agent of such corporation or is or was serving at the request of such corporation as a director, officer, employee or agent of another corporation or enterprise. The indemnity may include expenses (including attorneys’ fees), judgments, fines and amounts paid in settlement actually and reasonably incurred by such person in connection with such action, suit or proceeding, provided such person acted in good faith and in a manner he or she reasonably believed to be in or not opposed to the corporation’s best interests and, with respect to any criminal action or proceeding, had no reasonable cause to believe that his or her conduct was unlawful. A Delaware corporation may indemnify any persons who were or are a party to any threatened, pending or completed action or suit by or in the right of the corporation by reason of the fact that such person is or was a director, officer, employee or agent of another corporation or enterprise. The indemnity may include expenses (including attorneys’ fees) actually and reasonably incurred by such person in connection with the defense or settlement of such action or suit, provided such person acted in good faith and in a manner he or she reasonably believed to be in or not opposed to the corporation’s best interests, provided further that no indemnification is permitted without judicial approval if the officer, director, employee or agent is adjudged to be liable to the corporation. Where an
II-1
Table of Contents
officer or director is successful on the merits or otherwise in the defense of any action referred to above, the corporation must indemnify him or her against the expenses (including attorneys’ fees) which such officer or director has actually and reasonably incurred.
Section 145 further authorizes a corporation to purchase and maintain insurance on behalf of any person who is or was a director, officer, employee or agent of the corporation or is or was serving at the request of the corporation as a director, officer, employee or agent of another corporation or enterprise, against any liability asserted against such person and incurred by such person in any such capacity, or arising out of his or her status as such, whether or not the corporation would otherwise have the power to indemnify such person under Section 145.
Our amended and restated bylaws will provide that we must indemnify and advance expenses to our directors and officers to the full extent authorized by the DGCL.
The indemnification rights set forth above shall not be exclusive of any other right which an indemnified person may have or hereafter acquire under any statute, any provision of our amended and restated certificate of incorporation, our amended and restated bylaws, agreement, vote of stockholders or disinterested directors or otherwise. Notwithstanding the foregoing, we shall not be obligated to indemnify a director or officer in respect of a proceeding (or part thereof) instituted by such director or officer, unless such proceeding (or part thereof) has been authorized by the Board of Directors pursuant to the applicable procedure outlined in the amended and restated bylaws.
Section 174 of the DGCL provides, among other things, that a director, who willfully or negligently approves of an unlawful payment of dividends or an unlawful stock purchase or redemption, may be held jointly and severally liable for such actions. A director who was either absent when the unlawful actions were approved or dissented at the time may avoid liability by causing his or her dissent to such actions to be entered in the books containing the minutes of the meetings of the Board of Directors at the time such action occurred or immediately after such absent director receives notice of the unlawful acts.
We expect to maintain standard policies of insurance that provide coverage (1) to our directors and officers against loss rising from claims made by reason of breach of duty or other wrongful act and (2) to us with respect to indemnification payments that we may make to such directors and officers.
The underwriting agreement provides for indemnification by the underwriters of us and our officers and directors and the selling stockholders, and by us and the selling stockholders of the underwriters, for certain liabilities arising under the Securities Act or otherwise in connection with this offering.
| ITEM 15. | RECENT SALES OF UNREGISTERED SECURITIES. |
During the fiscal year ended June 30, 2012, we issued 186,400 shares of our Class A common stock to members of our management.
During the fiscal year ended June 29, 2013, we issued 2,500 shares of our Class B common stock to members of our management upon the exercise of stock options granted pursuant to our equity incentive plan.
During the fiscal year ended June 28, 2014, we issued 17,399 shares of our Class B common stock to members of our management upon the exercise of stock options granted pursuant to our equity incentive plan.
All of these shares were issued without registration in reliance on the exemptions afforded by Section 4(a)(2) of the Securities Act and Rule 701 promulgated thereunder.
II-2
Table of Contents
| ITEM 16. | EXHIBITS AND FINANCIAL STATEMENT SCHEDULES. |
(a) Exhibits. See the Exhibit Index immediately following the signature page hereto, which is incorporated by reference as if fully set forth herein.
(b) Financial Statement Schedules. All schedules except Schedule 1 are omitted because the required information is either not present, not present in material amounts or presented within the consolidated financial statements included in the prospectus and are incorporated herein by reference.
| ITEM 17. | UNDERTAKINGS |
(1) Insofar as indemnification for liabilities arising under the Securities Act of 1933 may be permitted to directors, officers and controlling persons of the registrant pursuant to the foregoing provisions, or otherwise, the registrant has been advised that in the opinion of the Securities and Exchange Commission such indemnification is against public policy as expressed in the Securities Act of 1933 and is, therefore, unenforceable. In the event that a claim for indemnification against such liabilities (other than the payment by the registrant of expenses incurred or paid by a director, officer or controlling person of the registrant in the successful defense of any action, suit or proceeding) is asserted by such director, officer or controlling person in connection with the securities being registered, the registrant will, unless in the opinion of its counsel the matter has been settled by controlling precedent, submit to a court of appropriate jurisdiction the question of whether such indemnification by it is against public policy as expressed in the Securities Act of 1933 and will be governed by the final adjudication of such issue.
(2) The undersigned Registrant hereby undertakes that:
| (A) | For purposes of determining any liability under the Securities Act of 1933, the information omitted from the form of prospectus filed as part of this registration statement in reliance upon Rule 430A and contained in a form of prospectus filed by the registrant pursuant to Rule 424(b) (1) or (4) or 497(h) under the Securities Act shall be deemed to be part of this registration statement as of the time it was declared effective. |
| (B) | For the purpose of determining any liability under the Securities Act of 1933, each post-effective amendment that contains a form of prospectus shall be deemed to be a new registration statement relating to the securities offered therein, and the offering of such securities at that time shall be deemed to be the initial bona fide offering thereof. |
II-3
Table of Contents
SIGNATURES
Pursuant to the requirements of the Securities Act of 1933, as amended, the Registrant has duly caused this Registration Statement to be signed on its behalf by the undersigned, thereunto duly authorized, in Richmond, State of Virginia, on the 9th day of September, 2014.
| PERFORMANCE FOOD GROUP COMPANY | ||||
| By: |
/s/ Michael Miller | |||
| Name: | Michael Miller | |||
| Title: | Senior Vice President, General Counsel and Secretary | |||
POWER OF ATTORNEY
Know all men by these presents, that each person whose signature appears below hereby constitutes and appoints Robert D. Evans, Jeffrey Fender and Michael L. Miller, and each of them, any of whom may act without joinder of the other, the individual’s true and lawful attorneys-in-fact and agents, with full power of substitution and resubstitution, for the person and in his or her name, place and stead, in any and all capacities, to sign this Registration Statement and any or all amendments, including post-effective amendments to the Registration Statement, including a prospectus or an amended prospectus therein and any Registration Statement for the same offering that is to be effective upon filing pursuant to Rule 462(b) under the Securities Act, and all other documents in connection therewith to be filed with the Securities and Exchange Commission, granting unto said attorneys-in-fact and agents, and each of them, full power and authority to do and perform each and every act and thing requisite and necessary to be done in and about the premises, as fully to all intents and purposes as he or she might or could do in person, hereby ratifying and confirming all that said attorneys-in-fact as agents or any of them, or their substitute or substitutes, may lawfully do or cause to be done by virtue hereof.
Pursuant to the requirements of the Securities Act of 1933, as amended, this Registration Statement and Power of Attorney have been signed by the following persons in the capacities indicated on the 9th day of September, 2014.
| Signature |
Title | |
| /s/ George L. Holm George L. Holm |
President and Chief Executive Officer; Director (Principal Executive Officer) | |
| /s/ Robert D. Evans Robert D. Evans |
Senior Vice President and Chief Financial Officer (Principal Financial Officer) | |
| /s/ AnnMarie Lobred AnnMarie Lobred |
Director of Financial Reporting (Principal Accounting Officer) | |
| /s/ William F. Dawson Jr. William F. Dawson Jr. |
Director | |
| /s/ Thomas H. Hoffman Thomas H. Hoffman |
Director | |
| /s/ Bruce McEvoy Bruce McEvoy |
Director | |
II-4
Table of Contents
| Signature |
Title | |
| /s/ Prakash A. Melwani Prakash A. Melwani |
Director | |
| /s/ Jeffrey Overly Jeffrey Overly |
Director | |
| /s/ Douglas M. Steenland Douglas M. Steenland |
Chairman of the Board of Directors | |
II-5
Table of Contents
EXHIBIT INDEX
| Exhibit No. |
Description | |||
| 1.1 | * | Form of Underwriting Agreement | ||
| 3.1 | * | Form of Amended and Restated Certificate of Incorporation of the Registrant | ||
| 3.2 | * | Form of Amended and Restated Bylaws of the Registrant | ||
| 5.1 | * | Opinion of Simpson Thacher & Bartlett LLP | ||
| 10.1 | Amended and Restated Credit Agreement, dated May 8, 2012, among Performance Food Group, Inc., PFGC, Inc., and Wells Fargo, National Association, as administrative agent and collateral agent, and the other agents and lenders parties thereto | |||
| 10.2 | First Amendment to Credit Agreement, dated as of May 6, 2013, among Performance Food Group, Inc., PFGC, Inc., the guarantors party thereto, Wells Fargo Bank, N.A., as administrative agent and collateral agent, and the lenders party thereto | |||
| 10.3 | Credit Agreement, dated May 14, 2013, among Performance Food Group Inc., PFGC, Inc., Credit Suisse AG, Cayman Islands Branch, as administrative and collateral agent, Credit Suisse Securities (USA) LLC, Merrill Lynch, Pierce, Fenner & Smith Incorporated, BMO Capital Markets, Barclays Bank PLC, J.P. Morgan Securities LLC, and Wells Fargo Securities LLC, as joint lead arrangers and joint bookrunners, and the other lenders party thereto | |||
| 10.4 | * | Form of Stockholders’ Agreement | ||
| 10.5 | * | Form of Registration Rights Agreement | ||
| 10.6 | *† | 2007 Stock Option Plan | ||
| 10.7 | *† | Form of 2014 Omnibus Incentive Plan | ||
| 10.8 | † | Employment Letter Agreement, dated September 6, 2002, between George L. Holm and Performance Food Group Company (f/k/a Wellspring Distribution Corp.) | ||
| 10.9 | * | Advisory Agreement | ||
| 21.1 | Subsidiaries of the Registrant | |||
| 23.1 | Consent of Deloitte & Touche LLP | |||
| 23.2 | * | Consent of Simpson Thacher & Bartlett LLP (included as part of Exhibit 5.1) | ||
| 24.1 | Power of Attorney (included on signature pages to this Registration Statement) | |||
| * | To be filed by amendment. |
| † | Identifies exhibits that consist of a management contract or compensatory plan or arrangement. |