Attached files
| file | filename |
|---|---|
| 8-K - FORM 8-K - PNC FINANCIAL SERVICES GROUP, INC. | d785270d8k.htm |
 The PNC
Financial Services Group, Inc. Barclays Global Investor Conference
September 9, 2014
Exhibit 99.1 |
 2
Cautionary Statement Regarding Forward-Looking
Information and Adjusted Information
Our presentation includes “snapshot”
information about PNC used by way of illustration. It is not intended as a full business or
financial review and should be viewed in the context of all of the information made
available by PNC in its SEC filings. The presentation also contains forward-looking
statements regarding our outlook for earnings, revenues, expenses, capital and liquidity
levels and ratios, asset levels, asset quality, financial position, and other matters
regarding or affecting PNC and its future business and operations. Forward-looking statements are necessarily subject to numerous
assumptions, risks and uncertainties, which change over time. The forward-looking
statements in this presentation are qualified by the factors affecting
forward-looking statements identified in the more detailed Cautionary Statement included
in the Appendix, which is included in the version of the presentation
materials
posted
on
our
corporate
website
at
www.pnc.com/investorevents,
and
in
our
SEC
filings.
We
provide
greater
detail
regarding
these as well as other factors in our 2013 Form 10-K and our 2014 Form 10-Qs,
including in the Risk Factors and Risk Management sections and in the Legal Proceedings
and Commitments and Guarantees Notes of the Notes To Consolidated Financial Statements in those reports, and in our subsequent
SEC filings. Our forward-looking statements may also be subject to other risks and
uncertainties, including those we may discuss in this presentation or in our SEC
filings, accessible on the SEC’s website at www.sec.gov and on PNC’s corporate website at www.pnc.com/secfilings. We have included web
addresses in this presentation as inactive textual references only. Information on those
websites is not part of this presentation. Future events or circumstances may change
our outlook and may also affect the nature of the assumptions, risks and uncertainties to which our forward-looking
statements are subject. Forward-looking statements in this presentation speak only as of
the date of this presentation. We do not assume any duty and do not undertake to update
those statements. Actual results or future events could differ, possibly materially, from those anticipated in forward-looking
statements, as well as from historical performance.
In
this
presentation,
we
may
sometimes
refer
to
adjusted
results
to
help
illustrate
the
impact
of
certain
types
of
items.
This
information
supplements
our
results as reported in accordance with GAAP and should not be viewed in isolation from, or as
a substitute for, our GAAP results. We believe that this additional
information
and
the
reconciliations
we
provide
may
be
useful
to
investors,
analysts,
regulators
and
others
to
help
evaluate
the
impact
of
these
respective items on our operations. We may also provide information on the components of total
net interest income (purchase accounting accretion and the remainder, which we refer to
as core net interest income), on the impact of purchase accounting accretion on net interest margin (core net interest
margin (net interest margin less annualized purchase accounting accretion divided by average
interest-earning assets)), on pretax pre-provision earnings (total revenue less
noninterest expense), and on tangible book value per common share (calculated based on tangible common shareholders’
equity (common shareholders’
equity less goodwill and other intangible assets, other than servicing rights, net of
deferred tax liabilities on such intangible assets) divided by period-end common
shares outstanding). Where applicable, we provide GAAP reconciliations for such additional
information, including in the slides, the Appendix and/or other slides and materials on our
corporate website at www.pnc.com/investorevents and in our SEC filings. In certain
discussions, we may also provide information on yields and margins for all interest-earning assets calculated using net interest
income on a taxable-equivalent basis by increasing the interest income earned on
tax-exempt assets to make it fully equivalent to interest income earned
on
taxable
investments.
We
believe
this
adjustment
may
be
useful
when
comparing
yields
and
margins
for
all
earning
assets.
We
may
also
use
annualized, pro forma, estimated or third party numbers for illustrative or comparative
purposes only. These may not reflect actual results. This presentation may also include
discussion of other non-GAAP financial measures, which, to the extent not so qualified therein or in the Appendix, is
qualified
by
GAAP
reconciliation
information
available
on
our
corporate
website
at
www.pnc.com
under
“About
PNC–Investor
Relations,”
which
may
include materials from other investor presentations or in our annual, quarterly or current
reports. |
 3
Focused on Executing
Difficult operating environment
Revenue growth challenged
Regulatory compliance costs increasing
Remain focused on acquiring appropriate risk-adjusted assets
Invest and grow our fee income businesses
Enhance our technologies and processes
Maintain capital management discipline
Industry Issues
PNC’s Differentiation |
 % Chg From
All Time High (3)
Variance
(1)
Performance Through the Cycle
Tangible Book Value
Per Common Share
(2)
All Time High
(3)
Closing
Stock Price vs. 9/4/14
Basel I Tier 1 Common
Capital Ratios
(1)
(1)
Source:
The
Board
of
Governors
of
the
Federal
Reserve
System
Dodd-Frank
Act
Stress
Test
(DFAST),
March
2014:
Supervisory
Stress
Test
Methodology
and
Results,
March
2014
(as
corrected).
The
variance
reflects
the
difference
under
the
Federal
Reserve’s
supervisory
stress
test
between
the
Basel
I
Tier
1
common
capital
ratios
reported
as
of
September
30,
2013
and
the
minimum
Basel
I
Tier
1
common
capital
ratio
projected
under
the
supervisory
severely
adverse
scenario
between
the
periods
4Q13
and
4Q15.
Ratios
were
calculated
using
the
capital
action
assumptions
contained
in
the
Federal
Reserve’s
Dodd-Frank
stress
testing
rules.
(2)
See
Note
A,
B
and
PNC
reconciliation
in
Appendix
for
further
details.
PNC's
book
value
per
share
was
$43.60
and
$75.62
at
12/31/07
and
6/30/14,
respectively.
(3)
See
Note
C
in
Appendix
for
further
details.
Performance
through the cycle
Disciplined risk
management
culture
Diverse franchise
Strong capital
management
Strategies to
drive growth
Franchise
Differentiation
% Chg 12/31/07 to 6/30/14
(2) |
 5
Southeast
sales
(1)
+22% CAGR (’12 -’14)
Midwest sales
(2)
+8% CAGR (’09 -’14)
Drive growth in
acquired &
underpenetrated
markets
Capture more
investable assets
Redefine the Retail
Banking business
Build a stronger
Residential Mortgage
business
Bolster infrastructure &
streamline processes
Executing Our Strategic Priorities
Strategic Priorities Update
AUA
(3)
:$300B +10% (2Q14 vs. 2Q13)
Executing according to plan
Increased % of Purchase
(5)
originations to
50% of total originations in 2Q14
Fee income
(4)
+7% (2Q14 vs. 2Q13)
Noninterest expense +0% (2Q14 vs. 2Q13)
(1)
Southeast
markets
defined
as
Alabama,
Georgia,
North
Carolina,
South
Carolina
and
Florida.
Sales
for
total
Corporate
Banking
and
AMG.
AMG
refers
to
Asset
Management
Group.
(2)
Sales
for
total
Corporate
Banking
and
AMG
sales.
(3)
AUA
refers
to
client
assets
under
administration
including
both
AMG
AUA
and
brokerage
assets
of
approximately
$43
billion
for
2Q14
and
$39
billion
for
2Q13
from
Retail
Banking
Brokerage
business.
(4)
Retail
Banking
fee
income
refers
to
noninterest
income
in
the
following
categories:
service
charges
on
deposits,
brokerage,
and
consumer
services.
See
Reconcilement
in
Appendix.
(5)
A
mortgage
with
a
borrower
as
part
of
a
residential
real
estate
purchase
transaction. |
 6
Building Best In Class Technology & Operations
Priorities
Activities
Key Accomplishments
YTD 2014
Establish and demonstrate
ability to recover critical
systems
Strengthening all perimeter
defenses
Implementing scanning and
monitoring capabilities
Refreshing technology
Migrating to new data centers
and infrastructure
Introduced new lean
management systems which
continuously improves
processes
Support scalable businesses and provide additional expense savings to fund investments
Simplify how we work and lower cost of managing our businesses
Deliver greater value to our customers
Reduce operational risk
Developed and began execution
of technology strategy to further
mitigate business continuity and
disaster recovery risks
90% of applications vulnerability
scanned
Expanded security monitoring to
Online banking and PNC.com
Data center location selection and
hosting strategy developed
Onboarding applications
Achieved productivity gains of
20%
Business
Continuity
Infrastructure
Modernization
Cyber Security
Process
Optimization &
Continuous
Improvement
Long-Term Benefits |
 Redefining the
Retail Banking Business Digital Consumer Customers
(1)
Retail Banking Headcount (HC)
12 month change
Investment Professionals
Call Center Sales Reps.
Tellers
Total HC
(June 2013 vs. June 2014)
(1) Digital Consumer Customers represents consumer checking relationships that process the
majority of their transactions through non-teller channels.
Successfully
migrating
customers
to
self-service
–
ATM/Mobile
usage
increasing
2Q13
2Q14
Total deposit transactions |
 Diverse and
Higher Percentage of Noninterest Income 1H14 Noninterest Income Mix
(1)
Includes
net
commercial
mortgage
servicing
rights
valuation
gains.
(2)
Includes
benefit/provision
for
residential
mortgage
repurchase
obligations.
(3)
Other
includes
net
gains
on
sales
of
securities,
net
other-than-temporary
impairments
and
other
income.
Other
income
includes
gain
on
sale
of
a
portion
of
VISA
class
B
common
shares
and
credit
valuations
for
customer-related
derivatives
activities.
Noninterest Income to Total Revenue
8 |
 Branch
reconfiguration Process optimization
Re-engineering mortgage
servicing business
Continued focus on expense
savings initiatives through
CIP
(2)
goal of $500 million
Noninterest Expense Trends
(1)
Focused Expense Management While Investing for
Future Growth
2014 Expense Management
Opportunities
(1)
Prior
period
amounts
have
been
updated
to
reflect
the
first
quarter
2014
adoption
of
Accounting
Standards
Update
(ASU)
2014-01
related to investments in low income housing tax credits. (2) CIP refers to PNC’s
Continuous Improvement Program. Investing for Future Growth
Ongoing CIP
(2)
initiatives
including cost savings from
additional efficiencies should
fund future investments
–
Infrastructure
–
Product and technology
–
Underpenetrated markets
9 |
 10
Balance Sheet Positioned for Rising Rates
Assumptions
(1)
As
of
6/30/2014.
Reflects
the
interest
rate
risk
exposure
on
PNC’s
net
interest
income.
See
2Q14
Form
10-Q
disclosure
for
further
details
on
interest
rate
exposure.
(2)
Reflects
the
percentage
change
in
net
interest
income
in
first
year
as
a
result
of
gradual
100
bps
interest
rate
increase
over
following
twelve
months.
(3)
Reflects
the
percentage
change
in
net
interest
income
in
second
year
as
a
result
of
gradual
100bps
interest
rate
increase
over
preceding
twelve
months.
Net Interest Income Sensitivity
2Q14
(1)
Deposit betas are more
conservative and higher
than historical
Assumes re-investment
yield of 1.54% on
6/30/14 and 2.54% on
6/30/15 on 4 year
average life securities
Yr1
(2)
Yr2
(3)
2Q14 10-Q
2.0%
6.8%
Yr1
Yr2
Yr3
Yr4
Invest $20 billion immediately
$210
$156
$156
156
Invest $20 billion one year forward
-
356
356
356
Impact of delaying investment
($210)
$200
$200
$200
100 Bps Parallel Increase
$ in millions |
 11
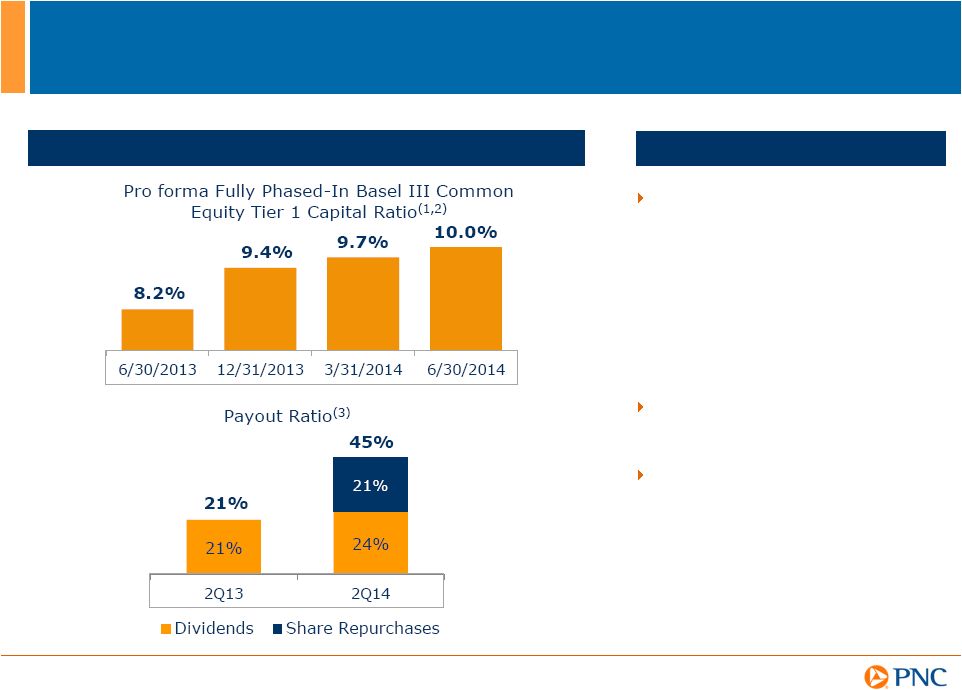
Stronger Capital Position
Capital Position Provides Capital Flexibility
Highlights
Capital priorities:
Increased quarterly common
stock dividend by 9% to $0.48
for 2Q14
Repurchased 2.6 million
common shares for $223
million in 2Q14 under our
capital plan authorization of up
to $1.5 billion of common stock
through 1Q15
(4)
(1) We previously referred to Basel III common equity Tier 1 capital ratio as the Basel III
Tier 1 common capital ratio. (2) Calculated on a pro forma basis without the benefit of the Basel III phase-in
provisions. For 2Q14, 1Q14 and 4Q13, the resulting pro forma fully phased-in Basel III
common equity Tier 1 ratios were calculated based on the standardized approach RWAs. Advanced approaches RWAs
were utilized for 2Q13. See Transitional Basel III and Pro forma
Fully Phased-In Basel III Common Equity Tier 1 Capital Ratios and related information in
the Appendix for further details. (3) Payout ratio refers to amount used to fund common
stock dividends and share repurchases as a percentage of net income. (4) For four quarter period through 1Q15, subject to factors such as market and general
economic conditions, economic capital and regulatory capital conditions, alternative uses of
capital, regulatory and contractual limitations, issuances related to employee benefit
plans and the potential impact on credit ratings.
11
–
Build capital to support client
growth and business
investment
–
Maintain appropriate capital in
light of economic uncertainty
–
Return excess capital to
shareholders, subject to the
CCAR process |
 12
Strategies to Drive Long-Term Potential
Strategic Priorities Update
Long-Term
Potential
(1)
Incremental annual
revenue of $500M
Total investable assets
growth of $100 billion+
Fee income
(2)
growth of
mid to upper single digit
Increase product
penetration to
8%-10%
(3)
Scalable
Drive growth in acquired &
underpenetrated markets
Capture more investable assets
Redefine the Retail Banking
business
Build a stronger Residential
Mortgage business
Bolster infrastructure &
streamline processes
(1)
Refer
to
Cautionary
Statement
in
Appendix,
including
economic
and
other
assumptions.
Does
not
take
into
account
the
impact
of
potential
legal
and
regulatory
contingencies.
(2)
Retail
Banking
fee
income
refers
to
noninterest
income
in
the
following
categories:
service
charges
on
deposits,
brokerage,
and
consumer
services.
(3)
Residential
Mortgage
product
penetration
based
on
cross-sales
to
existing
Retail
Banking
households
with
current
penetration
of
6%. |
 13
Well-Positioned for the Future
Opportunity to grow share in underpenetrated markets
and deepen product penetration
Focused on growing fee income businesses
Creating opportunities to drive positive operating
leverage
Stronger capital provides opportunity to return more
capital to shareholders |
 14
Cautionary Statement Regarding Forward-Looking
Information
Appendix
This presentation includes “snapshot”
information about PNC used by way of illustration and is not intended as a full business or
financial review. It should not be viewed in isolation but rather in the context of all
of the information made available by PNC in its SEC filings. We also make statements in
this presentation, and we may from time to time make other statements, regarding our outlook for earnings,
revenues, expenses, capital and liquidity levels and ratios, asset levels, asset quality,
financial position, and other matters regarding or affecting PNC and its future
business and operations that are forward-looking statements within the meaning of the Private Securities Litigation Reform Act.
Forward-looking statements are typically identified by words such as
“believe,” “plan,”
“expect,”
“anticipate,”
“see,”
“look,”
“intend,”
“outlook,”
“project,”
“forecast,”
“estimate,”
“goal,”
“will,”
“should”
and other similar words and expressions.
Forward-looking statements are subject to numerous assumptions, risks and uncertainties,
which change over time. Forward-looking statements speak only as of the date made.
We do not assume any duty and do not undertake to update forward-looking
statements. Actual results or future events could differ, possibly materially, from
those anticipated in forward-looking statements, as well as from historical
performance. Our forward-looking statements are subject to the following principal
risks and uncertainties. •
Our businesses, financial results and balance sheet values are affected by business and
economic conditions, including the following: –
Changes in interest rates and valuations in debt, equity and other financial markets.
–
Disruptions in the liquidity and other functioning of U.S. and global financial markets.
–
The impact on financial markets and the economy of any changes in the credit ratings of U.S.
Treasury obligations and other U.S. government-backed debt, as well as issues
surrounding the levels of U.S. and European government debt and concerns regarding the
creditworthiness of certain sovereign governments, supranationals and financial
institutions in Europe. –
Actions by the Federal Reserve, U.S. Treasury and other government agencies, including those
that impact money supply and market interest rates.
–
Changes in customers’, suppliers’
and other counterparties’
performance and creditworthiness.
–
Slowing or reversal of the current U.S. economic expansion.
–
Continued residual effects of recessionary conditions and uneven
spread of positive impacts of recovery on the economy and our
counterparties, including adverse impacts on levels of unemployment, loan utilization rates,
delinquencies, defaults and counterparty ability to meet credit and other obligations.
–
Changes in customer preferences and behavior, whether due to changing business and economic
conditions, legislative and regulatory initiatives, or other factors.
•
Our forward-looking financial statements are subject to the risk that economic and
financial market conditions will be substantially different than we are currently
expecting. These statements are based on our current view that the U.S. economic expansion will speed
up to an above trend growth rate near 3.0 percent in the second half of 2014 and that
short-term interest rates will remain very low and bond yields will rise only
slowly in the latter half of 2014. These forward-looking statements also do not, unless otherwise indicated, take
into account the impact of potential legal and regulatory contingencies.
|
 15
Cautionary Statement Regarding Forward-Looking
Information (continued)
Appendix
•
PNC’s ability to take certain capital actions, including paying dividends and any plans
to increase common stock dividends, repurchase common stock under current or future
programs, or issue or redeem preferred stock or other regulatory capital instruments, is
subject to the review of such proposed actions by the Federal Reserve as part of PNC’s
comprehensive capital plan for the applicable period
in
connection
with
the
regulators’
Comprehensive
Capital
Analysis
and
Review
(CCAR)
process
and
to
the
acceptance
of
such
capital plan and non-objection to such capital actions by the Federal Reserve.
•
PNC’s regulatory capital ratios in the future will depend on, among other things, the
company’s financial performance, the scope and terms of final capital regulations
then in effect (particularly those implementing the Basel Capital Accords), and management actions
affecting the composition of PNC’s balance sheet. In addition, PNC’s ability to
determine, evaluate and forecast regulatory capital ratios, and to take actions (such as
capital distributions) based on actual or forecasted capital ratios, will be dependent at least in part
on the development, validation and regulatory approval of related models.
•
Legal and regulatory developments could have an impact on our ability to operate our
businesses, financial condition, results of operations, competitive position,
reputation, or pursuit of attractive acquisition opportunities. Reputational impacts could affect
matters such as business generation and retention, liquidity, funding, and ability to attract
and retain management. These developments could include:
–
Changes resulting from legislative and regulatory reforms, including major reform of the
regulatory oversight structure of the financial services industry and changes to laws
and regulations involving tax, pension, bankruptcy, consumer protection, and other
industry aspects, and changes in accounting policies and principles. We will be impacted by extensive reforms provided
for in the Dodd-Frank Wall Street Reform and Consumer Protection Act (the
“Dodd-Frank Act”) and otherwise growing out of the
most
recent
financial
crisis,
the
precise
nature,
extent
and
timing
of
which,
and
their
impact
on
us,
remains
uncertain.
–
Changes to regulations governing bank capital and liquidity standards, including due to the
Dodd-Frank Act and to Basel- related initiatives.
–
Unfavorable resolution of legal proceedings or other claims and regulatory and other
governmental investigations or other inquiries. In addition to matters relating to
PNC’s current and historical business and activities, such matters may include
proceedings, claims, investigations, or inquiries relating to pre-acquisition business
and activities of acquired companies, such as National City. These matters may result
in monetary judgments or settlements or other remedies, including fines, penalties,
restitution or alterations in our business practices, and in additional expenses and
collateral costs, and may cause reputational harm to PNC.
–
Results of the regulatory examination and supervision process, including our failure to
satisfy requirements of agreements with governmental agencies.
–
Impact on business and operating results of any costs associated
with obtaining rights in intellectual property claimed by others
and of adequacy of our intellectual property protection in general.
|
 16
Cautionary Statement Regarding Forward-Looking
Information (continued)
Appendix
Business and operating results are affected by our ability to identify and effectively manage
risks inherent in our businesses, including, where appropriate, through effective use
of third-party insurance, derivatives, and capital management techniques, and to
meet evolving regulatory capital and liquidity standards. In particular, our results
currently depend on our ability to manage elevated levels of impaired assets.
Business and operating results also include impacts relating to our equity interest in
BlackRock, Inc. and rely to a significant extent
on information provided to us by BlackRock. Risks and uncertainties that could affect
BlackRock are discussed in more detail by BlackRock in its SEC filings.
We grow our business in part by acquiring from time to time other financial services
companies, financial services assets and related deposits and other liabilities.
Acquisition risks and uncertainties include those presented by the nature of the business acquired,
including
in
some
cases
those
associated
with
our
entry
into
new
businesses
or
new
geographic
or
other
markets
and
risks
resulting
from our inexperience in those new areas, as well as risks and uncertainties related to the
acquisition transactions themselves, regulatory issues, and the integration of the
acquired businesses into PNC after closing. Competition can have an impact on customer
acquisition, growth and retention and on credit spreads and product pricing, which can
affect market share, deposits and revenues. Industry restructuring in the current environment
could also impact our business and financial performance through changes in counterparty
creditworthiness and performance and in the competitive and regulatory landscape. Our
ability to anticipate and respond to technological changes can also impact our ability to respond to customer needs
and meet competitive demands.
Business and operating results can also be affected by widespread natural and other disasters,
dislocations, terrorist activities, cyberattacks
or
international
hostilities
through
impacts
on
the
economy
and
financial
markets
generally
or
on
us
or
our
counterparties specifically.
We provide greater detail regarding these as well as other factors in our 2013 Form 10-K
and our 2014 Form 10-Qs, including in the Risk Factors and Risk Management sections
and the Legal Proceedings and Commitments and Guarantees Notes of the Notes To Consolidated
Financial Statements in those reports, and in our subsequent SEC
filings. Our forward-looking statements may also be subject to other
risks
and
uncertainties,
including
those
we
may
discuss
elsewhere
in
this
presentation
or
in
our
SEC
filings,
accessible
on
the
SEC’s website
at www.sec.gov and on our corporate website at www.pnc.com/secfilings. We have included these
web addresses as inactive textual references only. Information on these websites is not
part of this document. Any annualized, pro forma, estimated, third party or consensus
numbers in this presentation are used for illustrative or comparative purposes only and
may not reflect actual results. Any consensus earnings estimates are calculated based on the earnings projections made
by analysts who cover that company. The analysts’
opinions, estimates or forecasts (and therefore the consensus earnings estimates) are
theirs alone, are not those of PNC or its management, and may not reflect PNC’s or other
company’s actual or anticipated results. |
 17
Notes
Appendix
Explanatory Notes
(A) Tangible book value (TBV) per common share calculated based on tangible common
shareholders' equity (common shareholders' equity less goodwill and other intangible
assets, other than servicing rights, net of deferred tax liabilities on such intangible
assets) divided by period-end common shares outstanding. Peer source: SNL Datasource and company
filings. See Appendix for PNC reconciliation.
(B) Tangible book value 12/31/2007 PNC data has not been updated to reflect PNC's first
quarter 2014 adoption of Accounting Standards Update (ASU) 2014-01 related to
investments in low income housing credits. (C) All time high percent change reflects the
difference between the all time high closing stock price using the highest closing
price since 12/31/1989 as reported by SNL DataSource and the 9/4/14 closing price. |
 18
Transitional Basel III and Pro forma Fully Phased-In Basel III
Common Equity Tier 1 Capital Ratios
Appendix
As a result of the staggered effective dates of the final U.S. capital rules issued in July
2013, as well as the fact that PNC remains in the parallel run qualification phase for
the advanced approaches, PNC’s regulatory risk-based capital ratios during
2014 are based on the definitions of, and deductions from, capital under Basel III (as
such definitions and deductions are phased-in for 2014) and Basel I risk-weighted assets (but subject
to certain adjustments as defined by the Basel III rules). We refer to the capital ratios
calculated using these Basel III phased-in provisions and Basel I risk-weighted
assets as the Transitional Basel III ratios. These capital ratios became effective for
PNC on January 1, 2014. We provide information on the next slide regarding PNC’s
Transitional Basel III common equity Tier 1 ratio and PNC’s pro forma fully
phased-in Basel III common equity Tier 1 ratio. We previously referred to the
Basel III common equity Tier 1 ratio as the Basel III Tier 1 common ratio. In addition,
on the next slide we provide information regarding PNC’s Basel I Tier 1 common capital
ratio, which was applicable to PNC through 2013 under the U.S. regulatory capital
rules. Common equity Tier 1 capital as defined under the Basel III rules adopted by the
U.S. banking agencies differs materially from Basel I Tier 1 common capital. For
example, under Basel III, significant common stock investments in unconsolidated
financial institutions, mortgage servicing rights and deferred tax assets must be
deducted from capital to the extent they individually exceed 10%, or in the aggregate
exceed 15%, of the institution’s adjusted common equity Tier 1 capital. Also,
Basel I regulatory capital excludes accumulated other comprehensive income related to
securities currently and previously held as available for sale, as well as pension and other
postretirement plans, whereas under Basel III these items are a component of PNC's
capital. |
 19
Transitional Basel III and Pro forma Fully Phased-In Basel III
Common Equity Tier 1 Capital Ratios
Appendix
Transitional Basel III
Pro forma Fully Phased-In Basel III
Dollars in millions
June 30, 2014
March 31, 2014
June 30, 2014
March 31, 2014
December 31, 2013(a)
June 30, 2013(a)
Common stock, related surplus, and retained earnings, net of treasury stock
$39,380
$38,722
$39,380
$38,722
$38,031
$36,302
Less regulatory capital adjustments:
Goodwill and disallowed intangibles, net of deferred tax liabilities
(8,923)
(8,932)
(9,262)
(9,291)
(9,321)
(9,381)
Basel III total threshold deductions
(216)
(214)
(1,075)
(1,186)
(1,386)
(2,224)
Accumulated other comprehensive income (b)
115
82
576
410
196
(241)
All other adjustments (c)
(5)
(16)
(74)
(106)
(64)
(536)
Common equity Tier 1 capital
30,351
29,642
29,545
28,549
27,456
23,920
Basel I risk-weighted assets calculated in accordance with transition rules for
2014 (d)
277,126
$
273,826
$
N/A
N/A
N/A
N/A
Estimated Basel III standardized approach risk-weighted assets (e)
N/A
N/A
295,217
293,310
291,977
N/A
Estimated Basel III advanced approaches risk-weighted assets (f)
N/A
N/A
290,063
289,441
290,080
290,838
Basel III Common equity Tier 1 capital ratio
11.0%
10.8%
10.0%
9.7%
9.4%
8.2%
Risk-weight and associated rules utilized
Basel I (with 2014
transition
adjustments)
Basel I (with
2014 transition
adjustments)
Standardized
Standardized
Standardized
Advanced
(a) Amounts have not been updated to reflect the first quarter 2014 adoption of ASU 2014-01
related to investments in low income housing tax credits. (b) Represents net adjustments
related to accumulated other comprehensive income for securities currently and previously held as available for sale, as well as
pension and other postretirement plans.
(c) Includes adjustments as required based on whether the standardized approach or advanced
approaches are utilized. (d) Includes credit and market risk-weighted assets.
(e) Basel III standardized approach risk-weighted assets were estimated based on the Basel
III standardized approach rules and include credit and market risk-weighted assets.
(f) Basel III advanced approaches risk-weighted assets were estimated based on the Basel
III advanced approach rules, and include credit, market and operational risk-weighted assets.
2013 Basel I Tier 1 Common Capital Ratios (a) (b)
Dollars in millions
Dec. 31, 2013
Jun. 30, 2013
Basel I Tier 1 common capital
$28,484
$26,668
Basel I risk-weighted assets
272,169
264,750
Basel I Tier 1 common capital ratio
10.5%
10.1%
(a) Effective January 1, 2014, the Basel I Tier 1 common capital ratio no longer applies to PNC
(except for stress testing purposes). Our 2013 Form 10-K included additional
information regarding our Basel I capital ratios. PNC utilizes the pro forma fully
phased-in Basel III capital ratios to assess its capital position (without the benefit of phase-ins), including comparison to similar estimates made by other financial
institutions. Our Basel III capital ratios and estimates may be impacted by additional
regulatory guidance or analysis, and in the case of those ratios calculated using the advanced approaches, the
ongoing evolution, validation and regulatory approval of PNC’s models integral to the
calculation of advanced approaches risk-weighted assets. (b) Amounts have not been
updated to reflect the first quarter 2014 adoption of ASU 2014-01 related to investments in low income
housing tax credits. |
 20
Tangible Book Value per Common Share
Appendix
Tangible Book Value per Common Share Ratio
6/30/14 vs.
12/31/07
Dollars in millions, except per share data
June 30, 2014
Dec. 31, 2007
(a)
Book value per common share (a)
75.62
$
43.60
$
73%
Tangible book value per common share
Common shareholders' equity (a)
40,261
$
14,847
$
Goodwill and Other Intangible Assets (b)
(9,590)
(8,850)
Deferred tax liabilities on Goodwill and Other Intangible Assets (b)
327
594
Tangible common shareholders' equity
30,998
$
6,591
$
Period-end common shares outstanding (in millions)
532
341
Tangible book value per common share (Non-GAAP)
58.22
$
19.36
$
201%
(b) Excludes the impact from mortgage servicing rights of $1.5 billion at June 30, 2014 and
$.7 billion at December 31, 2007. Tangible book value per common share is a non-GAAP
financial measure and is calculated based on tangible common shareholders’ equity
divided by period-end common shares outstanding. We believe this non-GAAP financial measure serves as a
useful tool to help evaluate the strength and discipline of a company's capital management
strategies and as an additional, conservative measure of total company value.
(a) Amounts for the 2007 period have not been updated to reflect the first quarter 2014
adoption of Accounting Standards Update (ASU) 2014-01 related to investments in low
income housing tax credits. % Change |
 21
Non-GAAP to GAAP Reconcilement
Appendix
For the three months ended
$ in millions
June 30, 2014
June 30, 2013
% change
Service charges on deposits
$148
$141
Brokerage
$61
$58
Consumer Services
$248
$229
Total Retail Banking fee income
$457
$428
7%
Other
$84
$114
Total Retail Banking noninterest income, as reported
$541
$542
0%
For the six months ended
$ in millions
June 30, 2014
June 30, 2012
2 year cagr
Asset management
$726
$562
Consumer services
$613
$554
Corporate services
$644
$522
Residential mortgage
$343
$57
Deposit service charges
$303
$271
Total fee income
$2,629
$1,966
16%
Net gains on sales of securities less OTTI
$1
$47
Other
$633
$525
Total noninterest income, as reported
$3,263
$2,538
13% |
 22
Peer Group of Banks
Appendix
The PNC Financial Services Group, Inc.
PNC
BB&T Corporation
BBT
Bank of America Corporation
BAC
Capital One Financial, Inc.
COF
Comerica Inc.
CMA
Fifth Third Bancorp
FITB
JPMorgan Chase
JPM
KeyCorp
KEY
M&T Bank
MTB
Regions Financial Corporation
RF
SunTrust Banks, Inc.
STI
U.S. Bancorp
USB
Wells Fargo & Co.
WFC |