Attached files
| file | filename |
|---|---|
| EX-10.11 - EX-10.11 - ANCHOR BANCORP WISCONSIN INC | d608895dex1011.htm |
| EX-10.13 - EX-10.13 - ANCHOR BANCORP WISCONSIN INC | d608895dex1013.htm |
| EX-10.12 - EX-10.12 - ANCHOR BANCORP WISCONSIN INC | d608895dex1012.htm |
| EX-10.14 - EX-10.14 - ANCHOR BANCORP WISCONSIN INC | d608895dex1014.htm |
| EX-10.9 - EX-10.9 - ANCHOR BANCORP WISCONSIN INC | d608895dex109.htm |
| EX-10.10 - EX-10.10 - ANCHOR BANCORP WISCONSIN INC | d608895dex1010.htm |
| EX-23.1 - EX-23.1 - ANCHOR BANCORP WISCONSIN INC | d608895dex231.htm |
Table of Contents
As filed with the Securities and Exchange Commission on September 8, 2014
Registration No. 333-192964
UNITED STATES
SECURITIES AND EXCHANGE COMMISSION
WASHINGTON, D.C. 20549
Amendment No. 5
to
FORM S-1
REGISTRATION STATEMENT
UNDER
THE SECURITIES ACT OF 1933
ANCHOR BANCORP WISCONSIN INC.
(Exact name of registrant as specified in its charter)
| Delaware | 6712 | 39-1726871 | ||
| (State or Other Jurisdiction of Incorporation or Organization) |
(Primary Standard Industrial Classification Code Number) |
(I.R.S. Employer Identification No.) |
25 West Main Street
Madison, Wisconsin 53703
(608) 252-8700
(Address, Including Zip Code, and Telephone Number, Including Area Code, of Registrant’s Principal Executive Offices)
Mark D. Timmerman, Esq.
Executive Vice President, Secretary and General Counsel
Anchor BanCorp Wisconsin Inc.
25 West Main Street
Madison, Wisconsin 53703
(608) 252-8700
(Name, Address, Including Zip Code and Telephone Number, Including Area Code of Agent for Service)
Copies to:
| Michael J. Zeidel, Esq. Skadden, Arps, Slate, Meagher & Flom LLP Four Times Square New York, New York 10036-6522 (212) 735-3000 |
Jennifer Durham King, Esq. Vedder Price P.C. 222 North LaSalle Street Chicago, Illinois 60601 (312) 609-7500 |
Approximate date of commencement of proposed sale to the public: As soon as practicable after the effective date of this registration statement.
If any of the securities being registered on this Form are to be offered on a delayed or continuous basis pursuant to Rule 415 under the Securities Act of 1933 check the following box: ¨
If this Form is filed to register additional securities for an offering pursuant to Rule 462(b) under the Securities Act, please check the following box and list the Securities Act registration statement number of the earlier effective registration statement for the same offering. ¨
If this Form is a post-effective amendment filed pursuant to Rule 462(c) under the Securities Act, check the following box and list the Securities Act registration statement number of the earlier effective registration statement for the same offering. ¨
If this Form is a post-effective amendment filed pursuant to Rule 462(d) under the Securities Act, check the following box and list the Securities Act registration statement number of the earlier effective registration statement for the same offering. ¨
Indicate by check mark whether the registrant is a large accelerated filer, an accelerated filer, a non-accelerated filer, or a smaller reporting company. See the definitions of “large accelerated filer,” “accelerated filer” and “smaller reporting company” in Rule 12b-2 of the Exchange Act.
| Large accelerated filer | ¨ | Accelerated filer | ¨ | |||
| Non-accelerated filer | ¨ (Do not check if a smaller reporting company) | Smaller reporting company | x | |||
Calculation of Registration Fee
|
| ||||
| Title of Each Class of Securities to be Registered |
Proposed Maximum Aggregate Offering Price(1)(2) |
Amount of Registration Fee | ||
| Common Stock, $0.01 par value per share |
$10,000,000.00 | $1,288.00(3) | ||
|
| ||||
|
| ||||
| (1) | Estimated solely for the purpose of computing the amount of the registration fee pursuant to Rule 457(o) under the Securities Act of 1933, as amended. This amount represents the proposed maximum aggregate offering price of the securities registered hereunder to be sold by the Registrant and selling stockholders. |
| (2) | Includes the shares of common stock the underwriters have the option to purchase to cover over-allotments, if any. |
| (3) | This amount was previously paid in connection with the initial filing of this Registration Statement. |
The Registrant hereby amends this Registration Statement on such date or dates as may be necessary to delay its effective date until the Registrant shall file a further amendment which specifically states that this Registration Statement shall thereafter become effective in accordance with Section 8(a) of the Securities Act of 1933 or until the Registration Statement shall become effective on such date as the Commission, acting pursuant to said Section 8(a), may determine.
Table of Contents
The information in this prospectus is not complete and may be changed. We and the selling stockholders may not sell these securities until the registration statement filed with the Securities and Exchange Commission is effective. This prospectus is not an offer to sell these securities and neither we nor the selling stockholders are soliciting an offer to buy these securities in any state where the offer or sale is not permitted.
Subject to Completion
Preliminary Prospectus dated September 8, 2014
PRELIMINARY PROSPECTUS

Anchor BanCorp Wisconsin Inc.
Shares of Common Stock
This is the initial public offering of Anchor BanCorp Wisconsin Inc.’s shares of common stock following our Recapitalization (as defined herein), and no public market currently exists for our shares. We are offering to sell shares in this offering. The selling stockholders identified in this prospectus are offering to sell shares. We will not receive any of the proceeds from the sale of the shares being sold by the selling stockholders.
It is currently estimated that the initial public offering price per share will be between $ and $ . We have applied to list the shares of our common stock on the NASDAQ Global Market under the symbol “ABCW.”
Investing in our common stock involves a high degree of risk. See “Risk Factors” beginning on page 11 to read about factors you should consider before buying our common stock.
Neither the Securities and Exchange Commission (the “SEC”) nor any other regulatory body has approved or disapproved of these securities or passed upon the adequacy or accuracy of this prospectus. Any representation to the contrary is a criminal offense.
The shares of our common stock that you purchase in this offering will not be savings accounts, deposits or other obligations and are not insured or guaranteed by the Federal Deposit Insurance Corporation or any other governmental agency.
| Per Share | Total | |||||||
| Initial public offering price |
$ | $ | ||||||
| Underwriting discounts(1) |
$ | $ | ||||||
| Proceeds, before expenses, to us |
$ | $ | ||||||
| Proceeds, before expenses, to the selling stockholders |
$ | $ | ||||||
| (1) | We have also agreed to reimburse the underwriters for certain expenses in connection with the offering. See “Underwriting.” |
We and the selling stockholders have granted the underwriters the right to purchase up to an additional shares of common stock at the initial public offering price less the underwriting discounts and commissions to cover over-allotments, if any.
The underwriters expect to deliver the shares of common stock to purchasers against payment in New York, New York on , 2014, subject to customary closing conditions.
| SANDLER O’NEILL + PARTNERS, L.P. | Baird |
The date of this prospectus is , 2014.
Table of Contents
| 1 | ||||
| 11 | ||||
| 29 | ||||
| 31 | ||||
| 32 | ||||
| 34 | ||||
| 35 | ||||
| 37 | ||||
| MANAGEMENT’S DISCUSSION AND ANALYSIS OF FINANCIAL CONDITION AND RESULTS OF OPERATIONS |
42 | |||
| 83 | ||||
| 116 | ||||
| 123 | ||||
| 142 | ||||
| 144 | ||||
| 145 | ||||
| 149 | ||||
| 151 | ||||
| MATERIAL UNITED STATES FEDERAL INCOME TAX CONSEQUENCES TO NON-U.S. HOLDERS |
152 | |||
| 155 | ||||
| 159 | ||||
| 159 | ||||
| 159 | ||||
| F-1 | ||||
Table of Contents
ABOUT THIS PROSPECTUS
You should rely only on the information contained in this prospectus or to which we have referred you. We, the selling stockholders and the underwriters have not authorized anyone to provide you with information that is different. We, the selling stockholders and the underwriters take no responsibility for, and can provide no assurance as to the reliability of, any other information that others may give you. This prospectus may only be used where it is legal to sell the securities being offered by this prospectus. You should not assume that the information contained in, or incorporated by reference into, this prospectus is accurate as of any date other than the date on the front cover of this prospectus.
No action is being taken in any jurisdiction outside the United States to permit a public offering of our securities or possession or distribution of this prospectus in that jurisdiction. Persons who come into possession of this prospectus in jurisdictions outside the United States are required to inform themselves about, and to observe, any restrictions as to the offering and the distribution of this prospectus applicable to those jurisdictions.
MARKET DATA
Market data and other statistical information used in this prospectus are based on independent industry sources and publications, as well as from research reports prepared for other purposes. Industry publications, surveys and forecasts generally state that the information contained therein has been obtained from sources believed to be reliable. None of the independent industry publications referred to in this prospectus were prepared on our or on our affiliates’ behalf or at our expense, and we have not independently verified the data obtained from these sources. Forward-looking information obtained from these sources is subject to the same qualifications and the additional uncertainties as the other forward-looking statements in this prospectus.
Table of Contents
The following summary contains basic information about us and the offering. Because it is a summary, it may not contain all of the information that is important to you. You should read this summary together with the entire prospectus, including our financial statements and the notes to those financial statements and “Management’s Discussion and Analysis of Financial Condition and Results of Operations” included in this prospectus before making an investment decision. See the “Risk Factors” section for a discussion of the risks involved in the offering and investing in our common stock. Unless the context otherwise requires or unless this prospectus otherwise indicates, “Anchor,” “we,” “us,” “our,” the “Company” and similar terms refer to Anchor BanCorp Wisconsin Inc. and its subsidiaries, and the “Bank” refers to our wholly owned bank subsidiary, AnchorBank, fsb.
About Anchor
Anchor BanCorp Wisconsin Inc. is a savings and loan holding company incorporated under the laws of the State of Delaware and headquartered in Madison, Wisconsin. We offer a full range of financial services through the Bank. The Bank offers financial services through 54 full-service banking offices throughout our market area, which is concentrated in the greater Madison, Fox Valley and Milwaukee regions of Wisconsin. We believe that our markets exhibit attractive demographic attributes and present favorable competitive dynamics with long-term growth opportunities. Our strategy focuses on building a strong franchise with meaningful commercial banking market share and growing revenues complemented by operational efficiencies that we believe can produce attractive risk-adjusted returns. As of June 30, 2014 on a consolidated basis, we had total assets of approximately $2.12 billion, total loans of approximately $1.56 billion, total deposits of approximately $1.87 billion, and total stockholders’ equity of approximately $211.5 million.
We are the third largest bank headquartered in Wisconsin, based upon deposit balances as of June 30, 2014 as reported in the consolidated reports of Condition and Income filed with the Federal Financial Institutions Examination Council. We are led by a team of experienced bankers, most of whom have significant experience in the Wisconsin banking markets. The Bank’s core businesses are currently primarily dedicated to providing quality, personalized financial and investment services to local businesses and individuals. Our commercial banking services include cash management, working capital lines of credit, term loans for fixed asset acquisitions, commercial mortgages, other forms of asset-based financing, construction and multi-family mortgage loans, commercial real estate and commercial loans. We also offer a wide range of consumer banking services, including residential mortgage loans, consumer loans, checking and savings accounts, money market and interest-bearing checking accounts, certificates of deposit, and individual retirement accounts. We believe our presence in the markets in which we serve, our local market knowledge and our ability to make responsive decisions at the local level give us the ability to tailor our products and services to meet our client’s specific needs.
As we work to transition the Bank from a traditional mortgage-based lender to a commercially-focused, full service community bank, we continue to seek and recruit seasoned commercial banking talent and transition our corporate culture toward building relationships and pursuing cross-selling opportunities through a sales and service model. Management regularly and periodically evaluates and assesses all aspects of our operations, including retail branch delivery, for opportunities to improve our profitability. In the case of branch delivery, this includes the closure, sale or other disposal of a branch or adding additional branches to the current branch structure.
Our Markets
The Bank’s market area is concentrated in Wisconsin’s greater Madison, Fox Valley and Milwaukee regions. Collectively, these areas account for nearly half of Wisconsin’s population and we believe they provide a desirable platform for long-term local and regional growth. Our headquarters is located in the attractive market of
1
Table of Contents
Madison, Wisconsin, where we have 18 branches within Dane County. Madison is the state capital and home to both state and county governments, as well as the University of Wisconsin-Madison. Dane County has enjoyed steady population growth of 3.2% annually since 2010, a median household income 17.3% above the national average and relatively low unemployment at 4.0% versus the state average of 5.7% and the national average of 6.1% (each as of June 2014), according to the U.S. Census data. Madison was named the eighth best city to raise a family by Parenting Magazine in 2012. Madison was also named America’s 14th Most Recession-Proof City by CNNMoney.com in September of 2010.
We have seven branches located in Wisconsin’s Fox Valley region, consisting primarily of the cities of Appleton and Oshkosh and their associated satellite communities. We also have an additional seven branches in the greater Milwaukee area, one of the largest metropolitan areas in the Midwest and home to approximately 1.6 million people and close to 60,000 businesses according to SNL Financial LC. Our remaining 22 locations are community based locations distributed primarily in counties adjacent to Dane County and the southwestern counties of Wisconsin.
Competitive Strengths
In addition to our presence in these attractive markets, we believe that we are well-positioned to grow our franchise and create value for our stockholders as a result of the following competitive strengths:
| • | Experienced and respected management team with a proven track record. Our President and Chief Executive Officer Chris Bauer joined us in 2009 and recruited an executive management team, bringing in highly experienced community bankers with extensive knowledge of the Wisconsin banking market. Each of these executives has significant experience at nationally recognized mid- to large-cap commercial banking institutions. Mr. Bauer has 45 years of financial services experience, with a combined 16 years as bank president at First Wisconsin Bank and Firstar Bank Milwaukee, N.A. |
| • | Strong capital position. At June 30, 2014, we had a 16.12% tier 1 risk-based ratio, a 9.75% tier 1 leverage ratio and a 17.40% total risk-based capital ratio. Our loan to deposit ratio was 83.8% at June 30, 2014. |
| • | Disciplined enterprise-wide and credit risk management. Since 2009, we have invested significantly in our risk management platform in order to provide a consistent approach to identifying, assessing, managing, monitoring and reporting risk across the Company. Our focus both on remediating our classified assets and improving and implementing enhanced credit underwriting and administration over the last five years has enabled us to significantly improve asset quality and create a stable banking platform from which to grow. |
| • | Core funding. A significant component of our franchise is our core deposit base, such as checking and savings deposits, which we use to fund our loans and grow our balance sheet. At June 30, 2014, our total deposits were approximately $1.87 billion, 73.7% of which were core deposits (defined as total deposits excluding certificates of deposit). We seek to cross-sell deposit products at the time of loan origination to our clients as part of our focus on relationship banking in order to provide a stable source of funding. |
Our Business Strategy
Our business strategy centers around the following initiatives:
| • | Balance our franchise by increasing commercial banking relationships and market share. Our primary strategic focus is the transformation of the Bank from a residential/commercial real estate lender and retail-focused savings bank to a service-driven, relationship-based franchise with a focus on building commercial business and with a continued dedication to our retail line of business. We believe there is |
2
Table of Contents
| an underserved base of small and middle market businesses that are interested in banking with a company headquartered in, and with decision-making authority based in, the markets in which we operate. We intend to maintain disciplined growth, a strong credit culture and a relationship-based and community service-focused approach to banking. We continue to recruit seasoned commercial banking talent and transition our corporate culture toward building relationships and pursuing cross-selling opportunities through a sales and service model. |
| • | Expansion of commercial banking services. We plan to increase our commercial banking staff and sales efforts, emphasizing our multi-family and other commercial real estate banking businesses and a comprehensive commercial and industrial (“C&I”) banking program designed to service manufacturing businesses, professional service firms and privately owned businesses and their related business owners. We believe these services are a key component in our transition to a commercial bank. To that end, we added six experienced commercial bankers to our team during the first six months of 2014. |
| • | Continue to improve asset quality. Over the last five years, we have dedicated significant resources to reducing our level of problem assets and improving our credit risk function, including implementing comprehensive credit policies, processes and procedures to better manage the loan portfolio and any delinquent and troubled loans. Our non-performing assets have declined by $357.0 million, or 78.4%, from $455.3 million as of March 31, 2010 to $98.3 million as of June 30, 2014. We continue to focus on improving our asset quality and proactively monitoring credit risk. |
| • | Build a scalable and efficient operating model. Management team is focused on sustainable expense control across all lines of business. We continue to make investments in information technology to improve efficiencies and enhance customer service, including upgraded account and data processing systems, improved loan monitoring and quality control systems, as well as upgraded accounting systems and outsourcing when appropriate. In addition, we are implementing an improved cost and profit center reporting system to better assess product and service performance, as well as a sales activity database to better track sales performance and market penetration. |
| • | Focus on generating core deposits. We continue to focus on growing our core deposits to fund our lending and investment opportunities by expanding our marketing efforts and improving product offerings, including a full rebranding effort and execution of an integrated strategic marketing plan. In addition, as part of our focus on relationship banking, we seek to generate increased core deposits from new commercial and commercial real estate lending customers. |
Significant Transactions and Recent Developments
Recapitalization Transactions
As a result of the economic downturn that began in 2008, we experienced significant operating losses beginning in fiscal 2009, significant levels of criticized assets, depleted levels of capital and difficulty in raising additional capital necessary to stabilize the Bank as required by our banking regulators. Also, we owed $183.5 million under a credit facility, which we were unable to repay, and issued $110.0 million of Fixed Rate Cumulative Perpetual Preferred Stock, Series B (the “TARP Preferred Stock”) to the United States Department of the Treasury (the “Treasury”) as part of the Troubled Asset Relief Program (“TARP”) in 2009. In order to facilitate our restructuring and the recapitalization of the Bank, on August 12, 2013 (the “Petition Date”), we filed a voluntary petition for relief (the “Chapter 11 Case”) under the provisions of chapter 11 of title 11 of the United States Code, 11 U.S.C. §§ 101, et seq., in the United States Bankruptcy Court for the Western District of Wisconsin (the “Bankruptcy Court”) to implement a “pre-packaged” plan of reorganization (the “Plan of Reorganization”).
3
Table of Contents
Pursuant to the Plan of Reorganization, the following transactions (collectively, the “Recapitalization”) were consummated on September 27, 2013 (the “Effective Date”):
| • | we entered into stock purchase agreements (the “Investor SPAs”) on August 12, 2013 with certain institutional investors, other private investors and directors and officers of the Company (the “Investors”), pursuant to which we issued and sold our common stock to (i) certain Investors such that each such Investor owns up to 9.9% (the “9.9% Investors”) of the common stock for an aggregate purchase price of $87.8 million, (ii) certain other Investors such that each such Investor owns up to 4.9% of our common stock (the “4.9% Investors”) for an aggregate purchase price of $83.7 million, and (iii) certain directors and officers of the Company for an aggregate purchase price of $3.5 million (collectively, the “Private Placements”). We received gross proceeds of $175.0 million, implying a purchase price of $20 per share after giving effect to the reverse stock split, as a result of the Private Placements and incurred transaction costs of $14.4 million; |
| • | we (i) exchanged the TARP Preferred Stock for 60.0 million shares (adjusted to 300,000 common shares as a result of the reverse stock split) of common stock (the “Treasury Issuance”) and (ii) cancelled a warrant (the “TARP Warrant”) to purchase up to 7,399,103 shares of our pre-recapitalization common stock, par value $0.10 per share (the “Legacy Common Stock”) in its entirety (collectively, the “TARP Exchange”); |
| • | we satisfied all of our obligations under the Amended and Restated Credit Agreement, dated as of June 9, 2008 (the “Credit Agreement”), among us, the lenders from time to time a party thereto (the “Lenders”), and the U.S. Bank National Association (“U.S. Bank”), as administrative agent (the “Administrative Agent”) for the Lenders with a cash payment to the Lenders of $49.0 million (plus expense reimbursement as contemplated by the Credit Agreement) and recognized a gain on extinguishment of debt of $134.5 million; |
| • | we converted from a Wisconsin corporation to a Delaware corporation and filed a certificate of incorporation with the Secretary of State of the State of Delaware (the “Amended Charter”), to, among other things, declassify our board of directors (the “Board”), increase the number of authorized shares of our common stock and preferred stock and adopt certain restrictions on acquisitions and dispositions of our securities; and |
| • | all shares of issued and outstanding legacy Common Stock were cancelled. |
Following the effectiveness of the Plan of Reorganization, the Treasury sold to certain institutional investors (the “Secondary Investors”) all of the shares of common stock delivered to the Treasury in connection with the Treasury Issuance (the “Secondary Treasury Sales”). In connection with the Secondary Treasury Sales, we entered into secondary sale purchaser agreements (the “Secondary SPAs”) with the Secondary Investors pursuant to which we made certain representations and warranties to the Secondary Investors and provided rights to the Secondary Investors similar to the rights provided under the Investor SPAs. As a result of the Secondary Treasury Sales, the Treasury ceased to be our stockholder.
See “Description of Business—Background and Overview of Plan of Reorganization” for more information about the Recapitalization and the related accounting treatment.
Change in Fiscal Year End
On December 18, 2013, the Board approved the change of our fiscal year end from March 31 to December 31, beginning with December 31, 2013. References to any of our previous fiscal years mean the fiscal years ended on March 31. On March 20, 2014, we filed with the SEC a transition report on Form 10-K/T covering the fiscal period beginning on April 1, 2013 through December 31, 2013. In the future, we intend to file annual reports on Form 10-K covering fiscal years ending December 31.
4
Table of Contents
Purchase Agreement to Sell Bank Headquarters
The Bank executed a letter of intent on January 3, 2014 with an unrelated third party to sell the Bank’s main office building located at 25 West Main Street, Madison, Wisconsin, the adjacent surface parking lot immediately behind the main office building at 115 South Carroll Street and the 261-stall parking ramp located at 126 South Carroll Street. A purchase agreement was executed on February 6, 2014 and the sale is expected to close during the fourth quarter of 2014. The Bank will lease a portion of the space after the sale. We expect to record a gain on the sale of the office building for the quarterly period ending December 31, 2014.
C&D Orders and PCA Directive
The Bank’s primary regulator is the Office of the Comptroller of the Currency (the “OCC”). The Federal Reserve is the primary regulator of the Company. On June 26, 2009, the Company and the Bank each consented to the issuance of Orders to Cease and Desist (the “Company Order” and “Bank Order”, respectively, collectively the “C&D Orders”). On August 31, 2010, a Prompt Corrective Action Directive (the “PCA Directive”) was issued for the Bank.
The Company Order required the Company to notify, and in certain cases to obtain the permission of, the Federal Reserve prior to making dividends or capital distributions, incurring debt, making changes to or entering into contracts with directors or executive officers.
The Bank Order required the Bank to notify, or in certain cases obtain the permission of, the OCC prior to increases above a certain threshold in total assets, entering into brokered deposits, making changes to or entering into contracts with directors or executives officers, entering into certain transactions with affiliates or entering into third-party contracts outside the normal course of business and to meet and maintain both a core capital ratio and a total risk-based capital ratio.
On April 2, 2014, the Bank was notified that the Bank Order and the PCA Directive were terminated. On July 31, 2014, the Company was notified that the Company Order was terminated. For more information, see “Description of Business—Background and Overview of Plan of Reorganization.”
Deferred Tax Assets
We have generated considerable deferred tax assets, which consist of net operating loss carry-forwards and certain built-in losses, as of June 30, 2014 of $116.1 million, or $12.83 per share of common stock outstanding. Our ability to use these net operating loss carry-forwards and built-in losses to offset future taxable income will be limited if we experience an “ownership change” as defined in Section 382 of the Internal Revenue Code of 1986, as amended (the “Code”). See “Risk Factors—Our ability to realize the benefit of our deferred tax assets may be materially impaired.”
Subject to certain exceptions, our common stock is subject to transfer restrictions as set forth in our Amended Charter. Until the third anniversary of the Effective Date (the “Expiration Date”), unless approved by the Board in accordance with the procedures set forth in the Amended Charter and subject to certain exceptions for permitted transfers, any attempted transfer of our common stock is prohibited to the extent that, as a result of such transfer (or any series of transfers of which such transfer is a part), either (i) any person or group of persons will own 4.95% or more of the Company (a “5% Stockholder”) or (ii) the ownership interest in the Company of any of our existing 5% Stockholders will be increased. The Expiration Date may be extended in the Board’s discretion until the sixth anniversary of the Effective Date in order to protect the tax attributes of the Company. This provision may limit the ability of the investors to participate in this offering and the ability to resell our shares. See “Description of the Common Stock—Anti-Takeover Considerations and Special Provisions of Our Certificate of Incorporation, Bylaws and Delaware Law—Tax Attribute Preservation Provision.”
5
Table of Contents
Corporate Information
We presently maintain our principal offices at Anchor BanCorp Wisconsin Inc., 25 West Main Street, Madison, Wisconsin 53703 and our general telephone number is (608) 252-8700. Our website address is http://www.anchorbank.com. The contents of our website are not incorporated by reference herein or otherwise a part of this prospectus. We were initially incorporated in 1992 as a Wisconsin corporation for the purpose of becoming a savings and loan holding company for the Bank. On September 25, 2013, we were reincorporated as a Delaware corporation.
6
Table of Contents
THE OFFERING
The summary below describes the principal terms of the common stock and is not intended to be complete. It does not contain all the information that is important to you. For a more detailed description of the terms and conditions of our common stock, please refer to the section entitled “Description of the Common Stock.”
| Common stock offered by us |
shares ( shares if the underwriters exercise their option in full to purchase additional shares). |
| Common stock offered by the selling stockholders |
shares ( shares if the underwriters exercise their option in full to purchase additional shares). |
| Total common stock offered |
shares ( shares if the underwriters exercise their option in full to purchase additional shares). |
| Common stock outstanding after this |
shares ( shares if the underwriters exercise their option in full to purchase additional shares). |
| Use of proceeds |
Our net proceeds from this offering will be approximately $ million (or approximately $ million if the underwriters exercise their option in full to purchase additional shares), assuming an initial public offering price of $ per share, which is the midpoint of the price range set forth on the cover of this prospectus, after deducting underwriting discounts and commissions and estimated offering expenses payable by us. |
| We intend to use the net proceeds from this offering (including any additional proceeds we may receive if the underwriters exercise their option in full to purchase additional shares) for general corporate purposes. |
| We will not receive any proceeds from the sale of shares of our common stock by the selling stockholders. |
| Dividend policy |
We are a legal entity separate and distinct from the Bank. Our principal source of revenue consists of dividends from the Bank. The payment of dividends by the Bank is subject to various regulatory requirements, including a minimum of 30 days’ advance notice to the OCC of any proposed dividend. We have not paid dividends on our common stock since December 31, 2008 and do not intend to pay dividends for the foreseeable future. See “Dividend Policy.” |
| Proposed NASDAQ Global Market symbol |
We have applied to list our common stock on the NASDAQ Global Market under the symbol “ABCW.” |
| Risk factors |
See “Risk Factors” and other information included in this prospectus for a discussion of factors you should carefully consider before deciding to invest in shares of our common stock. |
Except as otherwise indicated, all information in this prospectus assumes the underwriters will not exercise their option to purchase additional shares of common stock from us and certain of the selling stockholders in this offering.
7
Table of Contents
SUMMARY HISTORICAL CONSOLIDATED FINANCIAL DATA
The following tables present our selected historical consolidated financial information. The unaudited consolidated statement of operations and comprehensive income (loss) data and condensed statement of cash flows data for the six months ended June 30, 2014 and 2013 and for the nine months ended December 31, 2012 has been derived from our unaudited condensed consolidated financial statements included in this prospectus. The consolidated statement of operations data for the nine months ended December 31, 2013 and the fiscal years ended March 31, 2013 and 2012 and the consolidated balance sheet data as of December 31, 2013 and March 31, 2013 have been derived from our audited consolidated financial statements included in this prospectus. The unaudited consolidated financial statements have been prepared on the same basis as the audited consolidated financial statements, and, in the opinion of management, include all adjustments necessary for a fair presentation of the information set forth herein. Results for interim periods are not indicative of results to be expected for any other interim period or for a full year. As a result of the Recapitalization, operating results in prior periods are not indicative of results to be expected for any other period.
On December 18, 2013, the Board approved the change of our fiscal year end from March 31 to December 31, beginning with December 31, 2013. References to any of our previous fiscal years mean the fiscal years ended on March 31. On March 20, 2014, we filed with the SEC a transition report on Form 10-K/T covering the fiscal period beginning on April 1, 2013 through December 31, 2013. In the future, we intend to file annual reports on Form 10-K covering fiscal years ending December 31.
The summary historical consolidated financial data should be read in conjunction with the sections entitled “Management’s Discussion and Analysis of Financial Condition and Results of Operations” and “Capitalization,” as well as our consolidated financial statements and the related notes included elsewhere in this prospectus. We have presented certain information in the table below on a non-GAAP basis. We believe that these non-GAAP ratios, when taken together with the corresponding ratios calculated in accordance with GAAP, provide meaningful supplemental information regarding our performance for the periods presented.
Consolidated Statement of Operations Data:
| Six Months Ended June 30, |
Nine Months Ended December 31, |
Fiscal Years Ended March 31, |
||||||||||||||||||||||
| 2014 | 2013 | 2013 | 2012 | 2013 | 2012 | |||||||||||||||||||
| (In thousands, except per share data) | ||||||||||||||||||||||||
| Total interest income |
$ | 38,418 | $ | 43,892 | $ | 62,223 | $ | 77,166 | $ | 99,882 | $ | 127,253 | ||||||||||||
| Total interest expense |
2,241 | 15,655 | 14,117 | 29,503 | 37,399 | 55,329 | ||||||||||||||||||
|
|
|
|
|
|
|
|
|
|
|
|
|
|||||||||||||
| Net interest income |
36,177 | 28,237 | 48,106 | 47,663 | 62,483 | 71,924 | ||||||||||||||||||
| Provision for loan losses |
— | 950 | 275 | 7,058 | 7,733 | 33,887 | ||||||||||||||||||
|
|
|
|
|
|
|
|
|
|
|
|
|
|||||||||||||
| Net interest income after provision for loan losses |
36,177 | 27,287 | 47,831 | 40,605 | 54,750 | 38,037 | ||||||||||||||||||
| Total non-interest income |
13,542 | 16,355 | 159,533 | 38,398 | 45,901 | 49,261 | ||||||||||||||||||
| Total non-interest expense |
45,172 | 63,043 | 95,732 | 99,336 | 135,004 | 124,026 | ||||||||||||||||||
|
|
|
|
|
|
|
|
|
|
|
|
|
|||||||||||||
| Income (loss) before income taxes |
4,547 | (19,401 | ) | 111,632 | (20,333 | ) | (34,353 | ) | (36,728 | ) | ||||||||||||||
| Net income (loss) |
$ | 4,537 | $ | (19,401 | ) | $ | 111,623 | $ | (20,152 | ) | $ | (34,172 | ) | $ | (36,738 | ) | ||||||||
|
|
|
|
|
|
|
|
|
|
|
|
|
|||||||||||||
| Income (loss) per common share(1): |
||||||||||||||||||||||||
| Basic |
$ | 0.50 | $ | (1.25 | ) | $ | 12.18 | $ | (1.44 | ) | $ | (2.27 | ) | $ | (2.37 | ) | ||||||||
| Diluted |
0.50 | (1.25 | ) | 12.18 | (1.44 | ) | (2.27 | ) | (2.37 | ) | ||||||||||||||
| (1) | The calculation of weighted average shares included 21,247,000 shares of Legacy Common Stock outstanding through September 26, 2013 and 9,050,000 shares of common stock outstanding from September 27, 2013 through June 30, 2014. |
8
Table of Contents
Consolidated Balance Sheet Data:
| As of | ||||||||||||
| June 30, 2014 |
December 31, 2013 |
March 31, 2013 |
||||||||||
| (In thousands) | ||||||||||||
| Total assets |
$ | 2,121,249 | $ | 2,112,474 | $ | 2,367,583 | ||||||
|
|
|
|
|
|
|
|||||||
| Allowance for loan losses |
(49,175 | ) | (65,182 | ) | (79,815 | ) | ||||||
| Total loans |
1,556,138 | 1,609,506 | 1,750,358 | |||||||||
| Total deposits |
1,873,240 | 1,875,293 | 2,025,025 | |||||||||
| Total liabilities |
1,909,742 | 1,910,276 | 2,427,447 | |||||||||
| Total stockholders’ equity (deficit) |
211,507 | 202,198 | (59,864 | ) | ||||||||
|
|
|
|
|
|
|
|||||||
| Total liabilities and stockholders’ equity (deficit) |
$ | 2,121,249 | $ | 2,112,474 | $ | 2,367,583 | ||||||
|
|
|
|
|
|
|
|||||||
Other Data (Unaudited):
| Six Months Ended June 30, |
Nine Months Ended December 31, |
Fiscal Year Ended March 31, |
||||||||||||||||||||||
| 2014 | 2013 | 2013 | 2012 | 2013 | 2012 | |||||||||||||||||||
| Performance ratios(1) |
||||||||||||||||||||||||
| Return on average assets |
0.43 | % | (2.53 | )% | 6.54 | % | (0.99 | )% | (1.30 | )% | (1.17 | )% | ||||||||||||
| Return on average equity |
4.41 | (96.77 | ) | 5.51 | (0.89 | ) | (0.99 | ) | (2.38 | ) | ||||||||||||||
| Yield on earning assets |
3.81 | 3.87 | 3.80 | 3.95 | 3.96 | 4.34 | ||||||||||||||||||
| Cost of interest bearing liabilities |
0.24 | 1.36 | 0.86 | 1.48 | 1.45 | 1.79 | ||||||||||||||||||
| Equity to assets ratio |
9.97 | (3.05 | ) | 9.57 | (1.93 | ) | (2.53 | ) | (1.06 | ) | ||||||||||||||
| Interest rate spread |
3.57 | 2.51 | 2.94 | 2.47 | 2.51 | 2.55 | ||||||||||||||||||
| Net interest margin |
3.58 | 2.47 | 2.94 | 2.44 | 2.48 | 2.45 | ||||||||||||||||||
| Loan to deposit ratio(2) |
83.81 | 86.02 | 86.47 | 89.51 | 87.07 | 96.61 | ||||||||||||||||||
| Efficiency Ratio(3) |
90.85 | 144.45 | 46.17 | 125.74 | 134.13 | 142.07 | ||||||||||||||||||
| Asset quality ratios |
||||||||||||||||||||||||
| Non-performing loans to total loans |
2.69 | % | 6.21 | % | 4.22 | % | 7.96 | % | 6.74 | % | 10.28 | % | ||||||||||||
| Non-performing assets to total assets |
4.64 | 7.47 | 6.25 | 9.80 | 8.58 | 11.25 | ||||||||||||||||||
| Allowance for loan losses to total loans |
3.13 | 4.41 | 4.02 | 4.55 | 4.53 | 5.08 | ||||||||||||||||||
| Allowance for loan losses to non-performing loans |
116.62 | 70.93 | 95.16 | 57.23 | 67.19 | 49.45 | ||||||||||||||||||
| Net charge-offs to average loans(1) |
2.03 | 0.99 | 1.18 | 2.25 | 1.97 | 3.14 | ||||||||||||||||||
| Capital ratios |
||||||||||||||||||||||||
| Tangible common equity to tangible assets(4) |
9.97 | % | (7.55 | )% | 9.57 | % | (6.16 | )% | (6.91 | )% | (4.52 | )% | ||||||||||||
| Tier 1 common capital to total risk weighted assets(5) |
16.12 | 7.90 | 15.77 | 8.03 | 7.71 | 7.11 | ||||||||||||||||||
| Tier 1 risk-based capital(5) |
16.12 | 7.90 | 15.77 | 8.03 | 7.71 | 7.11 | ||||||||||||||||||
| Total risk-based capital(5) |
17.40 | 9.21 | 17.07 | 9.33 | 9.02 | 8.42 | ||||||||||||||||||
| Tier 1 leverage(5) |
9.75 | 4.57 | 9.60 | 4.84 | 4.53 | 4.51 | ||||||||||||||||||
| (1) | Annualized. |
| (2) | Calculated using the total unpaid principal balance of loans. |
| (3) | Efficiency ratio is the ratio of non-interest expense to net interest income after provision for loan losses and non-interest income. |
9
Table of Contents
| (4) | Tangible common equity to tangible assets ratio is a non-GAAP financial measure. Tangible common equity is computed as total stockholders’ equity, excluding preferred stock, less intangible assets, and tangible assets are calculated as total assets less intangible assets. We believe that the most directly comparable GAAP financial measure is total stockholders’ equity to assets. |
| (5) | Bank-only capital ratios. |
Non-GAAP Financial Measures
Our accounting and reporting policies conform to accounting principles generally accepted in the United States (“GAAP”) and the prevailing practices in the banking industry. However, we also evaluate our performance based on certain additional metrics. Tangible common equity, tangible assets and tangible common equity to tangible assets ratio are not financial measures recognized under GAAP and, therefore, are considered non-GAAP financial measures.
Management, banking regulators, many financial analysts and other investors use these non-GAAP financial measures to compare the capital adequacy of banking organizations with significant amounts of preferred equity and/or goodwill or other intangible assets. Tangible common equity, tangible assets or related measures should not be considered in isolation or as a substitute for total stockholders’ equity, total assets or any other measure calculated in accordance with GAAP. Moreover, the manner in which we calculate tangible common equity, tangible assets and any other related measures may differ from that of other companies reporting measures with similar names. The following table reconciles, as of the dates set forth below, stockholders’ equity (on a GAAP basis) to tangible common equity and total assets (on a GAAP basis) to tangible assets.
| As of June 30, | As of December 31, | As of March 31, | ||||||||||||||||||||||
| 2014 | 2013 | 2013 | 2012 | 2013 | 2012 | |||||||||||||||||||
| (in thousands) | ||||||||||||||||||||||||
| Total stockholders’ equity (deficit)—GAAP |
$ | 211,507 | $ | (71,389 | ) | $ | 202,198 | $ | (46,622 | ) | $ | (59,864 | ) | $ | (29,550 | ) | ||||||||
| Adjustments |
||||||||||||||||||||||||
| Preferred equity |
— | 105,696 | — | 101,990 | 103,833 | 96,421 | ||||||||||||||||||
| Goodwill and other intangibles |
— | — | — | — | — | — | ||||||||||||||||||
|
|
|
|
|
|
|
|
|
|
|
|
|
|||||||||||||
| Tangible common equity |
$ | 211,507 | $ | (177,085 | ) | $ | 202,198 | $ | (148,612 | ) | $ | (163,697 | ) | $ | (125,971 | ) | ||||||||
|
|
|
|
|
|
|
|
|
|
|
|
|
|||||||||||||
| Total assets—GAAP |
$ | 2,121,249 | $ | 2,344,469 | $ | 2,112,474 | $ | 2,412,379 | $ | 2,367,583 | $ | 2,789,452 | ||||||||||||
| Adjustments |
||||||||||||||||||||||||
| Goodwill and other intangibles |
— | — | — | — | — | — | ||||||||||||||||||
|
|
|
|
|
|
|
|
|
|
|
|
|
|||||||||||||
| Tangible assets |
$ | 2,121,249 | $ | 2,344,469 | $ | 2,112,474 | $ | 2,412,379 | $ | 2,367,583 | $ | 2,789,452 | ||||||||||||
|
|
|
|
|
|
|
|
|
|
|
|
|
|||||||||||||
| Tangible common equity to tangible assets |
9.97 | % | (7.55 | )% | 9.57 | % | (6.16 | )% | (6.91 | )% | (4.52 | )% | ||||||||||||
10
Table of Contents
The shares of our common stock being offered hereby are highly speculative in nature, involve a high degree of risk and should be purchased only by persons who can afford to lose the entire investment. Before purchasing any of the shares of common stock, you should carefully consider the following factors relating to our business, industry and prospects. If any of the following risks actually occurs, our business, financial condition or operation results could be materially adversely affected. In such case, you may lose all or part of your investment. You should carefully consider the risks described below and the other information included in, or incorporated by reference into, this prospectus before investing in our common stock.
Risks Related to Our Business
We may not be able to fully execute on our new business initiatives, which could have a material adverse effect on our financial condition or results of operations.
We are primarily a community-oriented retail bank offering traditional deposit products and have historically focused on residential mortgage lending. However, the current economic environment has made it difficult for us to profitably grow our business. Accordingly, we have been developing strategies to grow other loan categories to diversify earning assets and to increase low cost core deposits, including transforming our business to a relationship-focused commercial bank, the expansion of our commercial banking services and our other business strategies. These strategies include, over time, significantly expanding our business banking operations. Our business banking initiative includes focusing on small and mid-sized businesses, with an emphasis on attracting clients from larger competitors. There are costs, risks and uncertainties associated with the development, implementation and execution of these initiatives, including the investment of time and resources, the possibility that these initiatives will be unprofitable and the risk of additional liabilities associated with these initiatives. In addition, our ability to successfully execute on these new initiatives will depend in part on our ability to attract and retain talented individuals to help manage these initiatives and the existence of satisfactory market conditions that will allow us to profitably grow. Our potential inability to successfully execute these initiatives could have a material adverse effect on our business, financial condition or results of operations.
We have a significant deferred tax asset that may not be fully realized in the future.
Our net deferred tax asset totaled $116.1 million as of June 30, 2014. The ultimate realization of a deferred tax asset is dependent upon the generation of future taxable income during the periods that the related net operating losses and certain recognized built-in losses and net unrealized built-in losses, if any (collectively, “pre-change losses”), may be utilized and is also subject to the rules of Section 382 of the Code, described below. If our estimates and assumptions about future taxable income are not accurate, the value of our deferred tax asset may not be recoverable and our cash flow available to fund operations could be adversely affected. Due to the uncertainty with respect to the recognition of the deferred tax asset, it has been fully reserved.
Our ability to realize the benefit of our deferred tax assets may be materially impaired.
Our ability to use our deferred tax assets to offset future taxable income will be limited if we experience an “ownership change” as defined in Section 382 of the Code. Due to the complexity of Section 382, it is difficult to conclude with certainty at any given point in time whether an “ownership change” has occurred. A corporation that experiences an ownership change will generally be subject to an annual limitation on the use of its pre-change losses equal to the equity value of the corporation immediately before the ownership change (in some cases, reduced by certain capital contributions received in the two years preceding the ownership change), multiplied by the applicable “long-term tax-exempt rate” (a rate that changes monthly and was 3.5% for ownership changes occurring in December 2013). While the Tax Attribute Preservation Provision (as defined below) has been included in our Amended Charter to prohibit and void ab initio future transactions in our common stock that would result in an ownership change, such an ownership change nevertheless could occur in
11
Table of Contents
the future, which likely would have a material adverse effect on our results of operations, financial condition and stockholder value. Any change in applicable law may result in an ownership change. Further, this provision may limit our ability to raise capital by selling shares of our common stock.
The implementation of the Plan of Reorganization could adversely affect our operations going forward.
Although the Plan of Reorganization has become effective, our prior bankruptcy could adversely affect our future operations. Our existing and potential depositors, customers, vendors, suppliers and others with whom we have commercial relationships could discontinue their relationships with us or be more cautious in doing business with us. In addition, the fact that we recently implemented the Plan of Reorganization may adversely affect our ability to enter into or maintain contracts that are critical to our operations and could materially impact our reputation and the value of our brand. Further, the fact that we recently emerged from the Chapter 11 Case may adversely affect our ability to retain our key officers and employees and may make it more difficult to recruit qualified personnel in the future. Any such consequences would likely have a material adverse effect on our business, financial results of operations and the value of our common stock.
We depend on our key officers and employees to continue the implementation of our long-term business strategy and could be harmed by the loss of their services. Management’s ability to retain key officers and employees may change.
We believe that the implementation of our long-term business strategy and future success will depend in large part on the skills of our current senior management team. We believe our senior management team possesses valuable knowledge about and experience in the banking industry and that their knowledge and relationships would be very difficult to replace. Although most of our senior management team has entered into employment agreements with us, they may not complete the term of their employment agreements or renew them upon expiration. Our success also depends on the experience of our branch managers and lending officers and on their relationships with the customers and communities they serve.
Our future operating results also depend in significant part upon our ability to attract and retain qualified management, financial, technical, marketing, sales and support personnel, particularly in respect of the implementation of our business strategy, which may require the recruitment of new personnel in new or expanded business areas. Competition for qualified personnel is intense, and we may not be successful in attracting or retaining qualified personnel. There may be only a limited number of persons with the requisite skills to serve in these positions, and it may be increasingly difficult for us to hire personnel over time. The loss of service of one or more of our key officers and employees, or the inability to recruit and retain qualified personnel in the future, could have an adverse effect on our business, financial condition or operating results and the value of our common stock.
Our allowance for losses on loans may not be adequate to cover probable losses.
The allowance for loan losses (“ALLL”) is established through a provision for loan losses charged to expense. Loans are charged off against the ALLL when we believe that repayment of principal is unlikely. Our level of non-performing loans decreased significantly in the six months ended June 30, 2014, relative to the prior year period.
| • | Our provision for loan losses was zero for the six months ended June 30, 2014, a decrease from $950,000 for the six months ended June 30, 2013. |
| • | Our allowance for loan losses was 116.6% and 95.2% of non-performing loans at June 30, 2014 and December 31, 2013, respectively. |
However, any material declines in the credit worthiness of our customers, real estate market conditions and values, general economic conditions or changes in regulatory policies would likely result in a higher probability that principal on some loans will not be repaid and require us to increase our ALLL. A material increase in ALLL would adversely affect our results of operations and our capital.
12
Table of Contents
The Bank’s business is subject to liquidity risk, and changes in its source of funds may adversely affect our performance and financial condition by increasing its cost of funds.
The Bank’s ability to make loans is directly related to its ability to secure funding. Retail deposits and core deposits are the Bank’s primary source of liquidity. The Bank also relies on advances from the Federal Home Loan Bank of Chicago (the “FHLB of Chicago”) as a funding source. As of June 30, 2014, the Bank had outstanding borrowings from the FHLB of Chicago of $10.0 million. The total maximum credit capacity at the FHLB of Chicago based on the existing stock holding as of June 30, 2014 was $238.8 million, subject to collateral availability. Total credit capacity based on the value of the existing collateral pledged was $470.6 million as of June 30, 2014 after considering other collateral requirements for letters of credit and our participation in the Mortgage Partnership Finance Program of the FHLB of Chicago (“MPF Program”). The Bank has also been granted access to Federal Reserve Bank of Chicago’s discount window, but as of June 30, 2014 the Bank had no borrowings outstanding from this source.
Primary uses of funds include withdrawal of and interest payments on deposits, originations of loans and payment of operating expenses. Core deposits represent a significant source of low-cost funds. Alternative funding sources such as large balance time deposits or borrowings are a comparatively higher-cost source of funds. Liquidity risk arises from the inability to meet obligations when they come due or to manage unplanned decreases or changes in funding sources. Significant fluctuations in core deposit balances may adversely affect our financial condition and results of operations and we face significant competition for core deposits.
Our liquidity is largely dependent upon our ability to receive dividends from the Bank, which accounts for substantially all our revenue and could affect our ability to pay dividends, and we may be unable to generate liquidity from other sources.
We are a separate and distinct legal entity from our subsidiaries, including the Bank. We receive substantially all of our revenue from dividends from the Bank, which we use as the principal source of funds to pay our expenses. Various federal and/or state laws and regulations limit the amount of dividends that the Bank and certain of our non-bank subsidiaries may pay us. Such limits are also tied to the earnings of our subsidiaries. If the Bank does not receive OCC approval or if our subsidiaries’ earnings are not sufficient to make dividend payments to us while maintaining adequate capital levels, our ability to pay our expenses and our business, financial condition or results of operations could be materially and adversely impacted.
Increases in our level of non-performing assets would have an adverse effect on our financial condition and results of operations.
Weakening conditions in the real estate sector have adversely affected, and may continue to adversely affect, our loan and other real estate owned (“OREO”) portfolio. Non-performing assets decreased by $33.7 million to $98.3 million, or 4.6%, of total assets, at June 30, 2014 from $132.0 million, or 6.3%, of total assets, at December 31, 2013. If loans that are currently non-performing further deteriorate, we may need to increase our allowance to cover additional charge-offs. If loans that are currently performing become non-performing, we may need to continue to increase our ALLL if additional losses are anticipated which would have an adverse impact on our financial condition and results of operations. The increased time and expense associated with the work out of non-performing assets and potential non-performing assets also could adversely affect our operations.
Although the Bank has been considered “well capitalized” since the termination of the C&D Orders and the PCA Directive under guidelines for regulatory purposes, we will incur increased premiums for deposit insurance and other potential consequences if we fall below the “adequately capitalized” threshold.
In April 2011, the Federal Deposit Insurance Corporation (the “FDIC”) issued new base assessment rates dependent upon the risk category assigned to an institution. These rates range between five and 45 basis points. The revised assessment criteria is a risk-based determination, rather than solely based on capital levels. Higher insurance premiums may be assessed to institutions that fall in the higher risk categories, which would impact earnings.
13
Table of Contents
Further, if the Bank falls below the “adequately capitalized” threshold, it would be subject to further restrictions on its operations. An FDIC-insured bank may not make a capital distribution (including payment of a dividend) or paying any management fee to its holding company if the bank would thereafter be “undercapitalized.” “Undercapitalized” banks are also subject to growth limitations and are required to submit a capital restoration plan that includes, among other things, a guarantee by the parent holding company that the bank will comply with the plan until the bank has been adequately capitalized on average during each of four consecutive calendar quarters. The aggregate liability of the parent holding company under this guarantee would be limited to the lesser of: (i) an amount equal to 5% of the bank’s total assets at the time it became “undercapitalized;” and (ii) the amount which is necessary (or would have been necessary) to bring the institution into compliance with all capital standards applicable with respect to such institution as of the time it fails to comply with the plan. If we become “undercapitalized,” we may need to take actions to raise capital that could limit our use of our deferred tax asset.
If our investment in the capital stock of the FHLB of Chicago is other than temporarily impaired, our financial condition and results of operations could be materially impaired.
The Bank owns capital stock of the FHLB of Chicago. The capital stock is held to qualify for membership in the Federal Home Loan Bank System and to be eligible to borrow funds under the FHLB of Chicago’s advance program. The aggregate cost and fair value of our FHLB of Chicago capital stock as of June 30, 2014 was $11.9 million, based on its par value. There is no market for the FHLB of Chicago capital stock and, while redemptions may be requested, they are at the discretion of the FHLB of Chicago.
The Bank evaluates the FHLB of Chicago stock for impairment on a regular basis. The determination of whether FHLB of Chicago stock is impaired depends on a number of factors and is based on an assessment of the ultimate recoverability of cost rather than changes in the book value of the shares. If our investment in the capital stock of the FHLB of Chicago were to become other than temporarily impaired, our financial condition and results of operations could be materially affected.
Maintaining or increasing market share depends on market acceptance and regulatory approval of new products and services.
Our success depends, in part, on the ability to adapt products and services to evolving industry and regulatory standards. There is increasing pressure to provide products and services at lower prices. This can reduce net interest income and non-interest income from fee-based products and services. In addition, the widespread adoption of new technologies could require us to make substantial capital expenditures to modify or adapt existing products and services or develop new products and services. We may not be successful in introducing new products and services in response to industry trends or development in technology or those new products may not achieve market acceptance. As a result, we could lose business, be forced to price products and services on less advantageous terms to retain or attract clients, or be subject to cost increases.
Deterioration in the real estate markets or other segments of our loan portfolio could lead to additional losses, which could have a material negative effect on our financial condition and results of operations.
The commercial and residential real estate markets have experienced a variety of difficulties. From 2007 to 2014, commercial real estate values and residential real estate values in markets in the State of Wisconsin in which we do business, have declined 15.0% and 14.0%, respectively. The decline in commercial real estate values was derived from data for multi-family, office, industrial and retail property asking prices per unit or square foot, as appropriate, in the LoopNet Wisconsin Market Trends through April 2014. The decline in residential real estate values through May 2014 was derived using the annual median home sales price as provided by the Wisconsin Realtors Association. Any future declines in real estate values reduce the customer’s borrowing power and the value of the collateral securing the loan. Increases in delinquency levels or declines in real estate values, which cause our borrowers’ loan-to-value ratios to increase, could result in additional charge-offs and provisions for loan losses. This could have a material negative effect on our business and results of operations.
14
Table of Contents
While we attempt to manage the risk from changes in market interest rates, interest rate risk management techniques are not exact. In addition, we may not be able to economically hedge our interest rate risk. A rapid or substantial increase or decrease in interest rates could adversely affect our net interest income and results of operations.
Our earnings and cash flows depend to a great extent upon the level of our net interest income. Net interest income is income that remains after deducting, from total interest income generated by earning assets, the interest expense attributable to the acquisition of the funds required to support earning assets. Interest income from earning assets includes income from loans, investment securities and short-term investments. The amount of interest income is dependent on many factors, including the volume of earning assets, the general level of interest rates, the dynamics of changes in interest rates and the level of nonperforming loans. The cost of funds varies with the amount of funds required to support earning assets, the rates paid to attract and hold deposits, rates paid on borrowed funds and the levels of non-interest-bearing demand deposits and equity capital.
Different types of assets and liabilities are impacted differently, and at different times, by changes in market interest rates. We expect that we will periodically experience “gaps” in the interest rate sensitivities of our assets and liabilities. That means either our interest-bearing liabilities will be more sensitive to changes in market interest rates than our interest earning assets, or vice versa. When interest bearing liabilities mature or reprice more quickly than interest earning assets in a period, an increase in interest rates could reduce net interest income. Similarly, when interest earning assets mature or reprice more quickly than interest bearing liabilities, falling interest rates could reduce net interest income. We are unable to predict changes in market interest rates, which are affected by many factors beyond our control including inflation, recession, unemployment, money supply, domestic and international events, changes in the United States and other financial markets and policies of various governmental and regulatory agencies, particularly the Federal Reserve. Net interest income is not only affected by the level and direction of interest rates, but also by the shape of the yield curve, credit spreads, relationships between interest sensitive instruments and key driver rates, balance sheet growth, client loan and deposit preferences and the timing of changes in these variables. Additionally, an increase in interest rates may, among other things, reduce the demand for loans and our ability to originate loans and decrease loan repayment rates. A decrease in the general level of interest rates may affect us through, among other things, increased prepayments on our loan and mortgage-backed securities portfolios and increased competition for deposits. Accordingly, changes in the level of market interest rates affect our net yield on interest earning assets, loan origination volume, loan and mortgage-backed securities portfolios, and our overall results.
We attempt to manage our risk from changes in market interest rates by adjusting the rates, maturity, repricing, and balances of the different types of interest-earning assets and interest bearing liabilities. Interest rate risk management techniques, however, are not precise, and we may not be able to successfully manage our interest rate risk. As a result, a rapid increase or decrease in interest rates could have an adverse effect on our net interest margin and results of operations.
Since we engage in lending secured by real estate and may be forced to foreclose on the collateral property and own the underlying real estate, we may be subject to the increased costs and risks associated with the ownership of real property, which could have an adverse effect on our business and results of operations.
A significant portion of our loan portfolio is secured by real property. During the ordinary course of business, we may foreclose on and take title to properties securing certain loans, in which case, we are exposed to the risks inherent in the ownership of real estate. The amount that we, as a mortgagee, may realize after a default is dependent upon factors outside of our control, including:
| • | general or local economic conditions; |
| • | environmental cleanup liabilities; |
| • | neighborhood values; |
| • | interest rates; |
15
Table of Contents
| • | real estate tax rates; |
| • | operating expenses of the mortgaged properties; |
| • | supply of and demand for rental units or properties; |
| • | ability to obtain and maintain adequate occupancy of the properties; |
| • | zoning laws; |
| • | governmental rules, regulations and fiscal policies; and |
| • | extreme weather conditions or other natural or man-made disasters. |
Certain expenditures associated with the ownership of real estate, principally real estate taxes and maintenance costs, may also adversely affect our operating expenses.
An interruption in or breach in security of our information systems may result in a loss of customer business.
We rely heavily on communications and information systems to conduct our business. Any failure or interruptions or breach in security of these systems could result in failures or disruptions in our customer relationship management, general ledger, deposits, servicing, or loan origination systems. The occurrence of any failures, interruptions or security breaches of information systems used to process customer transactions could damage our reputation, result in a loss of customer business, subject us to additional regulatory scrutiny, or expose us to civil litigation and possible financial liability, any of which could have a material adverse effect on our financial condition, results of operations and cash flows.
Additionally, we outsource portions of our data processing to third parties. If our third party provider encounters difficulties or if we have difficulty in communicating with such third party, it will significantly affect our ability to adequately process and account for customer transactions, which would significantly affect our business operations. Furthermore, breaches of such third party’s technology may also cause reimbursable loss to our consumer and business customers, through no fault of our own.
Management regularly reviews and updates our internal controls, disclosure controls and procedures, and corporate governance policies and procedures. Any system of controls, however well designed and operated, is based in part on certain assumptions and can provide only reasonable, not absolute, assurances that the objectives of the system are met. Any failure or circumvention of our controls and procedures or failure to comply with regulations related to controls and procedures could have a material adverse effect on our business, results of operations, cash flows and financial condition.
Our regional concentration makes us particularly at risk for changes in economic conditions in our primary market.
Our business is primarily located in Wisconsin. Due to our lack of geographic diversification, we are particularly vulnerable to adverse changes in economic conditions in Wisconsin, and the Midwest more generally. The economic conditions in Wisconsin and the Midwest affect our business, financial condition, results of operations, and future prospects, where adverse economic developments, among other things, could affect the volume of loan originations, increase the level of nonperforming assets, increase the rate of foreclosure losses on loans and reduce the value of our loans and loan servicing portfolio. Any regional or local economic downturn that affects Wisconsin and the Midwest or existing or prospective borrowers or property values in such areas may affect us and our profitability more significantly and more adversely than our competitors whose operations are less geographically concentrated.
16
Table of Contents
Our asset valuations include observable inputs and may include methodologies, estimations and assumptions that are subject to differing interpretations and could result in changes to asset valuations that may materially adversely affect our results of operations or financial condition.
We use estimates, assumptions and judgments when financial assets and liabilities are measured and reported at fair value. Assets and liabilities carried at fair value inherently result in a higher degree of financial statement volatility. Fair values and the information used to record valuation adjustments for certain assets and liabilities are based on quoted market prices and/or other observable inputs provided by independent third-party sources, when available. When such third-party information is not available, we estimate fair value primarily by using cash flows and other financial modeling techniques utilizing assumptions such as credit quality, liquidity, interest rates and other relevant inputs. Changes in underlying inputs, factors, assumptions or estimates in any of the areas underlying our estimates could materially impact our future financial condition and results of operations.
During periods of market disruption, including periods of significantly rising or high interest rates, rapidly widening credit spreads or illiquidity, it may be more difficult to value certain of our assets if trading becomes less frequent and/or market data becomes less observable. There may be certain asset classes that were in active markets with significant observable data that become illiquid due to changes in the current financial environment. In such cases, certain asset valuations may require more subjectivity and management judgment. As such, valuations may include inputs and assumptions that are less observable or require greater estimation. Further, rapidly changing and unprecedented credit and equity market conditions and interest rates could materially impact the valuation of assets as reported within our consolidated financial statements, and the period-to-period changes in value could vary significantly.
We may be required to repurchase mortgage loans or indemnify mortgage loan purchasers as a result of breaches of representations and warranties, borrower fraud, or certain borrower defaults, which could harm our liquidity, results of operations and financial condition.
When we sell mortgage loans we are required to make customary representations and warranties to the purchaser about the mortgage loans and the manner in which they were originated. While we sell mortgage loans with no recourse, our whole loan sale agreements require us to repurchase or substitute mortgage loans in the event we breach any of these representations or warranties. In addition, we may be required to repurchase mortgage loans as a result of borrower fraud. While we have taken steps to enhance our underwriting policies and procedures, these steps do not reduce the risks associated with loans sold prior to the enhancement of such policies and procedures. In addition, a reserve for repurchase of sold loans was established in September 2012 to absorb estimated losses. The balance of the serviced mortgage loan portfolio subject to repurchase was $2.59 billion at June 30, 2014.
Historically, the volume of repurchases and investor reimbursements has been insignificant; however, the volume of repurchases or reimbursements may rise from time to time and our current reserves may not be sufficient to cover our repurchase obligations. Repurchases totaled $648,000 and investor loss reimbursements were $1,000 for the six months ended June 30, 2014. We have recorded a reserve for repurchase of sold loans of $2.4 million as of June 30, 2014. If the level of repurchase and indemnity activity becomes material, our liquidity, results of operations and financial condition could be materially and adversely affected.
Certain provisions in our Amended Charter limit our likelihood of being acquired in a manner not approved by the Board.
In connection with the Plan of Reorganization, on September 25, 2013, we adopted the Amended Charter. In order to protect certain tax attributes of the Company and its subsidiaries following our emergence from bankruptcy, the Amended Charter imposes certain restrictions on the transfer of our common stock (the “Tax Attribute Preservation Provision”). No such provisions were included in the Amended Charter prior to the effectiveness of the Plan of Reorganization.
17
Table of Contents
Until the Expiration Date, unless approved by the Board in accordance with the procedures set forth in the Amended Charter and subject to certain exceptions for permitted transfers, any attempted transfer of our common stock is prohibited and void ab initio to the extent that, as a result of such transfer (or any series of transfers of which such transfer is a part), either (i) any person or group of persons will own 4.95% or more of the Company or (ii) the ownership interest in the Company of any of our existing 5% Stockholders will be increased. The Expiration Date may be extended in the Board’s discretion until the sixth anniversary of the Effective Date in order to protect the tax attributes of the Company.
The existence of the Tax Attribute Preservation Provision may make it more difficult, delay, discourage, prevent or make it more costly to acquire us or effect a change-in-control that is not approved by the Board. This, in turn, could prevent our stockholders from recognizing a gain in the event that a favorable offer is extended and could materially and adversely affect the market price of our common stock.
We may suffer substantial losses due to our agreements to indemnify the Investors and the Secondary Investors against a broad range of potential claims.
In connection with the Investor SPAs and the Secondary SPAs, we agreed to indemnify the Investors and the Secondary Investors, respectively, for a broad range of claims, including any inaccuracies or breaches of our representations and warranties in the Investor SPAs or the Secondary SPAs, as applicable, entered into in connection with the Plan of Reorganization and any losses arising out of or resulting from any legal, administrative or other proceedings arising out of the transactions contemplated by such Investor SPAs or the Secondary SPAs, as applicable, and the terms of the securities offered thereby. While these indemnities are capped at the purchase price applicable to each Investor under their respective Investor SPA, if all or some claims were successfully brought against us, it could potentially result in significant losses for us.
We offer third-party products including mutual funds, annuities, life insurance, individual securities and other wealth management services which could experience significant declines in value subjecting us to reputational damage and litigation risk.
We offer third-party products including mutual funds, annuities, life insurance, individual securities and other wealth management products and services. If these products do not generate competitive risk-adjusted returns that satisfy clients in a variety of asset classes, we will have difficulty maintaining existing business and attracting new business. Additionally, our investment services business involves the risk that clients or others may sue us, claiming that we have failed to perform under a contract or otherwise failed to carry out a duty owed to them. Our investment services businesses are particularly subject to this risk and this risk may be heightened during periods when credit, equity or other financial markets are deteriorating in value or are particularly volatile, or when clients or investors are experiencing losses. Significant declines in the performance of these third-party products could subject us to reputational damage and litigation risk.
Significant legal actions could subject us to substantial uninsured liabilities.
We are from time to time subject to claims related to our businesses. These claims and legal actions, including supervisory actions by our regulators, could involve large monetary damages or penalties and significant defense costs. Substantial legal liability or significant regulatory action against us could have material adverse financial effects or cause significant reputational harm to us, which in turn could seriously harm our business prospects. We may be exposed to substantial uninsured liabilities, which could adversely affect our results of operations and financial condition. See “Description of Business—Legal Proceedings.”
We are exposed to risk of environmental liabilities with respect to properties to which we take title.
In the course of our business, we may own or foreclose and take title to real estate, and could be subject to environmental liabilities with respect to these properties. We may be held liable to a governmental entity or to third parties for property damage, personal injury, investigation and clean-up costs incurred by these parties in connection with environmental contamination, or may be required to investigate or clean up hazardous or toxic
18
Table of Contents
substances, or chemical releases at a property. The costs associated with investigation or remediation activities could be substantial. In addition, as the owner or former owner of a contaminated site, we may be subject to common law claims by third parties based on damages and costs resulting from environmental contamination emanating from the property. If we ever become subject to significant environmental liabilities, our business, financial condition, cash flows, liquidity and results of operations could be materially and adversely affected.
Risks Related to Our Industry
Our business may be adversely affected by the slow economic recovery, current conditions in the financial markets, the real estate market and economic conditions generally.
The slow economic recovery has continued to result in decreased lending by some financial institutions to their customers and to each other. This has continued to result in a lack of customer confidence, increased market volatility and a widespread reduction in general business activity. Competition among financial institutions for deposits and loans continues to be high, and access to deposits or borrowed funds remains lower than average.
The soundness of other financial institutions could materially and adversely affect us.
Our ability to engage in routine funding transactions could be adversely affected by the actions and commercial soundness of other financial institutions. Financial services institutions are interrelated as a result of trading, clearing, counterparty, or other relationships. As a result, defaults by, or even rumors or questions about, one or more financial services institutions, or the financial services industry generally, have led to market-wide liquidity problems and could lead to losses or defaults by us or by other institutions. Many of these transactions expose us to credit risk in the event of default of our counterparty or client. In addition, our credit risk is likely to be exacerbated when the collateral held by us cannot be realized upon or is liquidated at prices not sufficient to recover the full amount of the financial instrument exposure due us. Any losses resulting from such defaults by us, our counterparties or our clients could materially and adversely affect our results of operations.
Competition in the financial services industry is intense and could result in losing business or reducing margins.
We operate in a highly competitive industry that could become even more competitive as a result of legislative, regulatory and technological changes, and continued consolidation. We face aggressive competition from other domestic and foreign lending institutions and from numerous other providers of financial services, some of whom are better funded than us, have a more visible market presence than we do and are significantly larger than us. The ability of non-banking financial institutions to provide services previously limited to commercial banks has intensified competition. Because non-banking financial institutions are not subject to the same regulatory restrictions as banks and bank holding companies, they can often operate with greater flexibility and lower cost structures.
Securities firms and insurance companies that elect to become financial holding companies may acquire banks and other financial institutions. This may significantly change the competitive environment in which we conduct business. Some of our competitors have greater financial resources and/or face fewer regulatory constraints. As a result of these various sources of competition, we could lose business to competitors or be forced to price products and services on less advantageous terms to retain or attract clients, either of which would adversely affect our profitability.
We continually encounter technological change.
The financial services industry is continually undergoing rapid technological change with frequent introductions of new technology-driven products and services. The effective use of technology increases efficiency and enables financial institutions to better serve customers and to reduce costs. Our future success depends, in part, upon our ability to address the needs of our customers by using technology to provide products and services that will satisfy customer demands, as well as to create additional efficiencies in our operations. Many competitors have substantially greater resources to invest in technological improvements. We may not be able to effectively
19
Table of Contents
implement new technology-driven products and services or be successful in marketing these products and services to our customers. Failure to successfully keep pace with technological change affecting the financial services industry could have a material adverse impact on our business and, in turn, our financial condition, results of operations and cash flows.
Risks Related to Recent Market, Legislative and Regulatory Events
We are highly dependent upon programs administered by Fannie Mae, Freddie Mac and Ginnie Mae. Changes in existing U.S. government-sponsored mortgage programs or servicing eligibility standards could materially and adversely affect our business, financial position, results of operations or cash flows.
Our ability to generate revenues through mortgage loan sales to institutional investors in the form of mortgage-backed securities depends to a significant degree on programs administered by Fannie Mae, Freddie Mac, Ginnie Mae and others that facilitate the issuance of mortgage-backed securities in the secondary market. These entities play a powerful role in the residential mortgage industry, and we have significant business relationships with them. Our status as a Fannie Mae and Freddie Mac approved seller/servicer is subject to compliance with each entity’s respective selling and servicing guides.
During the six months ended June 30, 2014 and 2013, 64% and 89%, respectively, of our mortgage loan sales were sold to, or were sold pursuant to programs sponsored by, Fannie Mae or Freddie Mac. We also derive other material financial benefits from our relationships with Fannie Mae and Freddie Mac, including the assumption of credit risk by these entities on loans included in mortgage-backed securities in exchange for our payment of guarantee fees and the ability to avoid certain loan inventory finance costs through streamlined loan funding and sale procedures. Any discontinuation of, or significant reduction or material change in, the operation of these entities or any significant adverse change in the level of activity in the secondary mortgage market or the underwriting criteria of these entities would likely prevent us from originating and selling most, if not all, of our mortgage loan originations.
In addition, we service loans on behalf of Fannie Mae and Freddie Mac, as well as loans that have been securitized pursuant to securitization programs sponsored by Fannie Mae and Freddie Mac in connection with the issuance of agency guaranteed mortgage-backed securities and a majority of our mortgage servicing rights (“MSR”) relate to these servicing activities. These entities establish the base service fee in which to compensate us for servicing loans. In January 2011, the Federal Housing Finance Agency directed Fannie Mae and Freddie Mac to develop a joint initiative to consider alternatives for future mortgage servicing structures and compensation. Under this proposal, the government-sponsored entities (“GSE”) are considering potential structures in which the minimum service fee would be reduced or eliminated altogether. The GSEs are also considering different pricing options for non-performing loans to better align servicer incentives with mortgage-backed securities investors and provide the loan guarantor the ability to transfer non-performing servicing. These proposals, if adopted, could result in changes that impact the entire mortgage industry, possibly reducing capital requirements and increasing competition by lowering barriers to entry on mortgage originations and increasing the concentration of performing loans with larger servicers.
The potential changes to the government-sponsored mortgage programs, and related servicing compensation structures, could require us to fundamentally change our business model in order to effectively compete in the market. Our inability to make the necessary changes to respond to these changing market conditions or loss of our approved seller/servicer status with any of these entities, would have a material adverse effect on our overall business and our consolidated financial position, results of operations and cash flows.
We operate in a highly regulated environment and the laws and regulations that govern our operations, corporate governance, executive compensation and accounting principles, or changes in them, or our failure to comply with them, may adversely affect us.
As a savings and loan holding company and a federal savings association, we and the Bank are subject to extensive regulation, supervision, and legal requirements that govern almost all aspects of our operations.
20
Table of Contents
Intended to protect customers, depositors, the deposit insurance fund (“DIF”), and the overall financial stability of the United States, these laws and regulations, among other matters, prescribe minimum capital requirements, impose limitations on the business activities in which we can engage, limit the dividends or distributions that the Bank can pay to us, restrict the ability of institutions to guarantee our debt, and impose certain specific accounting requirements on us that may be more restrictive and may result in greater or earlier charges to earnings or reductions in our capital than generally accepted accounting principles. Congress and state legislatures and federal and state regulatory agencies continually review banking laws, regulations, and policies for possible changes. Changes to statutes, regulations, or regulatory policies, including interpretation or implementation of statutes, regulations, or policies, could affect us adversely, including limiting the types of financial services and products we may offer and/or increasing the ability of non-banks to offer competing financial services and products. Compliance with laws and regulations can be difficult and costly, and changes to laws and regulations often impose additional compliance costs. Our failure to comply with these laws and regulations, even if the failure follows good faith effort or reflects a difference in interpretation, could subject us to restrictions on our business activities, fines and other penalties, any of which could adversely affect our results of operations, capital base and the price of our securities. Further, any new laws, rules and regulations could make compliance more difficult or expensive or otherwise adversely affect our business and financial condition.
Federal banking agencies periodically conduct examinations of our business, including compliance with laws and regulations, and our failure to comply with any supervisory actions to which we are or become subject as a result of such examinations may adversely affect us.
Federal banking agencies, including the OCC and Federal Reserve, periodically conduct examinations of our business, including compliance with laws and regulations. If, as a result of an examination, a federal banking agency were to determine that the financial condition, capital resources, asset quality, earnings prospects, management, liquidity or other aspects of any of our operations had become unsatisfactory, or that we or the Bank or its management were in violation of any law or regulation, it may take a number of different remedial actions as it deems appropriate. These actions include the power to enjoin “unsafe or unsound” practices, to require affirmative actions to correct any conditions resulting from any violation or practice, to issue an administrative order that can be judicially enforced, to direct an increase in our or the Bank’s capital, to restrict our growth, to assess civil monetary penalties against us, our officers or directors, to remove officers and directors and, if it is concluded that such conditions cannot be corrected or there is an imminent risk of loss to depositors, to terminate the Bank’s deposit insurance.
Regulatory requirements may affect our ability to attract and retain management and directors.
Chris M. Bauer, in addition to being the Chief Executive Officer and a Director of each of the Company and the Bank, is a member of the boards of directors of The Auto Club Group and Auto Club Insurance Association (collectively, “Auto Club”). Auto Club, based in Dearborn, Michigan, operates certain insurance and automobile membership organizations in the mid-west and south-east regions as part of the American Automobile Association, Inc. Mr. Bauer’s dual service with us and Auto Club is permitted by a Federal Reserve exemption under the Depository Institution Management Interlocks Act, which exemption expires on October 21, 2015. If the Federal Reserve does not further extend this exemption, then Mr. Bauer will no longer be permitted to serve simultaneously with both us and Auto Club.
We may not be able to obtain the written approvals described above in a timely manner or at all. If we fail to meet the applicable regulatory requirements, such failure could adversely affect our ability to attract and retain management and directors.
21
Table of Contents
The enactment of the Dodd-Frank Wall Street Reform and Consumer Protection Act of 2010 may have a material effect on our operations.
The Dodd-Frank Wall Street Reform and Consumer Protection Act of 2010 (“Dodd-Frank Act”) was signed into law on July 21, 2010. The Dodd-Frank Act made a number of significant regulatory and compliance changes. The key effects of the Dodd-Frank Act on our business were:
| • | changes to the thrift supervisory structure; |
| • | changes to regulatory capital requirements; |
| • | creation of new government regulatory agencies; |
| • | limitation on federal preemption; |
| • | changes in insured depository institution regulations; and |
| • | mortgage loan origination and risk retention. |
There remains significant uncertainty surrounding the manner in which the provisions of the Dodd-Frank Act will be implemented by the various regulatory agencies and the full extent of the impact of the requirements on our operations is unclear. The changes resulting from the Dodd-Frank Act may impact the profitability of our business activities, require changes to certain of our business practices, impose upon us more stringent capital, liquidity and leverage requirements or otherwise adversely affect our business. These changes may also require us to invest significant management attention and resources to evaluate and make any changes necessary to comply with new statutory and regulatory requirements. Failure to comply with the new requirements or with any future changes in laws or regulations may materially and adversely impact our results of operations and financial condition. For a more detailed description of the Dodd-Frank Act, see “Description of Business—Regulation and Supervision—The Dodd-Frank Act.”
New activities and expansion plans may require regulatory approvals, and failure to obtain them may restrict our growth.
We must generally receive federal regulatory approval before we can acquire an institution or business, or engage in certain activities. In determining whether to approve a proposed acquisition, federal banking regulators will consider, among other factors, the effect of the acquisition on the competition, our financial condition, and our future prospects. The regulators also review current and projected capital ratios and levels, the competence, experience, and integrity of management and its record of compliance with laws and regulations, the convenience and needs of the communities to be served (including the acquiring institution’s record of compliance under the Community Reinvestment Act (the “CRA”)), the effectiveness of the acquiring institution in combating money laundering activities, and the existence of any outstanding enforcement actions. Such regulatory approvals may not be granted on terms that are acceptable to us, or at all. The failure to obtain required regulatory approvals may impact our business plans and restrict our growth.
Financial institutions, such as the Bank, face a risk of noncompliance and enforcement action with the Bank Secrecy Act and other anti-money laundering statutes and regulations.
The federal Bank Secrecy Act, the USA PATRIOT Act, and other laws and regulations require financial institutions, among other duties, to institute and maintain an effective anti-money laundering program and file suspicious activity and currency transaction reports as appropriate. The federal Financial Crimes Enforcement Network, established by the U.S. Treasury Department to administer the Bank Secrecy Act, is authorized to impose significant civil money penalties for violations of those requirements, and has recently engaged in coordinated enforcement efforts with the individual federal banking regulators, as well as the U.S. Department of Justice, U.S. Drug Enforcement Administration, and Internal Revenue Service. There is also increased scrutiny of compliance with the sanctions programs and rules administered and enforced by the U.S. Treasury Department’s Office of Foreign Assets Control. In order to comply with regulations, guidelines and examination procedures in
22
Table of Contents
this area, we have dedicated significant resources to the development of our anti-money laundering program, adopting enhanced policies and procedures and implementing a robust automated anti-money laundering software solution. If our policies, procedures and systems are deemed deficient, we could be subject to liability, including fines and regulatory actions such as restrictions on our ability to pay dividends and the necessity to obtain regulatory approvals to proceed with certain aspects of our business plans.
We are subject to the CRA and fair lending laws, and failure to comply with these laws could lead to material penalties.
The CRA, the Equal Credit Opportunity Act, the Fair Housing Act and other fair lending laws and regulations impose nondiscriminatory lending requirements on financial institutions. The U.S. Department of Justice and other federal agencies are responsible for enforcing these laws and regulations. A successful challenge to an institution’s performance under the CRA or fair lending laws and regulations could result in a wide variety of sanctions, including the required payment of damages and civil money penalties, injunctive relief, imposition of restrictions on mergers and acquisitions activity, and restrictions on expansion activity. Private parties may also have the ability to challenge an institution’s performance under fair lending laws in private class action litigation.
The FDIC’s restoration plan and the related increased assessment rate could adversely affect our earnings.
Market developments have significantly depleted the Deposit Insurance Fund of the FDIC and reduced the ratio of reserves to insured deposits. As a result of recent economic conditions and the enactment of the Dodd-Frank Act, the FDIC has increased the deposit insurance assessment rates and thus raised deposit premiums for insured depository institutions. If these increases are insufficient for the DIF to meet its funding requirements, further special assessments or increases in deposit insurance premiums may be required. We are generally unable to control the amount of premiums that we are required to pay for FDIC insurance. If there are additional bank or financial institution failures, we may be required to pay even higher FDIC premiums than the recently increased levels. Any future additional assessments, increases or required prepayments in FDIC insurance premiums may materially adversely affect results of operations.
We may be subject to more stringent capital requirements.
The Dodd-Frank Act would require the federal banking agencies to establish stricter risk-based capital requirements and leverage limits to apply to banks and bank and savings and loan holding companies. In July 2013, the federal banking agencies published final rules (the “Basel III Capital Rules”) that revised their risk-based and leverage capital requirements and their method for calculating risk-weighted assets to implement, in part, agreements reached by the Basel Committee on Banking Supervision and certain provisions of the Dodd-Frank Act. The Basel III Capital Rules will apply to banking organizations, including the Company and the Bank.
Among other things, the Basel III Capital Rules: (i) introduce a new capital measure entitled “Common Equity Tier 1” (“CET1”); (ii) specify that tier 1 capital consist of CET1 and additional financial instruments satisfying specified requirements that permit inclusion in tier 1 capital; (iii) define CET1 narrowly by requiring that most deductions or adjustments to regulatory capital measures be made to CET1 and not to the other components of capital; and (iv) expand the scope of the deductions or adjustments from capital as compared to the existing regulations. The Basel III Capital Rules also provide a permanent exemption from the proposed phase out of existing trust preferred securities and cumulative perpetual preferred stock from regulatory capital for banking organizations with less than $15 billion in total consolidated assets as of December 31, 2009.
The Basel III Capital Rules provide for the following minimum capital to risk-weighted assets ratios:
| • | 4.5% based upon CET1; |
| • | 6.0% based upon tier 1 capital; and |
23
Table of Contents
| • | 8.0% based upon total regulatory capital. |
A minimum leverage ratio (tier 1 capital as a percentage of total assets) of 4.0% is also required under the Basel III Capital Rules. The Basel III Capital Rules additionally require institutions to retain a capital conservation buffer of 2.5% above these required minimum capital ratio levels. Banking organizations that fail to maintain the minimum 2.5% capital conservation buffer could face restrictions on capital distributions or discretionary bonus payments to executive officers.
Finally, the Basel III Capital Rules amend the thresholds under the “prompt corrective action” framework enforced with respect to the Bank by the OCC to reflect both (i) the generally heightened requirements for regulatory capital ratios as well as (ii) the introduction of the CET1 capital measure.
As a result of the enactment of the Basel III Capital Rules, the Company will formally become subject to regulatory capital requirements, and the Bank could be subject to increased required capital levels. The Basel III Capital Rules become effective as applied to the Company and the Bank on January 1, 2015, with a phase in period that generally extends from January 1, 2015 through January 1, 2019.
The fiscal and monetary policies of the federal government and its agencies could have a material adverse effect on our earnings.
The Federal Reserve regulates the supply of money and credit in the United States. Its policies determine in large part the cost of funds for lending and investing and the return earned on those loans and investments, both of which affect the net interest margin. The resultant changes in interest rates can also materially decrease the value of certain financial assets we hold, such as debt securities. Its policies can also adversely affect borrowers, potentially increasing the risk that they may fail to repay their loans. Changes in Federal Reserve policies are beyond our control and difficult to predict. In January 2014, a new chairperson of the Federal Reserve was appointed. The new chairperson may pursue different policies, such as increasing the federal funds rate or increasing regulatory restrictions on banks, that could have a material adverse effect on our business and results of operations.
Risks Related to this Offering
An active, liquid and orderly trading market for our common stock may not develop, our stock price may be volatile, and you may be unable to sell your shares at or above the offering price you paid.
There is no public market for our common stock. We cannot predict the extent to which a trading market will develop or how liquid that market might become. The initial public offering price for our common stock will be determined by negotiations between us, the selling stockholders and the underwriters and may not be indicative of prices that will prevail in the trading market after the offering closes. You may not be able to resell your shares above the initial public offering price and may suffer a loss on your investment. In addition, the market price of our common stock could be subject to wide fluctuations in response to many risk factors listed in this section and others beyond our control, including:
| • | addition or loss of significant customers; |
| • | changes in laws or regulations applicable to our industry, products or services; |
| • | additions or departures of key personnel; |
| • | the failure of securities analysts to cover our common stock after this offering; |
| • | actual or anticipated changes in expectations regarding our performance by investors or securities analysts; |
| • | price and volume fluctuations in the overall stock market; |
| • | volatility in the market price and trading volume of companies in our industry or companies that investors consider comparable; |
24
Table of Contents
| • | share price and volume fluctuations attributable to inconsistent trading volume levels of our shares; |
| • | our ability to protect our intellectual property and other proprietary rights; |
| • | sales of our common stock by us or our stockholders; |
| • | the expiration of contractual lock-up agreements; |
| • | litigation involving us, our industry or both; |
| • | the impact of changes in the economic environment; |
| • | the impact of changes in the political environment; |
| • | activities by our competitors; |
| • | major catastrophic events; and |
| • | general economic and market conditions and trends. |
Further, the stock markets have experienced significant price and volume fluctuations that have affected and continue to affect the market prices of equity securities of many companies. These fluctuations often have been unrelated or disproportionate to the operating performance of those companies. In addition, the stock prices of many savings and loan holdings companies have experienced wide fluctuations that have often been unrelated to the operating performance of those companies. These broad market and industry fluctuations, as well as general economic, political and market conditions such as recessions, interest rate changes or international currency fluctuations, may cause the market price of our common stock to decline. If the market price of our common stock after this offering does not exceed the initial public offering price, you may not realize any return on your investment and may lose some or all of your investment.
In the past, companies that have experienced volatility in the market price of their stock have been subject to securities class action litigation. We may be the target of this type of litigation in the future. Securities litigation against us could result in substantial costs and divert management’s attention from other business concerns, which could seriously harm our business.
As a result of the Plan of Reorganization, a limited number of stockholders are substantial holders of the shares of our common stock.
As a result of the Private Placements pursuant to the Plan of Reorganization, as of June 30, 2014, certain Investors own up to 9.9% of our common stock and certain other Investors own up to 4.9% of our common stock. Having a large portion of our shares of common stock held by a relatively small number of stockholders could result in a material impact on the trading volume and price per share of our common stock if any of these stockholders decide to sell a significant portion of their holdings. As a result, a small number of holders of our common stock are able to exercise significant influence over matters requiring stockholder approval. As of June 30, 2014, we had 56 holders of record of our common stock.
The Investor SPAs and the Secondary SPAs grant the Investors and the Secondary Investors, respectively, certain preemptive rights and approval rights which could impede our ability to raise additional equity capital.
Under the Investor SPAs and the Secondary SPAs, in certain instances, the Investors and the Secondary Investors, respectively, have preemptive rights to purchase equity securities we may offer in non-SEC registered capital raising transactions. These rights may adversely affect our ability to raise additional equity capital on favorable terms. If management determines we need to raise additional equity capital for our business, our inability to do so on favorable terms may have a material adverse effect on our business, financial condition and results of operations and, as a result, a material adverse effect on our ability to satisfy our debt obligations. See “Description of the Common Stock—Preemptive Rights; Redemption and Assessment.”
25
Table of Contents
Our stock price could decline due to the large number of outstanding shares of our common stock eligible for future sale.
Sales of substantial amounts of our common stock in the public market following this offering, or the perception that these sales could occur, could cause the market price of our common stock to decline. These sales could also make it more difficult for us to sell equity or equity-related securities in the future at a time and price that we deem appropriate.
Upon completion of this offering, we will have outstanding shares of common stock based upon 9,050,000 shares outstanding as of June 30, 2014 and assuming no exercise of the underwriters’ over-allotment option. The shares sold pursuant to this offering will be immediately tradable without restriction. Of the remaining shares:
| • | shares are currently freely tradable (i.e. shares saleable under Rule 144 that are not subject to a lock-up; and |
| • | shares will become eligible for sale, subject to the provisions of Rule 144, upon the expiration of agreements not to sell such shares entered into between the underwriters and such stockholders beginning 180 days after the date of this prospectus, subject to extension in certain circumstances. |
We, our executive officers and directors, the selling stockholders and certain other persons, have agreed that we and they will not, without the prior written consent of the underwriters, during the period ending 180 days after the date of this prospectus:
| • | offer, pledge, sell, contract to sell, sell any option or contract to purchase, purchase any option or contract to sell, grant any option, right or warrant to purchase, lend, or otherwise transfer or dispose of, directly or indirectly, any shares of our common stock or securities convertible into or exercisable or exchangeable for our common stock; or |
| • | enter into any swap or other arrangement that transfers to another, in whole or in part, any of the economic consequences of ownership of our common stock; |
whether any transaction described above is to be settled by delivery of shares of our common stock or such other securities, in cash or otherwise. This agreement is subject to certain limited exceptions and extensions described in the section entitled “Underwriting.” The 9.9% Investors have certain registration rights and are subject to lock-up provisions in their respective Investor SPAs. The 4.9% Investors and the Secondary Investors have registration rights, but they are not subject to any lock-up agreements. See “Description of the Common Stock.”
The underwriters may, in their sole discretion and at any time, release all or any portion of the securities subject to lock-up agreement.
Management will have broad discretion over the use of the proceeds from this offering and may not apply the proceeds of this offering in ways that increase the value of your investment.
Management will have broad discretion to use the net proceeds we receive from this offering and you will be relying on its judgment regarding the application of these proceeds. We expect to use the net proceeds from this offering as described under the heading “Use of Proceeds.” However, management may not apply the net proceeds of this offering in ways that increase the value of your investment.
If you purchase shares of our common stock in this offering, you will experience immediate dilution.
If you purchase shares of our common stock in this offering, you will experience immediate dilution of $ per share based on an assumed initial public offering price of $ per share, the mid-point of the price range on the cover of this prospectus, because the price that you pay will be substantially greater than the net tangible book
26
Table of Contents
value per share of the common stock that you acquire. This dilution is due in large part because our earlier investors paid substantially less than the initial public offering price when they purchased their shares of our common stock. You will experience additional dilution upon the exercise of options to purchase common stock under our equity incentive plans, if we issue restricted stock to our employees under these plans or if we otherwise issue additional shares of our common stock. See “Dilution.”
If securities or industry analysts do not publish or cease publishing research or reports about us, our business or our market, or if they change their recommendations regarding our stock adversely, our stock price and trading volume could decline.
The trading market for our common stock will be influenced by the research and reports that industry or securities analysts may publish about us, our business, our market or our competitors. If any of the analysts who may cover us change their recommendation regarding our stock adversely, or provide more favorable relative recommendations about our competitors, our stock price would likely decline. If any analyst who may cover us were to cease coverage of our Company or fail to regularly publish reports on us, we could lose visibility in the financial markets, which in turn could cause our stock price or trading volume to decline.
Because we do not expect to pay any dividends for the foreseeable future, investors in this offering may be forced to sell their stock to realize a return on their investment.
We have not paid dividends on our common stock since December 31, 2008. The payment of dividends by the Bank is subject to various regulatory requirements, including a minimum of 30 days’ advance notice to the OCC of any proposed dividend. Additionally, all dividends are declared and paid at the discretion of the Board and are dependent upon our liquidity, financial condition, results of operations, capital requirements and such other factors as the Board may deem relevant.
Further, we do not intend to resume paying cash dividends for the foreseeable future. Our ability to pay dividends might be restricted by the terms of any indebtedness that we incur in the future. Consequently, you should not rely on dividends to receive a return on your investment. See “Dividend Policy.”
“Anti-takeover” provisions and the regulations to which we are subject may make it more difficult for a third party to acquire control of us, even if the change in control would be beneficial to our stockholders.
Anti-takeover provisions in Delaware law and our Amended Charter and bylaws (the “Amended Bylaws”), as well as regulatory approvals that would be required under federal law, could make it more difficult for a third-party to take control of us and may prevent stockholders from receiving a premium for their shares of our common stock. These provisions could adversely affect the market price of our common stock and could reduce the amount that stockholders might get if we are sold.
Our Amended Charter provides for, among other things:
| • | advance notice for nomination of directors and other stockholder proposals; |
| • | limitations on the ability of stockholders to call a special meeting of stockholders; |
| • | the approval by a super-majority of outstanding shares to amend certain provisions of the Amended Bylaws and the certificate of incorporation; and |
| • | the Tax Attribute Preservation Provision. |
Delaware law also imposes some restrictions on mergers and other business combinations between us and any holder of 15% or more of our outstanding common stock. See “Description of the Common Stock—Anti-Takeover Considerations and Special Provisions of Our Certificate of Incorporation, Bylaws and Delaware Law.” We believe that these provisions protect our stockholders from coercive or otherwise unfair takeover tactics by
27
Table of Contents
requiring potential acquirers to negotiate with our Board and by providing our Board with more time to assess any acquisition proposal. However, these provisions apply even if the offer may be determined to be beneficial by some stockholders and could delay or prevent an acquisition that our Board determines is not in the best interest of our stockholders.
Furthermore, banking laws impose notice, approval and ongoing regulatory requirements on any stockholder or other party that seeks to acquire direct or indirect “control” of an FDIC-insured depository institution. These laws include the Federal Savings and Loan Holding Company Act, the Bank Holding Company Act of 1956 and the Change in Bank Control Act. These laws could delay or prevent an acquisition.
28
Table of Contents
NOTE REGARDING FORWARD-LOOKING STATEMENTS
This prospectus contains “forward-looking statements” within the meaning of the federal securities laws, which statements involve substantial risks and uncertainties. Forward-looking statements generally relate to business plans or strategies, projected or anticipated benefits from strategic transactions made by or to be made by us, projections involving anticipated revenues, earnings, liquidity, profitability or other aspects of operating results or other future developments in our affairs or the industry in which we conduct business. Forward-looking statements may be identified by reference to a future period or periods or by the use of forward-looking terminology such as “anticipate,” “believe,” “project,” “continue,” “ongoing,” “expect,” “intend,” “plan,” “estimate” or similar expressions.
Although we believe that the anticipated results or other expectations reflected in our forward-looking statements are based on reasonable assumptions, we can give no assurance that those results or expectations will be attained. Forward-looking statements involve risks, uncertainties and assumptions, some of which are beyond our control, and as a result actual results may differ materially from those expressed in forward-looking statements due to several factors more fully described in “Risk Factors,” as well as elsewhere in this prospectus. Factors that could cause actual results to differ from forward-looking statements include, but are not limited to, the following, as well as those discussed elsewhere herein:
| • | our ability to successfully transform our business and implement our new business strategy; |
| • | our ability to fully realize our deferred tax assets; |
| • | on-going impact of the Recapitalization; |
| • | changes in the quality or composition of our loan and investment portfolios, OREO values and ALLL; |
| • | impact of potential impairment of other intangibles in a challenging economy; |
| • | our ability to pay dividends; |
| • | our ability to address our liquidity needs; |
| • | deterioration in the value of commercial real estate, land and construction loan portfolios resulting in increased loan losses; |
| • | our ability to recruit and retain key employees; |
| • | uncertainties about market interest rates; |
| • | demand for financial services, loss of customer confidence, and customer deposit account withdrawals; |
| • | competitive pressures could intensify and affect our profitability, including as a result of continued industry consolidation, the increased availability of financial services from non-banks, technological developments or bank regulatory reform; |
| • | security breaches of our information systems; |
| • | changes in the conditions of the securities markets, which could adversely affect, among other things, the value or credit quality of our assets, the availability and terms of funding necessary to meet our liquidity needs and our ability to originate loans; |
| • | soundness of other financial institutions with which we and the Bank engage in transactions; |
| • | the performance of third party investment products we offer; |
| • | environmental liability for properties to which we take title; |
| • | the effects of any changes to the servicing compensation structure for mortgage servicers pursuant to the programs of government sponsored-entities; |
| • | changes in accounting principles, policies or guidelines; |
29
Table of Contents
| • | the impact of dilution of existing stockholders as a result of possible future capital raising transactions; |
| • | uncertainties relating to the Emergency Economic Stabilization Act of 2008, the American Recovery and Reinvestment Act of 2009, the Dodd-Frank Act, the implementation by the U.S. Department of the Treasury and federal banking regulators of a number of programs to address capital and liquidity issues in the banking system and additional programs that will apply to us in the future, all of which may have significant effects on us and the financial services industry; and |
| • | other risk factors included under “Risk Factors” in this prospectus. |
You should not put undue reliance on any forward-looking statements. Forward-looking statements speak only as of the date they are made and we undertake no obligation to update them in light of new information or future events, except to the extent required by federal securities laws.
30
Table of Contents
We estimate that the net proceeds from the sale of shares of our common stock that we are selling in this offering will be approximately $ million (or approximately $ million if the underwriters exercise their option in full to purchase additional shares), assuming on an initial public offering price of $ per share, the midpoint of the estimated initial public offering price range set forth on the cover of this prospectus, after deducting the underwriting discounts and commissions and estimated offering expenses payable by us.
We will not receive any proceeds from the sale of shares of common stock by the selling stockholders.
We intend to use the net proceeds we receive from this offering (including any additional proceeds we receive if the underwriters exercise their option in full to purchase additional shares) for general corporate purposes. We will have broad discretion over the uses of the net proceeds in this offering, and, as of the date of this prospectus, we have not allocated the net proceeds to particular uses.
A $1.00 increase (decrease) in the assumed initial public offering price per share would increase (decrease) the estimated net proceeds to us by approximately $ million, assuming that the number of shares of common stock sold by us, as set forth on the cover page of this prospectus, remains the same and after deducting the underwriting discounts and commissions and estimated offering expenses payable by us. Similarly, each increase (decrease) of one million shares in the number of shares of common stock offered by us would increase (decrease) the net proceeds to us from this offering by approximately $ million, assuming that the assumed initial public offering price remains the same, and after deducting the underwriting discounts and commissions and estimated offering expenses payable by us.
The information above is for illustrative purposes only and is subject to the actual offering price and the actual number of shares issued at pricing.
31
Table of Contents
The following table sets forth our cash, cash equivalents and debt and capitalization as of June 30, 2014:
| • | on an actual basis; and |
| • | on an as adjusted basis to give effect to the sale of shares of common stock by us in this offering at an assumed initial public offering price of $ per share (the mid-point of the price range on the cover of this prospectus) and after deducting estimated underwriting discounts and commissions and estimated offering expenses. |
This table should be read in conjunction with “Selected Historical Consolidated Financial Statements,” “Management’s Discussion and Analysis of Financial Condition and Results of Operations” and our consolidated financial statements and related notes included elsewhere in this prospectus.
| As of June 30, 2014 | ||||||||
| Actual | As Adjusted(1) | |||||||
| (in thousands, except share and per share data) |
||||||||
| Cash and cash equivalents(2) |
$ | 177,347 | $ | |||||
|
|
|
|
|
|||||
| Total long-term debt |
$ | 13,781 | $ | |||||
| Stockholders’ equity: |
||||||||
| Preferred stock, $0.01 par value, 100,000 shares authorized, no shares issued and outstanding, actual; no shares issued and outstanding, as adjusted |
— | |||||||
| Common stock, $0.01 par value per share: 11,900,000 shares authorized, 9,050,000 shares issued and outstanding, actual: 11,900,000 shares authorized, shares issued and outstanding, as adjusted |
91 | |||||||
| Additional paid-in capital |
188,370 | |||||||
| Retained earnings |
24,896 | |||||||
| Accumulated other comprehensive loss related to AFS securities(3) |
(1,738 | ) | ||||||
| Accumulated other comprehensive loss related to OTTI securities—noncredit factors(4) |
(112 | ) | ||||||
|
|
|
|
|
|||||
| Total accumulated other comprehensive loss |
(1,850 | ) | ||||||
| Total stockholders’ equity |
$ | 211,507 | $ | |||||
|
|
|
|
|
|||||
| Total capitalization |
$ | 225,288 | $ | |||||
|
|
|
|
|
|||||
| Capital ratios: |
||||||||
| Tangible common equity to tangible assets(5) |
9.97 | % | % | |||||
| Tier 1 common capital to total risk weighted assets(6) |
16.12 | |||||||
| Tier 1 risk-based capital(6) |
16.12 | |||||||
| Total risk-based capital(6) |
17.40 | |||||||
| Tier 1 leverage(6) |
9.75 | |||||||
| (1) | Each $1.00 increase or decrease in the assumed initial public offering price of $ per share (the mid-point of the price range on the cover of this prospectus) would increase (decrease) the amount of cash, additional paid-in capital and total capitalization by approximately $ million, assuming the number of shares we offer, as stated on the cover of this prospectus, remains the same and after deducting the estimated underwriting discounts and commissions and estimated offering expenses. |
| (2) | Includes $4.2 million of cash and cash equivalents held directly by the Company as of June 30, 2014. All remaining cash and cash equivalents were held through the Company’s subsidiaries. |
| (3) | “AFS securities” means available-for-sale securities. |
| (4) | “OTTI securities” means other than temporary impairment securities. |
| (5) | Tangible common equity to tangible assets ratio is a non-GAAP financial measure. Tangible common equity is computed as total stockholders’ equity, excluding preferred stock, less intangible assets. Tangible assets |
32
Table of Contents
| are calculated as total assets less intangible assets. We believe that the most directly comparable GAAP financial measure is total stockholders’ equity to assets. For a reconciliation of the non-GAAP measure to the most directly comparable GAAP financial measure, please refer to the section titled “Prospectus Summary—Summary Historical Consolidated Financial Data—Non-GAAP Financial Measures.” |
| (6) | Bank-only capital ratios. |
33
Table of Contents
If you invest in the shares of our common stock, your interest will be diluted to the extent of the difference between the public offering price per share of our common stock and the as adjusted net tangible book value per share of our common stock after this offering. Our net tangible book value as of June 30, 2014 was $ million, or $ per share of common stock based on the 9,050,000 shares issued and outstanding as of that date. Net tangible book value per share represents total tangible assets less total liabilities, divided by the number of shares of common stock outstanding. After giving effect to our sale of our common stock in this offering at the assumed initial public offering price of $ per share, the mid-point of the price range on the cover of this prospectus, and after deducting the estimated underwriting discounts and commissions and our estimated offering expenses, our as adjusted net tangible book value as of June 30, 2014 would have been $ million, or $ per share. This represents an immediate increase in net tangible book value of $ per share to our existing stockholders and an immediate dilution of $ per share to new investors purchasing shares of common stock in this offering. The following table illustrates this dilution on a per share basis:
| Assumed initial public offering price per share |
$ | |||||||
| Net tangible book value per share as of June 30, 2014 |
$ | |||||||
| Increase in actual net tangible book value per share attributable to this offering |
||||||||
|
|
|
|||||||
| Pro forma net tangible book value per share after this offering |
||||||||
|
|
|
|||||||
| Dilution per share to new investors in this offering |
$ | |||||||
|
|
|
The following table illustrates the differences between the number of shares of common stock purchased from us, the total consideration paid, and the average price per share paid by existing stockholders and new investors purchasing shares of our common stock in this offering based on an assumed initial public offering price of $ per share, the mid-point of the price range on the cover of this prospectus, and before deducting estimated underwriting discounts and commissions and estimated offering expenses as of June 30, 2014 on a pro forma basis.
| Shares Purchased | Total Consideration (in thousands) |
Average Price Per Share | ||||||||||||||
| Number | Percent | Amount | Percent | |||||||||||||
| Existing Stockholders |
% | % | $ | |||||||||||||
| New Investors |
$ | |||||||||||||||
| Total |
% | % | ||||||||||||||
If the underwriters exercise their over-allotment option in full, the percentage of shares of common stock held by existing stockholders will decrease to approximately % of the total number of shares of our common stock outstanding after this offering, and the number of shares held by new investors will be increased to , or approximately % of the total number of shares of our common stock outstanding after this offering.
Sales of shares of common stock by the selling stockholders in this offering will reduce the number of shares of common stock held by existing stockholders to , or approximately % of the total shares of common stock outstanding after this offering, and will increase the number of shares held by new investors to , or approximately % of the total shares of common stock outstanding after this offering.
34
Table of Contents
Our business is subject to extensive regulation and supervision under federal banking laws and other federal and state laws and regulations. In general, these laws and regulations are intended for the protection of depositors, the deposit insurance funds administered by the FDIC, and the banking system as a whole, and not for the protection of stockholders or creditors of insured institutions.
The Company
We are a legal entity separate and distinct from the Bank. We depend on the payment of dividends from our subsidiaries for our cash flow. As noted below, the payment of dividends by the Bank is subject to various regulatory requirements, including a minimum of 30 days advance notice to the OCC of any proposed dividend. We have not paid dividends on our common stock since December 31, 2008 and do not intend to pay dividends for the foreseeable future. If dividends are declared by the Board, the distribution of dividends will be at the discretion of the Board, will be subject to compliance with applicable laws and may be restricted by agreements to which the Company is a party, including any financing arrangements at the time a Board determination is made.
The Bank
The Bank is a federal savings bank organized under the laws of the United States and subject to regulation and examination by the OCC. The OCC regulates all areas of the Bank’s banking operations, including investments, reserves, lending, mergers, payment of dividends, interest rates, transactions with affiliates (including the Company), establishment of branches and other aspects of the Bank’s operations. The Bank is subject to regular examinations by the OCC and is assessed amounts to cover the costs of such examinations. In addition, because the Bank’s deposits are insured to the maximum extent permitted by law by the FDIC, the Bank is also regulated by the FDIC.
Current federal law prohibits, except under certain circumstances and with prior regulatory approval, an insured depository institution from paying dividends or making any other capital distribution if, after making the payment or distribution, the institution would be considered “undercapitalized,” as that term is defined in applicable regulations.
Regulatory Limits on Dividends and Distributions
OCC and Federal Reserve regulations govern capital distributions by savings institutions, which include cash dividends, stock repurchases and other transactions charged to the capital account of a savings institution to make capital distributions. Under applicable regulations, a savings institution must file an application for approval of the capital distribution if:
| • | the total capital distributions for the applicable calendar year exceed the sum of the institution’s net income for that year to date plus the institution’s retained net income for the preceding two years; |
| • | the institution would not be at least adequately capitalized under the PCA guidelines following the distribution; |
| • | the distribution would violate any applicable statute, regulation, agreement or OCC-imposed condition; or |
| • | the institution is not eligible for expedited treatment of its filings with the OCC. |
If an application is not required to be filed, savings institutions such as the Bank which are a subsidiary of a holding company (as well as certain other institutions) must still file a notice with the OCC and Federal Reserve at least 30 days before the board of directors declares a dividend or approves a capital distribution.
35
Table of Contents
An institution that either before or after a proposed capital distribution fails to meet its then applicable minimum capital requirement or that has been notified that it needs more than normal supervision may not make any capital distributions without the prior written approval of the OCC. In addition, the OCC may prohibit a proposed capital distribution, which would otherwise be permitted by OCC regulations, if the OCC determines that such distribution would constitute an unsafe or unsound practice.
The FDIC prohibits an insured depository institution from paying dividends on its capital stock or interest on its capital notes or debentures (if such interest is required to be paid only out of net profits) or distributing any of its capital assets while it remains in default in the payment of any assessment due the FDIC. The Bank is currently not in default in any assessment payment to the FDIC.
36
Table of Contents
SELECTED HISTORICAL CONSOLIDATED FINANCIAL STATEMENTS
The following tables present our selected historical consolidated financial information. The unaudited consolidated statement of operations and comprehensive income (loss) data and condensed statement of cash flows data for the six months ended June 30, 2014 and 2013 and for the nine months ended December 31, 2012 has been derived from our unaudited condensed consolidated financial statements included in this prospectus. The consolidated statement of operations and comprehensive income (loss) data and condensed statement of cash flows data for the nine months ended December 31, 2013 and the fiscal years ended March 31, 2013 and 2012 and the consolidated balance sheet data as of December 31, 2013 and March 31, 2013 have been derived from our audited consolidated financial statements included in this prospectus. The consolidated statement of operations and comprehensive income (loss) data and condensed statement of cash flows data for the years ended March 31, 2011 and 2010 and the consolidated balance sheet data as of March 31, 2011 and 2010 have been derived from our audited consolidated financial statements not included in this prospectus. The unaudited consolidated financial statements have been prepared on the same basis as the audited consolidated financial statements, and, in the opinion of management, include all adjustments necessary for a fair presentation of the information set forth herein. Results for interim periods are not indicative of results to be expected for any other interim period or for a full year. As a result of the Recapitalization, operating results in prior periods are not indicative of results to be expected for any other period.
On December 18, 2013, the Board approved the change of our fiscal year end from March 31 to December 31, beginning with December 31, 2013. References to any of our previous fiscal years mean the fiscal years ended on March 31. On March 20, 2014, we filed with the SEC a transition report on Form 10-K/T covering the fiscal period beginning on April 1, 2013 through December 31, 2013. In the future, we intend to file annual reports on Form 10-K covering fiscal years ending December 31.
The selected historical consolidated financial information presented below should be read in conjunction with “Management’s Discussion and Analysis of Financial Condition and Results of Operations” and our audited and unaudited consolidated financial statements and accompanying notes included in this prospectus.
37
Table of Contents
Consolidated Statement of Operations and Comprehensive Income (Loss) Data:
| Six Months Ended June 30, |
Nine Months Ended December 31, |
Fiscal Year Ended March 31, | ||||||||||||||||||||||||||||||
| 2014 | 2013 | 2013 | 2012 | 2013 | 2012 | 2011 | 2010 | |||||||||||||||||||||||||
| (In thousands, except per share data) | ||||||||||||||||||||||||||||||||
| Interest income |
||||||||||||||||||||||||||||||||
| Loans |
$ | 35,197 | $ | 40,954 | $ | 57,702 | $ | 72,147 | $ | 93,335 | $ | 116,929 | $ | 150,692 | $ | 195,594 | ||||||||||||||||
| Investment securities and Federal Home Loan Bank stock |
3,062 | 2,713 | 4,179 | 4,478 | 5,912 | 9,738 | 15,249 | 20,443 | ||||||||||||||||||||||||
| Interest-earning deposits |
159 | 225 | 342 | 541 | 635 | 586 | 526 | 1,045 | ||||||||||||||||||||||||
|
|
|
|
|
|
|
|
|
|
|
|
|
|
|
|
|
|||||||||||||||||
| Total interest income |
38,418 | 43,892 | 62,223 | 77,166 | 99,882 | 127,253 | 166,467 | 217,082 | ||||||||||||||||||||||||
| Interest expense |
||||||||||||||||||||||||||||||||
| Deposits |
2,121 | 3,214 | 4,108 | 8,614 | 10,324 | 24,962 | 48,626 | 87,251 | ||||||||||||||||||||||||
| Other borrowed funds |
120 | 12,441 | 10,009 | 20,889 | 27,075 | 30,367 | 32,757 | 44,872 | ||||||||||||||||||||||||
|
|
|
|
|
|
|
|
|
|
|
|
|
|
|
|
|
|||||||||||||||||
| Total interest expense |
2,241 | 15,655 | 14,117 | 29,503 | 37,399 | 55,329 | 81,383 | 132,123 | ||||||||||||||||||||||||
|
|
|
|
|
|
|
|
|
|
|
|
|
|
|
|
|
|||||||||||||||||
| Net interest income |
36,177 | 28,237 | 48,106 | 47,663 | 62,483 | 71,924 | 85,084 | 84,959 | ||||||||||||||||||||||||
| Provision for loan losses |
— | 950 | 275 | 7,058 | 7,733 | 33,887 | 50,325 | 161,926 | ||||||||||||||||||||||||
|
|
|
|
|
|
|
|
|
|
|
|
|
|
|
|
|
|||||||||||||||||
| Net interest income (loss) after provision for loan losses |
36,177 | 27,287 | 47,831 | 40,605 | 54,750 | 38,037 | 34,759 | (76,967 | ) | |||||||||||||||||||||||
| Non-interest income |
||||||||||||||||||||||||||||||||
| Net impairment losses recognized in earnings |
(34 | ) | (83 | ) | (23 | ) | (325 | ) | (408 | ) | (568 | ) | (440 | ) | (1,084 | ) | ||||||||||||||||
| Loan servicing income (loss), net of amortization |
1,514 | 110 | 1,382 | (1,947 | ) | (1,892 | ) | (789 | ) | 2,128 | 3,829 | |||||||||||||||||||||
| Service charges on deposits |
4,789 | 4,949 | 7,751 | 8,066 | 10,435 | 10,589 | 11,463 | 15,433 | ||||||||||||||||||||||||
| Investment and insurance commissions |
1,987 | 2,015 | 2,965 | 2,942 | 3,894 | 3,808 | 3,448 | 3,451 | ||||||||||||||||||||||||
| Net gain on sale of loans |
1,290 | 5,823 | 5,086 | 20,165 | 23,195 | 17,680 | 17,925 | 18,584 | ||||||||||||||||||||||||
| Net gain (loss) on sale and call of investment securities |
301 | (200 | ) | 292 | (47 | ) | (247 | ) | 6,579 | 8,661 | 11,095 | |||||||||||||||||||||
| Net gain on sale of OREO |
1,201 | 2,262 | 3,260 | 5,539 | 6,876 | 6,118 | 3,640 | 632 | ||||||||||||||||||||||||
| Extinguishment of debt |
— | — | 134,514 | — | — | — | — | — | ||||||||||||||||||||||||
| Other income(1) |
2,494 | 1,479 | 4,306 | 4,005 | 4,048 | 5,844 | 12,435 | 5,445 | ||||||||||||||||||||||||
|
|
|
|
|
|
|
|
|
|
|
|
|
|
|
|
|
|||||||||||||||||
| Total non-interest income |
13,542 | 16,355 | 159,533 | 38,398 | 45,901 | 49,261 | 59,260 | 57,385 | ||||||||||||||||||||||||
| Non-interest expense |
||||||||||||||||||||||||||||||||
| Compensation and benefits |
21,901 | 21,272 | 32,426 | 30,594 | 40,736 | 41,262 | 41,485 | 53,042 | ||||||||||||||||||||||||
| Occupancy |
3,852 | 4,297 | 6,517 | 5,822 | 8,133 | 7,946 | 8,541 | 10,256 | ||||||||||||||||||||||||
| Furniture and equipment |
1,557 | 1,612 | 2,510 | 3,801 | 4,563 | 5,665 | 6,198 | 7,950 | ||||||||||||||||||||||||
| Federal deposit insurance premiums |
1,748 | 2,686 | 3,386 | 4,567 | 5,921 | 7,189 | 11,402 | 18,630 | ||||||||||||||||||||||||
| Data processing |
2,686 | 3,282 | 4,300 | 4,361 | 6,223 | 6,259 | 6,540 | 7,178 | ||||||||||||||||||||||||
| Communications |
1,036 | 948 | 1,517 | 1,428 | 1,840 | 2,081 | 2,389 | 2,576 | ||||||||||||||||||||||||
| Marketing |
1,532 | 902 | 2,099 | 839 | 1,345 | 1,466 | 1,491 | 2,282 | ||||||||||||||||||||||||
| OREO expense, net |
3,452 | 16,548 | 9,797 | 25,312 | 37,571 | 28,684 | 30,926 | 26,082 | ||||||||||||||||||||||||
| Investor loss reimbursement |
(86 | ) | 3,181 | 687 | 1,720 | 4,530 | 157 | — | 4,677 | |||||||||||||||||||||||
| Mortgage servicing rights impairment (recovery) |
95 | (3,448 | ) | (1,664 | ) | 1,787 | (403 | ) | 2,410 | (97 | ) | (1,905 | ) | |||||||||||||||||||
| Provision for unfunded loan commitments |
780 | 2,159 | 2,708 | 967 | 1,392 | (309 | ) | 873 | — | |||||||||||||||||||||||
| Loan processing and servicing expense |
1,276 | 2,194 | 2,549 | 2,569 | 3,871 | 3,653 | 3,484 | 3,601 | ||||||||||||||||||||||||
| Legal services |
955 | 2,371 | 2,773 | 4,156 | 5,256 | 5,024 | 8,040 | 5,137 | ||||||||||||||||||||||||
| Other professional fees |
758 | 1,154 | 1,699 | 1,687 | 2,346 | 3,669 | 5,294 | 4,995 | ||||||||||||||||||||||||
| Insurance |
516 | 794 | 2,497 | 1,238 | 1,656 | 1,478 | 1,126 | 1,042 | ||||||||||||||||||||||||
| Debt prepayment penalty |
— | — | 16,149 | 3,549 | 3,549 | — | — | — | ||||||||||||||||||||||||
| Reorganization costs |
— | — | 1,929 | — | — | — | — | — | ||||||||||||||||||||||||
| Other expense(1) |
3,114 | 3,091 | 3,853 | 4,939 | 6,475 | 7,392 | 7,341 | 13,289 | ||||||||||||||||||||||||
|
|
|
|
|
|
|
|
|
|
|
|
|
|
|
|
|
|||||||||||||||||
| Total non-interest expense |
45,172 | 63,043 | 95,732 | 99,336 | 135,004 | 124,026 | 135,033 | 158,832 | ||||||||||||||||||||||||
|
|
|
|
|
|
|
|
|
|
|
|
|
|
|
|
|
|||||||||||||||||
| Income (loss) before income taxes |
4,547 | (19,401 | ) | 111,632 | (20,333 | ) | (34,353 | ) | (36,728 | ) | (41,014 | ) | (178,414 | ) | ||||||||||||||||||
| Income tax expense (benefit) |
10 | — | 9 | (181 | ) | (181 | ) | 10 | 164 | (1,500 | ) | |||||||||||||||||||||
|
|
|
|
|
|
|
|
|
|
|
|
|
|
|
|
|
|||||||||||||||||
| Net income (loss) |
4,537 | (19,401 | ) | 111,623 | (20,152 | ) | (34,172 | ) | (36,738 | ) | (41,178 | ) | (176,914 | ) | ||||||||||||||||||
| (1) | Certain items have been reclassified to conform to current period presentation. |
38
Table of Contents
| Six Months Ended June 30, |
Nine Months Ended December 31, |
Fiscal Year Ended March 31, | ||||||||||||||||||||||||||||||
| 2014 | 2013 | 2013 | 2012 | 2013 | 2012 | 2011 | 2010 | |||||||||||||||||||||||||
| (In thousands, except per share data) | ||||||||||||||||||||||||||||||||
| Preferred stock dividends in arrears |
— | (3,363 | ) | (2,538 | ) | (4,898 | ) | (6,560 | ) | (6,278 | ) | (5,934 | ) | (5,648 | ) | |||||||||||||||||
| Preferred stock discount accretion |
— | (3,706 | ) | (6,167 | ) | (5,569 | ) | (7,412 | ) | (7,413 | ) | (7,412 | ) | (7,411 | ) | |||||||||||||||||
| Retirement of preferred shares |
— | — | 104,000 | — | — | — | — | — | ||||||||||||||||||||||||
|
|
|
|
|
|
|
|
|
|
|
|
|
|
|
|
|
|||||||||||||||||
| Net income (loss) available to common equity |
$ | 4,537 | $ | (26,470 | ) | $ | 206,918 | $ | (30,619 | ) | $ | (48,144 | ) | $ | (50,429 | ) | $ | (54,524 | ) | $ | (189,973 | ) | ||||||||||
|
|
|
|
|
|
|
|
|
|
|
|
|
|
|
|
|
|||||||||||||||||
| Net income (loss) |
4,537 | (19,401 | ) | 111,623 | (20,152 | ) | (34,172 | ) | (36,738 | ) | (41,178 | ) | (176,914 | ) | ||||||||||||||||||
| Other comprehensive income (loss), net of tax: |
||||||||||||||||||||||||||||||||
| Reclassification adjustment for realized net gains recognized in Statement of Operations—Net gain (loss) on sale and call of investment securities |
(301 | ) | 200 | (292 | ) | 47 | 247 | (6,579 | ) | (8,661 | ) | (11,095 | ) | |||||||||||||||||||
| Reclassification adjustments recognized in Statement of Operations—Net impairment losses recognized in earnings: |
||||||||||||||||||||||||||||||||
| Net change in unrealized credit related other-than-temporary impairment |
(78 | ) | (158 | ) | (201 | ) | (220 | ) | (310 | ) | 194 | 432 | 847 | |||||||||||||||||||
| Credit related other-than-temporary impairment previously recognized on securities paid-off during the period |
— | — | — | (4 | ) | (4 | ) | — | — | (2,100 | ) | |||||||||||||||||||||
| Realized credit losses |
112 | 241 | 224 | 549 | 722 | 364 | — | — | ||||||||||||||||||||||||
| Change in net unrealized gains (losses) on available-for-sale securities |
5,039 | (5,649 | ) | (9,932 | ) | 2,297 | 2,792 | 26,105 | (6,324 | ) | 13,286 | |||||||||||||||||||||
|
|
|
|
|
|
|
|
|
|
|
|
|
|
|
|
|
|||||||||||||||||
| Total other comprehensive income (loss) |
4,772 | (5,366 | ) | (10,201 | ) | 2,669 | 3,447 | 20,084 | (14,553 | ) | 938 | |||||||||||||||||||||
|
|
|
|
|
|
|
|
|
|
|
|
|
|
|
|
|
|||||||||||||||||
| Comprehensive income (loss) |
$ | 9,309 | $ | (24,767 | ) | $ | 101,422 | $ | (17,483 | ) | $ | (30,725 | ) | $ | (16,654 | ) | $ | (55,731 | ) | $ | (175,976 | ) | ||||||||||
|
|
|
|
|
|
|
|
|
|
|
|
|
|
|
|
|
|||||||||||||||||
| Income (loss) per common share: |
||||||||||||||||||||||||||||||||
| Basic(2) |
$ | 0.50 | $ | (1.25 | ) | $ | 12.18 | $ | (1.44 | ) | $ | (2.27 | ) | $ | (2.37 | ) | $ | (2.57 | ) | $ | (8.97 | ) | ||||||||||
| Diluted(2) |
$ | 0.50 | $ | (1.25 | ) | $ | 12.18 | $ | (1.44 | ) | $ | (2.27 | ) | $ | (2.37 | ) | $ | (2.57 | ) | $ | (8.97 | ) | ||||||||||
| Dividends declared per common share |
— | — | — | — | — | — | — | — | ||||||||||||||||||||||||
| (1) | Certain items have been reclassified to conform to current period presentation. |
| (2) | The calculation of weighted average shares included 21,247,000 shares of Legacy Common Stock outstanding through September 26, 2013 and 9,050,000 shares of common stock outstanding from September 27, 2013 through June 30, 2014. |
39
Table of Contents
Consolidated Balance Sheet Data:
| As of June 30, 2014 |
As of December 31, 2013 |
As of March 31, | ||||||||||||||||||||||
| 2013 | 2012 | 2011 | 2010 | |||||||||||||||||||||
| (In thousands, except share data) | ||||||||||||||||||||||||
| Assets |
||||||||||||||||||||||||
| Cash and due from banks |
$ | 38,982 | $ | 44,139 | $ | 30,237 | $ | 47,119 | $ | 34,596 | $ | 42,411 | ||||||||||||
| Interest-earning deposits |
138,365 | 99,257 | 198,299 | 195,861 | 72,419 | 469,751 | ||||||||||||||||||
|
|
|
|
|
|
|
|
|
|
|
|
|
|||||||||||||
| Cash and cash equivalents |
177,347 | 143,396 | 228,536 | 242,980 | 107,015 | 512,162 | ||||||||||||||||||
| Investment securities available for sale |
295,290 | 277,872 | 266,787 | 242,299 | 523,289 | 416,203 | ||||||||||||||||||
| Investment securities held to maturity |
— | — | — | 20 | 27 | 39 | ||||||||||||||||||
| Loans held for sale |
5,261 | 3,085 | 18,058 | 39,332 | 7,538 | 19,484 | ||||||||||||||||||
| Loans held for investment |
1,556,138 | 1,609,506 | 1,750,358 | 2,168,959 | 2,670,489 | 3,409,224 | ||||||||||||||||||
| Less: ALLL |
(49,175 | ) | (65,182 | ) | (79,815 | ) | (111,215 | ) | (150,122 | ) | (179,644 | ) | ||||||||||||
|
|
|
|
|
|
|
|
|
|
|
|
|
|||||||||||||
| Loans held for investment, net |
1,506,963 | 1,544,324 | 1,670,543 | 2,057,744 | 2,520,367 | 3,229,580 | ||||||||||||||||||
| OREO, net |
56,170 | 63,460 | 84,342 | 88,841 | 90,707 | 55,436 | ||||||||||||||||||
| Premises and equipment, net |
25,459 | 24,800 | 24,469 | 25,453 | 29,127 | 43,558 | ||||||||||||||||||
| Federal Home Loan Bank stock—at cost |
11,940 | 11,940 | 25,630 | 35,792 | 54,829 | 54,829 | ||||||||||||||||||
| Mortgage servicing rights, net |
20,929 | 22,294 | 21,824 | 22,156 | 24,961 | 23,877 | ||||||||||||||||||
| Accrued interest receivable |
7,640 | 8,216 | 9,563 | 12,075 | 16,353 | 20,158 | ||||||||||||||||||
| Other assets |
14,250 | 13,087 | 17,831 | 22,760 | 20,612 | 40,939 | ||||||||||||||||||
|
|
|
|
|
|
|
|
|
|
|
|
|
|||||||||||||
| Total assets |
$ | 2,121,249 | $ | 2,112,474 | $ | 2,367,583 | $ | 2,789,452 | $ | 3,394,825 | $ | 4,416,265 | ||||||||||||
|
|
|
|
|
|
|
|
|
|
|
|
|
|||||||||||||
| Liabilities and Stockholders’ Equity (Deficit) |
||||||||||||||||||||||||
| Deposits |
||||||||||||||||||||||||
| Non-interest bearing |
$ | 276,829 | $ | 259,926 | $ | 267,732 | $ | 264,700 | $ | 240,671 | $ | 285,374 | ||||||||||||
| Interest bearing |
1,596,411 | 1,615,367 | 1,757,293 | 2,000,201 | 2,458,762 | 3,251,322 | ||||||||||||||||||
|
|
|
|
|
|
|
|
|
|
|
|
|
|||||||||||||
| Total deposits |
1,873,240 | 1,875,293 | 2,025,025 | 2,264,901 | 2,699,433 | 3,536,696 | ||||||||||||||||||
| Other borrowed funds |
13,781 | 12,877 | 317,225 | 476,103 | 659,005 | 796,832 | ||||||||||||||||||
| Accrued interest and fees payable |
393 | 415 | 61,290 | 43,327 | 28,319 | 19,468 | ||||||||||||||||||
| Accrued taxes, insurance and employee related expenses |
5,586 | 7,302 | 6,389 | 6,385 | 6,609 | 8,744 | ||||||||||||||||||
| Other liabilities |
16,742 | 14,389 | 17,518 | 28,286 | 14,630 | 12,311 | ||||||||||||||||||
|
|
|
|
|
|
|
|
|
|
|
|
|
|||||||||||||
| Total liabilities |
1,909,742 | 1,910,276 | 2,427,447 | 2,819,002 | 3,407,996 | 4,374,051 | ||||||||||||||||||
|
|
|
|
|
|
|
|
|
|
|
|
|
|||||||||||||
| Commitments and contingent liabilities |
||||||||||||||||||||||||
| Preferred stock, $0.01 par value, 100,000 shares authorized, no shares issued and outstanding at June 30, 2014 and $0.10 par value, 5,000,000 shares authorized, 110,000 shares issued and outstanding prior to September 27, 2013 |
— | — | 103,833 | 96,421 | 89,008 | 81,596 | ||||||||||||||||||
| Common stock, $0.01 par value, 11,900,000 shares authorized, 9,050,000 shares issued at June 30, 2014 and $0.10 par value, 100,000,000 shares authorized prior to September 27, 2013 |
91 | 91 | 2,536 | 2,536 | 2,536 | 2,536 | ||||||||||||||||||
| Additional paid-in capital |
188,370 | 188,370 | 110,034 | 110,402 | 111,513 | 114,662 | ||||||||||||||||||
| Retained earnings (deficit) |
24,896 | 20,359 | (189,097 | ) | (147,513 | ) | (103,362 | ) | (54,677 | ) | ||||||||||||||
| Accumulated other comprehensive income (loss) related to AFS securities |
(1,738 | ) | (6,378 | ) | 3,918 | 3,628 | (16,397 | ) | 507 | |||||||||||||||
| Accumulated other comprehensive loss related to OTTI securities—noncredit factors |
(112 | ) | (244 | ) | (339 | ) | (3,496 | ) | (3,555 | ) | (5,906 | ) | ||||||||||||
|
|
|
|
|
|
|
|
|
|
|
|
|
|||||||||||||
| Total accumulated other comprehensive income (loss) |
(1,850 | ) | (6,622 | ) | 3,579 | 132 | (19,952 | ) | (5,399 | ) | ||||||||||||||
| Treasury stock, at cost |
— | — | (89,848 | ) | (90,259 | ) | (90,534 | ) | (90,975 | ) | ||||||||||||||
| Deferred compensation obligation |
— | — | (901 | ) | (1,269 | ) | (2,380 | ) | (5,529 | ) | ||||||||||||||
|
|
|
|
|
|
|
|
|
|
|
|
|
|||||||||||||
| Total stockholders’ equity (deficit) |
211,507 | 202,198 | (59,864 | ) | (29,550 | ) | (13,171 | ) | 42,214 | |||||||||||||||
|
|
|
|
|
|
|
|
|
|
|
|
|
|||||||||||||
| Total liabilities and stockholders’ equity |
$ | 2,121,249 | $ | 2,112,474 | $ | 2,367,583 | $ | 2,789,452 | $ | 3,394,825 | $ | 4,416,265 | ||||||||||||
|
|
|
|
|
|
|
|
|
|
|
|
|
|||||||||||||
40
Table of Contents
Condensed Statements of Cash Flows Data:
| Six Months Ended June 30, |
Nine Months Ended December 31, |
Fiscal Year Ended March 31, | ||||||||||||||||||||||||||||||
| 2014 | 2013 | 2013 | 2012 | 2013 | 2012 | 2011 | 2010 | |||||||||||||||||||||||||
| (In thousands) | ||||||||||||||||||||||||||||||||
| Net income (loss) |
$ | 4,537 | $ | (19,401 | ) | $ | 111,623 | $ | (20,152 | ) | $ | (34,172 | ) | $ | (36,738 | ) | $ | (41,178 | ) | $ | (176,914 | ) | ||||||||||
|
|
|
|
|
|
|
|
|
|
|
|
|
|
|
|
|
|||||||||||||||||
| Net cash provided by (used in) operating activities |
6,529 | 14,038 | 6,677 | 32,427 | 40,166 | 7,236 | 63,989 | (387,807 | ) | |||||||||||||||||||||||
| Net cash provided by investing activities |
28,571 | 87,710 | 134,323 | 284,726 | 344,144 | 746,149 | 229,019 | 1,120,398 | ||||||||||||||||||||||||
| Net cash used in financing activities |
(1,149 | ) | (51,489 | ) | (226,140 | ) | (368,853 | ) | (398,754 | ) | (617,420 | ) | (698,155 | ) | (654,255 | ) | ||||||||||||||||
|
|
|
|
|
|
|
|
|
|
|
|
|
|
|
|
|
|||||||||||||||||
| Increase (decrease) in cash and cash equivalents |
33,951 | 50,259 | (85,140 | ) | (51,700 | ) | (14,444 | ) | 135,965 | (405,147 | ) | 78,336 | ||||||||||||||||||||
| Cash and cash equivalents at beginning of year |
143,396 | 191,280 | 228,536 | 242,980 | 242,980 | 107,015 | 512,162 | 433,826 | ||||||||||||||||||||||||
|
|
|
|
|
|
|
|
|
|
|
|
|
|
|
|
|
|||||||||||||||||
| Cash and cash equivalents at end of period/year |
$ | 177,347 | $ | 241,539 | $ | 143,396 | $ | 191,280 | $ | 228,536 | $ | 242,980 | $ | 107,015 | $ | 512,162 | ||||||||||||||||
|
|
|
|
|
|
|
|
|
|
|
|
|
|
|
|
|
|||||||||||||||||
41
Table of Contents
MANAGEMENT’S DISCUSSION AND ANALYSIS
OF FINANCIAL CONDITION AND RESULTS OF OPERATIONS
The following discussion should be read in conjunction with the “Selected Historical Consolidated Financial Statements,” and our financial statements and related notes thereto included elsewhere in this prospectus. In addition to historical information, this discussion contains forward-looking statements that involve risks, uncertainties and assumptions that could cause actual results to differ materially from management’s expectations. Factors that could cause such differences are discussed in the sections entitled “Note Regarding Forward-Looking Statements” and “Risk Factors.” We assume no obligation to update any of these forward-looking statements.
Set forth below is management’s discussion and analysis of the consolidated results of operations and financial condition of Anchor BanCorp Wisconsin Inc. and its wholly owned subsidiaries, the Bank and Investment Directions Inc. (“IDI”), which includes information regarding significant regulatory developments and the Company’s risk management activities, including asset/liability management strategies, sources of liquidity and capital resources. This discussion should be read in conjunction with the consolidated financial statements and supplemental data contained elsewhere in this prospectus.
EXECUTIVE OVERVIEW
Headquartered in Madison, Wisconsin, Anchor BanCorp Wisconsin Inc. is a savings and loan holding company that operates primarily through the Bank, its wholly owned banking subsidiary. As of June 30, 2014, the Bank had $2.12 billion in total assets.
As a result of the economic downturn, significant operating losses beginning in fiscal 2009, significant levels of criticized assets and low levels of capital raised substantial doubt about our ability to continue as a going concern. The Company and the Bank started operating under the C&D Orders, and the Company owed $116.3 million to various Lenders led by the Administrative Agent under the Credit Agreement which it was unable to repay. Additionally, the Company obtained funds in 2009 by issuing senior preferred stock as part of the TARP. These funds were then distributed downstream to the Bank to be used to increase capital levels to absorb operating losses as a result of increasing levels of non-performing assets and higher required levels of ALLL. We continued to negotiate and obtain amendments to the Credit Agreement and diligent efforts were made to seek qualified sources of outside capital.
In 2013, we executed the following transactions associated with recapitalizing the Company and the Bank: (i) made a discounted cash payment of $49.0 million in satisfaction of the approximately $183.5 million of senior secured bank debt held by a three member bank groups led by U.S. Bank; (ii) exchanged senior preferred stock issued as part of the TARP for $6.0 million or 60.0 million common shares (adjusted to 300,000 shares as a result of the reverse stock split); (iii) issued new common stock in consideration of $175 million in new equity capital; and (iv) eliminated the legacy Common Stock for no consideration.
To effect these transactions, on the Petition Date, we filed the Chapter 11 Case in the Bankruptcy Court to implement the Plan of Reorganization in order to facilitate the restructuring of the Company and the recapitalization of the Bank. Prior to the Petition Date, U.S. Bank and Bank of America, N.A., as lenders, and the Treasury, as our sole preferred stockholder, voted to accept the Plan of Reorganization.
During the period of bankruptcy, $1.9 million of expenses were incurred and expensed as reorganization costs in the nine months ended December 31, 2013. In connection with the Private Placements, transaction costs of $14.4 million were incurred and have been recorded in the Statement of Changes in Stockholders’ Equity (Deficit).
42
Table of Contents
Financial Results
Results for interim periods are not indicative of results to be expected for any interim period or for a full year. As a result of the Recapitalization, operating results in prior periods are not indicative of results to be expected for any other period. On September 27, 2013, all Legacy Common Stock was cancelled and 1,810,000,000 shares of our common stock were issued pursuant to the Plan of Reorganization. As a result of the Reverse Stock Split on October 2, 2013, 9,050,000 shares of our common stock were outstanding. All per share data for the fiscal years ended March 31, 2013 and 2012 was calculated on the basis of the weighted average shares of Legacy Common Stock for the relevant period. With respect to the nine months ended December 31, 2013, the calculation of weighted average shares included 21,247,000 shares of Legacy Common Stock outstanding through September 26, 2013 and 9,050,000 shares of common stock outstanding from September 27 through December 31, 2013.
Results for the six months ended June 30, 2014 include:
| • | Basic and diluted earnings per share available to common equity increased to $0.50 for the six months ended June 30, 2014, compared to basic and diluted loss per share available to common equity of $1.25 for the same period in 2013; |
| • | Net income and net income available to common equity were $4.5 million for the six months ended June 30, 2014, compared to a net loss of $19.4 million and net loss available to common equity of $26.5 million for the prior year period; |
| • | Net interest margin increased 1.11% to 3.58% for the six months ended June 30, 2014, from 2.47% in the prior year period largely due to lower average balances and rates paid on borrowings. Average balances declined due to the settlement of the Credit Agreement and prepayments of FHLB of Chicago borrowings; |
| • | Loans held for investment (net of the allowance for loan losses) decreased $37.4 million, or 2.4%, since December 31, 2013 primarily due to repayments outpacing loan originations for a net decline of $54.1 million. The allowance for loan losses declined $16.0 million since December 31, 2013 and $7.7 million of loans were transferred to other real estate owned; |
| • | Total non-performing loans decreased $26.3 million, or 38.4%, to $42.2 million at June 30, 2014 from $68.5 million at December 31, 2013; |
| • | Total non-performing assets (total non-performing loans and other real estate owned) decreased $33.7 million, or 25.5%, to $98.3 million at June 30, 2014 from $132.0 million at December 31, 2013, as the Bank continues its efforts to reduce problem asset levels; |
| • | Deposits decreased $2.1 million, less than one percent, since December 31, 2013 primarily due to runoff of time deposits of $58.1 million partially offset by increases in regular savings balances of $23.0 million and seasonal increases in advance payments of $39.2 million; |
| • | The Bank was considered well capitalized as of June 30, 2014. Total risk-based capital ratio was 17.40% as of June 30, 2014, compared to 17.07% at December 31, 2013. Tier 1 leverage ratio capital was 9.75% as of June 30, 2014, compared to 9.60% at December 31, 2013; |
| • | No provision for loan losses was recorded for the six months ended June 30, 2014, a decrease from the $950,000 for the six months ended June 30, 2013; and |
| • | Delinquencies (loans past due 30 days or more) decreased $22.6 million, or 34.7%, to $42.6 million at June 30, 2014 from $65.2 million at December 31, 2013. |
43
Table of Contents
Termination of Orders to Cease and Desist
The Bank’s primary regulator is the OCC. The Federal Reserve is the primary regulator of the Company. On June 26, 2009, the Company and the Bank each consented to the issuance of the C&D Orders. On August 31, 2010, a PCA Directive was issued for the Bank. The Company Order required the Company to notify, and in certain cases to obtain the permission of, the Federal Reserve prior to making dividends or capital distributions, incurring debt, making changes to or entering into contracts with directors or executive officers. The Bank Order required the Bank to notify, or in certain cases obtain the permission of, the OCC prior to increases above a certain threshold in total assets, entering into brokered deposits, making changes to or entering into contracts with directors or executives officers, entering into certain transactions with affiliates or entering into third-party contracts outside the normal course of business and to meet and maintain both a core capital ratio and a total risk-based capital ratio.
On April 2, 2014, the Bank was notified that the Bank Order and the PCA Directive were terminated. On July 31, 2014, the Company was notified that the Company Order was terminated.
Credit Highlights
The Company has continued to see improvement in early stage and overall delinquencies during the past two years. This, coupled with the Bank’s ongoing efforts to aggressively work out of troubled credits, has led to a decline in the level of non-performing loans. At June 30, 2014, non-performing loans (consisting of loans past due more than 90 days, loans less than 90 days delinquent but placed on non-accrual status due to anticipated probable loss and non-accrual troubled debt restructurings (“TDRs”)) were $42.2 million, a decline of $26.3 million from the $68.5 million at December 31, 2013. Foreclosed properties declined $7.3 million to $56.2 million at June 30, 2014 from $63.5 million at December 31, 2013, an 11.5% decrease. Non-performing assets have had, and we expect will continue to have, a negative impact on net interest income and expenses related to managing the troubled loan portfolio and foreclosed properties.
The ALLL declined to $49.2 million at June 30, 2014 from $65.2 million at December 31, 2013, a 24.6% decrease. Net charge-offs during the six months ended June 30, 2014 were $16.0 million compared to $8.8 million during the same period in 2013. There was no provision for loan losses for the six months ended June 30, 2014 compared to $950,000 for the six months ended June 30, 2013. While the balance of the ALLL declined 24.6% during the six months ended June 30, 2014, the allowance compared to total non-performing loans was 116.6% at June 30, an increase from 95.2% at December 31, 2013 as a result of a larger decrease in non-performing loans. At June 30, 2014, the ratio of the allowance to total loans was 3.16% compared to 4.05% at December 31, 2013.
Recent Market and Industry Developments
The economic turmoil that began in the middle of 2007 and continued through 2012 appears to have settled into a slow economic recovery. At this time, the recovery has somewhat uncertain prospects. This has been accompanied by dramatic changes in the competitive landscape of the financial services industry and a wholesale reformation of the legislative and regulatory landscape with the passage of Dodd-Frank and other legislation.
Dodd-Frank is an extensive, complex and comprehensive piece of legislation that impacts many aspects of banking organizations. Dodd-Frank is likely to negatively impact our revenue and increase both the direct and indirect costs of doing business, as it includes provisions that could increase regulatory fees and deposit insurance assessments and impose heightened capital standards, while at the same time impacting the nature and costs of our businesses.
Until such time as the regulatory agencies issue proposed and final regulations implementing the numerous provisions of Dodd-Frank, a process that may last several years, management will not be able to fully assess the impact the legislation will have on its business and, accordingly, results of operations may vary from period to period.
44
Table of Contents
Selected quarterly data are set forth in the following tables.
| Three Months Ended | ||||||||||||||||
| June 30, 2014 |
March 31, 2014 |
December 31, 2013 |
September 30, 2013 |
|||||||||||||
| (Dollars in thousands—except per share amounts) | ||||||||||||||||
| Operations Data: |
||||||||||||||||
| Net interest income |
$ | 17,862 | $ | 18,315 | $ | 18,877 | $ | 15,812 | ||||||||
| Provision for loan losses |
— | — | — | — | ||||||||||||
| Non-interest income |
7,610 | 5,932 | 8,002 | 142,679 | ||||||||||||
| Non-interest expense |
22,855 | 22,317 | 23,125 | 45,232 | ||||||||||||
| Income before income tax expense |
2,617 | 1,930 | 3,754 | 113,259 | ||||||||||||
| Income tax expense |
10 | — | — | 9 | ||||||||||||
| Net income |
2,607 | 1,930 | 3,754 | 113,250 | ||||||||||||
| Preferred stock dividends in arrears(1) |
— | — | — | 103,163 | ||||||||||||
| Preferred stock discount accretion |
— | — | — | (4,304 | ) | |||||||||||
| Net income available to common equity |
2,607 | 1,930 | 3,754 | 212,109 | ||||||||||||
| Selected Financial Ratios(2): |
||||||||||||||||
| Yield on interest-earning assets |
3.72 | % | 3.89 | % | 3.86 | % | 3.80 | % | ||||||||
| Cost of funds |
0.23 | 0.25 | 0.27 | 0.89 | ||||||||||||
| Interest rate spread |
3.49 | 3.64 | 3.59 | 2.91 | ||||||||||||
| Net interest margin |
3.51 | 3.66 | 3.61 | 2.88 | ||||||||||||
| Return on average assets |
0.49 | 0.37 | 0.69 | 19.76 | ||||||||||||
| Average equity to average assets |
9.88 | 9.81 | 9.32 | (2.67 | ) | |||||||||||
| Non-interest expense to average assets |
4.33 | 4.32 | 4.24 | 7.89 | ||||||||||||
| Per Share: |
||||||||||||||||
| Basic earnings per common share |
$ | 0.29 | $ | 0.21 | $ | 0.41 | $ | 10.24 | ||||||||
| Diluted earnings per common share |
0.29 | 0.21 | 0.41 | 10.24 | ||||||||||||
| Dividends per common share |
— | — | — | — | ||||||||||||
| Book value per common share |
23.37 | 22.84 | 22.34 | 22.21 | ||||||||||||
| Financial Condition: |
||||||||||||||||
| Total assets |
$ | 2,121,249 | $ | 2,109,824 | $ | 2,112,474 | $ | 2,191,001 | ||||||||
| Loans receivable |
||||||||||||||||
| Held for sale |
5,261 | 2,944 | 3,085 | 4,571 | ||||||||||||
| Held for investment, net |
1,506,963 | 1,513,720 | 1,544,324 | 1,582,554 | ||||||||||||
| Deposits |
1,873,240 | 1,868,751 | 1,875,293 | 1,943,144 | ||||||||||||
| Other borrowed funds |
13,781 | 13,210 | 12,877 | 19,748 | ||||||||||||
| Stockholders’ equity |
211,507 | 206,708 | 202,198 | 201,037 | ||||||||||||
| Allowance for loan losses |
49,175 | 53,497 | 65,182 | 71,853 | ||||||||||||
| Non-performing assets(3) |
98,337 | 102,118 | 131,957 | 162,899 | ||||||||||||
| (1) | The September 30, 2013 figure includes $104.0 million for retirement of preferred shares under the Plan of Reorganization and the figures for all periods include compounding. |
| (2) | Annualized when appropriate. |
| (3) | Non-performing assets consist of loans past due ninety days or more and on non-accrual status, loans past due less than ninety days but placed on non-accrual status due to anticipated probable loss, non-accrual troubled debt restructurings and OREO. |
45
Table of Contents
RESULTS OF OPERATIONS
The following results should be read in conjunction with the “Selected Historical Consolidated Financial Statements” section and the consolidated financial statements included elsewhere in this prospectus.
Comparison of Six Months Ended June 30, 2014 and 2013
Net results from operations for the six months ended June 30, 2014 improved $23.9 million to net income of $4.5 million from a net loss of $19.4 million in the prior year period. The improvement in results was primarily the result of a $17.9 million decline in non-interest expense and an increase in net interest income of $7.9 million compared to the six months ended June 30, 2013. Non-interest income was lower than the prior year period by $2.8 million. The discussion that follows in this section provides additional details regarding these results for the six month periods.
46
Table of Contents
Net Interest Income
The following table shows the Company’s average balances, interest, average rates, the spread between the combined average rates earned on interest-earning assets and average cost of interest-bearing liabilities, net interest margin, which represents net interest income as a percentage of average interest-earning assets, and the ratio of average interest-earning assets to average interest-bearing liabilities for the periods indicated. The average balances are derived from daily balances.
| Six Months Ended June 30, | ||||||||||||||||||||||||
| 2014 | 2013 | |||||||||||||||||||||||
| Average Balance |
Interest | Average Yield/ Cost(1) |
Average Balance |
Interest | Average Yield/ Cost(1) |
|||||||||||||||||||
| (Dollars in thousands) | ||||||||||||||||||||||||
| Interest-Earning Assets |
||||||||||||||||||||||||
| Mortgage loans |
$ | 1,199,339 | $ | 26,116 | 4.33 | % | $ | 1,340,668 | $ | 30,113 | 4.47 | % | ||||||||||||
| Consumer loans |
356,456 | 8,502 | 4.81 | 414,500 | 10,004 | 4.87 | ||||||||||||||||||
| Commercial business loans |
21,624 | 579 | 5.33 | 25,426 | 837 | 6.55 | ||||||||||||||||||
|
|
|
|
|
|
|
|
|
|||||||||||||||||
| Total loans receivable(2) (3) |
1,577,419 | 35,197 | 4.44 | 1,780,594 | 40,954 | 4.57 | ||||||||||||||||||
| Investment securities(4) |
286,865 | 3,027 | 2.10 | 267,250 | 2,675 | 1.99 | ||||||||||||||||||
| Interest-earning deposits |
130,488 | 159 | 0.25 | 184,105 | 225 | 0.25 | ||||||||||||||||||
| Federal Home Loan Bank stock |
11,940 | 35 | 0.59 | 25,630 | 38 | 0.30 | ||||||||||||||||||
|
|
|
|
|
|
|
|
|
|||||||||||||||||
| Total interest-earning assets |
2,006,712 | 38,418 | 3.81 | 2,257,579 | 43,892 | 3.87 | ||||||||||||||||||
| Non-interest-earning assets |
98,688 | 104,109 | ||||||||||||||||||||||
|
|
|
|
|
|||||||||||||||||||||
| Total assets |
$ | 2,105,400 | $ | 2,361,688 | ||||||||||||||||||||
|
|
|
|
|
|||||||||||||||||||||
| Interest-Bearing Liabilities |
||||||||||||||||||||||||
| Demand deposits |
$ | 1,013,413 | 602 | 0.12 | $ | 1,031,260 | 667 | 0.13 | ||||||||||||||||
| Regular savings |
328,487 | 173 | 0.11 | 310,148 | 165 | 0.11 | ||||||||||||||||||
| Certificates of deposit |
519,577 | 1,346 | 0.52 | 667,744 | 2,382 | 0.72 | ||||||||||||||||||
|
|
|
|
|
|
|
|
|
|||||||||||||||||
| Total deposits |
1,861,477 | 2,121 | 0.23 | 2,009,152 | 3,214 | 0.32 | ||||||||||||||||||
| Other borrowed funds |
14,968 | 120 | 1.59 | 318,894 | 12,441 | 7.87 | ||||||||||||||||||
|
|
|
|
|
|
|
|
|
|||||||||||||||||
| Total interest-bearing liabilities |
1,876,445 | 2,241 | 0.24 | 2,328,046 | 15,655 | 1.36 | ||||||||||||||||||
|
|
|
|||||||||||||||||||||||
| Non-interest-bearing liabilities |
21,650 | 88,793 | ||||||||||||||||||||||
|
|
|
|
|
|||||||||||||||||||||
| Total liabilities |
1,898,095 | 2,416,839 | ||||||||||||||||||||||
| Stockholders’ equity (deficit) |
207,305 | (55,151 | ) | |||||||||||||||||||||
|
|
|
|
|
|||||||||||||||||||||
| Total liabilities and stockholders’ equity (deficit) |
$ | 2,105,400 | $ | 2,361,688 | ||||||||||||||||||||
|
|
|
|
|
|||||||||||||||||||||
| Net interest income/interest rate spread(5) |
$ | 36,177 | 3.57 | % | $ | 28,237 | 2.51 | % | ||||||||||||||||
|
|
|
|
|
|
|
|
|
|||||||||||||||||
| Net interest-earning assets |
$ | 130,267 | $ | (70,467 | ) | |||||||||||||||||||
|
|
|
|
|
|||||||||||||||||||||
| Net interest margin(6) |
3.58 | % | 2.47 | % | ||||||||||||||||||||
|
|
|
|
|
|||||||||||||||||||||
| Ratio of average interest-earning assets to average interest-bearing liabilities |
1.07 | 0.97 | ||||||||||||||||||||||
|
|
|
|
|
|||||||||||||||||||||
| (1) | Annualized. |
| (2) | For the purpose of these computations, non-accrual loans are included in the average loan amounts outstanding. |
| (3) | Interest earned on loans includes loan fees (which are not material in amount) and interest income which has been received from borrowers whose loans were removed from non-accrual status during the period indicated. |
47
Table of Contents
| (4) | Average balances of securities available-for-sale are based on fair value. |
| (5) | Interest rate spread represents the difference between the weighted-average yield on interest-earning assets and the weighted-average cost of interest-bearing liabilities and is represented on a fully tax equivalent basis if applicable. |
| (6) | Net interest margin represents net interest income as a percentage of average interest-earning assets. |
Net interest income increased $7.9 million, or 28.1%, for the six months ended June 30, 2014, as compared to the same period in the prior year. Interest income decreased $5.5 million, or 12.5%, for the six months ended June 30, 2014, compared to the same period in the prior year, due to declines in average balances and yields in all loan categories but primarily declines in the residential and commercial real estate loan portfolios. Investment securities average balance and yield increased modestly over the prior year period. Interest expense declined $13.4 million, or 85.7%, for the six months ended June 30, 2014, as compared to the same period in the prior year due to the settlement of the credit agreement with U.S. Bank and prepayment of FHLB of Chicago borrowings resulting in lower borrowed funds balances and a reduction in certificate of deposit average balances and the rate paid on these accounts. The net interest margin increased to 3.58% for the six month period ended June 30, 2014 from 2.47% for the respective period in the prior year.
Loan portfolio average balances declined $203.2 million from June 30, 2013 largely due to principal and interest payments net of new loan originations and loan sales. New loan originations had been limited as part of our capital improvement strategy to reduce risk-weighted assets by shrinking the overall size of the balance sheet. However, as problem loans have been steadily rolling off, we are now replacing them but at a slower rate with the intent of generating new loan volume to improve the net interest margin. Investment securities average balances increased $19.6 million primarily due to the purchase of securities totaling $37.8 million since June 30, 2013, partially offset by sales, maturities and principal collections of $24.4 million. The average balance of interest-earning deposits declined $53.6 million as the flow of funds from the loan and investment securities portfolios were used to reinvest in higher yielding investment securities and fund deposit run off.
Other borrowed funds average balances declined by $303.9 million for the six months ended June 30, 2014 when compared to the same period in the prior year primarily due to the payoff and settlement of $116.3 million under the Credit Agreement and prepayment of $187.5 million of FHLB of Chicago borrowings during the quarter ended September 30, 2013. The average balance of certificates of deposit decreased $148.2 million for the six months ended June 30, 2014 compared to the same period in the previous year. Likewise, the average rate paid on certificates of deposit fell by 20 basis points year over year. The decline in certificates of deposit average balances and interest rates was largely the result of lower rates offered in the market and pricing discipline as a result of reduced funding needs.
Provision for Loan Losses
Provision for loan losses was zero, a decrease of $950,000 for the six month period ended June 30, 2014, as compared to the same period in the previous year. Non-performing loans totaled $42.2 million at June 30, 2014, down from $68.5 million at December 31, 2013.
The decrease in provision for loan losses for the six months ended June 30, 2014 was due to reduced loan balances compared to the same period in the prior year, particularly non-performing loans which carry a greater loan provision. In addition, reduced net charge-offs resulted in no additional provision being required for the six months ending June 30, 2014. Future provisions for loan losses will continue to be based upon management’s assessment of the overall loan portfolio and the underlying collateral, trends in non-performing loans, current economic conditions and other relevant factors in order to maintain the ALLL at adequate levels to provide for probable and estimable future losses. The establishment of the amount of the loan loss allowance inherently involves judgments by management as to the adequacy of the allowance, which ultimately may change. Higher rates of loan defaults than anticipated would likely result in a need to increase the provision for loan losses recorded in the consolidated statements of operations in future periods. Conversely, the amount of provision recorded could decline or a reversal of expense may be warranted should credit metrics such as net charge-offs and the amount of non-performing loans or economic conditions continue to improve in the future.
48
Table of Contents
Non-Interest Income
The following table presents non-interest income by major category for the periods indicated:
| Six Months Ended June 30, |
Increase (Decrease) | |||||||||||||||
| 2014 | 2013 | Amount | Percent | |||||||||||||
| (Dollars in thousands) | ||||||||||||||||
| Net impairment losses recognized in earnings |
$ | (34 | ) | $ | (83 | ) | $ | 49 | 59.0 | % | ||||||
| Loan servicing income (loss), net of amortization |
1,514 | 110 | 1,404 | N/M | ||||||||||||
| Service charges on deposits |
4,789 | 4,949 | (160 | ) | (3.2 | ) | ||||||||||
| Investment and insurance commissions |
1,987 | 2,015 | (28 | ) | (1.4 | ) | ||||||||||
| Net gain on sale of loans |
1,290 | 5,823 | (4,533 | ) | (77.8 | ) | ||||||||||
| Net gain on sale of investment securities |
301 | (200 | ) | 501 | N/M | |||||||||||
| Net gain on sale of OREO |
1,201 | 2,262 | (1,061 | ) | (46.9 | ) | ||||||||||
| Other income |
2,494 | 1,479 | 1,015 | 68.6 | ||||||||||||
|
|
|
|
|
|
|
|
|
|||||||||
| Total non-interest income |
$ | 13,542 | $ | 16,355 | $ | (2,813 | ) | (17.2 | %) | |||||||
|
|
|
|
|
|
|
|
|
|||||||||
N/M means “Not Meaningful.”
Non-interest income decreased $2.8 million, or 17.2%, to $13.5 million for the six months ended June 30, 2014, compared to $16.4 million for the same period in 2013. The decrease was primarily due to declines in gain on sale of loans of $4.5 million and net gain on sale of OREO of $1.1 million. These unfavorable items were partially offset by increases in loan servicing income of $1.4 million, other income of $1.0 million, and gain on sale of securities of $501,000.
The decrease in net gain on sale of loans of $4.5 million was primarily attributable to a significantly lower volume of residential mortgage loan sales in the current year period of $57.0 million compared to $312.8 million in the same six month period a year ago. Market mortgage rates reached historic lows during the fourth calendar quarter of 2012 into the first quarter of 2013 and have increased significantly since March 31, 2013, which caused a reduction in financing activity resulting in decreased sales volume. Net gain on sale of OREO decreased by $1.1 million in the six months ended June 30, 2014 from $2.3 million in the prior year same period largely due to the impact of lower sales volume with smaller gains per property.
Loan servicing income increased $1.4 million in the current period compared to the respective period a year ago primarily due to lower amortization charges related to the MSR asset. Other income increased by $1.0 million over the prior year due to income from real estate partnerships, increased rental income of bank property and increased credit card income. Sales of investment securities reflect a $301,000 gain during the six months ended June 30, 2014 compared to a loss of $200,000 in the same period in 2013.
49
Table of Contents
Non-Interest Expense
The following table presents non-interest expense by major category for the periods indicated:
| Six Months Ended June 30, |
Increase (Decrease) | |||||||||||||||
| 2014 | 2013 | Amount | Percent | |||||||||||||
| (Dollars in thousands) | ||||||||||||||||
| Compensation and benefits |
$ | 21,901 | $ | 21,272 | $ | 629 | 3.0 | % | ||||||||
| Occupancy |
3,852 | 4,297 | (445 | ) | (10.4 | ) | ||||||||||
| Furniture and equipment |
1,557 | 1,612 | (55 | ) | (3.4 | ) | ||||||||||
| Federal deposit insurance premiums |
1,748 | 2,686 | (938 | ) | (34.9 | ) | ||||||||||
| Data processing |
2,686 | 3,282 | (596 | ) | (18.2 | ) | ||||||||||
| Communications |
1,036 | 948 | 88 | 9.3 | ||||||||||||
| Marketing |
1,532 | 902 | 630 | 69.8 | ||||||||||||
| OREO expense, net |
3,452 | 16,548 | (13,096 | ) | (79.1 | ) | ||||||||||
| Investor loss reimbursement |
(86 | ) | 3,181 | (3,267 | ) | N/M | ||||||||||
| Mortgage servicing rights impairment (recovery) |
95 | (3,448 | ) | 3,543 | N/M | |||||||||||
| Provision for unfunded loan commitments |
780 | 2,159 | (1,379 | ) | (63.9 | ) | ||||||||||
| Loan processing and servicing expense |
1,276 | 2,194 | (918 | ) | (41.8 | ) | ||||||||||
| Legal services |
955 | 2,371 | (1,416 | ) | (59.7 | ) | ||||||||||
| Other professional fees |
758 | 1,154 | (396 | ) | (34.3 | ) | ||||||||||
| Insurance |
516 | 794 | (278 | ) | (35.0 | ) | ||||||||||
| Other expense |
3,114 | 3,091 | 23 | 0.7 | ||||||||||||
|
|
|
|
|
|
|
|
|
|||||||||
| Total non-interest expense |
$ | 45,172 | $ | 63,043 | $ | (17,871 | ) | (28.3 | )% | |||||||
|
|
|
|
|
|
|
|
|
|||||||||
N/M means “Not Meaningful.”
Non-interest expense decreased $17.9 million, or 28.3%, to $45.2 million for the six months ended June 30, 2014, as compared to $63.0 million for the respective period in 2013. The decrease was primarily due to lower OREO expense, net, investor loss reimbursement, legal services and provision for unfunded loan commitments. These decreases were partly offset by an increase in mortgage servicing rights impairment of $3.5 million due to a recovery recorded in the current year period.
The significant decline in OREO expense of $13.1 million during the six months ended June 30, 2014 was primarily the result of a decline of $9.3 million in valuation adjustments on repossessed property. OREO real estate taxes also declined by $2.5 million over the prior year period. Investor loss reimbursement declined due to a $1.7 million reserve was recorded in the prior year period. Legal fees declined $1.4 million due to lower expense related to commercial loan workouts as non-performing loans continue to decline. The prior year provision for unfunded loan commitments included a specific reserve of $1.7 million related to one credit. Most other categories of expense reflected declines over the prior year period in part due to ongoing expense control efforts.
MSR impairment expense was $95,000 in the six months ended June 30, 2014 as rates have increased and prepayment has slowed versus a recovery of $3.4 million in the prior year period. Other increases include marketing expense of $630,000 which has been ramped up to support the growth objectives of the bank and compensation and benefits have increased $629,000 as new commercial lending staff has been added to support commercial banking growth initiatives.
Income Taxes
Income tax expense of $10,000 was recorded for the six month period ended June 30, 2014 compared to no expense for the same period in 2013. While previously unrecognized net operating loss carryforwards were used to substantially offset taxable income, some states in which we operate have a minimum tax requirement which resulted in $10,000 of tax expense in the current period. A full valuation allowance has been recorded on the remaining net deferred tax asset due to the uncertainty of our ability to create sufficient taxable income to utilize the tax asset.
50
Table of Contents
Comparison of Nine Months Ended December 31, 2013 and 2012
Net results from operations for the nine months ended December 31, 2013 improved $131.8 million to net income of $111.6 million from a net loss of $20.2 million in the prior year period. The improvement in results was primarily the result of $134.5 extinguishment of debt related to the payoff and settlement of the Credit Agreement and a decline in provision for loan losses of $6.8 million. Non-interest income was lower than the prior year period by $13.4 million when excluding the $134.5 extinguishment of debt. Other positive effects on earnings were lower non-interest expense which declined by $3.6 million and higher net interest income which increased by $443,000 when compared to the nine month period ended December 31, 2012. The discussion that follows in this section provides additional details regarding these results for the nine month periods.
Net Interest Income
The following table shows the Company’s average balances, interest, average rates, the spread between the combined average rates earned on interest-earning assets and average cost of interest-bearing liabilities, net interest margin, which represents net interest income as a percentage of average interest-earning assets, and the ratio of average interest-earning assets to average interest-bearing liabilities for the years indicated. The average balances are derived from daily balances.
| Nine Months Ended December 31, | ||||||||||||||||||||||||
| 2013 | 2012 | |||||||||||||||||||||||
| Average Balance |
Interest | Average Yield/ Cost (1) |
Average Balance |
Interest | Average Yield/ Cost (1) |
|||||||||||||||||||
| (Dollars in thousands) | ||||||||||||||||||||||||
| Interest-earning assets |
||||||||||||||||||||||||
| Mortgage loans |
$ | 1,509,105 | $ | 50,712 | 4.48 | % | $ | 1,789,331 | $ | 63,159 | 4.71 | % | ||||||||||||
| Consumer loans |
156,729 | 5,730 | 4.87 | 228,205 | 7,799 | 4.56 | ||||||||||||||||||
| Commercial business loans |
24,374 | 1,260 | 6.89 | 25,988 | 1,189 | 6.10 | ||||||||||||||||||
|
|
|
|
|
|
|
|
|
|||||||||||||||||
| Total loans receivable(2)(3) |
1,690,208 | 57,702 | 4.55 | 2,043,524 | 72,147 | 4.71 | ||||||||||||||||||
| Investment securities(4) |
283,183 | 4,102 | 1.93 | 242,985 | 4,401 | 2.41 | ||||||||||||||||||
| Interest-bearing deposits |
184,397 | 342 | 0.25 | 289,255 | 541 | 0.25 | ||||||||||||||||||
| Federal Home Loan Bank stock |
23,141 | 77 | 0.44 | 28,930 | 77 | 0.35 | ||||||||||||||||||
|
|
|
|
|
|
|
|
|
|||||||||||||||||
| Total interest-earning assets |
2,180,929 | 62,223 | 3.80 | 2,604,694 | 77,166 | 3.95 | ||||||||||||||||||
| Non-interest-earning assets |
94,038 | 101,689 | ||||||||||||||||||||||
|
|
|
|
|
|||||||||||||||||||||
| Total assets |
$ | 2,274,967 | $ | 2,706,383 | ||||||||||||||||||||
|
|
|
|
|
|||||||||||||||||||||
| Interest-bearing liabilities |
||||||||||||||||||||||||
| Demand deposits |
$ | 1,021,637 | 892 | 0.12 | $ | 1,039,010 | 1,324 | 0.17 | ||||||||||||||||
| Regular savings |
344,238 | 294 | 0.11 | 282,288 | 277 | 0.13 | ||||||||||||||||||
| Certificates of deposit |
602,808 | 2,922 | 0.65 | 861,899 | 7,013 | 1.08 | ||||||||||||||||||
|
|
|
|
|
|
|
|
|
|||||||||||||||||
| Total deposits |
1,968,683 | 4,108 | 0.28 | 2,183,197 | 8,614 | 0.53 | ||||||||||||||||||
| Other borrowed funds |
211,747 | 10,009 | 6.30 | 467,709 | 20,889 | 5.95 | ||||||||||||||||||
|
|
|
|
|
|
|
|
|
|||||||||||||||||
| Total interest-bearing liabilities |
2,180,430 | 14,117 | 0.86 | 2,650,906 | 29,503 | 1.48 | ||||||||||||||||||
|
|
|
|
|
|||||||||||||||||||||
| Non-interest-bearing liabilities |
67,534 | 85,736 | ||||||||||||||||||||||
|
|
|
|
|
|||||||||||||||||||||
| Total liabilities |
2,247,964 | 2,736,642 | ||||||||||||||||||||||
| Stockholders’ equity (deficit) |
27,003 | (30,259 | ) | |||||||||||||||||||||
|
|
|
|
|
|||||||||||||||||||||
| Total liabilities and stockholders’ equity (deficit) |
$ | 2,274,967 | $ | 2,706,383 | ||||||||||||||||||||
|
|
|
|
|
|||||||||||||||||||||
| Net interest income/interest rate spread(5) |
$ | 48,106 | 2.94 | % | $ | 47,663 | 2.47 | % | ||||||||||||||||
|
|
|
|
|
|
|
|
|
|||||||||||||||||
| Net interest-earning assets |
$ | 499 | $ | (46,212 | ) | |||||||||||||||||||
|
|
|
|
|
|||||||||||||||||||||
| Net interest margin(6) |
2.94 | % | 2.44 | % | ||||||||||||||||||||
|
|
|
|
|
|||||||||||||||||||||
| Ratio of average interest-earning assets to average interest-bearing liabilities |
1.00 | 0.98 | ||||||||||||||||||||||
|
|
|
|
|
|||||||||||||||||||||
51
Table of Contents
| (1) | Annualized. |
| (2) | For the purpose of these computations, non-accrual loans were included in the daily average loan amounts outstanding. |
| (3) | Interest earned on loans includes loan fees (which are not material in amount) and interest income, which has been received from borrowers whose loans were removed from non-accrual status during the period indicated. |
| (4) | Average balances of securities available-for-sale are based on fair value. |
| (5) | Interest rate spread represents the difference between the weighted-average yield on interest-earning assets and the weighted-average cost of interest-bearing liabilities and is represented on a fully tax equivalent basis, if applicable. |
| (6) | Net interest margin represents net interest income as a percentage of average interest-earning assets. |
Rate/Volume Analysis
The most significant impact on the Company’s net interest income between periods is derived from the interaction of changes in the volume of and rates earned or paid on interest-earning assets and interest-bearing liabilities. The volume of investments in loans and securities, compared to the volume of interest-bearing liabilities represented by deposits and borrowings, combined with the spread, produces the changes in net interest income between periods. The following table shows the relative contribution of the changes in average volume and average interest rates on changes in net interest income for the periods indicated. Information is provided with respect to the effects on net interest income attributable to (i) changes in rate (changes in rate multiplied by prior volume) and (ii) changes in volume (changes in volume multiplied by prior rate). The change in interest income (tax equivalent, if applicable) due to both rate and volume have been allocated to rate and volume changes in proportion to the relationship of the absolute dollar amounts of the change in each.
| Nine Months Ended December 31, 2013 Compared to Nine Months Ended December 31, 2012 |
||||||||||||
| Rate | Volume | Net | ||||||||||
| Interest-earning assets |
||||||||||||
| Mortgage loans |
$ | (2,919 | ) | $ | (9,528 | ) | $ | (12,447 | ) | |||
| Consumer loans |
513 | (2,582 | ) | (2,069 | ) | |||||||
| Commercial business loans |
148 | (77 | ) | 71 | ||||||||
|
|
|
|
|
|
|
|||||||
| Total loans receivable |
(2,258 | ) | (12,187 | ) | (14,445 | ) | ||||||
| Investment securities |
(961 | ) | 662 | (299 | ) | |||||||
| Interest-bearing deposits |
(5 | ) | (194 | ) | (199 | ) | ||||||
| Federal Home Loan Bank stock |
17 | (17 | ) | — | ||||||||
|
|
|
|
|
|
|
|||||||
| Total decrease in interest income |
(3,207 | ) | (11,736 | ) | (14,943 | ) | ||||||
| Interest-bearing liabilities |
||||||||||||
| Demand deposits |
(410 | ) | (22 | ) | (432 | ) | ||||||
| Regular savings |
(39 | ) | 56 | 17 | ||||||||
| Certificates of deposit |
(2,346 | ) | (1,745 | ) | (4,091 | ) | ||||||
|
|
|
|
|
|
|
|||||||
| Total deposits |
(2,795 | ) | (1,711 | ) | (4,506 | ) | ||||||
| Other borrowed funds |
1,155 | (12,035 | ) | (10,880 | ) | |||||||
|
|
|
|
|
|
|
|||||||
| Total decrease in interest expense |
(1,640 | ) | (13,746 | ) | (15,386 | ) | ||||||
|
|
|
|
|
|
|
|||||||
| Total increase (decrease) in net interest income |
$ | (1,567 | ) | $ | 2,010 | $ | 443 | |||||
|
|
|
|
|
|
|
|||||||
52
Table of Contents
Net interest income increased $443,000, or 0.9%, for the nine months ended December 31, 2013, as compared to the same period in the prior year. Interest income decreased $14.9 million, or 19.4%, for the nine months ended December 31, 2013, compared to the same period in the prior year, primarily due to a decline in average balances and yields in the residential and commercial real estate loan portfolios, a decline in average balances of consumer loans, and lower investment securities yields. Interest expense decreased $15.4 million, or 52.2%, for the nine months ended December 31, 2013, as compared to the same period in the prior year due to lower borrowed funds balances and a reduction in certificate of deposit average balances and the rate paid on these accounts. The net interest margin increased to 2.94% for the nine month period ended December 31, 2013 from 2.44% for the respective period in the prior year.
Loan portfolio average balances declined $353.3 million in the nine months ending December 31, 2013 compared to the same period a year ago largely due to scheduled principal payments, prepayments of principal and transfers to OREO. New loan originations had been limited as part of our capital improvement strategy to reduce risk-weighted assets by shrinking the overall size of the balance sheet. However, we have recently developed and are implementing strategies to increase profitability by slowing asset runoff and generating new loan volume to improve the net interest margin. Investment securities average balances increased $40.2 million primarily due to the purchase of securities totaling $63.3 million since March 31, 2013, partially offset by sales, maturities and principal collections in the past nine months. The average balance of interest-earning deposits decreased $104.9 million as the flow of funds from the loan and investment securities portfolios were used to reinvest in higher yielding investment securities, fund deposit run off and payoff of borrowings.
Other borrowed funds average balances declined by $256.0 million for the nine months ended December 31, 2013 when compared to the same period in the prior year primarily due to the payoff and settlement of $116.3 million under the Credit Agreement and $187.5 million of FHLB of Chicago borrowings during the quarter ended September 30, 2013. The average balance of certificates of deposit decreased $259.1 million for the nine months ended December 31, 2013 compared to the same period in the previous year. Likewise, the average rate paid on certificates of deposit fell by 43 basis points year over year. The decline in certificate of deposit average balances and interest rates was largely the result of lower rates offered in the market due to reduced funding needs and improved deposit pricing disciplines.
Provision for Loan Losses
Provision for loan losses decreased $6.8 million for the nine month period ended December 31, 2013, as compared to the same period in the previous year. Non-performing loans totaled $68.5 million at December 31, 2013, down from $118.8 million at March 31, 2013.
The decrease in provision for loan losses for the nine months ended December 31, 2013 was due to lower levels of non-performing loans and lower net charges-offs for the period. In addition, the decrease was partly due to the impact of lower net charge-offs in the quarter ended December 31, 2013 of $6.7 million that replaced net charge-offs of $15.8 million in the quarter ended December 31, 2011 in the trailing eight quarter net charge-off history used in the determination of the general component of the ALLL. The provision for loan losses attributable to substandard and impaired loans was favorably impacted by the steady quarter-over-quarter decrease in non-performing loans since March 2010.
Future provisions for loan losses will continue to be based upon management’s assessment of the overall loan portfolio and the underlying collateral, trends in non-performing loans, current economic conditions and other relevant factors in order to maintain the ALLL at adequate levels to provide for probable and estimable future losses. The establishment of the amount of the loan loss allowance inherently involves judgments by management as to the adequacy of the allowance, which ultimately may change. Higher rates of loan defaults than anticipated would likely result in a need to increase provisions in future periods. Conversely, the provision for loan losses may decline should credit metrics such as net charge-offs and the amount of non-performing loans improve in the future.
53
Table of Contents
Non-Interest Income
The following table presents non-interest income by major category for the periods indicated:
| Nine Months Ended December 31, |
Increase (Decrease) | |||||||||||||||
| 2013 | 2012 | Amount | Percent | |||||||||||||
| (Dollars in thousands) | ||||||||||||||||
| Net impairment losses recognized in earnings |
$ | (23 | ) | $ | (325 | ) | $ | 302 | 92.9 | % | ||||||
| Loan servicing income (loss), net of amortization |
1,382 | (1,947 | ) | 3,329 | N/M | |||||||||||
| Service charges on deposits |
7,751 | 8,066 | (315 | ) | (3.9 | ) | ||||||||||
| Investment and insurance commissions |
2,965 | 2,942 | 23 | 0.8 | ||||||||||||
| Net gain on sale of loans |
5,086 | 20,165 | (15,079 | ) | (74.8 | ) | ||||||||||
| Net gain on sale and call of investment securities |
292 | (47 | ) | 339 | N/M | |||||||||||
| Net gain on sale of OREO |
3,260 | 5,539 | (2,279 | ) | (41.1 | ) | ||||||||||
| Extinguishment of debt |
134,514 | — | 134,514 | N/M | ||||||||||||
| Other income |
4,306 | 4,005 | 301 | 7.5 | ||||||||||||
|
|
|
|
|
|
|
|
|
|||||||||
| Total non-interest income |
$ | 159,533 | $ | 38,398 | $ | 121,135 | N/M | |||||||||
|
|
|
|
|
|
|
|
|
|||||||||
N/M means “Not Meaningful.”
Non-interest income increased $121.1 million to $159.5 million for the nine months ended December 31, 2013, compared to $38.4 million for the respective period in 2012. The increase was primarily due to the $134.5 extinguishment of debt resulting from the payoff and settlement of the Credit Agreement and $3.3 million increase in loan servicing income due to a loss recorded in the prior year period. These favorable items were partially reduced by a $15.1 million decline in net gain on sale of loans and a $2.3 million decline in gains on the sale of OREO.
The loan servicing increase of $3.3 million in the current period compared to the respective period a year ago was primarily due to lower amortization charges related to the mortgage servicing right asset. The decrease in net gain on sale of loans of $15.1 million was primarily attributable to a significantly lower volume of residential mortgage loan sales in the current year period of $243.7 million compared to $760.7 million in the same nine month period a year ago. Market mortgage rates reached historic lows during the fourth calendar quarter of 2012 into the first quarter of 2013 and have been on the rise since March 31, 2013, which caused a reduction in financing activity resulting in decreased sales volume. Net gain on sale of OREO decreased to $3.3 million in the nine months ended December 31, 2013 from $5.5 million in the year ago period largely due to the impact of lower sales volume with smaller gains per property as the OREO portfolio balances continue to decline and smaller margins per property.
54
Table of Contents
Non-Interest Expense
The following table presents non-interest expense by major category for the periods indicated:
| Nine Months Ended December 31, |
Increase (Decrease) | |||||||||||||||
| 2013 | 2012 | Amount | Percent | |||||||||||||
| (Dollars in thousands) | ||||||||||||||||
| Compensation and benefits |
$ | 32,426 | $ | 30,594 | $ | 1,832 | 6.0 | % | ||||||||
| Occupancy |
6,517 | 5,822 | 695 | 11.9 | ||||||||||||
| Furniture and equipment |
2,510 | 3,801 | (1,291 | ) | (34.0 | ) | ||||||||||
| Federal deposit insurance premiums |
3,386 | 4,567 | (1,181 | ) | (25.9 | ) | ||||||||||
| Data processing |
4,300 | 4,361 | (61 | ) | (1.4 | ) | ||||||||||
| Communications |
1,517 | 1,428 | 89 | 6.2 | ||||||||||||
| Marketing |
2,099 | 839 | 1,260 | N/M | ||||||||||||
| OREO expense, net |
9,797 | 25,312 | (15,515 | ) | (61.3 | ) | ||||||||||
| Investor loss reimbursement |
687 | 1,720 | (1,033 | ) | (60.1 | ) | ||||||||||
| Mortgage servicing rights impairment (recovery) |
(1,664 | ) | 1,787 | (3,451 | ) | N/M | ||||||||||
| Provision for unfunded loan commitments |
2,708 | 967 | 1,741 | 180.0 | ||||||||||||
| Legal services |
2,773 | 4,156 | (1,383 | ) | (33.3 | ) | ||||||||||
| Other professional fees |
1,699 | 1,687 | 12 | 0.7 | ||||||||||||
| Insurance |
2,497 | 1,238 | 1,259 | 101.7 | ||||||||||||
| Debt prepayment penalty |
16,149 | 3,549 | 12,600 | N/M | ||||||||||||
| Reorganization costs |
1,929 | — | 1,929 | N/M | ||||||||||||
| Other expense |
6,402 | 7,508 | (1,106 | ) | (14.7 | ) | ||||||||||
|
|
|
|
|
|
|
|
|
|||||||||
| Total non-interest expense |
$ | 95,732 | $ | 99,336 | $ | (3,604 | ) | (3.6 | )% | |||||||
|
|
|
|
|
|
|
|
|
|||||||||
N/M means “Not Meaningful.”
Non-interest expense decreased $3.6 million, or 3.6%, to $95.7 million for the nine months ended December 31, 2013, as compared to $99.3 million for the respective period in 2012. The decrease was primarily due to lower OREO expense and MSR impairment. These decreases were mostly offset by a debt prepayment penalty related to the early payoff of $176.0 million of FHLB of Chicago borrowings in 2013, reorganization costs incurred in conjunction with the bankruptcy filing, and higher compensation and benefits, provision for unfunded loan commitments expenses, marketing and insurance expense.
The significant decline in OREO expense of $15.5 million during the nine months ended December 31, 2013 was the result of lower valuation adjustments on repossessed property. MSR impairment declined $3.5 million reflecting a sharp increase in market interest rates in the prior year as the 10-year Treasury rate rose 117 basis points causing a reduction in mortgage refinance activity. Other decreases include $1.4 million in legal services and $1.3 million in furniture and equipment as a result of ongoing efforts to reduce operating costs. Reduced depreciation expense is the result of older assets becoming fully depreciated and the nine months ended December 31, 2012 included a $571,000 write off for the closures of branches and discontinued software. Federal deposit insurance premiums declined $1.2 million due to a lower deposit insurance assessment base primarily attributable to the drop in average consolidated total assets.
The increase in insurance premiums of $1.3 million in the current year period compared to a year ago was due to a runoff policy related to pre-bankruptcy activity. Compensation and benefits increased in part due to increased employee benefits and lower amortization of loan origination, salaries and benefits due to the discontinuation of the deferral of origination costs on held for sale mortgage loan originations. The provision for unfunded loan commitments increased due to a change in methodology wherein specific credits are provided for as needed.
55
Table of Contents
Income Taxes
Income tax expense of $9,000 for the nine month period ended December 31, 2013 increased by $190,000 from the $181,000 income tax benefit recorded in the prior year period. No taxes were recorded on the cancellation of indebtedness (“COD”) income since COD income is excluded from gross income when the discharge occurs in a bankruptcy proceeding. Consistent with applicable tax regulations, in addition to not recognizing the COD income, the Company forfeited their right to use a related amount of NOLs and reduced its net operating losses by a like amount. A full valuation allowance has been recorded on the remaining net deferred tax asset due to the uncertainty of our ability to create sufficient taxable income to utilize the tax asset.
Comparison of Years Ended March 31, 2013 and 2012
General
Operating results improved $2.5 million to a net loss of $34.2 million in fiscal 2013 from net loss of $36.7 million in fiscal 2012. Improved results were primarily due to a $26.2 million decrease in the provision for loan losses. This favorable variance was partially offset by decreases in net interest income of $9.4 million and non-interest income of $3.4 million; and an $11.0 million increase in non-interest expense.
56
Table of Contents
Net Interest Income
Net interest income totaled $62.5 million in fiscal 2013, a decrease of $9.4 million from $71.9 million in fiscal 2012. The decline in net interest income was primarily due to lower earning rates on mortgage loans as customers renewed and refinanced loans in a generally lower rate environment during fiscal 2013 and on investment securities attributable to sales of higher yielding positions in fiscal 2012 for capital management purposes. These unfavorable variances were partially offset by the positive impact of maturing above market rate certificates of deposit and renewals of a portion of these maturing deposits at significantly lower rates.
| Year Ended March 31, | ||||||||||||||||||||||||
| 2013 | 2012 | |||||||||||||||||||||||
| Average Balance |
Interest | Average Yield/ Cost |
Average Balance |
Interest | Average Yield/ Cost |
|||||||||||||||||||
| (Dollars in thousands) | ||||||||||||||||||||||||
| Interest-earning assets |
||||||||||||||||||||||||
| Mortgage loans |
$ | 1,742,764 | $ | 81,749 | 4.69 | % | $ | 1,998,194 | $ | 101,250 | 5.07 | % | ||||||||||||
| Consumer loans |
218,232 | 9,969 | 4.57 | 273,260 | 12,281 | 4.49 | ||||||||||||||||||
| Commercial business loans |
25,807 | 1,617 | 6.27 | 45,480 | 3,398 | 7.47 | ||||||||||||||||||
|
|
|
|
|
|
|
|
|
|||||||||||||||||
| Total loans receivable(1)(2) |
1,986,803 | 93,335 | 4.70 | 2,316,934 | 116,929 | 5.05 | ||||||||||||||||||
| Investment securities(3) |
248,484 | 5,815 | 2.34 | 330,903 | 9,683 | 2.93 | ||||||||||||||||||
| Interest-bearing deposits |
256,128 | 635 | 0.25 | 235,169 | 586 | 0.25 | ||||||||||||||||||
| Federal Home Loan Bank stock |
28,116 | 97 | 0.34 | 52,437 | 55 | 0.10 | ||||||||||||||||||
|
|
|
|
|
|
|
|
|
|||||||||||||||||
| Total interest-earning assets |
2,519,531 | 99,882 | 3.96 | 2,935,443 | 127,253 | 4.34 | ||||||||||||||||||
| Non-interest-earning assets |
104,076 | 210,000 | ||||||||||||||||||||||
|
|
|
|
|
|||||||||||||||||||||
| Total assets |
$ | 2,623,607 | $ | 3,145,443 | ||||||||||||||||||||
|
|
|
|
|
|||||||||||||||||||||
| Interest-bearing liabilities |
||||||||||||||||||||||||
| Demand deposits |
$ | 1,008,207 | 1,672 | 0.17 | $ | 906,563 | 2,073 | 0.23 | ||||||||||||||||
| Regular savings |
311,704 | 352 | 0.11 | 284,504 | 376 | 0.13 | ||||||||||||||||||
| Certificates of deposit |
821,388 | 8,300 | 1.01 | 1,354,303 | 22,513 | 1.66 | ||||||||||||||||||
|
|
|
|
|
|
|
|
|
|||||||||||||||||
| Total deposits |
2,141,299 | 10,324 | 0.48 | 2,545,370 | 24,962 | 0.98 | ||||||||||||||||||
| Other borrowed funds |
430,856 | 27,075 | 6.28 | 548,148 | 30,367 | 5.54 | ||||||||||||||||||
|
|
|
|
|
|
|
|
|
|||||||||||||||||
| Total interest-bearing liabilities |
2,572,155 | 37,399 | 1.45 | 3,093,518 | 55,329 | 1.79 | ||||||||||||||||||
|
|
|
|
|
|||||||||||||||||||||
| Non-interest-bearing liabilities |
86,117 | 67,391 | ||||||||||||||||||||||
|
|
|
|
|
|||||||||||||||||||||
| Total liabilities |
2,658,272 | 3,160,909 | ||||||||||||||||||||||
| Stockholders’ equity (deficit) |
(34,665 | ) | (15,466 | ) | ||||||||||||||||||||
|
|
|
|
|
|||||||||||||||||||||
| Total liabilities and stockholders’ equity (deficit) |
$ | 2,623,607 | $ | 3,145,443 | ||||||||||||||||||||
|
|
|
|
|
|||||||||||||||||||||
| Net interest income/interest rate spread(4) |
$ | 62,483 | 2.51 | % | $ | 71,924 | 2.55 | % | ||||||||||||||||
|
|
|
|
|
|
|
|
|
|||||||||||||||||
| Net interest-earning assets |
$ | (52,624 | ) | $ | (158,075 | ) | ||||||||||||||||||
|
|
|
|
|
|||||||||||||||||||||
| Net interest margin(5) |
2.48 | % | 2.45 | % | ||||||||||||||||||||
|
|
|
|
|
|||||||||||||||||||||
| Ratio of average interest-earning assets to average interest-bearing liabilities |
0.98 | 0.95 | ||||||||||||||||||||||
|
|
|
|
|
|||||||||||||||||||||
| (1) | For the purpose of these computations, non-accrual loans are included in the daily average loan amounts outstanding. |
| (2) | Interest earned on loans includes loan fees (which are not material in amount) and interest income which has been received from borrowers whose loans were removed from non-accrual status during the period indicated. |
57
Table of Contents
| (3) | Average balances of securities available-for-sale are based on fair value. |
| (4) | Interest rate spread represents the difference between the weighted-average yield on interest-earning assets and the weighted-average cost of interest-bearing liabilities and is represented on a fully tax equivalent basis. |
| (5) | Net interest margin represents net interest income as a percentage of average interest-earning assets. |
Rate/Volume Analysis
The most significant impact on the Company’s net interest income between periods is derived from the interaction of changes in the volume of and rates earned or paid on interest-earning assets and interest-bearing liabilities. The volume of investments in loans and securities, compared to the volume of interest-bearing liabilities represented by deposits and borrowings, combined with the spread, produces the changes in net interest income between periods. The following table shows the relative contribution of the changes in average volume and average interest rates on changes in net interest income for the periods indicated. Information is provided with respect to the effects on net interest income attributable to (i) changes in rate (changes in rate multiplied by prior volume) and (ii) changes in volume (changes in volume multiplied by prior rate). The change in interest income (tax equivalent, if applicable) due to both rate and volume have been allocated to rate and volume changes in proportion to the relationship of the absolute dollar amounts of the change in each.
| Fiscal Year Ended March 31, 2013 Compared to Fiscal Year Ended March 31, 2012 |
||||||||||||
| Rate | Volume | Net | ||||||||||
| (In thousands) | ||||||||||||
| Interest-earning assets |
||||||||||||
| Mortgage loans |
$ | (7,166 | ) | $ | (12,335 | ) | $ | (19,501 | ) | |||
| Consumer loans |
199 | (2,511 | ) | (2,312 | ) | |||||||
| Commercial business loans |
(484 | ) | (1,297 | ) | (1,781 | ) | ||||||
|
|
|
|
|
|
|
|||||||
| Total loans receivable |
(7,451 | ) | (16,143 | ) | (23,594 | ) | ||||||
| Investment securities |
(1,724 | ) | (2,144 | ) | (3,868 | ) | ||||||
| Interest-bearing deposits |
(3 | ) | 52 | 49 | ||||||||
| Federal Home Loan Bank stock |
78 | (36 | ) | 42 | ||||||||
|
|
|
|
|
|
|
|||||||
| Total decrease in interest income |
(9,100 | ) | (18,271 | ) | (27,371 | ) | ||||||
| Interest-bearing liabilities |
||||||||||||
| Demand deposits |
(615 | ) | 214 | (401 | ) | |||||||
| Regular savings |
(58 | ) | 34 | (24 | ) | |||||||
| Certificates of deposit |
(7,094 | ) | (7,119 | ) | (14,213 | ) | ||||||
|
|
|
|
|
|
|
|||||||
| Total deposits |
(7,767 | ) | (6,871 | ) | (14,638 | ) | ||||||
| Other borrowed funds |
3,742 | (7,034 | ) | (3,292 | ) | |||||||
|
|
|
|
|
|
|
|||||||
| Total decrease in interest expense |
(4,025 | ) | (13,905 | ) | (17,930 | ) | ||||||
|
|
|
|
|
|
|
|||||||
| Total increase (decrease) in net interest income |
$ | (5,075 | ) | $ | (4,366 | ) | $ | (9,441 | ) | |||
|
|
|
|
|
|
|
|||||||
Provision for Loan Losses
The provision for loan losses decreased $26.2 million from $33.9 million in fiscal 2012 to $7.7 million in fiscal 2013. The improvement was largely due to a lower required allowance for losses on impaired loans, reflecting the relatively steady quarter-over-quarter decrease in non-performing loans since June 2010. The ALLL decreased in fiscal 2013 falling $31.4 million from $111.2 million at March 31, 2012 to $79.8 million at March 31, 2013. The ALLL represented 4.53% of total loans at March 31, 2013, compared to 5.08% of total loans at March 31, 2012. For further discussion of the ALLL, see “—Risk Management—Allowance for Loan Losses.”
58
Table of Contents
Future provisions for loan losses will continue to be based upon management’s assessment of the overall loan portfolio and the underlying collateral, trends in non-performing loans, current economic conditions and other relevant factors in order to maintain the ALLL at adequate levels to provide for probable and estimable future losses. The establishment of the amount of the loan loss allowance inherently involves judgments by management as to the adequacy of the allowance, which ultimately may change. Higher rates of loan defaults than anticipated would likely result in a need to increase provisions in future years.
Non-interest Income
The following table presents non-interest income by major category for the periods indicated:
| Fiscal Year Ended March 31, |
Increase (Decrease) | |||||||||||||||
| 2013 | 2012 | Amount | Percent | |||||||||||||
| (Dollars in thousands) | ||||||||||||||||
| Net impairment losses recognized in earnings |
$ | (408 | ) | $ | (568 | ) | $ | 160 | 28.2 | % | ||||||
| Loan servicing income (loss), net of amortization |
(1,892 | ) | (789 | ) | (1,103 | ) | N/M | |||||||||
| Service charges on deposits |
10,435 | 10,589 | (154 | ) | (1.5 | ) | ||||||||||
| Investment and insurance commissions |
3,894 | 3,808 | 86 | 2.3 | ||||||||||||
| Net gain on sale of loans |
23,195 | 17,680 | 5,515 | 31.2 | ||||||||||||
| Net gain (loss) on sale of investment securities |
(247 | ) | 6,579 | (6,826 | ) | N/M | ||||||||||
| Net gain on sale of OREO |
6,876 | 6,118 | 758 | 12.4 | ||||||||||||
| Other |
4,048 | 5,844 | (1,796 | ) | (30.7 | ) | ||||||||||
|
|
|
|
|
|
|
|
|
|||||||||
| Total non-interest income |
$ | 45,901 | $ | 49,261 | $ | (3,360 | ) | (6.8 | )% | |||||||
|
|
|
|
|
|
|
|
|
|||||||||
N/M means “Not Meaningful.”
Non-interest income totaled $45.9 million in fiscal 2013, a decrease of $3.4 million, or 6.8%, compared to $49.3 million in the prior year. The decrease was largely due to lower loan servicing income, net of amortization, gain on sale of securities and other income; partially offset by higher gains on the sale of loans.
The decrease in loan servicing income of $1.1 million was primarily attributable to lower servicing fees reflecting a 6.9% decrease in the serviced loan portfolio during fiscal 2013, and moderately higher amortization of the MSR asset as mortgage market interest rates drifted generally lower during the year. Net gain (loss) on sale of securities fell by $6.8 million to a loss of $0.2 million compared to the prior year largely due to a significant decrease in the level of investment security sale activity, as proceeds from sale totaled $12.3 million in fiscal 2013 compared to $338.2 million in the year ago period. The decrease in other income of $1.8 million was primarily due to a cash surrender value adjustment on bank owned life insurance policies and net losses on disposition of premises and equipment.
Gain on sale of loans increased $5.5 million, or 31.2% primarily due to significantly higher margins on the sale of residential mortgage loans, partially offset by a modestly lower volume of sales in the current fiscal year totaling $920.2 million compared to $930.2 million a year ago.
59
Table of Contents
Non-interest Expense
The following table presents non-interest expense by major category for the periods indicated:
| Fiscal Year Ended March 31, |
Increase (Decrease) | |||||||||||||||
| 2013 | 2012 | Amount | Percent | |||||||||||||
| (Dollars in thousands) | ||||||||||||||||
| Compensation and benefits |
$ | 40,736 | $ | 41,262 | $ | (526 | ) | (1.3 | )% | |||||||
| Occupancy |
8,133 | 7,946 | 187 | 2.4 | ||||||||||||
| Furniture and equipment |
4,563 | 5,665 | (1,102 | ) | (19.5 | ) | ||||||||||
| Federal deposit insurance premiums |
5,921 | 7,189 | (1,268 | ) | (17.6 | ) | ||||||||||
| Data processing |
6,223 | 6,259 | (36 | ) | (0.6 | ) | ||||||||||
| Communications |
1,840 | 2,081 | (241 | ) | (11.6 | ) | ||||||||||
| Marketing |
1,345 | 1,466 | (121 | ) | (8.3 | ) | ||||||||||
| OREO expense, net |
37,571 | 28,684 | 8,887 | 31.0 | ||||||||||||
| Investor loss reimbursement |
4,530 | 157 | 4,373 | N/M | ||||||||||||
| Mortgage servicing rights impairment (recovery) |
(403 | ) | 2,410 | (2,813 | ) | N/M | ||||||||||
| Provision for unfunded loan commitments |
1,392 | (309 | ) | 1,701 | N/M | |||||||||||
| Legal services |
5,256 | 5,024 | 232 | 4.6 | ||||||||||||
| Other professional fees |
2,346 | 3,669 | (1,323 | ) | (36.1 | ) | ||||||||||
| Insurance |
1,656 | 1,478 | 178 | 12.0 | ||||||||||||
| Debt prepayment penalty |
3,549 | — | 3,549 | N/M | ||||||||||||
| Other |
10,346 | 11,045 | (699 | ) | (6.3 | ) | ||||||||||
|
|
|
|
|
|
|
|
|
|||||||||
| Total non-interest expense |
$ | 135,004 | $ | 124,026 | $ | 10,978 | 8.9 | % | ||||||||
|
|
|
|
|
|
|
|
|
|||||||||
N/M means “Not Meaningful.”
Non-interest expense increased $11.0 million to $135.0 million in fiscal 2013 compared to $124.0 million in the prior year. The increase was primarily due to higher OREO expense, investor loss reimbursement, and a current year debt prepayment penalty, and an increase in the provision for unfunded loan commitments; partially offset by lower furniture and equipment expense, FDIC insurance premiums, MSR impairment and other professional fees.
The increase in OREO expense of $8.9 million primarily reflects higher provisions for losses on repossessed property. Investor loss reimbursement increased $4.4 million largely due to higher volume of repurchases of sold residential mortgage loans and worsening loan level loss severity. The provision for unfunded commitment and letter of credit losses increased $1.7 million from $(309,000) in fiscal 2012 to $1.4 million in fiscal 2013. The unfavorable variance was primarily due to an increase in classified unfunded. A one-time debt prepayment penalty of $3.5 million was incurred in the current fiscal year upon the prepayment of $150.0 million of FHLB of Chicago advances in December 2012.
The decreases in furniture and equipment expense of $1.1 million, and other professional fees of $1.3 million, were largely due to ongoing efforts to reduce operating costs. The decrease in FDIC premiums of $1.3 million was due to a lower deposit insurance assessment base primarily attributable to a drop in average consolidated total assets. Mortgage servicing rights impairment (recovery) improved $2.8 million reflecting mortgage market interest rates drifting generally higher during the year.
Income Taxes
Income tax expense for the fiscal year ended March 31, 2013 was a benefit of $181,000 compared to expense of $10,000 in fiscal 2012. The current year tax benefit was primarily due to the recognition of a previously unrecognized tax benefit that was recorded following the receipt of tax refunds from the Internal Revenue Service related to an uncertain tax position.
60
Table of Contents
A full valuation allowance has been in place since June 30, 2009 on the net deferred tax asset due to the uncertainty of our ability to create sufficient taxable income in the near future to utilize it.
FINANCIAL CONDITION
General
Total assets of the Company decreased $8.8 million, or less than one percent, to $2.12 billion at June 30, 2014 from $2.11 billion at December 31, 2013. This decrease was primarily attributable to lower balances in net loans held for investment and OREO which were mostly offset by higher cash and cash equivalents and investment securities balances.
Investment Securities
Investment securities available-for-sale increased $17.4 million during the six months ended June 30, 2014, or 6.3%, primarily due to purchases of $37.8 million and a decrease in fair market value net loss adjustments of $4.8 million. The increase was partially offset by principal repayments and sales of $24.4 million and $115,000 of other-than-temporary impairment losses that were recognized in earnings. See Notes 1 and 4 to the Consolidated Financial Statements included in this prospectus.
Investment securities are subject to inherent risks based upon the future performance of the underlying collateral (i.e., mortgage loans) for these securities. Among these risks are prepayment risk, interest rate risk and credit risk. Should general interest rate levels decline, the mortgage-related securities portfolio would be subject to (i) prepayments as borrowers typically would seek to obtain financing at lower rates, (ii) a decline in interest income received on adjustable-rate mortgage-related securities, and (iii) an increase in fair value of fixed-rate mortgage-related securities. Conversely, should general interest rate levels increase, the mortgage-related securities portfolio would be subject to (i) a longer term to maturity as borrowers would be less likely to prepay their loans, (ii) an increase in interest income received on adjustable-rate mortgage-related securities, (iii) a decline in fair value of fixed-rate mortgage-related securities, (iv) a decline in fair value of adjustable-rate mortgage-related securities to the extent dependent upon the level of interest rate increases, the time period to the next interest rate repricing date for individual loans within the security and the applicable periodic (annual and/or lifetime) cap which could limit the degree to which an individual loan could reprice within a given time period, and (v) should default rates and loss severities increase on the underlying collateral of mortgage-related securities, the Company may experience credit losses that need to be recognized in earnings as other-than-temporary impairment.
Loans Held for Investment
Loans held for investment decreased $53.4 million during the six months ended June 30, 2014 from $1.61 billion at December 31, 2013 to $1.56 billion at June 30, 2014. The activity included principal repayments and other adjustments (the majority of which are undisbursed loan proceeds) of $209.4 million and transfers to other real estate owned of $7.7 million, partially offset by originations and refinances. During the six months ended June 30, 2014, the Company originated $97.9 million of loans for investment, as compared to $57.4 million during the six months ended June 30, 2014.
Loans Held for Sale
Residential mortgage loans originated for sale amounted to $57.9 million for the six months ended June 30, 2014 compared to $295.2 million for the same period ended June 30, 2013. At December 31, 2013, loans held for sale, which consisted solely of single-family residential mortgage loans, amounted to $3.1 million, and increased $2.2 million to $5.3 million at June 30, 2014.
61
Table of Contents
Other Real Estate Owned
OREO, net decreased $7.3 million to $56.2 million at June 30, 2014 from $63.5 million at December 31, 2013 due to sales of $12.7 million offset by additions during the six-month period of $7.7 million, net of $2.3 million in valuation adjustments.
Accrued Interest Receivable
Accrued interest receivable decreased $576,000 to $7.6 million at June 30, 2014 from $8.2 million at December 31, 2013 commensurate with the decrease in yields on the securities and loan portfolios.
Deposits
Deposits decreased $2.1 million during the six months ended June 30, 2014 to $1.87 billion, due to declines of $58.1 million in certificates of deposit (“CDs”) and $7.4 million in money market accounts which was mostly offset by increases in advance payments of $39.2 million and regular savings accounts of $23.0 million. A significant portion of the CD decreases were due to planned reductions in deposits from single service special rate households. Deposits obtained from brokerage firms which solicit deposits from their customers amounted to zero at June 30, 2014 and December 31, 2013. The weighted average rate of certificate of deposits decreased to 0.52% at June 30, 2014 compared to 0.57% at December 31, 2013.
Borrowings
FHLB of Chicago advances totaled $10.0 million at June 30, 2014 and December 31, 2013 and had a weighted average interest rate of 2.33%. Other borrowed funds as of June 30, 2014 and December 31, 2013 consisted of retail repurchase agreements of $3.5 million and $2.6 million, respectively. For additional information, see Note 9 to the June 30, 2014 consolidated financial statements included in this prospectus.
Other Liabilities
Other liabilities increased by $615,000 from December 31, 2013 to June 30, 2014 which includes the consolidated balance sheets categories of accrued interest payable, accrued taxes, insurance and employee related expenses and other liabilities. An increase in other liabilities of $2.4 million during the six months ended June 30, 2014 was partially offset by a decrease in accrued taxes, insurance and employee related expenses of $1.7 million since December 31, 2013.
Stockholders’ Equity
Stockholders’ equity increased $9.3 million to $211.5 million at June 30, 2014 compared to $202.2 million at December 31, 2013. The increase during the six months ended June 30, 2014 was primarily the result of net income during the period of $4.5 million and a decline in accumulated other comprehensive income (loss) (AOCI) related to AFS securities. AOCI declined by $4.8 million during the six months ended June 30, 2014.
Taxation
We file a consolidated federal income tax return on behalf of ourselves, our non-banking subsidiary, the Bank and its subsidiary as well as income tax returns in various state jurisdictions. The tax years 2010-2013 remain open to examination by the Internal Revenue Service and certain state jurisdictions while the years 2009-2013 remain open to examination by certain other state jurisdictions.
62
Table of Contents
RISK MANAGEMENT
The Company encounters risk as part of its normal course of business and designs risk management processes to help manage these risks. This section describes the Bank’s risk management philosophy, principles, governance and various aspects of its risk management process.
Risk Management Philosophy
Our risk management philosophy is to manage to an overall level of risk while still allowing us to capture opportunities and optimize stockholder value. However, due to the general state of the economy and the elevated risk in the loan portfolio, our risk profile does not currently meet our desired risk level. While improvements have occurred, we continue to work toward reducing the overall risk level to a more desired risk profile.
We view risk management as not about eliminating risks, but about identifying and accepting risks and then working to effectively manage them so as to optimize stockholder value. Risk management includes, but is not limited to the following:
| • | Taking only risks consistent with our strategy and within our capability to manage, |
| • | Ensuring strong underwriting and credit risk management practices, |
| • | Practicing disciplined capital and liquidity management, |
| • | Helping ensure that risks and earnings volatility are appropriately understood and measured, |
| • | Avoiding excessive concentrations, and |
| • | Helping support external stakeholder confidence. |
Although the Board is primarily responsible for oversight of risk management, committees of the Board may provide oversight to specific areas of risk with respect to the level of risk and risk management structure. We use management level risk committees to help ensure that business decisions are executed within our desired risk profile. Management provides oversight for the establishment and implementation of new risk management initiatives, reviews risk profiles and discusses key risk issues. The Chief Risk Officer is in charge of overseeing credit risk management. Our internal audit and compliance departments perform an independent assessment of the internal control environment and play a critical role in risk and compliance management, testing the operation of the internal control system and reporting findings to the Risk Committee and the Audit Committee of the Board.
Credit Risk Management
Credit risk represents the possibility that a customer, counterparty or issuer may not perform in accordance with contractual terms. Credit risk is inherent in the financial services business and results from extending credit to customers, purchasing investment securities and entering into certain guarantee contracts. Credit risk is one of the most significant risks facing our business.
In addition to credit policies and procedures and setting portfolio objectives for the level of credit risk, we have established guidelines for problem loans, acceptable levels of total borrower exposure and other credit measures. Management continues to focus on loss mitigation and maximization of recoveries in the Bank’s non-performing assets portfolio. Over time, we intend to return to management of portfolio returns through discrete portfolio investments within approved risk tolerances.
The Bank seeks to achieve credit portfolio objectives by maintaining a customer base that is diverse in borrower exposure and industry types. Corporate credit personnel are responsible for loan underwriting and approval processes to help ensure that newly approved loans meet policy and portfolio objectives.
63
Table of Contents
The Risk Management group is responsible for monitoring credit risk, while Internal Audit provides an independent assessment of the effectiveness of the credit risk management process. An external credit risk management group also provides loan review services. Credit risk is managed taking into account regulatory guidance.
Non-Performing Loans
The composition of non-performing loans is summarized as follows:
| June 30, 2014 | December 31, 2013 | March 31, 2013 | ||||||||||||||||||||||||||||||||||
| Non- Performing Loans |
Percent of Non- Performing Loans |
Percent of Total Gross Loans(1) |
Non- Performing Loans |
Percent of Non- Performing Loans |
Percent of Total Gross Loans(1) |
Non- Performing Loans |
Percent of Non- Performing Loans |
Percent of Total Gross Loans(1) |
||||||||||||||||||||||||||||
| (Dollars in thousands) | ||||||||||||||||||||||||||||||||||||
| Residential |
$ | 6,047 | 14.3 | % | 0.39 | % | $ | 14,404 | 21.0 | % | 0.89 | % | $ | 33,107 | 27.9 | % | 1.88 | % | ||||||||||||||||||
| Commercial and industrial |
994 | 2.4 | 0.06 | 1,509 | 2.2 | 0.09 | 2,915 | 2.4 | 0.17 | |||||||||||||||||||||||||||
| Land and construction |
18,846 | 44.7 | 1.20 | 24,729 | 36.1 | 1.52 | 31,787 | 26.8 | 1.80 | |||||||||||||||||||||||||||
| Multi-family |
6,249 | 14.8 | 0.40 | 3,658 | 5.4 | 0.22 | 20,652 | 17.4 | 1.17 | |||||||||||||||||||||||||||
| Retail/office |
3,994 | 9.4 | 0.25 | 14,365 | 21.0 | 0.89 | 17,523 | 14.8 | 1.00 | |||||||||||||||||||||||||||
| Other commercial real estate |
4,286 | 10.2 | 0.27 | 6,802 | 9.9 | 0.42 | 8,165 | 6.9 | 0.46 | |||||||||||||||||||||||||||
| Education(2) |
209 | 0.5 | 0.01 | 276 | 0.4 | 0.02 | 424 | 0.3 | 0.02 | |||||||||||||||||||||||||||
| Other consumer |
1,542 | 3.7 | 0.10 | 2,754 | 4.0 | 0.17 | 4,217 | 3.5 | 0.24 | |||||||||||||||||||||||||||
|
|
|
|
|
|
|
|
|
|
|
|
|
|
|
|
|
|
|
|||||||||||||||||||
| Total |
$ | 42,167 | 100.0 | % | 2.68 | % | $ | 68,497 | 100.0 | % | 4.22 | % | $ | 118,790 | 100.0 | % | 6.74 | % | ||||||||||||||||||
|
|
|
|
|
|
|
|
|
|
|
|
|
|
|
|
|
|
|
|||||||||||||||||||
| (1) | Gross loans are the unpaid principal balance before the reduction for loans in process, unearned interest and loan fees and the allowance for loans losses. |
| (2) | Excludes the guaranteed portion of education loans 90+ days past due with an unpaid principal balance totaling $6,767, $8,930 and $13,497 at June 30, 2014, December 31, 2013 and March 31, 2013, respectively, that are not considered impaired based on a guarantee provided by government agencies. |
The following is a summary of non-performing loan activity for the six months ended June 30, 2014 and the nine months ended December 31, 2013:
| Non- Performing Loans December 31, 2013 |
Additions | Transfer to Accrual Status |
Transfer to OREO |
Paid Down |
Charged Off |
Non- Performing Loans June 30, 2014 |
Remaining Balance of Loans |
Associated ALLL |
||||||||||||||||||||||||||||
| (In thousands) | ||||||||||||||||||||||||||||||||||||
| Residential |
$ | 14,404 | $ | 1,972 | $ | (4,013 | ) | $ | (4,105 | ) | $ | (740 | ) | $ | (1,471 | ) | $ | 6,047 | $ | 527,283 | $ | 10,325 | ||||||||||||||
| Commercial and industrial |
1,509 | 4,844 | (401 | ) | (57 | ) | (518 | ) | (4,383 | ) | 994 | 15,008 | 2,596 | |||||||||||||||||||||||
| Land and construction |
24,729 | 5,242 | (219 | ) | (852 | ) | (6,308 | ) | (3,746 | ) | 18,846 | 87,143 | 9,633 | |||||||||||||||||||||||
| Multi-family |
3,658 | 4,592 | (791 | ) | — | (422 | ) | (788 | ) | 6,249 | 260,145 | 6,169 | ||||||||||||||||||||||||
| Retail/office |
14,365 | 1,613 | (1,359 | ) | (2,349 | ) | (1,737 | ) | (6,539 | ) | 3,994 | 138,013 | 8,824 | |||||||||||||||||||||||
| Other commercial real estate |
6,802 | 2,661 | (1,474 | ) | (140 | ) | (3,808 | ) | 245 | 4,286 | 151,960 | 6,544 | ||||||||||||||||||||||||
| Education |
276 | — | — | — | (67 | ) | — | 209 | 118,091 | 428 | ||||||||||||||||||||||||||
| Other consumer |
2,754 | 850 | (569 | ) | (156 | ) | (353 | ) | (984 | ) | 1,542 | 230,083 | 4,656 | |||||||||||||||||||||||
|
|
|
|
|
|
|
|
|
|
|
|
|
|
|
|
|
|
|
|||||||||||||||||||
| Total |
$ | 68,497 | $ | 21,774 | $ | (8,826 | ) | $ | (7,659 | ) | $ | (13,953 | ) | $ | (17,666 | ) | $ | 42,167 | $ | 1,527,726 | $ | 49,175 | ||||||||||||||
|
|
|
|
|
|
|
|
|
|
|
|
|
|
|
|
|
|
|
|||||||||||||||||||
64
Table of Contents
| Non- Performing Loans March 31, 2013 |
Additions | Transfer to Accrual Status |
Transfer to OREO |
Paid Down |
Charged Off |
Non- Performing Loans December 31, 2013 |
Remaining Balance of Loans |
Associated ALLL |
||||||||||||||||||||||||||||
| (In thousands) | ||||||||||||||||||||||||||||||||||||
| Residential |
$ | 33,107 | $ | (1,309 | ) | $ | (4,183 | ) | $ | (5,462 | ) | $ | (3,948 | ) | $ | (3,801 | ) | $ | 14,404 | $ | 515,373 | $ | 13,059 | |||||||||||||
| Commercial and industrial |
2,915 | 2,285 | (115 | ) | — | (838 | ) | (2,738 | ) | 1,509 | 20,082 | 6,402 | ||||||||||||||||||||||||
| Land and construction |
31,787 | 1,603 | (143 | ) | (1,845 | ) | (4,012 | ) | (2,661 | ) | 24,729 | 67,321 | 13,741 | |||||||||||||||||||||||
| Multi-family |
20,652 | 8,268 | (18,653 | ) | (1,901 | ) | (4,137 | ) | (571 | ) | 3,658 | 278,259 | 8,049 | |||||||||||||||||||||||
| Retail/office |
17,523 | 3,602 | (349 | ) | (2,401 | ) | (3,418 | ) | (592 | ) | 14,365 | 139,710 | 14,209 | |||||||||||||||||||||||
| Other commercial real estate |
8,165 | 12,777 | (66 | ) | (7,300 | ) | (2,172 | ) | (4,602 | ) | 6,802 | 167,511 | 6,066 | |||||||||||||||||||||||
| Education |
424 | 37 | — | — | (185 | ) | — | 276 | 129,244 | 191 | ||||||||||||||||||||||||||
| Other consumer |
4,217 | 2,081 | (1,531 | ) | (288 | ) | (461 | ) | (1,264 | ) | 2,754 | 235,557 | 3,465 | |||||||||||||||||||||||
|
|
|
|
|
|
|
|
|
|
|
|
|
|
|
|
|
|
|
|||||||||||||||||||
| Total |
$ | 118,790 | $ | 29,344 | $ | (25,040 | ) | $ | (19,197 | ) | $ | (19,171 | ) | $ | (16,229 | ) | $ | 68,497 | $ | 1,553,057 | $ | 65,182 | ||||||||||||||
|
|
|
|
|
|
|
|
|
|
|
|
|
|
|
|
|
|
|
|||||||||||||||||||
Non-performing loans decreased $26.3 million during the six months ended June 30, 2014. The loan categories with the largest decline in non-performing loans were retail/office of $10.4 million, residential loans of $8.4 million land and construction of $5.9 million, and other commercial real estate of $2.5 million. Non-performing loans decreased $50.2 million during the nine months ended December 31, 2013. The loan categories with the largest decline in non-performing loans were residential loans of $18.7 million, multi-family of $17.0 million and land and construction of $7.1 million.
The interest income that would have been recorded during the six months ended June 30, 2014 and nine months ended December 31, 2013 if the Bank’s non-performing loans at the end of the period had been current in accordance with their terms during the period was $1.9 million and $4.1 million, respectively.
Non-Performing Assets
The composition of non-performing assets and related credit metrics are summarized as follows:
| June 30, 2014 |
December 31, 2013 |
March 31, 2013 |
||||||||||
| (Dollars in thousands) | ||||||||||||
| Non-accrual loans—excluding troubled debt restructurings |
$ | 20,762 | $ | 39,151 | $ | 92,503 | ||||||
| Troubled debt restructurings—non-accrual(1) |
21,405 | 29,346 | 26,287 | |||||||||
| Other real estate owned (OREO) |
56,170 | 63,460 | 84,342 | |||||||||
|
|
|
|
|
|
|
|||||||
| Total non-performing assets |
$ | 98,337 | $ | 131,957 | $ | 203,132 | ||||||
|
|
|
|
|
|
|
|||||||
| Non-performing loans to gross loans(2) |
2.69 | % | 4.22 | % | 6.74 | % | ||||||
| Non-performing assets to total assets |
4.64 | 6.25 | 8.58 | |||||||||
| ALLL to gross loans(2) |
3.13 | 4.02 | 4.53 | |||||||||
| ALLL to non-performing loans |
116.62 | 95.16 | 67.19 | |||||||||
| ALLL plus OREO valuation allowance to non-performing assets |
74.94 | 72.77 | 57.02 | |||||||||
| (1) | Troubled debt restructurings—non-accrual represent non-accrual loans that were modified in a troubled debt. |
| (2) | Gross loans are the unpaid principal balance before the reduction for loans in process, unearned interest and loan fees and the allowance for loans losses. |
Loans modified in a TDR due to rate or term concessions that are currently on non-accrual status will remain on non-accrual status for a period of at least six months. If after six months, or a longer period sufficient enough to
65
Table of Contents
demonstrate the willingness and ability of the borrower to perform under the modified terms, the borrower has made payments in accordance with the modified terms, the loan is returned to accrual status but retains its status as a troubled debt restructuring. The designation as a troubled debt restructuring is removed in years after the restructuring if both of the following conditions exist: (a) the restructuring agreement specifies an interest rate equal to or greater than the rate that the creditor was willing to accept at the time of restructuring for a new loan with comparable risk and (b) the loan is not impaired based on the terms specified by the restructuring agreement.
The following is a summary of non-performing asset activity for the six months ended June 30, 2014:
| Non-Performing Loans(1) |
Other Real Estate Owned (OREO) |
Total Non- Performing Assets |
||||||||||
| (In thousands) | ||||||||||||
| Balance at December 31, 2013 |
$ | 68,497 | $ | 63,460 | $ | 131,957 | ||||||
| Additions |
21,774 | 7,659 | 29,433 | |||||||||
| Transfer of loans to OREO |
(7,659 | ) | — | (7,659 | ) | |||||||
| Returned to accrual status |
(8,826 | ) | — | (8,826 | ) | |||||||
| Sales |
— | (12,698 | ) | (12,698 | ) | |||||||
| Loan charge-offs/OREO valuations adjustments, net |
(17,666 | ) | (2,279 | ) | (19,945 | ) | ||||||
| Capitalized improvements |
— | 28 | 28 | |||||||||
| Payments |
(13,953 | ) | — | (13,953 | ) | |||||||
|
|
|
|
|
|
|
|||||||
| Balance at June 30, 2014 |
$ | 42,167 | $ | 56,170 | $ | 98,337 | ||||||
|
|
|
|
|
|
|
|||||||
| (1) | Total non-performing loans exclude the guaranteed portion of education loans of $6,767 and $8,930 that are 90 days or more past due but still accruing interest at June 30, 2014, and December 31, 2013, respectively. |
The following is a summary of non-performing asset activity for the nine months ended December 31, 2013:
| Non-Performing Loans(1) |
Other Real Estate Owned (OREO) |
Total Non- Performing Assets |
||||||||||
| (In thousands) | ||||||||||||
| Balance at March 31, 2013 |
$ | 118,790 | $ | 84,342 | $ | 203,132 | ||||||
| Additions |
29,344 | — | 29,344 | |||||||||
| Transfer of loans to OREO |
(19,197 | ) | 19,352 | 155 | ||||||||
| Returned to accrual status |
(25,040 | ) | — | (25,040 | ) | |||||||
| Sales |
— | (35,604 | ) | (35,604 | ) | |||||||
| Loan charge-offs/OREO valuation adjustments, net |
(16,229 | ) | (4,937 | ) | (21,166 | ) | ||||||
| Capitalized improvements |
— | 307 | 307 | |||||||||
| Payments |
(19,171 | ) | — | (19,171 | ) | |||||||
|
|
|
|
|
|
|
|||||||
| Balance at December 31, 2013 |
$ | 68,497 | $ | 63,460 | $ | 131,957 | ||||||
|
|
|
|
|
|
|
|||||||
| (1) | Total non-performing loans exclude the guaranteed portion of education loans of $8,930 and $13,697 that are 90 days or more past due but still accruing interest at December 31, 2013 and March 31, 2013, respectively. |
66
Table of Contents
Loan Delinquencies 30 Days and Over
The following table sets forth information relating to past due loans that were delinquent 30 days and over at the dates indicated.
| June 30, 2014 |
December 31, | March 31, | ||||||||||||||||||||||||||||||||||||||||||||||
| 2013 | 2013 | 2012 | 2011 | 2010 | ||||||||||||||||||||||||||||||||||||||||||||
| Days Past Due |
Balance | % of Total Gross Loans |
Balance | % of Total Gross Loans |
Balance | % of Total Gross Loans |
Balance | % of Total Gross Loans |
Balance | % of Total Gross Loans |
Balance | % of Total Gross Loans |
||||||||||||||||||||||||||||||||||||
| (Dollars in thousands) | ||||||||||||||||||||||||||||||||||||||||||||||||
| 30 to 59 days |
$ | 11,257 | 0.72 | % | $ | 11,885 | 0.73 | % | $ | 14,294 | 0.81 | % | $ | 18,332 | 0.84 | % | $ | 46,244 | 1.72 | % | $ | 53,105 | 1.54 | % | ||||||||||||||||||||||||
| 60 to 89 days |
6,751 | 0.43 | 4,280 | 0.26 | 10,109 | 0.57 | 12,230 | 0.56 | 30,479 | 1.14 | 53,864 | 1.56 | ||||||||||||||||||||||||||||||||||||
| 90 days and over |
24,556 | 1.56 | 49,017 | 3.02 | 92,209 | 5.23 | 190,663 | 8.71 | 238,256 | 8.88 | 217,393 | 6.31 | ||||||||||||||||||||||||||||||||||||
|
|
|
|
|
|
|
|
|
|
|
|
|
|
|
|
|
|
|
|
|
|
|
|
|
|||||||||||||||||||||||||
| Total |
$ | 42,564 | 2.71 | % | $ | 65,182 | 4.02 | % | $ | 116,612 | 6.61 | % | $ | 221,225 | 10.11 | % | $ | 314,979 | 11.74 | % | $ | 324,362 | 9.42 | % | ||||||||||||||||||||||||
|
|
|
|
|
|
|
|
|
|
|
|
|
|
|
|
|
|
|
|
|
|
|
|
|
|||||||||||||||||||||||||
Loans delinquent 30 to 89 days increased $1.8 million to $18.0 million at June 30, 2014 from $16.2 million at December 31, 2013 as a result of increased monitoring and loss mitigation efforts. Loans delinquent greater than 90 days declined $24.5 million from December 31, 2014 to $24.6 million at June 30, 2014 primarily due to charge offs of $20.0 million during the first six months of the year and transfers to OREO also contributed to the decline.
Impaired Loans
At June 30, 2014, the Company identified $53.4 million of loans as impaired, which includes $11.2 million of performing TDRs. At December 31, 2013, impaired loans were $101.6 million, which included $33.1 million of performing TDRs. A loan is identified as impaired when, based on current information and events, it is probable that the Bank will be unable to collect all amounts due according to the contractual terms of the loan agreement and thus are placed on non-accrual status.
The following is additional information regarding impaired loans.
| June 30, 2014 |
December 31, | March 31, | ||||||||||||||||||||||
| 2013 | 2013 | 2012 | 2011 | 2010 | ||||||||||||||||||||
| (In thousands) | ||||||||||||||||||||||||
| Carrying amount of impaired loans |
$ | 47,914 | $ | 78,471 | $ | 131,263 | $ | 253,422 | $ | 341,498 | $ | 419,207 | ||||||||||||
| Average carrying amount of impaired loans |
58,017 | 77,734 | 189,919 | 304,060 | 442,142 | 364,585 | ||||||||||||||||||
| Loans and troubled debt restructurings on non-accrual status |
42,167 | 68,497 | 118,790 | 224,924 | 306,274 | 399,936 | ||||||||||||||||||
| Troubled debt restructurings—accrual |
11,249 | 33,087 | 41,565 | 72,648 | 89,417 | 79,891 | ||||||||||||||||||
| Troubled debt restructurings— non-accrual(1) |
21,405 | 29,346 | 26,287 | 76,378 | 17,262 | 44,578 | ||||||||||||||||||
| Valuation allowance for troubled debt restructurings |
5,500 | 12,216 | 15,293 | 29,476 | 17,140 | 8,254 | ||||||||||||||||||
| Loans past due ninety days or more and still accruing(2) |
6,767 | 8,930 | 13,697 | 30,697 | 23,629 | — | ||||||||||||||||||
| (1) | Troubled debt restructurings—non-accrual are included in the loans and troubled debt restructurings on non-accrual status line item above. |
| (2) | Includes the guaranteed portion of education loans that were 90+ days past due which continue to accrue interest due to a guarantee provided by government agencies covering approximately 97% of the outstanding balance. |
67
Table of Contents
Interest income recognized on impaired loans on a cash basis was $1.5 million and $1.3 million for the six months ended June 30, 2014 and 2013, respectively; $2.4 million and $5.5 million for the nine months ended December 31, 2013 and 2012, respectively; and $5.7 million and $7.2 million for the fiscal years ended March 31, 2013 and 2012, respectively.
Allowance for Loan Losses
Like all financial institutions, we must maintain an adequate ALLL. The ALLL is established through a provision for loan losses charged to expense. Loans are charged-off against the ALLL when we believe that repayment of principal is unlikely. Subsequent recoveries, if any, are credited to the ALLL. The balance in the ALLL is an amount that we believe will be adequate to absorb probable losses on existing loans that may become uncollectible, based on evaluation of the collectability of loans and prior credit loss experience, together with the other factors discussed in “Critical Accounting Estimates and Judgments.”
The ALLL consists of general and specific components even though the entire allowance is available to cover losses on any loan. The specific allowance component relates to impaired loans (i.e.—non-accrual) and loans reported as troubled debt restructurings. For such loans, an ALLL is established when the discounted cash flows (or collateral value if repayment relies solely on the operation or sale of the collateral) of the impaired loan are lower than the carrying value of that loan. The general allowance component is based on historical net loss experience for the past nine quarters, adjusted for qualitative factors. A reserve for unfunded commitments, letters of credit and repurchase of sold loans is also maintained which is classified in other liabilities.
For the quarter ended June 30, 2014, the Bank modified its general allowance methodology to increase the historical loss period from an eight to nine quarter historical look-back period with the intent to build to a 12 quarter look back period subsequent to June 30, 2014. The modification was done to reflect a more stable economic environment and to capture additional loss statistics considered reflective of the current portfolio. The impact to the allowance for loan losses at June 30, 2014 after implementing the above modifications was a reduction of the required reserve of $381,000 as compared to the previous methodology. See the Company’s annual report on Form 10-K/T for the nine months ended December 31, 2013 for a full description of the allowance methodology.
The general component of the allowance for loan loss methodology incorporates the following qualitative risk factors to establish the appropriate general allowance for loan loss at each reporting date.
Qualitative factors include:
| • | Changes in lending policies and procedures, including changes in underwriting standards and collection, charge-off, and recovery practices not considered elsewhere in estimating credit losses; |
| • | Changes in international, national, regional and local economic and business conditions and developments that affect the collectability of the portfolio, including the condition of various market segments; |
| • | Changes in the nature and volume of the portfolio and in the terms of loans; |
| • | Changes in the experience, ability and depth of lending management and other relevant staff; |
| • | Changes in the volume and severity of past due loans, the volume of non-accrual loans, and volume and severity of adversely classified or graded loans; |
| • | Changes in the quality of our loan review system; |
| • | Changes in the value of underlying collateral for collateral-dependent loans; |
| • | The existence and effect of any concentrations of credit, and changes in the level of such concentrations; and |
| • | The effect of other external factors such as competition and legal and regulatory requirements on the level of estimated credit losses in the current portfolio. |
68
Table of Contents
Any changes in the risk factors are based on perceived risk of similar groups of loans classified by collateral type, purpose and terms. Statistics on local trends, peers, and an internal nine quarter net loss history are also incorporated into the allowance methodology. Due to the credit concentration of our loan portfolio in real estate secured loans, the qualitative factor related to the value of collateral is heavily dependent on real estate values in Wisconsin and surrounding states. While management uses the best information available to make its evaluation, future adjustments to the ALLL may be necessary if there are significant changes in economic or other conditions. In addition, the OCC, as an integral part of their examination processes, periodically reviews the Banks’ ALLL, and may recommend adjustments based on their assessment of the adequacy of the ALLL. Management periodically reviews the assumptions and formula used in determining the ALLL and makes adjustments if required to reflect the current risk profile of the portfolio.
The following table presents the ALLL by component:
| June 30, 2014 |
December 31, 2013 |
March 31, 2013 |
||||||||||
| (In thousands) | ||||||||||||
| General reserve |
$ | 33,633 | $ | 35,844 | $ | 38,641 | ||||||
| Substandard reserve |
10,040 | 6,225 | 12,082 | |||||||||
| Specific reserve |
5,502 | 23,113 | 29,092 | |||||||||
|
|
|
|
|
|
|
|||||||
| Total ALLL |
$ | 49,175 | $ | 65,182 | $ | 79,815 | ||||||
|
|
|
|
|
|
|
|||||||
The following table presents the unpaid principal balance of loans by risk category:
| June 30, 2014 |
December 31, 2013 |
March 31, 2013 |
||||||||||
| (In thousands) | ||||||||||||
| Pass |
$ | 1,484,701 | $ | 1,460,457 | $ | 1,497,361 | ||||||
| Special mention |
2,693 | 24,203 | 33,363 | |||||||||
|
|
|
|
|
|
|
|||||||
| Total pass and special mention rated loans |
1,487,394 | 1,484,660 | 1,530,724 | |||||||||
| Substandard rated loans, excluding TDR accrual(1) |
29,083 | 35,310 | 72,117 | |||||||||
| Troubled debt restructurings—accrual |
11,249 | 33,087 | 41,565 | |||||||||
| Non-accrual |
42,167 | 68,497 | 118,790 | |||||||||
|
|
|
|
|
|
|
|||||||
| Total impaired loans |
53,416 | 101,584 | 160,355 | |||||||||
|
|
|
|
|
|
|
|||||||
| Total unpaid principal balance |
$ | 1,569,893 | $ | 1,621,554 | $ | 1,763,196 | ||||||
|
|
|
|
|
|
|
|||||||
| (1) | Includes residential and consumer loans identified as substandard that are not necessarily on non-accrual. |
The following table presents credit risk metrics related to the ALLL:
| June 30, 2014 |
December 31, 2013 |
March 31, 2013 |
||||||||||
| (Dollars in thousands) | ||||||||||||
| General ALLL / pass and special mention loans |
2.3 | % | 2.4 | % | 2.5 | % | ||||||
| Substandard ALLL / substandard loans |
34.5 | % | 17.6 | % | 16.8 | % | ||||||
| Specific ALLL / impaired loans |
10.3 | % | 22.8 | % | 18.1 | % | ||||||
| Loans 30 to 89 days past due |
$ | 18,008 | $ | 16,165 | $ | 24,403 | ||||||
The ratio of general ALLL to pass and special mention loans remained relatively stable while the substandard ALLL to substandard loans increased from December 31, 2013 to reflect management’s assessment of risk and related potential for loss. The ratio of specific ALLL to impaired loans declined from December 31, 2013 as a result of higher charge offs and significantly lower levels of impaired loans.
69
Table of Contents
The ratio of the general ALLL to pass and special mention rated loans declined to 2.4% at December 31, 2013 from 2.5% at March 31, 2013 reflecting comparable charge-offs year-over-year. The ratios associated with substandard and impaired loans have both increased from March 31, 2013 to December 31, 2013 reflecting management’s current estimate of loss due to current market values of collateral and anticipated cash flow from borrower operations.
The following table summarizes the activity in the ALLL for the periods indicated.
| Six Months Ended June 30, |
Nine Months Ended December 31, |
Fiscal Year Ended March 31, | ||||||||||||||||||||||||||||||
| 2014 | 2013 | 2013 | 2012 | 2013 | 2012 | 2011 | 2010 | |||||||||||||||||||||||||
| (Dollars in thousands) | ||||||||||||||||||||||||||||||||
| Allowance at beginning of year |
$ | 65,182 | $ | 83,761 | $ | 79,815 | $ | 111,215 | $ | 111,215 | $ | 150,122 | $ | 179,644 | $ | 137,165 | ||||||||||||||||
| Charge-offs: |
||||||||||||||||||||||||||||||||
| Single-family residential |
(1,662 | ) | (3,529 | ) | (4,419 | ) | (4,795 | ) | (6,659 | ) | (6,625 | ) | (17,563 | ) | (5,505 | ) | ||||||||||||||||
| Multi-family residential |
(883 | ) | (354 | ) | (2,972 | ) | (2,472 | ) | (2,656 | ) | (4,247 | ) | (14,497 | ) | (12,729 | ) | ||||||||||||||||
| Commercial real estate |
(7,391 | ) | (781 | ) | (6,678 | ) | (12,983 | ) | (13,390 | ) | (32,009 | ) | (21,986 | ) | (32,580 | ) | ||||||||||||||||
| Construction and land |
(3,628 | ) | (2,377 | ) | (3,450 | ) | (17,497 | ) | (18,219 | ) | (21,429 | ) | (12,554 | ) | (44,107 | ) | ||||||||||||||||
| Consumer |
(1,435 | ) | (3,320 | ) | (1,903 | ) | (2,533 | ) | (4,946 | ) | (3,259 | ) | (3,302 | ) | (4,322 | ) | ||||||||||||||||
| Commercial business |
(4,955 | ) | (1,135 | ) | (864 | ) | (2,759 | ) | (3,483 | ) | (14,993 | ) | (18,984 | ) | (23,040 | ) | ||||||||||||||||
|
|
|
|
|
|
|
|
|
|
|
|
|
|
|
|
|
|||||||||||||||||
| Total charge-offs |
(19,954 | ) | (11,496 | ) | (20,286 | ) | (43,039 | ) | (49,353 | ) | (82,562 | ) | (88,886 | ) | (122,283 | ) | ||||||||||||||||
| Recoveries: |
||||||||||||||||||||||||||||||||
| Single-family residential |
356 | 181 | 729 | 1,725 | 1,743 | 1,711 | 1,522 | 580 | ||||||||||||||||||||||||
| Multi-family residential |
131 | 108 | 190 | 293 | 327 | 1,425 | 653 | — | ||||||||||||||||||||||||
| Commercial real estate |
2,294 | 1,063 | 2,274 | 2,800 | 3,686 | 2,670 | 2,331 | 632 | ||||||||||||||||||||||||
| Construction and land |
133 | 873 | 1,062 | 2,267 | 2,787 | 1,429 | 1,166 | 119 | ||||||||||||||||||||||||
| Consumer |
257 | 145 | 330 | 116 | 219 | 693 | 299 | 46 | ||||||||||||||||||||||||
| Commercial business |
776 | 287 | 793 | 1,326 | 1,458 | 1,840 | 3,068 | 1,459 | ||||||||||||||||||||||||
|
|
|
|
|
|
|
|
|
|
|
|
|
|
|
|
|
|||||||||||||||||
| Total recoveries |
3,947 | 2,657 | 5,378 | 8,527 | 10,220 | 9,768 | 9,039 | 2,836 | ||||||||||||||||||||||||
| Net charge-offs |
(16,007 | ) | (8,839 | ) | (14,908 | ) | (34,512 | ) | (39,133 | ) | (72,794 | ) | (79,847 | ) | (119,447 | ) | ||||||||||||||||
|
|
|
|
|
|
|
|
|
|
|
|
|
|
|
|
|
|||||||||||||||||
| Provision for loan losses |
— | 950 | 275 | 7,058 | 7,733 | 33,887 | 50,325 | 161,926 | ||||||||||||||||||||||||
|
|
|
|
|
|
|
|
|
|
|
|
|
|
|
|
|
|||||||||||||||||
| Allowance at end of year |
$ | 49,175 | $ | 75,872 | $ | 65,182 | $ | 83,761 | $ | 79,815 | $ | 111,215 | $ | 150,122 | $ | 179,644 | ||||||||||||||||
|
|
|
|
|
|
|
|
|
|
|
|
|
|
|
|
|
|||||||||||||||||
| Net charge-offs to average loans held for sale and for investment(1) |
(2.03 | )% | (0.99 | )% | (1.18 | )% | (2.25 | )% | (1.97 | )% | (3.14 | )% | (2.76 | )% | (3.30 | )% | ||||||||||||||||
|
|
|
|
|
|
|
|
|
|
|
|
|
|
|
|
|
|||||||||||||||||
| (1) | Annualized. |
Total charge-offs and recoveries of $20.0 million and $3.9 million, respectively, for the six months ended June 30, 2014 increased $8.5 million and $1.3 million, respectively, from the six months ended June 30, 2013. Total charge-offs and recoveries of $20.3 million and $5.4 million, respectively, for the nine months ended December 31, 2013 declined $22.8 million and $3.1 million, respectively, from the nine months ended December 31, 2012. Total charge-offs of $49.4 million for the fiscal year ended March 31, 2013 declined $33.2 million from the fiscal year ended March 31, 2012 while recoveries increased $452,000 over the same period.
The provision for loan losses decreased $950,000 to zero for the six months ended June 30, 2014 compared to the same period in the prior year and decreased $6.8 million to $275,000 for the nine months ended December 31, 2013 compared to $7.1 million for the same period in the prior year. The improvement was largely due to a lower
70
Table of Contents
required allowance for losses on impaired loans, reflecting the relatively steady quarter-over-quarter decrease in non-performing loans since June 2010. Management monitors and evaluates the portfolio on an ongoing basis and also considered the decrease in non-accrual loans to total loans to 2.69% at June 30, 2014 from 4.22% at December 31, 2013 to be a factor that warranted the decrease in provision for loan losses.
The allowance process is analyzed regularly, with modifications made if needed, and those results are reported monthly to the Bank’s Board of Directors. Although management believes that the June 30, 2014 allowance for loan losses is adequate based upon the current evaluation of loan delinquencies, non-performing assets, charge off trends, economic conditions and other factors, there can be no assurance that future adjustments to the allowance will not be necessary. Management also continues to pursue all practical and legal methods of collection, repossession and disposal, and adheres to high underwriting standards in the origination process in order to continue to improve asset quality. Determination as to the classification of assets and the amount of valuation allowances is subject to review by the Bank regulatory agencies which can recommend the establishment of additional general or specific loss allowances.
The following table presents the allocation of the ALLL by loan category.
| As of March 31, | ||||||||||||||||||||||||||||||||||||||||||||||||
| As of June 30, 2014 |
% of Loan Type to Total Loans |
As of December 31, 2013 |
% of Loan Type to Total Loans |
2013 | % of Loan Type to Total Loans |
2012 | % of Loan Type to Total Loans |
2011 | % of Loan Type to Total Loans |
2010 | % of Loan Type to Total Loans |
|||||||||||||||||||||||||||||||||||||
| (Dollars in thousands) | ||||||||||||||||||||||||||||||||||||||||||||||||
| Single-family residential |
$ | 10,325 | 34.0 | % | $ | 13,059 | 32.7 | % | $ | 14,525 | 31.1 | % | $ | 13,027 | 26.0 | % | $ | 20,487 | 24.3 | % | $ | 20,960 | 22.3 | % | ||||||||||||||||||||||||
| Multi-family residential |
6,169 | 17.0 | 8,049 | 17.4 | 10,753 | 16.3 | 15,714 | 19.4 | 22,358 | 18.6 | 26,471 | 17.9 | ||||||||||||||||||||||||||||||||||||
| Commercial real estate |
15,368 | 19.0 | 20,274 | 20.2 | 26,330 | 21.1 | 37,629 | 21.8 | 61,836 | 24.1 | 75,379 | 24.5 | ||||||||||||||||||||||||||||||||||||
| Land and construction |
9,633 | 6.7 | 13,742 | 5.7 | 17,498 | 6.3 | 31,810 | 7.9 | 22,251 | 8.4 | 23,908 | 9.9 | ||||||||||||||||||||||||||||||||||||
| Consumer |
5,084 | 22.3 | 3,656 | 22.7 | 3,637 | 23.5 | 2,467 | 23.3 | 3,649 | 21.0 | 2,650 | 20.6 | ||||||||||||||||||||||||||||||||||||
| Commercial business |
2,596 | 1.0 | 6,402 | 1.3 | 7,072 | 1.7 | 10,568 | 1.6 | 19,541 | 3.6 | 30,276 | 4.8 | ||||||||||||||||||||||||||||||||||||
|
|
|
|
|
|
|
|
|
|
|
|
|
|
|
|
|
|
|
|
|
|
|
|
|
|||||||||||||||||||||||||
| Total allowance for loan losses |
$ | 49,175 | 100.0 | % | $ | 65,182 | 100.0 | % | $ | 79,815 | 100.0 | % | $ | 111,215 | 100.0 | % | $ | 150,122 | 100.0 | % | $ | 179,644 | 100.0 | % | ||||||||||||||||||||||||
|
|
|
|
|
|
|
|
|
|
|
|
|
|
|
|
|
|
|
|
|
|
|
|
|
|||||||||||||||||||||||||
The following table presents the associated ALLL as a percentage of the total ALLL by loan category:
| As of June 30, 2014 |
As of December 31, 2013 |
As of March 31, | ||||||||||||||||||||||
| 2013 | 2012 | 2011 | 2010 | |||||||||||||||||||||
| Single-family residential |
21.0 | % | 20.0 | % | 18.2 | % | 11.7 | % | 13.6 | % | 11.7 | % | ||||||||||||
| Multi-family residential |
12.5 | 12.4 | 13.5 | 14.1 | 14.9 | 14.7 | ||||||||||||||||||
| Commercial real estate |
31.3 | 31.1 | 33.0 | 33.8 | 41.2 | 42.0 | ||||||||||||||||||
| Land and construction |
19.6 | 21.1 | 21.9 | 28.6 | 14.8 | 13.3 | ||||||||||||||||||
| Consumer |
10.3 | 9.8 | 4.6 | 2.2 | 2.4 | 1.5 | ||||||||||||||||||
| Commercial business |
5.3 | 5.6 | 8.8 | 9.5 | 13.0 | 16.9 | ||||||||||||||||||
|
|
|
|
|
|
|
|
|
|
|
|
|
|||||||||||||
| Total allowance for loan losses |
100.0 | % | 100.0 | % | 100.0 | % | 100.0 | % | 100.0 | % | 100.0 | % | ||||||||||||
|
|
|
|
|
|
|
|
|
|
|
|
|
|||||||||||||
71
Table of Contents
Other Real Estate Owned
OREO, net decreased $7.3 million during the six months ended June 30, 2014. Individual properties included in OREO at June 30, 2014 with a recorded balance in excess of $1 million are listed below:
| Description |
Location |
Carrying Value | ||||
| (in thousands) | ||||||
| Raw Land |
Northeast Wisconsin | $ | 3,266 | |||
| Commercial Building |
Northwest Wisconsin | 2,355 | ||||
| Commercial Building |
Northwest Wisconsin | 1,140 | ||||
| Commercial Building |
South Central Wisconsin | 3,825 | ||||
| Raw Land |
South Central Wisconsin | 2,231 | ||||
| Commercial Building |
South Central Wisconsin | 1,790 | ||||
| Commercial Building |
South Central Wisconsin | 1,403 | ||||
| Raw Land |
South Central Wisconsin | 1,352 | ||||
| Raw Land |
South Central Wisconsin | 1,238 | ||||
| Condo Lot |
South Central Wisconsin | 1,161 | ||||
| Raw Land |
South Central Wisconsin | 1,105 | ||||
| Commercial Lot |
South Central Wisconsin | 1,071 | ||||
| Raw Land |
Southeast Wisconsin | 3,680 | ||||
| Commercial Building |
Southeast Wisconsin | 3,036 | ||||
| Commercial Building |
Southeast Wisconsin | 2,054 | ||||
| Raw Land |
Southeast Wisconsin | 1,162 | ||||
| Other properties individually less than $1 million |
24,302 | |||||
|
|
|
|||||
| $ | 56,170 | |||||
|
|
|
|||||
Foreclosed properties are recorded at fair value less cost to sell upon transfer to OREO with shortfalls, if any, charged to the ALLL. Subsequent decreases in the valuation of OREO are recorded in a valuation account for the foreclosed property with a corresponding charge to OREO expense, net. The fair value is primarily based on appraisals. On a quarterly basis, the carrying values of OREO properties are reviewed and appropriate adjustments made based upon updated appraisals, broker opinions or signed sales contracts. For appraisals received over one year ago, management considers broker and market analysis to update the estimated fair value. Incremental valuation adjustments may be recognized in the Statement of Operations if, in the opinion of management, additional losses are deemed probable.
Compliance, Strategic and/or Reputational Risk Management
Compliance risk represents the risk of regulatory sanctions, reputational impact or financial loss resulting from our failure to comply with regulations and standards of good banking practice. Activities which may expose us to compliance risk include, but are not limited to, those dealing with the prevention of money laundering, privacy and data protection, community reinvestment initiatives, fair lending challenges and employment and tax matters. We have a separate department with individuals having specialized training and experience tasked with ensuring compliance with state and federal public interest, consumer, and civil rights oriented banking laws and regulations.
Strategic and/or reputation risk represents the risk of loss due to damage to reputation, failure to fully develop and execute business plans, failure to assess current and new opportunities in business, markets and products and any other event not identified in the defined risk types mentioned previously. Mitigation of the various risk elements that represent strategic and/or reputation risk is achieved through initiatives to help us better understand, monitor and report on the various risks.
72
Table of Contents
Liquidity Risk Management
Liquidity risk is the risk of potential loss if the Company were unable to meet its funding requirements at a reasonable cost. The Company manages liquidity risk at the Bank and holding company to help ensure that it can obtain cost-effective funding to meet current and future obligations.
The largest source of liquidity on a consolidated basis is the deposit base that originates from retail and corporate banking businesses. Other borrowed funds are available from a diverse mix of short- and long-term funding sources. Liquid assets and unused borrowing capacity from a number of sources are also available to maintain an adequate liquidity position.
Liquidity
Operating Activities
Net cash provided by operations of $6.5 million for the six months ended June 30, 2014 decreased $7.5 million when compared to the same period in 2013 primarily due to lower valuation adjustments for OREO losses and lower gains on the sale of residential first mortgage loans.
Net cash provided by operations of $6.7 million for the nine months ended December 31, 2013 decreased $25.8 million when compared to the same period in 2012 primarily due to lower gains on the sale of residential first mortgage loans and OREO.
Investing Activities
Net cash from investing activities decreased $59.1 million for the six months ended June 30, 2014 as compared to the same period in 2013 due to a decline in the origination of loans held for investment and lower proceeds from sales of investments and OREO.
Net cash from investing activities decreased $150.4 million for the nine months ended December 31, 2013 as compared to the same period in 2012 primarily due to a decline in the origination of mortgage loans held for investment.
Financing Activities
Net cash used for financing activities decreased $50.3 million for the six months ended June 30, 2014 as compared to the same period in 2013 primarily due to a decline in the level of run off on deposit balances during the period.
Net cash used for financing activities decreased $142.7 million for the nine months ended December 31, 2013 as compared to the same period in 2012 primarily due to an increase in the net repayment of borrowings, proceeds from the issuance of common stock, and a decline in deposit balances during the period.
Liquidity and Capital Resources
On an unconsolidated basis, the Company’s typical sources of funds could include dividends from its subsidiaries, including the Bank, interest on its investments and returns on its real estate held for sale. The Company currently finances its operations through cash on hand and, to a lesser extent, interest on investments and dividends from its non-Bank subsidiary. A significant amount of our consolidated operating expenses are incurred and paid directly by the Company’s subsidiaries.
The Bank’s primary sources of funds are payments on loans and securities, deposits from retail and corporate banking businesses and wholesale funding sources (FHLB of Chicago advances, other borrowings and broker/
73
Table of Contents
internet CDs). The Bank was previously prohibited from obtaining new brokered deposits under provisions of the Bank Order. As of June 30, 2014, the Company had outstanding borrowings from the FHLB of Chicago of $10.0 million. The total maximum credit capacity at the FHLB of Chicago based on the existing stock holding as of June 30, 2014 was $238.8 million, subject to collateral availability. Total credit capacity based on the value of the existing collateral pledged was $470.6 million as of June 30, 2014 after considering other collateral requirements for letters of credit and our participation in the Mortgage Partnership finance Program of the FHLB of Chicago (“MPF Program”).
The Bank has also been granted access to the Federal Reserve Bank of Chicago’s Discount Window, but as of June 30, 2014, the Bank had no borrowings outstanding from this source.
Loan Commitments
At June 30, 2014, the Bank had outstanding commitments to originate loans of $82.5 million, $786,000 of unused commitments and commitments to extend funds to, or on behalf of, customers pursuant to lines, and unused letters of credit of $240.7 million. Scheduled maturities of certificates of deposits during the six months following June 30, 2014 amounted to $174.6 million. Scheduled maturities of borrowings during the same period totaled $3.5 million. Management believes adequate resources are available to fund all Bank commitments to the extent required.
Investment Securities
Investment securities are subject to inherent risks based upon the future performance of the underlying collateral (i.e., mortgage loans) for these securities. Among these risks are prepayment risk, interest rate risk and credit risk. Should general interest rate levels decline, the mortgage-related securities portfolio would be subject to (i) prepayments as borrowers typically would seek to obtain financing at lower rates, (ii) a decline in interest income received on adjustable-rate mortgage-related securities, and (iii) an increase in fair value of fixed-rate mortgage-related securities. Conversely, should general interest rate levels increase, the mortgage-related securities portfolio would be subject to (i) a longer term to maturity as borrowers would be less likely to prepay their loans, (ii) an increase in interest income received on adjustable-rate mortgage-related securities, (iii) a decline in fair value of fixed-rate mortgage-related securities, (iv) a decline in fair value of adjustable-rate mortgage-related securities to an extent dependent upon the level of interest rate increases, the time period to the next interest rate repricing date for the individual security and the applicable periodic (annual and/or lifetime) cap which could limit the degree to which the individual security may reprice within a given time period and (v) should default rates and loss severities increase on the underlying collateral of mortgage-related securities, credit losses may be experienced, which are recognized in earnings as net impairment losses.
MPF Program
The Company previously participated in the MPF Program. Pursuant to the credit enhancement feature of the MPF Program, the Company retained a secondary credit loss exposure in the amount of $15.9 million at June 30, 2014 related to approximately $191.9 million of residential mortgage loans that the Company has originated and is still outstanding as agent for the FHLB of Chicago. Under the credit enhancement, the FHLB of Chicago is liable for losses on loans up to 1% of the original delivered loan balances in each pool up to the point the credit enhancement is reset. After the credit enhancement resets, the FHLB of Chicago loss contingency could be reduced depending upon losses experienced and loan balances. The Company is then liable for losses over and above the FHLB of Chicago first loss position up to a contractually agreed-upon maximum amount in each pool that was delivered to the Program. The Company receives a monthly fee for this credit enhancement obligation based on the outstanding loan balances. The monthly fee received is net of losses under the MPF Program. The MPF Program was discontinued in 2008 in its present format and the Company no longer funds loans through the MPF Program.
74
Table of Contents
FHLB of Chicago Advances
The Bank pledges certain loans that meet underwriting criteria established by the FHLB of Chicago as collateral for outstanding advances. The unpaid principal balance of loans pledged to secure FHLB of Chicago borrowings totaled $644.5 million and $659.4 million at June 30, 2014 and December 31, 2013, respectively. The FHLB of Chicago borrowings are also collateralized by mortgage-related securities totaling $110.2 million and $122.2 million at June 30, 2014 and December 31, 2013, respectively. At June 30, 2014, there were no FHLB of Chicago borrowings with call features that may be exercised by the FHLB of Chicago.
On September 19, 2013 FHLB advances totaling $176.0 million were prepaid. The prepaid advances were fixed rate, due to mature in January 2018, with a then-current weighted average rate of 3.18%. The prepayment triggered an early termination penalty of $16.1 million, which was recorded in non-interest expense. On December 21, 2012, FHLB of Chicago advances totaling $150.0 million were prepaid. The prepaid advances were floating rate, due to mature in January 2015, with a then-current weighted average rate of 1.41%. The prepayment triggered an early termination penalty of $3.5 million which was recorded in non-interest expense.
Other
The Bank has, in the past, entered into agreements with certain brokers that provided deposits obtained from their customers at specified interest rates for an identified fee, or so called “brokered deposits.” At June 30, 2014, the Bank had no brokered deposits. The Bank Order, which was terminated on April 2, 2014, previously prohibited the Bank’s ability to accept, renew or roll over brokered deposits without prior approval of the OCC.
Regulatory Capital
Under federal law and regulation, the Bank is required to meet tier 1 leverage, tier 1 risk-based and total risk-based capital requirements. Tier 1 capital primarily consists of stockholders’ equity minus certain intangible assets and unrealized gains/losses on available-for-sale securities. Total risk-based capital primarily consists of tier 1 capital plus a qualifying portion of the allowance for loan losses. The risk-based capital requirements presently address credit risk related to both recorded and off-balance sheet commitments and obligations. At June 30, 2014, the Bank met the requirements to be considered well capitalized under these regulations.
At June 30, 2014, the Bank had a tier 1 leverage (core) ratio of 9.75% and a total risk-based capital ratio of 17.40%. All customer deposits remain fully insured to the highest limits set by the FDIC.
Our ability to meet our short-term liquidity and capital resource requirements may be subject to our ability to obtain additional debt financing and equity capital. We may increase our capital resources through offerings of equity securities (possibly including common shares and one or more classes of preferred shares), commercial paper, medium-term notes, securitization transactions structured as secured financings, and senior or subordinated notes.
75
Table of Contents
The following table summarizes the Bank’s capital ratios to be considered adequately or well capitalized under standard regulatory guidelines:
| Minimum Required | ||||||||||||||||||||||||
| Actual | To be Adequately Capitalized |
To be Well Capitalized |
||||||||||||||||||||||
| Capital | Ratio | Capital | Ratio | Capital | Ratio | |||||||||||||||||||
| (Dollars in thousands) | ||||||||||||||||||||||||
| June 30, 2014 |
||||||||||||||||||||||||
| Tier 1 leverage(1) |
$ | 206,272 | 9.75 | % | $ | 84,658 | 4.00 | % | $ | 105,823 | 5.00 | % | ||||||||||||
| Tier 1 risk-based capital(2) |
206,272 | 16.12 | 51,194 | 4.00 | 76,792 | 6.00 | ||||||||||||||||||
| Total risk-based capital(3) |
222,747 | 17.40 | 102,389 | 8.00 | 127,986 | 10.00 | ||||||||||||||||||
| December 31, 2013 |
||||||||||||||||||||||||
| Tier 1 leverage(1) |
$ | 201,995 | 9.60 | % | $ | 84,170 | 4.00 | % | $ | 105,212 | 5.00 | % | ||||||||||||
| Tier 1 risk-based capital(2) |
201,995 | 15.77 | 51,226 | 4.00 | 76,839 | 6.00 | ||||||||||||||||||
| Total risk-based capital(3) |
218,668 | 17.07 | 102,452 | 8.00 | 128,065 | 10.00 | ||||||||||||||||||
| March 31, 2013 |
||||||||||||||||||||||||
| Tier 1 leverage(1) |
$ | 107,272 | 4.53 | % | $ | 94,775 | 4.00 | % | $ | 118,469 | 5.00 | % | ||||||||||||
| Tier 1 risk-based capital(2) |
107,272 | 7.71 | 55,655 | 4.00 | 83,483 | 6.00 | ||||||||||||||||||
| Total risk-based capital(3) |
125,459 | 9.02 | 111,311 | 8.00 | 139,139 | 10.00 | ||||||||||||||||||
| (1) | Tier 1 capital divided by adjusted total assets. |
| (2) | Tier 1 capital divided by total risk-weighted assets. |
| (3) | Total risk-based capital divided by total risk-weighted assets. |
The following table presents the components of the Bank’s regulatory capital:
| June 30, 2014 |
December 31, 2013 |
March 31, 2013 |
||||||||||
| (In thousands) | ||||||||||||
| Stockholders’ equity of the Bank |
$ | 205,922 | $ | 196,469 | $ | 112,796 | ||||||
| Less: Disallowed servicing assets |
(1,500 | ) | (1,096 | ) | (1,945 | ) | ||||||
| Accumulated other comprehensive (income) loss |
1,850 | 6,622 | (3,579 | ) | ||||||||
|
|
|
|
|
|
|
|||||||
| Tier 1 capital |
206,272 | 201,995 | 107,272 | |||||||||
| Plus: Allowable allowance for loan losses |
16,475 | 16,673 | 18,187 | |||||||||
|
|
|
|
|
|
|
|||||||
| Total risk-based capital |
$ | 222,747 | $ | 218,668 | $ | 125,459 | ||||||
|
|
|
|
|
|
|
|||||||
We are a separate and distinct legal entity from our subsidiaries, including the Bank. As a holding company without independent operations, our liquidity (on an unconsolidated basis) is primarily dependent upon our ability to raise debt or equity capital from third parties and the receipt of dividends from the Bank and its non-bank subsidiary. We receive substantially all of our revenue from dividends from the Bank. These dividends are the principal source of funds to pay dividends on our preferred or common stock. Various federal and/or state laws and regulations limit the amount of dividends that the Bank may pay us. Additionally, if the Bank’s earnings are not sufficient to make dividend payments to us while maintaining adequate capital levels, our ability to make dividend payments to our preferred or common stockholders will be negatively impacted. At June 30, 2014, the Company’s cash and cash equivalents, on an unconsolidated basis amounted to $4.2 million.
Contractual Obligations and Commitments
At June 30, 2014, the Bank had outstanding commitments to originate loans of $82.5 million, $786,000 of unused commitments and commitments to extend funds to, or on behalf of, customers pursuant to lines, and unused letters of credit of $240.7 million. Scheduled maturities of certificates of deposits during the six months
76
Table of Contents
following June 30, 2014 amounted to $174.6 million. Scheduled maturities of borrowings during the same period totaled $3.5 million. Management believes adequate resources are available to fund all Bank commitments to the extent required.
The following table summarizes our contractual principal cash obligations and other commitments at June 30, 2014:
| Payment Due by Period | ||||||||||||||||||||
| Contractual Obligations |
Less than 1 Year |
1-3 Years | 4-5 Years | More than 5 Years |
Total | |||||||||||||||
| (In thousands) | ||||||||||||||||||||
| FHLB advances |
$ | — | $ | — | $ | 10,000 | $ | — | $ | 10,000 | ||||||||||
| Repurchase agreements |
3,540 | — | — | — | 3,540 | |||||||||||||||
|
|
|
|
|
|
|
|
|
|
|
|||||||||||
| Total other borrowed funds |
3,540 | — | 10,000 | — | 13,540 | |||||||||||||||
| Certificates of deposit |
174,569 | 261,046 | 49,649 | 7,561 | 492,825 | |||||||||||||||
| Other deposits |
1,380,415 | — | — | — | 1,380,415 | |||||||||||||||
| Lease obligations |
1,511 | 2,544 | 1,932 | 5,034 | 11,021 | |||||||||||||||
|
|
|
|
|
|
|
|
|
|
|
|||||||||||
| Total contractual obligations |
$ | 1,560,035 | $ | 263,590 | $ | 61,581 | $ | 12,595 | $ | 1,897,801 | ||||||||||
|
|
|
|
|
|
|
|
|
|
|
|||||||||||
As of June 30, 2014, balances of our contractual principal cash obligations and other commitments declined $1.9 million from December 31, 2013. The decline was primarily due to lower balances in CDs of $58.1 million as higher cost deposits either matured or renewed at lower rates and was mostly offset by an increase in other deposits of $56.1 million.
Quantitative and Qualitative Disclosures About Market Risk
Market risk is the risk of a loss in earnings or economic value due to adverse movements in market factors such as interest rates, credit spreads, foreign exchange rates, and equity prices. We are exposed to market risk primarily by our involvement in, among others, traditional banking activities of taking deposits and extending loans.
While the Company attempts to manage its balance sheet to minimize the effect that a change in interest rates has on its net interest margin it may utilize derivative financial instruments as part of its interest rate risk management strategy. The Board recently approved developing a program for the prudent use of interest rate swap transactions to manage the interest rate risk of commercial loans and to manage other balance sheet interest rate risk. The Company intends to enter into interest rate-related transactions to facilitate the interest rate risk management strategies of commercial customers. The Company would then mitigate this risk by entering into equal and offsetting interest rate-related transactions with highly rated third party financial institutions. The Company’s objectives with the use of derivatives are to add stability to its net interest margin and to manage its exposure to movements in interest rates. There were no outstanding interest rate derivative transactions or any other activity at or during the six months ended June 30, 2014.
Asset/Liability Management
The business of the Company and the composition of its consolidated balance sheet consist of investments in interest-earning assets (primarily loans, mortgage-backed securities, and other securities) that are largely funded by interest-bearing liabilities (deposits and borrowings). All of the financial instruments of the Company as of June 30, 2014 were held for other-than-trading purposes. Such financial instruments have varying levels of sensitivity to changes in market rates of interest. The Company’s net interest income is dependent on the amounts of and yields on its interest-earning assets as compared to the amounts of and rates on its interest-bearing liabilities. Net interest income is therefore sensitive to changes in market rates of interest.
77
Table of Contents
The Company’s asset/liability management strategy is to maximize net interest income while limiting exposure to risks associated with changes in interest rates. This strategy is implemented by the Company’s ongoing analysis and management of its interest rate risk. A principal function of asset/liability management is to coordinate the levels of interest-sensitive assets and liabilities to manage net interest income changes within limits in times of fluctuating market interest rates.
Interest rate risk results when the maturity or repricing intervals and interest rate indices of the interest-earning assets, interest-bearing liabilities, and off-balance-sheet financial instruments are different, thus creating a risk that will result in disproportionate changes in the value of and the net earnings generated from these instruments. The Company’s exposure to interest rate risk is managed primarily through the strategy of selecting the types and terms of interest-earning assets and interest-bearing liabilities that generate favorable earnings while limiting the potential negative effects of changes in market interest rates. Because the primary source of interest-bearing liabilities is customer deposits, the Company’s ability to manage the types and terms of such deposits may be somewhat limited by customer maturity preferences in the market areas in which the Company operates. Deposit pricing is competitive with promotional rates frequently offered by competitors. Borrowings, which include FHLB of Chicago advances, short-term borrowings, and long-term borrowings, are generally structured with specific terms which, in management’s judgment, when aggregated with the terms for outstanding deposits and matched with interest-earning assets, reduce the Company’s exposure to interest rate risk. The rates, terms, and interest rate indices of the interest-earning assets result primarily from the Company’s strategy of investing in securities and loans (a portion of which have adjustable rates). This permits the Company to limit its exposure to interest rate risk, together with credit risk, while at the same time achieving a positive interest rate spread from the difference between the income earned on interest-earning assets and the cost of interest-bearing liabilities.
Management uses a simulation model for internal asset/liability management. The model uses maturity and repricing information for securities, loans, deposits, and borrowings plus repricing assumptions on products without specific repricing dates (e.g., savings and interest-bearing demand deposits), to calculate the cash flows, income, and expense of assets and liabilities. In addition, the model computes a theoretical market value of equity by estimating the market values of its assets and liabilities using present value methodology. The model also projects the effect on earnings and theoretical value under various interest rate change scenarios. The Company’s exposure to interest rates is reviewed on a monthly basis by senior management and the Board.
Net Interest Income Sensitivity Analysis
The Company performs a net interest income sensitivity analysis as part of its asset/liability management processes. Net interest income sensitivity analysis measures the change in net interest income in the event of hypothetical changes in interest rates. This analysis assesses the risk of change in net interest income in the event of sudden and sustained 100 and 200 basis point increases in market interest rates. The table below presents the projected changes in twelve-month cumulative net interest income for the various rate shock levels at June 30, 2014 and December 31, 2013, respectively.
| 200 Basis Point Rate Increase |
100 Basis Point Rate Increase |
|||||||
| June 30, 2014 |
3.7 | % | 1.8 | % | ||||
| December 31, 2013 |
3.5 | % | 1.4 | % | ||||
As a result of current market conditions, 100 and 200 basis point decreases in market interest rates are not applicable for the periods presented as those decreases would result in some deposit interest rate assumptions falling below zero. Nonetheless, the Company’s net interest income may decline in declining rate environments as yields on earning assets could continue to adjust downward.
As shown above, at June 30, 2014, the effect of an immediate 200 basis point increase in interest rates would increase the Company’s net interest income by 3.7%. The net interest income sensitivity was changed at December 31, 2013 to reflect a change in methodology that has been implemented to segregate nonaccrual loans in the model. Overall net interest income sensitivity remains within the Company’s guidelines.
78
Table of Contents
The changes in the Company’s net interest income reflected above were due, in large part, to the optionality on both sides of the balance sheet. The changes in net interest income over the one year horizon for June 30, 2014 under the 100 basis point and 200 basis point increases in market interest rates scenarios are reflective of this optionality. In general, in a rising rate environment, yields on loans and investment securities are expected to re-price upwards more quickly than the cost of funds.
Mortgage-backed securities, including adjustable rate mortgage pools, are modeled in the above analysis based on their estimated repricing or principal pay-downs obtained from outside analytical sources. Loans are modeled in the above analysis based on contractual maturity or contractual repricing dates, coupled with principal prepayment assumptions. Deposits are based on management’s analysis of industry trends and customer behavior.
The Company also uses these assumptions to estimate the market value of equity and the market risk to this value due to changes in interest rates. This focus helps model risks embedded in the balance sheet over a longer time horizon than the net interest income simulation. The calculation is based on the present value of projected future cash flows. As of June 30, 2014, the projected changes for the market value of equity were within the Company’s policy limits.
Computations of the prospective effects of hypothetical interest rate changes are dependent on numerous assumptions, including relative levels of market interest rates, loan prepayments and deposit decay rates. These computations should not be relied upon as indicative of actual results. Actual values may differ from those projections set forth above, should market conditions vary from assumptions used in preparing the analyses. Further, the computations do not contemplate any actions the Company may undertake in response to changes in interest rates. Because such assumptions can be no more than estimates, certain assets and liabilities modeled as maturing or otherwise repricing within a stated period may, in fact, mature or reprice at different times and at different volumes than those estimated. Also, the renewal or repricing of certain assets and liabilities can be discretionary and subject to competitive and other pressures. Therefore, the rate sensitivity results included above do not and cannot necessarily indicate the actual future impact of general interest rate movements on the Company’s net interest income.
Critical Accounting Estimates and Judgments
The consolidated financial statements are prepared by applying certain accounting policies. Certain of these policies require management to make estimates and strategic or economic assumptions that may prove inaccurate or be subject to variations that may significantly affect the reported results and financial position for the period or in future periods. Some of the more significant policies are as follows:
Fair Value Measurements
Management must use estimates, assumptions, and judgments when assets and liabilities are required to be recorded at, or adjusted to reflect, fair value under GAAP. This includes the initial measurement at fair value of the assets acquired and liabilities assumed in acquisitions qualifying as business combinations, foreclosed properties and repossessed assets and the capitalization of mortgage servicing rights. The valuation of both financial and nonfinancial assets and liabilities in these transactions requires numerous assumptions and estimates and the use of third-party sources including appraisers and valuation specialists.
Assets and liabilities carried at fair value inherently result in a higher degree of financial statement volatility. Assets and liabilities measured at fair value on a recurring basis include available for sale securities, loans held for sale, interest rate lock commitments and forward contracts to sell mortgage loans. Assets and liabilities measured at fair value on a non-recurring basis may include mortgage servicing rights, certain impaired loans and OREO. Fair values and the information used to record valuation adjustments for certain assets and liabilities are based on either quoted market prices or are provided by other independent third-party sources, when
79
Table of Contents
available. When such third-party information is not available, fair value is estimated primarily by using cash flow and other financial modeling techniques. Changes in underlying factors, assumptions, or estimates in any of these areas could materially impact future financial condition and results of operations.
Available-for-Sale Securities
Declines in the fair value of available-for-sale securities below their amortized cost that are deemed to be other-than-temporary are reflected in earnings as unrealized losses. In estimating other-than-temporary impairment losses on debt securities, management considers many factors which include: (1) the length of time and the extent to which the fair value has been less than cost, (2) the financial condition and near-term prospects of the issuer and (3) our intent and ability to retain our ownership in a security for a period of time sufficient to allow for any anticipated recovery in fair value. To determine if other-than-temporary impairment exists on a debt security, we first determine if (a) we intend to sell the security or (b) we are more likely than not that we will be required to sell the security before our anticipated recovery. If either of the conditions is met, we will recognize an other-than-temporary impairment loss in earnings equal to the difference between the fair value of the security and our amortized cost. If neither of the conditions is met, we determine (a) the amount of the impairment related to credit loss and (b) the amount of the impairment due to all other factors. The difference between the present values of the cash flows expected to be collected, discounted at the purchase yield or current accounting yield of the security, and the amortized cost basis is the credit loss. The credit loss is the amount of impairment deemed other-than-temporary and recognized in earnings and is a reduction to the cost basis of the security. The amount of impairment related to all other factors (i.e., non-credit) is deemed temporary and included in accumulated other comprehensive income (loss).
Allowance for Loan Losses
The allowance for loan losses is a valuation account for probable and inherent losses incurred in the loan portfolio. Management maintains an allowance for loan losses—and separately a reserve for unfunded loan commitments, letters of credit and repurchase of sold loans in other liabilities—at levels that we believe to be adequate to absorb estimated probable credit losses incurred in the loan portfolio. The adequacy of the ALLL is determined based on periodic evaluations of the loan portfolios and other relevant factors. The ALLL is comprised of general and specific components. Even though the entire allowance is available to cover losses on any loan, specific allowances are provided on impaired loans pursuant to accounting standards. The general allowance is based on historical loss experience, adjusted for qualitative factors. At least quarterly, management reviews the assumptions and methodology related to the general and specific allowances in an effort to update and refine the estimate.
In determining the general allowance, the loan portfolio is segregated by purpose and collateral type. By doing so, trends in borrower behavior and loss severity are more easily identified. For each class of loan, a historical loss factor is computed. In determining the appropriate period of activity to use in computing the historical loss factor we look at trends in quarterly net charge-off rates. It is management’s intention to utilize a period of activity that is most reflective of current experience. Changes in the historical period are made when there is a distinct change in the trend of net charge-off experience or other factors. Given the changes in the credit market that have occurred since 2008, management reviews each class’ historical losses by quarter for any trends that would indicate a different look back period would be more representative of current experience.
Historical loss rates used to calculate the general allowance are adjusted by values assigned to nine qualitative factors which are listed in the section titled “Allowance for Loan Losses” within “Credit Risk Management”. In determining the appropriate value to assign to a particular factor, if any, management compares the current underlying facts and circumstances with respect to that factor with those in the historical periods. Values assigned to factors are modified when changes in the environment relative to that qualitative factor are deemed to be significant. Management will continue to analyze the factors on a quarterly basis, adjusting the historical loss rates as necessary, to a rate believed to be appropriate for the probable and inherent risk of loss in the portfolio.
80
Table of Contents
For the quarter ended June 30, 2014, the Bank modified its general allowance methodology to increase the historical loss period from an eight to nine quarter historical look-back period, with the intent to build to a 12 quarter look back period subsequent to June 30, 2014. The modification was done to reflect a more stable economic environment and to capture additional loss statistics considered reflective of the current portfolio. The impact to the allowance for loan losses at June 30, 2014 after implementing the above modifications was a reduction of the required reserve of $381,000 as compared to the previous methodology.
Specific allowances are determined as a result of an impairment review process. When a loan is identified as impaired it is evaluated for loss using either the fair value of collateral method or the present value of expected cash flows method. If the present value of expected cash flows or the fair value of collateral exceeds the Bank’s carrying value of a loan no loss is anticipated and no specific reserve is established. However, if the carrying value of a loan is greater than the present value of expected cash flows or fair value of collateral a specific reserve is established. In either situation, loans identified as impaired are excluded from the calculation of the general allowance.
The Company regularly obtains updated appraisals for real estate collateral dependent loans for which it calculates impairment based on the fair value of collateral. Loans having an unpaid principal balance of $500,000 or less in a homogenous pool of assets do not require an impairment analysis. Due to certain limitations, including, but not limited to, the availability of qualified appraisers, the time necessary to complete acceptable appraisals, the availability of comparable market data and information, and other considerations, in certain instances current appraisals are not readily available. In those cases, evaluations are being utilized for smaller properties when an appraisal has been done within five years and no market deterioration is evident.
The determination of value on an individually reviewed loan is estimated using an appraisal discounted by 15%, 25% or 35% depending on whether the appraisal is a) current (less than one year old), b) improved land or commercial real estate (CRE) greater than a year old, or c) unimproved land greater than a year old, respectively. The 15% discount represents an estimate of selling costs and potential taxes and other expenses the Bank may need to incur to dispose of a property. The additional discounts on appraisals greater than a year old of 10% and 20% on improved land/CRE and unimproved land, respectively, reflect the decrease in collateral values during years beginning 2011 through the current period. These percentages are supported by the Bank’s analysis of appraisal activity over the past 12 months.
Loans are considered to be non-performing at such time that they become ninety days past due or earlier if a loss is deemed probable. At the time a loan is determined to be non-performing it is downgraded per our loan rating system, it is placed on non-accrual, and an allowance consistent with our historical experience for similar “substandard” loans is established. Within ninety days of this determination a comprehensive analysis of the loans is completed, including ordering new appraisals, where necessary, and an adjustment to the estimated allowance is recognized to reflect the impaired value of the loan based on the underlying collateral or the discounted cash flows. Until such date at which an updated appraisal is obtained, when deemed necessary, we apply discounts to the existing appraisals in estimating the fair value of collateral as described above.
Management considers the ALLL at June 30, 2014 to be at an adequate level, although changes may be necessary if future economic and other conditions differ substantially from the current environment. Although the best information available is used, the level of the ALLL remains an estimate that is subject to significant judgment and short-term change. To the extent actual outcomes differ from our estimates, additional provision for loan losses may be required that would reduce future earnings.
Foreclosure
Real estate acquired by foreclosure or by deed in lieu of foreclosure and other repossessed assets are held for sale and are initially recorded at fair value less estimated selling costs at the date of foreclosure, establishing a new cost basis. Any write down to fair value less estimated selling costs is charged to the ALLL. If the fair value
81
Table of Contents
exceeds the net carrying value of the loans, recoveries to the ALLL are recorded to the extent of previous charge-offs, with any excess, which is infrequent, recognized as a gain in non-interest income. Subsequent to foreclosure, updated appraisals are generally obtained on an annual basis and the assets are adjusted to the lower of cost or fair value, less estimated selling expenses. Costs relating to the development and improvement of the property may be capitalized. Holding period costs and subsequent changes to the valuation allowance are charged to OREO expense, net included in non-interest expense. Incremental valuation adjustments may be recognized in the Statement of Operations if, in the opinion of management, additional losses are deemed probable.
Mortgage Servicing Rights
MSRs are initially recorded as an asset, measured at fair value, when loans are sold to third parties with servicing rights retained. MSR assets are amortized in proportion to, and over the period of, estimated net servicing revenues. The carrying value of these assets is periodically reviewed for impairment using a lower of amortized cost or fair value methodology. The fair value of the servicing rights is determined by estimating the present value of future net cash flows, taking into consideration market loan prepayment speeds, discount rates, servicing costs and other economic factors. For purposes of measuring impairment, the underlying loans are stratified into relatively homogeneous pools based on predominant risk characteristics which include product type (i.e., fixed, adjustable or balloon) and interest rate bands. If the aggregate carrying value of the capitalized mortgage servicing rights for a stratum exceeds its fair value, MSR impairment is recognized in earnings for the difference. As the loans are repaid and net servicing revenue is earned, the MSR asset is amortized as an offset in loan servicing income. Servicing revenues are expected to exceed this amortization expense. However, if actual prepayment experience or defaults exceed what was originally anticipated, net servicing revenues may be less than expected and mortgage servicing rights may be impaired.
Income Taxes
Our provision for federal income taxes results in the recognition of a deferred tax liability or deferred tax asset computed by applying the current statutory tax rates to net taxable or deductible differences between the tax basis of an asset or liability and our reported amount in the consolidated financial statements that will produce taxable income or deductible expenses in future periods. We regularly review the carrying amount of our net deferred tax assets (net of deferred tax liabilities) to determine if the establishment of a valuation allowance is necessary. If based on the available evidence, it is more likely than not that all or a portion of our net deferred tax assets will not be realized in future periods, a deferred tax valuation allowance would be established. Consideration is given to various positive and negative factors that could affect the realization of the net deferred tax assets.
In evaluating this available evidence, management considers, among other things, historical financial performance, expectation of future earnings, the ability to carry back losses to recoup taxes previously paid, length of statutory carry forward periods, experience with operating loss and tax credit carry forwards not expiring unused, tax planning strategies and timing of reversals of temporary differences. Significant judgment is required in assessing future earnings trends and the timing of reversals of temporary differences. Our evaluation is based on current tax laws as well as management’s expectations of future performance.
As a result this evaluation, a full valuation allowance has been established against the net deferred tax asset.
Recent Accounting Pronouncements. Refer to Note 3 of our interim consolidated financial statements for a description of recent accounting pronouncements including the respective dates of adoption and effects on results of operations and financial condition.
82
Table of Contents
Overview of Business Operations
We are a savings and loan holding company incorporated under the laws of the State of Delaware and headquartered in Madison, Wisconsin. We offer a full range of financial services through the Bank. The Bank offers financial services through 54 full-service banking offices throughout our market area, which is concentrated in the greater Madison, Fox Valley and suburban Milwaukee regions of Wisconsin. We believe that our markets exhibit attractive demographic attributes and present favorable competitive dynamics with long-term growth opportunities. Our strategy focuses on building a strong commercial banking franchise with meaningful market share and growing revenues complemented by operational efficiencies that we believe can produce attractive risk-adjusted returns. As of June 30, 2014, on a consolidated basis, we had total assets of approximately $2.12 billion, total loans of approximately $1.56 billion, total deposits of approximately $1.87 billion, and total stockholders’ equity of approximately $211.5 million.
We are the third largest bank headquartered in Wisconsin, based upon deposit balances as of June 30, 2014 as reported in the consolidated reports of Condition and Income filed with the Federal Financial Institutions Examination Council. We are led by a team of experienced bankers, most of whom have significant experience in the Wisconsin banking markets. The Bank’s core businesses are currently primarily dedicated to providing quality, personalized financial and investment services to local businesses and individuals. Our commercial banking services include cash management, working capital lines of credit, term loans for fixed asset acquisitions, commercial mortgages, other forms of asset-based financing, construction and multi-family mortgage loans, commercial real estate and commercial loans. We also offer a wide range of consumer banking services, including residential mortgage loans, consumer loans, checking and savings accounts, money market and interest-bearing checking accounts, certificates of deposit, and individual retirement accounts. We believe our presence in the markets in which we serve, our local market knowledge and our ability to make responsive decisions at the local level give us the ability to tailor our products and services to meet our client’s specific needs.
As we work to transition the Bank from a traditional mortgage-based lender to a commercially-focused, full service community bank, we continue to seek and recruit seasoned commercial banking talent and transition our corporate culture toward building relationships and pursuing cross-selling opportunities through a sales and service model. Management regularly and periodically evaluates and assesses all aspects of our operations, including retail branch delivery, for opportunities to improve our profitability. In the case of branch delivery, this includes the closure, sale or other disposal of a branch or adding additional branches to the current branch structure.
We also have a non-banking subsidiary, IDI, a Wisconsin corporation which has historically invested in real estate partnerships. During 2010, IDI sold substantially all of its assets and its investment activities have been significantly curtailed.
The Bank has one wholly owned subsidiary, ADPC Corporation, a Wisconsin corporation, which holds and develops certain of the Bank’s foreclosed properties.
83
Table of Contents
Corporate Structure
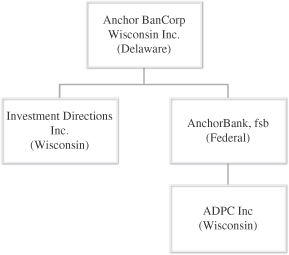
Our Markets
Our market area is concentrated in Wisconsin’s greater Madison, Fox Valley and Milwaukee regions. Collectively, these areas account for nearly half of Wisconsin’s population and we believe they provide a desirable platform for long-term local and regional growth. Our headquarters is located in the attractive market of Madison, Wisconsin, where we have 18 branches within Dane County. Madison is the state capital and home to both state and county governments, as well as the University of Wisconsin-Madison. Dane County has enjoyed steady population growth of 3.2% annually since 2010, a median household income 17.3% above the national average and relatively low unemployment at 4.0% versus the state average of 5.7% and the national average of 6.1% (each as of June 2014), according to the U.S. Census data. The decline in unemployment rates from 2012 through 2013 in Dane County and the State of Wisconsin was minimal. Madison was named the eighth best city to raise a family by Parenting Magazine in 2012. Madison was also named America’s 14th Most Recession-Proof City by CNNMoney.com in September of 2010.
We have seven branches located in Wisconsin’s Fox Valley region, consisting primarily of the cities of Appleton and Oshkosh and their associated satellite communities. We also have an additional seven branches in the greater Milwaukee area, one of the largest metropolitan areas in the Midwest and home to approximately 1.6 million people and close to 60,000 businesses according to SNL Financial LC. Our remaining 22 locations are community based locations distributed primarily in counties adjacent to Dane County and the southwestern counties of Wisconsin.
Competitive Strengths
In addition to our presence in these attractive markets, we believe that we are well-positioned to grow our franchise and create value for our stockholders as a result of the following competitive strengths:
| • | Experienced and respected management team with a proven track record. Our President and Chief Executive Officer Chris Bauer joined us in 2009 and recruited an executive management team, bringing in highly experienced community bankers with extensive knowledge of the Wisconsin banking market. Each of these executives has significant experience at nationally recognized mid- to large-cap commercial banking institutions. Mr. Bauer has 37 years of financial services experience, with a combined 16 years as bank president at First Wisconsin Bank and Firstar Bank Milwaukee, N.A. |
| • | Strong capital position. At June 30, 2014, we had a 16.12% tier 1 risk-based ratio, a 9.75% tier 1 leverage ratio and a 17.40% total risk-based capital ratio. Our loan to deposit ratio was 83.8% at June 30, 2014. |
84
Table of Contents
| • | Disciplined enterprise-wide and credit risk management. Since 2009, we have invested significantly in our risk management platform in order to provide a consistent approach to identifying, assessing, managing, monitoring and reporting risk across the Company. Our focus both on remediating our classified assets and improving and implementing enhanced credit underwriting and administration over the last five years has enabled us to significantly improve asset quality and create a stable banking platform from which to grow. |
| • | Core funding. A significant component of our franchise is our core deposit base, such as checking and savings deposits, which we use to fund our loans and grow our balance sheet. At June 30, 2014, our total deposits were approximately $1.87 billion, 73.7% of which were core deposits (defined as total deposits excluding certificates of deposit). We seek to cross-sell deposit products at the time of loan origination to our clients as part of our focus on relationship banking in order to provide a stable source of funding. |
Our Business Strategy
Our growth strategy centers around the following initiatives:
| • | Balance our franchise by increasing commercial banking relationships and market share. Our primary strategic focus is the transformation of the Bank from a residential/commercial real estate lender and retail-focused savings bank to a service-driven, relationship-based franchise with a focus on building commercial business and with a continued dedication to our retail line of business. We believe there is an underserved base of small and middle market businesses that are interested in banking with a company headquartered in, and with decision-making authority based in, the markets in which we operate. We intend to maintain disciplined growth, a strong credit culture and a relationship-based and community service-focused approach to banking. We continue to recruit seasoned commercial banking talent and transition our corporate culture toward building relationships and pursuing cross-selling opportunities through a sales and service model. |
| • | Expansion of commercial banking services. We plan to increase our commercial banking staff and sales efforts, emphasizing our multi-family and other commercial real estate banking businesses and a comprehensive C&I banking program designed to service manufacturing businesses, professional service firms and privately owned businesses and their related business owners. We believe these services are a key component in our transition to a commercial bank. To that end, we added six experienced commercial bankers to our team during the first six months of 2014. |
| • | Continue to improve asset quality. Over the last five years, we have dedicated significant resources to reducing our level of problem assets and improving our credit risk function, including implementing comprehensive credit policies, processes and procedures to better manage the loan portfolio and any delinquent and troubled loans. Our non-performing assets have declined by $357.0 million, or 78.4%, from $455.3 million as of March 31, 2010 to $98.3 as of June 30, 2014. We continue to focus on improving our asset quality and proactively monitoring credit risk. |
| • | Build a scalable and efficient operating model. Management team is focused on sustainable expense control across all lines of business. We continue to make investments in information technology to improve efficiencies and enhance customer service, including upgraded account and data processing systems, improved loan monitoring and quality control systems, as well as upgraded reporting systems and outsourcing when appropriate. In addition, we are implementing an improved cost and profit center accounting system to better assess product and service performance, as well as a sales activity database to better track sales performance and market penetration. |
| • | Focus on generating core deposits. We continue to focus on growing our core deposits to fund our lending and investment opportunities by expanding our marketing efforts and improving product offerings, including a full rebranding effort and execution of an integrated strategic marketing plan. In addition, as part of our focus on relationship banking, we seek to generate increased core deposits from new commercial and commercial real estate lending customers. |
85
Table of Contents
Background and Overview of Plan of Reorganization
In the fall of 2008, the United States economy suffered one of the worst financial crises on record. What came to be known as the “Great Recession” had worldwide implications and brought with it a tremendous loss of value in the United States real estate market, among other areas. Unemployment reached its highest levels in decades, and consumers as well as commercial borrowers began to default on credit obligations in record numbers.
We and the Bank have suffered significant losses since 2008. To complicate matters, our obligations under the Credit Agreement originally were scheduled to mature on September 30, 2008. We were successful in negotiating a 15-month extension of the Credit Agreement maturity through 2009. No payments had been made on the bank claims since March 2009, when we deposited a reserve sufficient to pay interest through April 2010. In addition, we took further necessary steps to improve our capital ratio by participating in TARP. Without the injection of TARP funds in January 2009, the Bank’s core capital ratio was projected to fall below 2% as of September 2009 which is considered “critically undercapitalized” and would create an imminent risk that the Bank would be seized by the FDIC. Notwithstanding these measures, the difficulties faced by the Company and the Bank remained. As a consequence of the financial crisis and related challenges, on June 26, 2009, the Company and the Bank each were compelled to consent to the issuance of the C&D Orders.
In July 2009, following issuance of the C&D Orders, a new senior management team was brought in, under the leadership of Chris M. Bauer, who joined the Bank as Chief Executive Officer. The new management team led the Bank’s turnaround efforts, focusing its efforts on stabilizing the Bank and removing the imminent threat of the Bank’s failure, and was ultimately able to achieve compliance with every task set forth in the C&D Orders except the capital ratio requirements, as further discussed below.
Among other things, the C&D Orders required that, no later than December 31, 2009, the Bank meet and maintain both a tier 1 (core) capital ratio equal to or greater than 8% and a total risk-based capital ratio equal to or greater than 12%. The C&D Orders also required the Bank to submit a capital restoration plan, along with a revised business plan. The Bank submitted its capital restoration plan on July 23, 2010. On August 31, 2010, the OTS approved the capital restoration plan, although the approval was accompanied by the PCA Directive.
During the entire time period from the submission of the capital restoration plan to the present, we pursued alternative solutions to meet the required capital ratios and otherwise satisfy the obligations of the capital restoration plan and the PCA Directive. These alternatives included raising outside capital with the assistance of the Bank’s legal and financial advisors. We also focused our efforts on improving the overall financial performance and efficiency of the Bank.
While we were reasonably successful in stabilizing the financial condition of the Bank from an operational standpoint, we were not successful in raising outside capital, which was needed to meet the required capital ratios and also to repay the amounts owing under the Credit Agreement. The primary obstacle that we faced in our capital-raising efforts was the existence of $183.5 million in principal, interest, and fees owing under the Credit Agreement with additional interest accruing at the default rate of 17% per annum and $137.9 million in TARP-related preferred-stock investments, including unpaid dividends. This capital structure made it very difficult for us to incur debt or raise equity to address our capital requirements.
Recapitalization Transactions
We and our advisors negotiated with the lenders and the Administrative Agent, and with the U.S. Treasury, for a mutually satisfactory settlement of our outstanding obligations for the benefit of all of our stakeholders. During the time period from approximately the end of 2009 through June 30, 2013, the Administrative Agent (and requisite Lenders) agreed, from time to time, to extend the maturity of the Credit Agreement obligations while these negotiations and our capital-raising efforts were ongoing, and we also received the requisite regulatory approval for such extensions.
86
Table of Contents
On August 12, 2013, we filed the Chapter 11 Case in the Bankruptcy Court to implement the Plan of Reorganization in order to facilitate the restructuring of the Company and the recapitalization of the Bank. Prior to the Petition Date, U.S. Bank and Bank of America, N.A., as our senior secured creditors, and the Treasury, as our sole preferred stockholder, voted to accept the Plan of Reorganization. The Chapter 11 Case was being administered in the Bankruptcy Court under the caption “In re Anchor BanCorp Wisconsin Inc.,” Case No. 13-14003-rdm.
On August 30, 2013, the Bankruptcy Court entered the Confirmation Order, whereby it confirmed the Plan of Reorganization. On September 27, 2013, the Plan of Reorganization became effective in accordance with its terms. During the period of bankruptcy, we incurred and expensed as reorganization costs $1.9 million of expenses for the nine months ended December 31, 2013.
The following is a summary of the transactions consummated on or before the Effective Date pursuant to the Plan of Reorganization confirmed by the Bankruptcy Court. Note that this summary only highlights the material provisions of, is not a complete description of, and is qualified in its entirety by reference to, the Plan of Reorganization attached to the Confirmation Order, which is filed as an exhibit to our registration statement on Form S-1, of which this prospectus is a part.
Delaware Conversion
Pursuant to the Plan of Reorganization, on September 25, 2013, we (i) converted from a Wisconsin corporation to a Delaware corporation in accordance with Section 265 of the Delaware General Corporation Law and (ii) filed the Amended Charter, to, among other things, declassify the Board, increase the number of authorized shares of our common stock and adopt certain restrictions on acquisitions and dispositions of our securities. The Amended Charter provides for (a) 2,000,000,000 shares of authorized common stock, par value $0.01 per share (the “common stock”), and (b) 1,000,000 shares of authorized preferred stock, par value $0.01 per share. The Reverse Stock Split was effected and a subsequent amendment to the corporate charter was filed on October 2, 2013 providing for 11,900,000 shares of authorized common stock, par value $0.01 per share and 100,000 shares of authorized preferred stock, par value $0.01. There were 9,050,000 shares of common stock outstanding as of June 30, 2014.
Private Placements
In connection with the Plan of Reorganization, we entered into the Investor SPAs with the Investors for the purchase and sale of 1,750,000,000 shares of our common stock (adjusted to 8,750,000 shares on October 2, 2013 as a result of a Reverse Stock Split) at a pre-Reverse Stock Split purchase price of $0.10 per share (implying a $20.00 per share price after giving effect to the Reverse Stock Split) and received gross proceeds of $175.0 million. In connection with the Private Placements, transaction costs of $14.4 million were incurred and have been recorded in the Statement of Changes in Stockholders’ Equity (Deficit).
TARP Exchange
On January 30, 2009, pursuant to the Treasury’s Capital Purchase Program, we issued and sold to the Treasury the TARP Preferred Stock and the TARP Warrant. Pursuant to the Plan of Reorganization, we, on the Effective Date and immediately following the consummation of the Private Placements, consummated the TARP Exchange.
Cancellation of Legacy Common Stock
On the Effective Date, immediately following the consummation of the TARP Exchange pursuant to the terms of the Plan of Reorganization, all 21,247,225 shares of issued and outstanding Legacy Common Stock, including shares held as treasury stock and in any stock incentive plans, were cancelled for no consideration. In connection with the cancellation of the Legacy Common Stock, the Rights Agreement, dated as of November 5, 2010, by and between the Company and American Stock Transfer & Trust Company, LLC was terminated on the Effective Date in accordance with its terms.
87
Table of Contents
Senior Debt Settlement
The aggregate amount of our obligations under the Credit Agreement was approximately $183.5 million as of August 12, 2013 (including with respect to unpaid principal balance, accrued but unpaid interest thereon and all administrative and other fees or penalties). On the Effective Date, pursuant to the Plan of Reorganization, we satisfied all of our obligations under the Credit Agreement by a cash payment to the Lenders of $49.0 million (plus expense reimbursement as contemplated by the Credit Agreement). As a result of the transaction, we recognized a gain on extinguishment of debt of $134.5 million.
All Other Claims Unaffected
All other claims were unaffected by, and were paid in full under, the Plan of Reorganization.
Post-Effectiveness of the Plan of Reorganization
Following the effectiveness of the Plan of Reorganization, the Treasury consummated the Secondary Treasury Sales under securities purchase agreements, dated as of September 19, 2013, among the Treasury, the Secondary Investors and, with respect to certain provisions, us. In connection with the Secondary Treasury Sales, we entered into the Secondary SPAs pursuant to which we made certain representations and warranties to the Secondary Investors and provided rights to the Secondary Investors similar to the rights provided to 4.9% Investors under the Investor SPAs. In connection with the Secondary Treasury Sales, the Treasury received gross proceeds of $6.0 million and ceased to be our stockholder.
Emergence Accounting
Upon emergence, we determined we did not meet the requirements to apply fresh start reporting under applicable accounting standards because we did not meet the solvency criteria of ASC 852-10-45-19. The reorganization value immediately before the date of confirmation was greater than the total of all post-petition liabilities and allowed claims and, therefore, indicative of not meeting the test to require fresh start accounting under ASC 852. As of the date of confirmation, we estimated our enterprise value (or reorganization value) to be approximately $2.2 billion. The Company utilized the equity value using the income and market approach to approximate fair value. Accordingly, the consolidated financial statements do not include fresh start reporting, whereby the Company would have to revalue all of its assets and liabilities. At the time of filing for the Chapter 11 Case, we identified liabilities subject to compromise of $188.3 million, which included the outstanding principal balance under the Credit Agreement of approximately $116.3 million, interest and fees due under the Credit Agreement of $67.2 million and $4.8 million in other liabilities. On August 30, 2013, the Bankruptcy Court confirmed the Plan of Reorganization and the Company emerged from bankruptcy and consummated the Plan of Reorganization.
Termination of C&D Orders and the PCA Directive
On April 2, 2014, the OCC notified the Bank that the Bank Order and the PCA Directive were terminated. On July 31, 2014, the Federal Reserve notified the Company that the Company Order was terminated.
Lending Activities
General. At June 30, 2014, our net loans held for investment totaled $1.51 billion, representing approximately 71.0% of our $2.12 billion of total assets at that date. Loans held for investment based on portfolio segment consist of single-family residential loans with an unpaid principal balance of $533.3 million, multi-family residential loans of $266.4 million, commercial real estate loans of $298.3 million, land and construction loans of $106.0 million, C&I loans of $16.0 million, and consumer loans of $349.9 million.
We originate residential loans secured by properties located primarily in Wisconsin, with adjustable-rate loans generally being originated for inclusion in our loan portfolio and fixed-rate loans generally being originated for sale into the secondary market. We also originate loans for commercial, corporate and business purposes, including issuing letters of credit, and commercial real estate loans, which include land and construction, multi-family, retail/office and other commercial real estate. Further, we offer consumer loans in order to provide a wider range of financial services to our customers.
88
Table of Contents
Loan Portfolio Composition. The following table presents the composition of loans held for investment at the dates indicated. During the fiscal year ended March 31, 2011, we began disaggregating our loans by portfolio segment, the level at which we have developed and documented its systematic method for determining our ALLL, and class of financing receivable, which is a disaggregation of portfolio segment in accordance with current accounting standards. For comparative purposes, the following table presents the loan portfolio according to the current classifications except for March 31, 2010.
| June 30, 2014 |
December 31, 2013 |
March 31, | ||||||||||||||||||||||||||||||||||||||||||||||
| 2013 | 2012 | 2011 | 2010 | |||||||||||||||||||||||||||||||||||||||||||||
| Amount | Percent of Total |
Amount | Percent of Total |
Amount | Percent of Total |
Amount | Percent of Total |
Amount | Percent of Total |
Amount | Percent of Total |
|||||||||||||||||||||||||||||||||||||
| (Dollars in thousands) |
||||||||||||||||||||||||||||||||||||||||||||||||
| Single-family residential |
$ | 533,330 | 34.0 | % | $ | 529,777 | 32.7 | % | $ | 547,720 | 31.1 | % | $ | 564,427 | 25.8 | % | $ | 648,514 | 24.2 | % | $ | 765,312 | 22.3 | % | ||||||||||||||||||||||||
| Multi-family residential |
266,394 | 17.0 | 281,917 | 17.4 | 287,447 | 16.3 | 342,216 | 15.6 | 423,587 | 15.8 | 614,930 | 17.9 | ||||||||||||||||||||||||||||||||||||
| Commercial real estate |
298,253 | 19.0 | 328,388 | 20.2 | 371,543 | 21.1 | 546,552 | 25.0 | 696,127 | 25.9 | 842,905 | 24.5 | ||||||||||||||||||||||||||||||||||||
| Land and construction |
105,989 | 6.7 | 92,050 | 5.7 | 111,953 | 6.3 | 186,048 | 8.5 | 251,043 | 9.4 | 339,816 | 9.9 | ||||||||||||||||||||||||||||||||||||
|
|
|
|
|
|
|
|
|
|
|
|
|
|
|
|
|
|
|
|
|
|
|
|
|
|||||||||||||||||||||||||
| Total mortgage loans |
1,203,966 | 76.7 | 1,232,132 | 76.0 | 1,318,663 | 74.8 | 1,639,243 | 74.9 | 2,019,271 | 75.3 | 2,562,963 | 74.6 | ||||||||||||||||||||||||||||||||||||
| Residential—other |
220,639 | 14.1 | 226,225 | 14.0 | 234,380 | 13.3 | 253,763 | 11.6 | 268,786 | 10.0 | 352,795 | 10.3 | ||||||||||||||||||||||||||||||||||||
| Education |
118,300 | 7.5 | 129,520 | 8.0 | 166,429 | 9.4 | 240,331 | 11.0 | 276,735 | 10.3 | 331,475 | 9.6 | ||||||||||||||||||||||||||||||||||||
| Other |
10,986 | 0.7 | 12,086 | 0.7 | 13,150 | 0.8 | 15,769 | 0.7 | 18,365 | 0.7 | 24,990 | 0.7 | ||||||||||||||||||||||||||||||||||||
|
|
|
|
|
|
|
|
|
|
|
|
|
|
|
|
|
|
|
|
|
|
|
|
|
|||||||||||||||||||||||||
| Total consumer loans |
349,925 | 22.3 | 367,831 | 22.7 | 413,959 | 23.5 | 509,863 | 23.3 | 563,886 | 21.0 | 709,260 | 20.6 | ||||||||||||||||||||||||||||||||||||
| Commercial and industrial loans |
16,002 | 1.0 | 21,591 | 1.3 | 30,574 | 1.7 | 38,977 | 1.8 | 99,689 | 3.7 | 164,329 | 4.8 | ||||||||||||||||||||||||||||||||||||
|
|
|
|
|
|
|
|
|
|
|
|
|
|
|
|
|
|
|
|
|
|
|
|
|
|||||||||||||||||||||||||
| Total commercial business loans |
16,002 | 1.0 | 21,591 | 1.3 | 30,574 | 1.7 | 38,977 | 1.8 | 99,689 | 3.7 | 164,329 | 4.8 | ||||||||||||||||||||||||||||||||||||
|
|
|
|
|
|
|
|
|
|
|
|
|
|
|
|
|
|
|
|
|
|
|
|
|
|||||||||||||||||||||||||
| Total loans receivable |
1,569,893 | 100.0 | % | 1,621,554 | 100.0 | % | 1,763,196 | 100.0 | % | 2,188,083 | 100.0 | % | 2,682,846 | 100.0 | % | 3,436,552 | 100.0 | % | ||||||||||||||||||||||||||||||
|
|
|
|
|
|
|
|
|
|
|
|
|
|
|
|
|
|
|
|
|
|
|
|
|
|||||||||||||||||||||||||
| Contras to loans: |
||||||||||||||||||||||||||||||||||||||||||||||||
| Allowance for loan losses |
(49,175 | ) | (65,182 | ) | (79,815 | ) | (111,215 | ) | (150,122 | ) | (179,644 | ) | ||||||||||||||||||||||||||||||||||||
| Undisbursed loan proceeds |
(12,182 | ) | (10,322 | ) | (10,997 | ) | (16,034 | ) | (8,761 | ) | (23,334 | ) | ||||||||||||||||||||||||||||||||||||
| Unearned net loan fees |
(1,568 | ) | (1,722 | ) | (1,838 | ) | (3,086 | ) | (3,476 | ) | (3,898 | ) | ||||||||||||||||||||||||||||||||||||
| Unearned interest |
(5 | ) | (4 | ) | (3 | ) | (4 | ) | (115 | ) | (88 | ) | ||||||||||||||||||||||||||||||||||||
| Net discount on purchased loans |
— | — | — | — | (5 | ) | (8 | ) | ||||||||||||||||||||||||||||||||||||||||
|
|
|
|
|
|
|
|
|
|
|
|
|
|||||||||||||||||||||||||||||||||||||
| Total contras to loans |
(62,930 | ) | (77,230 | ) | (92,653 | ) | (130,339 | ) | (162,479 | ) | (206,972 | ) | ||||||||||||||||||||||||||||||||||||
|
|
|
|
|
|
|
|
|
|
|
|
|
|||||||||||||||||||||||||||||||||||||
| Loans receivable, net |
$ | 1,506,963 | $ | 1,544,324 | $ | 1,670,543 | $ | 2,057,744 | $ | 2,520,367 | $ | 3,229,580 | ||||||||||||||||||||||||||||||||||||
|
|
|
|
|
|
|
|
|
|
|
|
|
|||||||||||||||||||||||||||||||||||||
89
Table of Contents
The following table presents, at June 30, 2014, the scheduled contractual maturities of gross loans held for investment, as well as the dollar amount of such loans which are scheduled to mature after one year which have fixed or adjustable interest rates disaggregated according to current classifications.
| Residential | Commercial and Industrial |
Commercial Real Estate |
Consumer | Total | ||||||||||||||||
| (In Thousands) | ||||||||||||||||||||
| Amounts due: |
||||||||||||||||||||
| In one year or less |
$ | 3,443 | $ | 9,397 | $ | 170,810 | $ | 21,301 | $ | 204,951 | ||||||||||
| After one year through five years |
15,520 | 6,504 | 285,035 | 116,593 | 423,652 | |||||||||||||||
| After five years |
514,367 | 101 | 214,791 | 212,031 | 941,290 | |||||||||||||||
|
|
|
|
|
|
|
|
|
|
|
|||||||||||
| $ | 533,330 | $ | 16,002 | $ | 670,636 | $ | 349,925 | $ | 1,569,893 | |||||||||||
|
|
|
|
|
|
|
|
|
|
|
|||||||||||
| Interest rate terms on amounts due after one year: |
||||||||||||||||||||
| Fixed |
$ | 213,122 | $ | 6,600 | $ | 316,292 | $ | 216,075 | $ | 752,089 | ||||||||||
| Adjustable |
316,765 | 5 | 183,534 | 112,549 | 612,853 | |||||||||||||||
Residential Loans
At June 30, 2014, $533.3 million, or 34.0%, of the total loans unpaid principal balance receivable consisted of residential loans, substantially all of which were 1-to-4 family dwellings. Residential loans consist of both adjustable and fixed-rate loans. The adjustable-rate loans currently in the portfolio were originated with up to 30-year maturities and terms which provide for annual increases or decreases of the rate on the loans, based on a designated index. These rate changes are generally subject to a limit of 2% per adjustment and an aggregate 6% adjustment over the life of the loan. These loans are documented according to standard industry practices. We make a limited number of interest-only loans which tend to have a shorter term to maturity and do not originate negative amortization and option payment adjustable rate mortgages.
Adjustable-rate loans decrease the risks associated with changes in interest rates but involve other risks, primarily because as interest rates rise, the payment by the borrower rises to the extent permitted by the terms of the loan, thereby increasing the potential for default. At the same time, the marketability of the underlying property may be adversely affected by higher interest rates. We believe that these risks, which have not had a material adverse effect to date, generally are less than the risks associated with holding fixed-rate loans in an increasing interest rate environment. Also, as interest rates decline, borrowers may refinance their mortgages into fixed-rate loans thereby prepaying the balance of the loan prior to maturity. At June 30, 2014, approximately $316.8 million, or 59.4%, of the held for investment residential loans unpaid principal balance consisted of loans with adjustable interest rates.
We continue to originate long-term, fixed-rate conventional mortgage loans. Current production of these loans with terms of 15 years or more are generally sold to Fannie Mae, Freddie Mac and other institutional investors, while a portion of loan production is retained in the held for investment portfolio. In order to provide a full range of products to our customers, we also participate in the loan origination programs of Wisconsin Housing and Economic Development Authority, Wisconsin Department of Veterans Affairs and the Federal Housing Administration. We retain the right to service substantially all loans sold.
At June 30, 2014, approximately $216.5 million, or 40.6%, of the held for investment residential loans unpaid principal balance consisted of loans with fixed rates of interest. Although these loans generally provide for repayments of principal over a fixed period of 10 to 30 years, because of prepayments and due-on-sale clauses, such loans generally remain outstanding for a shorter period of time.
90
Table of Contents
Commercial and Industrial Loans
We originate loans for commercial and business purposes, including issuing letters of credit. At June 30, 2014, the unpaid principal balance receivable of commercial and industrial loans amounted to $16.0 million, or 1.0%, of the total loans unpaid principal balance receivable. The commercial and industrial loan portfolio is comprised of loans for a variety of business purposes which are generally secured by equipment, machinery and other corporate assets. These loans generally have terms of seven years or less and interest rates that float in accordance with a designated published index. Substantially all such loans are secured and backed by the personal guarantees of the owners of the business.
Commercial Real Estate Loans
We originate commercial real estate loans which include land and construction, multi-family, retail/office and other commercial real estate. Such loans generally have adjustable rates and shorter terms than single-family residential loans, thus increasing the earnings sensitivity of the loan portfolio to changes in interest rates, as well as providing higher fees and rates than residential loans. At June 30, 2014, $670.6 million of loans unpaid principal balance receivable were secured by commercial real estate, which represented 42.7% of the total loans unpaid principal balance. The origination of such loans is generally limited to our primary market area, concentrated in Wisconsin’s greater Madison, Fox Valley and Milwaukee regions. Loans are made in contiguous states when appropriate.
Commercial real estate loans are primarily secured by apartment buildings, office and industrial buildings, land, warehouses, small retail shopping centers and various special purpose properties, including community-based residential facilities and senior housing. Although terms vary, commercial real estate loans generally have fixed interest rates, amortization periods of 15 to 30 years, as well as balloon payments of two to seven years.
Consumer Loans
We offer consumer loans in order to provide a wider range of financial services to our customers. At June 30, 2014, $349.9 million, or 22.3%, of the total loans unpaid principal balance receivable consisted of consumer loans. Consumer loans consist of education loans, first and second mortgages, credit cards, vehicles and other unsecured personal loans. Consumer loans typically have higher interest rates than mortgage loans and generally involve more risk than mortgage loans because of the type and nature of the collateral and, in certain cases, the absence of collateral.
Approximately $118.3 million, or 7.5%, of the total loans unpaid principal balance receivable at June 30, 2014 consisted of education loans. These loans are generally made for a maximum of $3,500 per year for undergraduate studies and $8,500 per year for graduate studies and are placed in repayment status on an installment basis within nine months following graduation. Education loans generally have interest rates that adjust annually in accordance with a designated index. Both the principal amount of an education loan and interest thereon are generally guaranteed by the Great Lakes Higher Education Corporation up to 97% of the balance of the loan, which typically obtains reinsurance of its obligations from the U.S. Department of Education. We discontinued the origination of student loans beginning October 1, 2010 following the March 2010 law ending loan guarantees provided by the U.S. Department of Education. Although direct student loans, without a government guarantee, may be originated, risk-adjusted returns for these loans continue to be unattractive. Education loans may be sold to the U.S. Department of Education or to other investors. No education loans were sold during the six months ended June 30, 2014 or 2013.
The residential loans included in the consumer portfolio include both first and second mortgages and consist primarily of the Express loan product (the Bank’s expedited first mortgage refinance and home equity loan product). Express loans are available for owner occupied one- to two-family residential properties, with loan amounts up to $200,000, a fixed interest rate, up to 15 year amortization, low fees and rapid closing timeframes. The primary home equity loan product has an adjustable rate that is linked to the prime interest rate
91
Table of Contents
and is secured by a mortgage, either a primary or a junior lien, on the borrower’s residence. New home equity lines do not exceed 90% of appraised value of the property at the loan origination date. A fixed-rate home equity second mortgage term product is also offered.
Other consumer loans consist of credit cards, vehicle loans and other secured and unsecured loans made for a variety of consumer purposes. Credit is extended to Bank customers through credit cards issued by a third party, ELAN Financial Services (ELAN), pursuant to an agency arrangement under which we participate in outstanding balances, currently at 25% to 28%. We also share 33% to 37% of annual fees, and 30% of late payment, over limit and cash advance fees, as well as 25% to 30% of interchange income from the underlying portfolio net of our share of losses.
Net Fee Income From Lending Activities
Loan origination and commitment fees and certain direct loan origination costs are being deferred and the net amounts are amortized as an adjustment to the related loan’s yield.
We also receive other fees and charges relating to existing residential and commercial loans, which include prepayment penalties, late charges and fees collected in connection with a change in borrower or other loan modifications. Other types of loans also generate fee income. These include annual fees assessed on credit card accounts, transactional fees relating to credit card usage and late charges on consumer loans.
Origination, Purchase and Sale of Loans
Our new loan production comes from a number of sources. Residential mortgage loan production is originated primarily from depositors, branch customers, our website, non-compensated referrals from real estate brokers, builders and direct solicitations. Commercial real estate and C&I loan production is obtained by direct solicitations and referrals. Consumer loans are originated from branch customers, existing depositors and mortgagors, and direct solicitation.
Applications for all types of loans are taken at certain branch locations and one loan origination facility. Loans may be approved by designated underwriting/concurrence officers or our senior loan committee, within pre-established limits, or by the Board.
Loan approvals are determined, on the basis of the total loan exposure to a particular borrower or principal, with an in-house lending guideline of $20.0 million and a regulatory lending limit of $39.3 million. Loans that, if approved, would increase total credit exposure to less than $1.5 million with respect to a borrower or principal can be approved by a designated underwriting/concurrence officer. Loans that, if approved, would increase total credit exposure from $1.5 million to $4.0 million with respect to a borrower or principal must be approved by the Senior Loan Committee. Loans that, if approved, would increase total exposure in excess of $4.0 million with respect to a borrower or principal must be submitted for the approval of the board of directors of the Bank. This is determined by total exposure, risk rate and whether the loan is new business or a renewal. We regularly review our loan approval policies and these policies remain subject to amendment at the discretion of the Board.
Our general policy is to lend up to the lesser of 80% of the appraised value or purchase price of the property, whichever is less, securing a single-family residential loan (referred to as the loan-to-value ratio). We will lend more than 80% of the appraised value of the property, but will require that the borrower obtain, when possible, private mortgage insurance in an amount intended to reduce exposure to 80% or less of the appraised value of the underlying property. At June 30, 2014, approximately $96.2 million, or 6.2% of loans had original loan-to-value ratios of greater than 80% and did not have private mortgage insurance for the portion of the loans above such amount.
Property appraisals on the real estate and improvements securing single-family residential loans are made by our staff or by independent appraisers, approved by the Bank’s board of directors, during the underwriting process. Appraisals are performed in accordance with federal regulations and policies.
92
Table of Contents
Our underwriting criteria generally require that multi-family residential and commercial real estate loans have loan-to-value ratios of 80% or less and debt coverage ratios of at least 115% or 120%, depending on the asset class. Personal guarantees are also obtained on multi-family residential and commercial real estate loans from the principals of the borrowing entity, as well as appraisals of the collateral from independent appraisal firms in the case of multi-family residential and commercial real estate loans.
The portfolio of commercial real estate and C&I loans is reviewed on a continuing basis to identify any potential risks that exist in regard to the property management, financial criteria of the loan, operating performance, competitive marketplace and collateral valuation. The relationship manager is responsible for identifying and reporting credit risk quantified through a loan rating system and making recommendations to mitigate credit risk in the portfolio. The risk management function provides an independent review of this activity. These and other underwriting standards are documented in written policy statements, which are periodically updated and approved by the Bank’s board of directors.
We encounter certain environmental risks in our lending activities. Under federal and state environmental laws, lenders may become liable for costs of cleaning up hazardous materials found on secured properties. Certain states may also impose liens with higher priorities than first mortgages on properties to recover funds used in such cleanup efforts. Although the foregoing environmental risks are more often associated with industrial and commercial loans, environmental risks may be substantial for residential lenders, since environmental contamination may render the secured property unsuitable for residential use. In addition, the value of residential properties may become substantially diminished by contamination of nearby properties. In accordance with the guidelines of Fannie Mae and Freddie Mac, appraisals for single-family homes include comments on environmental influences and conditions. We attempt to control our exposure to environmental risks with respect to loans secured by larger properties by monitoring available information on hazardous waste disposal sites and requiring environmental inspections of such properties prior to closing the loan. No assurance can be given, however, that the value of properties securing loans will not be adversely affected by the presence of hazardous materials or that future changes in federal or state laws will not increase our exposure to liability for environmental cleanup.
We have been actively involved in the mortgage secondary market since the mid-1980s and generally originate single-family residential mortgage loans under terms, conditions and documentation which permit sale to investors. A significant portion of the fixed-rate, single-family residential loans with terms over 15 years originated are sold to investors. The volume of loans originated is dependent on a number of factors, but is most influenced by general interest rates. In periods of lower interest rates, demand for fixed-rate mortgages increases. In periods of higher interest rates, customer demand for fixed-rate mortgages declines. We attempt to limit any interest rate risk created by interest rate lock commitments by limiting the number of days between the commitment and closing, charging fees for commitments, and limiting the amounts of un-hedged commitments at any one time. Forward sale contracts used to economically hedge closed loans and rate lock commitments to customers range from 70% to 100% of the closed and committed amounts.
The following table presents the activity in loans held for sale:
| Six Months Ended June 30, |
Nine Months Ended December 31, |
Fiscal Year Ended March 31, |
||||||||||||||||||||||
| 2014 | 2013 | 2013 | 2012 | 2013 | 2012 | |||||||||||||||||||
| (In thousands) | ||||||||||||||||||||||||
| Beginning balance |
$ | 3,085 | $ | 31,483 | $ | 18,058 | $ | 39,332 | $ | 39,332 | $ | 7,538 | ||||||||||||
| Originations |
57,931 | 295,227 | 228,748 | 752,829 | 898,960 | 961,947 | ||||||||||||||||||
| Sales |
(55,755 | ) | (307,005 | ) | (243,721 | ) | (760,678 | ) | (920,234 | ) | (930,153 | ) | ||||||||||||
|
|
|
|
|
|
|
|
|
|
|
|
|
|||||||||||||
| Ending balance |
$ | 5,261 | $ | 19,705 | $ | 3,085 | $ | 31,483 | $ | 18,058 | $ | 39,332 | ||||||||||||
|
|
|
|
|
|
|
|
|
|
|
|
|
|||||||||||||
93
Table of Contents
We generally service all originated loans that have been sold to investors. This includes the collection of payments, the inspection of the secured property, and the disbursement of certain insurance and tax escrows on behalf of borrowers. Servicing fees are recognized when the related loan payments are received. At June 30, 2014, $2.59 billion of loans are serviced for others.
At June 30, 2014, approximately $118.3 million of education loans, $5.3 million of purchased participation mortgage loans and $6.4 million of credit card loans were being serviced for us by others. Servicing of purchased loans or loan participations is performed by the seller, with a portion of the interest paid by the borrower retained by the seller to cover servicing costs. We are not an active purchaser of loans.
Delinquency Procedures
Delinquent and problem loans are a normal part of any lending business. When a borrower fails to make a required payment by the 15th day after which the payment is due, internal collection procedures are instituted. The borrower is contacted to determine the reason for non-payment and attempts are made to cure the delinquency. Loan status, the condition of the property, and circumstances of the borrower are regularly reviewed. Based upon the results of its review, we may negotiate and accept a repayment program with the borrower, accept a voluntary deed in lieu of foreclosure, agree to the terms of a short sale or initiate foreclosure proceedings.
A decision as to whether and when to initiate foreclosure proceedings is based upon such factors as the amount of the outstanding loan in relation to the original indebtedness, the extent of delinquency, the value of the collateral, and the borrower’s financial ability and willingness to cooperate in curing the deficiencies. If foreclosed on, the property is sold at a public sale and we will generally bid an amount reasonably equivalent to the fair value of the foreclosed property or the amount of judgment due.
Real estate acquired by foreclosure or by deed in lieu of foreclosure as well as other repossessed assets (OREO) are held for sale and are initially recorded at fair value less a discount for estimated selling costs at the date of foreclosure. Any write down to fair value less estimated selling costs is charged to the ALLL. If the discounted fair value exceeds the net carrying value of the loans, recoveries to the ALLL are recorded to the extent of previous charge-offs, with any excess, which is infrequent, recognized as a gain in non-interest income. Subsequent to foreclosure, valuations are periodically performed and a valuation allowance is established if the carrying value exceeds the fair value less estimated selling costs. Costs relating to the development and improvement of the property may be capitalized, generally those greater than $10,000; holding period costs and subsequent changes to the valuation allowance are charged to OREO expense, net included in non-interest expense. Incremental valuation adjustments may be recognized in the Statement of Operations if, in the opinion of management, additional losses are deemed probable.
Investment Securities
In addition to lending activities, we conduct other investing activities on an ongoing basis in order to diversify assets, limit interest rate and credit risk, and meet regulatory liquidity requirements. We invest in mortgage-related securities which are insured or guaranteed by Freddie Mac, Fannie Mae and Ginnie Mae; non-agency collateralized mortgage obligations (“CMOs”), and U.S. government agency obligations. Investment decisions are made by authorized officers in accordance with policies established by the Board.
Management determines the appropriate financial reporting classification of securities at the time of purchase. Debt securities may be classified as held to maturity when we have the intent and ability to hold the securities to maturity. Held to maturity securities are carried at amortized cost. Securities are classified as trading when we intend to actively buy and sell securities in order to make a profit. Trading securities are carried at fair value, with unrealized holding gains and losses included in earnings. There were no securities designated as trading during the six months ended June 30, 2014 and 2013, the nine months ended December 31, 2013 or the fiscal years ended March 31, 2013 and 2012. No held to maturity securities were owned at June 30, 2014, December 31, 2013 or March 31, 2013.
94
Table of Contents
Securities not classified as held to maturity or trading are classified as available for sale. Available for sale securities are carried at fair value, with the unrealized gains and losses, net of tax (if any), reported as a separate component of stockholders’ equity (deficit). For the six months ended June 30, 2014 and the nine months ended December 31, 2013, this component of stockholders’ equity increased $4.8 million and decreased $10.2 million, respectively, to reflect net unrealized gains and losses on holding securities classified as available for sale.
Our policy does not permit investment in non-investment grade bonds. Permissible investments under OCC regulations include U.S. government obligations, municipal bonds, securities of various federal agencies, certain certificates of deposit of insured banks and savings institutions, certain bankers’ acceptances, repurchase agreements and federal funds. Although we do not purchase non-investment grade securities, as of June 30, 2014, we owned $5.8 million, or 2.0%, of the total investment securities portfolio, of non-investment grade securities as a result of ratings downgrades subsequent to purchase.
Agency-backed securities increase the quality of our assets by virtue of the insurance or guarantees of federal agencies that back them, require less capital under risk-based regulatory capital requirements than non-insured or guaranteed mortgage loans, are more liquid than individual mortgage loans and may be used to collateralize borrowings or other obligations of the Company. At June 30, 2014, securities with a fair value of $289.4 million held by us either had a credit rating of AAA or are guaranteed by government sponsored agencies. At June 30, 2014, $143.2 million of our securities available for sale were pledged to secure various obligations of the Company.
The table below sets forth information regarding the amortized cost and fair values of our investment securities at the dates indicated.
| March 31, | ||||||||||||||||||||||||||||||||
| June 30, 2014 | December 31, 2013 | 2013 | 2012 | |||||||||||||||||||||||||||||
| Amortized Cost |
Fair Value |
Amortized Cost |
Fair Value |
Amortized Cost |
Fair Value |
Amortized Cost |
Fair Value |
|||||||||||||||||||||||||
| (In thousands) | ||||||||||||||||||||||||||||||||
| Available for sale: |
||||||||||||||||||||||||||||||||
| U.S. government sponsored and federal agency obligations |
$ | 3,303 | $ | 3,328 | $ | 3,359 | $ | 3,376 | $ | 3,444 | $ | 3,504 | $ | 3,556 | $ | 3,531 | ||||||||||||||||
| Corporate stock and bonds |
1 | 6 | 88 | 355 | 152 | 264 | 652 | 661 | ||||||||||||||||||||||||
| Non-agency CMOs(1) |
5,968 | 5,856 | 6,452 | 6,208 | 7,885 | 7,549 | 25,067 | 21,592 | ||||||||||||||||||||||||
| Government sponsored agency mortgage-backed securities(1) |
83,879 | 84,131 | 50,721 | 50,158 | 2,975 | 3,184 | 3,944 | 4,195 | ||||||||||||||||||||||||
| GNMA mortgage-backed securities |
203,989 | 201,969 | 223,874 | 217,775 | 248,752 | 252,286 | 208,948 | 212,320 | ||||||||||||||||||||||||
|
|
|
|
|
|
|
|
|
|
|
|
|
|
|
|
|
|||||||||||||||||
| $ | 297,140 | $ | 295,290 | $ | 284,494 | $ | 277,872 | $ | 263,208 | $ | 266,787 | $ | 242,167 | $ | 242,299 | |||||||||||||||||
| Held-to-maturity: |
||||||||||||||||||||||||||||||||
| Government sponsored agency mortgage-backed securities(1) |
— | — | — | — | — | — | 20 | 20 | ||||||||||||||||||||||||
|
|
|
|
|
|
|
|
|
|
|
|
|
|
|
|
|
|||||||||||||||||
| $ | — | $ | — | $ | — | $ | — | $ | — | $ | — | $ | 20 | $ | 20 | |||||||||||||||||
|
|
|
|
|
|
|
|
|
|
|
|
|
|
|
|
|
|||||||||||||||||
| Total investment securities |
$ | 297,140 | $ | 295,290 | $ | 284,494 | $ | 277,872 | $ | 263,208 | $ | 266,787 | $ | 242,187 | $ | 242,319 | ||||||||||||||||
|
|
|
|
|
|
|
|
|
|
|
|
|
|
|
|
|
|||||||||||||||||
| (1) | CMOs (collateralized mortgage obligations), GSAs (government sponsored agencies) and GNMA (Ginnie Mae) mortgage-backed securities are primarily collateralized by residential mortgages. |
Our mortgage-backed securities are made up of Government National Mortgage Association (“GNMA”), government sponsored agency mortgage-backed securities, and non-agency mortgage-backed securities. At June 30, 2014, we had no held to maturity securities. The fair value of the mortgage-backed securities available for sale amounted to $292.0 million at June 30, 2014.
95
Table of Contents
The following tables set forth the maturity and weighted average yield characteristics of investment securities at June 30, 2014, classified by term to maturity and reported at fair value.
| One to Five Years | Five to Ten Years | Over Ten Years | ||||||||||||||||||||||||||
| Balance | Weighted Average Yield |
Balance | Weighted Average Yield |
Balance | Weighted Average Yield |
Total | ||||||||||||||||||||||
| (Dollars in thousands) | ||||||||||||||||||||||||||||
| Available for sale: |
||||||||||||||||||||||||||||
| U.S. government sponsored and federal agency obligations |
$ | 3,328 | 1.08 | % | $ | — | — | % | $ | — | — | % | $ | 3,328 | ||||||||||||||
| Corporate stock and other |
— | — | — | — | 6 | — | 6 | |||||||||||||||||||||
| Non-agency CMOs |
— | — | 2 | 7.94 | 5,854 | 5.45 | 5,856 | |||||||||||||||||||||
| Government sponsored agency mortgage-backed securities |
164 | 4.69 | 13,263 | 1.67 | 70,704 | 2.18 | 84,131 | |||||||||||||||||||||
| GNMA mortgage-backed securities |
233 | 4.90 | — | — | 201,736 | 1.90 | 201,969 | |||||||||||||||||||||
|
|
|
|
|
|
|
|
|
|
|
|
|
|
|
|||||||||||||||
| Total investment securities |
$ | 3,725 | 1.46 | % | $ | 13,265 | 1.67 | % | $ | 278,300 | 2.05 | % | $ | 295,290 | ||||||||||||||
|
|
|
|
|
|
|
|
|
|
|
|
|
|
|
|||||||||||||||
At June 30, 2014, our balance of total investment securities with a maturity of less than one year was not material.
Due to prepayments of the underlying loans, the actual maturities of certain investment securities are expected to be substantially earlier than the scheduled maturities.
Sources of Funds
General. Deposits are a major source of our funds for lending and other investment activities. In addition to deposits, funds are derived from principal repayments and prepayments on loan and mortgage-related securities, maturities of investment securities, sales of loans and securities, interest payments on loans and securities, advances from the FHLB of Chicago and, from time to time, repurchase agreements and other borrowings. Loan repayments and interest payments are a relatively stable source of funds, while deposit inflows and outflows and loan prepayments are significantly influenced by the general level of interest rates, economic conditions, the stock market and competition. Borrowings may be used on a short-term basis to compensate for reductions in the availability of funds from other sources. Borrowings may also be used on a longer term basis for general business purposes, including providing financing for lending and other investment activities and asset/liability management strategies.
Deposits. Our deposit products include passbook and statement savings accounts, non-interest bearing checking, interest bearing checking accounts, money market deposit accounts and certificates of deposit ranging in terms of 42 days to five years. Included among these deposit products are individual retirement account certificates and Keogh retirement certificates, as well as negotiable-rate certificates of deposit with balances of $100,000 or more.
Deposits are obtained primarily from residents of Wisconsin. From time to time, prior to the effectiveness of the C&D Orders, we entered into agreements with certain brokers that provide funds for a specified fee. While brokered deposits are a good source of funds, they are interest rate driven and thus inherently have more liquidity and interest rate risk. At June 30, 2014, there were no brokered deposits included in the $1.87 billion of total deposits. At June 30, 2014, we were precluded from obtaining new or renewing existing brokered deposits pursuant to the C&D Orders, which have now been terminated. There were no out of network certificates of deposit at June 30, 2014. These deposits are opened via internet listing services and the balances are kept within FDIC insured limits.
96
Table of Contents
We attract deposits through a network of convenient office locations by utilizing a customer sales and service plan and by offering a wide variety of accounts and services, competitive interest rates and convenient customer hours. Deposit terms offered vary according to the minimum balance required, the time period the funds must remain on deposit and the interest rate, among other factors. In determining the characteristics of deposit accounts, consideration is given to the profitability and liquidity of the Company, matching terms of the deposits with loan products, the attractiveness to customers and the rates offered by competitors.
The following table sets forth the amount and maturities of certificates of deposit at June 30, 2014 and December 31, 2013.
| At June 30, 2014 |
Three Months and Less |
Over Three Months Through One Year |
Over One Year Through Two Years |
Over Two Years Through Three Years |
Over Three Years |
Total | ||||||||||||||||||
| Interest Rate |
||||||||||||||||||||||||
| (in thousands) | ||||||||||||||||||||||||
| 0.00% to 0.99% |
$ | 92,698 | $ | 209,591 | $ | 91,748 | $ | 5,744 | $ | 6,156 | $ | 405,937 | ||||||||||||
| 1.00% to 1.99% |
3,341 | 643 | 5,346 | 28,065 | 33,898 | 71,293 | ||||||||||||||||||
| 2.00% to 3.99% |
1,817 | 4,544 | 7,700 | 1,534 | — | 15,595 | ||||||||||||||||||
| 4.00% and above |
— | — | — | — | — | — | ||||||||||||||||||
|
|
|
|
|
|
|
|
|
|
|
|
|
|||||||||||||
| $ | 97,856 | $ | 214,778 | $ | 104,794 | $ | 35,343 | $ | 40,054 | $ | 492,825 | |||||||||||||
|
|
|
|
|
|
|
|
|
|
|
|
|
|||||||||||||
| At December 31, 2013 |
Three Months and Less |
Over Three Months Through One Year |
Over One Year Through Two Years |
Over Two Years Through Three Years |
Over Three Years |
Total | ||||||||||||||||||
| Interest Rate |
||||||||||||||||||||||||
| (in thousands) | ||||||||||||||||||||||||
| 0.00% to 0.99% |
$ | 132,706 | $ | 228,795 | $ | 81,164 | $ | 7,443 | $ | 7,299 | $ | 457,407 | ||||||||||||
| 1.00% to 1.99% |
965 | 5,155 | 3,183 | 16,664 | 41,795 | 67,762 | ||||||||||||||||||
| 2.00% to 3.99% |
4,486 | 6,408 | 3,473 | 9,059 | — | 23,426 | ||||||||||||||||||
| 4.00% and above |
2,374 | — | — | — | — | 2,374 | ||||||||||||||||||
|
|
|
|
|
|
|
|
|
|
|
|
|
|||||||||||||
| $ | 140,531 | $ | 240,358 | $ | 87,820 | $ | 33,166 | $ | 49,094 | $ | 550,969 | |||||||||||||
|
|
|
|
|
|
|
|
|
|
|
|
|
|||||||||||||
At June 30, 2014, $78.2 million of certificates of deposit were greater than or equal to $100,000, of which $18.3 million are scheduled to mature in less than three months, $11.8 million in three to six months, $19.5 million in six to twelve months and $28.7 million in over twelve months.
Borrowings. From time to time we obtain advances from the FHLB of Chicago, which generally are secured by capital stock of the FHLB of Chicago and certain mortgage loans and investment securities. Such advances are made pursuant to several different credit programs, each of which has its own interest rate and range of maturities. The FHLB of Chicago may prescribe the acceptable uses for these advances, as well as limitations on the size of the advances and repayment provisions.
At March 31, 2013, we had drawn $116.3 million under a short-term line of credit. We settled the obligation in full as part of the Recapitalization during the quarter ended September 30, 2013.
97
Table of Contents
The following tables set forth the outstanding balances and weighted average interest rates for borrowings at the dates indicated.
| June 30, 2014 |
December 31, 2013 |
March 31, | ||||||||||||||||||||||||||||||
| 2013 | 2012 | |||||||||||||||||||||||||||||||
| Amount | Weighted Average Rate |
Amount | Weighted Average Rate |
Amount | Weighted Average Rate |
Amount | Weighted Average Rate |
|||||||||||||||||||||||||
| FHLB of Chicago advances |
$ | 10,000 | 2.33 | % | $ | 10,000 | 2.33 | % | $ | 197,500 | 3.06 | % | $ | 357,500 | 2.49 | % | ||||||||||||||||
| Credit agreement |
— | — | — | — | 116,300 | 15.00 | 116,300 | 15.00 | ||||||||||||||||||||||||
| Repurchase agreements |
3,540 | 0.10 | 2,636 | 0.10 | 3,425 | 0.14 | 2,303 | 0.21 | ||||||||||||||||||||||||
| Long term lease obligation |
241 | 2.46 | 241 | 2.46 | — | — | — | — | ||||||||||||||||||||||||
|
|
|
|
|
|
|
|
|
|||||||||||||||||||||||||
| Total |
$ | 13,781 | 1.76 | % | $ | 12,877 | 1.88 | % | $ | 317,225 | 7.41 | % | $ | 476,103 | 5.53 | % | ||||||||||||||||
|
|
|
|
|
|
|
|
|
|||||||||||||||||||||||||
The following table sets forth information relating to short-term borrowings with original maturities of one year or less for the periods indicated.
| June 30, 2014 |
December 31, 2013 |
March 31, | ||||||||||||||||||||||||||||||
| 2013 | 2012 | |||||||||||||||||||||||||||||||
| Balance | Weighted Average Rate |
Balance | Weighted Average Rate |
Balance | Weighted Average Rate |
Balance | Weighted Average Rate |
|||||||||||||||||||||||||
| Balance at end of Period: |
||||||||||||||||||||||||||||||||
| FHLB advances |
$ | — | — | % | $ | — | — | % | $ | — | — | % | $ | 10,000 | 4.12 | % | ||||||||||||||||
| Credit agreement |
— | — | — | — | 116,300 | 15.00 | 116,300 | 15.00 | ||||||||||||||||||||||||
| Repurchase agreements |
3,540 | 0.10 | 2,636 | 0.10 | 3,425 | 0.14 | 2,303 | 0.21 | ||||||||||||||||||||||||
| Maximum month-end balance: |
||||||||||||||||||||||||||||||||
| FHLB advances |
$ | — | — | % | $ | — | — | % | $ | — | — | % | $ | 25,000 | 0.13 | % | ||||||||||||||||
| Credit agreement |
— | — | 116,300 | 15.00 | 116,300 | 15.00 | 116,300 | 15.00 | ||||||||||||||||||||||||
| Repurchase agreements |
3,540 | 0.10 | 4,949 | 0.12 | 3,786 | 0.21 | 4,721 | 0.59 | ||||||||||||||||||||||||
| Average month-end balance: |
||||||||||||||||||||||||||||||||
| FHLB advances |
— | — | % | 3,055 | 0.09 | % | — | — | % | 4,167 | 0.13 | % | ||||||||||||||||||||
| Credit agreement |
— | — | 75,701 | 9.30 | 116,300 | 15.00 | 116,300 | 15.00 | ||||||||||||||||||||||||
| Repurchase agreements |
3,131 | 0.10 | 5,122 | 0.09 | 2,914 | 0.14 | 3,683 | 0.40 | ||||||||||||||||||||||||
Subsidiaries
Investment Directions, Inc. IDI is a wholly owned, non-banking subsidiary of the Company that has invested in various limited partnerships and subsidiaries funded by borrowings from us. The assets at IDI totaling $560,000 at June 30, 2014 and $369,000 at December 31, 2013 primarily included cash compared to $831,000 at March 31, 2013, which included cash, an equity interest in one commercial enterprise and one real estate development, along with various notes receivable, and an intercompany receivable which was settled during the quarter ended December 31, 2013.
At March 31, 2012, we had a loan of $4.2 million to IDI to fund various partnership and subsidiary investments which was paid off during the fiscal year ended March 31, 2013. The amount was eliminated in consolidation.
ADPC Corporation. ADPC is a wholly owned subsidiary of the Bank that holds certain of the Bank’s foreclosed properties. The Bank’s investment in ADPC at June 30, 2014 and December 31, 2013 amounted to $4.1 million. ADPC had no net income or loss for the six months ended June 30, 2014, net income of $331,000 for the nine months ended December 31, 2013, a net loss of $153,000 for the fiscal year ended March 31, 2013 and net income of $758,000 for the fiscal year ended March 31, 2012.
98
Table of Contents
Anchor Investment Corporation. AIC was an operating subsidiary of the Bank incorporated in the State of Nevada and formed for the purpose of managing a portion of the Bank’s investment portfolio (primarily mortgage-backed securities). During the fiscal year ended March 31, 2012, AIC was dissolved and the remaining assets were transferred to the Bank. As an operating subsidiary, AIC’s results of operations were combined with the Bank’s for financial and regulatory purposes. At June 30, 2014, December 31, 2013, March 31, 2013 and March 31, 2012, the Bank had no remaining investment in AIC. AIC had no net income for the six months ended June 30, 2014 and 2013, nine months ended December 31, 2013 or fiscal year ended March 31, 2013, and $3.3 million for the fiscal year ended March 31, 2012.
Regulation and Supervision
The U.S. banking industry is highly regulated under federal and state law. These regulations affect the operations of the Company and its subsidiaries. Statutes, regulations and policies limit the activities in which we may engage and the conduct of our permitted activities. Further, the regulatory system imposes reporting and information collection obligations. We incur significant costs relating to compliance with these laws and regulations. Banking statutes, regulations and policies are continually under review by federal and state legislatures and regulatory agencies, and a change in them, including changes in how they are interpreted or implemented, could have a material adverse effect on our business.
The material statutory and regulatory requirements that are applicable to us are summarized below. The description below is not intended to summarize all laws and regulations applicable to us.
The Bank as a Federal Savings Association
The Bank is a federal savings association organized under the federal Home Owners’ Loan Act (“HOLA”). A federal savings association is commonly referred to as a federal thrift. As a federal thrift, the Bank is currently subject to ongoing and comprehensive supervision, regulation, examination and enforcement by the OCC. The OCC regulates all areas of banking operations, including investments, reserves, lending, mergers, payment of dividends, interest rates, transactions with affiliates (including the Company), establishment of branches and other aspects of the Bank’s operations. The Bank is subject to regular examinations by the OCC and is assessed amounts to cover the costs of such examinations.
The Company as a Savings and Loan Holding Company
Under Section 10 of the HOLA, any entity that holds or acquires direct or indirect control of a thrift must obtain prior approval of the Federal Reserve to become a savings and loan holding company (“SLHC”). The Company, which controls the Bank, is registered with the Federal Reserve as an SLHC, and is currently subject to ongoing and comprehensive Federal Reserve supervision, regulation, examination and enforcement. In addition, we must file quarterly and annual reports with the Federal Reserve describing the Company’s financial condition. This Federal Reserve jurisdiction also extends to any company that is directly or indirectly controlled by the Company.
FDIC Deposit Insurance
The FDIC is an independent federal agency that insures the deposits of federally insured depository institutions up to applicable limits. The FDIC also has certain regulatory, examination and enforcement powers with respect to FDIC-insured institutions. The deposits of the Bank are insured by the FDIC up to applicable limits. As a general matter, the maximum deposit insurance amount is $250,000 per depositor.
Broad Supervision, Examination and Enforcement Powers
A principal objective of the U.S. bank regulatory system is to protect depositors by ensuring the financial safety and soundness of banking organizations. To that end, the banking regulators have broad regulatory, examination and enforcement authority. The regulators regularly examine the operations of banking organizations. In
99
Table of Contents
addition, banking organizations are subject to periodic reporting requirements. The regulators have various remedies available if they determine that the financial condition, capital resources, asset quality, earnings prospects, management, liquidity or other aspects of a banking organization’s operations are unsatisfactory. The regulators may also take action if they determine that the banking organization or its management is violating or has violated any law or regulation. The regulators have the power to, among other things:
| • | enjoin “unsafe or unsound” practices; |
| • | require affirmative actions to correct any violation or practice; |
| • | issue administrative orders that can be judicially enforced; |
| • | direct increases in capital; |
| • | direct the sale of subsidiaries or other assets; |
| • | limit dividends and distributions; |
| • | restrict growth; |
| • | assess civil monetary penalties; |
| • | remove officers and directors; and |
| • | terminate deposit insurance. |
The FDIC may terminate a depository institution’s deposit insurance after notice and a hearing upon a finding that the institution’s financial condition is unsafe or unsound or that the institution has engaged in unsafe or unsound practices or has violated any applicable rule, regulation, order or condition enacted or imposed by the institution’s regulatory agency. Engaging in unsafe or unsound practices or failing to comply with applicable laws, regulations and supervisory agreements could subject the Company, and subsidiaries of the Company or their officers, directors and institution-affiliated parties to the remedies described above and other sanctions.
The Dodd-Frank Act
On July 21, 2010, the Dodd-Frank Act was signed into law. The Dodd-Frank Act is having a broad impact on the financial services industry, and imposes significant regulatory and compliance requirements, including the designation of certain financial companies as systemically important financial companies, the changing roles of credit rating agencies, the imposition of increased capital, leverage, and liquidity requirements, and numerous other provisions designed to improve supervision and oversight of, and strengthen safety and soundness within, the financial services sector. Additionally, the Dodd-Frank Act established a new framework of authority to conduct systemic risk oversight within the financial system to be distributed among new and existing federal regulatory agencies, including the Financial Stability Oversight Council, the Federal Reserve, the OCC, and the FDIC. The following items provide a brief description of certain provisions of the Dodd-Frank Act that are most relevant to the Company and the Bank.
Principal changes for federal thrifts and SLHCs. The Dodd-Frank Act preserved the charter for federal thrifts, but eliminated the OTS as the primary federal regulator for federal thrifts and SLHCs. Primary jurisdiction for the supervision and regulation of federal thrifts, including the Bank, was transferred to the OCC, while supervision and regulation of SLHCs, including the Company, was transferred to the Federal Reserve. Although the Dodd-Frank Act maintained the federal thrift charter, it eliminated certain benefits of the charter and imposed new penalties for failure to comply with the qualified thrift investment (“QTL”) test. Under the Dodd-Frank Act, the risk-based and leverage capital standards currently applicable to U.S. insured depository institutions will be imposed on U.S. bank holding companies and SLHCs, and depository institutions and their holding companies will be subject to minimum risk-based and leverage capital requirements on a consolidated basis. In addition, the Dodd-Frank Act requires that SLHCs be well capitalized and well managed in the same manner as bank holding companies in order to engage in the expanded financial activities permissible only for a financial holding company.
100
Table of Contents
Source of strength. The Dodd-Frank Act requires all companies, including SLHCs, that directly or indirectly control an insured depository institution to serve as a source of strength for the institution. Under this requirement, the Company in the future could be required to provide financial assistance to the Bank should it experience financial distress.
Limitation on federal preemption. The Dodd-Frank Act significantly reduces the ability of national banks and federal thrifts to rely upon federal preemption of state consumer financial laws. Although the OCC, as the primary regulator of federal thrifts, will have the ability to make preemption determinations where certain conditions are met, the broad rollback of federal preemption has the potential to create a patchwork of federal and state compliance obligations. This could, in turn, result in significant new regulatory requirements applicable to us, with potentially significant changes in our operations and increases in our compliance costs. It could also result in uncertainty concerning compliance, with attendant regulatory and litigation risks.
Mortgage loan origination and risk retention. The Dodd-Frank Act contains additional regulatory requirements that may affect our operations and result in increased compliance costs. For example, the Dodd-Frank Act imposes new standards for mortgage loan originations on all lenders, including banking organizations, in an effort to require steps to verify a borrower’s ability to repay. In addition, the Dodd-Frank Act generally requires lenders or securitizers to retain an economic interest in the credit risk relating to loans the lender sells or mortgage and other asset-backed securities that the securitizer issues. The risk retention requirement generally will be 5%, but could be increased or decreased by regulation. On January 10, 2013, federal regulators released the “qualified mortgage” rule. The qualified mortgage rule is intended to clarify the application of the Dodd-Frank Act requirement that mortgage lenders have a reasonable belief that borrowers can afford their mortgages, or the lender may not be able to foreclose on the mortgage.
On August 28, 2013, the OCC, the Federal Reserve, the FDIC, the SEC, the Federal Housing Finance Agency and the U.S. Department of Housing and Urban Development issued a revised proposed rule in connection with the risk retention requirement mandated by Section 941 of the Dodd-Frank Act. The risk retention requirement generally requires a securitizer to retain no less than 5% of the credit risk in assets it sells into a securitization and prohibits a securitizer from directly or indirectly hedging or otherwise transferring the credit risk that the securitizer is required to retain, subject to limited exemptions.
The proposed rule includes alternatives for structuring the economic interest required to be retained and the application of the rules to specific types of securitization transactions, as well as exemptions from the standard 5% risk retention requirement. One significant exemption is for securities entirely collateralized by “qualified residential mortgages” (“QRMs”), which are loans deemed to have a lower risk of default. The proposed rule defines QRMs to have the same meaning as the term “qualified mortgage,” as defined by the Consumer Financial Protection Bureau. In addition, the Proposed Rule provides for reduced risk retention requirements for qualifying commercial loan, commercial real estate loan and auto loan securitizations.
Imposition of restrictions on certain activities. The Dodd-Frank Act imposes a new regulatory structure on the over-the-counter derivatives market, including requirements for clearing, exchange trading, capital, margin, reporting, and record keeping. In addition, certain swaps and other derivatives activities are required to be “pushed out” of insured depository institutions and conducted in separately capitalized non-bank affiliates. The Dodd-Frank Act also requires certain persons to register as a “major security-based swap participant” or a “security-based swap dealer.” The U.S. Commodity Futures Trading Commission, the SEC and other U.S. regulators are in the process of adopting regulations to implement the Dodd-Frank Act. It is anticipated that this rulemaking process will further clarify, among other things, reporting and recordkeeping obligations, margin and capital requirements, the scope of registration requirements, and what swaps are required to be centrally cleared and exchange-traded. Rules will also be issued to enhance the oversight of clearing and trading entities. These restrictions may affect our ability to manage certain risks in our business.
101
Table of Contents
Expanded FDIC resolution authority. While insured depository institutions have long been subject to the FDIC’s resolution process, the Dodd-Frank Act creates a new mechanism for the FDIC to conduct the orderly liquidation of certain “covered financial companies,” including bank and thrift holding companies and systemically significant non-bank financial companies. Upon certain findings being made, the FDIC may be appointed receiver for a covered financial company, and would conduct an orderly liquidation of the entity. The FDIC liquidation process is modeled on the existing Federal Deposit Insurance Act (the “FDIA”) bank resolution process, and generally gives the FDIC more discretion than in the traditional bankruptcy context. The FDIC has issued final rules implementing the orderly liquidation authority.
Consumer Financial Protection Bureau. The Dodd-Frank Act created the Consumer Financial Protection Bureau (the “CFPB”). While technically located within the Federal Reserve, the CFPB is and functions as an independent agency. The CFPB is tasked with establishing and implementing rules and regulations under certain federal consumer protection laws with respect to the conduct of providers of certain consumer financial products and services. The CFPB has rulemaking authority over many of the statutes governing products and services offered to bank and thrift consumers. For banking organizations with assets of more than $10 billion, the CFPB has exclusive rule making and examination, and primary enforcement authority under federal consumer financial law. For depository institutions with $10 billion or less in assets, such as the Bank, examination and primary enforcement authority will remain largely with the institutions’ primary regulator. However, the CFPB may participate in examinations of these smaller institutions on a “sampling basis” and may refer potential enforcement actions against such institutions to their primary regulator. In addition, the Dodd-Frank Act permits states to adopt consumer protection laws and regulations that are stricter than those regulations promulgated by the CFPB. Compliance with any such new regulations would increase our cost of operations. On January 4, 2012, President Obama installed Richard Cordray as director of the CFPB through a recess appointment. On January 24, 2013, President Obama formally re-nominated Cordray to the same position, and Cordray was confirmed by the Senate on July 16, 2013.
Deposit insurance. The Dodd-Frank Act made permanent the general $250,000 deposit insurance limit for insured deposits. Amendments to the FDIA also revised the assessment base against which an insured depository institution’s deposit insurance premiums paid to the DIF of the FDIC will be calculated. Under the amendments, the assessment base is no longer the institution’s deposit base, but rather its average consolidated total assets less its average tangible equity. Additionally, the Dodd-Frank Act makes changes to the minimum designated reserve ratio of the DIF, increasing the minimum from 1.15% to 1.35% of the estimated amount of total insured deposits, and eliminating the requirement that the FDIC pay dividends to depository institutions when the reserve ratio exceeds certain thresholds. Several of these provisions may impact the FDIC deposit insurance premiums paid by the Bank.
Transactions with affiliates and insiders. The Dodd-Frank Act generally enhanced the restrictions on transactions with affiliates under Section 23A and 23B of the Federal Reserve Act, including an expansion of the definition of “covered transactions” and a clarification of the amount of time for which collateral requirements regarding covered credit transactions must be satisfied. Insider transaction limitations were expanded through the strengthening of loan restrictions to insiders and the expansion of the types of transactions subject to the various limits, including derivatives transactions, repurchase agreements, reverse repurchase agreements and securities lending or borrowing transactions. Restrictions were also placed on certain asset sales to and from an insider to an institution, including requirements that such sales be on market terms and, in certain circumstances, approved by the institution’s board of directors.
Enhanced lending limits. The Dodd-Frank Act strengthened the existing limits on a depository institution’s credit exposure to one borrower. Federal banking law currently limits a federal thrift’s ability to extend credit to one person (or group of related persons) in an amount exceeding certain thresholds. The Dodd-Frank Act expanded the scope of these restrictions to include, for example, credit exposure arising from derivative transactions, repurchase agreements, and securities lending and borrowing transactions.
102
Table of Contents
Corporate governance. The Dodd-Frank Act addresses many investor protection, corporate governance and executive compensation matters that will affect most U.S. publicly traded companies, including the Company. The Dodd-Frank Act (i) grants stockholders of U.S. publicly traded companies an advisory vote on executive compensation; (ii) enhances independence requirements for compensation committee members; (iii) requires companies listed on national securities exchanges to adopt incentive-based compensation clawback policies for executive officers; and (iv) provides the SEC with authority to adopt proxy access rules that would allow stockholders of publicly traded companies to nominate candidates for election as a director and have those nominees included in a company’s proxy materials.
Many of the requirements of the Dodd-Frank Act are in the process of being implemented and most will be subject to regulations implemented over the course of several years. Given the uncertainty associated with the manner in which the provisions of the Dodd-Frank Act will be implemented by the various regulatory agencies and through regulations, the full extent of the impact such requirements will have on our operations is unclear. The changes resulting from the Dodd-Frank Act may impact the profitability of our business activities, require changes to certain of our business practices, impose upon us more stringent capital, liquidity and leverage requirements or otherwise adversely affect our business. These changes may also require us to invest significant management attention and resources to evaluate and make any changes necessary to comply with new statutory and regulatory requirements.
Failure to comply with the new requirements may negatively impact our results of operations and financial condition.
Notice and Approval Requirements Related to Control
Banking laws impose notice, approval, and ongoing regulatory requirements on any stockholder or other party that seeks to acquire direct or indirect “control” of an FDIC-insured depository institution. These laws include the Bank Holding Company Act, the Change in Bank Control Act, and the Savings and Loan Holding Company Act and the rules and regulations enacted thereunder. Among other things, these laws require regulatory filings by a stockholder or other party that seeks to acquire direct or indirect “control” of an FDIC-insured depository institution. The determination whether an investor “controls” a depository institution is based on all of the facts and circumstances surrounding the investment. As a general matter, a party is deemed to control a depository institution or other company if the party owns or controls 25% or more of any class of voting stock. Subject to rebuttal, a party may be presumed to control a depository institution or other company if the investor owns or controls 10% or more of any class of voting stock and any of certain additional control factors exist. Ownership by affiliated parties, or parties acting in concert, is typically aggregated for these purposes. If a party’s ownership of the Company were to exceed certain thresholds, the investor could be deemed to “control” the Company for regulatory purposes. This could subject the investor to regulatory filings or other regulatory consequences.
In addition, except under limited circumstances, SLHCs are prohibited from acquiring, without prior approval:
| • | control of any other savings institution or SLHC or all or substantially all the assets thereof; or |
| • | more than 5% of the voting shares of a savings institution or SLHC which is not already a subsidiary. |
In evaluating an application by a holding company to acquire a savings association, the factors considered include the financial and managerial resources and future prospects of the holding company and savings association involved, the risk of the acquisition to the DIF, the convenience and needs of the community and the effect of the acquisition on competition.
Permissible Activities and Investments
A particular subset of SLHCs are generally permitted to engage in nonbanking and commercial activities without restriction. These SLHCs are known as “grandfathered unitary SLHCs.” A “grandfathered unitary SLHC” is an SLHC that owned a single savings association, or for which an application to acquire a single savings association was pending, on or before May 4, 1999. The Company currently qualifies as a grandfathered unitary SLHC and, as such, is generally permitted to engage in nonbanking and commercial activities without restriction.
103
Table of Contents
In order to be able to continue to rely on this status, a grandfathered unitary SLHC must continue to control the thrift that caused it to qualify (or a successor to that thrift), and the thrift must meet the QTL test. If the savings association subsidiary of a grandfathered unitary SLHC fails to meet the QTL test, then the holding company will become subject to restrictions on its activities and, unless the savings association re-qualifies as a QTL within one year thereafter, would be required to register as, and become subject to the restrictions applicable to, a bank holding company. Regulation as a bank holding company could be adverse to our operations and impose additional and possibly more burdensome regulatory requirements on the Company.
In addition, if the OCC determines that there is reasonable cause to believe that the continuation by a SLHC, including a grandfathered unitary SLHC, of an activity constitutes a serious risk to the financial safety, soundness or stability of its subsidiary savings association, the OCC may impose such restrictions as it deems necessary to address such risk, including limiting (i) payment of dividends by the savings association; (ii) transactions between the savings association and its affiliates; and (iii) any activities of the savings association that might create a serious risk that the liabilities of the holding company and its affiliates may be imposed on the savings association.
The Dodd-Frank Act did not eliminate the general authority for grandfathered unitary SLHCs to conduct activities without restriction. However, under section 626 of the Dodd-Frank Act, the Federal Reserve is authorized to require a grandfathered unitary thrift holding company to put its financial activities beneath an intermediate holding company. Separating commercial and financial activities within an SLHC’s legal structure is intended, among other things, to make supervision of the financial activities easier and to reduce the reporting and supervision burden applicable at the top tier of a commercial SLHC. The Federal Reserve is required to promulgate rules setting forth the criteria for when a grandfathered unitary SLHC would be required to establish an intermediate holding company, but to date it has not yet proposed any such rules.
Qualified Thrift Lender Test
Federal banking laws require a thrift to meet the QTL test by maintaining at least 65% of its “portfolio assets” in certain “qualified thrift investments,” such as residential housing related loans, certain consumer and small business loans and residential mortgage-backed securities, on a monthly average basis in at least nine months out of every twelve months. A thrift that fails the QTL test must either operate under certain restrictions on its activities or convert to a bank charter. The Dodd-Frank Act imposes additional restrictions on the ability of any thrift that fails to become or remain a QTL to pay dividends. Specifically, the thrift is not only subject to the general dividend restrictions as would apply to a national bank (as under prior law), but also is prohibited from paying dividends at all (regardless of its financial condition) unless required to meet the obligations of a company that controls the thrift, permissible for a national bank and specifically approved by the OCC and the Federal Reserve. In addition, violations of the QTL test now are treated as violations of federal banking laws subject to remedial enforcement action. At June 30, 2014, the amount of the Bank’s assets invested in qualified thrift investments exceeded the percentage required to qualify the Bank under the QTL test.
Regulatory Capital Requirements and Capital Adequacy
The federal banking regulators view capital levels as important indicators of an institution’s financial soundness. As a general matter, FDIC-insured depository institutions and their holding companies are required to maintain minimum capital relative to the amount and types of assets they hold. The final supervisory determination on an institution’s capital adequacy is based on the regulator’s assessment of numerous factors.
The OCC has established risk-based and leverage capital guidelines applicable to federal thrifts, including the Bank. As noted above, as a result of the Dodd-Frank Act, SLHCs, including the Company, will formally become subject to regulatory capital requirements. The SLHC capital requirements are discussed below in “—Basel III.”
104
Table of Contents
The current risk-based capital guidelines, commonly referred to as Basel I, are based upon the 1988 capital accord of the International Basel Committee on Banking Supervision (“Basel Committee”), a committee of central banks and bank supervisors, as implemented by the U.S. federal banking agencies. As discussed further below, the federal banking agencies have adopted separate risk-based capital guidelines for so-called “core banks” based upon the Revised Framework for the International Convergence of Capital Measurement and Capital Standards (“Basel II”) issued by the Basel Committee in November 2005, and recently adopted rules implementing the revised standards referred to as Basel III.
Basel I
OCC regulations implementing the Basel I standards currently require that federal thrifts maintain: (i) tier 1 capital in an amount not less than 4.0% (3.0% if the federal thrift is assigned the highest composite rating of 1 under the Uniform Financial Institutions Rating System) of adjusted total assets (the “leverage ratio”), (ii) tier 1 capital in an amount not less than 4.0% of risk-weighted assets and (iii) total risk-based capital in an amount not less than 8.0% of risk-weighted assets.
Tier 1 capital (core capital) includes common stockholders’ equity (including common stock, additional paid in capital and retained earnings, but excluding any net unrealized gains or losses, net of related taxes, on certain securities available for sale), noncumulative perpetual preferred stock and any related surplus and non-controlling interests in the equity accounts of fully consolidated subsidiaries. Intangible assets generally must be deducted from tier 1 capital, other than certain servicing assets and purchased credit card relationships, subject to limitations.
Total capital, for purposes of the risk-based capital requirement, equals the sum of tier 1 capital plus supplementary (tier 2) capital up to 100% of core capital (which generally includes the sum of, among other items, perpetual preferred stock not counted as tier 1 capital, limited life preferred stock, subordinated debt and general loan and lease loss allowances up to 1.25% of risk-weighted assets) less certain deductions.
Risk-weighted assets are determined by multiplying certain categories of assets, including off-balance sheet equivalents, by an assigned risk weight of 0% to 100% (or more) based on the degree of credit risk associated with those assets as specified in OCC regulations.
As of June 30, 2014, the Bank met the standard minimum regulatory capital requirements noted above, with tier 1 (core) capital, tier 1 risk-based capital and total risk-based capital ratios of 9.75%, 16.12% and 17.40%, respectively.
Basel II
Under the final U.S. Basel II rules issued by the federal banking agencies, there are a small number of “core” banking organizations that have been required to use the advanced approaches under Basel II for calculating risk-based capital related to credit risk and operational risk, instead of the methodology reflected in the regulations effective prior to adoption of Basel II. The rules also require core banking organizations to have rigorous processes for assessing overall capital adequacy in relation to their total risk profiles, and to publicly disclose certain information about their risk profiles and capital adequacy. The Company and the Bank are not among the core banking organizations required to use Basel II advanced approaches.
Basel III
On December 16, 2010, the Basel Committee released its final framework for strengthening international capital and liquidity regulation, known as Basel III. The Basel III calibration and phase-in arrangements were previously endorsed by the Seoul G20 Leaders Summit in November 2010. Under these standards, when fully phased-in on January 1, 2019, banking institutions would be required to satisfy three risk-based capital ratios:
| • | A new common equity tier 1 capital to risk-weighted assets ratio of at least 7.0%, inclusive of a 4.5% minimum common equity tier 1 capital ratio, net of regulatory deductions, and the new 2.5% “capital conservation buffer” of common equity to risk-weighted assets; |
105
Table of Contents
| • | A tier 1 capital ratio of at least 8.5%, inclusive of the 2.5% capital conservation buffer; and |
| • | A total capital ratio of at least 10.5%, inclusive of the 2.5% capital conservation buffer. |
The capital conservation buffer is designed to absorb losses during periods of economic stress. Banking institutions with a common equity tier 1 ratio above the minimum but below the conservation buffer may face constraints on dividends, equity repurchases, and compensation based on the amount of such shortfall. The Basel Committee also announced that a “countercyclical buffer” of 0% to 2.5% of common equity or other loss-absorbing capital “will be implemented according to national circumstances” as an “extension” of the conservation buffer during periods of excess credit growth.
Basel III also introduced a non-risk adjusted tier 1 leverage ratio of 3%, based on a measure of total exposure rather than total assets and new liquidity standards. The Basel Committee had initially planned for member nations to begin implementing the Basel III requirements by January 1, 2013, with full implementation by January 1, 2019. On November 9, 2012, U.S. regulators announced that implementation of Basel III’s first requirements would be delayed.
In July 2013, the federal banking agencies published final rules (the “Basel III Capital Rules”) that revised their risk-based and leverage capital requirements and their method for calculating risk-weighted assets to implement, in part, agreements reached by the Basel Committee and certain provisions of the Dodd-Frank Act. The Basel III Capital Rules will apply to banking organizations, including the Company and the Bank.
Among other things, the Basel III Capital Rules: (i) introduce a new capital measure entitled “Common Equity Tier 1” (“CET1”); (ii) specify that tier 1 capital consist of CET1 and additional financial instruments satisfying specified requirements that permit inclusion in tier 1 capital; (iii) define CET1 narrowly by requiring that most deductions or adjustments to regulatory capital measures be made to CET1 and not to the other components of capital; and (iv) expand the scope of the deductions or adjustments from capital as compared to the existing regulations. The Basel III Capital Rules also provide a permanent exemption from the proposed phase out of existing trust preferred securities and cumulative perpetual preferred stock from regulatory capital for banking organizations with less than $15 billion in total consolidated assets as of December 31, 2009.
The Basel III Capital Rules provide for the following minimum capital to risk-weighted assets ratios:
| • | 4.5% based upon CET1; |
| • | 6.0% based upon tier 1 capital; and |
| • | 8.0% based upon total regulatory capital. |
A minimum leverage ratio (tier 1 capital as a percentage of total assets) of 4.0% is also required under the Basel III Capital Rules (even for highly rated institutions). The Basel III Capital Rules additionally require institutions to retain a capital conservation buffer of 2.5% above these required minimum capital ratio levels. Banking organizations that fail to maintain the minimum 2.5% capital conservation buffer could face restrictions on capital distributions or discretionary bonus payments to executive officers.
The Basel III Capital Rules did not address the proposed liquidity coverage ratio (“LCR”) called for by the Basel Committee’s Basel III framework. On October 24, 2013, the Federal Reserve issued a proposed rule implementing a LCR requirement in the United States for larger banking organizations. Neither the Company nor the Bank would be subject to the LCR requirement as proposed.
Finally, the Basel III Capital Rules amend the thresholds under the “prompt corrective action” framework enforced with respect to the Bank by the OCC to reflect both (i) the generally heightened requirements for regulatory capital ratios as well as (ii) the introduction of the CET1 capital measure.
106
Table of Contents
As a result of the enactment of the Basel III Capital Rules the Company and the Bank could be subject to increased required capital levels. The Basel III Capital Rules become effective as applied to us and the Bank on January 1, 2015, with a phase in period that generally extends from January 1, 2015 through January 1, 2019.
The ultimate impact of the new capital and liquidity standards on the Company and Bank is currently being reviewed and will depend on a number of factors, including the implementation of the new Basel III Capital Rules and any additional related rulemaking by the U.S. banking agencies.
Prompt Corrective Action
Under the FDIA, the federal bank regulatory agencies must take “prompt corrective action” against undercapitalized U.S. depository institutions. U.S. depository institutions are assigned one of five capital categories: “well capitalized,” “adequately capitalized,” “undercapitalized,” “significantly undercapitalized,” and “critically undercapitalized,” and are subjected to differential regulation corresponding to the capital category within which the institution falls. A depository institution is currently deemed to be “well capitalized” if the banking institution has a total risk-based capital ratio of 10.0% or greater, a tier 1 risk-based capital ratio of 6.0% or greater, and a leverage ratio of 5.0% or greater, and the institution is not subject to an order, written agreement, capital directive, or prompt corrective action directive to meet and maintain a specific level for any capital measure. Under certain circumstances, a well-capitalized, adequately capitalized or undercapitalized institution may be treated as if the institution were in the next lower capital category. A banking institution that is less than adequately capitalized is required to submit a capital restoration plan. Failure to meet capital guidelines could subject the institution to a variety of enforcement remedies by federal bank regulatory agencies, including: termination of deposit insurance by the FDIC, restrictions on certain business activities, and appointment of the FDIC as conservator or receiver.
In addition, when effective the Basel III Capital Rules will amend the thresholds under the “prompt corrective action” framework enforced with respect to the Bank by the OCC to reflect both (i) the generally heightened requirements for regulatory capital ratios as well as (ii) the introduction of the CET1 capital measure.
As of June 30, 2014, the Bank was considered well capitalized under standard PCA guidelines. Under these OCC requirements, a bank must have a total risk-based capital ratio of 10.0% or greater to be considered well capitalized.
Regulatory Limits on Dividends and Distributions
OCC and Federal Reserve regulations govern capital distributions by savings institutions, which include cash dividends, stock repurchases and other transactions charged to the capital account of a savings institution to make capital distributions. Under applicable regulations, a savings institution must file an application for approval of the capital distribution if:
| • | the total capital distributions for the applicable calendar year exceed the sum of the institution’s net income for that year to date plus the institution’s retained net income for the preceding two years; |
| • | the institution would not be at least adequately capitalized under the PCA guidelines following the distribution; |
| • | the distribution would violate any applicable statute, regulation, agreement or OCC-imposed condition; or |
| • | the institution is not eligible for expedited treatment of its filings with the OCC. |
If an application is not required to be filed, savings institutions such as the Bank which are a subsidiary of a holding company (as well as certain other institutions) must still file a notice with the OCC and Federal Reserve at least 30 days before the board of directors declares a dividend or approves a capital distribution.
107
Table of Contents
An institution that either before or after a proposed capital distribution fails to meet its then applicable minimum capital requirement or that has been notified that it needs more than normal supervision may not make any capital distributions without the prior written approval of the OCC. In addition, the OCC may prohibit a proposed capital distribution, which would otherwise be permitted by OCC regulations, if the OCC determines that such distribution would constitute an unsafe or unsound practice.
The FDIC prohibits an insured depository institution from paying dividends on its capital stock or interest on its capital notes or debentures (if such interest is required to be paid only out of net profits) or distributing any of its capital assets while it remains in default in the payment of any assessment due the FDIC. The Bank is currently not in default in any assessment payment to the FDIC.
We are a legal entity separate and distinct from the Bank and its subsidiary. Our principal source of revenue consists of dividends from the Bank. As noted above, the payment of dividends by the Bank is subject to various regulatory requirements, including a minimum of 30 days’ advance notice to the OCC of any proposed dividend to us.
Limits on Transactions with Affiliates and Insiders
Insured depository institutions are subject to restrictions on their ability to conduct transactions with affiliates and other related parties. Section 23A of the Federal Reserve Act imposes quantitative limits, qualitative requirements, and collateral requirements on certain transactions by an insured depository institution with, or for the benefit of, its affiliates. Transactions covered by Section 23A include loans, extensions of credit, investment in securities issued by an affiliate, and acquisitions of assets from an affiliate. Section 23B of the Federal Reserve Act requires that most types of transactions by an insured depository institution with, or for the benefit of, an affiliate be on terms at least as favorable to the insured depository institution as if the transaction were conducted with an unaffiliated third party. Section 11 of the HOLA applies Sections 23A and 23B to federal thrifts, including the Bank. In addition, Section 11 of HOLA prohibits the Bank from lending to any affiliate engaged in activities not permissible for a bank holding company and from acquiring the securities of any affiliate other than a subsidiary.
As noted above, the Dodd-Frank Act generally enhances the restrictions on transactions with affiliates under Section 23A and 23B of the Federal Reserve Act, including an expansion of the definition of “covered transactions” and a clarification of the amount of time for which collateral requirements regarding covered credit transactions must be satisfied. The ability of the Federal Reserve to grant exemptions from these restrictions is also narrowed by the Dodd-Frank Act, including by requiring coordination with other bank regulators.
The Federal Reserve’s Regulation O and OCC regulations impose restrictions and procedural requirements in connection with the extension of credit by an insured depository institution to directors, executive officers, principal stockholders and their related interests.
Brokered Deposits
The FDIC restricts the use of brokered deposits by certain depository institutions. Under the applicable regulations, (i) a “well capitalized insured depository institution” may solicit and accept, renew or roll over any brokered deposit without restriction, (ii) an “adequately capitalized insured depository institution” may not accept, renew or roll over any brokered deposit unless it has applied for and been granted a waiver of this prohibition by the FDIC and (iii) an “undercapitalized insured depository institution” may not (x) accept, renew or roll over any brokered deposit or (y) solicit deposits by offering an effective yield that exceeds by more than 75 basis points the prevailing effective yields on insured deposits of comparable maturity in such institution’s normal market area or in the market area in which such deposits are being solicited. The FDIC may, on a case-by-case basis and upon application by an adequately capitalized insured depository institution, waive the restriction on brokered deposits upon a finding that the acceptance of brokered deposits does not constitute an unsafe or unsound practice with respect to such institution.
108
Table of Contents
At June 30, 2014, the Bank had no outstanding brokered deposits and was considered well capitalized under PCA guidelines.
Examination Fees
The OCC currently charges fees to recover the costs of examining national banks and federal thrifts, processing applications and other filings, and covering direct and indirect expenses in regulating national banks and federal thrifts and their affiliates. The Dodd-Frank Act provides various agencies with the authority to assess additional supervision fees.
Deposit Insurance Assessments
FDIC-insured depository institutions are required to pay deposit insurance assessments to the FDIC. The amount of a particular institution’s deposit insurance assessment is based on that institution’s risk classification under an FDIC risk-based assessment system. An institution’s risk classification is assigned based on its capital levels and the level of supervisory concern the institution poses to the regulators. Deposit insurance assessments fund the DIF. As noted above, the Dodd-Frank Act changed the way an insured depository institution’s deposit insurance premiums are calculated. These changes may impact assessment rates, which could impact the profitability of our operations.
Depositor Preference
The FDIA provides that, in the event of the “liquidation or other resolution” of an insured depository institution, the claims of depositors of the institution (including the claims of the FDIC as subrogee of insured depositors) and certain claims for administrative expenses of the FDIC as a receiver will have priority over other general unsecured claims against the institution. If we invest in or acquire an insured depository institution that fails, insured and uninsured depositors, along with the FDIC, will have priority in payment ahead of unsecured, non-deposit creditors, including us, with respect to any extensions of credit they have made to such insured depository institution.
Federal Reserve System and Federal Home Loan Bank System
The Federal Reserve has adopted regulations that require savings associations to maintain non-earning reserves against their transaction accounts (primarily negotiable order of withdrawal accounts and regular checking accounts). These reserves may be used to satisfy liquidity requirements imposed by the OCC. Because required reserves must be maintained in the form of vault cash, with a pass-through correspondent institution or an account at a Federal Reserve Bank, the effect of this reserve requirement is to potentially restrict the amount of the Bank’s assets.
The Federal Home Loan Bank System consists of twelve regional Federal Home Loan Banks, each subject to supervision and regulation by the Federal Housing Finance Agency (“FHFA”). The Bank is a member of the FHLB of Chicago. The FHLBs provide a central credit facility for member savings associations, and impose collateral requirements on advances. The maximum amount that the FHLB of Chicago will advance fluctuates from time to time in accordance with changes in policies of the FHFB and the FHLB of Chicago, and the maximum amount generally is reduced by borrowings from any other source. In addition, the amount of FHLB of Chicago advances that a savings association may obtain is restricted in the event the institution fails to maintain its status as a QTL.
Anti-Money Laundering and OFAC
Under federal law, financial institutions must maintain anti-money laundering programs that include established internal policies, procedures, and controls; a designated compliance officer; an ongoing employee training program; and testing of the program by an independent audit function. Financial institutions are also prohibited
109
Table of Contents
from entering into specified financial transactions and account relationships and must meet enhanced standards for due diligence and customer identification in their dealings with non-U.S. financial institutions, non-U.S. customers and other high-risk customers. Financial institutions must take reasonable steps to conduct enhanced scrutiny of account relationships to guard against money laundering and to report any suspicious transactions, and law enforcement authorities have been granted increased access to financial information maintained by financial institutions. Bank regulators routinely examine institutions for compliance with these obligations and they must consider an institution’s compliance in connection with the regulatory review of applications, including applications for banking mergers and acquisitions. The regulatory authorities have imposed “cease and desist” orders and civil money penalty sanctions against institutions found to be violating these obligations.
The U.S. Department of the Treasury’s Office of Foreign Assets Control (“OFAC”) is responsible for helping to insure that U.S. entities do not engage in transactions with certain prohibited parties, as defined by various executive orders and acts of Congress. OFAC publishes lists of persons, organizations, and countries suspected of aiding, harboring or engaging in terrorist acts, known as Specially Designated Nationals and Blocked Persons. If the Company or the Bank finds a name on any transaction, account or wire transfer that is on an OFAC list, the Company or Bank must freeze or block such account or transaction, file a suspicious activity report and notify the appropriate authorities.
Consumer Laws and Regulations
Banking organizations are subject to numerous laws and regulations intended to protect consumers. These laws include, among others:
| • | Truth in Lending Act; |
| • | Truth in Savings Act; |
| • | Electronic Funds Transfer Act; |
| • | Expedited Funds Availability Act; |
| • | Equal Credit Opportunity Act; |
| • | Fair and Accurate Credit Transactions Act; |
| • | Fair Housing Act; |
| • | Fair Credit Reporting Act; |
| • | Fair Debt Collection Act; |
| • | Gramm-Leach-Bliley Act; |
| • | Home Mortgage Disclosure Act; |
| • | Right to Financial Privacy Act; |
| • | Real Estate Settlement Procedures Act; |
| • | laws regarding unfair and deceptive acts and practices; and |
| • | usury laws. |
Many states and local jurisdictions have consumer protection laws analogous, and in addition to, those listed above. These federal, state and local laws regulate the manner in which financial institutions deal with customers when taking deposits, making loans, or conducting other types of transactions. Failure to comply with these laws and regulations could give rise to regulatory sanctions, customer rescission rights, action by state and local attorneys general, and civil or criminal liability. The creation of the CFPB by the Dodd-Frank Act has led to enhanced enforcement of consumer financial protection laws.
110
Table of Contents
The Community Reinvestment Act
The CRA is intended to encourage banks and thrifts to help meet the credit needs of their service areas, including low and moderate-income neighborhoods, consistent with safe and sound operations. The bank regulators examine and assign each bank a public CRA rating. The CRA then requires bank regulators to take into account the bank’s record in meeting the needs of its service area when considering an application by a bank to establish or relocate a branch or to conduct certain mergers or acquisitions. The Federal Reserve is required to consider the CRA records of an SLHC’s controlled thrift(s) when considering an application by the SLHC to acquire a banking organization or to merge with another SLHC. When the Company or the Bank applies for regulatory approval to make certain investments, the regulators will consider the CRA record of target institutions and the Bank. A less than satisfactory CRA record could substantially delay approval or result in denial of an application. The regulatory agency’s assessment of the institution’s record is made available to the public. Following its most recent CRA examination in June 2013, the Bank received an overall rating of “Satisfactory.”
Overdraft Fees
The Federal Reserve has adopted amendments under its Regulation E that impose restrictions on banks’ abilities to charge overdraft fees. The rule prohibits financial institutions from charging fees for paying overdrafts on ATM and one-time debit card transactions, unless a consumer consents, or opts in, to the overdraft service for those types of transactions.
Interchange Fees
The Dodd-Frank Act, through a provision known as the Durbin Amendment, required the Federal Reserve to establish standards for interchange fees that are “reasonable and proportional” to the cost of processing the debit card transaction and imposes other requirements on card networks. Institutions like the Bank with less than $10 billion in assets are exempt. However, while we are under the $10 billion level that caps income per transaction, we have been affected by federal regulations that prohibit network exclusivity arrangements and routing restrictions. Essentially, issuers and networks must allow transaction processing through a minimum of two unaffiliated networks. These additional processing alternatives have negatively affected interchange income from our PIN/point of sale network.
Changes in Laws, Regulations or Policies
Federal, state and local legislators and regulators regularly introduce measures or take actions that would modify the regulatory requirements applicable to banks, their holding companies and other financial institutions. Changes in laws, regulations or regulatory policies could adversely affect the operating environment for the Company and the Bank in substantial and unpredictable ways, increase our cost of doing business, impose new restrictions on the way in which we conduct our operations or add significant operational constraints that might impair our profitability. We cannot predict whether new legislation will be enacted and, if enacted, the effect that it, or any implementing regulations, would have on our business, financial condition or results of operations. The Dodd-Frank Act imposes substantial changes to the regulatory framework applicable to us and our subsidiaries. The majority of these changes will be implemented over time by various regulatory agencies. The full effect that these changes will have on us remains uncertain at this time and may have a material adverse effect on our business and results of operations.
Homeowners Affordability and Stability Plan
In February 2009, the U.S. government also announced its Financial Stability Plan and Homeowners Affordability and Stability Plan (“HASP”). The Financial Stability Plan is the second phase of TARP, to be administrated by the Treasury. Its four key elements include:
| • | the development of a public/private investment fund essentially structured as a government sponsored enterprise with the mission to purchase troubled assets from banks with an initial capitalization from government funds; |
111
Table of Contents
| • | the Capital Assistance Program under which the Treasury will purchase additional preferred stock available only for banks that have undergone a new stress test given by their regulator; |
| • | an expansion of the Federal Reserve’s term asset-backed liquidity facility to support the purchase of up to $1 trillion in AAA-rated asset backed securities backed by consumer, student, and small business loans, and possible other types of loans; and |
| • | the establishment of a mortgage loan modification program with $50 billion in federal funds further detailed in the HASP. |
The HASP is a program aimed to help seven to nine million families restructure their mortgages to avoid foreclosure. The plan also develops guidance for loan modifications nationwide. HASP provides programs and funding for eligible refinancing of loans owned or guaranteed by Fannie Mae or Freddie Mac, along with incentives to lenders, mortgage servicers, and borrowers to modify mortgages of “responsible” homeowners who are at risk of defaulting on their mortgage. The goals of HASP are to assist in the prevention of home foreclosures and to help stabilize falling home prices.
Beyond the Company’s participation in certain programs, such as TARP, the Company will benefit from these programs if they help stabilize the national banking system and aid in the recovery of the housing market.
Federal Housing Finance Agency
In January 2011, the Federal Housing Finance Agency (“FHFA”) announced that it directed Fannie Mae and Freddie Mac to work on a joint initiative, in coordination with FHFA and HUD, to consider alternatives for future mortgage servicing structures and servicing compensation for their single-family mortgage loans. Not all aspects of the joint initiative have yet been implemented and it is as yet uncertain how the financial services industry in general and the Bank specifically will be affected by the final requirements.
The Volcker Rule
On December 10, 2013, five U.S. financial regulators, including the Federal Reserve and the OCC, adopted a final rule implementing the so-called “Volcker Rule.” The Volcker Rule was created by Section 619 of the Dodd-Frank Act and prohibits “banking entities” from engaging in “proprietary trading” and making investments and conducting certain other activities with “private equity funds and hedge funds.” Although the final rule provides some tiering of compliance and reporting obligations based on size, the fundamental prohibitions of the Volcker Rule apply to banking entities of any size, including the Company and the Bank. The final rule became effective April 1, 2014; however, the Federal Reserve has extended the conformance period for all banking entities until July 21, 2015.
While the final rule and its accompanying materials comprise approximately 1,000 pages, banking entities that do not engage in any of the activities covered by the Volcker Rule (other than with respect to certain U.S. government obligations) are not required to adopt any formal compliance program specific to the Volcker Rule. We are currently reviewing the scope of the final rule to determine its impact on our operations.
Legislative and Regulatory Proposals
Proposals to change the laws and regulations governing the operations and taxation of, and federal insurance premiums paid by, savings banks and other financial institutions and companies that control such institutions are frequently raised in the U.S. Congress, state legislatures and before the FDIC, the OCC and other bank regulatory authorities. The likelihood of any major changes in the future and the impact such changes might have on us or our subsidiaries are impossible to determine. Similarly, proposals to change the accounting treatment applicable to savings banks and other depository institutions are frequently raised by the SEC, the federal banking agencies, the IRS and other appropriate authorities, including, among others, proposals relating to fair market value accounting for certain classes of assets and liabilities. The likelihood and impact of any additional future accounting rule changes and the impact such changes might have on us or our subsidiaries are impossible to determine at this time.
112
Table of Contents
Taxation
Federal. We file a consolidated federal income tax return on behalf of the Company, the Bank and its subsidiaries on a calendar tax year basis.
State. Under current law, the state of Wisconsin imposes a corporate franchise tax of 7.9% on the combined taxable incomes of the members of our consolidated income tax group.
Competition
The Bank encounters strong competition in attracting both loan and deposit customers. Such competition includes other banks, savings institutions, mortgage banking companies, credit unions, finance companies, mutual funds, insurance companies and brokerage and investment banking firms. The Bank’s market area includes branches of several commercial banks that are substantially larger in terms of loans and deposits. Furthermore, tax exempt credit unions operate in most of the Bank’s market area and aggressively price their products and services to a large portion of the market. Our profitability depends upon the Bank’s continued ability to successfully expand market share and mitigate credit losses.
Customer demand for loans secured by real estate has been reduced by a weak economy and a decrease in real estate values. Low demand for real estate loans has decreased the Bank’s income because alternative investments, such as securities, typically earn a lower return than real estate secured loans.
The principal factors that are used to attract deposit accounts and that distinguish one financial institution from another include rates of return, quality of service to the customers, types of accounts, service fees, convenience of office locations and hours, and other services. We offer a full array of deposit, savings and investment products to meet the needs of our consumer and business customers with features, high service levels, convenience and rates/fees structured to provide a competitive value proposition for our customers and prospective customers. In return, our customers have rewarded us with high levels of satisfaction and loyalty as proven by our recent rating by a well-known agency which showed the Bank to be one of the highest rated banks in the upper Midwest.
The primary factors in competing for loans are interest rates, loan fee charges, and timeliness and quality of service to the borrower. Similar to the market for deposit and investment products, we focus on offering the best overall value to our loan customers. During the six months ended June 30, 2014, we originated $57.9 million in single family “conforming” loans. While single family “conforming” loans are subsequently sold to investors, a key competitive difference is that the Bank retains servicing on our residential mortgages, thereby ensuring a high level of continuing customer service. At June 30, 2014, the Bank has a servicing portfolio of approximately $2.59 billion.
Sales and Marketing
Key to our future success is the re-launch of a focused and proactive marketing and sales program.
Marketing. In 2009, the marketing budget was significantly reduced to manage expenses. Media and other marketing channels continued to be used to promote the Bank’s name in the market place and to support a narrowed band of products. In 2012, the Bank introduced a new consumer product line-up oriented toward rewarding its customers who leverage various self-service channels including debit cards, online bill pay and direct deposit. Even greater value was provided to those with significant deposit, investment and loan balances.
In 2013, the marketing budget was expanded to support core deposit and loan growth initiatives. Further there has been a shift in the proportion of expenditures away from traditional channels and toward digital media including the Bank’s website, email, and various internet search engines. Recent studies have shown the fastest
113
Table of Contents
growing delivery channels in banking are online and mobile. In fact up to 70% of consumers now use the internet to research before making “buying” decisions. The Bank intends to be among the banks considered potential and existing customers consider new financial products researched online. To support this move, the Bank introduced mobile banking in August 2012 along with email and text alerts. Further online enhancements are scheduled for 2014.
Additionally, the Bank recently changed its logo and will begin rolling out a new branding effort in a cost effective manner, first digitally and then to branch signage replacements and enhancements.
Sales. Sales and service has traditionally been approached from a price driven strategy coupled with outstanding customer service. The Bank recently contracted with an international sales process partner to create a more proactive and disciplined sales culture within the Retail Banking Group of the Bank. Similar initiatives are occurring in the commercial banking area. A limited but powerful set of initiatives will support this effort including stronger sales tracking and reporting, improved sales incentive programs, robust sales and sales management training, sales support technology, and continued efforts to ensure the hiring top talent.
Description of Property
Our main office headquarters are located at 25 West Main Street, Madison, Wisconsin and we have 53 other full-service offices and one loan origination office. The Bank owns 34 of its full-service offices, leases the land on which four such offices are located, and leases the remaining 16 full-service offices. The Bank also owns its headquarters building, adjacent surface parking lot and parking garage. The leases expire between 2014 and 2029. On February 6, 2014, the Bank entered into a Purchase Agreement for the sale of its headquarters building, the adjacent surface parking lot and the parking garage. The aggregate net book value at June 30, 2014 of the properties owned or leased, including headquarters, properties and leasehold improvements, was $19.0 million. We believe that our current facilities are adequate to meet present needs.
Employees
As of June 30, 2014, we had 679 full-time equivalent employees. The average tenure of the Bank employees is 10.5 years. None of the Bank employees are covered under collective bargaining agreements.
Legal Proceedings
We are a defendant in a pending lawsuit captioned Village of Kronenwetter v. AnchorBank, fsb, Marathon County, Wisconsin, Case No. 11-CV-1370, which is an action brought by the Village of Kronenwetter, Wisconsin (“the Village”) on November 14, 2011 to enforce and collect on a $4.4 million letter of credit issued by the Bank in support of the development of a mixed use TIF development in the Village. The complaint alleges that the Bank wrongfully refused to honor a full draw on the letter of credit and that the developer failed to notify the plaintiff of the renewal of the letter of credit or to renew the letter of credit within the time limitations set forth in the development agreement. A specific reserve for loss on unfunded loan commitments was established at June 30, 2013 due to a shortfall in the value of the residential real estate development supporting the letter of credit. The specific reserve balance at June 30, 2014 was $2.4 million. On August 18, 2014, the court decided in favor of the Village, rejecting all defenses raised by the Bank. Judgment has not yet been entered in the case, but if judgment is entered it will include accrued interest and actual attorney fees. It is anticipated that we will record approximately $1.1 million during the quarter ending September 30, 2014 which will include accrued interest payable through the date of the summary judgment decision; additional specific reserve for loss based upon additional collateral shortfall and legal fees.
We are the plaintiff/counterclaim defendant in a pending lawsuit captioned AnchorBank, fsb v. Henriette McLean et al., Dane County, Wisconsin Case No. 13-CV-811. The Bank is seeking to enforce personal guarantees executed by McLean related to amounts borrowed by Mineral Point Road Holdings, LLC (“MPRH”). At the time
114
Table of Contents
of the commencement of the lawsuit, March 7, 2013, McLean owed the Bank $363,302 under the guarantees. As a result of the recent sale of real estate owned by MPRH, the amount of the debt is now $300,127. The Bank has the right to obtain its attorneys’ fees incurred in collecting on the guarantees if it prevails in the lawsuit. On January 27, 2014, McLean filed a 196-paragraph Counterclaim against the Bank. McLean alleges various misconduct by the Bank related to its loans to MPRH and the procurement of her guarantees. Most of the counterclaims are based upon alleged misrepresentations and/or misrepresentations by omission. McLean is seeking the return of the $182,629 she paid to the Bank in 2012 under her guarantees, treble damages and punitive damages. McLean has also filed a third-party complaint seeking contribution/indemnity from Joseph Gallina (the managing member of MPRH) and various entities controlled by Gallina.
We are involved in routine legal proceedings occurring in the ordinary course of business which, in the aggregate, are believed to be immaterial to our financial condition and results of operations.
On February 21, 2013, we received a “Wells Notice” from the SEC indicating its intent to bring a civil injunctive action against us alleging that we violated Sections 10(b), 13(a), 13(b)(2)(A), 13(b)(2)(B), and 13(b)(2)(B) of the Securities Exchange Act of 1934, as amended (the “Exchange Act”), and Rules 10b-5 and 13a-13 thereunder. On August 14, 2013, the SEC filed a complaint alleging that we and our former chief financial officer, Dale Ringgenberg, made material misstatements in our quarterly report on Form 10-Q for the period ended June 30, 2009. Without admitting or denying the allegations in the SEC’s complaint, we agreed to settle the action against us by consenting to the entry of a final judgment permanently enjoining us from violating Sections 10(b), 13(a), 13(b)(2)(A), 13(b)(2)(B), and 13(b)(2)(B) of the Exchange Act and Rules 10b-5 and 13a-13 thereunder. There was no monetary fine or penalty assessed to us for the settlement of this action. Final entry of judgment was made on November 26, 2013, and accordingly, this matter is concluded.
115
Table of Contents
DIRECTORS AND EXECUTIVE OFFICERS
The following table sets forth information regarding our directors, executive officers and key employees as of September 8, 2014:
| Name | Age | Position | ||||
| Chris M. Bauer |
65 | Director, President and Chief Executive Officer of the Company and the Bank | ||||
| Richard A. Bergstrom |
64 | Director of the Company and the Bank | ||||
| Holly Cremer Berkenstadt |
58 | Director of the Company | ||||
| Bradley E. Cooper |
47 | Director of the Company | ||||
| Martin S. Friedman |
45 | Director of the Company | ||||
| David L. Omachinski |
62 | Director of the Company and the Bank and Chairman of the Board | ||||
| Pat Richter |
72 | Director of the Company and the Bank | ||||
| Thomas G. Dolan |
54 | Executive Vice President and Chief Operating Officer of the Company and the Bank | ||||
| Martha M. Hayes |
52 | Executive Vice President—Chief Risk Officer of the Bank | ||||
| William T. James |
55 | Senior Vice President, Chief Financial Officer and Treasurer of the Company and the Bank | ||||
| Scott M. McBrair |
57 | Executive Vice President—Retail Banking Group of the Bank | ||||
| Ronald R. Osterholz |
65 | Senior Vice President—Human Resources of the Bank | ||||
| Mark D. Timmerman |
46 | Executive Vice President, Secretary and General Counsel of the Company and the Bank; Director of the Bank | ||||
Directors
Chris M. Bauer. Mr. Bauer has been a Director, President and Chief Executive Officer of the Company since June 2009. Prior to joining the Company, Mr. Bauer was an independent consultant and immediate past chairman of the American Automobile Association, Inc.; founded First Business Bank Milwaukee in 2000, serving as its chairman until 2003; retired as chairman and Chief Executive Officer of Firstar Bank Milwaukee, N.A. and head of commercial banking for Firstar Corp. in 1999. Mr. Bauer is currently a member of the boards of directors of The Auto Club Group and Auto Club Insurance Association. His qualifications to serve as a Director, President and Chief Executive Officer of the Company and the Bank include his 45 years of financial services experience, with a combined 16 years as bank president at First Wisconsin Bank and Firstar Bank Milwaukee, N.A.
Richard A. Bergstrom. Mr. Bergstrom has been a Director of the Company since 1999. He is also President of Bergstrom Corporation, Wisconsin’s largest automotive retailer, with 25 dealerships across the state, and Director of the Bank. His qualifications to serve as a Director of the Company, as a member of the Compensation Committee, and as a member of the Nominating and Governance Committee include substantial senior management expertise and financial expertise as president of Bergstrom Corporation.
Holly Cremer Berkenstadt. Ms. Berkenstadt has been a Director of the Company since 1994. She is the former Chairman of the Board and Director of Wisconsin Cheeseman, Inc., a direct food and gift company located in Sun Prairie, Wisconsin. She is also Director of the Cremer Foundation and serves as a Director of several not-for-profit boards. Her qualifications to serve as a Director of the Company and a member of the Audit Committee include substantial senior management expertise and financial expertise.
Bradley E. Cooper. Mr. Cooper has been a Director of the Company since December 2013. He is a founding partner of Capital Z Partners, a private equity fund focused on investing in the financial services sector. Prior to founding Capital Z in 1990, Mr. Cooper was an investment banker in the Financial Institutions Group of
116
Table of Contents
Salomon Brothers. Mr. Cooper currently serves as a director of several Capital Z Partners portfolio companies. As an experienced investor in the financial services industry, Mr. Cooper has developed an extensive network of contacts throughout the industry. He regularly speaks at industry conferences as an expert on acquisitions and investments in the financial services companies.
Martin S. Friedman. Mr. Friedman has been a Director of the Company since December 2013. He is co-founder of FJ Capital Management, an investment fund firm based in McLean, Virginia, and has served as its CEO since 2008. He was previously Director of Research for Friedman, Billings, Ramsey Group, a research and securities trading firm, from 1998 to 2007. Prior to that, he was a securities analyst with the same firm from 1992 to 1998. He has been a member of the Board of Directors of Reston, VA-based commercial bank Access National since 2009. Mr. Friedman also served on the Board of Directors for Guaranty Savings Bank in Metairie, Louisiana from 2008 to 2009. Mr. Friedman has over 25 years of experience in and around the commercial and investment banking industries, in which he applied and developed skills in financial analysis with an expertise in financial institutions, corporate finance, SEC and banking compliance and management.
David L. Omachinski. Mr. Omachinski has been a Director of the Company since 2002. Mr. Omachinski is currently serving as an independent business consultant. He has been the Chairman of the Board since June 2009 and Lead Director of the Board from February 2009 to June 2009. He was President & Chief Executive Officer (from October 2005 to August 2006) of Magnum Products, LLC., a company which supplies light towers, mobile generators, trash pumps and other construction equipment for a variety of industries. Prior thereto, he was President & Chief Operating Officer (since February 2004), Executive Vice President, Chief Operating & Financial Officer, and Treasurer (since 2002) and Vice President-Finance, Chief Financial Officer & Treasurer (since 1993) of OshKosh B’Gosh, Inc. He is also Director of Bioanalytical Systems, Inc. since 2009. His qualifications to serve as a Director of the Company and as Chair of the Audit Committee include his education and training in finance and accounting, substantial senior management experience and financial expertise. He is a Certified Public Accountant, has practiced with a public accounting firm and has served in various executive capacities. He meets the requirements of an Audit Committee financial expert.
Pat Richter. Mr. Richter has been a Director of the Company since 1990. He is also Director of Athletics-Emeritus at the University of Wisconsin-Madison and Emeritus Director of the Board of the Green Bay Packers, Green Bay, Wisconsin. He is a member of the Board of Directors at Meriter Health Services, Madison, Wisconsin. Mr. Richter is currently serving as a consultant for several business organizations. His qualifications to serve as a Director of the Company, as a member of the Nominating and Governance Committee, and as Chair of the Compensation Committee include his substantial senior management experience.
Executive Officers and Key Employees
Thomas G. Dolan. Mr. Dolan is currently Executive Vice President and Chief Operating Officer of the Company and the Bank and was previously Executive Vice President, Chief Financial Officer and Treasurer of the Company and of the Bank until September 2014. Mr. Dolan joined the Company and the Bank in March 2011, following a consulting arrangement with the Company and the Bank since January 2009. Mr. Dolan oversees the Bank’s operations and Management Information Systems areas. Mr. Dolan has more than 25 years of experience with LaSalle Bank and Bank of America and was the owner and Managing Director of Northern Pointe Consulting, a financial institution consulting firm from 2008 to 2012.
Martha M. Hayes. Ms. Hayes currently serves as Executive Vice President-Chief Risk Officer of the Bank. She joined the Bank as its Chief Credit Risk Officer on July 31, 2009. She previously served as President and Managing Director of Merrill Lynch Business Financial Services in Chicago from 2004 to 2008. Prior to that role, she served in a variety of related capacities beginning in 1987 for Wachovia Corporation, including Senior Vice President and Director of Commercial Loan Products and Chief Operating Officer for Wachovia’s Risk Management Division, Business Credit Solutions.
117
Table of Contents
William T. James. Mr. James is currently Senior Vice President, Chief Financial Officer and Treasurer of the Company and the Bank. Mr. James joined the Company and the Bank in October 2013. Mr. James oversees the Treasury Management, Finance, and Accounting areas. He previously served as Treasurer and Senior Vice President of Guaranty Bank in Milwaukee from 2006 to 2013. He began his banking career at St. Francis Bank in Milwaukee and served in a variety of finance related roles for over 20 years including Executive Vice President and Treasurer. He has been a Chartered Financial Analyst (CFA) since 1991.
Scott M. McBrair. Mr. McBrair is Executive Vice President—Retail Banking Group of the Bank. He oversees the Bank’s branch network, Marketing, Bank Operations and Anchor Investment Services. Prior to joining Anchor in January 2011, Mr. McBrair consulted for First Niagara Bank after serving as the Executive Vice President-Retail Banking at Webster Bank from 2005 to 2009. He began his banking career at Bank One, now JPMorgan Chase, where he served in a variety of Retail Banking assignments over a 21 year span from 1983 to 2005 with the latest being Executive Vice President-Retail Region Manager.
Ronald R. Osterholz. Mr. Osterholz is Senior Vice President-Human Resources of the Bank. Mr. Osterholz joined the Bank in 1973 and previously served as Savings Officer, Branch Manager and Branch Coordinator. Mr. Osterholz currently oversees the Bank’s Human Resources and Training departments. Mr. Osterholz is active in the University of Wisconsin-Madison Alumni Association functions, on the Board of the University of Wisconsin-Platteville Foundation and is in various civic organizations and clubs.
Mark D. Timmerman. Mr. Timmerman currently serves as Executive Vice President, Secretary and General Counsel of the Company and the Bank, and he is a Director of the Bank. Mr. Timmerman oversees the Bank’s legal and compliance areas. Mr. Timmerman previously served as a Director of the Company and as Executive Vice President of the Bank. Mr. Timmerman has been a member of the State Bar of Wisconsin since 1994.
CORPORATE GOVERNANCE
Director Independence
The Board has adopted the following standards for director independence in compliance with rules of the SEC and generally consistent with corporate governance listing standards for companies listed on the NASDAQ Global Market:
| • | No director qualifies as “independent” unless the Board affirmatively determines that the director has no material relationship with us (either directly or as a partner, stockholder or officer of an organization that has a relationship with us); |
| • | A director who is an employee, or whose immediate family member is an executive officer of ours is not “independent” until three years after the end of such employment relationship; |
| • | A director who receives, or whose immediate family member receives, more than $120,000 per year in direct compensation from us or any of our subsidiaries, other than director and committee fees and pension or other forms of deferred compensation for prior service (provided such compensation is not contingent in any way on continued service), is not “independent” until three years after he or she ceases to receive more than $120,000 per year in such compensation; |
| • | A director who is affiliated with or employed by, or whose immediate family member is affiliated with or employed in a professional capacity by, a present or former internal or external auditor of ours is not “independent” until three years after the end of the affiliation or the employment or auditing relationship; |
| • | A director who is employed, or whose immediate family member is employed, as an executive officer of another company where any of our present executives serve on that company’s compensation committee is not “independent” until three years after the end of such service or the employment relationship; and |
118
Table of Contents
| • | A director who is an executive officer or an employee, or whose immediate family member is an executive officer, of a charity to which we donate or a company that makes payments to, or received payments from, us for property or services in an amount which, in any single fiscal year, exceeds the greater of $200,000 or 5% of such other charity’s or company’s consolidated gross revenues, is not “independent” until three years after falling below such threshold. |
The independence standards listed above were adopted prior to the effectiveness of the Plan of Reorganization and continue to be in force.
Based on its review of the independence of directors, the Board has determined that each member of the Board, except Mr. Bauer meets the aforementioned independence standards. Mr. Bauer does not meet the aforementioned independence standards because he is the President and Chief Executive Officer of the Company and of the Bank.
The independent directors regularly meet in executive session without Mr. Bauer.
The Board and Its Committees
Audit Committee. The Audit Committee of the Board provides assistance to the Board in fulfilling its oversight responsibility to the stockholders of the Company relating to:
| • | Monitoring the quality and integrity of our financial reporting process, financial statements and systems of internal controls regarding finance and accounting, including reviewing our annual report and quarterly reports; |
| • | Reviewing our corporate compliance policies and monitoring compliance with our Code of Business Conduct and Ethics, a copy of which is available on the Company’s website at www.anchorbank.com, and other compliance policies with legal and regulatory requirements, including reviewing any significant case of employee conflict of interest or misconduct; |
| • | Monitoring the qualifications, independence and performance of the independent auditors, including approving in advance all audit and non-audit engagements; |
| • | Retaining and determining the compensation of the independent auditors; |
| • | Monitoring our financial, litigation and compliance risks; and |
| • | Reporting to the Board as appropriate. |
The Audit Committee is empowered to appoint, compensate and oversee the work of the Company’s independent registered public accounting firm and to investigate any matter brought to its attention with full access to all books, records, facilities and personnel of the Company and the authority to engage and retain independent counsel and other advisors as it determines necessary to carry out its duties. In connection with the Plan of Reorganization, the composition of the Audit Committee changed. The members of the Audit Committee currently include Ms. Holly Cremer Berkenstadt and Messrs. David Omachinski and Pat Richter. Each of these persons is independent within the meaning of applicable laws and regulations, the listing standards of the NASDAQ Global Market and the Company’s corporate governance guidelines.
The Board has determined that Messrs. Omachinski and Richter meet the standard of “Audit Committee Financial Expert,” as defined by the SEC, and that each member of the Audit Committee is independent from management and financially literate, as defined by the NASDAQ Global Market listing standards.
119
Table of Contents
Compensation Committee. The Compensation Committee evaluates, oversees and approves the compensation and benefits policies for our executive officers. It conducts its duties consistent with a written charter, assists the Board in fulfilling its responsibilities for overseeing the compensation of our executive officers and is responsible for the following:
| • | Reviewing and approving corporate goals and objectives relevant to CEO compensation and evaluating the CEO’s performance in light of such goals and objectives; |
| • | Recommending to the Board the compensation and benefits for the CEO considering (at a minimum) the Company’s performance, relative stockholder return and the value of compensation granted to CEO’s at comparable or peer companies; |
| • | Setting compensation for our executive officers other than the CEO, after consideration of the CEO’s recommendations; |
| • | In accordance with the American Recovery and Reinvestment Act of 2009 (the “ARRA”), meeting at least semi-annually to discuss and evaluate employee compensation plans in light of an assessment of any risk posed to the Company, to ensure that such plans do not encourage employees to take unnecessary and excessive risks; and, to the extent required by EESA, reviewing, at least annually “Senior Executive Officer” (“SEO” as defined in EESA) compensation, to ensure SEO compensation does not encourage such officers to take unnecessary and excessive risks; |
| • | Maintaining compensation practices that are consistent with applicable market standards and compliant with applicable regulatory requirements; |
| • | Recommending to the Board the approval, amendment and termination of any of our plans that permit awards of our common stock; |
| • | Approving significant amendments to the retirement plans, severance plans, deferred compensation plans or any other compensation or benefit plans in which our executive officers participate; |
| • | Overseeing our policies on structuring compensation programs for executive officers to preserve tax deductibility and to establish and certify, as and when required, the attainment of performance goals pursuant to the U.S. tax code; |
| • | Discussing and reviewing with management the disclosure regarding compensation and benefit matters and the Compensation Discussion and Analysis (“CD&A”) in the annual proxy statement, and recommending to the full Board whether the CD&A should be included in the annual proxy statement; and |
| • | Producing the Compensation Committee Report for inclusion in our annual proxy statement or in our Annual Report filed on Form 10-K, in accordance with applicable regulations. |
The members of this committee are Ms. Holly Cremer Berkenstadt and Messrs. Richard Bergstrom, Martin Friedman and Pat Richter. Each of these persons is independent within the meaning of applicable laws and regulations, the listing standards of the NASDAQ Global Market and the Company’s corporate governance guidelines.
Nominating and Governance Committee. The Nominating and Governance Committee of the Board evaluates and makes recommendations to the Board for the election of directors and evaluation of the Company’s corporate governance practices and policies. The members of this committee are Ms. Holly Cremer Berkenstadt and Messrs. Richard Bergstrom and Bradley Cooper. Each of these persons is independent within the meaning of applicable laws and regulations, the listing standards of the NASDAQ Global Market and the Company’s corporate governance guidelines.
The Nominating and Governance Committee proposes a slate of directors for election by our stockholders at each annual meeting and appoints candidates to fill any vacancies on the Board. In addition, the Nominating and Governance Committee assists the Board with:
| • | Identifying and recommending qualified candidates to fill positions on the Board and its committees; |
120
Table of Contents
| • | Recommending to the Board the compensation and benefits for directors; |
| • | Overseeing the evaluation of the structure, duties, size, membership and functions of the Board and its committees, as appropriate, including advising the Board as to whether any director has a conflict of interest; |
| • | Overseeing the evaluation of the Board and its committees and members; |
| • | Overseeing corporate governance, including developing and recommending corporate governance guidelines and policies; |
| • | Overseeing the succession planning process for the Company’s Chief Executive Officer, executive officers and senior managers holding significant positions within the Company; and |
| • | Reviewing disclosures in our annual proxy statement, including any stockholder proposals and any statements in opposition. |
We have amended and adopted the charters of our Audit Committee, Compensation Committee and Nominating and Corporate Governance Committee to implement the listing standards of NASDAQ Global Market and the Company’s Corporate governance guidelines. Such charters were adopted and amended prior to the effectiveness of the Plan of Reorganization and continue to be in force. We have adopted a Code of Business Conduct and Ethics applicable to all of our directors, officers and employees. You can access our committee charters and our Code of Business Conduct and Ethics at our website at www.anchorbank.com or by writing to us at 25 West Main Street, Madison, Wisconsin 53703, Attention Mark D. Timmerman, Executive Vice President, Secretary and General Counsel.
Compensation Committee Interlocks and Insider Participation
No member of the Compensation Committee serves as an officer or employee of the Company. None of the Company’s executive officers serve as a member of the Compensation Committee of any other company that has an executive officer serving as a member of the Board. None of the Company’s executive officers serve as a member of the board of directors of any other company that has an executive officer serving as a member the Company’s Compensation Committee.
Compensation of Directors
Meeting Fees. Each member of the Board is paid a fee of $2,250 for each regular quarterly board meeting attended. In addition, each director of the Bank also is paid a fee of $2,250 for each regular meeting of the board of directors of the Bank attended. Directors of the Company and the Bank also receive a fee of $450 for each regular committee meeting of the respective board attended and $1,125 for each special board meeting attended. The Audit Committee Chair receives an annual retainer of $7,200, payable in quarterly installments. As Chairman of the Board of the Company and Bank, respectively, Mr. Omachinski receives a monthly fee of $5,000. Each employee-member of the Board of the Company or the Bank receives no meeting fee. Accordingly, as an employee-member of the Boards of both the Company and the Bank, Mr. Bauer receives no meeting fees.
The following table sets forth information concerning compensation paid or accrued by the Company and the Bank to each member of the board of directors during the nine months ended December 31, 2013.
121
Table of Contents
Director Compensation. There were no stock awards, non-equity incentive plan compensation or above-market or preferential earnings on deferred compensation to any of the non-employee directors in nine months ended December 31, 2013.
| Name |
Fees Earned or Paid in Cash(1) |
All Other Compensation(2) |
Total | |||||||||
| Richard A. Bergstrom |
$ | 31,050 | $ | — | $ | 31,050 | ||||||
| Holly L. Cremer Berkenstadt |
15,750 | — | 15,750 | |||||||||
| Bradley E. Cooper |
1,125 | — | 1,125 | |||||||||
| Martin S. Friedman |
1,125 | — | 1,125 | |||||||||
| David L. Omachinski |
82,575 | 1,355 | 83,930 | |||||||||
| Pat Richter |
27,450 | — | 27,450 | |||||||||
| James D. Smessaert |
12,825 | — | 12,825 | |||||||||
| (1) | Includes meeting, committee and board and committee chairmanship fees. |
| (2) | Includes interest paid on Mr. Omachinski’s deferred compensation plan from Fox Cities Bank. |
Directors’ Stock Option Plans. We adopted our 2001 Stock Option Plan for non-employee directors (the “2001 Directors’ Plan”) which provided for the grant of non-qualified stock options to non-employee directors of the Company and the Bank. During the nine months ended December 31, 2013, no stock options were granted. The 2001 Directors’ Plan was cancelled pursuant to the Plan of Reorganization. Also, pursuant to the Plan of Reorganization, all Legacy Common Stock and related securities were cancelled. Each non-officer director had no equity awards outstanding at December 31, 2013:
| Name |
Option Awards | Stock Awards | ||||||
| Number of Securities Underlying Unexercised Options |
Number of Securities Underlying Stock Awards |
|||||||
| Richard A. Bergstrom |
— | — | ||||||
| Holly L. Cremer Berkenstadt |
— | — | ||||||
| Bradley E. Cooper |
— | — | ||||||
| Martin S. Friedman |
— | — | ||||||
| David L. Omachinski |
— | — | ||||||
| Pat Richter |
— | — | ||||||
| James D. Smessaert |
— | — | ||||||
As of December 31, 2013, there were no options issued or outstanding.
Directors’ Deferred Compensation Plan. The Company and the Bank maintain plans under which members of their Boards of Directors may elect to defer receipt of all or a portion of their director’s fees. Under the plans, the Company and the Bank are obligated to pay the deferred fees, semi-annually over a five-year period together with interest at a stated rate, upon the participating director’s resignation from the board of directors. During the nine months ended December 31, 2013, no director deferred funds pursuant to these deferred compensation plans.
122
Table of Contents
COMPENSATION DISCUSSION AND ANALYSIS
Overview of Compensation Administration
Our Compensation Committee is responsible for all compensation, including equity compensation, of our named executive officers (“NEOs”). The Compensation Committee consists of Ms. Holly Cremer Berkenstadt and Messrs. Richard A. Bergstrom, Martin Friedman and Pat Richter, Chair. The Compensation Committee sets the strategic direction for our executive compensation policies and programs and helps ensure management’s execution and compliance with that strategic direction. It also oversees administration of certain of our compensation and benefit arrangements. It sets the compensation of the Chief Executive Officer (the “CEO”) and, with input from the CEO, establishes compensation for the other NEOs.
Our compensation philosophy envisions offering competitive total compensation and rewarding financial performance results that drive stockholder value. Through our executive compensation program, we strive to align the financial interests of our executive officers with the long-term interests of our stockholders, motivate our executive officers to achieve our strategic goals and attract and retain high performing executive officers to increase long-term and sustainable profitability, all within the parameters of prudent risk management requirements and a highly regulated industry, as well as the compensation restrictions that we have previously operated under. We believe in the concept of structuring a significant portion of the value of our executives’ total compensation in a form to motivate them to take actions that will favorably impact our long-term and sustainable profitability without creating undue risk, as well as long-term stockholder value. Our compensation program strives to offer competitive pay packages in order for us to retain our executive talent and to attract talented executives.
We believe each compensation element is important in achieving our strategic plan objectives for the compensation programs, which in turn reflect the Board’s objectives for us. Annual non-equity incentive payments should be properly structured to be paid in amounts that are dependent on financial performance relative to our performance as compared to our peer group. Equity awards in the form of restricted stock subject to long term vesting schedules serve to retain executives and keep a portion of executives’ compensation tied to the long-term value created in the Company.
Prior to the Plan of Reorganization, our executive compensation was governed by the Interim Final Rule on TARP Standards for Compensation and Corporate Governance (the “Interim Final Rule”) issued by the U.S. Treasury in June 2009 under the ARRA. We were subject to the Interim Final Rule due to our participation in the TARP CPP.
For our senior executive officers, including the NEOs, the Interim Final Rule prohibited or limited certain components of our executive compensation program, including:
| • | payment or accrual of annual and long-term incentive compensation; |
| • | granting of stock options (except for long-term restricted stock); |
| • | certain retirement benefits; and |
| • | potential payments upon termination of employment or change of control (severance payments) that the executive officers or covered employees might otherwise have been eligible to receive. |
As a result, during the nine months ended December 31, 2013, which represents the Company’s new fiscal year end, the primary means available to us for compensating NEOs and other employees covered under the Interim Final Rule were limited to cash salary, and, on a limited basis, restricted stock. Following the Effective Date, we were no longer subject to the limitations set forth by the Interim Final Rule. As a result, the Compensation Committee engaged McLagan, a management consulting firm, to assist it in the process of reevaluating our executive and Board’s compensation program based on our philosophy set forth above, including the Company’s peer group, as well as best practice elements of a comprehensive executive compensation program.
123
Table of Contents
Peer Group Review
The Compensation Committee has historically used peer group information as a general check to confirm that the compensation levels of our NEOs are generally aligned with levels of our peers. For the nine months ended December 31, 2013, our peer group included eight publicly traded bank and thrift holding companies (listed below) that range in asset size from $2.0 billion to $9.7 billion and which are engaged in similar lines of business as us. The median size of the companies in this group was $4.8 billion in assets compared to our $2.1 billion in assets as of December 31, 2013. Management provided input as to the constituents of this peer group to the Compensation Committee. The following peer group is used for comparison of compensation levels for the NEOs and for comparing our business performance to demonstrate pay-for-performance and other pay practices:
| • | Bank Mutual Corporation; |
| • | Chemical Financial Corp; |
| • | First Busey Corporation; |
| • | First Financial Bancorp; |
| • | Independent Bank Corporation; |
| • | Old National Bancorp; |
| • | Old Second Bancorp, Inc; and |
| • | Park National Corp. |
As part of the engagement of McLagan, the Compensation Committee is evaluating the current composition of our peer group.
Nine Months Ended December 31, 2013 (Company’s new fiscal year end)
The Compensation Committee evaluates the base salary of the CEO and the other NEOs each year and approves any changes to base salaries after reviewing peer group information. The Compensation Committee also noted approval of the stockholder advisory vote on executive compensation at the 2012 Annual Meeting of Stockholders and determined that no changes in the compensation process were required as a result of that vote. There was no 2013 Annual Meeting of Stockholders.
For the nine months ended December 31, 2013, our executive compensation was primarily impacted by our financial performance.
For the nine months ended December 31, 2013, the Compensation Committee took the following actions with regard to executive compensation:
| • | restored, and in certain cases, increased, the base salary for certain NEOs; |
| • | continued the suspension of any non-equity incentive plan payments for the NEOs and for other senior management; and |
| • | continued the suspension of any long-term equity incentive awards for the NEOs and for other senior management. |
The Elements of Executive Compensation
The Compensation Committee believes that an effective executive compensation program includes the following:
Short Term
Base Salary. Our objective is to pay a base salary that is competitive with that of peer companies to reward performance and to enable it to attract and retain the top talent that we need to manage its business. Base salary is set each year taking into account market compensation data, as well as the performance level of the executive
124
Table of Contents
and the competency level demonstrated in the past. Changes in base salary are market-based and typically effective in the first quarter of each year. Although we do not formally benchmark base salary amounts for NEOs and other executive officers to selected competitors or peer group averages, we believe the base salaries for the NEOs are directionally consistent and appropriately aligned with competitive norms.
Anchor Bancorp Wisconsin Inc. 2014 Omnibus Incentive Plan
Overview
On August 12, 2014, our Board approved, subject to shareholder approval, a new incentive plan, the Anchor Bancorp Wisconsin Inc. 2014 Omnibus Incentive Plan (the “2014 Plan”). The purposes of the 2014 Plan are to attract, retain, focus and motivate executives and other selected employees, directors, consultants and advisors and to increase stockholder value. The 2014 Plan provides for the grant of both equity-based and cash-based incentive compensation awards.
The 2014 Plan is intended to permit the grant of performance-based compensation within the meaning of Section 162(m) of the Code, which generally limits the annual deduction that the Company may take for compensation of its covered officers, which consist of its chief executive officer and the three other most highly compensated executive officers (other than its chief financial officer) who are serving at the end of the year. The 2014 Plan is also intended to permit the grant of incentive stock options, which are stock options that qualify for certain favorable tax treatment under Section 422 of the Code.
The following is a summary (of the material provisions) of the 2014 Plan and is qualified in its entirety by the full text of the 2014 Plan, a copy of which is included as Exhibit 10.15 to the registration statement on Form S-1 of which this prospectus forms a part.
Summary of Plan Terms
Shares Subject to the 2014 Plan
The maximum number of shares of common stock (each, a “Share”) that may be issued to participants pursuant to awards under the 2014 Plan (all of which may be granted as incentive stock options) will be equal to 600,000. Such Shares may be either authorized and unissued Shares or Shares reacquired at any time and now or hereafter held as treasury stock.
In the case of (i) a merger in which the Shares are changed or exchanged; (ii) a subdivision or combination of the Shares of the Company or the declaration of a dividend payable in shares; (iii) the declaration of a cash dividend that exceeds 10% of the fair market value of a Share at the time of the dividend; (iv) the declaration of any other dividend or distribution on the Shares in the form of cash or a repurchase of Shares that the Board determines is special or extraordinary in nature or is publicly characterized as a recapitalization or reorganization involving the Shares or (v) any other event that, in the judgment of the Committee (as defined below under “—Administration of the 2014 Plan”), requires an adjustment to prevent the dilution or enlargement of the benefits intended to be made available under the 2014 Plan, the Committee shall, in such manner as it may deem equitable to prevent dilution or enlargement of the benefits or potential benefits intended to be made available under this 2014 Plan, adjust as applicable (i) the number of Shares available for issuance under the 2014 Plan and other limits stated in the 2014 Plan, (ii) the number and type of Shares subject to outstanding awards, (iii) the grant, purchase or exercise price of any such award, or (iv) to the extent that such discretion does not cause an award intended to qualify as performance-based compensation under Section 162(m) of the Code to lose its status as such, performance goals.
With respect to incentive stock options, no adjustment may be authorized to the extent that such adjustment would cause the 2014 Plan to violate Section 422(b) of the Code. In the event of an adjustment, the number of
125
Table of Contents
Shares subject to an award payable or denominated in Shares must be a whole number. The Committee may also provide for a cash payment to the participant in exchange for the cancellation of all or a portion of the award in the event of any reorganization, merger, consolidation, combination or other similar corporate transaction or event.
The following Shares will again be available for grant under the 2014 Plan: (i) any Shares subject to an award that lapses, expires, terminates, or is cancelled without the issuance of Shares to the participant, (ii) Shares that, at the conclusion of the term of an award, are determined to be not issuable or that other compensation with respect to the shares covered by the award will not be payable on the basis that the conditions for such issuance will not be satisfied, or (iii) Shares that are forfeited under an award. Additionally, if the Company subsequently reacquires Shares issued under any award pursuant to repurchase rights reserved at the time of grant, such shares will again be available for grant under the 2014 Plan; provided, however, that Shares acquired through repurchase rights will not be issued pursuant to incentive stock options. Notwithstanding the foregoing, the Shares tendered as payment of either the exercise price of an option and/or withholding taxes in respect of an award and shares purchased by the Company using proceeds from option exercises will no longer be available for awards under the 2014 Plan.
Limits on Awards
The 2014 Plan imposes certain limits on the awards that may be granted to participants: (i) the aggregate number of Shares that may be made subject to options or stock appreciation rights granted to any participant during any fiscal year cannot exceed 100,000; (ii) the aggregate number of Shares that may be granted to any participant during the fiscal year in the form of restricted stock, restricted stock units or other stock based awards cannot exceed 100,000 Shares; (iii) the aggregate number of Shares that may be granted to any participant during any fiscal year in the form of performance shares or awards of performance units cannot exceed 100,000 and (iv) no participant can receive an award of performance units, the value of which is not based on the fair market value of Shares, annual incentive awards, long-term incentive awards or dividend equivalents that would pay more than $1,000,000 to the participant in a single fiscal year.
Eligibility For Awards
Any of the following are eligible to participate in the 2014 Plan: any officer or other employee of the Company or its affiliates; any individual that the Company or an affiliate has engaged to become an officer or employee; any consultant or advisor who provides services to the Company or its affiliates; or any director, including a non-employee director. As of the date hereof, the number of persons who would be eligible to participate in the 2014 Plan is approximately 100.
Administration of the 2014 Plan
The 2014 Plan will be administered by our Compensation Committee or such other committee of the Board as designated by Board (the “Committee”). To the extent required to comply with the requirements of Section 162(m) of the Code and Rule 16b-3 promulgated under the Exchange Act, the Committee will consist solely of two or more individuals who each qualify as an “outside director” within the meaning of Section 162(m) of the Code and a “non-employee director” within the meaning of Rule 16b-3.
The Committee has full discretionary authority to administer the 2014 Plan, including but not limited to the authority to: (i) interpret the provisions of the 2014 Plan and any underlying award agreement; (ii) prescribe, amend and rescind rules and regulations relating to the 2014 Plan; (iii) correct any defect, supply any omission, or reconcile any inconsistency in the 2014 Plan, any award or any agreement covering an award in the manner and to the extent it deems desirable to carry the 2014 Plan or such award into effect; and (iv) make all other determinations necessary or advisable for the administration of the 2014 Plan. All Committee determinations shall be made in the sole discretion of the Committee and are final and binding on all interested parties.
126
Table of Contents
The Committee may grant to any participant any type of award to any participant that it selects, except that incentive stock options may be granted only to employees. The Committee has the discretion to grant an award with any vesting condition, any vesting period or any performance period if the award is granted to a newly hired or promoted participant, or accelerate or shorten the vesting or performance period of an award in connection with a participant’s death, disability, retirement or termination by the company or an affiliate without cause or a change of control.
To the extent applicable law permits, the Committee may delegate to one or more officers of the Company any or all of their respective authority and responsibility as the administrator of the 2014 Plan, provided that no such delegation is permitted with respect to awards to participants who are subject to the requirements of Section 16 of the Exchange Act.
Types of Awards
The following types of awards may be granted under the 2014 Plan. All of the awards described below are subject to the conditions, limitations, restrictions, exercise price, vesting and forfeiture provisions determined by the Committee, in its sole discretion, subject to such limitations as are provided in the 2014 Plan. In addition, subject to the limitations provided in the 2014 Plan and in accordance with applicable law, the Committee may accelerate or defer the vesting or payment of awards, cancel or modify outstanding awards, and waive any conditions or restrictions imposed with respect to awards or the Shares issued pursuant to awards.
Options
The Committee may grant incentive stock options and non-qualified stock options, subject to the limits of the 2014 Plan. An award of an option grants a participant the right to purchase Shares at a stated price for a specified period of time. An incentive stock option is a stock option that meets the requirements of Section 422 of the Code, which generally includes requirements for among other things an exercise price of no less than 100% of fair market value on the grant date, a term of no more than ten years, and that the option be granted from a plan that has been approved by stockholders. Only employees are eligible to receive incentive stock options under the 2014 Plan. A non-qualified stock option is an option that does not meet the qualifications of an incentive stock option. The term of any option granted under the 2014 Plan may not exceed ten years from the date of grant.
The “fair market value” of Shares as of a particular date for purposes of the 2014 Plan will generally mean the closing price per Share on the national securities exchange on which the Shares are principally traded as reported in the Wall Street Journal for the last preceding date on which there was a sale of such Shares on such exchange, or, if no sale occurred on that date, on the last preceding date on which there was a sale of Shares (subject to certain exceptions set forth in 2014 Plan in the event that the shares are not traded on a national securities exchange).
Unless otherwise restricted by the Committee, the exercise price of a stock option may be paid (i) with cash or Shares already owned by the participant, (ii) with the proceeds from a sale of the Shares subject to the option or (iii) by “net exercise,” meaning that the participant receives the Shares underlying the options exercised less such number of Shares equivalent in value to the exercise price and withholding taxes resulting from the exercise of the options, or (iv) by any combination of (i) through (iii).
Stock Appreciation Rights
The Committee may grant stock appreciation rights, subject to the limits of the 2014 Plan. A stock appreciation right (“SAR”) entitles the participant to receive cash and/or Shares with a value equal to the appreciation in the value of a Share during a specified period of time. A SAR may be granted in relation to an option, in which case generally the SAR shall be exercisable or shall mature at the same time or times, on the same conditions and to
127
Table of Contents
the extent and in the proportion, that the related option is exercisable and be exercised or mature for all or part of the Shares subject to the related option. Payment to a participant upon the exercise of a SAR may be in cash, Shares or a combination thereof.
Performance and Stock Awards
The Committee may grant restricted stock and restricted stock unit awards, subject to the terms of the 2014 Plan. A restricted stock award is an award of outstanding Shares that does not vest until after a specified period of time, or satisfaction of performance goals, or satisfaction of other vesting conditions as determined by the Committee, and which may be forfeited if conditions to vesting are not met. A restricted stock unit is an award denominated in Shares that may be settled either in Shares or cash, subject to terms and conditions determined by the Committee, which may include time-based or performance-based restrictions or the satisfaction of other vesting conditions as determined by the Committee.
Incentive Awards
The Committee may grant annual incentive awards or long-term incentive awards that are payable in cash, as deemed by the Committee to be consistent with the purposes of the 2014 Plan. The payment of cash awards must be subject to the achievement of specified performance goals.
Dividend Equivalent Units
A dividend equivalent unit means the right to receive a payment, in cash or Shares, equal to the cash dividends or other distributions paid with respect to a Share. These dividend equivalent units may be subject to the satisfaction of specified performance goals. Dividend equivalent units may not be granted in tandem with a stock appreciation right or option or contain vesting provisions more favorable to the participant than the vesting conditions, if any, to which the tandem award is subject. Dividend equivalent units generally relate to a period of at least one year, unless the dividend equivalent unit is granted to a participant upon hire or promotion.
Other Stock Based Awards
The Committee may grant other stock based awards, which may be denominated or payable in, valued in whole or in part by reference to, or otherwise based on, Shares, either alone, in addition to or in conjunction with other awards. Other stock based awards may be settled in Shares or cash. Without limitation, other stock based awards may include the issuance of Shares of unrestricted stock. Other stock based awards may be subject to the satisfaction of specified performance goals.
Performance Criteria
Awards granted under the 2014 Plan may be made subject to specified performance goals. Performance goals are based on the Company’s attainment of performance measures pre-established by the Committee, in its sole discretion, based on one or more of the following:
| • | stock value or increase therein; |
| • | earnings per Share and/or earnings per Share growth; |
| • | net earnings; |
| • | earnings and/or earnings growth (before or after one or more of taxes, interest, depreciation and/or amortization); |
| • | operating profit; |
| • | operating cash flow; |
| • | operating or other expenses; |
128
Table of Contents
| • | operating efficiency; |
| • | return on equity, tangible equity, assets, capital and/or investment; |
| • | sales or revenues or growth thereof; |
| • | deposits, loan and/or equity levels or growth thereof; |
| • | working capital targets; |
| • | cost control measures; |
| • | regulatory compliance; |
| • | gross, operating or other margins; |
| • | efficiency ratio (as generally recognized and used for bank financial reporting and analysis); |
| • | interest income; |
| • | non-interest income; |
| • | credit quality; |
| • | net charge-offs and/or non-performing assets (excluding such loans or classes of loans as may be designated for exclusions); |
| • | productivity; |
| • | customer satisfaction; |
| • | satisfactory internal or external audits; |
| • | improvement of financial ratings; |
| • | achievement of balance sheet or income statement objectives or initiatives; |
| • | quality measures |
| • | achievement of strategic performance objectives or initiatives; |
| • | achievement of merger or acquisition objectives or initiatives; or |
Any component or components of the foregoing (including, without limitation, determination thereof, in the Committee’s sole discretion, with or without the effect of discontinued operations and dispositions of business units or segments, nonrecurring items, material extraordinary items that are both unusual and infrequent, non-budgeted items, special charges, accruals for acquisitions, reorganization and restructuring programs and/or changes in tax law, accounting principles or other such laws or provisions affecting the Company’s reported results), regulatory exam results, achievement of risk management objectives or implementation, management or completion of critical projects or processes.
Performance goals may be absolute in their terms or measured against or in relationship to a pre-established target, the Company’s budget or budgeted results, previous period results, a market index, a designated comparison group of other companies comparably, similarly or otherwise situated, or any combination thereof. To the extent permitted under Section 162(m) of the Code or to the extent that an award is not intended to qualify as “performance-based compensation” under Section 162(m) of the Code, the Committee, in its sole discretion, may establish other performance goals and provide for other exclusions or adjustments not listed in the 2014 Plan. Performance goals may include a threshold level of performance below which no award will be earned, a level of performance at which the target amount of an award will be earned and a level of performance at which the maximum amount of the award will be earned. The Committee, in its sole discretion, to the extent permitted by Section 162(m) of the Code, may adjust any evaluation of performance under a Performance Goal to take into account any of the following events that occurs during a performance period: (i) asset write-downs, (ii) litigation or claim judgments or settlements, (iii) the effect of changes in tax law, accounting principles or other such laws
129
Table of Contents
or provisions affecting reported results, (iv) accruals for reorganization and restructuring programs, and (v) any extraordinary non-recurring items as described in Accounting Standards Codification 225-20 (or in any replacement or modification thereof) and/or in a management’s discussion and analysis of financial condition and results of operations appearing in the Company’s annual report to stockholders, if any, for the applicable year.
Change of Control
The 2014 Plan provides that, except as otherwise set forth in a participant’s award agreement or (if applicable and more favorable) employment agreement , immediately prior to a change of control of the Company: (i) each option, stock appreciation right, restricted stock award, and restricted stock unit award will become fully vested, exercisable and free of restrictions, (ii) all earned but not yet paid performance awards shall be paid, (iii) all performance awards for which the performance period has not expired shall be cancelled in exchange for a cash payment equal to the amount payable if the performance goals were to continue to be achieved at the same rate through the end of the performance period, (iv) all unvested dividend equivalent units shall vest and be paid in cash and (v) all other unvested awards shall vest, and if an amount is payable under such vested award, such amount shall be paid in cash. Unless otherwise determined by the Board or Committee, each option and SAR will be cancelled in exchange for a cash payment equal to the excess of the consideration paid per Share in the change of control over the purchase price (if any) per Share subject to the award, multiplied by the number of Shares subject to the award.
To the extent the treatment of an award under the 2014 Plan upon a change of control would give result in “golden parachute” excise taxes, the value of the award would be reduced if doing so would cause the award not to be subject to such taxes and the participant would realize more value on an after-tax basis if such a reduction were effected.
Assignability
Except in specific circumstances described in the 2014 Plan, awards granted under the 2014 Plan may not be sold, assigned, mortgaged, pledged, exchanged, hypothecated or otherwise transferred, or encumbered or disposed of in any manner other than by will or the laws of descent and distribution.
Amendment and Termination
The 2014 Plan and any award may be amended, suspended or terminated at any time by the Board, provided that no amendment will be made without stockholder approval if such shareholder approval is required in order to comply with Section 16 of the Exchange Act, the Code, the listing requirements of any principal securities exchange on which the Shares are traded or any other applicable law. Moreover, stockholder approval is required to materially increase the number of Shares reserved for issuance under the 2014 Plan, increase the limits on awards described above (except for permitted equitable adjustments), or reduce the exercise price of outstanding stock options or SARs.
Except as may be required to comply with applicable tax law, no termination, suspension or amendment of the 2014 Plan may adversely affect the right of any participant with respect to a previously granted award without the participant’s written consent. Notwithstanding anything to the contrary in an award agreement, the Committee has the power and authority to terminate or cause a participant to forfeit an award or disgorge to the Company any gains attributable to the award if the participant is terminated for cause or breaches any award agreement or other agreement between the participant and the Company concerning noncompetition, nonsolicitation, confidentiality, trade secrets, intellectual property, nondisparagement or similar obligations.
Awards under the 2014 Plan Benefits
On August 15, 2014, the Committee awarded 195,900 Shares of the 600,000 Shares authorized under the 2014 Plan to approximately 100 participants, of which 100,500 share of restricted stock were awarded to our named
130
Table of Contents
executive officers and 6,000 Shares were awarded to our directors. Chris M. Bauer received 37,500 shares of restricted stock that vest in three equal installments beginning on December 31, 2014 and each anniversary thereafter . Thomas G. Dolan, Martha M. Hayes and Scott McBrair each received 18,000 shares of restricted stock that vest in three equal installments beginning on March 31, 2015 and each anniversary thereafter. Mark Timmerman received 9,000 shares of restricted stock that vest in three equal installments beginning on March 31, 2015 and each anniversary thereafter. William T. James received 1,500 shares of restricted stock that vest in three equal installments beginning on March 31, 2015 and each anniversary thereafter. Finally, each director received 1,000 shares of restricted stock that vest on March 31, 2015.
Awards under the 2014 Plan will be made in the discretion of the Committee and thus neither the recipients of any awards nor their terms are determinable at this time.
U.S. Federal Income Tax Consequences of 2014 Plan Awards
The following is a brief summary of the principal United States federal income tax consequences of awards under the 2014 Plan based on current United States federal income tax laws. To the extent required by law, the Company will withhold from any amount paid in settlement of an award amounts of withholding and other taxes due or take other action as the Company deems advisable to enable the Company and the participant to satisfy withholding and tax obligations related to any awards.
This summary is not intended to be exhaustive, does not constitute tax advice and, among other things, does not describe state, local or foreign tax consequences, which may be substantially different.
Non-Qualified Stock Options
Generally, a participant will not recognize taxable income on the grant or vesting of a non-qualified stock option. Upon the exercise of a non-qualified stock option, a participant will recognize ordinary income in an amount equal to the difference between the fair market value of our Shares received on the date of exercise and the option cost (number of Shares purchased multiplied by the exercise price per share). The Company will ordinarily be entitled to a deduction on the exercise date equal to the ordinary income recognized by the participant upon exercise.
Incentive Stock Options
No taxable income is recognized by a participant on the grant or vesting of an incentive stock option. If a participant exercises an incentive stock option in accordance with its terms and does not dispose of the Shares acquired within two years after the date of the grant of the incentive stock option or within one year after the date of exercise, the participant will be entitled to treat any gain related to the exercise of the incentive stock option as capital gain (instead of ordinary income). In this case, the Company will not be entitled to a deduction by reason of the grant or exercise of the incentive stock option; however, the excess of the fair market value over the exercise price of the Shares acquired is an item of adjustment in computing alternative minimum tax of the participant. If a participant holds the shares acquired for at least one year from the exercise date and does not sell or otherwise dispose of the shares for at least two years from the grant date, the participant’s gain or loss upon a subsequent sale will be long-term capital gain or loss equal to the difference between the amount realized on the sale and the participant’s basis in the shares acquired. If a participant sells or otherwise disposes of the shares acquired without satisfying the required minimum holding period, such “disqualifying disposition” will give rise to ordinary income equal to the excess of the fair market value of the Shares acquired on the exercise date (or, if less, the amount realized upon disqualifying disposition) over the participant’s tax basis in the Shares acquired. The Company will ordinarily be entitled to a deduction equal to the amount of the ordinary income resulting from a disqualifying disposition.
Stock Appreciation Rights
Generally, a participant will not recognize taxable income upon the grant or vesting of a SAR, but will recognize ordinary income upon the exercise of a SAR in an amount equal to the cash amount received upon exercise (if
131
Table of Contents
the SAR is cash-settled) or the difference between the fair market value of our Shares received from the exercise of the SAR and the exercise price of the SAR. The participant’s basis in the shares will be equal to the ordinary income attributable to the exercise. The participant’s holding period for shares acquired pursuant to the exercise of a SAR begins on the exercise date. Upon the exercise of a SAR, the Company will ordinarily be entitled to a deduction in the amount of the ordinary income recognized by the participant.
Restricted Stock
A participant generally will not be taxed at the time of a restricted stock award but will recognize taxable income when the award vests or otherwise is no longer subject to a substantial risk of forfeiture. The amount of taxable income will be the fair market value of the Shares at that time.
Participants may elect to be taxed at the time of grant by making an election under Section 83(b) of the Code within 30 days of the award date. If a restricted stock award subject to the Section 83(b) election is subsequently canceled, no deduction will be allowed for the amount previously recognized as income, and no tax previously paid will be refunded. Unless a participant makes a Section 83(b) election, dividends paid to a participant in respect of an unvested restricted stock award will be taxable to the participant as ordinary income. If the participant made a Section 83(b) election, the dividends will be taxable to the participant as dividend income.
The Company will ordinarily be entitled to a deduction at the same time and in the same amounts as the ordinary income recognized by the participant. Unless a participant has made a Section 83(b) election, the Company will also be entitled to a deduction for dividends paid on unvested restricted stock awards.
Restricted Stock Units
A participant will generally not recognize taxable income on a restricted stock unit award until Shares subject to the award are distributed. The amount of this ordinary income will be the fair market value of our Shares on the date of distribution. Any dividend equivalents paid on unvested deferred share awards are taxable as ordinary income when paid to the participant.
The Company will ordinarily be entitled to a deduction at the same time and in the same amounts as the ordinary income recognized by the participant. The Company will also be entitled to a deduction on any dividend equivalent payments made to the participant.
Share Awards
A participant will generally recognize taxable income on the grant of unrestricted stock in an amount equal to the fair market value of the Shares on the grant date. The Company will ordinarily be entitled to a deduction at the same time and in the same amounts as the ordinary income recognized by the participant.
Incentive Awards
A participant will generally recognize taxable income upon the payment of a cash award in an amount equal to the amount of the cash received. The Company will ordinarily be entitled to a deduction at the same time and in the same amounts as the ordinary income recognized by the participant.
Retirement Plans
All of the NEOs participate in the 401(k) Plan. The Bank reinstated the employer matching contributions of our 401(k) Plan as of January 1, 2013.
Perquisites
Historically, we provided the NEOs with perquisites and other personal benefits that we believe are reasonable relative to our peer group and consistent with our overall compensation program so as to better enable us to
132
Table of Contents
attract and retain superior employees for key positions. This approach has changed in recent years and all perquisites have been discontinued, except as contractually required. The incremental costs to us of providing these perquisites and other personal benefits to the NEOs for the nine months ended December 31, 2013 are included in the Summary Compensation Table under the “All Other Compensation” column.
Employment Agreements and Change in Control Agreements
We are currently party to employment agreements or arrangements with our NEOs. These agreements or arrangements with the NEOs are customary in the banking industry and for public companies in general and we believe they are important for gaining assurances that the primary individuals responsible for leading us remain committed to us. Ms. Hayes and Messrs. Bauer, Dolan, McBrair, James and Timmerman executed employment agreements on September 5, 2014.
We are party to severance agreements with certain other non-executive officers, which provide for certain financial protection in the event of termination of employment following a change in control. We believe these agreements are important from both a retention standpoint as well as to provide us with some degree of assurance that executives will remain focused on operating our business and insuring a smooth transition in the event of a change-in-control despite personal uncertainty and disruption arising from the circumstances.
Employment Agreements
All of our NEOs’ employment agreements or arrangements are subject to the restrictions pertaining to executive compensation contained in the Interim Final Rule and ARRA and any amendments thereto or regulations promulgated thereunder, as well as customary non-disclosure, non-disparagement and similar provisions. As part of the McLagan engagement, the Compensation Committee is evaluating its approach with respect to the use of employment agreements going forward as a means of creating the proper incentive to focus executives on achieving long-term value for our stockholders and to serve as a key employee retention tool.
Chris M. Bauer
Chris M. Bauer has been retained as our President and Chief Executive Officer and Chief Executive Officer of the Bank since 2009. On September 5, 2014, we and the Bank entered into a three year employment agreement, retaining Mr. Bauer as President and Chief Executive Officer of each of us and the Bank through September 5, 2017. The employment agreement provides for a salary of $500,000 per year. As consideration for entering into the employment agreement, Mr. Bauer is entitled to receive a one-time signing bonus of $100,000. If Mr. Bauer voluntarily resigns, he is required to provide the Bank with thirty days advance written notice. If he resigns, he will be entitled to receive only his base salary and benefits as accrued through the effective date of such resignation and will forfeit any unpaid bonuses and any unaccrued or nonvested benefits. Upon termination of employment for cause, Mr. Bauer is entitled to receive only compensation or benefits accrued prior to his termination date. Upon termination of employment other than for cause, death or disability. Mr. Bauer is entitled to receive, (i) the award of restricted stock granted under the Anchor BanCorp Wisconsin Inc. 2014 Omnibus Incentive Plan, (ii) compensation or benefits accrued prior to his termination date, (iii) an amount equal to two times the aggregate of (x) the then current base salary per annum and (y) Mr. Bauer’s target annual bonus payout value for the calendar year in which Mr. Bauer’s employment terminates and (iv) payment or reimbursement of monthly premiums for COBRA continuation coverage for Mr. Bauer and the members of his family who are qualified beneficiaries for eighteen months following his employment termination date. If the OCC or FDIC requires Mr. Bauer’s agreement to be terminated, all our obligations and obligations of the Bank shall be terminated, except with respect to any previously vested rights. If the OCC or FDIC requires Mr. Bauer’s agreement to be suspended, our obligations and the Bank’s obligations shall be suspended; provided that if the suspension is lifted or charges dismissed, Mr. Bauer shall receive all compensation withheld during the suspension.
In the event of a change in control, Mr. Bauer’s employment agreement, other than Appendix A, shall lapse and the provisions of Appendix A will apply in its place. Under Appendix A, Mr. Bauer will enter into a new, three
133
Table of Contents
year term of employment commencing on the date of a change in control. Appendix A provides that Mr. Bauer will receive (i) an annual base salary of not less than twelve times his highest monthly base salary for the twelve-month period immediately preceding the month in which the change in control occurs, (ii) the immediate vesting of any restricted stock, (iii) the immediate vesting of any stock options, (iv) the payment of any performance awards granted to him pursuant to the long-term incentive plan, on a pro rated basis and (v) an amount equal to his annual incentive target bonus for the fiscal year in which the change in control occurs. In the event that his employment is terminated during the three year period following a change in control, he will receive (i) three times the sum of (x) his annual base salary plus (y) his annual incentive bonus, (ii) outplacement services, to be provided by a nationally recognized executive placement firm, until the end of the first calendar year following the calendar year in which the termination occurs, provided that the cost shall not exceed 5% of his annual base salary (iii) life insurance, medical and dental coverage for the duration of the three year period following a change in control, or until he becomes covered under new employment and (iv) the immediate vesting of any benefits under his retirement plans that include vesting provisions to the extent permitted without jeopardizing the tax-qualified status or legal compliance of such plans.
Thomas Dolan
Thomas Dolan is our Executive Vice President and Chief Operating Officer and the Bank’s Executive Vice President and Chief Operating Officer. Effective September 3, 2014, we and the Bank entered into a two year employment agreement, replacing the ongoing terms of a prior arrangement. Mr. Dolan will receive a salary of $350,000 per year. Upon termination of employment for cause, or due to Mr. Dolan voluntarily terminating his employment other than for good reason, Mr. Dolan is entitled to receive only accrued benefits. Upon termination of employment without cause or by Mr. Dolan for good reason (as defined in the employment agreement), (i) the award of restricted stock under the Anchor Bancorp Wisconsin Inc. 2014 Omnibus Incentive Plan will become fully vested upon the effective date of Mr. Dolan’s termination of employment, (ii) he will receive an amount equal to the aggregate of (x) Mr. Dolan’s then current base salary per annum and (y) Mr. Dolan’s target annual bonus payout value for the calendar year in which Mr. Dolan’s employment terminates, and (iii) he will also be entitled to payment or reimbursement of monthly premiums for COBRA continuation coverage for Mr. Dolan and the members of his family who are qualified beneficiaries for eighteen months following his employment termination date. If the OCC or FDIC requires Mr. Dolan’s agreement to be terminated, all of our obligations and the obligations of the Bank shall be terminated, except with respect to any previously vested rights. If the OCC or FDIC requires Mr. Dolan’s agreement to be suspended, our obligations and the Bank’s obligations shall be suspended; provided that if the suspension is lifted or charges dismissed, Mr. Dolan shall receive all compensation withheld during the suspension.
In the event of a change in control, Mr. Dolan will continue to be employed for a period of two years from the date of the change in control. During this period Mr. Dolan will receive (i) an annual base salary of not less than twelve times his highest monthly base salary for the twelve-month period immediately preceding the month in which the change in control occurs, (ii) the immediate vesting of any restricted stock, (iii) the immediate vesting of any stock options, (iv) the payment of any performance awards granted to him pursuant to the long-term incentive plan, on a pro rated basis and (v) an amount equal to his annual incentive target bonus for the fiscal year in which the change in control occurs. In the event that his employment is terminated during the two year period following a change in control, he will receive (i) two times the sum of (x) his annual base salary plus (y) his annual incentive bonus, (ii) outplacement services, to be provided by a nationally recognized executive placement firm, until the end of the first calendar year following the calendar year in which the termination occurs, provided that the cost shall not exceed 5% of his annual base salary (iii) life insurance, medical and dental coverage for the duration of the three year period following a change in control, or until he becomes covered under new employment and (iv) the immediate vesting of any benefits under his retirement plans that include vesting provisions to the extent permitted without jeopardizing the tax-qualified status or legal compliance of such plans.
Martha M. Hayes
Martha M. Hayes is the Bank’s Executive Vice President—Chief Risk Officer. Effective September 5, 2014, we and the Bank entered into a two year employment agreement, replacing the ongoing terms of a prior arrangement.
134
Table of Contents
Ms. Hayes will receive a salary of $330,000 per year. Upon termination of employment for cause, or due to Ms. Hayes voluntarily terminating her employment other than for good reason (as defined in the employment agreement), Ms. Hayes is entitled to receive only accrued benefits. Upon termination of employment without cause or by Ms. Hayes for good reason, (i) the award of restricted stock under the Anchor Bancorp Wisconsin Inc. 2014 Omnibus Incentive Plan will become fully vested upon the effective date of Ms. Hayes’ termination of employment, (ii) she will receive an amount equal to the aggregate of (x) Ms. Hayes’ then current base salary per annum and (y) Ms. Hayes’ target annual bonus payout value for the calendar year in which Ms. Hayes’ employment terminates, and (iii) she will also be entitled to payment or reimbursement of monthly premiums for COBRA continuation coverage for Ms. Hayes and the members of her family who are qualified beneficiaries for eighteen months following her employment termination date. If the OCC or FDIC requires Ms. Hayes’ agreement to be terminated, all of our obligations and the obligations of the Bank shall be terminated, except with respect to any previously vested rights. If the OCC or FDIC requires Ms. Hayes’ agreement to be suspended, our obligations and the Bank’s obligations shall be suspended; provided that if the suspension is lifted or charges dismissed, Ms. Hayes shall receive all compensation withheld during the suspension.
In the event of a change in control, Ms. Hayes will continue to be employed for a period of two years from the date of the change in control. During this period, Ms. Hayes will receive (i) an annual base salary of not less than twelve times her highest monthly base salary for the twelve-month period immediately preceding the month in which the change in control occurs, (ii) the immediate vesting of any restricted stock, (iii) the immediate vesting of any stock options, (iv) the payment of any performance awards granted to her pursuant to the long-term incentive plan, on a pro rated basis and (v) an amount equal to her annual incentive target bonus for the fiscal year in which the change in control occurs. In the event that her employment is terminated during the two year period following a change in control, she will receive (i) two times the sum of (x) her annual base salary plus (y) her annual incentive bonus, (ii) outplacement services, to be provided by a nationally recognized executive placement firm, until the end of the first calendar year following the calendar year in which the termination occurs, provided that the cost shall not exceed 5% of her annual base salary (iii) life insurance, medical and dental coverage for the duration of the three year period following a change in control, or until she becomes covered under new employment and (iv) the immediate vesting of any benefits under her retirement plans that include vesting provisions to the extent permitted without jeopardizing the tax-qualified status or legal compliance of such plans.
William T. James
William T. James is the Senior Vice President, Chief Financial Officer and Treasurer of the Company and the Bank. Effective September 3, 2014, we and the Bank entered into a two year employment agreement, replacing the ongoing terms of a prior arrangement. Mr. James will receive a salary of $160,000 per year. Upon termination of employment for cause, or due to Mr. James voluntarily terminating his employment other than for good reason (as defined in the employment agreement), Mr. James is entitled to receive only accrued benefits. Upon termination of employment without cause or by Mr. James for good reason, (i) the award of restricted stock under the Anchor Bancorp Wisconsin Inc. 2014 Omnibus Incentive Plan will become fully vested upon the effective date of Mr. James’s termination of employment, (ii) he will receive an amount equal to the aggregate of (x) Mr. James’s then current base salary per annum and (y) Mr. James’s target annual bonus payout value for the calendar year in which Mr. James’s employment terminates, and (iii) he will also be entitled to payment or reimbursement of monthly premiums for COBRA continuation coverage for Mr. James and the members of his family who are qualified beneficiaries for eighteen months following her employment termination date. If the OCC or FDIC requires Mr. James’s agreement to be terminated, all of our obligations and the obligations of the Bank shall be terminated, except with respect to any previously vested rights. If the OCC or FDIC requires Mr. James’s agreement to be suspended, our obligations and the Bank’s obligations shall be suspended; provided that if the suspension is lifted or charges dismissed, Mr. James shall receive all compensation withheld during the suspension.
In the event of a change in control, Mr. James will continue to be employed for a period of two years from the date of the change in control. During this period, Mr. James will receive (i) an annual base salary of not less than
135
Table of Contents
twelve times his highest monthly base salary for the twelve-month period immediately preceding the month in which the change in control occurs, (ii) the immediate vesting of any restricted stock, (iii) the immediate vesting of any stock options, (iv) the payment of any performance awards granted to him pursuant to the long-term incentive plan, on a pro rated basis and (v) an amount equal to his annual incentive target bonus for the fiscal year in which the change in control occurs. In the event that his employment is terminated during the two year period following a change in control, he will receive (i) two times the sum of (x) his annual base salary plus (y) his annual incentive bonus, (ii) outplacement services, to be provided by a nationally recognized executive placement firm, until the end of the first calendar year following the calendar year in which the termination occurs, provided that the cost shall not exceed 5% of his annual base salary (iii) life insurance, medical and dental coverage for the duration of the three year period following a change in control, or until he becomes covered under new employment and (iv) the immediate vesting of any benefits under his retirement plans that include vesting provisions to the extent permitted without jeopardizing the tax-qualified status or legal compliance of such plans.
Scott M. McBrair
Scott M. McBrair is the Bank’s Executive Vice President—Retail Banking. Effective September 5, 2014, we and the Bank entered into a two year employment agreement, replacing the ongoing terms of a prior arrangement. Mr. McBrair will receive a salary of $330,000 per year. Upon termination of employment for cause, or due to Mr. McBrair voluntarily terminating his employment other than for good reason (as defined in the employment agreement), Mr. McBrair is entitled to receive only accrued benefits. Upon termination of employment without cause or by Mr. McBrair for good reason, (i) the award of restricted stock under the Anchor Bancorp Wisconsin Inc. 2014 Omnibus Incentive Plan will become fully vested upon the effective date of Mr. McBrair’s termination of employment, (ii) he will receive an amount equal to the aggregate of (x) Mr. McBrair’s then current base salary per annum and (y) Mr. McBrair’s target annual bonus payout value for the calendar year in which Mr. McBrair’s employment terminates, and (iii) he will also be entitled to payment or reimbursement of monthly premiums for COBRA continuation coverage for Mr. McBrair and the members of his family who are qualified beneficiaries for eighteen months following her employment termination date. If the OCC or FDIC requires Mr. McBrair’s agreement to be terminated, all of our obligations and the obligations of the Bank shall be terminated, except with respect to any previously vested rights. If the OCC or FDIC requires Mr. McBrair’s agreement to be suspended, our obligations and the Bank’s obligations shall be suspended; provided that if the suspension is lifted or charges dismissed, Mr. McBrair shall receive all compensation withheld during the suspension.
In the event of a change in control, Mr. McBrair will continue to be employed for a period of two years from the date of the change in control. During this period, Mr. McBrair will receive (i) an annual base salary of not less than twelve times his highest monthly base salary for the twelve-month period immediately preceding the month in which the change in control occurs, (ii) the immediate vesting of any restricted stock, (iii) the immediate vesting of any stock options, (iv) the payment of any performance awards granted to him pursuant to the long-term incentive plan, on a pro rated basis and (v) an amount equal to his annual incentive target bonus for the fiscal year in which the change in control occurs. In the event that his employment is terminated during the two year period following a change in control, he will receive (i) two times the sum of (x) his annual base salary plus (y) his annual incentive bonus, (ii) outplacement services, to be provided by a nationally recognized executive placement firm, until the end of the first calendar year following the calendar year in which the termination occurs, provided that the cost shall not exceed 5% of his annual base salary (iii) life insurance, medical and dental coverage for the duration of the three year period following a change in control, or until he becomes covered under new employment and (iv) the immediate vesting of any benefits under his retirement plans that include vesting provisions to the extent permitted without jeopardizing the tax-qualified status or legal compliance of such plans.
136
Table of Contents
Mark D. Timmerman
Mark D. Timmerman is our Secretary and Executive Vice President—General Counsel and the Bank’s Secretary and Executive Vice President—General Counsel. Effective September 5, 2014, we and the Bank entered into a two year employment agreement, replacing the ongoing terms of a prior arrangement. Mr. Timmerman will receive a salary of $200,000 per year. Upon termination of employment for cause, or due to Mr. Timmerman voluntarily terminating his employment other than for good reason (as defined in the employment agreement), Mr. Timmerman is entitled to receive only accrued benefits. Upon termination of employment without cause or by Mr. Timmerman for good reason, (i) the award of restricted stock under the Anchor Bancorp Wisconsin Inc. 2014 Omnibus Incentive Plan will become fully vested upon the effective date of Mr. Timmerman’s termination of employment, (ii) he will receive an amount equal to the aggregate of (x) Mr. Timmerman’s then current base salary per annum and (y) Mr. Timmerman’s target annual bonus payout value for the calendar year in which Mr. Timmerman’s employment terminates, and (iii) he will also be entitled to payment or reimbursement of monthly premiums for COBRA continuation coverage for Mr. Timmerman and the members of his family who are qualified beneficiaries for eighteen months following her employment termination date. If the OCC or FDIC requires Mr. Timmerman’s agreement to be terminated, all of our obligations and the obligations of the Bank shall be terminated, except with respect to any previously vested rights. If the OCC or FDIC requires Mr. Timmerman’s agreement to be suspended, our obligations and the Bank’s obligations shall be suspended; provided that if the suspension is lifted or charges dismissed, Mr. Timmerman shall receive all compensation withheld during the suspension.
In the event of a change in control, Mr. Timmerman will continue to be employed for a period of two years from the date of the change in control. During this period Mr. Timmerman will receive (i) an annual base salary of not less than twelve times his highest monthly base salary for the twelve-month period immediately preceding the month in which the change in control occurs, (ii) the immediate vesting of any restricted stock, (iii) the immediate vesting of any stock options, (iv) the payment of any performance awards granted to him pursuant to the long-term incentive plan, on a pro rated basis and (v) an amount equal to his annual incentive target bonus for the fiscal year in which the change in control occurs. In the event that his employment is terminated during the two year period following a change in control, he will receive (i) two times the sum of (x) his annual base salary plus (y) his annual incentive bonus, (ii) outplacement services, to be provided by a nationally recognized executive placement firm, until the end of the first calendar year following the calendar year in which the termination occurs, provided that the cost shall not exceed 5% of his annual base salary (iii) life insurance, medical and dental coverage for the duration of the three year period following a change in control, or until he becomes covered under new employment and (iv) the immediate vesting of any benefits under his retirement plans that include vesting provisions to the extent permitted without jeopardizing the tax-qualified status or legal compliance of such plans.
Security Ownership Guidelines
The Compensation Committee has not established any stock ownership guidelines for the NEOs and other senior officers, or for our outside directors.
137
Table of Contents
Executive Compensation
The following table sets forth a summary of certain information concerning the compensation awarded to or paid by us or our subsidiaries for services rendered in all capacities during the last fiscal year to our principal executive officer and our principal financial officer as well as our three other highest compensated executive officers (the “named executive officer(s)” or “NEO(s)”). On the Effective Date, pursuant to the Plan of Reorganization, all shares of the outstanding Legacy Common Stock, including shares held as treasury stock and in any stock incentive plans, were cancelled for no consideration.
SUMMARY COMPENSATION TABLE(1)
| Name and Principal Position |
Year | Salary ($) |
Stock Awards ($)(2) |
All Other Compensation ($)(4) |
Total ($) |
|||||||||||||||
| Chris M. Bauer |
Dec-13 | $ | 500,000 | $ | — | $ | 13,542 | $ | 513,542 | |||||||||||
| President and Chief Executive Officer of the Company and the Bank |
Mar-13 | $ | 615,000 | $ | — | $ | 17,384 | $ | 632,384 | |||||||||||
| Thomas G. Dolan(3) |
Dec-13 | $ | 303,500 | $ | — | $ | 509 | $ | 304,009 | |||||||||||
| Executive Vice President, Chief Operating Officer of the Company and the Bank |
Mar-13 | $ | 358,750 | $ | — | $ | 454 | $ | 359,204 | |||||||||||
| Mark D. Timmerman |
Dec-13 | $ | 180,000 | $ | — | $ | 5,692 | $ | 185,692 | |||||||||||
| Executive Vice President, Secretary, General Counsel of the Company and the Bank |
Mar-13 | $ | 267,500 | $ | 51,793 | $ | 2,440 | $ | 321,733 | |||||||||||
| Martha M. Hayes |
Dec-13 | $ | 313,500 | $ | — | $ | 5,080 | $ | 318,580 | |||||||||||
| Executive Vice President—Chief Risk Officer of the Bank |
Mar-13 | $ | 400,500 | $ | — | $ | 3,743 | $ | 404,243 | |||||||||||
| Scott M. McBrair |
Dec-13 | $ | 303,500 | $ | — | $ | 5,360 | $ | 308,860 | |||||||||||
| Executive Vice President—Retail Banking of the Bank |
Mar-13 | $ | 358,750 | $ | — | $ | 3,231 | $ | 361,981 | |||||||||||
| (1) | On December 18, 2013, the Board approved a change in the Company’s fiscal year end from March 31 to December 31. Compensation and benefit totals herein reflect nine months ended December 31, 2013 and fiscal year ended March 31, 2013. |
| (2) | Reflects the dollar amounts recognized for financial statement reporting purposes in accordance with FASB ASC Topic 718, of restricted stock awarded under our 2004 Equity Incentive Plan and thus may include amounts from awards granted in and prior to 2007. The assumptions used in the calculation of these amounts are included in the notes to the audited consolidated financial statements included elsewhere in this prospectus. Market value of shares vesting during the fiscal year ended March 31, 2013 was $6,715 for Mr. Timmerman. |
| (3) | Effective September 3, 2014, the Board appointed Mr. Dolan as Executive Vice President and Chief Operating Officer of the Company and the Bank. Mr. William T. James has also been appointed as Senior Vice President, Chief Financial Officer and Treasurer of the Company and the Bank. |
138
Table of Contents
| (4) | The amounts listed as “All Other Compensation” in the “Summary Compensation Table” above include Company contributions to the AnchorBank 401(k) Plan, dividends paid on restricted stock, directors fees received from the Company and/or the Bank, Company contributions to non-qualified deferred compensation plans, life insurance premiums paid by the Company and the imputed personal use of Company-owned vehicles, if applicable, which are listed in the table below: |
| Year | Company Matching Contribution to 401(k) Plan |
Life Insurance Premiums |
Imputed Personal Use of Company- Owned Vehicles |
Total | ||||||||||||||||
| Chris M. Bauer |
Dec-13 | $ | 3,128 | $ | 674 | $ | 9,740 | $ | 13,542 | |||||||||||
| Mar-13 | $ | 4,522 | $ | 861 | $ | 12,001 | $ | 17,384 | ||||||||||||
| Thomas G. Dolan(1) |
Dec-13 | $ | — | $ | 509 | $ | — | $ | 509 | |||||||||||
| Mar-13 | $ | — | $ | 454 | $ | — | $ | 587 | ||||||||||||
| Mark D. Timmerman |
Dec-13 | $ | 5,356 | $ | 336 | $ | — | $ | 5,692 | |||||||||||
| Mar-13 | $ | 1,844 | $ | 596 | $ | — | $ | 2,440 | ||||||||||||
| Martha M. Hayes |
Dec-13 | $ | 4,622 | $ | 458 | $ | — | $ | 5,080 | |||||||||||
| Mar-13 | $ | 3,028 | $ | 715 | $ | — | $ | 3,743 | ||||||||||||
| Scott M. McBrair |
Dec-13 | $ | 4,959 | $ | 401 | $ | — | $ | 5,360 | |||||||||||
| Mar-13 | $ | 2,691 | $ | 540 | $ | — | $ | 3,231 | ||||||||||||
| (1) | Effective September 3, 2014, the Board appointed Mr. Dolan as Executive Vice President and Chief Operating Officer of the Company and the Bank. Mr. William T. James has also been appointed as Senior Vice President, Chief Financial Officer and Treasurer of the Company and the Bank. |
Outstanding Equity Awards At Fiscal Year-End
The following table sets forth information concerning outstanding equity awards held by each NEO as of December 31, 2013. In connection with the Plan of Reorganization, all securities owned pursuant to such equity awards were cancelled.
| Options Awards | Stock Awards | |||||||||||||||||||
| Name |
Number of Securities Underlying Unexercised Options Exercisable (#) |
Option Exercise Price ($) |
Option Expiration Date |
Number of Shares or Units of Stock That Have Not Vested (#) |
Market Value of Shares or Units of Stock That Have Not Vested ($) |
|||||||||||||||
| Chris M. Bauer |
— | — | — | — | — | |||||||||||||||
| Thomas G. Dolan |
— | — | — | — | — | |||||||||||||||
| Mark D. Timmerman |
— | — | — | — | — | |||||||||||||||
| Martha M. Hayes |
— | — | — | — | — | |||||||||||||||
| Scott M. McBrair |
— | — | — | — | — | |||||||||||||||
139
Table of Contents
Option Exercises And Stock-Vested
The following table sets forth certain information with respect to stock options exercised and restricted stock awards vested for the NEOs during the nine-months ended December 31, 2013.
| Options Awards | Stock Awards | |||||||||||||||
| Name |
Number of Shares Acquired on Exercise (#) |
Value Realized On Exercise ($) |
Number of Shares Acquired on Vesting (#) |
Value Realized On Vesting ($) |
||||||||||||
| Chris M. Bauer |
— | $ | — | — | $ | — | ||||||||||
| Thomas G. Dolan |
— | $ | — | — | $ | — | ||||||||||
| Mark D. Timmerman |
— | $ | — | — | $ | — | ||||||||||
| Martha M. Hayes |
— | $ | — | — | $ | — | ||||||||||
| Scott McBrair |
— | $ | — | — | $ | — | ||||||||||
Non-Qualified Deferred Compensation
The following table sets forth information concerning the Excess Benefit Plan and the Deferred Compensation Plan.
| Name |
Executive Contributions in Last FY ($) |
Registrant Contributions in Last FY ($) |
Aggregate Earnings in Last FY ($) |
Aggregate Withdrawals/ Distributions in Last FY ($) |
Aggregate Balance at Last FYE ($) |
|||||||||||||||
| Chris M. Bauer |
$ | — | $ | — | $ | — | $ | — | $ | — | ||||||||||
| Thomas G. Dolan |
— | — | — | — | — | |||||||||||||||
| Mark D. Timmerman |
— | — | — | — | — | |||||||||||||||
| Martha M. Hayes |
— | — | — | — | — | |||||||||||||||
| Scott McBrair |
— | — | — | — | — | |||||||||||||||
140
Table of Contents
Termination and Change in Control Payments and Benefits
The following table describes the potential payments to the NEOs upon an assumed termination of employment or a change in control as of December 31, 2013. Mr. Bauer’s employment contract, the terms of which we continue to comply with, required compliance with the provisions of EESA and ARRA, which nullified the payment of certain benefits. Pursuant to the C&D Orders, there are restrictions on the ability of the Bank or Company to make any golden parachute payment or any prohibited indemnification payment as those terms are defined in applicable regulations.
| Chris M. Bauer |
Thomas G. Dolan(4) |
Mark D. Timmerman |
Martha M. Hayes |
Scott M. McBrair |
||||||||||||||||
| Disability |
||||||||||||||||||||
| Base Salary |
— | — | — | — | — | |||||||||||||||
| Incentive Compensation |
— | — | — | — | — | |||||||||||||||
| Early Vesting of Restricted Shares |
— | — | — | — | — | |||||||||||||||
| Accrued and Unused Vacation |
$ | 45,879 | $ | 52,046 | $ | 55,382 | $ | 34,621 | $ | 37,612 | ||||||||||
| Other Benefits(1) |
— | — | — | — | — | |||||||||||||||
|
|
|
|
|
|
|
|
|
|
|
|||||||||||
| Total(2) |
$ | 45,879 | $ | 52,046 | $ | 55,382 | $ | 34,621 | $ | 37,612 | ||||||||||
|
|
|
|
|
|
|
|
|
|
|
|||||||||||
| Death(3) |
||||||||||||||||||||
| Base Salary |
— | — | — | — | — | |||||||||||||||
| Incentive Compensation |
— | — | — | — | — | |||||||||||||||
| Early Vesting of Restricted Shares |
— | — | — | — | — | |||||||||||||||
| Accrued and Unused Vacation |
$ | 45,879 | $ | 52,046 | $ | 55,382 | $ | 34,621 | $ | 37,612 | ||||||||||
| Other Benefits(1) |
— | — | — | — | — | |||||||||||||||
|
|
|
|
|
|
|
|
|
|
|
|||||||||||
| Total(2) |
$ | 45,879 | $ | 52,046 | $ | 55,382 | $ | 34,621 | $ | 37,612 | ||||||||||
|
|
|
|
|
|
|
|
|
|
|
|||||||||||
| For Cause; Voluntary Resignation |
||||||||||||||||||||
| Base Salary |
— | — | — | — | — | |||||||||||||||
| Incentive Compensation |
— | — | — | — | — | |||||||||||||||
| Early Vesting of Restricted Shares |
— | — | — | — | — | |||||||||||||||
| Accrued and Unused Vacation |
$ | 45,879 | $ | 52,046 | $ | 55,382 | $ | 34,621 | $ | 37,612 | ||||||||||
| Other Benefits(1) |
— | — | — | — | — | |||||||||||||||
|
|
|
|
|
|
|
|
|
|
|
|||||||||||
| Total(2) |
$ | 45,879 | $ | 52,046 | $ | 55,382 | $ | 34,621 | $ | 37,612 | ||||||||||
|
|
|
|
|
|
|
|
|
|
|
|||||||||||
| Change in Control |
— | — | — | — | — | |||||||||||||||
| Base Salary |
— | — | — | — | — | |||||||||||||||
| Incentive Compensation |
— | — | — | — | — | |||||||||||||||
| Early Vesting of Restricted Shares |
— | — | — | — | — | |||||||||||||||
| Accrued and Unused Vacation |
$ | 45,879 | $ | 52,046 | $ | 55,382 | $ | 34,621 | $ | 37,612 | ||||||||||
| Other Benefits(1) |
— | — | — | — | — | |||||||||||||||
|
|
|
|
|
|
|
|
|
|
|
|||||||||||
| Total(2) |
$ | 45,879 | $ | 52,046 | $ | 55,382 | $ | 34,621 | $ | 37,612 | ||||||||||
|
|
|
|
|
|
|
|
|
|
|
|||||||||||
| (1) | Examples of Other Benefits would include automobile allowance, insurance benefits and club dues. |
| (2) | The total amounts shown exclude the following: (i) the value of the vested benefits under our 401(k) Plan, which amounted to $160,419 for Mr. Bauer, $0 for Mr. Dolan, $274,706 for Mr. Timmerman, $94,617 for Ms. Hayes and $72,000 for Mr. McBrair, and (ii) earned but unpaid salary and reimbursable expenses. |
| (3) | If the executive had died as of December 31, 2013, his or her beneficiaries or estate would have received life insurance proceeds of approximately $600,000 for Mr. Bauer, $369,000 for Mr. Dolan, $303,000 for Mr. Timmerman, $413,000 for Ms. Hayes and $361,000 for Mr. McBrair. |
| (4) | Effective September 3, 2014, the Board appointed Mr. Dolan as Executive Vice President and Chief Operating Officer of the Company and the Bank. Mr. William T. James has also been appointed as Senior Vice President, Chief Financial Officer and Treasurer of the Company and the Bank. |
141
Table of Contents
PRINCIPAL AND SELLING STOCKHOLDERS
The following table presents information regarding the beneficial ownership of our common stock as of September 8, 2014, and as adjusted to reflect the sale of the common stock in this offering, by:
| • | each beneficial owner of 5% or more of our outstanding common stock; |
| • | each of our named executive officers and directors; |
| • | all of our executive officers and directors; and |
| • | each of the selling stockholders. |
Percentage ownership calculations for beneficial ownership prior to this offering are based on 9,050,000 shares outstanding as of September 8, 2014. Percentage ownership calculations for beneficial ownership after this offering are based on shares outstanding after this offering, assuming no exercise of the underwriters’ option to purchase additional shares and no purchase of shares in the offering by any existing stockholders. Except as otherwise indicated in the table below, address of each of the individuals and entities listed below is care of Anchor BanCorp Wisconsin Inc., 25 West Main Street, Madison, Wisconsin 53703.
| Number of Shares Being Offered Pursuant to the Underwriters’ Option to Purchase Additional Shares(**) |
||||||||||||||||
| Name of Beneficial Owner |
Shares Beneficially Owned Prior to Offering(1)(2) |
Number of Shares Being Offered |
Shares Beneficially Owned After Offering | |||||||||||||
| Shares | % | Shares | % | |||||||||||||
| Named Executive Officers and Directors: |
||||||||||||||||
| Chris M. Bauer |
47,500 | 0.52 | % | |||||||||||||
| Holly Cremer Berkenstadt |
5,000 | 0.06 | % | |||||||||||||
| Richard A. Bergstrom |
15,000 | 0.17 | % | |||||||||||||
| Bradley E. Cooper(3) |
877,800 | 9.70 | % | |||||||||||||
| Martin S. Friedman(4) |
877,800 | 9.70 | % | |||||||||||||
| David L. Omachinski |
25,000 | 0.28 | % | |||||||||||||
| Pat Richter |
5,000 | 0.06 | % | |||||||||||||
| Thomas G. Dolan(8) |
20,000 | 0.22 | % | |||||||||||||
| Martha M. Hayes |
12,500 | 0.14 | % | |||||||||||||
| Scott McBrair |
10,000 | 0.11 | % | |||||||||||||
| Mark D. Timmerman |
12,500 | 0.14 | % | |||||||||||||
| All directors and executive officers of the Company and the Bank as a group (11 persons) |
1,930,600 | 21.33 | % | |||||||||||||
|
|
|
|
|
|||||||||||||
| Selling Stockholders: |
||||||||||||||||
| Other 5% or Greater Stockholders: |
||||||||||||||||
| Bridge Equities III, LLC(3) |
877,800 | 9.70 | % | |||||||||||||
| 5425 Wisconsin Avenue, Suite 701 Chevy Chase, MD 20815 |
||||||||||||||||
| Capital Z Partners III, L.P.(4) |
877,800 | 9.70 | % | |||||||||||||
| 142 West 57th Street, 3rd Floor New York, NY 10019 |
||||||||||||||||
| Castle Creek Capital Partners V, LP(5) |
877,800 | 9.70 | % | |||||||||||||
| P.O. Box 1329 6051 El Tordo, Rancho Santa Fe, CA 92067 |
||||||||||||||||
| EJF Capital LLC(6) |
877,800 | 9.70 | % | |||||||||||||
| 2107 Wilson Blvd. Arlington, VA 22201 |
||||||||||||||||
| Wellington Management Company LLP(7) |
877,800 | 9.70 | % | |||||||||||||
| 280 Congress Street Boston, MA 02210 |
||||||||||||||||
142
Table of Contents
| ** | Assumes that the underwriters will exercise their option to purchase additional shares from us and the selling stockholders. |
| (1) | For purposes of this table, pursuant to rules promulgated under the Exchange Act, an individual is considered to beneficially own shares of common stock if he or she directly or indirectly has or shares (1) voting power, which includes the power to vote or to direct the voting of the shares; or (2) investment power, which includes the power to dispose or direct the disposition of the shares. Unless otherwise indicated, a director has sole voting power and sole investment power with respect to the indicated shares. We currently have no convertible securities or securities exercisable for common stock outstanding. To our knowledge, all persons identified in the above table have voting and investment power with respect to their shares of common stock. |
| (2) | Includes shares held directly, in retirement accounts or by members of the named individuals’ families, with respect to which shares the named individuals and group may be deemed to have sole or shared voting and/or dispositive powers. |
| (3) | Bridge Equities III, LLC (“Bridge”) is the record owner of 827,800 shares of our common stock. FJ Capital Long/Short Equity Fund LLC (“FJ Fund”) is the record owner of 50,000 shares of our common stock. FJ Fund, FJ Capital Management, LLC (“FJ Management”), Martin S. Friedman, Bridge, SunBridge Manager, LLC (“SBM”), SunBridge Holdings, LLC (“SBH”) and Realty Investment Company, Inc. (“Realty”) may be deemed to constitute a “group” for purposes of Section 13(d) of the Exchange Act and the rules promulgated thereunder. |
FJ Fund shares voting and dispositive power over the shares held by it with FJ Management, as managing member of FJ Fund, and Mr. Friedman, as managing member of FJ Management. Bridge shares voting power over the shares held by it with SBM, as managing member of Bridge; SBH, as managing member of SBM; Realty, as manager of SBH; FJ Management, as sub-investment advisor of Bridge; and Mr. Friedman, as managing member of FJ Management.
| (4) | Capital Z Partners III, L.P. (“Cap Z III”) is the record holder of 877,800 shares of our common stock. Cap Z III is a Cayman Islands limited partnership formed to invest in securities of insurance, financial services and healthcare service companies and other related businesses. Capital Z Partners III GP, L.P. is a Cayman Islands limited partnership, the principal business of which is serving as the sole general partner of Cap Z III. Capital Z Partners III GP, Ltd. is a Cayman Islands exempt company, the principal business of which is serving as the sole general partner of Capital Z Partners III GP, L.P. Each of Capital Z Partners III GP, L.P. and Capital Z Partners III GP, Ltd. has disclaimed beneficial ownership of the shares of our common stock held by Cap Z III. Bradley E. Cooper is a founding partner of the Capital Z family of funds. |
| (5) | Castle Creek Capital Partners V, LP (“Fund V”) is the record owner of 877,800 shares of our common stock. Castle Creek Capital V LLC (“CCC V”) serves as the sole general partner of, and manages, Fund V and has disclaimed beneficial ownership of the shares of our common stock owned by Fund V. Mr. John M. Eggemeyer shares voting and dispositive power over the 877,800 shares beneficially owned by Fund V with Mr. Mark G. Merlo, Mr. John T. Pietrzak and Mr. J. Mikesell Thomas, due to the fact that each is a managing principal of CCC V, the sole general partner of Fund V. Each of Messrs. Eggemeyer, Merlo, Pietrzak and Thomas has disclaimed beneficial ownership of the shares of our common stock beneficially owned by CCC V and Fund V, respectively. |
| (6) | EJF Financial Services Fund, LP and EJF Financial Opportunities Master Fund, LP are the record owners of 614,460 and 158,004, respectively, shares of our common stock. EJF Financial Services GP, LLC serves as the general partner and investment manager of EJF Financial Services Fund, LP and may be deemed to share beneficial ownership of the shares of our common stock of which EJF Financial Services Fund, LP is the record owner. EJF Financial Opportunities GP, LLC serves as the general partner of EJF Financial Opportunities Master Fund, LP and may be deemed to share beneficial ownership of the shares of our common stock of which EJF Financial Opportunities Master Fund, LP is the record owner. EJF Capital LLC is the sole member and manager of each of EJF Financial Services GP, LLC and EJF Financial Opportunities GP, LLC, and may be deemed to share beneficial ownership of the shares of our common stock of which such entities may share beneficial ownership. |
EJF Capital LLC also serves as the investment manager of EJF Financial Opportunities Master Fund, LP and various other managed accounts and may be deemed to share beneficial ownership of the shares of our common stock of which EJF Financial Opportunities Master Fund, LP is the record owner and the 105,336 shares of our common stock of which the various other managed accounts are the record owners. Emanuel J. Friedman is the controlling member of EJF Capital LLC and may be deemed to share beneficial ownership of the shares of common stock over which EJF Capital LLC may share beneficial ownership.
| (7) | Wellington Management Company, LLP (“Wellington”) is an investment adviser registered under the Investment Advisers Act of 1940, as amended. Wellington, in such capacity, may be deemed to share beneficial ownership over the shares held by its client accounts. |
| (8) | Effective September 3, 2014, the Board appointed Mr. Dolan as Executive Vice President and Chief Operating Officer of the Company and the Bank. Mr. William T. James has also been appointed as Senior Vice President, Chief Financial Officer and Treasurer of the Company and the Bank. |
143
Table of Contents
CERTAIN RELATIONSHIPS AND RELATED PARTY TRANSACTIONS
Indebtedness of Management
Our directors, officers and employees, including those of our subsidiaries are permitted to borrow from the Bank in accordance with the requirements of federal and state law. All loans made by the Bank to directors and executive officers or their related interests have been made in the ordinary course of business, on substantially the same terms, including interest rates and collateral, as those prevailing at the time for comparable transactions with persons not related to the Bank and did not involve more than the normal risk of collectability or present other unfavorable features. Mr. Bergstrom, a director on our Board, has a line of credit with the Bank that was entered into on December 23, 2002 in the amount of $300,000 with an applicable interest rate of 5%. For the nine months ended December 31, 2013, there were no amounts outstanding under this line of credit.
Registration Rights
We have granted the Investors and the Secondary Investors registration rights pursuant to the Investor SPAs and the Secondary SPAs, respectively. For a further description of these rights, see “Description of the Common Stock—Registration Rights.”
Other than as described above under this section titled “Certain Relationships and Related Party Transactions,” since March 31, 2011, we have not entered into any transactions, nor are there any currently proposed transactions, between us and a related party where the amount involved exceeds, or would exceed, $120,000, and in which any related person had or will have a direct or indirect material interest. We believe the terms of the transactions described above were comparable to terms that could have been obtained in arm’s-length dealings with unrelated third parties.
144
Table of Contents
DESCRIPTION OF THE COMMON STOCK
General
The following is a summary of the rights of our common stock and certain provisions of our Amended Charter and Amended Bylaws. This description is only a summary. For more detailed information, you should refer to our Amended Charter and Amended Bylaws, copies of which are incorporated by reference as exhibits to the registration statement of which this prospectus forms a part.
The transfer agent and registrar for our common stock is Broadridge Corporate Issuer, Inc., 1717 Arch St., Suite 1300, Philadelphia, PA 19103.
Our outstanding shares of common stock are, and the shares that may be offered by us pursuant to this prospectus will be, when issued and paid for, fully paid and non-assessable.
Authorized Capital Stock
Under the Amended Charter, our authorized capital stock consists of 11,900,000 shares of common stock, $ 0.01 par value per share. As of June 30, 2014, 9,050,000 shares of our common stock were issued and outstanding and there were 56 holders of record of our common stock. We are also authorized to issue 100,000 shares of preferred stock, no shares of which are issued and outstanding.
Dividends
The holders of common stock will be entitled to receive and share equally in such dividends, if any, declared by the Board out of funds legally available therefor. We may pay dividends if, as and when declared by the Board. The payment of dividends by us is subject to limitations imposed by the Delaware General Corporations Law, the Federal Reserve and the OCC. See “Dividend Policy.” If we issue preferred stock, the holders thereof may have a priority over the holders of the common stock with respect to dividends.
Voting Rights
Each share of our common stock will entitle the holder thereof to one vote on all matters upon which stockholders have the right to vote. Holders of our common stock, together with holders of any other class or series of capital stock with voting rights, elect the Board and act on such other matters as are required to be presented to them under Delaware law or our articles of incorporation, as amended or as otherwise presented to them by the Board. Our stockholders are not entitled to cumulate their votes for the election of directors.
Liquidation Rights
In the event of any liquidation, dissolution, or winding up of us, the holders of shares of common stock will be entitled to receive, after payment of all debts and liabilities and after satisfaction of all liquidation preferences applicable to any preferred stock, all remaining assets and funds available for distribution in cash or in kind in proportion to the number of shares held by them.
In the event of any liquidation, dissolution, or winding up of the Bank, we, as the holder of all shares of our subsidiary’s common stock, would be entitled to receive, after payment of all debts and liabilities of the subsidiary (including all deposits and accrued interest thereon), all remaining assets of the subsidiary available for distribution in cash or in kind.
Preemptive Rights; Redemption and Assessment
In connection with the Plan of Reorganization, we entered into the Investor SPAs and the Secondary SPAs. Pursuant to the terms of these stock purchase agreements, each Investor and Secondary Investor will be entitled,
145
Table of Contents
for so long as such Investor or Secondary Investor beneficially owns at least 50% or more of all of the shares issued and sold to the Investor or Secondary Investor under such stock purchase agreements, preemptive rights (“Preemptive Rights”) with respect to any equity, or any securities, options or debt that are convertible or exchangeable into equity or that include an equity component (any such security, a “New Security”) issued by us (a “New Issuance”). The Investor or the Secondary Investor, as applicable, will have the right to purchase for cash, at the price and on the same terms and conditions and at the same time as the New Issuance, such number of New Securities as are required to enable it to maintain its proportionate common stock-equivalent interest in us immediately prior to any such issuance of New Securities.
The Investors or the Secondary Investor, as applicable, will not have any Preemptive Rights in connection with (i) any issuance of New Securities to management, consultants, employees, officers or directors of the Company pursuant to management or employee incentive programs or plans approved by the Board (including any such programs or plans in existence on the date of the Investor SPAs or Secondary SPAs, as applicable), (ii) any issuance, delivery or sale of New Securities by us to any person as consideration in connection with (but not in connection with raising capital to fund) (1) an acquisition or strategic business combination approved by the Board or (2) an investment by us approved by the Board in any party which is not prior to such transaction an affiliate of ours (whether by merger, consolidation, stock swap, sale of assets or securities, or otherwise), (iii) any issuance, delivery or sale of New Securities in any registered public offering or (iv) any issuance of New Securities in connection with any stock split, stock dividend paid on a proportionate basis to all holders of the affected class of capital stock or recapitalization approved by the Board.
If a majority of the Board determines it is appropriate that we issue equity or debt securities on an expedited basis, then we may consummate the proposed issuance or sale of such securities (“Expedited Issuance”) and then comply with the stock purchase agreements; provided that (i) the purchaser(s) of such New Securities has consented in writing to the issuance of additional New Securities, and (ii) the sale of any such additional New Securities to the investor and certain other investors in the Private Placements or Secondary Treasury Sales, as applicable, will be consummated as promptly as is practicable but in any event no later than ninety days subsequent to the date on which we consummate the Expedited Issuance. Notwithstanding anything to the contrary in the Investor SPAs or Secondary SPAs, as applicable, the consent of the purchasers of such New Securities will not be required in connection with any Expedited Issuance undertaken at the written direction of the applicable federal regulator of ours or the Bank.
In addition, the Investors and the Secondary Investors will not have any Preemptive Rights in connection with any New Issuance to the extent that a majority of the Board determines that such issuance would materially increase the risk of or cause an “ownership change” within the meaning of Section 382 of the Code.
Our common stock is not subject to redemption or any sinking fund and all of the outstanding shares are fully paid and non-assessable.
Registration Rights
The Investor SPAs and the Secondary SPAs contain registration rights provisions with respect to the registration and sales of shares of our common stock. These provisions provide that we are required to file a registration statement for the shares of common stock on or prior to December 26, 2013.
In addition, pursuant to the registration rights provisions, in the event that we are registering shares of our common stock for sale to the public, we are required to give notice of such registration to the Investors that hold registrable securities (which includes members of management that hold shares of our common stock) of the intention to effect such a registration. Such notified persons have piggyback registration rights providing them the right to have us include the shares of common stock owned by them in any such registration if we have received written requests for inclusion therein within prescribed time limits, subject to other provisions under the Investor SPAs or the Secondary SPAs, as applicable.
146
Table of Contents
Listing on the NASDAQ Global Market
We have applied to list our common stock on the NASDAQ Global Market under the trading symbol “ABCW.”
Anti-Takeover Considerations and Special Provisions of Our Certificate of Incorporation, Bylaws and Delaware Law
The following sets forth certain provisions of the Delaware General Corporation Law, the Amended Charter and the Amended Bylaws. Banking laws also impose notice approval and ongoing regulatory requirements on any stockholder or other party that seeks to acquire direct or indirect “control” of an FDIC-insured depository institution. For additional information, see “Description of Business—Regulation and Supervision—Notice and Approval Requirements Related to Control.”
Requirements for Advance Notification of Stockholder Nominations and Proposals
The Amended Charter and the Amended Bylaws established advance notice procedures with respect to stockholder proposals and the nomination of candidates for election as directors, other than nominations made by or at the direction of the Board or a committee of the Board.
Stockholder Meetings
The Amended Charter and the Amended Bylaws provide that special meetings of the stockholders may be called for any purpose or purposes at any time by a majority of the Board, or a committee of the Board, or Stockholders, or by the Chief Executive Officer, the President or Secretary.
Amendments to the Amended Bylaws
The Board, by the affirmative vote of at least a majority of the Board, has the power without the assent or vote of the stockholders to adopt, amend, alter or repeal the Amended Bylaws. The Amended Bylaws also may be adopted, amended, altered or repealed by the affirmative vote of the holders of a majority of the votes entitled to be cast by the shares of outstanding capital stock entitled to vote thereon.
Tax Attribute Preservation Provision
In connection with the Plan of Reorganization, on September 25, 2013, we adopted the Amended Charter. In order to protect certain tax attributes of the Company and its subsidiaries following emergence from bankruptcy, the Amended Charter contains the Tax Attribute Preservation Provision.
Until the Expiration Date, unless approved by the Board in accordance with the procedures set forth in the Amended Charter and subject to certain exceptions for permitted transfers, any attempted transfer of our common stock is prohibited and void ab initio to the extent that, as a result of such transfer (or any series of transfers of which such transfer is a part), either (i) any person or group of persons will own 4.95% or more of the Company or (ii) the ownership interest in the Company of any of our existing 5% Stockholders will be increased. The Expiration Date may be extended in the Board’s discretion until the sixth anniversary of the Effective Date in order to protect the tax attributes of the Company.
Section 203
We have elected to “opt out” of Section 203 of the Delaware General Corporation Law, which prohibits a Delaware corporation from engaging in any business combination with any interested stockholder for a period of three years after the date that such stockholder became an interested stockholder with the following exceptions:
| • | before such date, the Board approved either the business combination or the transaction that resulted in the stockholder becoming an interested holder; |
| • | upon completion of the transaction that resulted in the stockholder becoming an interested stockholder, the interested stockholder owned at least 85.0% of the voting stock of the corporation outstanding at the time the transaction began, excluding for purposes of determining the voting stock outstanding (but |
147
Table of Contents
| not the outstanding voting stock owned by the interested stockholder) those shares owned (i) by persons who are directors and also officers and (ii) employee stock plans in which employee participants do not have the right to determine confidentially whether shares held subject to the plan will be tendered in a tender or exchange offer; or |
| • | on or after such date, the business combination is approved by the Board and authorized at an annual or special meeting of the stockholders, and not by written consent, by the affirmative vote of the holders of at least 66 2/3% of the outstanding voting stock that is not owned by the interested stockholder. |
In general, Section 203 defines business combination to include the following:
| • | any merger or consolidation involving the corporation and the interested stockholder; |
| • | any sale, transfer, pledge, or other disposition of 10.0% or more of the assets of the corporation involving the interested stockholder; |
| • | subject to certain exceptions, any transaction that results in the issuance or transfer by the corporation of any stock of the corporation to the interested stockholder; |
| • | any transaction involving the corporation that has the effect of increasing the proportionate share of the stock or any class or series of the corporation beneficially owned by the interested stockholder; or |
| • | the receipt by the interested stockholder of the benefit of any loans, advances, guarantees, pledges, or other financial benefits by or through the corporation. |
In general, Section 203 defines an “interested stockholder” as an entity or person who, together with the person’s affiliates and associates, beneficially owns, or within three years prior to the time of determination of interested stockholder status did own, 15.0% or more of the outstanding voting stock of the corporation.
A Delaware corporation may “opt out” of Section 203 with an expressed provision in its original certificate of incorporation or an expressed provision in its certificate of incorporation or bylaws resulting from amendments approved by holders of at least a majority of the corporation’s outstanding voting shares.
Notice and Approval Requirements Related to Control
Banking laws impose notice, approval, and ongoing regulatory requirements on any stockholder or other party that seeks to acquire direct or indirect “control” of an FDIC-insured depository institution. These laws include the Bank Holding Company Act, the Change in Bank Control Act, and the Savings and Loan Holding Company Act and the rules and regulations enacted thereunder. Among other things, these laws require regulatory filings by a stockholder or other party that seeks to acquire direct or indirect “control” of an FDIC-insured depository institution. The determination whether an investor “controls” a depository institution is based on all of the facts and circumstances surrounding the investment. As a general matter, a party is deemed to control a depository institution or other company if the party owns or controls 25% or more of any class of voting stock. Subject to rebuttal, a party may be presumed to control a depository institution or other company if the investor owns or controls 10% or more of any class of voting stock and any of certain additional control factors exist. Ownership by affiliated parties, or parties acting in concert, is typically aggregated for these purposes. If a party’s ownership of the Company were to exceed certain thresholds, the investor could be deemed to “control” the Company for regulatory purposes. This could subject the investor to regulatory filings or other regulatory consequences.
In addition, except under limited circumstances, SLHCs are prohibited from acquiring, without prior approval:
| • | control of any other savings institution or SLHC or all or substantially all the assets thereof; or |
| • | more than 5% of the voting shares of a savings institution or SLHC which is not already a subsidiary. |
In evaluating an application by a holding company to acquire a savings association, the factors considered include the financial and managerial resources and future prospects of the holding company and savings association involved, the risk of the acquisition to the DIF, the convenience and needs of the community and the effect of the acquisition on competition.
148
Table of Contents
SHARES ELIGIBLE FOR FUTURE SALE
Immediately prior to this offering and since September 27, 2013, there was no public market for our common stock. Future sales of substantial amounts of common stock in the public market, or the perception that such sales may occur, could adversely affect the market price of our common stock. Although we have applied to have our common stock approved for listing on the NASDAQ Global Market, we cannot assure you that there will be an active public market for our common stock.
Upon completion of this offering and based upon 9,050,000 shares outstanding as of June 30, 2014, we will have outstanding an aggregate of shares of common stock, assuming no exercise of the underwriters’ over-allotment option. Of these shares, the shares sold in this offering by us and by the selling stockholders will be freely tradable without restriction or further registration under the Securities Act of 1933, as amended (the “Securities Act”), except for any shares purchased in this offering by our “affiliates,” as that term is defined in Rule 144 under the Securities Act, whose sales would be subject to certain limitations and restrictions.
As a result of the lock-up agreements described below and the provisions of Rule 144 under the Securities Act, the shares of our common stock (excluding the shares sold in this offering) that will be available for sale in the public market are as follows:
| Date of Availability of Sale |
Approximate Number of Shares |
Description | ||
| As of the date of this prospectus |
Shares sold in the offering, shares saleable under Rule 144 that are not subject to a lock-up | |||
| 180 days after the date of this prospectus |
Lock-up released; shares saleable under Rule 144 | |||
Rule 144
In general, under Rule 144, a person (or persons whose shares are aggregated) who is not deemed to have been an affiliate of ours at any time during the three months preceding a sale, and who has beneficially owned restricted securities within the meaning of Rule 144 for at least six months (including any period of consecutive ownership of preceding non-affiliated holders) would be entitled to sell those shares, subject only to the availability of current public information about us. A non-affiliated person who has beneficially owned restricted securities within the meaning of Rule 144 for at least one year would be entitled to sell those shares without regard to the provisions of Rule 144.
A person (or persons whose shares are aggregated) who is deemed to be an affiliate of ours and who has beneficially owned restricted securities within the meaning of Rule 144 for at least six months would be entitled to sell within any three-month period a number of shares that does not exceed the greater of one percent of the then outstanding shares of our common stock or the average weekly trading volume of our common stock reported through the NASDAQ Global Market during the four calendar weeks preceding such sale. Sales under Rule 144 by our affiliates are also subject to manner of sale provisions and notice requirements and to the availability of current public information about us.
Registration Rights
The Investors and the Secondary Investors are entitled to certain rights with respect to the registration of the offer and sale of those shares under the Securities Act. For a description of these registration rights, please see the section titled “Description of the Common Stock—Registration Rights.” If the offer and sale of these shares are registered, they will be freely tradable without restriction under the Securities Act.
149
Table of Contents
Lock-up Agreements
In connection with this offering, we, our executive officers and directors, the selling stockholders and certain other persons will agree not to sell any shares of our common stock for a period of 180 days from the date of this prospectus, subject to certain exceptions. We refer you to “Underwriting—Lock-up Agreements.”
150
Table of Contents
PRICE RANGE OF AND DIVIDENDS ON OUR LEGACY COMMON STOCK
There is currently no established trading market for the shares of our common stock. The Legacy Common Stock was previously listed on the NASDAQ Global Select Market under the symbol “ABCW” until the trading of the Legacy Common Stock was suspended on November 21, 2011 as a result of the Company’s failure to comply with the $1.00 per share minimum bid price requirement for continued inclusion on the NASDAQ Global Select Market. On December 16, 2011, the NASDAQ Stock Market LLC filed a Form 25 pursuant to Rule 12d2-2(b) under the Exchange Act with the SEC to remove the Legacy Common Stock from listing and registration on the NASDAQ Global Select Market. The Legacy Common Stock was delisted effective December 26, 2011.
From November 21, 2011 until the Effective Date, the Legacy Common Stock was quoted under the symbol “ABCWQ” on the OTC Bulletin Board. On the Effective Date, pursuant to the Plan of Reorganization, all shares of the outstanding Legacy Common Stock, including shares held as treasury stock and in any stock incentive plans, were cancelled. Subsequent to the Effective Date, our common stock has not traded on any national securities exchange or on an automated dealer quotation system.
The historical performance of our Legacy Common Stock is not indicative of performance to be expected of the shares of our common stock in the future.
The following table sets forth, for the fiscal quarters indicated, the high and low sales prices and cash dividends per share of the Legacy Common Stock.
| Legacy Common Stock | ||||||||||||
| High | Low | Cash Dividend | ||||||||||
| Fiscal Year Ended March 31, 2012 |
||||||||||||
| First Quarter |
$ | 1.010 | $ | 0.610 | $ | — | ||||||
| Second Quarter |
0.750 | 0.490 | — | |||||||||
| Third Quarter |
0.550 | 0.140 | — | |||||||||
| Fourth Quarter |
1.020 | 0.210 | — | |||||||||
| Fiscal Year Ended March 31, 2013 |
||||||||||||
| First Quarter |
$ | 1.000 | $ | 0.400 | $ | — | ||||||
| Second Quarter |
0.540 | 0.340 | — | |||||||||
| Third Quarter |
0.430 | 0.310 | — | |||||||||
| Fourth Quarter |
0.850 | 0.338 | — | |||||||||
| Nine Months Ended December 31, 2013 |
||||||||||||
| First Quarter |
$ | 0.720 | $ | 0.530 | $ | — | ||||||
| Second Quarter (through September 27, 2013) |
0.580 | 0.007 | — | |||||||||
We have not paid dividends on our common stock since December 31, 2008 and do not intend to pay dividends for the foreseeable future.
151
Table of Contents
MATERIAL UNITED STATES FEDERAL INCOME TAX CONSEQUENCES TO NON-U.S. HOLDERS
The following is a discussion of material United States federal income tax consequences applicable to a non-U.S. holder (as defined below) with respect to the purchase, ownership and disposition of our common stock. This discussion assumes that a non-U.S. holder purchased our common stock in this offering and holds our common stock as a capital asset (generally, property held for investment). As used in this discussion, the term “non-U.S. holder” means a beneficial owner of our common stock that is, for United States federal income tax purposes, neither a partnership (or an entity classified as a partnership for United States federal income tax purposes) nor any of the following:
| • | an individual who is a citizen or resident of the United States; |
| • | a corporation, or other entity treated as a corporation for United States federal income tax purposes, created or organized in or under the laws of the United States or any political subdivision thereof; |
| • | an estate whose income is includible in gross income for United States federal income tax purposes regardless of its source; or |
| • | a trust, in general, if (a) a United States court is able to exercise primary supervision over the administration of the trust and one or more United States persons have the authority to control all substantial decisions of the trust, or (b) the trust has a valid election in effect under applicable United States Treasury Regulations to be treated as a United States person. |
If an entity classified as a partnership for United States federal income tax purposes holds our common stock, the tax treatment of a partner in such partnership generally depends on the status of the partner and the activities of the partnership. Partnerships holding our common stock and partners in such partnerships should consult their tax advisers.
This discussion does not address all aspects of United States federal income taxation that may be relevant to particular non-U.S. holders in light of their individual circumstances or the United States federal income tax consequences applicable to non-U.S. holders that are subject to special rules, such as controlled foreign corporations, passive foreign investment companies, corporations that accumulate earnings to avoid United States federal income tax, banks or other financial institutions, insurance companies, tax-exempt organizations, United States expatriates, broker-dealers and traders in securities, and non-U.S. holders that hold our common stock as part of a “straddle,” “hedge,” “conversion transaction” or other integrated investment.
The discussion is based on currently existing provisions of the United States Internal Revenue Code of 1986, as amended, applicable United States Treasury Regulations promulgated thereunder, judicial decisions, and rulings and pronouncements of the United States Internal Revenue Service, or the IRS, all as in effect on the date hereof, and all of which are subject to change, possibly on a retroactive basis, or subject to different interpretation. Any changes in such authorities could alter the tax consequences to non-U.S. holders described herein. This discussion does not address the state, local, or foreign tax or United States federal alternative minimum tax consequences relating to the purchase, ownership and disposition of our common stock. We recommend that non-U.S. holders consult their tax advisors regarding the United States federal tax consequences with respect to the purchase, ownership and disposition of our common stock, as well as the applicability and effect of any state, local or foreign tax laws in light of their particular circumstances.
Distributions on Our Common Stock
Distributions on our common stock generally will constitute dividends for United States federal income tax purposes to the extent paid from our current or accumulated earnings and profits, as determined under United States federal income tax principles. If a distribution exceeds such current and accumulated earnings and profits, the excess will be treated first as a tax-free return of a holder’s adjusted tax basis in our common stock and thereafter as capital gain, subject to the tax treatment described below in “—Sale, Exchange or Other Taxable Disposition of Our Common Stock.”
152
Table of Contents
The gross amount of dividends paid to a non-U.S. holder of our common stock generally will be subject to withholding of United States federal income tax at a rate of 30%, or at a lower rate if an applicable income tax treaty so provides and we have received proper certification as to the application of that treaty.
A non-U.S. holder that conducts a trade or business within the United States generally will be subject to United States federal income tax at ordinary United States federal income tax rates (on a net income basis) on dividends that are effectively connected with the conduct of such trade or business and, if certain tax treaties apply, on dividends that are attributable to its permanent establishment in the United States, and such dividends will not be subject to the withholding described above. Non-U.S. holders that are non-United States corporations may also be subject to a 30% “branch profits tax” unless they qualify for a lower rate under an applicable United States income tax treaty.
A non-U.S. holder that wishes to claim the benefit of an applicable United States income tax treaty with respect to dividends on our common stock will be required to provide the applicable withholding agent with a valid IRS Form W-8BEN or W-8BEN-E (or other applicable form) and certify under penalties of perjury that such holder (i) is not a United States person (as defined under the Code) and (ii) is eligible for the benefits of such treaty, and the withholding agent must not have actual knowledge or reason to know that the certification is incorrect. This certification must be provided to the applicable withholding agent prior to the payment of dividends and may be required to be updated periodically. Non-U.S. holders may obtain a refund of any excess amounts withheld by timely filing an appropriate claim for refund with the IRS. Non-U.S. holders should consult their tax advisers regarding their entitlement to benefits under an applicable income tax treaty and the specific manner of claiming the benefits of the treaty.
Sale, Exchange or Other Taxable Disposition of Our Common Stock
A non-U.S. holder generally will not be subject to United States federal income tax on gain recognized on a sale, exchange or other taxable disposition of our common stock unless:
| • | the non-U.S. holder is an individual who is present in the United States for 183 days or more during the taxable year of the sale, exchange or other taxable disposition and meets certain other conditions; |
| • | the gain is effectively connected with the non-U.S. holder’s conduct of a trade or business and, if certain tax treaties apply, is attributable to its permanent establishment in the United States; or |
| • | we are or have been a “United States real property holding corporation” for United States federal income tax purposes at any time during the shorter of the five-year period ending on the date of the sale, exchange or other taxable disposition and the period that the non-U.S. holder held our common stock and either (a) our common stock has ceased to be traded on an established securities market prior to the beginning of the calendar year in which the sale, exchange or other taxable disposition occurs, or (b) the non-U.S. holder owns (actually or constructively) more than five percent of our common stock at some time during the shorter of the five-year period ending on the date of the sale, exchange or other taxable disposition and the period that the non-U.S. holder held our common stock. |
Although there can be no assurances, we believe we are not a United States real property holding corporation, and we do not expect to become a United States real property holding corporation.
An individual non-U.S. holder described in the first bullet point immediately above will be subject to United States federal income tax on the holder’s gains (including gain from the sale of our common stock, net of applicable United States source losses incurred on sales or exchanges of other capital assets during the year) at a flat rate of 30%. Other non-U.S. holders who may be subject to United States federal income tax on the disposition of our common stock will be subject to United States federal income tax on the disposition in the same manner in which citizens or residents of the United States would be subject to United States federal income tax.
153
Table of Contents
Information Reporting and Backup Withholding
Non-U.S. holders generally will be required to comply with certain certification procedures to establish that they are not United States persons in order to avoid backup withholding with respect to dividends or the proceeds of a disposition of our common stock. In addition, we are required to report annually to the IRS and each non-U.S. holder the amount of any dividends paid to such holder, regardless of whether we actually withheld any tax. Copies of the information returns reporting such dividends and the amounts withheld may also be made available to the tax authorities in the country in which such non-U.S. holders reside under the provisions of an applicable income tax treaty. Any amounts withheld under the backup withholding rules generally will be allowed as a refund or credit against the non-U.S. holder’s United States federal income tax liability, if any, provided that certain required information is provided on a timely basis to the IRS.
Foreign Account Tax Compliance Act
Withholding at a rate of 30% generally will be required in certain circumstances on dividends in respect of, and, after December 31, 2016, gross proceeds from the sale or other disposition of, shares of our common stock held by or through certain foreign financial institutions (including investment funds), unless such institution (i) enters into, and complies with, an agreement with the Internal Revenue Service to report, on an annual basis, information with respect to interests in, or accounts maintained by, the institution that are owned by certain United States persons or by certain non-U.S. entities that are wholly or partially owned by United States persons and to withhold on certain payments, or (ii) if required under an intergovernmental agreement between the United States and an applicable foreign country, reports such information to its local tax authority, which will exchange such information with the United States authorities. An intergovernmental agreement between the United States and an applicable foreign country, or future United States Treasury Regulations or other guidance, may modify these requirements. Accordingly, the entity through which our common stock is held will affect the determination of whether such withholding is required. Similarly, dividends in respect of, and after December 31, 2016, gross proceeds from the sale or other disposition of, our common stock held by an investor that is a non-financial non-U.S. entity that does not qualify under certain exceptions generally will be subject to withholding at a rate of 30%, unless such entity either (i) certifies that such entity does not have any “substantial United States owners” or (ii) provides certain information regarding the entity’s “substantial United States owners,” which we will in turn provide to the Internal Revenue Service. We will not pay any additional amounts to stockholders in respect of any amounts withheld. Prospective investors should consult their tax advisors regarding the possible implications of these rules on their investment in our common stock in light of their particular circumstances.
154
Table of Contents
We and the selling stockholders are offering the shares of our common stock described in this prospectus to Sandler O’Neill & Partners, L.P. and Robert W. Baird & Co. Incorporated, as underwriters. We, the selling stockholders and the underwriters have entered into an underwriting agreement dated , 2014. Subject to the terms and conditions of the underwriting agreement, the underwriters have agreed to purchase the number of shares of common stock in the following table:
| Underwriter |
Number of Shares | |||
| Sandler O’Neill & Partners, L.P. |
||||
| Robert W. Baird & Co. Incorporated |
||||
| Total |
||||
Our common stock is offered subject to a number of conditions, including receipt and acceptance of the common stock by the underwriters.
In connection with this offering, the underwriters or securities dealers may distribute offering documents to investors electronically.
Commission and Discounts
Shares of common stock sold by the underwriters to the public will initially be offered at the public offering price set forth on the cover of this prospectus. Any shares of common stock sold by the underwriters to securities dealers may be sold at a discount of up to $ per share from the public offering price. Any of these securities dealers may resell any shares of common stock purchased from the underwriters to other brokers or dealers at a discount of up to $ per share from the public offering price. If all of the shares of common stock are not sold at the public offering price, the underwriters may change the offering price and the other selling terms.
The following table shows the public offering price (assuming the midpoint of the offering price range on the cover page of this prospectus), underwriting discount and proceeds before expenses to us. The information assumes either no exercise or full exercise by the underwriters of their over-allotment option to purchase additional shares of our common stock:
| Per Share | No Exercise | Full Exercise | ||||||||||
| Public offering price |
$ | $ | $ | |||||||||
| Underwriting discount |
||||||||||||
| Proceeds to us, before expenses |
||||||||||||
We estimate the expenses of this offering payable by us, including the expenses of the selling stockholders but not including the underwriting discounts, will be approximately $ million. This amount includes the amount we have agreed to reimburse the underwriters for certain fees and expenses incurred in connection with this offering, including fees of counsel to the underwriters and fees and expenses incurred by the underwriters in connection with marketing, syndication and travel expenses, not to exceed $ in total.
Option to Purchase Additional Shares
We and the selling stockholders have granted the underwriters an option to buy up to additional shares of our common stock, at the public offering price less underwriting discounts. The underwriters may exercise this option, in whole or from time to time in part, solely for the purpose of covering over-allotments, if any, made in connection with this offering. The underwriters have 30 days from the date of this prospectus to exercise this option.
155
Table of Contents
Lock-up Agreements
We, our executive officers and directors, the selling stockholders and certain other persons, will enter into lock-up agreements with the underwriters. Under these agreements, each of these persons will not be permitted to, without the prior written approval of the underwriters, subject to limited exceptions,
| • | issue, offer, pledge, sell, contract to sell, sell any option or contract to purchase, purchase any option or contract to sell, grant any option, right or warrant for the sale of, or otherwise dispose of or transfer any shares of our common stock or any securities convertible into or exchangeable or exercisable for our common stock or file any registration statement under the Securities Act, as amended, with respect to any of the foregoing; or |
| • | enter into any swap, hedge or any other agreement or any transaction that transfers, in whole or in part, directly or indirectly, the economic consequence of ownership of the shares of our common stock, whether any such swap, hedge or transaction is to be settled by delivery of shares of our common stock or other securities, in cash or otherwise. |
These restrictions will be in effect for a period of 180 days after the date of the underwriting agreement. At any time and without public notice, the underwriters will be permitted to, in their sole discretion, release all or some of the securities from these lock-up agreements.
These restrictions also apply to securities convertible into or exchangeable or exercisable for or repayable with common stock to the same extent as they apply to our common stock. They also apply to common stock owned now or acquired later by the person executing the agreement or for which the person executing the agreement later acquires the power of disposition.
The 180-day restricted period described above is subject to extension under limited circumstances. In the event that either (1) during the period that begins on the date that is 15 calendar days plus three business days before the last day of the 180-day restricted period and ends on the last day of the 180-day restricted period, we issue an earnings release or material news or a material event relating to us occurs; or (2) prior to the expiration of the 180-day restricted period, we announce that we will release earnings results during the 16-day period beginning on the last day of the 180-day restricted period, then the restricted period will continue to apply until the expiration of the date that is 15 calendar days plus three business days after the date on which the earnings release is issued or the material news or material event relating to us occurs.
Pricing of the Offering
This is the initial public offering of our common stock following the Recapitalization and no public market currently exists for our shares. The initial public offering price will be negotiated among us, the selling stockholders and the underwriters. The factors to be considered in determining the initial public offering price of the shares, in addition to prevailing market conditions, include the information set forth in, or incorporated by reference into, this prospectus, our financial and operating performance, estimates of our business potential and earnings prospects and those of our industry in general, an assessment of management and the consideration of the above factors in relation to market valuation of companies in related businesses. The estimated public offering price range set forth on the cover page of this preliminary prospectus is subject to change as a result of market conditions and other factors. Neither we nor the underwriters can assure investors than an active trading market will develop for our common stock or that the common stock will trade in the public market at or above the initial offering price.
We have applied to list our common stock on the NASDAQ Global Market under the symbol “ABCW.”
Indemnification and Contribution
We have agreed to indemnify the underwriters and their affiliates, selling agents and controlling persons against certain liabilities, including under the Securities Act. If we are unable to provide this indemnification, we will
156
Table of Contents
contribute to the payments the underwriters and their affiliates, selling agents and controlling persons may be required to make in respect of those liabilities.
Price Stabilization, Short Positions and Penalty Bids
To facilitate the offering of our common stock, the underwriters may engage in transactions that stabilize, maintain or otherwise affect the price of the common stock, including:
| • | stabilizing transactions; |
| • | short sales; and |
| • | purchases to cover positions created by short sales. |
Stabilizing transactions consist of bids or purchases made for the purpose of preventing or retarding a decline in the market price of our common stock while this offering is in progress. These transactions may also include making short sales of our common stock, which involve the sale by the underwriters of a greater number of shares of common stock than it is required to purchase in this offering. Short sales may be “covered short sales,” which are short positions in an amount not greater than the underwriters’ purchase option referred to above, or they be “naked short sales,” which are short positions in excess of that amount.
The underwriters may close out any covered short position either by exercising its purchase option, in whole or in part, or by purchasing shares in the open market. In making this determination, the underwriters will consider, among other things, the price of shares available for purchase in the open market compared to the price at which it may purchase shares through the purchase option. The underwriters must close out any naked short position by purchasing shares in the open market. A naked short position is more likely to be created if the underwriters are concerned that there may be downward pressure on the price of the common stock in the open market that could adversely affect investors who purchased shares in this offering.
As a result of these activities, the price of our common stock may be higher than the price that otherwise might exist in the open market. If these activities are commenced, they may be discontinued by the underwriters at any time without notice. The underwriters may carry out these transactions on the NASDAQ Global Market, in the over-the-counter market or otherwise.
Passive Market Making
In connection with this offering, the underwriters and selling group members may engage in passive market-making transactions in our common stock on the NASDAQ Global Market in accordance with Rule 103 of Regulation M under the Exchange Act during a period before the commencement of offers or sales of common stock and extending through the completion of the distribution of this offering. A passive market maker must display its bid at a price not in excess of the highest independent bid of that security. However, if all independent bids are lowered below the passive market maker’s bid, that bid must then be lowered when specified purchase limits are exceeded. Passive market making may cause the price of our common stock to be higher than the price that otherwise would exist in the open market in the absence of those transactions. The underwriters and dealers are not required to engage in passive market making and may end passive market-making activities at any time.
Electronic Distribution
A prospectus in electronic format may be made available by e-mail or on the websites or through online services maintained by the underwriters or their affiliates. In those cases, prospective investors may view offering terms online and may be allowed to place orders online. The underwriters may agree with us to allocate a specific number of shares for sale to online brokerage account holders. Any such allocation for online distributions will be made by the underwriters on the same basis as other allocations. Other than the prospectus in electronic format, the information on the underwriters’ websites and any information contained on any other website
157
Table of Contents
maintained by the underwriters is not part of this prospectus, has not been approved and/or endorsed by the underwriters or us, and should not be relied upon by investors.
Affiliations
The underwriters and their affiliates are full-service financial institutions engaged in various activities, which may include securities trading, commercial and investment banking, financial advisory, investment management, investment research, principal investment, hedging, financing, valuation and brokerage activities. From time to time, the underwriters and/or their affiliates have directly and indirectly engaged, or may engage, in various financial advisory, investment banking and commercial banking services for us and our affiliates, for which they received, or may receive, customary compensation, fees and expense reimbursement. In the ordinary course of their various business activities, the underwriters and their affiliates may make or hold a broad array of investments and actively trade debt and equity securities (or related derivative securities) and financial instruments (including bank loans) for their own account and for the accounts of their customers, and those investment and securities activities may involve securities and/or instruments of ours. The underwriters and their affiliates may also make investment recommendations and/or publish or express independent research views in respect of those securities or instruments and may at any time hold, or recommend to clients that they acquire, long and/or short positions in those securities and instruments.
Sandler O’Neill & Partners, L.P. served as financial advisor in connection with the Plan of Reorganization and received $8.9 million in fees for services rendered relating to the Private Placements consummated in connection therewith.
158
Table of Contents
Certain legal matters, including the validity of the shares of our common stock offered by this prospectus, will be passed upon for us by Skadden, Arps, Slate, Meagher & Flom LLP, New York, New York. Certain legal matters relating to this offering will be passed upon for the underwriters by Vedder Price P.C., Chicago, Illinois.
The consolidated financial statements as of December 31, 2013 and March 31, 2013 and for the nine months ended December 31, 2013 and for each of the two years in the period ended March 31, 2013, and management’s assessment of the effectiveness of internal control over financial reporting as of December 31, 2013, have been audited by McGladrey LLP, independent registered public accounting firm, appearing elsewhere herein, and upon the authority of said firm as experts in accounting and auditing.
WHERE YOU CAN FIND MORE INFORMATION
We currently file annual, quarterly and current reports and other information with the SEC and will continue to do so after this offering. You may read and copy these documents and the registration statement, including exhibits and schedules, at the SEC’s public reference room at 100 F Street, N.E., Washington, D.C. 20549. Please call the SEC at 1-800-SEC-0330 for further information on the operation of the public reference room. In addition, our filings with the SEC are also available to the public on the SEC’s website at http://www.sec.gov.
You may request a copy of certain of the information referred to in this prospectus, at no cost, by contacting us at the following address: Anchor BanCorp Wisconsin Inc., 25 West Main Street, Madison, Wisconsin 53703 and our general telephone number is (608) 252-8700. Certain of such information is also available on our website at http://www.anchorbank.com. The contents of our website are not incorporated by reference herein or otherwise a part of this prospectus.
We have filed a registration statement on Form S-1 with the SEC relating to this offering. This prospectus is part of the registration statement. As allowed by the SEC’s rules, this prospectus does not contain all of the information you can find in the registration statement or the exhibits to the registration statement. You should note that where we summarize the material terms of any contract, agreement or other document filed as an exhibit to the registration statement in this prospectus, the summary information provided in the prospectus is less complete than the actual contract, agreement or document. You should refer to the exhibits filed with the registration statement for copies of the actual contract, agreement or document.
159
Table of Contents
ANCHOR BANCORP WISCONSIN INC.
INDEX TO CONSOLIDATED FINANCIAL STATEMENTS
| Financial Statements |
||||
| F-2 | ||||
| Consolidated Balance Sheets at December 31, 2013 and March 31, 2013 |
F-4 | |||
| F-5 | ||||
| Consolidated Statements of Changes in Stockholders’ Equity (Deficit) for the nine months ended December 31, 2013 and 2012 and the fiscal years ended March 31, 2013 and 2012 |
F-7 | |||
| F-8 | ||||
| F-10 | ||||
| Unaudited Financial Statements |
||||
| F-68 | ||||
| F-69 | ||||
| F-71 | ||||
| Consolidated Statements of Cash Flows for the six months ended June 30, 2014 and 2013 |
F-72 | |||
| F-74 | ||||
F-1
Table of Contents
Report of Independent Registered Public Accounting Firm
To the Board of Directors and Stockholders
Anchor BanCorp Wisconsin Inc.
We have audited the accompanying consolidated balance sheets of Anchor BanCorp Wisconsin Inc. and Subsidiaries (the Corporation) as of December 31, 2013 and March 31, 2013, and the related consolidated statements of operations and comprehensive income (loss), changes in stockholders’ equity (deficit), and cash flows for the nine months ended December 31, 2013 and for each of the two years in the period ended March 31, 2013. These financial statements are the responsibility of the Corporation’s management. Our responsibility is to express an opinion on these financial statements based on our audits.
We conducted our audits in accordance with the standards of the Public Company Accounting Oversight Board (United States). Those standards require that we plan and perform the audit to obtain reasonable assurance about whether the financial statements are free of material misstatement. An audit includes examining, on a test basis, evidence supporting the amounts and disclosures in the financial statements. An audit also includes assessing the accounting principles used and significant estimates made by management, as well as evaluating the overall financial statement presentation. We believe that our audits provide a reasonable basis for our opinion.
In our opinion, the consolidated financial statements referred to above present fairly, in all material respects, the financial position of the Corporation as of December 31, 2013 and March 31, 2013, and the results of their operations and their cash flows for the nine months ended December 31, 2013 and for each of the two years in the period ended March 31, 2013, in conformity with U.S. generally accepted accounting principles.
We have also audited, in accordance with the standards of the Public Company Accounting Oversight Board (United States), the Corporation’s internal control over financial reporting as of December 31, 2013, based on criteria established in Internal Control—Integrated Framework issued by the Committee of Sponsoring Organizations of the Treadway Commission in 1992 and our report dated March 20, 2014 expressed an unqualified opinion on the effectiveness of internal control over financial reporting.
| /s/ McGladrey LLP |
| Madison, Wisconsin |
| March 20, 2014 |
F-2
Table of Contents
Report of Independent Registered Public Accounting Firm
To the Board of Directors and Stockholders
Anchor BanCorp Wisconsin Inc.
We have audited Anchor BanCorp Wisconsin Inc. and Subsidiaries’ (the Corporation’s) internal control over financial reporting as of December 31, 2013, based on criteria established in Internal Control-Integrated Framework issued by the Committee of Sponsoring Organizations of the Treadway Commission in 1992. The Corporation’s management is responsible for maintaining effective internal control over financial reporting and for its assessment of the effectiveness of internal control over financial reporting included in the accompanying Management’s Annual Report on Internal Control over Financial Reporting. Our responsibility is to express an opinion on the Corporation’s internal control over financial reporting based on our audit.
We conducted our audit in accordance with the standards of the Public Company Accounting Oversight Board (United States). Those standards require that we plan and perform the audit to obtain reasonable assurance about whether effective internal control over financial reporting was maintained in all material respects. Our audit included obtaining an understanding of internal control over financial reporting, assessing the risk that a material weakness exists, and testing and evaluating the design and operating effectiveness of internal control based on the assessed risk. Our audit also included performing such other procedures as we considered necessary in the circumstances. We believe that our audit provides a reasonable basis for our opinion.
A corporation’s internal control over financial reporting is a process designed to provide reasonable assurance regarding the reliability of financial reporting and the preparation of financial statements for external purposes in accordance with generally accepted accounting principles. A corporation’s internal control over financial reporting includes those policies and procedures that (a) pertain to the maintenance of records that, in reasonable detail, accurately and fairly reflect the transactions and dispositions of the assets of the corporation; (b) provide reasonable assurance that transactions are recorded as necessary to permit preparation of financial statements in accordance with generally accepted accounting principles, and that receipts and expenditures of the corporation are being made only in accordance with authorizations of management and directors of the corporation; and (c) provide reasonable assurance regarding prevention or timely detection of unauthorized acquisition, use, or disposition of the corporation’s assets that could have a material effect on the financial statements.
Because of its inherent limitations, internal control over financial reporting may not prevent or detect misstatements. Also, projections of any evaluation of effectiveness to future periods are subject to the risk that controls may become inadequate because of changes in conditions, or that the degree of compliance with the policies or procedures may deteriorate.
In our opinion the Corporation maintained in all material respects effective internal control over financial reporting as of December 31, 2013, based on criteria established in Internal Control—Integrated Framework issued by the Committee of Sponsoring Organizations of the Treadway Commission in 1992.
We have also audited, in accordance with the standards of the Public Company Accounting Oversight Board (United States), the consolidated balance sheets of Anchor BanCorp Wisconsin Inc. as of December 31, 2013 and March 31, 2013 and the related consolidated statements of operations and comprehensive income (loss), changes in stockholders’ equity (deficit), and cash flows for the nine months ended December 31, 2013 and for each of the two years in the period ended March 31, 2013. and our report dated March 20, 2014 expressed an unqualified opinion.
| /s/ McGladrey LLP |
| Madison, Wisconsin |
| March 20, 2014 |
F-3
Table of Contents
ANCHOR BANCORP WISCONSIN INC. AND SUBSIDIARIES
| December 31, 2013 |
March 31, 2013 |
|||||||||||||||
| (In thousands, except share data) | ||||||||||||||||
| Assets |
||||||||||||||||
| Cash and due from banks |
$ | 44,139 | $ | 30,237 | ||||||||||||
| Interest-earning deposits |
99,257 | 198,299 | ||||||||||||||
|
|
|
|
|
|||||||||||||
| Cash and cash equivalents |
143,396 | 228,536 | ||||||||||||||
| Investment securities available for sale |
277,872 | 266,787 | ||||||||||||||
| Loans held for sale |
3,085 | 18,058 | ||||||||||||||
| Loans held for investment |
1,609,506 | 1,750,358 | ||||||||||||||
| Less: Allowance for loan losses |
(65,182 | ) | (79,815 | ) | ||||||||||||
|
|
|
|
|
|||||||||||||
| Loans held for investment, net |
1,544,324 | 1,670,543 | ||||||||||||||
| Other real estate owned, net |
63,460 | 84,342 | ||||||||||||||
| Premises and equipment, net |
24,800 | 24,469 | ||||||||||||||
| Federal Home Loan Bank stock—at cost |
11,940 | 25,630 | ||||||||||||||
| Mortgage servicing rights, net |
22,294 | 21,824 | ||||||||||||||
| Accrued interest receivable |
8,216 | 9,563 | ||||||||||||||
| Other assets |
13,087 | 17,831 | ||||||||||||||
|
|
|
|
|
|||||||||||||
| Total assets |
$ | 2,112,474 | $ | 2,367,583 | ||||||||||||
|
|
|
|
|
|||||||||||||
| Liabilities and Stockholders’ Equity (Deficit) |
||||||||||||||||
| Deposits |
||||||||||||||||
| Non-interest bearing |
$ | 259,926 | $ | 267,732 | ||||||||||||
| Interest bearing |
1,615,367 | 1,757,293 | ||||||||||||||
|
|
|
|
|
|||||||||||||
| Total deposits |
1,875,293 | 2,025,025 | ||||||||||||||
| Other borrowed funds |
12,877 | 317,225 | ||||||||||||||
| Accrued interest and fees payable |
415 | 61,290 | ||||||||||||||
| Accrued taxes, insurance and employee related expenses |
|
7,302 | 6,389 | |||||||||||||
| Other liabilities |
14,389 | 17,518 | ||||||||||||||
|
|
|
|
|
|||||||||||||
| Total liabilities |
1,910,276 | 2,427,447 | ||||||||||||||
|
|
|
|
|
|||||||||||||
| Commitments and contingent liabilities (Note 15) |
||||||||||||||||
| December 31, 2013 | March 31, 2013 | |||||||||||||||
| Preferred stock: |
||||||||||||||||
| Par value |
$ | 0.01 | $ | 0.10 | ||||||||||||
| Authorized |
100,000 | 5,000,000 | ||||||||||||||
| Issued |
— | 110,000 | — | 103,833 | ||||||||||||
| Dividends in arrears |
N/A | $ | 25,345 | |||||||||||||
| Common stock: |
||||||||||||||||
| Par value |
$ | 0.01 | $ | 0.10 | ||||||||||||
| Authorized |
11,900,000 | 100,000,000 | ||||||||||||||
| Issued |
9,050,000 | 25,363,339 | 91 | 2,536 | ||||||||||||
| Additional paid-in capital |
188,370 | 110,034 | ||||||||||||||
| Retained earnings (deficit) |
20,359 | (189,097 | ) | |||||||||||||
| Accumulated other comprehensive income (loss) related to AFS securities |
|
(6,378 | ) | 3,918 | ||||||||||||
| Accumulated other comprehensive loss related to OTTI securities—non-credit factors |
|
(244 | ) | (339 | ) | |||||||||||
|
|
|
|
|
|||||||||||||
| Total accumulated other comprehensive income (loss) |
|
(6,622 | ) | 3,579 | ||||||||||||
| Treasury stock (4,116,114 shares at March 31, 2013), at cost |
|
— | (89,848 | ) | ||||||||||||
| Deferred compensation obligation |
— | (901 | ) | |||||||||||||
|
|
|
|
|
|||||||||||||
| Total stockholders’ equity (deficit) |
202,198 | (59,864 | ) | |||||||||||||
|
|
|
|
|
|||||||||||||
| Total liabilities and stockholders’ equity (deficit) |
|
$ | 2,112,474 | $ | 2,367,583 | |||||||||||
|
|
|
|
|
|||||||||||||
See accompanying Notes to Consolidated Financial Statements
F-4
Table of Contents
ANCHOR BANCORP WISCONSIN INC. AND SUBSIDIARIES
Consolidated Statements of Operations and Comprehensive Income (Loss)
| Nine Months Ended December 31, | Year Ended March 31, | |||||||||||||||
| 2013 | 2012 | 2013 | 2012 | |||||||||||||
| (Unaudited) | ||||||||||||||||
| (In thousands, except per share data) | ||||||||||||||||
| Interest income |
||||||||||||||||
| Loans |
$ | 57,702 | $ | 72,147 | $ | 93,335 | $ | 116,929 | ||||||||
| Investment securities and Federal Home Loan Bank stock |
4,179 | 4,478 | 5,912 | 9,738 | ||||||||||||
| Interest-earning deposits |
342 | 541 | 635 | 586 | ||||||||||||
|
|
|
|
|
|
|
|
|
|||||||||
| Total interest income |
62,223 | 77,166 | 99,882 | 127,253 | ||||||||||||
| Interest expense |
||||||||||||||||
| Deposits |
4,108 | 8,614 | 10,324 | 24,962 | ||||||||||||
| Other borrowed funds |
10,009 | 20,889 | 27,075 | 30,367 | ||||||||||||
|
|
|
|
|
|
|
|
|
|||||||||
| Total interest expense |
14,117 | 29,503 | 37,399 | 55,329 | ||||||||||||
|
|
|
|
|
|
|
|
|
|||||||||
| Net interest income |
48,106 | 47,663 | 62,483 | 71,924 | ||||||||||||
| Provision for loan losses |
275 | 7,058 | 7,733 | 33,887 | ||||||||||||
|
|
|
|
|
|
|
|
|
|||||||||
| Net interest income after provision for loan losses |
47,831 | 40,605 | 54,750 | 38,037 | ||||||||||||
| Non-interest income |
||||||||||||||||
| Net impairment losses recognized in earnings |
(23 | ) | (325 | ) | (408 | ) | (568 | ) | ||||||||
| Loan servicing income (loss), net of amortization |
1,382 | (1,947 | ) | (1,892 | ) | (789 | ) | |||||||||
| Service charges on deposits |
7,751 | 8,066 | 10,435 | 10,589 | ||||||||||||
| Investment and insurance commissions |
2,965 | 2,942 | 3,894 | 3,808 | ||||||||||||
| Net gain on sale of loans |
5,086 | 20,165 | 23,195 | 17,680 | ||||||||||||
| Net gain (loss) on sale and call of investment securities |
292 | (47 | ) | (247 | ) | 6,579 | ||||||||||
| Net gain on sale of OREO |
3,260 | 5,539 | 6,876 | 6,118 | ||||||||||||
| Extinguishment of debt |
134,514 | — | — | — | ||||||||||||
| Other income |
4,306 | 4,005 | 4,048 | 5,844 | ||||||||||||
|
|
|
|
|
|
|
|
|
|||||||||
| Total non-interest income |
159,533 | 38,398 | 45,901 | 49,261 | ||||||||||||
| Non-interest expense |
||||||||||||||||
| Compensation and benefits |
$ | 32,426 | $ | 30,594 | $ | 40,736 | $ | 41,262 | ||||||||
| Occupancy |
6,517 | 5,822 | 8,133 | 7,946 | ||||||||||||
| Furniture and equipment |
2,510 | 3,801 | 4,563 | 5,665 | ||||||||||||
| Federal deposit insurance premiums |
3,386 | 4,567 | 5,921 | 7,189 | ||||||||||||
| Data processing |
4,300 | 4,361 | 6,223 | 6,259 | ||||||||||||
| Communications |
1,517 | 1,428 | 1,840 | 2,081 | ||||||||||||
| Marketing |
2,099 | 839 | 1,345 | 1,466 | ||||||||||||
| OREO expense, net |
9,797 | 25,312 | 37,571 | 28,684 | ||||||||||||
| Investor loss reimbursement |
687 | 1,720 | 4,530 | 157 | ||||||||||||
| Mortgage servicing rights impairment (recovery) |
(1,664 | ) | 1,787 | (403 | ) | 2,410 | ||||||||||
| Provision for unfunded commitments |
2,708 | 967 | 1,392 | (309 | ) | |||||||||||
| Legal services |
2,773 | 4,156 | 5,256 | 5,024 | ||||||||||||
| Other professional fees |
1,699 | 1,687 | 2,346 | 3,669 | ||||||||||||
| Insurance |
2,497 | 1,238 | 1,656 | 1,478 | ||||||||||||
| Debt prepayment penalty |
16,149 | 3,549 | 3,549 | — | ||||||||||||
| Reorganization costs |
1,929 | — | — | — | ||||||||||||
| Other expense |
6,402 | 7,508 | 10,346 | 11,045 | ||||||||||||
|
|
|
|
|
|
|
|
|
|||||||||
| Total non-interest expense |
95,732 | 99,336 | 135,004 | 124,026 | ||||||||||||
|
|
|
|
|
|
|
|
|
|||||||||
| Income (loss) before income taxes |
111,632 | (20,333 | ) | (34,353 | ) | (36,728 | ) | |||||||||
| Income tax expense (benefit) |
9 | (181 | ) | (181 | ) | 10 | ||||||||||
|
|
|
|
|
|
|
|
|
|||||||||
| Net income (loss) |
111,623 | (20,152 | ) | (34,172 | ) | (36,738 | ) | |||||||||
| Preferred stock dividends in arrears |
(2,538 | ) | (4,898 | ) | (6,560 | ) | (6,278 | ) | ||||||||
| Preferred stock discount accretion |
(6,167 | ) | (5,569 | ) | (7,412 | ) | (7,413 | ) | ||||||||
| Retirement of preferred shares |
104,000 | — | — | — | ||||||||||||
|
|
|
|
|
|
|
|
|
|||||||||
| Net income (loss) available to common equity |
$ | 206,918 | $ | (30,619 | ) | $ | (48,144 | ) | $ | (50,429 | ) | |||||
|
|
|
|
|
|
|
|
|
|||||||||
(Continued)
F-5
Table of Contents
ANCHOR BANCORP WISCONSIN INC. AND SUBSIDIARIES
Consolidated Statements of Operations and Comprehensive Income (Loss)
| Nine Months Ended December 31, | Year Ended March 31, | |||||||||||||||
| 2013 | 2012 | 2013 | 2012 | |||||||||||||
| (Unaudited) | ||||||||||||||||
| (In thousands, except per share data) | ||||||||||||||||
| Net income (loss) |
$ | 111,623 | $ | (20,152 | ) | $ | (34,172 | ) | $ | (36,738 | ) | |||||
| Other comprehensive income (loss), net of tax: |
||||||||||||||||
| Reclassification adjustment for realized net (gains) losses recognized in Statement of Operations—Net gain (loss) on sale and call of investment securities |
(292 | ) | 47 | 247 | (6,579 | ) | ||||||||||
| Reclassification adjustments recognized in Statement of Operations—Net impairment losses recognized in earnings: |
||||||||||||||||
| Net change in unrealized credit related other-than-temporary impairment |
(201 | ) | (220 | ) | (310 | ) | 194 | |||||||||
| Credit related other-than-temporary impairment previously recognized on securities paid-off during the period |
— | (4 | ) | (4 | ) | — | ||||||||||
| Realized credit losses |
224 | 549 | 722 | 364 | ||||||||||||
| Change in net unrealized gains (losses) on available-for-sale securities |
(9,932 | ) | 2,297 | 2,792 | 26,105 | |||||||||||
|
|
|
|
|
|
|
|
|
|||||||||
| Total other comprehensive income (loss) |
(10,201 | ) | 2,669 | 3,447 | 20,084 | |||||||||||
|
|
|
|
|
|
|
|
|
|||||||||
| Comprehensive income (loss) |
$ | 101,422 | $ | (17,483 | ) | $ | (30,725 | ) | $ | (16,654 | ) | |||||
|
|
|
|
|
|
|
|
|
|||||||||
| Income (loss) per common share: |
||||||||||||||||
| Basic |
$ | 12.18 | $ | (1.44 | ) | $ | (2.27 | ) | $ | (2.37 | ) | |||||
| Diluted |
12.18 | (1.44 | ) | (2.27 | ) | (2.37 | ) | |||||||||
| Dividends declared per common share |
— | — | — | — | ||||||||||||
See accompanying Notes to Consolidated Financial Statements
F-6
Table of Contents
ANCHOR BANCORP WISCONSIN INC. AND SUBSIDIARIES
Consolidated Statements of Changes in Stockholders’ Equity (Deficit)
| Preferred Stock |
Common Stock |
Additional Paid-in Capital |
Retained Earnings (Deficit) |
Treasury Stock |
Deferred Compensation Obligation |
Accu- mulated Other Compre- hensive Income (Loss) |
Total | |||||||||||||||||||||||||
| (In thousands) | ||||||||||||||||||||||||||||||||
| Balance at March 31, 2011 |
$ | 89,008 | $ | 2,536 | $ | 111,513 | $ | (103,362 | ) | $ | (90,534 | ) | $ | (2,380 | ) | $ | (19,952 | ) | $ | (13,171 | ) | |||||||||||
| Net loss |
— | — | — | (36,738 | ) | — | — | — | (36,738 | ) | ||||||||||||||||||||||
| Other comprehensive income, net of tax |
— | — | — | — | — | — | 20,084 | 20,084 | ||||||||||||||||||||||||
| Vesting of restricted stock |
— | — | — | — | 275 | — | — | 275 | ||||||||||||||||||||||||
| Change in stock-based deferred compensation obligation |
— | — | (1,111 | ) | — | — | 1,111 | — | — | |||||||||||||||||||||||
| Accretion of preferred stock discount |
7,413 | — | — | (7,413 | ) | — | — | — | — | |||||||||||||||||||||||
|
|
|
|
|
|
|
|
|
|
|
|
|
|
|
|
|
|||||||||||||||||
| Balance at March 31, 2012 |
96,421 | 2,536 | 110,402 | (147,513 | ) | (90,259 | ) | (1,269 | ) | 132 | (29,550 | ) | ||||||||||||||||||||
|
|
|
|
|
|
|
|
|
|
|
|
|
|
|
|
|
|||||||||||||||||
| Net loss |
— | — | — | (34,172 | ) | — | — | — | (34,172 | ) | ||||||||||||||||||||||
| Other comprehensive income, net of tax |
— | — | — | — | — | — | 3,447 | 3,447 | ||||||||||||||||||||||||
| Vesting of restricted stock |
— | — | — | — | 411 | — | 411 | |||||||||||||||||||||||||
| Change in stock-based deferred compensation obligation |
— | — | (368 | ) | — | — | 368 | — | — | |||||||||||||||||||||||
| Accretion of preferred stock discount |
7,412 | — | — | (7,412 | ) | — | — | — | — | |||||||||||||||||||||||
|
|
|
|
|
|
|
|
|
|
|
|
|
|
|
|
|
|||||||||||||||||
| Balance at March 31, 2013 |
103,833 | 2,536 | 110,034 | (189,097 | ) | (89,848 | ) | (901 | ) | 3,579 | (59,864 | ) | ||||||||||||||||||||
|
|
|
|
|
|
|
|
|
|
|
|
|
|
|
|
|
|||||||||||||||||
| Net income |
— | — | — | 111,623 | — | — | — | 111,623 | ||||||||||||||||||||||||
| Other comprehensive income, net of tax |
— | — | — | — | — | — | (10,201 | ) | (10,201 | ) | ||||||||||||||||||||||
| Recapitalization transaction fees |
— | — | (14,360 | ) | — | — | — | — | (14,360 | ) | ||||||||||||||||||||||
| Cancellation of common stock |
— | (2,536 | ) | (88,213 | ) | — | 89,848 | 901 | — | — | ||||||||||||||||||||||
| Issuance of common stock |
— | 88 | 174,912 | — | — | — | — | 175,000 | ||||||||||||||||||||||||
| Preferred stock exchanged for common stock |
(110,000 | ) | 3 | 5,997 | 104,000 | — | — | — | — | |||||||||||||||||||||||
| Accretion of preferred stock discount |
6,167 | — | — | (6,167 | ) | — | — | — | — | |||||||||||||||||||||||
|
|
|
|
|
|
|
|
|
|
|
|
|
|
|
|
|
|||||||||||||||||
| Balance at December 31, 2013 |
$ | — | $ | 91 | $ | 188,370 | $ | 20,359 | $ | — | $ | — | $ | (6,622 | ) | $ | 202,198 | |||||||||||||||
|
|
|
|
|
|
|
|
|
|
|
|
|
|
|
|
|
|||||||||||||||||
See accompanying Notes to Consolidated Financial Statements
F-7
Table of Contents
ANCHOR BANCORP WISCONSIN INC. AND SUBSIDIARIES
Consolidated Statements of Cash Flows
| Nine Months Ended December 31, | Year Ended March 31, | |||||||||||||||
| 2013 | 2012 | 2013 | 2012 | |||||||||||||
| (Unaudited) | ||||||||||||||||
| (In thousands) | ||||||||||||||||
| Operating Activities |
||||||||||||||||
| Net income (loss) |
$ | 111,623 | $ | (20,152 | ) | $ | (34,172 | ) | $ | (36,738 | ) | |||||
| Adjustments to reconcile net income (loss) to net cash provided by operating activities: |
||||||||||||||||
| Amortization and accretion of investment securities premium, net |
1,290 | 720 | 1,013 | 1,083 | ||||||||||||
| Net (gain) loss on sale of investment securities |
(292 | ) | 47 | 247 | (6,579 | ) | ||||||||||
| Net impairment losses on investment securities |
27 | 325 | 408 | 568 | ||||||||||||
| Origination of loans held for sale |
(228,748 | ) | (752,829 | ) | (898,960 | ) | (961,947 | ) | ||||||||
| Proceeds from sale of loans held for sale |
248,807 | 780,843 | 943,429 | 947,833 | ||||||||||||
| Net gain on sale of loans |
(5,086 | ) | (20,165 | ) | (23,195 | ) | (17,680 | ) | ||||||||
| Provision for loan losses |
275 | 7,058 | 7,733 | 33,887 | ||||||||||||
| OREO valuation adjustments, net |
4,937 | 17,498 | 26,733 | 15,338 | ||||||||||||
| Provision for unfunded loan commitments |
2,708 | 967 | 1,392 | (309 | ) | |||||||||||
| Loss provision on deposit method OREO property |
— | 3,301 | 3,301 | — | ||||||||||||
| Gain on sale of OREO |
(3,260 | ) | (5,539 | ) | (6,876 | ) | (6,118 | ) | ||||||||
| Depreciation and amortization |
1,871 | 2,476 | 3,079 | 3,494 | ||||||||||||
| Loss on disposal of premises and equipment, net |
3 | 572 | 651 | 677 | ||||||||||||
| Mortgage servicing rights impairment (recovery) |
(1,664 | ) | 1,787 | (403 | ) | 2,410 | ||||||||||
| Impairment of real estate held for development and sale |
212 | 535 | 535 | 87 | ||||||||||||
| Stock-based compensation expense |
— | 55 | 55 | 256 | ||||||||||||
| Extinguishment of debt |
(134,514 | ) | — | — | — | |||||||||||
| Decrease in accrued interest receivable |
1,347 | 1,751 | 2,512 | 4,278 | ||||||||||||
| (Increase) decrease in other assets |
5,726 | 3,699 | 5,129 | (1,749 | ) | |||||||||||
| Increase in accrued interest and fees payable |
6,339 | 13,494 | 17,963 | 15,001 | ||||||||||||
| Increase (decrease) in accrued taxes, insurance and employee related expenses |
913 | 1,120 | 4 | (224 | ) | |||||||||||
| Increase (decrease) in other liabilities |
(5,837 | ) | (5,136 | ) | (10,412 | ) | 13,668 | |||||||||
|
|
|
|
|
|
|
|
|
|||||||||
| Net cash provided by operating activities |
6,677 | 32,427 | 40,166 | 7,236 | ||||||||||||
| Investing Activities |
||||||||||||||||
| Proceeds from sale of investment securities |
356 | 5,842 | 12,262 | 338,224 | ||||||||||||
| Purchase of investment securities |
(63,293 | ) | (56,333 | ) | (81,202 | ) | (71,441 | ) | ||||||||
| Principal collected on investment securities |
40,626 | 32,900 | 46,251 | 39,226 | ||||||||||||
| Decrease in loans held for investment |
106,592 | 249,200 | 302,907 | 352,039 | ||||||||||||
| Purchases of premises and equipment |
(2,205 | ) | (321 | ) | (434 | ) | (1,590 | ) | ||||||||
| Proceeds from sale of OREO |
38,864 | 43,276 | 54,498 | 70,481 | ||||||||||||
| Capitalized improvements of OREO |
(307 | ) | — | (300 | ) | — | ||||||||||
| Proceeds from sale of real estate held for development and sale |
— | — | — | 173 | ||||||||||||
| FHLB stock redemption |
13,690 | 10,162 | 10,162 | 19,037 | ||||||||||||
|
|
|
|
|
|
|
|
|
|||||||||
| Net cash provided by investing activities |
134,323 | 284,726 | 344,144 | 746,149 | ||||||||||||
(Continued)
F-8
Table of Contents
ANCHOR BANCORP WISCONSIN INC. AND SUBSIDIARIES
Consolidated Statements of Cash Flows
| Nine Months Ended December 31, | Year Ended March 31, | |||||||||||||||
| 2013 | 2012 | 2013 | 2012 | |||||||||||||
| (Unaudited) | ||||||||||||||||
| (In thousands) | ||||||||||||||||
| Financing Activities |
||||||||||||||||
| Decrease in deposits |
$ | (129,750 | ) | $ | (188,153 | ) | $ | (238,321 | ) | $ | (435,140 | ) | ||||
| Increase (decrease) in advance payments by borrowers for taxes and insurance |
(19,982 | ) | (21,699 | ) | (1,555 | ) | 622 | |||||||||
| Proceeds from borrowed funds |
718,989 | 63,670 | 92,694 | 1,656,057 | ||||||||||||
| Repayment of borrowed funds |
(956,037 | ) | (222,671 | ) | (251,572 | ) | (1,838,959 | ) | ||||||||
| Issuance of common stock |
175,000 | — | — | — | ||||||||||||
| Recapitalization transaction fees |
(14,360 | ) | — | — | — | |||||||||||
|
|
|
|
|
|
|
|
|
|||||||||
| Net cash used in financing activities |
(226,140 | ) | (368,853 | ) | (398,754 | ) | (617,420 | ) | ||||||||
|
|
|
|
|
|
|
|
|
|||||||||
| Net increase (decrease) in cash and cash equivalents |
(85,140 | ) | (51,700 | ) | (14,444 | ) | 135,965 | |||||||||
| Cash and cash equivalents at beginning of period |
228,536 | 242,980 | 242,980 | 107,015 | ||||||||||||
|
|
|
|
|
|
|
|
|
|||||||||
| Cash and cash equivalents at end of period |
$ | 143,396 | $ | 191,280 | $ | 228,536 | $ | 242,980 | ||||||||
|
|
|
|
|
|
|
|
|
|||||||||
| Supplemental disclosures of cash flow information: |
||||||||||||||||
| Cash paid (received) or credited to accounts: |
||||||||||||||||
| Interest on deposits and borrowings |
$ | 7,778 | $ | 17,294 | $ | 21,097 | $ | 40,328 | ||||||||
| Income tax payments (receipts) |
17 | 10 | (1,735 | ) | 10 | |||||||||||
| Non-cash transactions: |
||||||||||||||||
| Transfer of loans to OREO |
19,352 | 62,007 | 75,169 | 76,742 | ||||||||||||
| Transfer of premises and equipment to OREO |
— | 558 | 558 | 1,093 | ||||||||||||
| Transfer of OREO to premises and equipment |
— | 2,870 | 2,870 | — | ||||||||||||
See accompanying Notes to Unaudited Consolidated Financial Statements
F-9
Table of Contents
NOTES TO CONSOLIDATED FINANCIAL STATEMENTS
Note 1—Summary of Significant Accounting Policies
Business. Anchor BanCorp Wisconsin Inc. (the “Corporation”) is a Wisconsin corporation incorporated in 1992 for the purpose of becoming a savings and loan holding company for AnchorBank, fsb (the “Bank”), a wholly-owned subsidiary. The Bank provides a full range of financial services to individual customers through its branch locations in Wisconsin. The Bank is subject to competition from other financial institutions and other financial service providers. The Corporation and its subsidiary also are subject to the regulations of certain federal and state agencies and undergo periodic examinations by those regulatory authorities.
Change in Fiscal Year End
On December 18, 2013, the Board approved the change of our fiscal year end from March 31 to December 31, beginning with December 31, 2013. References to any of our previous fiscal years mean the fiscal years ended on March 31. This transition report on Form 10-K/T covers the transition period beginning on April 1, 2013 through December 31, 2013, and annual reports on Form 10-K covering fiscal years ending December 31 will be filed thereafter. As a result of the change in fiscal year end, the consolidated financial statements include the Company’s financial results for the nine month transition period from April 1, 2013 to December 31, 2013 (the “transition period”). The comparative nine month information provided for the period ended December 31, 2012 is unaudited as it represented an interim period during the fiscal year ended March 31, 2013.
Basis of Financial Statement Presentation. The consolidated financial statements have been prepared in accordance with U. S. generally accepted accounting principles and include the accounts and operations of the Corporation and its wholly owned subsidiaries, the Bank and Investment Directions, Inc. The Bank has one subsidiary at December 31, 2013; ADPC Corporation. Significant intercompany accounts and transactions have been eliminated.
The unaudited consolidated financial statements included herein have been prepared in accordance with U.S. generally accepted accounting principles. In the opinion of management, all adjustments, including normal recurring accruals, necessary for a fair presentation of the unaudited interim consolidated financial statements have been included.
In preparing the consolidated financial statements, management is required to make estimates and assumptions that affect the amounts reported in the consolidated financial statements and accompanying notes. Actual results could differ from those estimates. Material estimates that are particularly susceptible to significant change in the near term relate to the determination of the allowance for loan losses, the valuation of foreclosed real estate, the net carrying value of mortgage servicing rights and deferred tax assets, and the fair value of investment securities.
The Corporation has three distinct operating segments; the Bank, IDI and the holding company and produces discreet financial information for each which is available to management. However, operating revenues and related assets of IDI and the holding company fall below the required reporting thresholds and therefore are not disclosed in the consolidated financial statements.
We have evaluated all subsequent events through the date of this filing.
Cash and Cash Equivalents. The Corporation considers interest-earning deposits that have an original maturity of three months or less to be cash equivalents.
Investment Securities Available For Sale. Debt securities that the Corporation has the intent and ability to hold to maturity may be classified as held to maturity and are stated at amortized cost as adjusted for premium amortization and discount accretion. Securities not classified as held to maturity are classified as available for
F-10
Table of Contents
sale. Available for sale securities are stated at fair value, with unrealized gains and losses, reported as a separate component of accumulated other comprehensive income (loss) in stockholders’ equity. Securities would be classified as trading when the Corporation intends to actively buy and sell securities in order to make a profit. Trading securities are carried at fair value, with unrealized holding gains and losses included in earnings. There were no securities designated as held to maturity or trading during the nine months ended December 31, 2013 or the fiscal year ended March 31, 2013.
As of December 31, 2013, discounts and premiums on investment securities are accreted and amortized into interest income using a level yield method. Previously the company utilized a method that approximated the effective yield method over the estimated remaining life of the assets. The change in method was adopted because it is more commonly used and more accurately reflects the behavior pattern of the security. The change was applied prospectively beginning December 1, 2013. The difference between the two methods for the month of December, 2013 was approximately a $15,500 increase in amortization which was immaterial (less than .1%) to the results of operations for the Company.
Realized gains and losses are included in net gain (loss) on sale of investment securities in the consolidated statements of operations as a component of non-interest income. The cost of securities sold is based on the specific identification method. If the Corporation sells held to maturity securities, it is only in accordance with accounting standards as the securities have substantially matured.
Declines in the fair value of investment securities below amortized cost basis that are deemed to be other-than-temporary are reflected as impairment losses. To determine if an other-than-temporary impairment exists on a debt security, the Corporation first determines if (a) it intends to sell the security or (b) it is more likely than not that it will be required to sell the security before its anticipated recovery. If either of the conditions is met, the Corporation will recognize an other-than-temporary impairment in earnings equal to the difference between the fair value of the security and its amortized cost basis. If neither of the conditions is met, the Corporation determines (a) the amount of the impairment related to credit loss and (b) the amount of the impairment due to all other factors. The difference between the present values of the cash flows expected to be collected discounted at the purchase yield or current accounting yield and the amortized cost basis is the credit loss. The amount of the credit loss is included in the consolidated statements of operations as an other-than-temporary impairment on securities and is a reduction in the cost basis of the security. The portion of the total impairment that is related to all other factors is included in other comprehensive income (loss).
Loans Held for Sale. Loans held for sale generally consist of the current origination of certain fixed- and adjustable-rate mortgage loans. Effective for loans originated on or after April 1, 2013, residential mortgage loans held for sale are carried at fair value and upfront costs and fees related to these loans are recognized in earnings as incurred. Prior to April 1, 2013, loans held for sale were recorded at the lower of cost or fair value with fees received from the borrower and direct costs to originate the loan deferred and included as a basis adjustment of the loan. Residential mortgage loans held for sale will continue to be reported at the lower of cost or fair value for previous periods.
Loans Held for Investment. Loans held for investment are stated at the amount of the unpaid principal, reduced by undisbursed loan proceeds, unearned net loan fees and an allowance for loan losses. Interest on loans is accrued into income on the unpaid principal balances as earned. Loans are placed on non-accrual status when they become 90 days past due or, when in the judgment of management, the probability of collection of principal and interest is deemed to be insufficient to warrant further accrual. Past due status is based on contractual terms of the loan. Factors that management considers when assessing the collectability of principal and interest include early stage delinquencies and financial difficulties of the borrower. When a loan is placed on non-accrual status, previously accrued but unpaid interest is deducted from interest income. Payments received on non-accrual loans are generally credited to the loan receivable balance and no interest income is recognized on those loans until the principal balance is current. In cases in which the net carrying value of the loan is deemed to be fully collectible, payments received may be recognized in income on a cash basis. Loans are restored to accrual status when the
F-11
Table of Contents
obligation is brought current, has performed in accordance with the contractual terms for a reasonable period of time, and the ultimate collectability of the total contractual principal and interest is no longer in doubt.
Loans held for investment are summarized into four different segments: residential loans, commercial and industrial loans, commercial real estate loans and consumer loans.
Residential Loans
Residential loans, substantially all of which finance the purchase of 1-to-4 family dwellings, are generally smaller in size and considered homogeneous as they exhibit similar product and risk characteristics. Loans in this category are placed on non-accrual status when they become 90 days past due and remain on non-accrual status until sufficient payments are received to bring the loan to current status. Residential loans are charged off at the time of an approved short sale and funds are received; information is received indicating an insufficient value and the borrower has not made a payment in six months; or a foreclosure sale is complete and the loan is being moved to other real estate owned.
Commercial and Industrial Loans
Commercial and industrial loans are funded for commercial and business purposes, including issuing letters of credit. The commercial business loan portfolio is comprised of loans for a variety of purposes which are generally secured by equipment, machinery, other occupied real estate and other business assets. Commercial business loans typically have terms of five years or less and interest rates that float in accordance with a designated published index. Substantially all such loans are secured and backed by the personal guarantees of the owners of the business. Loans in this category are placed on non-accrual status when they become 90 days past due or in the judgment of management the probability of collection of principal and interest is deemed to be insufficient to warrant further accrual. If a loan goes 90 days delinquent, the loan will remain on non-accrual status until the loan is brought current and there is evidence that the borrower has sufficient cash flow, income or liquidity to repay the loan in full. Commercial and industrial loans are charged off when information confirms that any portion of the recorded investment in a collateral dependent loan in excess of the fair value of the collateral is deemed a confirmed loss.
Commercial Real Estate Loans
Commercial real estate loans are primarily secured by apartment buildings, office and industrial buildings, land, warehouses, small retail shopping centers and various special purpose properties, including community-based residential facilities and senior housing. Although terms vary, commercial real estate loans generally have amortization periods of 15 to 30 years, as well as balloon payments of two to seven years. Loans in this category are placed on non-accrual status when they become 90 days past due or in the judgment of management the probability of collection of principal and interest is deemed to be insufficient to warrant further accrual. If a loan goes 90 days delinquent, the loan will remain on non-accrual status until the loan is brought current and there is evidence that the borrower has sufficient cash flow, income or liquidity to repay the loan in full. Commercial real estate loans are charged off when available information confirms that any portion of the recorded investment in a collateral dependent loan in excess of the fair value of the collateral is deemed a confirmed loss.
Consumer Loans
Consumer loans generally have higher interest rates than mortgage loans. The risk involved in consumer loans is based on the type and nature of the collateral and, in certain cases, the absence of collateral. Consumer loans include second mortgage and home equity loans, education loans, vehicle loans and other secured and unsecured loans that have been made for a variety of consumer purposes. Loans in this category are placed on non-accrual status when they become 90 days past due and remain on non-accrual status until sufficient payments are received to bring the loan to current status. Consumer loans are charged off when a recent valuation shows no
F-12
Table of Contents
surplus for the Corporation, upon repossession or sale of the collateral and deficiency is realized, or upon reaching 120 days past due if unsecured or 180 days past due if secured.
Loan Fees and Discounts. Certain loan origination, commitment and other loan fees and associated direct loan origination costs are deferred and amortized as an adjustment to the related loan’s yield. These amounts, as well as discounts on purchased loans, are amortized using a method that approximates level yield, adjusted for prepayments, over the life of the related loans.
Allowance for Loan Losses. The allowance for loan losses is maintained at a level believed appropriate by management to absorb probable and estimable losses inherent in the loan portfolio and is based on the size and current risk characteristics of the loan portfolio; an assessment of individual problem loans; actual and anticipated loss experience; and current economic events in specific industries and geographical areas. These economic events include unemployment levels, regulatory guidance, and general economic conditions. Determination of the allowance is inherently subjective as it requires significant estimates, including the amounts and timing of expected future cash flows on impaired loans, estimated losses on pools of homogeneous loans based on historical loss experience, and consideration of current economic trends, all of which may be susceptible to significant change. Loan losses are charged off against the allowance, while recoveries of amounts previously charged off are credited to the allowance. A provision for loan losses is recorded in the statement of operations based on management’s periodic evaluation of the factors previously mentioned as well as other pertinent factors. In addition, regulatory agencies periodically review the adequacy of the allowance for loan losses. These agencies may require the Corporation to make additions to the allowance for loan losses based on their judgments of collectability using information available to them at the time of their examination.
The allowance for loan losses consists of general and specific components. In determining the general allowance, the Corporation has defined the following segments within its loan portfolio: residential, commercial and industrial, commercial real estate and consumer. The Corporation has disaggregated those segments into the following classes based on risk characteristics: residential, commercial and industrial, land and construction, multi-family, retail/office and other commercial real estate within the commercial real estate segment and education and other consumer within the consumer segment. This additional detail allows management to better identify trends in borrower behavior and loss severity. A historical loss factor is computed for each class of loan and used as the major determinate of the general allowance for loan losses. In determining the appropriate period of activity to use in computing the historical loss factor management considers trends in quarterly net charge-off ratios. It is management’s intention to utilize a period of activity that it believes to be most reflective of current experience. Changes in the historical period are made when there is a distinct change in the trend of net charge-off experience. Management reviews each class’ historical losses by quarter for any trends that indicate the most representative look back period. The Corporation currently uses a eight quarter historical loss look-back period.
For the quarter ended June 30, 2013, the Bank modified its general allowance methodology to increase the historical loss period from a six to seven quarter historical look-back period and increased to an eight quarter look-back beginning in the quarter ended September, 2013. The modification was done to reflect a more stable economic environment and to capture additional loss statistics considered reflective of the current portfolio. The impact to the ALLL at September 30, 2013 after implementing the above modifications was a reduction of the required reserve of $2.0 million as compared to the previous methodology. In addition, as the Bank begins to increase its new loan originations, a new loan risk factor was added to capture the unique risk factor adjustments needed for loans originated after September 2012, reflecting a different risk level as compared to the existing legacy portfolio.
Management adjusts historical loss factors based on the following qualitative factors: changes in lending policies, procedures and practices; economic and industry trends and conditions; trends in terms and the volume of loans; experience, ability and depth of lending management; level of and trends in past dues and delinquent loans; changes in the quality of the loan review system; changes in the value of the underlying collateral for collateral dependent loans; changes in credit concentrations; other external factors such as legal and regulatory
F-13
Table of Contents
requirements; and changes in size of the portfolio. In determining the impact, if any, of an individual qualitative factor, management compares the current underlying facts and circumstances surrounding a particular factor with those in the historical periods, adjusting the historical loss factor based on changes in the qualitative factor. Management will continue to analyze the qualitative factors on a quarterly basis, adjusting the historical loss factor as necessary, to a factor believed to be appropriate for the probable and inherent risk of loss in the portfolio.
Specific allowance allocations are established for probable losses resulting from analysis of impaired loans. A loan is considered impaired when it is probable that the Corporation will be unable to collect all contractual principal and interest due according to the terms of the loan agreement. Impaired loans include all non-accrual loans and performing troubled debt restructurings. Troubled debt restructurings are loans that have been modified, due to financial difficulties of the borrower, where the terms of the modified loan are more favorable for the borrower than what the Corporation would normally accept. The fair value of impaired loans is determined based on the present value of expected future cash flows discounted at the loan’s effective interest rate or the fair value of the underlying collateral less costs to sell, if the loan is collateral dependent. Cash collections on impaired loans are generally credited to the loan receivable balance and no interest income is recognized on those loans until the principal balance is current.
Other Real Estate Owned. Real estate acquired by foreclosure or by deed in lieu of foreclosure as well as other repossessed assets (OREO) are held for sale and are initially recorded at fair value less a discount for estimated selling costs at the date of foreclosure. Any write down to fair value less estimated selling costs is charged to the allowance for loan losses. If the discounted fair value exceeds the net carrying value of the loans, recoveries to the allowance for loan losses are recorded to the extent of previous charge-offs, with any excess, which is infrequent, recognized as a gain in non-interest income. Subsequent to foreclosure, valuations are periodically performed and a valuation allowance is established if the carrying value exceeds the fair value less estimated selling costs. Costs relating to the development and improvement of the property may be capitalized; holding period costs and subsequent changes to the valuation allowance are charged to OREO expense, net included in non-interest expense. Incremental valuation adjustments may be recognized in the Statement of Operations if, in the opinion of management, additional losses are deemed probable.
Premises and Equipment. Premises and equipment are recorded at cost and include expenditures for new facilities and items that substantially increase the estimated useful lives (3 years to 40 years) of existing buildings and equipment. Expenditures for normal repairs and maintenance are charged to operations as incurred. When properties are retired or otherwise disposed of, the related cost and accumulated depreciation are removed from the respective accounts and any resulting gain or loss is recorded in income. The cost of office properties and equipment is being depreciated principally by the straight-line method over the estimated useful lives (3 years to 40 years) of the assets. The cost of capitalized leasehold improvements is depreciated on the straight-line method over the lesser of the term of the respective lease or estimated economic life.
Federal Home Loan Bank Stock. The Bank is a member of the Federal Home Loan Bank (FHLB) system which is organized as a member owned cooperative. As a result of membership in the FHLB system, the Bank is required to maintain a minimum investment in FHLB stock. The stock is redeemable at par and is, therefore, carried at cost and periodically evaluated for impairment. Ownership in the FHLB provides a potential dividend and allows access to member privileges including loans, advances, letters of credit and mortgage purchases. The stock is not transferable and cannot be used as collateral. The Bank has concluded that its investment in the stock of FHLB was not impaired at December 31, 2013.
Mortgage Servicing Rights. Mortgage servicing rights are recorded as an asset when loans are sold to third parties with servicing rights retained. The cost allocated to the mortgage servicing rights retained has been recognized as a separate asset and is initially recorded at fair value and subsequently amortized in proportion to, and over the period of, estimated net servicing revenues. The carrying value of these assets is periodically reviewed for impairment using a lower of amortized cost or fair value methodology. The fair value of the
F-14
Table of Contents
servicing rights is determined by estimating the present value of future net cash flows, taking into consideration market loan prepayment speeds, discount rates, servicing costs and other economic factors. For purposes of measuring fair value and impairment, the rights are stratified based on predominant risk characteristics of the underlying loans which include product type (i.e., fixed or adjustable) and interest rate bands. The amount of impairment recognized is the amount by which the amortized cost of the capitalized mortgage servicing rights on a strata-by-strata basis exceed their fair value.
Transfers of Financial Assets. Transfers of financial assets are accounted for as sales when control over the assets has been surrendered. Control over transferred assets is deemed to be surrendered when (1) the assets have been isolated from the Corporation, (2) the transferee obtains the right (free of conditions that constrain it from taking advantage of that right) to pledge or exchange the transferred assets, and (3) the Corporation does not maintain effective control over the transferred assets through an agreement to repurchase them before their maturity.
Deferred Stock Issuance Cost. Stock issuance costs include incremental direct costs incurred with third parties that are directly attributable to equity financing transactions. Those costs include legal and accounting fees and underwriters’ fees and expenses. Since certain of those costs are incurred in advance of receiving the proceeds from a planned equity financing transaction, they are deferred pending completion of the offering at which point the deferred costs are netted against stock issuance proceeds and recorded in equity.
As further discussed in Note 2—Significant Transactions, Significant Risks and Uncertainties, in connection with obtaining capital from an outside source, the Corporation filed for Chapter 11 in the Bankruptcy Court to implement a Plan of Reorganization in order to facilitate the restructuring of the Company and the recapitalization of the Bank. During the period of bankruptcy, $1.9 million of expenses, primarily comprised of professional fees, were incurred and expensed as reorganization costs in the current period. In connection with the recapitalization, we received gross proceeds of $175.0 million and incurred $14.4 million of capital raise or stock issuance costs all of which have been recorded in the Consolidated Statement of Changes in Stockholders’ Equity (Deficit).
In connection with the S-1 filing currently in process, the Corporation is pursuing an equity offering in the form of sale of or proposed issuance of additional common stock. At December 31, 2013, approximately $435,000 of direct, incremental costs incurred have been capitalized and included in other assets in the consolidated balance sheet.
Deferred Compensation Obligations. Deferred compensation obligations are the carrying value of stock associated with selected employee benefit plans. Such plans include a deferred compensation agreement with a previous executive established in 1986 and an Excess Benefit Plan to provide deferred compensation to certain members of management. No contributions were made to these plans during the nine months ended December 31, 2013 and 2012 or the fiscal years ended March 31, 2013 and 2012.
The carrying value of undistributed shares related to the deferred compensation obligations are recorded in a separate category of stockholders’ deficit titled accordingly and the liability is included in additional paid in capital in stockholders’ deficit in the consolidated balance sheets.
The obligations associated with these plans were cancelled as part of the Plan of Reorganization. As a result, there are no amounts recorded in the Consolidated Balance Sheets as of December 31, 2013 in relation to these plans. See Note 14 for further discussion of the plans.
Stock-Based Compensation Plan. The Corporation periodically grants stock-based compensation to employees and directors under various plans discussed in Note 14. The grants are generally in the forms of restricted stock and stock options. Compensation expense related to stock-based compensation was zero for the nine months
F-15
Table of Contents
ended December 31, 2013 and 2012, and was $55,000 and $256,000 for the fiscal years ended March 31, 2013 and 2012, respectively.
Reserve for Unfunded Commitments, Letters of Credit and Repurchase of Sold Loans. A reserve for unfunded commitments and letters of credit is determined by applying the general reserve loss factor used in the determination of the allowance for loan losses of the associated loan class to unfunded commitments of each class of performing loans. A reserve for potential losses related to the repurchase of sold loans is also maintained. This reserve is determined based on an analysis of probable loss associated with open repurchase requests and pending file reviews by the current owner of the underlying mortgage. The increase or decrease in the reserve for unfunded commitments and letters of credit is charged to non-interest expense. Adjustments to the reserve for repurchase of sold loans is included in non-interest expense. The entire reserve is included in other liabilities on the consolidated balance sheet.
Interest Rate Lock Commitments for Mortgage Loans Held for Sale. Interest rate lock commitments for mortgage loans originated for sale meet the definition of derivatives. These instruments are carried at fair value and included in other assets and other liabilities in the consolidated balance sheets with changes in value included in net gain on sale of loans in the consolidated statements of operations.
Income Taxes. The Corporation’s deferred income tax assets and liabilities are computed for differences between the financial statement and tax basis of assets and liabilities that will result in taxable or deductible amounts in the future based on enacted tax laws and rates applicable to periods in which the differences are expected to affect taxable income. Valuation allowances are established, when necessary, to reduce deferred tax assets to the amount expected to be realized. Income tax expense is the tax payable or refundable for the period adjusted for the change during the period in deferred tax assets and liabilities and associated valuation allowance. The Corporation and its subsidiaries file a consolidated federal income tax return and combined state income tax returns. An intercompany settlement of taxes paid is determined based on tax sharing agreements which generally provide for allocation of taxes to each entity on a separate return basis.
The Corporation is subject to the income tax laws of the U.S., its states and municipalities. These tax laws are complex and subject to different interpretations by the taxpayer and the relevant governmental taxing authorities. Accounting guidance related to uncertainty in income taxes provides a comprehensive model for how companies should recognize, measure, present and disclose in their financial statements uncertain tax positions taken or expected to be taken on a tax return. Under the guidance, tax positions shall initially be recognized in the financial statements when it is more likely than not the position will be sustained upon examination by the tax authorities. Such tax positions shall initially and subsequently be measured as the largest amount of tax benefit that is greater than 50% likely of being realized upon ultimate settlement with the tax authority assuming full knowledge of the position and all relevant facts. The guidance also revised disclosure requirements to include an annual tabular roll forward of unrecognized tax benefits. In establishing a provision for income tax expense, the Corporation must make judgments and interpretations about the application of these inherently complex tax laws within the framework of existing U.S. generally accepted accounting principles. The Corporation recognizes interest and penalties related to uncertain tax positions in other non-interest expense.
Earnings Per Share. Basic earnings per share (“EPS”) is computed by dividing net income (loss) available to common equity of the Corporation by the weighted average number of common shares outstanding for the period. The basic EPS computation excludes the dilutive effect of all common stock equivalents, if any. Diluted EPS is computed by dividing net income (loss) available to common equity by the weighted average number of common shares outstanding plus all potentially dilutive common shares which could be issued if securities or other contracts to issue common stock were exercised or converted into common stock or resulted in the issuance of common stock (“common stock equivalents”). While there are currently none, the Corporation’s common stock equivalents represent shares issuable under prior long-term incentive compensation plans. Such common stock equivalents were computed based on the treasury stock method using the average market price for the period.
F-16
Table of Contents
Comprehensive Income (Loss). Comprehensive income or loss is the total of reported net income or loss and all other revenues, expenses, gains and losses that under generally accepted accounting principles are not reported as net income (loss). As such, the Corporation includes unrealized gains or losses on securities available for sale in other comprehensive income (loss).
New Accounting Pronouncements.
ASU No. 2013-01, “Balance Sheet (Topic 210)—Clarifying the Scope of Disclosures about Offsetting Assets and Liabilities.” ASU 2013-01 addresses implementation issues about the scope of ASU 2011-11, “Balance Sheet (Topic 210)—Disclosures about Offsetting Assets and Liabilities” which requires entities to disclose both gross information and net information about both instruments and transactions eligible for offset in the statement of financial position and instruments and transactions subject to an agreement similar to a master netting arrangement. The objective of this disclosure is to facilitate comparison between those entities that prepare their financial statements on the basis of US GAAP and those entities that prepare their financial statements on the basis of IFRS. ASU 2013-01 and ASU 2011-11 were effective for annual reporting periods beginning on or after January 1, 2013 and interim periods within those annual periods. The required disclosures are presented in Note 11—Offsettting Assets and Liabilities.
ASU 2014-04, “Receivables—Troubled Debt Restructurings by Creditors (Subtopic 310-40)—Reclassification of Residential Real Estate Collateralized Consumer Mortgage Loans upon Foreclosure.” These amendments are intended to clarify when a creditor should be considered to have received physical possession of residential real estate property collateralizing a consumer mortgage loan such that the loan should be derecognized and the real estate recognized. Further, this amendment clarifies that an in substance repossession or foreclosure occurs, and a creditor is considered to have received physical possession of residential real estate property collateralizing a consumer mortgage loan, upon either: (1) the creditor obtaining legal title to the residential real estate property upon completion of a foreclosure, or (2) the borrower conveying all interest in the residential real estate property to the creditor to satisfy that loan through completion of a deed in lieu of foreclosure or through a similar legal agreement. ASU 2014-04 is effective for public companies for annual periods and interim periods within those annual periods beginning after December 15, 2014. The Corporation has not yet evaluated the effect this ASU will have on its consolidated financial statements.
ASC Topic 740 “Income Taxes.” New authoritative accounting guidance under ASC Topic 740, “Income Taxes” amended prior guidance to include explicit guidance on the financial statement presentation of an unrecognized tax benefit when a net operating loss carryforward, a similar tax loss, or a tax credit carryforward exists. An unrecognized tax benefit, or a portion of an unrecognized tax benefit, should be presented in the financial statements as a reduction to a deferred tax asset for a net operating loss carryforward, a similar tax loss, or a tax credit carryforward, except as follows. To the extent a net operating loss carryforward, a similar tax loss, or a tax credit carryforward is not available at the reporting date under the tax law of the applicable jurisdiction to settle any additional income taxes that would result from the disallowance of a tax position or the tax law of the applicable jurisdiction does not require the entity to use, and the entity does not intend to use, the deferred tax asset for such purpose, the unrecognized tax benefit should be presented in the financial statements as a liability and should not be combined with deferred tax assets. The new authoritative guidance will be for reporting periods after January 1, 2014 and is not expected to have an impact on the Corporation’s statements of operations and financial condition.
Reclassifications. Prior period amounts have been reclassified as needed to conform to the current period presentations. There was no impact on earnings or stockholders’ equity (deficit) as a result of the reclassifications.
F-17
Table of Contents
Note 2—Significant Transactions, Significant Risks and Uncertainties
Bankruptcy Proceedings and Emergence from Chapter 11
Background
Headquartered in Madison, Wisconsin, the Company is a savings and loan holding company that operates primarily through AnchorBank, its wholly owned banking subsidiary. The Bank is a $2.11 billion bank and Wisconsin’s largest thrift and offers personal and business banking services to more than 110,000 households and businesses.
As a result of the economic downturn, significant operating losses beginning in fiscal 2009, significant levels of criticized assets and low levels of capital raised substantial doubt about the Corporation’s ability to continue as a going concern. The Company and the Bank were operating under Orders to Cease and Desist issued by the Office of Thrift Supervision in 2009, and the Corporation had outstanding $116.3 million owed to various lenders led by U.S. Bank under a short term line of credit (the “Credit Agreement”) which it was unable to repay. Additionally, the Company obtained funds in 2009 by issuing senior preferred shares as part of the Troubled Asset Relief Program (“TARP”). These funds were then distributed downstream to Anchor Bank. The Corporation continued to negotiate and obtain amendments to the Credit Agreement and diligent efforts were made to seek qualified sources of outside capital.
In 2013, we executed the following transaction (“Plan of Reorganization”) associated with recapitalizing the Company and the Bank: (i) made a discounted cash payment of $49.0 million in satisfaction of the approximately $183.5 million of senior secured bank debt and accrued interest and fees held by a three member bank groups led by U.S. Bank; (ii) exchanged senior preferred stock issued as part of the TARP for $6.0 million or 60.0 million common shares; (iii) issued new common stock in consideration of $175 million in new equity capital; and (iv) eliminated the Legacy Common Stock for no consideration. To effect the transaction, we filed for Chapter 11 in the Bankruptcy Court to implement the Plan of Reorganization in order to facilitate the restructuring of the Company and the recapitalization of the Bank.
Bankruptcy Proceedings
On August 12, 2013, the Company filed a voluntary petition for relief (the “Chapter 11 Case”) under the provisions of chapter 11 of title 11 of the United States Code, 11 U.S.C. §§ 101, et seq. (the “Bankruptcy Code”), Case No. 13-14003-rdm, in the United States Bankruptcy Court for the Western District of Wisconsin (the “Bankruptcy Court”) to implement the Plan of Reorganization in order to facilitate the restructuring of the Company and the recapitalization of the Bank. Prior to the petition date, U.S. Bank National Association and Bank of America, N.A., as senior secured creditors of the Company (the “Lenders”), and the Treasury, as sole preferred stockholder of the Company, voted to accept the Plan of Reorganization.
On August 30, 2013, the Bankruptcy Court entered the Confirmation Order, by which it confirmed the Plan of Reorganization. On September 27, 2013 (the “Effective Date”), the Plan of Reorganization became effective in accordance with its terms. During the period of bankruptcy, we incurred and expensed $1.9 million of reorganization costs, primarily comprised of professional fees.
Emergence Accounting
Upon emergence, we determined we did not meet the requirements to apply fresh start reporting under applicable accounting standards because we did not meet the solvency criteria of ASC 852-10-45-19. The reorganization value immediately before the date of confirmation was greater than the total of all post-petition liabilities and allowed claims and, therefore, indicative of not meeting the test to require fresh start accounting under ASC 852. As of the date of confirmation, we estimated our enterprise value (or reorganization value) to be approximately $2.2 billion. The Company utilized the equity value using the income and market approach to approximate fair
F-18
Table of Contents
value. Accordingly, our financial statements do not include fresh start reporting, whereby the Company would have to revalue all of its assets and liabilities. At the time of filing for the Chapter 11 Case, we identified liabilities subject to compromise of $188.3 million, which included the outstanding Credit Agreement of approximately $116.3 million, interest and fees due under the Credit Agreement of $67.2 million and $4.8 million in other liabilities.
Plan of Reorganization. Below is a summary of the significant transactions affecting the Company as a result of the effectiveness of the Plan of Reorganization.
Delaware Conversion
Pursuant to the Plan of Reorganization, on September 25, 2013, we (i) converted from a Wisconsin corporation to a Delaware corporation in accordance with Section 265 of the Delaware General Corporation Law and (ii) filed a Certificate of Incorporation with the Secretary of State of the State of Delaware (the “Amended Charter”), to, among other things, declassify our Board, increase the number of authorized shares of our common stock and adopt certain restrictions on acquisitions and dispositions of our securities. The Amended Charter provides for (a) 2,000,000,000 shares of authorized common stock, par value $0.01 per share (the “Common Stock”), and (b) 1,000,000 shares of authorized preferred stock, par value $0.01 per share. A reverse stock split was effected and a subsequent amendment to the corporate charter was filed on October 2, 2013 providing for 11,900,000 shares of authorized common stock, par value $0.01 per share and 100,000 shares of authorized preferred stock, par value $0.01. There are 9,050,000 shares of Common Stock outstanding as of December 31, 2013.
Private Placements
In connection with the Plan of Reorganization, we entered into stock purchase agreements with certain institutional and other private investors and directors and officers of the Company (the “Investors”) for the purchase and sale of 1,750,000,000 (adjusted on October 2, 2013 as a result of a reverse stock split to 8,750,000 shares) shares of our Common Stock at a purchase price of $0.10 per share.
Pursuant to the stock purchase agreements, we issued and sold the Common Stock to (i) certain Investors such that, after giving effect to the transactions contemplated in the Plan of Reorganization, each such Investor owns up to 9.9% of the Common Stock pursuant to the Private Placements and the Treasury Issuance (as defined below), for an aggregate purchase price of $87.8 million, (ii) certain other Investors such that, after giving effect to the transactions contemplated in the Plan of Reorganization, each such Investor owns up to 4.9% of the Authorized Common Stock pursuant to the Private Placements and the Treasury Issuance, for an aggregate purchase price of $83.7 million, and (iii) certain directors and officers of the Company for an aggregate purchase price of $3.5 million. We received gross proceeds of $175.0 million as a result of the Private Placements and incurred $14.4 million of capital raise costs all of which have been recorded in the Consolidated Statement of Changes in Stockholders’ Equity (Deficit).
TARP Exchange
On January 30, 2009, pursuant to the Treasury’s Capital Purchase Program, we issued and sold to the Treasury 110,000 shares of Fixed Rate Cumulative Perpetual Preferred Stock, Series B of the Company with an aggregate liquidation preference of $110.0 million (the “TARP Preferred Stock”). In addition, we issued to the Treasury a warrant (the “TARP Warrant”) to purchase up to 7,399,103 shares of our common stock, par value $0.10 per share (the “Legacy Common Stock”), at an initial per share exercise price of $2.23. Pursuant to the Plan of Reorganization, we, on the Effective Date and immediately following the consummation of the Private Placements, (i) exchanged the TARP Preferred Stock for 60.0 million shares (adjusted to 300,000 shares as a result of the reverse stock split) of Common Stock (the “Treasury Issuance”) and (ii) cancelled the TARP Warrant in its entirety (collectively, the “TARP Exchange”). The difference between the Common Stock issued
F-19
Table of Contents
and the Preferred Stock redeemed of $104.0 million was recorded as an increase directly to retained earnings. The $104.0 million represents a return from the Preferred stockholder thereby increasing the amount available to common stockholders for purposes of earnings per share.
Following the effectiveness of the Plan of Reorganization, the Treasury sold to certain institutional investors (the “Secondary Investors”) all of the shares of Common Stock delivered to the Treasury in connection with the Treasury Issuance at a purchase price equal to $0.10 per share (the “Secondary Treasury Sales”) under the securities purchase agreements, dated as of September 19, 2013, among the Treasury, the Secondary Investor and (with respect to certain provisions) the Company. In connection with the Secondary Treasury Sales, we entered into secondary sale purchaser agreements with the Secondary Investors pursuant to which we made certain representations and warranties to the Investor and provided rights to the Secondary Investors similar to the rights provided to Investors under the Stock Purchase Agreements. In connection with the Secondary Treasury Sales, the Treasury received gross proceeds of $6.0 million and ceased to be our stockholder.
Cancellation of Legacy Common Stock
As of July 31, 2013, we had 21,247,225 shares of Legacy Common Stock issued and outstanding. On the Effective Date, immediately following the consummation of the TARP Exchange, all shares of the outstanding Legacy Common Stock including those shares held as treasury stock and in any stock incentive plans were cancelled for no consideration pursuant to the Plan of Reorganization. In connection with the cancellation of the Legacy Common Stock pursuant to the Plan of Reorganization, the Rights Agreement, dated as of November 5, 2010, by and between the Company and American Stock Transfer & Trust Company, LLC was terminated on the Effective Date in accordance with its terms.
Senior Debt Settlement
We were a party to the Amended and Restated Credit Agreement, dated as of June 9, 2008, among the Company, the lenders from time to time a party thereto (the “Lenders”), and U.S. Bank National Association, as administrative agent for the Lenders. As of June 30, 2013, the aggregate amount of obligations under the Credit Agreement was approximately $183.5 million (including with respect to unpaid principal balance, accrued but unpaid interest thereon and all administrative and other fees or penalties). On the Effective Date, pursuant to the Plan of Reorganization, we satisfied all of our obligations under the Credit Agreement by a cash payment to the Lenders of $49.0 million (plus expense reimbursement as contemplated by the Credit Agreement). As a result of the transaction, we recognized a gain on extinguishment of debt of $134.5 million.
All Other Claims Unaffected
All other claims were unaffected by, and were paid in full under, the Plan of Reorganization.
Regulatory Agreements
The Bank’s primary regulator is the Office of the Comptroller of the Currency (“OCC”). The Federal Reserve is the primary regulator of the Corporation. On June, 26, 2009, the Corporation and the Bank each consented to the issuance of an Order to Cease and Desist (the “Corporation Order” and the “Bank Order,” respectively, and together, the “C&D Orders”).
The Corporation Order requires the Corporation to notify, and in certain cases to obtain the permission of, the Federal Reserve prior to: (i) declaring, making or paying any dividends or other capital distributions on its capital stock, including the repurchase or redemption of its capital stock; (ii) incurring, issuing, renewing or rolling over any debt, increasing any current lines of credit or guaranteeing the debt of any entity; (iii) making certain changes to its directors or senior executive officers; (iv) entering into, renewing, extending or revising any contractual arrangement related to compensation or benefits with any of its directors or senior executive officers;
F-20
Table of Contents
and (v) making any golden parachute payments or prohibited indemnification payments. In July 2010, the Corporation developed and submitted to the Office of Thrift Supervision, the Corporation’s primary regulator at the time until it was disbanded in 2011 and the Federal Reserve assumed the role of primary regulator, a three-year cash flow plan, which must be reviewed at least quarterly by the Corporation’s management and board of directors for material deviations between cash flow plan projections and actual results (the “Variance Analysis Report”). Within 45 days following the end of each quarter, the Corporation is required to provide and has been providing the Federal Reserve its Variance Analysis Report for that quarter.
The Bank Order requires the Bank to notify, or in certain cases obtain the permission of, the OCC prior to (i) increasing its total assets in any quarter in excess of an amount equal to net interest credited on deposit liabilities during the quarter; (ii) accepting, rolling over or renewing any brokered deposits; (iii) making certain changes to its directors or senior executive officers; (iv) entering into, renewing, extending or revising any contractual arrangement related to compensation or benefits with any of its directors or senior executive officers; (v) making any golden parachute or prohibited indemnification payments; (vi) paying dividends or making other capital distributions on its capital stock; (vii) entering into certain transactions with affiliates; and (viii) entering into third-party contracts outside the normal course of business. The Bank also developed and submitted within the prescribed time periods, a written capital restoration plan, a problem asset plan, a revised business plan, and an implementation plan resulting from a review of commercial lending practices. The Orders also require the Bank to regularly review its current liquidity management policy and the adequacy of its allowance for loan and lease losses.
The Bank is also subject to a capital restoration plan including the PCA Directive. Under the PCA Directive, the Bank must obtain prior written approval before entering into any contract or lease for the purchase or sale of real estate or of any interest therein, except for contracts entered into in the ordinary course of business for the purchase or sale of other real estate owned due to foreclosure (“OREO”) where the contract does not exceed $3.5 million and the sales price of the OREO does not fall below 85% of the net carrying value of the OREO.
The Orders also stipulated that, as of September 30, 2009, the Bank was required to meet and maintain both a core capital ratio equal to or greater than 7% and a total risk-based capital ratio equal to or greater than 11%. Further, as of December 31, 2009, the Orders required the Bank to meet and maintain both a core capital ratio equal to or greater than 8% and a total risk-based capital ratio equal to or greater than 12%.
As disclosed above, pursuant to a pre-packaged plan of reorganization (the “Plan of Reorganization”) to facilitate the restructuring of the Corporation and the recapitalization of the Bank, the Corporation completed a capital raise and received gross proceeds of $175.0 million.
At December 31, 2013, the Bank had a tier 1 leverage (core) ratio of 9.60% and a total risk-based capital ratio of 17.07%, each meeting the required capital ratios set forth above. As a result of the Plan of Reorganization and the recapitalization of the Bank, the Bank is in compliance with the tier 1 (core) leverage and total risk-based capital ratios as required by the Bank Order. All customer deposits remain fully insured to the highest limits set by the FDIC.
Note 3—Restrictions on Cash and Due From Bank Accounts
AnchorBank fsb (Bank) is required to maintain reserve balances in cash or on deposit with the Federal Reserve Bank based on a percentage of deposits. The average amount of required reserve balances for the nine months ended December 31, 2013 was approximately $1.3 million and for the fiscal year ended March 31, 2013 was approximately $5.5 million. The Bank met the required reserves with cash balances in the branch system.
The Bank is required to maintain an account with its official check service provider equal to one day’s average remittance. The balance in this restricted account was $4.5 million at December 31, 2013 and March 31, 2013.
F-21
Table of Contents
The Bank is required to maintain an account pledged in favor of a Government-sponsored enterprise to enter into cash purchase contracts and/or mandatory master commitments. At December 31, 2013 and March 31, 2013, the balance in the restricted account was $1.0 million and zero, respectively.
The Bank is required to maintain an account with its prepaid card provider equal to one day’s average settlement. At December 31, 2013 and March 31, 2013, the balance in the restricted account was $5,000 and zero, respectively.
Investment Directions Inc. (IDI), a subsidiary of the Corporation, had a security interest in an interest reserve escrow account in conjunction with a lending arrangement resulting from the sale in 2009 of its investment in a real estate development company. At December 31, 2013 and March 31, the interest reserve escrow was zero and $174,000, respectively.
The nature of the Corporation’s business requires that it maintain amounts due from banks and federal funds sold which, at times, may exceed federally insured limits. Management monitors these correspondent relationships and has not experienced any losses in such accounts.
Note 4—Investment Securities
The amortized cost and fair value of investment securities are as follows:
| Amortized Cost |
Gross Unrealized | Fair Value |
||||||||||||||
| Gains | Losses | |||||||||||||||
| (In thousands) | ||||||||||||||||
| December 31, 2013 |
||||||||||||||||
| Available for sale: |
||||||||||||||||
| U.S. government sponsored and federal agency obligations |
$ | 3,359 | $ | 17 | $ | — | $ | 3,376 | ||||||||
| Corporate stock and bonds |
88 | 267 | — | 355 | ||||||||||||
| Non-agency CMOs (1) |
6,452 | 9 | (253 | ) | 6,208 | |||||||||||
| Government sponsored agency mortgage-backed securities (1)(2) |
50,721 | 160 | (723 | ) | 50,158 | |||||||||||
| GNMA mortgage-backed securities (1)\(2) |
223,874 | 1,056 | (7,155 | ) | 217,775 | |||||||||||
|
|
|
|
|
|
|
|
|
|||||||||
| $ | 284,494 | $ | 1,509 | $ | (8,131 | ) | $ | 277,872 | ||||||||
|
|
|
|
|
|
|
|
|
|||||||||
| March 31, 2013 |
||||||||||||||||
| Available for sale: |
||||||||||||||||
| U.S. government sponsored and federal agency obligations |
$ | 3,444 | $ | 60 | $ | — | $ | 3,504 | ||||||||
| Corporate stock and bonds |
152 | 112 | — | 264 | ||||||||||||
| Non-agency CMOs (1) |
7,885 | 15 | (351 | ) | 7,549 | |||||||||||
| Government sponsored agency mortgage-backed securities (1)(2) |
2,975 | 209 | — | 3,184 | ||||||||||||
| GNMA mortgage-backed securities (1)\(2) |
248,752 | 3,907 | (373 | ) | 252,286 | |||||||||||
|
|
|
|
|
|
|
|
|
|||||||||
| $ | 263,208 | $ | 4,303 | $ | (724 | ) | $ | 266,787 | ||||||||
|
|
|
|
|
|
|
|
|
|||||||||
| (1) | Primarily collateralized by residential mortgages. |
| (2) | Includes mortgage-backed securities and CMOs. |
Independent pricing services are used to value all investment securities. One pricing service is used to value all securities except the non-agency CMOs. A specialized pricing service is used for valuation of the non-agency CMO portfolio.
F-22
Table of Contents
To estimate the fair value of non-agency CMOs, the pricing service valuation model discounted estimated expected cash flows after credit losses at rates ranging from 4% to 7%. The rates utilized are based on the risk free rate equivalent to the remaining average life of the security, plus a spread for normal liquidity and a spread to reflect the uncertainty of the cash flow estimates. The pricing service benchmarks its fair value results to other pricing services and monitors the market for actual trades. The cash flow model includes these inputs in its derivation of the discount rates used to estimate fair value. There are no payments in kind allowed on these non-agency CMOs.
The table below presents the fair value and gross unrealized losses of securities in a loss position, aggregated by investment category and length of time that individual holdings have been in a continuous unrealized loss position at December 31, 2013 and March 31, 2013.
| Unrealized Loss Position | ||||||||||||||||||||||||
| Less than 12 months | 12 months or More | Total | ||||||||||||||||||||||
| Fair Value | Unrealized Loss |
Fair Value | Unrealized Loss |
Fair Value | Unrealized Loss |
|||||||||||||||||||
| (In thousands) | ||||||||||||||||||||||||
| December 31, 2013 |
||||||||||||||||||||||||
| Non-agency CMOs |
$ | 1,219 | $ | (7 | ) | $ | 4,776 | $ | (246 | ) | $ | 5,995 | $ | (253 | ) | |||||||||
| Government sponsored agency mortgage-backed securities (1) |
47,480 | (723 | ) | — | — | 47,480 | (723 | ) | ||||||||||||||||
| GNMA mortgage-backed securities |
140,824 | (5,143 | ) | 25,449 | (2,012 | ) | 166,273 | (7,155 | ) | |||||||||||||||
|
|
|
|
|
|
|
|
|
|
|
|
|
|||||||||||||
| $ | 189,523 | $ | (5,873 | ) | $ | 30,225 | $ | (2,258 | ) | $ | 219,748 | $ | (8,131 | ) | ||||||||||
|
|
|
|
|
|
|
|
|
|
|
|
|
|||||||||||||
| March 31, 2013 |
||||||||||||||||||||||||
| Non-agency CMOs |
$ | — | $ | — | $ | 6,674 | $ | (351 | ) | $ | 6,674 | $ | (351 | ) | ||||||||||
| GNMA mortgage-backed securities |
82,822 | (373 | ) | — | — | 82,822 | (373 | ) | ||||||||||||||||
|
|
|
|
|
|
|
|
|
|
|
|
|
|||||||||||||
| $ | 82,822 | $ | (373 | ) | $ | 6,674 | $ | (351 | ) | $ | 89,496 | $ | (724 | ) | ||||||||||
|
|
|
|
|
|
|
|
|
|
|
|
|
|||||||||||||
| (1) | Includes mortgage-backed securities and CMOs. |
In 2008, the Company received proceeds in connection with shares redeemed as part of the Visa, Inc. initial public offering. The Bank was a member of the former Visa, Inc. payments organization and was issued shares when Visa, Inc. was organized. Approximately 39% of those shares were redeemed in connection with the public offering. The remaining shares are restricted because of unsettled litigation pending against Visa, Inc. At its discretion, Visa, Inc. may redeem additional shares in order to resolve pending litigation. The restriction expires upon resolution of the pending litigation. Accordingly, the Company has recorded these shares at zero in the consolidated balance sheets. Upon expiration of the restriction, the Company expects to record the fair value of the remaining shares.
Other-Than-Temporary Impairment
The number of individual securities in the tables above total 35 at December 31, 2013 and 15 at March 31, 2013. Although these securities have declined in value, the unrealized losses are considered temporary. Management evaluates securities for other-than-temporary impairment on a quarterly basis, and more frequently when economic or market concerns warrant such evaluation. In estimating other-than-temporary impairment losses on investment securities, management considers many factors which include: (1) the length of time and the extent to which the fair value has been less than cost, (2) the financial condition and near-term prospects of the issuer, and (3) the intent and ability of the Corporation to retain its investment for a period of time sufficient to allow for any anticipated recovery in fair value.
F-23
Table of Contents
To determine if an other-than-temporary impairment exists on a debt security with an unrealized loss, the Corporation first determines if (a) it intends to sell the security or (b) it is more likely than not that it will be required to sell the security before its anticipated recovery. If either of the conditions is met, an other-than-temporary impairment loss is recognized in earnings equal to the difference between the security’s fair value and its amortized cost basis. If neither condition is met, the Corporation determines (a) the amount of the impairment related to credit loss and (b) the amount of the impairment due to all other factors. The difference between the present values of the cash flows expected to be collected, discounted at the purchase yield or current accounting yield of the security, and the amortized cost basis is the credit loss. The credit loss is the portion of the impairment that is deemed other-than-temporary and recognized in earnings and is a reduction in the cost basis of the security. The portion of impairment related to all other factors is deemed temporary and included in other comprehensive income (loss).
An independent pricing service is utilized to run a discounted cash flow model in the calculation of other-than-temporary impairment losses on non-agency CMOs. This model determines the portion of the impairment that is other-than-temporary due to credit losses, and the portion that is temporary due to all other factors.
The significant inputs used for calculating the credit loss portion of securities with other-than-temporary impairment (“OTTI”) include prepayment assumptions, loss severities, original FICO scores, historical rates of delinquency, percentage of loans with limited underwriting, historical rates of default, original loan-to-value ratio, aggregate property location by metropolitan statistical area, original credit support, current credit support, and weighted-average maturity.
The discount rates used to establish the net present value of expected cash flows for purposes of determining OTTI ranged from 4% to 7%. These rates equate to the effective yield implicit in the security at the date of acquisition of the bonds for which OTTI has not been previously incurred. For bonds with previously recorded OTTI, the discount rate used equates to the accounting yield on the security as of the valuation date.
Default rates were calculated separately for each category of underlying borrower based on delinquency status (i.e. current, 30 to 59 days delinquent, 60 to 89 days delinquent, 90+ days delinquent, and foreclosure balances) of the underlying loans as of December 31, 2013. This data is entered into a loss migration model to calculate projected default rates, which are benchmarked against results that have recently been experienced by other major servicers of non-agency CMOs with similar attributes. The month one to month 24 constant default rate in the model ranged from 5.30% to 11.60%.
At December 31, 2013, six non-agency CMOs with a fair value of $6.2 million and an adjusted cost basis of $6.4 million were other-than-temporarily impaired. At March 31, 2013, six non-agency CMOs with a fair value of $6.9 million and an adjusted cost basis of $7.3 million were other-than-temporarily impaired. Unrealized other-than-temporary impairment due to credit losses of $23,000 and $408,000 was included in earnings for the nine months ended December 31, 2013 and the fiscal year ended March 31, 2013, respectively. For the nine months ended December 31, 2013 and the fiscal year ended March 31, 2013, realized losses of $224,000 and $722,000, respectively, related to credit issues (i.e. – principal reduced without a receipt of cash) were incurred that were previously recognized in earnings as unrealized other-than-temporary impairment.
Unrealized losses on U.S. government sponsored and federal agency obligations, corporate stocks and bonds and Ginnie Mae (“GNMA”) mortgage-backed securities as of December 31, 2013 and March 31, 2013 due to changes in interest rates and other non-credit related factors totaled $7.9 million and $373,000, respectively. The Corporation has analyzed these securities for evidence of other-than-temporary impairment and concluded that no OTTI exists and that the unrealized losses are properly classified in accumulated other comprehensive income (loss).
F-24
Table of Contents
The following table is a roll forward of the amount of other-than-temporary impairment related to credit losses that have been recognized in earnings for which a portion of impairment was deemed temporary and recognized in other comprehensive income for the periods presented:
| Nine Months Ended December 31, | Year Ended March 31, | |||||||||||||||
| 2013 | 2012 | 2013 | 2012 | |||||||||||||
| (Unaudited) | ||||||||||||||||
| (In thousands) | ||||||||||||||||
| Beginning balance of unrealized OTTI related to credit losses |
$ | 1,002 | $ | 2,391 | $ | 2,391 | $ | 2,197 | ||||||||
| Additional unrealized OTTI related to credit losses for which OTTI was previously recognized |
23 | 329 | 412 | 558 | ||||||||||||
| Debit related OTTI previously recognized for OTTI recovery during the period |
5 | — | — | — | ||||||||||||
| Credit related OTTI previously recognized for securities sold during the period |
— | (389 | ) | (1,075 | ) | — | ||||||||||
| Credit related OTTI previously recognized for securities paid-off during the period |
— | (4 | ) | (4 | ) | 0 | ||||||||||
| Decrease for realized amount of credit losses for which unrealized credit related OTTI was previously recognized |
(229 | ) | (549 | ) | (722 | ) | (364 | ) | ||||||||
|
|
|
|
|
|
|
|
|
|||||||||
| Ending balance of unrealized OTTI related to credit losses |
$ | 801 | $ | 1,778 | $ | 1,002 | $ | 2,391 | ||||||||
|
|
|
|
|
|
|
|
|
|||||||||
On a cumulative basis, other-than-temporary impairment losses recognized in earnings by year of vintage were as follows:
| Year of Vintage |
December 31, 2013 | |||
| (In thousands) | ||||
| Prior to 2005 |
$ | 7 | ||
| 2005 |
258 | |||
| 2006 |
— | |||
| 2007 |
536 | |||
|
|
|
|||
| $ | 801 | |||
|
|
|
|||
The cost of investment securities sold is determined using the specific identification method. Sales of investment securities available for sale are summarized below:
| Nine Months Ended December 31, | Year Ended March 31, | |||||||||||||||
| 2013 | 2012 | 2013 | 2012 | |||||||||||||
| (Unaudited) | ||||||||||||||||
| (In thousands) | ||||||||||||||||
| Proceeds from sales & calls (1) |
$ | 356 | $ | 6,359 | $ | 12,780 | $ | 338,224 | ||||||||
|
|
|
|
|
|
|
|
|
|||||||||
| Gross gains |
$ | 292 | $ | 90 | $ | 91 | $ | 6,618 | ||||||||
| Gross losses |
— | (137 | ) | (338 | ) | (39 | ) | |||||||||
|
|
|
|
|
|
|
|
|
|||||||||
| Net gain/(loss) on sales & calls (1) |
$ | 292 | $ | (47 | ) | $ | (247 | ) | $ | 6,579 | ||||||
|
|
|
|
|
|
|
|
|
|||||||||
| (1) | Includes proceeds of $517,000 received during the fiscal year ended March 31, 2013 by the issuers of investment securities exercising the right to call the securities. This resulted in a gain of $18,000. |
F-25
Table of Contents
At December 31, 2013 and March 31, 2013, investment securities available for sale with a fair value of approximately $162.8 million and $187.2 million, respectively, were pledged to secure deposits, borrowings and for other purposes as permitted or required by law.
The fair values of investment securities by contractual maturity at December 31, 2013 are shown below. Actual maturities may differ from contractual maturities because issuers have the right to call or prepay obligations with or without call or prepayment penalties.
| Within 1 Year |
After 1 Year through 5 Years |
After 5 Years through 10 Years |
Over Ten Years |
Total | ||||||||||||||||
| (In thousands) | ||||||||||||||||||||
| U.S. government sponsored and federal agency obligations |
$ | — | $ | 3,376 | $ | — | $ | — | $ | 3,376 | ||||||||||
| Corporate stock and bonds |
— | — | — | 355 | 355 | |||||||||||||||
| Non-agency CMOs |
— | — | — | 6,208 | 6,208 | |||||||||||||||
| Government sponsored agency mortgage-backed securities (1) |
— | 191 | 4,938 | 45,029 | 50,158 | |||||||||||||||
| GNMA mortgage-backed securities |
— | 270 | — | 217,505 | 217,775 | |||||||||||||||
|
|
|
|
|
|
|
|
|
|
|
|||||||||||
| Total |
$ | — | $ | 3,837 | $ | 4,938 | $ | 269,097 | $ | 277,872 | ||||||||||
|
|
|
|
|
|
|
|
|
|
|
|||||||||||
| (1) | Includes mortgage-backed securities and CMOs. |
Note 5—Loans Receivable
Loans receivable held for investment consist of the following:
| December 31, | March 31, | |||||||
| 2013 | 2013 | |||||||
| (In thousands) | ||||||||
| Residential |
$ | 529,777 | $ | 547,720 | ||||
| Commercial and industrial |
21,591 | 30,574 | ||||||
| Commercial real estate: |
||||||||
| Land and construction |
92,050 | 111,953 | ||||||
| Multi-family |
281,917 | 287,447 | ||||||
| Retail/office |
154,075 | 198,686 | ||||||
| Other commercial real estate |
174,313 | 172,857 | ||||||
| Consumer: |
||||||||
| Education |
129,520 | 166,429 | ||||||
| Other consumer |
238,311 | 247,530 | ||||||
|
|
|
|
|
|||||
| Total unpaid principal balance |
1,621,554 | 1,763,196 | ||||||
| Undisbursed loan proceeds (1) |
(10,322 | ) | (10,997 | ) | ||||
| Unamortized loan fees, net |
(1,722 | ) | (1,838 | ) | ||||
| Unearned interest |
(4 | ) | (3 | ) | ||||
|
|
|
|
|
|||||
| Total loan contra balances |
(12,048 | ) | (12,838 | ) | ||||
|
|
|
|
|
|||||
| Loans held for investment |
1,609,506 | 1,750,358 | ||||||
| Allowance for loan losses |
(65,182 | ) | (79,815 | ) | ||||
|
|
|
|
|
|||||
| Loans held for investment, net |
$ | 1,544,324 | $ | 1,670,543 | ||||
|
|
|
|
|
|||||
| (1) | Undisbursed loan proceeds are funds to be released upon a draw request approved by the Corporation. |
F-26
Table of Contents
Residential Loans
At December 31, 2013, $529.8 million, or 32.7%, of the total loans unpaid principal balance receivable consisted of residential loans, substantially all of which were 1-to-4 family dwellings. Residential loans consist of both adjustable and fixed-rate loans. The adjustable-rate loans currently in the portfolio have up to 30-year maturities and terms which provide for annual increases or decreases of the rate on the loans, based on a designated index. These rate changes are generally subject to a limit of 2% per adjustment and an aggregate 6% adjustment over the life of the loan. These loans are documented according to standard industry practices. The Corporation makes a limited number of interest-only loans which tend to have a shorter term to maturity and does not originate negative amortization and option payment adjustable rate mortgages.
Adjustable-rate loans decrease the risks associated with changes in interest rates but involve other risks, primarily because as interest rates rise, the payment by the borrower rises to the extent permitted by the terms of the loan, thereby increasing the potential for default. At the same time, the marketability of the underlying property may be adversely affected by higher interest rates. These risks, which have not had a material adverse effect to date, generally are less than the risks associated with holding fixed-rate loans in an increasing interest rate environment. Also, as interest rates decline, borrowers may refinance their mortgages into fixed-rate loans thereby prepaying the balance of the loan prior to maturity. At December 31, 2013, approximately $324.0 million, or 61.2%, of the held for investment residential loans unpaid principal balance consisted of loans with adjustable interest rates.
The Corporation continues to originate long-term, fixed-rate conventional mortgage loans. Current production of these loans with terms of 15 years or more are generally sold to Fannie Mae, Freddie Mac and other institutional investors, while a portion of loan production is retained in the held for investment portfolio. In order to provide a full range of products to its customers, the Corporation also participates in the loan origination programs of Wisconsin Housing and Economic Development Authority (“WHEDA”), Wisconsin Department of Veterans Affairs (“WDVA”) and the Federal Housing Administration (“FHA”). The right to service substantially all loans sold is retained.
At December 31, 2013, approximately $205.8 million, or 38.8%, of the held for investment residential loans unpaid principal balance consisted of loans with fixed rates of interest. Although these loans generally provide for repayments of principal over a fixed period of 10 to 30 years, because of prepayments and due-on-sale clauses, such loans generally remain outstanding for a shorter period of time.
Commercial and Industrial Loans
The Corporation originates loans for commercial and business purposes, including issuing letters of credit. At December 31, 2013, the unpaid principal balance receivable of commercial and industrial loans amounted to $21.6 million, or 1.3%, of the total loans unpaid principal balance receivable. The commercial and industrial loan portfolio is comprised of loans for a variety of business purposes and generally are secured by equipment, machinery and other corporate assets. These loans generally have terms of seven years or less and interest rates that float in accordance with a designated published index. Substantially all such loans are secured and backed by the personal guarantees of the owners of the business.
Commercial Real Estate Loans
The Corporation originates commercial real estate loans which include land and construction, multi-family, retail/office and other commercial real estate. Such loans generally have adjustable rates and shorter terms than single-family residential loans, thus increasing the earnings sensitivity of the loan portfolio to changes in interest rates, as well as providing higher fees and rates than residential loans. At December 31, 2013, $702.3 million of loans unpaid principal balance receivable were secured by commercial real estate, which represented 43.3% of
F-27
Table of Contents
the total loans unpaid principal balance. The origination of such loans is generally limited to the Corporation’s primary market area.
Commercial real estate loans are primarily secured by apartment buildings, office and industrial buildings, land, warehouses, small retail shopping centers and various special purpose properties, including community-based residential facilities and senior housing. Although terms vary, commercial real estate loans generally have fixed interest rates, amortization periods of 15 to 30 years, as well as balloon payments of two to seven years.
Consumer Loans
The Corporation offers consumer loans in order to provide a wider range of financial services to its customers. At December 31, 2013, $367.8 million, or 22.7%, of the total loans unpaid principal balance receivable consisted of consumer loans. Consumer loans typically have higher interest rates than mortgage loans but generally involve more risk than mortgage loans because of the type and nature of the collateral and, in certain cases, the absence of collateral.
The residential-other portfolio consists primarily of Express refinance first mortgage loans, second mortgage and home equity loans. Express refinance loans are available for owner occupied one- to two-family residential properties, with loan amounts up to $200,000, a fixed interest rate, up to 15 year amortization, low fees and rapid closing timeframes. The primary home equity loan product has an adjustable rate that is linked to the prime interest rate and is secured by a mortgage, either a primary or a junior lien, on the borrower’s residence. New home equity lines do not exceed 90% of appraised value of the property at the loan origination date. A fixed-rate home equity second mortgage term product is also offered.
Approximately $129.5 million, or 8.0%, of the total loans unpaid principal balance receivable at December 31, 2013 consisted of education loans. These loans are generally made for a maximum of $3,500 per year for undergraduate studies and $8,500 per year for graduate studies and are placed in repayment status on an installment basis within nine months following graduation. Education loans generally have interest rates that adjust annually in accordance with a designated index. Both the principal amount of an education loan and interest thereon are generally guaranteed by the Great Lakes Higher Education Corporation up to 97% of the balance of the loan, which typically obtains reinsurance of its obligations from the U.S. Department of Education. The origination of student loans was discontinued beginning October 1, 2010 following the March 2010 law ending loan guarantees provided by the U. S. Department of Education. Although direct student loans, without a government guarantee, may be originated, risk-adjusted returns for these loans continue to be unattractive. Education loans may be sold to the U.S. Department of Education or to other investors. No education loans were sold during the nine months ended December 31, 2013 or the fiscal years ended March 31, 2013 and 2012.
The other consumer loan portfolio consists of vehicle loans and other secured and unsecured loans made for a variety of consumer purposes. These include credit extended through credit cards issued by a third party, ELAN Financial Services (ELAN), pursuant to an agency arrangement under which the Corporation participates in outstanding balances, currently at 25% to 28%. The Corporation also shares 33% to 37% of annual fees, and 30% of late payment, over limit and cash advance fees, as well as 25% to 30% of interchange income from the underlying portfolio.
Allowances for Loan Losses
The allowance for loan losses consists of general, substandard and specific components even though the entire allowance is available to cover losses on any loan. The specific allowance component relates to impaired loans (i.e.—non-accrual) and all loans reported as troubled debt restructurings. For such loans, an allowance is established when the discounted cash flows (or collateral value if repayment relies solely on the operation or sale of the collateral) of the impaired loan are lower than the carrying value of that loan. The substandard loan
F-28
Table of Contents
component is primarily associated with loans rated in this category but not in non-accrual status. The general allowance component covers pass and special mention rated loans and is based on historical loss experience adjusted for various qualitative and quantitative factors. Loans graded substandard and below are individually examined to determine the appropriate loan loss reserve. In addition, reserves for unfunded commitments, letters of credit and repurchase of sold loans are maintained and classified in other liabilities.
The following table presents the allowance for loan losses by component:
| December 31, | March 31, | |||||||
| 2013 | 2013 | |||||||
| (In thousands) | ||||||||
| General reserve: |
||||||||
| General component |
$ | 35,844 | $ | 38,641 | ||||
| Substandard loan component |
6,225 | 12,082 | ||||||
| Specific reserve |
23,113 | 29,092 | ||||||
|
|
|
|
|
|||||
| Total allowance for loan losses |
$ | 65,182 | $ | 79,815 | ||||
|
|
|
|
|
|||||
The following table presents the unpaid principal balance of loans by risk category:
| December 31, | March 31, | |||||||
| 2013 | 2013 | |||||||
| (In thousands) | ||||||||
| Pass |
$ | 1,460,457 | $ | 1,497,361 | ||||
| Special mention |
24,203 | 33,363 | ||||||
|
|
|
|
|
|||||
| Total pass and special mention rated loans |
1,484,660 | 1,530,724 | ||||||
| Substandard rated loans, excluding TDR accrual (1) |
35,310 | 72,117 | ||||||
| Troubled debt restructurings—accrual |
33,087 | 41,565 | ||||||
| Non-accrual |
68,497 | 118,790 | ||||||
|
|
|
|
|
|||||
| Total impaired loans |
101,584 | 160,355 | ||||||
|
|
|
|
|
|||||
| Total unpaid principal balance |
$ | 1,621,554 | $ | 1,763,196 | ||||
|
|
|
|
|
|||||
| (1) | Includes residential and consumer loans identified as substandard, that are not necessarily on non-accrual. |
F-29
Table of Contents
The following table presents activity in the allowance for loan losses by portfolio segment:
| Residential | Commercial and Industrial |
Commercial Real Estate |
Consumer | Total | ||||||||||||||||
| (In thousands) | ||||||||||||||||||||
| For Nine Months Ended: |
||||||||||||||||||||
| December 31, 2013 |
||||||||||||||||||||
| Beginning balance |
$ | 14,525 | $ | 7,072 | $ | 54,581 | $ | 3,637 | $ | 79,815 | ||||||||||
| Provision |
2,224 | (599 | ) | (2,942 | ) | 1,592 | 275 | |||||||||||||
| Charge-offs |
(4,419 | ) | (864 | ) | (13,100 | ) | (1,903 | ) | (20,286 | ) | ||||||||||
| Recoveries |
729 | 793 | 3,526 | 330 | 5,378 | |||||||||||||||
|
|
|
|
|
|
|
|
|
|
|
|||||||||||
| Ending balance |
$ | 13,059 | $ | 6,402 | $ | 42,065 | $ | 3,656 | $ | 65,182 | ||||||||||
|
|
|
|
|
|
|
|
|
|
|
|||||||||||
| December 31, 2012 (Unaudited) |
||||||||||||||||||||
| Beginning balance |
$ | 13,027 | $ | 10,568 | $ | 85,153 | $ | 2,467 | $ | 111,215 | ||||||||||
| Provision |
2,217 | (2,544 | ) | 4,708 | 2,677 | 7,058 | ||||||||||||||
| Charge-offs |
(4,795 | ) | (2,759 | ) | (32,952 | ) | (2,533 | ) | (43,039 | ) | ||||||||||
| Recoveries |
1,725 | 1,326 | 5,360 | 116 | 8,527 | |||||||||||||||
|
|
|
|
|
|
|
|
|
|
|
|||||||||||
| Ending balance |
$ | 12,174 | $ | 6,591 | $ | 62,269 | $ | 2,727 | $ | 83,761 | ||||||||||
|
|
|
|
|
|
|
|
|
|
|
|||||||||||
| For the Fiscal Year Ended: |
||||||||||||||||||||
| March 31, 2013 |
||||||||||||||||||||
| Beginning balance |
$ | 13,027 | $ | 10,568 | $ | 85,153 | $ | 2,467 | $ | 111,215 | ||||||||||
| Provision |
6,414 | (1,471 | ) | (3,107 | ) | 5,897 | 7,733 | |||||||||||||
| Charge-offs |
(6,659 | ) | (3,483 | ) | (34,265 | ) | (4,946 | ) | (49,353 | ) | ||||||||||
| Recoveries |
1,743 | 1,458 | 6,800 | 219 | 10,220 | |||||||||||||||
|
|
|
|
|
|
|
|
|
|
|
|||||||||||
| Ending balance |
$ | 14,525 | $ | 7,072 | $ | 54,581 | $ | 3,637 | $ | 79,815 | ||||||||||
|
|
|
|
|
|
|
|
|
|
|
|||||||||||
| March 31, 2012 |
||||||||||||||||||||
| Beginning balance |
$ | 20,487 | $ | 19,541 | $ | 106,445 | $ | 3,649 | $ | 150,122 | ||||||||||
| Provision |
(2,546 | ) | 4,180 | 30,869 | 1,384 | 33,887 | ||||||||||||||
| Charge-offs |
(6,625 | ) | (14,993 | ) | (57,685 | ) | (3,259 | ) | (82,562 | ) | ||||||||||
| Recoveries |
1,711 | 1,840 | 5,524 | 693 | 9,768 | |||||||||||||||
|
|
|
|
|
|
|
|
|
|
|
|||||||||||
| Ending balance |
$ | 13,027 | $ | 10,568 | $ | 85,153 | $ | 2,467 | $ | 111,215 | ||||||||||
|
|
|
|
|
|
|
|
|
|
|
|||||||||||
F-30
Table of Contents
The following table presents the balance in the allowance for loan losses and the recorded investment in loans by portfolio segment and based on impairment method as of December 31, 2013 and March 31, 2013:
| Residential | Commercial and Industrial |
Commercial Real Estate |
Consumer | Total | ||||||||||||||||
| (In thousands) | ||||||||||||||||||||
| December 31, 2013 |
||||||||||||||||||||
| Allowance for loan losses: |
||||||||||||||||||||
| Associated with impaired loans |
$ | 2,375 | $ | 1,745 | $ | 18,516 | $ | 477 | $ | 23,113 | ||||||||||
| Associated with all other loans |
10,684 | 4,657 | 23,549 | 3,179 | 42,069 | |||||||||||||||
|
|
|
|
|
|
|
|
|
|
|
|||||||||||
| Total |
$ | 13,059 | $ | 6,402 | $ | 42,065 | $ | 3,656 | $ | 65,182 | ||||||||||
|
|
|
|
|
|
|
|
|
|
|
|||||||||||
| Loans: |
||||||||||||||||||||
| Impaired loans individually evaluated |
$ | 19,060 | $ | 2,314 | $ | 77,047 | $ | 3,163 | $ | 101,584 | ||||||||||
| All other loans |
510,717 | 19,277 | 625,308 | 364,668 | 1,519,970 | |||||||||||||||
|
|
|
|
|
|
|
|
|
|
|
|||||||||||
| Total |
$ | 529,777 | $ | 21,591 | $ | 702,355 | $ | 367,831 | $ | 1,621,554 | ||||||||||
|
|
|
|
|
|
|
|
|
|
|
|||||||||||
| March 31, 2013 |
||||||||||||||||||||
| Allowance for loan losses: |
||||||||||||||||||||
| Associated with impaired loans |
$ | 7,038 | $ | 2,508 | $ | 19,182 | $ | 364 | $ | 29,092 | ||||||||||
| Associated with all other loans |
7,487 | 4,564 | 35,399 | 3,273 | 50,723 | |||||||||||||||
|
|
|
|
|
|
|
|
|
|
|
|||||||||||
| Total |
$ | 14,525 | $ | 7,072 | $ | 54,581 | $ | 3,637 | $ | 79,815 | ||||||||||
|
|
|
|
|
|
|
|
|
|
|
|||||||||||
| Loans: |
||||||||||||||||||||
| Impaired loans individually evaluated |
$ | 37,378 | $ | 3,760 | $ | 114,540 | $ | 4,677 | $ | 160,355 | ||||||||||
| All other loans |
510,342 | 26,814 | 656,403 | 409,282 | 1,602,841 | |||||||||||||||
|
|
|
|
|
|
|
|
|
|
|
|||||||||||
| Total |
$ | 547,720 | $ | 30,574 | $ | 770,943 | $ | 413,959 | $ | 1,763,196 | ||||||||||
|
|
|
|
|
|
|
|
|
|
|
|||||||||||
At December 31, 2013, $101.6 million of unpaid principal balance of loans are deemed impaired which includes performing troubled debt restructurings. At March 31, 2013, impaired loans were $160.4 million. A loan is identified as impaired when, based on current information and events, it is probable that all amounts due according to the contractual terms of the loan agreement may not be collected and thus are placed on non-accrual status. Interest income on certain impaired loans is recognized on a cash basis.
A substantial portion of loans are collateralized by real estate in Wisconsin and adjacent states. Accordingly, the ultimate collectability of the loan portfolio is susceptible to changes in real estate market conditions in that area.
F-31
Table of Contents
The following table presents impaired loans segregated by loans with no specific allowance and loans with an allowance by class of loans as of December 31, 2013 and March 31, 2013. The carrying amounts represent the unpaid principal balance less the associated allowance. Interest income is recognized on a cash basis during the periods presented.
| Unpaid Principal Balance |
Associated Allowance |
Carrying Amount |
Average Carrying Amount (1) |
Nine Months
Ended December 31, 2013 Interest Income Recognized |
||||||||||||||||
| (In thousands) | ||||||||||||||||||||
| December 31, 2013 |
||||||||||||||||||||
| With no specific allowance recorded: |
||||||||||||||||||||
| Residential |
$ | 3,751 | $ | — | $ | 3,751 | $ | 4,032 | $ | 43 | ||||||||||
| Commercial and industrial |
60 | — | 60 | 79 | 39 | |||||||||||||||
| Land and construction |
4,311 | — | 4,311 | 4,707 | 91 | |||||||||||||||
| Multi-family |
9,848 | — | 9,848 | 5,845 | 221 | |||||||||||||||
| Retail/office |
6,896 | — | 6,896 | 7,659 | 210 | |||||||||||||||
| Other commercial real estate |
9,216 | — | 9,216 | 9,737 | 456 | |||||||||||||||
| Education |
— | — | — | — | — | |||||||||||||||
| Other consumer |
343 | — | 343 | 631 | 87 | |||||||||||||||
|
|
|
|
|
|
|
|
|
|
|
|||||||||||
| Subtotal |
34,425 | — | 34,425 | 32,690 | 1,147 | |||||||||||||||
|
|
|
|
|
|
|
|
|
|
|
|||||||||||
| With an allowance recorded (2): |
||||||||||||||||||||
| Residential |
15,309 | 2,375 | 12,934 | 13,140 | 422 | |||||||||||||||
| Commercial and industrial |
2,254 | 1,745 | 509 | 658 | 44 | |||||||||||||||
| Land and construction |
20,418 | 7,512 | 12,906 | 15,193 | 252 | |||||||||||||||
| Multi-family |
14,312 | 3,693 | 10,619 | 6,286 | 228 | |||||||||||||||
| Retail/office |
9,347 | 6,925 | 2,422 | 4,948 | 128 | |||||||||||||||
| Other commercial real estate |
2,699 | 386 | 2,313 | 2,270 | 99 | |||||||||||||||
| Education (3) |
276 | — | 276 | 338 | — | |||||||||||||||
| Other consumer |
2,544 | 477 | 2,067 | 2,211 | 105 | |||||||||||||||
|
|
|
|
|
|
|
|
|
|
|
|||||||||||
| Subtotal |
67,159 | 23,113 | 44,046 | 45,044 | 1,278 | |||||||||||||||
|
|
|
|
|
|
|
|
|
|
|
|||||||||||
| Total |
||||||||||||||||||||
| Residential |
19,060 | 2,375 | 16,685 | 17,172 | 465 | |||||||||||||||
| Commercial and industrial |
2,314 | 1,745 | 569 | 737 | 83 | |||||||||||||||
| Land and construction |
24,729 | 7,512 | 17,217 | 19,900 | 343 | |||||||||||||||
| Multi-family |
24,160 | 3,693 | 20,467 | 12,131 | 449 | |||||||||||||||
| Retail/office |
16,243 | 6,925 | 9,318 | 12,607 | 338 | |||||||||||||||
| Other commercial real estate |
11,915 | 386 | 11,529 | 12,007 | 555 | |||||||||||||||
| Education (3) |
276 | — | 276 | 338 | — | |||||||||||||||
| Other consumer |
2,887 | 477 | 2,410 | 2,842 | 192 | |||||||||||||||
|
|
|
|
|
|
|
|
|
|
|
|||||||||||
| $ | 101,584 | $ | 23,113 | $ | 78,471 | $ | 77,734 | $ | 2,425 | |||||||||||
|
|
|
|
|
|
|
|
|
|
|
|||||||||||
F-32
Table of Contents
| Unpaid Principal Balance |
Associated Allowance |
Carrying Amount |
Average Carrying Amount (1) |
Fiscal Year to Date Interest Income Recognized |
||||||||||||||||
| (In thousands) | ||||||||||||||||||||
| March 31, 2013 |
||||||||||||||||||||
| With no specific allowance recorded: |
||||||||||||||||||||
| Residential |
$ | 11,545 | $ | — | $ | 11,545 | $ | 12,655 | $ | 448 | ||||||||||
| Commercial and industrial |
280 | — | 280 | 1,020 | 75 | |||||||||||||||
| Land and construction |
9,982 | — | 9,982 | 21,678 | 189 | |||||||||||||||
| Multi-family |
12,217 | — | 12,217 | 14,826 | 400 | |||||||||||||||
| Retail/office |
6,913 | — | 6,913 | 15,810 | 350 | |||||||||||||||
| Other commercial real estate |
13,365 | — | 13,365 | 19,378 | 691 | |||||||||||||||
| Education |
— | — | — | — | — | |||||||||||||||
| Other consumer |
531 | — | 531 | 665 | 62 | |||||||||||||||
|
|
|
|
|
|
|
|
|
|
|
|||||||||||
| Subtotal |
54,833 | — | 54,833 | 86,032 | 2,215 | |||||||||||||||
|
|
|
|
|
|
|
|
|
|
|
|||||||||||
| With an allowance recorded (2): |
||||||||||||||||||||
| Residential |
25,833 | 7,038 | 18,795 | 23,509 | 611 | |||||||||||||||
| Commercial and industrial |
3,480 | 2,508 | 972 | 1,556 | 78 | |||||||||||||||
| Land and construction |
23,492 | 6,552 | 16,940 | 19,024 | 659 | |||||||||||||||
| Multi-family |
15,448 | 4,261 | 11,187 | 13,918 | 722 | |||||||||||||||
| Retail/office |
14,505 | 3,312 | 11,193 | 19,553 | 519 | |||||||||||||||
| Other commercial real estate |
18,618 | 5,057 | 13,561 | 19,545 | 632 | |||||||||||||||
| Education (3) |
424 | 1 | 423 | 615 | — | |||||||||||||||
| Other consumer |
3,722 | 363 | 3,359 | 6,167 | 293 | |||||||||||||||
|
|
|
|
|
|
|
|
|
|
|
|||||||||||
| Subtotal |
105,522 | 29,092 | 76,430 | 103,887 | 3,514 | |||||||||||||||
|
|
|
|
|
|
|
|
|
|
|
|||||||||||
| Total |
||||||||||||||||||||
| Residential |
37,378 | 7,038 | 30,340 | 36,164 | 1,059 | |||||||||||||||
| Commercial and industrial |
3,760 | 2,508 | 1,252 | 2,576 | 153 | |||||||||||||||
| Land and construction |
33,474 | 6,552 | 26,922 | 40,702 | 848 | |||||||||||||||
| Multi-family |
27,665 | 4,261 | 23,404 | 28,744 | 1,122 | |||||||||||||||
| Retail/office |
21,418 | 3,312 | 18,106 | 35,363 | 869 | |||||||||||||||
| Other commercial real estate |
31,983 | 5,057 | 26,926 | 38,923 | 1,323 | |||||||||||||||
| Education (3) |
424 | 1 | 423 | 615 | — | |||||||||||||||
| Other consumer |
4,253 | 363 | 3,890 | 6,832 | 355 | |||||||||||||||
|
|
|
|
|
|
|
|
|
|
|
|||||||||||
| $ | 160,355 | $ | 29,092 | $ | 131,263 | $ | 189,919 | $ | 5,729 | |||||||||||
|
|
|
|
|
|
|
|
|
|
|
|||||||||||
| (1) | Calculated on a trailing 9 month basis for December 31, 2013 and a trailing 12 month basis for March 31, 2013. |
| (2) | Includes ratio-based allowance for loan losses of $2.1 million and $5.7 million associated with loans totaling $12.5 million and $35.9 million at December 31, 2013 and March 31, 2013, respectively, for which individual reviews have not been completed but an allowance established based on the ratio of allowance for loan losses to unpaid principal balance for the loans individually reviewed, by class of loan. |
| (3) | Excludes the guaranteed portion of education loans 90+ days past due with unpaid principal balance of $8,930 and $13,697 and average carrying amounts totaling $13,730 and $21,249 at December 31, 2013 and March 31, 2013, respectively, that are not considered impaired based on a guarantee provided by government agencies. |
F-33
Table of Contents
The average recorded investment in impaired loans and interest income recognized on impaired loans follows:
| Nine Months Ended December 31, | Year Ended March 31, | |||||||||||||||||||||||||||||||
| 2013 | 2012 | 2013 | 2012 | |||||||||||||||||||||||||||||
| Average | Interest | Average | Interest | Average | Interest | Average | Interest | |||||||||||||||||||||||||
| Carrying | Income | Carrying | Income | Carrying | Income | Carrying | Income | |||||||||||||||||||||||||
| Amount (1) | Recognized | Amount (1) | Recognized | Amount (1) | Recognized | Amount (1) | Recognized | |||||||||||||||||||||||||
| (Unaudited) | ||||||||||||||||||||||||||||||||
| (In Thousands) | ||||||||||||||||||||||||||||||||
| Residential |
$ | 17,172 | $ | 465 | $ | 33,759 | $ | 705 | $ | 36,164 | $ | 1,059 | $ | 50,294 | $ | 728 | ||||||||||||||||
| Commercial and industrial |
737 | 83 | 2,425 | 211 | 2,576 | 153 | 13,056 | 321 | ||||||||||||||||||||||||
| Land and construction |
19,900 | 343 | 37,858 | 905 | 40,702 | 848 | 87,100 | 1,467 | ||||||||||||||||||||||||
| Multi-family |
12,131 | 449 | 28,094 | 994 | 28,744 | 1,122 | 47,427 | 1,191 | ||||||||||||||||||||||||
| Retail/office |
12,607 | 338 | 34,965 | 1,187 | 35,363 | 869 | 50,994 | 1,674 | ||||||||||||||||||||||||
| Other commercial real estate |
12,007 | 555 | 39,774 | 1,172 | 38,923 | 1,323 | 46,703 | 1,308 | ||||||||||||||||||||||||
| Education |
338 | — | 662 | — | 615 | — | 789 | — | ||||||||||||||||||||||||
| Other consumer |
2,842 | 192 | 6,210 | 345 | 6,832 | 355 | 7,697 | 542 | ||||||||||||||||||||||||
|
|
|
|
|
|
|
|
|
|
|
|
|
|
|
|
|
|||||||||||||||||
| $ | 77,734 | $ | 2,425 | $ | 183,747 | $ | 5,519 | $ | 189,919 | $ | 5,729 | $ | 304,060 | $ | 7,231 | |||||||||||||||||
|
|
|
|
|
|
|
|
|
|
|
|
|
|
|
|
|
|||||||||||||||||
| (1) | The average carry amount was calculated on a trailing 9 month basis for December 31, 2013 and 2012 and a trailing 12 month basis for March 31, 2013 and 2012. |
The following is additional information regarding impaired loans:
| December 31, | March 31, | |||||||
| 2013 | 2013 | |||||||
| (In thousands) | ||||||||
| Carrying amount of impaired loans |
$ | 78,471 | $ | 131,263 | ||||
| Average carrying amount of impaired loans |
77,734 | 189,919 | ||||||
| Loans and troubled debt restructurings on non-accrual status |
68,497 | 118,790 | ||||||
| Troubled debt restructurings—accrual |
33,087 | 41,565 | ||||||
| Troubled debt restructurings—non-accrual (1) |
29,346 | 26,287 | ||||||
| Loans past due ninety days or more and still accruing (2) |
8,930 | 13,697 | ||||||
| (1) | Troubled debt restructurings—non-accrual are included in the loans and troubled debt restructurings on non-accrual status line item above. |
| (2) | Represents the guaranteed portion of education loans that were more than 90 days past due which continue to accrue interest due to a guarantee provided by government agencies covering approximately 97% of the outstanding balance. |
Interest income recognized on impaired loans on a cash basis was $2.4 million and $5.5 million for the nine months ended December 31, 2013 and 2012, respectively, and $5.7 million and $7.2 million for the fiscal years ended March 31, 2013 and 2012, respectively.
Although the Corporation is currently not committed to lend any additional funds on impaired loans in accordance with the original terms of these loans, it is not legally obligated to, and will cautiously disburse additional funds on any loans while in nonaccrual status or if the borrower is in default.
F-34
Table of Contents
The Corporation experienced declines in the valuations for real estate collateral supporting portions of its loan portfolio throughout fiscal years 2012 and 2013 and the nine months ended December 31, 2013 and 2012, as reflected in recently received appraisals. Currently, $177.4 million or approximately 90% of the unpaid principal balance of classified loans (i.e. loans risk rated as substandard or loss) have recent appraisals (i.e. within one year) or have been determined to not need an appraisal. Loans that do not require an appraisal under corporate policy include situations in which the loan (i) is fully reserved; (ii) has a small balance (less than $250,000) and rather than being individually evaluated for impairment, is included in a homogenous pool of loans; (iii) uses a net present value of future cash flows to measure impairment; or (iv) is not secured by real estate. Appraised values greater than one year old are discounted by an additional 10% for improved land or commercial real estate and 20% for unimproved land, in determination of the allowance for loan losses.
While corporate policy may not require updated appraisals for these loans, new appraisals may still be obtained. For example, 46% of the loans which do not require an updated appraisal do have either an appraisal within the last year or an appraisal on order. If real estate values decline, the allowance for loan losses may increase as updated appraisals or other indications of a decrease in the value of collateral are received.
The following table presents the aging of the recorded investment in past due loans as of December 31, 2013 and March 31, 2013 by class of loans:
| Days Past Due | ||||||||||||||||
| 30-59 | 60-89 | 90 or More | Total | |||||||||||||
| (In thousands) | ||||||||||||||||
| December 31, 2013 |
||||||||||||||||
| Residential |
$ | 1,287 | $ | 564 | $ | 8,897 | $ | 10,748 | ||||||||
| Commercial and industrial |
1,609 | — | 1,461 | 3,070 | ||||||||||||
| Land and construction |
105 | — | 11,307 | 11,412 | ||||||||||||
| Multi-family |
1,612 | — | 1,079 | 2,691 | ||||||||||||
| Retail/office |
968 | 83 | 10,887 | 11,938 | ||||||||||||
| Other commercial real estate |
184 | 506 | 3,785 | 4,475 | ||||||||||||
| Education |
5,210 | 2,914 | 9,206 | 17,330 | ||||||||||||
| Other consumer |
910 | 213 | 2,395 | 3,518 | ||||||||||||
|
|
|
|
|
|
|
|
|
|||||||||
| $ | 11,885 | $ | 4,280 | $ | 49,017 | $ | 65,182 | |||||||||
|
|
|
|
|
|
|
|
|
|||||||||
| March 31, 2013 |
||||||||||||||||
| Residential |
$ | 2,028 | $ | 3,390 | $ | 24,645 | $ | 30,063 | ||||||||
| Commercial and industrial |
1,004 | 115 | 2,212 | 3,331 | ||||||||||||
| Land and construction |
841 | 456 | 11,777 | 13,074 | ||||||||||||
| Multi-family |
2,170 | 856 | 17,619 | 20,645 | ||||||||||||
| Retail/office |
2,160 | 653 | 12,263 | 15,076 | ||||||||||||
| Other commercial real estate |
10 | 55 | 5,873 | 5,938 | ||||||||||||
| Education |
4,414 | 3,853 | 14,121 | 22,388 | ||||||||||||
| Other consumer |
1,667 | 731 | 3,699 | 6,097 | ||||||||||||
|
|
|
|
|
|
|
|
|
|||||||||
| $ | 14,294 | $ | 10,109 | $ | 92,209 | $ | 116,612 | |||||||||
|
|
|
|
|
|
|
|
|
|||||||||
Total delinquencies (loans past due 30 days or more) at December 31, 2013 were $65.2 million. The Corporation has experienced a significant reduction in delinquencies since March 31, 2013 due to improving credit conditions and loans moving to OREO. The Corporation has $8.9 million of education loans past due 90 days or more at December 31, 2013 that are still accruing interest due to the approximate 97% guarantee provided by governmental agencies. Loans less than 90 days delinquent may be placed on non-accrual status when the probability of collection of principal and interest is deemed to be insufficient to warrant further accrual.
F-35
Table of Contents
Credit Quality Indicators:
The Corporation groups commercial and industrial loans and commercial real estate loans into risk categories based on relevant information about the ability of borrowers to service their debt such as: current financial information, historical payment experience, credit documentation, public information and current economic trends, among other factors. This analysis is updated on a monthly basis. The following definitions are used for risk ratings:
Pass. Loans classified as pass represent assets that are evaluated and are performing under the stated terms. Pass rated assets are analyzed by the pay capacity of the obligor, current net worth of the obligor and/or by the value of the loan collateral. A subcategory of loans classified as pass are watch loans.
Watch. Loans classified as watch possess potential weaknesses that require management attention, but do not yet warrant adverse classification. While the status of an asset put on this list does not technically trigger their classification as substandard or non-accrual, it is considered a proactive way to identify potential issues and address them before the situation deteriorates further and results in a loss.
Special Mention. Loans classified as special mention exhibit material negative financial trends due to company specific or industry conditions which, if not corrected or mitigated, threaten their capacity to meet current or continuing debt obligations. These borrowers still demonstrate the financial flexibility to address and cure the root cause of these adverse financial trends without significant deviations from their current business plan. Their potential weakness deserves close attention and warrants enhanced monitoring on the part of management. The expectation is these borrowers will return to a pass rating given reasonable time; or will be further downgraded.
Substandard. Loans classified as substandard are inadequately protected by the current net worth, paying capacity of the obligor, or by the collateral pledged. Substandard assets must have a well-defined weakness or weaknesses that jeopardize the liquidation of the debt. They are characterized by the distinct possibility that a loss will be sustained if the deficiencies are not corrected.
Non-Accrual. Loans classified as non-accrual have the weaknesses of those classified as Substandard, with the added characteristic that the weaknesses make collection or liquidation in full, on the basis of currently existing facts, conditions and values, highly questionable and improbable. Loans that fall into this category are deemed collateral dependent and an individual impairment evaluation is performed for all relationships greater than $500,000. Loans in this category are allocated a specific reserve if the collateral does not support the outstanding loan balance or charged off if deemed uncollectible.
F-36
Table of Contents
As of December 31, 2013 and March 31, 2013, and based on the most recent analysis performed, the risk category of loans by class of loans is as follows:
| Pass | Special Mention |
Substandard | Non-Accrual | Total Unpaid Principal Balance |
||||||||||||||||
| (In thousands) | ||||||||||||||||||||
| December 31, 2013 |
||||||||||||||||||||
| Commercial and industrial |
$ | 16,542 | $ | — | $ | 3,540 | $ | 1,509 | $ | 21,591 | ||||||||||
| Commercial real estate: |
||||||||||||||||||||
| Land and construction |
57,221 | 75 | 10,025 | 24,729 | 92,050 | |||||||||||||||
| Multi-family |
255,741 | 465 | 22,053 | 3,658 | 281,917 | |||||||||||||||
| Retail/office |
130,966 | 2,967 | 5,777 | 14,365 | 154,075 | |||||||||||||||
| Other |
135,045 | 20,696 | 11,770 | 6,802 | 174,313 | |||||||||||||||
|
|
|
|
|
|
|
|
|
|
|
|||||||||||
| $ | 595,515 | $ | 24,203 | $ | 53,165 | $ | 51,063 | $ | 723,946 | |||||||||||
|
|
|
|
|
|
|
|
|
|
|
|||||||||||
| Percent of total unpaid principal balance |
82.3 | % | 3.3 | % | 7.3 | % | 7.1 | % | 100.0 | % | ||||||||||
|
|
|
|
|
|
|
|
|
|
|
|||||||||||
| March 31, 2013 |
||||||||||||||||||||
| Commercial and industrial |
$ | 21,141 | $ | 878 | $ | 5,640 | $ | 2,915 | $ | 30,574 | ||||||||||
| Commercial real estate: |
||||||||||||||||||||
| Land and construction |
64,229 | 787 | 15,150 | 31,787 | 111,953 | |||||||||||||||
| Multi-family |
245,980 | 3,660 | 17,155 | 20,652 | 287,447 | |||||||||||||||
| Retail/office |
156,919 | 5,144 | 19,100 | 17,523 | 198,686 | |||||||||||||||
| Other |
107,465 | 22,894 | 34,333 | 8,165 | 172,857 | |||||||||||||||
|
|
|
|
|
|
|
|
|
|
|
|||||||||||
| $ | 595,734 | $ | 33,363 | $ | 91,378 | $ | 81,042 | $ | 801,517 | |||||||||||
|
|
|
|
|
|
|
|
|
|
|
|||||||||||
| Percent of total unpaid principal balance |
74.3 | % | 4.2 | % | 11.4 | % | 10.1 | % | 100.0 | % | ||||||||||
|
|
|
|
|
|
|
|
|
|
|
|||||||||||
Residential and consumer loans are managed on a pool basis due to their homogeneous nature. Loans that are delinquent 90 days or more are considered non-accrual. The following table presents the unpaid principal balance of residential and consumer loans based on accrual status as of December 31, 2013 and March 31, 2013:
| December 31, 2013 | March 31, 2013 | |||||||||||||||||||||||
| Accrual | Non-Accrual | Total Unpaid Principal Balance |
Accrual | Non-Accrual | Total Unpaid Principal Balance |
|||||||||||||||||||
| (In thousands) | ||||||||||||||||||||||||
| Residential |
$ | 515,373 | $ | 14,404 | $ | 529,777 | $ | 514,613 | $ | 33,107 | $ | 547,720 | ||||||||||||
| Consumer: |
||||||||||||||||||||||||
| Education (1) |
129,244 | 276 | 129,520 | 166,005 | 424 | 166,429 | ||||||||||||||||||
| Other consumer |
235,557 | 2,754 | 238,311 | 243,313 | 4,217 | 247,530 | ||||||||||||||||||
|
|
|
|
|
|
|
|
|
|
|
|
|
|||||||||||||
| $ | 880,174 | $ | 17,434 | $ | 897,608 | $ | 923,931 | $ | 37,748 | $ | 961,679 | |||||||||||||
|
|
|
|
|
|
|
|
|
|
|
|
|
|||||||||||||
| (1) | Non-accrual education loans represent the portion of these loans 90+ days past due that are not covered by a guarantee provided by government agencies that is limited to approximately 97% of the outstanding balance. |
Troubled Debt Restructurings
Modifications of loan terms in a troubled debt restructuring (“TDR”) are generally in the form of an extension of payment terms or lowering of the interest rate, although occasionally the Corporation has reduced the outstanding principal balance.
F-37
Table of Contents
Loans modified in a troubled debt restructuring that are currently on non-accrual status will remain on non-accrual status for a period of at least six months. If after six months, or a longer period sufficient to demonstrate the willingness and ability of the borrower to perform under the modified terms, the borrower has made payments in accordance with the modified terms, the loan is returned to accrual status but retains its designation as a troubled debt restructuring. The designation as a troubled debt restructuring is removed in years after the restructuring if both of the following conditions exist: (a) the restructuring agreement specifies an interest rate equal to or greater than the rate that the creditor was willing to accept at the time of restructuring for a new loan with comparable risk and (b) the loan is not impaired based on the terms specified by the restructuring agreement.
The following table presents information related to loans modified in a troubled debt restructuring, by class, during the nine months ended December 31, 2013 and the fiscal year ended March 31, 2013:
| Nine Months Ended December 31, 2013 | Year Ended March 31, 2013 | |||||||||||||||||||||||
| Troubled Debt Restructurings (1) |
Number of Modifications |
Unpaid Principal Balance (at beginning of period) |
Unpaid Principal Balance (2) (at period end) |
Number of Modifications |
Unpaid Principal Balance (at beginning of period) |
Unpaid Principal Balance (2) (at period end) |
||||||||||||||||||
| (Dollars in thousands) | ||||||||||||||||||||||||
| Residential |
21 | $ | 3,761 | $ | 3,788 | — | $ | — | $ | — | ||||||||||||||
| Commercial and industrial |
19 | 13,322 | 12,788 | 3 | 238 | 169 | ||||||||||||||||||
| Land and construction |
— | — | — | 2 | 705 | 546 | ||||||||||||||||||
| Multi-family |
20 | 25,556 | 23,531 | — | — | — | ||||||||||||||||||
| Retail/office |
6 | 1,673 | 1,604 | 3 | 931 | 899 | ||||||||||||||||||
| Other commercial real estate |
8 | 15,269 | 15,346 | 4 | 950 | 934 | ||||||||||||||||||
| Education |
— | — | — | — | — | — | ||||||||||||||||||
| Other consumer |
12 | 401 | 423 | 2 | 37 | 32 | ||||||||||||||||||
|
|
|
|
|
|
|
|
|
|
|
|
|
|||||||||||||
| 86 | $ | 59,982 | $ | 57,480 | 14 | $ | 2,861 | $ | 2,580 | |||||||||||||||
|
|
|
|
|
|
|
|
|
|
|
|
|
|||||||||||||
| (1) | Loans modified in a TDR that were fully paid down, charged-off or foreclosed upon by period end are not reported in this table. |
| (2) | The unpaid principal balance is inclusive of all partial paydowns and charge-offs since the modification date. |
The following tables present the unpaid principal balance of loans modified in a troubled debt restructuring during the nine months ended December 31, 2013 and the fiscal year ended March 31, 2013, by class and by type of modification:
| Nine Months Ended December 31, 2013 | ||||||||||||||||||||||||
| Principal and Interest to Interest Only |
Interest Rate Reduction | Below Market Rate (4) |
||||||||||||||||||||||
| Troubled Debt Restructurings (1)(2) |
To Below Market Rate |
To Interest Only (3) |
Other (5) | Total | ||||||||||||||||||||
| (In thousands) | ||||||||||||||||||||||||
| Residential |
$ | — | $ | 1,318 | $ | — | $ | — | $ | 2,470 | $ | 3,788 | ||||||||||||
| Commercial and industrial |
— | 345 | — | — | 12,443 | 12,788 | ||||||||||||||||||
| Land and construction |
— | — | — | — | — | — | ||||||||||||||||||
| Multi-family |
— | 231 | — | — | 23,300 | 23,531 | ||||||||||||||||||
| Retail/office |
— | 45 | 216 | — | 1,343 | 1,604 | ||||||||||||||||||
| Other commercial real estate |
— | 701 | — | 144 | 14,501 | 15,346 | ||||||||||||||||||
| Education |
— | — | — | — | — | — | ||||||||||||||||||
| Other consumer |
— | 411 | — | — | 12 | 423 | ||||||||||||||||||
|
|
|
|
|
|
|
|
|
|
|
|
|
|||||||||||||
| $ | — | $ | 3,051 | $ | 216 | $ | 144 | $ | 54,069 | $ | 57,480 | |||||||||||||
|
|
|
|
|
|
|
|
|
|
|
|
|
|||||||||||||
F-38
Table of Contents
| (1) | Loans modified in a TDR that were fully paid down, charged-off or foreclosed upon by period end are not reported in this table. |
| (2) | The unpaid principal balance is inclusive of all partial paydowns and charge-offs since the modification date. |
| (3) | Includes modifications of loan repayment terms from principal and interest to interest only, along with a reduction in the contractual interest rate. |
| (4) | Includes loans modified at below market rates for borrowers with similar risk profiles and having comparable loan terms and conditions. Market rates are determined by reference to internal new loan pricing grids that specify credit spreads based on loan risk rating and term to maturity. |
| (5) | Other modifications primarily include providing for the deferral of interest currently due to the new maturity date of the loan. |
| Year Ended March 31, 2013 | ||||||||||||||||||||||||
| Principal and Interest to Interest Only |
Interest Rate Reduction | Below Market Rate (4) |
||||||||||||||||||||||
| Troubled Debt Restructurings (1)(2) |
To Below Market Rate |
To Interest Only (3) |
Other (5) | Total | ||||||||||||||||||||
| (In thousands) | ||||||||||||||||||||||||
| Residential |
$ | — | $ | — | $ | — | $ | — | $ | — | $ | — | ||||||||||||
| Commercial and industrial |
— | — | — | 16 | 153 | 169 | ||||||||||||||||||
| Land and construction |
— | — | — | 425 | 121 | 546 | ||||||||||||||||||
| Multi-family |
— | — | — | — | — | — | ||||||||||||||||||
| Retail/office |
— | 214 | 160 | — | 525 | 899 | ||||||||||||||||||
| Other commercial real estate |
540 | 122 | — | — | 272 | 934 | ||||||||||||||||||
| Education |
— | — | — | — | — | — | ||||||||||||||||||
| Other consumer |
— | — | — | 19 | 13 | 32 | ||||||||||||||||||
|
|
|
|
|
|
|
|
|
|
|
|
|
|||||||||||||
| $ | 540 | $ | 336 | $ | 160 | $ | 460 | $ | 1,084 | $ | 2,580 | |||||||||||||
|
|
|
|
|
|
|
|
|
|
|
|
|
|||||||||||||
| (1) | Loans modified in a TDR that were fully paid down, charged-off or foreclosed upon by period end are not reported in this table. |
| (2) | The unpaid principal balance is inclusive of all partial paydowns and charge-offs since the modification date. |
| (3) | Includes modifications of loan repayment terms from principal and interest to interest only, along with a reduction in the contractual interest rate. |
| (4) | Includes loans modified at below market rates for borrowers with similar risk profiles and having comparable loan terms and conditions. Market rates are determined by reference to internal new loan pricing grids that specify credit spreads based on loan risk rating and term to maturity. |
| (5) | Other modifications primarily include providing for the deferral of interest currently due to the new maturity date of the loan. |
F-39
Table of Contents
The following table presents loans modified in a troubled debt restructuring from April 1, 2013 to December 31, 2013, by class, that subsequently defaulted (i.e.: 90 days or more past due following a modification) during the nine months ended December 31, 2013 compared to loans modified from April 1, 2012 to March 31, 2013 that defaulted during the fiscal year ended March 31, 2013:
| Nine Months Ended December 31, | Year Ended March 31, | |||||||||||||||
| 2013 | 2013 | |||||||||||||||
| Troubled Debt Restructurings (1) |
Number of Modified Loans |
Unpaid Principal Balance (2) (at period end) |
Number of Modified Loans |
Unpaid Principal Balance (2) (at period end) |
||||||||||||
| (Dollars in thousands) | ||||||||||||||||
| Residential |
— | $ | — | — | $ | — | ||||||||||
| Commercial and industrial |
— | — | — | — | ||||||||||||
| Land and construction |
— | — | — | — | ||||||||||||
| Multi-family |
— | — | — | — | ||||||||||||
| Retail/office |
— | — | 2 | 374 | ||||||||||||
| Other commercial real estate |
— | — | 2 | 581 | ||||||||||||
| Education |
— | — | — | — | ||||||||||||
| Other consumer |
— | — | — | — | ||||||||||||
|
|
|
|
|
|
|
|
|
|||||||||
| — | $ | — | 4 | $ | 955 | |||||||||||
|
|
|
|
|
|
|
|
|
|||||||||
| (1) | Loans modified in a TDR that were fully paid down, charged-off or foreclosed upon by period end are not reported in this table. |
| (2) | The unpaid principal balance is inclusive of all partial paydowns and charge-offs since the modification date. |
Unfunded Commitments and Repurchase Loan Reserve
In addition to the allowance for loan losses reflected on the Consolidated Balance Sheets, a reserve is also provided for unfunded loan commitments and for the repurchase of previously sold loans. The reserve for unfunded loan commitments includes unfunded commitments to lend and commercial letters of credit. These reserves are classified in other liabilities on the Consolidated Balance Sheets. The balances of these reserves for the periods presented is as follows:
| At December 31, | At March 31, | |||||||||||||||
| 2013 | 2012 | 2013 | 2012 | |||||||||||||
| (Unaudited) | ||||||||||||||||
| (In thousands) | ||||||||||||||||
| Reserve for unfunded commitment losses beginning balance |
$ | 1,956 | $ | 564 | $ | 564 | $ | 873 | ||||||||
| Provision for unfunded commitments |
2,708 | 967 | 1,392 | (309 | ) | |||||||||||
|
|
|
|
|
|
|
|
|
|||||||||
| Ending reserve for unfunded commitment losses |
$ | 4,664 | $ | 1,531 | $ | 1,956 | $ | 564 | ||||||||
|
|
|
|
|
|
|
|
|
|||||||||
| Reserve for repurchased loans beginning balance |
$ | 2,600 | $ | — | $ | — | $ | — | ||||||||
| Provision for repurchased loans |
— | 570 | 2,600 | — | ||||||||||||
|
|
|
|
|
|
|
|
|
|||||||||
| Ending reserve for repurchased loans |
$ | 2,600 | $ | 570 | $ | 2,600 | $ | — | ||||||||
|
|
|
|
|
|
|
|
|
|||||||||
The amount of the allowance for unfunded loan commitments is determined using the average reserve rate by risk rating that applies to the associated funded loan category multiplied by the unfunded commitment amount. The reserve also covers potential loss on letters of credit outstanding for which the Bank may be unable to recover the amount outstanding. At December 31, 2013, a liability of $4.7 million was required of which $2.4 million was a specific reserve related to one outstanding letter of credit currently in litigation. The increase
F-40
Table of Contents
during the nine months ended December 31, 2013 included an increase for the specific reserve of this outstanding credit.
The amount of the reserve for repurchased loans is determined using the serviced portfolio balances multiplied by historical and expected loss rates to provide for the probable losses related to sold mortgage loans. Expense incurred was $687,000, $1.7 million, $4.5 million and $157,000 for the nine months ended December 31, 2013 and 2012, and the fiscal years ended March 31, 2013 and 2012, respectively. The increase during fiscal year 2013 resulted from the establishment of the reserve. Losses may result from the repurchase of loans or indemnification of loss incurred upon foreclosure and disposition of related collateral. The analysis of the reserve at December 31, 2013 required a liability of $2.6 million.
Pledged Loans
At December 31, 2013 and March 31, 2013, residential, multi-family, education and other consumer loans receivable with unpaid principal of approximately $744.1 million and $823.7 million were pledged to secure borrowings and for other purposes as permitted or required by law. Certain real-estate related loans are pledged as collateral for FHLB borrowings. See Note 10.
In the ordinary course of business, the Bank has granted loans to principal officers and directors and their affiliates with outstanding balances amounting to $80,000 and $91,000 at December 31, 2013 and March 31, 2013, respectively. During the nine months ended December 31, 2013, there were no principal additions and principal payments totaled $11,000.
Note 6—Other Real Estate Owned
Real estate acquired by foreclosure or by deed in lieu of foreclosure as well as other repossessed assets (OREO) are held for sale and are initially recorded at fair value less a discount for estimated selling costs at the date of foreclosure. Any write down to fair value less estimated selling costs is charged to the allowance for loan losses. If the discounted fair value exceeds the net carrying value of the loans, recoveries to the allowance for loan losses are recorded to the extent of previous charge-offs, with any excess, which is infrequent, recognized as a gain in non-interest income. Subsequent to foreclosure, valuations are periodically performed and a valuation allowance is established if the carrying value exceeds the fair value less estimated selling costs. Costs relating to the development and improvement of the property may be capitalized, generally those greater than $10,000; holding period costs and subsequent changes to the valuation allowance are charged to OREO expense, net included in non-interest expense. Incremental valuation adjustments may be recognized in the Statements of Operations if, in the opinion of management, such additional losses are deemed probable.
A summary of the activity in other real estate owned is as follows:
| Nine Months Ended | Year Ended | |||||||
| December 31, 2013 | March 31, 2013 | |||||||
| (In thousands) | ||||||||
| Balance at beginning of period |
$ | 84,342 | $ | 88,841 | ||||
| Additions (1) |
19,352 | 75,727 | ||||||
| Capitalized improvements |
307 | 300 | ||||||
| OREO valuation adjustments, net (2) |
(4,937 | ) | (26,733 | ) | ||||
| Valuation of deposit method property (3) |
— | (3,301 | ) | |||||
| Transfer to premises and equipment |
— | (2,870 | ) | |||||
| Sales |
(35,604 | ) | (47,622 | ) | ||||
|
|
|
|
|
|||||
| Balance at end of period |
$ | 63,460 | $ | 84,342 | ||||
|
|
|
|
|
|||||
F-41
Table of Contents
| (1) | Includes a transfer from premises and equipment of a closed retail branch facility no longer used for banking purposes totaling $558,000 during the year ended March 31, 2013. |
| (2) | Includes adjustments to the OREO reserve for probable losses and property write-downs. |
| (3) | Represents the write-down to fair value less estimated selling costs of a loan classified as OREO due to a Bank financed sale of foreclosed property accounted for under the deposit method because of an inadequate down payment by the buyer. The buyer recently defaulted on this loan and the property has been foreclosed upon and revalued in OREO. The valuation amount includes the write-off of principal and interest payments received over the life of the loan totaling $1.4 million and a charge-off to the allowance for loan losses of $1.9 million. |
The balances at end of period above are net of a valuation allowance of $30.8 million at December 31, 2013 and $36.0 million at March 31, 2013, recognized during the holding period for declines in fair value subsequent to foreclosure or acceptance of deed in lieu of foreclosure. A summary of activity in the OREO valuation allowance is as follows:
| Nine Months Ended December 31, | For the Year Ended March 31, | |||||||||||||||
| 2013 | 2012 | 2013 | 2012 | |||||||||||||
| (Unaudited) | ||||||||||||||||
| (In thousands) | ||||||||||||||||
| Balance at beginning of period |
$ | 36,009 | $ | 22,521 | $ | 22,521 | $ | 19,975 | ||||||||
| Provision |
4,937 | 17,498 | 26,733 | 15,338 | ||||||||||||
| Sales |
(10,104 | ) | (8,891 | ) | (13,245 | ) | (12,792 | ) | ||||||||
|
|
|
|
|
|
|
|
|
|||||||||
| Balance at end of period |
$ | 30,842 | $ | 31,128 | $ | 36,009 | $ | 22,521 | ||||||||
|
|
|
|
|
|
|
|
|
|||||||||
Net OREO expense consisted of the following components:
| Nine Months Ended December 31, | Year Ended March 31, | |||||||||||||||
| 2013 | 2012 | 2013 | 2012 | |||||||||||||
| (Unaudited) | ||||||||||||||||
| (In thousands) | ||||||||||||||||
| Valuation adjustments |
$ | 4,937 | $ | 17,498 | $ | 26,733 | $ | 15,338 | ||||||||
| Foreclosure cost expense |
1,541 | 2,093 | 2,602 | 4,387 | ||||||||||||
| Expenses from operations, net |
3,319 | 5,721 | 8,236 | 8,959 | ||||||||||||
|
|
|
|
|
|
|
|
|
|||||||||
| OREO expense, net |
$ | 9,797 | $ | 25,312 | $ | 37,571 | $ | 28,684 | ||||||||
|
|
|
|
|
|
|
|
|
|||||||||
Note 7—Premises, Equipment and Lease Commitments
Premises and equipment are summarized as follows:
| December 31, 2013 | March 31, 2013 | |||||||
| (In thousands) | ||||||||
| Land and land improvements |
$ | 7,947 | $ | 7,948 | ||||
| Office buildings |
41,510 | 41,569 | ||||||
| Furniture and equipment |
38,483 | 36,666 | ||||||
| Leasehold improvements |
4,264 | 4,280 | ||||||
|
|
|
|
|
|||||
| 92,204 | 90,463 | |||||||
| Less accumulated depreciation and amortization |
(67,404 | ) | (65,994 | ) | ||||
|
|
|
|
|
|||||
| $ | 24,800 | $ | 24,469 | |||||
|
|
|
|
|
|||||
F-42
Table of Contents
Depreciation expense is summarized as follows:
| Nine Months Ended December 31, | Year Ended March 31, 2013 | |||||||||||||||
| 2013 | 2012 | 2013 | 2012 | |||||||||||||
| (Unaudited) | ||||||||||||||||
| (In thousands) | ||||||||||||||||
| Building depreciation expense |
$ | 959 | $ | 1,080 | $ | 1,397 | $ | 1,484 | ||||||||
| Furniture and fixture depreciation expense |
912 | 1,396 | 1,682 | 2,010 | ||||||||||||
|
|
|
|
|
|
|
|
|
|||||||||
| $ | 1,871 | $ | 2,476 | $ | 3,079 | $ | 3,494 | |||||||||
|
|
|
|
|
|
|
|
|
|||||||||
The Corporation leases 19 branch offices and office facilities under non-cancelable operating leases which expire on various dates through 2029. Future minimum payments under non-cancelable operating leases with initial or remaining terms of one year or more at December 31, 2013 are as follows:
| Year Ending December 31, |
Amount of Future Minimum Payments |
|||
| (In thousands) | ||||
| 2014 |
$ | 1,426 | ||
| 2015 |
1,325 | |||
| 2016 |
1,179 | |||
| 2017 |
1,055 | |||
| 2018 |
1,029 | |||
| Thereafter |
5,561 | |||
|
|
|
|||
| Total |
$ | 11,575 | ||
|
|
|
|||
For the nine months ended December 31, 2013 and 2012 and fiscal years ended March 31, 2013 and 2012, land and building lease rental expense was $1.3 million, $1.4 million, $1.9 million and $2.2 million, respectively.
Note 8—Mortgage Servicing Rights
Mortgage servicing rights (MSRs) are recorded when loans are sold to third parties with servicing of those loans retained. In addition, MSRs are recorded when acquiring or assuming an obligation to service a financial (loan) asset that does not relate to an asset that is owned. Servicing assets are initially measured at fair value determined using a discounted cash flow model based on market assumptions at the time of origination. Subsequently, the MSR asset is carried at the lower of amortized cost or fair value. MSRs are assessed for impairment using a discounted cash flow model provided by a third party that is based on current market assumptions at the end of each reporting period. For purposes of measuring impairment, the servicing rights are stratified into relatively homogeneous pools based on characteristics such as product type and interest rate bands. Impairment is recognized, if necessary, at the pool level rather than for each individual servicing right asset.
Accounting for MSRs is based on the amortization method. Under this method, servicing assets are amortized in proportion to and over the period of net servicing income. Income generated as the result of the capitalization of new servicing assets is reported as net gain on sale of loans and the amortization of servicing assets is reported as a reduction to loan servicing income in the consolidated statements of operations. Ancillary income is recorded in other non-interest income.
F-43
Table of Contents
Information regarding the Corporation’s mortgage servicing rights for the nine months ended December 31, 2013 and the fiscal year ended March 31, 2013 is as follows:
| Nine Months Ended | Year Ended | |||||||
| December 31, 2013 | March 31, 2013 | |||||||
| (In thousands) | ||||||||
| Balance at beginning of period |
$ | 24,235 | $ | 24,970 | ||||
| Additions |
2,751 | 8,566 | ||||||
| Amortization |
(3,945 | ) | (9,301 | ) | ||||
|
|
|
|
|
|||||
| Balance at end of period - before valuation allowance |
23,041 | 24,235 | ||||||
| Valuation allowance at end of period |
(747 | ) | (2,411 | ) | ||||
|
|
|
|
|
|||||
| Balance at end of period |
$ | 22,294 | $ | 21,824 | ||||
|
|
|
|
|
|||||
| Fair value at the end of the period |
$ | 23,553 | $ | 22,088 | ||||
| Key assumptions: |
||||||||
| Weighted average discount rate |
12.02 | % | 10.79 | % | ||||
| Weighted average prepayment speed |
7.06 | % | 11.76 | % | ||||
The projections of amortization expense for mortgage servicing rights set forth below are based on asset balances as of December 31, 2013 and an assumed amortization rate of 20% per year. Future amortization expense may be significantly different depending upon changes in the mortgage servicing portfolio, mortgage interest rates and market conditions.
| MSR | ||||
| Amortization | ||||
| (In thousands) | ||||
| Nine months ended December 31, 2013 |
$ | 3,945 | ||
|
|
|
|||
| Estimate for the year ended December 31, |
||||
| 2014 |
$ | 4,608 | ||
| 2015 |
3,687 | |||
| 2016 |
2,949 | |||
| 2017 |
2,359 | |||
| 2018 |
1,888 | |||
| Thereafter |
7,550 | |||
|
|
|
|||
| Total |
$ | 23,041 | ||
|
|
|
|||
The unpaid principal balance of mortgage loans serviced for others is not included in the consolidated balance sheets. The unpaid principal of mortgage loans serviced was approximately $2.71 billion at December 31, 2013 and $2.91 billion at March 31, 2013.
Loans intended to be sold are originated in accordance with specific criteria established by the investor agencies—these are known as “conforming loans”. During the sale of these loans, certain representations and warranties are made that the loans conform to these previously established underwriting standards. In the event that any of these representations and warranties or standards are found to be out of compliance, the Corporation is responsible for repurchasing the loan at the unpaid principal balance or indemnifying the buyer against loss related to that loan. The expense recorded to indemnify investors for such losses totaled $687,000 and $1.4 million for the nine months ended December 31, 2013 and 2012, respectively, and $4.5 million and $157,000 for the fiscal years ended March 31, 2013 and 2012, respectively. The $4.5 million recorded in the fiscal year ended March 31, 2013 included a $2.6 million provision for repurchased loans.
F-44
Table of Contents
Note 9—Deposits
Deposits are summarized as follows:
| December 31, 2013 | March 31, 2013 | |||||||||||||||
| Weighted | Weighted | |||||||||||||||
| Carrying | Average | Carrying | Average | |||||||||||||
| Amount | Rate | Amount | Rate | |||||||||||||
| (Dollars in thousands) | ||||||||||||||||
| Non-interest-bearing checking |
$ | 259,926 | — | % | $ | 267,732 | — | % | ||||||||
| Interest-bearing checking |
301,956 | 0.07 | 295,478 | 0.08 | ||||||||||||
|
|
|
|
|
|||||||||||||
| Total checking accounts |
561,882 | 0.04 | 563,210 | 0.04 | ||||||||||||
| Money market accounts |
468,461 | 0.19 | 491,330 | 0.19 | ||||||||||||
| Regular savings |
293,159 | 0.10 | 290,705 | 0.10 | ||||||||||||
| Advance payments by borrowers for taxes and insurance |
822 | 0.10 | 20,804 | 0.10 | ||||||||||||
| Certificates of deposit: |
||||||||||||||||
| 0.00% to 0.99% |
457,407 | 0.33 | 519,909 | 0.39 | ||||||||||||
| 1.00% to 1.99% |
67,762 | 1.28 | 92,164 | 1.23 | ||||||||||||
| 2.00% to 2.99% |
16,116 | 2.37 | 17,628 | 2.37 | ||||||||||||
| 3.00% to 3.99% |
7,310 | 3.59 | 12,433 | 3.58 | ||||||||||||
| 4.00% and above |
2,374 | 4.24 | 16,842 | 4.38 | ||||||||||||
|
|
|
|
|
|||||||||||||
| Total certificates of deposit |
550,969 | 0.57 | 658,976 | 0.72 | ||||||||||||
|
|
|
|
|
|||||||||||||
| Total deposits |
$ | 1,875,293 | 0.24 | % | $ | 2,025,025 | 0.31 | % | ||||||||
|
|
|
|
|
|||||||||||||
Annual maturities of certificates of deposit outstanding at December 31, 2013 are summarized as follows:
| Matures During Year Ending December 31 |
Amount | |||
| (In thousands) | ||||
| 2014 |
$ | 380,889 | ||
| 2015 |
87,820 | |||
| 2016 |
33,166 | |||
| 2017 |
27,240 | |||
| 2018 |
21,854 | |||
|
|
|
|||
| Total |
$ | 550,969 | ||
|
|
|
|||
At December 31, 2013 and March 31, 2013, certificates of deposit with balances greater than or equal to $100,000 totaled $88.7 million and $109.5 million, respectively.
The Bank has entered into agreements with certain brokers that will provide deposits obtained from their customers at specified interest rates for an identified fee, or so called “brokered deposits.” At December 31, 2013 and March 31, 2013, the Bank had zero and $100,000, respectively, in brokered deposits. Due to existing capital levels, the Bank is currently prohibited from obtaining or renewing any brokered deposits. There were no out of network certificates of deposit at December 31, 2013 and March 31, 2013. These deposits, which are not considered brokered deposits, are opened via internet listing services and are kept within FDIC insured balance limits.
F-45
Table of Contents
Note 10—Other Borrowed Funds
Other borrowed funds consist of the following:
| December 31, 2013 | March 31, 2013 | |||||||||||||||||||||||
| Weighted | Weighted | |||||||||||||||||||||||
| Matures During Year | Average | Matures During Year | Average | |||||||||||||||||||||
| Ending December 31, | Amount | Rate | Ending March 31, | Amount | Rate | |||||||||||||||||||
| (Dollars in thousands) | ||||||||||||||||||||||||
| FHLB advances: |
2014 | $ | — | — | % | 2014 | $ | 11,500 | 1.93 | % | ||||||||||||||
| 2018 | 10,000 | 2.33 | 2018 | 100,000 | 3.36 | |||||||||||||||||||
| 2019 | — | 0.00 | 2019 | 86,000 | 2.87 | |||||||||||||||||||
|
|
|
|
|
|
|
|
|
|||||||||||||||||
| Total FHLB advances |
10,000 | 2.33 | 197,500 | 3.06 | ||||||||||||||||||||
| Credit agreement |
— | — | 116,300 | 15.00 | ||||||||||||||||||||
| Repurchase agreements |
2,636 | 0.10 | 3,425 | 0.14 | ||||||||||||||||||||
| Long term lease obligation |
241 | 2.46 | — | — | ||||||||||||||||||||
|
|
|
|
|
|||||||||||||||||||||
| $ | 12,877 | 1.88 | % | $ | 317,225 | 7.41 | % | |||||||||||||||||
|
|
|
|
|
|||||||||||||||||||||
FHLB Advances
The Bank pledges certain loans that meet underwriting criteria established by the FHLB as collateral for outstanding advances. The unpaid principal balance of loans pledged to secure FHLB borrowings totaled $659.4 million and $717.0 million at December 31, 2013 and March 31, 2013, respectively. The FHLB borrowings are also collateralized by mortgage-related securities with a fair value of $122.2 million and $152.1 million at December 31, 2013 and March 31, 2013, respectively. At December 31, 2013, there were no FHLB borrowings with call features that may be exercised by the FHLB.
On September 19, 2013, FHLB advances totaling $176.0 million were prepaid. The prepaid advances were fixed rate, maturing in January 2018, with a then current weighted average rate of 3.18%. The prepayment triggered an early termination penalty of $16.1 million which was recorded in non-interest expense. On December 21, 2012, FHLB advances totaling $150.0 million were prepaid. The prepaid advances were floating rate, maturing in January 2015, with a then current weighted average rate of 1.41%. The prepayment triggered an early termination penalty of $3.5 million which was recorded in non-interest expense.
Credit Agreement
As of March 31, 2013, we had drawn a total of $116.3 million pursuant to the Credit Agreement at a weighted average interest rate of 15.0%, on a short term line of credit to various lenders led by the Administrative Agent. On September 27, 2013, pursuant to the Plan of Reorganization, we satisfied all of our obligations under the Credit Agreement through a cash payment to the Lenders of $49.0 million (plus expense reimbursement as contemplated by the Credit Agreement) and the Credit Agreement was terminated. We recorded $134.5 million extinguishment of debt in the results of operations during the nine months ended December 31, 2013.
Temporary Liquidity Guarantee Program
In October 2008, the Secretary of the United States Department of the Treasury invoked the systemic risk exception of the FDIC Improvement Act of 1991 and the FDIC announced the Temporary Liquidity Guarantee Program (the “TLGP”). The TLGP provides a guarantee, through the earlier of maturity or December 31, 2012, of certain senior unsecured debt issued by participating Eligible Entities (including the Corporation) between October 14, 2008 and December 31, 2009. The Bank signed a master agreement with the FDIC on December 5, 2008 for issuance of bonds under the program and subsequently issued $60.0 million of bonds in February 2009 bearing interest at a fixed rate of 2.74%. The bonds matured on February 11, 2012 and were paid in full.
F-46
Table of Contents
Note 11—Offsetting Assets and Liabilities
ASC 210-20-50 requires entities to provide disclosures of both gross information and net information about instruments and transactions eligible for offset in the statement of financial position and instruments and transactions subject to an agreement similar to a master netting arrangement. The objective of this disclosure is to facilitate comparison between those entities that prepare their financial statements on the basis of US GAAP and those entities that prepare their financial statements on the basis of IFRS.
Offsetting, otherwise known as netting, takes place when entities present their rights and obligations to each other as a net amount in their statement of financial condition. The Company has certain assets and liabilities on the Consolidated Balance Sheets which could be subject to the right of setoff and related arrangements associated with financial instruments and derivatives. Derivative instruments reported are used as part of a risk management strategy to address exposure to changes in interest rates inherent in the Company’s origination and sale of certain residential mortgages into the secondary market, as presented in Note 16—Derivative Financial Instruments. A repurchase agreement is a transaction that involves the “sale” of financial assets by one party to another, subject to an agreement by the “seller” to repurchase the assets at a specified date or in specified circumstances.
The following table reflects the gross and net amounts of such assets and liabilities as of December 31, 2013 and March 31, 2013.
| As of December 31, 2013 |
Gross Amounts of Recognized Assets or Liabilities |
Gross Amounts Offset in the Consolidated Balance Sheets |
Net Amount of Assets Presented in the Consolidated Balance Sheets |
|||||||||
| Assets |
||||||||||||
| Interest rate commitments |
$ | 40 | $ | — | $ | 40 | ||||||
| Forward sale contracts |
33 | (1 | ) | 32 | ||||||||
| Liabilities |
||||||||||||
| Interest rate commitments |
16 | — | 16 | |||||||||
| Forward sale contracts |
1 | (1 | ) | — | ||||||||
| Repurchase Agreements |
2,636 | — | 2,636 | |||||||||
| As of March 31, 2013 |
||||||||||||
| Assets |
||||||||||||
| Interest rate commitments |
$ | 689 | $ | — | $ | 689 | ||||||
| Forward sale contracts |
1 | (1 | ) | — | ||||||||
| Liabilities |
||||||||||||
| Interest rate commitments |
3 | — | 3 | |||||||||
| Forward sale contracts |
313 | (1 | ) | 312 | ||||||||
| Repurchase Agreements |
3,425 | — | 3,425 | |||||||||
Note 12—Stockholders’ Equity
Pursuant to the Plan of Reorganization, on September 25, 2013, we (i) converted from a Wisconsin corporation to a Delaware corporation in accordance with Section 265 of the Delaware General Corporation Law and (ii) filed a Certificate of Incorporation with the Secretary of State of the State of Delaware (the “Amended Charter”), to, among other things, declassify our Board, increase the number of authorized shares of our common stock and adopt certain restrictions on acquisitions and dispositions of our securities. The Amended Charter provides for (a) 2,000,000,000 shares of authorized common stock, par value $0.01 per share (the “Common Stock”), and (b) 1,000,000 shares of authorized preferred stock, par value $0.01 per share. A reverse stock split was effected and a subsequent amendment to the corporate charter was filed on October 2, 2013 providing for 11,900,000 shares of authorized common stock, par value $0.01 per share and 100,000 shares of authorized preferred stock, par value $0.01. There are 9,050,000 shares of Common Stock outstanding as of December 31,
F-47
Table of Contents
2013. See Note 2—Significant Transactions, Significant Risks and Uncertainties for information regarding the Plan of Reorganization.
Preferred Stock
On January 30, 2009, pursuant to the Treasury’s Capital Purchase Program, we issued and sold to the Treasury 110,000 shares of Fixed Rate Cumulative Perpetual Preferred Stock, Series B of the Company with an aggregate liquidation preference of $110.0 million (the “TARP Preferred Stock”). In addition, we issued to the Treasury a warrant (the “TARP Warrant”) to purchase up to 7,399,103 shares of our common stock, par value $0.10 per share (the “Legacy Common Stock”), at an initial per share exercise price of $2.23. Pursuant to the Plan of Reorganization, we, on the Effective Date and immediately following the consummation of the Private Placements, (i) exchanged the TARP Preferred Stock for 60.0 million shares (adjusted to 300,000 shares as a result of the reverse stock split) of Common Stock (the “Treasury Issuance”) and (ii) cancelled the TARP Warrant in its entirety (collectively, the “TARP Exchange”). The difference between the Common Stock issued and the Preferred Stock redeemed of $104.0 million was recorded as an increase directly to retained earnings. The $104.0 million represents a return from the Preferred stockholder thereby increasing the amount available to common stockholders for purposes of earnings per share.
Following the effectiveness of the Plan of Reorganization, the Treasury sold to certain institutional investors (the “Secondary Investors”) all of the shares of Common Stock delivered to the Treasury in connection with the Treasury Issuance at a purchase price equal to $0.10 per share (the “Secondary Treasury Sales”) under the securities purchase agreements, dated as of September 19, 2013, among the Treasury, the Secondary Investor and (with respect to certain provisions) the Company. In connection with the Secondary Treasury Sales, we entered into secondary sale purchaser agreements with the Secondary Investors pursuant to which we made certain representations and warranties to the Investor and provided rights to the Secondary Investors similar to the rights provided to Investors under the Stock Purchase Agreements. In connection with the Secondary Treasury Sales, the Treasury received gross proceeds of $6.0 million and ceased to be our stockholder.
Common Stock
In connection with the Plan of Reorganization, we entered into stock purchase agreements with certain institutional and other private investors and directors and officers of the Company (the “Investors”) for the purchase and sale of 1,750,000,000 (adjusted on October 2, 2013 as a result of a reverse stock split to 8,750,000 shares) shares of our Common Stock at a purchase price of $0.10 per share.
Cancellation of Legacy Common Stock
As of July 31, 2013, we had 21,247,225 shares of Legacy Common Stock issued and outstanding. On the Effective Date, immediately following the consummation of the TARP Exchange, all shares of the outstanding Legacy Common Stock including those shares held as treasury stock and in any stock incentive plans were cancelled for no consideration pursuant to the Plan of Reorganization. In connection with the cancellation of the Legacy Common Stock pursuant to the Plan of Reorganization, the Rights Agreement, dated as of November 5, 2010, by and between the Company and American Stock Transfer & Trust Company, LLC was terminated on the Effective Date in accordance with its terms.
Note 13—Regulatory Capital
The Bank is subject to various regulatory capital requirements administered by the federal banking agencies. Failure to meet minimum capital requirements can initiate certain mandatory, and possibly additional discretionary actions by bank regulators that, if undertaken, could have a direct material effect on the Bank’s financial statements. Under capital adequacy guidelines and the regulatory framework for prompt corrective action, the Bank must meet specific capital guidelines that involve quantitative measures of the Bank’s assets,
F-48
Table of Contents
liabilities and certain off-balance-sheet items as calculated under regulatory accounting practices. The Bank’s capital amounts and classification are also subject to qualitative judgments by the regulators about components, risk weightings, and other factors.
Qualitative measures established by regulation to ensure capital adequacy require the Bank to maintain minimum amounts and ratios of tier 1 leverage, tier 1 risk-based and total risk-based capital. Under standard regulatory guidelines, a bank must have a total risk-based capital ratio of 8% or greater to be considered “adequately capitalized.” The Bank is required pursuant to the previously issued C&D Orders to maintain a total risk-based capital ratio of 12%, which exceeds traditional capital requirements for a bank. The Bank was in compliance with these requirements at December 31, 2013.
The following table summarizes the Bank’s capital ratios and the ratios required by its federal regulators to be considered adequately or well capitalized under standard regulatory guidelines and as required by the C&D Orders at December 31, 2013 and March 31, 2013:
| Minimum Required | ||||||||||||||||||||||||||||||||
| To be Adequately | To be Well | Under Order to | ||||||||||||||||||||||||||||||
| Actual | Capitalized | Capitalized | Cease and Desist | |||||||||||||||||||||||||||||
| Capital | Ratio | Capital | Ratio | Capital | Ratio | Capital | Ratio | |||||||||||||||||||||||||
| (Dollars in thousands) | ||||||||||||||||||||||||||||||||
| December 31, 2013 |
||||||||||||||||||||||||||||||||
| Tier 1 leverage (1) |
$ | 201,995 | 9.60 | % | $ | 84,170 | 4.00 | % | $ | 105,212 | 5.00 | % | $ | 168,340 | 8.00 | % | ||||||||||||||||
| Tier 1 risk-based capital (2) |
201,995 | 15.77 | 51,226 | 4.00 | 76,839 | 6.00 | N/A | N/A | ||||||||||||||||||||||||
| Total risk-based capital (3) |
218,668 | 17.07 | 102,452 | 8.00 | 128,065 | 10.00 | 153,678 | 12.00 | ||||||||||||||||||||||||
| March 31, 2013 |
||||||||||||||||||||||||||||||||
| Tier 1 leverage (1) |
$ | 107,272 | 4.53 | % | $ | 94,775 | 4.00 | % | $ | 118,469 | 5.00 | % | $ | 189,551 | 8.00 | % | ||||||||||||||||
| Tier 1 risk-based capital (2) |
107,272 | 7.71 | 55,655 | 4.00 | 83,483 | 6.00 | N/A | N/A | ||||||||||||||||||||||||
| Total risk-based capital (3) |
125,459 | 9.02 | 111,311 | 8.00 | 139,139 | 10.00 | 166,966 | 12.00 | ||||||||||||||||||||||||
| (1) | Tier 1 capital divided by adjusted total assets. |
| (2) | Tier 1 capital divided by total risk-weighted assets. |
| (3) | Total risk-based capital divided by total risk-weighted assets. |
The following table presents the components of the Bank’s regulatory capital at December 31, 2013 and March 31, 2013:
| December 31, 2013 |
March 31, 2013 |
|||||||
| (In thousands) | ||||||||
| Stockholders’ equity of the Bank |
$ | 196,469 | $ | 112,796 | ||||
| Less: Disallowed servicing assets |
(1,096 | ) | (1,945 | ) | ||||
| Accumulated other comprehensive income (loss) |
6,622 | (3,579 | ) | |||||
|
|
|
|
|
|||||
| Tier 1 capital |
201,995 | 107,272 | ||||||
| Plus: Allowable allowance for loan losses |
16,673 | 18,187 | ||||||
|
|
|
|
|
|||||
| Total risk-based capital |
$ | 218,668 | $ | 125,459 | ||||
|
|
|
|
|
|||||
The Bank may not declare or pay a cash dividend if such declaration and payment would violate regulatory requirements. As part of the C&D Orders, the Corporation must receive the permission of the Federal Reserve prior to declaring, making or paying any dividends or other capital distributions on its capital stock as further described in Note 2.
F-49
Table of Contents
Note 14—Employee Benefit Plans
Defined Contribution Plans
The Corporation maintains a defined contribution plan under Sections 401(a) and 401(k) of the Internal Revenue Code, the AnchorBank, fsb Retirement Plan, in which all employees are eligible to participate. Employees become eligible on the first of the month following 60 days of employment. Participating employees may contribute up to 100% of their base compensation on a pre-tax basis up to annual IRS limits. In January 2013, the Corporation reinstated the matching contribution which had been suspended since October 2009. The Corporation previously matched the first 2% contributed with a dollar-for-dollar match and the next 2% of employee contributions at a rate of $.50 for each dollar. These amounts were increased beginning in January 2014 to the first 2% contributed with a dollar-for-dollar match, the next 2% matched at a rate of $0.50 for each dollar and the next 4% matched at $0.25 for each dollar. The plan offers 20 investment options and employees are allowed to self-direct their investments on a daily basis. The Corporation may also contribute additional amounts at its discretion. The Corporation contributed $579,000 and zero for the nine months ended December 31, 2013 and 2012, $213,000 for the fiscal year ended March 31, 2013 and made no contributions to this plan for the fiscal year ended March 31, 2012.
MRP
The Corporation maintained a Management Recognition Plan (“MRP”), under which a total of 4% of the shares of the Corporation’s common stock was acquired and reserved for issuance under the MRP. The Bank previously contributed $2.0 million to the MRP with which the MRP trustee acquired a total of 1,000,000 shares of the Corporation’s common stock. In 2001, the MRP was amended and restated to extend the term. There were no shares granted, no compensation expense and no shares vested related to the MRP during the nine months ended December 31, 2013 and 2012 or the fiscal years ended March 31, 2013 and 2012.
All shares issued under the plan were cancelled as part of the Plan of Reorganization. The number and cost of unallocated MRP shares totaled 429,869 shares and $927,000 at March 31, 2013 and 2012 and were included in treasury stock in the consolidated balance sheets.
Stock Compensation Plans
The Corporation had several stock-based compensation plans (“Plan(s)”) including the 2004 Equity Incentive Plan under which shares of common stock were reserved for the grant of incentive and non-incentive stock options and restricted stock or restricted stock units to directors, officers and employees. All shares or options issued under any plans were cancelled as part of the Plan of Reorganization. See Note 2—Significant Transactions, Significant Risks and Uncertainties for additional information.
Stock Options
Stock option activity is summarized as follows:
| Nine Months
Ended December 31, 2013 |
Year Ended March 31, | |||||||||||||||||||||||
| 2013 | 2012 | |||||||||||||||||||||||
| Options | Weighted Average Price |
Options | Weighted Average Price |
Options | Weighted Average Price |
|||||||||||||||||||
| Outstanding at beginning of year |
120,345 | $ | 25.82 | 189,345 | $ | 25.19 | 408,850 | $ | 22.34 | |||||||||||||||
| Forfeited |
— | — | (69,000 | ) | 24.08 | (219,505 | ) | 19.89 | ||||||||||||||||
| Cancelled (1) |
(120,345 | ) | 25.82 | — | — | — | — | |||||||||||||||||
|
|
|
|
|
|
|
|||||||||||||||||||
| Outstanding at end of year |
— | $ | — | 120,345 | $ | 25.82 | 189,345 | $ | 25.19 | |||||||||||||||
|
|
|
|
|
|
|
|||||||||||||||||||
| Options vested and exercisable at year-end |
— | $ | — | 120,345 | $ | 25.82 | 189,345 | $ | 25.19 | |||||||||||||||
|
|
|
|
|
|
|
|||||||||||||||||||
| (1) | All legacy common stock was cancelled pursuant to the terms of the Plan of Reorganization. See Note 2 for additional information. |
F-50
Table of Contents
The aggregate intrinsic value of options outstanding and exercisable at March 31, 2013 was zero. There was no compensation expense related to stock options for the nine months ended December 31, 2013 and 2012 or the fiscal years ended March 31, 2013 and 2012.
There were no outstanding stock options nor exercisable stock options at December 31, 2013.
Restricted Stock
Restricted stock grants primarily vest over a period of three to five years and are included in outstanding shares at the time of grant. The fair value of restricted stock equals the average of the high and low market value on the date of grant and that amount is amortized on a straight-line basis to compensation and benefits expense over the vesting period. There were no shares granted under the plan for the nine months ended December 31, 2013 or the fiscal years ended March 31, 2013 and 2012. The restricted stock grant plan expense was zero for the nine months ended December 31, 2013 and 2012, and $55,000 and $256,000 for the fiscal years ended March 31, 2013 and 2012, respectively.
The activity in restricted stock is summarized as follows:
| Year Ended March 31, | ||||||||||||||||
| 2013 | 2012 | |||||||||||||||
| Shares | Weighted Average Grant Date Fair Value |
Shares | Weighted Average Grant Date Fair Value |
|||||||||||||
| Balance at beginning of year |
18,500 | $ | 22.85 | 30,000 | $ | 23.24 | ||||||||||
| Granted |
— | — | — | — | ||||||||||||
| Vested |
(18,000 | ) | 22.85 | (11,500 | ) | 23.87 | ||||||||||
| Forfeited |
(500 | ) | 22.85 | — | — | |||||||||||
|
|
|
|
|
|||||||||||||
| Balance at end of year |
— | $ | — | 18,500 | $ | 22.85 | ||||||||||
|
|
|
|
|
|||||||||||||
As of March 31, 2013, all compensation cost related to restricted stock grants was recognized. The fair value of restricted stock that vested during the year ended March 31, 2013 was $8,000.
Deferred Compensation Plans
Deferred compensation plans include an agreement with a previous executive established in 1986 to provide recognition of services performed and additional compensation for services to be performed. The Bank established a grantor trust in 1992 and fully funded the vehicle to facilitate distribution obligations under the agreement, and the trust subsequently purchased shares as all benefits payable under the agreement are payable in the Corporation’s stock. The benefits were 100% vested and the first distribution was made on December 3, 2010. The remaining balance payable of 166,480 shares was cancelled as part of the Plan or Reorganization.
The Corporation also established an Excess Benefit Plan to provide deferred compensation to certain members of management. As contributions were made to a participant’s account, funds were deposited into a trust account for the participant and in turn shares of ABCW stock were purchased. No contributions were made during the nine months ended December 31, 2013 or the fiscal years ended March 31, 2013 and 2012 and all shares previously issued under the plan were cancelled as part of the Plan of Reorganization.
An obligation totaling $901,000 at March 31, 2013, representing the cost basis of undistributed shares in both plans described above was included in the deferred compensation obligation component of stockholders’ deficit. This amount is offset by the cost basis of undistributed shares purchased included in the additional paid in capital component of stockholders’ deficit. All shares issued under the plan were cancelled as part of the Plan of Reorganization.
F-51
Table of Contents
Note 15—Commitments and Contingent Liabilities
The Corporation is a party to financial instruments with off-balance-sheet risk in the normal course of business to meet the financing needs of its customers. These financial instruments include commitments to extend credit and financial guarantees which involve, to varying degrees, elements of credit and interest rate risk in excess of the amount recognized in the consolidated balance sheets. The contract amounts of those instruments reflect the extent of involvement and exposure to credit loss the Corporation has in particular classes of financial instruments. The same credit policies are used in making commitments and conditional obligations as for on-balance-sheet instruments. Since many of the commitments are expected to expire without being drawn upon, the total committed amounts do not necessarily represent future cash requirements.
Financial instruments whose contract amounts represent credit risk are as follows:
| December 31, 2013 | March 31, 2013 | |||||||
| (In thousands) | ||||||||
| Commitments to extend credit |
$ | 26,054 | $ | 34,697 | ||||
| Unused commitments |
657 | — | ||||||
| Unused lines of credit: |
||||||||
| Home equity |
109,414 | 108,628 | ||||||
| Credit cards |
22,751 | 28,541 | ||||||
| Commercial |
54,840 | 15,666 | ||||||
| Letters of credit |
17,131 | 15,546 | ||||||
| Credit enhancement under the Federal Home Loan Bank of Chicago Mortgage Partnership Finance Program |
15,877 | 15,877 | ||||||
Commitments to extend credit are in the form of a loan in the near future. Unused lines of credit are agreements to lend to a customer as long as there is no violation of any condition established in the contract and may be drawn upon at the borrowers’ discretion. Letters of credit commit the Corporation to make payments on behalf of customers when certain specified future events occur. Commitments and letters of credit primarily have fixed expiration dates or other termination clauses and may require payment of a fee. As some such commitments expire without being drawn upon, the total commitment amounts do not necessarily represent future cash requirements. The Corporation evaluates each customer’s creditworthiness on a case-by-case basis. With the exception of credit card lines of credit, the Corporation primarily extends credit on a secured basis. Collateral obtained consists primarily of single-family residences and income-producing commercial properties.
At December 31, 2013, the Corporation has $4.7 million of reserves on unfunded commitments, unused lines of credit, letters of credit and $2.6 million of reserves for repurchase of sold loans classified in other liabilities. The Corporation intends to fund commitments through current liquidity.
The Bank previously participated in the Mortgage Partnership Finance (MPF) Program of the Federal Home Loan Bank of Chicago (FHLB). The program was intended to provide member institutions with an alternative to holding fixed-rate mortgages in their loan portfolios or selling them in the secondary market. An institution participates in the MPF Program by either originating individual loans on a “flow” basis as agent for the FHLB pursuant to the “MPF 100 Program” or by selling, as principal, closed loans owned by an institution to the FHLB pursuant to one of the FHLB’s closed-loan programs. The program was discontinued in 2008 in its present format and the Bank no longer funds loans through the MPF program. The Bank does, however, continue to service the loans funded under the program and maintains the credit exposure and credit enhancement fees. Under the MPF Program, credit risk is shared by the participating institution and the FHLB by structuring the loss exposure in several layers, with the participating institution being liable for losses after application of an initial layer of losses (after any private mortgage insurance) is absorbed by the FHLB, subject to an agreed-upon maximum amount of such secondary credit enhancement which is intended to be in an amount equivalent to a “AA” credit risk rating by a rating agency. The participating institution receives credit enhancement fees from
F-52
Table of Contents
the FHLB for providing this credit enhancement and continuing to manage the credit risk of the MPF Program loans. Participating institutions are also paid specified servicing fees for servicing the loans.
The Corporation previously participated in the Mortgage Partnership Finance Program of the FHLB of Chicago (“MPF Program”). Pursuant to the credit enhancement feature of the MPF Program, the Corporation has retained a secondary credit loss exposure in the amount of $15.9 million at December 31, 2013 related to approximately $214.5 million of residential mortgage loans that the Corporation has originated and is still outstanding as agent for the FHLB. Under the credit enhancement, the FHLB is liable for losses on loans up to one percent of the original delivered loan balances in each pool up to the point the credit enhancement is reset. After the credit enhancement resets, the FHLB loss contingency could reduce depending upon losses experienced and loan balances. The Corporation is then liable for losses over and above the FHLB first loss position up to a contractually agreed-upon maximum amount in each pool that was delivered to the Program. The Corporation receives a monthly fee for this credit enhancement obligation based on the outstanding loan balances. The monthly fee received is net of losses under the MPF Program. The MPF Program was discontinued in 2008 in its present format and the Corporation no longer funds loans through the MPF Program.
Other loans sold to investors with recourse to the Corporation met the underwriting standards of the investor and the Corporation at the time of origination. In the event of default by the borrower, the investor may resell the loans to the Corporation at par value. As the Corporation expects relatively few such loans to become delinquent, the total amount of loans sold with recourse does not necessarily represent future cash requirements. Collateral obtained on such loans consists primarily of single-family residences. The unpaid principal balance of loans repurchased from investors totaled $1.8 million, $1.6 million and $1.7 million for the nine months ended December 31, 2013 and the fiscal years ending March 31, 2013 and 2012, respectively. Alternatively, investors make requests to be made whole on a loan whereby the property has been disposed of at a loss. The related expense was $687,000, $1.4 million, $1.9 million and $157,000 for the nine months ended December 31, 2013 and 2012 and the fiscal years ended March 31, 2013 and 2012, respectively.
In the ordinary course of business, there are legal proceedings against the Corporation and its subsidiaries. Management considers that the aggregate liabilities, if any, resulting from such actions would not have a material, adverse effect on the consolidated financial position of the Corporation.
We are a defendant in a pending lawsuit captioned Village of Kronenwetter v. AnchorBank, fsb, Marathon County, Wisconsin, Case No. 11-CV-1370, which is an action brought by the Village of Kronenwetter on November 14, 2011 to enforce and collect on a $4.4 million letter of credit issued by the Bank in support of the development of a mixed use TIF development in the Village of Kronenwetter, Wisconsin. The complaint alleges that the Bank wrongfully refused to honor a full draw on the letter of credit and that the developer failed to notify the plaintiff of the renewal of the letter of credit or to renew the letter of credit within the time limitations set forth in the development agreement. A specific reserve for loss on unfunded loan commitments was established at June 30, 2013 in the amount of $2.4 million due to a shortfall in the value of the residential real estate development supporting the letter of credit, $1.7 million of which was recorded during the quarter ended June 30, 2013. The specific reserve balance at December 31, 2013 remained at $2.4 million.
We are the plaintiff/counterclaim defendant in a pending lawsuit captioned AnchorBank, fsb v. Henriette McLean et al., Dane County, Wisconsin, Case No. 13-CV-811. The Bank is seeking to enforce personal guarantees executed by McLean related to amounts borrowed by Mineral Point Road Holdings, LLC (“MPRH”). At the time of the commencement of the lawsuit, March 7, 2013, McLean owed the Bank $363,302 under the guarantees. As a result of the recent sale of real estate owned by MPRH, the amount of the debt is now $300,127. The Bank has the right to obtain its attorneys’ fees incurred in collecting on the guarantees if it prevails in the lawsuit. On January 27, 2014, McLean filed a 196-paragraph Counterclaim against the Bank. McLean alleges various misconduct by the Bank related to its loans to MPRH and the procurement of her guarantees. Most of the counterclaims are based upon alleged misrepresentations and/or misrepresentations by omission. McLean is seeking the return of the $182,629 she paid to the Bank in 2012 under her guarantees, treble damages, and
F-53
Table of Contents
punitive damages. McLean has also filed a third-party complaint seeking contribution/indemnity from Joseph Gallina (the managing member of MPRH) and various entities controlled by Gallina.
Note 16—Derivative Financial Instruments
The Corporation enters into contracts that meet the definition of derivative financial instruments in accordance with ASC 815 - Derivative and Hedging. Derivatives are used as part of a risk management strategy to address exposure to changes in interest rates inherent in the Corporation’s origination and sale of certain residential mortgages into the secondary market. These derivative contracts used for risk management purposes include: (1) interest rate lock commitments provided to customers to fund mortgage loans intended to be sold; and (2) forward sale contracts for the future delivery of funded residential mortgages.
Forward sale contracts are entered into when interest rate lock commitments are granted to customers in an effort to economically hedge the effect of future changes in interest rates on the commitments to fund mortgage loans intended to be sold (the “pipeline”), as well as on the portfolio of funded mortgages not yet sold (the “warehouse”). For accounting purposes, these derivatives are not designated as being in a hedging relationship. The contracts are carried at fair value on the consolidated balance sheets, with changes in fair value recorded in the consolidated statements of operations.
The Corporation’s board of directors approved a recommendation by the Asset Liability Committee to utilize a maximum limit for un-hedged exposure in the Bank’s pipeline and warehouse, subject to certain constraints, of $115.0 million.
Derivative financial instruments are summarized as follows:
| December 31, 2013 | March 31, 2013 | |||||||||||||||||
| Balance Sheet Location |
Notional Amount |
Estimated Fair Value |
Notional Amount |
Estimated Fair Value |
||||||||||||||
| (In thousands) | ||||||||||||||||||
| Derivative assets: |
||||||||||||||||||
| Interest rate lock commitments (1) |
Other assets | $ | 3,863 | $ | 37 | $ | 53,169 | $ | 689 | |||||||||
| Unused commitments (2) |
Other assets | 369 | 3 | — | — | |||||||||||||
| Forward contracts to sell mortgage loans (3) |
Other assets | 8,000 | 33 | 10,000 | 1 | |||||||||||||
| Derivative liabilities: |
||||||||||||||||||
| Interest rate lock commitments (1) |
Other liabilities | 2,172 | 12 | 559 | 3 | |||||||||||||
| Unused commitments (2) |
Other liabilities | 288 | 4 | — | — | |||||||||||||
| Forward contracts to sell mortgage loans (3) |
Other assets | 1,000 | 1 | 50,000 | 313 | |||||||||||||
| (1) | Interest rate lock commitments include $1.5 million and $35.8 million of commitments not yet approved in the credit underwriting process at December 31, 2013 and March 31, 2013, respectively, yet represent potential interest rate risk exposure to the extent of those mortgage loan applications eventually approved for funding. |
| (2) | The Corporation recognizes fair value of unused commitments held for trading which consists of closed residential real estate loans still in recission at period end. |
| (3) | The Corporation has elected to offset the fair value of individual forward sale contracts and present a net amount on the Consolidated Balance Sheets in accordance with ASC 815-45, Derivatives and Hedging. |
F-54
Table of Contents
Net gains (losses) included in the consolidated statements of operations related to derivative financial instruments, recognized in net gain on sale of loans, are summarized as follows:
| Nine Months Ended December 31 | Year Ended March 31, | |||||||||||||||
| 2013 | 2012 | 2013 | 2012 | |||||||||||||
| (Unaudited) | ||||||||||||||||
| (In thousands) | ||||||||||||||||
| Interest rate lock commitments |
$ | (688 | ) | $ | 257 | $ | (184 | ) | $ | 796 | ||||||
| Unused commitments |
26 | — | — | — | ||||||||||||
| Forward contracts to sell mortgage loans |
2,463 | (6,703 | ) | (6,836 | ) | (7,270 | ) | |||||||||
|
|
|
|
|
|
|
|
|
|||||||||
| Total |
$ | 1,801 | $ | (6,446 | ) | $ | (7,020 | ) | $ | (6,474 | ) | |||||
|
|
|
|
|
|
|
|
|
|||||||||
Note 17—Fair Value of Financial Instruments
ASC Topic 820 establishes a framework for measuring fair value and disclosures about fair value measurements. Fair value is defined as the price that would be received to sell an asset or paid to transfer a liability in an orderly transaction between market participants at the measurement date.
In determining fair value, various valuation methods are used including market, income and cost approaches. Assumptions that market participants would use in pricing the asset or liability are utilized in these valuation methods, including assumptions about risk and the risks inherent in the inputs to the valuation technique. These inputs may be readily observable, market corroborated or generally unobservable inputs. Valuation methodologies are employed that maximize the use of observable inputs and minimize the use of unobservable inputs. Based on observability of the inputs used in the valuation methodologies, financial assets and liabilities measured at fair value on a recurring and nonrecurring basis are categorized according to the fair value hierarchy. The fair value hierarchy ranks the quality and reliability of the information used to determine fair values. Financial assets and liabilities that are adjusted to fair value are classified in one of the following three categories:
| • | Level 1: Quoted prices (unadjusted) for identical assets or liabilities in active markets that the entity has the ability to access as of the measurement date. |
| • | Level 2: Significant other observable inputs other than Level 1 prices such as quoted prices for similar assets or liabilities; quoted prices in markets that are not active; or other inputs that are observable or can be corroborated by observable market data. |
| • | Level 3: Significant unobservable inputs that reflect a reporting entity’s own assumptions about the assumptions that market participants would use in pricing an asset or liability. |
F-55
Table of Contents
Fair Value on a Recurring Basis
The table below presents the financial instruments carried at fair value as of December 31, 2013 and March 31, 2013, by the valuation hierarchy (as described above):
| Level 1 | Level 2 | Level 3 | Total | |||||||||||||
| (In Thousands) | ||||||||||||||||
| December 31, 2013 |
||||||||||||||||
| Financial assets |
||||||||||||||||
| Investment securities available for sale: |
||||||||||||||||
| U.S. government sponsored and federal agency obligations |
$ | — | $ | 3,376 | $ | — | $ | 3,376 | ||||||||
| Corporate stock and bonds |
355 | — | — | 355 | ||||||||||||
| Non-agency CMOs |
— | — | 6,208 | 6,208 | ||||||||||||
| Government sponsored agency mortgage-backed securities |
— | 50,158 | — | 50,158 | ||||||||||||
| GNMA mortgage-backed securities |
— | 217,775 | — | 217,775 | ||||||||||||
| Loans held for sale (1) |
— | 3,085 | — | 3,085 | ||||||||||||
| Other assets: |
||||||||||||||||
| Interest rate lock commitments |
— | 37 | — | 37 | ||||||||||||
| Unused commitments |
— | 3 | — | 3 | ||||||||||||
| Forward contracts to sell mortgage loans |
— | 33 | — | 33 | ||||||||||||
|
|
|
|
|
|
|
|
|
|||||||||
| Total |
$ | 355 | $ | 274,467 | $ | 6,208 | $ | 281,030 | ||||||||
|
|
|
|
|
|
|
|
|
|||||||||
| Financial liabilities |
||||||||||||||||
| Other liabilities: |
||||||||||||||||
| Interest rate lock commitments |
$ | — | $ | 12 | $ | — | $ | 12 | ||||||||
| Unused commitments |
— | 4 | — | 4 | ||||||||||||
| Forward contracts to sell mortgage loans |
— | 1 | — | 1 | ||||||||||||
|
|
|
|
|
|
|
|
|
|||||||||
| Total |
$ | — | $ | 17 | $ | — | $ | 17 | ||||||||
|
|
|
|
|
|
|
|
|
|||||||||
| (1) | Beginning April 1, 2013, pursuant to ASC 825-10-25 Fair Value Option, loans held for sale are recorded at fair value. |
| Level 1 | Level 2 | Level 3 | Total | |||||||||||||
| (In thousands) | ||||||||||||||||
| March 31, 2013 |
||||||||||||||||
| Financial assets |
||||||||||||||||
| Investment securities available for sale: |
||||||||||||||||
| U.S. government sponsored and federal agency obligations |
$ | — | $ | 3,504 | $ | — | $ | 3,504 | ||||||||
| Corporate stock and bonds |
264 | — | — | 264 | ||||||||||||
| Non-agency CMOs |
— | — | 7,549 | 7,549 | ||||||||||||
| Government sponsored agency mortgage-backed securities |
— | 3,184 | — | 3,184 | ||||||||||||
| GNMA mortgage-backed securities |
— | 252,286 | — | 252,286 | ||||||||||||
| Other assets: |
||||||||||||||||
| Interest rate lock commitments |
— | 689 | — | 689 | ||||||||||||
| Forward contracts to sell mortgage loans |
— | 1 | — | 1 | ||||||||||||
|
|
|
|
|
|
|
|
|
|||||||||
| Total |
$ | 264 | $ | 259,664 | $ | 7,549 | $ | 267,477 | ||||||||
|
|
|
|
|
|
|
|
|
|||||||||
| Financial liabilities |
||||||||||||||||
| Other liabilities: |
||||||||||||||||
| Interest rate lock commitments |
$ | — | $ | 3 | $ | — | $ | 3 | ||||||||
| Forward contracts to sell mortgage loans |
— | 313 | — | 313 | ||||||||||||
|
|
|
|
|
|
|
|
|
|||||||||
| Total |
$ | — | $ | 316 | $ | — | $ | 316 | ||||||||
|
|
|
|
|
|
|
|
|
|||||||||
F-56
Table of Contents
An independent service is used to price available-for-sale U.S. government sponsored and federal agency obligations, government sponsored agency mortgage-backed securities, and GNMA mortgage-backed securities using a market data model under Level 2. The significant inputs used at December 31, 2013 and March 31, 2013 to price GNMA mortgage-backed securities are as follows:
| December 31, 2013 | Weighted Average |
March 31, 2013 | Weighted Average |
|||||||||||||||||||||
| From | To | From | To | |||||||||||||||||||||
| Coupon rate |
1.6 | % | 4.6 | % | 2.4 | % | 1.6 | % | 4.6 | % | 2.4 | % | ||||||||||||
| Duration (in years) |
1.1 | 5.7 | 3.6 | 1.2 | 5.1 | 3.6 | ||||||||||||||||||
| PSA prepayment speed |
128 | 458 | 346 | 283 | 453 | 332 | ||||||||||||||||||
The Corporation had 99.2% of its non-agency CMOs valued by an independent pricing service that used a discounted cash flow model that incorporates inputs considered Level 3 by the accounting guidance.
| December 31, 2013 | Weighted Average |
March 31, 2013 | Weighted Average |
|||||||||||||||||||||
| From | To | From | To | |||||||||||||||||||||
| Observable inputs: |
||||||||||||||||||||||||
| 30 to 59 day delinquency rate |
1.6 | % | 5.8 | % | 4.0 | % | 2.0 | % | 4.6 | % | 3.8 | % | ||||||||||||
| 60 to 89 day delinquency rate |
0.8 | 2.5 | 1.9 | 0.7 | 3.1 | 1.8 | ||||||||||||||||||
| 90 plus day delinquency rate |
4.6 | 9.9 | 6.5 | 2.4 | 6.2 | 5.6 | ||||||||||||||||||
| Loss severity |
52.0 | 68.5 | 57.1 | 39.9 | 71.2 | 58.3 | ||||||||||||||||||
| Coupon rate |
5.0 | 6.0 | 5.5 | 5.0 | 6.0 | 5.5 | ||||||||||||||||||
| Current credit support |
— | 4.3 | — | — | 58.4 | 1.4 | ||||||||||||||||||
| Unobservable inputs: |
||||||||||||||||||||||||
| Month 1 to month 24 constant default rate |
5.3 | 11.6 | 8.2 | 4.5 | 11.5 | 8.1 | ||||||||||||||||||
| Discount rate |
4.0 | 7.0 | 6.6 | 4.0 | 7.0 | 6.3 | ||||||||||||||||||
Other assets and other liabilities include interest rate lock commitments provided to customers to fund mortgage loans intended to be sold and forward sale contracts for future delivery of funded residential mortgages to investors. The Corporation relies on an internal valuation model to estimate the fair value of its interest rate lock commitments, which includes applying an estimated pull-through rate (the percentage of commitments expected to result in a closed loan) based on historical experience; multiplied by quoted investor prices on closed loans for future delivery determined to be reasonably applicable to the loan commitment based on interest rate, terms and rate lock expiration.
The Corporation also relies on an internal valuation model to estimate the fair value of its forward contracts to sell residential mortgage loans (i.e., an estimate of what the Corporation would receive or pay to terminate the forward delivery contract) based on market prices for similar financial instruments, which includes matching specific terms and maturities of the forward commitments against applicable investor pricing available.
F-57
Table of Contents
The following is a reconciliation of assets measured at fair value on a recurring basis using significant unobservable inputs (level 3):
| Nine Months Ended | Year Ended | |||||||
| December 31, 2013 | March 31, 2013 | |||||||
| (In thousands) | ||||||||
| Non-agency CMOs |
||||||||
| Beginning balance |
$ | 7,549 | $ | 21,592 | ||||
| Total realized/unrealized gains (losses): |
||||||||
| Included in earnings |
2 | (191 | ) | |||||
| Included in other comprehensive income |
93 | 3,139 | ||||||
| Included in earnings as unrealized other-than-temporary impairment |
(23 | ) | (412 | ) | ||||
| Included in earnings upon payoff of securities for which other-than-temporary impairment was previously recognized |
— | 4 | ||||||
| Included in earnings as realized other-than-temporary impairment |
224 | 721 | ||||||
| Principal repayments |
(1,637 | ) | (5,042 | ) | ||||
| Sales |
— | (12,262 | ) | |||||
|
|
|
|
|
|||||
| Ending balance |
$ | 6,208 | $ | 7,549 | ||||
|
|
|
|
|
|||||
There were no transfers in or out of Levels 1, 2 or 3 during the nine months ended December 31, 2013 or fiscal year ended March 31, 2013. The Corporation’s policy for determining transfers between levels occurs at the end of the reporting period when circumstances in the underlying valuation criteria changes and result in transfers between levels.
Fair Value on a Nonrecurring Basis
Certain assets are measured at fair value on a nonrecurring basis; that is, the instruments are not measured at fair value on an ongoing basis but are subject to fair value adjustments in certain circumstances (for example, when there is evidence of impairment). Loans held for sale and mortgage servicing rights includes only those items that were adjusted to fair value as of the dates indicated.
The following table presents such assets carried on the consolidated balance sheet by caption and by level within the fair value hierarchy as of December 31, 2013 and March 31, 2013:
| Level 1 | Level 2 | Level 3 | Total | |||||||||||||
| (In thousands) | ||||||||||||||||
| December 31, 2013 |
||||||||||||||||
| Impaired loans, with an allowance recorded, net |
$ | — | $ | — | $ | 44,046 | $ | 44,046 | ||||||||
| Mortgage servicing rights |
— | — | 6,448 | 6,448 | ||||||||||||
| Other real estate owned |
— | — | 63,460 | 63,460 | ||||||||||||
|
|
|
|
|
|
|
|
|
|||||||||
| Total assets at fair value |
$ | — | $ | — | $ | 113,954 | $ | 113,954 | ||||||||
|
|
|
|
|
|
|
|
|
|||||||||
| March 31, 2013 |
||||||||||||||||
| Impaired loans, with an allowance recorded, net |
$ | — | $ | — | $ | 76,430 | $ | 76,430 | ||||||||
| Loans held for sale (1) |
— | 643 | — | 643 | ||||||||||||
| Mortgage servicing rights |
— | — | 20,889 | 20,889 | ||||||||||||
| Other real estate owned |
— | — | 84,342 | 84,342 | ||||||||||||
|
|
|
|
|
|
|
|
|
|||||||||
| Total assets at fair value |
$ | — | $ | 643 | $ | 181,661 | $ | 182,304 | ||||||||
|
|
|
|
|
|
|
|
|
|||||||||
| (1) | Prior to April 1, 2013, loans held for sale were recorded at the lower of cost or fair value. |
F-58
Table of Contents
The significant inputs used at December 31, 2013 for those assets measured at fair value on a nonrecurring basis are as follows:
| December 31, 2013 | ||||
| Method |
Inputs | |||
| Impaired loans, with an allowance recorded, net | Appraised Values | External appraised values-adjustments made to values due to management factors including age of appraisal, age of comparables, known changes in the market and in the collateral and selling and commission cost of 15 % to 35%. | ||
| Mortgage servicing rights | Discounted Cash Flow | Weighted average prepayment speed 7.06 %; weighted average discount rate 12.02%. | ||
| Other real estate owned | Appraised Values | External appraised values less selling and commission cost of 15 % to 35%. | ||
The Corporation does not adjust loans held for investment to fair value on a recurring basis. However, some loans are considered impaired and an allowance for loan losses is established. The specific reserves for collateral dependent impaired loans are based on the fair value of the underlying collateral less estimated costs to sell. The fair value of collateral is usually determined based on appraisals. In some cases, adjustments are made to appraised values due to various factors including age of the appraisal, age of comparables included in the appraisal, and known changes in the market and in the collateral. Since adjustments to appraised values are based on unobservable inputs, the resulting fair value measurement is categorized as a Level 3 measurement.
Loans held for sale primarily consist of certain recently originated fixed- and adjustable-rate residential mortgage loans and are carried at the lower of cost or fair value, determined on a loan level basis. These loans are valued individually based upon quoted market prices for similar loans and the amount of any gross loss is recorded as a valuation allowance in loans held for sale. Fees received from the borrower and direct costs to originate the loan are deferred and recorded as an adjustment to the loan carrying value.
Mortgage servicing rights are recorded as an asset when loans are sold to third parties with servicing rights retained. Mortgage servicing rights are initially recorded at fair value and subsequently amortized in proportion to, and over the period of, estimated net servicing revenues. The carrying value of these assets is reviewed for impairment on a monthly basis using a lower of carrying value or fair value methodology. The fair value of servicing rights is determined by estimating the present value of future net cash flows using a discounted cash flow model, taking into consideration market loan prepayment speeds, discount rates, servicing costs and other economic factors. For purposes of measuring impairment, the rights are stratified based on predominant risk characteristics of the underlying loans which include product type (i.e., fixed, adjustable or balloon) and interest rate bands. If the aggregate carrying value of the capitalized mortgage servicing rights for a stratum exceeds its fair value, the difference is recognized in non-interest expense as an impairment loss.
Critical assumptions used in the MSR discounted cash flow model include mortgage prepayment speeds, discount rates, costs to service, ancillary and late fee income. Variations in the assumptions could materially affect the estimated fair values. Changes to the assumptions are made when market data indicate that new trends have developed. Current market participant assumptions based on loan product types—fixed rate, adjustable rate and balloon loans—include discount rates in the range of 11.5% to 25.0% as well as portfolio weighted average prepayment speeds of 0.0% to 49.3% annual CPR. Many of these assumptions are subjective and involve a high degree of management judgment. MSR valuation assumptions are reviewed and approved by management on a quarterly basis.
F-59
Table of Contents
Prepayment speeds may be affected by economic factors such as changes in home prices, market interest rates, the availability of other credit products to borrowers and customer payment patterns. Prepayment speeds include the impact of all borrower prepayments, including full payoffs, additional principal payments and the impact of loans paid off due to foreclosure liquidations. As market interest rates decline, prepayment speeds will generally increase as customers refinance existing mortgages to more favorable interest rate terms. As prepayment speeds increase, anticipated cash flows will generally decline resulting in a potential reduction, or impairment, of the fair value of the capitalized MSRs. Alternatively, an increase in market interest rates may cause a decrease in prepayment speeds and therefore an increase in fair value of MSRs. Annually, external data is obtained to test the values and assumptions that are used for the initial valuations in the discounted cash flow model.
Real estate acquired by foreclosure, real estate acquired by deed in lieu of foreclosure and other repossessed assets (OREO) are held for sale and are initially recorded at fair value less estimated selling expenses at the date of foreclosure. OREO is re-measured at the lower of cost or fair value after initial recognition and reported using a valuation allowance on foreclosed assets. Fair value is generally based on third party appraisals and is therefore considered a Level 3 measurement.
Fair Value Summary
ASC Topic 825 requires disclosure of fair value information about financial instruments, for which it is practicable to estimate that value, whether or not recognized in the consolidated balance sheets, including those financial assets and liabilities that are not measured and reported at fair value on a recurring or nonrecurring basis. In cases where quoted market prices are not available, fair values are based on estimates using present value or other valuation techniques. Results from these techniques are significantly affected by the assumptions used, including the discount rate and estimates of future cash flows. In that regard, the derived fair value estimates cannot be substantiated by comparison to independent markets and, in many cases, may not be realized in immediate settlement of the instruments. Certain financial instruments with a fair value that is not practicable to estimate and all non-financial instruments are excluded from the disclosure requirements. Accordingly, the aggregate fair value amounts presented in the table below do not necessarily represent the underlying value of the Corporation.
The following methods and assumptions were used in estimating the fair value of financial instruments that were not previously disclosed:
Cash and cash equivalents and accrued interest: The carrying amounts reported in the balance sheets approximate the fair values for those assets and liabilities. In accordance with ASC Topic 820, cash and cash equivalents and accrued interest have been categorized as a Level 2 fair value measurement.
Loans held for investment: The fair value of residential mortgage loans held for investment, commercial real estate loans, commercial and industrial loans, and consumer and other loans held for investment are estimated using observable inputs including estimated cash flows, and discount rates based on interest rates currently being offered for loans with similar terms, to borrowers of similar credit quality. In accordance with ASC Topic 820, loans held for investment that are not included with impaired loans in the preceding section titled Fair Value on a Nonrecurring Basis have been categorized as a Level 2 fair value measurement.
Federal Home Loan Bank stock: The carrying amount of FHLB stock approximates its fair value as it can only be redeemed with the FHLB at par value. In accordance with ASC Topic 820, Federal Home Loan Bank stock has been categorized as a Level 2 fair value measurement.
Deposits: The fair value of checking, savings and money market accounts are estimated using a discounted cash flow analysis, with run-off rates based on published bank regulatory decay rate tables. The fair values of fixed-rate certificates of deposit are estimated using a discounted cash flow calculation that applies current interest rates being offered on certificates of deposit to a schedule of aggregated expected monthly maturities of
F-60
Table of Contents
the outstanding certificates of deposit. In accordance with ASC Topic 820, deposits have been categorized as a Level 2 fair value measurement.
Other borrowed funds: The fair value of FHLB advances and repurchase agreements are estimated using discounted cash flow analysis, based on the Corporation’s current incremental borrowing rates for similar types of borrowing arrangements. In the absence of a reasonably precise methodology to determine the fair value of the credit agreement, carrying value has been used to represent fair value. In accordance with ASC Topic 820, other borrowed funds have been categorized as a Level 2 fair value measurement.
Off-balance-sheet instruments: The fair value of off-balance-sheet instruments (held for investment lending commitments and unused lines of credit) are based on fees currently charged to enter into similar agreements, taking into account the remaining terms of the agreements, the counterparties’ credit standing and discounted cash flow analyses. The fair value of these off-balance-sheet items approximates the recorded amounts of the related fees and is not material at December 31, 2013 and March 31, 2013.
The carrying amount and fair value of the Corporation’s financial instruments consist of the following:
| December 31, 2013 | March 31, 2013 | |||||||||||||||
| Carrying | Fair | Carrying | Fair | |||||||||||||
| Amount | Value | Amount | Value | |||||||||||||
| (In thousands) | ||||||||||||||||
| Financial assets: |
||||||||||||||||
| Cash and cash equivalents |
$ | 143,396 | $ | 143,396 | $ | 228,536 | $ | 228,536 | ||||||||
| Investment securities available for sale |
277,872 | 277,872 | 266,787 | 266,787 | ||||||||||||
| Loans held for sale |
3,085 | 3,085 | 18,058 | 18,356 | ||||||||||||
| Loans held for investment |
1,544,324 | 1,488,677 | 1,670,543 | 1,643,968 | ||||||||||||
| Mortgage servicing rights |
22,294 | 23,553 | 21,824 | 22,088 | ||||||||||||
| Federal Home Loan Bank stock |
11,940 | 11,940 | 25,630 | 25,630 | ||||||||||||
| Accrued interest receivable |
8,216 | 8,216 | 9,563 | 9,563 | ||||||||||||
| Interest rate lock commitments |
37 | 37 | 689 | 689 | ||||||||||||
| Unused commitments |
3 | 3 | — | — | ||||||||||||
| Forward contracts to sell mortgage loans (1) |
33 | 33 | 1 | 1 | ||||||||||||
| Financial liabilities: |
||||||||||||||||
| Non-maturity deposits |
1,324,324 | 1,324,324 | 1,366,049 | 1,366,049 | ||||||||||||
| Deposits with stated maturities |
550,969 | 549,668 | 658,976 | 660,536 | ||||||||||||
| Other borrowed funds |
12,877 | 13,121 | 317,225 | 341,903 | ||||||||||||
| Accrued interest payable—borrowings |
22 | 22 | 53,788 | 53,788 | ||||||||||||
| Accrued interest payable—deposits |
393 | 393 | 607 | 607 | ||||||||||||
| Interest rate lock commitments |
12 | 12 | 3 | 3 | ||||||||||||
| Unused commitments |
4 | 4 | — | — | ||||||||||||
| Forward contracts to sell mortgage loans (1) |
1 | 1 | 313 | 313 | ||||||||||||
| (1) | The Corporation has elected to offset the fair value of individual forward sale contracts and present a net amount on the Consolidated Balance Sheets in accordance with ASC 815-45, Derivatives and Hedging. |
F-61
Table of Contents
Note 18—Income Taxes
The Corporation and its subsidiaries file a consolidated federal income tax return and combined state income tax returns. The provision for income taxes consists of the following:
| Nine Months Ended December 31, | Year Ended March 31, | |||||||||||||||
| 2013 | 2012 | 2013 | 2012 | |||||||||||||
| (Unaudited) | ||||||||||||||||
| (In thousands) | ||||||||||||||||
| Current: |
||||||||||||||||
| Federal |
$ | — | $ | (51 | ) | $ | (51 | ) | $ | — | ||||||
| State |
9 | (130 | ) | (130 | ) | 10 | ||||||||||
|
|
|
|
|
|
|
|
|
|||||||||
| 9 | (181 | ) | (181 | ) | 10 | |||||||||||
| Deferred: |
||||||||||||||||
| Federal |
— | — | — | — | ||||||||||||
| State |
— | — | — | — | ||||||||||||
|
|
|
|
|
|
|
|
|
|||||||||
| — | — | — | — | |||||||||||||
|
|
|
|
|
|
|
|
|
|||||||||
| Total income tax expense (benefit) |
$ | 9 | $ | (181 | ) | $ | (181 | ) | $ | 10 | ||||||
|
|
|
|
|
|
|
|
|
|||||||||
At December 31, 2013, March 31, 2013 and 2012, the affiliated group had a federal net operating loss and tax credit carryover of $185.1 million, $285.9 million and $232.4 million, respectively, and at December 31, 2013, March 31, 2013 and 2012, certain subsidiaries had state net operating loss carryovers of $301.8 million, $403.4 million and $350.4 million, respectively. These carryovers expire in varying amounts in 2014 through 2033.
The provision for income taxes differs from that computed at the federal statutory corporate tax rate as follows:
| Nine Months Ended December 31, | Year Ended March 31, | |||||||||||||||||||||||||||||||
| 2013 | 2012 | 2013 | 2012 | |||||||||||||||||||||||||||||
| % of | % of | % of | % of | |||||||||||||||||||||||||||||
| Pretax | Pretax | Pretax | Pretax | |||||||||||||||||||||||||||||
| Amount | Income | Amount | Income | Amount | Income | Amount | Income | |||||||||||||||||||||||||
| (Unaudited) | ||||||||||||||||||||||||||||||||
| (Dollars in thousands) | ||||||||||||||||||||||||||||||||
| Net income (loss) before income taxes |
$ | 111,632 | 100.0 | % | $ | (20,333 | ) | 100.0 | % | $ | (34,353 | ) | 100.0 | % | $ | (36,728 | ) | 100.0 | % | |||||||||||||
|
|
|
|
|
|
|
|
|
|||||||||||||||||||||||||
| Income tax expense (benefit) at federal statutory rate |
$ | 39,071 | 35.0 | % | $ | (7,117 | ) | 35.0 | % | $ | (12,024 | ) | 35.0 | % | $ | (12,855 | ) | 35.0 | % | |||||||||||||
| State income taxes, net of federal income tax benefits |
(1,008 | ) | (0.9 | ) | (1,116 | ) | 5.5 | (1,840 | ) | 5.3 | (1,874 | ) | 5.1 | |||||||||||||||||||
| Cancellation of indebtedness income exclusion |
(47,080 | ) | (42.2 | ) | — | — | — | — | — | — | ||||||||||||||||||||||
| Increase in valuation allowance |
7,906 | 7.1 | 8,004 | (39.4 | ) | 13,643 | (39.7 | ) | 14,666 | (39.9 | ) | |||||||||||||||||||||
| Other |
1,120 | 1.0 | 48 | (0.2 | ) | 40 | (0.1 | ) | 73 | (0.2 | ) | |||||||||||||||||||||
|
|
|
|
|
|
|
|
|
|
|
|
|
|
|
|
|
|||||||||||||||||
| Income tax expense (benefit) |
$ | 9 | — | % | $ | (181 | ) | 0.9 | % | $ | (181 | ) | 0.5 | % | $ | 10 | — | % | ||||||||||||||
|
|
|
|
|
|
|
|
|
|
|
|
|
|
|
|
|
|||||||||||||||||
The Corporation accounts for income taxes based on the asset and liability method. Deferred tax assets and liabilities are recorded based on the difference between the tax basis of assets and liabilities and their carrying amounts for financial reporting purposes, computed using enacted tax rates. Significant net deferred tax assets have been created for NOL carryforwards and deductible temporary differences, the largest of which relates to our allowance for loan losses. For income tax purposes, only net charge-offs on uncollectible loans are deductible, not the provision for credit losses.
F-62
Table of Contents
Under generally accepted accounting principles, a valuation allowance is required to be recognized if it is “more likely than not” that a deferred tax asset will not be realized. The determination of the realizability of the deferred tax assets is highly subjective and dependent upon management’s evaluation and judgment of both positive and negative evidence, the forecasts of future income, applicable tax planning strategies, and assessments of the current and future economic and business conditions. The Corporation considers both positive and negative evidence regarding the ultimate realizability of deferred tax assets. Positive evidence includes the existence of taxes paid in available carry back years as well as the probability that taxable income will be generated in future periods while negative evidence includes significant cumulative losses in the past several years as well as general business and economic trends.
At December 31, 2013 and March 31, 2013, the Corporation determined that a valuation allowance relating to the deferred tax asset was necessary. This determination was based largely on the negative evidence represented by the losses in the prior fiscal years caused by the significant loss provisions associated with the loan portfolio. In addition, general uncertainty surrounding future economic and business conditions increase the potential volatility and uncertainty of projected earnings. Therefore, a valuation allowance of $119.8 million and $162.1 million at December 31, 2013 and March 31, 2013, respectively, was recorded to offset net deferred tax assets.
The significant components of deferred tax assets (liabilities) are as follows:
| December 31, | March 31, | |||||||
| 2013 | 2013 | |||||||
| (In thousands) | ||||||||
| Deferred tax assets: |
||||||||
| Allowance for loan losses |
$ | 27,193 | $ | 32,275 | ||||
| OREO valuation allowance and other loss reserves |
15,026 | 17,101 | ||||||
| Federal NOL carryforwards |
66,359 | 101,629 | ||||||
| State NOL carryforwards |
15,710 | 20,929 | ||||||
| Unrealized securities losses, net |
2,657 | — | ||||||
| Other |
3,141 | 3,629 | ||||||
|
|
|
|
|
|||||
| Total deferred tax assets |
130,086 | 175,563 | ||||||
| Valuation allowance |
(119,780 | ) | (162,077 | ) | ||||
|
|
|
|
|
|||||
| Adjusted deferred tax assets |
10,306 | 13,486 | ||||||
| Deferred tax liabilities: |
||||||||
| FHLB stock dividends |
(820 | ) | (1,928 | ) | ||||
| Mortgage servicing rights |
(8,944 | ) | (8,754 | ) | ||||
| Unrealized securities gains, net |
— | (1,435 | ) | |||||
| Other |
(542 | ) | (1,369 | ) | ||||
|
|
|
|
|
|||||
| Total deferred tax liabilities |
(10,306 | ) | (13,486 | ) | ||||
|
|
|
|
|
|||||
| Net deferred tax assets |
$ | — | $ | — | ||||
|
|
|
|
|
|||||
The Corporation is subject to U.S. federal income tax as well as income tax of various state jurisdictions. The tax years 2010-2013 remain open to examination by the Internal Revenue Service and certain state jurisdictions while the years 2009-2013 remain open to examination by certain other state jurisdictions.
The Corporation recognizes any interest and penalties related to uncertain tax positions in income tax expense. As of December 31, 2013 and March 31, 2013, the Corporation has not recognized any accrued interest and penalties related to uncertain tax positions.
F-63
Table of Contents
Note 19—Earnings Per Share
Basic earnings per share for the nine months ended December 31, 2013 and 2012 and the fiscal years ended March 31, 2013 and 2012 have been determined by dividing net income (loss) available to common equity for the respective periods by the weighted average number of shares of common stock outstanding. Diluted earnings per share is computed by dividing net loss available to common equity by the weighted average number of common shares outstanding plus the effect of dilutive securities. The effects of dilutive securities are computed using the treasury stock method.
The computation of earnings per share for the nine months ended December 31, 2013 and 2012 and the fiscal years ended March 31, 2013 and 2012 is as follows:
| Nine Months Ended December 31, |
Year Ended March 31, | |||||||||||||||
| 2013 (1) | 2012 | 2013 | 2012 | |||||||||||||
| (Unaudited) | ||||||||||||||||
| (In thousands, except share and per share data) | ||||||||||||||||
| Numerator: |
||||||||||||||||
| Numerator for basic and diluted earnings per share—net income (loss) available to common equity |
$ | 206,918 | $ | (30,619 | ) | $ | (48,144 | ) | $ | (50,429 | ) | |||||
| Denominator: |
||||||||||||||||
| Denominator for basic earnings per share—weighted-average shares |
16,989 | 21,247 | 21,247 | 21,248 | ||||||||||||
| Effect of dilutive securities: |
||||||||||||||||
| Employee stock options |
— | — | — | — | ||||||||||||
|
|
|
|
|
|
|
|
|
|||||||||
| Denominator for diluted earnings per share—adjusted weighted-average shares and assumed conversions |
16,989 | 21,247 | 21,247 | 21,248 | ||||||||||||
|
|
|
|
|
|
|
|
|
|||||||||
| Basic income (loss) per common share |
$ | 12.18 | $ | (1.44 | ) | $ | (2.27 | ) | $ | (2.37 | ) | |||||
|
|
|
|
|
|
|
|
|
|||||||||
| Diluted income (loss) per common share |
$ | 12.18 | $ | (1.44 | ) | $ | (2.27 | ) | $ | (2.37 | ) | |||||
|
|
|
|
|
|
|
|
|
|||||||||
| (1) | On September 27, 2013, all Legacy Common Stock was cancelled and 1,810,000,000 shares of common stock were issued pursuant to the Plan of reorganization. On October 2, 2013, as a result of the Reverse Stock Split, 9,050,000 shares of common stock were outstanding. The calculation of weighted average shares includes 21,247,000 shares of Legacy Common Stock outstanding through September 26, 2013 and 9,050,000 shares of common stock outstanding from September 27 through December 31, 2013. |
F-64
Table of Contents
Note 20—Condensed Parent Only Financial Information
The following represents parent company only financial information:
Condensed Balance Sheets
| December 31, | March 31, | |||||||
| 2013 | 2013 | |||||||
| (In thousands) | ||||||||
| Assets |
||||||||
| Cash and cash equivalents |
$ | 5,238 | $ | 2,976 | ||||
| Investment in subsidiaries |
196,824 | 116,357 | ||||||
| Intercompany receivables from non-bank subsidiaries |
95 | — | ||||||
| Other |
511 | 541 | ||||||
|
|
|
|
|
|||||
| Total assets |
$ | 202,668 | $ | 119,874 | ||||
|
|
|
|
|
|||||
| Liabilities |
||||||||
| Loans payable |
$ | — | $ | 116,300 | ||||
| Accrued interest and fees payable |
— | 60,161 | ||||||
| Other liabilities |
470 | 3,277 | ||||||
|
|
|
|
|
|||||
| Total liabilities |
470 | 179,738 | ||||||
| Stockholders’ Equity (Deficit) |
||||||||
| Total stockholders’ equity (deficit) |
202,198 | (59,864 | ) | |||||
|
|
|
|
|
|||||
| Total liabilities and stockholders’ equity (deficit) |
$ | 202,668 | $ | 119,874 | ||||
|
|
|
|
|
|||||
Condensed Statements of Operations
| Nine Months Ended December 31, | Year Ended March 31, | |||||||||||||||
| 2013 | 2012 | 2013 | 2012 | |||||||||||||
| (Unaudited) | ||||||||||||||||
| (In thousands) | ||||||||||||||||
| Interest income |
$ | 4 | $ | 4 | $ | 5 | $ | 7 | ||||||||
| Interest expense |
7,053 | 14,448 | 19,119 | 17,498 | ||||||||||||
|
|
|
|
|
|
|
|
|
|||||||||
| Net interest expense |
(7,049 | ) | (14,444 | ) | (19,114 | ) | (17,491 | ) | ||||||||
| Equity in net income (loss) from subsidiaries |
18,787 | (5,519 | ) | (14,781 | ) | (19,498 | ) | |||||||||
| Non-interest income |
— | 4 | 4 | 413 | ||||||||||||
| Extinguishment of debt |
134,514 | — | — | — | ||||||||||||
|
|
|
|
|
|
|
|
|
|||||||||
| Income (Loss) from operations |
146,252 | (19,959 | ) | (33,891 | ) | (36,576 | ) | |||||||||
| Reorganization costs |
1,929 | — | — | — | ||||||||||||
| Non-interest expense |
1,031 | 599 | 687 | 1,287 | ||||||||||||
|
|
|
|
|
|
|
|
|
|||||||||
| Income (loss) before income taxes |
143,292 | (20,558 | ) | (34,578 | ) | (37,863 | ) | |||||||||
| Income tax expense (benefit) |
31,669 | (406 | ) | (406 | ) | (1,125 | ) | |||||||||
|
|
|
|
|
|
|
|
|
|||||||||
| Net Income (loss) |
111,623 | (20,152 | ) | (34,172 | ) | (36,738 | ) | |||||||||
| Preferred stock dividends in arrears |
(2,538 | ) | (4,898 | ) | (6,560 | ) | (6,278 | ) | ||||||||
| Preferred stock discount accretion |
(6,167 | ) | (5,569 | ) | (7,412 | ) | (7,413 | ) | ||||||||
| Retirement of preferred shares |
104,000 | — | — | — | ||||||||||||
|
|
|
|
|
|
|
|
|
|||||||||
| Net income (loss) available to common equity |
$ | 206,918 | $ | (30,619 | ) | $ | (48,144 | ) | $ | (50,429 | ) | |||||
|
|
|
|
|
|
|
|
|
|||||||||
F-65
Table of Contents
Condensed Statements of Cash Flows
| Nine Months Ended December 31, | Year Ended March 31, | |||||||||||||||
| 2013 | 2012 | 2013 | 2012 | |||||||||||||
| (Unaudited) | ||||||||||||||||
| (In thousands) | ||||||||||||||||
| Operating Activities |
||||||||||||||||
| Net income (loss) |
$ | 111,623 | $ | (20,152 | ) | $ | (34,172 | ) | $ | (36,738 | ) | |||||
| Adjustments to reconcile net loss to net cash provided (used) by operating activities: |
||||||||||||||||
| Equity in income (income) loss of subsidiaries |
(18,787 | ) | 5,519 | 14,781 | 19,498 | |||||||||||
| Extinguishment of debt |
(134,514 | ) | — | — | — | |||||||||||
| Increase in accrued interest and fees payable |
7,053 | 14,448 | 19,119 | 17,498 | ||||||||||||
| Costs associated with stock plan |
2,922 | — | — | — | ||||||||||||
| Increase (decrease) in other |
(2,872 | ) | 371 | (3,561 | ) | (293 | ) | |||||||||
|
|
|
|
|
|
|
|
|
|||||||||
| Net cash used in operating activities |
(34,575 | ) | 186 | (3,833 | ) | (35 | ) | |||||||||
| Investing Activities |
||||||||||||||||
| Net (increase) decrease in intercompany loans |
— | — | 4,225 | — | ||||||||||||
| Dividend received from subsidiaries |
5,402 | — | — | — | ||||||||||||
| Capital contribution to subsidiaries |
(80,205 | ) | — | — | — | |||||||||||
|
|
|
|
|
|
|
|
|
|||||||||
| Net cash provided by (used in) investing activities |
(74,803 | ) | — | 4,225 | — | |||||||||||
| Financing Activities |
||||||||||||||||
| Repayment of borrowed funds |
(49,000 | ) | — | — | — | |||||||||||
| Recapitalization transaction fees |
(14,360 | ) | — | — | — | |||||||||||
| Issuance of common stock |
175,000 | — | — | — | ||||||||||||
|
|
|
|
|
|
|
|
|
|||||||||
| Net cash provided by (used in) financing activities |
111,640 | — | — | — | ||||||||||||
| Increase (decrease) in cash and cash equivalents |
2,262 | 186 | 392 | (35 | ) | |||||||||||
| Cash and cash equivalents at beginning of year |
2,976 | 2,584 | 2,584 | 2,619 | ||||||||||||
|
|
|
|
|
|
|
|
|
|||||||||
| Cash and cash equivalents at end of year |
$ | 5,238 | $ | 2,770 | $ | 2,976 | $ | 2,584 | ||||||||
|
|
|
|
|
|
|
|
|
|||||||||
Note 21—Subsequent Events
Filing of Registration Statement on Form S-1
On December 20, 2013, we filed a registration statement on Form S-1 in connection with a potential initial public offering of our common stock. Certain of our current stockholders may participate as selling stockholders in the offering but they are not legally obligated to do so. The offering is subject to market conditions and there can be no assurance as to whether or when the offering may be completed, or as to the actual size or terms of the offering.
F-66
Table of Contents
Purchase Agreement to Sell Bank Headquarters
The Bank executed a Letter of Intent (LOI) on January 3, 2014, with an unrelated third party to sell the Bank’s main office building located at 25 West Main Street, Madison, Wisconsin, the adjacent surface parking lot immediately behind the main office building at 115 South Carroll Street, and the 261-stall parking ramp located at 126 South Carroll Street. Subsequently, a Purchase Agreement was executed on February 6, 2014 and the sale is expected to close in July 2014. The Bank will lease a portion of the space after the sale.
Note 22—Quarterly Financial Data (unaudited)
Unaudited condensed financial data by quarter for the nine months ended December 31, 2013 and the fiscal year ended March 31, 2013 is as follows:
| Quarter Ended | ||||||||||||||||||||||||||||
| 12/31/2013 | 9/30/2013 | 6/30/2013 | 3/31/2013 | 12/31/2012 | 9/30/2012 | 6/30/2012 | ||||||||||||||||||||||
| (Dollars in thousands—except per share amounts) | ||||||||||||||||||||||||||||
| Operations Data: |
||||||||||||||||||||||||||||
| Net interest income |
$ | 18,877 | $ | 15,812 | $ | 13,417 | $ | 14,820 | $ | 15,205 | $ | 16,059 | $ | 16,399 | ||||||||||||||
| Provision for credit losses |
— | — | 275 | 675 | 4,832 | 5,029 | (2,803 | ) | ||||||||||||||||||||
| Non-interest income |
8,002 | 142,679 | 8,852 | 7,503 | 11,844 | 13,056 | 13,498 | |||||||||||||||||||||
| Non-interest expense |
23,125 | 45,232 | 27,375 | 35,668 | 33,849 | 32,842 | 32,645 | |||||||||||||||||||||
| Income (loss) before income tax expense (benefit) |
3,754 | 113,259 | (5,381 | ) | (14,020 | ) | (11,632 | ) | (8,756 | ) | 55 | |||||||||||||||||
| Income tax expense (benefit) |
— | 9 | — | — | 10 | (191 | ) | — | ||||||||||||||||||||
| Net income (loss) |
3,754 | 113,250 | (5,381 | ) | (14,020 | ) | (11,642 | ) | (8,565 | ) | 55 | |||||||||||||||||
| Preferred stock dividends in arrears (1) |
— | 103,163 | (1,701 | ) | (1,662 | ) | (1,654 | ) | (1,634 | ) | (1,610 | ) | ||||||||||||||||
| Preferred stock discount accretion |
— | (4,304 | ) | (1,863 | ) | (1,843 | ) | (1,853 | ) | (1,853 | ) | (1,863 | ) | |||||||||||||||
| Net income (loss) available to common equity |
3,754 | 212,109 | (8,945 | ) | (17,525 | ) | (15,149 | ) | (12,052 | ) | (3,418 | ) | ||||||||||||||||
| Per Share: |
||||||||||||||||||||||||||||
| Basic earnings (loss) per common share |
$ | 0.41 | $ | 10.24 | $ | (0.42 | ) | $ | (0.82 | ) | $ | (0.71 | ) | $ | (0.57 | ) | $ | (0.16 | ) | |||||||||
| Diluted earnings (loss) per common share |
0.41 | 10.24 | (0.42 | ) | (0.82 | ) | (0.71 | ) | (0.57 | ) | (0.16 | ) | ||||||||||||||||
| Dividends per common share |
— | — | — | — | — | — | — | |||||||||||||||||||||
| (1) | The quarter ended 9/30/2013 includes $104.0 million for retirement of preferred shares. |
F-67
Table of Contents
ANCHOR BANCORP WISCONSIN INC. AND SUBSIDIARIES
Consolidated Balance Sheets
| June 30, 2014 |
December 31, 2013 |
|||||||||||||||
| (Unaudited) | ||||||||||||||||
| (In thousands, except share data) | ||||||||||||||||
| Assets |
||||||||||||||||
| Cash and due from banks |
|
$ | 38,982 | $ | 44,139 | |||||||||||
| Interest-earning deposits |
|
138,365 | 99,257 | |||||||||||||
|
|
|
|
|
|||||||||||||
| Cash and cash equivalents |
|
177,347 | 143,396 | |||||||||||||
| Investment securities available for sale (AFS) |
|
295,290 | 277,872 | |||||||||||||
| Loans held for sale |
|
5,261 | 3,085 | |||||||||||||
| Loans held for investment |
|
1,556,138 | 1,609,506 | |||||||||||||
| Less: Allowance for loan losses |
|
(49,175 | ) | (65,182 | ) | |||||||||||
|
|
|
|
|
|||||||||||||
| Loans held for investment, net |
|
1,506,963 | 1,544,324 | |||||||||||||
| Other real estate owned (OREO), net |
|
56,170 | 63,460 | |||||||||||||
| Premises and equipment, net |
|
25,459 | 24,800 | |||||||||||||
| Federal Home Loan Bank stock—at cost |
|
11,940 | 11,940 | |||||||||||||
| Mortgage servicing rights, net |
|
20,929 | 22,294 | |||||||||||||
| Accrued interest receivable |
|
7,640 | 8,216 | |||||||||||||
| Other assets |
|
14,250 | 13,087 | |||||||||||||
|
|
|
|
|
|||||||||||||
| Total assets |
|
$ | 2,121,249 | $ | 2,112,474 | |||||||||||
|
|
|
|
|
|||||||||||||
| Liabilities and Stockholders’ Equity |
|
|||||||||||||||
| Deposits |
|
|||||||||||||||
| Non-interest bearing |
|
$ | 276,829 | $ | 259,926 | |||||||||||
| Interest bearing |
|
1,596,411 | 1,615,367 | |||||||||||||
|
|
|
|
|
|||||||||||||
| Total deposits |
|
1,873,240 | 1,875,293 | |||||||||||||
| Other borrowed funds |
|
13,781 | 12,877 | |||||||||||||
| Accrued interest payable |
|
393 | 415 | |||||||||||||
| Accrued taxes, insurance and employee related expenses |
|
5,586 | 7,302 | |||||||||||||
| Other liabilities |
|
16,742 | 14,389 | |||||||||||||
|
|
|
|
|
|||||||||||||
| Total liabilities |
|
1,909,742 | 1,910,276 | |||||||||||||
|
|
|
|
|
|||||||||||||
| Commitments and contingent liabilities (Note 12) |
|
|||||||||||||||
| June 30, 2014 | December 31, 2013 | |||||||||||||||
| Preferred stock: |
||||||||||||||||
| Par value |
$ | 0.01 | $ | 0.01 | ||||||||||||
| Authorized |
100,000 | 100,000 | ||||||||||||||
| Issued |
$ | — | $ | — | ||||||||||||
| Common stock: |
||||||||||||||||
| Par value |
$ | 0.01 | $ | 0.01 | ||||||||||||
| Authorized |
11,900,000 | 11,900,000 | ||||||||||||||
| Issued |
9,050,000 | 9,050,000 | 91 | 91 | ||||||||||||
| Additional paid-in capital |
|
188,370 | 188,370 | |||||||||||||
| Retained earnings |
|
24,896 | 20,359 | |||||||||||||
| Accumulated other comprehensive loss related to AFS securities |
|
(1,738 | ) | (6,378 | ) | |||||||||||
| Accumulated other comprehensive loss related to other than temporary impairment (OTTI) securities—non-credit factors |
|
(112 | ) | (244 | ) | |||||||||||
|
|
|
|
|
|||||||||||||
| Total accumulated other comprehensive loss |
|
(1,850 | ) | (6,622 | ) | |||||||||||
|
|
|
|
|
|||||||||||||
| Total stockholders’ equity |
|
211,507 | 202,198 | |||||||||||||
|
|
|
|
|
|||||||||||||
| Total liabilities and stockholders’ equity |
|
$ | 2,121,249 | $ | 2,112,474 | |||||||||||
|
|
|
|
|
|||||||||||||
See accompanying Notes to Unaudited Consolidated Financial Statements
F-68
Table of Contents
ANCHOR BANCORP WISCONSIN INC. AND SUBSIDIARIES
Consolidated Statements of Operations and Comprehensive Income (Loss)
(Unaudited)
| Three Months Ended June 30, | Six Months Ended June 30, | |||||||||||||||
| 2014 | 2013 | 2014 | 2013 | |||||||||||||
| (In thousands, except per share data) | ||||||||||||||||
| Interest income |
||||||||||||||||
| Loans |
$ | 17,321 | $ | 19,766 | $ | 35,197 | $ | 40,954 | ||||||||
| Investment securities and Federal Home Loan Bank stock |
1,541 | 1,279 | 3,062 | 2,713 | ||||||||||||
| Interest-earning deposits |
94 | 131 | 159 | 225 | ||||||||||||
|
|
|
|
|
|
|
|
|
|||||||||
| Total interest income |
18,956 | 21,176 | 38,418 | 43,892 | ||||||||||||
| Interest expense |
||||||||||||||||
| Deposits |
1,033 | 1,504 | 2,121 | 3,214 | ||||||||||||
| Other borrowed funds |
61 | 6,255 | 120 | 12,441 | ||||||||||||
|
|
|
|
|
|
|
|
|
|||||||||
| Total interest expense |
1,094 | 7,759 | 2,241 | 15,655 | ||||||||||||
|
|
|
|
|
|
|
|
|
|||||||||
| Net interest income |
17,862 | 13,417 | 36,177 | 28,237 | ||||||||||||
| Provision for loan losses |
— | 275 | — | 950 | ||||||||||||
|
|
|
|
|
|
|
|
|
|||||||||
| Net interest income after provision for loan losses |
17,862 | 13,142 | 36,177 | 27,287 | ||||||||||||
| Non-interest income |
||||||||||||||||
| Net impairment losses recognized in earnings |
(13 | ) | — | (34 | ) | (83 | ) | |||||||||
| Loan servicing income, net of amortization |
740 | 55 | 1,514 | 110 | ||||||||||||
| Service charges on deposits |
2,523 | 2,580 | 4,789 | 4,949 | ||||||||||||
| Investment and insurance commissions |
1,131 | 1,063 | 1,987 | 2,015 | ||||||||||||
| Net gain on sale of loans |
698 | 2,793 | 1,290 | 5,823 | ||||||||||||
| Net gain (loss) on sale of investment securities |
— | — | 301 | (200 | ) | |||||||||||
| Net gain on sale of OREO |
1,040 | 925 | 1,201 | 2,262 | ||||||||||||
| Other income |
1,491 | 1,436 | 2,494 | 1,479 | ||||||||||||
|
|
|
|
|
|
|
|
|
|||||||||
| Total non-interest income |
7,610 | 8,852 | 13,542 | 16,355 | ||||||||||||
| Non-interest expense |
||||||||||||||||
| Compensation and benefits |
$ | 10,739 | $ | 11,130 | $ | 21,901 | $ | 21,272 | ||||||||
| Occupancy |
1,614 | 1,986 | 3,852 | 4,297 | ||||||||||||
| Furniture and equipment |
791 | 850 | 1,557 | 1,612 | ||||||||||||
| Federal deposit insurance premiums |
700 | 1,332 | 1,748 | 2,686 | ||||||||||||
| Data processing |
1,315 | 1,420 | 2,686 | 3,282 | ||||||||||||
| Communications |
463 | 536 | 1,036 | 948 | ||||||||||||
| Marketing |
879 | 396 | 1,532 | 902 | ||||||||||||
| OREO expense, net |
2,267 | 4,289 | 3,452 | 16,548 | ||||||||||||
| Investor loss reimbursement |
(248 | ) | 371 | (86 | ) | 3,181 | ||||||||||
| Mortgage servicing rights impairment (recovery) |
84 | (1,258 | ) | 95 | (3,448 | ) | ||||||||||
| Provision for unfunded commitments |
600 | 1,734 | 780 | 2,159 | ||||||||||||
| Loan processing and servicing expense |
709 | 891 | 1,276 | 2,194 | ||||||||||||
| Legal services |
602 | 1,271 | 955 | 2,371 | ||||||||||||
| Other professional fees |
351 | 495 | 758 | 1,154 | ||||||||||||
| Insurance |
206 | 376 | 516 | 794 | ||||||||||||
| Other expense |
1,783 | 1,556 | 3,114 | 3,091 | ||||||||||||
|
|
|
|
|
|
|
|
|
|||||||||
| Total non-interest expense |
22,855 | 27,375 | 45,172 | 63,043 | ||||||||||||
|
|
|
|
|
|
|
|
|
|||||||||
| Income (loss) before income taxes |
2,617 | (5,381 | ) | 4,547 | (19,401 | ) | ||||||||||
| Income tax expense (benefit) |
10 | — | 10 | — | ||||||||||||
|
|
|
|
|
|
|
|
|
|||||||||
| Net income (loss) |
2,607 | (5,381 | ) | 4,537 | (19,401 | ) | ||||||||||
| Preferred stock dividends in arrears |
— | (1,701 | ) | — | (3,363 | ) | ||||||||||
| Preferred stock discount accretion |
— | (1,863 | ) | — | (3,706 | ) | ||||||||||
|
|
|
|
|
|
|
|
|
|||||||||
| Net income (loss) available to common equity |
$ | 2,607 | $ | (8,945 | ) | $ | 4,537 | $ | (26,470 | ) | ||||||
|
|
|
|
|
|
|
|
|
|||||||||
(Continued)
F-69
Table of Contents
ANCHOR BANCORP WISCONSIN INC. AND SUBSIDIARIES
Consolidated Statements of Operations and Comprehensive Income (Loss)
(Unaudited)
| Three Months Ended June 30, | Six Months Ended June 30, | |||||||||||||||
| 2014 | 2013 | 2014 | 2013 | |||||||||||||
| (In thousands, except per share data) | ||||||||||||||||
| Net income (loss) |
$ | 2,607 | $ | (5,381 | ) | $ | 4,537 | $ | (19,401 | ) | ||||||
| Reclassification adjustment for realized net (gains) losses recognized in Statements of Operations—Net gain (loss) on sale and call of investment securities |
— | — | (301 | ) | 200 | |||||||||||
| Reclassification adjustments recognized in Statements of Operations—Net impairment losses recognized in earnings: |
||||||||||||||||
| Net change in unrealized credit related other-than-temporary impairment |
(36 | ) | (68 | ) | (78 | ) | (158 | ) | ||||||||
| Realized credit losses |
49 | 68 | 112 | 241 | ||||||||||||
| Change in net unrealized gains (losses) on available-for-sale securities |
2,179 | (6,144 | ) | 5,039 | (5,649 | ) | ||||||||||
|
|
|
|
|
|
|
|
|
|||||||||
| Total other comprehensive income (loss) |
2,192 | (6,144 | ) | 4,772 | (5,366 | ) | ||||||||||
|
|
|
|
|
|
|
|
|
|||||||||
| Comprehensive income (loss) |
$ | 4,799 | $ | (11,525 | ) | $ | 9,309 | $ | (24,767 | ) | ||||||
|
|
|
|
|
|
|
|
|
|||||||||
| Income (loss) per common share: |
||||||||||||||||
| Basic |
$ | 0.29 | $ | (0.42 | ) | $ | 0.50 | (1.25 | ) | |||||||
| Diluted |
0.29 | (0.42 | ) | 0.50 | (1.25 | ) | ||||||||||
| Dividends declared per common share |
— | — | — | — | ||||||||||||
See accompanying Notes to Unaudited Consolidated Financial Statements
F-70
Table of Contents
ANCHOR BANCORP WISCONSIN INC. AND SUBSIDIARIES
Consolidated Statements of Changes in Stockholders’ Equity (Deficit)
| Preferred Stock |
Common Stock |
Additional Paid-in Capital |
Retained Earnings (Deficit) |
Treasury Stock |
Deferred Compensation Obligation |
Accu- mulated Other Compre- hensive Income (Loss) |
Total | |||||||||||||||||||||||||
| (In thousands) | ||||||||||||||||||||||||||||||||
| Balance at March 31, 2013 (Audited) |
$ | 103,833 | $ | 2,536 | $ | 110,034 | $ | (189,097 | ) | $ | (89,848 | ) | $ | (901 | ) | $ | 3,579 | $ | (59,864 | ) | ||||||||||||
| Net income |
— | — | — | 111,623 | — | — | — | 111,623 | ||||||||||||||||||||||||
| Other comprehensive income, net of tax |
— | — | — | — | — | — | (10,201 | ) | (10,201 | ) | ||||||||||||||||||||||
| Recapitalization transaction fees |
— | — | (14,360 | ) | — | — | — | — | (14,360 | ) | ||||||||||||||||||||||
| Cancellation of common stock |
— | (2,536 | ) | (88,213 | ) | — | 89,848 | 901 | — | — | ||||||||||||||||||||||
| Issuance of common stock |
— | 88 | 174,912 | — | — | — | — | 175,000 | ||||||||||||||||||||||||
| Preferred stock exchanged for common stock |
(110,000 | ) | 3 | 5,997 | 104,000 | — | — | — | — | |||||||||||||||||||||||
| Accretion of preferred stock discount |
6,167 | — | — | (6,167 | ) | — | — | — | — | |||||||||||||||||||||||
|
|
|
|
|
|
|
|
|
|
|
|
|
|
|
|
|
|||||||||||||||||
| Balance at December 31, 2013 (Audited) |
$ | — | $ | 91 | $ | 188,370 | $ | 20,359 | $ | — | $ | — | $ | (6,622 | ) | $ | 202,198 | |||||||||||||||
|
|
|
|
|
|
|
|
|
|
|
|
|
|
|
|
|
|||||||||||||||||
| Net income |
— | — | — | 4,537 | — | — | — | 4,537 | ||||||||||||||||||||||||
| Other comprehensive income, net of tax |
— | — | — | — | — | — | 4,772 | 4,772 | ||||||||||||||||||||||||
|
|
|
|
|
|
|
|
|
|
|
|
|
|
|
|
|
|||||||||||||||||
| Balance at June 30, 2014 (Unaudited) |
$ | — | $ | 91 | $ | 188,370 | $ | 24,896 | $ | — | $ | — | $ | (1,850 | ) | $ | 211,507 | |||||||||||||||
|
|
|
|
|
|
|
|
|
|
|
|
|
|
|
|
|
|||||||||||||||||
See accompanying Notes to Unaudited Consolidated Financial Statements
F-71
Table of Contents
ANCHOR BANCORP WISCONSIN INC. AND SUBSIDIARIES
Consolidated Statements of Cash Flows
(Unaudited)
| Six Months Ended June 30, | ||||||||
| 2014 | 2013 | |||||||
| (In thousands) | ||||||||
| Operating Activities |
||||||||
| Net income (loss) |
$ | 4,537 | $ | (19,401 | ) | |||
| Adjustments to reconcile net income (loss) to net cash provided by operating activities: |
||||||||
| Amortization and accretion of investment securities premium, net |
676 | 689 | ||||||
| Net (gain) loss on sale of investment securities |
(301 | ) | 200 | |||||
| Net impairment losses on investment securities |
34 | 83 | ||||||
| Origination of loans held for sale |
(57,931 | ) | (295,227 | ) | ||||
| Proceeds from sale of loans held for sale |
57,045 | 312,828 | ||||||
| Net gain on sale of loans |
(1,290 | ) | (5,823 | ) | ||||
| Provision for loan losses |
— | 950 | ||||||
| Valuation adjustments for OREO |
2,279 | 11,603 | ||||||
| Provision for unfunded loan commitments |
780 | 2,159 | ||||||
| Gain on sale of OREO |
(1,201 | ) | (2,262 | ) | ||||
| Depreciation and amortization |
1,212 | 1,248 | ||||||
| Loss on disposal of premises and equipment, net |
76 | 79 | ||||||
| Mortgage servicing rights impairment (recovery) |
95 | (3,448 | ) | |||||
| Decrease in accrued interest receivable |
576 | 1,261 | ||||||
| Decrease in other assets |
107 | 2,757 | ||||||
| Increase (decrease) in accrued interest payable |
(22 | ) | 9,127 | |||||
| Decrease in accrued taxes, insurance and employee related expenses |
(1,716 | ) | (549 | ) | ||||
| Increase (decrease) in other liabilities |
1,573 | (2,236 | ) | |||||
|
|
|
|
|
|||||
| Net cash provided by operating activities |
6,529 | 14,038 | ||||||
| Investing Activities |
||||||||
| Proceeds from sale of investment securities |
388 | 6,420 | ||||||
| Purchase of investment securities |
(37,787 | ) | (68,009 | ) | ||||
| Principal collected on investment securities |
24,344 | 27,773 | ||||||
| Decrease in loans held for investment |
29,702 | 93,471 | ||||||
| Purchases of premises and equipment |
(1,947 | ) | (786 | ) | ||||
| Proceeds from sale of OREO |
13,899 | 29,193 | ||||||
| Capitalized improvements of OREO |
(28 | ) | (352 | ) | ||||
|
|
|
|
|
|||||
| Net cash provided by investing activities |
28,571 | 87,710 | ||||||
| Financing Activities |
||||||||
| Decrease in deposits |
$ | (41,239 | ) | $ | (92,817 | ) | ||
| Increase in advance payments by borrowers for taxes and insurance |
39,186 | 39,681 | ||||||
| Proceeds from borrowed funds |
53,561 | 60,793 | ||||||
| Repayment of borrowed funds |
(52,657 | ) | (59,146 | ) | ||||
|
|
|
|
|
|||||
| Net cash used in financing activities |
(1,149 | ) | (51,489 | ) | ||||
|
|
|
|
|
|||||
| Net increase in cash and cash equivalents |
33,951 | 50,259 | ||||||
| Cash and cash equivalents at beginning of period |
143,396 | 191,280 | ||||||
|
|
|
|
|
|||||
| Cash and cash equivalents at end of period |
$ | 177,347 | $ | 241,539 | ||||
|
|
|
|
|
|||||
(Continued)
F-72
Table of Contents
ANCHOR BANCORP WISCONSIN INC. AND SUBSIDIARIES
Consolidated Statements of Cash Flows
(Unaudited)
| Six Months Ended June 30, | ||||||||
| 2014 | 2013 | |||||||
| (In thousands) | ||||||||
| Supplemental disclosures of cash flow information: |
||||||||
| Cash paid (received) or credited to accounts: |
||||||||
| Interest on deposits and borrowings |
$ | 2,263 | $ | 7,277 | ||||
| Income tax payments (receipts) |
22 | (1,728 | ) | |||||
| Non-cash transactions: |
||||||||
| Transfer of loans to OREO |
7,659 | 16,423 | ||||||
See accompanying Notes to Unaudited Consolidated Financial Statements
F-73
Table of Contents
NOTES TO UNAUDITED CONSOLIDATED FINANCIAL STATEMENTS
Note 1—Basis of Presentation
The unaudited consolidated financial statements include the accounts and results of operations of Anchor BanCorp Wisconsin Inc. (the “Corporation” or the “Company”) and its wholly-owned subsidiaries, AnchorBank, fsb (the “Bank”) and Investment Directions, Inc. (“IDI”). The Bank has one subsidiary at June 30, 2014: ADPC Corporation. Significant inter-company balances and transactions have been eliminated.
The accompanying unaudited interim consolidated financial statements have been prepared in accordance with U.S. generally accepted accounting principles (“GAAP”) and with the instructions to Form 10-Q and Rule 10-01 of Regulation S-X. Accordingly, they do not include all of the information and footnotes required by GAAP for complete financial statements. In the opinion of management, all adjustments (including normal recurring accruals) necessary for a fair presentation of the unaudited interim consolidated financial statements have been included.
In preparing the unaudited consolidated financial statements in conformity with GAAP, management is required to make estimates and assumptions that affect the amounts reported in the consolidated financial statements and accompanying notes. Actual results could differ from those estimates. Material estimates that are particularly susceptible to significant change in the near term relate to the determination of the allowance for loan losses, the valuation of foreclosed real estate, the net carrying value of mortgage servicing rights and deferred tax assets, and the fair value of investment securities, interest rate lock commitments, forward contracts to sell mortgage loans, and loans held for sale. The results of operations and other data for the three- and six-month periods ended June 30, 2014 are not necessarily indicative of results that may be expected for the year ending December 31, 2014. We have evaluated all subsequent events through the date of this filing. The interim unaudited consolidated financial statements presented herein should be read in conjunction with the audited consolidated financial statements and related notes thereto included in the Corporation’s Annual Report on Form 10-K/T for the transition period ended December 31, 2013.
Change in Fiscal Year End. On December 18, 2013, the Board approved the change of our fiscal year end from March 31 to December 31, beginning with December 31, 2013. References to any previous fiscal years mean the fiscal years ended on March 31. As a result of the change in fiscal year end, the consolidated financial statements include the Company’s financial results for the six month period from January 1, 2013 to June 30, 2013 of which January 1, 2013 to March 31, 2013 results were previously included in the fiscal year ended March 31, 2013 results.
Reclassifications. Certain prior period amounts are reclassified to conform to the current period presentations with no impact on net income (loss) or total stockholders’ equity when applicable.
Note 2—Significant Transactions, Significant Risks and Uncertainties
Filing of Registration Statement on Form S-1
On May 12, 2014, the Company filed the fourth amendment to the registration statement on Form S-1 originally filed on December 20, 2013 in connection with a potential initial public offering of our common stock. Certain of our current stockholders may participate as selling stockholders in the offering but they are not legally obligated to do so. The offering is subject to market conditions and there can be no assurance as to whether or when the offering may be completed or as to the actual size or terms of the offering.
Bankruptcy Proceedings and Emergence from Chapter 11
Background
Headquartered in Madison, Wisconsin, the Company is a savings and loan holding company that operates primarily through AnchorBank, its wholly owned banking subsidiary. The Bank is a $2.12 billion bank and Wisconsin’s largest thrift and offers personal and business banking services to more than 110,000 households and businesses.
F-74
Table of Contents
As a result of the economic downturn, beginning in 2009, the Company experienced significant operating losses, significant levels of criticized assets and low levels of capital, all of which raised substantial doubt about the Company’s ability to continue as a going concern. As a result, in 2009 both the Company and the Bank became subject to Orders to Cease and Desist issued by the Office of Thrift Supervision. Further, the Company owed $116.3 million to various lenders led by U.S. Bank under a short-term line of credit (the “Credit Agreement”) which it was unable to repay. Additionally, the Company received $110 million in 2009 from the issuance of senior preferred shares under the Troubled Asset Relief Program (“TARP”). These funds were distributed down to the Bank. Despite the TARP funds, the Company’s financial condition did not improve. The Company continued to negotiate with U.S. Bank and was successful in negotiating amendments to the Credit Agreement to avoid a default thereunder. Also during that time, the Company diligently sought qualified sources of outside capital.
In 2013, the Company entered into a Plan of Reorganization. Under the Plan of Reorganization, a Chapter 11 Proceeding was filed in federal Bankruptcy Court to effect a reorganization of the Company. Pursuant to the Plan of Reorganization, the Company: (i) issued new common stock to a limited number of investors in consideration of $175 million of new equity capital; (ii) made a discounted cash payment of $49.0 million in full satisfaction of the amounts owed under the Credit Agreement (which included the principal amount of $116.3 million plus accrued interest and fees of approximately $67.2 million); (iii) exchanged the senior preferred shares issued pursuant to TARP for 60 million shares of common stock; and (iv) eliminated the previously existing shares of Company common stock that were outstanding (which we refer to in this report as “Legacy Common Stock”). The Plan of Reorganization is described in greater detail below.
Bankruptcy Proceedings
On August 12, 2013, the Company filed a voluntary petition for relief (the “Chapter 11 Case”) under the provisions of chapter 11 of title 11 of the United States Code, 11 U.S.C. §§ 101, et seq. (the “Bankruptcy Code”), Case No. 13-14003-rdm, in the United States Bankruptcy Court for the Western District of Wisconsin (the “Bankruptcy Court”) to implement the Plan of Reorganization in order to facilitate the restructuring of the Company and the recapitalization of the Bank. Prior to the petition date, U.S. Bank National Association and Bank of America, N.A., as senior secured creditors of the Company (the “Lenders”), and the Treasury, as sole preferred stockholder of the Company, voted to accept the Plan of Reorganization.
On August 30, 2013, the Bankruptcy Court entered the Confirmation Order, by which it confirmed the Plan of Reorganization. On September 27, 2013 (the “Effective Date”), the Plan of Reorganization became effective in accordance with its terms. During the period of bankruptcy, we incurred and expensed $1.9 million of reorganization costs, primarily comprised of professional fees.
Emergence Accounting
Upon emergence, we determined we did not meet the requirements to apply fresh start reporting under applicable accounting standards because we did not meet the solvency criteria of Accounting Standards Codification (ASC) 852-10-45-19. The reorganization value immediately before the date of confirmation was greater than the total of all post-petition liabilities and allowed claims and, therefore, indicative of not meeting the test to require fresh start accounting under ASC 852. As of the date of confirmation, we estimated our enterprise value (or reorganization value) to be approximately $2.2 billion. The Company utilized the equity value using the income and market approach to approximate fair value. Accordingly, our consolidated financial statements do not include fresh start reporting, whereby the Company would have to revalue all of its assets and liabilities. At the time of filing for the Chapter 11 Case, we identified liabilities subject to compromise of $188.3 million, which included the outstanding Credit Agreement of approximately $116.3 million, interest and fees due under the Credit Agreement of $67.2 million and $4.8 million in other liabilities.
Plan of Reorganization. Below is a summary of the significant transactions affecting the Company as a result of the effectiveness of the Plan of Reorganization.
F-75
Table of Contents
Delaware Conversion
Pursuant to the Plan of Reorganization, on September 25, 2013, we (i) converted from a Wisconsin corporation to a Delaware corporation in accordance with Section 265 of the Delaware General Corporation Law and (ii) filed a Certificate of Incorporation with the Secretary of State of the State of Delaware (the “Amended Charter”), to, among other things, declassify our Board, increase the number of authorized shares of our common stock and adopt certain restrictions on acquisitions and dispositions of our securities. The Amended Charter provides for (a) 2,000,000,000 shares of authorized common stock, par value $0.01 per share (the “Common Stock”), and (b) 1,000,000 shares of authorized preferred stock, par value $0.01 per share. A reverse stock split was effected and a subsequent amendment to the corporate charter was filed on October 2, 2013 providing for 11,900,000 shares of authorized common stock, par value $0.01 per share and 100,000 shares of authorized preferred stock, par value $0.01. There are 9,050,000 shares of Common Stock outstanding as of June 30, 2014.
Private Placements
In connection with the Plan of Reorganization, we entered into stock purchase agreements with certain institutional and other private investors and directors and officers of the Company (the “Investors”) for the purchase and sale of 1,750,000,000 (adjusted on October 2, 2013 as a result of a reverse stock split to 8,750,000 shares) shares of our Common Stock at a purchase price of $0.10 per share.
Pursuant to the stock purchase agreements, we issued and sold the Common Stock to (i) certain Investors such that, after giving effect to the transactions contemplated in the Plan of Reorganization, each such Investor owns up to 9.9% of the Common Stock pursuant to the Private Placements and the Treasury Issuance (as defined below), for an aggregate purchase price of $87.8 million, (ii) certain other Investors such that, after giving effect to the transactions contemplated in the Plan of Reorganization, each such Investor owns up to 4.9% of the Authorized Common Stock pursuant to the Private Placements and the Treasury Issuance, for an aggregate purchase price of $83.7 million, and (iii) certain directors and officers of the Company for an aggregate purchase price of $3.5 million. We received gross proceeds of $175.0 million as a result of the Private Placements and incurred $14.4 million of capital raise costs all of which have been recorded in the Consolidated Statement of Changes in Stockholders’ Equity (Deficit).
TARP Exchange
On January 30, 2009, pursuant to the Treasury’s Capital Purchase Program, we issued and sold to the Treasury 110,000 shares of Fixed Rate Cumulative Perpetual Preferred Stock, Series B of the Company with an aggregate liquidation preference of $110.0 million (the “TARP Preferred Stock”). In addition, we issued to the Treasury a warrant (the “TARP Warrant”) to purchase up to 7,399,103 shares of our common stock, par value $0.10 per share (the “Legacy Common Stock”), at an initial per share exercise price of $2.23. Pursuant to the Plan of Reorganization, we, on the Effective Date and immediately following the consummation of the Private Placements, (i) exchanged the TARP Preferred Stock for 60.0 million shares (adjusted to 300,000 shares as a result of the reverse stock split) of Common Stock (the “Treasury Issuance”) and (ii) cancelled the TARP Warrant in its entirety (collectively, the “TARP Exchange”). The difference between the Common Stock issued and the Preferred Stock redeemed of $104.0 million was recorded as an increase directly to retained earnings. The $104.0 million represents a return from the Preferred stockholder thereby increasing the amount available to common stockholders for purposes of earnings per share.
Following the effectiveness of the Plan of Reorganization, the Treasury sold to certain institutional investors (the “Secondary Investors”) all of the shares of Common Stock delivered to the Treasury in connection with the Treasury Issuance at a purchase price equal to $0.10 per share (the “Secondary Treasury Sales”) under the securities purchase agreements, dated as of September 19, 2013, among the Treasury, the Secondary Investor and (with respect to certain provisions) the Company. In connection with the Secondary Treasury Sales, we entered into secondary sale purchaser agreements with the Secondary Investors pursuant to which we made certain
F-76
Table of Contents
representations and warranties to the Investor and provided rights to the Secondary Investors similar to the rights provided to Investors under the Stock Purchase Agreements. In connection with the Secondary Treasury Sales, the Treasury received gross proceeds of $6.0 million and ceased to be our stockholder.
Cancellation of Legacy Common Stock
As of July 31, 2013, we had 21,247,225 shares of Legacy Common Stock issued and outstanding. On the Effective Date, immediately following the consummation of the TARP Exchange, all shares of the outstanding Legacy Common Stock including those shares held as treasury stock and in any stock incentive plans were cancelled for no consideration pursuant to the Plan of Reorganization. In connection with the cancellation of the Legacy Common Stock pursuant to the Plan of Reorganization, the Rights Agreement, dated as of November 5, 2010, by and between the Company and American Stock Transfer & Trust Company, LLC was terminated on the Effective Date in accordance with its terms.
Senior Debt Settlement
We were a party to the Amended and Restated Credit Agreement, dated as of June 9, 2008, among the Company, the lenders from time to time a party thereto, and U.S. Bank National Association, as administrative agent for the Lenders. As of June 30, 2013, the aggregate amount of obligations under the Credit Agreement was approximately $183.5 million (including with respect to unpaid principal balance, accrued but unpaid interest thereon and all administrative and other fees or penalties). On the Effective Date, pursuant to the Plan of Reorganization, we satisfied all of our obligations under the Credit Agreement by a cash payment to the Lenders of $49.0 million (plus expense reimbursement as contemplated by the Credit Agreement). As a result of the transaction, we recognized a gain on extinguishment of debt of $134.5 million.
All Other Claims Unaffected
All other claims were unaffected by, and were paid in full under, the Plan of Reorganization.
Termination of Orders to Cease and Desist
The Bank’s primary regulator is the Office of the Comptroller of the Currency (“OCC”). The Federal Reserve is the primary regulator of the Corporation. On June 26, 2009, the Corporation and the Bank each consented to the issuance of an Order to Cease and Desist (the “Corporation Order” and the “Bank Order,” respectively, and together, the “C&D Orders”). On August 31, 2010, a Prompt and Corrective Action Directive (“PCA Directive”) was issued for the Bank.
The Corporation Order required the Corporation to notify, and in certain cases to obtain the permission of, the Federal Reserve prior to making dividends or capital distributions, incurring debt, making changes to or entering into contracts with directors or executive officers.
The Bank Order required the Bank to notify, or in certain cases obtain the permission of, the OCC prior to increases above a certain threshold in total assets, entering into brokered deposits, making changes to or entering into contracts with directors or executives officers, entering into certain transactions with affiliates or entering into third-party contracts outside the normal course of business and to meet and maintain both a core capital ratio and a total risk-based capital ratio.
On April 2, 2014, the Bank was notified that the Bank Order and the PCA Directive were terminated. On July 31, 2014, the Corporation was notified that the Corporation Order was terminated.
F-77
Table of Contents
Note 3—Recent Accounting Pronouncements
Accounting Standards Update (ASU) 2014-12, “Accounting for Share-Based Payments When the Terms of an Award Provide That a Performance Target Could be Achieved After the Requisite Service Period.” The ASU clarifies that entities should treat performance targets that can be met after the requisite service period of a share-based payment award as performance conditions that affect vesting. Therefore, an entity would not record compensation expense (measured as of the grant date without taking into account the effect of the performance target) related to an award for which transfer to the employee is contingent on the entity’s satisfaction of a performance target until it becomes probable that the performance target will be met. The ASU does not contain any new disclosure requirements and is effective for annual periods and interim periods within those annual periods beginning after December 15, 2015. Earlier adoption is permitted. This ASU currently has no impact on the Company.
ASU 2014-11, “Transfers and Servicing: Repurchase-to-Maturity Transactions, Repurchase Financings, and Disclosures” makes limited amendments to the guidance in ASC 860 on accounting for certain repurchase agreements (“repos”). The ASU (1) requires entities to account for repurchase-to-maturity transactions as secured borrowings (rather than as sales with forward repurchase agreements), (2) eliminates accounting guidance on linking repurchase financing transactions, and (3) expands disclosure requirements related to certain transfers of financial assets that are accounted for as sales and certain transfers (specifically, repos, securities lending transactions and repurchase-to-maturity transactions) accounted for as secured borrowings. In addition, the ASU provides examples of repurchase and securities lending arrangements that illustrate whether a transferor has maintained effective control over the transferred financial assets. The accounting changes in the ASU are effective for public business entities for the first interim or annual period beginning after December 15, 2014. Early adoption is prohibited. This ASU will have no effect on the Company.
ASU 2014-04, “Receivables—Troubled Debt Restructurings by Creditors (Subtopic 310-40)—Reclassification of Residential Real Estate Collateralized Consumer Mortgage Loans upon Foreclosure.” These amendments are intended to clarify when a creditor should be considered to have received physical possession of residential real estate property when collateralizing a consumer mortgage loan such that the loan should be derecognized and the real estate recognized. Further, this amendment clarifies that an in-substance repossession or foreclosure occurs, and a creditor is considered to have received physical possession of residential real estate property collateralizing a consumer mortgage loan, upon either: (1) the creditor obtaining legal title to the residential real estate property upon completion of a foreclosure, or (2) the borrower conveying all interest in the residential real estate property to the creditor to satisfy that loan through completion of a deed in lieu of foreclosure or through a similar legal agreement. ASU 2014-04 is effective for public companies for annual periods and interim periods within those annual periods beginning after December 15, 2014. The Corporation has not yet evaluated the effect this ASU will have on its consolidated financial statements.
ASC Topic 740 “Income Taxes.” New authoritative accounting guidance under ASC Topic 740, “Income Taxes” amended prior guidance to include explicit guidance on the financial statement presentation of an unrecognized tax benefit when a net operating loss carryforward, a similar tax loss, or a tax credit carryforward exists. An unrecognized tax benefit, or a portion of an unrecognized tax benefit, should be presented in the financial statements as a reduction to a deferred tax asset for a net operating loss carryforward, a similar tax loss, or a tax credit carryforward, except as follows. To the extent a net operating loss carryforward, a similar tax loss, or a tax credit carryforward is not available at the reporting date under the tax law of the applicable jurisdiction to settle any additional income taxes that would result from the disallowance of a tax position or the tax law of the applicable jurisdiction does not require the entity to use, and the entity does not intend to use, the deferred tax asset for such purpose, the unrecognized tax benefit should be presented in the financial statements as a liability and should not be combined with deferred tax assets. The authoritative guidance is effective for reporting periods after January 1, 2014. The Company is in compliance with these requirements and adoption did not have an impact on the consolidated financial statements.
F-78
Table of Contents
Note 4—Investment Securities
The amortized cost and fair value of investment securities are as follows:
| Amortized Cost |
Gross Unrealized | Fair Value |
||||||||||||||
| Gains | Losses | |||||||||||||||
| (In thousands) | ||||||||||||||||
| June 30, 2014 |
||||||||||||||||
| Available for sale: |
||||||||||||||||
| U.S. government sponsored and federal agency obligations |
$ | 3,303 | $ | 25 | $ | — | $ | 3,328 | ||||||||
| Corporate stock and bonds |
1 | 5 | — | 6 | ||||||||||||
| Non-agency CMOs(1) |
5,968 | 12 | (124 | ) | 5,856 | |||||||||||
| GSA mortgage-backed securities(1) |
83,879 | 476 | (224 | ) | 84,131 | |||||||||||
| GNMA mortgage-backed securities(1) |
203,989 | 1,152 | (3,172 | ) | 201,969 | |||||||||||
|
|
|
|
|
|
|
|
|
|||||||||
| $ | 297,140 | $ | 1,670 | $ | (3,520 | ) | $ | 295,290 | ||||||||
|
|
|
|
|
|
|
|
|
|||||||||
| December 31, 2013 |
||||||||||||||||
| Available for sale: |
||||||||||||||||
| U.S. government sponsored and federal agency obligations |
$ | 3,359 | $ | 17 | $ | — | $ | 3,376 | ||||||||
| Corporate stock and bonds |
88 | 267 | — | 355 | ||||||||||||
| Non-agency CMOs(1) |
6,452 | 9 | (253 | ) | 6,208 | |||||||||||
| GSA mortgage-backed securities(1) |
50,721 | 160 | (723 | ) | 50,158 | |||||||||||
| GNMA mortgage-backed securities(1) |
223,874 | 1,056 | (7,155 | ) | 217,775 | |||||||||||
|
|
|
|
|
|
|
|
|
|||||||||
| $ | 284,494 | $ | 1,509 | $ | (8,131 | ) | $ | 277,872 | ||||||||
|
|
|
|
|
|
|
|
|
|||||||||
| (1) | CMOs (collateralized mortgage obligations), GSAs (government sponsored agencies) and GNMA (Ginnie Mae) mortgage-backed securities are primarily collateralized by residential mortgages. |
Independent pricing services are used to value all investment securities. One pricing service is used to value all securities except the non-agency CMOs. A specialized pricing service is used for valuation of the non-agency CMO portfolio.
To estimate the fair value of non-agency CMOs, the pricing service valuation model discounted estimated expected cash flows after credit losses at rates ranging from 4.0% to 6.5%. The rates utilized are based on the risk free rate equivalent to the remaining average life of the security, plus a spread for normal liquidity and a spread to reflect the uncertainty of the cash flow estimates. The pricing service benchmarks its fair value results to other pricing services and monitors the market for actual trades. The cash flow model includes these inputs in its derivation of the discount rates used to estimate fair value. There are no payments in kind allowed on these non-agency CMOs.
F-79
Table of Contents
The table below presents the fair value and gross unrealized losses of securities in a loss position, aggregated by investment category and length of time that individual holdings have been in a continuous unrealized loss position.
| Unrealized Loss Position | ||||||||||||||||||||||||
| Less than 12 months | 12 months or More | Total | ||||||||||||||||||||||
| Fair Value | Unrealized Loss |
Fair Value | Unrealized Loss |
Fair Value | Unrealized Loss |
|||||||||||||||||||
| (In thousands) | ||||||||||||||||||||||||
| June 30, 2014 |
||||||||||||||||||||||||
| Non-agency CMOs |
$ | — | $ | — | $ | 4,525 | $ | (124 | ) | $ | 4,525 | $ | (124 | ) | ||||||||||
| Government sponsored agency mortgage-backed securities(1) |
21,227 | (70 | ) | 9,006 | (154 | ) | 30,233 | (224 | ) | |||||||||||||||
| GNMA mortgage-backed securities |
27,250 | (39 | ) | 106,696 | (3,133 | ) | 133,946 | (3,172 | ) | |||||||||||||||
|
|
|
|
|
|
|
|
|
|
|
|
|
|||||||||||||
| $ | 48,477 | $ | (109 | ) | $ | 120,227 | $ | (3,411 | ) | $ | 168,704 | $ | (3,520 | ) | ||||||||||
|
|
|
|
|
|
|
|
|
|
|
|
|
|||||||||||||
| December 31, 2013 |
||||||||||||||||||||||||
| Non-agency CMOs |
$ | 1,219 | $ | (7 | ) | $ | 4,776 | $ | (246 | ) | $ | 5,995 | $ | (253 | ) | |||||||||
| Government sponsored agency mortgage-backed securities(1) |
47,480 | (723 | ) | — | — | 47,480 | (723 | ) | ||||||||||||||||
| GNMA mortgage-backed securities |
140,824 | (5,143 | ) | 25,449 | (2,012 | ) | 166,273 | (7,155 | ) | |||||||||||||||
|
|
|
|
|
|
|
|
|
|
|
|
|
|||||||||||||
| $ | 189,523 | $ | (5,873 | ) | $ | 30,225 | $ | (2,258 | ) | $ | 219,748 | $ | (8,131 | ) | ||||||||||
|
|
|
|
|
|
|
|
|
|
|
|
|
|||||||||||||
| (1) | Includes mortgage-backed securities and CMOs. |
In 2008, the Company received proceeds in connection with shares redeemed as part of the Visa, Inc. initial public offering. The Bank was a member of the former Visa, Inc. payments organization and was issued shares when Visa, Inc. was organized. Approximately 39% of those shares were redeemed in connection with the public offering. The remaining shares are restricted because of unsettled litigation pending against Visa, Inc. At its discretion, Visa, Inc. may redeem additional shares in order to resolve pending litigation. The restriction expires upon resolution of the pending litigation. Accordingly, the Company has recorded these shares at zero in the Consolidated Balance Sheets. Upon expiration of the restriction, the Company expects to record the fair value of the remaining shares.
Other-Than-Temporary Impairment
The number of individual securities in the tables above total 29 at June 30, 2014 and 35 at December 31, 2013. Although these securities have declined in value at some point, the unrealized losses are considered temporary. Management evaluates securities for other-than-temporary impairment on a quarterly basis, and more frequently when economic or market concerns warrant such evaluation. In estimating other-than-temporary impairment losses on investment securities, management considers many factors which include: (1) the length of time and the extent to which the fair value has been less than cost, (2) the financial condition and near-term prospects of the issuer, and (3) the intent and ability of the Corporation to retain its investment for a period of time sufficient to allow for any anticipated recovery in fair value.
To determine if an other-than-temporary impairment exists on a debt security with an unrealized loss, the Corporation first determines if (a) it intends to sell the security or (b) it is more likely than not that it will be required to sell the security before its anticipated recovery. If either of the conditions is met, an other-than-temporary impairment loss is recognized in earnings equal to the difference between the security’s fair value and its amortized cost basis. If neither condition is met, the Corporation determines (a) the amount of the impairment related to credit loss and (b) the amount of the impairment due to all other factors. The difference between the present values of the cash flows expected to be collected, discounted at the purchase yield or current accounting
F-80
Table of Contents
yield of the security, and the amortized cost basis is the credit loss. The credit loss is the portion of the impairment that is deemed other-than-temporary and recognized in earnings and is a reduction in the cost basis of the security. The portion of impairment related to all other factors is deemed temporary and included in other comprehensive income (loss).
An independent pricing service is utilized to run a discounted cash flow model in the calculation of other-than-temporary impairment losses on non-agency CMOs. This model determines the portion of the impairment that is other-than-temporary due to credit losses, and the portion that is temporary due to all other factors.
The significant inputs used for calculating the credit loss portion of securities with other-than-temporary impairment (“OTTI”) include prepayment assumptions, loss severities, original FICO scores, historical rates of delinquency, percentage of loans with limited underwriting, historical rates of default, original loan-to-value ratio, aggregate property location by metropolitan statistical area, original credit support, current credit support, and weighted-average maturity.
The discount rates used to establish the net present value of expected cash flows for purposes of determining OTTI ranged from 4.0% to 6.5%. These rates equate to the effective yield implicit in the security at the date of acquisition of the bonds for which OTTI has not been previously incurred. For bonds with previously recorded OTTI, the discount rate used equates to the accounting yield on the security as of the valuation date.
Default rates were calculated separately for each category of underlying borrower based on delinquency status (i.e. current, 30 to 59 days delinquent, 60 to 89 days delinquent, 90+ days delinquent, and foreclosure balances) of the underlying loans as of June 30, 2014. This data is entered into a loss migration model to calculate projected default rates, which are benchmarked against results that have recently been experienced by other major servicers of non-agency CMOs with similar attributes. The month one to month 24 constant default rate in the model ranged from 5.57% to 12.18%.
At June 30, 2014, five non-agency CMOs with a fair value of $5.8 million and an adjusted cost basis of $5.9 million were other-than-temporarily impaired. At December 31, 2013, six non-agency CMOs with a fair value of $6.2 million and an adjusted cost basis of $6.4 million were other-than-temporarily impaired. Unrealized other-than-temporary impairment due to credit losses of $13,000 and $34,000 was included in earnings for the three and six months ended June 30, 2014 and zero and $83,000 for the three and six months ended June 30, 2013, respectively. For the three months ended June 30, 2014 and 2013, realized losses of $49,000 and $68,000, respectively, and $112,000 and $241,000 for the six month periods, respectively, related to credit issues (i.e.—principal reduced without a receipt of cash) were incurred that were previously recognized in earnings as unrealized other-than-temporary impairment.
Unrealized losses on U.S. government sponsored and federal agency obligations, corporate stocks and bonds and GNMA mortgage-backed securities as of June 30, 2014 and December 31, 2013 due to changes in interest rates and other non-credit related factors totaled $3.4 million and $7.9 million, respectively. The Corporation has analyzed these securities for evidence of other-than-temporary impairment and concluded that no OTTI exists and that the unrealized losses are properly classified in accumulated other comprehensive loss.
F-81
Table of Contents
The following table is a roll forward of the amount of other-than-temporary impairment related to credit losses that have been recognized in earnings for which a portion of impairment was deemed temporary and recognized in other comprehensive loss for the periods presented:
| Three Months Ended June 30, | Six Months Ended June 30, | |||||||||||||||
| 2014 | 2013 | 2014 | 2013 | |||||||||||||
| (In thousands) | ||||||||||||||||
| Beginning balance of unrealized OTTI related to credit losses |
$ | 759 | $ | 1,002 | $ | 801 | $ | 1,778 | ||||||||
| Additional unrealized OTTI related to credit losses for which OTTI was previously recognized |
12 | — | 33 | 83 | ||||||||||||
| Debit related OTTI previously recognized for OTTI recovery during the period |
2 | 3 | 3 | 3 | ||||||||||||
| Credit related OTTI previously recognized for securities sold during the period |
— | — | — | (686 | ) | |||||||||||
| Decrease for realized amount of credit losses for which unrealized credit related OTTI was previously recognized |
(51 | ) | (71 | ) | (115 | ) | (244 | ) | ||||||||
|
|
|
|
|
|
|
|
|
|||||||||
| Ending balance of unrealized OTTI related to credit losses |
$ | 722 | $ | 934 | $ | 722 | $ | 934 | ||||||||
|
|
|
|
|
|
|
|
|
|||||||||
On a cumulative basis, other-than-temporary impairment losses recognized in earnings by year of vintage were as follows:
| Year of Vintage |
June 30, 2014 | |||
| (In thousands) | ||||
| Prior to 2005 |
$ | 7 | ||
| 2005 |
220 | |||
| 2007 |
495 | |||
|
|
|
|||
| $ | 722 | |||
|
|
|
|||
The cost of investment securities sold is determined using the specific identification method. Sales of investment securities available for sale are summarized below:
| Three Months Ended June 30, | Six Months Ended June 30, | |||||||||||||||
| 2014 | 2013 | 2014 | 2013 | |||||||||||||
| (In thousands) | ||||||||||||||||
| Proceeds from sales |
$ | — | $ | — | $ | 388 | $ | 6,420 | ||||||||
|
|
|
|
|
|
|
|
|
|||||||||
| Gross gains |
$ | — | $ | — | $ | 301 | $ | 1 | ||||||||
| Gross losses |
— | — | — | (201 | ) | |||||||||||
|
|
|
|
|
|
|
|
|
|||||||||
| Net gain/(loss) on sales |
$ | — | $ | — | $ | 301 | $ | (200 | ) | |||||||
|
|
|
|
|
|
|
|
|
|||||||||
At June 30, 2014 and December 31, 2013, investment securities available for sale with a fair value of approximately $143.2 million and $162.8 million, respectively, were pledged to secure deposits, borrowings and for other purposes as permitted or required by law.
F-82
Table of Contents
The fair values of investment securities by contractual maturity at June 30, 2014 are shown below. Actual maturities may differ from contractual maturities because issuers have the right to call or prepay obligations with or without call or prepayment penalties.
| Within 1 Year |
After 1 Year through 5 Years |
After 5 Years through 10 Years |
Over Ten Years |
Total | ||||||||||||||||
| (In thousands) | ||||||||||||||||||||
| U.S. government sponsored and federal agency obligations |
$ | — | $ | 3,328 | $ | — | $ | — | $ | 3,328 | ||||||||||
| Corporate stock and bonds |
— | — | — | 6 | 6 | |||||||||||||||
| Non-agency CMOs |
— | — | 2 | 5,854 | 5,856 | |||||||||||||||
| Government sponsored agency mortgage-backed securities(1) |
— | 164 | 13,263 | 70,704 | 84,131 | |||||||||||||||
| GNMA mortgage-backed securities |
— | 233 | — | 201,736 | 201,969 | |||||||||||||||
|
|
|
|
|
|
|
|
|
|
|
|||||||||||
| Total |
$ | — | $ | 3,725 | $ | 13,265 | $ | 278,300 | $ | 295,290 | ||||||||||
|
|
|
|
|
|
|
|
|
|
|
|||||||||||
| (1) | Includes mortgage-backed securities and CMOs. |
Note 5—Loans Receivable
Loans receivable held for investment consist of the following:
| June 30, 2014 |
December 31, 2013 |
|||||||
| (In thousands) | ||||||||
| Residential |
$ | 533,330 | $ | 529,777 | ||||
| Commercial and industrial |
16,002 | 21,591 | ||||||
| Commercial real estate: |
||||||||
| Land and construction |
105,989 | 92,050 | ||||||
| Multi-family |
266,394 | 281,917 | ||||||
| Retail/office |
142,007 | 154,075 | ||||||
| Other commercial real estate |
156,246 | 174,313 | ||||||
| Consumer: |
||||||||
| Education |
118,300 | 129,520 | ||||||
| Other consumer |
231,625 | 238,311 | ||||||
|
|
|
|
|
|||||
| Total unpaid principal balance |
1,569,893 | 1,621,554 | ||||||
| Undisbursed loan proceeds(1) |
(12,182 | ) | (10,322 | ) | ||||
| Unamortized loan fees, net |
(1,568 | ) | (1,722 | ) | ||||
| Unearned interest |
(5 | ) | (4 | ) | ||||
|
|
|
|
|
|||||
| Total loan contra balances |
(13,755 | ) | (12,048 | ) | ||||
|
|
|
|
|
|||||
| Loans held for investment |
1,556,138 | 1,609,506 | ||||||
| Allowance for loan losses |
(49,175 | ) | (65,182 | ) | ||||
|
|
|
|
|
|||||
| Loans held for investment, net |
$ | 1,506,963 | $ | 1,544,324 | ||||
|
|
|
|
|
|||||
| (1) | Undisbursed loan proceeds are funds to be released upon a draw request approved by the Corporation. |
Residential Loans
At June 30, 2014, $533.3 million, or 34.0%, of the total loans unpaid principal balance receivable consisted of residential loans, substantially all of which were 1-to-4 family dwellings. Residential loans consist of both adjustable and fixed-rate loans. The adjustable-rate loans currently in the portfolio were originated with up to
F-83
Table of Contents
30-year maturities and terms which provide for annual increases or decreases of the rate on the loans, based on a designated index. These rate changes are generally subject to a limit of 2% per adjustment and an aggregate 6% adjustment over the life of the loan. These loans are documented according to standard industry practices. The Corporation makes a limited number of interest-only loans which tend to have a shorter term to maturity and does not originate negative amortization and option payment adjustable rate mortgages.
Adjustable-rate loans decrease the risks associated with changes in interest rates but involve other risks, primarily because as interest rates rise, the payment by the borrower rises to the extent permitted by the terms of the loan, thereby increasing the potential for default. At the same time, the marketability of the underlying property may be adversely affected by higher interest rates. These risks, which have not had a material adverse effect to date, generally are less than the risks associated with holding fixed-rate loans in an increasing interest rate environment. Also, as interest rates decline, borrowers may refinance their mortgages into fixed-rate loans thereby prepaying the balance of the loan prior to maturity. At June 30, 2014, approximately $316.8 million, or 59.4%, of the held for investment residential loans unpaid principal balance consisted of loans with adjustable interest rates.
The Corporation continues to originate long-term, fixed-rate conventional mortgage loans. Current production of these loans with terms of 15 years or more are generally sold to Fannie Mae, Freddie Mac and other institutional investors, while a portion of loan production is retained in the held for investment portfolio. In order to provide a full range of products to its customers, the Corporation also participates in the loan origination programs of Wisconsin Housing and Economic Development Authority, Wisconsin Department of Veterans Affairs and the Federal Housing Administration. The right to service substantially all loans sold is retained.
At June 30, 2014, approximately $216.5 million, or 40.6%, of the held for investment residential loans unpaid principal balance consisted of loans with fixed rates of interest. Although these loans generally provide for repayments of principal over a fixed period of 10 to 30 years, because of prepayments and due-on-sale clauses, such loans generally remain outstanding for a shorter period of time.
Commercial and Industrial Loans
The Corporation originates loans for commercial and business purposes, including issuing letters of credit. At June 30, 2014, the unpaid principal balance receivable of commercial and industrial loans amounted to $16.0 million, or 1.0%, of the total loans unpaid principal balance receivable. The commercial and industrial loan portfolio is comprised of loans for a variety of business purposes which are generally secured by equipment, machinery and other corporate assets. These loans generally have terms of seven years or less and interest rates that float in accordance with a designated published index. Substantially all such loans are secured and backed by the personal guarantees of the owners of the business.
Commercial Real Estate Loans
The Corporation originates commercial real estate loans which include land and construction, multi-family, retail/office and other commercial real estate. Such loans generally have adjustable rates and shorter terms than single-family residential loans, thus increasing the earnings sensitivity of the loan portfolio to changes in interest rates, as well as providing higher fees and rates than residential loans. At June 30, 2014, $670.6 million of loans unpaid principal balance receivable were secured by commercial real estate, which represented 42.7% of the total loans unpaid principal balance. The origination of such loans is generally limited to the Corporation’s primary market area, concentrated in Wisconsin’s greater Madison, Fox Valley and Milwaukee regions. Loans are made in contiguous states when appropriate.
Commercial real estate loans are primarily secured by apartment buildings, office and industrial buildings, land, warehouses, small retail shopping centers and various special purpose properties, including community-based residential facilities and senior housing. Although terms vary, commercial real estate loans generally have fixed interest rates, amortization periods of 15 to 30 years, as well as balloon payments of two to seven years.
F-84
Table of Contents
Consumer Loans
The Corporation offers consumer loans in order to provide a wider range of financial services to its customers. At June 30, 2014, $349.9 million, or 22.3%, of the total loans unpaid principal balance receivable consisted of consumer loans. Consumer loans consist of education loans, first and second mortgages, credit cards, vehicles and other unsecured personal loans. Consumer loans typically have higher interest rates than mortgage loans and generally involve more risk than mortgage loans because of the type and nature of the collateral and, in certain cases, the absence of collateral.
Approximately $118.3 million, or 7.5%, of the total loans unpaid principal balance receivable at June 30, 2014 consisted of education loans. These loans are generally made for a maximum of $3,500 per year for undergraduate studies and $8,500 per year for graduate studies and are placed in repayment status on an installment basis within nine months following graduation. Education loans generally have interest rates that adjust annually in accordance with a designated index. Both the principal amount of an education loan and interest thereon are generally guaranteed by the Great Lakes Higher Education Corporation up to 97% of the balance of the loan, which typically obtains reinsurance of its obligations from the U.S. Department of Education. The origination of student loans was discontinued October 1, 2010 following the March 2010 law ending loan guarantees provided by the U.S. Department of Education. Although direct student loans, without a government guarantee, may be originated, risk-adjusted returns for these loans continue to be unattractive. Education loans may be sold to the U.S. Department of Education or to other investors. No education loans were sold during the three and six months ended June 30, 2014 or 2013.
The residential loans included in the consumer portfolio include both first and second mortgages and consist primarily of the Express loan product (the Bank’s expedited first mortgage refinance and home equity loan product). Express loans are available for owner occupied one- to two-family residential properties, with loan amounts up to $200,000, a fixed interest rate, up to 15 year amortization, low fees and rapid closing timeframes. The primary home equity loan product has an adjustable rate that is linked to the prime interest rate and is secured by a mortgage, either a primary or a junior lien, on the borrower’s residence. New home equity lines do not exceed 90% of appraised value of the property at the loan origination date. A fixed-rate home equity second mortgage term product is also offered.
Other consumer loans consist of credit cards, vehicle loans and other secured and unsecured loans made for a variety of consumer purposes. Credit is extended to Bank customers through credit cards issued by a third party, ELAN Financial Services (ELAN), pursuant to an agency arrangement under which the Corporation participates in outstanding balances, currently at 25% to 28%. The Corporation also shares 33% to 37% of annual fees, and 30% of late payment, over limit and cash advance fees, as well as 25% to 30% of interchange income from the underlying portfolio net of our share of losses
Allowances for Loan Losses
The allowance for loan losses consists of general and specific components even though the entire allowance is available to cover losses on any loan. The specific allowance component relates to impaired loans (i.e.—non-accrual) and all loans reported as troubled debt restructurings. For such loans, an allowance is established when the discounted cash flows (or collateral value if repayment relies solely on the operation or sale of the collateral) of the impaired loan are lower than the carrying value of that loan. The general allowance component is based on historical loss experience adjusted for various qualitative factors. Loans graded substandard and below are individually examined to determine the appropriate loan loss reserve. In addition, reserves for unfunded commitments, letters of credit and repurchase of sold loans are maintained and classified in other liabilities.
For the quarter ended June 30, 2014, the Bank modified its general allowance methodology to increase the historical loss period from an eight to nine quarter historical look-back period with the intent to build to a 12 quarter look back period subsequent to June 30, 2014. The modification was done to reflect a more stable
F-85
Table of Contents
economic environment and to capture additional loss statistics considered reflective of the current portfolio. The impact to the allowance for loan losses at June 30, 2014 after implementing the above modification was a reduction of the required reserve of $381,000 as compared to the previous methodology. See the Company’s annual report on Form 10-K for the nine months ended December 31, 2013 for a full description of the allowance methodology.
The following table presents the allowance for loan losses by component:
| June 30, 2014 |
December 31, 2013 |
|||||||
| (In thousands) | ||||||||
| General reserve |
$ | 33,633 | $ | 35,844 | ||||
| Substandard reserve |
10,040 | 6,225 | ||||||
| Specific reserve |
5,502 | 23,113 | ||||||
|
|
|
|
|
|||||
| Total allowance for loan losses |
$ | 49,175 | $ | 65,182 | ||||
|
|
|
|
|
|||||
The following table presents the unpaid principal balance of loans by risk category:
| June 30, 2014 |
December 31, 2013 |
|||||||
| (In thousands) | ||||||||
| Pass |
$ | 1,484,701 | $ | 1,460,457 | ||||
| Special mention |
2,693 | 24,203 | ||||||
|
|
|
|
|
|||||
| Total pass and special mention rated loans |
1,487,394 | 1,484,660 | ||||||
| Substandard rated loans, excluding TDR accrual(1) |
29,083 | 35,310 | ||||||
| Troubled debt restructurings—accrual |
11,249 | 33,087 | ||||||
| Non-accrual |
42,167 | 68,497 | ||||||
|
|
|
|
|
|||||
| Total impaired loans |
53,416 | 101,584 | ||||||
|
|
|
|
|
|||||
| Total unpaid principal balance |
$ | 1,569,893 | $ | 1,621,554 | ||||
|
|
|
|
|
|||||
| (1) | Includes residential and consumer loans identified as substandard that are not necessarily on non-accrual. |
F-86
Table of Contents
The following table presents activity in the allowance for loan losses by portfolio segment:
| For the Three Months Ended: |
Residential | Commercial and Industrial |
Commercial Real Estate |
Consumer | Total | |||||||||||||||
| (In thousands) | ||||||||||||||||||||
| June 30, 2014 |
||||||||||||||||||||
| Beginning balance |
$ | 9,378 | $ | 4,938 | $ | 35,043 | $ | 4,138 | $ | 53,497 | ||||||||||
| Provision |
1,388 | 911 | (3,383 | ) | 1,084 | — | ||||||||||||||
| Charge-offs |
(566 | ) | (3,633 | ) | (1,141 | ) | (291 | ) | (5,631 | ) | ||||||||||
| Recoveries |
125 | 380 | 651 | 153 | 1,309 | |||||||||||||||
|
|
|
|
|
|
|
|
|
|
|
|||||||||||
| Ending balance |
$ | 10,325 | $ | 2,596 | $ | 31,170 | $ | 5,084 | $ | 49,175 | ||||||||||
|
|
|
|
|
|
|
|
|
|
|
|||||||||||
| June 30, 2013 |
||||||||||||||||||||
| Beginning balance |
$ | 14,525 | $ | 7,072 | $ | 54,581 | $ | 3,637 | $ | 79,815 | ||||||||||
| Provision |
2,099 | (974 | ) | (2,180 | ) | 1,330 | 275 | |||||||||||||
| Charge-offs |
(1,665 | ) | (411 | ) | (2,199 | ) | (907 | ) | (5,182 | ) | ||||||||||
| Recoveries |
163 | 155 | 604 | 42 | 964 | |||||||||||||||
|
|
|
|
|
|
|
|
|
|
|
|||||||||||
| Ending balance |
$ | 15,122 | $ | 5,842 | $ | 50,806 | $ | 4,102 | $ | 75,872 | ||||||||||
|
|
|
|
|
|
|
|
|
|
|
|||||||||||
| For the Six Months Ended: |
Residential | Commercial and Industrial |
Commercial Real Estate |
Consumer | Total | |||||||||||||||
| (In thousands) | ||||||||||||||||||||
| June 30, 2014 |
||||||||||||||||||||
| Beginning balance |
$ | 13,059 | $ | 6,402 | $ | 42,065 | $ | 3,656 | $ | 65,182 | ||||||||||
| Provision |
(1,428 | ) | 373 | (1,551 | ) | 2,606 | — | |||||||||||||
| Charge-offs |
(1,662 | ) | (4,955 | ) | (11,902 | ) | (1,435 | ) | (19,954 | ) | ||||||||||
| Recoveries |
356 | 776 | 2,558 | 257 | 3,947 | |||||||||||||||
|
|
|
|
|
|
|
|
|
|
|
|||||||||||
| Ending balance |
$ | 10,325 | $ | 2,596 | $ | 31,170 | $ | 5,084 | $ | 49,175 | ||||||||||
|
|
|
|
|
|
|
|
|
|
|
|||||||||||
| June 30, 2013 |
||||||||||||||||||||
| Beginning balance |
$ | 12,174 | $ | 6,591 | $ | 62,269 | $ | 2,727 | $ | 83,761 | ||||||||||
| Provision |
6,296 | 99 | (9,995 | ) | 4,550 | 950 | ||||||||||||||
| Charge-offs |
(3,529 | ) | (1,135 | ) | (3,512 | ) | (3,320 | ) | (11,496 | ) | ||||||||||
| Recoveries |
181 | 287 | 2,044 | 145 | 2,657 | |||||||||||||||
|
|
|
|
|
|
|
|
|
|
|
|||||||||||
| Ending balance |
$ | 15,122 | $ | 5,842 | $ | 50,806 | $ | 4,102 | $ | 75,872 | ||||||||||
|
|
|
|
|
|
|
|
|
|
|
|||||||||||
F-87
Table of Contents
The following table presents the balance in the allowance for loan losses and the recorded investment in loans by portfolio segment and based on impairment method:
| Residential | Commercial and Industrial |
Commercial Real Estate |
Consumer | Total | ||||||||||||||||
| (In thousands) | ||||||||||||||||||||
| June 30, 2014 |
||||||||||||||||||||
| Allowance for loan losses: |
||||||||||||||||||||
| Associated with impaired loans |
$ | 816 | $ | 202 | $ | 4,050 | $ | 434 | $ | 5,502 | ||||||||||
| Associated with all other loans |
9,509 | 2,394 | 27,120 | 4,650 | 43,673 | |||||||||||||||
|
|
|
|
|
|
|
|
|
|
|
|||||||||||
| Total |
$ | 10,325 | $ | 2,596 | $ | 31,170 | $ | 5,084 | $ | 49,175 | ||||||||||
|
|
|
|
|
|
|
|
|
|
|
|||||||||||
| Loans: |
||||||||||||||||||||
| Impaired loans individually evaluated |
$ | 10,215 | $ | 995 | $ | 40,355 | $ | 1,851 | $ | 53,416 | ||||||||||
| All other loans |
523,115 | 15,007 | 630,281 | 348,074 | 1,516,477 | |||||||||||||||
|
|
|
|
|
|
|
|
|
|
|
|||||||||||
| Total |
$ | 533,330 | $ | 16,002 | $ | 670,636 | $ | 349,925 | $ | 1,569,893 | ||||||||||
|
|
|
|
|
|
|
|
|
|
|
|||||||||||
| December 31, 2013 |
||||||||||||||||||||
| Allowance for loan losses: |
||||||||||||||||||||
| Associated with impaired loans |
$ | 2,375 | $ | 1,745 | $ | 18,516 | $ | 477 | $ | 23,113 | ||||||||||
| Associated with all other loans |
10,684 | 4,657 | 23,549 | 3,179 | 42,069 | |||||||||||||||
|
|
|
|
|
|
|
|
|
|
|
|||||||||||
| Total |
$ | 13,059 | $ | 6,402 | $ | 42,065 | $ | 3,656 | $ | 65,182 | ||||||||||
|
|
|
|
|
|
|
|
|
|
|
|||||||||||
| Loans: |
||||||||||||||||||||
| Impaired loans individually evaluated |
$ | 19,060 | $ | 2,314 | $ | 77,047 | $ | 3,163 | $ | 101,584 | ||||||||||
| All other loans |
510,717 | 19,277 | 625,308 | 364,668 | 1,519,970 | |||||||||||||||
|
|
|
|
|
|
|
|
|
|
|
|||||||||||
| Total |
$ | 529,777 | $ | 21,591 | $ | 702,355 | $ | 367,831 | $ | 1,621,554 | ||||||||||
|
|
|
|
|
|
|
|
|
|
|
|||||||||||
At June 30, 2014, $53.4 million of unpaid principal balance of loans are deemed impaired which includes performing troubled debt restructurings. At December 31, 2013, impaired loans were $101.6 million. A loan is identified as impaired when, based on current information and events, it is probable that all amounts due according to the contractual terms of the loan agreement may not be collected and thus are placed on non-accrual status. Interest income on certain impaired loans is recognized on a cash basis.
A substantial portion of loans are collateralized by real estate in Wisconsin and adjacent states. Accordingly, the ultimate collectability of the loan portfolio is susceptible to changes in real estate market conditions in that area.
F-88
Table of Contents
The following table presents impaired loans segregated by loans with no specific allowance and loans with an allowance by class of loans. The carrying amounts represent the unpaid principal balance less the associated allowance. The interest income recognized column represents all interest income recorded either on a cash or accrual basis after the loan became impaired.
| Unpaid Principal Balance |
Associated Allowance |
Carrying Amount |
Average Carrying Amount(1) |
Year-to-Date Interest Income Recognized |
||||||||||||||||
| (In thousands) | ||||||||||||||||||||
| June 30, 2014 |
||||||||||||||||||||
| With no specific allowance recorded: |
||||||||||||||||||||
| Residential |
$ | 5,555 | $ | — | $ | 5,555 | $ | 6,114 | $ | 63 | ||||||||||
| Commercial and industrial |
688 | — | 688 | 2,167 | 53 | |||||||||||||||
| Land and construction |
11,531 | — | 11,531 | 15,391 | 339 | |||||||||||||||
| Multi-family |
6,446 | — | 6,446 | 5,892 | 305 | |||||||||||||||
| Retail/office |
3,385 | — | 3,385 | 4,794 | 96 | |||||||||||||||
| Other commercial real estate |
8,425 | — | 8,425 | 9,110 | 347 | |||||||||||||||
| Education |
209 | — | 209 | 274 | — | |||||||||||||||
| Other consumer |
1,049 | — | 1,049 | 1,446 | 25 | |||||||||||||||
|
|
|
|
|
|
|
|
|
|
|
|||||||||||
| Subtotal |
37,288 | — | 37,288 | 45,188 | 1,228 | |||||||||||||||
|
|
|
|
|
|
|
|
|
|
|
|||||||||||
| With an allowance recorded(2): |
||||||||||||||||||||
| Residential |
$ | 4,660 | $ | 816 | $ | 3,844 | $ | 4,028 | $ | 111 | ||||||||||
| Commercial and industrial |
307 | 202 | 105 | 775 | 26 | |||||||||||||||
| Land and construction |
7,875 | 3,585 | 4,290 | 5,199 | 114 | |||||||||||||||
| Multi-family |
451 | 95 | 356 | 350 | 7 | |||||||||||||||
| Retail/office |
1,339 | 250 | 1,089 | 1,284 | 6 | |||||||||||||||
| Other commercial real estate |
903 | 120 | 783 | 783 | 44 | |||||||||||||||
| Education(3) |
— | — | — | — | — | |||||||||||||||
| Other consumer |
593 | 434 | 159 | 410 | 13 | |||||||||||||||
|
|
|
|
|
|
|
|
|
|
|
|||||||||||
| Subtotal |
16,128 | 5,502 | 10,626 | 12,829 | 321 | |||||||||||||||
|
|
|
|
|
|
|
|
|
|
|
|||||||||||
| Total |
||||||||||||||||||||
| Residential |
$ | 10,215 | $ | 816 | $ | 9,399 | $ | 10,142 | $ | 174 | ||||||||||
| Commercial and industrial |
995 | 202 | 793 | 2,942 | 79 | |||||||||||||||
| Land and construction |
19,406 | 3,585 | 15,821 | 20,590 | 453 | |||||||||||||||
| Multi-family |
6,897 | 95 | 6,802 | 6,242 | 312 | |||||||||||||||
| Retail/office |
4,724 | 250 | 4,474 | 6,078 | 102 | |||||||||||||||
| Other commercial real estate |
9,328 | 120 | 9,208 | 9,893 | 391 | |||||||||||||||
| Education(3) |
209 | — | 209 | 274 | — | |||||||||||||||
| Other consumer |
1,642 | 434 | 1,208 | 1,856 | 38 | |||||||||||||||
|
|
|
|
|
|
|
|
|
|
|
|||||||||||
| $ | 53,416 | $ | 5,502 | $ | 47,914 | $ | 58,017 | $ | 1,549 | |||||||||||
|
|
|
|
|
|
|
|
|
|
|
|||||||||||
F-89
Table of Contents
| Unpaid Principal Balance |
Associated Allowance |
Carrying Amount |
Average Carrying Amount(1) |
Nine Months Ended December 31, 2013 Interest Income Recognized |
||||||||||||||||
| (In thousands) | ||||||||||||||||||||
| December 31, 2013 |
||||||||||||||||||||
| With no specific allowance recorded: |
||||||||||||||||||||
| Residential |
$ | 3,751 | $ | — | $ | 3,751 | $ | 4,032 | $ | 43 | ||||||||||
| Commercial and industrial |
60 | — | 60 | 79 | 39 | |||||||||||||||
| Land and construction |
4,311 | — | 4,311 | 4,707 | 91 | |||||||||||||||
| Multi-family |
9,848 | — | 9,848 | 5,845 | 221 | |||||||||||||||
| Retail/office |
6,896 | — | 6,896 | 7,659 | 210 | |||||||||||||||
| Other commercial real estate |
9,216 | — | 9,216 | 9,737 | 456 | |||||||||||||||
| Education |
0 | — | — | — | — | |||||||||||||||
| Other consumer |
343 | — | 343 | 631 | 87 | |||||||||||||||
|
|
|
|
|
|
|
|
|
|
|
|||||||||||
| Subtotal |
34,425 | — | 34,425 | 32,690 | 1,147 | |||||||||||||||
|
|
|
|
|
|
|
|
|
|
|
|||||||||||
| With an allowance recorded(2): |
||||||||||||||||||||
| Residential |
$ | 15,309 | $ | 2,375 | $ | 12,934 | $ | 13,140 | $ | 422 | ||||||||||
| Commercial and industrial |
2,254 | 1,745 | 509 | 658 | 44 | |||||||||||||||
| Land and construction |
20,418 | 7,512 | 12,906 | 15,193 | 252 | |||||||||||||||
| Multi-family |
14,312 | 3,693 | 10,619 | 6,286 | 228 | |||||||||||||||
| Retail/office |
9,347 | 6,925 | 2,422 | 4,948 | 128 | |||||||||||||||
| Other commercial real estate |
2,699 | 386 | 2,313 | 2,270 | 99 | |||||||||||||||
| Education(3) |
276 | — | 276 | 338 | — | |||||||||||||||
| Other consumer |
2,544 | 477 | 2,067 | 2,211 | 105 | |||||||||||||||
|
|
|
|
|
|
|
|
|
|
|
|||||||||||
| Subtotal |
67,159 | 23,113 | 44,046 | 45,044 | 1,278 | |||||||||||||||
|
|
|
|
|
|
|
|
|
|
|
|||||||||||
| Total |
||||||||||||||||||||
| Residential |
$ | 19,060 | $ | 2,375 | $ | 16,685 | $ | 17,172 | $ | 465 | ||||||||||
| Commercial and industrial |
2,314 | 1,745 | 569 | 737 | 83 | |||||||||||||||
| Land and construction |
24,729 | 7,512 | 17,217 | 19,900 | 343 | |||||||||||||||
| Multi-family |
24,160 | 3,693 | 20,467 | 12,131 | 449 | |||||||||||||||
| Retail/office |
16,243 | 6,925 | 9,318 | 12,607 | 338 | |||||||||||||||
| Other commercial real estate |
11,915 | 386 | 11,529 | 12,007 | 555 | |||||||||||||||
| Education(3) |
276 | — | 276 | 338 | — | |||||||||||||||
| Other consumer |
2,887 | 477 | 2,410 | 2,842 | 192 | |||||||||||||||
|
|
|
|
|
|
|
|
|
|
|
|||||||||||
| $ | 101,584 | $ | 23,113 | $ | 78,471 | $ | 77,734 | $ | 2,425 | |||||||||||
|
|
|
|
|
|
|
|
|
|
|
|||||||||||
| (1) | Calculated on a trailing 12 month basis for June 30, 2014, and a trailing 9 month basis for December 31, 2013. |
| (2) | Includes ratio-based allowance for loan losses of $0.7 million and $2.1 million associated with loans totaling $2.1 million and $12.5 million at June 30, 2014, and December 31, 2013, respectively, for which individual reviews have not been completed but an allowance established based on the ratio of allowance for loan losses to unpaid principal balance for the loans individually reviewed, by class of loan. |
| (3) | Excludes the guaranteed portion of education loans 90+ days past due with unpaid principal balance of $6,767 and $8,930 and average carrying amounts totaling $9,787 and $13,730 at June 30, 2014, and December 31, 2013, respectively, that are not considered impaired based on a guarantee provided by government agencies. |
F-90
Table of Contents
The average recorded investment in impaired loans and interest income recognized on impaired loans follows:
| Interest Income Recognized | Interest Income Recognized | |||||||||||||||||||||||
| Average Carrying Amount (1) |
Three Months Ended |
Six Months Ended |
Average Carrying Amount(1) |
Three Months Ended |
Six Months Ended |
|||||||||||||||||||
| June 30, 2014 | June 30, 2013 | |||||||||||||||||||||||
| (In Thousands) | ||||||||||||||||||||||||
| Residential |
$ | 10,142 | $ | 65 | $ | 174 | $ | 26,643 | $ | 250 | $ | 604 | ||||||||||||
| Commercial and industrial |
2,942 | 53 | 79 | 1,043 | 47 | (11 | ) | |||||||||||||||||
| Land and construction |
20,590 | 260 | 453 | 26,820 | 128 | 71 | ||||||||||||||||||
| Multi-family |
6,242 | 2 | 312 | 22,297 | 305 | 433 | ||||||||||||||||||
| Retail/office |
6,078 | 37 | 102 | 16,775 | 13 | (305 | ) | |||||||||||||||||
| Other commercial real estate |
9,893 | 185 | 391 | 29,188 | 321 | 472 | ||||||||||||||||||
| Education |
274 | — | — | 538 | — | — | ||||||||||||||||||
| Other consumer |
1,856 | 7 | 38 | 3,285 | 73 | 83 | ||||||||||||||||||
|
|
|
|
|
|
|
|
|
|
|
|
|
|||||||||||||
| $ | 58,017 | $ | 609 | $ | 1,549 | $ | 126,589 | $ | 1,137 | $ | 1,347 | |||||||||||||
|
|
|
|
|
|
|
|
|
|
|
|
|
|||||||||||||
| (1) | The average carry amount was calculated on a trailing 12 month basis. |
The following is additional information regarding impaired loans:
| June 30, 2014 |
December 31, 2013 |
|||||||
| (In thousands) | ||||||||
| Carrying amount of impaired loans |
$ | 47,914 | $ | 78,471 | ||||
| Average carrying amount of impaired loans |
58,017 | 77,734 | ||||||
| Loans and troubled debt restructurings on non-accrual status |
42,167 | 68,497 | ||||||
| Troubled debt restructurings—accrual |
11,249 | 33,087 | ||||||
| Troubled debt restructurings—non-accrual(1) |
21,405 | 29,346 | ||||||
| Troubled debt restructurings valuation allowance |
5,500 | 12,216 | ||||||
| Loans past due ninety days or more and still accruing(2) |
6,767 | 8,930 | ||||||
| (1) | Troubled debt restructurings—non-accrual are included in the loans and troubled debt restructurings on non-accrual status line item above. |
| (2) | Representes the guaranteed portion of education loans that were 90+ days past due which continue to accrue interest due to a guarantee provided by government agencies covering approximately 97% of the outstanding balance. |
Although the Corporation is currently not committed to lend any additional funds on impaired loans in accordance with the original terms of these loans, it is not legally obligated to, and will cautiously disburse additional funds on any loans while in nonaccrual status or if the borrower is in default.
The Corporation experienced declines in the valuations for real estate collateral supporting portions of its loan portfolio throughout 2012 and 2013 and the three and six months ended June 30, 2014, as reflected in recently received appraisals. Currently, $80.2 million or approximately 97.2% of the unpaid principal balance of classified loans (i.e. loans risk rated as substandard, doubtful or loss) have recent appraisals (i.e. within one year) or have been determined to not need an appraisal. Loans that do not require an appraisal under corporate policy include situations in which the loan (i) is fully reserved; (ii) has a small balance (less than $250,000) and rather than being individually evaluated for impairment, is included in a homogenous pool of loans; (iii) uses a net present value of future cash flows to measure impairment; or (iv) is not secured by real estate. Appraised values greater than one year old are discounted by an additional 10% for improved land or commercial real estate and 20% for unimproved land, in determination of the allowance for loan losses.
F-91
Table of Contents
While corporate policy may not require updated appraisals for these loans, new appraisals may still be obtained. For example, 46% of the loans which do not require an updated appraisal either have had an appraisal within the last year or an appraisal is on order. If real estate values decline, the allowance for loan losses may increase as updated appraisals or other indications of a decrease in the value of collateral are received.
The following table presents the aging of the recorded investment in past due loans by class of loans:
| Days Past Due | ||||||||||||||||
| 30-59 | 60-89 | 90 or More | Total | |||||||||||||
| (In thousands) | ||||||||||||||||
| June 30, 2014 |
||||||||||||||||
| Residential |
$ | 1,691 | $ | 328 | $ | 3,315 | $ | 5,334 | ||||||||
| Commercial and industrial |
220 | 48 | 2,755 | 3,023 | ||||||||||||
| Land and construction |
170 | — | 3,917 | 4,087 | ||||||||||||
| Multi-family |
2,064 | 228 | 2,842 | 5,134 | ||||||||||||
| Retail/office |
2,734 | 1,214 | 2,169 | 6,117 | ||||||||||||
| Other commercial real estate |
262 | 2,020 | 1,352 | 3,634 | ||||||||||||
| Education |
3,500 | 2,682 | 6,976 | 13,158 | ||||||||||||
| Other consumer |
616 | 231 | 1,230 | 2,077 | ||||||||||||
|
|
|
|
|
|
|
|
|
|||||||||
| $ | 11,257 | $ | 6,751 | $ | 24,556 | $ | 42,564 | |||||||||
|
|
|
|
|
|
|
|
|
|||||||||
| December 31, 2013 |
||||||||||||||||
| Residential |
$ | 1,287 | $ | 564 | $ | 8,897 | $ | 10,748 | ||||||||
| Commercial and industrial |
1,609 | — | 1,461 | 3,070 | ||||||||||||
| Land and construction |
105 | — | 11,307 | 11,412 | ||||||||||||
| Multi-family |
1,612 | — | 1,079 | 2,691 | ||||||||||||
| Retail/office |
968 | 83 | 10,887 | 11,938 | ||||||||||||
| Other commercial real estate |
184 | 506 | 3,785 | 4,475 | ||||||||||||
| Education |
5,210 | 2,914 | 9,206 | 17,330 | ||||||||||||
| Other consumer |
910 | 213 | 2,395 | 3,518 | ||||||||||||
|
|
|
|
|
|
|
|
|
|||||||||
| $ | 11,885 | $ | 4,280 | $ | 49,017 | $ | 65,182 | |||||||||
|
|
|
|
|
|
|
|
|
|||||||||
Total delinquencies (loans past due 30 days or more) at June 30, 2014 were $42.6 million. The Corporation has experienced a significant reduction in delinquencies since December 31, 2013 primarily due to improving credit conditions and $7.7 million of loans moving to OREO. The Corporation has $6.8 million of education loans past due 90 days or more at June 30, 2014 that are still accruing interest due to the approximate 97% guarantee provided by governmental agencies. Loans less than 90 days delinquent may be placed on non-accrual status when the probability of collection of principal and interest is deemed to be insufficient to warrant further accrual.
Credit Quality Indicators:
The Corporation groups commercial and industrial loans and commercial real estate loans into risk categories based on relevant information about the ability of borrowers to service their debt such as: current financial information, historical payment experience, credit documentation, public information and current economic trends, among other factors. This analysis is updated on a monthly basis. The following definitions are used for risk ratings:
Pass. Loans classified as pass represent assets that are evaluated and are performing under the stated terms. Pass rated assets are analyzed by the pay capacity of the obligor, current net worth of the obligor and/or by the value of the loan collateral. A subcategory of loans classified as pass are watch loans.
Watch. Loans classified as watch possess potential weaknesses that require management attention, but do not yet warrant adverse classification. While the status of an asset put on this list does not technically trigger their classification as substandard or non-accrual, it is considered a proactive way to identify potential issues and address them before the situation deteriorates further and results in a loss.
F-92
Table of Contents
Special Mention. Loans classified as special mention exhibit material negative financial trends due to company specific or industry conditions which, if not corrected or mitigated, threaten their capacity to meet current or continuing debt obligations. These borrowers still demonstrate the financial flexibility to address and cure the root cause of these adverse financial trends without significant deviations from their current business plan. Their potential weakness deserves close attention and warrants enhanced monitoring on the part of management. The expectation is these borrowers will return to a pass rating given reasonable time; or will be further downgraded.
Substandard. Loans classified as substandard are inadequately protected by the current net worth, paying capacity of the obligor, or by the collateral pledged. Substandard assets must have a well-defined weakness or weaknesses that jeopardize the liquidation of the debt. They are characterized by the distinct possibility that a loss will be sustained if the deficiencies are not corrected.
Non-Accrual. Loans classified as non-accrual have the weaknesses of those classified as Substandard, with the added characteristic that the weaknesses make collection or liquidation in full, on the basis of currently existing facts, conditions and values, highly questionable and improbable. Loans that fall into this category are deemed collateral dependent and an individual impairment evaluation is performed for all relationships greater than $500,000. Loans in this category are allocated a specific reserve if the collateral does not support the outstanding loan balance or charged off if deemed uncollectible.
The risk category of loans by class of loans, and based on the most recent analysis performed, is as follows:
| Pass | Special Mention |
Substandard | Non-Accrual | Total Unpaid Principal Balance |
||||||||||||||||
| (In thousands) | ||||||||||||||||||||
| June 30, 2014 |
||||||||||||||||||||
| Commercial and industrial |
$ | 11,676 | $ | — | $ | 3,332 | $ | 994 | $ | 16,002 | ||||||||||
| Commercial real estate: |
||||||||||||||||||||
| Land and construction |
83,101 | 70 | 3,972 | 18,846 | 105,989 | |||||||||||||||
| Multi-family |
258,307 | — | 1,838 | 6,249 | 266,394 | |||||||||||||||
| Retail/office |
131,315 | 1,019 | 5,679 | 3,994 | 142,007 | |||||||||||||||
| Other |
137,557 | 1,228 | 13,175 | 4,286 | 156,246 | |||||||||||||||
|
|
|
|
|
|
|
|
|
|
|
|||||||||||
| $ | 621,956 | $ | 2,317 | $ | 27,996 | $ | 34,369 | $ | 686,638 | |||||||||||
|
|
|
|
|
|
|
|
|
|
|
|||||||||||
| Percent of total unpaid principal balance |
90.6 | % | 0.3 | % | 4.1 | % | 5.0 | % | 100.0 | % | ||||||||||
|
|
|
|
|
|
|
|
|
|
|
|||||||||||
| December 31, 2013 |
||||||||||||||||||||
| Commercial and industrial |
$ | 16,542 | $ | — | $ | 3,540 | $ | 1,509 | $ | 21,591 | ||||||||||
| Commercial real estate: |
||||||||||||||||||||
| Land and construction |
57,221 | 75 | 10,025 | 24,729 | 92,050 | |||||||||||||||
| Multi-family |
255,741 | 465 | 22,053 | 3,658 | 281,917 | |||||||||||||||
| Retail/office |
130,966 | 2,967 | 5,777 | 14,365 | 154,075 | |||||||||||||||
| Other |
135,045 | 20,696 | 11,770 | 6,802 | 174,313 | |||||||||||||||
|
|
|
|
|
|
|
|
|
|
|
|||||||||||
| $ | 595,515 | $ | 24,203 | $ | 53,165 | $ | 51,063 | $ | 723,946 | |||||||||||
|
|
|
|
|
|
|
|
|
|
|
|||||||||||
| Percent of total unpaid principal balance |
82.3 | % | 3.3 | % | 7.3 | % | 7.1 | % | 100.0 | % | ||||||||||
|
|
|
|
|
|
|
|
|
|
|
|||||||||||
F-93
Table of Contents
Residential and consumer loans are managed on a pool basis due to their homogeneous nature. Loans that are delinquent 90 days or more are considered non-accrual. The following table presents the unpaid principal balance of residential and consumer loans based on accrual status:
| June 30, 2014 | December 31, 2013 | |||||||||||||||||||||||
| Accrual(1) | Non-Accrual | Total Unpaid Principal Balance |
Accrual | Non-Accrual | Total Unpaid Principal Balance |
|||||||||||||||||||
| (In thousands) | ||||||||||||||||||||||||
| Residential |
$ | 527,283 | $ | 6,047 | $ | 533,330 | $ | 515,373 | $ | 14,404 | $ | 529,777 | ||||||||||||
| Consumer |
||||||||||||||||||||||||
| Education(2) |
118,091 | 209 | 118,300 | 129,244 | 276 | 129,520 | ||||||||||||||||||
| Other consumer |
230,083 | 1,542 | 231,625 | 235,557 | 2,754 | 238,311 | ||||||||||||||||||
|
|
|
|
|
|
|
|
|
|
|
|
|
|||||||||||||
| $ | 875,457 | $ | 7,798 | $ | 883,255 | $ | 880,174 | $ | 17,434 | $ | 897,608 | |||||||||||||
|
|
|
|
|
|
|
|
|
|
|
|
|
|||||||||||||
| (1) | Accrual residential and consumer loans includes substandard rated loans including TDR-accrual. |
| (2) | Non-accrual education loans represent the portion of these loans 90+ days past due that are not covered by a guarantee provided by government agencies that is limited to approximately 97% of the outstanding balance. |
Troubled Debt Restructurings
Modifications of loan terms in a troubled debt restructuring (“TDR”) are generally in the form of an extension of payment terms or lowering of the interest rate, although occasionally the Corporation has reduced the outstanding principal balance.
Loans modified in a troubled debt restructuring that are currently on non-accrual status will remain on non-accrual status for a period of at least six months. If after six months, or a longer period sufficient to demonstrate the willingness and ability of the borrower to perform under the modified terms, the borrower has made payments in accordance with the modified terms, the loan is returned to accrual status but retains its designation as a troubled debt restructuring. The designation as a troubled debt restructuring is removed at year end after the time in which both of the following conditions exist: (a) the restructuring agreement specifies an interest rate equal to or greater than the rate that the creditor was willing to accept at the time of restructuring for a new loan with comparable risk and (b) the loan is not impaired based on the terms specified by the restructuring agreement.
F-94
Table of Contents
The following table presents information related to loans modified in a troubled debt restructuring by class:
| Three Months Ended June 30, | ||||||||||||||||||||||||
| 2014 | 2013 | |||||||||||||||||||||||
| Troubled Debt Restructurings(1) |
Number of Modifications |
Unpaid Principal Balance (at beginning of period) |
Unpaid Principal Balance(2) (at period end) |
Number of Modifications |
Unpaid Principal Balance (at beginning of period) |
Unpaid Principal Balance(2) (at period end) |
||||||||||||||||||
| (Dollars in thousands) | ||||||||||||||||||||||||
| Residential |
5 | $ | 775 | $ | 546 | $ | — | $ | — | $ | — | |||||||||||||
| Commercial and industrial |
— | — | — | — | — | — | ||||||||||||||||||
| Land and construction |
2 | 372 | 357 | — | — | — | ||||||||||||||||||
| Multi-family |
1 | 315 | 273 | — | — | — | ||||||||||||||||||
| Retail/office |
— | — | — | 1 | 47 | 47 | ||||||||||||||||||
| Other commercial real estate |
— | — | — | 1 | 98 | 98 | ||||||||||||||||||
| Education |
— | — | — | — | — | — | ||||||||||||||||||
| Other consumer |
10 | 287 | 280 | — | — | — | ||||||||||||||||||
|
|
|
|
|
|
|
|
|
|
|
|
|
|||||||||||||
| 18 | $ | 1,749 | $ | 1,456 | 2 | $ | 145 | $ | 145 | |||||||||||||||
|
|
|
|
|
|
|
|
|
|
|
|
|
|||||||||||||
| Six Months Ended June 30, | ||||||||||||||||||||||||
| 2014 | 2013 | |||||||||||||||||||||||
| Troubled Debt Restructurings(1) |
Number of Modifications |
Unpaid Principal Balance (at beginning of period) |
Unpaid Principal Balance(2) (at period end) |
Number of Modifications |
Unpaid Principal Balance (at beginning of period) |
Unpaid Principal Balance(2) (at period end) |
||||||||||||||||||
| (Dollars in thousands) | ||||||||||||||||||||||||
| Residential |
10 | $ | 1,294 | $ | 1,284 | $ | — | $ | — | $ | — | |||||||||||||
| Commercial and industrial |
1 | 48 | 48 | — | — | — | ||||||||||||||||||
| Land and construction |
2 | 372 | 357 | 1 | 438 | 425 | ||||||||||||||||||
| Multi-family |
3 | 1,283 | 1,198 | — | — | — | ||||||||||||||||||
| Retail/office |
— | — | — | 2 | 264 | 261 | ||||||||||||||||||
| Other commercial real estate |
2 | 251 | 257 | 3 | 681 | 679 | ||||||||||||||||||
| Education |
— | — | — | — | — | — | ||||||||||||||||||
| Other consumer |
11 | 353 | 346 | — | — | — | ||||||||||||||||||
|
|
|
|
|
|
|
|
|
|
|
|
|
|||||||||||||
| 29 | $ | 3,601 | $ | 3,490 | 6 | $ | 1,383 | $ | 1,365 | |||||||||||||||
|
|
|
|
|
|
|
|
|
|
|
|
|
|||||||||||||
F-95
Table of Contents
The following tables present the unpaid principal balance of loans modified in a troubled debt restructuring by class and by type of modification:
| Three Months Ended June 30, 2014 | ||||||||||||||||||||||||
| Principal and Interest to Interest Only |
Interest Rate Reduction | Below Market Rate(4) |
||||||||||||||||||||||
| Troubled Debt Restructurings(1)(2) |
To Below Market Rate |
To
Interest Only(3) |
Other(5) | Total | ||||||||||||||||||||
| (In thousands) | ||||||||||||||||||||||||
| Residential |
$ | 176 | $ | 163 | $ | — | $ | — | $ | 207 | $ | 546 | ||||||||||||
| Commercial and industrial |
— | — | — | — | — | — | ||||||||||||||||||
| Land and construction |
— | — | — | — | 357 | 357 | ||||||||||||||||||
| Multi-family |
— | — | — | — | 273 | 273 | ||||||||||||||||||
| Retail/office |
— | — | — | — | — | — | ||||||||||||||||||
| Other commercial real estate |
— | — | — | — | — | — | ||||||||||||||||||
| Education |
— | — | — | — | — | — | ||||||||||||||||||
| Other consumer |
— | 188 | — | — | 92 | 280 | ||||||||||||||||||
|
|
|
|
|
|
|
|
|
|
|
|
|
|||||||||||||
| $ | 176 | $ | 351 | $ | — | $ | — | $ | 929 | $ | 1,456 | |||||||||||||
|
|
|
|
|
|
|
|
|
|
|
|
|
|||||||||||||
| Three Months Ended June 30, 2013 | ||||||||||||||||||||||||
| Principal and Interest to Interest Only |
Interest Rate Reduction | Below Market Rate(4) |
||||||||||||||||||||||
| Troubled Debt Restructurings(1)(2) |
To Below Market Rate |
To
Interest Only(3) |
Other(5) | Total | ||||||||||||||||||||
| (In thousands) | ||||||||||||||||||||||||
| Residential |
$ | — | $ | — | $ | — | $ | — | $ | — | $ | — | ||||||||||||
| Commercial and industrial |
— | — | — | — | — | — | ||||||||||||||||||
| Land and construction |
— | — | — | — | — | — | ||||||||||||||||||
| Multi-family |
— | — | — | — | — | — | ||||||||||||||||||
| Retail/office |
— | 47 | — | — | — | 47 | ||||||||||||||||||
| Other commercial real estate |
— | 98 | — | — | — | 98 | ||||||||||||||||||
| Education |
— | — | — | — | — | — | ||||||||||||||||||
| Other consumer |
— | — | — | — | — | — | ||||||||||||||||||
|
|
|
|
|
|
|
|
|
|
|
|
|
|||||||||||||
| $ | 0 | $ | 145 | $ | — | $ | — | $ | 0 | $ | 145 | |||||||||||||
|
|
|
|
|
|
|
|
|
|
|
|
|
|||||||||||||
| (1) | Loans modified in a TDR that were fully paid down, charged-off or foreclosed upon by period end are not reported in this table. |
| (2) | The unpaid principal balance is inclusive of all partial paydowns and charge-offs since the modification date. |
| (3) | Includes modifications of loan repayment terms from principal and interest to interest only, along with a reduction in the contractual interest rate. |
| (4) | Includes loans modified at below market rates for borrowers with similar risk profiles and having comparable loan terms and conditions. Market rates are determined by reference to internal new loan pricing grids that specify credit spreads based on loan risk rating and term to maturity. |
| (5) | Other modifications primarily include providing for the deferral of interest currently due to the new maturity date of the loan. |
F-96
Table of Contents
| Six Months Ended June 30, 2014 | ||||||||||||||||||||||||
| Principal and Interest to Interest Only |
Interest Rate Reduction | Below Market Rate (4) |
||||||||||||||||||||||
| Troubled Debt Restructurings (1)(2) |
To Below Market Rate |
To Interest Only (3) |
Other (5) | Total | ||||||||||||||||||||
| (In thousands) | ||||||||||||||||||||||||
| Residential |
$ | 176 | $ | 448 | $ | — | $ | 120 | $ | 540 | $ | 1,284 | ||||||||||||
| Commercial and industrial |
— | — | — | — | 48 | 48 | ||||||||||||||||||
| Land and construction |
— | — | — | — | 357 | 357 | ||||||||||||||||||
| Multi-family |
— | — | — | 925 | 273 | 1,198 | ||||||||||||||||||
| Retail/office |
— | — | — | — | — | — | ||||||||||||||||||
| Other commercial real estate |
— | — | — | 215 | 42 | 257 | ||||||||||||||||||
| Education |
— | — | — | — | — | — | ||||||||||||||||||
| Other consumer |
— | 254 | — | — | 92 | 346 | ||||||||||||||||||
|
|
|
|
|
|
|
|
|
|
|
|
|
|||||||||||||
| $ | 176 | $ | 702 | $ | — | $ | 1,260 | $ | 1,352 | $ | 3,490 | |||||||||||||
|
|
|
|
|
|
|
|
|
|
|
|
|
|||||||||||||
| Six Months Ended June 30, 2013 | ||||||||||||||||||||||||
| Principal and Interest to Interest Only |
Interest Rate Reduction | Below Market Rate (4) |
||||||||||||||||||||||
| Troubled Debt Restructurings (1)(2) |
To Below Market Rate |
To Interest Only (3) |
Other (5) | Total | ||||||||||||||||||||
| (In thousands) | ||||||||||||||||||||||||
| Residential |
$ | — | $ | — | $ | — | $ | — | $ | — | $ | — | ||||||||||||
| Commercial and industrial |
— | — | — | — | — | — | ||||||||||||||||||
| Land and construction |
— | — | — | 425 | — | 425 | ||||||||||||||||||
| Multi-family |
— | — | — | — | — | — | ||||||||||||||||||
| Retail/office |
— | 261 | — | — | — | 261 | ||||||||||||||||||
| Other commercial real estate |
540 | 139 | — | — | — | 679 | ||||||||||||||||||
| Education |
— | — | — | — | — | — | ||||||||||||||||||
| Other consumer |
— | — | — | — | — | — | ||||||||||||||||||
|
|
|
|
|
|
|
|
|
|
|
|
|
|||||||||||||
| $ | 540 | $ | 400 | $ | — | $ | 425.00 | $ | 0 | $ | 1,365 | |||||||||||||
|
|
|
|
|
|
|
|
|
|
|
|
|
|||||||||||||
| (1) | Loans modified in a TDR that were fully paid down, charged-off or foreclosed upon by period end are not reported in this table. |
| (2) | The unpaid principal balance is inclusive of all partial paydowns and charge-offs since the modification date. |
| (3) | Includes modifications of loan repayment terms from principal and interest to interest only, along with a reduction in the contractual interest rate. |
| (4) | Includes loans modified at below market rates for borrowers with similar risk profiles and having comparable loan terms and conditions. Market rates are determined by reference to internal new loan pricing grids that specify credit spreads based on loan risk rating and term to maturity. |
| (5) | Other modifications primarily include providing for the deferral of interest currently due to the new maturity date of the loan. |
F-97
Table of Contents
The following table presents loans modified in a troubled debt restructuring during the twelve months prior to the dates indicated, by portfolio segment, that subsequently defaulted (i.e.: 90 days or more past due following a modification) during the three and six months ended June 30, 2014 and June 30, 2013:
| Three Months Ended June 30, | Six Months Ended June 30, | |||||||||||||||||||||||||||||||
| 2014 | 2013 | 2014 | 2013 | |||||||||||||||||||||||||||||
| Troubled Debt Restructurings (1) |
Number of Modified Loans |
Unpaid Principal Balance (2) (at period end) |
Number of Modified Loans |
Unpaid Principal Balance (2) (at period end) |
Number of Modified Loans |
Unpaid Principal Balance (2) (at period end) |
Number of Modified Loans |
Unpaid Principal Balance (2) (at period end) |
||||||||||||||||||||||||
| (Dollars in thousands) | (Dollars in thousands) | |||||||||||||||||||||||||||||||
| Residential |
— | $ | — | — | $ | — | — | $ | — | — | $ | — | ||||||||||||||||||||
| Commercial and industrial |
— | — | 2 | 34 | — | — | 2 | 34 | ||||||||||||||||||||||||
| Land and construction |
— | — | 2 | 369 | — | — | 2 | 369 | ||||||||||||||||||||||||
| Multi-family |
— | — | — | — | — | — | — | — | ||||||||||||||||||||||||
| Retail/office |
— | — | 2 | 261 | — | — | 2 | 261 | ||||||||||||||||||||||||
| Other commercial real estate |
— | — | 5 | 1,029 | — | — | 5 | 1,029 | ||||||||||||||||||||||||
| Education |
— | — | — | — | — | — | — | — | ||||||||||||||||||||||||
| Other consumer |
— | — | 1 | 13 | — | — | 1 | 13 | ||||||||||||||||||||||||
|
|
|
|
|
|
|
|
|
|
|
|
|
|
|
|
|
|||||||||||||||||
| — | $ | — | 12 | $ | 1,706 | — | $ | — | 12 | $ | 1,706 | |||||||||||||||||||||
|
|
|
|
|
|
|
|
|
|
|
|
|
|
|
|
|
|||||||||||||||||
| (1) | Loans modified in a TDR that were fully paid down, charged-off or foreclosed upon by period end are not reported in this table. |
| (2) | The unpaid principal balance is inclusive of all partial paydowns and charge-offs since the modification date. |
Unfunded Commitments and Repurchase Loan Reserve
In addition to the allowance for loan losses reflected on the Consolidated Balance Sheets, a reserve is also provided for unfunded loan commitments and for the repurchase of previously sold loans. The reserve for unfunded loan commitments includes unfunded commitments to lend and commercial letters of credit. These reserves are classified in other liabilities on the Consolidated Balance Sheets. The balances of these reserves for the periods presented is as follows:
| Three months ended June 30, | Six months ended June 30, | |||||||||||||||
| 2014 | 2013 | 2014 | 2013 | |||||||||||||
| (In thousands) | ||||||||||||||||
| Reserve for unfunded commitment losses beginning balance |
$ | 4,844 | $ | 1,956 | $ | 4,664 | $ | 1,531 | ||||||||
| Provision for unfunded commitments |
600 | 1,734 | 780 | 2,159 | ||||||||||||
|
|
|
|
|
|
|
|
|
|||||||||
| Ending reserve for unfunded commitment losses |
$ | 5,444 | $ | 3,690 | $ | 5,444 | $ | 3,690 | ||||||||
|
|
|
|
|
|
|
|
|
|||||||||
| Reserve for repurchased loans beginning balance |
$ | 2,600 | $ | 2,600 | $ | 2,600 | $ | 570 | ||||||||
| Provision for repurchased loans |
(249 | ) | — | (249 | ) | 2,030 | ||||||||||
|
|
|
|
|
|
|
|
|
|||||||||
| Ending reserve for repurchased loans |
$ | 2,351 | $ | 2,600 | $ | 2,351 | $ | 2,600 | ||||||||
|
|
|
|
|
|
|
|
|
|||||||||
The amount of the allowance for unfunded loan commitments is determined using the average reserve rate by risk rating that applies to the associated funded loan category multiplied by the unfunded commitment amount
F-98
Table of Contents
multiplied by an estimated utilization factor. The reserve also covers potential loss on letters of credit outstanding for which the Bank may be unable to recover the amount outstanding. At June 30, 2014, a liability of $5.4 million was required and reflects an increase due to increased balances of outstanding commitments most of which are construction related credits. In addition, $2.4 million is a specific reserve related to one outstanding letter of credit currently in litigation.
The amount of the reserve for repurchased loans is determined using the serviced portfolio balances multiplied by historical and expected loss rates to provide for the probable losses related to sold mortgage loans. The reserve declined $249,000 during both the three and six month periods ended June 30, 2014 compared to zero and $2.0 million during the three and six months ended June 30, 2013, respectively. Total expense incurred for investor loss reimbursements including any provision recorded or reserve released was ($248,000) and ($86,000) for the three and six months ended June 30, 2014, respectively and $371,000 and $3.2 million for the three and six months ended June 30, 2013, respectively. Losses may result from the repurchase of loans or indemnification of loss incurred upon foreclosure and disposition of related collateral. The analysis of the reserve at June 30, 2014 required a liability of $2.4 million.
Pledged Loans
At June 30, 2014 and December 31, 2013, residential, multi-family, education and other consumer loans receivable with unpaid principal of approximately $724.4 million and $744.1 million were pledged to secure borrowings and for other purposes as permitted or required by law. Certain real-estate related loans are pledged as collateral for FHLB of Chicago borrowings. See Note 9.
Related Party Loans
In the ordinary course of business, the Bank has granted loans to principal officers and directors and their affiliates with outstanding balances amounting to $73,000 and $83,000 at June 30, 2014 and December 31, 2013, respectively. During the six months ended June 30, 2014, principal additions were $3,000 and principal payments totaled $13,000.
Note 6—Other Real Estate Owned
Real estate acquired by foreclosure or by deed in lieu of foreclosure as well as other repossessed assets (OREO) are held for sale and are initially recorded at fair value less a discount for estimated selling costs at the date of foreclosure. Any write down to fair value less estimated selling costs is charged to the allowance for loan losses. If the discounted fair value exceeds the net carrying value of the loans, recoveries to the allowance for loan losses are recorded to the extent of previous charge-offs, with any excess, which is infrequent, recognized as a gain in non-interest income. Subsequent to foreclosure, valuations are periodically performed and a valuation allowance is established if the carrying value exceeds the fair value less estimated selling costs. Costs relating to the development and improvement of the property may be capitalized, generally those greater than $10,000; holding period costs and subsequent changes to the valuation allowance are charged to OREO expense, net included in non-interest expense. Incremental valuation adjustments may be recognized in the Statements of Operations if, in the opinion of management, such additional losses are deemed probable.
F-99
Table of Contents
A summary of the activity in other real estate owned is as follows:
| For the Three Months Ended June 30, |
For the Six Months
Ended June 30, |
|||||||||||||||
| 2014 | 2013 | 2014 | 2013 | |||||||||||||
| (In thousands) | ||||||||||||||||
| Balance at beginning of period |
$ | 62,140 | $ | 84,342 | $ | 63,460 | $ | 90,000 | ||||||||
| Additions |
3,321 | 3,261 | 7,659 | 16,423 | ||||||||||||
| Capitalized improvements |
0 | 52 | 28 | 352 | ||||||||||||
| OREO valuation adjustments, net(1) |
(1,824 | ) | (2,368 | ) | (2,279 | ) | (11,603 | ) | ||||||||
| Sales |
(7,467 | ) | (17,046 | ) | (12,698 | ) | (26,931 | ) | ||||||||
|
|
|
|
|
|
|
|
|
|||||||||
| Balance at end of period |
$ | 56,170 | $ | 68,241 | $ | 56,170 | $ | 68,241 | ||||||||
|
|
|
|
|
|
|
|
|
|||||||||
| (1) | Includes adjustments to the OREO reserve for probable losses and property writedowns. |
The balances at end of period above are net of a valuation allowance of $24.5 million at June 30, 2014 and $35.4 million at June 30, 2013, recognized during the holding period for declines in fair value subsequent to foreclosure or acceptance of deed in lieu of foreclosure. A summary of activity in the OREO valuation allowance is as follows:
| For the Three Months Ended June 30 |
For the Six Months
Ended June 30 |
|||||||||||||||
| 2014 | 2013 | 2014 | 2013 | |||||||||||||
| (In thousands) | ||||||||||||||||
| Balance at beginning of period |
$ | 29,653 | $ | 36,009 | $ | 30,842 | $ | 31,128 | ||||||||
| Valuation adjustments(1) |
1,824 | 2,368 | 2,279 | 11,603 | ||||||||||||
| Sales |
(6,962 | ) | (2,929 | ) | (8,606 | ) | (7,283 | ) | ||||||||
|
|
|
|
|
|
|
|
|
|||||||||
| Balance at end of period |
$ | 24,515 | $ | 35,448 | $ | 24,515 | $ | 35,448 | ||||||||
|
|
|
|
|
|
|
|
|
|||||||||
| (1) | Includes adjustments to the OREO reserve for probable losses and property writedowns. |
Net OREO expense consisted of the following components:
| Three Months Ended June 30 | Six Months Ended June 30 | |||||||||||||||
| 2014 | 2013 | 2014 | 2013 | |||||||||||||
| (In thousands) | ||||||||||||||||
| Valuation adjustments |
$ | 1,824 | $ | 2,368 | $ | 2,279 | $ | 11,603 | ||||||||
| Foreclosure cost expense |
187 | 557 | 331 | 1,067 | ||||||||||||
| Expenses from operations, net |
256 | 1,364 | 842 | 3,878 | ||||||||||||
|
|
|
|
|
|
|
|
|
|||||||||
| OREO expense, net |
$ | 2,267 | $ | 4,289 | $ | 3,452 | $ | 16,548 | ||||||||
|
|
|
|
|
|
|
|
|
|||||||||
Note 7—Mortgage Servicing Rights
Mortgage servicing rights (MSRs) are recorded when loans are sold to third parties with servicing of those loans retained. In addition, MSRs are recorded when acquiring or assuming an obligation to service a financial (loan) asset that does not relate to an asset that is owned. Servicing assets are initially measured at fair value determined using a discounted cash flow model based on market assumptions at the time of origination. Subsequently, the MSR asset is carried at the lower of amortized cost or fair value. MSRs are assessed for impairment using a discounted cash flow model provided by a third party that is based on current market assumptions at the end of each reporting period. For purposes of measuring impairment, the servicing rights are stratified into relatively homogeneous pools based on characteristics such as product type and interest rate bands. Impairment is recognized, if necessary, at the pool level rather than for each individual servicing right asset.
F-100
Table of Contents
Accounting for MSRs is based on the amortization method. Under this method, servicing assets are amortized in proportion to and over the period of net servicing income. Income generated as the result of the capitalization of new servicing assets is reported as net gain on sale of loans and the amortization of servicing assets is reported as a reduction to loan servicing income in the Consolidated Statements of Operations. Ancillary income is recorded in other non-interest income.
Information regarding the Corporation’s mortgage servicing rights is as follows:
| Three Months Ended June 30 | Six Months Ended June 30 | |||||||||||||||
| 2014 | 2013 | 2014 | 2013 | |||||||||||||
| (In thousands) | ||||||||||||||||
| Balance at beginning of period |
$ | 22,341 | $ | 24,235 | $ | 23,041 | $ | 24,348 | ||||||||
| Additions |
353 | 1,383 | 599 | 3,036 | ||||||||||||
| Amortization |
(922 | ) | (1,747 | ) | (1,868 | ) | (3,513 | ) | ||||||||
|
|
|
|
|
|
|
|
|
|||||||||
| Balance at end of period—before valuation allowance |
21,772 | 23,871 | 21,772 | 23,871 | ||||||||||||
| Valuation allowance |
(843 | ) | (1,153 | ) | (843 | ) | (1,153 | ) | ||||||||
|
|
|
|
|
|
|
|
|
|||||||||
| Balance at end of period |
$ | 20,929 | $ | 22,718 | $ | 20,929 | $ | 22,718 | ||||||||
|
|
|
|
|
|
|
|
|
|||||||||
| As of June 30, | ||||||||
| 2014 | 2013 | |||||||
| Fair value at the end of the period |
$ | 21,588 | $ | 23,372 | ||||
| Key assumptions: |
||||||||
| Weighted average discount rate |
11.98 | % | 12.17 | % | ||||
| Weighted average prepayment speed |
8.63 | % | 9.08 | % | ||||
The projections of amortization expense for mortgage servicing rights set forth below are based on asset balances as of June 30, 2014 and an assumed amortization rate of 20% per year. Future amortization expense may be significantly different depending upon changes in the mortgage servicing portfolio, mortgage interest rates and market conditions.
| MSR Amortization |
||||
| (In thousands) | ||||
| Six months ended June 30, 2014 |
$ | 1,868 | ||
|
|
|
|||
| Estimate for the year ended December 31, |
||||
| 2014 |
$ | 2,177 | ||
| 2015 |
3,919 | |||
| 2016 |
3,135 | |||
| 2017 |
2,508 | |||
| 2018 |
2,007 | |||
| Thereafter |
8,026 | |||
|
|
|
|||
| Total |
21,772 | |||
|
|
|
|||
The unpaid principal balance of mortgage loans serviced for others is not included in the Consolidated Balance Sheets. The unpaid principal of mortgage loans serviced for others was approximately $2.59 billion at June 30, 2014 and $2.71 billion at December 31, 2013.
Loans intended to be sold are originated in accordance with specific criteria established by the investor agencies—these are known as “conforming loans”. During the sale of these loans, certain representations and
F-101
Table of Contents
warranties are made that the loans conform to these previously established underwriting standards. In the event that any of these representations and warranties or standards are found to be out of compliance, the Corporation may be responsible for repurchasing the loan at the unpaid principal balance or indemnifying the buyer against loss related to that loan.
Note 8—Deposits
Deposits are summarized as follows:
| June 30, 2014 | December 31, 2013 | |||||||||||||||
| Carrying Amount |
Weighted Average Rate |
Carrying Amount |
Weighted Average Rate |
|||||||||||||
| (Dollars in thousands) | ||||||||||||||||
| Non-interest-bearing checking |
$ | 276,829 | — | % | $ | 259,926 | — | % | ||||||||
| Interest-bearing checking |
286,268 | 0.05 | 301,956 | 0.07 | ||||||||||||
|
|
|
|
|
|||||||||||||
| Total checking accounts |
563,097 | 0.03 | 561,882 | 0.04 | ||||||||||||
| Money market accounts |
461,114 | 0.19 | 468,461 | 0.19 | ||||||||||||
| Regular savings |
316,196 | 0.10 | 293,159 | 0.10 | ||||||||||||
| Advance payments by borrowers for taxes and insurance |
40,008 | 0.19 | 822 | 0.21 | ||||||||||||
| Certificates of deposit: |
||||||||||||||||
| 0.00% to 0.99% |
405,937 | 0.32 | 457,407 | 0.33 | ||||||||||||
| 1.00% to 1.99% |
71,293 | 1.27 | 67,762 | 1.28 | ||||||||||||
| 2.00% to 2.99% |
15,595 | 2.37 | 16,116 | 2.37 | ||||||||||||
| 3.00% to 3.99% |
— | — | 7,310 | 3.59 | ||||||||||||
| 4.00% and above |
— | — | 2,374 | 4.24 | ||||||||||||
|
|
|
|
|
|||||||||||||
| Total certificates of deposit |
492,825 | 0.52 | 550,969 | 0.57 | ||||||||||||
|
|
|
|
|
|||||||||||||
| Total deposits |
$ | 1,873,240 | 0.21 | % | $ | 1,875,293 | 0.24 | % | ||||||||
|
|
|
|
|
|||||||||||||
Annual maturities of certificates of deposit outstanding at June 30, 2014 are summarized as follows:
| Amount | ||||
| (In thousands) | ||||
| Matures During Year Ending December 31: |
||||
| 2014 |
$ | 174,569 | ||
| 2015 |
196,475 | |||
| 2016 |
64,571 | |||
| 2017 |
28,442 | |||
| 2018 |
21,207 | |||
| 2019 |
7,561 | |||
|
|
|
|||
| Total |
$ | 492,825 | ||
|
|
|
|||
At June 30, 2014 and December 31, 2013, certificates of deposit with balances greater than or equal to $100,000 totaled $78.2 million and $88.7 million, respectively.
The Bank has entered into agreements with certain brokers that will provide deposits obtained from their customers at specified interest rates for an identified fee, or so called “brokered deposits.” The Bank had no brokered deposits at June 30, 2014 and December 31, 2013. There were no out of network certificates of deposit at June 30, 2014 and December 31, 2013. These deposits, which are not considered brokered deposits, are opened via internet listing services and are kept within FDIC insured balance limits.
F-102
Table of Contents
Note 9—Other Borrowed Funds
Other borrowed funds consist of the following:
| June 30, 2014 | December 31, 2013 | |||||||||||||||||
| Matures During Year Ending December 31, |
Amount | Weighted Average Rate |
Amount | Weighted Average Rate |
||||||||||||||
| (Dollars in thousands) | ||||||||||||||||||
| FHLB advances |
2018 | $ | 10,000 | 2.33 | % | $ | 10,000 | 2.33 | % | |||||||||
| Repurchase agreements |
3,540 | 0.10 | 2,636 | 0.10 | ||||||||||||||
| Long term lease obligation |
241 | 2.46 | 241 | 2.46 | ||||||||||||||
|
|
|
|
|
|||||||||||||||
| $ | 13,781 | 1.76 | % | $ | 12,877 | 1.88 | % | |||||||||||
|
|
|
|
|
|||||||||||||||
FHLB of Chicago Advances
The Bank pledges certain loans that meet underwriting criteria established by the Federal Home Loan Bank of Chicago (“FHLB of Chicago”) as collateral for outstanding advances. The unpaid principal balance of loans pledged to secure FHLB of Chicago borrowings totaled $644.5 million and $659.4 million at June 30, 2014 and December 31, 2013, respectively. The FHLB of Chicago borrowings are also collateralized by mortgage-related securities totaling $110.2 million and $122.2 million at June 30, 2014 and December 31, 2013, respectively. At June 30, 2014, there were no FHLB of Chicago borrowings with call features that may be exercised by the FHLB of Chicago.
Credit Agreement
On September 27, 2013, pursuant to the Plan of Reorganization, we satisfied all of our obligations under the Credit Agreement through a cash payment to the Lenders of $49.0 million (plus expense reimbursement as contemplated by the Credit Agreement) and the Credit Agreement was terminated.
Note 10—Regulatory Capital
The Bank is subject to various regulatory capital requirements administered by the federal banking agencies. Failure to meet minimum capital requirements can initiate certain mandatory, and possibly additional discretionary actions by bank regulators that, if undertaken, could have a direct material effect on the Bank’s financial statements. Under capital adequacy guidelines and the regulatory framework for prompt corrective action, the Bank must meet specific capital guidelines that involve quantitative measures of the Bank’s assets, liabilities and certain off-balance-sheet items as calculated under regulatory accounting practices. The Bank’s capital amounts and classification are also subject to qualitative judgments by the regulators about components, risk weightings, and other factors.
Qualitative measures established by regulation to ensure capital adequacy require the Bank to maintain minimum amounts and ratios of tier 1 leverage, tier 1 risk-based and total risk-based capital. Under standard regulatory guidelines, a bank must have a total risk-based capital ratio of 8% or greater to be considered “adequately capitalized.”
F-103
Table of Contents
The following table summarizes the Bank’s capital ratios to be considered adequately or well capitalized under standard regulatory guidelines:
| Minimum Required | ||||||||||||||||||||||||
| Actual | To be Adequately Capitalized |
To be Well Capitalized |
||||||||||||||||||||||
| Capital | Ratio | Capital | Ratio | Capital | Ratio | |||||||||||||||||||
| (Dollars in thousands) | ||||||||||||||||||||||||
| June 30, 2014 |
||||||||||||||||||||||||
| Tier 1 leverage (1) |
$ | 206,272 | 9.75 | % | $ | 84,658 | 4.00 | % | $ | 105,823 | 5.00 | % | ||||||||||||
| Tier 1 risk-based capital (2) |
206,272 | 16.12 | 51,194 | 4.00 | 76,792 | 6.00 | ||||||||||||||||||
| Total risk-based capital (3) |
222,747 | 17.40 | 102,389 | 8.00 | 127,986 | 10.00 | ||||||||||||||||||
| December 31, 2013 |
||||||||||||||||||||||||
| Tier 1 leverage (1) |
$ | 201,995 | 9.60 | % | $ | 84,170 | 4.00 | % | $ | 105,212 | 5.00 | % | ||||||||||||
| Tier 1 risk-based capital (2) |
201,995 | 15.77 | 51,226 | 4.00 | 76,839 | 6.00 | ||||||||||||||||||
| Total risk-based capital (3) |
218,668 | 17.07 | 102,452 | 8.00 | 128,065 | 10.00 | ||||||||||||||||||
| (1) | Tier 1 capital divided by adjusted total assets. |
| (2) | Tier 1 capital divided by total risk-weighted assets. |
| (3) | Total risk-based capital divided by total risk-weighted assets. |
The following table presents the components of the Bank’s regulatory capital:
| June 30, 2014 |
December 31, 2013 |
|||||||
| (In thousands) | ||||||||
| Stockholders’ equity of the Bank |
$ | 205,922 | $ | 196,469 | ||||
| Less: Disallowed servicing assets |
(1,500 | ) | (1,096 | ) | ||||
| Accumulated other comprehensive loss |
1,850 | 6,622 | ||||||
|
|
|
|
|
|||||
| Tier 1 capital |
206,272 | 201,995 | ||||||
| Plus: Allowable allowance for loan losses |
16,475 | 16,673 | ||||||
|
|
|
|
|
|||||
| Total risk-based capital |
$ | 222,747 | $ | 218,668 | ||||
|
|
|
|
|
|||||
The Bank may not declare or pay a cash dividend if such declaration and payment would violate regulatory requirements.
Note 11—Offsetting Assets and Liabilities
ASC 210-20-50—Disclosures of Offsetting Assets and Liabilities, requires entities to provide disclosures of both gross information and net information about instruments and transactions eligible for offset in the statement of financial position and instruments and transactions subject to an agreement similar to a master netting arrangement.
The objective of this disclosure is to facilitate comparison between those entities that prepare their financial statements on the basis of GAAP and those entities that prepare their financial statements on the basis of International Financial Reporting Standards (IFRS).
Offsetting, otherwise known as netting, takes place when entities present their rights and obligations to each other as a net amount in their statement of financial condition. The Company has certain assets and liabilities on the Consolidated Balance Sheets which could be subject to the right of setoff and related arrangements associated with financial instruments and derivatives. Derivative instruments reported are used as part of a risk management strategy to address exposure to changes in interest rates inherent in the Company’s origination and sale of certain residential mortgages into the secondary market, as presented in Note 13—Derivative Financial Instruments. A repurchase agreement is a transaction that involves the “sale” of financial assets by one party to another, subject to an agreement by the “seller” to repurchase the assets at a specified date or in specified circumstances.
F-104
Table of Contents
The following table reflects the gross and net amounts of such assets and liabilities:
| As of June 30, 2014 |
Gross Amounts of Recognized Assets or Liabilities |
Gross Amounts Offset in the Consolidated Balance Sheets |
Net Amount of Assets Presented in the Consolidated Balance Sheets |
|||||||||
| Assets |
||||||||||||
| Interest rate commitments |
$ | 179 | $ | — | $ | 179 | ||||||
| Forward sale contracts |
23 | (23 | ) | — | ||||||||
| Liabilities |
||||||||||||
| Interest rate commitments |
9 | — | 9 | |||||||||
| Forward sale contracts |
130 | (23 | ) | 107 | ||||||||
| Repurchase Agreements |
3,540 | — | 3,540 | |||||||||
| As of December 31, 2013 |
||||||||||||
| Assets |
||||||||||||
| Interest rate commitments |
$ | 40 | $ | — | $ | 40 | ||||||
| Forward sale contracts |
33 | (1 | ) | 32 | ||||||||
| Liabilities |
||||||||||||
| Interest rate commitments |
16 | — | 16 | |||||||||
| Forward sale contracts |
1 | (1 | ) | — | ||||||||
| Repurchase Agreements |
2,636 | — | 2,636 | |||||||||
Note 12—Commitments and Contingent Liabilities
The Corporation is a party to financial instruments with off-balance-sheet risk in the normal course of business to meet the financing needs of its customers. These financial instruments include commitments to extend credit and financial guarantees which involve, to varying degrees, elements of credit and interest rate risk in excess of the amount recognized in the Consolidated Balance Sheets. The contract amounts of those instruments reflect the extent of involvement and exposure to credit loss the Corporation has in particular classes of financial instruments. The same credit policies are used in making commitments and conditional obligations as for on-balance-sheet instruments.
Financial instruments whose contract amounts represent credit risk are as follows:
| June 30, 2014 | December 31, 2013 | |||||||
| (In thousands) | ||||||||
| Commitments to extend credit |
$ | 82,532 | $ | 26,054 | ||||
| Unused commitments |
786 | 657 | ||||||
| Unused lines of credit: |
||||||||
| Home equity |
113,941 | 109,414 | ||||||
| Credit cards |
22,711 | 22,751 | ||||||
| Commercial |
104,052 | 54,840 | ||||||
| Letters of credit |
17,857 | 17,131 | ||||||
| Credit enhancement under the Federal Home Loan Bank of Chicago Mortgage Partnership Finance Program |
15,877 | 15,877 | ||||||
Commitments to extend credit are in the form of a loan in the near future. Unused lines of credit are agreements to lend to a customer as long as there is no violation of any condition established in the contract and may be drawn upon at the borrowers’ discretion. Letters of credit commit the Corporation to make payments on behalf of customers when certain specified future events occur. Commitments and letters of credit primarily have fixed
F-105
Table of Contents
expiration dates or other termination clauses and may require payment of a fee. As some such commitments expire without being drawn upon, the total commitment amounts do not necessarily represent future cash requirements. The Corporation evaluates each customer’s creditworthiness on a case-by-case basis. With the exception of credit card lines of credit, the Corporation primarily extends credit on a secured basis. Collateral obtained consists primarily of single-family residences and income-producing commercial properties.
At June 30, 2014, the Corporation has $5.4 million of reserves on unfunded commitments, unused lines of credit, letters of credit and $2.4 million of reserves for repurchase of sold loans classified in other liabilities. The Corporation intends to fund commitments through current liquidity.
The Corporation previously participated in the Mortgage Partnership Finance Program of the FHLB of Chicago (“MPF Program”). Pursuant to the credit enhancement feature of the MPF Program, the Corporation retained a secondary credit loss exposure in the amount of $15.9 million at June 30, 2014 related to approximately $191.9 million of residential mortgage loans that the Corporation has originated and is still outstanding as agent for the FHLB of Chicago. Under the credit enhancement, the FHLB of Chicago is liable for losses on loans up to one percent of the original delivered loan balances in each pool up to the point the credit enhancement is reset. After the credit enhancement resets, the FHLB of Chicago loss contingency could be reduced depending upon losses experienced and loan balances. The Corporation is then liable for losses over and above the FHLB of Chicago first loss position up to a contractually agreed-upon maximum amount in each pool that was delivered to the Program. The Corporation receives a monthly fee for this credit enhancement obligation based on the outstanding loan balances. The monthly fee received is net of losses under the MPF Program. The MPF Program was discontinued in 2008 in its present format and the Corporation no longer funds loans through the MPF Program.
Other loans sold to investors with recourse to the Corporation met the underwriting standards of the investor and the Corporation at the time of origination. In the event of default by the borrower, the investor may resell the loans to the Corporation at par value. As the Corporation expects relatively few such loans to become delinquent, the total amount of loans sold with recourse does not necessarily represent future cash requirements. Collateral obtained on such loans consists primarily of single-family residences. The unpaid principal balance of loans repurchased from investors totaled $469,000 and $648,000 for the three and six months ended June 30, 2014 and $228,000 for each of the three and six month periods ended June 30, 2013. Alternatively, investors make requests to be made whole on a loan whereby the property has been disposed of at a loss. The related expense excluding the reserves for repurchased loans was $1,000 and $163,000 for the three and six months ended June 30, 2014 and $371,000 and $1.2 million for the three and six months ended June 30, 2013.
In the ordinary course of business, there are legal proceedings against the Corporation and its subsidiaries. Management considers that the aggregate liabilities, if any, resulting from such actions would not have a material, adverse effect on the consolidated financial position of the Corporation.
We are a defendant in a pending lawsuit captioned Village of Kronenwetter v. AnchorBank, fsb, Marathon County, Wisconsin, Case No. 11-CV-1370, which is an action brought by the Village of Kronenwetter on November 14, 2011 to enforce and collect on a $4.4 million letter of credit issued by the Bank in support of the development of a mixed use TIF development in the Village of Kronenwetter, Wisconsin. The complaint alleges that the Bank wrongfully refused to honor a full draw on the letter of credit and that the developer failed to notify the plaintiff of the renewal of the letter of credit or to renew the letter of credit within the time limitations set forth in the development agreement. A specific reserve for loss on unfunded loan commitments was established at June 30, 2013 in the amount of $2.4 million due to a shortfall in the value of the residential real estate development supporting the letter of credit, $1.7 million of which was recorded during the quarter ended June 30, 2013. The specific reserve balance at June 30, 2014 remained at $2.4 million.
We are the plaintiff/counterclaim defendant in a pending lawsuit captioned AnchorBank, fsb v. Henriette McLean et al., Dane County, Wisconsin, Case No. 13-CV-811. The Bank is seeking to enforce personal guarantees executed by McLean related to amounts borrowed by Mineral Point Road Holdings, LLC (“MPRH”). At the time
F-106
Table of Contents
of the commencement of the lawsuit, March 7, 2013, McLean owed the Bank $363,302 under the guarantees. As a result of the recent sale of real estate owned by MPRH, the amount of the debt is now $300,127. The Bank has the right to obtain its attorneys’ fees incurred in collecting on the guarantees if it prevails in the lawsuit. On January 27, 2014, McLean filed a 196-paragraph Counterclaim against the Bank. McLean alleges various misconduct by the Bank related to its loans to MPRH and the procurement of her guarantees. Most of the counterclaims are based upon alleged misrepresentations and/or misrepresentations by omission. McLean is seeking the return of the $182,629 she paid to the Bank in 2012 under her guarantees, treble damages, and punitive damages. McLean has also filed a third-party complaint seeking contribution/indemnity from Joseph Gallina (the managing member of MPRH) and various entities controlled by Gallina.
Note 13—Derivative Financial Instruments
The Corporation enters into contracts that meet the definition of derivative financial instruments in accordance with ASC 815—Derivative and Hedging. Derivatives are used as part of a risk management strategy to address exposure to changes in interest rates inherent in the Corporation’s origination and sale of certain residential mortgages into the secondary market. These derivative contracts used for risk management purposes include: (1) interest rate lock commitments provided to customers to fund mortgage loans intended to be sold; and (2) forward sale contracts for the future delivery of funded residential mortgages.
Forward sale contracts are entered into when interest rate lock commitments are granted to customers in an effort to economically hedge the effect of future changes in interest rates on the commitments to fund mortgage loans intended to be sold (the “pipeline”), as well as on the portfolio of funded mortgages not yet sold (the “warehouse”). For accounting purposes, these derivatives are not designated as being in a hedging relationship. The contracts are carried at fair value on the Consolidated Balance Sheets, with changes in fair value recorded in the Consolidated Statements of Operations.
Derivative financial instruments are summarized as follows:
| June 30, 2014 | December 31, 2013 | |||||||||||||||||
| Balance Sheet Location |
Notional Amount |
Estimated Fair Value |
Notional Amount |
Estimated Fair Value |
||||||||||||||
| (In thousands) | ||||||||||||||||||
| Derivative assets: |
||||||||||||||||||
| Interest rate lock commitments(1) |
Other assets | $ | 16,142 | $ | 164 | $ | 3,863 | $ | 37 | |||||||||
| Unused commitments(2) |
Other assets | 786 | 15 | 369 | 3 | |||||||||||||
| Forward contracts to sell mortgage loans(3) |
Other assets | 8,000 | 23 | 8,000 | 33 | |||||||||||||
| Derivative liabilities: |
||||||||||||||||||
| Interest rate lock commitments(1) |
Other liabilities | 3,901 | 9 | 2,172 | 12 | |||||||||||||
| Unused commitments(2) |
Other liabilities | — | — | 288 | 4 | |||||||||||||
| Forward contracts to sell mortgage loans(3) |
Other assets | 16,000 | 130 | 1,000 | 1 | |||||||||||||
| (1) | Interest rate lock commitments include $8.8 million and $1.5 million of commitments not yet approved in the credit underwriting process at June 30, 2014 and December 31, 2013, respectively, yet represent potential interest rate risk exposure to the extent of those mortgage loan applications eventually approved for funding. |
| (2) | The Corporation recognizes fair value of unused commitments held for trading which consists of closed residential real estate loans in recission at period end. |
| (3) | The Corporation has elected to offset the fair value of individual forward sale contracts and present a net amount on the Consolidated Balance Sheets in accordance with ASC 815-45, Derivatives and Hedging. |
F-107
Table of Contents
Net gains (losses) included in the Consolidated Statements of Operations related to derivative financial instruments, recognized in net gain on sale of loans, are summarized as follows:
| Three Months Ended June 30, | Six Months Ended June 30, | |||||||||||||||
| 2014 | 2013 | 2014 | 2013 | |||||||||||||
| (In thousands) | ||||||||||||||||
| Interest rate lock commitments |
$ | 36 | $ | (1,123 | ) | $ | 156 | $ | (1,564 | ) | ||||||
| Unused commitments |
$ | 15 | $ | (226 | ) | $ | (11 | ) | $ | (226 | ) | |||||
| Forward contracts to sell mortgage loans |
(304 | ) | 2,529 | (330 | ) | 2,396 | ||||||||||
|
|
|
|
|
|
|
|
|
|||||||||
| Total |
$ | (253 | ) | $ | 1,180 | $ | (185 | ) | $ | 606 | ||||||
|
|
|
|
|
|
|
|
|
|||||||||
Note 14—Fair Value of Financial Instruments
ASC Topic 820 establishes a framework for measuring fair value and disclosures about fair value measurements. Fair value is defined as the price that would be received to sell an asset or paid to transfer a liability in an orderly transaction between market participants at the measurement date.
In determining fair value, various valuation methods are used including market, income and cost approaches. Assumptions that market participants would use in pricing the asset or liability are utilized in these valuation methods, including assumptions about risk and the risks inherent in the inputs to the valuation technique. These inputs may be readily observable, market corroborated or generally unobservable inputs. Valuation methodologies are employed that maximize the use of observable inputs and minimize the use of unobservable inputs. Based on observability of the inputs used in the valuation methodologies, financial assets and liabilities measured at fair value on a recurring and nonrecurring basis are categorized according to the fair value hierarchy. The fair value hierarchy ranks the quality and reliability of the information used to determine fair values. Financial assets and liabilities that are adjusted to fair value are classified in one of the following three categories:
| • | Level 1: Quoted prices (unadjusted) for identical assets or liabilities in active markets that the entity has the ability to access as of the measurement date. |
| • | Level 2: Significant other observable inputs other than Level 1 prices such as quoted prices for similar assets or liabilities; quoted prices in markets that are not active; or other inputs that are observable or can be corroborated by observable market data. |
| • | Level 3: Significant unobservable inputs that reflect a reporting entity’s own assumptions about the assumptions that market participants would use in pricing an asset or liability. |
F-108
Table of Contents
Fair Value on a Recurring Basis
The table below presents the financial instruments carried at fair value by the valuation hierarchy (as described above):
| Level 1 | Level 2 | Level 3 | Total | |||||||||||||
| (In Thousands) | ||||||||||||||||
| June 30, 2014 |
||||||||||||||||
| Financial assets |
||||||||||||||||
| Investment securities available for sale: |
||||||||||||||||
| U.S. government sponsored and federal agency obligations |
$ | — | $ | 3,328 | $ | — | $ | 3,328 | ||||||||
| Corporate stock and bonds |
6 | — | — | 6 | ||||||||||||
| Non-agency CMOs |
— | — | 5,856 | 5,856 | ||||||||||||
| Government sponsored agency mortgage-backed securities |
— | 84,131 | — | 84,131 | ||||||||||||
| GNMA mortgage-backed securities |
— | 201,969 | — | 201,969 | ||||||||||||
| Loans held for sale |
— | 5,261 | — | 5,261 | ||||||||||||
| Other assets: |
||||||||||||||||
| Interest rate lock commitments |
— | 164 | — | 164 | ||||||||||||
| Unused commitments |
— | 15 | — | 15 | ||||||||||||
| Forward contracts to sell mortgage loans |
— | 23 | — | 23 | ||||||||||||
|
|
|
|
|
|
|
|
|
|||||||||
| Total |
$ | 6 | $ | 294,891 | $ | 5,856 | $ | 300,753 | ||||||||
|
|
|
|
|
|
|
|
|
|||||||||
| Financial liabilities |
||||||||||||||||
| Other liabilities: |
||||||||||||||||
| Interest rate lock commitments |
$ | — | $ | 9 | $ | — | $ | 9 | ||||||||
| Unused commitments |
— | — | — | — | ||||||||||||
| Forward contracts to sell mortgage loans |
— | 130 | — | 130 | ||||||||||||
|
|
|
|
|
|
|
|
|
|||||||||
| Total |
$ | — | $ | 139 | $ | — | $ | 139 | ||||||||
|
|
|
|
|
|
|
|
|
|||||||||
F-109
Table of Contents
| Level 1 | Level 2 | Level 3 | Total | |||||||||||||
| (In Thousands) | ||||||||||||||||
| December 31, 2013 |
||||||||||||||||
| Financial assets |
||||||||||||||||
| Investment securities available for sale: |
||||||||||||||||
| U.S. government sponsored and federal agency obligations |
$ | — | $ | 3,376 | $ | — | $ | 3,376 | ||||||||
| Corporate stock and bonds |
355 | — | — | 355 | ||||||||||||
| Non-agency CMOs |
— | — | 6,208 | 6,208 | ||||||||||||
| Government sponsored agency mortgage-backed securities |
— | 50,158 | — | 50,158 | ||||||||||||
| GNMA mortgage-backed securities |
— | 217,775 | — | 217,775 | ||||||||||||
| Loans held for sale(1) |
— | 3,085 | — | 3,085 | ||||||||||||
| Other assets: |
||||||||||||||||
| Interest rate lock commitments |
— | 37 | — | 37 | ||||||||||||
| Unused commitments |
— | 3 | — | 3 | ||||||||||||
| Forward contracts to sell mortgage loans |
— | 33 | — | 33 | ||||||||||||
|
|
|
|
|
|
|
|
|
|||||||||
| Total |
$ | 355 | $ | 274,467 | $ | 6,208 | $ | 281,030 | ||||||||
|
|
|
|
|
|
|
|
|
|||||||||
| Financial liabilities |
||||||||||||||||
| Other liabilities: |
||||||||||||||||
| Interest rate lock commitments |
$ | — | $ | 12 | $ | — | $ | 12 | ||||||||
| Unused commitments |
— | 4 | — | 4 | ||||||||||||
| Forward contracts to sell mortgage loans |
— | 1 | — | 1 | ||||||||||||
|
|
|
|
|
|
|
|
|
|||||||||
| Total |
$ | — | $ | 17 | $ | — | $ | 17 | ||||||||
|
|
|
|
|
|
|
|
|
|||||||||
An independent service is used to price available-for-sale U.S. government sponsored and federal agency obligations, government sponsored agency mortgage-backed securities, and GNMA mortgage-backed securities using a market data model under Level 2. The significant inputs used to price GNMA mortgage-backed securities are as follows:
| June 30, 2014 | Weighted Average |
December 31, 2013 | Weighted Average |
|||||||||||||||||||||
| From | To | From | To | |||||||||||||||||||||
| Coupon rate |
1.6 | % | 4.6 | % | 2.4 | % | 1.6 | % | 4.6 | % | 2.4 | % | ||||||||||||
| Duration (in years) |
1.0 | 6.4 | 3.9 | 1.1 | 5.7 | 3.6 | ||||||||||||||||||
| PSA prepayment speed |
147 | 374 | 214 | 128 | 458 | 346 | ||||||||||||||||||
The Corporation had 99.1% of its non-agency CMOs valued by an independent pricing service that used a discounted cash flow model that incorporates inputs considered Level 3 by the accounting guidance.
| June 30, 2014 | Weighted Average |
December 31, 2013 | Weighted Average |
|||||||||||||||||||||
| From | To | From | To | |||||||||||||||||||||
| Observable inputs: |
||||||||||||||||||||||||
| 30 to 59 day delinquency rate |
2.0 | % | 4.9 | % | 3.1 | % | 1.6 | % | 5.8 | % | 4.0 | % | ||||||||||||
| 60 to 89 day delinquency rate |
0.3 | 2.1 | 1.2 | 0.8 | 2.5 | 1.9 | ||||||||||||||||||
| 90 plus day delinquency rate |
3.9 | 8.1 | 6.1 | 4.6 | 9.9 | 6.5 | ||||||||||||||||||
| Loss severity |
52.6 | 64.0 | 57.9 | 52.0 | 68.5 | 57.1 | ||||||||||||||||||
| Coupon rate |
5.0 | 6.0 | 5.5 | 5.0 | 6.0 | 5.5 | ||||||||||||||||||
| Current credit support |
— | 3.9 | — | — | 4.3 | — | ||||||||||||||||||
| Unobservable inputs: |
||||||||||||||||||||||||
| Month 1 to month 24 constant default rate |
5.6 | 12.2 | 8.5 | 5.3 | 11.6 | 8.2 | ||||||||||||||||||
| Discount rate |
4.0 | 6.5 | 6.1 | 4.0 | 7.0 | 6.6 | ||||||||||||||||||
F-110
Table of Contents
Other assets and other liabilities include interest rate lock commitments provided to customers to fund mortgage loans intended to be sold and forward sale contracts for future delivery of funded residential mortgages to investors. The Corporation relies on an internal valuation model to estimate the fair value of its interest rate lock commitments, which includes applying an estimated pull-through rate (the percentage of commitments expected to result in a closed loan) based on historical experience; multiplied by quoted investor prices on closed loans for future delivery determined to be reasonably applicable to the loan commitment based on interest rate, terms and rate lock expiration.
The Corporation also relies on an internal valuation model to estimate the fair value of its forward contracts to sell residential mortgage loans (i.e., an estimate of what the Corporation would receive or pay to terminate the forward delivery contract) based on market prices for similar financial instruments, which includes matching specific terms and maturities of the forward commitments against applicable investor pricing available.
The following is a reconciliation of assets measured at fair value on a recurring basis using significant unobservable inputs (level 3):
| Three Months Ended June 30, | Six Months Ended June 30, | |||||||||||||||
| 2014 | 2013 | 2014 | 2013 | |||||||||||||
| (In thousands) | ||||||||||||||||
| Non-agency CMOs |
||||||||||||||||
| Beginning balance |
$ | 6,041 | $ | 7,549 | $ | 6,208 | $ | 14,158 | ||||||||
| Total realized/unrealized gains (losses): |
||||||||||||||||
| Included in earnings |
— | 1 | — | (198 | ) | |||||||||||
| Included in other comprehensive income |
76 | 114 | 132 | 972 | ||||||||||||
| Included in earnings as unrealized other-than-temporary impairment |
(12 | ) | — | (33 | ) | (83 | ) | |||||||||
| Included in earnings upon payoff of securities for which other-than-temporary impairment was previously recognized |
— | — | — | — | ||||||||||||
| Included in earnings as realized other-than-temporary impairment |
49 | 68 | 112 | 241 | ||||||||||||
| Principal repayments |
(298 | ) | (551 | ) | (563 | ) | (1,489 | ) | ||||||||
| Sales |
— | — | (6,420 | ) | ||||||||||||
|
|
|
|
|
|
|
|
|
|||||||||
| Ending balance |
$ | 5,856 | $ | 7,181 | $ | 5,856 | $ | 7,181 | ||||||||
|
|
|
|
|
|
|
|
|
|||||||||
There were no transfers in or out of Levels 1, 2 or 3 during the three and six months ended June 30, 2014 or 2013. The Corporation’s policy for determining transfers between levels occurs at the end of the reporting period when circumstances in the underlying valuation criteria changes and result in transfers between levels.
Fair Value on a Nonrecurring Basis
Certain assets are measured at fair value on a nonrecurring basis; that is, the instruments are not measured at fair value on an ongoing basis but are subject to fair value adjustments in certain circumstances (for example, when there is evidence of impairment). Loans held for sale and mortgage servicing rights includes only those items that were adjusted to fair value as of the dates indicated.
F-111
Table of Contents
The following table presents such assets carried on the Consolidated Balance Sheets by caption and by level within the fair value hierarchy:
| Level 1 | Level 2 | Level 3 | Total | |||||||||||||
| (In thousands) | ||||||||||||||||
| June 30, 2014 |
||||||||||||||||
| Impaired loans, with an allowance recorded, net |
$ | — | $ | — | $ | 10,626 | $ | 10,626 | ||||||||
| Mortgage servicing rights |
— | — | 7,766 | 7,766 | ||||||||||||
| Other real estate owned |
— | — | 56,170 | 56,170 | ||||||||||||
|
|
|
|
|
|
|
|
|
|||||||||
| Total assets at fair value |
$ | — | $ | — | $ | 74,562 | $ | 74,562 | ||||||||
|
|
|
|
|
|
|
|
|
|||||||||
| December 31, 2013 |
||||||||||||||||
| Impaired loans, with an allowance recorded, net |
$ | — | $ | — | $ | 44,046 | $ | 44,046 | ||||||||
| Mortgage servicing rights |
— | — | 6,448 | 6,448 | ||||||||||||
| Other real estate owned |
— | — | 63,460 | 63,460 | ||||||||||||
|
|
|
|
|
|
|
|
|
|||||||||
| Total assets at fair value |
$ | — | $ | — | $ | 113,954 | $ | 113,954 | ||||||||
|
|
|
|
|
|
|
|
|
|||||||||
The significant inputs for those assets measured at fair value on a nonrecurring basis are as follows:
| June 30, 2014 | ||||
| Method |
Inputs | |||
| Impaired loans, with an allowance recorded, net | Appraised Values | External appraised values-adjustments made to values due to management factors including age of appraisal, age of comparables, known changes in the market and in the collateral and selling and commission cost of 15% to 35%. | ||
| Mortgage servicing rights | Discounted Cash Flow | Weighted average prepayment speed 8.63%; weighted average discount rate 11.98%. | ||
| Other real estate owned | Appraised Values | External appraised values less selling and commission cost of 15% to 35%. | ||
The Corporation does not adjust loans held for investment to fair value on a recurring basis. However, some loans are considered impaired and an allowance for loan losses is established. The specific reserves for collateral dependent impaired loans are based on the fair value of the underlying collateral less estimated costs to sell. The fair value of collateral is usually determined based on appraisals. In some cases, adjustments are made to appraised values due to various factors including age of the appraisal, age of comparables included in the appraisal, and known changes in the market and in the collateral. Since adjustments to appraised values are based on unobservable inputs, the resulting fair value measurement is categorized as a Level 3 measurement.
Mortgage servicing rights (MSR) are recorded as an asset when loans are sold to third parties with servicing rights retained. Mortgage servicing rights are initially recorded at fair value and subsequently amortized in proportion to, and over the period of, estimated net servicing revenues. The carrying value of these assets is reviewed for impairment on a monthly basis using a lower of carrying value or fair value methodology. The fair value of servicing rights is determined by estimating the present value of future net cash flows using a discounted cash flow model, taking into consideration market loan prepayment speeds, discount rates, servicing costs and other economic factors. For purposes of measuring impairment, the rights are stratified based on predominant risk characteristics of the underlying loans which include product type (i.e., fixed, adjustable or balloon) and interest rate bands. If the aggregate carrying value of the capitalized mortgage servicing rights for a stratum exceeds its fair value, the difference is recognized in non-interest expense as an impairment loss.
F-112
Table of Contents
Critical assumptions used in the MSR discounted cash flow model include mortgage prepayment speeds, discount rates, costs to service, ancillary and late fee income. Variations in the assumptions could materially affect the estimated fair values. Changes to the assumptions are made when market data indicate that new trends have developed. Current market participant assumptions based on loan product types—fixed rate, adjustable rate and balloon loans—include discount rates in the range of 11.5% to 25.0% as well as portfolio weighted average prepayment speeds of 2.9% to 59.9% annual CPR. Many of these assumptions are subjective and involve a high degree of management judgment. MSR valuation assumptions are reviewed and approved by management on a quarterly basis.
Prepayment speeds may be affected by economic factors such as changes in home prices, market interest rates, the availability of other credit products to borrowers and customer payment patterns. Prepayment speeds include the impact of all borrower prepayments, including full payoffs, additional principal payments and the impact of loans paid off due to foreclosure liquidations. As market interest rates decline, prepayment speeds will generally increase as customers refinance existing mortgages to more favorable interest rate terms. As prepayment speeds increase, anticipated cash flows will generally decline resulting in a potential reduction, or impairment, of the fair value of the capitalized MSRs. Alternatively, an increase in market interest rates may cause a decrease in prepayment speeds and therefore an increase in fair value of MSRs. Annually, external data is obtained to test the values and assumptions that are used for the initial valuations in the discounted cash flow model.
Real estate acquired by foreclosure, real estate acquired by deed in lieu of foreclosure and other repossessed assets (OREO) are held for sale and are initially recorded at fair value less estimated selling expenses at the date of foreclosure. OREO is re-measured at the lower of cost or fair value after initial recognition and reported using a valuation allowance on foreclosed assets. Fair value is generally based on third party appraisals subject to discounting and is therefore considered a Level 3 measurement.
Fair Value Summary
ASC Topic 825 requires disclosure of fair value information about financial instruments, for which it is practicable to estimate that value, whether or not recognized in the Consolidated Balance Sheets, including those financial assets and liabilities that are not measured and reported at fair value on a recurring or nonrecurring basis. In cases where quoted market prices are not available, fair values are based on estimates using present value or other valuation techniques. Results from these techniques are significantly affected by the assumptions used, including the discount rate and estimates of future cash flows. In that regard, the derived fair value estimates cannot be substantiated by comparison to independent markets and, in many cases, may not be realized in immediate settlement of the instruments. Certain financial instruments with a fair value that is not practicable to estimate and all non-financial instruments are excluded from the disclosure requirements. Accordingly, the aggregate fair value amounts presented in the table below do not necessarily represent the underlying value of the Corporation.
The following methods and assumptions were used in estimating the fair value of financial instruments that were not previously disclosed:
Cash and cash equivalents and accrued interest: The carrying amounts reported in the balance sheets approximate the fair values for those assets and liabilities. In accordance with ASC Topic 820, cash and cash equivalents and accrued interest have been categorized as a Level 2 fair value measurement.
Loans held for investment: The fair value of residential mortgage loans held for investment, commercial real estate loans, commercial and industrial loans, and consumer and other loans held for investment are estimated using observable inputs including estimated cash flows, and discount rates based on interest rates currently being offered for loans with similar terms, to borrowers of similar credit quality. In accordance with ASC Topic 820, loans held for investment that are not included with impaired loans in the preceding section titled Fair Value on a Nonrecurring Basis have been categorized as a Level 2 fair value measurement.
F-113
Table of Contents
Federal Home Loan Bank stock: The carrying amount of FHLB stock approximates its fair value as it can only be redeemed with the FHLB at par value. In accordance with ASC Topic 820, Federal Home Loan Bank stock has been categorized as a Level 2 fair value measurement.
Deposits: The fair value of checking, savings and money market accounts are estimated using a discounted cash flow analysis, with run-off rates based on published bank regulatory decay rate tables. The fair values of fixed-rate certificates of deposit are estimated using a discounted cash flow calculation that applies current interest rates being offered on certificates of deposit to a schedule of aggregated expected monthly maturities of the outstanding certificates of deposit. In accordance with ASC Topic 820, deposits have been categorized as a Level 2 fair value measurement.
Other borrowed funds: The fair value of FHLB advances and repurchase agreements are estimated using discounted cash flow analysis, based on the Corporation’s current incremental borrowing rates for similar types of borrowing arrangements. In accordance with ASC Topic 820, other borrowed funds have been categorized as a Level 2 fair value measurement.
Off-balance-sheet instruments: The fair value of off-balance-sheet instruments (held for investment lending commitments and unused lines of credit) are based on fees currently charged to enter into similar agreements, taking into account the remaining terms of the agreements, the counterparties’ credit standing and discounted cash flow analyses. The fair value of these off-balance-sheet items approximates the recorded amounts of the related fees and is not material at June 30, 2014 and December 31, 2013.
The carrying amount and fair value of the Corporation’s financial instruments consist of the following:
| June 30, 2014 | December 31, 2013 | |||||||||||||||
| Carrying Amount |
Fair Value |
Carrying Amount |
Fair Value |
|||||||||||||
| (In thousands) | ||||||||||||||||
| Financial assets: |
||||||||||||||||
| Cash and cash equivalents |
$ | 177,347 | $ | 177,347 | $ | 143,396 | $ | 143,396 | ||||||||
| Investment securities available for sale |
295,290 | 295,290 | 277,872 | 277,872 | ||||||||||||
| Loans held for sale |
5,261 | 5,261 | 3,085 | 3,085 | ||||||||||||
| Loans held for investment |
1,506,963 | 1,463,279 | 1,544,324 | 1,488,677 | ||||||||||||
| Mortgage servicing rights |
20,929 | 21,588 | 22,294 | 23,553 | ||||||||||||
| Federal Home Loan Bank stock |
11,940 | 11,940 | 11,940 | 11,940 | ||||||||||||
| Accrued interest receivable |
7,640 | 7,640 | 8,216 | 8,216 | ||||||||||||
| Interest rate lock commitments |
164 | 164 | 37 | 37 | ||||||||||||
| Unused commitments |
15 | 15 | 3 | 3 | ||||||||||||
| Forward contracts to sell mortgage loans(1) |
23 | 23 | 33 | 33 | ||||||||||||
| Financial liabilities: |
||||||||||||||||
| Non-maturity deposits |
1,380,415 | 1,380,415 | 1,324,324 | 1,324,324 | ||||||||||||
| Deposits with stated maturities |
492,825 | 492,263 | 550,969 | 549,668 | ||||||||||||
| Other borrowed funds |
13,781 | 14,076 | 12,877 | 13,121 | ||||||||||||
| Accrued interest payable—borrowings |
19 | 19 | 22 | 22 | ||||||||||||
| Accrued interest payable—deposits |
374 | 374 | 393 | 393 | ||||||||||||
| Interest rate lock commitments |
9 | 9 | 12 | 12 | ||||||||||||
| Unused commitments |
— | — | 4 | 4 | ||||||||||||
| Forward contracts to sell mortgage loans(1) |
130 | 130 | 1 | 1 | ||||||||||||
Note 15—Income Taxes
The Corporation accounts for income taxes based on the asset and liability method. Deferred tax assets and liabilities are recorded based on the difference between the tax basis of assets and liabilities and their carrying
F-114
Table of Contents
amounts for financial reporting purposes, computed using enacted tax rates. Significant net deferred tax assets have been created for net operating loss (NOL) carryforwards and deductible temporary differences, the largest of which relates to our allowance for loan losses. For income tax purposes, only net charge-offs on uncollectible loans are deductible, not the provision for credit losses.
Under generally accepted accounting principles, a valuation allowance is required to be recognized if it is “more likely than not” that a deferred tax asset will not be realized. The determination of the realizability of the deferred tax assets is highly subjective and dependent upon management’s evaluation and judgment of both positive and negative evidence, the forecasts of future income, applicable tax planning strategies, and assessments of the current and future economic and business conditions. The Corporation considers both positive and negative evidence regarding the ultimate realizability of deferred tax assets. Positive evidence includes the existence of taxes paid in available carry back years as well as the probability that taxable income will be generated in future periods while negative evidence includes significant cumulative losses in the past several years as well as general business and economic trends.
At June 30, 2014 and December 31, 2013, the Corporation determined that a valuation allowance relating to the deferred tax asset was necessary. This determination was based largely on the negative evidence represented by the losses in the prior fiscal years caused by the significant loss provisions associated with the loan portfolio. Therefore, a valuation allowance of $116.1 million and $119.8 million at June 30, 2014 and December 31, 2013, respectively, was recorded to offset net deferred tax assets.
The significant components of deferred tax assets (liabilities) are as follows:
| June 30, 2014 |
December 31, 2013 |
|||||||
| (In thousands) | ||||||||
| Deferred tax assets: |
||||||||
| Allowance for loan losses |
$ | 19,728 | $ | 27,193 | ||||
| OREO valuation allowance and other loss reserves |
13,598 | 15,026 | ||||||
| Federal NOL carryforwards |
72,312 | 66,359 | ||||||
| State NOL carryforwards |
16,793 | 15,710 | ||||||
| Unrealized securities losses, net |
742 | 2,657 | ||||||
| Other |
2,670 | 3,154 | ||||||
|
|
|
|
|
|||||
| Total deferred tax assets |
125,843 | 130,099 | ||||||
| Valuation allowance |
(116,071 | ) | (119,780 | ) | ||||
|
|
|
|
|
|||||
| Adjusted deferred tax assets |
9,772 | 10,319 | ||||||
| Deferred tax liabilities: |
||||||||
| FHLB stock dividends |
(833 | ) | (833 | ) | ||||
| Mortgage servicing rights |
(8,397 | ) | (8,944 | ) | ||||
| Other |
(542 | ) | (542 | ) | ||||
|
|
|
|
|
|||||
| Total deferred tax liabilities |
(9,772 | ) | (10,319 | ) | ||||
|
|
|
|
|
|||||
| Net deferred tax assets |
$ | — | $ | — | ||||
|
|
|
|
|
|||||
The Corporation is subject to U.S. federal income tax as well as income tax of various state jurisdictions. The tax years 2010-2013 remain open to examination by the Internal Revenue Service and certain state jurisdictions while the years 2009-2013 remain open to examination by certain other state jurisdictions.
The Corporation recognizes any interest and penalties related to uncertain tax positions in income tax expense. As of June 30, 2014 and December 31, 2013, the Corporation has not recognized any accrued interest and penalties related to uncertain tax positions.
F-115
Table of Contents
Note 16—Earnings Per Share
Basic earnings per share for the three and six months ended June 30, 2014 and 2013 have been determined by dividing net income (loss) available to common equity for the respective periods by the weighted average number of shares of common stock outstanding. Diluted earnings per share is computed by dividing net loss available to common equity by the weighted average number of common shares outstanding plus the effect of dilutive securities. The effects of dilutive securities are computed using the treasury stock method.
The computation of earnings per share is as follows:
| Three Months Ended June 30, | Six Months Ended June 30, | |||||||||||||||
| 2014 | 2013 | 2014 | 2013 | |||||||||||||
| (In thousands, except per share data) | ||||||||||||||||
| Numerator: |
||||||||||||||||
| Numerator for basic and diluted earnings per share—income (loss) available to common stockholders |
$ | 2,607 | $ | (8,945 | ) | $ | 4,537 | $ | (26,470 | ) | ||||||
| Denominator: |
||||||||||||||||
| Denominator for basic earnings per share—weighted average shares |
9,050 | 21,247 | 9,050 | 21,247 | ||||||||||||
| Effect of dilutive securities: |
||||||||||||||||
| Employee stock options |
— | — | — | — | ||||||||||||
|
|
|
|
|
|
|
|
|
|||||||||
| Denominator for diluted earnings per share—weighted average shares |
9,050 | 21,247 | 9,050 | 21,247 | ||||||||||||
|
|
|
|
|
|
|
|
|
|||||||||
| Basic earnings (loss) per common share |
$ | 0.29 | $ | (0.42 | ) | $ | 0.50 | $ | (1.25 | ) | ||||||
| Diluted earnings (loss) per common share |
$ | 0.29 | $ | (0.42 | ) | $ | 0.50 | $ | (1.25 | ) | ||||||
F-116
Table of Contents
Anchor BanCorp Wisconsin Inc.
Shares of Common Stock
Prospectus
2014
| SANDLER O’NEILL + PARTNERS, L.P. | Baird |
Until , 2014 (the 25th day after the date of this prospectus), all dealers that buy, sell or trade shares of our common stock, whether or not participating in this offering, may be required to deliver a prospectus. This delivery requirement is in addition to the dealers’ obligations to deliver a prospectus when acting as underwriter and with respect to their unsold allotments or subscriptions.
Table of Contents
PART II—INFORMATION NOT REQUIRED IN PROSPECTUS
| Item 13. | Other Expenses of Issuance and Distribution. |
The following table sets forth the costs and expenses, other than the underwriting discounts, payable in connection with the sale of common stock being registered. All amounts shown are estimates, except the Securities and Exchange Commission registration fee, and the Financial Industry Regulatory Authority filing fee.
| Securities and Exchange Commission registration fee |
$ | 1,288.00 | ||
| Financial Industry Regulatory Authority filing fee |
2,000.00 | |||
| Legal fees and expenses |
* | |||
| Accountants’ fees and expenses |
* | |||
| Printing expenses |
* | |||
| Transfer agent and registrar fees and expenses |
* | |||
| Blue Sky fees and expenses |
* | |||
| Miscellaneous |
* | |||
| NASDAQ Global Market Listing fee |
* | |||
| Total |
* |
| * | To be provided by amendment. |
| Item 14. | Indemnification of Officers and Directors. |
We are incorporated under the laws of the state of Delaware. Section 145 of the Delaware General Corporation Law provides that a Delaware corporation may indemnify any persons who are, or are threatened to be made, parties to any threatened, pending or completed action, suit or proceeding, whether civil, criminal, administrative or investigative (other than an action by or in the right of such corporation), by reason of the fact that such person was an officer, director, employee or agent of such corporation, or is or was serving at the request of such person as an officer, director, employee or agent of another corporation or enterprise. The indemnity may include expenses (including attorneys’ fees), judgments, fines and amounts paid in settlement actually and reasonably incurred by such person in connection with such action, suit or proceeding, provided that such person acted in good faith and in a manner he or she reasonably believed to be in or not opposed to the corporation’s best interests and, with respect to any criminal action or proceeding, had no reasonable cause to believe that his or her conduct was illegal. A Delaware corporation may indemnify any persons who are, or are threatened to be made, a party to any threatened, pending or completed action or suit by or in the right of the corporation by reason of the fact that such person was a director, officer, employee or agent of such corporation, or is or was serving at the request of such corporation as a director, officer, employee or agent of another corporation or enterprise. The indemnity may include expenses (including attorneys’ fees) actually and reasonably incurred by such person in connection with the defense or settlement of such action or suit provided such person acted in good faith and in a manner he or she reasonably believed to be in or not opposed to the corporation’s best interests except that no indemnification is permitted without judicial approval if the officer or director is adjudged to be liable to the corporation. Where an officer or director is successful on the merits or otherwise in the defense of any action referred to above, the corporation must indemnify him or her against the expenses which such officer or director has actually and reasonably incurred. The Amended Charter and the Amended Bylaws provide for the indemnification of our directors and officers to the fullest extent permitted under the Delaware General Corporation Law.
Section 102(b)(7) of the Delaware General Corporation Law permits a corporation to provide in its certificate of incorporation that a director of the corporation shall not be personally liable to the corporation or its stockholders for monetary damages for breach of fiduciary duties as a director, except for liability for any:
| • | any breach of the director’s duty of loyalty to us or our stockholders; |
| • | any act or omission not in good faith or that involves intentional misconduct or a knowing violation of law; |
II-1
Table of Contents
| • | any act related to unlawful stock repurchases, redemptions or other distributions or payment of dividends; or |
| • | any transaction from which the director derived an improper personal benefit. |
These limitations of liability do not affect the availability of equitable remedies such as injunctive relief or rescission. Our amended and restated certificate of incorporation also authorizes us to indemnify our officers, directors and other agents to the fullest extent permitted under Delaware law.
As permitted by Section 145 of the Delaware General Corporation Law, the Amended Bylaws provide that:
| • | we may indemnify our directors, officers and employees to the fullest extent permitted by the Delaware General Corporation Law, subject to limited exceptions; |
| • | we may advance expenses to our directors, officers and employees in connection with a legal proceeding to the fullest extent permitted by the Delaware General Corporation Law, subject to limited exceptions; and |
| • | the rights provided in our amended and restated bylaws are not exclusive. |
Section 174 of the Delaware General Corporation Law provides, among other things, that a director, who willfully or negligently approves of an unlawful payment of dividends or an unlawful stock purchase or redemption, may be held liable for such actions. A director who was either absent when the unlawful actions were approved, or dissented at the time, may avoid liability by causing his or her dissent to such actions to be entered in the books containing minutes of the meetings of the board of directors at the time such action occurred or immediately after such absent director receives notice of the unlawful acts.
As permitted by the Delaware General Corporation Law, we have entered and expect to continue to enter into agreements to indemnify our directors, executive officers and other employees as determined by the Board. Under the terms of our indemnification agreements, we are required to indemnify each of our directors and officers, to the fullest extent permitted by the laws of the state of Delaware, if the basis of the indemnitee’s involvement was by reason of the fact that the indemnitee is or was a director, or officer, of the Company or any of its subsidiaries or was serving at the Company’s request in an official capacity for another entity. We must indemnify our officers and directors against (1) attorneys’ fees and (2) all other costs of any type or nature whatsoever, including any and all expenses and obligations paid or incurred in connection with investigating, defending, being a witness in, participating in (including on appeal), or preparing to defend, be a witness or participate in any completed, actual, pending or threatened action, suit, claim or proceeding, whether civil, criminal, administrative or investigative, or establishing or enforcing a right to indemnification under the indemnification agreement. The indemnification agreements also set forth certain procedures that will apply in the event of a claim for indemnification thereunder.
In addition, we have purchased a policy of directors’ and officers’ liability insurance that insures our directors and officers against the cost of defense, settlement or payment of a judgment in some circumstances. These indemnification provisions and the indemnification agreements may be sufficiently broad to permit indemnification of our officers and directors for liabilities, including reimbursement of expenses incurred, arising under the Securities Act.
The form of underwriting agreement, to be attached as Exhibit 1.1 hereto, provides for indemnification by the underwriters and our officers who sign this Registration Statement and directors for specified liabilities, including matters arising under the Securities Act.
In addition, the Amended Charter provides that we must indemnify our directors and officers to the fullest extent authorized by law. We are also expressly required to advance certain expenses to our directors and officers and carry directors’ and officers’ insurance providing indemnification for our directors and officers for some liabilities. We believe that these indemnification provisions and the directors’ and officers’ insurance are useful to attract and retain qualified directors and executive officers.
II-2
Table of Contents
| Item 15. | Recent Sales of Unregistered Securities. |
Private Placements
In connection with the Plan of Reorganization, we entered into the Investor SPAs on August 12, 2013 with the Investors for the purchase and sale of 1,750,000,000 shares of our common stock (adjusted to 8,750,000 shares on October 2, 2013 as a result of a Reverse Stock Split) at a purchase price of $0.10 per share (implying a $20.00 per share price after giving effect to the Reverse Stock Split). At the closing of the Private Placements on September 27, 2013, we received gross proceeds of $175.0 million. In connection with the Private Placements, transaction costs of $14.4 million were incurred and have been recorded in the Statement of Changes in Stockholders’ Equity (Deficit). $8.9 million of this amount was paid to Sandler O’Neill & Partners, L.P. for services rendered relating to the Private Placements.
The Investors were certain of our officers and directors and institutional investors. We believe each transaction was exempt from the registration requirements of the Securities Act in reliance upon Section 4(a)(2) of the Securities Act or Regulation D promulgated under the Securities Act. Furthermore, we affixed appropriate legends to the share certificates and instruments issued in each foregoing transaction setting forth that the securities had not been registered and the applicable restrictions on transfer.
TARP Exchange
On January 30, 2009, pursuant to the Treasury’s Capital Purchase Program, we issued and sold to the Treasury the TARP Preferred Stock and TARP Warrant. Pursuant to the Plan of Reorganization, we, on the Effective Date and immediately following the consummation of the Private Placements, consummated the TARP Exchange. After the effectiveness of the Plan of Reorganization, the Treasury sold their shares of our common stock in the Secondary Treasury Sales for aggregate consideration of $6,000,000.
We believe the transaction was exempt from the registration requirements of the Securities Act in reliance upon Section 1145 of the Bankruptcy Code.
Cancellation of Legacy Common Stock
On the Effective Date, immediately following the consummation of the TARP Exchange pursuant to the terms of the Plan of Reorganization, all 21,247,225 shares of issued and outstanding Legacy Common Stock, including shares held as treasury stock and in any stock incentive plans, were cancelled for no consideration. In connection with the cancellation of the Legacy Common Stock, the Rights Agreement, dated as of November 5, 2010, by and between the Company and American Stock Transfer & Trust Company, LLC was terminated on the Effective Date in accordance with its terms.
Debt Issuance
In connection with the Plan of Reorganization, on August 12, 2013, we entered into a notes purchase agreement with certain institutional investors in connection with the offer and sale by us of up to $30.0 million aggregate principal amount of unsecured notes at an offering price of 100% of the face amount (the “Debt Issuance”). The Debt Issuance was never consummated and we paid the potential investors an aggregate fee of $2.6 million, or 1% of the total committed aggregate principal amount, to terminate the notes purchase agreement. We believe the offering was exempt from the registration requirements of the Securities Act in reliance upon Section 4(a)(2) of the Securities Act or Regulation D promulgated under the Securities Act.
| Item 16. | Exhibits and Financial Statement Schedules. |
(a) Exhibits. See the Index to Exhibits attached to this registration statement, which is incorporated by reference herein.
(b) Financial Statement Schedules. Schedules not listed above have been omitted because the information required to be set forth therein is not applicable or is shown in the financial statements or the notes thereto.
II-3
Table of Contents
| Item 17. | Undertakings. |
The undersigned registrant hereby undertakes to provide to the underwriters at the closing specified in the underwriting agreements, certificates in such denominations and registered in such names as required by the underwriter to permit prompt delivery to each purchaser.
Insofar as indemnification for liabilities arising under the Securities Act may be permitted to directors, officers and controlling persons of the registrant pursuant to the foregoing provisions or otherwise, the registrant has been advised that in the opinion of the Securities and Exchange Commission such indemnification is against public policy as expressed in the Securities Act and is, therefore, unenforceable. In the event that a claim for indemnification against such liabilities (other than the payment by the registrant of expenses incurred or paid by a director, officer or controlling person of the registrant in the successful defense of any action, suit or proceeding) is asserted by such director, officer or controlling person in connection with the securities being registered, the registrant will, unless in the opinion of its counsel the matter has been settled by controlling precedent, submit to a court of appropriate jurisdiction the question whether such indemnification by it is against public policy as expressed in the Act and will be governed by the final adjudication of such issue.
The undersigned registrant hereby undertakes that:
| (1) | for purposes of determining any liability under the Securities Act, the information omitted from the form of prospectus filed as part of this registration statement in reliance upon Rule 430A and contained in a form of prospectus filed by the registrant pursuant to Rule 424(b)(1) or (4) or 497(h) under the Securities Act of 1933 shall be deemed to be part of this registration statement as of the time it was declared effective; and |
| (2) | for the purpose of determining any liability under the Securities Act, each post-effective amendment that contains a form of prospectus shall be deemed to be a new registration statement relating to the securities offered therein, and the offering of such securities at that time shall be deemed to be the initial bona fide offering thereof. registration statement or made in any such document immediately prior to such date of first use. |
II-4
Table of Contents
SIGNATURES
Pursuant to the requirements of the Securities Act, the registrant has duly caused this registration statement to be signed on its behalf by the undersigned, thereunto duly authorized.
| ANCHOR BANCORP WISCONSIN INC. | ||||
| By: | /s/ Chris M. Bauer | |||
| Name: | Chris M. Bauer | |||
| Title: | President and Chief Executive Officer | |||
| Date: | September 8, 2014 | |||
In accordance with the requirements of the Securities Act, this registration statement was signed by the following persons in the capacities and on the dates stated.
| By: | /s/ Chris M. Bauer |
By: | * | |||||
| Chris M. Bauer President and Chief Executive Officer, Director (principal executive officer) Date: September 8, 2014 |
Thomas G. Dolan Executive Vice President, Chief Operating Officer Date: September 8, 2014 | |||||||
| By: | * |
By: | * | |||||
| Richard A. Bergstrom Director Date: September 8, 2014 |
Bradley E. Cooper Director Date: September 8, 2014 | |||||||
| By: | * |
By: | * | |||||
| David L. Omachinski Director Date: September 8, 2014 |
Pat Richter Director Date: September 8, 2014 | |||||||
| By: | * |
By: | * | |||||
| Martin S. Friedman Director Date: September 8, 2014 |
Holly Cremer Berkenstadt Director Date: September 8, 2014 | |||||||
| *By: |
/s/ Chris M. Bauer |
|||||||
| Chris M. Bauer Attorney-in-fact |
||||||||
II-5
Table of Contents
KNOW ALL PERSONS BY THESE PRESENTS, that each person whose signature appears below constitutes and appoints Chris M. Bauer, as his or her true and lawful attorney-in-fact and agent with full power of substitution and resubstitution, for him and in her name, place and stead, in any and all capacities, to sign any or all amendments (including post-effective amendments) to this Registration Statement on Form S-1 of Anchor BanCorp Wisconsin Inc., and to file the same, with all exhibits thereto, and other documents in connection therewith, with the Securities and Exchange Commission, grant unto said attorney-in-fact and agent, full power and authority to do and perform each and every act and thing requisite and necessary to be done in and about the foregoing, as fully to all intents and purposes as he might or could do in person, hereby ratifying and confirming all that said attorney-in-fact and agent, or her substitutes, may lawfully do or cause to be done by virtue hereof.
| By: | /s/ William T. James | |
| William T. James Senior Vice President, Chief Financial Officer and Treasurer (principal financial and accounting officer) Date: September 8, 2014 | ||
| *By: |
/s/ Chris M. Bauer | |
| Chris M. Bauer Attorney-in-fact | ||
II-6
Table of Contents
INDEX TO EXHIBITS
| Exhibit |
Description | |
| 1.1* | Form of Underwriting Agreement. | |
| 2.1 | Confirmation Order, dated August 30, 2013 (incorporated by reference to Exhibit 3.1 of the Registrant’s Form 8-K filed on September 6, 2013). | |
| 3.1 | Amended and Restated Certificate of Incorporation of Anchor BanCorp Wisconsin Inc. (incorporated by reference to Exhibits 3.1 of the Registrant’s Forms 8-K filed on September 27, 2013 and November 29, 2013). | |
| 3.2 | Amended and Restated Bylaws of Anchor BanCorp Wisconsin Inc. (Effective September 25, 2013) (incorporated by reference to Exhibit 3.2 of the Registrant’s Form 8-K filed on September 27, 2013). | |
| 4.1* | Specimen Share Certificate. | |
| 4.2** | Form of 9.9% Investor Stock Purchase Agreement dated August 12, 2013 by and between the Company and the investors named therein. | |
| 4.3** | Form of 4.9% Investor Stock Purchase Agreement dated August 12, 2013 by and between the Company and the investors named therein. | |
| 4.4** | Form of Management Investor Stock Purchase Agreement dated August 12, 2013 by and between the Company and the investors named therein. | |
| 4.5** | Form of Secondary Sale Purchaser Agreement dated September 19, 2013 by and between the Company and the investors named therein. | |
| 5.1* | Opinion of Skadden, Arps, Slate, Meagher & Flom LLP. | |
| 10.1 | Anchor BanCorp Wisconsin Inc. Retirement Plan (incorporated by reference to Exhibit 10.1 of Registrant’s Form S-1 Registration Statement filed on March 19, 1992). | |
| 10.2 | Anchor BanCorp Wisconsin Inc. Annual Incentive Bonus Plan (incorporated by reference to Exhibit 10.10 of Registrant’s Form S-1 Registration Statement filed on March 19, 1992). | |
| 10.3 | Anchor BanCorp Wisconsin Inc. Directors’ Deferred Compensation Plan (incorporated by reference to Exhibit 10.9 of Registrant’s Form S-1 Registration Statement filed on March 19, 1992). | |
| 10.4 | Order to Cease and Desist between Anchor BanCorp Wisconsin, Inc. and the Office of Thrift Supervision dated June 26, 2009 (incorporated by reference to Exhibit 10.28 of Registrant’s Annual Report on Form 10-K for the year ended March 31, 2009 filed on June 29, 2009, File No. 000-20006, Film No. 09915927). | |
| 10.5 | Stipulation and Consent to Issuance of Order to Cease and Desist between Anchor BanCorp Wisconsin, Inc. and the Office of Thrift Supervision dated June 26, 2009 (incorporated by reference to Exhibit 10.29 of Registrant’s Annual Report on Form 10-K for the year ended March 31, 2009 filed on June 29, 2009, File No. 000-20006, Film No. 09915927). | |
| 10.6 | Order to Cease and Desist between AnchorBank, fsb and the Office of Thrift Supervision dated June 26, 2009 (incorporated by reference to Exhibit 10.30 of Registrant’s Annual Report on Form 10-K for the year ended March 31, 2009 filed on June 29, 2009, File No. 000-20006, Film No. 09915927). | |
| 10.7 | Stipulation and Consent to Issuance of Order to Cease and Desist between AnchorBank, fsb and the Office of Thrift Supervision dated June 26, 2009 (incorporated by reference to Exhibit 10.31 of Registrant’s Annual Report on Form 10-K for the year ended March 31, 2009 filed on June 29, 2009, File No. 000-20006, Film No. 09915927). | |
II-7
Table of Contents
| Exhibit |
Description | |
| 10.8 | Prompt Corrective Action Directive between AnchorBank, fsb and the Office of Thrift Supervision (incorporated by reference to Exhibit 99.1 of Registrant’s Current Report on Form 8-K filed September 8, 2010, File No. 000-20006, Film No. 101061856). | |
| 10.9 | Employment Agreement between the Bank and Chris M. Bauer effective September 5, 2014. | |
| 10.10 | Key Executive Employment and Severance Agreement between the Bank and Thomas Dolan effective September 5, 2014. | |
| 10.11 | Key Executive Employment and Severance Agreement between the Bank and Martha M. Hayes effective September 5, 2014. | |
| 10.12 | Key Executive Employment and Severance Agreement between the Bank and William T. James effective September 5, 2014. | |
| 10.13 | Key Executive Employment and Severance Agreement between the Bank and Scott M. McBrair effective September 5, 2014. | |
| 10.14 | Key Executive Employment and Severance Agreement between the Bank and Mark D. Timmerman effective September 5, 2014. | |
| 10.15 | Anchor Bancorp Wisconsin Incentive Plan (incorporated by reference to Exhibit 99.1 of Registrant’s Current Report on Form 8-K filed August 14, 2014, File No. 001-34955). | |
| 21.1** | List of Subsidiaries. | |
| 23.1 | Consent of McGladrey LLP. | |
| 23.2* | Consent of Skadden, Arps, Slate, Meagher & Flom LLP (included in Exhibit 5.1). | |
| 24.1** | Powers of Attorney. | |
| * | To be filed by amendment |
| ** | Previously filed. |
II-8