Attached files
| file | filename |
|---|---|
| EX-5.1 - EX-5.1 - Smart & Final Stores, Inc. | a2221270zex-5_1.htm |
| EX-10.13 - EX-10.13 - Smart & Final Stores, Inc. | a2221270zex-10_13.htm |
| EX-10.11 - EX-10.11 - Smart & Final Stores, Inc. | a2221270zex-10_11.htm |
| EX-10.15 - EX-10.15 - Smart & Final Stores, Inc. | a2221270zex-10_15.htm |
| EX-23.2 - EX-23.2 - Smart & Final Stores, Inc. | a2221270zex-23_2.htm |
| EX-3.2 - EX-3.2 - Smart & Final Stores, Inc. | a2221270zex-3_2.htm |
| EX-10.12 - EX-10.12 - Smart & Final Stores, Inc. | a2221270zex-10_12.htm |
| EX-3.1 - EX-3.1 - Smart & Final Stores, Inc. | a2221270zex-3_1.htm |
Use these links to rapidly review the document
TABLE OF CONTENTS
INDEX TO CONSOLIDATED FINANCIAL STATEMENTS
As filed with the Securities and Exchange Commission on September 8, 2014
Registration No. 333-196931
UNITED STATES
SECURITIES AND EXCHANGE COMMISSION
Washington, D.C. 20549
AMENDMENT NO. 3
TO
FORM S-1
REGISTRATION STATEMENT
UNDER
THE SECURITIES ACT OF 1933
Smart & Final Stores, Inc.
(Exact name of registrant as specified in its charter)
| Delaware (State or other jurisdiction of incorporation or organization) |
5411 (Primary Standard Industrial Classification Code Number) |
80-0862253 (I.R.S. Employer Identification Number) |
600 Citadel Dr.
Commerce, CA 90040
(323) 869-7500
(Address, including zip code, and telephone number, including area code, of registrant's principal executive offices)
David G. Hirz
President and Chief Executive Officer
Smart & Final Stores, Inc.
600 Citadel Dr.
Commerce, CA 90040
(323) 869-7500
(Name, address, including zip code, and telephone number, including area code, of agent for service)
| Copies to: | ||
Philippa M. Bond Robin M. Feiner Proskauer Rose LLP 2049 Century Park East, Suite 3200 Los Angeles, CA 90067 (310) 557-2900 (310) 557-2193 (facsimile) |
Kirk A. Davenport II Latham & Watkins LLP 885 Third Avenue New York, NY 10022 (212) 906-1200 (212) 751-4864 (facsimile) |
|
Approximate date of commencement of proposed sale to the public: As soon as practicable after the effective date of this Registration Statement.
If any of the securities being registered on this Form are to be offered on a delayed or continuous basis pursuant to Rule 415 under the Securities Act of 1933, check the following box. o
If this Form is filed to register additional securities for an offering pursuant to Rule 462(b) under the Securities Act, please check the following box and list the Securities Act registration statement number of the earlier effective registration statement for the same offering. o
If this Form is a post-effective amendment filed pursuant to Rule 462(c) under the Securities Act, check the following box and list the Securities Act registration statement number of the earlier effective registration statement for the same offering. o
If this Form is a post-effective amendment filed pursuant to Rule 462(d) under the Securities Act, check the following box and list the Securities Act registration statement number of the earlier effective registration statement for the same offering. o
Indicate by check mark whether the registrant is a large accelerated filer, an accelerated filer, a non-accelerated filer, or a smaller reporting company. See the definitions of "large accelerated filer," "accelerated filer" and "smaller reporting company" in Rule 12b-2 of the Exchange Act. (Check one):
| Large accelerated filer o | Accelerated filer o | Non-accelerated filer ý (Do not check if a smaller reporting company) |
Smaller reporting company o |
The Registrant hereby amends this Registration Statement on such date or dates as may be necessary to delay its effective date until the Registrant shall file a further amendment which specifically states that this Registration Statement shall thereafter become effective in accordance with Section 8(a) of the Securities Act of 1933 or until the Registration Statement shall become effective on such date as the Commission, acting pursuant to said Section 8(a), may determine.
The information in this preliminary prospectus is not complete and may be changed. We may not sell these securities until the registration statement filed with the Securities and Exchange Commission is effective. This preliminary prospectus is not an offer to sell these securities and it is not soliciting an offer to buy these securities in any state where the offer or sale is not permitted.
SUBJECT TO COMPLETION, DATED SEPTEMBER 8, 2014
Shares

Smart & Final Stores, Inc.
Common Stock
This is the initial public offering of shares of our common stock. Prior to this offering, there has been no public market for our common stock. We are selling shares of common stock. The initial public offering price of our common stock is expected to be between $ and $ per share. We intend to apply to list our common stock on the New York Stock Exchange under the symbol "SFS."
Investing in our common stock involves risks. See "Risk Factors" on page 15.
The underwriters have an option to purchase up to an additional shares of common stock from the selling stockholders identified in this prospectus at the initial public offering price, less the underwriting discount, within 30 days from the date of this prospectus to cover over-allotments of shares.
| |
Initial public offering price |
Underwriting discount |
Proceeds, before expenses, to us(1) |
|||||||
|---|---|---|---|---|---|---|---|---|---|---|
| Per Share | $ | $ | $ | |||||||
| Total | $ | $ | $ | |||||||
- (1)
- The underwriters will receive compensation in addition to the underwriting discount. See "Underwriting (Conflicts of Interest)."
Delivery of the shares of common stock will be made on or about , 2014.
Neither the Securities and Exchange Commission nor any state securities commission has approved or disapproved of these securities or determined if this prospectus is truthful or complete. Any representation to the contrary is a criminal offense.
| Credit Suisse | Morgan Stanley | Deutsche Bank Securities |
| Barclays | Citigroup | Piper Jaffray | Guggenheim Securities |
The date of this prospectus is , 2014


Neither we, the underwriters nor the selling stockholders identified in this prospectus have authorized anyone to provide any information or to make any representations other than those contained in this prospectus or in any free writing prospectuses we have prepared. We, the selling stockholders and the underwriters take no responsibility for, and can provide no assurance as to the reliability of, any other information that others may give you. This prospectus is an offer to sell only the shares of common stock offered hereby, but only under circumstances and in jurisdictions where it is lawful to do so. The information contained in this prospectus is current only as of its date.
Persons who come into possession of this prospectus and any such free writing prospectus in jurisdictions outside the United States are required to inform themselves about and to observe any restrictions as to this offering and the distribution of this prospectus and any such free writing prospectus applicable to that jurisdiction.
Through and including , 2014 (the 25th day after the date of this prospectus), all dealers effecting transactions in these securities, whether or not participating in this offering, may be required to deliver a prospectus. This is in addition to a dealer's obligation to deliver a prospectus when acting as an underwriter and with respect to an unsold allotment or subscription.
i
Our fiscal year is the 52- or 53-week period ending on the Sunday closest to December 31. Each of our fiscal years consists of twelve-week periods in the first, second and fourth quarters of the fiscal year and a sixteen-week period in the third quarter. Our last three completed fiscal years ended on December 29, 2013, December 30, 2012 and January 1, 2012. Our fiscal year 2012 is divided into two separate periods: the period from January 2, 2012 through November 14, 2012, representing the period prior to the Ares Acquisition (as defined below), and the period from November 15, 2012 through December 30, 2012, representing the period after the Ares Acquisition.
Smart & Final Stores, Inc. (f/k/a SF CC Holdings, Inc. and Smart & Final Holdings, Inc.) (the "Company"), the issuer of common stock in this offering, was incorporated in October 2012 and became the ultimate parent company of our business in November 2012. All of the financial information in this prospectus prior to that time represents the results of operations of our prior parent company, Smart & Final Holdings Corp.
This prospectus includes our trademarks and service marks, including Smart & Final®, Smart & Final Extra!®, Cash & Carry Smart Foodservice®, First Street®, Ambiance®, Cattleman's Finest®, Iris®, La Romanella®, Montecito®, Simply Value® and Tradewinds®, which are protected under applicable intellectual property laws and are the property of Smart & Final Stores LLC or Cash & Carry Stores LLC, as applicable. This prospectus also contains trademarks, service marks, trade names and copyrights of other companies, which are the property of their respective owners. Solely for convenience, trademarks, service marks and trade names referred to in this prospectus may appear without the ® or TM symbols. We do not intend our use or display of other parties' trademarks, service marks or trade names to imply, and such use or display should not be construed to imply, a relationship with, or endorsement or sponsorship of us by, these other parties.
MARKET, INDUSTRY AND OTHER DATA
Unless otherwise indicated, information contained in this prospectus concerning our industry and the markets in which we operate is based on information from independent industry and research organizations, other industry publications, surveys and forecasts, and management estimates. Management estimates are derived from publicly available information released by independent industry analysts and research organizations, such as Intalytics, a national customer analytics research company, and other third party sources, as well as data from our internal research, and are based on assumptions made by us upon reviewing such data and our knowledge of our industry and markets, which we believe to be reasonable. In addition, projections, assumptions and estimates of the future performance of our industry and our future performance are necessarily subject to a high degree of uncertainty and risk due to a variety of factors, including those described in "Risk Factors." These and other factors could cause our results to differ materially from those expressed in the estimates made by the independent industry analysts and other third party sources and by us.
With respect to any period, comparable store sales for such period, at both the Company and segment levels, reflect the definition we utilized during such period and include sales for stores operating both during such period and in the same period of the previous year. Sales from a store are also included in the calculation of comparable store sales for the Company or segment, as applicable, after the 60th full week of operations, and sales from a store are also included in the calculation of comparable store sales if (i) the store has been physically relocated, (ii) the selling square footage has been increased or decreased or (iii) the store has been converted to a new format within a segment
ii
(e.g., from legacy Smart & Final to Smart & Final Extra!). However, sales from an existing store are not included in the calculation of comparable store sales for the Company or segment, as applicable, if the store has been converted to a different segment (e.g., from Smart & Final to Cash & Carry).
For fiscal years prior to 2008, sales from a store were included in the calculation of comparable store sales after the 52nd full week of operations. Comparable store sales for fiscal years 1989 through 2006, as presented herein, have been derived from the financial statements of our predecessor companies which are not included in this prospectus. For fiscal years 1996 through 1998, comparable store sales, as presented herein, include sales from comparable stores that were subsequently classified as discontinued operations.
Comparable store sales growth represents the year-over-year sales comparisons for comparable stores.
To supplement our financial information presented in accordance with U.S. generally accepted accounting principles ("GAAP"), we use Adjusted EBITDA to clarify and enhance understanding of our past performance. We define Adjusted EBITDA as earnings (net income or loss) before income taxes, interest expense (net), depreciation and amortization, further adjusted to eliminate the effects of items management does not consider in assessing our ongoing performance.
This non-GAAP measure is intended to provide additional information only, and does not have any standard meaning prescribed by GAAP. Use of Adjusted EBITDA may differ from similar measures reported by other companies. Because of its limitations, Adjusted EBITDA should be considered as a measure of discretionary cash available to use to reinvest in the growth of our business, or as a measure of cash that will be available to meet our obligations. Adjusted EBITDA has limitations as an analytical tool, and you should not consider it in isolation or as a substitute for analysis of our results as reported under GAAP.
For a reconciliation of Adjusted EBITDA to net income, a GAAP measure, see "Prospectus Summary—Summary Historical and Consolidated Financial and Other Data."
iii
This summary highlights information contained elsewhere in this prospectus and does not contain all of the information that you should consider in making your investment decision. Before investing in our common stock, you should read this entire prospectus carefully, including the sections entitled "Risk Factors" and "Management's Discussion and Analysis of Financial Condition and Results of Operations" and our consolidated financial statements and related notes. Some of the statements in this summary constitute forward-looking statements. See "Special Note Regarding Forward-Looking Statements."
As used in this prospectus, unless the context otherwise requires, references to the "Company," "we," "us" and "our" refer to Smart & Final Stores, Inc. (the "Issuer") and, where appropriate, its consolidated subsidiaries.
Who We Are
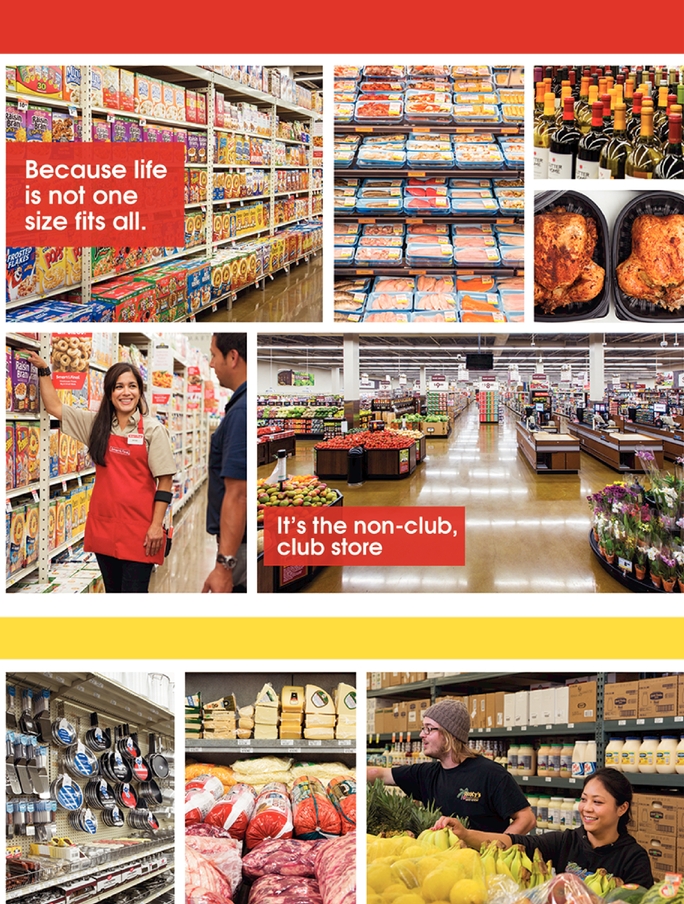
We are a high-growth, value-oriented food retailer serving a diverse demographic of household and business customers through two complementary and highly productive store banners. Our Smart & Final ("Smart & Final") stores focus on both household and business customers, and our Cash & Carry ("Cash & Carry") stores focus primarily on business customers. We operate 250 convenient, non-membership, smaller-box, warehouse-style stores throughout the Western United States, with an additional 13 stores in Northwestern Mexico in a joint venture. We have a differentiated merchandising strategy that emphasizes high quality perishables, a wide selection of private label products, products tailored to business and foodservice customers and products offered in a broad range of sizes, all at "everyday low prices." We believe our compelling value proposition has enabled us to achieve comparable store sales growth in 24 of our past 25 fiscal years.
Named after two of our founders, J.S. Smart and H.D. Final, Smart & Final represents one of the longest continuously operated food retailers in the United States and has become an iconic brand in the markets we serve. We operate 198 Smart & Final stores in California, Arizona and Nevada, which offer extensive selections of fresh perishables and everyday grocery items, together with a targeted selection of foodservice, packaging and janitorial products, under both national and private label brands. Customers can choose from a broad range of product sizes, including an assortment of standard-sized products typically found at conventional grocers, and a large selection of bulk-size offerings (including uniquely sized national brand products) more typical of larger-box warehouse clubs. Pricing in our Smart & Final stores is targeted to be substantially lower than that of conventional grocers and competitive with that of large discounters and warehouse clubs. We believe we offer higher quality produce at lower prices than large discounters. We also believe our Smart & Final stores provide a better everyday value to household and business customers than typical warehouse clubs by offering greater product selection at competitive prices, and with no membership fee requirement, in a convenient easy-to-shop format.
Five years ago, we launched a transformational initiative to convert our larger legacy Smart & Final stores to a format called Smart & Final Extra! ("Extra!"). With a larger store footprint, our Extra! format offers a one-stop shopping experience with a more expansive selection of items than our legacy Smart & Final stores and an emphasis on perishables and household items. This initiative was facilitated, in part, by our acquisition of a dedicated perishables warehouse, and has been further supported by our continued investments in distribution capabilities and in-store merchandising. Today we operate 87 Extra! stores, of which 65 represent conversions or relocations of legacy Smart & Final stores and 22 represent new store openings. Our store conversions and relocations to the Extra! format have typically resulted in significant increases in comparable store sales and gross margin. The continued development of our Extra! store format, through additional new store openings and conversions and relocations of legacy Smart & Final stores, is the cornerstone of our growth strategy.
1
We also operate 52 Cash & Carry stores focused primarily on restaurants, caterers and a wide range of other foodservice businesses such as food trucks and coffee houses. We offer customers the opportunity to shop for their everyday foodservice needs in a convenient, no-frills warehouse shopping environment. These stores are located in Washington, Oregon, Northern California, Idaho and Nevada. Pricing in our Cash & Carry stores is targeted to be substantially lower than that of our foodservice delivery competitors, with greater price transparency to customers and no minimum order size. Pricing is also competitive with typical warehouse clubs, with no membership fee requirement.
We believe that our stores are highly productive based on sales per square foot data, and that our "everyday low prices," differentiated merchandising strategy and convenient locations enable us to offer a highly differentiated food shopping experience with broad appeal to a diverse customer demographic. These attributes have enabled us to deliver strong financial results, as evidenced by the following key highlights:
- •
- Comparable store sales growth in 24 of our past 25 fiscal years.
- •
- Strong recent comparable store sales growth of 6.3%, 4.2%, 4.0%, 6.7% and 9.5% for the second quarter of fiscal year 2014,
the first quarter of fiscal year 2014 and fiscal years 2013, 2012 and 2011, respectively.
- •
- Fiscal year 2013 sales of $3.2 billion, a 5.5% increase compared to fiscal year 2012.
- •
- Fiscal year 2013 sales per square foot of $666, a 3.4% increase compared to fiscal year 2012.
- •
- Fiscal year 2013 Adjusted EBITDA of $164.3 million, a 20.2% increase compared to fiscal year 2012.
- •
- Fiscal year 2013 net income of $8.2 million, a 62.3% increase compared to fiscal year 2012.
What Makes Us Different
We believe that the following competitive strengths position us for accelerated growth as food shoppers increasingly focus on value and convenience:
Unique platform that appeals to household and business customers. We serve a diverse demographic of customers including households, businesses and community groups through our complementary Smart & Final and Cash & Carry banners. We offer a differentiated, highly convenient shopping experience with an emphasis on quality and value. We provide an easy-to-shop, no-frills, in-store environment in a smaller physical footprint compared to typical warehouse clubs, but with a greater stock keeping unit ("SKU") selection, which both simplifies and expedites our customers' shopping experience.
Sales at our Smart & Final stores benefit from a large base of diverse business customers. Our internal surveys indicate that our business customers typically shop Smart & Final for both their household and business needs and account for approximately one-third of our Smart & Final banner sales. On average, these business customers spend approximately twice as much per visit (including purchases of household items) as our typical household customers. We believe our household customers enjoy "shopping with the pros" because it reinforces the perception of value, quality and selection. At Cash & Carry, we believe our business customers appreciate our accessible locations and consistent shopping experience, where they shop for both everyday and supplemental business needs.
Distinctive and value-focused merchandise offering. Our Smart & Final stores feature a comprehensive grocery offering at "everyday low prices," including high quality perishables, extensive selections of private label and national brand products and a large selection of club-pack sizes (over 2,500 SKUs). With approximately 14,500 SKUs in our Extra! stores and approximately 10,000 SKUs in our legacy Smart & Final stores, each of our Smart & Final store formats offers a wider variety of
2
products than typical warehouse clubs. In fiscal year 2013, sales of private label items were approximately 29% of Smart & Final banner sales, and based on internal surveys commissioned by us, we estimate that approximately 43% of Smart & Final banner sales were from products or sizes (including both national brand and private label products) that are not typically found at conventional grocers.
Our Cash & Carry stores offer customers a wide variety of approximately 9,500 key SKUs targeted to core foodservice needs, including an extensive selection of high quality perishables (approximately 45% of Cash & Carry banner sales in fiscal year 2013), national brand and private label grocery products, and related foodservice equipment and supplies. We believe Cash & Carry customers value our low prices, extensive selection, price transparency and the ability to hand-select perishable products.
Two highly productive store banners. We believe that our stores are highly productive based on sales per square foot data. Since 2008, we have invested more than $310 million in our operations, establishing a highly productive store base and a low cost, efficient operating structure.
- •
- Smart & Final stores: We operate 87 Extra! stores, which average approximately 27,000 square feet. In fiscal year 2013, our Extra! stores generated average sales per square foot of $624. Our typical new Extra! store requires a cash investment of approximately $3.2 million, including store buildout (net of landlord contributions), inventory and cash pre-opening expenses. Based on historical performance, we target pre-tax cash-on-cash returns of 25% in the third year after opening.
- •
- Cash & Carry stores: We operate 52 Cash & Carry stores, which average approximately 20,000 square feet. In fiscal year 2013, our Cash & Carry stores generated average sales per square foot of $756. Our typical new Cash & Carry store requires a low initial cash investment of approximately $1.5 million, including store buildout (net of landlord contributions), inventory and cash pre-opening expenses. Based on historical performance, we target pre-tax cash-on-cash returns of 25% in the fourth year after opening.
Our recent Extra! store conversions generally required a cash investment of approximately $2.0 million and, based on historical performance, we target pre-tax cash-on-cash returns of at least 25% in the third year after conversion. Since 2008, we have successfully converted 45 stores to our Extra! format, generating an average sales increase of approximately 30% in the first twelve months following conversion.
We operate 111 legacy Smart & Final stores, which average approximately 17,000 square feet. In fiscal year 2013, our legacy Smart & Final stores generated average sales per square foot of $655.
Well-positioned store base and flexible real estate strategy. We operate 250 stores across six contiguous states in the Western U.S., including 192 stores in the large and growing California market. Our long operating history has enabled us to establish a store footprint that would be difficult to replicate, and has provided us with deep institutional knowledge of the local real estate markets in which we operate.
We have a flexible real estate strategy, which we believe enables our stores to achieve strong performance in a range of locations. Our store model is adaptable to a wide variety of potential sites, including new developments, "second use" spaces previously occupied by other retailers and conversions of non-retail sites to retail use. In addition, our stores appeal to a broad spectrum of customers in the markets we serve, which are generally characterized by ethnically and socio-economically diverse populations. This broad appeal enables us to perform profitably in a range of urban and suburban locations, however we typically target trade areas with higher concentrations of businesses.
3
Passionate and experienced management team. We are led by a passionate executive team with extensive food retail experience and a long history of operational excellence. All of our senior executives have made equity investments in the Company. Our senior executives average over 30 years of experience in the grocery, foodservice and retail industries. We believe our management's experience at all organizational levels will enable us to continue to grow our store base while improving operations and driving efficiencies through a strong focus on selling high quality products at "everyday low prices."
Our Growth Strategy
We are pursuing three primary growth strategies:
Increase our store footprint in existing and new markets. We plan to expand our store footprint, primarily through opening new Extra! stores in existing and adjacent markets, and by entering new markets. Since the beginning of fiscal year 2011, we have opened 18 new Extra! stores, including five in 2013 and ten in 2014. We expect to open three additional new Extra! stores in 2014, and we currently plan to open an additional 20 new Extra! stores in 2015.
We believe that our existing and adjacent markets can support more than 180 new Extra! stores. We also estimate that up to 100 new stores could be located in our key California market and that the broader U.S. market, beyond our existing and adjacent markets, has the potential to support more than 1,250 additional Extra! stores.
We also plan to opportunistically grow our Cash & Carry store base. We expect to open three new Cash & Carry stores through fiscal years 2014 and 2015, and to continue opening additional new stores for the foreseeable future.
We also believe that favorable macroeconomic trends in Mexico, combined with the demonstrated appeal of the Smart & Final offering in our existing Northwestern Mexico joint venture stores, represent an attractive long-term growth opportunity.
Continue store conversions to the Extra! format and store remodels. Extra! stores offer customers a one-stop shopping experience in a larger store footprint than our legacy Smart & Final stores to accommodate our expanded SKU selection. Since 2008, we have completed 45 Extra! store conversions and relocated 20 legacy Smart & Final stores as Extra! stores. We plan to continue converting our larger legacy Smart & Final stores to our Extra! format, including 14 planned in 2014 (as compared to eight in 2013), seven of which have already been completed. In addition, we plan to continue remodeling and relocating selected legacy Smart & Final stores that are not candidates for conversion to the Extra! format.
Drive comparable store sales and enhance gross margins. We have achieved comparable store sales growth in 24 of our past 25 fiscal years, including growth of 4.0%, 6.7% and 9.5% for fiscal years 2013, 2012 and 2011, respectively.
4
Comparable Store Sales Growth(1)
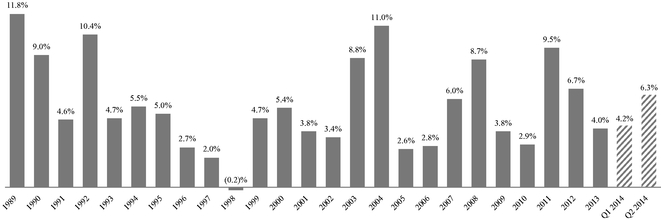
- (1)
- For more information on our calculation of comparable store sales growth, see "Comparable Store Sales" on page ii of this prospectus.
We plan to leverage our significant investments in management, information technology systems, infrastructure and marketing to grow our comparable store sales and enhance our gross margins through execution of the following key initiatives:
- •
- Continue to expand our offering of high quality perishables in our Smart &
Final stores, driven by conversions of legacy Smart & Final stores to the Extra! store format and major remodels of legacy
Smart & Final stores to accommodate additional
perishables offerings.
- •
- Grow private label sales through introduction of new SKUs.
- •
- Improve merchandising mix with introduction of higher margin bulk foods, enhanced selection of natural and organic
products and increased ready-to-eat offerings in our Smart & Final stores.
- •
- Continue to drive growth among business customers through direct marketing activities and volume-based merchandising
initiatives.
- •
- Expand customer reach through increased brand awareness, enhanced in-store experience and marketing channel optimization.
The Ares Acquisition
We were formed by funds affiliated with Ares Management, L.P. ("Ares Management") in connection with the Purchase and Sale Agreement, dated October 9, 2012, pursuant to which we acquired all of the outstanding stock of Smart & Final Holdings Corp., the former ultimate parent company of all of our operating subsidiaries (the "Ares Acquisition"). The Ares Acquisition was consummated on November 15, 2012. In connection with the Ares Acquisition, each of Ares Corporate Opportunities Fund III, L.P. and Ares Corporate Opportunities Fund IV, L.P. (together, "Ares") made an equity contribution to us in exchange for all of the shares of our common stock it currently owns. See "Principal and Selling Stockholders."
Ares Management
Ares Management is a leading global alternative asset manager with approximately $79 billion of assets under management and approximately 700 employees in over 15 offices in the United States, Europe and Asia as of June 30, 2014. Since its inception in 1997, Ares Management has adhered to a disciplined investment philosophy that focuses on delivering strong risk-adjusted investment returns throughout market cycles. Ares Management believes each of its four distinct but complementary
5
investment groups in Tradable Credit, Direct Lending, Private Equity and Real Estate is a market leader based on assets under management and investment performance. Ares Management was built upon the fundamental principle that each group benefits from being part of the greater whole.
The Private Equity Group has approximately $10 billion of assets under management, targeting investments in high quality franchises across multiple industries. In the consumer / retail sector, selected current investments include 99 Cents Only Stores LLC, Floor and Decor Outlets of America, Inc., Guitar Center Holdings, Inc., The Neiman Marcus Group LLC and the parent company of Serta International and Simmons Bedding Company. Selected prior investments include GNC Holdings, Inc., House of Blues Entertainment, LLC, Maidenform Brands, Inc. and Samsonite Corporation.
Upon the closing of this offering, Ares will beneficially own, in the aggregate, approximately % of our outstanding common stock, or approximately % if the underwriters' option to purchase additional shares from Ares is fully exercised. As a result, Ares acting alone will be able to exercise significant influence over all matters requiring stockholder approval, including the election of directors. Also, Ares may acquire or hold interests in businesses that compete directly with us, or may pursue acquisition opportunities that are complementary to our business, making such acquisitions unavailable to us. See "Risk Factors—Risks Related to this Offering and Ownership of Our Common Stock—Our principal stockholder will continue to have substantial control over us after this offering, will be able to influence corporate matters and may take actions that conflict with your interest and have the effect of delaying or preventing changes of control or changes in management, or limiting the ability of other stockholders to approve transactions they deem to be in their best interest."
Payments in Connection with Use of Proceeds
We intend to use approximately $ million of the net proceeds from this offering to repay borrowings under our first lien term loan facility (the "Term Loan Facility"). Funds affiliated with Ares hold approximately 10% of the outstanding loans under our Term Loan Facility and will receive funds representing their pro rata portion of such loans as a result of this repayment. See "Use of Proceeds."
Risks Related to Our Business and Strategy
Investing in our common stock involves a high degree of risk. You should carefully consider the risks highlighted in the section entitled "Risk Factors" following this prospectus summary before making an investment decision. These risks include, among others, the following:
- •
- competition in our industry is intense and our failure to compete successfully may adversely affect our sales, financial
condition and operating results;
- •
- our continued growth depends on new store openings and our failure to successfully open new stores could adversely affect
our business and stock price;
- •
- real or perceived quality or food safety concerns could adversely affect our business, operating results and reputation;
- •
- we may be unable to maintain or increase comparable store sales, which could adversely affect our business and stock
price;
- •
- the current geographic concentration of our stores and our net sales creates an exposure to local or regional downturns or
catastrophic occurrences;
- •
- disruption of significant supplier relationships could adversely affect our business;
- •
- any significant interruption in the operations of our distribution centers or common carriers could disrupt our ability to deliver our products in a timely manner;
6
- •
- our failure to comply with laws, rules and regulations affecting us and our industry could adversely affect our financial
condition and operating results;
- •
- disruptions to or security breaches involving our information technology systems could harm our ability to run our
business;
- •
- we have significant debt service obligations and may incur additional indebtedness in the future, which could adversely
affect our financial condition and operating results and our ability to react to changes to our business; and
- •
- covenants in our debt agreements restrict our operational flexibility.
Corporate Information
We are a Delaware corporation, were incorporated on October 5, 2012 under the name SF CC Holdings, Inc. and became the ultimate parent company of our operating subsidiaries in November 2012. We changed our name to Smart & Final Holdings, Inc. on December 3, 2012 and to Smart & Final Stores, Inc. on June 16, 2014. See "Business—Corporate History and Structure" for more information regarding our organizational structure. Our principal executive offices are located at 600 Citadel Dr., Commerce, California 90040, and our telephone number is (323) 869-7500. Our website address is smartandfinal.com. The information contained on our website is not incorporated by reference into this prospectus, and you should not consider any information contained on, or that can be accessed through, our website as part of this prospectus or in deciding whether to purchase our common stock.
7
Common stock offered by us |
shares | |
Common stock to be outstanding immediately after this offering |
shares |
|
Underwriters' option to purchase additional shares from the selling stockholders |
The underwriters have the option for 30 days following the date of this prospectus to purchase up to additional shares from the selling stockholders named in this prospectus, which are entities affiliated with Ares Management, at the initial public offering price, less the underwriting discount, to cover over-allotments of shares. |
|
Voting rights |
One vote per share. |
|
|
Ares, which immediately after this offering will control approximately % of the voting power of our outstanding common stock, or approximately % if the underwriters' option to purchase additional shares from Ares is fully exercised, will, acting alone, be able to exercise significant influence over all matters submitted to our stockholders for approval, including the election of our directors. See "Risk Factors—Risks Related to this Offering and Ownership of our Common Stock." |
|
Use of proceeds |
We estimate that our net proceeds from this offering will be approximately $ million, after deducting the estimated underwriting discount and estimated offering expenses payable by us. This assumes a public offering price of $ per share, which is the midpoint of the price range set forth on the cover page of this prospectus. We intend to use $ million of the net proceeds from this offering to repay borrowings under our Term Loan Facility. We intend to use any remaining net proceeds from this offering to fund our growth initiatives and for general corporate purposes. See "Use of Proceeds" for additional information. |
|
|
We will not receive any proceeds from the sale of shares by the selling stockholders pursuant to the underwriters' option to purchase additional shares. See "Principal and Selling Stockholders." |
|
Conflicts of interest |
A portion of the net proceeds from this offering will be used to repay borrowings under our Term Loan Facility. Because one or more funds or accounts managed or advised by an investment management affiliate of Guggenheim Securities, LLC are lenders under our Term Loan Facility and will receive 5% or more of the net proceeds from the sale of our common stock in this offering, Guggenheim Securities, LLC is deemed to have a "conflict of interest" under Rule 5121 of the Financial Industry Regulatory |
|
|
8
|
Authority, Inc., or "FINRA." As a result, this offering will be conducted in accordance with FINRA Rule 5121. Pursuant to that rule, the appointment of a "qualified independent underwriter" is not required in connection with this offering as the members primarily responsible for managing the public offering do not have a conflict of interest, are not affiliates of any member that has a conflict of interest and meet the requirements of paragraph (f)(12)(E) of FINRA Rule 5121. See "Use of Proceeds" and "Underwriting (Conflicts of Interest)." |
|
Dividend policy |
We do not anticipate declaring or paying in the foreseeable future any cash dividends on our capital stock. Any future determination as to the declaration and payment of dividends, if any, will be at the discretion of our board of directors and will depend on then existing conditions, including our operating results, financial condition, contractual restrictions, capital requirements, business prospects and other factors our board of directors may deem relevant. Our Term Loan Facility and our asset-based lending facility (our "Revolving Credit Facility" and together with our Term Loan Facility, our "Credit Facilities") contain covenants that would restrict our ability to pay cash dividends. |
|
Risk factors |
See "Risk Factors" beginning on page 14 and the other information included in this prospectus for a discussion of factors you should carefully consider before deciding to invest in our common stock. |
|
Directed share program |
The underwriters have reserved for sale at the initial public offering price up to % of the shares of common stock to be sold in this offering for our employees and directors and other persons associated with us who have expressed an interest in purchasing shares of our common stock in this offering. If purchased by these persons, these shares will be subject to a 180-day lock-up restriction. The number of shares available for sale to the general public in this offering will be reduced to the extent these persons purchase the reserved shares. Any reserved shares not so purchased will be offered by the underwriters to the general public on the same terms as the other shares. |
|
New York Stock Exchange trading symbol |
"SFS." |
Unless otherwise indicated, all information in this prospectus reflects and assumes the following:
- •
- the -for-one stock split of our common stock to be effected prior to the closing of this offering; and
- •
- no exercise of the underwriters' option to purchase up to additional shares of common stock from the selling stockholders.
9
The number of shares of our common stock to be outstanding immediately after this offering is based on shares of our common stock outstanding immediately prior to the closing of this offering, and excludes the following:
- •
- shares of common stock issuable upon the exercise of stock options granted under the SF CC
Holdings, Inc. 2012 Stock Incentive Plan (the "2012 Incentive Plan") and outstanding immediately prior to the closing of this offering, at a weighted average exercise price of
$
per share;
- •
- shares of common stock reserved for future issuance under our new Smart & Final Stores, Inc. 2014 Stock Incentive Plan (the "2014 Incentive Plan" and, together with the 2012 Incentive Plan, the "Incentive Plans"), which we intend to adopt prior to the closing of this offering, subject to stockholder approval, including shares of restricted stock and shares of common stock issuable upon the exercise of stock options to be granted under the 2014 Incentive Plan prior to the closing of this offering.
10
Summary Historical and Consolidated Financial and Other Data
The following table sets forth our summary historical consolidated financial information for the periods and dates indicated, and should be read together with "Risk Factors," "Selected Historical Consolidated Financial Information and Other Data," "Management's Discussion and Analysis of Financial Condition and Results of Operations" and our consolidated financial statements and related notes included elsewhere in this prospectus. Our historical results are not necessarily indicative of our financial condition or operating results to be expected in the future.
The consolidated statements of operations data for the year ended December 29, 2013, the period from January 2, 2012 through November 14, 2012, the period from November 15, 2012 through December 30, 2012, and the year ended January 1, 2012, and the consolidated balance sheet data as of December 29, 2013 and December 30, 2012 have been derived from our audited consolidated financial statements included elsewhere in this prospectus. The consolidated balance sheet data as of January 1, 2012 has been derived from our audited consolidated financial statements not included in this prospectus. The consolidated statements of operations for the twelve-week and twenty-four-week periods ended June 15, 2014 and June 16, 2013 and the consolidated balance sheet data as of June 15, 2014 have been derived from our unaudited interim consolidated financial statements included elsewhere in this prospectus. The unaudited interim consolidated financial statements have been prepared on the same basis as the audited consolidated financial statements and, in the opinion of our management, include all adjustments, consisting only of normal and recurring adjustments, necessary for a fair presentation of the information set forth herein. Interim financial results are not necessarily indicative of results that may be expected for the full fiscal year or any future reporting period.
In connection with the Ares Acquisition, as a result of the application of purchase accounting, the assets and liabilities of the Company were adjusted to their estimated fair values as of the closing date of the Ares Acquisition. We refer to the Company prior to the Ares Acquisition as the "Predecessor," and to the Company after the Ares Acquisition as the "Successor." The periods prior to the Ares Acquisition are referred to as the "Predecessor periods" and the periods following the Ares Acquisition are referred to as the "Successor periods." Our fiscal year 2012 is therefore divided into a Predecessor period from January 2, 2012 through November 14, 2012 and a Successor period from November 15, 2012 through December 30, 2012. Accordingly, in this prospectus, financial information is presented separately for Predecessor and Successor periods, which relate to the accounting periods preceding and succeeding the closing of the Ares Acquisition. See "Selected Historical Consolidated Financial Information and Other Data" and our financial statements and related notes thereto included elsewhere in this prospectus.
11
| |
Successor | |
Predecessor | |
Pro Forma(1) | ||||||||||||||||||||||||||||||
|---|---|---|---|---|---|---|---|---|---|---|---|---|---|---|---|---|---|---|---|---|---|---|---|---|---|---|---|---|---|---|---|---|---|---|---|
| |
Twenty-Four Weeks Ended June 15, 2014 |
Twenty-Four Weeks Ended June 16, 2013 |
Twelve Weeks Ended June 15, 2014 |
Twelve Weeks Ended June 16, 2013 |
Fiscal Year 2013 |
Period From November 15, 2012 Through December 30, 2012 |
|
Period From January 2, 2012 Through November 14, 2012 |
Fiscal Year 2011 |
|
Fiscal Year 2012 |
Fiscal Year 2011 |
|||||||||||||||||||||||
| |
(Dollars in thousands, except per share data) |
||||||||||||||||||||||||||||||||||
Consolidated Statement of Operations Data: |
|||||||||||||||||||||||||||||||||||
Net sales |
$ | 1,563,087 | $ | 1,446,101 | $ | 828,071 | $ | 755,943 | $ | 3,210,293 | $ | 378,550 | $ | 2,664,162 | $ | 2,840,336 | $ | 3,042,712 | $ | 2,840,336 | |||||||||||||||
Cost of sales, buying and occupancy |
1,330,313 | 1,232,778 | 699,886 | 642,528 | 2,736,357 | 333,787 | 2,265,154 | 2,412,180 | 2,596,847 | 2,413,545 | |||||||||||||||||||||||||
| | | | | | | | | | | | | | | | | | | | | | | | | | | | | | | | | | | | |
Gross margin |
232,774 | 213,323 | 128,185 | 113,415 | 473,936 | 44,763 | 399,008 | 428,156 | 445,865 | 426,791 | |||||||||||||||||||||||||
Operating and administrative expenses |
193,849 | 174,039 | 101,491 | 88,463 | 387,133 | 51,727 | 355,681 | 379,371 | 366,585 | 371,189 | |||||||||||||||||||||||||
Income (loss) on property sales |
— | — | — | — | — | (5 | ) | 8,818 | 1,952 | 8,813 | 1,952 | ||||||||||||||||||||||||
| | | | | | | | | | | | | | | | | | | | | | | | | | | | | | | | | | | | |
Income (loss) from operations |
38,925 | 39,284 | 26,694 | 24,952 | 86,803 | (6,959 | ) | 34,509 | 46,833 | 70,467 | 53,650 | ||||||||||||||||||||||||
Interest expense, net |
17,758 | 25,429 | 8,922 | 12,467 | 50,365 | 7,133 | 20,761 | 31,395 | 55,831 | 60,190 | |||||||||||||||||||||||||
(Loss) on early extinguishment of debt(2) |
— | (7,139 | ) | — | (7,139 | ) | (24,487 | ) | — | — | (4,209 | ) | — | (4,209 | ) | ||||||||||||||||||||
Equity in earnings of joint venture |
714 | 521 | 262 | 172 | 1,649 | — | 820 | 785 | 820 | 785 | |||||||||||||||||||||||||
| | | | | | | | | | | | | | | | | | | | | | | | | | | | | | | | | | | | |
Income (loss) from |
21,881 | 7,237 | 18,034 | 5,518 | 13,600 | (14,092 | ) | 14,568 | 12,014 | 15,456 | (9,964 | ) | |||||||||||||||||||||||
Income tax (provision) benefit |
(8,259 | ) | (2,110 | ) | (6,919 | ) | (1,920 | ) | (5,429 | ) | 4,804 | (244 | ) | (4,795 | ) | (1,283 | ) | 3,996 | |||||||||||||||||
| | | | | | | | | | | | | | | | | | | | | | | | | | | | | | | | | | | | |
Income (loss) from continuing operations |
13,622 | 5,127 | 11,115 | 3,598 | 8,171 | (9,288 | ) | 14,324 | 7,219 | 14,173 | (5,968 | ) | |||||||||||||||||||||||
Income (loss) from discontinued operations, net of income taxes(3) |
— | — | — | — | — | — | — | 3,260 | — | 3,260 | |||||||||||||||||||||||||
| | | | | | | | | | | | | | | | | | | | | | | | | | | | | | | | | | | | |
Net income (loss) |
$ | 13,622 | $ | 5,127 | $ | 11,115 | $ | 3,598 | $ | 8,171 | $ | (9,288 | ) | $ | 14,324 | $ | 10,479 | $ | 14,173 | $ | (2,708 | ) | |||||||||||||
| | | | | | | | | | | | | | | | | | | | | | | | | | | | | | | | | | | | |
| | | | | | | | | | | | | | | | | | | | | | | | | | | | | | | | | | | | |
Per Share Data: |
|||||||||||||||||||||||||||||||||||
Basic earnings (loss) per share: |
|||||||||||||||||||||||||||||||||||
Income (loss) per share from |
$ | 45.24 | $ | 17.13 | $ | 36.88 | $ | 12.02 | $ | 27.22 | $ | (31.04 | ) | $ | 1.07 | $ | 0.54 | ||||||||||||||||||
Income (loss) per share from |
— | — | — | — | — | — | — | 0.24 | |||||||||||||||||||||||||||
| | | | | | | | | | | | | | | | | | | | | | | | | | | | | | | | | | | | |
Basic earnings (loss) per |
$ | 45.24 | $ | 17.13 | $ | 36.88 | $ | 12.02 | $ | 27.22 | $ | (31.04 | ) | $ | 1.07 | $ | 0.78 | ||||||||||||||||||
| | | | | | | | | | | | | | | | | | | | | | | | | | | | | | | | | | | | |
| | | | | | | | | | | | | | | | | | | | | | | | | | | | | | | | | | | | |
Pro forma basic earnings (loss) per share(4) |
$ | $ | $ | ||||||||||||||||||||||||||||||||
| | | | | | | | | | | | | | | | | | | | | | | | | | | | | | | | | | | | |
| | | | | | | | | | | | | | | | | | | | | | | | | | | | | | | | | | | | |
Diluted earnings (loss) per share: |
|||||||||||||||||||||||||||||||||||
Income (loss) per share from |
$ | 43.64 | $ | 16.48 | $ | 35.61 | $ | 11.55 | $ | 26.14 | $ | (31.04 | ) | $ | 1.03 | $ | 0.54 | ||||||||||||||||||
Income (loss) per share from discontinued operations, net of income taxes |
— | — | — | — | — | — | — | 0.24 | |||||||||||||||||||||||||||
| | | | | | | | | | | | | | | | | | | | | | | | | | | | | | | | | | | | |
Diluted earnings (loss) per |
$ | 43.64 | $ | 16.48 | $ | 35.61 | $ | 11.55 | $ | 26.14 | $ | (31.04 | ) | $ | 1.03 | $ | 0.78 | ||||||||||||||||||
| | | | | | | | | | | | | | | | | | | | | | | | | | | | | | | | | | | | |
| | | | | | | | | | | | | | | | | | | | | | | | | | | | | | | | | | | | |
Pro forma diluted earnings (loss) per share(4) |
$ | $ | $ | ||||||||||||||||||||||||||||||||
| | | | | | | | | | | | | | | | | | | | | | | | | | | | | | | | | | | | |
| | | | | | | | | | | | | | | | | | | | | | | | | | | | | | | | | | | | |
Weighted average shares outstanding—basic |
301,133 | 299,304 | 301,365 | 299,407 | 300,158 | 299,201 | 13,363,635 | 13,362,665 | |||||||||||||||||||||||||||
Weighted average shares outstanding—diluted |
312,121 | 311,098 | 312,172 | 311,516 | 312,566 | 299,201 | 13,927,566 | 13,425,470 | |||||||||||||||||||||||||||
Weighted average shares outstanding—pro forma basic(4) |
|||||||||||||||||||||||||||||||||||
Weighted average shares outstanding—pro forma diluted(4) |
|||||||||||||||||||||||||||||||||||
Selected Operating Data: |
|||||||||||||||||||||||||||||||||||
Adjusted EBITDA(5) |
$ | 77,734 | $ | 71,097 | $ | 47,500 | $ | 41,586 | $ | 164,261 | $ | 138,696 | $ | 125,027 | |||||||||||||||||||||
Capital expenditures |
48,446 | 22,000 | 34,202 | 14,768 | 55,093 | 50,205 | 56,275 | ||||||||||||||||||||||||||||
Comparable store sales growth(6) |
5.3 |
% |
4.9 |
% |
6.3 |
% |
4.7 |
% |
4.0 |
% |
6.7 |
% |
9.5 |
% |
|||||||||||||||||||||
Smart & Final banner |
4.2 | % | 4.5 | % | 4.9 | % | 4.3 | % | 3.4 | % | 7.1 | % | 9.4 | % | |||||||||||||||||||||
Cash & Carry banner |
8.4 | % | 6.1 | % | 10.5 | % | 5.9 | % | 6.1 | % | 5.4 | % | 9.7 | % | |||||||||||||||||||||
Stores at end of period |
246 |
237 |
246 |
237 |
240 |
235 |
234 |
||||||||||||||||||||||||||||
Smart & Final banner |
194 | 185 | 194 | 185 | 188 | 183 | 182 | ||||||||||||||||||||||||||||
Extra! format |
80 | 63 | 80 | 63 | 69 | 56 | 46 | ||||||||||||||||||||||||||||
Cash & Carry banner |
52 | 52 | 52 | 52 | 52 | 52 | 52 | ||||||||||||||||||||||||||||
Square feet at end of period |
5,101,815 |
4,820,201 |
5,101,815 |
4,820,201 |
4,899,403 |
4,756,165 |
4,697,834 |
||||||||||||||||||||||||||||
Average store size at end of period(7) |
20,739 | 20,338 | 20,739 | 20,338 | 20,414 | 20,239 | 20,076 | ||||||||||||||||||||||||||||
12
| |
As of June 15, 2014 | ||||||
|---|---|---|---|---|---|---|---|
| |
Actual | Pro Forma(4) | |||||
| |
(Dollars in thousands) |
||||||
Consolidated Balance Sheet Data: |
|||||||
Cash and cash equivalents |
$ | 65,561 | |||||
Total assets |
1,627,431 | ||||||
Long-term debt (including current portion and debt discount) |
703,276 | ||||||
Total stockholders' equity |
353,890 | ||||||
- (1)
- The
unaudited pro forma condensed consolidated statements of operations for fiscal year 2012 and fiscal year 2011 give effect to the Ares Acquisition as if
it had occurred on January 3, 2011. See "Management's Discussion and Analysis of Financial Condition and Results of Operations—Unaudited Pro Forma Condensed Consolidated Financial
Information."
- (2)
- In
the second and fourth quarters of 2013, we recognized a loss on early extinguishment of debt of $24.5 million in the aggregate in connection with
amendments to our Term Loan Facility. In the second quarter of 2011, we recognized a loss on early extinguishment of debt of $4.2 million in connection with an amendment to our prior term loan
facility to permit the sale of Henry's Holdings, LLC ("Henry's"). See Note 5, Debt, to the audited consolidated financial statements included elsewhere in this prospectus.
- (3)
- In
the second quarter of 2011, we sold our wholly owned subsidiary, Henry's, to Sprouts Farmers Markets, LLC ("Sprouts"). In the fourth quarter of
2010, we closed five stores in Colorado. Accordingly, the consolidated statements of operations data for our fiscal years 2011, 2010 and 2009 reflect the results of operations of Henry's and the five
stores separately as discontinued operations. The results of operations of Henry's and the five stores are immaterial for fiscal years 2013 and 2012 and are not presented separately as discontinued
operations.
- (4)
- We
present certain share data on a pro forma basis to give effect to the -for-one stock split of our common stock to be effected prior to the
closing of this offering. We present certain balance sheet data on a pro forma basis to give effect to the -for-one stock split of our common stock to be effected prior to the closing of
this offering and to give further effect to the sale by us of shares of common stock in this offering at an assumed initial public offering
price of $ per share, which is
the midpoint of the price range set forth on the cover page of this prospectus, after deducting estimated underwriting discounts and commissions and estimated expenses payable by us and the
application of the estimated net proceeds from this offering as described under "Use of Proceeds."
- (5)
- To
supplement our financial information presented in accordance with GAAP, we use Adjusted EBITDA to clarify and enhance understanding of our past
performance. We define Adjusted EBITDA as earnings (net income or loss) before income taxes, interest expense (net), depreciation and amortization, as adjusted for the items set forth in the table
below.
This non-GAAP measure is intended to provide additional information only, and does not have any standard meaning prescribed by GAAP. Use of Adjusted EBITDA may differ from similar measures reported by other companies. Because of its limitations, Adjusted EBITDA should be considered as a measure of discretionary cash available to use to reinvest in the growth of our business, or as a measure of cash that will be available to meet our obligations. Adjusted EBITDA has limitations as an analytical tool, and you should not consider it in isolation or as a substitute for analysis of our results as reported under GAAP.
To properly and prudently evaluate our business, we encourage you to review our consolidated financial statements included elsewhere in this prospectus and the reconciliation to Adjusted EBITDA from net income (loss), the most directly comparable financial measure presented in accordance with GAAP, set forth in the table below. All of the items included in the reconciliation from net income to Adjusted EBITDA are either (a) non-cash items or (b) items that management does not consider in assessing our on-going operating performance. In the case of the non-cash items, management believes that investors may find it useful to assess our comparative operating performance because the measures without such items are less susceptible to variances in actual performance resulting from depreciation, amortization and other non-cash charges and more reflective of other factors that affect operating performance. In the case of the other items that management does not consider in assessing our on-going operating performance, management believes that investors may find it useful to assess our operating performance if the measures are presented without these items because their financial impact may not reflect on-going operating performance.
The following table reconciles Adjusted EBITDA to net income, the most comparable measure calculated in accordance with GAAP:
| |
Successor | |
Predecessor | |
Pro Forma | ||||||||||||||||||||||||||||||
|---|---|---|---|---|---|---|---|---|---|---|---|---|---|---|---|---|---|---|---|---|---|---|---|---|---|---|---|---|---|---|---|---|---|---|---|
(Dollars in thousands)
|
Twenty-Four Weeks Ended June 15, 2014 |
Twenty-Four Weeks Ended June 16, 2013 |
Twelve Weeks Ended June 15, 2014 |
Twelve Weeks Ended June 16, 2013 |
Fiscal Year 2013 |
Period from November 15, 2012 through December 30, 2012 |
|
Period from January 2, 2012 through November 14, 2012 |
Fiscal Year 2011 |
|
Fiscal Year 2012 |
Fiscal Year 2011 |
|||||||||||||||||||||||
Net income |
$ | 13,622 | $ | 5,127 | $ | 11,115 | $ | 3,598 | $ | 8,171 | $ | (9,288 | ) | $ | 14,324 | $ | 10,479 | $ | 14,173 | $ | (2,708 | ) | |||||||||||||
Income tax provision (benefit) |
8,259 | 2,110 | 6,919 | 1,920 | 5,429 | (4,804 | ) | 244 | 4,795 | 1,283 | (3,996 | ) | |||||||||||||||||||||||
Interest expense, net |
17,758 | 25,429 | 8,922 | 12,467 | 50,365 | 7,133 | 20,761 | 31,395 | 55,831 | 60,190 | |||||||||||||||||||||||||
Depreciation and amortization |
28,453 | 27,375 | 14,434 | 13,814 | 60,759 | 7,353 | 44,045 | 53,643 | 53,831 | 50,968 | |||||||||||||||||||||||||
| | | | | | | | | | | | | | | | | | | | | | | | | | | | | | | | | | | | |
EBITDA |
68,092 | 60,041 | 41,390 | 31,799 | 124,724 | 394 | 79,374 | 100,312 | 125,118 | 104,454 | |||||||||||||||||||||||||
Transaction costs(a) |
470 |
74 |
470 |
1 |
220 |
5,300 |
23,833 |
5,719 |
83 |
5,719 |
|||||||||||||||||||||||||
Purchase accounting inventory adjustment(b) |
— | — | — | — | — | 8,600 | — | — | — | — | |||||||||||||||||||||||||
Net (income) loss from closed stores and discontinued operations(c) |
970 | 1,445 | 663 | 1,139 | 3,592 | 407 | 1,549 | (1,825 | ) | 1,956 | (1,825 | ) | |||||||||||||||||||||||
(Gain) loss from asset dispositions |
235 | 44 | 162 | — | 974 | (8 | ) | 9,417 | 6,014 | 9,409 | 6,014 | ||||||||||||||||||||||||
Share based compensation expense |
1,741 | — | 1,741 | — | — | — | 7,483 | 2,455 | — | — | |||||||||||||||||||||||||
Non-cash rent |
2,578 | 1,792 | 1,394 | 1,122 | 3,985 | 449 | (339 | ) | 1,679 | 3,265 | 2,645 | ||||||||||||||||||||||||
Pre-opening costs(d) |
1,976 | 259 | 1,535 | 247 | 1,432 | — | 375 | 935 | 375 | 935 | |||||||||||||||||||||||||
Loss on early extinguishment of debt |
— | 7,139 | — | 7,139 | 24,487 | — | — | 4,209 | — | 4,209 | |||||||||||||||||||||||||
Management fees(e) |
— | — | — | — | — | — | 1,363 | 1,495 | — | — | |||||||||||||||||||||||||
Non-recurring charges(f) |
1,672 | 303 | 145 | 139 | 4,847 | 71 | (1,581 | ) | 2,876 | (1,510 | ) | 2,876 | |||||||||||||||||||||||
| | | | | | | | | | | | | | | | | | | | | | | | | | | | | | | | | | | | |
Adjusted EBITDA |
77,734 | 71,097 | 47,500 | 41,586 | $ | 164,261 | $ | 15,213 | $ | 121,474 | $ | 123,869 | $ | 138,696 | (g) | $ | 125,027 | (g) | |||||||||||||||||
| | | | | | | | | | | | | | | | | | | | | | | | | | | | | | | | | | | | |
| | | | | | | | | | | | | | | | | | | | | | | | | | | | | | | | | | | | |
- (a)
- Represents
costs associated with the Ares Acquisition during fiscal year 2012 and sale of Henry's during fiscal year 2011.
- (b)
- Represents
a purchase accounting inventory valuation adjustment in connection with the Ares Acquisition, which was fully amortized to cost of sales.
- (c)
- Represents (i) costs related primarily to store closures for the Successor periods and the 2012 Predecessor periods and (ii) costs related primarily to discontinued operations for fiscal year 2011.
13
- (d)
- Represents
costs of opening new and relocated stores including rent, utilities, distribution, store labor and advertising.
- (e)
- Represents
annual fees paid by the Predecessor to Apollo (as defined below) under a management services agreement.
- (f)
- Represents
(i) consulting expenses related to strategic growth initiatives for the twelve-week and twenty-four-week periods ended June 15,
2014 and fiscal year 2013 and (ii) costs related to a settlement related to our Mexico joint venture and severance costs, partially offset by recovery on company-owned life insurance policy
death benefits for the 2012 and 2011 Predecessor period.
- (g)
- The difference in Adjusted EBITDA for pro forma fiscal year 2012 and 2011 as compared to Adjusted EBITDA for actual fiscal year 2012 and 2011 reflects a purchase accounting adjustment to unamortized pension liability and a resulting decrease in pension expense.
- (6)
- For
more information regarding our calculation of comparable store sales growth, see "Comparable Store Sales" on page ii of this prospectus.
- (7)
- Average store size is calculated as the gross square feet divided by the stores open at the end of the period presented.
14
Investing in our common stock involves a high degree of risk. You should carefully consider the risks and uncertainties described below, together with all of the other information in this prospectus, including our consolidated financial statements and related notes, before deciding whether to purchase shares of our common stock. Any of the following risks could adversely affect our business, financial condition, operating results or prospects and cause the value of our common stock to decline, which could cause you to lose all or part of your investment.
Risks Related to Our Business and Industry
Competition in our industry is intense and our failure to compete successfully may adversely affect our sales, financial condition and operating results.
We operate in the highly competitive food retail and foodservice industries. We compete on a combination of factors, including price, product selection, product quality, convenience, customer service, store format and location.
Price is a significant driver of consumer choice in our industry. We expect our competitors to continue to apply pricing pressures, which may have an adverse effect on our ability to maintain profit margins and sales levels. We establish our consumer prices based on a number of factors, including surveys of prices of certain of our competitors. If our competitors change their cost structures such that we are unable to effectively compete on the basis of price, our financial condition and operating results could be adversely affected. Consumer choice is also driven by product selection and quality, and our success depends, in part, on our ability to identify market trends and offer products that appeal to our customers' preferences. Failure to identify such trends, offer such products or to accurately forecast changing customer preferences could lead to a decrease in the number of customer transactions at our stores and a decrease in the amount customers spend when they visit our stores.
We attempt to create a convenient and appealing shopping experience for our customers in terms of customer service, store format and location. If we are unable to provide a convenient and appealing shopping experience, our sales, profit margins and market share may decrease, resulting in an adverse effect on our financial condition and operating results. Some of our competitors are aggressively expanding their number of stores within our primary market areas. As our competitors open stores within close proximity to our stores, our financial condition and operating results may be adversely affected through a loss of sales, decrease in market share or greater operating costs.
Our principal competitors include conventional grocers such as Albertson's, Kroger and Safeway, discounters and warehouse clubs such as Costco, mass merchandisers such as Walmart and Target, foodservice delivery companies such as Sysco and US Foods, as well as online retailers and other specialty stores. Some of our competitors may have greater financial or marketing resources than we do and may be able to devote greater resources to sourcing, promoting and selling their products. Also, some of our competitors do not have unionized work forces, which may result in lower labor and benefit costs. These competitors could use these advantages to take certain measures, including reducing prices, that could adversely affect our competitive position, business, financial condition and operating results.
Some of our competitors have attempted to increase market share by expanding their footprints in our marketing areas. This competitor expansion creates a more difficult competitive environment for us. In addition, other established food retailers could enter our markets, increasing competition for market share.
Further, over the last several decades, the retail supermarket and foodservice industries have undergone significant changes. Companies such as Walmart (particularly through its Sam's Club, Walmart Neighborhood Market and Walmart Express formats) and Costco have developed a lower cost
15
structure to provide their customers with an "everyday low price" offering. In addition, wholesale outlets such as Restaurant Depot offer an additional low-cost option in the markets they serve. To the extent more of our competitors adopt an "everyday low price" strategy, we could be pressured to lower our prices, which would require us to achieve additional cost savings to offset these reductions. We may be unable to change our cost structure and pricing practices rapidly enough to successfully compete in that environment.
Our continued growth depends on new store openings and our failure to successfully open new stores or successfully manage the potential difficulties associated with store growth could adversely affect our business and stock price.
Our continued growth depends, in part, on our ability to open new stores and to operate those stores successfully. Successful execution of our growth strategy depends upon a number of factors, many of which are beyond our control, including our ability to effectively find suitable sites for new stores, negotiate and execute leases on acceptable terms, secure and manage the inventory necessary for the launch and operation of our new stores, hire, train and retain skilled store personnel, promote and market new stores and address competitive merchandising, distribution and other challenges encountered in connection with expansion into new geographic areas and markets. Delays or failures in opening new stores, or achieving lower than expected sales in new stores, could adversely affect our growth.
Although we believe that the U.S. market can support additional Extra! and Cash & Carry stores, we cannot assure you when or whether we will open any new stores. We may not have the level of cash flow or financing necessary to execute our growth strategy. If and when such store openings occur, we cannot assure you that these new stores will be successful or result in greater sales and profitability.
Additionally, our growth will place increased demands on our operational, managerial and administrative resources. These increased demands could cause us to operate our existing business less effectively, which in turn could adversely affect the financial condition and operating results of our existing stores. Also, new store openings in markets where we have existing stores may result in reduced sales volumes at those existing stores. We may also be unable to successfully manage the potential difficulties associated with store growth, including capturing efficiencies of scale, improving our systems, continuing cost discipline and maintaining appropriate store labor levels and disciplined product and real estate selection, which may result in stagnation or decline in our operating margins. If we experience such a decline in financial condition and operating results as a result of such difficulties, we may slow or discontinue store openings or we may close stores that we are unable to operate profitably.
Some of our new stores may be located in areas where we have little experience or a lack of brand recognition. Those markets may have different competitive conditions, market conditions, consumer tastes and discretionary spending patterns than our existing markets, which may cause these new stores to be less successful than stores in our existing markets. If we fail to successfully execute our growth strategy, including by opening new stores, our financial condition and operating results may be adversely affected.
Our continued growth also depends, in part, on our ability to successfully convert certain of our Smart & Final stores to our Extra! format, and to relocate certain of our Smart & Final stores to new locations as Extra! stores. If we fail to successfully identify the Smart & Final stores suitable for conversion or relocation, or fail to manage such conversions and relocations in a cost-effective manner, our financial condition and operating results may be adversely affected.
16
Our new stores may adversely affect our operating results in the short term and may not achieve sales and operating levels consistent with our more mature stores on a timely basis or at all.
We are actively pursuing new store growth and plan to continue doing so in the future. We cannot assure you that our new store openings will be successful or reach the sales and profitability levels of our existing stores. New store openings may adversely affect our financial condition and operating results in the short term due to the effect of opening costs and lower sales and contribution to overall profitability during the initial period following opening. New stores build their sales volume and their customer base over time and, as a result, generally have lower margins and higher operating expenses, as a percentage of net sales, than our more mature stores. New stores may not achieve sustained sales and operating levels consistent with our more mature store base on a timely basis or at all, which may adversely affect our long-term financial condition and operating results.
In addition, we may not be able to successfully integrate new stores into our existing store base and those new stores may not be as profitable as our existing stores. Further, we have historically experienced, and expect to experience in the future, some sales volume transfer from our existing stores to our new stores as some of our existing customers switch to new, closer locations. If our new stores are less profitable than our existing stores, or if we experience sales volume transfer from our existing stores, our financial condition and operating results may be adversely affected.
We may be unable to maintain or increase comparable store sales, which could adversely affect our business and stock price.
We may not be able to maintain or improve the levels of comparable store sales that we have experienced in the past. Our comparable store sales growth could be lower than our historical average for many reasons, including:
- •
- general economic conditions;
- •
- the effect of new and acquired stores entering into the comparable store base;
- •
- the opening of new stores that cannibalize store sales in existing markets;
- •
- increased competitive activity;
- •
- price changes in response to competitive factors;
- •
- supply shortages;
- •
- consumer preferences, buying trends and spending levels;
- •
- product price inflation and deflation;
- •
- cycling against any year of above-average sales results;
- •
- our ability to provide product offerings that generate new and repeat visits to our stores; and
- •
- the level of customer service that we provide in our stores.
These factors may cause our comparable store sales results to be materially lower than in recent periods, which could harm our business and result in a decline in the price of our common stock.
Our plans to remodel or convert certain of our existing stores and build new stores in our current markets could require us to spend capital, which must be allocated among various projects. Failure to use our capital efficiently could adversely affect our financial condition and operating results.
Since October 2008, we have converted 65 Smart & Final stores to our Extra! format through a combination of store conversions and relocations. Our recent conversions and relocations have been completed for an average net cash investment of approximately $2.0 million. We intend to convert
17
additional locations over the next several years. However, we cannot assure you that our future conversions will require similar levels of investment, reach the sales and profitability levels of our Smart & Final or Extra! stores or be completed at all. If any of these initiatives prove to be unsuccessful, we may experience reduced profitability and could be required to delay, significantly curtail or eliminate planned store openings, remodels or conversions.
Perishable products make up a significant portion of our sales, and ordering errors or product supply disruptions may adversely affect our financial condition and operating results.
We could suffer significant inventory losses in the event of the loss of a major supplier, disruption of our supply chain, extended power outages, natural disasters or other catastrophic occurrences. We have a significant focus on perishable products, sales of which accounted for approximately 34% of our net sales for our fiscal year 2013 and 36% of our second fiscal quarter 2014, and rely on various suppliers to provide and deliver our perishable product inventory on a continuous basis. Adverse weather conditions and natural disasters can lower crop yields and reduce crop size and quality, which in turn could reduce the available supply or increase the price of fresh produce.
While we have implemented certain systems to ensure our ordering is in line with demand, we cannot assure you that our ordering systems will always work efficiently, in particular in connection with the opening of new stores, which have limited or no ordering history. If we over-order, we may suffer inventory losses, which would adversely affect our financial condition and operating results.
Our private label products expose us to various risks.
We expect to continue to grow our exclusive private label products within many product categories. We have invested in our development and procurement resources and marketing efforts relating to these private label products. If we cannot anticipate, identify and react to changing consumer preferences relating to our private label products in a timely manner, or if our profit margins or sales levels from such products decline, then our financial condition and operating results may be adversely affected.
Our private label products also subject us to certain specific risks in addition to those discussed elsewhere in this section, such as:
- •
- mandatory or voluntary product recalls;
- •
- infringements of our proprietary rights (including counterfeit or otherwise unauthorized goods);
- •
- claims related to the proprietary rights of third parties;
- •
- adverse publicity about the quality, safety or integrity of our products; and
- •
- other risks generally encountered by entities that source, sell and market private label products for retail.
An increase in sales of our private label products may also adversely affect sales of our suppliers' products, which may, in turn, adversely affect our relationship with our suppliers. Our failure to adequately address some or all of these risks could have a material adverse effect on our business, financial condition and operating results.
Real or perceived quality or food safety concerns could adversely affect our business, operating results and reputation.
Brand value is based in large part on perceptions of subjective qualities, and even isolated incidents can erode trust and confidence, particularly if they result in governmental investigations, litigation or adverse publicity, especially in social media outlets, all of which can adversely affect these
18
perceptions and lead to adverse effects on our business, operating results and reputation. We believe our customers hold us to a high food safety standard. Real or perceived concerns regarding the safety of our food products or the safety and quality of our food supply chain, whether or not ultimately based on fact and whether or not involving products sold at our stores, could cause consumers to avoid shopping with us, and could adversely affect our financial condition and operating results, even if the basis for the concern is outside of our control. Any lost confidence on the part of consumers would be difficult and costly to reestablish.
Products we sell could cause unexpected side effects, illness, injury or death that could result in the discontinuance of such products or expose us to litigation, either of which could result in unexpected costs and damage to our reputation.
There is increasing governmental scrutiny and public awareness of food safety. Unexpected side effects, illness, injury or death caused by products we sell could result in the discontinuance of sales of these products or prevent us from achieving market acceptance of the affected products. Such side effects, illnesses, injuries and deaths could also expose us to product liability or negligence lawsuits. Any claims brought against us may exceed our existing or future insurance policy coverage or limits. Any judgment against us that is in excess of our policy limits would have to be paid from our cash reserves, which would reduce our capital resources. Also, we may not have sufficient capital resources to pay a judgment, in which case our creditors could levy against our assets. The real or perceived sale of contaminated or harmful products would cause negative publicity regarding our company, brand or products, which could in turn harm our reputation and net sales and adversely affect our business, financial condition and operating results.
If we fail to maintain our reputation and the value of our brand, our sales may decline.
We believe our continued success depends on our ability to maintain and grow the value of our Smart & Final, Extra! and Cash & Carry brands. Maintaining, promoting and positioning our brands and reputation will depend largely on the success of our marketing and merchandising efforts and our ability to provide a consistent, high quality customer experience. Brand value is based in large part on perceptions of subjective qualities, and even isolated incidents can erode trust and confidence, particularly if they result in governmental investigations, litigation or adverse publicity. Our brands could be adversely affected if we fail to achieve these objectives or if our public image or reputation were to be tarnished by negative publicity.
The current geographic concentration of our stores and our net sales creates an exposure to local or regional downturns or catastrophic occurrences.
As of June 15, 2014, we operated 177 Smart & Final stores in California, representing 91% of our total Smart & Final stores and accounting for 95% of Smart & Final banner sales in the twenty-four weeks ended June 15, 2014. Also, as of June 15, 2014, we operated 40 Cash & Carry stores in the Pacific Northwest (Washington, Oregon and Idaho), representing 77% of our total Cash & Carry stores and accounting for 77% of Cash & Carry banner sales in the twenty-four weeks ended June 15, 2014. In addition, we source a significant portion of our produce from California.
As a result, our business is currently more susceptible to regional conditions than the operations of our more geographically diversified competitors and we are vulnerable to economic downturns in those regions. Any unforeseen events or circumstances that adversely affect the areas in which we have stores or from which we obtain products, particularly in California and the Pacific Northwest, could adversely affect our financial condition and operating results. These factors include, among other things, changes in demographics, population, employee bases and economic conditions, wage increases, severe weather conditions, power outages and other catastrophic occurrences. Such conditions may result in reduced customer traffic and spending in our stores, physical damage to our stores, loss of inventory, closure of
19
one or more of our stores, inadequate work force in our markets, temporary disruption in the supply of products, delays in the delivery of goods to our stores and a reduction in the availability of products in our stores. Any of these factors may disrupt our business and adversely affect our financial condition and operating results.
Disruption of supplier relationships could adversely affect our business.
We source our products from over 1,650 vendors and suppliers. The cancellation of our distribution arrangement with or the disruption, delay or inability of any of these vendors or suppliers to deliver products to our stores could cause operational disruptions or delays or increased or unexpected costs including, among others, costs associated with finding alternative vendors or suppliers and obtaining inventory that meets our and our customers' standards.
As an example, Unified Grocers, Inc. ("Unified Grocers") is the primary supplier of dry grocery and perishable products to our Cash & Carry stores, accounting for approximately 82% of our product requirements (measured at cost) for our Cash & Carry stores for each of our fiscal year ended December 29, 2013 and the twenty-four-week period ended June 15, 2014, respectively, and 22% of our total Company product requirements (measured at cost) for each of our fiscal year ended December 29, 2013 and the twenty-four-week period ended June 15, 2014, respectively. Based on Unified Grocers' disclosure in its public filings, we accounted for 14% of Unified Grocers' total net sales for its fiscal year ended September 28, 2013. Our current contractual relationship with Unified Grocers continues through December 5, 2015. If our distribution arrangement with Unified Grocers was cancelled or Unified Grocers was unwilling or unable to supply our stores with dry grocery or perishable products, we could experience disruptions to our operations and incur unexpected expenses associated with finding one or more alternative suppliers or utilizing our own infrastructure to replace the products provided to and services performed for us by Unified Grocers.
Changes in commodity prices and availability may affect our financial condition and operating results.
Many products we sell include ingredients such as wheat, corn, oils, milk, sugar, cocoa and other commodities. Commodity prices worldwide have been increasing. Any increase in commodity prices may cause our suppliers to seek price increases from us. We cannot assure you that we will be able to mitigate supplier efforts to increase our costs, either in whole or in part. In the event we are unable to continue mitigating potential supplier price increases, we may consider raising our prices and our customers may be deterred by any such price increases. Our financial condition and operating results may be adversely affected through increased costs to us, which may affect gross margins, or through reduced sales as a result of a decline in the number and average size of customer transactions.
While management believes that these commodities are not currently in short supply and all are readily available from our current independent suppliers, an interruption in the supply chains of or volatility in the markets for any of these commodities could have an adverse effect on their overall supply and impede our ability or that of our suppliers to obtain products containing these commodities. Such a decrease in their availability to us or our suppliers, whether as a result of increased prices or otherwise, could adversely affect our financial condition and operating results.
Any significant interruption in the operations of our distribution centers or common carriers could disrupt our ability to deliver our products in a timely manner.
We distribute our products through six distribution centers in California, two of which serve our stores in Northern California and four of which serve our stores in Southern California, Arizona and Nevada. The operations of four of our distribution centers are outsourced to third parties. See "Business—Properties." We also maintain relationships with numerous common carriers. Any significant interruption in the operation of our distribution center infrastructure, such as disruptions
20
due to fire, severe weather or other catastrophic events, power outages, labor disagreements or shipping problems, or any disruption or cancellation of our contractual relationships with the third party operators of our distribution centers, could adversely affect our ability to distribute products to our stores. Such interruptions could result in lost sales and a loss of customer loyalty to our brands. While we maintain business interruption and property insurance, if the operation of our distribution centers were interrupted for any reason causing delays in shipment of products to our stores, our insurance may not be sufficient to cover losses we experience, which could adversely affect our business, financial condition and operating results.
We rely on common carriers, including rail and trucking, to transport products from our suppliers to our central distribution centers and from these centers to our stores. A disruption in the services of common carriers due to weather, employee strikes, increases in fuel costs or other unforeseen events, or any disruption or cancellation of our contractual relationships with our common carriers, could affect our ability to maintain sufficient quantities of inventory in our stores.
Our failure to comply with laws, rules and regulations affecting us and our industry could adversely affect our financial condition and operating results.
We are subject to numerous federal, state and local laws, rules and regulations that affect our business, such as those affecting food manufacturing, food and drug distribution, retailing, labor and employment and environmental practices, accounting standards and taxation requirements. We must also comply with numerous provisions regulating, among other things, health and sanitation standards, food labeling and safety, equal employment opportunity, minimum wages and licensing for the sale of food, drugs and alcoholic beverages. Our ongoing efforts related to compliance with such laws, rules and regulations, including with respect to implementation of immigration legislation, recently enacted food safety and health care reform legislation, new mandates, fees and taxes and stricter regulatory oversight, create uncertainty about the probability and effect of future regulatory changes and can significantly affect our operations and compliance costs. We cannot predict future laws, rules and regulations or the effect they will have on our financial condition and operating results, but in any event, additional record keeping, increased costs of recruiting, training and retaining employees, expanded documentation of the properties of certain products, and expanded or different labeling required by such laws, rules and regulations, could significantly increase our costs of doing business could adversely affect our business, financial condition and operating results.
As is common in our industry, we rely on our suppliers, including suppliers of our private label products, to ensure that the products they sell to us comply with all applicable regulatory and legislative requirements. In general, we seek certifications of compliance, representations and warranties, indemnification and/or insurance from our suppliers. However, even with adequate insurance and indemnification, any claims of non-compliance could significantly damage our reputation and consumer confidence in our products. In order to comply with applicable statutes and regulations, our suppliers have from time to time recalled, reformulated, eliminated or relabeled certain of their products.
In addition, many of our customers rely on food stamps and other governmental assistance programs to supplement their grocery-shopping budgets. As a result, any change in the ability of our customers to obtain food stamps and other governmental assistance could adversely affect our business, financial condition and operating results.
General economic conditions that affect consumer spending could adversely affect our business, financial condition and operating results.
The food retail and foodservice industries are sensitive to changes in general economic conditions. Recessionary economic cycles, increases in interest rates, higher prices for commodities, fuel and other energy, inflation, high levels of unemployment and consumer debt, depressed home values, high tax
21
rates and other economic factors that affect consumer spending and confidence or buying habits may adversely affect the demand for products we sell in our stores. In recent years, the U.S. economy has experienced volatility due to uncertainties related to energy prices, credit availability, difficulties in the banking and financial services sectors, decreases in home values and retirement accounts, high unemployment and falling consumer confidence. As a result, consumers are more cautious and could shift their spending to lower-priced competition, such as warehouse membership clubs, dollar stores or extreme value formats. In addition, inflation or deflation could affect our business. Food deflation could reduce sales growth and profit margins, while food inflation, combined with reduced consumer spending, could reduce gross profit margins. As a result of any of these factors, our business, financial condition and operating results could be adversely affected.
A widespread health epidemic could adversely affect our business.
Our business could be severely affected by a widespread regional, national or global health epidemic. A widespread health epidemic may cause customers to avoid public gathering places such as our stores or otherwise change their shopping behaviors. Additionally, a widespread health epidemic could adversely affect our business by disrupting production and delivery of products to our stores and by affecting our ability to appropriately staff our stores.
If we are unable to attract, train and retain, or maintain satisfactory relations with, our employees we may not be able to grow or successfully operate our business.
The food retail and foodservice industries are labor intensive. Our continued success is dependent in part upon our ability to attract, train and retain qualified employees who understand and appreciate our culture and can represent our brands effectively and establish credibility with our business partners and customers. We face intense competition for qualified employees, many of whom are subject to offers from competing employers. Our ability to meet our labor needs, while controlling wage and labor-related costs, is subject to numerous external factors, including the availability of a sufficient number of qualified persons in the work force in the markets in which we operate, unemployment levels within those markets, unionization of the available work force, prevailing wage rates, changing demographics, health and other insurance costs and changes in employment legislation. If we fail to maintain competitive wages, the quality of our workforce could decline and cause our customer service to suffer. However, increasing our wages could cause our profit margins to decrease. If we are unable to hire and retain employees capable of meeting our business needs and expectations, our business and brand images may be impaired. Any failure to meet our staffing needs or any material increase in turnover rates of our employees or employee wages may adversely affect our business, financial condition and operating results.
As of June 15, 2014, we had 8,805 employees. 181 of our employees, all of whom work at our Cash & Carry stores, are members of the International Brotherhood of Teamsters (the "Union") and are covered by a collective bargaining agreement. We may experience pressure from labor unions or become the target of campaigns similar to those faced by our competitors. The unionization of a more significant portion of our workforce, particularly at our Company-operated distribution centers and Smart & Final stores, could increase the overall costs at the affected locations and adversely affect our flexibility to run our business competitively and otherwise adversely affect our business, financial condition and operating results.
Labor relations issues arise from time to time, including issues in connection with Union efforts to represent employees at our stores and distribution centers, and with the negotiation of new collective bargaining agreements. If we fail to maintain satisfactory relations with our employees or with the Union, we may experience labor strikes, work stoppages or other labor disputes. Negotiation of collective bargaining agreements also could result in higher ongoing labor costs. Also, our recruiting and retention efforts and efforts to increase productivity may not be successful and there may be a
22
shortage of qualified employees in future periods. Any such shortage would decrease our ability to effectively serve our customers. Such a shortage would also likely lead to higher wages for employees and a corresponding reduction in our operating results.
We have obligations under our defined benefit employee pension plans and may be required to make plan contributions in excess of our current estimates.
We sponsor one single-employer defined benefit pension plan (the "Single-Employer Plan"), which, with limited exceptions, is frozen with respect to new participants. In addition, we participate through our Cash & Carry operations in one multiemployer pension plan, the Western Conference of Teamsters Pension Plan (the "Multiemployer Plan"), on behalf of our union-affiliated employees, and we are required to make contributions to this plan under our collective bargaining agreement. Neither the Single-Employer Plan nor the Multiemployer Plan are fully funded based on standards provided by the Pension Benefit Guaranty Corporation (the "PBGC"), in part due to increases in the costs of benefits provided or paid under the plans as well as lower returns on plan assets. Our funding requirements vary based upon plan asset performance, interest rates and actuarial assumptions. Poorer than assumed asset performance and continuing low interest rates may result in increased future funding contributions by us and, with respect to the Multiemployer Plan, other participating employers.
Going forward, our required contributions to the Multiemployer Plan could also increase as a result of many factors, including the outcome of collective bargaining with the Union, actions taken by the trustee that manages the plan, government regulations, the actual return on assets held in the plan and the payment of a withdrawal liability if we choose to exit the plan. Our risk of future increased payments may be greater if other participating employers withdraw from the Multiemployer Plan and are not able to pay the total liability assessed as a result of such withdrawal or if the pension plan adopts surcharges and/or increased pension contributions as part of a rehabilitation plan.
Pursuant to the Employee Retirement Income Security Act of 1974, as amended ("ERISA"), the PBGC has the right, subject to satisfaction of certain statutory requirements, to involuntarily terminate the pension plans described above (thus accelerating funding obligations) or enter into an alternative arrangement with us to prevent such termination. We expect to fund certain excess contributions to the Single-Employer Plan through plan year 2018 under the terms of an agreement with the PBGC that we entered into in connection with the Ares Acquisition. The amounts and timing of the remaining contributions we expect to make to the pension plans described above reflect a number of actuarial and other estimates and assumptions with respect to our expected plan funding obligations. The actual amounts and timing of these contributions will depend upon a number of factors and the actual amounts and timing of our future plan funding contributions may differ materially from those presented in this prospectus.
The minimum wage and cost of providing employee benefits continues to increase and is subject to factors outside of our control.
A considerable number of our employees are paid at rates related to the federal minimum wage. Many of our stores are located in states, including California, where the minimum wage is greater than the federal minimum wage and receive compensation equal to the state's minimum wage. The current California minimum wage is $8.00 per hour, and it will increase to $9.00 per hour effective July 1, 2014, and to $10.00 per hour effective January 1, 2016. Moreover, municipalities may set minimum wages above the applicable state standards. Any further increases in the federal minimum wage or the enactment of additional state or local minimum wage increases could increase our labor costs.
We provide health benefits to substantially all of our full-time employees and to certain part-time employees depending on average hours worked. Though employees generally pay a portion of the cost of such benefits, our cost of providing these benefits has increased steadily over the last several years.
23
We anticipate future increases in the cost of health benefits, partly, but not entirely, as a result of the implementation of the Patient Protection and Affordable Care Act enacted in 2010, as well as other healthcare reform legislation being considered by Congress and state legislatures. We are currently evaluating the potential effects of the Patient Protection and Affordable Care Act on our business. Due to provisions requiring phasing-in over time, changes to our healthcare costs structure could have a significant, negative impact on our future business. If we are unable to control healthcare and pension costs, we may experience increased operating costs, which may adversely affect our financial condition and operating results.
The loss of any of our executive officers could adversely affect our business.
We are dependent upon each of our executive officers listed under "Management—Executive Officers." Losing the services of any or a significant number of such individuals could adversely affect our business, as we may not be able to find suitable individuals to replace them on a timely basis, if at all. In addition, any such departure could be viewed negatively by investors and analysts, which may cause our stock price to decline. We do not maintain key person insurance on any employee, though we are the beneficiary of life insurance policies on certain members of management for the purpose of funding our obligations under our non-qualified defined benefit plan.
Energy costs are an increasingly significant component of our operating expenses and increasing energy costs, unless offset by more efficient usage or other operational responses, may affect our financial condition and operating results.
We use natural gas, water, sewer and electricity in our stores and gasoline and diesel in trucks that deliver products to our stores. We may also be required to pay certain adjustments or other amounts pursuant to our supply and delivery contracts in connection with increases in fuel prices. Increases in energy costs, whether driven by increased demand, decreased or disrupted supply or an anticipation of any such events will increase the costs of operating our stores. We may not be able to recover these increased costs by raising prices charged to our customers. Any such increased prices may also exacerbate the risk of customers choosing lower-cost alternatives. In addition, if we are unsuccessful in attempts to protect against these increases in energy costs through long-term energy contracts, improved energy procurement, improved efficiency and other operational improvements, the overall costs of operating our stores will increase, which could adversely affect our financial condition and operating results.
Disruptions to or security breaches involving our information technology systems could harm our ability to run our business.
In connection with payment card sales and other transactions, including bank cards, debit cards, credit cards and other merchant cards, we process and transmit confidential banking and payment card information. Additionally, as part of our normal business activities, we collect and store sensitive personal information, related to our employees, customers, vendors and other parties. Despite our security measures, our information technology and infrastructure may be vulnerable to criminal cyber-attacks or security incidents due to employee error, malfeasance or other vulnerabilities. Any such incident could compromise our networks and the information stored there could be accessed, publicly disclosed, lost or stolen. Third parties may have the technology and know-how to breach the security of this information, and our security measures and those of our banks, merchant card processing and other technology vendors may not effectively prohibit others from obtaining improper access to this information. The techniques used by criminals to obtain unauthorized access to sensitive data change frequently and often are not recognized until launched against a target; accordingly, we may be unable to anticipate these techniques or implement adequate preventative measures. Any security breach could expose us to risks of data loss, regulatory and law enforcement investigations, litigation and liability and could seriously disrupt our operations and any resulting negative publicity could significantly harm our reputation and relationships with our customers and adversely affect our business, financial condition and operating results.
24
Furthermore, our systems and operations, and those of our third party Internet and other systems service providers, are vulnerable to damage or interruption from natural disasters and other catastrophic events, power outages, server failures, telecommunications and Internet service failures, computer viruses and denial-of-service attacks, physical or electronic breaches, sabotage, human errors and similar events. Any of these events could lead to system interruptions, processing, distribution, communication and order fulfillment delays and loss of critical data for us or our Internet and other systems service providers or suppliers, and could have an adverse effect on our business, financial condition and operating results. Because we are dependent on third-party service providers for the implementation and maintenance of certain aspects of our systems and operations and because some of the causes of system interruptions may be outside of our control, we may not be able to remedy such interruptions in a timely manner, if at all, and any system disruptions could adversely affect our business, financial condition and operating results.
We need to comply with credit and debit card security regulations.
As a merchant that processes credit and debit card payments from customers, we are required to comply with the Payment Card Industry Data Security Standards and other requirements imposed on us for the protection and security of our customers' credit and debit card information. If we are unable to remain compliant with these standards and requirements, our business and operations could be adversely affected because we could incur significant fines or penalties from payment card companies or be prevented in the future from accepting customer payments by means of a credit or debit card. We also may need to expend significant management and financial resources to become or remain compliant with these requirements, which could divert these resources from other initiatives and adversely affect our business, financial condition and operating results.
Legal proceedings could adversely affect our business, financial condition and operating results.
Our operations, which are characterized by a high volume of customer traffic and by transactions involving a wide variety of product selections, carry a higher exposure to consumer litigation risk when compared to the operations of companies operating in some other industries. Consequently, we may be a party to individual personal injury, product liability, intellectual property, employment-related and other legal actions in the ordinary course of our business, including litigation arising from food-related illness. The outcome of litigation, particularly class action lawsuits, is difficult to assess or quantify. Plaintiffs in these types of lawsuits may seek recovery of very large or indeterminate amounts, and the magnitude of the potential loss relating to such lawsuits may remain unknown for substantial periods of time. While we maintain insurance, insurance coverage may not be adequate and the cost to defend against future litigation may be significant. There may also be adverse publicity associated with litigation that may decrease consumer confidence in our business, regardless of whether the allegations are valid or whether we are ultimately found liable. As a result, litigation may adversely affect our business, financial condition and operating results.
In addition, we believe there is a growing number of employment (including "wage-and-hour"), health, environmental and other lawsuits against companies in our industry, especially in California. State, federal and local laws and regulations regarding employment (including minimum wage requirements), health and the environment change frequently and the ultimate cost of compliance cannot be precisely estimated. Any changes in laws or regulations, or the imposition or enforcement of new laws or regulations, including legislation that impacts employment, health, the environment, labor or trade, could adversely affect our business, financial condition and operating results.
25
We may be unable to adequately protect our intellectual property rights, which could harm our business, financial condition and operating results.
Our trademarks, service marks, copyrights, patents, trade secrets, domain names and other intellectual property are valuable assets that are critical to our success. The unauthorized reproduction or other misappropriation of our intellectual property could diminish the value of our brands or goodwill and cause a decline in our net sales. Any infringement or other intellectual property claim made against us, whether or not it has merit, could be time-consuming, result in costly litigation, cause product delays or require us to enter into royalty or licensing agreements. As a result, any such claim could have a material adverse effect on our business, financial condition and operating results.
Claims under our insurance plans and policies may differ from our estimates, which could adversely affect our operating results.
We use a combination of insurance and self-insurance plans to provide for the potential liabilities for workers' compensation, general liability (including, in connection with legal proceedings described above under "—Risks Related to Our Business and Industry—Legal proceedings could adversely affect our business, financial condition and operating results"), property insurance, director and officers' liability insurance, vehicle liability and employee health-care benefits. Liabilities associated with the risks that are retained by us are estimated, in part, by considering historical claims experience, demographic factors, severity factors and other actuarial assumptions. Our results could be adversely affected by claims and other expenses related to such plans and policies if future occurrences and claims differ from these assumptions and historical trends.
Changes in accounting standards may adversely affect reporting of our financial condition and operating results.
New accounting rules or regulations and varying interpretations of existing accounting rules or regulations have occurred and may occur in the future. A change in accounting rules or regulations may even affect our reporting of transactions completed before the change is effective, and future changes to accounting rules or regulations or the questioning of current accounting practices may adversely affect our results of operations. The Financial Accounting Standards Board ("FASB") is focusing on several broad-based convergence projects, including accounting standards for financial instruments and leases. In August 2010, the FASB issued an exposure draft outlining proposed changes to current lease accounting under GAAP in FASB Accounting Standards Codification 840, "Leases." In July 2011, the FASB made the decision to issue a revised exposure draft, which was issued in May 2013. Currently, substantially all of our leased properties are accounted for as operating leases with limited related assets and liabilities recorded on our balance sheet. The proposed new accounting standard, if ultimately adopted in its proposed form, would treat each lease as creating an asset and a liability and require the capitalization of such leases on the balance sheet. While this change would not impact the cash flow related to our store leases, we would expect our assets and liabilities to increase relative to the current presentation, which may impact our ability to raise additional financing from banks or other sources in the future. The guidance as proposed may also affect the future reporting of our results from operations as both income and expense on leases previously accounted for as operating leases would be front-end loaded as compared to the existing accounting requirements. However, even if the new guidance is adopted as proposed, certain incurrence ratios and other provisions under the credit agreements governing the Credit Facilities permit us to account for leases in accordance with the existing accounting requirements. As a result, our ability to incur additional debt or otherwise comply with such covenants may not directly correlate to our financial condition or results from operations as each would be reported under GAAP as so amended.
26
Our high level of fixed lease obligations could adversely affect our financial condition and operating results.
Our high level of fixed lease obligations will require us to use a significant portion of cash generated by our operations to satisfy these obligations and could adversely affect our ability to obtain future financing to support our growth or other operational investments. We will require substantial cash flows from operations to make our payments under our operating leases, which in some cases provide for periodic adjustments in our rent rates. If we are not able to make the required payments under the leases, the lenders to or owners of the relevant stores, distribution centers or administrative offices may, among other things, repossess those assets, which could adversely affect our ability to conduct our operations. In addition, our failure to make payments under our operating leases could trigger defaults under other leases or under agreements governing our indebtedness, which could cause the counterparties under those agreements to accelerate the obligations due thereunder.
Our lease obligations may require us to continue paying rent for store locations that we no longer operate.
We are subject to risks associated with our current and future store, distribution center and administrative office real estate leases. We generally cannot cancel our leases, so if we decide to close or relocate a location, we may nonetheless be committed to perform our obligations under the applicable lease, including paying the base rent for the remaining lease term. In addition, as our leases expire, we may fail to negotiate renewals, either on commercially acceptable terms or at all, which could adversely affect our business, financial condition and operating results.
The joint venture in Northwestern Mexico subject us to risks associated with the legislative, judicial, accounting, regulatory, political, economic and other risks and conditions specific to that country, which could adversely affect our business, financial condition and operating results.
We are currently engaged, through one of our wholly owned subsidiaries, in the operation of 13 Smart & Final stores in Northwestern Mexico through a joint venture. For each of our fiscal year 2013 and the twenty-four weeks ended June 15, 2014, our Mexican operations generated approximately 12% and 3%, respectively, of our income from continuing operations. As a result of our expansion activities into Northwestern Mexico, we expect that our international operations could account for a larger portion of our net income in future years. Our future operating results in Mexico could be adversely affected by a variety of factors, most of which are beyond our control. These factors include political conditions and instability, economic conditions, legal and regulatory constraints, anti-money laundering laws and regulations, trade policies, currency regulations and other matters in this region, now or in the future. Foreign currency exchange rates and fluctuations may have an effect on our future costs or on future cash flows from our Mexican operations and could adversely affect our financial condition and operating results. Moreover, the economy in Mexico has in the past suffered from high rates of inflation and currency devaluations, which, if they occur again, could adversely affect our financial condition and operating results. Other factors that may affect, and additional risks inherent in, our Mexican operations include:
- •
- foreign trade, monetary and fiscal policies both of the U.S. and of Mexico;
- •
- laws, regulations and other activities of foreign governments, agencies and similar organizations;
- •
- risks associated with having facilities located in a country that has historically been less stable than the U.S.;
- •
- costs and difficulties of managing international operations; and
- •
- adverse tax consequences and greater difficulty in enforcing intellectual property rights in Mexico.
27
The various risks inherent in doing business in the U.S. generally also exist when doing business outside of the United States and may be exaggerated by the difficulty of doing business in numerous sovereign jurisdictions due to differences in culture, laws and regulations.
In Mexico, our associates, contractors or agents could, in contravention of our policies, engage in business practices prohibited by U.S. laws and regulations applicable to us, such as the Foreign Corrupt Practices Act, and we are subject to the risk that one or more of our associates, contractors or agents, including those based in or from countries where practices that violate such U.S. laws and regulations or the laws and regulations of other countries may be customary, will engage in business practices that are prohibited by our policies, circumvent our compliance programs and, by doing so, violate such laws and regulations. Any such violations, even if prohibited by our internal policies, could adversely affect our business, financial condition and operating results.
We also license certain of our trademarks to our Mexico joint venture for use in connection with operating the Smart & Final brand in Mexico. If the licensee fails to maintain the quality of the goods and services used in connection with these trademarks, our rights to and the value of this and similar trademarks could potentially be harmed. Also, negative publicity relating to the licensee could also be incorrectly associated with us, which could harm our business.
We have significant debt service obligations and may incur additional indebtedness in the future, which could adversely affect our financial condition and operating results and our ability to react to changes to our business.
As of June 15, 2014, on a pro forma basis, after giving effect to the application of the net proceeds of this offering as described in "Use of Proceeds," we would have had outstanding indebtedness of approximately $ million. We may incur additional indebtedness in the future, including borrowings under our Revolving Credit Facility. We will continue to have significant debt service obligations following the closing of this offering. Our existing indebtedness, and any additional indebtedness we may incur could require us to divert funds identified for other purposes for debt service and impair our liquidity position. If we cannot generate sufficient cash flow from operations to service our debt, we may need to refinance our debt, dispose of assets or issue equity to obtain necessary funds. We do not know whether we will be able to take any of such actions on a timely basis, on terms satisfactory to us or at all.
The fact that a substantial portion of our cash flow from operations could be needed to make payments on our indebtedness could have important consequences, including the following:
- •
- reducing our ability to execute our growth strategy, including new store development;
- •
- affecting our ability to continue to execute our operational strategies in existing stores;
- •
- increasing our vulnerability to general adverse economic and industry conditions or increased interests rates;
- •
- reducing the availability of our cash flow for other purposes;
- •
- limiting our flexibility in planning for or reacting to changes in our business and the market in which we operate, which
would place us at a competitive disadvantage compared to our competitors that may have less debt;
- •
- limiting our ability to borrow additional funds for working capital, new store growth, capital expenditures and other
investments; and
- •
- failing to comply with the covenants in our debt agreements could result in all of our indebtedness becoming immediately due and payable.
28
Our ability to obtain necessary funds through borrowing will depend on our ability to generate cash flow from operations. Our ability to generate cash is subject to general economic, financial, competitive, legislative, regulatory and other factors that are beyond our control. If our business does not generate sufficient cash flow from operations or if future borrowings are not available to us under our Credit Facilities or otherwise in amounts sufficient to enable us to fund our liquidity needs, our financial condition and operating results may be adversely affected. Our inability to make scheduled payments on our debt obligations in the future would require us to refinance all or a portion of our indebtedness on or before maturity, sell assets, delay capital expenditures or seek additional equity investment.
Covenants in our debt agreements restrict our operational flexibility.
The agreements governing our Credit Facilities contain usual and customary restrictive covenants relating to our management and the operation of our business, including restrictions on the ability of certain of our domestic direct and indirect subsidiaries to:
- •
- incur or guarantee additional indebtedness;
- •
- incur or permit to exist certain liens;
- •
- enter into certain sale and lease-back transactions;
- •
- make certain investments, loans and advances;
- •
- effect certain mergers, consolidations, asset sales and acquisitions;
- •
- pay dividends on, or redeem or repurchase, capital stock, enter into transactions with affiliates, materially change their
respective businesses; and
- •
- repay or modify certain other agreements with respect to other material indebtedness or modify their respective organizational documents.
In addition, the Credit Facilities place certain restrictions on Intermediate Holdings with respect to the incurrence or creation of additional liens on the equity interests of certain subsidiaries, the preservation of its corporate existence and the maintenance of its passive holding company status.
The Revolving Credit Facility includes a "springing" financial maintenance covenant, applicable when availability under the Revolving Credit Facility has fallen below a threshold level and for a specified period of time thereafter. At any time when the financial maintenance covenant is applicable, Smart & Final Stores LLC is required to maintain a fixed charge coverage ratio of not less than 1.0 to 1.0. Our ability to satisfy the financial maintenance covenant under the Revolving Credit Facility, if applicable, could be affected by events beyond our control. Failure to comply with any of the covenants under either of our Credit Facilities could result in a default under the same and a cross-default from one Credit Facility to the other, which could cause our lenders to accelerate the timing of payments and exercise their lien on substantially all of our assets, which would adversely affect our business, financial condition and operating results.
Variable rate indebtedness subjects us to interest rate risk, which could cause our debt service obligations to increase significantly.
Our borrowings under our Credit Facilities bear interest at variable rates and expose us to interest rate risk. If interest rates increase, our debt service obligations on the variable rate indebtedness would increase even though the amount borrowed remains the same and our net income would decrease. A hypothetical 0.50% increase in LIBOR rates applicable to borrowings under the Term Loan Facility, after giving effect to this offering, would increase interest expense related to such debt by approximately $ million per year, and a hypothetical 0.50% increase in LIBOR rates applicable to
29
borrowings under the Revolving Credit Facility would increase interest expense related to such debt by approximately $ million per year, assuming the Revolving Credit Facility is fully borrowed.
Our ability to raise capital in the future may be limited.
Our business and operations may consume resources faster than we anticipate. To support our growth strategy, we must have sufficient capital to continue to make significant investments in our new and existing stores and advertising. We cannot assure you that cash generated by our operations will be sufficient to allow us to fund such expansion. In the future, we may need to raise additional funds through credit, the issuance of new equity or debt securities or a combination of both. Additional financing may not be available on favorable terms or at all. If adequate funds are not available on acceptable terms, we may be unable to fund our capital requirements. If we obtain credit or issue new debt securities, the debt holders would have rights senior to holders of our common stock to make claims on our assets and the terms of any debt could restrict our operations, including our ability to pay dividends on our common stock. If we issue additional equity securities, existing stockholders will experience dilution and the new equity securities could have rights senior to those of our common stock. Because our decision to obtain credit or issue securities in any future offering will depend on market conditions and other factors beyond our control, we cannot predict or estimate the amount, timing or nature of such transactions. Thus, you bear the risk of our future indebtedness or securities offerings reducing the market price of our common stock and/or diluting your interest.
In addition, the credit and securities markets and the financial services industry have recently experienced disruption characterized by the bankruptcy, failure, collapse or sale of various financial institutions, increased volatility in securities prices, diminished liquidity and credit availability and intervention from the U.S. and other governments. The cost and availability of credit has been and may continue to be adversely affected by these conditions. We cannot be certain that funding for our capital needs will be available from our existing financial institutions and the credit and securities markets if needed, and if available, to the extent required, and on acceptable terms.
The Term Loan Facility matures on November 15, 2019, and the Revolving Credit Facility matures on November 15, 2017. If we cannot renew or refinance our Credit Facilities facility upon their respective maturities or, more generally, obtain funding when needed, in each case on acceptable terms, we may be unable to continue our current rate of growth and store expansion, which may have an adverse effect on our sales and operating results.
If our goodwill becomes impaired, we may be required to record a significant charge to earnings.
We have a significant amount of goodwill. As of June 15, 2014, we had goodwill of approximately $611 million, which represented approximately 38% of our total assets as of such date. Goodwill is reviewed for impairment on an annual basis in the fourth fiscal quarter or whenever events occur or circumstances change that would more likely than not reduce the fair value of our reporting unit below its carrying amount. Fair value is determined based on the discounted cash flows and comparable market values of our two reporting units (our Smart & Final stores and our Cash & Carry stores). If the fair value of the reporting unit is less than its carrying value, the fair value of the implied goodwill is calculated as the difference between the fair value of our reporting unit and the fair value of the underlying assets and liabilities, excluding goodwill. In the event an impairment to goodwill is identified, an immediate non-cash charge to earnings in an amount equal to the excess of the carrying value over the implied fair value would be recorded, which would adversely affect our operating results. See "Management's Discussion and Analysis of Financial Condition and Operating Results—Critical Accounting Estimates—Goodwill and Intangible Assets."
30
Determining market values using a discounted cash flow method requires that we make significant estimates and assumptions, including long-term projections of cash flows, market conditions and appropriate market rates. Our judgments are based on historical experience, current market trends and other information. In estimating future cash flows, we rely on internally generated forecasts for operating profits and cash flows, including capital expenditures. Based on our annual impairment test during fiscal years 2013, 2012 and 2011, no goodwill impairment charge was required to be recorded. Changes in estimates of future cash flows caused by items such as unforeseen events or changes in market conditions could adversely affect our reporting units' respective fair values and result in an impairment charge. Factors that could cause us to change our estimates of future cash flows include a prolonged economic crisis, successful efforts by our competitors to gain market share in our core markets, our inability to compete effectively with other retailers or our inability to maintain price competitiveness. An impairment of a significant portion of our goodwill could adversely affect our financial condition and operating results.
Risks Related to this Offering and Ownership of Our Common Stock
You may not be able to resell your shares at or above the offering price or at all, and our stock price may be volatile, which could result in a significant loss or impairment of your investment.
Prior to this offering, there has been no public market for our common stock. An active public market for our common stock may not develop or be sustained after this offering, in which case it may be difficult for you to sell your shares of our common stock at a price that is attractive to you or at all. The price of our common stock in any such market may be higher or lower than the price that you pay in this offering. If you purchase shares of our common stock in this offering, you will pay a price that was not established in a competitive market. Rather, you will pay the price that we negotiated with the representatives of the underwriters, which may not be indicative of prices that will prevail in the trading market.
The trading price of our common stock may be volatile and subject to wide price fluctuations in response to various factors, many of which are beyond our control, including those described above in "—Risks Related to Our Business and Industry" and the following:
- •
- actual or anticipated fluctuations in our quarterly or annual financial results;
- •
- the financial guidance we may provide to the public, any changes in such guidance or our failure to meet such guidance;
- •
- failure of industry or securities analysts to maintain coverage of us, changes in financial estimates by any industry or
securities analysts that follow us or our failure to meet such estimates;
- •
- market factors, including rumors, whether or not correct, involving us or our competitors;
- •
- fluctuations in stock market prices and trading volumes of securities of similar companies;
- •
- sales or anticipated sales of large blocks of our stock;
- •
- short selling of our common stock by investors;
- •
- additions or departures of key personnel;
- •
- announcements of new store openings, commercial relationships, acquisitions or entry into new markets by us or our
competitors;
- •
- failure of any of our initiatives, including our grown strategy, to achieve commercial success;
- •
- regulatory or political developments;
31
- •
- changes in accounting principles or methodologies;
- •
- litigation or governmental investigations;
- •
- negative publicity about us in the media and online; and
- •
- general financial market conditions or events.
Furthermore, the stock markets have experienced extreme price and volume fluctuations that have affected and continue to affect the market prices of equity securities of many companies. These fluctuations sometimes have been unrelated or disproportionate to the operating performance of those companies. These and other factors may cause the market price and demand for our common stock to fluctuate substantially, which may limit or prevent investors from readily selling their shares of common stock and may otherwise adversely affect the price or liquidity of our common stock.
In addition, in the past, when the market price of a stock has been volatile, holders of that stock have sometimes instituted securities class action litigation against the company that issued the stock. If any of our stockholders were to bring a lawsuit against us, we could incur substantial costs defending it or paying for settlements or damages. Such a lawsuit could also divert the time and attention of our management from our operating business. As a result, such litigation may adversely affect our business, financial condition and operating results.
Our principal stockholder will continue to have substantial control over us after this offering, will be able to influence corporate matters and may take actions that conflict with your interests and have the effect of delaying or preventing changes of control or changes in management, or limiting the ability of other stockholders to approve transactions they deem to be in their best interest.
Upon the closing of this offering, our directors, executive officers and holders of more than 5% of our common stock, together with their affiliates, will beneficially own, in the aggregate, approximately % of our outstanding common stock. Ares will beneficially own, in the aggregate, approximately % of our outstanding common stock, or approximately % if the underwriters exercise in full the option to purchase additional shares from Ares. As a result, these stockholders acting together, or Ares acting alone, will be able to exercise significant influence over all matters requiring stockholder approval, including the election of directors and approval of significant corporate transactions, such as a merger or other sale of us or all or substantially all of our assets. The interests of Ares could conflict in material respects with yours, and this concentration of ownership could limit your ability to influence corporate matters and may have the effect of delaying or preventing a third party from acquiring control over us.
The large number of shares eligible for public sale in the future, or the perception of the public that these sales may occur, could depress the market price of our common stock.
The market price of our common stock could decline as a result of (i) sales of a large number of shares of our common stock in the market after this offering, particularly sales by our directors, employees (including our executive officers) and significant stockholders, and (ii) a large number of shares of our common stock being registered or offered for sale. These sales, or the perception that these sales could occur, may depress the market price of our common stock. We will have shares of common stock outstanding after this offering (or shares if the underwriters' option to purchase additional shares is exercised in full). Of these shares, the common stock sold in this offering will be freely tradable, except for any shares purchased by our "affiliates" as defined in Rule 144 ("Rule 144") promulgated under the Securities Act of 1933, as amended (the "Securities Act").
Additionally, as of the closing of this offering, shares of our common stock will be issuable upon exercise of stock options that vest and are exercisable at various dates through , 2024, with an average weighted exercise price of $ per share. Of such options, are currently
32
exercisable. As soon as practicable after the closing of this offering, we intend to file a registration statement on Form S-8 under the Securities Act to register shares of our common stock issued or reserved for issuance under the Incentive Plans. The Form S-8 registration statement will become effective immediately upon filing, and shares covered by that registration statement will thereupon be eligible for sale in the public markets, subject to vesting restrictions, the lock-up agreements described below and Rule 144 limitations applicable to affiliates.
We expect our executive officers and directors and substantially all of our stockholders, including the selling stockholders, to agree to a lock-up agreement, pursuant to which neither we nor they will sell any shares without the prior consent of the representatives of the underwriters for 180 days after the date of this prospectus, subject to certain exceptions and extensions under certain circumstances. In addition, participants in the directed share program described under "Underwriting (Conflicts of Interest)—Directed Share Program" will be subject to similar restrictions during the 180-day period beginning on the date of this prospectus, except with the prior written consent of Credit Suisse Securities (USA) LLC and Morgan Stanley & Co. LLC. Following the expiration of the applicable lock-up period, all these shares of our common stock will be eligible for future sale, subject to the applicable volume, manner of sale, holding period and other limitations of Rule 144. In addition, Ares has certain demand registration rights, and all of our stockholders have piggyback registration rights with respect to the common stock that they will retain following this offering. See "Shares Eligible for Future Sale" for a discussion of the shares of common stock that may be sold into the public market in the future, including common stock held by Ares.
Sales of common stock as restrictions end may make it more difficult for us to sell equity securities in the future at a time and at a price that we deem appropriate.
You will incur immediate and substantial dilution in your investment because our earlier investors paid substantially less than the initial public offering price when they purchased their shares.
If you purchase shares in this offering, you will incur immediate and substantial dilution of $ in net tangible book value per share (or $ if the underwriters' option to purchase additional shares from the selling stockholders is exercised in full), based on an assumed initial public offering price of $ per share, the midpoint of the price range set forth on the cover page of this prospectus, because the price that you pay will be substantially greater than the net tangible book value per share of the shares acquired. This dilution arises because our earlier investors paid substantially less than the initial public offering price when they purchased their shares of our capital stock. Furthermore, there will be options to purchase shares of common stock outstanding upon the closing of this offering that have exercise prices below the initial public offering price. To the extent such options are exercised in the future, there may be further dilution to new investors. See "Dilution."
In the future, we expect to issue options, restricted stock and/or other forms of share-based compensation, which have the potential to dilute stockholders, value and cause the price of our common stock to decline.
We expect to offer stock options, restricted stock and/or other forms of share-based compensation to our directors and employees in the future. If any options that we issue are exercised or any restrictions on restricted stock that we issue lapse, and those shares are sold into the public market, the market price of our common stock may decline. In addition, the availability of shares of common stock for award under the Incentive Plans or the grant of stock options, restricted stock or other forms of share-based compensation may adversely affect the market price of our common stock.
33
Our future operating results may fluctuate significantly and our current operating results may not be a good indication of our future performance. Fluctuations in our quarterly or annual operating results could affect our stock price in the future.
Our operating results have historically varied from period to period and we expect that they will continue to do so as a result of a number of factors, many of which are outside of our control. If our quarterly or annual operating results or our forecasts of future operating results fail to meet the expectations of securities analysts and investors, our common stock price could be adversely affected. Any volatility in our quarterly or annual financial results may make it more difficult for us to raise capital in the future or pursue acquisitions that involve issuances of our stock. Our operating results for prior periods may not be effective predictors of our future performance.
Factors associated with our industry, the operation of our business and the markets for our products may cause our quarterly and annual operating results to fluctuate, including those factors discussed elsewhere in this prospectus.
Although we do not expect to rely on the "controlled company" exemption, since we will qualify as a "controlled company" within the meaning of the New York Stock Exchange upon completion of this offering, we will qualify for exemptions from certain corporate governance requirements.
Under the rules of the New York Stock Exchange (the "NYSE"), a company of which more than 50% of the voting power is held by another person or group of persons acting together is a "controlled company" and may elect not to comply with certain rules of the NYSE regarding corporate governance, including:
- •
- the requirement that our board of directors be composed of a majority of independent directors;
- •
- the requirement that we have a nominating and corporate governance committee of our board of directors composed entirely
of independent directors with a written charter addressing the committee's purpose and responsibilities;
- •
- the requirement that we have a compensation committee of our board of directors composed entirely of independent directors
with a written charter addressing the committee's purpose and responsibilities; and
- •
- the requirement that our board of directors conducts an annual performance evaluation of the nominating and corporate governance committee of our board of directors and the compensation committee of our board of directors.
These requirements will not apply to us as long as we remain a "controlled company." Although we will qualify as a "controlled company" upon completion of this offering, we do not expect to rely on this exemption, and we intend to fully comply with all corporate governance requirements under the rules of the NYSE. However, if we were to utilize some or all of these exemptions, you may not have the same protections afforded to stockholders of companies that are subject to all of the rules of the NYSE regarding corporate governance.
Conflicts of interest may arise because some of our directors are representatives of our principal stockholder.
Funds affiliated with Ares Management may hold equity interests in entities that directly or indirectly compete with us, and companies in which they currently invest may begin competing with us. In addition, Richard A. Anicetti and Norman H. Axelrod provide consulting services to Ares Management and Ares, and Dennis T. Gies, David B. Kaplan and Adam L. Stein are partners or employees of Ares Management or its affiliates. As a result of these relationships, when conflicts arise between the interests of Ares and its affiliates, on the one hand, and the interests of the Company and our other stockholders, on the other hand, these directors may not be disinterested. Although our
34
directors and officers have a duty of loyalty to the Company, under Delaware law, transactions that we enter into in which a director or officer has a financial interest are not void or voidable solely as a result of such interest so long as (i) the material facts relating to the director's or officer's relationship or interest and as to the transaction are disclosed or are known to our board of directors and a majority of our disinterested directors, or a committee consisting solely of disinterested directors approves the transaction, (ii) the material facts relating to the director's or officer's relationship or interest and as to the transaction are disclosed or are known to our stockholders and a majority of our disinterested stockholders specifically approves the transaction or (iii) the transaction is otherwise fair to us. Under our amended and restated certificate of incorporation (our "certificate of incorporation"), representatives of Ares are not required to offer to us any business opportunity of which they become aware and could take any such opportunity for themselves or offer it to other companies in which they have an investment, unless such opportunity is offered to them in writing solely in their capacity as an officer or director of us.
Our management will have broad discretion over the use of the proceeds we receive in this offering and might not apply the proceeds in ways that increase the value of your investment.
Our management will have broad discretion to use the net proceeds from this offering and you will be relying on the judgment of our management regarding the application of such proceeds. Our management might not apply the net proceeds of this offering in ways that increase the value of your investment. We expect to use the net proceeds from this offering to pay down indebtedness, to fund our growth initiatives and for general corporate purposes. We have not allocated these net proceeds for any specific purposes. Our management might not be able to generate a significant return, if any, on any investment of these net proceeds. You will not have the opportunity to influence management's decisions regarding how to use the net proceeds from this offering.
Anti-takeover provisions could impair a takeover attempt and adversely affect existing stockholders and the market value of our common stock.
Certain provisions of our certificate of incorporation and bylaws that will be in effect upon the closing of this offering and applicable provisions of Delaware law may have the effect of rendering more difficult, delaying or preventing an acquisition of our company, even when such an acquisition would be in the best interest of our stockholders. These provisions include:
- •
- a classified board of directors;
- •
- the inability of stockholders to remove directors without cause from and after the time that Ares and its affiliates cease
to beneficially own shares of capital stock representing at least a majority of our outstanding stock (the "Trigger Date");
- •
- the sole power of our board of directors to fix the number of directors;
- •
- the requirement that certain advance notice procedures be followed for our stockholders to submit nominations of
candidates for election to our board of directors and to bring other proposals before a meeting of the stockholders;
- •
- the power of our board of directors to amend our bylaws without stockholder approval;
- •
- the sole power of the board of directors to fill any newly created directorship or vacancy on the board of directors,
whether such vacancy occurs as a result of the resignation, removal or death of a director or otherwise;
- •
- the ability of our board of directors to designate one or more series of preferred stock and issue shares of preferred
stock without stockholder approval;
- •
- the inability of stockholders to act by written consent from and after the Trigger Date;
35
- •
- the requirement that, to the fullest extent permitted by law and unless we consent to an alternate forum, certain
proceedings against or involving us or our directors, officers or employees be brought exclusively in the Court of Chancery in the State of Delaware;
- •
- the requirement that, to the fullest extent permitted by law, a stockholder reimburse us for all fees, costs and expenses
incurred by us in connection with a proceeding initiated by such stockholder in which such stockholder does not obtain a judgment on the merits that substantially achieves the full remedy sought;
- •
- the lack of cumulative voting rights at elections of directors; and
- •
- the inability of stockholders to call special meetings.
Our issuance of shares of preferred stock could delay, defer or prevent a change of control of the Company without further action by our stockholders, even where stockholders are offered a premium for their shares. Our board of directors has the authority to cause us to issue, without any further vote or action by our stockholders, up to shares of preferred stock, par value $0.001 per share, in one or more series, to designate the number of shares constituting any series and to fix the rights, preferences, privileges of such series and qualifications, limitations and restrictions thereof, including, without limitation, dividend rights, voting rights, conversion rights, rights and terms of redemption, redemption price or prices and liquidation preferences of such series.
In addition, the issuance of shares of preferred stock with voting rights may adversely affect the voting power of the holders of our other classes of voting stock either by diluting the voting power of our other classes of voting stock if they vote together as a single class, or by giving the holders of any such preferred stock the right to block an action on which they have a separate class vote even if the action were approved by the holders of our other classes of voting stock. We currently do not anticipate issuing any shares of preferred stock in the foreseeable future.
These provisions could delay or prevent hostile takeovers and changes in control or changes in our management. Also, the issuance of shares of preferred stock with dividend or conversion rights, liquidation preferences or other economic terms favorable to the holders of preferred stock could adversely affect the market price for our common stock by making an investment in our common stock less attractive. For example, a conversion feature could cause the trading price of our common stock to decline to the conversion price of the preferred stock. Any provision of our certificate of incorporation or bylaws or Delaware law that has the effect of delaying or deterring a change in control or otherwise makes an investment in our common stock less attractive could limit the opportunity for our stockholders to receive a premium for their shares of our common stock and could also affect the price that some investors are willing to pay for our common stock. See "Description of Capital Stock."
The provision of our certificate of incorporation requiring exclusive venue in the Court of Chancery in the State of Delaware for certain types of lawsuits may have the effect of discouraging lawsuits against our directors and officers.
Our certificate of incorporation, as it will be in effect upon the closing of this offering, will require, to the fullest extent permitted by law, unless otherwise consented to by us, that (i) any derivative action or proceeding brought on our behalf, (ii) any action asserting a claim of breach of a fiduciary duty owed by any of our directors, officers or other employees to us or our stockholders, (iii) any action asserting a claim arising pursuant to any provision of the General Corporation Law of the State of Delaware (the "DGCL") or our certificate of incorporation or the bylaws or (iv) any action asserting a claim governed by the internal affairs doctrine will have to be brought only in the Court of Chancery in the State of Delaware. Although we believe this provision benefits us by providing increased consistency in the application of Delaware law in the types of lawsuits to which it applies and by
36
avoiding the time and expense of multi-forum litigation, the provision may have the effect of discouraging lawsuits against our directors and officers.
Since we do not expect to pay any cash dividends for the foreseeable future, investors in this offering may be forced to sell their stock in order to obtain a return on their investment.
We do not anticipate declaring or paying in the foreseeable future any cash dividends on our capital stock. Instead, we plan to retain any earnings to finance our operations and growth plans discussed elsewhere in this prospectus. In addition, our Credit Facilities contain covenants that would restrict the ability of our operating subsidiaries to pay cash dividends to us. Accordingly, investors must rely on sales of their common stock after price appreciation, which may never occur, as the only way to realize any return on their investment. As a result, investors seeking cash dividends should not purchase our common stock.
We will incur increased costs as a result of being, and our management has limited experience managing, a public company, and our current resources may not be sufficient to fulfill our public company obligations.
We will incur significant legal, accounting and other expenses as a public company, including costs resulting from public company reporting obligations of the Securities and Exchange Commission (the "SEC") under the Securities Exchange Act of 1934, as amended (the "Exchange Act"), and the rules and regulations regarding corporate governance practices, including those under the Sarbanes-Oxley Act of 2002 (the "Sarbanes-Oxley Act"), the Dodd-Frank Act of 2010 and the listing requirements of the NYSE. These requirements, including record keeping, financial reporting and corporate governance rules and regulations, will increase our legal and financial compliance costs and will make some activities more time-consuming and costly. Any changes that we make to comply with these obligations may not be sufficient to allow us to satisfy our obligations as a public company on a timely basis or at all.
Our management and other personnel have limited experience in managing a public company and will need to devote a substantial amount of time to ensure that we comply with all of these requirements. Our internal infrastructure may not have adequate resources to support the increased reporting obligations associated with being a public company and we may be unable to hire, train or retain necessary staff and may initially be reliant on engaging outside consultants or professionals to overcome our lack of experience. Our business could be adversely affected if our internal infrastructure is inadequate, we are unable to engage outside consultants or are otherwise unable to fulfill our public company obligations.
If we are unable to implement and maintain effective internal control over financial reporting in the future, we may fail to prevent or detect material misstatements in our financial statements, in which case investors may lose confidence in the accuracy and completeness of our financial reports and the market price of our common stock may decline.
As a public company, we will be required to maintain internal control over financial reporting and to report any material weaknesses in such internal control. In addition, we will be required to file a report by management on the effectiveness of our internal control over financial reporting pursuant to Section 404 of the Sarbanes-Oxley Act beginning with our 2015 annual report on Form 10-K to be filed in 2016. We are in the process of designing, implementing and testing the internal control over financial reporting required to comply with this future obligation, which is a time-consuming, costly and complicated process. In addition, beginning with our 2015 annual report on Form 10-K to be filed in 2016, our independent registered public accounting firm will be required to attest to the effectiveness of our internal control over financial reporting.
37
If we identify any material weaknesses in our internal control over financial reporting, if we are unable to comply with the requirements of Section 404 in a timely manner or assert that our internal control over financial reporting is effective or if our independent registered public accounting firm is unable to express an opinion as to the effectiveness of our internal control over financial reporting when required, investors may lose confidence in the accuracy and completeness of our financial reports and the market price of our common stock could be adversely affected. In addition, we could become subject to investigations by the NYSE, the SEC or other regulatory authorities, which could require additional financial and management resources.
Our holding company structure makes us dependent on our subsidiaries for our cash flow and subordinates your rights as a stockholder to the rights of creditors of our subsidiaries in the event of an insolvency or liquidation of any of our subsidiaries.
We are a holding company and, accordingly, substantially all of our operations are conducted through our subsidiaries. Our subsidiaries are separate and distinct legal entities. As a result, our cash flow depends upon the earnings of our subsidiaries. In addition, we depend on the distribution of earnings, loans or other payments by our subsidiaries to us, which is restricted by the covenants in the agreements governing our Credit Facilities. Our subsidiaries have no obligation to provide us with funds for our payment obligations. If there is an insolvency, liquidation or other reorganization of any of our subsidiaries, you as a stockholder will have no right to proceed against their assets. Creditors of those subsidiaries will be entitled to payment in full from the sale or other disposal of the assets of those subsidiaries before we, as a stockholder, would be entitled to receive any distribution from that sale or disposal.
If securities or industry analysts do not publish or cease publishing research or reports about us, our business or our industry, or if they adversely change their recommendations regarding our stock, our stock price and trading volume could decline.
The trading market for our common stock will be influenced by the research and reports that industry or securities analysts may publish about us, our business, our industry or our competitors. If we do not establish and maintain adequate research coverage or if any of the analysts who may cover us downgrade our stock, publish inaccurate or unfavorable research about our business or provide relatively more favorable recommendations about our competitors, our stock price could decline. If any analyst who may cover us were to cease coverage of our company or fail to regularly publish reports about us, we could lose visibility in the financial markets, which in turn could cause our stock price or trading volume to decline.
38
SPECIAL NOTE REGARDING FORWARD-LOOKING STATEMENTS
This prospectus, including the sections entitled "Prospectus Summary," "Risk Factors," "Use of Proceeds," "Management's Discussion and Analysis of Financial Condition and Results of Operations" and "Business," contains forward-looking statements. All statements other than statements of historical fact contained in this prospectus, including statements regarding our future operating results and financial position, business strategy and plans and objectives of management for future operations, are forward-looking statements. In many cases, you can identify forward-looking statements by terms such as "may," "should," "expects," "plans," "anticipates," "could," "intends," "target," "projects," "contemplates," "believes," "estimates," "predicts," "potential" or "continue" or the negative of these terms or other similar expressions.
The forward-looking statements contained in this prospectus reflect our views as of the date of this prospectus about future events and are subject to risks, uncertainties, assumptions and changes in circumstances that may cause our actual results, performance or achievements to differ significantly from those expressed or implied in any forward-looking statement. Although we believe that the expectations reflected in the forward-looking statements in this prospectus are reasonable, we cannot guarantee future events, results, performance or achievements. A number of important factors could cause actual results to differ materially from those indicated by the forward-looking statements in this prospectus, including, without limitation, those factors described in "Risk Factors" and "Management's Discussion and Analysis of Financial Condition and Results of Operations." Some of the key factors that could cause actual results to differ from our expectations include the following:
- •
- competition in our industry is intense and our failure to compete successfully may adversely affect our sales, financial
condition and operating results;
- •
- our continued growth depends on new store openings and our failure to successfully open new stores could adversely affect
our business and stock price;
- •
- real or perceived quality or food safety concerns could adversely affect our business, operating results and reputation;
- •
- we may be unable to maintain or increase comparable store sales, which could adversely affect our business and stock
price;
- •
- the current geographic concentration of our stores and our net sales creates an exposure to local or regional downturns or
catastrophic occurrences;
- •
- disruption of significant supplier relationships could adversely affect our business;
- •
- any significant interruption in the operations of our distribution centers or common carriers could disrupt our ability to
deliver our products in a timely manner;
- •
- our failure to comply with laws, rules and regulations affecting us and our industry could adversely affect our financial
condition and operating results;
- •
- disruptions to or security breaches involving our information technology systems could harm our ability to run our
business;
- •
- we have significant debt service obligations and may incur additional indebtedness in the future, which could adversely
affect our financial condition and operating results and our ability to react to changes to our business; and
- •
- covenants in our debt agreements restrict our operational flexibility.
Readers are urged to consider these factors carefully in evaluating the forward-looking statements in this prospectus and are cautioned not to place undue reliance on these forward-looking statements. All of the forward-looking statements in this prospectus are based on information available to us on the date of this prospectus. We undertake no obligation to publicly update or revise any forward-looking statement, whether as a result of new information, future events or otherwise, except as otherwise required by law.
39
We estimate that our net proceeds from the sale of our common stock in this offering will be approximately $ million, assuming an initial public offering price of $ per share, which is the midpoint of the price range set forth on the cover page of this prospectus, and after deducting the estimated underwriting discount and estimated offering expenses payable by us.
A $1.00 increase (decrease) in the assumed initial public offering price of $ per share would increase (decrease) the net proceeds to us from this offering by $ million, assuming the number of shares offered by us, as set forth on the cover page of this prospectus, remained the same and after deducting the estimated underwriting discount and estimated offering expenses payable by us. Similarly, a one million share increase (decrease) in the number of shares offered by us, as set forth on the cover of this prospectus, would increase (decrease) the net proceeds to us from this offering by $ million, assuming the assumed initial public offering price of $ per share, which is the midpoint of the price range set forth on the cover page of this prospectus, remained the same and after deducting the estimated underwriting discount and estimated offering expenses payable by us.
We intend to use approximately $ million of the net proceeds from this offering to repay borrowings under the Term Loan Facility. As of June 15, 2014, the interest rate on the Term Loan Facility, which is scheduled to mature on November 15, 2019, was 4.75%. See "Description of Certain Indebtedness" for more information. We intend to use the remaining net proceeds from this offering to fund our growth initiatives and for general corporate purposes. We will have broad discretion in the way we use the net proceeds.
Affiliates of Credit Suisse Securities (USA) LLC, Morgan Stanley & Co. LLC and Guggenheim Securities, LLC, underwriters in this offering, are lenders under the Term Loan Facility and therefore will receive a portion of the net proceeds of this offering. See "Underwriting (Conflicts of Interest)."
In addition, funds affiliated with Ares hold approximately 10% of the outstanding loans under the Term Loan Facility and will receive funds representing their pro rata portion of such loans.
We will not receive any proceeds from the sale of shares by the selling stockholders, which are entities affiliated with Ares Management, pursuant to the underwriters' option to purchase additional shares. See "Principal and Selling Stockholders."
40
We do not anticipate declaring or paying in the foreseeable future any cash dividends on our capital stock. Any future determination as to the declaration and payment of dividends, if any, will be at the discretion of our board of directors and will depend on then existing conditions, including our operating results, financial condition, contractual restrictions, capital requirements, business prospects and other factors our board of directors may deem relevant. Our Credit Facilities contain covenants that would restrict our ability to pay cash dividends. See "Risk Factors—Risks Related to Our Business and Industry—Covenants in our debt agreements restrict our operational flexibility."
41
The following table sets forth our cash and cash equivalents and capitalization as of June 15, 2014 on:
- •
- an actual basis; and
- •
- a pro forma basis, giving effect to:
- •
- the issuance and sale of shares of our common stock in this offering at an assumed initial public offering
price of $ per share, which is the midpoint of the price range set forth on the cover page of this prospectus, after deducting estimated underwriting discounts and commissions and
estimated expenses payable by us and the application of the estimated net proceeds from this offering as described under "Use of Proceeds"; and
- •
- the -for-one stock split of our common stock to be effected prior to the closing of this offering; and
The table below should be read in conjunction with "Use of Proceeds," "Selected Historical Consolidated Financial Information and Other Data," "Management's Discussion and Analysis of Financial Condition and Results of Operations," "Description of Capital Stock," and our consolidated financial statements and the related notes included in this prospectus.
| |
As of June 15, 2014 | ||||||
|---|---|---|---|---|---|---|---|
| |
Actual | Pro Forma(1) | |||||
| |
(in thousands, except share data) |
||||||
Cash and cash equivalents |
$ | 65,561 | $ | ||||
| | | | | | | | |
| | | | | | | | |
Long-term debt (including current portion and debt discount of $8,912) |
$ | 703,276 | |||||
| | | | | | | | |
Stockholders' equity: |
|||||||
Undesignated preferred stock, par value $0.001 per share; 375,000 shares authorized, no shares issued and outstanding, actual and pro forma |
— | ||||||
Common stock, par value $0.001 per share; 750,000 shares authorized, actual; shares authorized, pro forma; 303,195 shares issued and outstanding, actual; shares issued and outstanding, pro forma |
— | ||||||
Additional paid-in capital |
312,324 | ||||||
Retained earnings/(accumulated deficit) |
12,505 | ||||||
Accumulated other comprehensive income |
29,061 | ||||||
| | | | | | | | |
Total stockholders' equity |
$ | 353,890 | $ | ||||
| | | | | | | | |
Total capitalization |
$ | 1,057,166 | $ | ||||
| | | | | | | | |
| | | | | | | | |
- (1)
- A
$1.00 increase (decrease) in the assumed initial public offering price of $ per share, which is the midpoint of the price range set forth
on the cover page of this prospectus, would result in approximately a $ million increase (decrease) in the pro forma amounts of each of (i) cash and cash equivalents,
(ii) long-term debt, including current portion, (iii) total debt, (iv) additional paid-in capital, (v) total stockholders' equity and (vi) total capitalization,
assuming the number of shares offered by us, as set forth on the cover page of this prospectus, remained the same and after deducting the estimated underwriting discount and estimated offering
expenses payable by us.
Similarly, a one million share increase (decrease) in the number of shares offered by us, as set forth on the cover of this prospectus, would result in approximately a $ million increase (decrease) in the pro forma amounts of each of (i) cash and cash equivalents, (ii) long-term debt, including current portion, (iii) total debt, (iv) additional paid-in capital, (v) total stockholders' equity and (vi) total capitalization, assuming the assumed initial public offering price of $ per share, which is the midpoint of the price range set forth on the cover of this prospectus, remained the same and before deducting the estimated underwriting discount and estimated offering expenses payable by us.
42
If you invest in our common stock, your interest will be immediately diluted to the extent of the difference between the initial public offering price per share of our common stock and the pro forma net tangible book value per share of our common stock immediately after this offering.
The net tangible book value of our common stock as of June 15, 2014 was $ million, or $ per share. Net tangible book value is the amount of our total tangible assets less our total liabilities. Net tangible book value per share is our net tangible book value, divided by the number of outstanding shares, after giving effect to the -for-one stock split of our common stock to be effected prior to the closing of this offering.
Pro forma net tangible book value and pro forma net tangible book value per share give effect to the (i) the sale by us of shares of common stock in this offering at an assumed initial public offering price of $ per share, which is the midpoint of the price range set forth on the cover page of this prospectus, and after deducting the estimated underwriting discount and estimated offering expenses payable by us, and (ii) application of the net proceeds received by us as described under "Use of Proceeds." The pro forma net tangible book value of our common stock as of June 15, 2014 was approximately $ million, or approximately $ per share. This represents an immediate increase in pro forma net tangible book value of $ per share to our existing stockholders and an immediate dilution of $ per share to investors purchasing common stock in this offering.
The following table illustrates this dilution on a per share basis to new investors:
Assumed initial public offering price per share |
$ | ||||||
Net tangible book value per share as of June 15, 2014 |
$ | ||||||
Increase in pro forma net tangible book value per share attributable to new investors purchasing shares in this offering |
|||||||
| | | | | | | | |
Pro forma net tangible book value per share after this offering |
|||||||
| | | | | | | | |
Dilution per share to new investors purchasing shares in this offering |
$ | ||||||
| | | | | | | | |
| | | | | | | | |
A $1.00 increase (decrease) in the assumed initial public offering price of $ per share, which is the midpoint of the price range set forth on the cover page of this prospectus would increase (decrease) the pro forma net tangible book value after this offering by $ per share and the dilution to new investors by $ per share, assuming the number of shares offered by us, as set forth on the cover page of this prospectus, remained the same and after deducting the estimated underwriting discount and estimated offering expenses payable by us.
Similarly, a one million share increase (decrease) in the number of shares offered by us, as set forth on the cover of this prospectus, would increase (decrease) the pro forma net tangible book value (deficit) after this offering by approximately $ per share and decrease (increase) the dilution in pro forma to investors participating in this offering by approximately $ per share, assuming the assumed initial public offering price of $ per share, which is the midpoint of the price range set forth on the cover of this prospectus, remained the same and after deducting the estimated underwriting discount and estimated offering expenses payable by us.
If the underwriters were to fully exercise their option to purchase additional shares of our common stock from the selling stockholders, the pro forma net tangible book value per share as of , 2014 would be $ per share, and the dilution in pro forma net tangible book value per share to new investors in this offering would be $ per share.
The table below summarizes, as of June 15, 2014, on a pro forma basis described above, the number of shares of our common stock, the total consideration and the average price per share (i) paid to us by our existing stockholders and (ii) to be paid by new investors purchasing our common stock in
43
this offering at an assumed initial public offering price of $ per share, which is the midpoint of the price range set forth on the cover page of this prospectus, before deducting the estimated underwriting discount and estimated offering expenses payable by us.
| |
|
|
Total Consideration |
|
||||||||||||
|---|---|---|---|---|---|---|---|---|---|---|---|---|---|---|---|---|
| |
Shares Purchased | |
||||||||||||||
| |
Average Price Per Share |
|||||||||||||||
| |
Number | Percent | Amount | Percent | ||||||||||||
Existing stockholders |
% | $ | % | $ | ||||||||||||
New investors |
% | % | ||||||||||||||
| | | | | | | | | | | | | | | | | |
Total |
100.0 | % | 100.0 | % | ||||||||||||
| | | | | | | | | | | | | | | | | |
| | | | | | | | | | | | | | | | | |
A $1.00 increase (decrease) in the assumed initial public offering price of $ per share, which is the midpoint of the price range set forth on the cover page of this prospectus, would increase (decrease) total consideration paid by new investors by $ and increase (decrease) the percentage of total consideration paid by new investors by %, assuming the number of shares offered by us, as set forth on the cover page of this prospectus, remained the same and before deducting the estimated underwriting discount and estimated offering expenses payable by us.
Similarly, a one million share increase (decrease) in the number of shares offered by us, as set forth on the cover of this prospectus, would increase (decrease) total consideration paid by new investors by $ and increase (decrease) the percent of total consideration paid by new investors by %, assuming the assumed initial public offering price of $ per share, which is the midpoint of the price range set forth on the cover of this prospectus, remained the same and before deducting the estimated underwriting discount and estimated offering expenses payable by us.
If the underwriters' option to purchase additional shares from the selling stockholders in this offering is exercised in full, the percentage of shares of our common stock held by existing stockholders will be reduced to % of the total number of shares of our common stock outstanding after this offering, and the number of shares held by new investors will increase to shares, or % of the total number of shares of our common stock outstanding after this offering.
The discussion and tables above are based on shares of our common stock outstanding as of June 15, 2014, assuming the -for-one stock split of our common stock to be effected prior to the closing of this offering, and exclude the following:
- •
- shares of common stock issuable upon the exercise of stock options outstanding as of June 15, 2014
at a weighted average exercise price of $ per share; and
- •
- shares of common stock reserved for future issuance under the Incentive Plans.
If all of these outstanding options were exercised, then our existing stockholders, including the holders of these outstanding options, would own % and our new investors would own % of the total number of shares of our common stock outstanding upon the closing of this offering. In such event, the total consideration paid by our existing stockholders, including the holders of these outstanding options, would be approximately $ million, or %, the total consideration paid by our new investors would be $ million, or %, the average price per share paid by our existing stockholders would be $ , and the average price per share paid by our new investors would be $ .
In addition, we may choose to raise additional capital due to market conditions or strategic considerations even if we believe we have sufficient funds for our current or future operating plans. To the extent that additional capital is raised through the sale of equity or convertible debt securities, the issuance of such securities could result in further dilution to our stockholders.
44
SELECTED HISTORICAL CONSOLIDATED FINANCIAL INFORMATION AND OTHER DATA
The following table sets forth our selected historical consolidated financial information and other data for the periods and dates indicated, and should be read together with "Risk Factors," "Management's Discussion and Analysis of Financial Condition and Results of Operations" and our audited consolidated financial statements and unaudited interim consolidated financial statements related notes included elsewhere in this prospectus. Our historical results are not necessarily indicative of our financial condition or operating results to be expected in the future.
The consolidated statements of operations data for the year ended December 29, 2013, the period from January 2, 2012 through November 14, 2012, the period from November 15, 2012 through December 30, 2012, and the year ended January 1, 2012, and the consolidated balance sheet data as of December 29, 2013 and December 30, 2012 have been derived from our audited consolidated financial statements included elsewhere in this prospectus. The consolidated statements of operations data for the years ended January 2, 2011 and January 3, 2010 and the consolidated balance sheet data as of January 1, 2012, January 2, 2011 and January 3, 2010 have been derived from our audited consolidated financial statements not included in this prospectus. The consolidated statements of operations for the twelve-week and twenty-four-week periods ended June 15, 2014 and June 16, 2013 and the consolidated balance sheet data as of June 15, 2014 have been derived from our unaudited interim consolidated financial statements included elsewhere in this prospectus. The consolidated balance sheet data as of June 16, 2013 has been derived from our unaudited interim consolidated financial statements of our business not included in this prospectus. The unaudited interim consolidated financial statements have been prepared on the same basis as the audited consolidated financial statements and, in the opinion of our management, include all adjustments, consisting only of normal and recurring adjustments, necessary for a fair presentation of the information set forth herein. Interim financial results are not necessarily indicative of results that may be expected for the full fiscal year or any future reporting period.
In connection with the Ares Acquisition, as a result of the application of business combination accounting, the assets and liabilities of the Company were adjusted to their estimated fair values as of the closing date of the Ares Acquisition. We refer to the Company prior to the Ares Acquisition as the "Predecessor." The periods prior to the Ares Acquisition are referred to as the "Predecessor periods" and the periods following the Ares Acquisition are referred to as the "Successor periods." Our fiscal year 2012 is therefore divided into a Predecessor period from January 2, 2012 through November 14, 2012 and a Successor period from November 15, 2012 through December 30, 2012. Accordingly, in this prospectus, financial information is presented separately for Predecessor and Successor periods, which relate to the accounting periods preceding and succeeding the closing of the Ares Acquisition.
45
| |
Successor | |
Predecessor | ||||||||||||||||||||||||||||||
|---|---|---|---|---|---|---|---|---|---|---|---|---|---|---|---|---|---|---|---|---|---|---|---|---|---|---|---|---|---|---|---|---|---|
| |
Twenty- Four Weeks Ended June 15, 2014 |
Twenty- Four Weeks Ended June 16, 2013 |
Twelve Weeks Ended June 15, 2014 |
Twelve Weeks Ended June 16, 2013 |
Fiscal Year 2013 |
Period From November 15, 2012 Through December 30, 2012 |
|
Period From January 2, 2012 Through November 14, 2012 |
Fiscal Year 2011 |
Fiscal Year 2010 |
Fiscal Year 2009(1) |
||||||||||||||||||||||
| |
(Dollars in thousands, except per share data) |
||||||||||||||||||||||||||||||||
Consolidated Statement of Operations Data: |
|||||||||||||||||||||||||||||||||
Net sales |
$ | 1,563,087 | $ | 1,446,101 | $ | 828,071 | $ | 755,943 | $ | 3,210,293 | $ | 378,550 | $ | 2,664,162 | $ | 2,840,336 | $ | 2,591,116 | $ | 2,558,183 | |||||||||||||
Cost of sales, buying and occupancy |
1,330,313 | 1,232,778 | 699,886 | 642,528 | 2,736,357 | 333,787 | 2,265,154 | 2,412,180 | 2,218,618 | 2,176,160 | |||||||||||||||||||||||
| | | | | | | | | | | | | | | | | | | | | | | | | | | | | | | | | | |
Gross margin |
232,774 | 213,323 | 128,185 | 113,415 | 473,936 | 44,763 | 399,008 | 428,156 | 372,498 | 382,023 | |||||||||||||||||||||||
Operating and administrative expenses |
193,849 | 174,039 | 101,491 | 88,463 | 387,133 | 51,727 | 355,681 | 379,371 | 341,921 | 344,547 | |||||||||||||||||||||||
Income (loss) on property sales |
— | — | — | — | — | (5 | ) | 8,818 | 1,952 | — | — | ||||||||||||||||||||||
| | | | | | | | | | | | | | | | | | | | | | | | | | | | | | | | | | |
Income (loss) from operations |
38,925 | 39,284 | 26,694 | 24,952 | 86,803 | (6,959 | ) | 34,509 | 46,833 | 30,577 | 37,476 | ||||||||||||||||||||||
Interest expense, net |
17,758 | 25,429 | 8,922 | 12,467 | 50,365 | 7,133 | 20,761 | 31,395 | 33,330 | 42,134 | |||||||||||||||||||||||
(Loss) on early extinguishment of debt(2) |
— | (7,139 | ) | — | (7,139 | ) | (24,487 | ) | — | — | (4,209 | ) | — | — | |||||||||||||||||||
Equity in earnings of joint venture |
714 | 521 | 262 | 172 | 1,649 | — | 820 | 785 | 1,772 | 330 | |||||||||||||||||||||||
| | | | | | | | | | | | | | | | | | | | | | | | | | | | | | | | | | |
Income (loss) from continuing operations before income taxes |
21,881 | 7,237 | 18,034 | 5,518 | 13,600 | (14,092 | ) | 14,568 | 12,014 | (981 | ) | (4,328 | ) | ||||||||||||||||||||
Income tax (provision) benefit |
(8,259 | ) | (2,110 | ) | (6,919 | ) | (1,920 | ) | (5,429 | ) | 4,804 | (244 | ) | (4,795 | ) | 920 | 1,418 | ||||||||||||||||
| | | | | | | | | | | | | | | | | | | | | | | | | | | | | | | | | | |
Income (loss) from continuing operations |
13,622 | 5,127 | 11,115 | 3,598 | 8,171 | (9,288 | ) | 14,324 | 7,219 | (61 | ) | (2,910 | ) | ||||||||||||||||||||
Income (loss) from discontinued operations, net of income taxes(3) |
— | — | — | — | — | — | — | 3,260 | (12,870 | ) | 10,987 | ||||||||||||||||||||||
| | | | | | | | | | | | | | | | | | | | | | | | | | | | | | | | | | |
Net income (loss) |
$ | 13,622 | $ | 5,127 | $ | 11,115 | $ | 3,598 | $ | 8,171 | $ | (9,288 | ) | $ | 14,324 | $ | 10,479 | $ | (12,931 | ) | $ | 8,077 | |||||||||||
| | | | | | | | | | | | | | | | | | | | | | | | | | | | | | | | | | |
Per Share Data: |
|||||||||||||||||||||||||||||||||
Basic earnings (loss) per share: |
|||||||||||||||||||||||||||||||||
Income (loss) per share from continuing operations |
$ | 45.24 | $ | 17.13 | $ | 36.88 | $ | 12.02 | $ | 27.22 | $ | (31.04 | ) | $ | 1.07 | $ | 0.54 | $ | (0.00 | ) | $ | (0.22 | ) | ||||||||||
Income (loss) per share from discontinued operations, net of income taxes |
— | — | — | — | — | — | — | 0.24 | (0.96 | ) | 0.82 | ||||||||||||||||||||||
| | | | | | | | | | | | | | | | | | | | | | | | | | | | | | | | | | |
Basic earnings (loss) per share |
$ | 45.24 | $ | 17.13 | $ | 36.88 | $ | 12.02 | $ | 27.22 | $ | (31.04 | ) | $ | 1.07 | $ | 0.78 | $ | (0.97 | ) | $ | 0.60 | |||||||||||
| | | | | | | | | | | | | | | | | | | | | | | | | | | | | | | | | | |
Diluted earnings (loss) per share: |
|||||||||||||||||||||||||||||||||
Income (loss) per share from continuing operations |
$ | 43.64 | $ | 16.48 | $ | 35.61 | $ | 11.55 | $ | 26.14 | $ | (31.04 | ) | $ | 1.03 | $ | 0.54 | $ | (0.00 | ) | $ | (0.22 | ) | ||||||||||
Income (loss) per share from discontinued operations, net of income taxes |
— | — | — | — | — | — | — | 0.24 | (0.96 | ) | 0.82 | ||||||||||||||||||||||
| | | | | | | | | | | | | | | | | | | | | | | | | | | | | | | | | | |
Diluted earnings (loss) per share |
$ | 43.64 | $ | 16.48 | $ | 35.61 | $ | 11.55 | $ | 26.14 | $ | (31.04 | ) | $ | 1.03 | $ | 0.78 | $ | (0.97 | ) | $ | 0.60 | |||||||||||
| | | | | | | | | | | | | | | | | | | | | | | | | | | | | | | | | | |
Weighted average shares outstanding—basic |
301,133 | 299,304 | 301,365 | 299,407 | 300,158 | 299,201 | 13,363,635 | 13,362,665 | 13,367,108 | 13,377,740 | |||||||||||||||||||||||
Weighted average shares outstanding—diluted |
312,121 | 311,098 | 312,172 | 311,516 | 312,566 | 299,201 | 13,927,566 | 13,425,470 | 13,367,108 | 13,377,740 | |||||||||||||||||||||||
Selected Operating Data: |
|||||||||||||||||||||||||||||||||
Comparable store sales growth(4) |
5.3 | % | 4.9 | % | 6.3 | % | 4.7 | % | 4.0 | % | 5.3 | % | 6.9 | % | 9.5 | % | 2.9 | % | 3.8 | % | |||||||||||||
Smart & Final banner |
4.2 | % | 4.5 | % | 4.9 | % | 4.3 | % | 3.4 | % | 5.2 | % | 7.3 | % | 9.4 | % | 2.8 | % | 5.5 | % | |||||||||||||
Cash & Carry banner |
8.4 | % | 6.1 | % | 10.5 | % | 5.9 | % | 6.1 | % | 5.5 | % | 5.4 | % | 9.7 | % | 3.3 | % | (1.3 | )% | |||||||||||||
Stores at end of period |
246 |
237 |
246 |
237 |
240 |
235 |
236 |
234 |
234 |
234 |
|||||||||||||||||||||||
Smart & Final banner |
194 | 185 | 194 | 185 | 188 | 183 | 184 | 182 | 182 | 182 | |||||||||||||||||||||||
Extra! format |
80 | 63 | 80 | 63 | 69 | 56 | 56 | 46 | 35 | 32 | |||||||||||||||||||||||
Cash & Carry banner |
52 | 52 | 52 | 52 | 52 | 52 | 52 | 52 | 52 | 52 | |||||||||||||||||||||||
Square feet at end of period |
5,101,815 |
4,820,201 |
5,101,815 |
4,820,201 |
4,899,403 |
4,756,165 |
4,774,486 |
4,697,834 |
4,665,795 |
4,633,109 |
|||||||||||||||||||||||
Average store size at end of period(5) |
20,739 | 20,338 | 20,739 | 20,338 | 20,414 | 20,239 | 20,231 | 20,076 | 19,939 | 19,800 | |||||||||||||||||||||||
46
| |
Successor | |
Predecessor | ||||||||||||||||||||||||
|---|---|---|---|---|---|---|---|---|---|---|---|---|---|---|---|---|---|---|---|---|---|---|---|---|---|---|---|
| |
As of |
|
As of | ||||||||||||||||||||||||
| |
June 15, 2014 |
June 16, 2013 |
December 29, 2013 |
December 30, 2012 |
|
November 14, 2012 |
January 1, 2012 |
January 2, 2011 |
January 3, 2010 |
||||||||||||||||||
| |
(Dollars in thousands, except per share data) |
||||||||||||||||||||||||||
Consolidated Balance Sheet Data: |
|||||||||||||||||||||||||||
Cash and cash equivalents |
$ | 65,561 | $ | 67,548 | $ | 53,699 | $ | 35,987 | $ | 92,676 | $ | 72,462 | $ | 32,092 | $ | 52,971 | |||||||||||
Total assets |
1,627,431 | 1,585,086 | 1,599,541 | 1,572,914 | 1,049,039 | 1,038,384 | 1,377,212 | 1,398,627 | |||||||||||||||||||
Long-term debt (including current portion and debt discount) |
703,276 | 700,049 | 706,191 | 704,734 | 304,074 | 303,258 | 728,613 | 735,502 | |||||||||||||||||||
Total stockholders' equity |
353,890 | 314,925 | 341,859 | 307,023 | 287,076 | 248,579 | 225,813 | 242,771 | |||||||||||||||||||
- (1)
- Fiscal
year 2009 was comprised of a 53-week period.
- (2)
- In
the second and fourth quarters of 2013, we recognized a loss on early extinguishment of debt of $24.5 million in the aggregate in connection with
a repricing amendment to our Term Loan Facility. In the second quarter of 2011, we recognized a loss on early extinguishment of debt of $4.2 million in connection with an amendment to our prior
term loan facility to permit the sale of Henry's. See Note 5, Debt, to the audited consolidated financial statements included elsewhere in this prospectus.
- (3)
- In
the second quarter of 2011, we sold Henry's to Sprouts. In the fourth quarter of 2010, we closed five stores in Colorado. Accordingly, the consolidated
statements of operations data for our fiscal years 2011, 2010 and 2009 reflect the results of operations of Henry's and the five stores separately as discontinued operations. The results of operations
of Henry's and the five stores are immaterial for fiscal years 2013 and 2012 and are not presented separately as discontinued operations.
- (4)
- For
more information regarding our calculation of comparable store sales growth, see "Comparable Store Sales" on page ii of this prospectus.
- (5)
- Average store size is calculated as the gross square feet divided by the stores open at the end of the period presented.
47
MANAGEMENT'S DISCUSSION AND ANALYSIS OF FINANCIAL CONDITION AND
RESULTS OF OPERATIONS
You should read the following discussion and analysis of our financial condition and results of operations together with "Selected Historical Consolidated Financial Information and Other Data" and the consolidated financial statements and related notes that are included elsewhere in this prospectus. This discussion contains forward-looking statements based upon current expectations that involve risks and uncertainties. Our actual results may differ materially from those anticipated in these forward-looking statements as a result of various factors, including those set forth under "Risk Factors" or in other parts of this prospectus. Please also see the section entitled "Special Note Regarding Forward-Looking Statements."
Business Overview
We are a high-growth, value-oriented food retailer serving a diverse demographic of household and business customers through two complementary and highly productive store banners: Smart & Final and Cash & Carry. We operate 250 non-membership, warehouse-style stores throughout the Western United States, with an additional 13 stores in Northwestern Mexico in a joint venture. We have a differentiated merchandising strategy that emphasizes high quality perishables, a wide selection of private label products, products tailored to business and foodservice customers and products offered in a broad range of sizes.
We consider each of our store banners to be an operating segment, and have concluded that presenting disaggregated information for our two operating segments provides meaningful information because of differences in their respective economic characteristics and customer bases. For our fiscal year 2013, our Smart & Final and Cash & Carry segments represented approximately 75.5% and 24.5%, respectively, of our consolidated sales, compared to 75.7% and 24.3%, respectively, for our fiscal year 2012.
Our Smart & Final segment is based in Commerce, California and includes 111 legacy Smart & Final stores and 87 Extra! format stores, which focus on household and business customers and are located in California, Arizona and Nevada. Our Smart & Final stores offer extensive selections of fresh perishables and everyday grocery items, together with a targeted selection of foodservice, packaging and janitorial products, under both national and private label brands. Our Extra! store format offers a one-stop shopping experience with a more expansive selection of items than our legacy Smart & Final stores and an emphasis on perishables and household items. The continued development of our Extra! store format, through additional new store openings and conversions and relocations of legacy Smart & Final stores, is the cornerstone of our growth strategy.
Our Cash & Carry segment is based in Portland, Oregon and includes 52 Cash & Carry stores, which focus primarily on business customers and are located in Washington, Oregon, Northern California, Idaho and Nevada. Our Cash & Carry stores offer a wide variety of SKUs tailored to the core needs of foodservice customers such as restaurants, caterers and a wide range of other foodservice businesses in a flexible mix of "case quantity" or single unit purchases.
Outlook
We plan to expand our store footprint, primarily through opening new Extra! stores in existing and adjacent markets, and by entering new markets. We believe we have a scalable operating infrastructure to support our anticipated growth which, together with our flexible real estate strategy and advanced distribution capabilities, position us to capitalize on our growth opportunities. We plan to continue converting our larger legacy Smart & Final stores to our Extra! format and investing in our legacy Smart & Final stores that are not candidates for conversion to the Extra! format by completing major remodel projects and targeted relocations. We also plan to opportunistically grow our Cash & Carry store footprint.
48
In addition, we plan to leverage our significant investments in management, information technology systems, infrastructure and marketing to grow our comparable store sales and enhance our operating margins through execution of a number of key initiatives, including initiatives to increase net sales of perishable products in our Smart & Final stores, to increase net sales of private label products in our Smart & Final and Cash & Carry stores, and to expand our marketing programs in our Smart & Final and Cash & Carry stores. We expect each of these key initiatives, if successful, to generate increased comparable store sales and also expect our initiative to increase net sales of private label products to enhance our operating margins, as private label products have historically generated higher gross margins relative to national branded products.
Factors Affecting Our Results of Operations
Various factors affect our results of operations during each period, including:
Store Openings
We expect that a primary driver of our growth in sales and gross margin will be the continued development of our Extra! format stores through new store openings, conversions and relocations. We also plan to opportunistically open new Cash & Carry stores, which will further amplify sales and gross margin. Our results of operations have been and will continue to be materially affected by the timing and number of new store openings, including conversions and relocations of legacy Smart & Final stores to the Extra! format, and the amount of associated costs. For example, we typically incur higher than normal employee costs at the time of a new store opening, conversion or relocation associated with set-up and other related costs. Also, our operating margins are typically negatively affected by promotional discounts and other marketing costs associated with new store openings, conversions and relocations, as well as higher inventory markdowns and costs related to hiring and training new employees in new stores. Additionally, promotional activities may result in higher than normalized sales in the first several weeks following a new store opening. Our new Extra! and Cash & Carry stores typically build a customer base over time and reach a mature sales growth rate in the third and fourth year after opening, respectively. As a result, our new stores generally have lower margins and higher operating expenses, as a percentage of sales, than our more mature stores.
Based on our experience, we expect that certain of our new Extra! stores will impact sales at our existing stores in close proximity in the short term. However, we believe that over the longer term any such sales impact will be more than offset by future sales growth and expanded market share.
Developments in Competitive Landscape
We operate in the highly competitive food retail and foodservices industries. We compete on a combination of factors, including price, product selection, product quality, convenience, customer service, store format and location. Our principal competitors include conventional grocers such as Albertsons, Kroger and Safeway, discounters and warehouse clubs such as Costco, mass merchandisers such as Walmart and Target, foodservice delivery companies such as Sysco and US Foods, as well as online retailers and other specialty stores. Some of our competitors may have greater financial or marketing resources than we do and may be able to devote greater resources to sourcing, promoting and selling their products. These competitors could use these advantages to take certain measures, including reducing prices that could adversely affect our competitive position, business, financial condition and operating results.
Pricing Strategy and Investments in "Everyday Low Prices"
We have a commitment to "everyday low prices," which we believe positions both our Smart & Final and Cash & Carry stores as top of mind destinations for our target customers. Pricing in our
49
Smart & Final stores is targeted to be substantially lower than that of conventional grocers and competitive with that of large discounters and warehouse clubs, with no membership fee requirement. Pricing in our Cash & Carry stores is targeted to be substantially lower than our foodservice delivery competitors, with greater price transparency to customers and no minimum order size, and competitive with typical warehouse clubs.
Our pricing strategy is geared toward optimizing the pricing and promotional activities across our mix of higher-margin perishable items and everyday value-oriented traditional grocery items. This strategy involves determining prices that will improve our operating margins based upon our analysis of how demand varies at different price levels as well as our costs and inventory levels.
Expanded Private Label Offerings
Private label products are key components of our pricing and merchandising strategy, as we believe they build and deepen customer loyalty, enhance our value proposition, generate higher gross margins relative to national brands and improve the breadth and selection of our product offering. We believe that a strong private label offering has become an increasingly important competitive advantage in the food retail and foodservices industries.
As of the end of fiscal year 2013, we had a portfolio of over 2,500 private label items, which represented 29% of our Smart & Final banner sales. Typically, our private label products generate a higher gross margin as a percentage of sales as compared to a comparable national brand product.
General Economic Conditions and Changes in Consumer Behavior
The overall economic environment in the markets we serve, particularly California, and related changes in consumer behavior, have a significant impact on our business and results of operations. In general, positive conditions in the broader economy promote customer spending in our stores, while economic weakness results in reduced customer spending. Macroeconomic factors that can affect customer spending patterns, and thereby our results of operations, include employment rates, business conditions, changes in the housing market, the availability of consumer credit, interest rates, tax rates and fuel and energy costs.
Although continuing economic weakness has decreased overall consumer spending, we believe that many consumers are spending less of their overall food budget on meals away from home and more at food retailers. As a result, we believe that the impact of the recent economic slowdown on our results of operations has at least been partially mitigated by increased consumer preferences for meals at home. Further, our primary markets feature relatively stable local economies with diversified employer bases and stable to modestly growing populations.
Infrastructure Investment
Our historical results of operations reflect the impact of our ongoing investments in infrastructure to support our growth. We have made significant investments in senior management, information technology systems, supply chain systems and marketing. These investments include significant additions to our personnel, including experienced industry executives and management and merchandising teams to support our long-term growth objectives. We plan on continuing to make targeted investments in our infrastructure as necessary to support our growth.
Inflation and Deflation Trends
Inflation and deflation can impact our financial performance. During inflationary periods, our results of operations can be positively impacted in the short term, as we sell lower-priced inventory in a higher price environment. Over the longer term, the impact of inflation is largely dependent on our
50
ability to pass through product cost increases to our customers, which is subject to competitive market conditions. In recent inflationary periods, we have generally been able to pass through most cost increases. While food deflation moderated in fiscal year 2011, we began to experience inflation starting in early fiscal year 2012, particularly in some commodity driven categories, although we were generally able to pass through the effect of these higher prices. Food inflation moderated in early fiscal year 2013 and was essentially flat through the remainder of calendar year 2013.
Changes in Interest Expense and Loss on Debt Extinguishment
Our interest expense in any particular period is impacted by our overall level of indebtedness during that period and by changes in the applicable interest rates on such indebtedness. In connection with the Ares Acquisition, we entered into the Term Loan Facility and the Second Lien Term Loan Facility (as defined below), consisting of $525.0 million and $195.0 million of term indebtedness, respectively, and our $150.0 million Revolving Credit Facility. We recorded a $24.5 million loss on the early extinguishment of debt in fiscal year 2013, no such loss in the 2012 Predecessor or Successor periods and a $4.2 million loss in Predecessor fiscal year 2011. The losses in fiscal year 2013 were primarily the result of two amendments to the Term Loan Facility, which resulted in changes to the applicable margin and the incurrence of additional term loans under the Term Loan Facility, the proceeds of which were used to repay all amounts outstanding under the Second Lien Term Loan Facility (as defined below). Additionally, because we have a Term Loan Facility and a Revolving Credit Facility, each of which bears interest at a rate based in part on LIBOR, the federal funds rate or the prime rate, we are exposed to fluctuations in interest rates.
Components of Results of Operations
Net Sales
We recognize revenue from the sale of products at the point of sale. Discounts provided to customers at the time of sale are recognized as a reduction in sales as the products are sold. Sales tax collections are presented in the statement of operations and comprehensive income (loss) on a net basis and, accordingly, are excluded from reported sales revenues. Proceeds from the sale of our Smart & Final gift cards are recorded as a liability at the time of sale, and recognized as sales when they are redeemed by the customer. Our Smart & Final gift cards do not have an expiration date. We have not recorded any unredeemed gift card revenue or breakage related to our gift card program.
We regularly review and monitor comparable store sales growth to evaluate and identify trends in our sales performance. With respect to any fiscal period during any year, comparable store sales include sales for stores operating both during such fiscal period in such year and in the same fiscal period of the previous year. Sales from a store will be included in the calculation of comparable store sales after the 60th full week of operations, and sales from a store are also included in the calculation of comparable store sales if (i) the store has been physically relocated, (ii) the selling square footage has been increased or decreased or (iii) the store has been converted to a new format within a store banner (e.g., from a legacy Smart & Final store to the Extra! format). However, sales from an existing store will not be included in the calculation of comparable store sales if the store has been converted to a different store banner (e.g., from Smart & Final to Cash & Carry).
Cost of Sales, Buying and Occupancy and Gross Margin
The major categories of costs included in cost of sales, buying and occupancy are cost of goods sold, distribution costs, costs of our buying department and store occupancy costs, net of earned vendor rebates and other allowances. Distribution costs consist of all warehouse receiving and inspection costs, warehousing costs, all transportation costs associated with shipping goods from our warehouses to our stores, and other costs of our distribution network. Store occupancy costs include store rental, common
51
area maintenance, property taxes, property insurance, depreciation and amortization of favorable and unfavorable leasehold interests.
Gross margin represents sales less cost of sales, buying and occupancy. Our gross margin may not be comparable to other retailers, since not all retailers include all of the costs related to their distribution network in cost of sales like we do. Some retailers exclude a portion of these costs (e.g., store occupancy and buying department costs) from cost of sales and include them in selling, general and administrative expenses.
Our cost of sales, buying and occupancy expense and gross margin are correlated to sales volumes. As sales increase, gross margin is affected by the relative mix of products sold, pricing strategies, inventory shrinkage and improved leverage of fixed costs.
Operating and Administrative Expenses
Operating and administrative expenses include direct store-level expenses associated with displaying and selling our products at the store level, including salaries and benefits for our store work force, fringe benefits, store supplies, advertising and marketing and other store-specific costs. Operating and administrative expenses also consist of store overhead costs and corporate administrative costs including salaries and benefits costs, share-based compensation, corporate occupancy costs and amortization expense.
We expect that our operating and administrative expenses will increase in future periods as a result of additional legal, accounting, insurance and other expenses associated with being a public company and increases resulting from our store development program, including the growth in the number of our stores, as well as increased share-based compensation expense related to equity awards granted to our directors and eligible employees under the 2014 Incentive Plan both in connection with and following this offering and as explained elsewhere in this prospectus.
Income Tax (Provision) Benefit
We are subject to federal income tax as well as state income tax in various jurisdictions of the United States in which we conduct business. Income taxes are accounted for under the asset and liability method.
Equity in Earnings of Mexico Joint Venture
Our wholly owned subsidiary, Smart & Final de Mexico S.A. de C.V., is a Mexican holding company that owns a 50% interest in a joint venture. The remaining 50% of the joint venture is owned by Grupo Calimax S.A. de C.V., an entity comprising the investment interests of a family group who are also the owners of the Calimax grocery store chain in Mexico. As of June 15, 2014, this joint venture operated 13 Smart & Final stores in Northwestern Mexico, which are similar in concept to our legacy Smart & Final stores. This joint venture operates as a Mexican domestic corporation under the name Smart & Final del Noroeste, S.A. de C.V. Our interest in this joint venture is not consolidated and is reported using the equity method of accounting.
Factors Affecting Comparability of Results of Operations
We were formed by affiliates of Ares Management in connection with the Ares Acquisition, which was consummated on November 15, 2012. Upon completion of the Ares Acquisition, each share of Smart & Final Holdings Corp. was converted into the right to receive cash, for an aggregate cash consideration of approximately $669.5 million. In addition, payments in satisfaction of the Smart & Final Holdings Corp. stock options aggregated $54.2 million. As of the end of fiscal year 2013, Ares Management and Smart & Final Holdings Corp. reached agreement on the final calculation of working
52
capital adjustment, which resulted in an increase in the purchase price of $2.5 million. Our consolidated balance sheets and consolidated statements of cash flows reflect this change in the purchase price. The Ares Acquisition was accounted for as a business combination in accordance with Accounting Standards Codification ("ASC"), Business Combinations ("ASC 805"), whereby the purchase price paid to effect the acquisition was assigned to the assets acquired and the liabilities assumed based on their fair values at the acquisition date. The determination of fair value included the consideration of various factors including quoted market prices, expected future cash flows, current replacement costs, market rate assumptions and appropriate discounts and growth rates.
Basis of Presentation
Our fiscal year is the 52- or 53-week period ending on the Sunday closest to December 31. Each of our 52-week fiscal years consists of twelve-week periods in the first, second and fourth quarters of the fiscal year and a sixteen-week period in the third quarter. Our last three completed fiscal years ended on December 29, 2013, December 30, 2012 and January 1, 2012.
The accompanying consolidated financial information presents the financial position of the Successor as of December 29, 2013 and December 30, 2012 and the results of operations and cash flows of the Successor for fiscal year 2013 and for the period from November 15, 2012 through December 30, 2012, as well as the financial position of the Predecessor as of January 1, 2012 and the results of operations and cash flows of the Predecessor for the period from January 2, 2012 through November 14, 2012 and fiscal year 2011.
The consolidated financial information for all Predecessor periods has been prepared using the historical basis of accounting for the Company. Due to the significance of the Ares Acquisition and related transactions, as well as our application of purchase accounting with respect to the Ares Acquisition, our capitalization and basis of accounting have changed. Therefore, the financial information, other than net sales, for all Successor periods is not comparable to that of the Predecessor periods presented in the following tables and elsewhere in this prospectus.
Results of Operations
The following discussion of our financial performance includes supplemental unaudited pro forma condensed consolidated financial information for fiscal year 2012 and fiscal year 2011. Because the Ares Acquisition occurred during the fourth quarter of 2012, we believe this pro forma information aids in the comparison between historical periods presented. The pro forma information does not purport to represent what our results of operations would have been had the Ares Acquisition actually occurred at the beginning of fiscal year 2011, nor does it purport to project our results of operations or financial condition for any future period.
53
The following table contains results of operations for the twelve weeks and twenty-four weeks ended June 15, 2014 and June 16, 2013, respectively, and results of operations for fiscal year 2013, results of operations for the period from November 15, 2012 through December 30, 2012, results of operations for the period from January 2, 2012 through November 14, 2012 and results of operations for fiscal year 2011.
| |
|
|
|
|
|
|
|
|
|
||||||||||||||||||
|---|---|---|---|---|---|---|---|---|---|---|---|---|---|---|---|---|---|---|---|---|---|---|---|---|---|---|---|
| |
Successor | |
Predecessor | ||||||||||||||||||||||||
| |
Twenty-Four Weeks Ended June 15, 2014 |
Twenty-Four Weeks Ended June 16, 2013 |
Twelve Weeks Ended June 15, 2014 |
Twelve Weeks Ended June 16, 2013 |
Fiscal Year 2013 |
Period From November 15, 2012 Through December 30, 2012 |
|
Period From January 2, 2012 Through November 14, 2012 |
Fiscal Year 2011 |
||||||||||||||||||
| |
(Dollars in thousands, except per share) |
||||||||||||||||||||||||||
| |
|
|
|
|
|
|
|
|
|
||||||||||||||||||
Net sales |
$ | 1,563,087 | $ | 1,446,101 | $ | 828,071 | $ | 755,943 | $ | 3,210,293 | $ | 378,550 | $ | 2,664,162 | $ | 2,840,336 | |||||||||||
Cost of sales, buying and occupancy |
1,330,313 | 1,232,778 | 699,886 | 642,528 | 2,736,357 | 333,787 | 2,265,154 | 2,412,180 | |||||||||||||||||||
| | | | | | | | | | | | | | | | | | | | | | | | | | | | |
Gross margin |
232,774 | 213,323 | 128,185 | 113,415 | 473,936 | 44,763 | 399,008 | 428,156 | |||||||||||||||||||
Operating and administrative expense |
193,849 | 174,039 | 101,491 | 88,463 | 387,133 | 51,727 | 355,681 | 379,371 | |||||||||||||||||||
Loss (gain) on asset sales |
— | — | — | — | — | (5 | ) | 8,818 | 1,952 | ||||||||||||||||||
| | | | | | | | | | | | | | | | | | | | | | | | | | | | |
Income from operations |
38,925 | 39,284 | 26,694 | 24,952 | 86,803 | (6,959 | ) | 34,509 | 46,833 | ||||||||||||||||||
Interest expense, net |
17,758 | 25,429 | 8,922 | 12,467 | 50,365 | 7,133 | 20,761 | 31,395 | |||||||||||||||||||
(Loss) on early extinguishment of debt |
— | (7,139 | ) | — | (7,139 | ) | (24,487 | ) | — | — | (4,209 | ) | |||||||||||||||
Equity in earnings of joint venture |
714 | 521 | 262 | 172 | 1,649 | — | 820 | 785 | |||||||||||||||||||
| | | | | | | | | | | | | | | | | | | | | | | | | | | | |
Income (loss) from continuing operations before income taxes |
21,881 | 7,237 | 18,034 | 5,518 | 13,600 | (14,092 | ) | 14,568 | 12,014 | ||||||||||||||||||
Income tax (provision) benefit |
(8,259 | ) | (2,110 | ) | (6,919 | ) | (1,920 | ) | (5,429 | ) | 4,804 | (244 | ) | (4,795 | ) | ||||||||||||
| | | | | | | | | | | | | | | | | | | | | | | | | | | | |
Income (loss) from continuing operations |
13,622 | 5,127 | 11,115 | 3,598 | 8,171 | (9,288 | ) | 14,324 | 7,219 | ||||||||||||||||||
Income (loss) from discontinued operations, net of income taxes |
— | — | — | — | — | — | — | 3,260 | |||||||||||||||||||
| | | | | | | | | | | | | | | | | | | | | | | | | | | | |
Net income (loss) |
$ | 13,622 | $ | 5,127 | $ | 11,115 | $ | 3,598 | $ | 8,171 | $ | (9,288 | ) | $ | 14,324 | $ | 10,479 | ||||||||||
| | | | | | | | | | | | | | | | | | | | | | | | | | | | |
| | | | | | | | | | | | | | | | | | | | | | | | | | | | |
Earnings (loss) per share: |
|||||||||||||||||||||||||||
Net income (loss) per share—Basic |
$ | 45.24 | $ | 17.13 | $ | 36.88 | $ | 12.02 | $ | 27.22 | $ | (31.04 | ) | $ | 1.07 | $ | 0.78 | ||||||||||
Net income (loss) per share—Diluted |
$ | 43.64 | $ | 16.48 | $ | 35.61 | $ | 11.55 | $ | 26.14 | $ | (31.04 | ) | $ | 1.03 | $ | 0.78 | ||||||||||
The table below sets forth the components of our consolidated statements of operations as a percentage of net sales:
| |
Successor | |
Predecessor | ||||||||||||||||||||||||
|---|---|---|---|---|---|---|---|---|---|---|---|---|---|---|---|---|---|---|---|---|---|---|---|---|---|---|---|
| |
|
||||||||||||||||||||||||||
| |
Twenty-Four Weeks Ended June 15, 2014 |
Twenty-Four Weeks Ended June 16, 2013 |
Twelve Weeks Ended June 15, 2014 |
Twelve Weeks Ended June 16, 2013 |
Fiscal Year 2013 |
Period From November 15, 2012 Through December 30, 2012 |
|
Period From January 2, 2012 Through November 14, 2012 |
Fiscal Year 2011 |
||||||||||||||||||
Net sales |
100.0 | % | 100.0 | % | 100.0 | % | 100.0 | % | 100.0 | % | 100.0 | % | 100.0 | % | 100.0 | % | |||||||||||
Cost of sales, buying and occupancy |
85.1 | % | 85.2 | % | 84.5 | % | 85.0 | % | 85.2 | % | 88.2 | % | 85.0 | % | 84.9 | % | |||||||||||
| | | | | | | | | | | | | | | | | | | | | | | | | | | | |
Gross margin |
14.9 | % | 14.8 | % | 15.5 | % | 15.0 | % | 14.8 | % | 11.8 | % | 15.0 | % | 15.1 | % | |||||||||||
Operating and administrative expense |
12.4 | % | 12.0 | % | 12.3 | % | 11.7 | % | 12.1 | % | 13.7 | % | 13.4 | % | 13.4 | % | |||||||||||
Loss (gain) on asset sales |
0.0 | % | 0.0 | % | 0.0 | % | 0.0 | % | — | 0.0 | % | 0.3 | % | 0.1 | % | ||||||||||||
| | | | | | | | | | | | | | | | | | | | | | | | | | | | |
Income from operations |
2.5 | % | 2.7 | % | 3.2 | % | 3.3 | % | 2.7 | % | (1.8 | )% | 1.3 | % | 1.6 | % | |||||||||||
Interest expense, net |
1.1 | % | 1.8 | % | 1.1 | % | 1.6 | % | 1.6 | % | 1.9 | % | 0.8 | % | 1.1 | % | |||||||||||
(Loss) on early extinguishment of debt |
0.0 | % | 0.5 | % | 0.0 | % | 0.9 | % | 0.8 | % | — | — | 0.1 | % | |||||||||||||
Equity in earnings of joint venture |
0.0 | % | 0.0 | % | 0.0 | % | 0.0 | % | 0.1 | % | 0.0 | % | 0.0 | % | 0.0 | % | |||||||||||
| | | | | | | | | | | | | | | | | | | | | | | | | | | | |
Income (loss) from continuing operations before income taxes |
1.4 | % | 0.5 | % | 2.2 | % | 0.7 | % | 0.4 | % | (3.7 | )% | 0.5 | % | 0.4 | % | |||||||||||
Income tax (provision) benefit |
(0.5 | )% | (0.1 | )% | (0.8 | )% | (0.3 | )% | (0.2 | )% | 1.3 | % | 0.0 | % | (0.2 | )% | |||||||||||
| | | | | | | | | | | | | | | | | | | | | | | | | | | | |
Income (loss) from continuing operations |
0.9 | % | 0.4 | % | 1.3 | % | 0.5 | % | 0.3 | % | (2.5 | )% | 0.5 | % | 0.3 | % | |||||||||||
Income (loss) from discontinued operations, net of income taxes |
0.0 | % | 0.0 | % | 0.0 | % | 0.0 | % | — | — | — | 0.1 | % | ||||||||||||||
| | | | | | | | | | | | | | | | | | | | | | | | | | | | |
Net income (loss) |
0.9 | % | 0.4 | % | 1.3 | % | 0.5 | % | 0.3 | % | (2.5 | )% | 0.5 | % | 0.4 | % | |||||||||||
| | | | | | | | | | | | | | | | | | | | | | | | | | | | |
| | | | | | | | | | | | | | | | | | | | | | | | | | | | |
Twelve Weeks Ended June 15, 2014 Compared to the Twelve Weeks Ended June 16, 2013
Net Sales
Net sales for the twelve weeks ended June 15, 2014 increased $72.1 million, or 9.5%, to $828.1 million as compared to $755.9 million for the twelve weeks ended June 16, 2013. This increase
54
in net sales was attributable to comparable store sales growth of $47.1 million in our store banners, and the net sales of $25.0 million from the opening of six new stores in the twenty-four weeks ended June 15, 2014 and five new stores in 2013 since June 16, 2013.
Comparable store sales for the twelve weeks ended June 15, 2014 increased 6.3% as compared to the twelve weeks ended June 16, 2013. This increase in comparable store sales was attributable to an increase of 3.7% in comparable transaction count and an increase of 2.5% in comparable average transaction size.
For the twelve weeks ended June 15, 2014, net sales for our Smart & Final segment increased $52.6 million, or 9.2%, to $623.1 million as compared to $570.5 million for the twelve weeks ended June 16, 2013. Comparable store sales for our Smart & Final segment increased 4.9% as compared to the twelve weeks ended June 16, 2013, primarily attributable to increases in both comparable transaction count of 3.7% and comparable transaction size of 1.1%.
For the twelve weeks ended June 15, 2014, net sales for our Cash & Carry segment increased $19.5 million, or 10.5%, to $205.0 million as compared to $185.5 million for the twelve weeks ended June 16, 2013. Comparable store sales for our Cash & Carry segment increased 10.5% as compared to the twelve weeks ended June 16, 2013, primarily attributable to increases in both comparable transaction count of 3.6% and comparable transaction size of 6.6%.
Gross Margin
Gross margin for the twelve weeks ended June 15, 2014 increased $14.8 million, or 13.0%, to $128.2 million as compared to $113.4 million for the twelve weeks ended June 16, 2013. The increase in gross margin attributable to increased sales was $10.9 million and the increase in gross margin attributable to increased gross margin rate was $3.9 million. As a percentage of sales, gross margin increased 0.5% to 15.5% for the twelve weeks ended June 15, 2014, as compared to 15.0% for the twelve weeks ended June 16, 2013. The increase in gross margin as a percentage of sales was mainly due to higher merchandise product margin rates as a percentage of sales (accounting for an increase of 0.23%, including a 0.33% increase in our Smart & Final segment partially offset by a 0.10% decrease in our Cash & Carry segment), combined with decreased warehouse and transportation costs as a percentage of sales (accounting for a 0.08% decrease, including a 0.04% decrease in our Smart& Final segment and a 0.04% decrease in our Cash & Carry segment). Store occupancy costs as a percentage of sales decreased 0.17% including a 0.15% decrease in our Smart & Final segment and a 0.02% decrease in our Cash & Carry segment, reflecting the relatively fixed nature of these costs.
Operating and Administrative Expenses
Operating and administrative expenses for the twelve weeks ended June 15, 2014 increased $13.0 million, or 14.7%, to $101.5 million, as compared to $88.5 million for the twelve weeks ended June 16, 2013. This increase in operating and administrative expenses was primarily due to $4.9 million of higher store labor and related fringe benefit costs, $1.6 million of increased marketing costs in support of our increased sales and other marketing initiatives, $2.6 million of increased other store direct expenses, and $1.7 million of expense associated with our equity compensation program. As a percentage of sales, operating and administrative expenses increased 0.6% to 12.3% as compared to 11.7% for the twelve weeks ended June 16, 2013. Approximately 0.21% of the increase in operating and administrative expenses as a percentage of sales was due to the recognition of expense associated with our equity compensation program, 0.05% of the increase was due to higher marketing costs (including a 0.04% increase in our Smart & Final segment and a 0.01% increase in our Cash & Carry segment) and 0.11% of the increase was due to increased wages, benefits and administrative bonuses (including 0.07% increase in our Smart & Final segment partially offset by 0.02% decrease in our Cash & Carry segment). Additionally, 0.10% of the increase was due to increased other store direct
55
expenses in our Smart & Final segment and 0.06% of the increase was due to increased consulting costs.
Interest Expense, Net
Interest expense for the twelve weeks ended June 15, 2014 decreased $3.5 million, or 28.4%, to $8.9 million as compared to $12.5 million for the twelve weeks ended June 16, 2013. As a percentage of sales, interest expense for the twelve weeks ended June 15, 2014 decreased 0.6% to 1.1%, as compared to 1.6% for the twelve weeks ended June 16, 2013. This decrease was primarily due to a lower average effective interest rate under our Credit Facilities.
Income Tax (Provision) Benefit
Our income tax provision for the twelve weeks ended June 15, 2014 increased $5.0 million to $6.9 million as compared to $1.9 million for the twelve weeks ended June 16, 2013. The effective income tax rate, excluding the equity in earnings of joint venture, for the twelve weeks ended June 15, 2014 was 38.9% as compared to 35.9% for the twelve weeks ended June 16, 2013.
Equity in Earnings of Joint Venture
Equity in earnings of our joint venture for the twelve weeks ended June 15, 2014 increased $0.1 million to $0.3 million, as compared to $0.2 million for the twelve weeks ended June 16, 2013.
Twenty-Four Weeks Ended June 15, 2014 Compared to the Twenty-Four Weeks Ended June 16, 2013
Net Sales
Net sales for the twenty-four weeks ended June 15, 2014 increased $117.0 million, or 8.1%, to $1,563.1 million as compared to $1,446.1 million for the twenty-four weeks ended June 16, 2013. This increase in net sales was attributable to comparable store sales growth of $75.9 million in our store banners, and net sales of $41.1 million from the opening of six new stores in the twenty-four weeks ended June 15, 2014 and five new stores in 2013 since June 17, 2013.
Comparable store sales for the twenty-four weeks ended June 15, 2014 increased 5.3% as compared to the twenty-four weeks ended June 16, 2013. This increase in comparable store sales was attributable to an increase of 3.7% in comparable transaction count and an increase of 1.5% in comparable average transaction size.
For the twenty-four weeks ended June 15, 2014, net sales for our Smart & Final segment increased $87.6 million, or 8.0%, to $1,185.0 million as compared to $1,097.5 million for the twenty-four weeks ended June 16, 2013. Comparable store sales for our Smart & Final segment increased 4.2% as compared to the twenty-four weeks ended June 16, 2013, primarily attributable to increases in both comparable transaction count of 3.8% and comparable transaction size of 0.4%.
For the twenty-four weeks ended June 15, 2014, net sales for our Cash & Carry segment increased $29.4 million, or 8.4%, to $378.0 million as compared to $348.6 million for the twenty-four weeks ended June 16, 2013. Comparable store sales for our Cash & Carry segment increased 8.4% as compared to the twenty-four weeks ended June 16, 2013, primarily attributable to increases in both comparable transaction count of 3.1% and comparable transaction size of 5.2%.
Gross Margin
Gross margin for the twenty-four weeks ended June 15, 2014 increased $19.5 million, or 9.1%, to $232.8 million as compared to $213.3 million for the twenty-four weeks ended June 16, 2013. The increase in gross margin attributable to increased sales was $17.3 million and the increase in gross
56
margin attributable to increased gross margin rate was $2.2 million. As a percentage of sales, gross margin increased 0.1% to 14.9% for the twenty-four weeks ended June 15, 2014, as compared to 14.8% for the twenty-four weeks ended June 16, 2013. The increase in gross margin as a percentage of sales was mainly due to decreases in warehouse and transportation costs as a percentage of sales (accounting for a 0.09% decrease, including a 0.05% decrease in our Smart& Final segment and a 0.04% decrease in our Cash & Carry segment). Store occupancy costs as a percentage of sales decreased 0.11%, including a 0.09% decrease in our Smart & Final segment and a 0.02% decrease in our Cash & Carry segment, reflecting the relatively fixed nature of these costs. This decrease in store occupancy costs as a percentage of sales was partially offset by a 0.05% decrease in merchandise product margin rates (including the effect of inventory losses) as a percentage of sales including a 0.01% decrease in our Smart & Final segment and a 0.04% decrease in our Cash & Carry segment.
Operating and Administrative Expenses
Operating and administrative expenses for the twenty-four weeks ended June 15, 2014 increased $19.8 million, or 11.4%, to $193.8 million, as compared to $174.0 million for the twenty-four weeks ended June 16, 2013. This increase in operating and administrative expenses was primarily due to $7.6 million of higher store labor and related fringe benefit costs, $2.6 million of increased marketing costs in support of our increased sales and other marketing initiatives, $3.8 million of increased other store direct expenses, $1.7 million of expense associated with our equity compensation program, and $1.6 million of higher consulting costs associated with long-range store development planning (including remodels of our legacy Smart & Final stores and conversion to our Extra! format). As a percentage of sales, operating and administrative expenses increased 0.4% to 12.4% as compared to 12.0% for the twenty-four weeks ended June 16, 2013. Approximately 0.11% of the increase in operating and administrative expenses as a percentage of sales was due to equity compensation expense, 0.13% of the increase was due higher consulting costs primarily associated with long-range store development planning, 0.07% of the increase was due to higher marketing costs in our Smart & Final segment and 0.04% of the increase was due to increased wages, benefits and administrative bonuses (including a 0.03% increase in our Smart & Final segment partially offset by a 0.02% decrease in our Cash & Carry segment).
Interest Expense, Net
Interest expense for the twenty-four weeks ended June 15, 2014 decreased $7.7 million, or 30.2%, to $17.8 million as compared to $25.4 million for the twenty-four weeks ended June 16, 2013. As a percentage of sales, interest expense for the twenty-four weeks ended June 15, 2014 decreased 0.7% to 1.1%, as compared to 1.8% for the twenty-four weeks ended June 16, 2013. This decrease in interest expense was primarily due to a lower average effective interest rate under our Credit Facilities.
Loss on Early Extinguishment of Debt
We recorded a $7.1 million loss on the early extinguishment of debt in the twenty-four weeks ended June 16, 2013 and recorded no such loss in the twenty-four weeks ended June 15, 2014. The loss in the twenty-four weeks ended June 16, 2013 was primarily the result of an amendment to our Term Loan Facility, which resulted in changes to the applicable margin and the incurrence of additional term loans under the Term Loan Facility, the proceeds of which were used to repay $55.0 million outstanding under the Second Lien Term Loan Facility. Costs associated with such loss were related to fees and the write-off of the unamortized debt discount and deferred financing costs. In the twenty-four weeks ended June 16, 2013, we incurred approximately $7.5 million of fees in connection with the first amendment to our Term Loan Facility, approximately $4.9 million of which were recorded as a debt discount and are amortized over the term of the Term Loan Facility.
57
Income Tax (Provision) Benefit
Our income tax provision for the twenty-four weeks ended June 15, 2014 increased $6.1 million to $8.3 million, as compared to $2.1 million for the twenty-four weeks ended June 16, 2013. The effective income tax rate, excluding the equity in earnings of joint venture, for the twenty-four weeks ended June 15, 2014 was 39.0% as compared to 31.4% for the twenty-four weeks ended June 16, 2013.
Equity in Earnings of Joint Venture
Equity in earnings of our joint venture for the twenty-four weeks ended June 15, 2014 increased $0.2 million to $0.7 million, as compared to $0.5 million for the twenty-four weeks ended June 16, 2013.
Fiscal Year 2013 (Successor) Compared to the Periods November 15-December 30, 2012 (Successor) and January 2-November 14, 2012 (Predecessor)
Net Sales
Net sales for fiscal year 2013 increased $167.6 million, or 5.5%, to $3,210.3 million as compared to $3,042.7 million for fiscal year 2012, including $2,664.2 million in the 2012 Predecessor period and $378.5 million in the 2012 Successor period. This increase in net sales was attributable to comparable store sales growth of $122.5 million in our store banners, and net sales of $45.1 million primarily attributable to the opening of five new Extra! stores in fiscal 2013 and two new Extra! stores in fiscal year 2012.
Comparable store sales for fiscal year 2013 increased 4.0% as compared to fiscal year 2012. This increase in comparable store sales was attributable to an increase in comparable transaction counts of 4.1% and a decrease of 0.1% in comparable average transaction size.
Net sales for our Smart & Final segment increased $122.6 million, or 5.3%, to $2,425.4 million as compared to $2,302.7 million for fiscal year 2012, including $2,011.6 million in the 2012 Predecessor period and $291.1 million in the 2012 Successor period. Comparable store sales for fiscal year 2013 for our Smart & Final segment increased 3.4% as compared to fiscal year 2012, driven by a 4.2% increase in comparable transaction counts and a 0.8% decrease in comparable average transaction size.
Net sales for our Cash & Carry segment increased $45.0 million, or 6.1%, to $784.9 million as compared to $740.0 million for fiscal year 2012, including $652.5 million in the 2012 Predecessor period and $87.4 million in the 2012 Successor period. Comparable store sales for fiscal year 2013 for our Cash & Carry segment increased 6.1% as compared to fiscal year 2012, driven by a 3.6% increase in comparable transaction counts and a 2.5% increase in comparable average transaction size.
Gross Margin
Gross margin for fiscal year 2013 increased $30.2 million, or 6.8%, to $473.9 million as compared to $399.0 million in the 2012 Predecessor period and $44.8 million in the 2012 Successor period. As a percentage of sales, gross margin for fiscal year 2013 was 14.8% as compared to 15.0% in the 2012 Predecessor period and 11.8% in the 2012 Successor period.
Gross margin for fiscal year 2013 was impacted by adjustments to fair value made to our property, plant and equipment and lease related assets in connection with the Ares Acquisition. These adjustments resulted in a $6.9 million increase in depreciation and rent expense associated with store and distribution facilities (including a $6.8 million increase in our Smart & Final segment and a $0.1 million increase in our Cash & Carry segment). Gross margin for the 2012 Successor period was primarily impacted by adjustments to the fair value of inventory in connection with the Ares Acquisition, which resulted in an $8.6 million increase in merchandise product cost of sales (including a
58
$6.9 million increase in our Smart & Final segment and a $1.7 million increase in our Cash & Carry segment). In turn, these adjustments also adversely impacted gross margin as a percentage of sales.
Operating and Administrative Expenses
Operating and administrative expenses for fiscal year 2013 were $387.1 million as compared to $355.7 million in the 2012 Predecessor period and $51.7 million in the 2012 Successor period. As a percentage of sales, operating and administrative expenses for fiscal year 2013 were 12.1% as compared to 13.4% in the 2012 Predecessor period and 13.7% in the 2012 Successor period. Fiscal year 2013 was impacted by adjustments in connection with the Ares Acquisition related to a re-measurement of our pension plan and adjustments to fair value made to our property, plant and equipment and lease-related assets, which resulted in a $1.0 million decrease in our pension expense (including a $0.8 million decrease in our Smart & Final segment, a $0.1 million decrease in our Cash & Carry segment and a $0.1 million decrease in corporate overhead and administrative expenses incidental to activities of these segments) and a $2.0 million decrease in depreciation and rent expense associated with administrative assets for fiscal year 2013. Additionally, during fiscal year 2013 we recorded $3.0 million in pre-tax charges related to proposed settlements of two class action lawsuits and did not record any share-based compensation expense, as compared to $7.5 million in share-based compensation expense in the 2012 Predecessor period. During the 2012 Predecessor period we recognized $23.9 million in transaction-related costs, a $2.0 million gain as the result of a death benefit received on a life insurance policy in support of our nonqualified deferred compensation plan, as well as $1.4 million of management services fees expense paid to Apollo. During the 2012 Successor period we recognized $5.2 million in transaction-related costs, compared to $0 in fiscal year 2013.
Loss (Gain) on Asset Sales
We incurred no loss or gain on asset sales for fiscal year 2013, as compared to an $8.8 million loss in the 2012 Predecessor period and an immaterial gain in the 2012 Successor period. The loss during the 2012 Predecessor period was due to the sale of three of our operating store properties and seven of our former store properties. The sales transactions for our operating store properties occurred concurrently with our entrance into operating leases for each of such store properties. The sales transactions for our three operating store properties were accounted for as sale and leaseback transactions, resulting in the deferral of a $5.6 million gain which was being amortized to rent expense over the non-cancelable lease terms.
Interest Expense, Net
Interest expense for fiscal year 2013 was $50.4 million as compared to $20.8 million in the 2012 Predecessor period and $7.1 million in the 2012 Successor period. This change is primarily attributable to the financing structure of the Ares Acquisition, whereby the Company entered into the Credit Facilities, increasing total outstanding debt. As a percentage of sales, interest expense for fiscal year 2013 was 1.6% as compared to 0.8% in the 2012 Predecessor period and 1.9% in the 2012 Successor period.
Loss on Early Extinguishment of Debt
We recorded a $24.5 million loss on the early extinguishment of debt in fiscal year 2013 and recorded no such loss in either the 2012 Predecessor period or the 2012 Successor period. The loss for fiscal year 2013 was primarily the result of two amendments to our Term Loan Facility, which resulted in changes to the applicable margin and the incurrence of additional term loans under the Term Loan Facility, the proceeds of which were used to repay all amounts outstanding under the Second Lien Term Loan Facility. Costs associated with such loss were related to fees and the write-off of the unamortized debt discount and deferred financing costs. We incurred approximately $7.5 million of fees
59
in connection with the first amendment to our Term Loan Facility, approximately $4.9 million of which were recorded as a debt discount and are amortized over the term of the Term Loan Facility. We incurred approximately $4.8 million of fees in connection with the second amendment to our Term Loan Facility, approximately $1.1 million of which were recorded as debt discount, approximately $0.7 million of which were recorded as deferred financing cost, each of which are amortized over the term of the Term Loan Facility.
Income Tax (Provision) Benefit
Our income tax provision for fiscal year 2013 was $5.4 million as compared to $0.2 million in the 2012 Predecessor period and a $4.8 million benefit in the 2012 Successor period. The effective income tax rate, excluding the equity in earnings of our joint venture, for fiscal year 2013 was 45.4% as compared to 1.8% in the 2012 Predecessor period and 34.1% in the 2012 Successor period.
Equity in Earnings of Joint Venture
Equity in earnings of our joint venture for fiscal year 2013 was $1.6 million as compared to $0.8 million in the 2012 Predecessor period and $0 in the 2012 Successor period.
Periods November 15-December 30, 2012 (Successor) and January 2-November 14, 2012 (Predecessor) Compared to Fiscal Year 2011
Net Sales
Net sales for fiscal year 2012 increased $202.4 million, or 7.1%, to $3,042.7 million, including $2,664.2 million in the 2012 Predecessor period and $378.5 million in the 2012 Successor period, and as compared to $2,840.3 for fiscal year 2011. This increase in net sales was attributable to comparable store sales growth of $189.0 million in our store banners and net sales of $13.4 million primarily attributable to the opening of two new Extra! stores in fiscal 2012 and one new Extra! store in fiscal year 2011.
Comparable store sales for fiscal year 2012 increased 6.7% as compared to fiscal year 2011. This increase in comparable store sales was attributable to an increase in the comparable transaction counts of 7.0% and a decrease of 0.3% in comparable average transaction size.
Net sales for our Smart & Final segment increased $164.4 million, or 7.7%, to $2,302.7 million for fiscal year 2012, including $2,011.6 million in the 2012 Predecessor period and $291.1 million in the 2012 Successor period, and as compared to $2,138.3 million for fiscal year 2011. Comparable store sales for our Smart & Final segment for fiscal year 2012 increased 7.1% as compared to fiscal year 2011, driven primarily by a 7.3% increase in comparable transaction counts and a 0.2% decrease in comparable average transaction size.
Net sales for our Cash & Carry segment increased $38.0 million, or 5.4%, to $740.0 million for fiscal year 2012, including $652.5 million in the 2012 Predecessor period and $87.4 million in the 2012 Successor period, as compared to $702.0 million fiscal year 2011. Comparable store sales for our Cash & Carry segment for fiscal year 2012 increased 5.4% as compared to fiscal year 2011, driven by a 4.9% increase in comparable transaction count and a 0.5% increase in comparable average transaction size.
Gross Margin
Gross margin was $399.0 million in the 2012 Predecessor period and $44.8 million in the 2012 Successor period as compared to $428.2 million for fiscal year 2011. As a percentage of sales, gross margin was 15.0% in the 2012 Predecessor period and 11.8% in the 2012 Successor period, as compared to 15.1% for fiscal year 2011.
60
Gross margin for the 2012 Successor period was primarily impacted by an adjustment to fair value of inventory in connection with the Ares Acquisition. This adjustment resulted in an $8.6 million increase in merchandise product cost of sales (including a $6.9 million increase in our Smart & Final segment and a $1.7 million increase in our Cash & Carry segment) for the 2012 Successor period, adversely impacting gross margin as a percentage of sales. Additionally, we entered into sale and leaseback transactions with respect to 39 of our store properties and one warehouse distribution facility during the fourth quarter of fiscal year 2011 and three of our store properties during the second quarter of 2012. These sale and leaseback transactions resulted in increased depreciation and rent expense in the 2012 Predecessor and 2012 Successor periods, which increases were partially mitigated by gains deferred on the sale and leaseback transactions that were being amortized to cost of sales over the non-cancelable lease terms of the properties.
Operating and Administrative Expenses
Operating and administrative expenses were $355.7 million in the 2012 Predecessor period and $51.7 million in the 2012 Successor period as compared to $379.4 million for fiscal year 2011. The 2012 Predecessor period was impacted by $23.9 million in transaction-related costs in connection with the Ares Acquisition, a $2.0 million gain as the result of a death benefit received on a life insurance policy in support of our nonqualified deferred compensation plan and $1.4 million of management services fees paid to Apollo. The 2012 Successor period was impacted by $5.2 million in transaction-related costs in connection with the Ares Acquisition. As a percentage of sales, operating and administrative expenses were 13.4% in the 2012 Predecessor period and 13.7% in the 2012 Successor period as compared to 13.4% for fiscal year 2011. The change in operating and administrative expenses as a percentage of sales was additionally impacted by changes in our administrative incentive bonuses as a percentage of sales, which were 0.24% in the 2012 Predecessor period, 0.26% in the 2012 Successor period and 0.53% in fiscal year 2011.
Loss (Gain) on Asset Sales
Our loss on asset sales was $8.8 million in the 2012 Predecessor period and immaterial in the 2012 Successor period, as compared to $2.0 million for fiscal year 2011. The loss during the 2012 Predecessor period was due to the sale of three of our operating store properties and seven of our former store properties. The sales transactions for our operating store properties occurred concurrently with our entrance into operating leases for each of the three operating store properties. These sales transactions were accounted for as sale and leaseback transactions, resulting in the deferral of a $5.6 million gain which was being amortized to rent expense over the non-cancelable lease terms. The loss during fiscal year 2011 was due to the sale of 39 store properties and one warehouse distribution facility, concurrent with our entrance into operating leases for each of such properties. These transactions were also accounted for as sale and leaseback transactions, resulting in an immediate recognition of a $2.0 million loss on the sale of three of the operating store properties and a deferral of the $32.0 million gain associated with the remaining 37 properties, which was being amortized to rent expense over the non-cancelable lease terms.
Interest Expense, Net
Interest expense was $20.8 million in the 2012 Predecessor period and $7.1 million in the 2012 Successor period as compared to $31.4 million for fiscal year 2011. This increase in interest expense was primarily attributable to a higher average of total outstanding debt. As a percentage of sales, interest expense was 0.8% in the 2012 Predecessor period and 1.9% in the 2012 Successor period as compared to 1.1% for fiscal year 2011.
61
Loss on Early Extinguishment of Debt
We recorded no loss on the early extinguishment of debt in either the 2012 Predecessor period or the 2012 Successor period as compared to a $4.2 million loss in fiscal year 2011. The loss in the 2011 fiscal year was due to an amendment to our Term Loan Facility, which facilitated the sale of our interests in Henry's in April 2011 and pursuant to which we made principal amortization payments of $1.0 million and a prepayment of $209.7 million.
Income Tax (Provision) Benefit
Our income tax provision was $0.2 million in the 2012 Predecessor period and a $4.8 million benefit in the 2012 Successor period, as compared to a $4.8 million provision for fiscal year 2011. The effective income tax rate, excluding the equity in earnings of our joint venture, was 1.8% in the 2012 Predecessor period and 34.1% in the 2012 Successor period as compared to 42.7% for fiscal year 2011.
Equity in Earnings of Joint Venture
Equity in earnings of our joint venture were $0.8 million in the 2012 Predecessor period and $0 in the Successor period as compared to $0.8 million for fiscal year 2011.
Income from Discontinued Operations
We had no income from discontinued operations for the 2012 Predecessor period or 2012 Successor period, as compared to $3.3 million for fiscal year 2011. The income from discontinued operations for fiscal year 2011 is a net amount attributable to our sale of Henry's and the closing in fiscal year 2010 of five food stores operated in Colorado in an unrelated store format. The Colorado stores, which had been operated as a test of a potential store format, were closed primarily due to operating results that did not achieve the level required for profitable operations.
The following table is a summary of operations and other information of the discontinued operations for fiscal year 2011.
| |
Fiscal Year 2011 |
|||
|---|---|---|---|---|
Sales |
$ | 164,095 | ||
Pre-tax income from operations |
4,298 | |||
Income tax provision |
(1,038 | ) | ||
| | | | | |
Net income from discontinued operations |
$ | 3,260 | ||
| | | | | |
| | | | | |
Unaudited Pro Forma Condensed Consolidated Financial Information
The following supplemental unaudited pro forma condensed consolidated statement of operations was prepared by applying pro forma adjustments to our historical consolidated statements of operations. The Ares Acquisition was effective November 15, 2012. Accordingly, we applied purchase accounting standards, which required a new basis of accounting resulting in assets and liabilities being recorded at their respective fair values as of the date of the Ares Acquisition.
62
The aggregate consideration for the Ares Acquisition was as follows (in thousands):
Purchase of Predecessor common shares |
$ | 669,456 | ||
Payment on Predecessor stock options (inclusive of employer payroll taxes) |
54,993 | |||
Less cash acquired |
(92,676 | ) | ||
| | | | | |
Cash consideration |
631,773 | |||
Working capital adjustment |
6,231 |
|||
Tax consideration |
19,291 | |||
Value of management equity rollover |
11,091 | |||
| | | | | |
Total fair value of net assets acquired |
$ | 668,386 | ||
| | | | | |
| | | | | |
The following table below sets forth the fair values of the assets acquired and liabilities assumed in connection with the Ares Acquisition (in thousands):
| |
|
|||
|---|---|---|---|---|
Current assets, less cash acquired |
$ | 279,624 | ||
Property, plant, and equipment |
248,944 | |||
Capitalized software |
15,766 | |||
Finite-lived/amortizable intangible assets |
68,000 | |||
Indefinite-lived trade names |
265,000 | |||
Goodwill |
611,242 | |||
Investment in Mexico joint venture |
9,400 | |||
Other assets |
46,277 | |||
Current liabilities |
(251,661 | ) | ||
Debt |
(304,074 | ) | ||
Deferred taxes |
(135,865 | ) | ||
Other liabilities |
(184,267 | ) | ||
| | | | | |
Total assets acquired and liabilities assumed |
$ | 668,386 | ||
| | | | | |
| | | | | |
Although our operations did not change as a result of the Ares Acquisition, the accompanying unaudited pro forma condensed consolidated financial information is presented for the Predecessor and Successor relating to the periods preceding and succeeding the Ares Acquisition, respectively. The unaudited pro forma condensed consolidated statements of operations for the years ended December 30, 2012 and January 1, 2012 give effect to the Ares Acquisition as if it had occurred on January 3, 2011. Assumptions underlying the pro forma adjustments are described in the accompanying notes, which should be read in conjunction with this unaudited pro forma condensed consolidated financial information.
The unaudited pro forma adjustments are based upon available information and certain assumptions that we believe are reasonable. The unaudited pro forma condensed consolidated statements of operations are presented for supplemental information purposes only, we do not purport them to represent what our results of operations would have been had the Ares Acquisition actually occurred on January 3, 2011, and they do not project our results of operations or financial condition for any future period. The unaudited pro forma condensed consolidated statement of operations should be read in conjunction with other sections of the "Management's Discussion and Analysis of Financial Condition and Results of Operations," as well as "Selected Historical Consolidated Financial Information and Other Data" and our audited consolidated financial statements and related notes thereto appearing elsewhere in this prospectus. All pro forma adjustments and their underlying
63
assumptions are described more fully in the notes to our unaudited pro forma condensed consolidated statements of operations.
| |
Predecessor | Successor | Adjustment | Pro Forma | |||||||||
|---|---|---|---|---|---|---|---|---|---|---|---|---|---|
| (Dollars in thousands, except per share data) |
Period From January 2, 2012 Through November 14, 2012 |
Period From November 15, 2012 Through December 30, 2012 |
|
Fiscal Year 2012 |
|||||||||
Net sales |
$ | 2,664,162 | $ | 378,550 | $ | — | $ | 3,042,712 | |||||
Cost of sales, buying and occupancy |
2,265,154 | 333,787 | (2,094 | )(1) | 2,596,847 | ||||||||
| | | | | | | | | | | | | | |
Gross margin |
399,008 | 44,763 | 2,094 | 445,865 | |||||||||
Operating and administrative expense |
355,681 | 51,727 | (40,823 | )(2) | 366,585 | ||||||||
Income (loss) on property sales |
8,818 | (5 | ) | — | 8,813 | ||||||||
| | | | | | | | | | | | | | |
Income from operations |
34,509 | (6,959 | ) | 42,917 | 70,467 | ||||||||
Interest expense, net |
20,761 | 7,133 | 27,937 | (3) | 55,831 | ||||||||
(Loss) on early extinguishment of debt |
— | — | — | — | |||||||||
Equity in earnings of joint venture |
820 | — | — | 820 | |||||||||
| | | | | | | | | | | | | | |
Income (loss) from continuing operations before income taxes |
14,568 | (14,092 | ) | 14,980 | 15,456 | ||||||||
Income tax (provision) benefit |
(244 | ) | 4,804 | (5,843 | )(4) | (1,283 | ) | ||||||
| | | | | | | | | | | | | | |
Income (loss) from continuing operations |
14,324 | (9,288 | ) | 9,137 | 14,173 | ||||||||
Income (loss) from discontinued operations, net of income taxes |
— | — | — | — | |||||||||
| | | | | | | | | | | | | | |
Net income (loss) |
$ | 14,324 | $ | (9,288 | ) | $ | 9,137 | $ | 14,173 | ||||
| | | | | | | | | | | | | | |
| | | | | | | | | | | | | | |
Earnings (loss) per share: |
|||||||||||||
Net income (loss) per share—Basic |
$ | 1.07 | $ | (31.04 | ) | $ | 47.37 | ||||||
Net income (loss) per share—Diluted |
$ | 1.03 | $ | (31.04 | ) | $ | 47.37 | ||||||
- (1)
- Represents
the estimated impact on cost of sales, buying and occupancy related to (a) an adjustment to fair value of inventory and a resulting $8.6
million decrease in cost of sales; (b) an adjustment to fair value of property, plant and equipment and the resulting $4.4 million increase in depreciation expense; (c) a
$3.0 million increase in rent expense as a result of the new basis in leases as of the acquisition date; and (d) a purchase accounting adjustment to unamortized pension liability
resulting in a $0.9 million decrease in pension expense related to our distribution operations.
- (2)
- Represents
the estimated impact to operating and administrative expense related to (a) an adjustment to fair value of intangible assets and a
resulting $1.6 million increase in amortization expense; (b) an adjustment to fair value of property, plant, and equipment and the resulting $3.6 million decrease in depreciation
expense; (c) a change in the share-based compensation plan and a resulting $7.5 million elimination of share-based compensation expense; (d) a $1.4 million decrease of management fees
associated with the former ownership of the Company; (e) a $29.0 million elimination of certain costs associated with the Ares Acquisition which are not ongoing costs of the business; and
(f) a purchase accounting adjustment to unamortized pension liability and a resulting $1.0 million decrease in pension expense.
- (3)
- Represents the estimated increase in interest expense assuming the borrowings under the Term Loan Facility, the Second Lien Term Loan Facility (as defined below) and the Revolving Credit Facility outstanding as of the closing of the Ares Acquisition were outstanding as of January 3, 2011, including the amortization of original issue discount and deferred financing fees.
64
- (4)
- Represents the tax effect of the above adjustments at a 39.0% effective tax rate.
| |
Predecessor | Adjustment | Pro Forma | |||||||
|---|---|---|---|---|---|---|---|---|---|---|
| (Dollars in thousands, except per share data) |
Fiscal Year 2011 |
|
Fiscal Year 2011 |
|||||||
Net sales |
$ | 2,840,336 | $ | — | $ | 2,840,336 | ||||
Cost of sales, buying and occupancy |
2,412,180 | 1,365 | (1) | 2,413,545 | ||||||
| | | | | | | | | | | |
Gross margin |
428,156 | (1,365 | ) | 426,791 | ||||||
Operating and administrative expense |
379,371 | (8,182 | )(2) | 371,189 | ||||||
Loss (gain) on asset sales |
1,952 | — | 1,952 | |||||||
| | | | | | | | | | | |
Income from operations |
46,833 | 6,817 | 53,650 | |||||||
Interest expense, net |
31,395 | 28,795 | (3) | 60,190 | ||||||
(Loss) on early extinguishment of debt |
(4,209 | ) | — | (4,209 | ) | |||||
Equity in earnings of joint venture |
785 | — | 785 | |||||||
| | | | | | | | | | | |
Income (loss) from continuing operations before income taxes |
12,014 | (21,978 | ) | (9,964 | ) | |||||
Income tax (provision) benefit |
(4,795 | ) | 8,791 | (4) | 3,996 | |||||
| | | | | | | | | | | |
Income (loss) from continuing operations |
7,219 | (13,187 | ) | (5,968 | ) | |||||
Income (loss) from discontinued operations, net of income taxes |
3,260 | — | 3,260 | |||||||
| | | | | | | | | | | |
Net income (loss) |
$ | 10,479 | $ | (13,187 | ) | $ | (2,708 | ) | ||
| | | | | | | | | | | |
| | | | | | | | | | | |
Earnings (loss) per share: |
||||||||||
Net income (loss) per share—Basic |
$ | 0.78 | $ | (9.05 | ) | |||||
Net income (loss) per share—Diluted |
$ | 0.78 | $ | (9.05 | ) | |||||
- (1)
- Represents
the estimated impact on cost of sales, buying and occupancy related to (a) an adjustment to fair value of property, plant and equipment
and a resulting $1.1 million increase in depreciation expense; (b) a $1.0 million increase in rent expense as a result of the new basis in leases as of the acquisition date; and
(c) a purchase accounting adjustment to unamortized pension liability and a resulting $0.7 million decrease in pension expense related to our distribution operations.
- (2)
- Represents
the estimated impact to operating and administrative expense related to (a) a fair value of intangible long-lived assets and a resulting
$1.5 million increase in amortization expense; (b) an adjustment to fair value of property, plant, and equipment and a resulting $5.3 million decrease in depreciation expense;
(c) a change in the share-based compensation plan and the resulting $2.4 million elimination of share-based compensation expense; (d) a $1.5 million elimination of management fees
associated with the former ownership of the Company; and (e) a purchase accounting adjustment to unamortized pension liability and a resulting $0.5 million decrease in pension expense.
- (3)
- Represents
the estimated increase in interest expense assuming the borrowings under the Term Loan Facility, the Second Lien Term Loan Facility (as defined
below) and the Revolving Credit Facility outstanding as of the closing of the Ares Acquisition were outstanding as of January 3, 2011, including the amortization of original issue discount and
deferred financing fees.
- (4)
- Represents the tax effect of the above adjustments at a 40.0% effective tax rate.
65
| |
Successor | Pro Forma | Pro Forma | 2013 vs. 2012 Change |
2012 vs. 2011 Change |
|||||||||||||||||
|---|---|---|---|---|---|---|---|---|---|---|---|---|---|---|---|---|---|---|---|---|---|---|
| |
Fiscal Year 2013 |
Fiscal Year 2012 |
Fiscal Year 2011 |
|||||||||||||||||||
| (Dollars in thousands, except per share data) |
$ | % | $ | % | ||||||||||||||||||
Net sales |
$ | 3,210,293 | $ | 3,042,712 | $ | 2,840,336 | 167,581 | 5.51 | % | 202,376 | 7.13 | % | ||||||||||
Cost of sales, buying and occupancy |
2,736,357 | 2,596,847 | 2,413,545 | 139,510 | 5.37 | % | 183,302 | 7.59 | % | |||||||||||||
| | | | | | | | | | | | | | | | | | | | | | | |
Gross margin |
473,936 | 445,865 | 426,791 | 28,071 | 6.30 | % | 19,074 | 4.47 | % | |||||||||||||
Operating and administrative expense |
387,133 | 366,585 | 371,189 | 20,548 | 5.61 | % | (4,604 | ) | (1.24 | )% | ||||||||||||
Loss (gain) on asset sales |
— | 8,813 | 1,952 | (8,813 | ) | (100.00 | )% | 6,861 | 351.49 | % | ||||||||||||
| | | | | | | | | | | | | | | | | | | | | | | |
Income from operations |
86,803 | 70,467 | 53,650 | 16,336 | 23.18 | % | 16,817 | 31.35 | % | |||||||||||||
Interest expense, net |
50,365 | 55,831 | 60,190 | (5,466 | ) | (9.79 | )% | (4,359 | ) | 7.24 | % | |||||||||||
(Loss) on early extinguishment of debt |
(24,487 | ) | — | (4,209 | ) | (24,487 | ) | (100.00 | )% | 4,209 | 100.00 | % | ||||||||||
Equity in earnings of joint venture |
1,649 | 820 | 785 | 829 | 101.10 | % | 35 | 4.46 | % | |||||||||||||
| | | | | | | | | | | | | | | | | | | | | | | |
Income (loss) from continuing operations before income taxes |
13,600 | 15,456 | (9,964 | ) | (1,856 | ) | (12.01 | )% | 25,420 | (255.12 | )% | |||||||||||
Income tax (provision) benefit |
(5,429 | ) | (1,283 | ) | 3,996 | (4,146 | ) | 323.15 | % | 5,279 | 132.11 | % | ||||||||||
| | | | | | | | | | | | | | | | | | | | | | | |
Income (loss) from continuing operations |
8,171 | 14,173 | (5,968 | ) | (6,002 | ) | (42.35 | )% | 20,141 | (337.48 | )% | |||||||||||
Income (loss) from discontinued operations, net of income taxes |
— | — | 3,260 | — | 100.00 | % | (3,260 | ) | (100.00 | )% | ||||||||||||
| | | | | | | | | | | | | | | | | | | | | | | |
Net income (loss) |
$ | 8,171 | $ | 14,173 | $ | (2,708 | ) | (6,002 | ) | (42.35 | )% | 16,881 | (623.38 | )% | ||||||||
| | | | | | | | | | | | | | | | | | | | | | | |
| | | | | | | | | | | | | | | | | | | | | | | |
Earnings (loss) per share: |
||||||||||||||||||||||
Net income (loss) per share—Basic |
$ | 27.22 | $ | 47.37 | $ | (9.05 | ) | |||||||||||||||
Net income (loss) per share—Diluted |
$ | 26.14 | $ | 45.68 | $ | (9.05 | ) | |||||||||||||||
Fiscal Year 2013 (Successor) Compared to Pro Forma Fiscal Year 2012
Gross Margin
Gross margin for fiscal year 2013 increased $28.1 million, or 6.3%, to $473.9 million as compared to $445.9 million for pro forma fiscal year 2012. The increase in gross margin attributable to increased sales was $24.6 million and the increase in gross margin attributable to increased gross margin rate was $3.5 million. As a percentage of sales, gross margin for fiscal year 2013 increased 0.1% to 14.8% as compared to 14.7% for pro forma fiscal year 2012. The increase in gross margin as a percentage of sales was mainly due to a 0.12% increase in merchandise product margin rates as a percentage of sales (including a 0.05% increase in our Smart & Final segment and a 0.07% increase in our Cash & Carry segment) and a 0.05% increase in store occupancy costs primarily associated with fiscal years 2013 and 2012 Smart & Final Extra! store openings, partially offset by a 0.14% reduction in warehouse and transportation costs as a percentage of sales (including a 0.07% decrease in each of our Smart & Final and Cash & Carry segments).
Operating and Administrative Expenses
Operating and administrative expenses for fiscal year 2013 increased $20.5 million, or 5.6%, to $387.1 million as compared to $366.6 million in pro forma fiscal year 2012. As a percentage of sales, operating and administrative expenses for fiscal year 2013 increased 0.1% to 12.1% as compared to 12.0% in pro forma fiscal year 2012. The increase in operating and administrative expenses was primarily due to $12.3 million of increased store labor and associated fringe benefit costs in support of increased sales (including a $10.3 million increase in our Smart & Final segment and a $2.0 million increase in our Cash & Carry segment), $1.0 million of increased store advertising expense, $4.0 million of increased other store direct expenses, and $3.0 million of higher litigation costs. The 0.1% increase
66
in operating and administrative expenses as a percentage of sales was due to a 0.19% increase in asset impairment charges and adjustments to lease obligations associated with closed stores locations, expense accruals for sales tax audits and other corporate expenses, as well as a 0.02% increase in labor and associated fringe benefits, all of which were partially offset by a 0.17% decrease in administrative incentive bonus expense.
Interest Expense, Net
Interest expense for fiscal year 2013 decreased $5.4 million, or 9.8%, to $50.4 million as compared to $55.8 million in pro forma fiscal year 2012. As a percentage of sales, interest expense for fiscal year 2013 decreased 0.2% to 1.6% as compared to 1.8% in pro forma fiscal year 2012. This decrease in interest expense was primarily due to a lower average effective interest rate.
Income Tax (Provision) Benefit
Our income tax provision for fiscal year 2013 increased $4.1 million to $5.4 million as compared to $1.3 million for pro forma fiscal year 2012. The effective income tax rate, excluding the equity in earnings of our joint venture, for fiscal year 2013 was 45.4% as compared to 8.8% for the pro forma fiscal year 2012.
Equity in Earnings of Joint Venture
Equity in earnings of our joint venture for fiscal year 2013 increased $0.8 million to $1.6 million as compared to $0.8 million for pro forma fiscal year 2012.
Pro Forma Fiscal Year 2012 Compared to Pro Forma Fiscal Year 2011
Gross Margin
Gross margin for fiscal year 2012 increased $19.1 million, or 4.5% to $445.9 million as compared to $426.8 million for pro forma fiscal year 2011. The increase in gross margin attributable to increased sales was $30.4 million partially offset by an $11.3 million decrease attributable to lower gross margin rate. As a percentage of sales, gross margin for fiscal year 2012 decreased 0.3% to 14.7% as compared to 15.0% for pro forma fiscal year 2011. The decrease in gross margin as a percentage of sales was mainly due to the impact of sale and leaseback transactions during fiscal year 2011. These transactions resulted in a 0.40% increase (including a 0.39% increase in our Smart & Final segment and a 0.01% increase in our Cash & Carry segment) in store and distribution occupancy costs, partially offset by a 0.10% reduction in warehouse and transportation costs as a percentage of sales.
Operating and Administrative Expenses
Operating and administrative expenses for fiscal year 2012 decreased $4.6 million, or 1.2%, to $366.6 million as compared to $371.2 million in pro forma fiscal year 2011. As a percentage of sales, operating and administrative expenses for fiscal year 2012 decreased 1.1% to 12.0% as compared to 13.1% in pro forma fiscal year 2011. The decrease in operating and administrative expenses was primarily due to a decrease of $6.2 million related to closed stores and impairment charges, a decrease of $3.8 million related to administrative incentive bonuses, a decrease of $1.7 million associated with strategic costs, a $1.6 million decrease in litigation costs, a $1.1 million decrease in SERP (as defined below) costs, a $2.0 million death benefit recognized in fiscal year 2012 associated with the SERP, partially offset by (i) a $10.1 million increase in store labor and associated fringe benefit costs in support of increased sales (including an $8.0 million increase in our Smart & Final segment and a $2.1 million increase in our Cash & Carry segment) and (ii) $1.1 million of increased direct store expenses. The decrease in operating and administrative expenses as a percentage of sales was due to a 0.25% decrease (including a 0.21% decrease in our Smart & Final segment and a 0.04% decrease in our Cash & Carry segment) in store expenses including labor and associated fringe benefits, store supplies, utilities, as well as 0.16% reduction in administrative incentive bonus accrual and an 0.12% reduction in store closure reserve and expense. Additionally, pro forma fiscal year 2011 included $1.7 million of costs related to a strategic initiative.
67
Interest Expense, Net
Interest expense for pro forma fiscal year 2012 was $55.8 million or 1.8% of sales as compared to $60.2 million, or 2.1% of sales, in pro forma fiscal year 2011. The decrease in interest expense is primarily due to sale and leaseback transactions during fiscal year 2011, which resulted in the payoff of certain of our prior loan facilities.
Equity in Earnings of Joint Venture
Equity in earnings of our joint venture for pro forma fiscal year 2012 was $0.8 million as compared to $0.8 million for pro forma fiscal year 2011.
Income Tax (Provision) Benefit
Our income tax provision for fiscal year 2012 increased $5.3 million to $1.3 million as compared to a $4.0 million benefit for pro forma fiscal year 2011. The effective income tax rate, excluding the equity in earnings of our joint venture, for pro forma fiscal year 2012 was 8.8% as compared to 37.2% for pro forma fiscal year 2011. The low tax rate for the pro forma fiscal year 2012 was mainly due to California state EZ credits and foreign tax credits offset by tax on foreign dividend.
Liquidity and Capital Resources
Historically, our primary source of liquidity has been cash flows from operations. Additionally, we have the availability to make borrowings under our Credit Facilities. Our primary uses of cash are for purchases of inventory, operating expenses, capital expenditures primarily for opening, converting or remodeling stores, and debt service. See "—Liquidity and Capital Resources—Capital Expenditure and Other Capital Requirements." In fiscal year 2013, we generated $107.5 million in operating cash flows and ended fiscal year 2013 with $53.7 million of cash and cash equivalents. As of June 15, 2014, we had no amounts drawn under our Revolving Credit Facility and $65.6 million of cash and cash equivalents.
The following table sets forth the major sources and uses of cash for each of the periods set forth below, as well as our cash and cash equivalents at the end of each period.
| |
Successor | |
Predecessor | ||||||||||||||||||
|---|---|---|---|---|---|---|---|---|---|---|---|---|---|---|---|---|---|---|---|---|---|
| (dollars in thousands) |
Twenty-Four Weeks Ended June 15, 2014 |
Twenty-Four Weeks Ended June 16, 2013 |
Year Ended December 29, 2013 |
46 Days Ended December 30, 2012 |
|
318 Days Ended November 14, 2012 |
Year Ended January 1, 2012 |
||||||||||||||
Cash and cash equivalents at end of period |
$ | 65,561 | $ | 67,548 | $ | 53,699 | $ | 35,987 | $ | 92,676 | $ | 72,462 | |||||||||
Cash provided by (used in) continuing operating activities |
65,750 | $ | 61,046 | $ | 107,517 | $ | (9,772 | ) | $ | 16,612 | $ | 63,933 | |||||||||
Cash provided by (used in) continuing investing activities |
(48,462 | ) | $ | (22,279 | ) | $ | (55,319 | ) | $ | (633,718 | ) | $ | (17,489 | ) | $ | 174,342 | |||||
Cash (used in) provided by financing activities |
(5,426 | ) | $ | (7,206 | ) | $ | (34,486 | ) | $ | 679,477 | $ | 21,091 | $ | (472,181 | ) | ||||||
Twenty-Four Weeks Ended June 15, 2014 Compared to the Twenty-Four Weeks Ended June 16, 2013
Operating Activities
Cash flows from operating activities consist of net income adjusted for non-cash items including depreciation and amortization, deferred taxes and the effect of working capital changes. The increase or decrease in cash provided by operating activities from continuing operations reflects our operating performance before non-cash expenses and charges and including the timing of receipts and disbursements.
68
Cash provided by operating activities from continuing operations for the twenty-four weeks ended June 15, 2014 increased $4.7 million to $65.8 million as compared to $61.0 million for the twenty-four weeks ended June 16, 2013. This increase is primarily attributable to lower cash interest payments partially offset by higher cash pension contributions. During the twenty-four weeks ended June 15, 2014, we made cash interest payments of $15.8 million and cash pension contributions of $3.1 million, as compared to cash interest payments of $21.1 million and cash pension contributions of $2.3 million during the twenty-four weeks ended June 16, 2013.
Investing Activities
Cash used in investing activities increased $26.2 million to $48.5 million for the twenty-four weeks ended June 15, 2014 as compared to $22.3 million in the twenty-four weeks ended June 16, 2013. This increase is primarily due to a $26.4 million increase in capital expenditures for property, plant and equipment, including capitalized software, largely as a result of increased investment in store construction and equipment under our plan to accelerate openings of new Extra! stores and conversions of legacy stores to the Extra! format.
Financing Activities
Cash used in financing activities decreased $1.8 million to $5.4 million for the twenty-four weeks ended June 15, 2014, as compared to $7.2 million in in the twenty-four weeks ended June 16, 2013. This decrease is largely attributable to a $4.7 million decrease in net payments on our Term Loan Facility. The decrease in net payments on our Term Loan Facility was partially offset by cash used for employee withholding taxes related to the net settlement of an option exercise in the twenty-four weeks ended June 15, 2014.
At June 15, 2014, we had cash and cash equivalents of $65.6 million, stockholders' equity of $353.9 million and debt, net of debt discount, of $703.3 million. At June 15, 2014 we had working capital of $55.1 million as compared to $56.8 million at June 16, 2013. This decrease in working capital was primarily due to an increase in accrued construction in progress under our plan to accelerate openings of new Extra! stores.
Fiscal Year 2013 (Successor) Compared to the Periods November 15-December 30, 2012 (Successor) and January 2-November 14, 2012 (Predecessor)
Operating Activities
Cash provided by operating activities from continuing operations for fiscal year 2013 was $107.5 million as compared to cash provided by operating activities of $16.6 million in the 2012 Predecessor period and cash used in operating activities of $9.8 million in the 2012 Successor period. The change in cash provided by or used in operating activities is largely due to $7.7 million in pension contributions made in fiscal year 2013 as compared to $9.0 million in the 2012 Predecessor period $0 in the 2012 Successor period. In addition, we made $12.7 million in income tax payments during fiscal year 2013 as compared to $54.7 million in the 2012 Predecessor period and $0 in the 2012 Successor period.
Investing Activities
Cash used in investing activities from continuing operations was $55.3 million in fiscal year 2013 as compared to $17.5 million in the 2012 Predecessor period and $633.7 million in the 2012 Successor period. Cash of $55.1 million for capital expenditures, including capitalized software, was used in fiscal year 2013. Cash of $46.8 million for capital expenditures, including capitalized software, was used in the 2012 Predecessor period, and $27.2 million in cash proceeds was received on the sale of twelve of our store properties. Cash used for investing activities in the 2012 Successor period was primarily
69
attributable to a $631.8 million cash payment made, net of cash acquired, in connection with the Ares Acquisition, as well as $3.4 million for capital expenditures, including capitalized software.
Financing Activities
Cash used in financing activities was $34.5 million in fiscal year 2013 as compared to cash provided by financing activities of $21.1 million in the 2012 Predecessor period and $679.5 million in the 2012 Successor period. The cash used in financing activities in fiscal year 2013 was primarily a result of the amendments to our Term Loan Facility and our incurrence of additional debt issuance costs, as well as contingent consideration payments of $22.9 million related to the Ares Acquisition. Cash provided by financing activities in the 2012 Successor period included $687.3 million in net debt borrowings and $299.2 million received from issuances of our capital stock in connection with the Ares Acquisition, partially offset by the payment of $307.1 million in full satisfaction of Predecessor debt.
At the end of fiscal year 2013, we had cash and cash equivalents of $53.7 million, stockholders' equity of $341.9 million and debt, net of debt discount, of $706.2 million. At the end of fiscal year 2013, we had working capital of $69.0 million as compared to $46.3 million at the end of fiscal year 2012. This increase in working capital is primarily due to our results of operations and the payment of $22.9 million of contingent consideration related to the Ares Acquisition.
Periods November 15-December 30, 2012 (Successor) and January 2-November 14, 2012 (Predecessor) Compared to Fiscal Year 2011
Operating Activities
Cash provided by operating activities from continuing operations was $16.6 million in the 2012 Predecessor period and cash used by operating activities was $9.8 million in the 2012 Successor period, as compared to cash provided by operating activities of $63.9 million in fiscal year 2011. Cash flows in the 2012 Predecessor period were impacted by $9.0 million in pension contributions and $54.7 million in income tax payments; no such payments were made in the 2012 Successor period. Cash of $1.0 million and $51.8 million was used in fiscal year 2011 for pension contributions and income tax payments, respectively.
Investing Activities
Cash used in investing activities from continuing operations was $17.5 million in the 2012 Predecessor period and $633.7 million in the 2012 Successor period as compared to $174.3 million in fiscal year 2011. Cash of $46.8 million for capital expenditures, including capitalized software, was used in the 2012 Predecessor period, as well as $27.2 million in cash proceeds received on the sale of 12 of our store properties. Cash used for investing activities in the 2012 Successor period was primarily attributable to a $631.8 million cash payment made, net of cash acquired, in connection with the Ares Acquisition, as well as $3.4 million for capital expenditures, including capitalized software. Cash of $56.3 million for capital expenditures, including capitalized software, was used in fiscal year 2011, and $230.4 million in cash proceeds was received on the sale and leaseback of 39 of our store properties and one warehouse distribution facility.
Financing Activities
Cash provided by financing activities was $21.1 million in the 2012 Predecessor period and $679.5 million in the 2012 Successor period as compared to cash used in financing activities of $472.2 million in fiscal year 2011. Cash provided by financing activities in the 2012 Successor period included $687.3 million in net debt borrowings and $299.2 million received from issuances of our capital stock in connection with the Ares Acquisition, partially offset by the payment of $307.1 million in full satisfaction of Predecessor debt. The cash used in financing activities in fiscal year 2011 was
70
primarily a result of repayments of amounts outstanding under former credit facilities. Additionally, during fiscal year 2011 we received proceeds of $230.4 million on the sale and leaseback of 39 of our store properties and one warehouse distribution facility, which were used to repay $212.1 million in outstanding amounts under a commercial mortgage real estate agreement. Cash was also used in fiscal year 2011 to prepay certain loan amounts in the amount of $209.7 million and to pay a $41.4 million dividend.
At the end of fiscal year 2012, we had cash and cash equivalents of $36.0 million, stockholders' equity of $307.0 million and debt, net of debt discount, of $704.7 million. At the end of fiscal year 2012 we had working capital of $46.3 million as compared to $53.0 million at the end of fiscal year 2011. This decrease in working capital was primarily due to a $7.3 million increase in the current portion of liabilities included in long-term debt.
Capital Expenditure and Other Capital Requirements
Our primary uses of capital are to finance store development costs for buildings, leasehold improvements, equipment and initial set-up expenditures for new, relocated, converted and remodeled stores, investment in our distribution network, investment in information systems hardware and capitalized software, as well as general working capital requirements.
During fiscal year 2013, we opened five new Extra! stores, and during the twenty-four weeks ended June 15, 2014, we opened six new Extra! stores. We currently plan to open 13 new Extra! stores in fiscal year 2014, including ten that have already opened, and an additional 20 new Extra! stores in fiscal year 2015. We estimate that the average capital expenditure requirement for a new Extra! store is $2.8 million. Additionally, we currently expect to open three new Cash & Carry stores through the end of fiscal year 2015. We estimate that the average capital expenditure requirement for a new Cash & Carry store is $1.1 million.
During fiscal 2013, we converted eight legacy Smart & Final stores to our Extra! format. We plan to continue converting legacy Smart & Final stores to our Extra! format, including through relocations. We currently plan to convert 14 legacy Smart & Final stores to our Extra! format in fiscal year 2014, including seven that have already been completed. We estimate that the average capital expenditure requirement for an Extra! conversion is $2.0 million. We also plan to relocate two legacy Smart & Final stores to our Extra! format in fiscal year 2014, including one that has already been completed.
We also plan to continue investing in our legacy Smart & Final and older Extra! stores with store remodels. We currently plan to remodel four of our legacy Smart & Final stores in fiscal year 2014, including one that has already been completed. We estimate that the average capital expenditure requirement for a typical legacy Smart & Final format remodel is $0.8 million. We also currently plan to remodel six of our older Extra! stores in fiscal year 2014, including five that have already been completed. We estimate that the average capital expenditure requirement for a typical Extra! format remodel is $0.9 million.
We estimate that total capital expenditures, including other investment primarily related to our distribution network and information systems, for fiscal year 2014 will be approximately $105 million. However, we cannot assure that these estimates will be realized and our capital program plans are subject to change upon our further review.
We typically enter into lease arrangements for our store properties. From time to time we may purchase a property for an additional capital investment, depending on the property location and market value. Working capital investment related to a new store is approximately $0.3 million and primarily relates to inventory net of trade vendor accounts payable.
We have various retirement plans which subject us to certain funding obligations. Our Single Employer Plan covered substantially all of our full time employees prior to June 1, 2008. We froze the
71
accruing of future benefits under the Single Employer Plan effective June 1, 2008, with the exception of approximately 450 hourly paid employees in our distribution and transportation operations. We fund this plan with contributions as required by ERISA. Changes in the benefit plan assumptions as well as the funded status of the plan impact the funding and expense levels for future periods. We made cash contributions of $3.1 million and $2.3 million in the twenty-four weeks ended June 15, 2014 and June 16, 2013, respectively. During fiscal year 2014, we plan to fund the total minimum required contribution of $10.7 million.
We expect to fund our capital expenditures and other cash requirements with cash on hand, cash generated from operating activities, the net proceeds from this offering and, if required, borrowings under our Revolving Credit Facility. We believe that our sources of funds are adequate to provide for our working capital, capital expenditures and debt service requirements for the foreseeable future, including investments made, and expenses incurred, in connection with opening new stores or converting or relocating existing stores in accordance with our growth strategy. Our ability to continue to fund these items may be affected by general economic, competitive and other factors, many of which are outside of our control. If our future cash flow from operations and other capital resources are insufficient to fund our liquidity needs, we may be forced to reduce or delay our expected new store openings or store conversions and relocations, sell assets, obtain additional debt or equity capital or refinance all or a portion of our outstanding debt. Alternatively, we may elect to pursue additional expansion opportunities that could require additional debt or equity financing. There can be no assurance that equity or debt financing will be available to us when we need it or, if available, that the terms will be satisfactory to us and not dilutive to our then-current stockholders.
Credit Facilities
We have two arrangements governing our material outstanding indebtedness: our Term Loan Facility and our Revolving Credit Facility.
As of June 15, 2014, the aggregate principal balance of amounts outstanding under our Term Loan Facility was $712.2 million. The term loans incurred under our Term Loan Facility have a maturity date of November 15, 2019. Subject to certain conditions, we may incur additional term loans under the Term Loan Facility in an amount of up to $75.0 million (without regard to any leverage-based limitations) plus, to the extent we comply with certain leverage-based limitations, additional term loans in an unlimited amount. In each case, none of the existing lenders are obligated to provide additional term loans and any additional lenders require the consent of the administrative agent. Smart & Final Stores LLC is required to make scheduled payments of principal at the end of each calendar quarter, each equal to 0.25% of the aggregate original principal amount of the term loans incurred under the Term Loan Facility, with the balance due on the maturity date. Smart & Final Stores LLC may prepay the Term Loans, in whole or in part, at any time, subject to certain conditions. Mandatory prepayments are required in the amount of (i) the net proceeds of a sale of assets, subject to the priority of the Revolving Credit Facility Collateral (as defined below), (ii) the net proceeds of the incurrence of indebtedness to the extent such indebtedness is not permitted under the terms of the Term Loan Facility and (iii) a percentage of annual "excess cash flow," as adjusted by voluntary prepayments.
The Revolving Credit Facility provides for up to $150.0 million of borrowings (including up to $50.0 million for the issuance of letters of credit), subject to certain borrowing base limitations. Subject to certain conditions, we may increase the commitments under the Revolving Credit Facility by up to $100.0 million. The Revolving Credit Facility has a term of five years with a maturity date of November 15, 2017. As of June 15, 2014, we had no outstanding borrowings under the Revolving Credit Facility and outstanding letters of credit were $26.6 million. After giving effect to such letters of credit, we had $123.4 million of availability under the Revolving Credit Facility as of June 15, 2014.
72
Collateral
All obligations under the Term Loan Facility are guaranteed by Intermediate Holdings and certain of its current and future domestic direct and indirect subsidiaries. In addition, the obligations under the Term Loan Facility are secured by (x) a first-priority security interest in substantially all of the property and assets of, as well as the equity interests owned by, Smart & Final Stores LLC and Intermediate Holdings and the other guarantors (other than Revolving Credit Facility Collateral (as defined below)) and (y) a second-priority security interest in the Revolving Credit Facility Collateral.
All obligations under the Revolving Credit Facility are guaranteed by Intermediate Holdings and certain of Intermediate Holdings' current and future domestic direct and indirect subsidiaries. In addition, the obligations under the Revolving Credit Facility are secured by (i) a first-priority security interest in the accounts receivable, inventory, cash and cash equivalents, and related assets, of Smart & Final Stores LLC and Intermediate Holdings and the other guarantors (the "Revolving Credit Facility Collateral") and (ii) a second-priority security interest in substantially all of the other property and assets of, as well as the equity interests owned by, Smart & Final Stores LLC and Intermediate Holdings and the other guarantors.
Covenants
The Term Loan Facility has no financial maintenance covenants.
The Revolving Credit Facility includes a "springing" financial maintenance covenant, applicable when a covenant trigger event has occurred and is continuing. If such a covenant trigger event has occurred and is continuing, Smart & Final Stores LLC is required to maintain a fixed charge coverage ratio of not less than 1.0 to 1.0. A covenant trigger event shall have occurred any time that availability under the Revolving Credit Facility is less than the greater of (i) $12.5 million and (ii) 10.0% of the line cap (the lesser of the aggregate commitments under the Revolving Credit Facility and the borrowing base then in effect) (the "Trigger Threshold"). Once commenced, a covenant trigger event shall be deemed to continue until such time as availability equals or exceeds the Trigger Threshold for 20 consecutive days. As of June 15, 2014, no trigger event has occurred.
Contractual Obligations
The following table sets forth our future payments due by period of our contractual obligations as of December 29, 2013, in thousands:
| |
Total | Less than one year |
1 - 3 Years | 3 - 5 Years | Thereafter | |||||||||||
|---|---|---|---|---|---|---|---|---|---|---|---|---|---|---|---|---|
Long-term debt(1) |
$ | 715,788 | $ | 7,200 | $ | 16,200 | $ | 14,400 | $ | 677,988 | ||||||
Interest on long-term debt(1) |
211,038 | 32,023 | 81,631 | 68,946 | 28,438 | |||||||||||
Operating leases |
804,932 | 83,335 | 156,755 | 130,580 | 434,262 | |||||||||||
| | | | | | | | | | | | | | | | | |
Total contractual obligations |
$ | 1,731,758 | $ | 122,558 | $ | 254,586 | $ | 213,926 | $ | 1,140,688 | ||||||
| | | | | | | | | | | | | | | | | |
| | | | | | | | | | | | | | | | | |
- (1)
- Does not give effect to this offering and application of the net proceeds therefrom as set forth under "Use of Proceeds."
The interest payments on our Term Loan Facility outstanding as of December 29, 2013 incorporate the effect of the interest rate swap, which effectively converts the variable rate of the Term Loan to a fixed rate. The five-year interest rate swap fixed the LIBOR component of interest at 1.5995% on a variable notional amount through March 29, 2018. See Note 5, Debt, and Note 6, Derivative Financial Instruments, to our audited consolidated financial statements for additional information on our interest requirements and interest rate swap contract.
73
Purchase orders or contracts for the purchase of goods for resale in our stores and other goods and services are not included in the table above. We are not able to reasonably determine the aggregate amount of such purchase orders that may constitute established contractual obligations, as purchase orders may represent individual authorizations to purchase rather than binding agreements. Other than with respect to Unified Grocers (as described immediately below), we do not have significant agreements for the purchase of goods for resale in our stores or other goods and services that exceed our expected requirements or that are not cancelable on short notice.
We have a contractual obligation under our supply agreement with Unified Grocers to purchase a minimum amount of food and related items during any twelve-month period covered by the agreement. This contractual obligation does not exceed our expected requirements over any twelve-month period covered by the agreement. This agreement, as amended, expires in December 2015. The related amounts are not included in the above table.
The table above also excludes funding of pension and other postretirement benefit and postemployment obligations. See Note 9, Retirement Benefit Plans and Postretirement and Postemployment Benefit Obligations, to our audited consolidated financial statements for additional information on funding of our plans.
We also have asset retirement obligations with respect to owned or leased properties. Due to the nature of our business, such asset retirement obligation is immaterial.
Off-Balance Sheet Arrangements
As of June 15, 2014, we had no off-balance sheet arrangements.
Multiemployer Plan
The Company participates in and contributes to the Multiemployer Plan on behalf of union employees in our Cash & Carry operations. At the end of fiscal year 2013 and fiscal year 2012, there were approximately 165 and 152 union employees covered under this plan, respectively. Our employer contributions and corresponding pension expense for the Multiemployer Plan was $1.2 million for fiscal year 2013, $1.0 million for the 2012 Predecessor period, $0.2 million for the 2012 Successor period and $1.0 million for fiscal year 2011.
We participate in the Multiemployer Plan pursuant to a collective bargaining agreement with the Western Conference of Teamsters. The Multiemployer Plan provides and maintains retirement, death and termination benefits for employees in collective bargaining units represented by local unions affiliated with the Western Conference of Teamsters. The Multiemployer Plan is subject to the provisions of ERISA, as amended.
The Western Conference of Teamsters Pension Agreement and Declaration of Trust dated April 26, 1955, pursuant to which the Multiemployer Plan was established, provides that the trustees of the Multiemployer Plan shall establish and adjust the levels of prospective plan benefits so that employer contributions received by the Multiemployer Plan will always meet the minimum funding standards of Section 302 of ERISA and Section 412 of the Internal Revenue Code of 1986. The trustees have established a funding policy that specifies funding targets that may result in more rapid funding than prescribed by the minimum funding standards and that provides for benefit adjustments based on specified funding targets. The Multiemployer Plan's actuary has advised that the minimum funding requirements of ERISA are being met as of January 1, 2013 (based on the most recent information available).
As of January 1, 2013, the Multiemployer Plan actuarial present value of accumulated plan benefits was $37,865.4 million and the actuarial value of assets for funding the standard account was $34,132.5 million, resulting in a funded percentage of 90.1%. The Multiemployer Plan covered
74
approximately 539,000 participants as of December 31, 2012. Approximately 1,620 employers participate in the Multiemployer Plan and total employer contributions for the plan year ended December 31, 2012 totaled $1,367.3 million.
Impact of Inflation
Our primary costs, merchandise and labor, as well as utility and transportation costs are affected by a number of factors that are beyond our control, including inflation and deflation. Inflation and deflation in the price of merchandise we sell, as well as fuel and other commodities employed in the course of our business, may periodically affect our sales and gross margin. As is common practice within the food industry, we have generally been able to manage the short-term impact of inflation and deflation and maintain margins by adjusting selling prices and through procurement and supply chain efficiencies. Food inflation and deflation is affected by a variety of factors and our determination of whether to pass on the effects of inflation or deflation to our customers is made in conjunction with our overall pricing and marketing strategies. Although we may experience periodic effects on sales, operating margins and gross margin as a result of changing prices, we do not expect the effect of inflation or deflation to have a material impact on our ability to execute our long-term business strategy.
Critical Accounting Estimates
The preparation of financial statements in conformity with accounting principles generally accepted in the United States requires management to make estimates and assumptions that affect the reported assets, liabilities, sales and expenses in the accompanying financial statements. Critical accounting estimates are those that require the most subjective and complex judgments, often employing the use of estimates about the effect of matters that are inherently uncertain. These critical accounting estimates, under different conditions or using different assumptions or estimates, could show materially different results on our financial condition and results of operations. The following are considered our most critical accounting estimates that, under different conditions or using different assumptions or estimates, could show materially different results on our financial condition and results of operations.
Share-Based Compensation
We account for share-based compensation in accordance with ASC 718, Compensation—Stock Compensation ("ASC 718"). ASC 718 requires all share-based payments to be recognized in the statements of operations and comprehensive income (loss) as compensation expense based on their fair values over the requisite service period of the award, taking into consideration estimated forfeiture rates.
We use the Black-Scholes-Merton option-pricing model to estimate the fair value of the options on the date of each grant. The Black-Scholes-Merton option-pricing model utilizes highly subjective and complex assumptions to determine the fair value of share-based compensation, including the option's expected term and price volatility of the underlying stock.
Given the absence of a public trading market for our common stock, the fair value of the common stock underlying our share-based awards was determined by our board of directors, with input from management and, in some cases, a contemporaneous valuation report prepared by an unrelated nationally recognized third-party valuation specialist, in each case using the income and market valuation approach. We believe that our board of directors has the relevant experience and expertise to determine the fair value of our common stock. In accordance with the American Institute of Certified Public Accountants Accounting and Valuation Guide: Valuation of Privately-Held-Company Equity Securities Issued as Compensation, our board of directors exercised reasonable judgment and considered
75
numerous objective and subjective factors to determine the best estimate of the fair value of our common stock including:
- •
- contemporaneous valuations of our common stock performed by an unrelated nationally recognized third-party valuation
specialist;
- •
- our historical and projected operating and financial results, including capital expenditures;
- •
- current business conditions and performance, including dispositions and discontinued operations;
- •
- the market performance and financial results of comparable publicly-traded companies;
- •
- amounts of indebtedness;
- •
- industry or company-specific considerations;
- •
- likelihood of achieving a liquidity event, such as an initial public offering or a sale of the company;
- •
- lack of marketability of our common stock; and
- •
- the U.S. and global capital market conditions.
These estimates will not be necessary to determine the fair value of new awards once the underlying shares begin trading publicly.
In addition to assumptions used in the Black-Scholes-Merton option pricing model, we must also estimate a forfeiture rate to calculate the share-based compensation cost for our awards. Our forfeiture rate is based on an analysis of our actual historical forfeitures.
The assumptions referred to above represent management's best estimates. These estimates involve inherent uncertainties and the application of management's judgment. If these assumptions change and different factors are used, our share-based compensation expense could be materially different in the future.
We recognize compensation cost for graded vesting awards as if they were granted in multiple awards. We believe the use of this "multiple award" method is preferable because a stock option grant with graded vesting is effectively a series of individual grants that vests over various periods. Management also believes that this provides for better matching of compensation costs with the associated services rendered throughout the applicable vesting periods.
We have granted options to purchase up to 33,345 shares of our common stock to our employees and directors after the Ares Acquisition through June 15, 2014, which contain repurchase rights and transfer restrictions. Options to purchase up to 18,878 shares of our common stock granted through June 15, 2014 allow the Company to exercise such repurchase rights at the lesser of the exercise price paid by the participant to exercise the stock option or the fair market value of our common stock issuable upon exercise. If we were to exercise such repurchase rights related to these options to purchase up to 18,878 shares of our common stock the participant would receive no monetary benefit. Accordingly, as it is currently not assured or probable that participants will realize any monetary benefit from the exercise of such options, we have not recorded any share-based compensation expense. Upon closing of this offering (a "liquidity event"), the restrictions on transfer of shares will lapse. Thus, the participant would be able to realize rewards of ownership from the award upon a liquidity event and we would record share-based compensation expense as of the closing of this offering corresponding to the underlying vesting periods of such options.
76
The following table summarizes information regarding options to purchase our common stock granted since January 1, 2013 through the date hereof:
| |
|
Pre-Stock Split | Post-Stock Split | |||||||||||||
|---|---|---|---|---|---|---|---|---|---|---|---|---|---|---|---|---|
Grant Date
|
Number of Shares (Pre-Stock Split) |
Exercise Price Per Share |
Fair Value Per Share on Grant Date |
Exercise Price Per Share |
Fair Value Per Share on Grant Date |
|||||||||||
February 1, 2013 |
13,265 | $ | 1,000 | $ | 1,000 | $ | $ | |||||||||
|
13,265 | $ | 1,500 | $ | ||||||||||||
March 19, 2013 |
539 | $ | 1,000 | $ | 1,000 | $ | $ | |||||||||
|
539 | $ | 1,500 | $ | ||||||||||||
May 31, 2013 |
495 | $ | 1,000 | $ | 1,000 | $ | $ | |||||||||
|
495 | $ | 1,500 | $ | ||||||||||||
January 31, 2014 |
212 | $ | 1,500 | $ | 1,500 | $ | $ | |||||||||
|
212 | $ | 2,250 | $ | ||||||||||||
February 1, 2013 through May 31, 2013
The Ares Acquisition was consummated on November 15, 2012 for consideration reflecting a value of our common stock of $1,000 per share (or $ per share after giving effect to the -for-one split of our common stock to be effected prior to the closing of this offering). The purchase price was the product of arm's-length negotiation, following an auction process, between Ares and Apollo, the principal former stockholder of our predecessor and a sophisticated and knowledgeable private equity fund. Our board of directors determined that this negotiated price provided the best indication of the fair value of our common stock on the date of the Ares Acquisition.
Following the Ares Acquisition, we developed a new growth strategy to build upon our history of new store openings (the "New Growth Strategy"). The New Growth Strategy contemplated moderate increased growth in store openings in 2013 and accelerated growth in store openings in 2014 and 2015. Our board of directors determined that, based on (i) the short period of time we had to begin to implement and execute upon the New Growth Strategy and (ii) the overall stability of our business condition, prospects and operating performance during the six-month period from the date of the Ares Acquisition through May 31, 2013, no adjustment to the fair value of our common stock was appropriate during such period. Accordingly, for options granted during this period, our board of directors assigned exercise prices that equaled or exceeded $1,000 per share (or $ per share after giving effect to the -for-one split of our common stock to be effected prior to the closing of this offering), the fair value on the date of grant as determined by our board of directors.
January 31, 2014
Our board of directors determined the fair value of our common stock on January 31, 2014 was $1,500 per share (or $ per share after giving effect to the -for-one split of our common stock to be effected prior to the closing of this offering). This valuation was based on (i) the factors described above, primarily our financial and operating results for fiscal year 2013, including the increases in net sales and comparable store sales, (ii) an internal valuation that applied the same EBITDA multiple that had been used to determine the enterprise value reflected by the purchase price paid in the Ares Acquisition, and (iii) the demonstrated impact of our recent history of new store openings on our financial and operating results. The valuation also accounted for changes to enterprise value due to cash generated by us and changes in debt balances subsequent to the Ares Acquisition.
Our board of directors awarded options on January 31, 2014 at exercise prices equal to or exceeding $1,500 per share (or $ per share after giving effect to the -for-one split
77
of our common stock to be effected prior to the closing of this offering), which equaled the fair value thereof on the date of grant as so determined by our board of directors.
Supporting the reasonableness of this valuation, subsequent to the January 31, 2014 awards, we obtained a valuation report from a third-party valuation specialist, which concluded that, as of December 29, 2013, the fair value of our common stock was $1,430 per share (or $ per share after giving effect to the -for-one split of our common stock to be effected prior to the closing of this offering).
Estimates by our management or our board of directors will not be necessary to determine the fair value of new awards once a public trading market for our common stock has been established in connection with the completion of this offering.
Factors Contributing to the Difference Between the Grant Date Fair Value and the Price Range
As is typical for initial public offerings, the price range for this offering was not derived using a formal determination of fair value, but was determined as a result of discussions among representatives of our management, our board of directors and the underwriters. During these discussions, the parties considered both quantitative and non-quantitative factors, such as our business prospects and recent and prevailing market conditions.
In addition to this difference in purpose and methodology, we believe that the difference in value reflected between the midpoint of the price range set forth on the cover page of this prospectus and our board of directors' determinations of the fair value of our common stock as of the dates set forth above was also the result of the following factors, among others:
- •
- the execution of the New Growth Strategy in 2014 and our expected new store openings for the remainder of 2014 and in
2015;
- •
- our significant growth in the first half of 2014 as compared to the same period in 2013;
- •
- the determinations as of the dates set forth above were based on the fair values of our common stock that was then
illiquid and might never become liquid, whereas the price range set forth on the cover page of this prospectus represents a price for shares of our common stock freely tradeable in the public market;
- •
- we expect the use of proceeds from this offering to strengthen our balance sheet by increasing our cash and reducing our
outstanding indebtedness; and
- •
- this offering will provide us with access to the public company debt and equity markets.
Inventories
Inventories consist of merchandise purchased for resale which is stated at the lower of the weighted-average cost (which approximates FIFO) or market. We provide for estimated inventory losses between physical inventory counts at our stores based upon historical inventory losses as a percentage of sales. The provision is adjusted periodically to reflect updated trends of actual physical inventory count results.
The proper valuation of inventory also requires us to estimate the net realizable value of our slow-moving inventory at the end of each period. We base net realizable values upon many factors, including historical recovery rates, the aging of inventories on hand, the inventory movement of specific products and the current economic conditions. When we have determined inventory to be slow-moving, the inventory is reduced to its net realizable value by recording an obsolescence valuation allowance.
With regard to the proper valuation of inventories, we review our valuation methodologies on a recurring basis and make refinements where the facts and circumstances dictate. We had reserves for
78
inventory losses and slow-moving inventory totaling $3.3 million and $4.1 million as of December 29, 2013 and December 30, 2012, respectively.
Goodwill and Intangible Assets
We account for goodwill and identified intangible assets in accordance with ASC 350, Intangibles—Goodwill and Other. Goodwill and identifiable intangible assets with indefinite lives are not amortized, but instead are evaluated on an annual basis for impairment, or more frequently if events or changes in circumstances indicate that the asset might be impaired.
We evaluate goodwill for impairment by comparing the fair value of each reporting unit to its carrying value including the associated goodwill. We have designated our reporting units to be our Smart & Final banner and our Cash & Carry banner. We determine the fair value of the reporting units using the income approach methodology of valuation that includes the discounted cash flow method as well as other generally accepted valuation methodologies.
Our detailed impairment analysis involves the use of discounted cash flow models. Significant management judgment is necessary to evaluate the impact of operating and macroeconomic changes on existing and forecasted results. Determining market values using a discounted cash flow method requires that we make significant estimates and assumptions, including long-term projections of cash flows, market conditions and appropriate market rates. Our judgments are based on historical experience, current market trends and other information. In estimating future cash flows, we rely on internally generated forecasts for operating profits and cash flows, including capital expenditures. Critical assumptions include projected comparable store sales growth, timing and number of new store openings, operating profit rates, general and administrative expenses, direct store expenses, capital expenditures, discount rates, royalty rates and terminal growth rates. We determine discount rates based on the weighted average cost of capital of a market participant. Such estimates are derived from our analysis of peer companies and consider the industry weighted average return on debt and equity from a market participant perspective. We also use comparable market earnings multiple data and our Company's market capitalization to corroborate our reporting unit valuation. Factors that could cause us to change our estimates of future cash flows include a prolonged economic crisis, successful efforts by our competitors to gain market share in our core markets, our inability to compete effectively with other retailers or our inability to maintain price competitiveness.
If the fair value of the reporting unit exceeds the carrying value of the net assets, including goodwill assigned to that unit, goodwill is not impaired. If the carrying value of the reporting unit's net assets, including goodwill, exceeds the fair value of the reporting unit, we are required to perform a second step, as this is an indication that the reporting unit's goodwill may be impaired. In this step, we compare the implied fair value of the reporting unit's goodwill with the carrying amount of the reporting unit's goodwill. The implied fair value of goodwill is determined by allocating the fair value of the reporting unit to all of the assets and liabilities of the reporting unit in a manner similar to a purchase price allocation. The residual fair value after this allocation is the implied fair value of the reporting unit goodwill.
If the carrying amount of a reporting unit's goodwill exceeds its implied value, then an impairment of goodwill has occurred and we would recognize an impairment charge for the difference between the carrying amount and the implied fair value of goodwill. In fiscal years 2013, 2012 and 2011, we did not recognize any goodwill impairment loss as a result of such evaluation.
We evaluate our indefinite-lived intangible assets associated with trade names using a two-step approach. The first step screens for potential impairment by comparing the fair value of each trade name with its carrying value. The second step measures the amount of impairment. We determine the fair value of the indefinite-lived trade names using a "relief from royalty payments" methodology. This methodology involves estimating reasonable royalty rates for each trade name and applying these
79
royalty rates to a revenue stream and discounting the resulting cash flows to determine fair value. In the periods presented, we did not recognize any indefinite-lived trade name impairment loss as a result of such evaluation.
Finite-lived intangible assets, like other long-lived assets as required by ASC 360 (as defined below), are subject to review for impairment whenever events or changes in circumstances indicate that the carrying amount of the finite-lived intangible asset may not be recoverable. Impairment is recognized to the extent the sum of the discounted estimated future cash flows from the use of the finite-lived intangible asset is less than the carrying value. We did not report any impairment loss as a result of such reviews during any of the periods presented.
Impairments of Long-Lived Assets
In accordance with ASC 360, Property, Plant, and Equipment, ("ASC 360"), we assess review our long-lived assets, including property, plant and equipment and assets under capital leases, for impairment whenever events or changes in circumstances indicate that the carrying amount of an asset may not be recoverable. We believe that impairment assessment of long-lived assets is critical to the financial statements because the recoverability of the amounts, or lack thereof, could significantly affect our results of operations. Determining whether an impairment has occurred typically requires various estimates and assumptions, including determining which cash flows are directly related to the potentially impaired asset, the useful life over which cash flows will occur, amount of such cash flows, and the asset's residual value, if any. In turn, measurement of an impairment loss requires a determination of fair value, which is based on the best information available. We use internal discounted cash flow estimates and independent appraisals as appropriate to determine fair value. We derive the required cash flow estimates from our historical experience and our internal business plans and apply an appropriate discount rate. We group and evaluate long-lived assets for impairment at the individual store level, which is the lowest level at which individual identifiable cash flows are available. We regularly review our stores' operating performance for indicators of impairment, which include a significant underperformance relative to expected historical or projected future results of operations or a significant negative industry or economic trend.
Recoverability of assets to be held and used is measured by a comparison of the carrying amount of an asset to the future undiscounted cash flows expected to be generated by the asset. If the carrying amount of an asset exceeds its future undiscounted cash flows, an impairment charge is recognized equal to the excess of the carrying value over the estimated fair value of the asset.
We measure the fair value of our long-lived assets on a nonrecurring basis using Level 3 inputs as defined in the fair value hierarchy. As a result of such reviews, we recorded a pre-tax impairment loss of $0.8 million, $0, $0.5 million and $1.6 million for fiscal year 2013, the 2012 Successor period, the 2012 Predecessor period, and fiscal year 2011, respectively. The impairment losses were reported within "Operating and administrative expenses" on our consolidated statements of operations and comprehensive income (loss). We also recorded a pre-tax impairment loss of $0.9 million for fiscal year 2011, which was reported within "Discontinued operations, net of income taxes" on our consolidated statements of operations.
Capitalized software costs are subject to review for impairment whenever events or changes in circumstances indicate that the carrying amount of the capitalized software may not be recoverable, whether it is in use or under development. Impairment is recognized to the extent the sum of the future discounted cash flows from the use of the capitalized software is less than the carrying value. As a result of such reviews, we recorded a pre-tax impairment loss of $0.3 million for fiscal year 2013, which was reported within "Operating and administrative expenses" on our consolidated statements of operations and comprehensive income (loss). We did not report any impairment loss during the 2012
80
Predecessor period or 2012 Successor period. The Company recorded a pre-tax impairment loss of $0.3 million for fiscal year 2011.
Income Taxes
Income taxes are accounted for under the asset and liability method. Deferred tax assets and liabilities are recognized for the future tax consequences attributable to differences between the financial statement carrying amounts of existing assets and liabilities and their respective tax bases. Deferred tax assets and liabilities are measured using enacted tax rates expected to apply to taxable income in the years in which those temporary differences are expected to be recovered or settled. The effect on deferred tax assets and liabilities for a change in tax rates is recognized in income in the period that includes the enactment date. Under applicable accounting guidance, we are required to evaluate the realizability of our deferred tax assets. The realization of our deferred tax assets is dependent on future earnings. Applicable accounting guidance requires that we recognize a valuation allowance when it is more likely than not that all or a portion or all of a deferred tax asset will not be realized due to the inability to generate sufficient taxable income in future periods. Accordingly, significant accounting judgment is required in our assessment of deferred tax assets and valuation allowances and deferred liabilities, and determining the provision for income taxes and related accruals.
In the ordinary course of business, there are transactions and calculations where the ultimate tax outcome is uncertain. In addition, we are subject to periodic audits and examinations by the Internal Revenue Service and other state and local taxing authorities. Although we believe that our estimates are reasonable, actual results could materially differ from these estimates.
Self-Insurance
We purchase third-party insurance for risks related to workers' compensation and general liability costs that exceed certain limits for each respective insurance program.
We are also responsible for the payment of claims less than the insured amount. We establish estimated accruals for our insurance programs based on certain factors, including available claims data, historical trends and experience, as well as projected ultimate costs of the claims. These accruals are based on estimates prepared with the assistance of outside actuaries, and the ultimate cost of these claims may vary from initial estimates and established accruals. We believe that the use of actuarial studies to determine self-insurance accruals represents a consistent method of measuring these subjective estimates. The actuaries periodically update their estimates and we record such adjustments in the period in which such determination is made. The inherent uncertainty of future loss projections could cause actual claims to differ from our estimates.
The accrued obligation for these self-insurance programs was approximately $31.4 million and $29.4 million as of December 29, 2013 and December 30, 2012, respectively. These balances are included in "Other long-term liabilities" in our consolidated balance sheets.
Closed Store Reserve
The Company maintains reserves for costs associated with closures of operating stores and other properties that are no longer being utilized in current operations. In the event a leased store is closed before the expiration of the associated lease, the discounted remaining lease obligation less estimated sublease rental income, asset impairment charges related to improvements and fixtures, inventory write-downs and other miscellaneous closing costs associated with the disposal activity are recognized when the store closes. Adjustments to closed store liabilities primarily relate to changes in subtenant income and actual exit costs differing from original estimates. Adjustments are made for changes in estimates in the period in which the change becomes known.
81
Retirement Benefit Plans and Postretirement Benefit Plans
Certain of our employees are covered by a noncontributory funded defined benefit pension plan. GAAP requires that we measure the benefit obligations and fair value of plan assets that determine our plans' funded status as of our fiscal year end date.
The determination of our obligation and expense for pension benefits is dependent, in part, on our selection of certain assumptions used by us and our actuaries in calculating such amounts. Those assumptions are described in Note 9, Retirement Benefit Plans and Postretirement and Postemployment Benefit Obligations, in the accompanying notes to the consolidated financial statements contained herein. Pension assumptions are significant inputs to the actuarial models that measure pension benefit obligations and related effects on operations. Three assumptions, among others—discount rate, expected long-term return on plan assets rate of compensation increases—are important elements of plan expense and asset/liability measurement. We evaluate these critical assumptions at least annually. We periodically evaluate other assumptions involving demographic factors, such as retirement age, mortality and turnover, and update them to reflect our experience and expectations for the future. Actual results in any given year will often differ from actuarial assumptions because of economic and other factors.
In accordance with GAAP, the amount by which actual results differ from the actuarial assumptions is accumulated and amortized over future periods and, therefore, affects recognized expense in such future periods. While we believe our assumptions are appropriate, significant differences in actual results or significant changes in our assumptions may materially affect our pension and other postretirement obligations and future expenses.
We determine the discount rate using current investment yields on high quality fixed—income investments. The discount rate assumption used to determine the year-end projected benefit obligation is increased or decreased to be consistent with the change in yield rates for high quality fixed-income investments for the expected period to maturity of the pension benefits. A lower discount rate increases the present value of benefit obligations and increases pension expense.
Vendor Rebates and Other Allowances
As a component of our consolidated procurement program and consistent with standard practices in the retail industry, we frequently enter into contracts with vendors that provide for payments of rebates or other allowances. These rebates and allowances are primarily comprised of volume or purchase-based incentives, advertising allowances and promotional discounts. The purpose of these incentives and allowances is generally to help defray the costs we incur for stocking, advertising, promoting and selling the vendor's products.
As prescribed by GAAP, these vendor payments are reflected in the carrying value of the inventory when earned or as progress is made toward earning the rebate or allowance and as a component of cost of sales as the inventory is sold. Certain of these vendor contracts provide for rebates and other allowances that are contingent upon us meeting specified performance measures such as a cumulative level of purchases over a specified period of time. Such contingent rebates and other allowances are given accounting recognition at the point at which achievement of the specified performance measures are deemed to be probable and reasonably estimable.
We review the relevant or significant factors affecting proper performance measures, rebates and other allowances on a recurring basis and make adjustments where the facts and circumstances dictate.
Recently Issued Accounting Pronouncements Not Yet Adopted
In March 2013, FASB issued ASU 2013-05, Foreign Currency Matters (Topic 830): Parent's Accounting for the Cumulative Translation Adjustment upon Derecognition of Certain Subsidiaries or
82
Groups of Assets within a Foreign Entity or of an Investment in a Foreign Entity. ASU 2013-05 requires a reporting entity that either sells a part or all of its investment in a foreign entity or no longer holds a controlling financial interest in a subsidiary or group of assets that is a nonprofit activity or a business (other than a sale of in substance real estate or conveyance of oil and gas mineral rights) within a foreign entity, to release any cumulative translation adjustment into net income. ASU 2013-05 is effective for fiscal years beginning after December 15, 2013, with early adoption permitted. We do not expect the adoption of ASU 2013-05 will have a material effect on our consolidated financial statements.
In July 2013, FASB issued ASU 2013-11, Income Taxes (Topic 740): Presentation of an Unrecognized Tax Benefit When a Net Operating Loss Carryforward, a Similar Tax Loss, or a Tax Credit Carryforward Exists. ASU 2013-11 requires that an unrecognized tax benefit, or a portion of an unrecognized tax benefit, should be presented in the financial statements as a reduction to a deferred tax asset for a net operating loss carryforward, a similar tax loss or a tax credit carryforward. ASU 2013-11 further states that to the extent that a net operating loss carryforward, a similar tax loss or a tax credit carryforward is not available at the reporting date under the tax law of the applicable jurisdiction to settle any additional income taxes that would result from the disallowance of a tax position or the tax law of the applicable jurisdiction does not require the entity to use, and the entity does not intend to use, the deferred tax asset for such purpose, then the unrecognized tax benefit should be presented as a liability in the financial statements and should not be combined with deferred tax assets. ASU 2013-11 is effective for fiscal years, and interim periods within those years, beginning after December 15, 2013, with early adoption permitted. We do not expect the adoption of ASU 2013-11 will have a material effect on our consolidated financial statements.
In April 2014, FASB issued ASU No. 2014-08, Presentation of Financial Statements (Topic 205) and Property, Plant, and Equipment (Topic 360): Reporting Discontinued Operations and Disclosures of Disposals of Components of an Entity. The amendments in ASU 2014-08 change the criteria for reporting discontinued operations while enhancing disclosures in this area. It also addresses sources of confusion and inconsistent application related to financial reporting of discontinued operations guidance in GAAP. Under the new guidance, only disposals representing a strategic shift in operations should be presented as discontinued operations. Those strategic shifts should have a major effect on the organization's operations and financial results. Examples include a disposal of a major geographic area, a major line of business, or a major equity method investment. In addition, the new guidance requires expanded disclosures about discontinued operations that will provide financial statement users with more information about the assets, liabilities, income, and expenses of discontinued operations. The amendments in this ASU are effective for the first quarter of 2015 for public organizations with calendar year ends. We do not expect the adoption of the standard update to have a material impact on its consolidated financial position or results of operations.
In May 2014, the FASB issued ASU 2014-09, Revenue from Contracts with Customers (Topic 606). ASU 2014-09 outlines a single comprehensive model for entities to use in accounting for revenue arising from contracts with customers and supersedes most current revenue recognition guidance, including industry-specific guidance. The new revenue model is designed to provide a more robust framework for addressing revenue issues and requires an entity to recognize revenue to depict the transfer of promised goods or services to customers in an amount that reflects the consideration to which the entity expects to be entitled in exchange for those goods or services. ASU 2014-09 is effective for the fiscal years beginning after December 15, 2016, including interim periods within that reporting period, under either full or modified retrospective adoption. Early application is not permitted. We are currently evaluating the impact of the adoption of this standard on the Company's consolidated financial statements.
In June 2014, the FASB issued ASU 2014-12, Accounting for Share-Based Payments When the Terms of an Award Provide That a Performance Target Could Be Achieved after the Requisite Service Period. The
83
standard provides guidance that a performance target that affects vesting of a share-based payment and that could be achieved after the requisite service condition is a performance condition. As a result, the target is not reflected in the estimation of the award's grant date fair value. Compensation cost for such award would be recognized over the required service period, if it is probable that the performance condition will be achieved. ASU 2014-12 is effective for annual reporting periods beginning after December 15, 2015. Early adoption is permitted. The guidance should be applied on a prospective basis to awards that are granted or modified on or after the effective date. Companies also have the option to apply the amendments on a modified retrospective basis for performance targets outstanding on or after the beginning of the first annual period presented as of the adoption date. We do not expect the adoption of ASU 2014-12 to have a material effect on our consolidated financial statements.
Quantitative and Qualitative Disclosures about Market Risk
Foreign Currency Risk
We are exposed to market risks relating to fluctuations in foreign exchange rates between the U.S. dollar and other foreign currencies, primarily the Mexican Peso. Our exposure to foreign currency risk is limited to our operations in Mexico and the equity earnings of our joint venture. As of the end of fiscal year 2013, our exposure to foreign exchange rates was limited. At 2013 year end, such exposure was the $10.9 million net investment in Smart & Final Mexico, which was comprised primarily of the Mexico joint venture. The remainder of our business is conducted in U.S. dollars and thus is not exposed to fluctuation in foreign currency. We do not hedge our foreign currency exposure and therefore are not exposed to such hedging risk.
Interest Rate Risk and Sensitivity Analysis
As described under "—Liquidity and Capital Resources—Credit Facilities" and elsewhere in this prospectus, we have a Term Loan Facility and a Revolving Credit Facility, each of which bears interest at a rate based in part on LIBOR, the federal funds rate or the prime rate. Accordingly, we are exposed to fluctuations in interest rates.
We may manage interest rate risk through the use of interest swap agreements or interest cap agreements to limit the effect of interest rate fluctuations from time to time. On April 15, 2013, we entered into an interest rate cap agreement to cap the floating rate at 2.00% on a variable notional amount starting at $431.3 million and declining to $423.5 million for the period from March 17, 2013 to September 30, 2014. The cost of this interest rate cap was charged to "Interest Expense, net" and any benefits we receive will be charged to "Interest Expense, net" as an offset. On the same date, we entered into a five-year interest rate swap agreement to fix the LIBOR component of interest at 1.73250% on a variable notional amount starting at $422.7 million declining to $359.7 million for the period from September 30, 2014 through March 29, 2018. This interest rate swap agreement has been designated as a cash flow hedge against LIBOR interest rate movements on the Term Loan Facility and formally assessed, both at inception and at least quarterly thereafter, as to whether it was effective in offsetting changes in cash flows of the hedged item. The portion of the change in fair value attributable to hedge ineffectiveness was recorded in "Interest Expense, net" in our consolidated statements of operations and comprehensive income (loss). The portion of the change in fair value attributable to hedge effectiveness, net of income tax effects, was recorded to "Accumulated Other Comprehensive Income (Loss)" in the consolidated statements of stockholders' equity.
On May 30, 2013, we amended the interest rate swap agreement, changing the fixed LIBOR component to 1.5995% and changing the floor rate to 1.00%.
The following analysis presents our earnings sensitivity if a certain interest rate change occurred at the end of fiscal year 2013. The change chosen for this analysis reflects our view of a change that is reasonably possible over a one-year period. These forward-looking disclosures are selective in nature
84
and only address the potential impact from financial instruments. They do not include other potential effects that could impact our business as a result of these changes in interest rate.
At the end of fiscal year 2013, we had debt, totaling $715.8 million, all of which was variable-rate debt. At the end of fiscal year 2013, the weighted-average interest rate on the amount outstanding under the Term Loan Facility was 4.75%.
Holding other variables constant, such as debt levels, a one-percentage point increase in interest rates will have approximately $0.8 million impact on earnings, net of taxes and cash flows. The $0.8 million impact reflects any offset from our current hedging activities. Furthermore, for every additional 0.10% increase in interest rates, we estimate an additional $0.4 million impact on earnings, net of taxes and cash flows.
Credit Risk
We are exposed to credit risk on accounts receivable through the ordinary course of business and perform ongoing credit evaluations. Concentrations of credit risk with respect to accounts receivable are limited due to the number of customers comprising our customer base. We currently believe that our allowance for doubtful accounts is sufficient to cover customer credit risks.
85
Who We Are
We are a high-growth, value-oriented food retailer serving a diverse demographic of household and business customers through two complementary and highly productive store banners. Our Smart & Final stores focus on both household and business customers, and our Cash & Carry stores focus primarily on business customers. We operate 250 convenient, non-membership, smaller-box, warehouse-style stores throughout the Western United States, with an additional 13 stores in Northwestern Mexico in a joint venture. We have a differentiated merchandising strategy that emphasizes high quality perishables, a wide selection of private label products, products tailored to business and foodservice customers and products offered in a broad range of product sizes, all at "everyday low prices." We believe our compelling value proposition has enabled us to achieve comparable store sales growth in 24 of our past 25 fiscal years.
We operate 198 Smart & Final stores in California, Arizona and Nevada, which offer extensive selections of fresh perishables and everyday grocery items, together with a targeted selection of foodservice, packaging and janitorial products, under both national and private label brands. Customers can choose from a broad range of product sizes, including an assortment of standard-sized products typically found at conventional grocers, and a large selection of bulk-size offerings (including uniquely sized national brand products) more typical of larger-box warehouse clubs. Pricing in our Smart & Final stores is targeted to be substantially lower than that of conventional grocers and competitive with that of large discount store operators and warehouse clubs. We believe we offer higher quality produce at lower prices than large discounters. We also believe our Smart & Final stores provide a better everyday value to household and business customers than typical warehouse clubs by offering greater product selection at competitive prices, and with no membership fee requirement, in a convenient easy-to-shop format.
Five years ago, we launched a transformational initiative to convert our larger legacy Smart & Final stores to our Extra! format. With a larger store footprint and an expanded merchandise selection, our Extra! format offers a one-stop shopping experience with approximately 14,500 SKUs, including an expansive selection of approximately 4,500 more SKUs than our legacy Smart & Final stores, with an emphasis on perishables and household items. This initiative was facilitated, in part, by our acquisition of a dedicated perishables warehouse, and has been further supported by our continued investments in distribution capabilities and in-store merchandising. Today we operate 87 Extra! stores, of which 65 represent conversions or relocations of legacy Smart & Final stores and 22 represent new store openings. Our store conversions and relocations to the Extra! format have typically resulted in significant increases in comparable store sales and gross margin. The continued development of our Extra! store format, through additional new store openings and conversions and relocations of legacy Smart & Final stores, is the cornerstone of our growth strategy.
We also operate 52 Cash & Carry stores focused primarily on restaurants, caterers and a wide range of other foodservice businesses such as food trucks and coffee houses. We offer customers the opportunity to shop for their everyday foodservice needs in a convenient, no-frills warehouse shopping environment. These stores are located in Washington, Oregon, Northern California, Idaho and Nevada. Pricing in our Cash & Carry stores is targeted to be substantially lower than that of our foodservice delivery competitors, with greater price transparency to customers and no minimum order size. Pricing is also competitive with typical warehouse clubs, with no membership fee requirement.
We believe that our stores are highly productive based on sales per square foot data, and that our "everyday low prices," differentiated merchandising strategy and convenient locations enable us to offer a highly differentiated food shopping experience with broad appeal to a diverse customer demographic.
86
These attributes have enabled us to deliver strong financial results, as evidenced by the following key highlights:
- •
- Comparable store sales growth in 24 of our past 25 fiscal years.
- •
- Strong recent comparable store sales growth of 6.3%, 4.2%, 4.0%, 6.7% and 9.5% for the second quarter of fiscal year 2014,
the first quarter of fiscal year 2014 and fiscal years 2013, 2012 and 2011, respectively.
- •
- Fiscal year 2013 sales of $3.2 billion, a 5.5% increase compared to fiscal year 2012.
- •
- Fiscal year 2013 sales per square foot of $666, a 3.4% increase compared to fiscal year 2012.
- •
- Fiscal year 2013 Adjusted EBITDA of $164.3 million, a 20.2% increase compared to fiscal year 2012.
- •
- Fiscal year 2013 net income of $8.2 million, a 62.3% increase compared to fiscal year 2012.
Corporate History and Structure
Smart & Final is one of the longest continuously operated food retailers in the United States and has become an iconic brand name in the markets we serve. We were founded in Los Angeles in 1871 as Hellman-Haas Grocery Company, a wholesale grocery supplier to businesses. We changed our name to Smart & Final Wholesale Grocers in the early 1900s after a merger with Santa Ana Grocery Company, a wholesale grocery supplier founded by J.S. Smart and H.D. Final. In the years that followed, we expanded throughout California from our foundation in Southern California. We then expanded to Nevada in the late 1980s and to Arizona in 1990. In 1998, we acquired the Portland, Oregon-based Cash & Carry store chain. Since the Cash & Carry acquisition, we have operated as a multi-banner food retailer.
We were formed as a Delaware corporation on October 5, 2012 under the name SF CC Holdings, Inc., and we changed our name to Smart & Final Stores, Inc. on June 16, 2014. We were formed by funds affiliated with Ares Management in connection with the Ares Acquisition, which was consummated on November 15, 2012. Pursuant to the Ares Acquisition, we acquired all of the outstanding capital stock of Smart & Final Holdings Corp., the former ultimate parent company of all of our operating subsidiaries, and Ares became our principal stockholder (see "Principal and Selling Stockholders").
87
We are a holding company and all of our operations are conducted through our operating subsidiaries, primarily Smart & Final Stores LLC and Cash & Carry Stores LLC. The following diagram depicts our corporate structure:
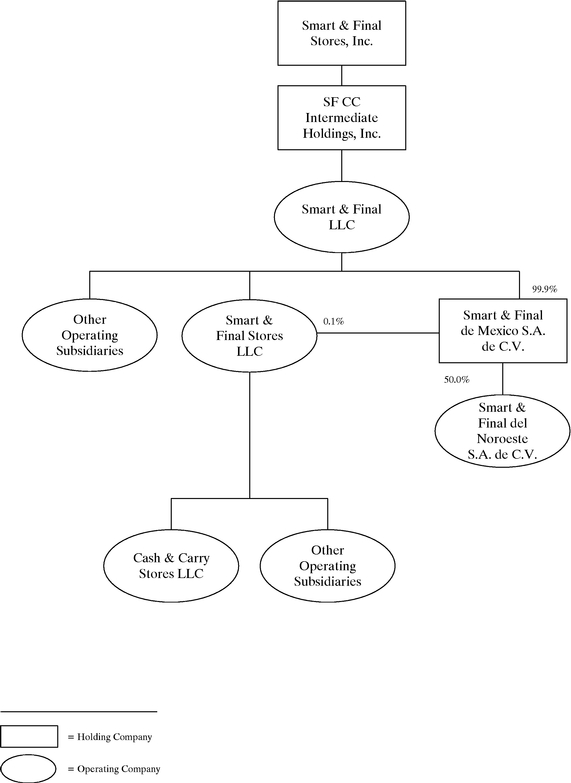
88
Our Industry
Our Smart & Final stores operate in the U.S. food retail industry, which includes a variety of distribution channels, including conventional grocers, mass merchandisers, warehouse clubs, discounters, online retailers and other specialty stores. According to Chain Store Guide ("CSG"), the U.S. grocery industry was approximately $716.8 billion in 2013. We believe that customers are increasingly attracted to alternative formats, and that conventional grocers are losing market share as a result. According to Willard Bishop's June 2013 publication, The Future of Food Retailing, market share for conventional grocers is expected to decrease to 44.9% by 2017 from 46.5% in 2012, while share for alternative formats will increase to 39.1% from 38.6% over the same period.
According to CSG, California, which is our primary market and the largest grocery retailing state in the United States, represented $87.2 billion of 2013 grocery sales and grew at a compounded annual growth rate ("CAGR") of 5.6% from 2008 to 2013. For all the states in which we operate Smart & Final stores, California, Arizona and Nevada, 2013 grocery sales were $113.8 billion, and have grown at a CAGR of 5.5% since 2008, faster than the national growth rate of 4.2% over the same period. Conventional grocers have a higher market share in the states in which we operate than the national average, representing a larger growth opportunity for alternative formats such as Smart & Final.
Our Cash & Carry stores operate in the U.S. foodservice supply industry, which includes a variety of distribution channels, including warehouse clubs, foodservice delivery companies, online retailers and other specialty stores. According to the United States Department of Agriculture Economic Research Service, the U.S. foodservice supply industry was approximately $207.3 billion in 2012, and has grown at a CAGR of 3.9% since 2008.
We believe our business is positively affected by the following key consumer preferences:
- •
- Continued interest in value.
- •
- Increasing demand for high quality perishables offerings.
- •
- Desire for efficient and convenient shopping experiences.
- •
- Strong demand for high quality private label products.
What Makes Us Different
We believe that the following competitive strengths position us for accelerated growth as food shoppers increasingly focus on value and convenience:
Unique platform that appeals to household and business customers. We serve a diverse demographic of customers including households, businesses and community groups through our complementary Smart & Final and Cash & Carry banners. We offer a differentiated, highly convenient shopping experience with an emphasis on quality and value. We provide an easy-to-shop, no-frills, in-store environment in a smaller physical footprint compared to typical warehouse clubs, but with a greater SKU selection, which both simplifies and expedites our customers' shopping experience.
Sales at our Smart & Final stores benefit from a large base of diverse business customers. Our internal surveys indicate that our business customers typically shop Smart & Final for both their household and business needs and account for approximately one-third of our Smart & Final sales. On average, these business customers spend approximately twice as much per visit (including purchases of household SKUs) as our typical household customers. We believe our household customers enjoy "shopping with the pros" because it reinforces the perception of value, quality and selection. At Cash & Carry, we believe our business customers appreciate our accessible locations and consistent shopping experience, where they shop for both everyday and supplemental business needs.
89
Distinctive and value-focused merchandise offering. Our Smart & Final stores feature a comprehensive grocery offering at "everyday low prices," including high quality perishables, extensive selections of private label and national brand products and a large selection of club-pack sizes (over 2,500 SKUs). With approximately 14,500 SKUs in our Extra! stores and approximately 10,000 SKUs in our legacy Smart & Final stores, each of our Smart & Final store formats offers a wider variety of products than typical warehouse clubs. Pricing in our Smart & Final stores is targeted to be substantially lower than that of conventional grocers and competitive with that of large discounters and warehouse clubs. We believe we offer higher quality produce at lower prices than large discounters. Unlike warehouse clubs, we do not require customers to pay a membership fee. Our differentiated merchandising strategy also includes established private label brands and an extensive portfolio of national brand products in a broad range of product sizes. In fiscal year 2013, sales of private label items were approximately 29% of Smart & Final banner sales, and based on internal surveys commissioned by us, we estimate that approximately 43% of Smart & Final banner sales were from products or sizes (including both national brand and private label products) that are not typically found at conventional grocers.
Our Cash & Carry stores offer customers a wide variety of approximately 9,500 key SKUs targeted to core foodservice needs, including an extensive selection of high quality perishables (approximately 45% of Cash & Carry banner sales in fiscal year 2013), national brand and private label grocery products, and related foodservice equipment and supplies. Our prices are targeted to be substantially lower than those of foodservice delivery companies and competitive with those of warehouse clubs. Our Cash & Carry stores do not require payment of a membership fee or minimum purchase amounts. We believe Cash & Carry customers value our low prices, extensive selection, price transparency and the ability to hand-select perishable products. In addition, we believe our customers value the convenience of being able to shop at times that are most suitable for their businesses, as opposed to receiving deliveries on a distributor's schedule. Our business customers also frequently utilize Cash & Carry as a convenient source for basic supplies or "fill-in" products that were either omitted from their regular foodservice delivery or of insufficient quality.
Across both our Smart & Final and Cash & Carry banners, we believe our differentiated merchandising strategy and consistent focus on delivering value has enabled us to generate loyalty, referrals and repeat business.
Two highly productive store banners. We believe that our stores are highly productive based on sales per square foot data. Since 2008, we have invested more than $311 million in our operations, establishing a highly productive store base and a low cost, efficient operating structure.
- •
- Smart & Final stores: We operate 87 Extra! stores, which average approximately 27,000 square feet. In fiscal year 2013, our Extra! stores generated average sales per square foot of $624. Extra! provides a one-stop shopping experience through an expansive selection of perishables and household items, including a perishables selection representing 29% of total SKUs compared to 24% at our legacy Smart & Final stores.
Our typical new Extra! store requires a cash investment of approximately $3.2 million, including store buildout (net of landlord contributions), inventory and cash pre-opening expenses. Based on historical performance, we target pre-tax cash-on-cash returns of 25% within three years after opening.
Our recent Extra! store conversions have generally required a cash investment of approximately $2.0 million and, based on historical performance, we target pre-tax cash-on-cash returns of at least 25% in the third year after conversion. Since 2008, we have successfully converted 45 stores to our Extra! format, generating an average sales increase of approximately 30% in the first twelve months following conversion.
90
- •
- Cash & Carry stores: We operate 52 Cash & Carry stores, which average approximately 20,000 square feet. In fiscal year 2013, our Cash & Carry stores generated average sales per square foot of $756. Comparable store sales in our Cash & Carry stores increased 6.1% in fiscal year 2013 compared to fiscal year 2012. Our typical new Cash & Carry store requires a low initial cash investment of approximately $1.5 million, including store buildout (net of landlord contributions), inventory and cash pre-opening expenses. Based on historical performance, we target pre-tax cash-on-cash returns of 25% within four years after opening.
We operate 111 legacy Smart & Final stores, which average approximately 17,000 square feet. In fiscal year 2013, our legacy Smart & Final stores generated average sales per square foot of $655. Our stores have a comparatively small footprint and are often located in dense markets with relatively few unoccupied sites available for larger-format retailers.
Well-positioned store base and flexible real estate strategy. We operate 250 stores across six contiguous states in the Western U.S., including 192 stores in the large and growing California market. Our long operating history has enabled us to establish a store footprint that would be difficult to replicate, and has provided us with deep institutional knowledge of the local real estate markets in which we operate.
We have a flexible real estate strategy, which we believe enables our stores to achieve strong performance in a range of locations. Our store model is adaptable to a wide variety of potential sites, including new developments, "second use" spaces previously occupied by other retailers and conversions of non-retail sites to retail use. In addition, our stores appeal to a broad spectrum of customers in the markets we serve, which are generally characterized by ethnically and socio-economically diverse populations. This broad appeal enables us to perform profitably in a range of urban and suburban locations, however we typically target trade areas with higher concentrations of businesses.
Passionate and experienced management team. We are led by a passionate executive team with extensive food retail experience and a long history of operational excellence. All of our senior executives have made equity investments in the Company. Our senior executives average over 30 years of experience in the grocery, foodservice and retail industries. Our executive team is complemented by a seasoned team of store managers and senior merchants, many of whom have been recruited to support our product and store growth initiatives. We believe our management's experience at all organizational levels will enable us to continue to grow our store base while improving operations and driving efficiencies through a strong focus on selling high quality products at "everyday low prices."
Our Growth Strategy
We are pursuing three primary growth strategies:
Increase our store footprint in existing and new markets. We plan to expand our store footprint, primarily through opening new Extra! stores in existing and adjacent markets, and by entering new markets. Since the beginning of fiscal year 2011, we have opened 18 new Extra! stores, including five in 2013 and ten in 2014. We expect to open three additional new Extra! stores in 2014 and we currently plan to open an additional 20 new Extra! stores in fiscal year 2015.
We believe that our existing and adjacent markets can support more than 180 new Extra! stores. We also estimate that up to 100 new stores could be located in our key California market and that the broader U.S. market, beyond our existing and adjacent markets, has the potential to support more than 1,250 additional Extra! stores.
We believe that our well-positioned store footprint, together with our flexible real estate strategy and advanced distribution capabilities, provide scalability to support our anticipated growth.
91
We also plan to opportunistically grow our Cash & Carry store base. We expect to open three new Cash & Carry stores through fiscal years 2014 and 2015, and continue opening additional new stores for the foreseeable future.
According to the Economist Intelligence Unit, Mexico's economic growth is expected to increase an average of 3.9% for the years 2015 through 2018. We believe that this favorable economic outlook, combined with the demonstrated appeal of the Smart & Final offering in our existing Northwestern Mexico joint venture stores, represent an attractive long-term growth opportunity.
Continue store conversions to the Extra! format and store remodels. Extra! stores offer customers a one-stop shopping experience in a larger store footprint than our legacy Smart & Final stores to accommodate our expanded SKU selection. Since 2008, we have completed 45 Extra! store conversions and relocated 20 legacy Smart & Final stores as Extra! stores. We plan to continue converting our larger legacy Smart & Final stores to our Extra! format, including 14 planned in 2014 (as compared to eight in 2013), seven of which have already been completed.
In addition, we plan to continue remodeling and relocating selected legacy Smart & Final stores that are not candidates for conversion to the Extra! format. We have a proven track record of successfully remodeling legacy Smart & Final stores, completing 15 major remodels in 2012 and 2013 with attractive returns. We believe that we will continue to have significant opportunities to remodel legacy Smart & Final stores in the future.
Drive growth comparable store sales and enhance operating margins. We have achieved comparable store sales growth in 24 of our past 25 fiscal years, including growth of 4.0%, 6.7% and 9.5% for fiscal years 2013, 2012 and 2011, respectively. We plan to leverage our significant investments in management, information technology systems, infrastructure and marketing to grow our comparable store sales and enhance our operating margins through execution of the following key initiatives:
- •
- Continue to expand our offering of high quality perishables in our Smart &
Final stores, driven by conversions of legacy Smart & Final stores to the Extra! store format and major remodels of legacy
Smart & Final stores to accommodate additional
perishables offerings.
- •
- Grow private label sales through introduction of new SKUs.
- •
- Improve merchandising mix with introduction of higher margin bulk foods, enhanced selections of natural and organic
products and increased ready-to-eat offerings in our Smart & Final stores.
- •
- Continue to drive growth among business customers through direct marketing activities and volume-based merchandising
initiatives.
- •
- Expand customer reach through increased brand awareness, enhanced in-store experience and marketing channel optimization.
Our Stores, Operations and Staff
All of our stores are designed for convenience and are clean, organized and clutter-free. Our concrete floors, bright lights, high ceilings and wide shopping aisles highlight our warehouse-style format and our focus on efficiency and value.
Typical Smart & Final customers drive a short distance from their homes and businesses and park in lots directly outside our stores. Customers are able to move quickly and deliberately through our departments and aisles. Within each of our store formats, our products are organized by product category. Our high quality produce is arranged in farmer's market-style displays, and our other household and business items are organized on shelves that run from the floor to approximately eye level. Typically, bulk-sized products are stocked on floor-level shelves, club-pack sized products on middle shelves and single-unit items on eye-level shelves. Discounted products, such as products subject
92
to our "buy more, save more" discounts, are marked with bright, clear signage. We believe our customers become accustomed to and value our store designs and shelf layouts.
Typical Cash & Carry customers visit our stores en route to or from their businesses to complete comprehensive shopping trips, or to satisfy "fill-in" needs during the business day. As with our Smart & Final stores, customers can move quickly and deliberately through our departments and aisles, typically loading their products onto low, flatbed-style carts to accommodate full case offerings and large "sub-primal cuts" of meat. Our products are organized by product category, and customers can select their products, including high quality perishables, directly from our displays. Our checkout displays are open and do not require our customers to unload their products onto conveyors; instead, our employees use hand-held scanners to quickly scan products to help make our customers' shopping experience as efficient as possible.
We operate 250 stores across the Western United States, including 198 Smart & Final stores in California, Arizona and Nevada and 52 Cash & Carry stores in Washington, Oregon, Northern California, Idaho and Nevada. In addition, 13 legacy Smart & Final stores are operated by a joint venture in Northwestern Mexico. Our stores are located primarily in areas with higher concentrations of businesses in both smaller and mid-sized shopping centers and at stand-alone sites.
We had a total of 8,805 employees as of June 15, 2014, including 7,138 employees in our Smart & Final stores, 664 employees in our Cash & Carry stores, 576 employees in our warehouses and distribution centers and 427 employees in our corporate offices. As of June 15, 2014, 181 Cash & Carry store employees were members of the Union and covered by a collective bargaining agreement.
We believe our customer service orientation, together with our focus on value pricing and shopping convenience, help us to encourage more frequent store visits than warehouse clubs and a higher average purchase size than conventional grocers. Management in our Smart & Final stores is knowledgeable about the needs of both household and business customers, and we emphasize cross-functional training to enhance our ability to serve our customers' needs. Management and employees in our Cash & Carry stores are also focused on customer service, and our more focused business and foodservice customer target allows for a higher level of specialized product knowledge to respond to our customers' needs.
For new stores, we assign employees well in advance of store openings to facilitate store setup, training and customer service. We also typically deploy employees in regional support teams for human resources, operations and compliance. These teams focus on hiring, retention, training, food safety, security, financial management and other operational best practices. As part of our ongoing store operations, we regularly perform reviews of our stores to assess customer service, inventory quality and control, merchandising and other factors.
We believe our continued growth and success depends on our ability to effectively recruit, train and develop our employees. Our culture emphasizes teamwork, accountability, integrity and respect, all of which we believe contribute to our growth and success. Our training programs encompass all levels of store operations, from entry level through management, and emphasize merchandising techniques, management and leadership skills and customer service goals to ensure top employee quality and productivity. We reward superior performance and motivate employees with incentive pay programs. We believe that well trained and motivated employees contribute to our consistently high service standards, which helps us maintain our existing stores and successfully open new stores with an extension of our operating culture. We believe we are an attractive place to work with significant career growth opportunities for our employees. To support career growth, we actively promote and financially support continuing education among our staff. We offer competitive wages and benefits, and believe active, educated and dedicated employees contribute to customer satisfaction.
93
Our Products and Pricing
We have a differentiated merchandising strategy that emphasizes high quality perishables and a wide selection of quality private label products and national brands, all offered in a broad range of product sizes. We believe that our merchandising strategy results in an appealing and hard-to-match store experience. We have a commitment to "everyday low prices," which helps to position both our Smart & Final and Cash & Carry stores as top of mind destinations for our customers.
The merchandise mix as a percentage of sales at our legacy Smart & Final, Extra! and Cash & Carry stores, respectively, for fiscal year 2013 was as follows:
| |
Smart & Final | Cash & Carry | ||||||||
|---|---|---|---|---|---|---|---|---|---|---|
| |
Extra! | Legacy | |
|||||||
Perishables |
35 | % | 28 | % | 45 | % | ||||
Grocery |
35 | % | 37 | % | 34 | % | ||||
Beverage |
16 | % | 17 | % | 4 | % | ||||
Paper and Packaging |
9 | % | 11 | % | 11 | % | ||||
Restaurant Equipment and Janitorial Supplies |
5 | % | 7 | % | 5 | % | ||||
Smart & Final Store Products
We offer an extensive portfolio of private label product and national brand SKUs in our Smart & Final stores, including national brand SKUs that we believe household customers purchase most frequently. Our product selection is designed to meet the regular shopping needs of household customers and higher frequency purchases by business customers, including basic grocery, produce, dairy, meat, beverage, foodservice, packaging and janitorial items. Customers can choose from a broad range of product sizes, including an assortment of standard-sized products typically found at conventional grocers, and a large selection of bulk-size offerings (including uniquely sized national brand products) more typical of larger-box warehouse clubs at prices that are designed to provide significant savings.
Our Smart & Final stores feature the following departments:
Produce. We offer a broad selection of fresh, high quality fruits and vegetables arranged in farmer's market-style displays and in value-focused multi-packs. We also offer packaged produce items such as salad mixes under both national brands and our Sun Harvest® private label brand. In selected stores, our produce department also includes a range of key organic produce SKUs.
Meat and Deli. We offer an extensive selection of quality beef, poultry, pork and seafood products, under various national brands and our private label brand, Cattlemen's Finest®. Our meat selection comes in a variety of cut sizes, including individual cuts and hard-to-find large "sub-primal cuts" targeted to our foodservice customers but also enjoyed by our household customers. To help introduce our household customers to the advantages of buying large cuts of meat (e.g., cutting steaks to preferred thickness), we offer detailed meat cutting instructions through our "Cut It Yourself & Save" advertisements. In addition, our deli department offers an assortment of rotisserie-style chicken, ready-to-eat sandwiches, salads and other fresh and appetizing meals.
Dairy and Cheese. We offer an expansive selection of milk, yogurt, fresh cheeses, ice cream and other dairy products sold under national brands and our signature private label brand First Street®, Sun Harvest® and Simply Value® labels.
Grocery. We offer an extensive selection of everyday grocery items, including pastas, rice, breads, canned fruits and vegetables, cookies, crackers, spices and oils. Customers can choose from a broad range of product sizes, including single units, club-packs and bulk foods. We sell grocery products
94
under national brands and a variety of private label brands, including First Street® (our signature line, including fresh, prepared and frozen items), La Romanella® (Mediterranean foods, including pastas and sauces), Montecito® (Hispanic foods, including tortilla chips, salsas and other condiments), Tradewinds® (spices and seasonings), Sun Harvest® (natural and organic products) and Simply Value® (value-focused grocery items). We also offer a selection of personal care items under national brands and our Iris® private label.
Beverage. We offer a wide variety of beverage products, including hot beverage items, bottled waters, juices, sports and energy drinks, carbonated soft drinks and, in most of our stores, beer, wine and spirits. We sell products under national brands, under our Ambiance® private label brand of coffee, tea and related products, and under our First Street® private label brand.
Paper and Packaging. We offer a wide selection of packaging, disposable table top and take out products, including paper bags, butcher paper, aluminum pans and trays, plastic cups, table coverings, party favors and other disposable food containers. Our products are sold under national brands and our private label brands, First Street® and Simply Value®.
Restaurant Equipment and Janitorial Supplies. We offer a large selection of restaurant equipment, including cookware, utensils, chafing dishes and supplies. We also offer an extensive assortment of janitorial products, including mops, brooms and other cleaning supplies. We offer products under national brands and our private labels First Street® and Simply Value®.
Our Extra! stores carry approximately 14,500 SKUs, and our legacy Smart & Final stores carry approximately 10,000 SKUs. The additional SKUs in our Extra! stores are mostly focused on an expanded selection of perishables and household items, including more produce, fresh meat, deli and dairy. In both our Extra! and legacy Smart & Final stores we also carry a selection of approximately 2,500 club-pack sized items, which are priced to deliver strong value on larger purchases for both household and business customers. In addition, we offer "buy more, save more" discounts on case quantity purchases of business-oriented SKUs to encourage larger purchases and to price competitively with case-sale oriented foodservice delivery companies.
Cash & Carry Store Products
We offer a wide variety of approximately 9,500 key SKUs in our Cash & Carry stores, which are tailored to the core needs of foodservice businesses such as restaurants, caterers and other foodservice providers, as well as businesses and community organizations.
Our Cash & Carry stores feature the following departments:
Produce. We offer a broad selection of fresh, high quality fruits and vegetables arranged in large walk-in refrigerated boxes, which accommodate large rolling carts. We believe our customers value the ability to hand-select their produce, a feature that is generally not available from foodservice delivery companies.
Meat and Deli. We offer an extensive selection of quality beef and pork products. Our meat selection is also presented in large walk-in refrigerators and comes a variety of cut sizes, including individual cuts and large "sub-primal cuts." We believe our customers value the ability to hand-select their meat products to accommodate specific recipes or presentations. We also offer a full line of frozen portion control products, which enable foodservice users to control their menu costs. In addition, our deli department offers an assortment of deli meats and prepared products in bulk sizes.
Dairy and Cheese. We offer an expansive selection of fresh cheeses and other dairy products under national brands and our signature private label brands First Street® and Simply Value®.
95
Grocery. We offer an extensive selection of dry grocery items, including flour, sugar, spices, rice, canned fruit and vegetables, sauces and dressings. Customers can choose from a broad range of product sizes, including case quantities and single units. We sell grocery products under national brands and a variety of private label brands, including First Street®, La Romanella®, Montecito®, Simply Value® and Tradewinds®.
Beverage. We offer a wide variety of hot and cold beverages, including bottled waters, juices, sodas, sports and energy drinks and other items used in the foodservice industry, including flavored coffee syrups, syrup refills for soda fountains and bar supplies. We offer products under national brands and our private label brands Ambiance® and First Street®.
Paper and Packaging. We offer a wide selection of packaging, disposable table top and take out products, including paper bags, butcher paper, aluminum pans and trays, plastic cups, table coverings, party favors and other disposable food containers. Our products are sold under national brands and our private label brands First Street® and Simply Value®.
Restaurant Equipment and Janitorial Supplies. We offer a large selection of restaurant equipment, including cookware, utensils, chafing dishes and bar and beverage supplies. We also offer an extensive assortment of janitorial products, including mops, brooms and other cleaning supplies. We offer products under national brands and our private labels First Street® and Simply Value®.
Our Cash & Carry stores offer a flexible mix of "case quantity" or single-unit purchases to provide a strong differentiation to our foodservice delivery competitors, which typically offer "case quantity" only. Because typical Cash & Carry customers purchase ingredients for further processing into finished meals, our customers frequently purchase the same items but may need varying quantities of individual SKUs.
Private Label Products
Our private label products are developed to provide our customers with a wide range of products comparable to leading national brands, or unique to our stores, and we seek to provide comparable or higher quality to national brand equivalents at a lower price point. We offer private label products across a broad array of product categories, with over 2,500 SKUs. We believe our ability to develop, and competitively source, quality private label products are important elements of our overall product offering. Private label products represented approximately 29% of net sales at our Smart & Final stores and 13% of net sales at our Cash & Carry stores for fiscal year 2013, compared to approximately 28% and 12%, respectively, for fiscal year 2012.
96
Our nine private label brands offer products in the following categories:
Private Label
|
Product Categories | |
|---|---|---|
| First Street | Our master brand, offering national brand-equivalent items in grocery, deli, dairy, cheese, bakery, beverage, paper and packaging, and cleaning products. | |
Ambiance |
Coffee, tea and hot beverage products including creamers, sweeteners and beverage service items. |
|
Cattleman's Finest |
Fresh meat products including portioned sizes for household customers. |
|
Iris |
Personal care products, including paper products, soaps and related items. |
|
La Romanella |
A wide range of pastas, sauces, entrees, and specialty foods with a Mediterranean theme. |
|
Montecito |
Authentic Hispanic products and ingredients including chips, salsas and dips and entrees. |
|
Simply Value |
Our value focused segment spanning grocery, paper and packaging, and cleaning products at compelling value price points. |
|
Sun Harvest |
Natural and organic products in produce, dairy, deli, cheese and grocery items. Sun Harvest products are produced under a royalty free-license agreement. |
|
Tradewinds |
A full line of quality spices and seasonings in a variety of package types to meet customer needs. |
We have a dedicated in-house product development team that focuses on continuing the growth of our private label brands. We have invested in strengthening and enhancing our private label brands over the last several years to meet the needs of both our household and business customers. As part of this program, we have reduced the number of private label brands we offer to focus more of our products in the core First Street® brand, which represented approximately 79% of our total private label sales in fiscal year 2013.
Pricing
We believe our Smart & Final stores maintain a price position that is competitive with other value retailers. Pricing in our Smart & Final stores is targeted to be substantially lower than that of conventional grocers and competitive with that of large discounters and warehouse clubs. We believe we offer higher quality produce at lower prices than large discounters. We conduct regular price surveys of our major competitors, and strive to maintain pricing that is competitive with that of warehouse clubs and discounters, and utilize more aggressive pricing on high quality produce items to build higher frequency customer visits. We also believe our Smart & Final stores provide a better everyday value to household and business customers than typical warehouse clubs by offering greater product selection at competitive prices, and with no membership fee requirement, in a convenient easy-to-shop format.
Our Cash & Carry store pricing is targeted to be significantly lower than foodservice delivery companies, with greater price transparency to customers and no minimum order size. Our foodservice direct delivery competitors typically adjust their customer-level pricing to account for their higher cost structures, which includes delivery costs. Pricing is also competitive with typical warehouse clubs, with no membership fee requirement. We seek to price our products competitively with our store-based competition to encourage our target customers to purchase a larger portion of their needs from our stores. We conduct regular price surveys of our principal store-based competition, which includes warehouse clubs and warehouse-style foodservice retailers.
97
Marketing and Advertising
Our store banners maintain separate marketing and advertising programs directed to their primary target customers. Our Extra! and legacy Smart & Final stores share a common marketing and advertising platform, with separate versions of advertising depending on the type and location of stores. In both our store banners, our primary advertising approach is an item-and-price message designed to reinforce the breadth of our product selection and value-price positioning of our stores.
For our Smart & Final stores, we advertise primarily by distributing a weekly print circular, which is distributed to approximately 10 million addresses each week. The distribution is targeted to reach potential customers at a sub-Zip Code level based on defined trade areas for each store. We produce separate versions of the circular for stores in different geographic areas and competitive regions, for newly opened or remodeled stores and for special promotional purposes. In addition to the weekly circular, we utilize a supplemental monthly distribution of a separate printed circular targeted to business customers. This business circular contains key business SKUs and pricing and is focused on high volume, price sensitive items for foodservice and other business customers. We also have an in-store marketing program that includes a "tag and sign" program, special signage for "buy more, save more" discounts and aisle banners. In addition, we maintain our website, smartandfinal.com, on which we offer or advertise special deals and coupons. To support the market positioning of Smart & Final stores, we are expanding our social media presence to include specific sponsored blogs, Facebook and Twitter streams.
For new stores, conversions of legacy Smart & Final stores to Extra! stores and store relocations, we organize special grand opening event periods. Grand openings typically include a community reception and special promotional pricing for a defined period following the store opening. We believe our grand opening events help to familiarize the community in our trade area with the differentiated offering and pricing of our Extra! stores.
For our Cash & Carry stores, our primary advertising is through bi-weekly mail distributions of "Hot Sheets" to key potential foodservice customers. The distribution is targeted to customers identified by business type and proximity to our Cash & Carry stores. A typical "Hot Sheet" is mailed to approximately 125,000 addresses and has pricing specials on key foodservice items. We also direct mail themed flyers to potential customers for special events and distribute flyers in our Cash & Carry stores to target purchasers of specific products. We offer Cash & Carry Customer Cards to regular purchasers so that they can manage receipts of purchases, track purchases of products, and maintain records for tax purposes. On our website, smartfoodservice.com, we offer vendor promotions, industry information, videos from successful customers and a catalog to create shopping lists.
The inclusion of our website addresses in this prospectus does not include or incorporate by reference the information on or accessible through our websites into this prospectus.
Product Sourcing and Distribution
Product Sourcing
We manage the buying of, and set the standards for, the products we sell, and we source our products from over 1,650 vendors and suppliers. We believe our scale generates cost savings, which is reflected in our commitment to "everyday low prices" in all our stores. We have many long-term relationships with both national brand and private label suppliers, and believe that our supplier relationships are strong.
Our strong supplier relationships support our differentiated merchandising strategy. Many of our national brand and private label vendors supply us with club-pack and bulk-size SKUs that they do not offer to conventional grocers, in addition to the single-unit products we offer that are not sold by warehouse clubs. These products enable us to provide a broader range of product sizes than our
98
competitors, and are designed to provide significant savings for our customers. Our 198 Smart & Final stores purchase products from a network of national brand companies, regional and local brands and strategically sourced private label suppliers, all at competitive costs. We seek to obtain high quality products at acquisition costs that allow us to maintain our pricing objectives.
For national brand products, we believe that our scale and flexibility allow us to acquire products at costs competitive to similarly situated food retailers. Where appropriate, we negotiate national procurement agreements with suppliers and, where possible, we utilize efficiencies provided by cooperative buying organizations to facilitate lower cost purchasing. For private label products, we utilize a network of selected manufacturers to produce products according to our specifications at costs determined through competitive processes or in reference to commodity market prices. We strive to maintain close working relationships with our major suppliers to reduce product and distribution costs, and we believe that our sales growth presents unique opportunities to achieve continuing synergies. During fiscal year 2013, we purchased from approximately 1,650 different suppliers. Our Smart & Final stores are not dependent on any individual supplier, and no product supplier represents more than 5% of our Smart & Final banner sales.
For our 52 Cash & Carry stores we employ a hybrid purchasing model to achieve operational efficiency. Cash & Carry management specifies all the products for our stores, and we have entered into an agreement with Unified Grocers, a regional grocery cooperative, to act as our primary purchasing and warehouse supplier for primary grocery and perishable products. Where applicable, Unified Grocers purchases products and maintains inventory in its warehouse facilities, filling orders from Cash & Carry stores as needed. This arrangement leverages the purchasing ability of Unified Grocers and allows our Cash & Carry stores to shift maintenance of warehouse inventories to a third party. Approximately 82% of our product requirements (measured at cost) for our Cash & Carry stores for each of fiscal year 2013 and the twenty-four-week period ended June 15, 2014 were made through our relationship with Unified Grocers. Based on Unified Grocer's disclosure in its public filings, we accounted for 15% of Unified Grocer's total net sales for the thirty-nine week period ended June 28, 2014.
Our Cash & Carry stores also purchase certain products through agreements with two other suppliers on a more traditional supplier basis. We believe that these relationships could be replicated at similar economics.
Product Distribution
We support our Smart & Final stores in California, Arizona and Nevada through a network of Company-controlled distribution facilities. These include Company leased-and-operated facilities, dedicated leased facilities operated by third-party logistics companies and shared third-party operations. Approximately 71% of Smart & Final store SKUs, including approximately 58% of perishable products in our California stores, are supplied from our Company-operated 445,000 square foot dry goods distribution center in Commerce, California and our Company-operated 241,000 square foot perishables warehouse in Riverside, California. The balance of our products (including frozen goods, deli and selected dry grocery) are supplied by third party-operated distribution centers or manufacturers' direct store delivery systems.
Deliveries to our stores from Company-controlled warehouses are made by a fleet of Company-owned and leased trucks, supplemented by third-party transportation providers. Deliveries of direct store delivered products are made by the respective product suppliers. We periodically evaluate the relative costs of maintaining products within our distribution system or provided through direct store delivery to maintain competitive product acquisition costs.
Within our Company-controlled warehouse facilities and distribution network, we utilize computerized warehouse management systems, radio frequency technology, computer voice assisted
99
order selection, integrated labor management systems and transportation optimization management systems. In our directly operated transportation network, we utilize onboard computers for all private fleet vehicles with GPS tracking for notification to stores of delivery and real-time visual tracking of in-route vehicles. We also utilize an integrated product purchasing and warehouse inventory enterprise computer system to optimize warehouse inventory monitoring and management.
Our Cash & Carry stores are primarily served through a contract service agreement with Unified Grocers. Unified Grocers maintains four distribution centers in the Western United States, and we primarily utilize Unified Grocers' Portland, Oregon and Seattle, Washington facilities, with a small number of products supplied from other Unified Grocers' locations.
By design, our network of distribution centers and third party operations has a flexible capacity to support our anticipated growth. In our Smart & Final banner, we estimate that the existing distribution network has the capacity to be expanded to service additional stores within our existing California, Arizona and Nevada market area at economics comparable to current operations. In our Cash & Carry banner, we estimate that the existing distribution network, or an alternate network of third party providers, could support additional stores within our existing market area at economics comparable to current operations. We believe that our established relationships with national third-party warehouse operators additionally provide the opportunity to expand beyond our existing market areas without significant risks.
Store Selection and Economics
We believe we have substantial opportunities for new store growth in our Extra! format. We have identified near-term opportunities for growth within our existing market areas, and longer-term opportunities in adjacent markets. We believe our flexible approach to the size of our stores and ability to utilize a wide variety of existing real estate provides us with flexibility in site selection, including entering into new developments, "second use" store spaces formerly operated by other retailers such as conventional grocers, office supply stores and electronics retailers and conversion of non-retail store sites to retail store use. We believe our value positioning allows us to serve a diverse demographic of customers and provides us with significant flexibility to enter new markets across a variety of socio-economic areas, including markets with varying levels of grocery and warehouse club penetration.
We have a rigorous process for new store site selection, which includes in-depth analysis of area demographics, competition, growth potential, traffic patterns, grocery spend and other key criteria. We have a dedicated, experienced sourcing and development real estate team, overseen by members of our senior management, including our Chief Executive Officer and Chief Financial Officer. Members of our senior management also conduct an on-site inspection prior to approving any new location.
Our typical Extra! store requires an average cash investment of $3.2 million. For store development, such investment consists of store buildout (net of landlord contributions), inventory for store operation and development and cash pre-opening expenses. On average, our Extra! stores reach a mature sales growth rate in the third year after opening. Based on our historical performance, we target net sales of $12 million to $14 million during the first year after opening and pre-tax cash-on-cash returns of 25% within three years after opening.
We believe that the U.S. market can support approximately 1,250 additional Extra! stores. We believe we have significant growth opportunities in existing markets, as approximately 100 potential new stores are located in our current U.S. markets (California, Nevada and Arizona). We currently expect to open 13 new Extra! stores in fiscal year 2014, including ten which have already opened, and 20 in 2015. We plan to continue opening additional new stores for the foreseeable future.
We also plan to opportunistically grow our Cash & Carry store base. We expect to open three new Cash & Carry stores through fiscal years 2014 and 2015, and continue opening additional new stores for
100
the foreseeable future. Our typical new store requires an average cash investment of $1.5 million. On average, our Cash & Carry stores reach a mature sales growth rate in the fourth year after opening. Based on our historical performance, we target net sales of $6 million to $8 million during the first year after opening and pre-tax cash-on-cash returns of 25% within four years after opening.
Customers
In both store banners, our typical customers seek a mix of national brand and private label products, sold at "everyday low prices" at convenient, easy-to-shop locations. We believe our customers are initially attracted to our stores by our compelling value proposition, broad selection of household and business products and shopping convenience. We also believe that our customer service and unique brand name and private label products are key factors in customer retention.
Our Smart & Final stores target both household and business customers, who represented 68% and 32%, respectively, of banner sales for fiscal year 2013. We believe that while sales to our Smart & Final banner's business customers, including restaurant owners, caterers, institutional consumers, offices and community organizations, are less than sales to household customers, business customers provide an important point of differentiation in the product mix of our stores. The resulting product mix establishes an environment whereby both household and business customers have the opportunity to purchase SKUs from a distinctive merchandising offering, fulfilling a larger fraction of customer needs.
Our Cash & Carry stores primarily target business customers, including restaurants, caterers and a wide range of other foodservice providers. We believe that business customers represented an estimated 90% of our banner sales for fiscal year 2013, and for many of these customers we represented a primary source of supply. While not a primary customer target, our Cash & Carry stores also serve household customers, which represented an estimated 10% of our banner sales for fiscal year 2013. We believe our Cash & Carry banner customers enjoy our "everyday low prices," our extensive SKU selection, our price transparency, the opportunity to purchase larger quantities at "case discount" prices and our accessible locations.
Mexico
We are party to a joint venture agreement in connection with the operation of 13 Smart & Final stores in Northwestern Mexico. We have a 50% interest in the joint venture, which we account for using the equity method of accounting, and do not consolidate with our earnings. Our joint venture partner, Grupo Calimax S. A. C.V., operates a chain of unaffiliated grocery stores across Northwestern Mexico. These Smart & Final joint venture stores are operated under our legacy Smart & Final format and, on average, are approximately 17,800 square feet and offer over 6,000 SKUs. We are party to a product supply agreement with the joint venture, pursuant to which we provide certain products to its stores, principally private label products. We believe that favorable macroeconomic trends in Mexico, combined with the demonstrated appeal of the Smart & Final offering in these existing Northwestern Mexico joint venture stores, represent an attractive long-term growth opportunity.
101
Properties
We operate 250 stores in six Western U.S. states, with an additional 13 stores in Northwestern Mexico in a joint venture, as shown in the chart below:
| |
Smart & Final | Cash & Carry | Total | |||||||||||||
|---|---|---|---|---|---|---|---|---|---|---|---|---|---|---|---|---|
State/Country
|
Extra! | Legacy | Total | |
||||||||||||
California |
85 | 96 | 181 | 11 | 192 | |||||||||||
Washington |
— | — | — | 21 | 21 | |||||||||||
Oregon |
— | — | — | 17 | 17 | |||||||||||
Arizona |
1 | 8 | 9 | — | 9 | |||||||||||
Nevada |
1 | 7 | 8 | 1 | 9 | |||||||||||
Idaho |
— | — | — | 2 | 2 | |||||||||||
| | | | | | | | | | | | | | | | | |
Subtotal: |
87 | 111 | 198 | 52 | 250 | |||||||||||
Mexico |
— |
13 |
13 |
— |
13 |
|||||||||||
| | | | | | | | | | | | | | | | | |
Total: |
87 | 124 | 211 | 52 | 263 | |||||||||||
| | | | | | | | | | | | | | | | | |
| | | | | | | | | | | | | | | | | |
We lease substantially all of our stores from unaffiliated third parties. We believe that leasing our stores allows us to deploy capital in a more focused manner on store operations, and that the resulting cost of leased occupancy is comparable to the economic cost of owned stores. Our typical store lease has an initial 15 to 20 year term with renewal options of 5 to 15 years. For stores with expiring leases, we expect that we will be able to renegotiate these leases or relocate our stores as necessary on acceptable terms. We believe our portfolio of long-term leases is a valuable asset supporting our retail operations, but we do not believe that any individual store property is material to our financial condition or operating results.
As of June 15, 2014, we leased three distribution centers and our corporate office in Commerce, California from unaffiliated third parties. Our other three distribution centers are owned or leased by third parties. Information about such facilities is set forth in the table below:
Facility
|
Location | Square Footage* |
Owned/Leased | Operated By | ||||||
|---|---|---|---|---|---|---|---|---|---|---|
Distribution Center |
Commerce, CA | 445,000 | Leased | Company | ||||||
Distribution Center |
Riverside, CA | 241,000 | Leased | Company | ||||||
Distribution Center |
Fontana, CA | 349,000 | Leased | Third Party | ||||||
Distribution Center |
Brea, CA | 100,000 | N/A | ** | Third Party | |||||
Distribution Center |
Tracy, CA | 151,000 | N/A | ** | Third Party | |||||
Distribution Center |
Turlock, CA | 75,000 | N/A | ** | Third Party | |||||
Corporate Office |
Commerce, CA | 81,000 | Leased | Company | ||||||
| | | | | | | | | | | |
|
Total Square Footage: | 1,442,000 | ||||||||
- *
- Rounded
to the nearest 1,000 square feet
- **
- Properties owned or leased by a third party
Segments
For revenue and other financial information for our two operating segments, see Note 19 to our audited consolidated financial statements, which are included elsewhere in this prospectus.
102
Competition
The food retail and foodservice industries are large, competitive and highly fragmented. See "Risk Factors—Risks Related to Our Business and Industry—Competition in our industry is intense and our failure to compete successfully may adversely affect our sales, financial condition and operating results."
Our principal competitors include conventional grocers such as Albertson's, Kroger and Safeway, discounters and warehouse clubs such as Costco, mass merchandisers such as Walmart and Target, foodservice delivery companies such as Sysco and US Foods, as well as online retailers and other specialty stores. Each of these companies competes with us on one or more elements of price, product selection, product quality, convenience, customer service, store format and location, or any combination of these factors. Some of our competitors may have greater financial or marketing resources than we do and may be able to devote greater resources to sourcing, promoting and selling their products. Also, some of our competitors do not have unionized work forces, which may result in lower labor and benefit costs. These competitors could use these advantages to take certain measures, including reducing prices, that could adversely affect our competitive position, business, financial condition and operating results.
Seasonality
Sales in our business exhibit modest seasonality. Our average weekly sales fluctuate throughout the year and are typically highest in our second and third fiscal quarters.
Insurance and Risk Management
We use a combination of insurance and self-insurance plans to provide for the potential liabilities for workers' compensation, general liability (including, in connection with legal proceedings described above under "Risk Factors—Risks Related to Our Business and Industry—Legal proceedings could adversely affect our business, financial condition and operating results"), property insurance, director and officers' liability insurance, vehicle liability and employee health-care benefits. Liabilities associated with the risks that are retained by us are estimated, in part, by considering historical claims experience, demographic factors, severity factors and other actuarial assumptions. Where we have retained risk through self-insurance or similar arrangements, we utilize third-party actuarial firms to assist management in assessing the financial impact of risk retention. Our results could be adversely affected by claims and other expenses related to such plans and policies if future occurrences and claims differ from these assumptions and historical trends.
Trademarks and Other Intellectual Property
We believe that our intellectual property has substantial value and has contributed to the success of our business. In particular, our trademarks, including our registered Smart & Final®, Smart & Final Extra!®, Cash & Carry Smart Foodservice®, Ambiance®, Cattleman's Finest®, First Street®, Iris®, La Romanella®, Montecito®, Simply Value® and Tradewinds® trademarks, in addition to the Sun Harvest® trademark with respect to which we have a royalty free license, are valuable assets that we believe reinforce our customers' favorable perception of our stores. In addition to our trademarks, we believe that our trade dress, which includes the arrangement, color scheme and other physical characteristics of our stores and product displays, is a large part of the atmosphere we create in our stores and enables customers to distinguish our stores and products from those of our competitors. For certain risks related to our trademarks and other intellectual property, see "Risk Factors—Risks Related to Our Business and Industry—We may be unable to adequately protect our intellectual property rights, which could harm our business, financial condition and operating result."
103
Information Technology Systems
We have made significant investments in information technology infrastructure, including purchasing, receiving, inventory, point of sale, warehousing, distribution, accounting, reporting and financial systems. We also maintain modern supply chain systems allowing for operating efficiencies and scalability to support our continued growth. All of our stores operate under one integrated information technology platform. We believe our current information technology infrastructure will support our growth plans but plan on continuing our history of investment in this area.
Regulatory Compliance
We are subject to regulations enacted by federal, state and local regulatory agencies, including the U.S. Food and Drug Administration and U.S. Department of Agriculture. These regulations include, but are not limited to, trade practices, pricing practices, labor, health, safety, transportation, environmental protection and regulations related to the sale and distribution of alcoholic beverages, tobacco products, milk, agricultural products, meat products and other food products. Compliance with these regulations has not historically had a material effect on our financial condition or operating results.
Employees
As of June 15, 2014, we had a total of 2,494 full-time and 6,311 part-time employees, of whom 7,138 were employed in our Smart & Final stores, 664 were employed in our Cash & Carry stores, 576 were employed in our warehouses and distribution centers and 427 were employed in our corporate offices. As of June 15, 2014, 181 Cash & Carry store employees were members of the Union and covered by a collective bargaining agreement. We consider relations with our employees to be good.
Legal Proceedings
We are engaged in various legal actions, claims and proceedings arising in the ordinary course of business, including claims related to employment related matters, breach of contracts, products liabilities and intellectual property matters resulting from our business activities. We do not believe that the ultimate resolution of these pending claims will have a material adverse effect on our business, financial condition, results of operation or cash flows. However, litigation is subject to many uncertainties, and the outcome of certain individual litigated matters may not be reasonably predictable and any related damages may not be estimable. Some litigation matters could result in an adverse outcome to us, and any such adverse outcome could have a material adverse effect on our business, financial condition, results of operation and cash flows.
104
Executive Officers and Directors
The following table sets forth certain information regarding our executive officers and directors as of the date of this prospectus:
Name
|
Age | Position | |||
|---|---|---|---|---|---|
David G. Hirz |
59 | President, Chief Executive Officer and Director | |||
Richard N. Phegley |
59 | Senior Vice President and Chief Financial Officer | |||
Donald G. Alvarado |
59 | Senior Vice President and General Counsel | |||
Scott R. Drew |
53 | Senior Vice President, Store Operations, Smart & Final | |||
Eleanor E. Hong |
38 | Senior Vice President and Chief Marketing Officer | |||
Michael M. Laddon |
61 | Senior Vice President and Chief Information Officer | |||
Richard A. Link |
60 | Group Vice President and Controller, Chief Accounting Officer | |||
Michael A. Mortensen |
58 | Senior Vice President, Sales and Merchandising, Smart & Final | |||
Eugene M. Smith |
46 | Vice President and Treasurer | |||
Martin J. Trtek |
59 | President, Cash & Carry | |||
Jeffrey D. Whynot |
58 | Senior Vice President, Human Resources | |||
David B. Kaplan |
47 | Chairman of the Board | |||
Richard A. Anicetti |
56 | Director | |||
Norman H. Axelrod |
62 | Director | |||
Andrew A. Giancamilli |
64 | Director | |||
Dennis T. Gies |
35 | Director | |||
Adam L. Stein |
38 | Director | |||
Joseph S. Tesoriero |
61 | Director | |||
There are no arrangements or understandings between any of our directors and any other person pursuant to which they were selected as directors.
Executive Officers
Each of our executive officers serves at the direction of our board of directors and holds office until his or her successor is duly elected and qualified or until his or her earlier resignation or removal. There are no family relationships among any of our directors or executive officers.
David G. Hirz has served as our President and Chief Executive Officer since January 2012, and previously served as our President and Chief Operating Officer from April 2010 to January 2012. Additionally, Mr. Hirz has served as a member of our board of directors since January 2012. Prior to joining us in April 2010, Mr. Hirz was an executive with divisions of The Kroger Company, one of the world's largest supermarket operators, including President of Food4Less, a national warehouse grocery store chain of The Kroger Company, from 1999 to 2004 and from September 2007 to April 2010, and President of the Ralphs Grocery Company, the largest supermarket chain in Southern California, from March 2004 to September 2007. Previously, he held store and operations management positions with several retail grocery companies. Mr. Hirz is a graduate of California State University, Fullerton. Mr. Hirz brings significant senior leadership and both operational and industry experience to our board of directors, along with an extensive knowledge of the food retail and foodservice industries.
Richard N. Phegley joined us in September 1996 as Vice President and Treasurer and has served as our Senior Vice President and Chief Financial Officer since May 2001. Prior to joining us, Mr. Phegley served in senior treasury, strategic planning and financial management positions with Atlantic Richfield Company, an international oil and gas company. He holds a Master's degree in Business Administration from the University of Southern California and is a graduate of Humboldt
105
State University. Mr. Phegley is an associate member of the American Institute of Certified Public Accountants.
Donald G. Alvarado joined us in 1987, was named our General Counsel and Corporate Secretary in 1991, and additionally as a Senior Vice President in 1996. Prior to joining us, Mr. Alvarado served in the legal department of a regional grocer that is now a division of Safeway Inc., one of North America's largest food and drug retailers. He holds a law degree from the University of Southern California and is a graduate of Loyola Marymount University. Mr. Alvarado is a member of the California Bar Association.
Scott R. Drew joined us in March 2010 and has served as Senior Vice President, Store Operations of our Smart & Final stores since December 2010. From March 2010 to December 2010, Mr. Drew served as Vice President and General Manager of a group of our stores. Prior to joining us, Mr. Drew served for 31 years in various store management positions with The Kroger Company, including as Vice President of Store Operations for Kroger's Indiana division.
Eleanor E. Hong joined us as Senior Vice President and Chief Marketing Officer in February 2014. Prior to joining us, Ms. Hong served as Senior Vice President of marketing for Kohl's Corporation, a national department store retailer, from May 2011 to February 2014, as Vice President of Marketing for Toys "R" Us, a leading dedicated toy and baby products retailer, and its Babies "R" Us division, from March 2007 to April 2011, and in marketing positions with Time Consumer Marketing, a publishing company. Ms. Hong holds a Master's degree in Business Administration from Columbia University and the London Business School, and is a graduate of the University of Pennsylvania.
Michael M. Laddon joined us in January 2011 as our Senior Vice President and Chief Information Officer, and he also has responsibility for our logistics operations. From March 2003 to October 2008, Mr. Laddon was Senior Vice President and Chief Information Officer of Longs Drug Stores Corp., a regional drugstore chain and pharmacy benefit company, a part of CVS Caremark Corp. Previously he held management positions in retail grocery, software sales and internet companies, including group vice president and chief information officer for Ralphs Grocery Company, a division of The Kroger Company.
Richard A. Link joined us in October 2001 as Vice President and Controller and in December 2001 was designated as our Chief Accounting Officer. In January 2008 he was appointed Group Vice President. From September 1988 through February 2001, Mr. Link served in various positions, including chief financial officer and chief accounting officer, with Maxicare Health Plans, Inc., an operator of health maintenance organizations. Mr. Link previously served as a senior audit manager with Price Waterhouse & Co., a professional services firm now named PricewaterhouseCoopers LLP. He holds a Master's degree in Business Administration and an undergraduate degree from the University of Southern California.
Michael A. Mortensen joined us in July 2010 as our Senior Vice President of Sales and Merchandising. From 1994 to July 2010, Mr. Mortensen held a variety of positions including Vice President of Grocery with Food4Less, a national warehouse grocery store division of The Kroger Company. Previously, he held store management and procurement positions with a Food4Less predecessor company. Mr. Mortensen is a graduate of California State University, Long Beach.
Eugene M. Smith joined us in July 1996 and has served as our Vice President and Treasurer since March 2013. Prior to his current position, Mr. Smith served us in a variety of roles including Director of Financial Services and Director of Internal Audit. He holds a Master's degree in Business Administration from Loyola Marymount University and is a graduate of the University of Connecticut. Mr. Smith is an associate member of the American Institute of Certified Public Accountants.
106
Martin J. Trtek joined us in May 1998 upon the acquisition of our Cash & Carry stores, and has served as the President of Cash & Carry since October 2008. Prior to his current position, Mr. Trtek served in various store management positions with the Cash & Carry stores, including Vice President of Operations and District Manager.
Jeffrey D. Whynot joined us in January 2000 as our Senior Vice President of Human Resources. Previously, Mr. Whynot served as Vice President of Human Resources for Dames & Moore Group, an engineering consulting firm, and in various capacities including Vice President of Human Resources for Knott's Berry Farm, an entertainment company. He holds a Master's degree in Human Resources and Organizational Development from University of San Francisco and is a graduate of California State University, Northridge.
Board of Directors
David B. Kaplan has served as our Chairman of the Board since November 2012. Mr. Kaplan is a Co-Founder of Ares Management, our principal stockholder, and a Director and Senior Partner of Ares Management GP LLC, Ares Management's general partner. He is a Senior Partner of Ares Management, Co-Head of its Private Equity Group and a member of its Management Committee. Mr. Kaplan joined Ares Management in 2003 from Shelter Capital Partners, LLC, where he was a Senior Principal from June 2000 to April 2003. From 1991 through 2000, Mr. Kaplan was affiliated with, and a Senior Partner of, Apollo Management, L.P. and its affiliates, during which time he completed multiple private equity investments from origination through exit. Prior to Apollo Management, L.P., Mr. Kaplan was a member of the Investment Banking Department at Donaldson, Lufkin & Jenrette Securities Corp., an investment banking and securities firm. Mr. Kaplan currently serves as Chairman of the boards of directors of the parent entities of The Neiman Marcus Group LLC, a luxury retailer and 99 Cents Only Stores LLC, a deep-discount retailer, and as a member of the board of directors of Guitar Center Holdings, Inc., a musical instruments retailer, and Floor and Decor Outlets of America, Inc., a hard surface flooring and related accessories retailer. Mr. Kaplan's previous public company board of directors experience includes Maidenform Brands, Inc., an intimate apparel retailer, where he served as the company's Chairman, GNC Holdings, Inc., a specialty retailer of health and wellness products, Dominick's Supermarkets, Inc., a grocery store retailer, Stream Global Services, Inc., a business process outsourcing provider, Orchard Supply Hardware Stores Corporation, a home improvement retailer, and Allied Waste Industries Inc., a waste services company. Mr. Kaplan also serves on the Board of Directors of Cedars-Sinai Medical Center, is a Trustee of the Center for Early Education, is a Trustee of the Marlborough School and serves on the President's Advisory Group of the University of Michigan. Mr. Kaplan graduated with High Distinction, Beta Gamma Sigma, from the University of Michigan, School of Business Administration with a B.B.A. concentrating in Finance. Mr. Kaplan's over 20 years of experience managing investments in, and serving on the boards of directors of, companies operating in various industries led to the conclusion that he should serve as chairman of our board of directors.
Richard A. Anicetti has served as a member of our board of directors since May 2014. Mr. Anicetti is currently the President and Founder of From One To Many Leadership Consulting LLC focusing on leadership, strategic planning, process redesign and organizational change management consulting. Mr. Anicetti served as Interim President and Chief Executive Officer of the parent entity of 99 Cents Only Stores LLC, a deep-discount retailer, from January 2013 until September 2013, as an Executive Vice President of Delhaize Group, an international food retailer, from September 2002 to May 2010. Mr. Anicetti also served as the Chief Executive Officer of Delhaize America Shared Services from January 2010 to May 2010. He served as the President and COO of Food Lion, LLC, a grocery store chain and a subsidiary of Delhaize America Inc., from September 2001 to October 2002 and Chief Executive Officer of Food Lion from October 2002 to December 2010. Mr. Anicetti joined Food Lion in August 2000. He is also a member of a US Advisory Board for Brambles Ltd, a logistics company based in Sydney, Australia, a member of the board of trustees for Bennett College for
107
Women and a member of the National Advisory Board for Duke Children's Hospital. Mr. Anicetti currently serves as a member of the board of directors of the parent entity of 99 Cents Only Stores LLC and was previously a member of the board of directors of A&P Supermarkets, a grocery store chain. With his more than 30 years' experience and strong record of performance in the food retail industry, Mr. Anicetti brings to our board of directors extensive knowledge and expertise in the industries in which the Company operates.
Norman H. Axelrod has served as a member of our board of directors since March 2013. Beginning in 1988, Mr. Axelrod served as Chief Executive Officer and a member of the board of directors of Linens 'n Things, Inc., a retailer of home textiles, housewares and decorative home accessories, was appointed as Chairman of its board of directors in 1997, and served in such capacities until its acquisition in February 2006. Mr. Axelrod is also the Chairman of the boards of directors of the parent entities of Guitar Center, Inc., a musical instruments retailer, and Floor and Decor Outlets of America, Inc., a specialty retailer of hard surface flooring and related accessories, and serves on the boards of directors of the parent entities of 99 Cents Only Stores LLC, a deep-discount retailer, and Jaclyn, Inc., a handbags and apparel company. Mr. Axelrod has also previously served as the Chairman of the board of directors of GNC Holdings, Inc., a specialty retailer of health and wellness products, National Bedding Company LLC, a mattress and bedding product manufacturer, and Simmons Company, a mattress and bedding product manufacturer, and as a member of the board of directors of Reebok International Ltd., a leading worldwide designer and marketer of sports, fitness and casual footwear, apparel and equipment, and Maidenform Brands, Inc., an intimate apparel retailer. Mr. Axelrod has provided consulting services to certain Ares Management entities. Mr. Axelrod received a B.S. in Management and Marketing from Lehigh University where he graduated summa cum laude and an M.B.A. from New York University. Mr. Axelrod's vast experience led to the conclusion that he should serve as a member of our board of directors.
Andrew A. Giancamilli has served as a member of our board of directors since March 2013. Mr. Giancamilli has served as President and Chief Executive Officer of Katz Group Canada Ltd., the Canadian subsidiary of the Katz Group of Companies, operators of over 1,800 traditional drug stores in Canada, from October 2003 to February 2012. Prior to joining Katz Group Canada, Mr. Giancamilli was with Canadian Tire Corporation Ltd., a Canadian retail conglomerate, from 2001 to 2003. Mr. Giancamilli also held several positions, including President and Chief Operating Officer, at Kmart Corporation, a discount retailer, from 1995 to 2001. From 1993 to 1995 he served as President and Chief Operating Officer of Perry Drug Stores, Inc., a U.S. based drug store chain. He began his career at Perry Drug Stores in 1975. Mr. Giancamilli currently serves as a director of the parent entity of 99 Only Stores LLC, a deep-discount retailer. Mr. Giancamilli also has served as a member of the board of GS1 Canada, and as a member of the board of directors, and Chairman of the National Association of Chain Drug Stores (NACDS), the Canadian Association of Chain Drug Stores, the Canadian Opera Company and Sacred Heart Rehabilitation Center, and has served as a Trustee of the Detroit Opera House. With his more than 30 years of experience and strong record of performance in the retail industry, Mr. Giancamilli brings to the board extensive knowledge and expertise in the industries in which the Company operates.
Dennis T. Gies has served as a member of our board of directors since November 2012. Mr. Gies is a Principal in the Private Equity Group of Ares Management, our principal stockholder. Mr. Gies joined Ares Management in 2006 from UBS Investment Bank where he participated in the execution of a variety of transactions including leveraged buyouts, mergers and acquisitions, dividend recapitalizations and debt and equity financings. Mr. Gies currently serves on the boards of directors of the parent entities of 99 Cents Only Stores LLC, a deep-discount retailer, and Sotera Defense Solutions, Inc., a national defense information technology contractor. Mr. Gies graduated with a MS in Electrical Engineering from University of California, Los Angeles and magna cum laude with a BS in Electrical Engineering from Virginia Tech. Mr. Gies brings to our board of directors financial expertise,
108
as well as experience as a private equity investor evaluating and managing investments in companies across various industries.
Adam L. Stein has served as a member of our board of directors since November 2012. Mr. Stein is a Partner in the Private Equity Group of Ares Management, our principal stockholder. Prior to joining Ares Management in 2000, Mr. Stein was a member of the Global Leveraged Finance Group at Merrill Lynch & Co. where he participated in the execution of leveraged loan, high yield bond and mezzanine financing transactions across various industries. Mr. Stein serves on the boards of directors of the parent entities of Floor and Decor Outlets of America, Inc., a specialty retailer of hard surface flooring and related accessories, The Neiman Marcus Group LLC, a luxury retailer, Marietta Corporation, a producer of hotel amenities, 99 Cents Only Stores LLC, a deep-discount retailer, and Guitar Center, Inc., a musical instruments retailer. Mr. Stein previously served on the board of directors of Maidenform Brands, Inc., an intimate apparel retailer. Mr. Stein graduated with distinction from Emory University's Goizueta Business School, where he received a BA in Business Administration with a concentration in Finance. Mr. Stein's experience working with and serving as a director of various companies in the retail industry controlled by private equity sponsors led to the conclusion that he should serve as a member of our board of directors.
Joseph S. Tesoriero has served as a member of our board of directors since July 2014. Mr. Tesoriero was most recently engaged as a financial advisor for Dole Asia Holding, Ltd. Pte, a wholly owned subsidiary of ITOCHU Corporation, from April 2013 to October 2013. Prior to this consulting engagement, Mr. Tesoriero served as Executive Vice President and Chief Financial Officer of Dole Food Company, Inc. ("Dole"), a producer, marketer and distributor of fresh fruits, fresh vegetables and packaged food products, from February 2010 until April 2013, and as Vice President and Chief Financial Officer from August 2004 until February 2010 and Vice President of Tax from September 2002 until August 2004. While serving as a principal financial officer at Dole, Mr. Tesoriero was responsible for overseeing the financial performance of Dole in preparing and evaluating its financial statements. Mr. Tesoriero holds a B.S. in Accounting from Villanova University, a J.D. from New York Law School and an L.L.M. in Taxation from Boston University. He has been a member of the New York State Bar since 1978. Mr. Tesoriero brings to the board of directors over 30 years of experience working for publicly held companies, including significant experience as a senior financial executive in the food industry, engaged in globally sourcing, manufacturing, distributing and marketing a wide variety of branded and private label fresh produce and grocery items.
Board Composition
Our business and affairs are managed by our board of directors, which upon the closing of this offering will consist of eight directors. The authorized number of directors will be set from time to time by our board of directors, provided the board of directors consists of at least three members.
Upon the closing of this offering, our board of directors will be divided into three classes. The members of each class will serve for a staggered, three-year term. Upon the expiration of the term of a class of directors, directors in that class will be elected for three-year terms at the annual meeting of stockholders in the year in which their term expires. There will be no cumulative voting at the election of directors. Consequently, at each annual meeting, the successors to any director whose term is then expiring will be decided by a majority of the votes cast with respect to such director's election at the meeting, unless the number of nominees exceeds the number of directors to be elected, in which case the election of directors will be decided by a plurality of the votes cast. The classes will be composed as follows:
- •
- two will be Class I directors, whose terms will expire at the first annual meeting of stockholders following this
offering;
- •
- three will be Class II directors, whose terms will expire at the second annual meeting of stockholders following
this offering; and
- •
- three will be Class III directors, whose terms will expire at the third annual meeting of stockholders following this offering.
109
Any additional directorships resulting from an increase in the number of directors will be distributed among the three classes so that, as nearly as possible, each class will consist of one-third of our directors. This classification of our board of directors may have the effect of delaying or preventing changes in control.
Director Independence
In September 2014, our board of directors undertook a review of the independence of our directors and considered whether any director has a material relationship with us that could compromise that director's ability to exercise independent judgment in carrying out that director's responsibilities. Our board of directors has affirmatively determined that each of Messrs. Anicetti, Axelrod, Giancamilli, Gies, Kaplan, Stein and Tesoriero qualifies as an "independent director," as defined in the corporate governance rules of the NYSE.
Controlled Company Exemption
Upon the closing of this offering, we will be deemed a "controlled company" under the rules of the NYSE, and we will qualify for, but do not intend to rely on, the "controlled company" exemption to the board of directors and committee composition requirements under the rules of the NYSE. If we were to rely on this exemption, we would be exempt from the requirements that (1) our board of directors be composed of a majority of independent directors, (2) we have a nominating and corporate governance committee composed entirely of independent directors with a written charter addressing the committee's purpose and responsibilities, (3) we have a compensation committee be composed solely of independent directors with a written charter addressing the committee's purpose and responsibilities and (4) we conduct an annual performance evaluation of the nominating and corporate governance committee and the compensation committee. The "controlled company" exemption does not modify the independence requirements for the audit committee, and we intend to comply with the requirements of the Sarbanes-Oxley Act and the rules of the NYSE, which require that our audit committee be composed of at least three members and entirely of independent directors within one year from the date of this prospectus.
Since we do not intend to rely on the "controlled company" exemption under the rules of the NYSE, the board of directors will take all actions necessary to comply with such rules, including appointing a majority of independent directors to the board and establishing certain committees composed entirely of independent directors within the time frames set forth under the rules of the NYSE.
Board Leadership Structure
Our board of directors has no policy with respect to the separation of the offices of Chief Executive Officer and Chairman of the Board. It is the board of directors' view that rather than having a rigid policy, the board of directors, with the advice and assistance of the nominating and corporate governance committee, and upon consideration of all relevant factors and circumstances, will determine, as and when appropriate, whether the two offices should be separate.
Currently, our leadership structure separates the offices of Chief Executive Officer and Chairman of the Board with Mr. Hirz serving as our Chief Executive Officer and Mr. Kaplan as Chairman of the Board. We believe this is appropriate as it provides Mr. Hirz with the ability to focus on our day-to-day operations while Mr. Kaplan focuses on oversight of our board of directors.
Risk Oversight
Our board of directors plays an active role in overseeing management of our risks. Our board of directors regularly reviews information regarding our credit, liquidity and operations, as well as the
110
risks associated with each. Our compensation committee is responsible for overseeing the management of risks relating to our executive compensation plans and arrangements and our audit committee is responsible for overseeing the management of financial risks. Upon the closing of this offering, our nominating and corporate governance committee will be responsible for managing risks associated with the independence of the board of directors. While each committee will be responsible for evaluating certain risks and overseeing the management of such risks, our full board of directors plans to keep itself regularly informed regarding such risks through committee reports and otherwise.
Board Committees
Our board of directors has the authority to appoint committees and, subject to certain exceptions, to delegate to such committees the power and authority of the board of directors to manage the business and affairs of the Company and administration functions. Our board of directors has an audit committee, a compensation committee and, upon the closing of this offering, will have a nominating and corporate governance committee. The composition and responsibilities of each such standing committee are described below. Members will serve on these committees until their resignation or until otherwise determined by the board of directors.
Audit Committee
Upon the closing of this offering, the audit committee of our board of directors (the "Audit Committee") will consist of Messrs. Gies, Giancamilli and Tesoriero, who will act as its chair. Our board of directors has determined that each of Messrs. Giancamilli and Tesoriero qualifies as an "audit committee financial expert" as defined in Item 407(d)(5)(ii) of Regulation S-K, has the attributes set forth in such section and is financially literate, as required by the rules of the NYSE. In addition, our board of directors has determined that each of Messrs. Giancamilli, Gies and Tesoriero is independent as independence is defined under the applicable section of the NYSE rules, and that each of Messrs. Giancamilli and Tesoriero is independent as independence is defined under Rule 10A-3(b)(1) under the Exchange Act. Within one year of the date of this prospectus, we expect to have a fully independent audit committee in accordance with the NYSE rules and Rule 10A-3(b)(1) under the Exchange Act.
The principal duties and responsibilities of our Audit Committee are as follows:
- •
- to monitor our financial reporting process and internal control system;
- •
- to appoint and replace our independent registered public accounting firm from time to time, determine their compensation
and other terms of engagement and oversee their work;
- •
- to oversee the performance of our internal audit function; and
- •
- to oversee our compliance with legal, ethical and regulatory requirements.
The Audit Committee will have the power to investigate any matter brought to its attention within the scope of its duties. It will also have the authority to retain counsel and advisors to fulfill its responsibilities and duties.
Compensation Committee
Upon the closing of this offering, the compensation committee of our board of directors (the "Compensation Committee") will consist of Messrs. Gies, Anicetti and Stein, who will act as its chair.
111
The principal duties and responsibilities of our Compensation Committee are as follows:
- •
- to provide oversight on the development and implementation of the compensation policies, strategies, plans and programs
for our key employees and outside directors and disclosure relating to these matters;
- •
- to review and approve the corporate goals and objectives relevant to the compensation of our chief executive officer,
evaluate the chief executive officer's performance and determine and approve the level of compensation based on this evaluation;
- •
- make recommendations to our board of directors with respect to compensation of our other executive officers, and
incentive-compensation and equity-based plans that are subject to approval of the board of directors; and
- •
- to provide oversight concerning succession planning and related matters.
Nominating and Corporate Governance Committee
Upon the closing of this offering, the nominating and corporate governance committee of our board of directors will consist of Messrs. Anicetti, Tesoriero and Stein, who will act as its chair.
The principal duties and responsibilities of the nominating and corporate governance committee will be as follows:
- •
- to establish criteria for board and committee membership and recommend to our board of directors proposed nominees for
election to the board of directors and for membership on committees of the board of directors; and
- •
- to make recommendations to our board of directors regarding board governance matters and practices.
Code of Conduct and Ethics
Our board of directors will adopt a code of conduct and ethics that applies to all of our employees, including those officers responsible for financial reporting. The code of conduct and ethics will be available on our website at www.smartandfinal.com. We intend to disclose any amendments to the code, or any waivers of its requirements, on our website to the extent required by applicable SEC or the rules of the NYSE. The inclusion of our website address in this prospectus does not include or incorporate by reference the information on or accessible through our website into this prospectus.
Compensation Committee Interlocks and Insider Participation
None of our executive officers currently serves, or in the past year has served, as a member of the board or compensation committee of any entity that has one or more executive officers serving on our board or compensation committee.
112
EXECUTIVE AND DIRECTOR COMPENSATION
Introduction
In this Compensation Discussion and Analysis, we address our philosophy, programs and processes related to the compensation paid or awarded for fiscal year 2013 to our named executive officers listed in the Summary Compensation Table for Fiscal Year 2013 that follows this discussion.
Our named executive officers for fiscal year 2013, which consist of our principal executive officer, our principal financial officer and our three other mostly highly compensated executive officers for fiscal year 2013, are:
- •
- David G. Hirz, who serves as President and Chief Executive Officer and a member of our board of directors and is our
principal executive officer;
- •
- Richard N. Phegley, who serves as Chief Financial Officer and is our principal financial officer;
- •
- Scott R. Drew, who serves as Senior Vice President, Store Operations, Smart &
Final;
- •
- Michael M. Laddon, who serves as Senior Vice President and Chief Information Officer; and
- •
- Martin J. Trtek, who serves as President, Cash & Carry.
Fiscal Year 2013 Compensation
Compensation Philosophy and Objectives
As a private company, we have not historically had a formal compensation philosophy. In connection with this offering, our Compensation Committee intends to work with Hay Group, our compensation consultant, to develop and formalize such a philosophy and to implement compensation arrangements that reflect that philosophy. We expect our compensation philosophy to reflect the following general principles:
- •
- Offer balanced total compensation, which may include base pay, short-term and long-term performance incentives, severance
and retirement and other benefits, in an effort to satisfy our stockholder, Company and individual executive goals.
- •
- Attract and retain high caliber executives and key personnel by offering total compensation that is competitive with that
offered by similarly situated companies. We refer to this objective as "competitive compensation."
- •
- Align the compensation of executives with the goals of the Company by conditioning a substantial portion of each named
executive officer's compensation on a combination of short- and long-term performance, including cash incentive bonuses and equity incentives. We refer to this objective as "performance incentives."
- •
- Increase, when appropriate, the percentage of a named executive officer's total compensation that is "at risk" proportionate to his or her overall responsibilities, position and compensation.
Determination of Compensation
During fiscal year 2013, our board of directors made compensation decisions with respect to our named executive officers. The first meeting of the Compensation Committee was in January 2014. We expect that our board of directors and the Compensation Committee will make future compensation decisions with respect to our named executive officers. In making executive compensation determinations for fiscal year 2013, we relied on the significant experience of our directors in establishing compensation across many companies in multiple industries, as well as the input of our chief executive officer, who has many years of experience in our industry. We expect that Hay Group
113
will be retained by the Compensation Committee as a compensation consultant to provide advice going forward. Other than serving as our compensation consultant, Hay Group will not provide any additional services to the Company following this offering. As a private company, we have not historically used a specific peer group in developing compensation packages for our named executive officers. In connection with this offering, the Compensation Committee analyzed market data for executive compensation focusing on retail and foodservice companies with $1.5 billion to $8 billion in annual revenue. The Compensation Committee reviewed compensation data from the public filings for the following companies:
| Big Lots | The Pantry | |
| Casey's General Stores | SpartanNash | |
| Core-Mark Holdings | Sprouts Farmers Market | |
| Fresh Market | Ulta Salon | |
| GNC Holdings | United Natural Foods | |
| Ingles Market | Village Super Market | |
| Roundy's | Weis Market | |
| Sally Beauty |
In connection with this offering, the Compensation Committee reviewed our named executive officer compensation against this peer group to ensure that our named executive officer compensation is competitive and sufficient to recruit and retain our named executive officers. While the Compensation Committee considered this data in evaluating named executive officer compensation, we did not seek to benchmark our named executive compensation to any particular level.
Following this offering, the Compensation Committee expects to periodically review and update this peer group and to utilize Hay Group for benchmarking and peer group analysis in determining and developing compensation packages for our named executive officers.
Elements of Our Executive Compensation Program
Historically, and for fiscal year 2013, our executive compensation program consisted of the following elements:
- •
- base salary;
- •
- annual cash incentive bonuses;
- •
- stock options;
- •
- health and retirement benefits and perquisites; and
- •
- severance payments.
We do not currently have, and following this offering we do not expect to have, formal policies relating to the allocation of total compensation among the various elements of our compensation program.
Base Salaries
The base salaries of our named executive officers are an important part of their total compensation package, and are intended to reflect their respective positions, duties and responsibilities. Base salary is a visible and stable foundation of our "competitive compensation" program. On a prospective basis, we will continue to evaluate the mix of base salary, short-term incentive compensation and long-term incentive compensation to appropriately align the interests of our named
114
executive officers with those of our stockholders. As of the end of fiscal year 2013, our named executive officers were entitled to the following base salaries:
Named Executive Officer
|
Base Salary | |||
|---|---|---|---|---|
David G. Hirz |
$ | 850,000 | ||
Richard N. Phegley |
$ | 425,000 | ||
Scott R. Drew |
$ | 262,656 | ||
Michael M. Laddon |
$ | 364,140 | ||
Martin J. Trtek |
$ | 273,268 | ||
Messrs. Hirz and Phegley did not have any increase in their respective base salaries in fiscal year 2013. In March 2013, Mr. Hirz approved merit-based increases in the base salaries of the other named executive officers in the following percentages: Mr. Drew, 2.5%; Mr. Laddon, 2.0%; and Mr. Trtek, 2.5%. These increases are reflected in the chart above.
In addition, in March 2014, Mr. Hirz approved merit-based increases in the base salaries of the following named executive officers (other than Mr. Hirz) to the following amounts: Mr. Phegley, $435,625; Mr. Drew, $300,000; Mr. Laddon, $373,244; and Mr. Trtek, $300,000. Mr. Hirz's base salary did not change in fiscal year 2014.
Cash Incentive Program
We consider annual cash incentive bonuses to be an important component of our "performance incentives." We consider annual cash incentive bonuses to be "at-risk" compensation. As "at-risk" compensation, we increase the size of the target bonus, as a percentage of base compensation, proportionate to the positions and responsibilities of our executive officers. Historically, including in fiscal year 2013, our named executive officers participated in our annual cash incentive bonus program at the following target percentages of base salary:
Named Executive Officer
|
Target Percentage |
|||
|---|---|---|---|---|
David G. Hirz |
100 | % | ||
Richard N. Phegley |
75 | % | ||
Scott R. Drew |
50 | % | ||
Michael M. Laddon |
60 | % | ||
Martin J. Trtek |
60 | % | ||
Our annual cash incentive bonus program for fiscal year 2013 was known as the Smart & Final Annual Incentive Program (the "2013 Cash Incentive Program"). Each named executive officers' target incentive bonus was the percentage of base salary set forth above, with the potential for greater or smaller payments in the event of performance above or below the target performance goals. For performance at threshold levels, the named executive officer was entitled to receive 50% of the target incentive bonus, and for performance at or above the maximum, the named executive officer was entitled to receive 150% of the target incentive bonus. Each named executive officer received an amount calculated using linear interpolation for performance between the threshold and the target, and for performance between the target and the maximum. For the 2013 Cash Incentive Program, the performance goals were based on a mix of Management Incentive EBITDA (as defined below), comparable store sales versus budget and new store sales versus pro forma sales (as described below). We believe that the use of Management Incentive EBITDA and sales growth (both comparable store and new store sales) provides consistency and comparability with our past financial performance and is consistent with our objective of tying annual incentives to metrics that support increasing stockholder value.
115
For Messrs. Hirz, Phegley and Laddon, Management Incentive EBITDA and comparable store sales versus budget under the 2013 Cash Incentive Program were measured at the Company level. The target Management Incentive EBITDA performance was $165.2 million, with an actual performance of $164.2 million. The target comparable store sales versus budget was 5.02% with an actual performance of 4.04%. For Mr. Drew, the Smart & Final comparable store sales versus budget was measured at the level of our Smart & Final segment, with a target of 4.88% and an actual performance of 3.38%. For Mr. Trtek, target comparable store sales versus budget was measured at the level of our Cash & Carry Segment, with a target performance of 5.45% and an actual performance of 6.08%.
For all of our named executive officers other than Mr. Trtek, we established pro forma sales goals in a manner intended to ensure the viability of such new stores when entering new markets. We believe such goals were ambitious and they were intended to be difficult to achieve and necessary to ensure the success of the Company as it grows. New store sales versus pro forma sales was a new performance goal added for fiscal year 2013. For Messrs. Drew and Trtek, we established segment-level Management Incentive EBITDA goals in a manner intended to increase shareholder value and maintain the growth of the business so that such goals were obtainable in a manner intended to reward outstanding performance. In recent years, the Company has outperformed the performance goals for Management Incentive EBITDA, however the incentive plan was realigned in fiscal year 2013 and the maximum bonus payment was reduced in connection with such realignment. Our Smart & Final banner stores achieved 190% of the Management Incentive EBITDA goal in 2011 and 136% of the Management Incentive EBITDA goal in 2012. Our Cash & Carry banner stores achieved 148% of the Management Incentive EBITDA goal in 2011 and 103% of the Management Incentive EBITDA goal in 2012. The weight of each performance objective and the percentage of each target achieved was set forth in the charts below.
Messrs. Hirz, Phegley and Laddon. The cash incentive bonuses for Messrs. Hirz, Phegley and Laddon for fiscal year 2013 were calculated based on the performance objectives applicable to corporate level executives as outlined in the chart below:
| |
Weight | Percentage of Target Achieved |
Bonus Payout Percentage |
|||||||
|---|---|---|---|---|---|---|---|---|---|---|
Management Incentive EBITDA |
65 | % | 99.4 | % | 93.4 | % | ||||
Comparable Store Sales vs. Budget |
20 | % | 80.5 | % | 61.0 | % | ||||
Smart & Final New Store Sales vs. Pro Forma Sales |
15 | % | 93.4 | % | 58.9 | % | ||||
Weighted Total |
81.8 | % | ||||||||
Mr. Drew. The cash incentive bonus for Mr. Drew for fiscal year 2013 was calculated based on the performance objectives applicable only to Smart & Final banner-level executives as outlined in the chart below:
| |
Weight | Percentage of Target Achieved |
Bonus Payout Percentage |
|||||||
|---|---|---|---|---|---|---|---|---|---|---|
Smart & Final Management Incentive EBITDA |
65 | % | 97.8 | % | 77.8 | % | ||||
Smart & Final Comparable Store Sales vs. Budget |
20 | % | 69.3 | % | 0.00 | % | ||||
Smart & Final New Store Sales vs. Pro Forma Sales |
15 | % | 93.4 | % | 58.9 | % | ||||
Weighted Total |
59.4 | % | ||||||||
116
Mr. Trtek. The cash incentive bonus for Mr. Trtek for fiscal year 2013 was calculated based on the performance objectives applicable only to Cash & Carry banner-level executives as outlined in the chart below:
| |
Weight | Percentage of Target Achieved |
Bonus Payout Percentage |
|||||||
|---|---|---|---|---|---|---|---|---|---|---|
Cash & Carry Management Incentive EBITDA |
80 | % | 104.0 | % | 116.1 | % | ||||
Cash & Carry Comparable Store Sales vs. Budget |
20 | % | 111.6 | % | 123.3 | % | ||||
Weighted Total |
117.6 | % | ||||||||
"Management Incentive EBITDA" means earnings before interests, taxes, depreciation and amortization (inclusive of share-based compensation), but excluding accruals for administrative incentive bonuses and the expense or income effect of certain unusual items, such as strategic transaction costs, discontinued operations and closed store costs, non-cash rent expense or income, non-cash benefit plan expenses, severance costs, unusual legal charges and expenses associated with business optimization programs. "Pro forma sales" refers to the anticipated sales used to calculate the anticipated return on capital when a new store was approved. Our annual cash incentive bonus program for fiscal year 2014 is identical to the 2013 Cash Incentive Program except that management incentive EBITDA is adjusted to include "pre-opening expenses." "Pre-opening expenses" means expenses applicable to projects under development and includes, among other expenses, pre-opening labor (including payroll taxes and fringe benefits), travel expenses, advertising expenses, rent, common area maintenance expenses, utilities and distribution costs.
Equity-Based Compensation
We view equity-based compensation as a critical component of our balanced total compensation program. Equity-based compensation creates an ownership culture among our employees that provides an incentive to contribute to the continued growth and development of our business and aligns interests of executives and managers with those of our stockholders. We have historically granted half of the stock options awarded to our named executive officers with an exercise price equal to the fair market value of the underlying share of common stock on the date of grant, and half of the stock options with an exercise price equal to 150% of the fair market value of the underlying share of common stock on the date of grant. Not only does this put the value of the stock options "at-risk" in the market, but it also provides a long-term performance incentive for our named executive officers to increase the value of the Company.
2012 Incentive Plan. We established the 2012 Incentive Plan in connection with the Ares Acquisition in November 2012. No grants, other than the rollover options described below, were made under the 2012 Incentive Plan prior to February 2013. In February 2013, we granted nonqualified stock options to certain employees, including our named executive officers, pursuant to the 2012 Incentive Plan. The number of shares underlying options granted to our named executive officers was determined by our board of directors. In making its determination, our board of directors considered competitive grant values for comparable positions as well as various subjective factors primarily relating to the responsibilities of each individual executive, including the executive's past performance and expected future contributions and value to the Company. Each of the options has a 10-year term, and vests in equal amounts on the first five anniversaries of the date of the Ares Acquisition.
In connection with this offering, we intend to amend the options granted to Mr. Hirz to provide for certain acceleration as follows: (i) if Mr. Hirz's employment is terminated by the Company without Cause or by Mr. Hirz for Good Reason following a Change in Control, the options will accelerate and vest; and (ii) if Mr. Hirz remains employed by the Company following a Change in Control, the options will accelerate and vest (A) on the 24-month anniversary of the Change in Control if such Change in
117
Control occurs within the 24 months following the date of grant or (B) on the 13-month anniversary of the Change in Control if such Change in Control occurs more than 24 months after the date of grant.
Pursuant to the 2012 Incentive Plan, if a participant engages in "detrimental activity" within the one-year period commencing on the later of (a) the date the option is exercised or (b) the termination of the participant's employment, the participant is required to repay to the Company an amount equal to the gain realized as a result of the exercise of the option. "Detrimental activity" is defined in the 2012 Incentive Plan, and generally includes: divulging confidential information; engaging in any activity while employed by the Company that, if known, could result in the participant's termination for "Cause," as defined in the 2012 Incentive Plan; soliciting employees to leave the Company or suppliers to provide services to support a competitor; or materially breaching an agreement with the Company.
We granted options to our named executive officers on February 1, 2013 in the following amounts, with exercise prices at or above the fair market value of the stock underlying the options on the date of grant:
Named Executive Officer
|
Number of Shares Underlying Option |
Exercise Price Per Share |
|||||
|---|---|---|---|---|---|---|---|
David G. Hirz |
4,419 | $ | 1,000 | ||||
David G. Hirz |
4,419 | $ | 1,500 | ||||
Richard N. Phegley |
1,503 | $ | 1,000 | ||||
Richard N. Phegley |
1,503 | $ | 1,500 | ||||
Scott R. Drew |
575 | $ | 1,000 | ||||
Scott R. Drew |
575 | $ | 1,500 | ||||
Michael M. Laddon |
442 | $ | 1,000 | ||||
Michael M. Laddon |
442 | $ | 1,500 | ||||
Martin J. Trtek |
575 | $ | 1,000 | ||||
Martin J. Trtek |
575 | $ | 1,500 | ||||
In connection with the Ares Acquisition, Messrs. Hirz, Phegley and Drew rolled over certain non-qualified stock options they held in our former parent company prior to the Ares Acquisition into options to purchase shares of our common stock. Each of these options was fully vested at the time of the rollover. The exercise prices of such rollover options range from $396.04 per share to $477.23 per share.
2014 Incentive Plan. In anticipation of this offering, our board of directors has adopted, and our stockholders are expected to approve, the 2014 Incentive Plan contingent upon the closing of this offering. A description of the 2014 Incentive Plan and grants thereunder is provided below under "—2014 Incentive Plan."
Perquisites
Our named executive officers are provided with limited perquisites to aid in the performance of their respective duties and to provide "competitive compensation" with executives with similar positions and levels of responsibilities. Our named executive officers are provided with a combination of a car allowance or Company car, a gas card, auto insurance for one vehicle and a cell phone for use in connection with the performance of their respective duties, as their positions require that the executive officers be available for consultation outside the office. The car and cell phones are also used for limited personal use. Mr. Hirz is provided with a car allowance of $1,500 per month; Messrs. Phegley and Laddon are each provided with a car allowance of $950 per month; and Mr. Trtek is provided with a car allowance of $800 per month. Mr. Drew is provided with a Company vehicle. In addition, Messrs. Hirz, Drew and Trtek may use a Company-provided gas card for business and personal use, but
118
are only reimbursed for gas card expenses if they file a business expense reimbursement form. Any amounts for which no business expense reimbursement form is submitted are reported as income. For fiscal year 2013, the following was reported as income related to gas cards: Mr. Hirz, $6,401; Mr. Drew, $170; and Mr. Trtek $5,026.
In addition, our named executive officers participate in a grandfathered executive medical insurance plan that provides for reimbursement of out-of-pocket medical expenses.
Mr. Drew relocated from Indiana to California at our request in connection with his hiring in 2010. In connection with his relocation, we reimbursed Mr. Drew for his relocation expenses. The final relocation reimbursement of $50,388 was made in fiscal year 2013.
401(k) Plan
We maintain a tax-qualified retirement plan (the "401(k) Plan") that provides eligible employees with an opportunity to save for retirement on a tax-advantaged basis. Eligible employees are able to participate in the 401(k) Plan as of the first day of the month following the date they meet the 401(k) Plan's eligibility requirements, and participants are able to defer up to 100% of their eligible compensation subject to applicable annual Code limits. All participants' interests in their deferrals are 100% vested when contributed. The 401(k) Plan permits us to make matching contributions and profit sharing contributions to eligible participants. We match contributions at a 50% rate, up to a cap of 6% of base salary. We have not made any profit sharing contributions to date.
Supplemental Deferred Compensation Plan
The Internal Revenue Code of 1986, as amended (the "Code"), imposes limits on highly compensated employees with respect to tax-qualified defined contribution retirement plans. This limitation reduces the retirement benefits for our named executive officers. Accordingly, as part of our total compensation benefits that we provide in order to maintain competitive compensation, we maintain a nonqualified deferred contribution plan (the "Supplemental Deferred Compensation Plan") in which a select group of our highly compensated employees, including all of our named executive officers, are eligible to participate. The Supplemental Deferred Compensation Plan allows employees to defer compensation into future years, including until retirement. The Supplemental Deferred Compensation Plan is partially funded in a rabbi trust.
In April 2011, our predecessor sold a former subsidiary to Sprouts Farmers Markets, Inc. ("Sprouts"). In connection with the sale, certain executive officers were offered the opportunity to acquire equity interests in an intermediate investment entity (the "Sprouts Entity"), which in turn acquired common stock of Sprouts. As an eligible investment under the Supplemental Deferred Compensation Plan, eligible executive officers who were also participants in the Supplemental Deferred Compensation Plan were provided the opportunity to invest a portion of their deferred compensation in an index fund with respect to the Sprouts Entity. As of the end of fiscal year 2013, such investment has provided above market earnings. Sprouts is not an affiliate of the Company.
In fiscal year 2013, the following named executive officers participated in the Supplemental Deferred Compensation Plan in the following amounts: Mr. Hirz deferred $1,792; Mr. Phegley deferred $89,956; Mr. Drew deferred $100,157; and Mr. Laddon deferred $15,068. Mr. Trtek did not make any deferrals thereunder in fiscal year 2013. Amounts deferred under the Supplemental Deferred Compensation Plan are then credited to each respective named executive officer's account based on his individual selections from a portfolio of available investments.
See "—Nonqualified Deferred Compensation Table" for further information regarding the Supplemental Deferred Compensation Plan.
119
Pension Plan
We maintain a defined benefit pension plan (the "Pension Plan") that was frozen in June 2008 for all participants and for benefit accruals, other than with respect to employees in our subsidiary, Commerce Distribution Company LLC or certain non-management employees in our warehouse or transportation departments. Messrs. Phegley and Trtek were participants in the Pension Plan prior to the Pension Plan being frozen and have fully vested benefits therein. The Pension Plan is not an ongoing element of our compensation philosophy, but is considered when reviewing whether the total compensation of our executives is balanced.
No payments were made to any named executive officer in fiscal year 2013 under the Pension Plan. The following were the present values of the accounts of our named executive officers under the Pension Plan as of the end of fiscal year 2013: Mr. Phegley, $198,691; and Mr. Trtek, $180,829. All present values in the participants' Pension Plan accounts decreased between the end of fiscal year 2012 and the end of fiscal year 2013. The respective incremental decreases in the present value of the accounts between the end of fiscal year 2012 and the end of fiscal year 2013 were as follows: Mr. Phegley, $18,894; and Mr. Trtek, $15,972.
See "—Pension Benefits Table" for further information regarding the Pension Plan.
Supplemental Executive Retirement Plan
We maintain the Supplemental Executive Retirement Plan (the "SERP"), which is a non-qualified defined benefit plan for our senior executives. The SERP is not an ongoing element of our compensation philosophy, but is considered when reviewing whether the total compensation of our executives is balanced. The SERP is partially funded in a rabbi trust. The SERP was frozen to all participants and benefit accruals in January 2008. However, all of our named executive officers who are eligible to receive benefits pursuant to the Pension Plan are entitled to receive benefits equal to a certain percentage of their compensation, less the amounts payable under the Pension Plan.
Messrs. Phegley and Trtek were participants in the Pension Plan prior to the SERP being frozen and have vested benefits in the SERP. No payments were made to any named executive officer in fiscal year 2013 under the SERP. The following were the present values of the accounts under the SERP as of the end of fiscal year 2013: Mr. Phegley, $1,702,631; and Mr. Trtek, $929,362. All present values in the participants' SERP accounts decreased between the end of fiscal year 2012 and the end of fiscal year 2013. The respective incremental decrease in the present value of the accounts between the end of fiscal year 2012 and the end of fiscal year 2013 were as follows: Mr. Phegley, $177,447; and Mr. Trtek, $90,812.
See "—Pension Benefits Table" for further information regarding the SERP.
Severance
In anticipation of this offering, we expect to enter into an employment agreement with Mr. Hirz that provides for severance under certain circumstances. We maintain a severance plan for our senior executives, including all of our named executive officers other than Mr. Hirz. We believe that providing severance is a necessary element of "competitive compensation," and is in line with current market practices. Severance protection also enhances our ability to retain capable executive officers and can create management stability during periods of uncertainty.
See "—Potential Payments Upon Termination or Change in Control" for information regarding benefits under Mr. Hirz's employment agreement and the Severance Plan.
Employment Agreements with David G. Hirz. In anticipation of this offering, we expect to enter into an employment agreement with Mr. Hirz. The employment agreement is for a three-year term,
120
provided that on the first anniversary of the effective date, and on each anniversary thereafter, the term of the employment agreement extends for an additional year unless either party provides 60 days' written notice prior to any such anniversary.
Mr. Hirz is also subject to a Fair Competition Agreement with us, pursuant to which he is subject to certain non-competition and non-solicitation restrictions while employed and for a limited time after the termination of his employment. In addition, Mr. Hirz is subject to confidentiality and non-disparagements restrictions.
Tax Considerations
As a general matter, our board of directors and the Compensation Committee review and consider the various tax and accounting implications of compensation programs we utilize.
Section 162(m) of the Code ("Section 162(m)") generally disallows public companies a tax deduction for compensation in excess of $1,000,000 paid to their chief executive officers and the three other most highly compensated executive officers (excluding the chief financial officer) unless certain performance and other requirements are met. Our intent generally is to design and administer executive compensation programs in a manner that will preserve the deductibility of compensation paid to our named executive officers, and we believe that a substantial portion of our current executive compensation program (including the stock options and other awards that may be granted to our named executive officers as described above) satisfies the requirements for exemption from the $1,000,000 deduction limitation. We intend to comply with applicable laws in order to rely on the transition rules under Section 162(m) for newly public companies. To the extent the transition rules under Section 162(m) apply to us, the $1,000,000 deduction limitation would not apply. However, we reserve the right to design programs that recognize a full range of performance criteria important to our success, even where the compensation paid under such programs may not be deductible.
Compensation Risk Assessment
In connection with this offering, management conducted a risk assessment of our compensation plans and practices and concluded that our compensation programs do not create risks that are reasonably likely to have a material adverse effect on the Company. The objective of the assessment was to identify any compensation plans or practices that may encourage employees to take unnecessary risk that could threaten the Company. No such plans or practices were identified. The Compensation Committee has reviewed and agrees with management's conclusion.
Role of Executive Officers in Determining Compensation for Our Executive Officers
Mr. Hirz determined merit increases in base salaries for executive officers, including named executive officers, as described above under "—Fiscal Year 2013 Compensation—Elements of Our Executive Compensation Program—Base Salaries." Otherwise, none of our executive officers played a role in determining compensation for our executive officers.
Role of the Compensation Committee in Executive Compensation
During fiscal year 2013, with the exception of the merit increase in base salary for certain of our executive officers determined by Mr. Hirz as described above with respect to named executive officers under "—Fiscal Year 2013 Compensation—Elements of Our Executive Compensation Program—Base Salaries," our board of directors made all decisions regarding the compensation of our executive officers. For fiscal year 2014 and beyond, we expect that our executive compensation program will be administered by the Compensation Committee. It is the Compensation Committee's responsibility to: oversee the design of our executive compensation programs, policies and practices; determine the types and amounts of most compensation for executive officers; and review and approve the adoption,
121
termination and amendment of, and to administer and, as appropriate, make recommendations to our board of directors regarding, our incentive compensation and stock option plans. The Compensation Committee considered and approved the payments under the 2013 Cash Incentive Program. Our human resources department supports the Compensation Committee's work, and in some cases acts under delegated authority to administer compensation programs. In addition, as described above, we expect that the Compensation Committee will directly engage Hay Group to assist in its review of compensation for our executive officers.
Compensation Committee Interlocks and Insider Participation
In fiscal year 2013, none of our executive officers served as a director or member of the compensation committee of another entity whose executive officers served on our board of directors or the Compensation Committee.
122
COMPENSATION OF OUR NAMED EXECUTIVE OFFICERS
Summary Compensation Table for Fiscal Year 2013
The following table contains information about the compensation paid to or earned by each of our named executive officers during our most recently completed fiscal year.
Name and Principal Position
|
Fiscal Year |
Salary ($) |
Option Awards ($)(1) |
Non-Equity Incentive Plan Compensation ($) |
Change in Pension Value and Nonqualified Deferred Compensation Earnings ($)(2) |
All Other Compensation ($)(3) |
Total ($) |
|||||||||||||||
|---|---|---|---|---|---|---|---|---|---|---|---|---|---|---|---|---|---|---|---|---|---|---|
David G. Hirz |
2013 | 850,000 | 5,039,781 | 694,875 | 81,948 | 39,671 | 6,706,275 | |||||||||||||||
President and Chief Executive Officer |
||||||||||||||||||||||
Richard N. Phegley |
2013 |
425,000 |
1,714,141 |
260,578 |
980,078 |
26,670 |
3,406,467 |
|||||||||||||||
Senior Vice President and Chief Financial Officer |
||||||||||||||||||||||
Scott R. Drew |
2013 |
261,424 |
655,776 |
77,996 |
— |
65,828 |
1,061,024 |
|||||||||||||||
Senior Vice President, Store Operations, Smart & Final |
||||||||||||||||||||||
Michael M. Laddon |
2013 |
362,767 |
504,092 |
178,611 |
— |
26,670 |
1,072,140 |
|||||||||||||||
Senior Vice President and Chief Information Officer |
||||||||||||||||||||||
Martin J. Trtek |
2013 |
271,986 |
655,776 |
192,736 |
— |
27,482 |
1,147,980 |
|||||||||||||||
President, Cash & Carry |
||||||||||||||||||||||
- (1)
- The
amounts shown for option awards are based on the grant date fair value of awards calculated in accordance with FASB ASC Topic 718. The assumptions used
in determining the amounts in this column are set forth in Note 13, Share-Based Compensation, to our consolidated financial statements for fiscal year 2013. For information regarding the number of
shares underlying stock option grants awarded in fiscal year 2013 and other features of those grants, see the "—Grants of Plan-Based Awards Table" below.
- (2)
- Represents
the amount of earnings on deferred compensation invested in the Sprouts Entity index fund under the Supplemental Deferred Compensation Plan
through the effective date of Sprouts' initial public offering. See "Supplemental Deferred Compensation Plan."
- (3)
- The amounts shown as All Other Compensation include: matching contributions under the 401(k) Plan of $5,237 for each named executive officer; matching contributions under the Supplemental Deferred Contribution Plan of $2,414 for each named executive officer other than Mr. Trtek; an annual car allowance of $18,000 for Mr. Hirz, $11,400 for each of Messrs. Phegley and Laddon, and $9,600 for Mr. Trtek; the incremental cost of Mr. Drew's Company-provided vehicle; the unreimbursed use of the Company-provided gas card; and the cost of the grandfathered executive medical plan, in an amount equal to $7,620, for each named executive officer. It also includes $50,388 in reimbursed relocation expenses for Mr. Drew.
Employment Agreement
In anticipation of this offering, we expect to enter into an employment agreement with Mr. Hirz, relating to Mr. Hirz's employment as our President and Chief Executive Officer, establishing his
123
position and duties and providing for compensatory terms. No other named executive officer is party to an employment agreement with the Company.
See "Compensation of Our Named Executive Officers" and "—Potential Payments upon Termination or Change in Control" for discussions of the current compensatory terms applicable to each named executive officer and a description of the terms of Mr. Hirz's employment agreement.
Grants of Plan-Based Awards Table
The following table contains information about each grant of an award made to our named executive officers under any incentive plan in fiscal year 2013.
| |
|
|
|
|
All Other Option Awards: Number of Securities Underlying Options (#)(3) |
|
|
|||||||||||||||
|---|---|---|---|---|---|---|---|---|---|---|---|---|---|---|---|---|---|---|---|---|---|---|
| |
|
|
|
|
|
Grant Date Fair Value of Option Awards ($) |
||||||||||||||||
| |
|
Estimated Future Payouts Under Non- Equity Incentive Plan Awards(2) |
Exercise or Base Price of Option Awards ($/share) |
|||||||||||||||||||
| |
Grant Date(1) |
|||||||||||||||||||||
Name
|
Threshold ($) | Target ($) | Maximum ($) | |||||||||||||||||||
David G. Hirz |
— | 425,000 | 850,000 | 1,275,000 | — | — | — | |||||||||||||||
|
2/1/13 | — | — | — | 4,419 | 1,000 | 2,711,764 | |||||||||||||||
|
2/1/13 | — | — | — | 4,419 | 1,500 | 2,328,018 | |||||||||||||||
Richard N. Phegley |
— |
159,375 |
318,750 |
478,125 |
— |
— |
— |
|||||||||||||||
|
2/1/13 | — | — | — | 1,503 | 1,000 | 922,331 | |||||||||||||||
|
2/1/13 | — | — | — | 1,503 | 1,500 | 791,810 | |||||||||||||||
Scott R. Drew |
— |
65,664 |
131,328 |
196,992 |
— |
— |
— |
|||||||||||||||
|
2/1/13 | — | — | — | 575 | 1,000 | 352,855 | |||||||||||||||
|
2/1/13 | — | — | — | 575 | 1,500 | 302,922 | |||||||||||||||
Michael M. Laddon |
— |
109,242 |
218,484 |
327,726 |
— |
— |
— |
|||||||||||||||
|
2/1/13 | — | — | — | 442 | 1,000 | 271,238 | |||||||||||||||
|
2/1/13 | — | — | — | 442 | 1,500 | 232,854 | |||||||||||||||
Martin J. Trtek |
— |
81,980 |
163,961 |
245,941 |
— |
— |
— |
|||||||||||||||
|
2/1/13 | — | — | — | 575 | 1,000 | 352,855 | |||||||||||||||
|
2/1/13 | — | — | — | 575 | 1,500 | 302,922 | |||||||||||||||
- (1)
- For
information regarding the timing of stock option grants, see "—Equity Based Compensation—2012 Incentive Plan."
- (2)
- Constitutes
threshold, target and maximum award opportunities for our named executive officers under the 2013 Cash Incentive Program. See
"—Fiscal Year 2013 Compensation—Elements of Our Executive Compensation Program—Cash Incentive Program" for information regarding the criteria applied in determining
amounts payable under the awards. The actual amounts paid with respect to these awards are included in the "Non-Equity Incentive Plan Compensation" column in the Summary Compensation Table for Fiscal
Year 2013.
- (3)
- The amounts shown in this column represent the shares of our common stock underlying options granted under the 2012 Incentive Plan. All options vest at a rate of 20% per year on each of November 15, 2013, 2014, 2015, 2016 and 2017, subject to earlier termination upon the occurrence of specified events.
124
Outstanding Equity Awards at Fiscal Year-End Table
The following table contains information concerning unexercised options for each named executive officer outstanding as of the end of fiscal year 2013.
| |
Option Awards | ||||||||||||
|---|---|---|---|---|---|---|---|---|---|---|---|---|---|
Name
|
Number of Securities Underlying Unexercised Options Exercisable |
Number of Securities Underlying Unexercised Options Unexercisable |
Option Exercise Price ($) |
Option Expiration Date |
|||||||||
David G. Hirz |
5,691 | (1) | — | 396.04 | 4/6/17 | ||||||||
|
5,050 | (1) | — | 475.25 | 1/1/19 | ||||||||
|
884 | (2) | 3,535 | 1,000 | 2/1/23 | ||||||||
|
884 | (2) | 3,535 | 1,500 | 2/1/23 | ||||||||
Richard N. Phegley |
4,867 |
(1) |
— |
396.04 |
5/31/14 |
||||||||
|
301 | (2) | 1,202 | 1,000 | 2/1/23 | ||||||||
|
301 | (2) | 1,202 | 1,500 | 2/1/23 | ||||||||
Scott R. Drew |
606 |
(1) |
— |
396.04 |
4/6/17 |
||||||||
|
784 | (1) | — | 396.04 | 1/27/18 | ||||||||
|
347 | (1) | — | 447.23 | 2/27/19 | ||||||||
|
115 | (2) | 460 | 1,000 | 2/1/23 | ||||||||
|
115 | (2) | 460 | 1,500 | 2/1/23 | ||||||||
Michael M. Laddon |
89 |
(2) |
353 |
1,000 |
2/1/23 |
||||||||
|
89 | (2) | 353 | 1,500 | 2/1/23 | ||||||||
Martin J. Trtek |
115 |
(2) |
460 |
1,000 |
2/1/23 |
||||||||
|
115 | (2) | 460 | 1,500 | 2/1/23 | ||||||||
- (1)
- Represents
options that were rolled over in connection with the Ares Acquisition from options in our former parent company. All options that were rolled
over were fully vested as of the time of the rollover. The number of shares of common stock subject to such options and the applicable exercise prices were equitably adjusted in connection with the
rollover.
- (2)
- The options granted on February 1, 2013 each vest at a rate of 20% per year on each of November 15, 2013, 2014, 2015, 2016 and 2017.
Option Exercises and Stock Vested
No options issued under the 2012 Incentive Plan, including those held by named executive officers, were exercised in fiscal year 2013. No stock subject to vesting has been awarded to any named executive officer.
Pension Benefits Table
We maintain the Pension Plan that was frozen in June 2008. Messrs. Phegley and Trtek were participants in the Pension Plan prior to the Pension Plan being frozen and have fully vested benefits therein.
Our named executive officers who participate in the Pension Plan may retire and begin receiving normal benefits at age 65. A participant is eligible to receive early retirement benefits under the Pension Plan after reaching age 55 and providing 10 years of service. Normal retirement benefits consist of a monthly benefit equal to a participant's final average earnings multiplied by 1.5% times
125
years of service prior to 1992 plus 1.0% times years of service after 1992, minus any benefits received under any other pension plan related to the participant's service to us for which the participant receives benefits (e.g., a union pension plan). If a participant elects to receive early retirement benefits, such benefit will consist of the normal retirement benefits, reduced by 0.5% for each month the early retirement precedes the normal retirement date.
We engaged the services of Towers Watson to determine the present value of annual accrued and actual benefits under the Pension Plan. The present value of such benefits decreased between the end of fiscal year 2012 and the end of fiscal year 2013 primarily due to the increase in the discount rate from 4.3% in 2012 to 5.15% in 2013. All other assumptions regarding mortality (preretirement and postretirement), forms of payment, married percentages and ages of spouses remained the same.
In addition, we maintain the SERP. The SERP was frozen to all participants and benefit accruals in January 2008. However, all of our named executive officers who are eligible to receive benefits pursuant to the Pension Plan are entitled to receive benefits equal to a certain percentage of their compensation, less the amounts payable under the Pension Plan. Messrs. Phegley and Trtek were participants in the SERP prior to the SERP being frozen and have fully vested benefits under the SERP.
We determine the present value of assets held in the SERP by each participant as of the end of each fiscal year. The calculations were performed on a person-by-person basis. Each participant's present value differs based on his individual election under the SERP. For example, participants could elect SERP benefits as single-life annuities, 15-year terms certain, joint-and-survivor or other applicable terms. Each election would have its own associated mortality assumption, if applicable. No compensation related to the SERP was attributed to any named executive officer in fiscal year 2013 because the SERP is frozen. Also, there is no estimated rate of return on assets because the SERP is a nonqualified plan. The discount rate used to calculate the present value of SERP assets was 3.17% for 2012 and 4.14% for 2013.
The following table contains information about our plans that provides for payments or other benefits at, following, or in connection with retirement.
Name
|
Plan Name | Number of Years Credited Service (#) |
Present Value of Accumulated Benefit ($) |
Payments During Last Fiscal Year ($) |
||||||||
|---|---|---|---|---|---|---|---|---|---|---|---|---|
David G. Hirz |
— | — | — | — | ||||||||
Richard N. Phegley |
Pension Plan |
11 |
198,691 |
— |
||||||||
|
Supplemental Executive Retirement Plan | 15 | 1,702,631 | — | ||||||||
Scott R. Drew |
— |
— |
— |
— |
||||||||
Michael M. Laddon |
— |
— |
— |
— |
||||||||
Martin J. Trtek |
Pension Plan |
10 |
180,829 |
— |
||||||||
|
Supplemental Executive Retirement Plan | 15 | 929,362 | — | ||||||||
Nonqualified Deferred Compensation Table
We maintain the Supplemental Deferred Compensation Plan for a select group of our highly compensated employees, in which all our named executive officers are eligible to participate. Participants are entitled to defer up to 100% of their base compensation and incentive bonus in the Supplemental Deferred Compensation Plan.
126
Deferred amounts are paid in accordance with the participant's elections under the Supplemental Deferred Compensation Plan. In the event of the participant's termination of employment, deferred amounts are generally paid within 90 days following termination of employment, except in the event of the participant's retirement or disability, in which case deferred amounts are paid, at the participant's prior election, within 90 days following retirement or disability, or the fifth, tenth or fifteenth anniversary of such retirement or disability. We provide a matching contribution to participants in the Supplemental Deferred Compensation Plan equal to the match such participant would have received under the 401(k) Plan, except to the extent such contributions are subject to limits imposed by qualified plans.
Participants in the Supplemental Deferred Compensation Plan, including named executive officers, allocate their contributions and plan account balances among investment alternatives which track the performance of investment funds. The alternatives that named executive officers may elect to track include a money market fund, S&P 500 Index fund, a growth fund, a value fund, a mid-cap growth fund, a small-mid cap value fund, an international fund, a total return fund, a small-mid cap growth series, a small-cap value series, a small-cap index, a global bond, and the Sprouts Entity index fund.
The following table contains information regarding nonqualified defined contribution and other nonqualified deferred compensation plans.
Name
|
Executive Contributions in Last FY ($) |
Registrant Contributions in Last FY ($) |
Aggregate Earnings in Last FY ($) |
Aggregate Withdrawals/ Distributions ($) |
Aggregate Balance at Last FYE ($) |
|||||||||||
|---|---|---|---|---|---|---|---|---|---|---|---|---|---|---|---|---|
David G. Hirz |
1,792 | 2,414 | 264,693 | 24,102 | 408,332 | |||||||||||
Richard N. Phegley |
89,956 | 2,414 | 3,148,903 | 24,102 | 4,951,091 | |||||||||||
Scott R. Drew |
100,157 | 2,414 | 25,515 | — | 181,152 | |||||||||||
Michael M. Laddon |
15,068 | 2,414 | 8,574 | — | 58,385 | |||||||||||
Martin J. Trtek |
— | — | — | — | — | |||||||||||
Potential Payments upon Termination or Change in Control
In this section, we describe payments that may be made to our named executive officers upon several events of termination, assuming the termination event occurred on the last day of fiscal year 2013 (except as otherwise noted).
The information in this section does not include information relating to the following:
- •
- distributions under the Pension Plan, the SERP and the Supplemental Deferred Compensation Plan—see
"—Fiscal Year 2013 Compensation—Elements of Our Executive Compensation Program—Pension Plan," "—Supplemental Deferred Compensation Plan" and
"—Supplemental Executive Retirement Plan" for information regarding these plans;
- •
- other payments and benefits provided on a nondiscriminatory basis to salaried employees generally upon termination of
employment, including our 401(k) Plan; and
- •
- shares underlying options that vested prior to the termination event—see the "—Outstanding Equity Awards at Fiscal Year-End Table."
Employment Agreement with David G. Hirz
In anticipation of this offering, we expect to enter into an employment agreement with Mr. Hirz that provides for severance in the event that Mr. Hirz's employment is terminated by the Company without Cause or by Mr. Hirz for Good Reason. In the event of either such termination, Mr. Hirz will be entitled to receive:
- •
- continuation of base salary for 24 months;
127
- •
- a prorated share of the annual bonus based on actual performance, payable at the time bonuses are paid generally; and
- •
- entitlement to exercise vested options for a period of 90 days after termination.
"Good Reason" generally means the occurrence of any of the following events by the Company, without Mr. Hirz's consent: (i) a material diminution of Mr. Hirz's authority, responsibility or duties, including if Mr. Hirz no longer reports directly to our board of directors; (ii) relocation to a principal place of employment that is 25 miles further (one-way) from Mr. Hirz's current residence than the current headquarters in Commerce, California is from such residence; or (iii) failure by the Company to comply with any material obligation imposed by the employment agreement. However, the Company may reduce Mr. Hirz's base salary in connection with a Company-wide reduction in salary or a reduction in salary of the Company's executive officers generally, and any such reduction shall not be deemed to be "Good Reason," provided that the percentage of any such reduction is no greater than the percentage reduction of any other officer.
"Cause" generally means the occurrence of any of the following events by Mr. Hirz: (i) a breach of any material provision of the employment agreement or a breach of any provision of the Fair Competition Agreement between Mr. Hirz and the Company; (ii) (A) the commission of any felony or (B) the conviction or plea of nolo contendere to any misdemeanor, in each case, that could cause material harm or embarrassment to the Company or any of its subsidiaries or any of its affiliates; (iii) theft, embezzlement or fraud in connection with the performance of Mr. Hirz's duties; (iv) the misappropriation of any material business opportunity of the Company or any of its subsidiaries by Mr. Hirz; (v) any material failure by Mr. Hirz to comply with, observe or carry out the Company's written rules, regulations, policies and codes of ethics and/or conduct applicable to its employees generally; (vi) any material failure by Mr. Hirz to comply with, observe or carry out the written rules, regulations, policies, directions, codes of ethics and/or conduct and restrictions for senior executives of the Company; and (vii) substance abuse or use of illegal drugs that (A) materially impairs performance of Mr. Hirz's duties or (B) causes or is likely to cause material harm or embarrassment to the Company or any of its subsidiaries.
In the event that Mr. Hirz's employment is terminated within 60 days prior to or within 24 months following a Change in Control (as defined in the 2014 Incentive Plan), he will be entitled to receive additional severance equal to two times his target annual bonus. To the extent permitted by Section 409A of the Code, any severance payable to Mr. Hirz will be paid in a lump sum.
In the event that Mr. Hirz's employment is terminated as a result of his death or disability, Mr. Hirz, his personal representative or guardian, as the case may be, is entitled to receive:
- •
- continuation of base salary for 24 months; and
- •
- a prorated share of the annual bonus based on actual performance, payable at the time bonuses are paid generally.
Severance Plan
The Company maintains the Severance Plan, in which all of our named executive officers other than Mr. Hirz participate.
In the event that the employment of any named executive officer who participates in the Severance Plan is involuntarily terminated by the Company for any reason other than on account of Cause (as defined below), death or disability, such named executive officer is entitled to receive the following severance benefits:
- •
- continuation of base salary for 12 months;
128
- •
- a prorated share of the annual bonus based on actual performance, payable at the time bonuses are paid generally;
- •
- continuation of medical, dental and vision insurance through the earlier of (i) 12 months or (ii) the
date the participant obtains eligibility for welfare benefits from a subsequent employer; and
- •
- reasonable executive level outplacement services for 12 months.
"Cause" generally means a finding by the Compensation Committee that the participant has (i) committed a felony or a crime involving moral turpitude, (ii) committed any act of gross negligence or fraud, (iii) failed, refused or neglected to substantially perform his or her employment duties (other than by reason of a physical or mental impairment) or to implement the reasonable directives of the Company (that is not cured within 30 days), (iv) violated any material policy of the Company (that is not cured within 30 days), or (v) engaged in fraud or misconduct that is materially injurious to the Company, monetarily or otherwise.
Name
|
Cash Payments ($) |
Continuation of Welfare Plans ($)(1) |
Outplacement Services ($)(2) |
|||||||
|---|---|---|---|---|---|---|---|---|---|---|
David G. Hirz |
2,394,875 | (4) | — | — | ||||||
Termination Without Cause/Resignation for Good Reason/Death/Disability(3) |
||||||||||
Richard N. Phegley |
685,578 |
(5) |
29,165 |
11,500 |
||||||
Termination Without Cause |
||||||||||
Scott R. Drew |
340,652 |
(5) |
29,165 |
11,500 |
||||||
Termination Without Cause |
||||||||||
Michael M. Laddon |
542,751 |
(5) |
29,165 |
11,500 |
||||||
Termination Without Cause |
||||||||||
Martin J. Trtek |
466,003 |
(5) |
22,827 |
11,500 |
||||||
Termination Without Cause |
||||||||||
- (1)
- Reflects
the cost of 12 months' continuation of medical, dental and vision insurance premium payments.
- (2)
- Reflects
the cost of 12 months of executive outplacement services.
- (3)
- As
of the end of fiscal year 2013, Mr. Hirz was not entitled to any additional compensation as a result of a change in control.
- (4)
- Reflects
24 months' continuation of base salary and a prorated bonus based on actual performance.
- (5)
- Reflects 12 months' continuation of base salary and a prorated bonus based on actual performance.
Compensation of Our Directors
For fiscal year 2013, directors who were executives of the Company or employees of Ares Management were not eligible to receive additional compensation for their services as directors.
129
Directors who were not executives of the Company or employees of Ares Management each earned director fees in fiscal year 2013 as follows:
- •
- an annual cash retainer of $35,000 for attending board of director meetings, pro-rated based on the amount of time he
served as a director; and
- •
- an additional $2,500 for each board of directors or committee meeting attended in excess of four such meetings per year.
Our board of directors has adopted a compensation program for our independent directors that will become effective upon the completion of this offering. Pursuant to this compensation program, each of our independent directors will be entitled to the following fees and awards:
- •
- an annual cash retainer of $50,000;
- •
- an additional annual cash retainer of $15,000 to the chairperson of the Audit Committee;
- •
- an additional annual cash retainer of $10,000 to the chairperson of the Compensation Committee;
- •
- an additional annual cash retainer of $6,000 to the chairperson of the nominating and corporate governance committee;
- •
- $1,500 for each committee or board meeting attended; and
- •
- a grant of restricted stock under the 2014 Incentive Plan in an amount equal to $100,000 per year, which will vest ratably on each of the first four anniversaries of the grant date.
Directors who are not independent directors will not receive any compensation for their services as directors.
Upon the completion of this offering and pursuant to our 2014 Incentive Plan, each of Messrs. Anicetti and Tesoriero will be granted an option to purchase 25,500 shares of our common stock, which will vest ratably on each of the first four anniversaries of the grant date.
We also reimburse each of our directors for reasonable out-of-pocket expenses incurred in connection with the performance of their duties as directors, including travel expenses in connection with their attendance in person at board of directors and committee meetings.
Director Compensation Table for Fiscal Year 2013
The following table contains information concerning the compensation of the above-referenced directors in fiscal year 2013.
Name
|
Fees Earned or Paid in Cash ($) |
Option Awards ($)(1) |
Total ($) | |||||||
|---|---|---|---|---|---|---|---|---|---|---|
Norman H. Axelrod |
35,000 | |||||||||
Robert A. Eckert(2) |
26,250 | |||||||||
Andrew A. Giancamilli |
42,500 | |||||||||
- (1)
- The amounts shown for option awards relate to stock options granted under the 2012 Incentive Plan. These amounts are based upon the grant date fair value of awards calculated in accordance with FASB ASC Topic 718. The assumptions used in determining the amounts in this column are set forth in Note 13, Share-Based Compensation, to our consolidated financial statements for fiscal year 2013. Each of Mr. Axelrod, Mr. Eckert and Mr. Giancamilli was granted 165 stock options with an exercise price of $1,000 per
130
share and 165 stock options with an exercise price of $1,500 per share. The stock option grants vest at a rate of 20% on each of March 19, 2013, 2014, 2015, 2016 and 2017.
- (2)
- Resigned from our board of directors in July 2014.
2012 Incentive Plan
We maintain the 2012 Incentive Plan, pursuant to which we may grant incentive stock options, non-qualified stock options, restricted stock and other stock-based awards to our employees, consultants and Non-Employee Directors (as defined in the 2012 Incentive Plan). We will cease granting awards under the 2012 Incentive Plan upon the implementation of the 2014 Incentive Plan described below.
Administration of the 2012 Incentive Plan
The board of directors intends to appoint the Compensation Committee to administer the 2012 Incentive Plan (we refer to our board of directors or the Compensation Committee, as applicable, as the "Administrator"). The Administrator is authorized to grant awards to eligible employees, consultants and Non-Employee Directors.
Number of Authorized Shares
Prior to giving effect to the -for-one stock split of our common stock to be effected prior to the closing of this offering, the 2012 Incentive Plan authorizes the issuance or transfer of shares of our common stock. As of , 2014, after giving effect to the -for-one stock split of our common stock to be effected prior to the closing of this offering, we had outstanding stock options to purchase an aggregate of shares of our common stock under the 2012 Incentive Plan. Upon closing of this offering, no additional shares of our common stock will be reserved for issuance under the 2012 Incentive Plan, and shares of our common stock will be reserved for issuance under the 2014 Incentive Plan.
Shares of our common stock that are subject to awards are counted against the overall limit as one share for every share granted or covered by an award. If any award is canceled, expires or terminates unexercised for any reason, the shares covered by such award are available for the grant of awards under the 2012 Incentive Plan, provided that, following this offering, such shares will be available for grant under the 2014 Incentive Plan. Shares of our common stock that are tendered to purchase shares upon exercise or satisfy withholding obligations are added back to the number of shares available for future grants.
The Administrator will, in accordance with the terms of the 2012 Incentive Plan, make appropriate adjustments to the above limits to the number and/or kind of shares or other property (including cash) underlying awards and to the purchase price of shares underlying awards, in each case, to reflect any change in our capital structure or business by reason of any stock split, reverse stock split, stock dividend, combination or reclassification of shares, any recapitalization or any other change in our capital structure.
Eligibility and Participation
All of our and our affiliates' current and prospective employees and consultants, as well as our Non-Employee Directors, were eligible to be granted non-qualified stock options, restricted stock and other stock based awards under the 2012 Incentive Plan. Only our and our subsidiaries' employees were eligible to be granted incentive stock options ("ISOs") under the 2012 Incentive Plan. Eligibility for awards under the 2012 Incentive Plan was determined by the Administrator in its sole discretion.
131
Stock Options
Nonqualified stock options are the only types of awards outstanding under the 2012 Incentive Plan. Options will be exercisable at such times and subject to such terms as are determined by the Administrator at grant. The maximum term of options granted under the 2012 Incentive Plan is ten years. Upon the exercise of an option, the participant must make payment of the full exercise price: in cash, by check, bank draft or money order; solely to the extent permitted by law, through the delivery of irrevocable instructions to a broker, reasonably acceptable to us, to promptly deliver to us an amount equal to the aggregate exercise price; or on such other terms and conditions as may be acceptable to the Administrator.
Effect of Certain Transactions; Change in Control
In the event of a change in control, as defined in the 2012 Incentive Plan, except as otherwise provided by the Administrator, unvested awards will not vest. Instead, the Administrator may, in its sole discretion, provide that outstanding awards will be: assumed and continued; purchased based on the price per share paid in the change in control transaction (less, in the case of options, the exercise price), as adjusted by the Administrator for any contingent purchase price, escrow obligations, indemnification obligations or other adjustments to the purchase price; and/or in the case of stock options where the change in control price is less than the applicable exercise price, canceled. However, the Administrator may in its sole discretion provide for the acceleration of vesting and lapse of restrictions of an award at any time including in connection with a change in control.
Term
Awards under the 2012 Incentive Plan may not be made on or after November 15, 2022, but awards granted prior to such date may extend beyond that date.
2014 Incentive Plan
In anticipation of this offering, our board of directors has adopted, and our stockholders have approved, the 2014 Incentive Plan contingent upon the effectiveness of this offering. We believe that a new omnibus incentive plan is appropriate in connection with a public offering of our common stock not only to continue to enable us to grant awards to management to reward and incentivize their performance and retention, but also to have a long-term equity plan that is appropriate for us as a publicly held company.
The material terms of the 2014 Incentive Plan are summarized below. The following summary is qualified in its entirety by reference to the complete text of the 2014 Incentive Plan, a copy of which is filed as an exhibit to the registration statement of which this prospectus forms a part.
Administration of the 2014 Incentive Plan
The board of directors has appointed the Compensation Committee to administer the 2014 Incentive Plan. The Administrator is authorized to grant awards to eligible employees, consultants and Non-Employee Directors (as defined in the 2014 Incentive Plan).
Number of Authorized Shares and Award Limits
The aggregate number of shares of our common stock that may be issued or used for reference purposes under the 2014 Incentive Plan may not exceed shares (subject to adjustment as described below). In addition, shares covered by any award under the 2012 Incentive Plan that is canceled, expires or terminates unexercised for any reason will be available for grant under the 2014 Incentive Plan.
132
Shares of our common stock that are subject to awards will be counted against the overall limit as one share for every share granted or covered by an award. If any award is canceled, expires or terminates unexercised for any reason, the shares covered by such award will again be available for the grant of awards under the 2014 Incentive Plan, except that any shares that are not issued as the result of a net settlement or that are used to pay any exercise price or tax withholding obligation will not be available for the grant of awards. Shares of our common stock that we repurchase on the open market with the proceeds of an option exercise price also will not be available for the grant of awards.
The maximum number of shares of our common stock that may be subject to any award of stock options, any restricted stock or other stock-based award denominated in shares that may be granted under the 2014 Incentive Plan during any fiscal year to each employee or consultant is 1,000,000 shares per type of award; provided that the maximum number of shares of our common stock for all types of awards during any fiscal year is 1,000,000 shares per each employee or consultant. The maximum number of shares of our common stock that may be granted pursuant to awards under the 2014 Incentive Plan during any fiscal year to any non-employee director is 100,000 shares.
The foregoing individual participant limits are cumulative; that is, to the extent shares of our common stock that may be granted to an individual in a fiscal year are not granted, the number of shares of our common stock that may be granted to such individual is increased in subsequent fiscal years.
In addition, the maximum grant date value of any other stock-based awards denominated in cash and the maximum payment under any performance-based cash award granted under the 2014 Incentive Plan payable with respect to any fiscal year to an employee or consultant is $10,000,000. However, the foregoing limits (other than the limit on the maximum number of shares of our common stock for all types of awards during any fiscal year) will not apply (i) to options, restricted stock or other stock-based awards that constitute "restricted property" under Section 83 of the Code to the extent granted during the Reliance Period (as described below) or (ii) to performance-based cash awards or other types of other stock-based awards to the extent paid or otherwise settled during the Reliance Period (as defined below).
For companies that become public in connection with an initial public offering, the deduction limit under Section 162(m) of the Code does not apply during a "reliance period" under the Treasury Regulations under Section 162(m) of the Code that may be relied upon until the earliest of: (i) the expiration of the 2014 Incentive Plan, (ii) the date the 2014 Incentive Plan is materially amended for purposes of Treasury Regulation Section 1.162-27(h)(1)(iii); (iii) the date all shares of our common stock available for issuance under the 2014 Incentive Plan have been allocated; and (iv) the date of the first annual meeting of our stockholders at which directors are to be elected that occurs after the close of the third calendar year following the calendar year in which the initial public offering occurs (such period, the "Reliance Period").
The Administrator will, in accordance with the terms of the 2014 Incentive Plan, make appropriate adjustments to the above aggregate and individual limits, to the number and/or kind of shares or other property (including cash) underlying awards and to the purchase price of shares underlying awards, in each case, to reflect any change in our capital structure or business by reason of any stock split, reverse stock split, stock dividend, combination or reclassification of shares, any recapitalization, merger, consolidation, spin off, split off, reorganization or any partial or complete liquidation, any sale or transfer of all or part of our assets or business, or any other corporate transaction or event that would be considered an "equity restructuring" within the meaning of FASB ASC Topic 718. In addition, the Administrator may take similar action with respect to other extraordinary events.
133
Eligibility and Participation
All of our and our affiliates' current and prospective employees and consultants, as well as our Non-Employee Directors, are eligible to be granted non-qualified stock options, restricted stock, performance-based cash awards and other stock-based awards under the 2014 Incentive Plan. Only our and our subsidiaries' employees are eligible to be granted ISOs under the 2014 Incentive Plan. Eligibility for awards under the 2014 Incentive Plan is determined by the Administrator in its sole discretion.
Types of Awards
Stock Options. The 2014 Incentive Plan authorizes the Administrator to grant ISOs to eligible employees and non-qualified stock options to purchase shares to employees, consultants, prospective employees, prospective consultants and Non-Employee Directors. The Administrator will determine the number of shares of our common stock subject to each option, the term of each option, the exercise price (which may not be less than the fair market value of the shares of our common stock at the time of grant, or 110 percent of fair market value in the case of ISOs granted to ten-percent stockholders), the vesting schedule and the other terms and conditions of each option. Options will be exercisable at such times and subject to such terms as are determined by the Administrator at grant. The maximum term of options under the 2014 Incentive Plan is ten years (or five years in the case of ISOs granted to ten-percent stockholders). Upon the exercise of an option, the participant must make payment of the full exercise price, either in cash or by check, bank draft or money order; solely to the extent permitted by law, through the delivery of irrevocable instructions to a broker, reasonably acceptable to us, to promptly deliver to us an amount equal to the aggregate exercise price; or on such other terms and conditions as may be acceptable to the Administrator (including, without limitation, the relinquishment of options or by payment in full or in part in the form of shares of our common stock).
Restricted Stock. The 2014 Incentive Plan authorizes the Administrator to grant restricted stock. Recipients of restricted stock enter into an agreement with us subjecting the restricted stock to transfer and other restrictions and providing the criteria or dates on which such awards vest and such restrictions lapse. The restrictions on restricted stock may lapse and the awards may vest over time, based on performance criteria or other factors (including, without limitation, performance goals that are intended to comply with the performance-based compensation exception under Section 162(m) of the Code, as discussed below), as determined by the Administrator at grant. Except as otherwise determined by the Administrator, a holder of restricted stock has all of the attendant rights of a stockholder including the right to receive dividends, if any, subject to and conditioned upon vesting and restrictions lapsing on the underlying restricted stock, the right to vote shares and, subject to and conditioned upon the vesting and restrictions lapsing for the underlying shares, the right to tender such shares. However, the Administrator may in its discretion provide at grant that the right to receive dividends on restricted stock will not be subject to the vesting or lapsing of the restrictions on the restricted stock.
Other Stock-Based Awards. The 2014 Incentive Plan authorizes the Administrator to grant awards of shares of our common stock and other awards that are valued in whole or in part by reference to, or are payable in or otherwise based on, shares of our common stock, including, but not limited to, shares of our common stock awarded purely as a bonus in lieu of cash and not subject to any restrictions or conditions; shares of our common stock in payment of the amounts due under an incentive or performance plan sponsored or maintained by us or an affiliate; stock appreciation rights; stock equivalent units; restricted stock units; performance awards entitling participants to receive a number of shares of our common stock (or cash in an equivalent value) or a fixed dollar amount, payable in cash, stock or a combination of both, with respect to a designated performance period; or awards valued by reference to book value of shares of our common stock. In general, other stock-based awards that are denominated in shares of our common stock will include the right to receive dividends, if any, subject
134
to and conditioned upon vesting and restrictions lapsing on the underlying award, but the Administrator may in its discretion provide at grant that the right to receive dividends on a stock-denominated award will not be subject to the vesting or lapsing of the restrictions on the performance award.
Certain Performance-Based Awards
As noted above, following the Reliance Period, performance-based awards granted under the 2014 Incentive Plan that are intended to satisfy the performance-based compensation exception under Section 162(m) of the Code will vest based on attainment of specified performance goals established by the Administrator. These performance goals will be based on the attainment of a certain target level of, or a specified increase in (or decrease where noted), criteria selected by the Administrator.
Such performance goals may be based upon the attainment of specified levels of company, subsidiary, division or other operational unit performance under one or more of the measures described above relative to the performance of other companies. The Administrator may designate additional business criteria on which the performance goals may be based or adjust, modify or amend those criteria, to the extent permitted by Section 162(m) of the Code. Unless the Administrator determines otherwise, to the extent permitted by Section 162(m) of the Code, the Administrator will disregard and exclude the impact of: special, unusual or non-recurring items, events, occurrences or circumstances; discontinued operations or the disposal of a business; the operations of any business that we acquire during the fiscal year or other applicable performance period; or a change in accounting standards required by generally accepted accounting principles.
Minimum Vesting
Awards to employees and consultants under the 2014 Incentive Plan after this offering will be subject to a minimum vesting period of three years (which may include installment vesting within such three-year period) or one year if the vesting is based on performance criteria other than continued service. However, the Administrator may provide for: (i) acceleration of vesting of all or a portion of an award in the event of a participant's death, disability or retirement, or upon the occurrence of a change in control; and (ii) the grant of an award without a minimum vesting period (or the acceleration of vesting of all or a portion of an award for any reason), but only with respect to awards to employees or consultants after this offering for no more than an aggregate of 10% of the total number of shares authorized for issuance under the 2014 Incentive Plan. Awards to our Non-Employee Directors are not subject to a minimum vesting period under the 2014 Incentive Plan.
Effect of Certain Transactions; Change in Control
In the event of a change in control, as defined in the 2014 Incentive Plan, except as otherwise provided by the Administrator, unvested awards will not vest. Instead, the Administrator may, in its sole discretion provide that outstanding awards will be: assumed and continued; purchased based on the price per share paid in the change in control transaction (less, in the case of options and stock appreciation rights ("SARs"), the exercise price), as adjusted by the Administrator for any contingent purchase price, escrow obligations, indemnification obligations or other adjustments to the purchase price; and/or in the case of stock options or other stock-based appreciation awards where the change in control price is less than the applicable exercise price, canceled. However, the Administrator may in its sole discretion provide for the acceleration of vesting and lapse of restrictions of an award at any time including in connection with a change in control.
135
Deferral Arrangements
The Administrator may permit or require the deferral of any payment of a restricted stock unit or performance award pursuant to a deferred compensation arrangement in a manner intended to comply with, or be exempt from, Section 409A of the Code.
Non-Transferability of Awards
Except as the Administrator may permit, at the time of grant or thereafter, awards granted under the 2014 Incentive Plan are generally not transferable by a participant other than by will or the laws of descent and distribution. Shares of our common stock acquired by a permissible transferee will continue to be subject to the terms of the 2014 Incentive Plan and the applicable award agreement.
Term
Awards under the 2014 Incentive Plan may not be made after , 2024, but awards granted prior to such date may extend beyond that date. We may seek stockholder reapproval of the performance goals in the 2014 Incentive Plan. If such stockholder approval is obtained, on or after the first stockholders' meeting in the fifth year following the year of the last stockholder approval of the performance goals in the 2014 Incentive Plan, awards under the 2014 Incentive Plan may be based on such performance goals in order to qualify for the "performance-based compensation" exception under Section 162(m) of the Code.
Amendment and Termination
Subject to the rules referred to in the balance of this paragraph, our board of directors or the Compensation Committee (to the extent permitted by law) may at any time amend, in whole or in part, any or all of the provisions of the 2014 Incentive Plan, or suspend or terminate it entirely, retroactively or otherwise. Except as required to comply with applicable law, no such amendment may substantially impair the rights of a participant with respect to awards previously granted without the consent of such participant. In addition, without the approval of stockholders, no amendment may be made that would: increase the aggregate number of shares of our common stock that may be issued under the 2014 Incentive Plan; increase the maximum individual participant share limitations for a fiscal year or year of a performance period; change the classification of individuals eligible to receive awards under the 2014 Incentive Plan; extend the maximum term of any option; reduce the exercise price of any option or SAR or cancel any outstanding "in-the-money" option or SAR in exchange for cash; substitute any option or SAR in exchange for an option or SAR (or similar other award) with a lower exercise price; alter the performance goals; or require stockholder approval in order for the 2014 Incentive Plan to continue to comply with Section 162(m) of the Code or Section 422 of the Code.
Following consummation of this offering, we intend to file a registration statement on Form S-8 under the Securities Act to register the full number of shares of our common stock that will be available for issuance under the 2014 Incentive Plan, as described in the section titled "—2014 Incentive Plan—Number of Authorized Shares and Award Limits" above.
Federal Income Tax Implications of the Incentive Plans
The federal income tax consequences arising with respect to awards granted under the Incentive Plans will depend on the type of award. From the recipients' standpoint, as a general rule, ordinary income will be recognized at the time of payment of cash, or delivery of actual shares. Future appreciation on shares held beyond the ordinary income recognition event will be taxable at capital gains rates when the shares are sold. We, as a general rule, will be entitled to a tax deduction that corresponds in time and amount to the ordinary income recognized by the recipient, and we will not be entitled to any tax deduction in respect of capital gain income recognized by the recipient. Exceptions
136
to these general rules may arise under the following circumstances: (i) if shares, when delivered, are subject to a substantial risk of forfeiture by reason of failure to satisfy any employment or performance-related condition, ordinary income taxation and our tax deduction will be delayed until the risk of forfeiture lapses (unless the recipient makes a special election to ignore the risk of forfeiture); (ii) if an employee is granted an ISO, no ordinary income will be recognized, and we will not be entitled to any tax deduction, if shares acquired upon exercise of the ISO are held longer than the later of one year from the date of exercise and two years from the date of grant; (iii) for awards granted after a specified transition period, we may not be entitled to a tax deduction for compensation attributable to awards granted to one of our named executive officers, if and to the extent such compensation does not qualify as "performance-based" compensation under Internal Revenue Code Section 162(m), and such compensation, along with any other non-performance-based compensation paid in the same calendar year, exceeds $1 million; and (iv) an award may be taxable at 20% above ordinary income tax rates at the time it becomes vested, even if that is prior to the delivery of the cash or stock in settlement of the award, if the award constitutes "deferred compensation" under Section 409A of the Code, and the requirements of Section 409A of the Code are not satisfied. The foregoing provides only a general description of the application of federal income tax laws to certain awards under the Incentive Plans, and is not intended as tax guidance to participants in the Incentive Plans, as the tax consequences may vary with the types of awards made, the identity of the recipients and the method of payment or settlement. This summary does not address the effects of other federal taxes (including possible "golden parachute" excise taxes) or taxes imposed under state, local, or foreign tax laws.
IPO Awards under the 2014 Incentive Plan
Upon the completion of this offering, we expect to grant options to purchase an aggregate of approximately shares of our common stock to certain of our eligible employees and Non-Employee Directors and approximately shares of restricted stock to certain of our eligible employees, in each case pursuant to the 2014 Incentive Plan. The actual exercise price and the number of shares of our common stock subject to such awards will be based upon the price at which the shares are sold to the public in this offering. These awards vest subject to continued employment. Such options granted to senior vice presidents and above will generally vest ratably over five years and options granted to other employees will generally vest ratably over four years.
We expect that options granted to Mr. Hirz will vest in annual installments over a five-year period at a rate of 10%/10%/20%/20%/40%, subject to acceleration as follows: (i) if Mr. Hirz's employment is terminated by the Company without Cause or by Mr. Hirz for Good Reason, an additional percentage of the remaining unvested options will accelerate and vest (such percentage equal to the number of full years Mr. Hirz is employed following the grant date divided by five); (ii) if Mr. Hirz's employment is terminated by the Company without Cause or by Mr. Hirz for Good Reason following a Change in Control, the options will accelerate and vest; and (iii) if Mr. Hirz remains employed by the Company following a Change in Control, the options will accelerate and vest (A) on the 24-month anniversary of the Change in Control if such Change in Control occurs within the 24 months following the date of grant or (B) on the 13-month anniversary of the Change in Control if such Change in Control occurs more than 24 months after the date of grant.
We expect that a portion of the options granted to Mr. Phegley will vest over a five-year period at a rate of 10%/10%/20%/20%/40%. We expect that the remainder of the options and any restricted stock granted to Mr. Phegley will vest upon the earliest of (i) May 30, 2017, (ii) a Change in Control, and (iii) the earliest day on or after May 30, 2016 on which Ares no longer beneficially owns securities representing 50% or more of the total voting power of our voting securities.
137
CERTAIN RELATIONSHIPS AND RELATED PARTY TRANSACTIONS
Term Loan Facility
Upon the closing of the Ares Acquisition, Smart & Final Stores LLC entered into the Term Loan Facility, under which various funds affiliated with Ares, our principal stockholder, are lenders. As of December 29, 2013, these affiliated funds had term loans of Smart & Final Stores LLC in the amount of $54.6 million. As of June 15, 2014, $712.2 million was outstanding under the Term Loan Facility. In addition, in fiscal year 2013, an aggregate of $2.6 million in principal and $2.5 million in interest was paid to affiliates of Ares in respect of amounts borrowed under the Term Loan Facility, and an aggregate of $19.5 million in principal and $2.0 million in interest was paid to affiliates of Ares under the Second Lien Term Loan Facility. No principal or interest was paid to any affiliate of Ares in fiscal year 2012 under the Credit Facilities. As of December 29, 2013, borrowings under the Term Loan Facility accrue interest at a weighted average rate of 4.75% per year.
Pre-IPO Stockholders Agreement
We are party to a Stockholders Agreement, dated as of November 15, 2012 (as amended, the "Pre-IPO Stockholders Agreement"), among us and each of our stockholders, including Ares and certain of our directors, executive officers and other employees. In connection with the closing of this offering, the Pre-IPO Stockholders Agreement will be replaced by a registration rights agreement (the "Registration Rights Agreement") as described below.
Registration Rights Agreement
Pursuant to the terms of the Registration Rights Agreement, all of our pre-offering stockholders, including Ares and certain or our executive officers and directors, will be entitled to various rights with respect to the registration of their shares under the Securities Act. Registration of any of these shares under the Securities Act would result in such shares becoming fully tradable without restriction under the Securities Act immediately upon the effectiveness of the registration statement, except for shares purchased by affiliates.
Demand Registration Rights
At any time following the closing of this offering and the expiration of the applicable lock-up period, subject to certain conditions and restrictions contained in the Registration Rights Agreement, Ares will be able to make an unlimited number of demands for us to register their shares of our common stock under the Securities Act.
Piggyback Registration Rights
In the event of a demand registration or if we propose to register any of our own securities under the Securities Act in a public offering, we will be required to provide notice to those holders of our common stock with registration rights under the Registration Rights Agreement and provide them with the right to include their shares in the registration statement, subject to certain conditions and exceptions contained in the Registration Rights Agreement.
Expenses
We will be required to bear the registration expenses, other than underwriting discounts and commissions and transfer taxes, associated with any registration of shares of our common stock held by the holders of our common stock with registration rights under the Registration Rights Agreement.
138
Management Services Agreements
In connection with the Ares Acquisition, on November 15, 2012, we entered into Management Services Agreements with certain affiliates of Ares Management (the "Management Services Agreements"). Each Management Services Agreement provides for reimbursement of the applicable manager's and its affiliates' out-of-pocket expenses in connection with the management services provided thereunder. To date, we have not made any reimbursements in accordance with the terms of the Management Services Agreements.
Each Management Services Agreement also provides that we will indemnify the applicable manager and its affiliates against all losses, claims, damages and liabilities arising in connection with the management and financial services provided by such manager thereunder.
Indemnification of Officers and Directors
Our certificate of incorporation and bylaws provide that we will indemnify each of our directors and officers to the fullest extent permitted by Delaware law. In addition, we expect to enter into indemnification agreements with each of our directors and executive officers. See "Description of Capital Stock—Limitations of Liability and Indemnification" below for more details.
Pre-Ares Acquisition Transactions
Apollo Management Services Agreement
In connection with the acquisition of us by affiliates of Apollo Management, L.P. ("Apollo"), we entered into a Management Services Agreement, effective May 31, 2007 (the "Apollo Agreement"), between Smart & Final Holdings Corp., our former ultimate parent company ("Former Parent"), and Apollo Management VI, L.P., an affiliate of Apollo (the "Manager"). Pursuant to the Apollo Agreement, the Manager provided certain investment banking, management, consulting and financial planning services to Former Parent, and Former Parent paid the Manager $1.4 million and $1.5 million in annual fees under the Apollo Agreement for our fiscal years 2012 and 2011, respectively. The Apollo Agreement was terminated upon consummation of the Ares Acquisition, and in connection with such termination, we paid the Manager (i) transaction and advisory fees (including reimbursement of expenses) in the aggregate amount of $10.5 million and (ii) a termination fee of $5.5 million.
Former CEO and Chairman
Pursuant to an employment agreement with George G. Golleher, our former chief executive officer and chairman of Former Parent's board of directors, Mr. Golleher received approximately $3.9 million and $2.9 million for fiscal years 2012 and 2011, respectively. The employment agreement was terminated in connection with the Ares Acquisition and, in connection with the transaction, Mr. Golleher received a change in control bonus of $1.0 million pursuant to the agreement.
Sprouts Agreement
In February 2011, Former Parent entered into an agreement with Sprouts, an affiliate of our former majority stockholder Apollo, for the sale of its interests in Henry's to Sprouts, and received total consideration of $274.6 million.
139
Policies and Procedures for Related Party Transactions
Upon the closing of this offering, we expect our board of directors to adopt a policy pursuant to which the audit committee of our board of directors will be charged with reviewing for approval or ratification all transactions with "related persons" (as defined in paragraph (a) of Item 404 Regulation S-K) that are brought to the audit committee's attention. This policy has not yet been adopted and, as a result, the transactions described under this section were not reviewed under such policies, but rather were entered into after presentation to and consideration and approval by our board of directors.
We also maintain certain compensation agreements and other arrangements with certain of our executive officers, which are described under "Executive and Director Compensation" elsewhere in this prospectus.
140
PRINCIPAL AND SELLING STOCKHOLDERS
The following table sets forth information regarding the beneficial ownership of our common stock as of , 2014 by:
- •
- each of our directors and named executive officers;
- •
- all of our directors and executive officers as a group;
- •
- each person, or group of affiliated persons, who is known by us to beneficially own more than 5% of our common stock; and
- •
- each selling stockholder.
Beneficial ownership is determined according to the rules of the SEC and generally means that a person has beneficial ownership of a security if he, she or it possesses sole or shared voting or investment power of that security, including options that are currently exercisable or exercisable within 60 days of , 2014. Shares issuable pursuant to options are deemed outstanding for computing the percentage of the person holding such options, but are not outstanding for computing the percentage of any other person. Except as indicated by the footnotes below, we believe, based on the information furnished to us, that the persons named in the table below have sole voting and investment power with respect to all shares of common stock shown that they beneficially own, subject to community property laws where applicable. The information does not necessarily indicate beneficial ownership for any other purpose.
Our calculation of the percentage of beneficial ownership is based on shares of common stock outstanding as of , 2014.
141
Unless otherwise indicated, the address of each beneficial owner listed in the table below is c/o Smart & Final Stores, Inc., 600 Citadel Dr., Commerce, California 90040.
| |
|
|
|
|
|
Shares Beneficially Owned(1) if Underwriters' Option to Purchase Additional Shares is Exercised in Full |
||||||||||||||||
|---|---|---|---|---|---|---|---|---|---|---|---|---|---|---|---|---|---|---|---|---|---|---|
| |
|
|
|
|
Maximum Number of Shares to be Sold if Underwriters' Option to Purchase Additional Shares is Exercised in Full |
|||||||||||||||||
| |
Shares Beneficially Owned(1) Before the Offering |
Shares Beneficially Owned(1) After the Offering |
||||||||||||||||||||
Name of Beneficial Owner
|
Number | Percentage | Number | Percentage | Number | Percentage | ||||||||||||||||
Named Executive Officers and Directors: |
||||||||||||||||||||||
David G. Hirz |
||||||||||||||||||||||
Richard N. Phegley |
||||||||||||||||||||||
Scott R. Drew |
||||||||||||||||||||||
Michael M. Laddon |
||||||||||||||||||||||
Martin J. Trtek |
||||||||||||||||||||||
David B. Kaplan |
||||||||||||||||||||||
Richard A. Anicetti |
||||||||||||||||||||||
Norman H. Axelrod |
||||||||||||||||||||||
Andrew A. Giancamilli |
||||||||||||||||||||||
Dennis T. Gies |
||||||||||||||||||||||
Adam L. Stein |
||||||||||||||||||||||
Joseph S. Tesoriero |
||||||||||||||||||||||
All directors and executive officers as a group (18 persons) |
||||||||||||||||||||||
5% and Selling Stockholders: |
||||||||||||||||||||||
Ares Corporate Opportunities Fund III, L.P.(2) |
||||||||||||||||||||||
Ares Corporate Opportunities Fund IV, L.P.(2) |
||||||||||||||||||||||
- (1)
- Beneficial
ownership is determined in accordance with the rules of the SEC. In computing the number of shares beneficially owned by a person and the
percentage ownership of that person, shares of our common stock subject to options or warrants held by that person that are currently exercisable or exercisable within 60 days are deemed
outstanding, but are not deemed outstanding for computing the percentage ownership of any other person. These rules generally attribute beneficial ownership of securities to persons who possess sole
or shared voting power or investment power with respect to such securities.
- (2)
- Shares
of our common stock are held directly by Ares Corporate Opportunities Fund III, L.P. ("ACOF III") and Ares Corporate Opportunities Fund IV,
L.P ("ACOF IV"). The manager of ACOF III is ACOF Operating Manager III, LLC ("ACOF Operating Manager III"), and the sole member of ACOF Operating Manager III is Ares Management LLC
("Ares Management LLC"). The manager of ACOF IV is ACOF Operating Manager IV, LLC ("ACOF Operating Manager IV"), and the sole member of ACOF Operating Manager IV is Ares Management LLC.
- The sole member of Ares Management LLC is Ares Management Holdings L.P. ("Ares Management Holdings") and the general partner of Ares Management Holdings is Ares Holdings Inc. ("Ares Holdings"), whose sole stockholder is Ares Management. The general partner of Ares Management is Ares Management GP LLC ("Ares Management GP") and the sole member of Ares Management GP is Ares Partners Holdco LLC ("Ares Partners" and, together with ACOF III, ACOF IV, ACOF Operating Manager III, ACOF Operating Manager IV, Ares Management LLC, Ares Management Holdings, Ares Holdings, Ares Management, and Ares Management GP, the "Ares Entities"). Ares Partners is managed by a board of managers, which is composed of Michael Arougheti, David Kaplan, John Kissick, Antony Ressler and Bennett Rosenthal. Decisions by Ares Partners' board of managers generally are made by a majority of the members, which majority, subject to certain conditions, must include Antony Ressler. Each of the Ares Entities (other than each of ACOF III and ACOF IV with respect to the shares held directly by it) and the members of Ares Partners' board of managers and the other directors, officers, partners, stockholders, members and managers of the Ares Entities expressly disclaims beneficial ownership of the shares of our common stock. The address of each Ares Entity is 2000 Avenue of the Stars, 12th Floor, Los Angeles, California 90067.
142
DESCRIPTION OF CERTAIN INDEBTEDNESS
The following is a summary of the material terms of the agreements and instruments that govern our material outstanding indebtedness. The following is only a summary, is not a complete description of all of the terms of such agreements and instruments and is qualified in its entirety by reference to the agreements and instruments that govern our material outstanding indebtedness, copies of which are available as set forth under "Where You Can Find More Information."
On November 15, 2012 (the "Original Closing Date"), in connection with the Ares Acquisition, Smart & Final Stores LLC, our indirect wholly owned subsidiary, entered into three financing arrangements: (i) the Term Loan Facility, (ii) the second lien term loan facility (the "Second Lien Term Loan Facility") and (iii) the Revolving Credit Facility.
The Second Lien Term Loan Facility was prepaid in full on December 19, 2013, as described below.
Term Loan Facility
Under the Term Loan Facility, (i) $525.0 million of term loans were incurred on the Original Closing Date, (ii) $55.0 million of additional term loans were incurred pursuant to an incremental facility effected through an amendment entered into on May 29, 2013 (the "First Amendment") and (iii) $140.0 of additional term loans were incurred pursuant to an incremental facility effected through an amendment entered into on December 19, 2013 (the "Second Amendment") (all such term loans, collectively, the "Term Loans"). Subject to certain conditions, we may incur additional term loans under the Term Loan Facility in an amount of up to $75.0 million (without regard to any leverage-based limitations) plus, to the extent we comply with certain leverage-based limitations, additional term loans in an unlimited amount. In each case, none of the existing lenders are obligated to provide additional term loans and any additional lenders require the consent of the administrative agent. The Term Loans have a term of seven years from the Original Closing Date with a maturity date of November 15, 2019. All obligations under the Term Loan Facility are guaranteed by SF CC Intermediate Holdings, Inc., our direct wholly owned subsidiary ("Intermediate Holdings"), and certain of its current and future domestic direct and indirect subsidiaries. In addition, the obligations under the Term Loan Facility are secured by (x) a first-priority security interest in substantially all of the property and assets of, as well as the equity interests owned by, Smart & Final Stores LLC and Intermediate Holdings and the other guarantors (other than Revolving Credit Facility Collateral (as defined below)) and (y) a second-priority security interest in the Revolving Credit Facility Collateral.
Smart & Final Stores LLC is required to make scheduled payments of principal at the end of each calendar quarter, each equal to 0.25% of the aggregate original principal amount of the Term Loans, with the balance due on the maturity date. Smart & Final Stores LLC may prepay the Term Loans, in whole or in part, at any time. Mandatory prepayments are required in the amount of (i) the net proceeds of a sale of assets, subject to the priority of the Revolving Credit Facility Collateral, (ii) the net proceeds of the incurrence of indebtedness to the extent such indebtedness is not permitted under the terms of the Term Loan Facility and (iii) a percentage of annual "excess cash flow," as adjusted by voluntary prepayments.
The Term Loans bear interest at an annual rate equal to an applicable margin plus, at Smart & Final Stores LLC's option, either (i) adjusted LIBOR (defined as a rate equal to the higher of (x) the LIBOR rate in effect for the applicable interest period, as adjusted for statutory reserves, and (y) 1.00%) or (ii) the base rate (defined as a fluctuating rate equal to the highest of (x) the federal funds effective rate plus 0.50%, (y) the rate of interest published by the Wall Street Journal as the "Prime Rate" (3.25% as of June 15, 2014) and (z) the adjusted LIBOR rate for an interest period of one month plus 1.00%). The applicable margin is 3.75% for adjusted LIBOR loans and 2.75% for base rate loans.
143
At December 29, 2013, the weighted-average interest rate on the Term Loans was 4.75%. As of June 15, 2014, the weighted-average interest rate on the outstanding Term Loans was 4.75%. As of June 15, 2014, the aggregate principal balance of the outstanding Term Loans was $712.2 million.
On May 29, 2013, we entered into the First Amendment and incurred related refinancing costs of approximately $7.5 million. The First Amendment, among other things, (i) provided $55.0 million of additional term loans as described above, (ii) decreased the applicable margin applicable to adjusted LIBOR loans from 4.50% to 3.50%, (iii) decreased the applicable margin applicable to base rate loans from 3.50% to 2.50% and (iv) reduced the LIBOR floor from 1.25% to 1.00%. The proceeds of the additional term loans extended pursuant to the First Amendment were used to prepay loans under the Second Lien Term Loan Facility, reducing the outstanding principal balance thereof to $140.0 million.
On December 19, 2013, we entered into the Second Amendment and incurred related refinancing costs of approximately $4.8 million. The Second Amendment, among other things, (i) provided $140.0 million of additional term loans as described above, (ii) increased the applicable margin applicable to adjusted LIBOR loans from 3.50% to 3.75%, (iii) increased the applicable margin applicable to base rate loans from 2.50% to 2.75%, (iv) reset the size of the incremental facilities that can be incurred without regard to leverage-based limitations from $125.0 million to $75.0 million and (v) extended the period during which a premium charged in the event of a repricing prepayment transaction is applicable to the date that is six months after the date of the Second Amendment. The proceeds of the additional term loans extended pursuant to the Second Amendment were used to prepay all outstanding loans under the Second Lien Term Loan Facility.
In connection with the First Amendment and the Second Amendment, we recognized a combined $24.4 million loss on debt extinguishment related to fees and the write-off of unamortized debt discount and deferred financing costs.
The Term Loan Facility has no financial maintenance covenants.
The Term Loan Facility includes restrictions on the ability of certain of our domestic direct and indirect subsidiaries (including Smart & Final Stores LLC and Smart & Final LLC, but not Intermediate Holdings) to incur or guarantee additional indebtedness, incur or permit to exist certain liens, enter into certain sale and lease-back transactions, make certain investments, loans and advances, effect certain mergers, consolidations, asset sales and acquisitions, pay dividends on, or redeem or repurchase, capital stock, enter into transactions with affiliates, materially change their respective businesses and repay or modify certain other agreements with respect to other material indebtedness or modify their respective organizational documents. In addition, the Term Loan Facility places certain restrictions on Intermediate Holdings with respect to the incurrence or creation of additional liens on the equity interests of certain subsidiaries, the preservation of its corporate existence and maintenance of its passive holding company status. As of June 15, 2014 and as of the date hereof, Smart & Final Stores LLC and Intermediate Holdings and the other guarantors were and are in compliance with the terms of the Term Loan Facility.
The Term Loan Facility contains events of default, including (subject to customary cure periods and materiality thresholds) defaults based on (i) the failure to make payments under the Term Loan Facility when due, (ii) breaches of covenants, (iii) inaccuracies of representations and warranties, (iv) cross-defaults to other material indebtedness, (v) bankruptcy events, (vi) material judgments, (vii) certain matters arising under ERISA, (viii) the actual or asserted invalidity of documents relating to any guarantee or security document, (ix) the actual or asserted invalidity of any subordination terms supporting the Term Loan Facility and (x) the occurrence of a change in control. If any such event of default occurs, the lenders would be entitled to accelerate the Term Loan Facility and take various other actions, including all actions permitted to be taken by a collateralized creditor. If certain bankruptcy events occur, the Term Loan Facility will automatically accelerate.
144
Revolving Credit Facility
The Revolving Credit Facility provides for up to $150.0 million of borrowings (including up to $50.0 million for the issuance of letters of credit), subject to certain borrowing base limitations. Subject to certain conditions, we may increase the commitments under the Revolving Credit Facility by up to $100.0 million. The Revolving Credit Facility has a term of five years with a maturity date of November 15, 2017. All obligations under the Revolving Credit Facility are guaranteed by Intermediate Holdings and certain of Intermediate Holdings' current and future domestic direct and indirect subsidiaries. In addition, the obligations under the Revolving Credit Facility are secured by (i) a first-priority security interest in the accounts receivable, inventory, cash and cash equivalents, and related assets, of Smart & Final Stores LLC and Intermediate Holdings and the other guarantors (the "Revolving Credit Facility Collateral") and (ii) a second-priority security interest in substantially all of the other property and assets of, as well as the equity interests owned by, Smart & Final Stores LLC and Intermediate Holdings and the other guarantors.
Borrowings under the Revolving Credit Facility bear interest at an annual rate equal to the applicable margin plus, at Smart & Final Stores LLC's option, either (i) adjusted LIBOR (defined as a rate equal to the LIBOR rate in effect for the applicable interest period, as adjusted for statutory reserves) or (ii) the alternate base rate (defined as a fluctuating rate equal to the highest of (x) the federal funds effective rate plus 0.50%, (y) the interest rate announced by the administrative agent as its "Prime Rate" (3.25% as of June 15, 2014), and (z) the adjusted LIBOR rate for an interest period of one month plus 1.00%). The applicable margin is determined by a pricing grid based on the availability of the facility and ranges from 1.25% to 1.75%, in the case of adjusted LIBOR loans, and 0.25% to 0.75%, in the case of alternate base rate loans. At June 15, 2014, the applicable margin was 1.25%, in the case of adjusted LIBOR loans, and 0.25%, in the case of alternate base rate loans.
In addition to paying interest on the outstanding principal balance of the loans under the Revolving Credit Facility and customary letter of credit fees, we were required to pay a commitment fee to the lenders under the Revolving Credit Facility on unused commitments. The commitment fee is determined by a pricing grid based on usage of the Revolving Credit Facility commitments, and ranges from 0.25% to 0.375%. For the twelve week period ended June 15, 2014, the applicable commitment fee was 0.375%.
As of June 15, 2014, we had no outstanding borrowings under the Revolving Credit Facility and outstanding letters of credit were $26.6 million. After giving effect to such letters of credit, we had $123.4 million of availability under the Revolving Credit Facility as of June 15, 2014.
The Revolving Credit Facility includes a "springing" financial maintenance covenant, applicable when a covenant trigger event (as described below) has occurred and is continuing. If such a covenant trigger event has occurred and is continuing, Smart & Final Stores LLC is required to maintain a fixed charge coverage ratio of not less than 1.0 to 1.0. A covenant trigger event shall have occurred any time that availability under the Revolving Credit Facility is less than the greater of (i) $12.5 million and (ii) 10.0% of the line cap (the lesser of the aggregate commitments under the Revolving Credit Facility and the borrowing base then in effect) (the "Trigger Threshold"). Once commenced, a covenant trigger event shall be deemed to continue until such time as availability equals or exceeds the Trigger Threshold for 20 consecutive days. As of June 15, 2014, no trigger event has occurred.
The Revolving Credit Facility includes restrictions on the ability of certain of our current and future domestic direct and indirect subsidiaries (including Smart & Final Stores LLC and Smart & Final LLC, but not Intermediate Holdings) to incur or guarantee additional indebtedness, incur or permit to exist certain liens, enter into certain sale and lease-back transactions, make certain investments, loans and advances, effect certain mergers, consolidations, asset sales and acquisitions, pay dividends on, or redeem or repurchase, capital stock, enter into transactions with affiliates, materially change their respective businesses and repay or modify certain other agreements with respect to other
145
material indebtedness or modify their respective organizational documents. In addition, the Revolving Credit Facility places certain restrictions on Intermediate Holdings with respect to the incurrence or creation of additional liens on the equity interests of certain subsidiaries, the preservation of its corporate existence and maintenance of its passive holding company status. As of June 15, 2014 and as of the date hereof, Smart & Final Stores LLC and Intermediate Holdings and the other guarantors were and are in compliance with the terms of the Revolving Credit Facility.
The Revolving Credit Facility contains events of default, including (subject to customary cure periods and materiality thresholds) defaults based on (i) the failure to make payments under the Revolving Credit Facility when due, (ii) breaches of covenants, (iii) inaccuracies of representations and warranties, (iv) cross-defaults to other material indebtedness, (v) bankruptcy events, (vi) material judgments, (vii) certain matters arising under ERISA, (viii) the actual or asserted invalidity of documents relating to any guarantee or security document, (ix) the actual or asserted invalidity of any subordination terms supporting the Revolving Credit Facility and (x) the occurrence of a change in control. If any such event of default occurs, the lenders would be entitled to accelerate the Revolving Credit Facility and take various other actions, including all actions permitted to be taken by a collateralized creditor. If certain bankruptcy events occur, the Revolving Credit Facility will automatically accelerate.
146
General
As of the closing of this offering, our authorized capital stock will consist of shares of common stock, par value $0.001 per share, and shares of undesignated preferred stock, par value $0.001 par value per share. The following description summarizes the material terms of our capital stock. Because it is only a summary, it does not contain all the information that may be important to you. For a complete description, you should refer to our certificate of incorporation and bylaws, which will become effective prior to the closing of this offering and are included as exhibits to the registration statement of which this prospectus forms a part, and to the provisions of applicable Delaware law. The descriptions of our common stock and preferred stock below reflect changes to our capital structure that will be in effect prior to the closing of this offering.
Common Stock
As of , 2014, after giving effect to the -for-one stock split of our common stock to be effected prior to the closing of this offering, there were shares of our common stock outstanding, held by stockholders of record, and no shares of our preferred stock outstanding. Immediately after the closing of this offering, there will be shares of our common stock outstanding, or shares if the underwriters' option to purchase additional shares from the selling stockholders is exercised in full.
Dividend Rights
Subject to preferences that may apply to shares of preferred stock outstanding at the time, the holders of outstanding shares of our common stock are entitled to receive dividends out of funds legally available at the times and in the amounts that our board of directors may determine from time to time.
Voting Rights
Each holder of our common stock is entitled to one vote for each share of common stock held on all matters submitted to a vote of stockholders. Our stockholders do not have cumulative voting rights at elections of directors.
Preemptive or Similar Rights
Our common stock is not entitled to preemptive rights and is not subject to conversion or redemption. The rights of the holders of our common stock are subject to, and may be adversely affected by, the rights of the holders of shares of any series of our preferred stock that our board of directors may designate and issue in the future.
Liquidation Rights
Upon our liquidation, dissolution or winding-up, the assets legally available for distribution to our stockholders would be distributable ratably among the holders of our common stock and any participating preferred stock outstanding at that time after payment of liquidation preferences, if any, on any outstanding shares of preferred stock and payment of claims of creditors.
Options
As of , 2014, after giving effect to the -for-one stock split of our common stock to be effected prior to the closing of this offering, we had outstanding stock options to purchase an aggregate of shares of our common stock under the 2012 Incentive Plan. Upon the closing of this offering, no additional shares of our common stock will be reserved for issuance under the 2012
147
Incentive Plan, and shares of our common stock will be reserved for issuance under the 2014 Incentive Plan. Upon the completion of this offering, we expect to grant options to purchase an aggregate of approximately shares of our common stock to certain of our eligible employees and Non-Employee Directors, and approximately shares of restricted stock to certain of our eligible employees, in each case pursuant to the 2014 Incentive Plan. See "Executive and Director Compensation—Equity-Based Compensation," "Compensation of our Named Executive Officers—IPO Awards under the 2014 Incentive Plan" and "Shares Eligible for Future Sale."
Preferred Stock
As of , 2014, there were no shares of preferred stock outstanding. Upon the closing of this offering, we will have no shares of preferred stock outstanding.
Our board of directors is authorized to issue up to shares of our preferred stock in one or more series, to establish from time to time the number of shares to be included in each series, to fix the designation, powers, preferences and rights of the shares of each series and any qualifications, limitations or restrictions thereof, in each case without further action by our stockholders. Subject to the terms of any series of preferred stock so designated, our board of directors is also authorized to increase or decrease the number of shares of any series of preferred stock, but not below the number of shares of that series then outstanding. Our board of directors may authorize the issuance of preferred stock with voting or conversion or other rights that could adversely affect the voting power or other rights of the holders of the common stock. The issuance of preferred stock, while providing flexibility in connection with possible acquisitions and other corporate purposes, could, among other things, have the effect of delaying, deferring or preventing a change in our control and could adversely affect the market price of our common stock and the voting and other rights of the holders of our common stock. We have no current plan to issue any shares of preferred stock in the foreseeable future.
Registration Rights
Pursuant to the terms of the Registration Rights Agreement, the holders of shares of our common stock, or their transferees, are entitled to various rights with respect to the registration of their shares under the Securities Act. For a more detailed description of the Registration Rights Agreement, see "Certain Relationships and Related Party Transactions—Registration Rights Agreement."
Exclusive Venue
Our certificate of incorporation requires, to the fullest extent permitted by law, unless otherwise consented to by us, that (i) any derivative action or proceeding brought on our behalf, (ii) any action asserting a claim of breach of a fiduciary duty owed by any of our directors, officers or other employees to us or our stockholders, (iii) any action asserting a claim arising pursuant to any provision of the DGCL or our certificate of incorporation or the bylaws or (iv) any action asserting a claim governed by the internal affairs doctrine will have to be brought only in the Court of Chancery in the State of Delaware. Although we believe this provision benefits us by providing increased consistency in the application of Delaware law in the types of lawsuits to which it applies and by avoiding the time and expense of multi-forum litigation, the provision may have the effect of discouraging lawsuits against our directors and officers.
Attorneys' Fees in Stockholder Actions
Our certificate of incorporation includes a requirement that, to the fullest extent permitted by law, a stockholder reimburse us for all fees, costs and expenses incurred by us in connection with a proceeding initiated by such stockholder in which such stockholder does not obtain a judgment on the
148
merits that substantially achieves the full remedy sought. This provision may have the effect of discouraging lawsuits against us or our directors and officers.
Anti-Takeover Effects of Our Certificate of Incorporation and Bylaws
We are governed by the DGCL. Our certificate of incorporation and bylaws contain certain provisions that could have the effect of delaying, deterring or preventing another party from acquiring control of us. These provisions, which are summarized below, may discourage coercive takeover practices and inadequate takeover bids. These provisions are also designed, in part, to encourage persons seeking to acquire control of us to negotiate first with our board of directors. We believe that the benefits of increased protection of our potential ability to negotiate more favorable terms with an unfriendly or unsolicited acquirer outweigh the disadvantages of potentially discouraging a proposal to acquire us.
Undesignated Preferred Stock
As discussed above, our board of directors has the ability to issue preferred stock with voting or other rights or preferences that could impede the success of any attempt to acquire control of us. These and other provisions may have the effect of deterring hostile takeovers or delaying changes in control or management of us.
Limits on Ability of Stockholders to Act by Written Consent or Call a Special Meeting
Our certificate of incorporation provides that, from and after the Trigger Date, our stockholders may not act by written consent, which may lengthen the amount of time required to take stockholder actions. As a result, following the Trigger Date, a holder controlling a majority of our capital stock would not be able to amend our bylaws or remove directors without holding a meeting of our stockholders called in accordance with our bylaws. In addition, our certificate of incorporation provides that special meetings of the stockholders may be called only by the chairperson of our board, our chief executive officer or our board of directors. Stockholders may not call a special meeting of stockholders, which may delay the ability of our stockholders to force consideration of a proposal or for holders controlling a majority of our capital stock to take any action, including the removal of directors.
Requirements for Advance Notification of Stockholder Nominations and Proposals
Our bylaws establish advance notice procedures with respect to stockholder proposals and stockholder nomination of candidates for election as directors. These provisions may have the effect of precluding the conduct of certain business at a meeting if the proper procedures are not followed. These provisions may also discourage or deter a potential acquirer from conducting a solicitation of proxies to elect the acquirer's own slate of directors or otherwise attempting to obtain control of us.
Board Classification
Our board of directors is divided into three classes, one class of which is elected each year by our stockholders. The directors in each class will serve for a three-year term. For more information on the classified board, see "Management—Board Composition." The classification of our board of directors and the limitations on the ability of our stockholders to remove directors without cause following the Trigger Date could make it more difficult for a third party to acquire, or discourage a third party from seeking to acquire, control of us.
Removal of Directors; Vacancies
From and after the Trigger Date, directors may only be removed for cause by the affirmative vote of at least two-thirds of the voting power of our outstanding stock. Prior to the Trigger Date, directors
149
may be removed with or without cause by the affirmative vote of at least a majority of the voting power of our outstanding stock.
No Cumulative Voting
Our certificate of incorporation does not permit cumulative voting at elections of directors. Cumulative voting entitles a stockholder to as many votes as equals the number of votes which such holder would be entitled to cast for the election of directors multiplied by the number of directors to be elected and allows a stockholder to cast a portion or all of the stockholder's votes for one or more candidates for seats on the board of directors. Without cumulative voting, a minority stockholder may not be able to gain as many seats on our board of directors as the stockholder would be able to gain if cumulative voting were permitted. The absence of cumulative voting makes it more difficult for a minority stockholder to gain a seat on our board of directors to influence our board of directors' decision regarding a takeover or otherwise.
Amendment of Charter and Bylaw Provisions
The amendment of certain of the provisions of our certificate of incorporation described above requires approval by holders of at least two-thirds of the voting power of our outstanding stock. Our certificate of incorporation provides that our board of directors may from time to time adopt, amend, alter or repeal our bylaws without stockholder approval and that the stockholders may adopt, amend, alter or repeal our bylaws by the affirmative vote of two-thirds of the voting power of our outstanding stock.
Delaware Anti-Takeover Statute
Our certificate of incorporation provides that, until Ares and its affiliates cease to beneficially own shares of capital stock representing at least 15% of the voting power of our outstanding stock, we are not governed by Section 203 of the DGCL, which, in the absence of such provision, would have imposed certain additional requirements in connection with mergers and other business combinations involving "interested stockholders" (as defined in Section 203 of the DGCL).
Corporate Opportunity
Our certificate of incorporation provides that no officer or director of ours who is also an officer or director of Ares or its affiliates will be liable to us or our stockholders for breach of any fiduciary duty by reason of the fact that any such individual directs a corporate opportunity to Ares instead of us, or does not communicate information regarding a corporate opportunity to us that the officer or director has directed to Ares other than corporate opportunities offered to such officers or directors solely in their capacity as an officer or director of us.
The provisions of our certificate of incorporation and bylaws could have the effect of discouraging others from attempting hostile takeovers and, as a consequence, might also inhibit temporary fluctuations in the market price of our common stock that often result from actual or rumored hostile takeover attempts. These provisions might also have the effect of preventing changes in our management. It is possible that these provisions could make it more difficult to accomplish transactions that stockholders might otherwise deem to be in their best interests.
Limitations of Liability and Indemnification and Advancement
Our certificate of incorporation provides that, to the fullest extent permitted by Delaware law, our directors shall not be personally liable for monetary damages for breaches of fiduciary duties as a director except for:
- •
- any breach of the director's duty of loyalty to us or to our stockholders;
150
- •
- acts or omissions not in good faith or that involve intentional misconduct or a knowing violation of law;
- •
- unlawful payment of dividends or unlawful stock repurchases or redemptions; and
- •
- any transaction from which the director derived an improper personal benefit.
If Delaware law is amended to authorize corporate action further eliminating or limiting the personal liability of a director, then the liability of our directors will be eliminated or limited to the fullest extent permitted by Delaware law, as so amended. Our certificate of incorporation does not eliminate a director's duty of care and, in appropriate circumstances, equitable remedies, such as injunctive or other forms of non-monetary relief, remain available under Delaware law. This provision also does not affect a director's responsibilities under any other laws, such as the federal securities laws or other state or federal laws. Our certificate of incorporation provides that we will indemnify and advance expenses to our directors and officers, and may indemnify and advance expenses to our employees and other agents, to the fullest extent permitted by Delaware law. We are also empowered to purchase insurance on behalf of any person whom we are required or permitted to indemnify.
In addition to the indemnification and advancement of expenses required in our certificate of incorporation and bylaws, we intend to enter into indemnification agreements with each of our current directors and executive officers. These agreements will provide for the indemnification of, and advancement of expenses to, such persons for all reasonable expenses and liabilities, including attorneys' fees, judgments, fines and settlement amounts, incurred in connection with any action or proceeding brought against them by reason of the fact that they are or were serving in such capacity. We believe that these charter and bylaw provisions and indemnification agreements are necessary to attract and retain qualified persons as directors and officers. We also maintain directors' and officers' liability insurance.
The limitation of liability and indemnification and advancement provisions in our certificate of incorporation and bylaws may discourage stockholders from bringing a lawsuit against directors for breach of their fiduciary duties. They may also reduce the likelihood of derivative litigation against directors and officers, even though an action, if successful, might benefit us and our stockholders. A stockholder's investment may be harmed to the extent we pay the costs of settlement and damage awards against directors and officers pursuant to these indemnification provisions. Insofar as indemnification for liabilities arising under the Securities Act may be permitted to our directors, officers and controlling persons pursuant to the foregoing provisions, or otherwise, we have been advised that, in the opinion of the SEC, such indemnification is against public policy as expressed in the Securities Act, and is, therefore, unenforceable. There is no pending litigation or proceeding naming any of our directors or officers as to which indemnification is being sought, nor are we aware of any pending or threatened litigation that may result in claims for indemnification or advancement by any director or officer.
Listing
We intend to apply to list our common stock on the NYSE under the symbol "SFS."
Transfer Agent and Registrar
The transfer agent and registrar for our common stock will be Wells Fargo Bank, N.A.
151
SHARES ELIGIBLE FOR FUTURE SALE
Prior to this offering, there has been no public market for our capital stock. Future sales of our common stock in the public market, or the availability of such shares for sale in the public market, could adversely affect market prices prevailing from time to time. As described below, only a limited number of shares will be available for sale shortly after this offering due to contractual and legal restrictions on resale. Nevertheless, sales of our common stock in the public market after such restrictions lapse, or the perception that those sales may occur, could adversely affect the prevailing market price at such time and our ability to raise equity capital in the future.
Based on the number of shares outstanding as of , 2014, after giving effect to the -for-one stock split of our common stock to be effected prior to the closing of this offering, upon the closing of this offering, shares of common stock will be outstanding, assuming no exercise of the underwriters' option to purchase additional shares from the selling stockholders and assuming no exercise of outstanding options prior to the closing of this offering. In addition, as of the closing of this offering, there will be outstanding options to acquire shares of common stock under the Incentive Plans. Of the outstanding shares, all of the shares sold in this offering will be freely tradable, except that any shares held by our affiliates, as that term is defined in Rule 144, may only be sold in compliance with the limitations described below.
The remaining shares of our common stock outstanding after this offering are restricted securities, as such term is defined in Rule 144, or are subject to lock-up agreements with the underwriters of this offering, as described below. Following the expiration of the lock-up period pursuant to any such lock-up agreements, restricted securities may be sold in the public market only if registered or if they qualify for an exemption from registration under Rule 144 or Rule 701 promulgated under the Securities Act, described in greater detail below.
Rule 144
In general, a person who has beneficially owned restricted shares of our common stock for at least six months would be entitled to sell their securities provided that (i) such person is not deemed to have been one of our affiliates at the time of, or at any time during the 90 days preceding, a sale and (ii) we are subject to the Exchange Act periodic reporting requirements for at least 90 days before the sale. Persons who have beneficially owned restricted shares of our common stock for at least six months but who are our affiliates at the time of, or any time during the 90 days preceding, a sale, would be subject to additional restrictions, by which such person would be entitled to sell within any three-month period only a number of securities that does not exceed the greater of either of the following:
- •
- 1% of the number of shares of our common stock outstanding at the time of such sale, which will equal
shares as of the closing of this offering (assuming no exercise of the underwriters' option to purchase additional shares from the selling stockholders); or
- •
- the average weekly trading volume of our common stock on the NYSE during the four calendar weeks preceding the filing of a notice on Form 144 with respect to the sale;
provided, in each case, that we are subject to the Exchange Act periodic reporting requirements for at least 90 days before the sale. Such sales both by affiliates and by non-affiliates must also comply with the manner of sale, current public information, and notice provisions of Rule 144.
Notwithstanding the availability of Rule 144, the holders of substantially all of our restricted shares, including the selling stockholders, will have entered into lock-up agreements and their restricted shares will become eligible for sale only following expiration of the restrictions set forth in those agreements.
152
Rule 701
Rule 701 under the Securities Act, as in effect on the date of this prospectus, permits resales of shares in reliance upon Rule 144 but without compliance with certain restrictions of Rule 144, including the holding period requirement. Most of our employees, executive officers, directors, or consultants who purchased shares under a written compensatory plan or contract may be entitled to rely on the resale provisions of Rule 701, but all holders of Rule 701 shares are required to wait until 90 days after the date of this prospectus before selling their shares. However, substantially all Rule 701 shares are subject to lock-up agreements as described below and under "Underwriting (Conflicts of Interest)," and will become eligible for sale only following expiration of those agreements.
Lock-Up Agreements
We, each of our directors and executive officers and substantially all stockholders, including the selling stockholders, will agree that, without the prior written consent of Credit Suisse Securities (USA) LLC and Morgan Stanley & Co. LLC, we and they will not (subject to certain exceptions), during the period ending 180 days after the date of this prospectus (subject to certain extensions):
- •
- offer, pledge, sell, contract to sell, sell any option or contract to purchase, purchase any option or contract to sell,
grant any option, right or warrant to purchase, lend, or otherwise transfer or dispose of, directly or indirectly, any shares of common stock or any other securities convertible into or exercisable or
exchangeable for common stock; or
- •
- enter into any swap or other arrangement that transfers to another, in whole or in part, any of the economic consequences of ownership of the common stock;
whether any transaction described above is to be settled by delivery of shares of our common stock or such other securities, in cash or otherwise. In addition, participants in the directed share program described under "Underwriting (Conflicts of Interest)—Directed Share Program" will be subject to similar restrictions during the 180-day period beginning on the date of this prospectus, except with the prior written consent of Credit Suisse Securities (USA) LLC and Morgan Stanley & Co. LLC. For additional information, see "Underwriting (Conflicts of Interest)."
Registration Rights under the Registration Rights Agreement
Pursuant to the terms of the Registration Rights Agreement, all of our pre-offering stockholders, including Ares and certain of our executive officers and directors, will be entitled to various rights with respect to the registration of their shares under the Securities Act. Registration of these any of these shares under the Securities Act would result in such shares becoming fully tradable without restriction under the Securities Act immediately upon the effectiveness of the registration statement, except for shares purchased by affiliates.
Demand Registration Rights
At any time following the closing of this offering and the expiration of the applicable lock-up period, subject to certain conditions and restrictions contained in the Registration Rights Agreement, Ares will be able to require us to register their common stock under the Securities Act.
Piggyback Registration Rights
In the event of a demand registration or if we propose to register any of our own securities under the Securities Act in a public offering, we will be required to provide notice to the holders of our common stock with registration rights under the Registration Rights Agreement and provide them with the right to include their shares in the registration statement, subject to certain conditions and exceptions contained in the Registration Rights Agreement.
153
Expenses
We will be required to bear the registration expenses, other than underwriting discounts and commissions and transfer taxes, associated with any registration of shares of our common stock held by the holders of our common stock with registration rights under the Registration Rights Agreement.
Incentive Plans
As soon as practicable after the closing of this offering, we intend to file a Form S-8 registration statement under the Securities Act to register shares of our common stock issued or reserved for issuance under the Incentive Plans. The Form S-8 registration statement will become effective immediately upon filing, and shares covered by that registration statement will thereupon be eligible for sale in the public markets, subject to vesting restrictions, the lock-up agreements described above, and Rule 144 limitations applicable to affiliates. For a more complete discussion of our equity compensation plans, see "Executive and Director Compensation—Equity-Based Compensation."
154
MATERIAL U.S. FEDERAL INCOME TAX CONSIDERATIONS FOR NON-U.S. HOLDERS OF COMMON STOCK
The following discussion is a summary of the material U.S. federal income tax consequences to non-U.S. holders (as defined below) of the purchase, ownership and disposition of our common stock issued pursuant to this offering. This discussion is not a complete analysis of all potential U.S. federal income tax consequences relevant to a non-U.S. holder's particular circumstances and does not address any tax consequences arising under (i) any state, local or foreign tax laws, (ii) Section 1411 of the Code, which generally imposes a Medicare contribution tax on net investment income or (iii) any other U.S. federal tax laws, including estate or gift tax laws. This discussion is based on the Code, U.S. Treasury Regulations promulgated thereunder, judicial decisions, and published rulings and administrative pronouncements of the U.S. Internal Revenue Service ("IRS") in effect as of the date of this prospectus. These authorities may change or be subject to differing interpretations. Any such change may be applied retroactively in a manner that could adversely affect a non-U.S. holder. We have not sought and will not seek any rulings from the IRS regarding the matters discussed below. There can be no assurance the IRS or a court will not take a contrary position regarding the tax consequences of the purchase, ownership and disposition of our common stock.
This discussion is limited to non-U.S. holders that hold our common stock as a "capital asset" within the meaning of Section 1221 of the Code (generally, property held for investment). This discussion does not address consequences relevant to non-U.S. holders subject to particular rules, including, without limitation:
- •
- U.S. expatriates and certain former citizens or long-term residents of the United States;
- •
- persons subject to the alternative minimum tax;
- •
- persons holding our common stock as part of a hedge, straddle or other risk reduction strategy or as part of a conversion
transaction or other integrated investment;
- •
- banks, insurance companies or other financial institutions;
- •
- real estate investment trusts or regulated investment companies;
- •
- brokers, dealers or traders in securities;
- •
- "controlled foreign corporations," "passive foreign investment companies" or corporations that accumulate earnings to
avoid U.S. federal income tax;
- •
- partnerships or other entities or arrangements treated as partnerships for U.S. federal income tax purposes (and investors
therein);
- •
- tax-exempt organizations or governmental organizations;
- •
- persons deemed to sell our common stock under the constructive sale provisions of the Code;
- •
- persons who hold or receive our common stock pursuant to the exercise of any employee stock option or otherwise as
compensation; and
- •
- tax-qualified retirement plans.
In addition, this discussion does not address the tax treatment of partnerships or persons who hold their common stock through partnerships or other entities that are transparent for U.S. federal income tax purposes. Partners in a partnership or other transparent entity that will hold our common stock should consult their own tax advisors regarding the U.S. federal income tax consequences of the ownership and disposition of our common stock through a partnership or other transparent entity, as applicable.
155
THIS DISCUSSION IS FOR INFORMATION PURPOSES ONLY AND IS NOT INTENDED AS TAX ADVICE. INVESTORS SHOULD CONSULT THEIR OWN TAX ADVISORS WITH RESPECT TO THE APPLICATION OF THE U.S. FEDERAL INCOME TAX LAWS TO THEIR PARTICULAR SITUATIONS AS WELL AS ANY TAX CONSEQUENCES OF THE PURCHASE, OWNERSHIP AND DISPOSITION OF OUR COMMON STOCK ARISING UNDER THE U.S. FEDERAL ESTATE OR GIFT TAX LAWS OR UNDER THE LAWS OF ANY STATE, LOCAL OR NON-U.S. TAXING JURISDICTION OR UNDER ANY APPLICABLE INCOME TAX TREATY.
Definition of a non-U.S. holder
For purposes of this discussion, a "non-U.S. holder" is any beneficial owner of our common stock that is neither a "U.S. person" nor a partnership for U.S. federal income tax purposes. A U.S. person is any of the following:
- •
- an individual who is a citizen or resident of the United States;
- •
- a corporation (or other entity treated as a corporation for U.S. federal income tax purposes) created or organized under
the laws of the United States, any state thereof, or the District of Columbia;
- •
- an estate, the income of which is subject to U.S. federal income tax regardless of its source; or
- •
- a trust if (1) a court within the United States is able to exercise primary supervision over the administration of the trust and one or more United States persons (within the meaning of Section 7701(a)(30) of the Code) have the authority to control all substantial decisions of the trust, or (2) it has made a valid election under applicable U.S. Treasury Regulations to continue to be treated as a United States person.
Distributions
As described in the section entitled "Dividend Policy," we do not anticipate declaring or paying dividends to holders of our common stock in the foreseeable future. However, if we pay distributions on our common stock, those distributions generally will constitute dividends for U.S. federal income tax purposes to the extent paid from our current or accumulated earnings and profits, as determined under U.S. federal income tax principles. If a distribution exceeds our current and accumulated earnings and profits, the excess will be treated as a tax-free return of the non-U.S. holder's investment, up to such holder's adjusted tax basis in the common stock. Any excess will be treated as capital gain and will be treated as described under the heading "—Gain on sale or other disposition of shares of our common stock" below.
Subject to the discussion below on backup withholding and foreign accounts, dividends paid to a non-U.S. holder of our common stock that are not effectively connected with the non-U.S. holder's conduct of a trade or business within the United States will generally be subject to withholding of U.S. federal income tax at a rate of 30% of the gross amount of the dividends. Non-U.S. holders may be entitled to a reduction in or an exemption from withholding on dividends as a result of either (a) an applicable income tax treaty or (b) the non-U.S. holder holding our common stock in connection with the conduct of a trade or business within the United States and dividends being paid in connection with that trade or business. To claim such a reduction in or exemption from withholding, the non-U.S. holder must provide the applicable withholding agent with a properly executed (a) IRS Form W-8BEN or W-8BEN-E, as applicable, claiming an exemption from or reduction of the withholding tax under the benefit of an income tax treaty between the United States and the country in which the non-U.S. holder resides or is established, or (b) IRS Form W-8ECI stating that the dividends are not subject to withholding because they are effectively connected with the conduct by the non-U.S. holder of a trade or business within the United States, as may be applicable. These certifications must be provided to the
156
applicable withholding agent prior to the payment of dividends and must be updated periodically. Non-U.S. holders that do not timely provide the applicable withholding agent with the required certification, but that qualify for a reduced rate under an applicable income tax treaty, may obtain a refund of any excess amounts withheld by timely filing an appropriate claim for refund with the IRS.
Subject to the discussion below on backup withholding and foreign accounts, if dividends paid to a non-U.S. holder are effectively connected with the non-U.S. holder's conduct of a trade or business within the United States (and, if required by an applicable income tax treaty, the non-U.S. holder maintains a permanent establishment in the United States to which such dividends are attributable), then, although exempt from withholding of U.S. federal income tax (provided the non-U.S. holder provides appropriate certification, as described above), the non-U.S. holder will be subject to U.S. federal income tax on such dividends on a net income basis at the regular graduated U.S. federal income tax rates. In addition, a non-U.S. holder that is a corporation may also be subject to a branch profits tax at a rate of 30% (or such lower rate specified by an applicable income tax treaty) of its effectively connected earnings and profits for the taxable year that are attributable to such dividends, as adjusted for certain items. Non-U.S. holders should consult their tax advisors regarding their entitlement to benefits under any applicable income tax treaty.
Gain on sale or other disposition of shares of our common stock
Subject to the discussions below on backup withholding and foreign accounts, a non-U.S. holder will not be subject to U.S. federal income tax on any gain realized upon the sale or other taxable disposition of our common stock unless:
- •
- the gain is effectively connected with the non-U.S. holder's conduct of a trade or business within the United States (and,
if required by an applicable income tax treaty, the non-U.S. holder maintains a permanent establishment in the United States to which such gain is attributable);
- •
- the non-U.S. holder is a nonresident alien individual present in the United States for 183 days or more during the
taxable year of the disposition and certain other requirements are met; or
- •
- our common stock constitutes a U.S. real property interest ("USRPI") by reason of our status as a U.S. real property holding corporation (a "USRPHC") for U.S. federal income tax purposes.
Gain described in the first bullet point above will generally be subject to U.S. federal income tax on a net income basis at the regular graduated U.S. federal income tax rates. A non-U.S. holder that is a foreign corporation also may be subject to a branch profits tax at a rate of 30% (or such lower rate specified by an applicable income tax treaty) on its effectively connected earnings and profits for the taxable year that are attributable to such gain, as adjusted for certain items.
A non-U.S. holder described in the second bullet point above will be subject to U.S. federal income tax at a rate of 30% (or such lower rate specified by an applicable income tax treaty) on any gain realized on the disposition, which may be offset by certain U.S. source capital losses of the non-U.S. holder (even though the individual is not considered a resident of the United States). With respect to the third bullet point above, we believe we are not currently and do not anticipate becoming a USRPHC. Because the determination of whether we are a USRPHC depends on the fair market value of our USRPIs relative to the fair market value of our other business assets and our non-U.S. real property interests, however, there can be no assurance we are not a USRPHC or will not become one in the future. Even if we are or were to become a USRPHC, gain arising from the sale or other taxable disposition by a non-U.S. holder of our common stock will not be subject to U.S. federal income tax if such class of stock is "regularly traded," as defined by applicable U.S. Treasury Regulations, on an established securities market, and such non-U.S. holder owned, actually or constructively, 5% or less of such class of our stock throughout the shorter of the five-year period
157
ending on the date of the sale or other disposition or the non-U.S. holder's holding period for such stock.
Non-U.S. holders should consult their tax advisors regarding potentially applicable income tax treaties that may provide for different rules.
Backup withholding and information reporting
A non-U.S. holder will not be subject to backup withholding with respect to payments of dividends on our common stock we make to the non-U.S. holder, provided the holder certifies under penalty of perjury its non-U.S. status, such as by providing a valid IRS Form W-8BEN, W-8BEN-E or W-8ECI, or other applicable form, or such owner otherwise establishes an exemption. However, information returns will be filed with the IRS in connection with any dividends on our common stock paid to the non-U.S. holder, regardless of whether any tax was actually withheld. Copies of these information returns may also be made available under the provisions of a specific treaty or agreement to the tax authorities of the country in which the non-U.S. holder resides or is established.
Information reporting and backup withholding may apply to the proceeds of a sale of our common stock within the United States, and information reporting may (although backup withholding generally will not) apply to the proceeds of a sale of our common stock outside the United States conducted through certain U.S.-related financial intermediaries, in each case, unless the non-U.S. holder certifies its non-U.S. status under penalty of perjury, such as by providing a valid IRS Form W-8BEN, W8-BEN-E, W-8ECI or other applicable form or such holder otherwise establishes an exemption.
Backup withholding is not an additional tax. Any amounts withheld under the backup withholding rules may be allowed as a refund or a credit against a non-U.S. holder's U.S. federal income tax liability, provided the required information is timely furnished to the IRS.
Additional withholding tax on payments made to foreign accounts
Under Sections 1471 to 1474 of the Code and the U.S. Treasury Regulations promulgated thereunder (such sections commonly referred to as the Foreign Account Tax Compliance Act, or "FATCA"), a 30% U.S. federal withholding tax may apply to any dividends paid after June 30, 2014, and the gross proceeds from a disposition of our common stock occurring after December 31, 2016, in each case paid to (i) a "foreign financial institution" (as specifically defined in the legislation), whether such foreign financial institution is the beneficial owner or an intermediary, unless such foreign financial institution enters into an agreement with the U.S. Department of Treasury to verify, report and disclose its U.S. "account" holders (as specifically defined) and meets certain other specified requirements or (ii) a non-financial foreign entity, whether such non-financial foreign entity is the beneficial owner or an intermediary, unless such entity provides a certification that the beneficial owner of the payment does not have any substantial U.S. owners or provides the name, address and taxpayer identification number of each such substantial U.S. owner and certain other specified requirements are met. In certain cases, the relevant foreign financial institution or non-financial foreign entity may qualify for an exemption from, or be deemed to be in compliance with, these rules. Certain jurisdictions have entered into agreements with the United States that may supplement or modify these rules. Non-U.S. holders should consult their own tax advisors regarding these provisions under FATCA and whether it may be relevant to their ownership and disposition of our common stock.
158
UNDERWRITING (CONFLICTS OF INTEREST)
Under the terms and subject to the conditions contained in an underwriting agreement dated , 2014, we have agreed to sell to the underwriters named below, for whom Credit Suisse Securities (USA) LLC and Morgan Stanley & Co. LLC are acting as representatives, the following respective numbers of shares of common stock:
Underwriter
|
Number of Shares |
|
|---|---|---|
Credit Suisse Securities (USA) LLC |
||
Morgan Stanley & Co. LLC |
||
Deutsche Bank Securities Inc |
||
Barclays Capital Inc |
||
Citigroup Global Markets Inc. |
||
Piper Jaffray & Co. |
||
Guggenheim Securities, LLC |
||
| | | |
Total |
||
| | | |
| | | |
The underwriting agreement provides that the underwriters are obligated to purchase all the shares of common stock in the offering if any are purchased, other than those shares covered by the over-allotment option described below. The underwriting agreement also provides that if an underwriter defaults the purchase commitments of non-defaulting underwriters may be increased or the offering may be terminated.
The selling stockholders have granted to the underwriters a 30-day option to purchase on a pro rata basis up to additional shares at the initial public offering price less the underwriting discounts and commissions. The option may be exercised only to cover any over-allotments of common stock.
The underwriters propose to offer the shares of common stock initially at the public offering price on the cover page of this prospectus and to selling group members at that price less a selling concession of $ per share. The underwriters and selling group members may allow a discount of $ per share on sales to other broker/dealers. After the initial public offering the representatives may change the public offering price and concession and discount to broker/dealers.
The following table summarizes the compensation and estimated expenses to be paid by us and, if the underwriters' option to purchase additional shares is exercised in full, by the selling stockholders:
| |
Per Share | Total | |||||||||||
|---|---|---|---|---|---|---|---|---|---|---|---|---|---|
| |
Without Over-allotment |
With Over-allotment |
Without Over-allotment |
With Over-allotment |
|||||||||
Underwriting Discounts and Commissions paid by us |
$ | $ | $ | $ | |||||||||
Underwriting Discounts and Commissions paid by the selling stockholders |
$ | $ | $ | $ | |||||||||
Expenses payable by us |
$ | $ | $ | $ | |||||||||
We have also agreed to reimburse the underwriters for certain of their expenses, in an amount equal to $30,000, incurred in connection with review by the Financial Industry Regulatory Authority, Inc. of the terms of this offering, as set forth in the underwriting agreement.
The underwriters have informed us that they do not expect sales to accounts over which the underwriters have discretionary authority to exceed 5% of the shares of common stock being offered.
159
We will agree that we will not, subject to certain exceptions, offer, sell, contract to sell, pledge or otherwise dispose of, directly or indirectly, or file with the SEC a registration statement under the Securities Act relating to, any shares of our common stock or securities convertible into or exchangeable or exercisable for any shares of our common stock, or publicly disclose the intention to make any offer, sale, pledge, disposition or filing, without the prior written consent of Credit Suisse Securities (USA) LLC and Morgan Stanley & Co. LLC for a period of 180 days after the date of this prospectus. However, in the event that either (1) during the last 17 days of the lock-up period, we release earnings results or material news or a material event relating to us occurs or (2) prior to the expiration of the lock-up period, we announce that we will release earnings results during the 16-day period beginning on the last day of the lock-up period, then in either case the expiration of the lock-up will be extended until the expiration of the 18-day period beginning on the date of the release of the earnings results or the occurrence of the material news or event, as applicable, unless Credit Suisse Securities (USA) LLC and Morgan Stanley & Co. LLC waive, in writing, such an extension. The foregoing restriction, however, will not apply to issuances by us of up to 10% of our common stock issued and outstanding on the closing date of this offering in connection with an acquisition, business combination or joint venture formation, provided that such common stock issued is subject to the terms of an agreement limiting its disposition prior to such issuance.
We expect our executive officers and directors and substantially all of our stockholders, including the selling stockholders, to agree that they will not, subject to certain exceptions, offer, sell, contract to sell, pledge or otherwise dispose of, directly or indirectly, any shares of our common stock or securities convertible into or exchangeable or exercisable for any shares of our common stock, enter into a transaction that would have the same effect, or enter into any swap, hedge or other arrangement that transfers, in whole or in part, any of the economic consequences of ownership of our common stock, whether any of these transactions are to be settled by delivery of our common stock or other securities, in cash or otherwise, or publicly disclose the intention to make any offer, sale, pledge or disposition, or to enter into any transaction, swap, hedge or other arrangement, without, in each case, the prior written consent of Credit Suisse Securities (USA) LLC and Morgan Stanley & Co. LLC for a period of 180 days after the date of this prospectus. However, in the event that either (1) during the last 17 days of the lock-up period, we release earnings results or material news or a material event relating to us occurs or (2) prior to the expiration of the lock-up period, we announce that we will release earnings results during the 16-day period beginning on the last day of the lock-up period, then in either case the expiration of the lock-up will be extended until the expiration of the 18-day period beginning on the date of the release of the earnings results or the occurrence of the material news or event, as applicable, unless Credit Suisse Securities (USA) LLC and Morgan Stanley & Co. LLC waive, in writing, such an extension.
Prior to this offering, there has been no public market for our common stock. The initial public offering price will be negotiated among us and the representatives. Among the factors to be considered in determining the initial public offering price of our common stock, in addition to prevailing market conditions, will be our historical performance, estimates of our business potential and earnings prospects, an assessment of our management and the consideration of the above factors in relation to market valuation of companies in related businesses. We cannot assure you, however, that the price at which our shares will sell in the public market after this offering will not be lower than the initial public offering price or that an active trading market in our shares will develop and continue after this offering.
We intend to apply to list our shares of common stock on the NYSE.
In connection with the offering the underwriters may engage in stabilizing transactions, over-allotment transactions, syndicate covering transactions and penalty bids in accordance with Regulation M under the Exchange Act. The short position may be either a covered short position or a naked short position. In a covered short position, the number of shares over-allotted by the
160
underwriters is not greater than the number of shares that they may purchase in the over-allotment option. In a naked short position, the number of shares involved is greater than the number of shares in the over-allotment option. The underwriters may close out any covered short position by either exercising their over-allotment option and/or purchasing shares in the open market. In determining the source of shares to close out the short position, the underwriters will consider, among other things, the price of shares available for purchase in the open market as compared to the price at which they may purchase shares through the over-allotment option. If the underwriters sell more shares than could be covered by the over-allotment option, a naked short position, the position can only be closed out by buying shares in the open market. A naked short position is more likely to be created if the underwriters are concerned that there could be downward pressure on the price of the shares in the open market after pricing that could adversely affect investors who purchase in the offering. These stabilizing transactions, syndicate covering transactions and penalty bids may have the effect of raising or maintaining the market price of our common stock or preventing or retarding a decline in the market price of the common stock. As a result the price of our common stock may be higher than the price that might otherwise exist in the open market. These transactions may be effected on the NYSE or otherwise and, if commenced, may be discontinued at any time.
A prospectus in electronic format will be made available on the websites maintained by one or more of the underwriters, or selling group members, if any, participating in this offering and one or more of the underwriters participating in this offering may distribute prospectuses electronically. The representatives may agree to allocate a number of shares to underwriters and selling group members for sale to their online brokerage account holders. Internet distributions will be allocated by the underwriters and selling group members that will make internet distributions on the same basis as other allocations.
We and the selling stockholders have agreed to indemnify the several underwriters against certain liabilities, including liabilities under the Securities Act of 1933.
The underwriters and their respective affiliates are full service financial institutions engaged in various activities, which may include securities trading, commercial and investment banking, financial advisory, investment management, investment research, principal investment, hedging, financing and brokerage activities. Certain of the underwriters and their respective affiliates have, from time to time, performed, and may in the future perform, various financial advisory and investment banking services for us, for which they received or will receive customary fees and expenses. In the ordinary course of their various business activities, the underwriters and their respective affiliates may make or hold a broad array of investments and actively trade debt and equity securities (or related derivative securities) and financial instruments (including bank loans) for their own account and for the accounts of their customers and such investment and securities activities may involve securities and/or instruments of the issuer. The underwriters and their respective affiliates may also make investment recommendations and/or publish or express independent research views in respect of such securities or instruments and may at any time hold, or recommend to clients that they acquire, long and/or short positions in such securities and instruments. Such investment and securities activities may involve securities and instruments of the issuer. In addition, under our Credit Facilities, Credit Suisse Securities (USA) LLC, Morgan Stanley & Co. LLC and Guggenheim Securities, LLC and/or certain of their respective affiliates act as agents or lenders and affiliates of each of Credit Suisse Securities (USA) LLC, Morgan Stanley & Co. LLC and Guggenheim Securities, LLC will receive a portion of the net proceeds of this offering due to the use of proceeds from this offering to repay borrowings under the Term Loan Facility.
Directed Share Program
The underwriters have reserved for sale at the initial public offering price up to % of the shares of common stock to be sold in this offering for our employees and directors and other persons
161
associated with us who have expressed an interest in purchasing shares of our common stock in this offering. If purchased by these persons, these shares will be subject to a 180-day lock-up restriction. The number of shares available for sale to the general public in this offering will be reduced to the extent these persons purchase the reserved shares. Any reserved shares not so purchased will be offered by the underwriters to the general public on the same terms as the other shares.
Conflicts of Interest
A portion of the net proceeds received by us from this offering will be used to repay borrowings under our Term Loan Facility. Because one or more funds or accounts managed or advised by an investment management affiliate of Guggenheim Securities, LLC are lenders under our Term Loan Facility and will receive 5% or more of the net proceeds of this offering, Guggenheim Securities, LLC is deemed to have a "conflict of interest" under FINRA Rule 5121. As a result, this offering will be conducted in accordance with FINRA Rule 5121. Pursuant to that rule, the appointment of a "qualified independent underwriter" is not required in connection with this offering as the members primarily responsible for managing the public offering do not have a conflict of interest, are not affiliates of any member that has a conflict of interest and meet the requirements of paragraph (f)(12)(E) of FINRA Rule 5121. See "Use of Proceeds."
Foreign Selling Restrictions
Notice to Prospective Investors in European Economic Area
In relation to each Member State of the European Economic Area which has implemented the Prospectus Directive (each, a "Relevant Member State"), with effect from and including the date on which the Prospectus Directive is implemented in that Relevant Member State (the "Relevant Implementation Date"), no offer of shares of our common stock may be made to the public in that Relevant Member State other than:
(a) to any legal entity which is a qualified investor as defined in the Prospectus Directive;
(b) to fewer than 100 or, if the Relevant Member State has implemented the relevant provision of the 2010 PD Amending Directive, 150, natural or legal persons (other than qualified investors as defined in the Prospectus Directive), as permitted under the Prospectus Directive, subject to obtaining the prior consent of the representatives; or
(c) in any other circumstances falling within Article 3(2) of the Prospectus Directive,
provided that no such offer of shares of our common stock shall require us or the representatives to publish a prospectus pursuant to Article 3 of the Prospectus Directive or supplement a prospectus pursuant to Article 16 of the Prospectus Directive.
Each person in a Relevant Member State who initially acquires any shares of our common stock or to whom any offer is made will be deemed to have represented, acknowledged and agreed that (A) it is a "qualified investor" within the meaning of the law in that Relevant Member State implementing Article 2(1)(e) of the Prospectus Directive, and (B) in the case of any shares of our common stock acquired by it as a financial intermediary, as that term is used in Article 3(2) of the Prospectus Directive, the shares of our common stock acquired by it in the offering have not been acquired on behalf of, nor have they been acquired with a view to their offer or resale to, persons in any Relevant Member State other than "qualified investors" as defined in the Prospectus Directive, or in circumstances in which the prior consent of the representatives has been given to the offer or resale. In the case of any shares of our common stock being offered to a financial intermediary as that term is used in Article 3(2) of the Prospectus Directive, each such financial intermediary will be deemed to have represented, acknowledged and agreed that the shares of our common stock acquired by it in the offer have not been acquired on a non-discretionary basis on behalf of, nor have they been acquired
162
with a view to their offer or resale to, persons in circumstances which may give rise to an offer of any shares of our common stock to the public other than their offer or resale in a Relevant Member State to qualified investors as so defined or in circumstances in which the prior consent of the representatives has been obtained to each such proposed offer or resale.
We, the representatives and their affiliates will rely upon the truth and accuracy of the foregoing representation, acknowledgment and agreement.
This prospectus has been prepared on the basis that any offer of shares of our common stock in any Relevant Member State will be made pursuant to an exemption under the Prospectus Directive from the requirement to publish a prospectus for offers of such shares. Accordingly any person making or intending to make an offer in that Relevant Member State of shares of our common stock which are the subject of the offering contemplated in this prospectus may only do so in circumstances in which no obligation arises for us or any of the underwriters to publish a prospectus pursuant to Article 3 of the Prospectus Directive in relation to such offer. Neither we nor the underwriters have authorized, nor do they authorize, the making of any offer of shares of our common stock in circumstances in which an obligation arises for us or the underwriters to publish a prospectus for such offer.
For the purpose of the above provisions, the expression "an offer to the public" in relation to any shares of our common stock in any Relevant Member State means the communication in any form and by any means of sufficient information on the terms of the offer and the shares of our common stock to be offered so as to enable an investor to decide to purchase or subscribe such shares, as the same may be varied in the Relevant Member State by any measure implementing the Prospectus Directive in the Relevant Member State and the expression "Prospectus Directive" means Directive 2003/71/EC (including the 2010 PD Amending Directive, to the extent implemented in the Relevant Member States) and includes any relevant implementing measure in the Relevant Member State and the expression "2010 PD Amending Directive" means Directive 2010/73/EU.
Notice to Prospective Investors in the United Kingdom
In addition, in the United Kingdom, this document is being distributed only to, and is directed only at, and any offer subsequently made may only be directed at persons who are "qualified investors" (as defined in the Prospectus Directive) (i) who have professional experience in matters relating to investments falling within Article 19 (5) of the Financial Services and Markets Act 2000 (Financial Promotion) Order 2005, as amended (the "Order") and/or (ii) who are high net worth companies (or persons to whom it may otherwise be lawfully communicated) falling within Article 49(2)(a) to (d) of the Order (all such persons together being referred to as "relevant persons"). This document must not be acted on or relied on in the United Kingdom by persons who are not relevant persons. In the United Kingdom, any investment or investment activity to which this document relates is only available to, and will be engaged in with, relevant persons.
Notice to Residents of Canada
The offering of the common stock in Canada is being made on a private placement basis in reliance on exemptions from the prospectus requirements under the securities laws of each applicable Canadian province and territory where the common stock may be offered and sold, and therein may only be made with investors that are purchasing as principal and that qualify as both an "accredited investor" as such term is defined in National Instrument 45-106 Prospectus and Registration Exemptions and as a "permitted client" as such term is defined in National Instrument 31-103 Registration Requirements, Exemptions and Ongoing Registrant Obligation. Any offer and sale of the common stock in any province or territory of Canada may only be made through a dealer that is properly registered under the securities legislation of the applicable province or territory wherein the common stock is
163
offered and/or sold or, alternatively, by a dealer that qualifies under and is relying upon an exemption from the registration requirements therein.
Any resale of the common stock by an investor resident in Canada must be made in accordance with applicable Canadian securities laws, which may require resales to be made in accordance with prospectus and registration requirements, statutory exemptions from the prospectus and registration requirements or under a discretionary exemption from the prospectus and registration requirements granted by the applicable Canadian securities regulatory authority. These resale restrictions may under certain circumstances apply to resales of the common stock outside of Canada.
Upon receipt of this document, each Canadian investor hereby confirms that it has expressly requested that all documents evidencing or relating in any way to the sale of the securities described herein (including for greater certainty any purchase confirmation or any notice) be drawn up in the English language only. Par la réception de ce document, chaque investisseur canadien confirme par les présentes qu'il a expressément exigé que tous les documents faisant foi ou se rapportant de quelque manière que ce soit à la vente des valeurs mobilières décrites aux présentes (incluant, pour plus de certitude, toute confirmation d'achat ou tout avis) soient rédigés en anglais seulement.
164
The validity of the shares of common stock offered hereby will be passed upon for us by Proskauer Rose LLP. Certain legal matters in connection with this offering will be passed upon for the underwriters by Latham & Watkins LLP, New York, New York. The selling stockholders are represented by Proskauer Rose LLP in connection with this offering.
The consolidated financial statements of Smart & Final Holdings, Inc. and Subsidiaries (the Successor) at December 29, 2013 and December 30, 2012, and for the year ended December 29, 2013 and the period November 15, 2012 through December 30, 2012; and of Smart & Final Holdings Corp. and Subsidiaries (the Predecessor) for the period January 2, 2012 through November 14, 2012 and the year ended January 1, 2012 appearing in this prospectus have been audited by Ernst & Young LLP, independent registered public accounting firm, as set forth in their report thereon appearing elsewhere herein, and are included in reliance upon such report given on the authority of such firm as experts in accounting and auditing.
WHERE YOU CAN FIND ADDITIONAL INFORMATION
We have filed with the SEC a registration statement on Form S-1 under the Securities Act with respect to this offering of our common stock. This prospectus, which constitutes a part of the registration statement, does not contain all of the information set forth in the registration statement, some items of which are contained in exhibits to the registration statement as permitted by the rules and regulations of the SEC. For further information with respect to us and our common stock, we refer you to the registration statement, including the exhibits and the financial statements and notes filed as a part of the registration statement. Statements contained in this prospectus concerning the contents of any contract or any other document are not necessarily complete. If a contract or document has been filed as an exhibit to the registration statement, please see the copy of the contract or document that has been filed. Each statement in this prospectus relating to a contract or document filed as an exhibit is qualified in all respects by the filed exhibit. The exhibits to the registration statement should be referenced for the complete contents of these contracts and documents. A copy of the registration statement and the exhibits filed therewith may be inspected without charge at the public reference room of the SEC, located at 100 F Street, N.E., Room 1580, Washington, D.C. 20549. You may obtain information on the operation of the public reference rooms by calling the SEC at 1-800-SEC-0330. The SEC also maintains an Internet website that contains reports, proxy statements, and other information about issuers, like us, that file electronically with the SEC. The address of that website is www.sec.gov.
As a result of this offering, we will become subject to the information and reporting requirements of the Exchange Act and, in accordance with this law, will file periodic reports, proxy statements, and other information with the SEC. These periodic reports, proxy statements, and other information will be available for inspection and copying at the SEC's public reference facilities and the website of the SEC referred to above. We also maintain a website at smartandfinal.com. After the closing of this offering, you may access our annual reports on Form 10-K, quarterly reports on Form 10-Q, current reports on Form 8-K, and amendments to those reports filed or furnished pursuant to Section 13(a) or 15(d) of the Exchange Act with the SEC free of charge at our website as soon as reasonably practicable after such material is electronically filed with, or furnished to, the SEC. The information contained in, or that can be accessed through, our website is not part of this prospectus.
165
INDEX TO CONSOLIDATED FINANCIAL STATEMENTS
F-1
Report of Independent Registered Public Accounting Firm
The
Board of Directors and Stockholders of
Smart & Final Stores, Inc. (f/k/a Smart & Final Holdings, Inc.)
We have audited the accompanying consolidated balance sheets of Smart & Final Holdings, Inc. and subsidiaries (the Successor) as of December 29, 2013 and December 30, 2012, and the related consolidated statements of operations and comprehensive income (loss), stockholders' equity and cash flows for the year ended December 29, 2013 and for the period November 15, 2012 through December 30, 2012, and the consolidated statements of operations and comprehensive income (loss), stockholders' equity and cash flows of the accounting predecessor Smart & Final Holdings Corp. and subsidiaries (the Predecessor) for the period January 2, 2012 through November 14, 2012 and the year ended January 1, 2012. Our audits also included the financial statement schedules listed in the index to the consolidated financial statements. These financial statements and schedules are the responsibility of the Company's management. Our responsibility is to express an opinion on these financial statements and schedules based on our audits.
We conducted our audits in accordance with the standards of the Public Company Accounting Oversight Board (United States). Those standards require that we plan and perform the audit to obtain reasonable assurance about whether the financial statements are free of material misstatement. We were not engaged to perform an audit of the Company's internal control over financial reporting. Our audits included consideration of internal control over financial reporting as a basis for designing audit procedures that are appropriate in the circumstances, but not for the purpose of expressing an opinion on the effectiveness of the Company's internal control over financial reporting. Accordingly, we express no such opinion. An audit also includes examining, on a test basis, evidence supporting the amounts and disclosures in the financial statements, assessing the accounting principles used and significant estimates made by management, and evaluating the overall financial statement presentation. We believe that our audits provide a reasonable basis for our opinion.
In our opinion, the financial statements referred to above present fairly, in all material respects, the consolidated financial position of Smart & Final Holdings, Inc. and subsidiaries at December 29, 2013 and December 30, 2012, and the consolidated results of their operations and their cash flows for the year ended December 29, 2013, and for the period November 15 through December 30, 2012 (representing the Successor), and for the period from January 2, 2012 through November 14, 2012 and the year ended January 1, 2012 (representing the Predecessor), in conformity with U.S. generally accepted accounting principles. Also, in our opinion, the related financial statement schedules, when considered in relation to the basic financial statements taken as a whole, fairly present in all material respects the information set forth therein.
/s/ Ernst & Young LLP
Los
Angeles, California
June 20, 2014
F-2
Smart & Final Holdings, Inc. and Subsidiaries
Consolidated Balance Sheets
(Dollars in Thousands, Except Share Amounts)
| |
December 29, 2013 |
December 30, 2012 |
|||||
|---|---|---|---|---|---|---|---|
Assets |
|||||||
Current assets: |
|||||||
Cash and cash equivalents |
$ | 53,699 | $ | 35,987 | |||
Accounts receivable, less allowances of $766 and $741 at December 29, 2013 and December 30, 2012, respectively |
19,453 | 17,698 | |||||
Inventories |
209,502 | 195,403 | |||||
Prepaid expenses and other current assets |
17,938 | 28,706 | |||||
Deferred income taxes |
20,747 | 22,029 | |||||
| | | | | | | | |
Total current assets |
321,339 | 299,823 | |||||
Property, plant, and equipment: |
|||||||
Land |
10,394 | 9,876 | |||||
Buildings and improvements |
20,441 | 20,959 | |||||
Leasehold improvements |
119,306 | 95,215 | |||||
Fixtures and equipment |
148,271 | 122,930 | |||||
Construction in progress |
5,541 | 1,174 | |||||
| | | | | | | | |
|
303,953 | 250,154 | |||||
Less accumulated depreciation and amortization |
59,961 | 6,561 | |||||
| | | | | | | | |
|
243,992 | 243,593 | |||||
Capitalized software, net of accumulated amortization of $5,168 and $565 at December 29, 2013 and December 30, 2012, respectively |
12,664 |
15,369 |
|||||
Other intangible assets, net |
328,865 | 332,536 | |||||
Goodwill |
611,242 | 611,242 | |||||
Deferred financing costs, net |
8,272 | 16,888 | |||||
Equity investment in joint venture |
10,948 | 9,400 | |||||
Other assets |
62,219 | 44,063 | |||||
| | | | | | | | |
Total assets |
$ | 1,599,541 | $ | 1,572,914 | |||
| | | | | | | | |
| | | | | | | | |
Liabilities and stockholders' equity |
|||||||
Current liabilities: |
|||||||
Accounts payable |
$ | 153,644 | $ | 133,577 | |||
Accrued salaries and wages |
22,337 | 25,449 | |||||
Accrued expenses |
69,174 | 87,246 | |||||
Current portion of long-term debt |
7,200 | 7,250 | |||||
| | | | | | | | |
Total current liabilities |
252,355 | 253,522 | |||||
Long-term debt, less current portion and debt discount |
698,991 |
697,484 |
|||||
Deferred income taxes |
151,232 | 138,742 | |||||
Postretirement and postemployment benefits |
84,155 | 128,266 | |||||
Other long-term liabilities |
70,949 | 47,877 | |||||
Commitments and contingencies |
|||||||
Stockholders' equity: |
|||||||
Preferred stock, $0.001 par value; |
|||||||
Authorized shares—375,000 |
|||||||
Issued and outstanding shares—none |
— | — | |||||
Common stock, $0.001 par value; |
|||||||
Authorized shares—750,000 |
|||||||
Issued and outstanding shares—300,901 at December 29, 2013 and 299,201 at December 30, 2012 |
— | — | |||||
Additional paid-in capital |
311,992 | 310,292 | |||||
Retained deficit |
(1,117 | ) | (9,288 | ) | |||
Accumulated other comprehensive income |
30,984 | 6,019 | |||||
| | | | | | | | |
Total stockholders' equity |
341,859 | 307,023 | |||||
| | | | | | | | |
Total liabilities and equity |
$ | 1,599,541 | $ | 1,572,914 | |||
| | | | | | | | |
| | | | | | | | |
See notes to consolidated financial statements.
F-3
Smart & Final Holdings, Inc. and Subsidiaries
Consolidated Statements of Operations and Comprehensive Income (Loss)
(Dollars in Thousands,
Except Share and Per Share Amounts)
| |
Successor | Successor | |
Predecessor | Predecessor | ||||||||||
|---|---|---|---|---|---|---|---|---|---|---|---|---|---|---|---|
| |
Fiscal Year 2013 |
Period From November 15, 2012 Through December 30, 2012 |
|
Period From January 2, 2012 Through November 14, 2012 |
Fiscal Year 2011 |
||||||||||
Net sales |
$ | 3,210,293 | $ | 378,550 | $ | 2,664,162 | $ | 2,840,336 | |||||||
Cost of sales, buying and occupancy |
2,736,357 | 333,787 | 2,265,154 | 2,412,180 | |||||||||||
| | | | | | | | | | | | | | | | |
Gross margin |
473,936 | 44,763 | 399,008 | 428,156 | |||||||||||
Operating and administrative expenses |
387,133 |
51,727 |
355,681 |
379,371 |
|||||||||||
(Income) loss on property sales |
— | (5 | ) | 8,818 | 1,952 | ||||||||||
| | | | | | | | | | | | | | | | |
Income (loss) from operations |
86,803 | (6,959 | ) | 34,509 | 46,833 | ||||||||||
Interest expense, net |
50,365 |
7,133 |
20,761 |
31,395 |
|||||||||||
(Loss) on early extinguishment of debt |
(24,487 | ) | — | — | (4,209 | ) | |||||||||
Equity in earnings of joint venture |
1,649 | — | 820 | 785 | |||||||||||
| | | | | | | | | | | | | | | | |
Income (loss) from continuing operations before income taxes |
13,600 | (14,092 | ) | 14,568 | 12,014 | ||||||||||
Income tax (provision) benefit |
(5,429 |
) |
4,804 |
(244 |
) |
(4,795 |
) |
||||||||
| | | | | | | | | | | | | | | | |
Income (loss) from continuing operations |
8,171 | (9,288 | ) | 14,324 | 7,219 | ||||||||||
Income from discontinued operations, net of income taxes |
— |
— |
— |
3,260 |
|||||||||||
| | | | | | | | | | | | | | | | |
Net income (loss) |
$ | 8,171 | $ | (9,288 | ) | $ | 14,324 | $ | 10,479 | ||||||
| | | | | | | | | | | | | | | | |
| | | | | | | | | | | | | | | | |
Basic earnings (loss) per share: |
|||||||||||||||
Income (loss) from continuing operations |
$ | 27.22 | $ | (31.04 | ) | $ | 1.07 | $ | 0.54 | ||||||
Income from discontinued operations, net of income taxes |
— | — | — | 0.24 | |||||||||||
| | | | | | | | | | | | | | | | |
Basic earnings (loss) per share |
$ | 27.22 | $ | (31.04 | ) | $ | 1.07 | $ | 0.78 | ||||||
| | | | | | | | | | | | | | | | |
| | | | | | | | | | | | | | | | |
Diluted earnings (loss) per share: |
|||||||||||||||
Income (loss) from continuing operations |
$ | 26.14 | $ | (31.04 | ) | $ | 1.03 | $ | 0.54 | ||||||
Income from discontinued operations, net of income taxes |
— | — | — | 0.24 | |||||||||||
| | | | | | | | | | | | | | | | |
Diluted earnings (loss) per share |
$ | 26.14 | $ | (31.04 | ) | $ | 1.03 | $ | 0.78 | ||||||
| | | | | | | | | | | | | | | | |
| | | | | | | | | | | | | | | | |
Weighted average shares outstanding: |
|||||||||||||||
Basic |
300,158 | 299,201 | 13,363,635 | 13,362,665 | |||||||||||
Diluted |
312,566 | 299,201 | 13,927,566 | 13,425,470 | |||||||||||
Comprehensive income: |
|||||||||||||||
Net income (loss) |
$ | 8,171 | $ | (9,288 | ) | $ | 14,324 | $ | 10,479 | ||||||
Minimum pension obligation adjustment, net of tax of $15,066, $4,029, $421 and $10,442, respectively |
22,505 |
6,019 |
(628 |
) |
(15,598 |
) |
|||||||||
Derivative instruments: |
|||||||||||||||
Gain, net of tax of $1,932 and $35, respectively |
2,898 | — | — | 52 | |||||||||||
Reclassification adjustments, net of tax of $12 included in net income |
(18 | ) | — | — | — | ||||||||||
Foreign currency translation |
(420 | ) | — | 1,819 | (939 | ) | |||||||||
| | | | | | | | | | | | | | | | |
Other comprehensive income |
24,965 | 6,019 | 1,191 | (16,485 | ) | ||||||||||
| | | | | | | | | | | | | | | | |
Comprehensive income (loss) |
$ | 33,136 | $ | (3,269 | ) | $ | 15,515 | $ | (6,006 | ) | |||||
| | | | | | | | | | | | | | | | |
| | | | | | | | | | | | | | | | |
See notes to consolidated financial statements.
F-4
Smart & Final Holdings, Inc. and Subsidiaries
Consolidated Statements of Stockholders' Equity
(Dollars in Thousands, Except Share Amounts)
| |
Common Stock | |
|
|
|
||||||||||||||
|---|---|---|---|---|---|---|---|---|---|---|---|---|---|---|---|---|---|---|---|
| |
|
|
Accumulated Other Comprehensive Income (Loss) |
|
|||||||||||||||
| |
Number of Shares |
Amount | Additional Paid-In Capital |
Retained Earnings (Deficit) |
Total | ||||||||||||||
Predecessor |
|||||||||||||||||||
Balance at January 2, 2011 |
13,362,665 |
$ |
134 |
$ |
281,512 |
$ |
(24,454 |
) |
$ |
(31,379 |
) |
$ |
225,813 |
||||||
Share-based compensation |
— | — | 2,107 | — | — | 2,107 | |||||||||||||
Capital contribution from Parent (Note 16) |
— | — | 68,089 | — | — | 68,089 | |||||||||||||
Dividend |
— | — | — | (41,424 | ) | — | (41,424 | ) | |||||||||||
Net income |
— | — | — | 10,479 | — | 10,479 | |||||||||||||
Other comprehensive loss |
— | — | — | — | (16,485 | ) | (16,485 | ) | |||||||||||
| | | | | | | | | | | | | | | | | | | | |
Balance at January 1, 2012 |
13,362,665 | 134 | 351,708 | (55,399 | ) | (47,864 | ) | 248,579 | |||||||||||
Share-based compensation |
— | — | 7,171 | — | — | 7,171 | |||||||||||||
Tax benefit from exercise of stock options |
— | — | 15,801 | — | — | 15,801 | |||||||||||||
Stock option exercised |
1,880 | — | 10 | — | — | 10 | |||||||||||||
Net income |
— | — | — | 14,324 | — | 14,324 | |||||||||||||
Other comprehensive income |
— | — | — | — | 1,191 | 1,191 | |||||||||||||
| | | | | | | | | | | | | | | | | | | | |
Balance at November 14, 2012 (prior to Ares Acquisition) |
13,364,545 | $ | 134 | $ | 374,690 | $ | (41,075 | ) | $ | (46,673 | ) | $ | 287,076 | ||||||
| | | | | | | | | | | | | | | | | | | | |
| | | | | | | | | | | | | | | | | | | | |
Successor |
|||||||||||||||||||
Issuance of common stock |
299,201 |
$ |
— |
$ |
299,201 |
$ |
— |
$ |
— |
$ |
299,201 |
||||||||
Successor options awarded in exchange for Predecessor options |
— | — | 11,091 | — | — | 11,091 | |||||||||||||
Net loss |
— | — | — | (9,288 | ) | — | (9,288 | ) | |||||||||||
Other comprehensive income |
— | — | — | — | 6,019 | 6,019 | |||||||||||||
| | | | | | | | | | | | | | | | | | | | |
Balance at December 30, 2012 |
299,201 | — | 310,292 | (9,288 | ) | 6,019 | 307,023 | ||||||||||||
Issuance of common stock |
1,700 | — | 1,700 | — | — | 1,700 | |||||||||||||
Net income |
— | — | — | 8,171 | — | 8,171 | |||||||||||||
Other comprehensive income |
— | — | — | — | 24,965 | 24,965 | |||||||||||||
| | | | | | | | | | | | | | | | | | | | |
Balance at December 29, 2013 |
300,901 | $ | — | $ | 311,992 | $ | (1,117 | ) | $ | 30,984 | $ | 341,859 | |||||||
| | | | | | | | | | | | | | | | | | | | |
| | | | | | | | | | | | | | | | | | | | |
See notes to consolidated financial statements.
F-5
Smart & Final Holdings, Inc. and Subsidiaries
Consolidated Statements of Cash Flows
(Dollars in Thousands)
| |
Successor | Successor |
|
Predecessor | Predecessor | ||||||||||
|---|---|---|---|---|---|---|---|---|---|---|---|---|---|---|---|
| |
Fiscal Year 2013 |
Period From November 15, 2012 Through December 30, 2012 |
|
Period From January 2, 2012 Through November 14, 2012 |
Fiscal Year 2011 |
||||||||||
Operating activities |
|||||||||||||||
Net income (loss) |
$ | 8,171 | $ | (9,288 | ) | $ | 14,324 | $ | 10,479 | ||||||
Net income from discontinued operations |
— | — | — | 3,260 | |||||||||||
| | | | | | | | | | | | | | | | |
Income (loss) from continuing operations |
8,171 | (9,288 | ) | 14,324 | 7,219 | ||||||||||
Adjustments to reconcile net income (loss) to net cash provided by (used in) operating activities: |
|||||||||||||||
Depreciation |
33,414 | 4,043 | 21,381 | 28,203 | |||||||||||
Amortization |
27,345 | 11,910 | 22,664 | 25,440 | |||||||||||
Amortization of deferred financing costs and debt discount |
4,465 | 518 | 1,997 | 2,634 | |||||||||||
Share-based compensation |
— | — | 7,481 | 2,454 | |||||||||||
Excess tax benefits related to share-based payments |
— | — | (21,402 | ) | — | ||||||||||
Deferred income taxes |
(1,258 | ) | (5,246 | ) | (10,508 | ) | (41,669 | ) | |||||||
Equity in earnings of joint venture |
(1,649 | ) | — | (820 | ) | (785 | ) | ||||||||
Loss (gain) on disposal of property, plant, and equipment |
75 | (1 | ) | 8,773 | 1,910 | ||||||||||
Asset impairment |
1,105 | 23 | 544 | 3,305 | |||||||||||
Loss on early extinguishment of debt |
24,487 | — | — | 4,209 | |||||||||||
Dividend from joint venture |
577 | — | 11,624 | — | |||||||||||
Changes in operating assets and liabilities: |
|||||||||||||||
Accounts receivable, net |
(1,755 | ) | 397 | (884 | ) | (999 | ) | ||||||||
Inventories, net |
(14,099 | ) | 11,412 | (16,539 | ) | (8,720 | ) | ||||||||
Prepaid expenses and other assets |
6,218 | (807 | ) | (20,512 | ) | 1,597 | |||||||||
Accounts payable |
20,067 | (11,401 | ) | 12,301 | 24,864 | ||||||||||
Accrued salaries and wages |
(3,112 | ) | 2,325 | (6,985 | ) | 15,799 | |||||||||
Other accrued liabilities |
3,466 | (13,657 | ) | (6,827 | ) | (1,528 | ) | ||||||||
| | | | | | | | | | | | | | | | |
Net cash provided by (used in) continuing operating activities |
107,517 | (9,772 | ) | 16,612 | 63,933 | ||||||||||
Net cash provided by discontinued operating activities |
— | — | — | 10,720 | |||||||||||
| | | | | | | | | | | | | | | | |
Net cash provided by (used in) operating activities |
107,517 | (9,772 | ) | 16,612 | 74,653 | ||||||||||
Investing activities |
|||||||||||||||
Acquisition of Smart & Final Holdings Corp., net of cash acquired |
— | (631,773 | ) | — | — | ||||||||||
Purchases of property, plant, and equipment |
(52,884 | ) | (3,302 | ) | (44,201 | ) | (54,132 | ) | |||||||
Proceeds from disposal of property, plant, and equipment |
85 | 1,383 | 27,209 | 230,353 | |||||||||||
Investment in capitalized software |
(2,209 | ) | (124 | ) | (2,578 | ) | (2,143 | ) | |||||||
Change in restricted cash |
— | — | 4,951 | 1,659 | |||||||||||
Other |
(311 | ) | 98 | (2,870 | ) | (1,395 | ) | ||||||||
| | | | | | | | | | | | | | | | |
Net cash (used in) provided by continuing investing activities |
(55,319 | ) | (633,718 | ) | (17,489 | ) | 174,342 | ||||||||
See notes to consolidated financial statements.
F-6
Smart & Final Holdings, Inc. and Subsidiaries
Consolidated Statements of Cash Flows (Continued)
(Dollars in Thousands)
| |
Successor | Successor |
|
Predecessor | Predecessor | ||||||||||
|---|---|---|---|---|---|---|---|---|---|---|---|---|---|---|---|
| |
Fiscal Year 2013 |
Period From November 15, 2012 Through December 30, 2012 |
|
Period From January 2, 2012 Through November 14, 2012 |
Fiscal Year 2011 |
||||||||||
Net proceeds from sale of Henry's Holdings LLC, net of cash sold |
— | — | — | 266,525 | |||||||||||
Net cash used in discontinued investing activities |
— | — | — | (2,969 | ) | ||||||||||
| | | | | | | | | | | | | | | | |
Net cash (used in) provided by investing activities |
(55,319 | ) | (633,718 | ) | (17,489 | ) | 437,898 | ||||||||
Financing activities |
|||||||||||||||
Borrowings on bank line of credit |
5,000 | 10,000 | 12,000 | — | |||||||||||
Issuance of bank debt, net of issuance costs |
188,985 | 702,508 | — | — | |||||||||||
Issuance of common stock |
1,700 | 299,201 | — | — | |||||||||||
Fees paid in conjunction with debt financing |
(1,073 | ) | (17,179 | ) | (311 | ) | (1,399 | ) | |||||||
Payments on bank line of credit |
(7,000 | ) | (8,000 | ) | (12,000 | ) | — | ||||||||
Payments on bank debt |
(199,213 | ) | (307,053 | ) | — | (429,335 | ) | ||||||||
Payments on notes payable |
— | — | — | (23 | ) | ||||||||||
Excess tax benefits related to share-based payments |
— | — | 21,402 | — | |||||||||||
Cash dividend |
— | — | — | (41,424 | ) | ||||||||||
Contingent consideration related to acquisition of SFHC |
(22,885 | ) | — | — | — | ||||||||||
| | | | | | | | | | | | | | | | |
Net cash (used in) provided by financing activities |
(34,486 | ) | 679,477 | 21,091 | (472,181 | ) | |||||||||
| | | | | | | | | | | | | | | | |
Net increase in cash and cash equivalents |
17,712 | 35,987 | 20,214 | 40,370 | |||||||||||
Cash and cash equivalents at beginning of period |
35,987 | — | 72,462 | 32,092 | |||||||||||
| | | | | | | | | | | | | | | | |
Cash and cash equivalents at end of period |
$ | 53,699 | $ | 35,987 | $ | 92,676 | $ | 72,462 | |||||||
| | | | | | | | | | | | | | | | |
| | | | | | | | | | | | | | | | |
Cash paid during the period for: |
|||||||||||||||
Interest |
$ | 45,547 | $ | 994 | $ | 18,144 | $ | 30,335 | |||||||
| | | | | | | | | | | | | | | | |
| | | | | | | | | | | | | | | | |
Income taxes |
$ | 12,718 | $ | — | $ | 54,655 | $ | 51,762 | |||||||
| | | | | | | | | | | | | | | | |
| | | | | | | | | | | | | | | | |
Non-cash investing and financing activities |
|||||||||||||||
Software development costs incurred but not paid |
$ | 49 | $ | 49 | $ | 10 | $ | 122 | |||||||
| | | | | | | | | | | | | | | | |
| | | | | | | | | | | | | | | | |
Construction in progress costs incurred but not paid |
$ | 3,366 | $ | 1,107 | $ | 1,987 | $ | 3,111 | |||||||
| | | | | | | | | | | | | | | | |
| | | | | | | | | | | | | | | | |
Successor options awarded in exchange for Predecessor options |
$ | 157 | $ | 11,091 | $ | — | $ | — | |||||||
| | | | | | | | | | | | | | | | |
| | | | | | | | | | | | | | | | |
Other consideration payable for acquisition of Smart & Final Holdings Corp. |
$ | 2,607 | $ | 25,522 | $ | — | $ | — | |||||||
| | | | | | | | | | | | | | | | |
| | | | | | | | | | | | | | | | |
See notes to consolidated financial statements.
F-7
Smart & Final Holdings, Inc. and Subsidiaries
Notes to Consolidated Financial Statements
December 29, 2013
1. Description of Business and Basis of Presentation
Business
Smart & Final Holdings, Inc., a Delaware corporation ("SFHI" or the "Successor" and, collectively with its wholly owned subsidiaries, the "Company"), is engaged primarily in the business of selling fresh perishables and everyday grocery items, together with foodservice, packaging and janitorial products. The Company operates non-membership, warehouse-style stores offering products in a range of product sizes. On June 16, 2014 we changed our name to Smart & Final Stores, Inc.
Smart & Final Holdings Corp. (the "Predecessor" and, collectively with its wholly owned subsidiaries, the "Predecessor Company"), a Delaware corporation, together with its wholly owned consolidated subsidiaries, was formed in connection with the acquisition of the "Smart & Final" and "Cash & Carry" businesses through the purchase of the publicly traded stock of Smart & Final Inc. ("SFI") and the concurrent acquisition of SFI's majority stockholder Casino USA, Inc. ("Casino USA") on May 31, 2007. The principal acquiring entity in both the SFI acquisition and the Casino USA acquisition was an affiliate of Apollo Management, L.P. ("Apollo"). Together, the two acquisitions are referred to as the "Apollo Acquisition."
Henry's Holding LLC, a Delaware limited liability company ("Henry's"), was formed on July 17, 2007. Henry's operated organic and natural food oriented supermarkets in California and Texas under the banners "Henry's Farmers Markets" and "Sun Harvest Markets." On September 30, 2007, Henry's was acquired by the Predecessor.
In February 2011, the Predecessor entered into an agreement for the sale of Henry's to Sprouts Farmers Markets, LLC, a Delaware limited liability company ("Sprouts") affiliated with Apollo. Closing of the sale was effective April 18, 2011. See Note 16, Discontinued Operations.
SFHI, was formed in connection with the acquisition of the "Smart & Final" and "Cash & Carry" businesses through the purchase of all of the outstanding common stock of the Predecessor on November 15, 2012. The principal acquiring entities were affiliates of Ares Management, L.P. ("Ares"), and the acquisition is referred to as the "Ares Acquisition."
The Company operates non-membership warehouse-style grocery stores under the "Smart & Final" banner in California, Arizona, and Nevada. These stores are operated through the Company's principal subsidiary, Smart & Final Stores LLC, a California limited liability company and an indirect wholly owned subsidiary of SFHI ("Smart & Final Stores"), and other related entities. Beginning in 2008, the Company began opening an expanded Smart & Final store format named "Smart & Final Extra!" ("Extra!") At December 29, 2013, the Company operated 188 stores, including 69 Extra! format stores, under the "Smart & Final" banner.
The Company also operates non-membership warehouse-style grocery stores in Washington, Oregon, California, Idaho, and Nevada, principally under the "Cash & Carry" banner. At December 29, 2013, the Company operated 52 "Cash & Carry" stores.
The Company's wholly owned subsidiary, Smart & Final de Mexico S.A. de C.V. ("SF Mexico"), is a Mexican holding company that owns 50% of a joint venture. The other 50% of the joint venture is owned by Grupo Calimax S.A. de C.V., an entity comprising the investment interests of a family group which is also the owner of the Calimax grocery store chain in Mexico. At December 29, 2013, this joint venture operated 13 "Smart & Final" format stores in Northwestern Mexico, similar in concept to the
F-8
Smart & Final Holdings, Inc. and Subsidiaries
Notes to Consolidated Financial Statements (Continued)
December 29, 2013
1. Description of Business and Basis of Presentation (Continued)
Company's U.S. "Smart & Final" stores. This joint venture operates the Mexico stores as a Mexican domestic corporation under the name Smart & Final del Noroeste, S.A. de C.V. ("SFDN").
The Company's 50% joint venture interest is accounted for by the equity method of accounting. The investment in SFDN at each reporting fiscal year-end is reported in the consolidated balance sheets under "Equity investment in joint venture." The carrying value of the investment as of December 29, 2013 and December 30, 2012 represents undistributed earnings of the joint venture and an $8.0 million fair value purchase accounting adjustment recorded as a result of the Ares Acquisition. The "Retained earnings/deficit" on SFHI's consolidated balance sheets included earnings of SFDN of $1.6 million and $0 at December 29, 2013 and December 30, 2012, respectively. As of December 30, 2012, SFDN has declared dividends of $15.4 million, representing earnings through 2011. Of the $15.4 million declared dividends, SFDN paid $0.6 million during the year ended December 29, 2013 and $11.6 million during the year ended December 30, 2012. The 2013 and 2012 undistributed earnings are considered retained indefinitely for reinvestment and, accordingly, no provision is made for U.S. federal and state income taxes and foreign income taxes. See Note 10, Income Taxes.
Basis of Presentation
The accompanying consolidated financial statements present the financial position, and results of operations and cash flows of SFHI as of December 29, 2013 and December 30, 2012, and for the year ended December 29, 2013, and for the period November 15, 2012 through December 30, 2012, and the Predecessor for the period January 2, 2012 through November 14, 2012 and for the year ended January 1, 2012. The consolidated financial statements for all predecessor periods have been prepared using the historical basis of accounting for the Predecessor Company. As a result of the Ares Acquisition and the associated purchase accounting, the consolidated financial statements of the Successor are not comparable to periods preceding the Ares Acquisition.
2. Summary of Significant Accounting Policies
Principles of Consolidation
The consolidated financial statements as of December 29, 2013 and December 30, 2012, and for the year ended December 29, 2013, and the period November 15, 2012 through December 30, 2012, represent the Successor. The consolidated financial statements for the period January 2, 2012 through November 14, 2012 and for the year ended January 1, 2012, represent the Predecessor. All significant intercompany accounts and transactions have been eliminated in consolidation.
Fiscal Years
The Company's fiscal year is the 52- or 53-week period that ends on the Sunday closest to December 31. Fiscal years 2013, 2012, and 2011 ended on December 29, 2013, December 30, 2012 and January 1, 2012, respectively. Each fiscal year consists of twelve-week periods in the first, second, and fourth quarters and a sixteen-week period in the third quarter.
F-9
Smart & Final Holdings, Inc. and Subsidiaries
Notes to Consolidated Financial Statements (Continued)
December 29, 2013
2. Summary of Significant Accounting Policies (Continued)
Discontinued Operations Presentation
In the second quarter of 2011, the Predecessor sold Henry's to Sprouts. In the fourth quarter of 2010, the Predecessor closed five food stores in Colorado which had been operated as a test of a potential store format. In accordance with Accounting Standards Codification ("ASC") 205-20, Presentation of Financial Statements—Discontinued Operation ("ASC 205-20"), the Predecessor's 2011 consolidated financial statements reflect the results of operations, financial position and cash flows of Henry's and the five food stores separately as discontinued operations.
Since the effect of these discontinued operations on the SFHI consolidated financial statements for fiscal 2013 and 2012 is immaterial, the Company has not presented these operations separately as discontinued operations for these periods.
Cash and Cash Equivalents
The Company considers all highly liquid instruments purchased with an original maturity of three months or less to be cash equivalents. All credit card, debit card and electronic benefits transfer transactions that process in less than seven days are classified as cash and cash equivalents. The amounts due from banks for these transactions classified as cash and cash equivalents totaled $15.4 million and $15.7 million as of December 29, 2013 and December 30, 2012, respectively. The carrying amount of cash equivalents is approximately the same as their respective fair values due to the short-term maturity of these instruments.
Accounts Receivable, Net
Accounts receivable generally represent billings to customers, billings to vendors for earned rebates and allowances, receivables from SFDN, and other items. The receivable from SFDN primarily relates to billings for the shipment of inventory product to SFDN. The following table sets forth the major components of accounts receivable for each fiscal year-end (in thousands):
| |
December 29, 2013 |
December 30, 2012 |
|||||
|---|---|---|---|---|---|---|---|
Trade |
$ | 3,608 | $ | 3,737 | |||
Vendor |
7,941 | 7,981 | |||||
SFDN |
1,907 | 1,695 | |||||
Other |
5,997 | 4,285 | |||||
| | | | | | | | |
Total |
$ | 19,453 | $ | 17,698 | |||
| | | | | | | | |
| | | | | | | | |
The Company evaluates the collectability of accounts receivable and determines the appropriate reserve for doubtful accounts based on analysis of historical trends of write-offs and recoveries on various levels of aged receivables. When the Company becomes aware of the deteriorated collectability of a specific account, additional reserves are made to reduce the net recognized receivable to the amount reasonably expected to be collectible or zero. When the specific account is determined to be uncollectible, the net recognized receivable is written off in its entirety against such reserves.
F-10
Smart & Final Holdings, Inc. and Subsidiaries
Notes to Consolidated Financial Statements (Continued)
December 29, 2013
2. Summary of Significant Accounting Policies (Continued)
The Company is exposed to credit risk on trade accounts receivable. The Company provides credit to certain trade customers in the ordinary course of business and performs ongoing credit evaluations. Concentrations of credit risk with respect to trade accounts receivable are limited due to the number of customers comprising the Company's customer base. The Company currently believes the allowance for doubtful accounts is sufficient to cover customer credit risks.
Inventories
Inventories consist of merchandise purchased for resale which is stated at the weighted-average cost (which approximates FIFO) or market. The Company provides for estimated inventory losses between physical inventory counts at its stores based upon historical inventory losses as a percentage of sales. The provision is adjusted periodically to reflect updated trends of actual physical inventory count results. The Company had reserves for inventory losses and slow-moving inventory totaling $3.3 million and $4.1 million as of December 29, 2013 and December 30, 2012, respectively.
Prepaid Expenses and Other Current Assets
Prepaid expenses and other current assets include primarily prepaid rent, insurance, property taxes, income taxes receivable and other current assets. As of December 29, 2013 and December 30, 2012, prepaid expenses and other current assets included $5.0 million and $17.7 million of income taxes receivable, respectively.
Property, Plant, and Equipment
Property, plant, and equipment is stated at cost or estimated fair value based on purchase accounting and depreciated or amortized using the straight-line method. Leased property meeting certain criteria is capitalized and the amortization is based on the straight-line method over the term of the lease.
The estimated useful lives are as follows:
Buildings and improvements |
20 - 25 years | |
Fixtures and equipment |
3 - 10 years | |
Leasehold improvements |
Lesser of lease term or useful life of improvement |
Costs of normal maintenance and repairs and minor replacements are charged to expense when incurred. Major replacements, remodeling or betterments of properties are capitalized. When assets are sold or otherwise disposed of, the costs and related accumulated depreciation and amortization are removed from the accounts, and any resulting gain or loss is included in the consolidated statements of operations and comprehensive income (loss).
Included in property, plant, and equipment are costs associated with the selection and procurement of real estate sites of $2.0 million, at both December 29, 2013 and December 30, 2012. These costs are amortized over the remaining lease term of the successful sites with which they are associated.
F-11
Smart & Final Holdings, Inc. and Subsidiaries
Notes to Consolidated Financial Statements (Continued)
December 29, 2013
2. Summary of Significant Accounting Policies (Continued)
In accordance with ASC 360, Property, Plant, and Equipment ("ASC 360"), the Company reviews its long-lived assets, including property, plant and equipment and assets under capital leases for impairment whenever events or changes in circumstances indicate that the carrying amount of an asset may not be recoverable. The Company groups and evaluates long-lived assets for impairment at the individual store level, which is the lowest level at which individual cash flows can be identified. The Company regularly reviews its stores' operating performance for indicators of impairment. Factors it considers important that could trigger an impairment review include a significant underperformance relative to expected historical or projected future operating results, a significant change in the manner of the use of the asset or a significant negative industry or economic trend. Recoverability of assets to be held and used is measured by a comparison of the carrying amount of an asset to estimated undiscounted future cash flows expected to be generated by the asset. If the carrying amount of an asset exceeds its estimated future cash flows, an impairment charge is recognized to the extent the sum of the estimated discounted future cash flows from the use of the asset is less than the carrying value. The Company measured the fair value of its long-lived assets on a nonrecurring basis using Level 3 inputs as defined in the fair value hierarchy. See Note 7, Fair Value Measurements. As a result of such reviews, the Successor and the Predecessor, as applicable, recorded a pre-tax impairment loss of $0.8 million, $0.5 million and $1.6 million for the year ended December 29, 2013, the period January 2, 2012 through November 14, 2012 and the year ended January 1, 2012, respectively. No impairment loss was recorded for the period November 15, 2012 through December 30, 2012. The impairment losses were reported within "Operating and administrative expenses" on SFHI's consolidated statements of operations and comprehensive income (loss). The Predecessor also recorded a pre-tax impairment loss of $0.9 million for the year ended January 1, 2012, which was reported within "Discontinued operations, net of taxes" on the Predecessor's consolidated statements of operations and comprehensive income (loss). See Note 16, Discontinued Operations.
During the year ended January 1, 2012, the Predecessor decided not to sell two properties that had been designated as "Assets held for sale"; accordingly, the properties were reclassified as assets to be held and used and were measured at their fair values at the date of the decision not to sell. The reclassification resulted in impairment losses of $(1.8) million, less costs to sell of $0.4 million, which were reported within "Operating and administrative expenses" on the Predecessor's consolidated statements of operations and comprehensive income (loss).
Capitalized Software
Capitalized software costs are comprised of third-party purchased software costs, capitalized costs associated with internally developed software including internal direct labor costs, and installation costs. Such capitalized costs are amortized over the period that the benefits of the software are fully realizable and enhance the operations of the business, ranging from three to seven years, using the straight-line method.
Capitalized software costs, like other long-lived assets as required by ASC 360, are subject to review for impairment whenever events or changes in circumstances indicate that the carrying amount of the capitalized software may not be recoverable, whether it is in use or under development. Impairment is recognized to the extent the sum of the estimated discounted future cash flows from the use of the capitalized software is less than the carrying value. As a result of such reviews, the Successor
F-12
Smart & Final Holdings, Inc. and Subsidiaries
Notes to Consolidated Financial Statements (Continued)
December 29, 2013
2. Summary of Significant Accounting Policies (Continued)
and the Predecessor, as applicable, recorded a pre-tax impairment loss of $0.3 million and $0.3 million for the year ended December 29, 2013 and for the year ended January 1, 2012, respectively, which was reported within "Operating and administrative expenses" on the Successor's and the Predecessor's consolidated statements of operations and comprehensive income (loss). The Company did not report any impairment loss during the periods in 2012.
Goodwill and Intangible Assets
In connection with the Ares Acquisition, the intangible assets were adjusted and recorded at fair market value in accordance with ASC Topic 805, Business Combinations ("ASC 805"). The following table summarizes the components of other intangible assets, net at December 29, 2013 and December 30, 2012, respectively (in thousands):
| |
Fair Value at Acquisition |
Accumulated Amortization |
Net Book Value |
|||||||
|---|---|---|---|---|---|---|---|---|---|---|
December 29, 2013 |
||||||||||
Indefinite-lived intangible assets: |
||||||||||
Trade names |
$ | 265,000 | $ | — | $ | 265,000 | ||||
Finite-lived intangible assets: |
||||||||||
Signature brands |
67,000 | (3,761 | ) | 63,239 | ||||||
Non-compete agreement |
1,000 | (374 | ) | 626 | ||||||
| | | | | | | | | | | |
Total finite-lived intangible assets |
68,000 | (4,135 | ) | 63,865 | ||||||
| | | | | | | | | | | |
Total intangible assets |
$ | 333,000 | $ | (4,135 | ) | $ | 328,865 | |||
| | | | | | | | | | | |
| | | | | | | | | | | |
| |
Fair Value at Acquisition |
Accumulated Amortization |
Net Book Value |
|||||||
|---|---|---|---|---|---|---|---|---|---|---|
December 30, 2012 |
||||||||||
Indefinite-lived intangible assets: |
||||||||||
Trade names |
$ | 265,000 | $ | — | $ | 265,000 | ||||
Finite-lived intangible assets: |
||||||||||
Signature brands |
67,000 | (422 | ) | 66,578 | ||||||
Non-compete agreement |
1,000 | (42 | ) | 958 | ||||||
| | | | | | | | | | | |
Total finite-lived intangible assets |
68,000 | (464 | ) | 67,536 | ||||||
| | | | | | | | | | | |
Total intangible assets |
$ | 333,000 | $ | (464 | ) | $ | 332,536 | |||
| | | | | | | | | | | |
| | | | | | | | | | | |
The recorded fair market value for each of the trade names was determined by estimating the amount of royalty income that could be generated from the trade name if it was licensed to a third-party owner and discounting the resulting cash flows using the weighted-average cost of capital for each respective trade name.
F-13
Smart & Final Holdings, Inc. and Subsidiaries
Notes to Consolidated Financial Statements (Continued)
December 29, 2013
2. Summary of Significant Accounting Policies (Continued)
The finite-lived intangible assets are amortized over their estimated useful benefit period and have the following weighted-average amortization periods:
Signature brands |
20 years | |
Non-compete agreement |
3 years |
Signature brands, leasehold interests and the non-compete agreement are amortized on a straight-line basis. Amortization expense reported within "Operating and administrative expenses" on the Company's consolidated statements of operations and comprehensive income (loss) was $2.5 million, $0.3 million, $2.3 million and $2.9 million for the year ended December 29, 2013, the period November 15, 2012 through December 30, 2012, the period January 2, 2012 through November 14, 2012 and for the year ended January 1, 2012, respectively.
Amortization of the finite-lived intangible assets over the next five fiscal years is as follows (in thousands):
2014 |
$ | 3,671 | ||
2015 |
3,697 | |||
2016 |
3,338 | |||
2017 |
3,338 | |||
2018 |
3,338 | |||
Thereafter |
46,483 | |||
| | | | | |
|
$ | 63,865 | ||
| | | | | |
| | | | | |
In accordance with ASC 350, Intangibles—Goodwill and Other ("ASC 350"), goodwill and intangible assets with indefinite lives are evaluated on an annual basis for impairment during the fourth quarter, or more frequently if events or changes in circumstances indicate that the asset might be impaired. The Company evaluates goodwill for impairment by comparing the fair value of each reporting unit to its carrying value including the associated goodwill. The Company has designated its reporting units to be its Smart & Final stores and Cash & Carry stores. The Company determines the fair value of the reporting units using the income approach methodology of valuation that includes the discounted cash flow method as well as other generally accepted valuation methodologies. If the fair value of the reporting unit exceeds the carrying value of the net assets, including goodwill assigned to that unit, goodwill is not impaired. If the carrying value of the reporting unit's net assets, including goodwill, exceeds the fair value of the reporting unit, then the Company determines the implied fair value of the reporting unit's goodwill. If the carrying value of a reporting unit's goodwill exceeds its implied value, then an impairment of goodwill has occurred and the Company would recognize an impairment charge for the difference between the carrying amount and the implied fair value of goodwill. For the year ended December 29, 2013, the period November 15, 2012 through December 30, 2012, the period January 2, 2012 through November 14, 2012 and the year ended January 1, 2012, the Company did not recognize any goodwill impairment loss as a result of such value evaluation.
The Company evaluates its indefinite-lived intangible assets associated with trade names by comparing the fair value of each trade name with its carrying value. The Company determines the fair value of the indefinite-lived trade names using a "relief from royalty payments" methodology. This
F-14
Smart & Final Holdings, Inc. and Subsidiaries
Notes to Consolidated Financial Statements (Continued)
December 29, 2013
2. Summary of Significant Accounting Policies (Continued)
methodology involves estimating reasonable royalty rates for each trade name and applying these royalty rates to a revenue stream and discounting the resulting cash flows to determine fair value. For the year ended December 29, 2013, the period November 15, 2012 through December 30, 2012, the period January 2, 2012 through November 14, 2012 and the year ended January 1, 2012, the Company did not recognize any indefinite-lived trade name impairment loss as a result of such evaluation.
Finite-lived intangible assets, like other long-lived assets as required by ASC 360, are subject to review for impairment whenever events or changes in circumstances indicate that the carrying amount of the finite-lived intangible asset may not be recoverable. Impairment is recognized to the extent the sum of the discounted estimated future cash flows from the use of the finite-lived intangible asset is less than the carrying value. The Company did not report any impairment loss as a result of such reviews during any of the periods presented.
Purchase Accounting
Under ASC 805, the Company's assets and liabilities have been accounted for at their estimated fair values as of the date of the Ares Acquisition. The aggregate purchase price was allocated to the tangible and intangible assets acquired and liabilities assumed based upon an assessment of their relative fair value as of the closing date of the Ares Acquisition. These estimates of fair values, the allocation of the purchase price and other factors related to the accounting for the Ares Acquisition are subject to significant judgments and the use of estimates. The inputs used in the fair value analysis fall within Level 3 of the fair value hierarchy due to the use of significant unobservable inputs to determine fair value.
For the Ares Acquisition, the excess of the purchase price over the sum of the amounts assigned to the tangible and intangible net assets acquired of $611.2 million was recorded as goodwill.
The intangible assets recorded related to the Ares Acquisition are not expected to be deductible for tax purposes as the acquisition of the Predecessor was a stock purchase.
Other Assets
Other assets primarily consist of assets held in trusts for certain retirement plans. See Note 9, Retirement Benefit Plans and Postretirement and Postemployment Benefit Obligations. liquor licenses and other miscellaneous assets. As of December 29, 2013 and December 30, 2012, Other assets included a $3.2 million and $3.8 million dividend receivable from SFDN to SF Mexico.
Accounts Payable
The Company's banking arrangements provide for the daily replenishment and limited monthly advanced payments of vendor payable accounts as checks are presented or payments are demanded. The checks and the advanced payments outstanding in these bank accounts totaled $34.4 million and $31.6 million at December 29, 2013 and December 30, 2012, respectively, and are included in "Accounts payable" on the accompanying consolidated balance sheets.
F-15
Smart & Final Holdings, Inc. and Subsidiaries
Notes to Consolidated Financial Statements (Continued)
December 29, 2013
2. Summary of Significant Accounting Policies (Continued)
Other Long-Term Liabilities
Other long-term liabilities include primarily general liabilities, workers' compensation liabilities, liabilities for deferred compensation plan, leasehold interests and other miscellaneous long-term liabilities. As a result of the Ares Acquisition, leasehold interests were adjusted and recorded at fair market value in accordance with ASC 805. At November 15, 2012, the fair value of the lease obligations was $9.8 million. As of December 29, 2013 and December 30, 2012, leasehold interests of $8.7 million and $9.7 million, net of accumulated amortization of $1.1 million and $0.1 million, respectively, are included in other long-term liabilities. These leasehold interests are amortized over their estimated useful benefit periods. The weighted-average amortization period is 14 years.
Accumulated Other Comprehensive Income (Loss)
The Company presents data in the consolidated statements of stockholders' equity in accordance with ASC 220, Comprehensive Income ("ASC 220"). ASC 220 establishes rules for the reporting of comprehensive income (loss) and its components. See Note 18, Accumulated Other Comprehensive Income.
Lease Accounting
Certain of the Company's operating leases provide for minimum annual payments that increase over the life of the lease. The aggregate minimum annual payments are charged to expense on a straight-line basis beginning when the Company takes possession of the property and extending over the term of the related lease. The amount by which straight-line rent expense exceeds actual lease payment requirements in the early years of the leases is accrued as deferred minimum rent and reduced in later years when the actual cash payment requirements exceed the straight-line expense. ASC 410, Asset Retirement and Environmental Obligations ("ASC 410"), requires an entity to recognize a liability for the fair value of a conditional asset retirement obligation if the fair value of the liability can be reasonably estimated. Due to the nature of the Company's business, its asset retirement obligation with respect to owned or leased properties is not significant.
Store Opening and Closing Costs
New store opening costs consisting primarily of rent, store payroll and general operating costs are charged to expense as incurred prior to the store opening.
In the event a leased store is closed before the expiration of the associated lease, the discounted remaining lease obligation less estimated sublease rental income, asset impairment charges related to improvements and fixtures, inventory write-downs and other miscellaneous closing costs associated with the disposal activity are recognized when the store closes.
Share-Based Compensation
The Company accounts for share-based compensation in accordance with ASC 718, Compensation—Stock Compensation ("ASC 718"). ASC 718 requires all share-based payments to be recognized in the statements of operations and comprehensive income as compensation expense based
F-16
Smart & Final Holdings, Inc. and Subsidiaries
Notes to Consolidated Financial Statements (Continued)
December 29, 2013
2. Summary of Significant Accounting Policies (Continued)
on the fair value of an award over its requisite service period, taking into consideration estimated forfeiture rates.
Under the fair value recognition provisions of ASC 718, the Company measures share-based compensation cost at the grant date based on the fair value of the award and recognizes share-based compensation cost as an expense over the award's vesting period. As share-based compensation expense recognized in the consolidated statements of operations and comprehensive income (loss) of the Company is based on awards ultimately expected to vest, the amount of expense has been reduced for estimated forfeitures. The Company's forfeiture rate assumption used in determining its share-based compensation expense is estimated primarily based upon historical data. The actual forfeiture rate could differ from these estimates.
The Company uses the Black-Scholes-Merton option-pricing model to determine the grant date fair value for each stock option grant. The Black-Scholes-Merton option-pricing model requires extensive use of subjective assumptions. Application of alternative assumptions could produce significantly different estimates of the fair value of share-based compensation and, consequently, the related amounts recognized in the Company's consolidated statements of operations and comprehensive income (loss). The Company recognizes compensation cost for graded vesting awards as if they were granted in multiple awards. Management believes the use of this "multiple award" method is preferable because a stock option grant with graded vesting is effectively a series of individual grants that vests over various periods and management believes that this method provides for better matching of compensation costs with the associated services rendered throughout the applicable vesting periods.
All of the options that SFHI has granted after the Ares Acquisition through December 29, 2013 give the Company repurchase rights. As a result of the Company's ability to exercise such repurchase right and the underlying provisions of such repurchase right, it has not recorded any share-based compensation expense for these grants. See Note 13, Share-Based Compensation.
Significant Accounting Estimates
The preparation of financial statements in conformity with U.S. generally accepted accounting principles ("GAAP") requires management to make estimates and assumptions. Such estimates and assumptions could affect the reported amounts of assets and liabilities and the disclosure of contingent assets and liabilities at the date of the financial statements and the reported amounts of revenues and expenses during the reporting period. Actual results could differ from those estimates.
Revenue Recognition
Revenues from the sale of products are recognized at the point of sale. Discounts provided to customers at the time of sale are recognized as a reduction in sales as the products are sold. Returns are also recognized as a reduction in sales and are immaterial in relation to total sales. The Company collects sales tax on taxable products purchased by its customers and remits such collections to the appropriate taxing authority in accordance with local laws. Sales tax collections are presented in the consolidated statements of operations and comprehensive income (loss) on a net basis and, accordingly, are excluded from reported revenues.
F-17
Smart & Final Holdings, Inc. and Subsidiaries
Notes to Consolidated Financial Statements (Continued)
December 29, 2013
2. Summary of Significant Accounting Policies (Continued)
Proceeds from the sale of the Company's Smart & Final gift cards are recorded as a liability at the time of sale, and recognized as sales when they are redeemed by the customer. The Smart & Final gift cards do not have an expiration date. The Company has not recorded any unredeemed gift card revenue or breakage related to its gift card program.
Cost of Sales, Buying and Occupancy
The major categories of costs included in cost of sales, buying and occupancy are cost of goods, distribution costs, costs of the Company's buying department and store occupancy costs, net of earned vendor rebates and other allowances. Distribution costs consist of all warehouse receiving and inspection costs, warehousing costs, all transportation costs associated with shipping goods from the Company's warehouses to its stores, and other costs of its distribution network. The Company does not exclude any portion of these costs from cost of sales.
Vendor Rebates and Other Allowances
As a component of the Company's consolidated procurement program, the Company frequently enters into contracts with vendors that provide for payments of rebates or other allowances. As prescribed by ASC 605, Revenue Recognition ("ASC 605"), these vendor payments are reflected in the carrying value of the inventory when earned or as progress is made toward earning the rebate or allowance and as a component of cost of sales as the inventory is sold. Certain of these vendor contracts provide for rebates and other allowances that are contingent upon the Company meeting specified performance measures such as a cumulative level of purchases over a specified period of time. Such contingent rebates and other allowances are given accounting recognition at the point at which achievement of the specified performance measures are deemed to be probable and reasonably estimable.
Operating and Administrative Expenses
The major categories of operating and administrative expenses include store direct expenses associated with displaying and selling at the store level, primarily labor and related fringe benefit costs, advertising and marketing costs, overhead costs and corporate office costs.
The Company charges to expense the costs of advertising as incurred. Total advertising expense reported within "Operating and administrative expenses" on the Company's consolidated statements of operations and comprehensive income (loss) was $28.6 million, $3.6 million, and $23.7 million for the year ended December 29, 2013, the period November 15, 2012 through December 30, 2012, and the period January 2, 2012 through November 14, 2012, respectively.
Income Taxes
The Company accounts for income taxes in accordance with ASC 740, Income Taxes ("ASC 740"). In accordance with ASC 740, the Company recognizes deferred tax assets and liabilities based on the liability method, which requires an adjustment to the deferred tax asset or liability to reflect income tax rates currently in effect. When income tax rates increase or decrease, a corresponding adjustment to income tax expense is recorded by applying the rate change to the cumulative temporary differences.
F-18
Smart & Final Holdings, Inc. and Subsidiaries
Notes to Consolidated Financial Statements (Continued)
December 29, 2013
2. Summary of Significant Accounting Policies (Continued)
ASC 740 prescribes the recognition threshold and measurement principles for financial statement disclosure of tax positions taken or expected to be taken on a tax return. ASC 740 requires the Company to determine whether it is "more likely than not" that a tax position will be sustained upon examination by the appropriate taxing authorities before any part of the benefit can be recognized. Additionally, ASC 740 provides guidance on recognition measurement, derecognition, classification, related interest and penalties, accounting in interim periods, disclosure and transition.
Foreign Currency Translations
The Company's joint venture in Mexico uses the Mexican Peso as its functional currency. The joint venture's assets and liabilities are translated into U.S. dollars at the exchange rates prevailing at the balance sheet dates. Revenue and expense accounts are translated into U.S. dollars at average exchange rates during the year. Foreign exchange translation adjustments are included in "Accumulated other comprehensive income (loss)," which is reflected as a separate component of stockholders' equity, on the accompanying consolidated balance sheets.
Derivative Financial Instruments
The Company uses interest rate swaps to manage its exposure to adverse fluctuations in interest rates. The contracts are accounted for in accordance with ASC Topic 815, Derivatives and Hedging ("ASC 815"). ASC 815 requires every derivative instrument to be recorded in the Company's consolidated balance sheets as either an asset or liability measured at its fair value. The Company designates its interest rate swaps as cash flow hedges and formally documents its hedge relationships, including identification of the hedging instruments and the hedged items, as well as its risk management objectives and strategies for undertaking the hedge transaction. Accordingly, changes in estimated fair value related to the interest rate swaps are recognized in "Accumulated other comprehensive income (loss)" in the consolidated statements of stockholders' equity and recognized in the consolidated statements of operations and comprehensive income(loss) when the hedged items affect earnings. See Note 6, Derivative Financial Instruments.
Debt Discount and Deferred Financing Costs
Costs incurred in connection with the placement of long-term debt paid directly to the Company's lenders are treated as a debt discount. Costs incurred in connection with the placement of long-term debt paid to third parties are capitalized to deferred financing costs. Debt issuance costs are amortized to interest expense over the term of the related debt using the effective interest method.
Debt issuance costs and fees paid to the lenders related to the Apollo Acquisition were recorded as a reduction to debt and were amortized to interest expense over the terms of the underlying debt instruments using the effective interest method. Effective November 14, 2012, the remaining unamortized debt discount of $3.0 million was written off in accordance ASC 805 in connection with the Ares Acquisition. On November 15, 2012, debt issuance costs and fees paid to the lenders related to the Ares Acquisition, totaling $17.5 million, were recorded as a reduction to debt and are amortized to interest expense over the terms of the underlying debt instruments using the effective interest method. At December 29, 2013 and December 30, 2012, the debt discount totaled $9.6 million and $17.3 million, respectively (net of accumulated amortization of $1.7 million and $0.2 million, respectively). See Note 5, Debt.
F-19
Smart & Final Holdings, Inc. and Subsidiaries
Notes to Consolidated Financial Statements (Continued)
December 29, 2013
2. Summary of Significant Accounting Policies (Continued)
Debt issuance costs and fees paid to parties other than the lenders related to the Apollo Acquisition had been capitalized and were amortized to interest expense over the terms of the underlying debt instruments using the effective interest method. Effective November 14, 2012, the remaining unamortized deferred financing costs of $2.5 million were written off in accordance with ASC 805 in connection with the Ares Acquisition. On November 15, 2012, debt issuance costs and fees paid to parties other than the lenders related to the Ares Acquisition, totaling $17.2 million, have been capitalized and are amortized to interest expense over the terms of the underlying debt instruments using the effective interest method. At December 29, 2013 and December 30, 2012, these deferred financing costs totaled $8.3 million and $16.9 million, respectively (net of accumulated amortization of $2.7 million and $0.3 million, respectively). These balances are included in "Deferred financing costs, net" in the consolidated balance sheets.
Self-Insurance
The Company purchases third-party insurance for workers' compensation and general liability costs that exceed certain limits for each respective insurance program. The Company is responsible for the payment of claims in amounts less than these insured excess limits and establishes estimated accruals for its insurance programs based on available claims data, historical trends and experience, and projected ultimate costs of the claims. These accruals are based on estimates prepared with the assistance of outside actuaries and consultants, and the ultimate cost of these claims may vary from initial estimates and established accruals. The actuaries periodically update their estimates and the Company records such adjustments in the period in which such determination is made.
The accrued obligation for these self-insurance programs was approximately $31.4 million and $29.4 million as of December 29, 2013 and December 30, 2012, respectively. These balances are included in "Other long-term liabilities" in the consolidated balance sheets.
Fair Value of Financial Instruments
The Company's financial instruments recorded on the consolidated balance sheets include cash and cash equivalents, accounts receivable, investments in affiliates, and long-term variable rate debt. The carrying amounts of cash and cash equivalents, accounts receivable, and equity investment in joint venture approximate fair value.
The Company's debt securities are not listed or traded on an established market. For the purpose of determining the fair value of the Company's first lien term loan facility (the "Term Loan Facility"), the administrative agent has provided to the debt holders valuations indicating the Term Loan Facility's carrying value approximates fair value.
The Company's consolidated financial statements reflect its ownership interest in an investment vehicle that invested in Sprouts through the Company's supplemental deferred compensation plan. The investment is presented at fair market value.
Accounting for Retirement Benefit Plans
The Company accounts for its retirement benefit plans and postretirement and postemployment benefit obligations in accordance with ASC 715, Compensation—Retirement Benefits ("ASC 715").
F-20
Smart & Final Holdings, Inc. and Subsidiaries
Notes to Consolidated Financial Statements (Continued)
December 29, 2013
2. Summary of Significant Accounting Policies (Continued)
ASC 715 requires the Company to recognize the overfunded or underfunded status of a defined benefit plan, measured as the difference between the fair value of plan assets and the plan's benefit obligation, as an asset or liability in its consolidated balance sheets and to recognize changes to that funded status in the year in which the changes occur through Accumulated other comprehensive income (loss). See Note 9, Retirement Benefit Plans and Postretirement and Postemployment Benefit Obligations. ASC 715 also requires measurement of the funded status of a plan as of the Company's consolidated balance sheet dates.
Earnings (Loss) per Share
Basic earnings (loss) per share is calculated by dividing net income (loss) by the weighted average number of shares outstanding during the fiscal period.
Diluted earnings (loss) per share is calculated by dividing net income (loss) by the weighted average number of shares outstanding, plus, where applicable, shares that would have been outstanding related to dilutive stock options.
Recently Adopted Accounting Pronouncements
In July 2012, the Financial Accounting Standards Board ("FASB") issued Accounting Standards Update (ASU) No. 2012-02, Intangibles—Goodwill and Other (Topic 350): Testing Indefinite-Lived Intangible Assets for Impairment. This ASU allows an entity to first assess qualitative factors to determine whether it is necessary to perform the quantitative impairment test for indefinite-lived intangible assets. An entity that elects to perform a qualitative assessment is required to perform the quantitative impairment test for an indefinite-lived intangible asset if it is more likely than not that the asset is impaired. This ASU, which applies to all public, private, and not-for-profit entities, is effective for annual and interim impairment tests performed for fiscal years beginning after September 15, 2012. Early adoption is permitted, including for annual and interim impairment tests performed as of a date before July 27, 2012, if a public entity's financial statements for the most recent annual or interim period have not yet been issued or, for nonpublic entities, have not yet been made available for issuance. The Company did not elect to perform a qualitative assessment for the fiscal year ended December 29, 2013.
In January 2013, the FASB issued ASU 2013-01, Balance Sheet (Topic 210): Clarifying the Scope of Disclosures about Offsetting Assets and Liabilities, which provides further clarification relating to the scope of ASU 2011-11, Balance Sheet (Topic 210): Disclosures about Offsetting Assets and Liabilities. Effective for fiscal years beginning on or after January 1, 2013, ASU 2011-11 requires an entity to include additional disclosures about financial instruments and transactions eligible for offset in the statement of financial position, as well as financial instruments subject to a master netting agreement or similar arrangement. ASU 2013-01 added further scope clarification that ASU 2011-11 applies to derivatives, including bifurcated embedded derivatives, repurchase agreements and reverse repurchase agreements, and securities borrowing and securities lending transactions that are either offset or subject to an enforceable master netting arrangement or similar agreement. This ASU was effective for fiscal years beginning on or after January 1, 2013. The adoption of this ASU did not have a material impact on the Company's consolidated financial statements.
F-21
Smart & Final Holdings, Inc. and Subsidiaries
Notes to Consolidated Financial Statements (Continued)
December 29, 2013
2. Summary of Significant Accounting Policies (Continued)
In February 2013, the FASB issued ASU 2013-02, Comprehensive Income (Topic 220): Reporting of Amounts Reclassified Out of Accumulated Other Comprehensive Income. ASU 2013-02 requires an entity to provide information about the changes in accumulated other comprehensive income by component. In addition, an entity is required to present, either on the face of the statement where net income is presented or in the notes, significant amounts reclassified out of accumulated other comprehensive income by the respective line items of net income, but only if the amount reclassified is required to be reclassified to net income in its entirety in the same reporting period. For other amounts that are not reclassified in their entirety to net income, an entity is required to cross-reference in a note to other required disclosures that provide additional detail about those amounts. ASU 2013-02 is effective for fiscal years, and interim periods within those years, beginning after December 15, 2012. The adoption of this ASU had no impact on the Company's financial condition or results of operations but impacted the presentation of other comprehensive income in the footnotes to the financial statements.
In July 2013, the FASB issued ASU 2013-10, Derivatives and Hedging (Topic 815): Inclusion of the Fed Funds Effective Swap Rate (or Overnight Index Swap Rate) as a Benchmark Interest Rate for Hedge Accounting Purposes. Prior to this standard, the only interest rates that were permitted to be used as benchmark interest rates in a fair value or cash flow hedge were the interest rates on direct Treasury obligations of the U.S. government (UST) and the London Interbank Offered Rate (LIBOR) swap rate. The new standard allows the use of the Fed Funds rate (the interest rate at which depository institutions lend balances to each other overnight) as a benchmark rate. The standard also eliminates the need to designate the same benchmark interest rate for similar hedges. Additionally, it removes language indicating that the use of different benchmark interest rates for similar hedges "shall be rare and shall be justified." The new standard was effective prospectively for qualifying new or redesignated hedging relationships entered into on or after July 17, 2013. The adoption of this ASU did not have a material impact on the Company's consolidated financial statements.
Recently Issued Accounting Pronouncements Not Yet Adopted
In March 2013, the FASB issued ASU 2013-05, Foreign Currency Matters (Topic 830): Parent's Accounting for the Cumulative Translation Adjustment upon Derecognition of Certain Subsidiaries or Groups of Assets within a Foreign Entity or of an Investment in a Foreign Entity. ASU 2013-05 requires a reporting entity that either sells a part or all of its investment in a foreign entity or no longer holds a controlling financial interest in a subsidiary or group of assets that is a nonprofit activity or a business (other than a sale of in substance real estate or conveyance of oil and gas mineral rights) within a foreign entity, to release any cumulative translation adjustment into net income. ASU 2013-05 is effective for fiscal years beginning after December 15, 2013, with early adoption permitted. The Company does not expect that the adoption of this guidance will have a material effect on the Company's consolidated financial statements.
In July 2013, the FASB issued ASU 2013-11, Income Taxes (Topic 740): Presentation of an Unrecognized Tax Benefit When a Net Operating Loss Carryforward, a Similar Tax Loss, or a Tax Credit Carryforward Exists. ASU 2013-11 requires that an unrecognized tax benefit, or a portion of an unrecognized tax benefit, should be presented in the financial statements as a reduction to a deferred tax asset for a net operating loss carryforward, a similar tax loss or a tax credit carryforward. ASU 2013-11 further states that to the extent that a net operating loss carryforward, a similar tax loss
F-22
Smart & Final Holdings, Inc. and Subsidiaries
Notes to Consolidated Financial Statements (Continued)
December 29, 2013
2. Summary of Significant Accounting Policies (Continued)
or a tax credit carryforward is not available at the reporting date under the tax law of the applicable jurisdiction to settle any additional income taxes that would result from the disallowance of a tax position, or the tax law of the applicable jurisdiction does not require the entity to use, and the entity does not intend to use, the deferred tax asset for such purpose, then the unrecognized tax benefit should be presented as a liability in the entity's financial statements and should not be combined with deferred tax assets. ASU 2013-11 is effective for fiscal years beginning after December 15, 2013, and interim periods within those years, with early adoption permitted. The Company does not expect that the adoption of this guidance will have a material effect on the Company's consolidated financial statements.
In April 2014, the FASB issued ASU No. 2014-08, Presentation of Financial Statements (Topic 205) and Property, Plant, and Equipment (Topic 360): Reporting Discontinued Operations and Disclosures of Disposals of Components of an Entity. The amendments in ASU 2014-08 change the criteria for reporting discontinued operations while enhancing disclosures in this area. They also address sources of confusion and inconsistent application related to financial reporting of discontinued operations guidance in GAAP. Under the new guidance, only disposals representing a strategic shift in operations should be presented as discontinued operations. Those strategic shifts should have a major effect on the entity's operations and financial results. Examples include a disposal of a major geographic area, a major line of business, or a major equity method investment. In addition, the new guidance requires expanded disclosures about discontinued operations that will provide financial statement users with more information about the assets, liabilities, income, and expenses of discontinued operations. The amendments in this ASU are effective for the first quarter of 2015 for public entities with calendar year ends. The Company does not expect that the adoption of ASU 2014-18 will have a material effect on the Company's consolidated financial statements.
In May 2014, the FASB issued ASU 2014-09, Revenue from Contracts with Customers (Topic 606). ASU 2014-09 outlines a single comprehensive model for entities to use in accounting for revenue arising from contracts with customers and supersedes most current revenue recognition guidance, including industry-specific guidance. The new revenue model is designed to provide a more robust framework for addressing revenue issues and requires an entity to recognize revenue to depict the transfer of promised goods or services to customers in an amount that reflects the consideration to which the entity expects to be entitled in exchange for those goods or services. ASU 2014-09 is effective for the fiscal years beginning after December 15, 2016, including interim periods within that reporting period, under either full or modified retrospective adoption. Early application is not permitted. The Company is currently evaluating the impact of the adoption of this standard on the Company's consolidated financial statements.
3. Apollo Acquisition Restructuring Reserves
Upon consummation of the Apollo Acquisition, new management of the Predecessor initiated various strategic initiative plans, including (a) a review of the Predecessor's portfolio of operating stores and stores in development (the "Store Program"), (b) a corporate cost reduction program (the "Corporate Program"), and (c) a restructuring of the Predecessor's retirement benefit plans. A liability in the amount of $13.2 million was recorded for estimated costs to be incurred in connection with the Predecessor's exit from certain operating stores or store properties in development related to the Store
F-23
Smart & Final Holdings, Inc. and Subsidiaries
Notes to Consolidated Financial Statements (Continued)
December 29, 2013
3. Apollo Acquisition Restructuring Reserves (Continued)
Program and a liability in the amount of $1.0 million was recorded for estimated costs associated with the involuntary termination of designated employees, excluding the Predecessor's former chief executive officer, related to the Corporate Program. These costs were included in the acquisition cost allocation of the Apollo Acquisition. For the year ended December 29, 2013, the period November 15, 2012 through December 30, 2012, the period January 2, 2012 through November 14, 2012 and the year end January 1, 2012, the reserves related to the Store Program were increased by $1.2 million, $0.3 million and $0.1 million, respectively, which are included in "Operating and administrative expenses" in the consolidated statements of operations and comprehensive income (loss). As of December 29, 2013, there was no remaining reserve balance related to the Corporate Program.
The following table summarizes the activity for the Store Program through each year-end (in thousands):
Balance as of January 2, 2011 |
$ | 2,626 | ||
Adjustments to reserve included in net income for the period |
75 | |||
Lease termination costs paid |
(668 | ) | ||
| | | | | |
Balance as of January 1, 2012 |
2,033 | |||
Adjustments to reserve included in net income for the period |
261 | |||
Lease termination costs paid |
(383 | ) | ||
| | | | | |
Balance as of November 14, 2012 |
1,911 | |||
Adjustments to reserve included in net income for the period |
53 | |||
Lease termination costs paid |
(78 | ) | ||
| | | | | |
Balance as of December 30, 2012 |
1,886 | |||
Adjustments to reserve included in net income for the period |
1,177 | |||
Lease termination costs paid |
(462 | ) | ||
| | | | | |
Balance as of December 29, 2013 |
$ | 2,601 | ||
| | | | | |
| | | | | |
4. Ares Acquisition
On November 15, 2012, pursuant to the Purchase and Sale Agreement (the "Acquisition Agreement") dated as of October 9, 2012, among the stockholders of the Predecessor (the "Sellers") and affiliates of Ares (the "Buyers"), the Ares Acquisition was consummated. Upon completion of the Ares Acquisition, each share of common stock of the Predecessor was cancelled and converted into the right to receive cash for aggregate cash consideration of approximately $669.5 million. In addition, payments in satisfaction of Predecessor stock options aggregated $54.2 million.
The Ares Acquisition was financed by:
- •
- Borrowings consisting of (i) a $525.0 million, 7-year Term Loan Facility; (ii) a $195.0 million, 8-year second lien term loan credit facility (the "Second Lien Term Loan Facility"); (iii) a $150.0 million, 5-year asset-based revolving credit facility (the "Revolving Credit Facility"), which was drawn for $10.0 million at closing of the Ares Acquisition, see Note 5, Debt; and
F-24
Smart & Final Holdings, Inc. and Subsidiaries
Notes to Consolidated Financial Statements (Continued)
December 29, 2013
4. Ares Acquisition (Continued)
- •
- Equity investment of $290.0 million from affiliates of Ares, $9.2 million from certain management employees of the Predecessor and $10.9 million from the management equity rollover.
The aggregate consideration for the Ares Acquisition was as follows (in thousands):
Purchase of Predecessor common shares |
$ | 669,456 | ||
Payment on Predecessor stock options (inclusive of employer payroll taxes) |
54,993 | |||
Less cash acquired |
(92,676 | ) | ||
| | | | | |
Cash consideration |
631,773 | |||
Working capital adjustment |
6,231 |
|||
Tax consideration |
19,291 | |||
Value of management equity rollover |
11,091 | |||
| | | | | |
Total fair value of net assets acquired |
$ | 668,386 | ||
| | | | | |
| | | | | |
In contemplation of the sale of the Predecessor, the Predecessor Company engaged financial, legal and other advisors to assist in the review of the Predecessor Company's strategic alternatives. The costs associated with the assessment of strategic alternatives and transaction costs incurred in conjunction with the Ares Acquisition included in the consolidated statements of operations and comprehensive income (loss) were $23.9 million for the period January 2, 2012 through November 14, 2012.
The cash consideration paid at the closing of the Ares Acquisition was based in part on an estimated closing working capital as of the closing date of November 15, 2012 (the Closing Date). The Acquisition Agreement provided for a purchase price adjustment based upon a final closing working capital statement to be prepared after the Closing Date, which would be subject to the review and agreement of both the Sellers and the Buyers. As of December 29, 2013, the Sellers and Buyers have reached agreement on the final calculation of the closing working capital statement resulting in a working capital adjustment to purchase price of $6.4 million, or $2.5 million greater than the estimated working capital adjustment. As such, the purchase price was increased by $2.5 million. Accordingly, the Company's prior year consolidated balance sheets and consolidated statements of cash flows have been restated to reflect the change in the purchase price. During the year ended December 29, 2013, the Company made additional payments of $6.2 million to the Sellers and increased the value of management equity rollover by $0.2 million. The allocation of the purchase price is final.
The Acquisition Agreement further provided that any income tax refunds or credits actually received by the Company relating to the Predecessor Company tax periods or any benefit of any overpayment of income taxes relating to the Predecessor Company tax periods that is applied to a Successor taxable period would inure to the benefit of the Sellers. The Company estimated an income tax refund receivable in the amount of $17.3 million related to the Predecessor tax periods, which was reflected on the Company's consolidated balance sheet as of December 30, 2012. The Company recorded a corresponding payable of $17.3 million to the Sellers. During the year ended December 29, 2013, the Company received and paid a total of $16.7 million to the Sellers. The estimated income tax refund receivable increased by $2.0 million in 2013. The Company has recorded an additional payable of $2.0 million to the Sellers.
F-25
Smart & Final Holdings, Inc. and Subsidiaries
Notes to Consolidated Financial Statements (Continued)
December 29, 2013
4. Ares Acquisition (Continued)
Allocation of Purchase Price
The Ares Acquisition was accounted for as a business combination in accordance with ASC 805 whereby the purchase price paid to effect the acquisition was assigned to the assets acquired and the liabilities assumed based on their fair values at the acquisition date. The determination of fair value included the consideration of various factors including quoted market prices, expected future cash flows, current replacement costs, market rate assumptions, and appropriate discount and growth rates.
The following table below sets forth the fair values of the assets acquired and liabilities assumed (in thousands):
| |
Ares Acquisition |
|||
|---|---|---|---|---|
Current assets, less cash acquired |
$ | 279,624 | ||
Property, plant, and equipment |
248,944 | |||
Capitalized software |
15,766 | |||
Finite-lived/amortizable intangible assets |
68,000 | |||
Indefinite-lived trade names |
265,000 | |||
Goodwill |
611,242 | |||
Investment in SFDN |
9,400 | |||
Other assets |
46,277 | |||
Current liabilities |
(251,661 | ) | ||
Debt |
(304,074 | ) | ||
Deferred taxes |
(135,865 | ) | ||
Other liabilities |
(184,267 | ) | ||
| | | | | |
|
$ | 668,386 | ||
| | | | | |
| | | | | |
5. Debt
Long-term debt at December 29, 2013 and December 30, 2012 is as follows (in thousands):
| |
December 29, 2013 |
December 30, 2012 |
|||||
|---|---|---|---|---|---|---|---|
Term Loan Facility, at 4.75% and 5.75% |
$ | 715,788 | $ | 525,000 | |||
Second Lien Term Loan Facility, at 10.5% |
— | 195,000 | |||||
Asset Based Lending Facility, at variable rate |
— | 2,000 | |||||
| | | | | | | | |
|
715,788 | 722,000 | |||||
Less: |
|||||||
Discount on debt issuance |
(9,597 | ) | (17,266 | ) | |||
Current portion of long-term debt |
(7,200 | ) | (7,250 | ) | |||
| | | | | | | | |
Total long-term debt, less current portion |
$ | 698,991 | $ | 697,484 | |||
| | | | | | | | |
| | | | | | | | |
F-26
Smart & Final Holdings, Inc. and Subsidiaries
Notes to Consolidated Financial Statements (Continued)
December 29, 2013
5. Debt (Continued)
Successor Credit Facilities
In conjunction with the Ares Acquisition, Smart & Final stores entered into three new financing arrangements effective November 15, 2012, including two term loan agreements: the Term Loan Facility and the Second Lien Term Loan Facility (together with the Term Loan Facility, the "Term Loan Facilities") and the Revolving Credit Facility.
The Term Loan Facility has a term of seven years and originally provided financing of up to a maximum of $525.0 million in term loans. At November 15, 2012, the Term Loan Facility was drawn to provide $525.0 million in gross proceeds as a part of the funding for the Ares Acquisition.
All obligations under the Term Loan Facility are secured by (1) a first-priority security interest in substantially all of the property and assets of, as well as the equity interests owned by, Smart & Final Stores and SF CC Intermediate Holdings Inc., a direct wholly owned subsidiary of SFHI ("Intermediate Holdings") and the other guarantors, with certain exceptions, and (2) a second-priority security interest in the Revolving Credit Facility collateral.
Initially, borrowings under the Term Loan Facility bore interest at an applicable margin of 3.50% plus, at Smart & Final Stores' option, a fluctuating rate equal to the highest of 1) the federal funds rate plus 0.50%, 2) a rate of interest published by The Wall Street Journal as the "Prime Rate," or 3) a LIBOR loan rate based on LIBOR plus 1.00%. Eurocurrency Borrowings (as defined in the credit agreement governing the Term Loan Facility) bore interest at the adjusted LIBOR rate, which is the greater of (a) the LIBOR rate in effect for the applicable interest period divided by one, minus the Statutory Reserves (as defined in the credit agreement governing the Term Loan Facility) applicable to such Eurocurrency Borrowing, if any, and (b) 1.25% plus the applicable Eurocurrency (as defined in the credit agreement governing the Term Loan Facility) loan rate margin of 4.50%. At December 29, 2013 and December 30, 2012, the weighted-average interest rate on the amount outstanding under the Term Loan Facility was 4.75% and 5.75%, respectively.
The Term Loan Facility contains a provision for quarterly amortization of principal in the amount of 0.25% of the aggregate principal amount of the term loans outstanding under the Term Loan Facility beginning March 31, 2013. The Term Loan Facility may be prepaid, in whole or in part, at any time but Smart & Final Stores must pay a prepayment premium of 1.00% of the principal amount of the term loans so prepaid if the prepayment occurs as a result of a repricing transaction and is effective prior to the first anniversary of the facility. Mandatory prepayments are required (i) in the amount of the net proceeds of a sale of assets, subject to the priority of the Revolving Credit Facility collateral, and (ii) in the amount of certain excess cash flows, adjusted by any voluntary prepayments. The Term Loan Facility has no financial covenant requirements.
The Second Lien Term Loan Facility had a term of eight years and provided $195.0 million in gross proceeds at November 15, 2012.
All obligations under the Second Lien Term Loan Facility were secured by (1) a second-priority security interest on all Term Loan Facility collateral and (2) a third-party security interest on the Revolving Credit Facility collateral.
Borrowings under the Second Lien Term Loan Facility bore interest at an applicable margin of 8.25% plus, at Smart & Final Stores' option, a fluctuating rate equal to the highest of (1) the federal
F-27
Smart & Final Holdings, Inc. and Subsidiaries
Notes to Consolidated Financial Statements (Continued)
December 29, 2013
5. Debt (Continued)
funds rate plus 0.50%, (2) a rate of interest published by The Wall Street Journal as the "Prime Rate," or (3) a LIBOR loan rate based on LIBOR plus 1.00%. Eurocurrency Borrowings (as defined in the credit agreement governing the Second Lien Term Loan Facility) bore interest at the adjusted LIBOR rate, which is the greater of (a) the LIBOR rate in effect for the applicable interest period divided by one, minus the Statutory Reserves (as defined in the credit agreement governing the Second Lien Term Loan Facility) applicable to such Eurocurrency Borrowing, if any, and (b) 1.25% plus the applicable Eurocurrency (as defined in the credit agreement governing the Second Lien Term Loan Facility) loan rate margin of 9.25%. At December 30, 2012, the weighted-average interest rate on the amount outstanding under the Second Lien Term Loan Facility was 10.50%.
The Second Lien Term Loan Facility could be prepaid, in whole or in part, at any time but Smart & Final Stores had to pay a prepayment premium of 2.00% of the principal amount of the term loans so prepaid through the first anniversary of the facility and 1.00% of the principal amount of the term loans so prepaid from the first anniversary through the second anniversary of the facility. Mandatory prepayments were required (1) in the amount of the net proceeds of a sale of assets, subject to the priority of the Revolving Credit Facility collateral, and (2) in the amount of certain excess cash flows, adjusted by any voluntary prepayments. Any mandatory prepayments for the Second Lien Term Loan Facility were reduced dollar-for-dollar by amounts required to prepay the Term Loan Facility. The Second Lien Term Loan Facility had no financial covenant requirements.
During the second quarter of 2013, the Company amended the Term Loan Facility, reducing the applicable margin from 4.50% to 3.50%. The definition of Adjusted LIBOR Rate was also amended to reduce the floor rate from 1.25% to 1.00%. Additionally, the Company increased the size of the Term Loan Facility by $55.0 million through an incremental facility. The proceeds of this additional borrowing were used to reduce the amounts outstanding under the Second Lien Term Loan Facility by $55.0 million, reducing the outstanding balance to $140.0 million. Consequently, the Company recorded a loss on the early extinguishment of debt of $7.1 million related to fees and the write-off of unamortized debt discount and deferred financing costs. The Company incurred approximately $7.5 million of fees in connection with the amendment of the Term Loan Facility. Approximately $4.9 million of these fees were recorded as debt discount and are amortized over the term of the loan. Quarterly amortization of the principal amount increased to $1.5 million.
During the fourth quarter of 2013, the Company amended the Term Loan Facility, increasing the applicable margin from 3.50% to 3.75%, and reducing the size of the incremental borrowing facilities that can be incurred without regard to leverage-based limitations from $125.0 million to $75.0 million (the "2nd Amendment"). Also, the Term Loan Facility may still be prepaid, in whole or in part, at any time but Smart & Final Stores must pay a prepayment premium of 1.00% of the principal amount of the term loans so prepaid if the prepayment occurs as a result of a repricing transaction and is effective within six months of the 2nd Amendment. Additionally, the Company increased the size of the Term Loan Facility by $140.0 million through an incremental facility. The proceeds of this borrowing were used to repay all amounts outstanding under the Second Lien Term Loan Facility. Consequently, the Company recorded a loss on the early extinguishment of debt of $17.3 million related to fees and the write-off of unamortized debt discount and deferred financing costs. The Company incurred approximately $4.8 million of fees in connection with the 2nd Amendment. Approximately $1.1 million of these fees were recorded as debt discount and approximately $0.7 million of these fees were
F-28
Smart & Final Holdings, Inc. and Subsidiaries
Notes to Consolidated Financial Statements (Continued)
December 29, 2013
5. Debt (Continued)
recorded as deferred financing costs. They are both amortized over the term of the Term Loan Facility. Quarterly amortization of the principal amount increased to $1.8 million.
The Term Loan Facility includes restrictions on the ability of certain of the Company's domestic direct and indirect subsidiaries to incur or guarantee additional indebtedness, incur or permit to exist certain liens, enter into certain sale and lease-back transactions, make certain investments, loans and advances, effect certain mergers, consolidations, asset sales and acquisitions, pay dividends on, or redeem or repurchase, capital stock, enter into transactions with affiliates, materially change their respective businesses and repay or modify certain other agreements with respect to other material indebtedness or modify their respective organizational documents. In addition, the Term Loan Facility places certain restrictions on Intermediate Holdings with respect to the incurrence or creation of additional liens on the equity interests of certain subsidiaries, the preservation of its corporate existence and maintenance of its passive holding company status. As of December 29, 2013 the Company was in compliance with the terms of the Term Loan Facility.
Under the Term Loan Facility, provided no event of default has occurred and is continuing, Smart & Final Stores LLC is permitted to pay dividends to the parent company in an amount not to exceed $50 million, at December 29, 2013, and pursuant to certain other limited exceptions. The restricted net assets of the Company's consolidated subsidiaries is $343 million as of December 29, 2013.
The Revolving Credit Facility provides financing of up to $150 million (including up to $50.0 million for the issuance of letters of credit) subject to a borrowing base, for a term of five years. The borrowing base is a formula based on certain eligible inventory and receivables, minus certain reserves.
All obligations under the Revolving Credit Facility are secured by (1) a first-priority security interest in the accounts receivable, inventory, cash and cash equivalents, and related assets of Smart & Final Stores and Intermediate Holdings and the other guarantors under the facility, and (2) a second-priority security interest in substantially all of the other property and assets of, as well as the equity interests owned by, Smart & Final Stores and Intermediate Holdings and the other guarantors under the facility.
Borrowings under the Revolving Credit Facility bear interest at an applicable margin plus, at Smart & Final Stores' option, a fluctuating rate equal to either (1) adjusted LIBOR (defined as a rate equal to the LIBOR rate in effect for the applicable interest period, as adjusted for statutory reserves) or (2) the alternate base rate (defined as a fluctuating rate equal to the highest of (x) the federal funds effective rate plus 0.50%, (y) the interest rate announced by the administrative agent as its "Prime Rate" and (z) the adjusted LIBOR rate for an interest period of one month plus 1.00%). The applicable margin is determined by a pricing grid based on the facility availability. At each of December 29, 2013 and December 30, 2012, the alternate base rate was 3.25% and the applicable margin for alternate base rate loans was 0.25% for a total rate of 3.50%. The calculated borrowing base of the Revolving Credit Facility was $147.8 million and $138.4 million at December 29, 2013 and December 30, 2012, respectively. At December 30, 2012, there was $2.0 million outstanding under the Revolving Credit Facility and was classified under "Current portion of long-term debt, less debt discount" in the consolidated balance sheet. The Company repaid the full amount under this facility in 2013 and as of December 29, 2013, there was no balance outstanding under the Revolving Credit Facility.
F-29
Smart & Final Holdings, Inc. and Subsidiaries
Notes to Consolidated Financial Statements (Continued)
December 29, 2013
5. Debt (Continued)
The Revolving Credit Facility also provides for a $50.0 million sub-limit for letters of credit of which the Company had $26.6 million and $26.7 million outstanding as of December 29, 2013 and December 30, 2012, respectively. As of December 29, 2013 and December 30, 2012, the amount available for borrowing under the Revolving Credit Facility was $121.2 million and $109.7 million, respectively.
The Revolving Credit Facility does not include financial covenant requirements unless a defined covenant trigger event has occurred and is continuing. If a covenant trigger event has occurred, Smart & Final Stores must maintain a fixed charge coverage ratio of not less than 1.0 to 1.0 for the most recent period of four consecutive fiscal quarters for which required financial statements are available at the time of occurrence of such covenant trigger event. A covenant trigger event shall have occurred at any time that availability is less than the greater of (a) $12.5 million and (b) 10.0% of the line cap (the lesser of the aggregate commitments under the Revolving Credit Facility and the borrowing base then in effect) then in effect. Once commenced, a covenant trigger event shall be deemed to be continuing until such time as availability equals or exceeds the greater of (i) $12.5 million and (ii) 10.0% of the line cap then in effect for 20 consecutive days. As of December 29, 2013 and December 30, 2012, no trigger event had occurred.
Successor Principal Payments
Aggregate future principal payments of the Company's debt are as follows (in thousands):
Fiscal Year: |
||||
2014 |
$ | 7,200 | ||
2015 |
9,000 | |||
2016 |
7,200 | |||
2017 |
7,200 | |||
2018 |
7,200 | |||
Thereafter |
677,988 | |||
| | | | | |
Total |
$ | 715,788 | ||
| | | | | |
| | | | | |
Predecessor Credit Facilities
In conjunction with the Apollo Acquisition, the Predecessor Company entered into four financing arrangements effective May 31, 2007, including a Commercial Mortgage Real Estate Agreement (the "CMBS Facility"), an Asset Based Lending Facility (the "Predecessor ABL Facility") and two Term Loan Agreements (the "Predecessor 1st Lien Term Loan" and the "Predecessor 2nd Lien Term Loan").
The CMBS Facility provided $240.0 million in gross proceeds at May 31, 2007, to a real estate subsidiary, established by the Predecessor on May 31, 2007, which owned the Predecessor's store and warehouse distribution properties that served as collateral solely for the CMBS Facility. At January 2, 2011, the CMBS Facility was secured by owned real estate related to 60 retail store properties and two warehouse distribution facilities. During the fourth quarter of 2011, the Predecessor sold and leased back 39 store properties and one warehouse distribution facility previously securing the CMBS Facility. See Note 8, Lease Obligations. In connection with the sales, the Predecessor received proceeds of
F-30
Smart & Final Holdings, Inc. and Subsidiaries
Notes to Consolidated Financial Statements (Continued)
December 29, 2013
5. Debt (Continued)
$230.3 million. The Predecessor used the proceeds to repay all amounts outstanding under the CMBS Facility. As of January 1, 2012 restricted cash of $5.0 million was held in trust for payment of property taxes, insurance and rent on the owned properties which secured the CMBS Facility. During the first quarter of 2012, this cash held in trust was returned to the Predecessor after all amounts outstanding under the CMBS Facility were repaid.
The Predecessor ABL Facility, as amended, provided financing up to $125.0 million and had a maturity date that was the earlier of June 29, 2016, or sixty days prior to the Predecessor 2nd Lien Term Loan maturity date (unless such term loan had been refinanced or paid in full). The Predecessor ABL Facility's borrowing base was a formula based on certain eligible inventory and receivables, minus certain reserves.
Borrowings under the Predecessor ABL Facility bore interest at a rate equal to, at the borrower's option, either: (i) an alternate base rate plus an applicable margin with the base rate determined by the higher of 1) the federal funds rate plus 0.05%, or 2) the lending agent's prime rate, or (ii) a Eurocurrency loan rate based on LIBOR plus an applicable margin. In both the original facility and the amended facility, the applicable margin is determined by a pricing grid based on the facility availability, but the pricing grid is slightly different in the amended facility. During the period January 2, 2012 through November 14, 2012, $12.0 million of the Predecessor ABL Facility was drawn and then repaid in full. There was no balance outstanding under the Predecessor ABL Facility as of November 14, 2012.
The Predecessor 1st Lien Term Loan was for a seven-year term and provided financing up to a maximum of $398.0 million in proceeds. At May 31, 2007, the Predecessor 1st Lien Term Loan was initially drawn to provide $238.0 million in gross proceeds as a part of the funding for the Apollo Acquisition. The additional $160.0 million was borrowed on September 25, 2007, to finance the Henry's Acquisition (defined in Note 11, Related Party Transactions).
Borrowings under the Predecessor 1st Lien Term Loan bore interest at a rate equal to, at the borrower's option, either: (i) an alternate base rate plus 2.0%, with the base rate determined as the higher of 1) the federal funds rate plus 0.05%, or 2) the lending agent's prime rate, or (ii) a LIBOR loan rate based on LIBOR plus 3.0%. In 2010, the Predecessor 1st Lien Term Loan was amended. Within the amended agreement there were two tranches of debt specified. There was a tranche of $107.0 million for which the original terms of the Predecessor 1st Lien Term Loan were applied, and there was a tranche of $278.0 million for which the terms were amended. The interest rate spread for the tranche of $278.0 million was changed to LIBOR plus 4.75%. The Predecessor amended agreement extended the maturity of the $278.0 million tranche to May 31, 2016.
The Predecessor 1st Lien Term Loan contained a provision for quarterly amortization of the principal in the amount of $1.0 million beginning September 30, 2007. This quarterly amortization of the principal in the amount of $1.0 million was divided between the $107.0 million tranche and the $278.0 million tranche. The Predecessor was required to make principal amortization payments of $0.3 million on the $107.0 million tranche and $0.7 million on the $278.0 million tranche every quarter until maturity. During the second quarter of 2011, the Predecessor 1st Lien Term Loan was amended. As part of that amendment, the Predecessor made principal amortization payments of $1.0 million and a prepayment of $209.7 million to the Predecessor 1st Lien Term Loan. Also, no principal amortization payment was required until maturity. As of November 14, 2012, the amount outstanding under both
F-31
Smart & Final Holdings, Inc. and Subsidiaries
Notes to Consolidated Financial Statements (Continued)
December 29, 2013
5. Debt (Continued)
tranches of the Predecessor 1st Lien Term Loan was $166.8 million. On November 15, 2012, the Predecessor 1st Lien Term Loan was terminated and paid in full in conjunction with the Ares Acquisition.
The Predecessor 2nd Lien Term Loan was for a 7.5-year term and provided $140.0 million in gross proceeds at May 31, 2007.
Borrowings under the Predecessor 2nd Lien Term Loan bore interest at a rate equal to, at the borrower's option, either: (i) an alternate base rate plus 5.75%, with the base rate determined as the higher of 1) the federal funds rate plus 0.05%, or 2) the lending agent's prime rate, or (ii) a Eurocurrency loan rate based on LIBOR plus 6.75%. In 2010, the Predecessor 2nd Lien Term Loan was amended. Within the amended agreement there were two tranches of debt specified. There was a tranche of $2.2 million for which the original terms of the Predecessor 2nd Lien Term Loan applied and there was a tranche of $151.0 million for which the terms were amended. The interest rate spread for the tranche of $151.0 million was changed to 8.75% plus LIBOR, rising to 9.00% plus LIBOR on the second anniversary of the amendment to the Predecessor 2nd Lien Term Loan. The amendment extended the maturity of the $151.0 million tranche to November 30, 2016.
In 2009, the Predecessor made an election to defer payment of interest on the loan (the "PIK Interest Deferral"). As of January 2, 2011, the total deferred interest added to the principal balance of the loan was $13.2 million. As a result of the amendment, the Predecessor made the first payment of $6.5 million of the PIK Interest Deferral on the amendment date. During the second quarter of 2011, the Predecessor 2nd Lien Term Loan was amended to allow for the sale of Henry's. Consequently, the Predecessor recorded a loss on the early extinguishment of debt of $0.2 million related to the write-off of the unamortized deferred financing costs. As a result of the amendment, the Predecessor accelerated the second payment of $6.5 million of the PIK Interest Deferral from December 2010 to April 2011. As of November 14, 2012, the amount outstanding under both tranches of the Predecessor 2nd Lien Term Loan was $140.2 million. On November 15, 2012, the Predecessor 2nd Lien Term Loan was terminated and repaid in full in conjunction with the Ares Acquisition.
6. Derivative Financial Instruments
On April 15, 2013, the Company entered into a five-year interest rate swap agreement (the "Swap") to fix the LIBOR component of interest under the Term Loan Credit Facility at 1.7325% on a variable notional amount starting at $422.7 million and declining to $359.7 million for the period from September 30, 2014 through March 29, 2018. The Swap has been designated as a cash flow hedge against LIBOR interest rate movements and formally assessed, both at inception and at least quarterly thereafter, as to whether it was effective in offsetting changes in cash flows of the hedged item. The portion of the change in fair value attributable to hedge ineffectiveness was recorded in "Interest expense, net" in the Company's consolidated statements of operations and comprehensive income (loss). The portion of the change in fair value attributable to hedge effectiveness, net of income tax effects, was recorded to "Accumulated other comprehensive income" in the Company's consolidated statements of stockholders' equity.
On May 30, 2013, the Company entered into an amendment to the Swap to change the fixed LIBOR component to 1.5995% and the floor rate to 1.00%.
F-32
Smart & Final Holdings, Inc. and Subsidiaries
Notes to Consolidated Financial Statements (Continued)
December 29, 2013
6. Derivative Financial Instruments (Continued)
As of December 29, 2013, the fair value carrying amount of the Company's interest rate swaps are recorded as follows (in thousands):
| |
December 29, 2013 |
|||
|---|---|---|---|---|
Other assets |
$ | 5,460 | ||
Accrued expenses |
(629 | ) | ||
| | | | | |
Total derivatives designated as hedging instruments |
$ | 4,831 | ||
| | | | | |
| | | | | |
The following tables summarize the gain recognized in accumulated other comprehensive income (loss) ("AOCI") and the amount of loss reclassified from AOCI into earnings for the year ended December 29, 2013, (in thousands):
| |
Amount of Gain Recognized in AOCI on Derivative, Net of Tax (Effective Portion) |
Amount of Loss Recognized in Earnings on Derivative, Net of Tax (Ineffective Portion) |
|||||
|---|---|---|---|---|---|---|---|
Interest rate swaps |
$ | 2,880 | $ | 30 | |||
7. Fair Value Measurements
The Company applies the provisions of ASC 820, Fair Value Measurements and Disclosures ("ASC 820"), for its financial and nonfinancial assets and liabilities. ASC 820 defines fair value as the price that would be received to sell an asset or paid to transfer a liability in an orderly transaction between market participants at the measurement date. ASC 820 establishes a fair value hierarchy, which prioritizes the inputs used in measuring fair value into three broad levels as follows:
Level 1—Quoted prices for identical instruments in active markets
Level 2—Quoted prices for similar instruments in active markets; quoted prices for identical or similar instruments in markets that are not active; and model-derived valuations in which all significant inputs and significant value drivers are observable in active markets
Level 3—Valuations derived from valuation techniques in which one or more significant inputs or significant value drivers are unobservable
F-33
Smart & Final Holdings, Inc. and Subsidiaries
Notes to Consolidated Financial Statements (Continued)
December 29, 2013
7. Fair Value Measurements (Continued)
The Company's assets and liabilities measured at fair value on a recurring basis are summarized in the following table by the type of inputs applicable to the fair value measurements (in thousands):
| |
Fair Value Measurement at December 29, 2013 | ||||||||||||
|---|---|---|---|---|---|---|---|---|---|---|---|---|---|
Description
|
Total as of December 29, 2013 |
Quoted Prices in Active Markets for Identical Assets (Level 1) |
Significant Other Observable Inputs (Level 2) |
Significant Unobservable Inputs (Level 3) |
|||||||||
Financial assets |
|||||||||||||
Other assets—cash and cash equivalents that fund supplemental executive retirement plan and deferred compensation plan |
$ | 739 | $ | 739 | $ | — | $ | — | |||||
Other assets—assets that fund supplemental executive retirement plan |
2,490 | 2,490 | — | — | |||||||||
Other assets—deferred compensation plan investment in Sprouts |
11,919 | — | 11,919 | — | |||||||||
Derivatives |
4,831 | — | 4,831 | — | |||||||||
Financial liabilities |
|||||||||||||
Other long-term liabilities—deferred compensation plan |
(18,831 | ) | — | (18,831 | ) | — | |||||||
| | | | | | | | | | | | | | |
Total |
$ | 1,148 | $ | 3,229 | $ | (2,081 | ) | $ | — | ||||
| | | | | | | | | | | | | | |
| | | | | | | | | | | | | | |
Level 1 Investments include money market funds of $0.7 million and market index funds of $2.5 million. The fair values of these funds are based on quoted market prices in an active market.
Level 2 Assets and liabilities include $18.8 million of deferred compensation liabilities, of which the fair value is based on quoted prices of similar assets traded in active markets, and $4.8 million of derivatives, which are interest rate hedges. The fair values of the derivatives are primarily determined based on third-party pricing services with observable inputs, including interest rates and yield curves.
Level 2 Investments also include deferred compensation plan investments in an investment vehicle invested in Sprouts. During the year ended December 29, 2013, the Company adjusted the fair market value of the investment vehicle to reflect the fair market value increase of $10.7 million. The valuation of the investment vehicle is based on the underlying asset of the entity that trades in observable markets. During the year ended December 29, 2013 the investment was reclassified from the
F-34
Smart & Final Holdings, Inc. and Subsidiaries
Notes to Consolidated Financial Statements (Continued)
December 29, 2013
7. Fair Value Measurements (Continued)
Level 3 category as the underlying asset was a nonpublic entity prior to 2013 and as such, the valuation in prior periods was based on unobservable inputs.
| |
Fair Value Measurement at December 30, 2012 | ||||||||||||
|---|---|---|---|---|---|---|---|---|---|---|---|---|---|
Description
|
Total as of December 30, 2012 |
Quoted Prices in Active Markets for Identical Assets (Level 1) |
Significant Other Observable Inputs (Level 2) |
Significant Unobservable Inputs (Level 3) |
|||||||||
Financial assets |
|||||||||||||
Other assets—cash and cash equivalents that fund supplemental executive retirement plan and deferred compensation plan |
$ | 313 | $ | 313 | $ | — | $ | — | |||||
Other assets—assets that fund supplemental executive retirement plan |
2,807 | 2,807 | — | — | |||||||||
Other assets—deferred compensation plan investment in Sprouts |
1,200 | — | — | 1,200 | |||||||||
Financial liabilities |
|||||||||||||
Other long-term liabilities—deferred compensation plan |
(7,506 | ) | — | (6,306 | ) | (1,200 | ) | ||||||
| | | | | | | | | | | | | | |
Total |
$ | (3,186 | ) | $ | 3,120 | $ | (6,306 | ) | $ | — | |||
| | | | | | | | | | | | | | |
| | | | | | | | | | | | | | |
Level 1 Investments include money market funds of $0.3 million and market index funds of $2.8 million. The fair values of these funds are based on quoted market prices in an active market.
Level 2 Liabilities include $6.3 million of deferred compensation liabilities, of which the fair value is based on quoted prices of similar assets traded in active markets.
Level 3 Assets and liabilities include deferred compensation plan investments in Sprouts of $1.2 million. The valuation of the investment and the related liability was based on unobservable inputs.
Certain assets are measured at fair value on a nonrecurring basis, which means the assets are not measured at fair value on an ongoing basis but, rather, are subject to fair value adjustments only in certain circumstances (for example, when there is evidence of impairment). See Note 2, Summary of Significant Accounting Policies—Property, Plant and Equipment, Capitalized Software and Goodwill and Intangible Assets. The fair value measurements were determined using available market capitalization rates and public comparable store sales data at the measurement dates. The Company classifies the measurements as Level 3.
8. Lease Obligations
The principal real and personal properties leased by the Company include store, office and warehouse buildings and delivery and computer equipment. As of December 29, 2013, of the Company's operating stores, 224 store properties are leased directly from third-party lessors and eight stores were on real property that is ground leased from third-party lessors. These leases had an average
F-35
Smart & Final Holdings, Inc. and Subsidiaries
Notes to Consolidated Financial Statements (Continued)
December 29, 2013
8. Lease Obligations (Continued)
remaining lease term of approximately 8.2 years as of December 29, 2013. These leases generally contain renewal options, at the Company's election, and require the Company to pay costs such as real estate taxes and common area maintenance. Certain leases include rent escalation clauses or provide for rental payments in excess of the minimum based upon the store's sales levels.
Lease expense for operating leases reported within "Cost of sales, buying and occupancy" on the Company's consolidated statements of operations and comprehensive income (loss) was $78.2 million, $9.6 million, $60.5 million and $54.1 million for the year ended December 29, 2013, the period November 15, 2012 through December 30, 2012, the period January 2, 2012 through November 14, 2012 and the year ended January 1, 2012, respectively. All lease expenses were paid to third-party lessors.
Aggregate minimum future lease payments for real property, including sale leaseback store properties, as well as equipment and other property at December 29, 2013, are as follows (in thousands):
| |
Operating Leases |
|||
|---|---|---|---|---|
Fiscal Year: |
||||
2014 |
$ | 83,335 | ||
2015 |
81,046 | |||
2016 |
75,709 | |||
2017 |
68,955 | |||
2018 |
61,625 | |||
Thereafter |
434,262 | |||
| | | | | |
Future minimum lease payments |
$ | 804,932 | ||
| | | | | |
| | | | | |
During the fourth quarter of 2011, the Predecessor Company sold 39 store properties and one warehouse distribution facility to three different buyers. Concurrent with the sales, the Predecessor Company entered into 20-year operating leases with two options to extend the term for a period of 10 years each for three store properties sold, 20-year operating leases with six options to extend the term for a period of five years each for 36 store properties sold, and a 10-year operating lease with four options to extend the term for a period of five years each for one warehouse distribution facility sold. The Predecessor Company received proceeds of $230.3 million in connection with the sales. The carrying value of the properties sold was $195.2 million. The transactions were accounted for as sale and leaseback resulting in an immediate recognition of a $2.0 million loss on the transactions and the deferral of a $32.0 million gain, which was being amortized to rent expense over various non-cancelable lease terms. During the second quarter of 2012, three additional store properties were sold. Concurrent with the sales, the Predecessor Company entered into 25-year operating leases with five options to extend the term for a period of five years. The transactions were also accounted for as sale and leaseback resulting in the deferral of a $5.6 million gain, which was being amortized to rent expense over the lease terms. These leases require the Company to pay costs such as real estate taxes and repair and maintenance. Certain leases include rent escalation clauses.
F-36
Smart & Final Holdings, Inc. and Subsidiaries
Notes to Consolidated Financial Statements (Continued)
December 29, 2013
8. Lease Obligations (Continued)
The deferred gain was included in "Other long-term liabilities" in the Predecessor's consolidated balance sheet. Deferred gain amortized and reported within "Cost of sales, buying and occupancy" on the Predecessor's consolidated statements of operations and comprehensive income (loss) was $1.7 million for the period January 2, 2012 through November 14, 2012. The remaining unamortized deferred gain of $35.9 million was written off in accordance with ASC 805 in connection with the Ares Acquisition.
The future minimum lease payments under the terms of the related lease agreements at December 29, 2013, are as follows (in thousands):
| |
Operating Leases |
|||
|---|---|---|---|---|
Fiscal Year: |
||||
2014 |
$ | 16,733 | ||
2015 |
16,810 | |||
2016 |
16,903 | |||
2017 |
16,996 | |||
2018 |
17,034 | |||
Thereafter |
207,484 | |||
| | | | | |
Future minimum lease payments |
$ | 291,960 | ||
| | | | | |
| | | | | |
9. Retirement Benefit Plans and Postretirement and Postemployment Benefit Obligations
Defined Benefit Retirement Plan
The Company has a funded noncontributory defined benefit retirement plan (the "Single-Employer Plan") that, prior to June 1, 2008, covered substantially all full-time employees following a vesting period of five years of service (the "Pension Participants") and provided defined benefits based on years of service and final average salary. The Predecessor froze the accruing of future benefits for the Pension Participants (the "Frozen Pension Participants") effective June 1, 2008, with the exception of approximately 450 hourly paid employees in the Company's distribution and transportation operations who remain eligible for pension benefits under the prior terms (the "Active Pension Participants"). No new employees are eligible for participation in the Single Employer Plan after June 1, 2008, with the exception of new hires in the Company's eligible distribution and transportation operations. Frozen Pension Participants will continue to accrue service for vesting purposes only and future payments from the Single-Employer Plan will be in accordance with the Single-Employer Plan's retirement payment provisions. The Company funds the Single-Employer Plan with annual contributions as required by the Employee Retirement Income Security Act of 1974, as amended ("ERISA"). The Company uses a measurement date of December 31 for the Single-Employer Plan.
As of December 29, 2013, the funded status of the accumulated benefit obligation was 75.5%. The Company expects to fund a minimum required contribution of $10.7 million during fiscal year 2014.
F-37
Smart & Final Holdings, Inc. and Subsidiaries
Notes to Consolidated Financial Statements (Continued)
December 29, 2013
9. Retirement Benefit Plans and Postretirement and Postemployment Benefit Obligations (Continued)
The following tables set forth the changes in benefit obligation and plan assets of this plan for the periods below (in thousands):
| |
Fiscal Year 2013 |
November 15 Through December 30, 2012 |
January 2 Through November 14, 2012 |
|||||||
|---|---|---|---|---|---|---|---|---|---|---|
| |
(Successor) |
(Successor) |
(Predecessor) |
|||||||
Change in Benefit Obligation |
||||||||||
Benefit obligation, beginning of period |
$ | (183,874 | ) | $ | (188,935 | ) | $ | (150,732 | ) | |
Service cost |
(1,311 | ) | (175 | ) | (864 | ) | ||||
Interest cost |
(7,973 | ) | (989 | ) | (6,842 | ) | ||||
Actuarial gain (loss) |
23,615 | 5,951 | (33,638 | ) | ||||||
Benefits paid |
3,747 | 274 | 3,141 | |||||||
| | | | | | | | | | | |
Benefit obligation, end of period |
$ | (165,796 | ) | $ | (183,874 | ) | $ | (188,935 | ) | |
| | | | | | | | | | | |
| | | | | | | | | | | |
| |
Fiscal Year 2013 |
November 15 Through December 30, 2012 |
January 2 Through November 14, 2012 |
|||||||
|---|---|---|---|---|---|---|---|---|---|---|
| |
(Successor) |
(Successor) |
(Predecessor) |
|||||||
Change in Plan Assets |
||||||||||
Fair value of plan assets, beginning of period |
$ | 101,660 | $ | 97,572 | $ | 88,163 | ||||
Actual return of plan assets, net of expenses |
17,423 | 4,362 | 3,550 | |||||||
Employer contribution |
7,703 | — | 9,000 | |||||||
Benefits paid |
(3,747 | ) | (274 | ) | (3,141 | ) | ||||
| | | | | | | | | | | |
Fair value of plan assets, end of period |
123,039 | 101,660 | 97,572 | |||||||
| | | | | | | | | | | |
Funded status |
(42,757 | ) | (82,214 | ) | (91,363 | ) | ||||
| | | | | | | | | | | |
Net amount recognized |
$ | (42,757 | ) | $ | (82,214 | ) | $ | (91,363 | ) | |
| | | | | | | | | | | |
| | | | | | | | | | | |
Amounts before income tax effect recognized in the consolidated balance sheets consist of the following (in thousands):
| |
December 29, 2013 |
December 30, 2012 |
|||||
|---|---|---|---|---|---|---|---|
Postretirement and postemployment benefits |
$ | (42,757 | ) | $ | (82,214 | ) | |
| | | | | | | | |
Net amount recognized |
$ | (42,757 | ) | $ | (82,214 | ) | |
| | | | | | | | |
| | | | | | | | |
F-38
Smart & Final Holdings, Inc. and Subsidiaries
Notes to Consolidated Financial Statements (Continued)
December 29, 2013
9. Retirement Benefit Plans and Postretirement and Postemployment Benefit Obligations (Continued)
Amounts before income tax effect recognized in accumulated other comprehensive income consist of the following (in thousands):
| |
December 29, 2013 |
December 30, 2012 |
January 1, 2012 |
|||||||
|---|---|---|---|---|---|---|---|---|---|---|
| |
(Successor) |
(Successor) |
(Predecessor) |
|||||||
Net actuarial gain (loss) |
$ | 42,909 | $ | 9,394 | $ | (64,557 | ) | |||
| | | | | | | | | | | |
Accumulated other comprehensive income (loss) |
$ | 42,909 | $ | 9,394 | $ | (64,557 | ) | |||
| | | | | | | | | | | |
| | | | | | | | | | | |
During 2014, $0.7 million of accumulated other comprehensive income is expected to be recognized as a component of net periodic benefit cost.
The following table shows the projected benefit obligation, the accumulated benefit obligation and the plan assets, in dollar amounts and as a percentage of the projected benefit obligation and the accumulated benefit obligation, respectively, as of each fiscal year-end (dollar amounts in thousands):
| |
December 29, 2013 |
December 30, 2012 |
|||||
|---|---|---|---|---|---|---|---|
Projected benefit obligation |
$ | 165,796 | $ | 183,874 | |||
Accumulated benefit obligation |
162,940 | 181,197 | |||||
Fair value of plan assets |
123,039 | 101,660 | |||||
Fair value of plan assets as a percentage of the projected benefit obligation |
74.2 | % | 55.3 | % | |||
Fair value of plan assets as a percentage of the accumulated benefit obligation |
75.5 | 56.1 | |||||
The components included in the net periodic benefit cost and the increase in minimum liability included in other comprehensive income (loss) for the periods indicated are as follows (in thousands):
| |
Fiscal Year 2013 |
November 15 Through December 30, 2012 |
January 2 Through November 14, 2012 |
Fiscal Year 2011 |
|||||||||
|---|---|---|---|---|---|---|---|---|---|---|---|---|---|
| |
(Successor) |
(Successor) |
(Predecessor) |
(Predecessor) |
|||||||||
Service cost component |
$ | 1,311 | $ | 175 | $ | 864 | $ | 878 | |||||
Interest cost component |
7,973 | 989 | 6,842 | 7,595 | |||||||||
Expected return on plan assets |
(7,523 | ) | (919 | ) | (5,947 | ) | (6,979 | ) | |||||
Amortization of net actuarial loss |
— | — | 1,106 | 764 | |||||||||
| | | | | | | | | | | | | | |
Net periodic benefit cost |
$ | 1,761 | $ | 245 | $ | 2,865 | $ | 2,258 | |||||
| | | | | | | | | | | | | | |
| | | | | | | | | | | | | | |
As a result of the Predecessor Company freezing plan benefits for substantially all of the Pension Participants effective June 1, 2008, the amortization of the unrecognized net actuarial loss (in excess of 10% of the greater of the projected benefit obligation or the fair value of plan assets) has been amortized on a straight-line basis over the expected average future lifetime of inactive participants expected to benefit under the plan.
F-39
Smart & Final Holdings, Inc. and Subsidiaries
Notes to Consolidated Financial Statements (Continued)
December 29, 2013
9. Retirement Benefit Plans and Postretirement and Postemployment Benefit Obligations (Continued)
The weighted-average assumptions used to determine benefit obligations for this plan at fiscal year-end were as follows:
| |
December 29, 2013 |
December 30, 2012 |
|||||
|---|---|---|---|---|---|---|---|
| |
(Successor) |
(Successor) |
|||||
Discount rate |
5.15 | % | 4.30 | % | |||
Rate of compensation increase |
2.50 | 2.50 | |||||
The Company determines the discount rate assumption based on the internal rate of return for a portfolio of high quality bonds, with a minimum rating of Moody's AA Corporate and with maturities that are consistent with the projected future cash flow obligations.
The weighted-average assumptions used to determine net periodic benefit cost for each of the periods indicated were as follows:
| |
Fiscal Year 2013 |
November 15 Through December 30, 2012 |
January 2 Through November 14, 2012 |
Fiscal Year 2011 |
|||||||||
|---|---|---|---|---|---|---|---|---|---|---|---|---|---|
| |
(Successor) |
(Successor) |
(Predecessor) |
(Predecessor) |
|||||||||
Discount rate |
4.30 | % | 4.10 | % | 5.25 | % | 5.85 | % | |||||
Expected long-term return on plan assets |
7.30 | 7.50 | 7.50 | 7.85 | |||||||||
Rate of compensation increase |
2.50 | 2.50 | 2.50 | 3.00 | |||||||||
The Company determines the expected long-term rate of return on plan assets based on an allocation approach that considers diversification and rebalancing for a portfolio of assets invested over a long-term time horizon. The approach relies on the historical returns of the plan's portfolio and relationships between equities and fixed income investments, consistent with the widely accepted capital market principle that a diversified portfolio with a larger allocation to equity investments can generate a greater return over the long run.
Plan assets are managed by outside investment managers and rebalanced among managers periodically at the Company's direction to realign assets to the target allocation. The managers allocate assets to individual investments within guidelines specified by the Company. The Company's strategy with respect to the plan asset investments has been to allocate a larger proportion to equities to achieve returns that sufficiently grow assets to cover the benefit obligations within acceptable risk parameters.
F-40
Smart & Final Holdings, Inc. and Subsidiaries
Notes to Consolidated Financial Statements (Continued)
December 29, 2013
9. Retirement Benefit Plans and Postretirement and Postemployment Benefit Obligations (Continued)
The plan asset allocation at the end of 2013 and 2012, and target allocation for 2014, in percentages, by asset category are as follows:
| |
Target Allocation 2014 |
December 29, 2013 |
December 30, 2012 |
|||||||
|---|---|---|---|---|---|---|---|---|---|---|
Equity securities |
60 | % | 64 | % | 57 | % | ||||
Debt securities |
37 | 31 | 36 | |||||||
Cash and cash equivalents |
3 | 5 | 7 | |||||||
| | | | | | | | | | | |
Total |
100 | % | 100 | % | 100 | % | ||||
| | | | | | | | | | | |
| | | | | | | | | | | |
The following table summarizes plan assets measured at fair value on December 29, 2013 and December 30, 2012, respectively (in thousands):
December 29, 2013
|
Total | Quoted Prices in Active Markets for Identical Assets (Level 1) |
Significant Observable Inputs (Level 2) |
Significant Unobservable Inputs (Level 3) |
|||||||||
|---|---|---|---|---|---|---|---|---|---|---|---|---|---|
Asset category |
|||||||||||||
Equity securities(1) |
$ | 78,773 | $ | 57,423 | $ | 21,350 | $ | — | |||||
Debt securities(2) |
37,786 | 22,233 | 15,060 | 493 | |||||||||
Cash and cash equivalents(3) |
6,480 | 6,480 | — | — | |||||||||
| | | | | | | | | | | | | | |
Total |
$ | 123,039 | $ | 86,136 | $ | 36,410 | $ | 493 | |||||
| | | | | | | | | | | | | | |
| | | | | | | | | | | | | | |
December 30, 2012
|
Total | Quoted Prices in Active Markets for Identical Assets (Level 1) |
Significant Observable Inputs (Level 2) |
Significant Unobservable Inputs (Level 3) |
|||||||||
|---|---|---|---|---|---|---|---|---|---|---|---|---|---|
Asset category |
|||||||||||||
Equity securities(1) |
$ | 58,384 | $ | 42,584 | $ | 15,800 | $ | — | |||||
Debt securities(2) |
36,351 | 14,494 | 21,340 | 517 | |||||||||
Cash and cash equivalents(3) |
6,925 | 6,925 | — | — | |||||||||
| | | | | | | | | | | | | | |
Total |
$ | 101,660 | $ | 64,003 | $ | 37,140 | $ | 517 | |||||
| | | | | | | | | | | | | | |
| | | | | | | | | | | | | | |
- (1)
- Equity securities include U.S. and foreign exchange traded common and preferred stocks and mutual funds. Common and preferred shares issued by U.S. and non-U.S. corporations are traded actively on exchanges and price quotes for these shares are readily available. Holdings of corporate stock are categorized as Level 1 investments. The securities categorized as Level 2 investments are American Depository Receipts. While these securities are traded in an active market, the trustee uses several observable market based inputs, such as exchange rates, to obtain the pricing of the securities.
F-41
Smart & Final Holdings, Inc. and Subsidiaries
Notes to Consolidated Financial Statements (Continued)
December 29, 2013
9. Retirement Benefit Plans and Postretirement and Postemployment Benefit Obligations (Continued)
- (2)
- Debt
securities include the debt of the U.S. Treasury and U.S. and foreign corporate issuers. U.S. Treasury notes and bonds are actively traded and price
quotes for these securities are readily available. Holdings of U.S. Treasury notes and bonds are categorized as Level 1 investments. Corporate bond securities of U.S. and foreign corporate
issuers are valued by independent pricing sources using a variety of market sources and observed market movements. Holdings of U.S. and foreign corporate issuers debt securities are categorized as
Level 2 investments. Infrequently traded corporate bonds and asset-backed securities, requiring valuation using observable as well as unobservable inputs, such as the estimation of the market
manager for the security, are categorized as Level 3 investments.
- (3)
- Cash and cash equivalents include short-term U.S. government investment notes, short-term money market mutual funds, accrued income and cash held on account. Cash held on account and short-term U.S. government investment notes (including accrued income thereon) for which there is an active market and daily pricing for the security are categorized as Level 1 investments.
| |
Fair Value Measurements Using Significant Unobservable Inputs (Level 3) |
|||
|---|---|---|---|---|
Ending balance at December 30, 2012 |
$ | 517 | ||
Actual return on plan assets: |
||||
Assets held at end of year |
(12 | ) | ||
Assets sold during the year |
— | |||
Purchases, sales and settlements |
(12 | ) | ||
Transfers in and/or out of Level 3 |
— | |||
| | | | | |
Ending balance at December 29, 2013 |
$ | 493 | ||
| | | | | |
| | | | | |
| |
Fair Value Measurements Using Significant Unobservable Inputs (Level 3) |
|||
|---|---|---|---|---|
Ending balance at January 1, 2012 |
$ | 354 | ||
Actual return on plan assets: |
||||
Assets held at end of year |
43 | |||
Assets sold during the year |
— | |||
Purchases, sales and settlements |
120 | |||
Transfers in and/or out of Level 3 |
— | |||
| | | | | |
Ending balance at December 30, 2012 |
$ | 517 | ||
| | | | | |
| | | | | |
The Company seeks to maximize medium- to long-term returns of overall pension plan assets with reasonable levels of investment risk. One element of controlling overall investment risk is through diversification of asset allocation, among domestic and international equity and debt instruments. The plan's equity investments include foreign and domestic exchange traded equities across a range of
F-42
Smart & Final Holdings, Inc. and Subsidiaries
Notes to Consolidated Financial Statements (Continued)
December 29, 2013
9. Retirement Benefit Plans and Postretirement and Postemployment Benefit Obligations (Continued)
industries and countries, but primarily in the domestic markets. The plan's debt securities are primarily invested in government and corporate issuers primarily in the domestic market.
The following benefit payments, which reflect expected future service, as appropriate, are expected to be paid (in thousands):
2014 |
$ | 5,017 | ||
2015 |
5,058 | |||
2016 |
5,604 | |||
2017 |
6,041 | |||
2018 |
6,239 | |||
2019 - 2023 |
38,381 |
Multi-employer Pension Plan
The Company participates in and contributes to a multi-employer pension plan on behalf of union employees in its Cash & Carry operations. At December 29, 2013 and December 30, 2012, there were approximately 165 and 152 union employees covered under this plan, respectively. The Company's employer contributions and corresponding pension expense for this plan were $1.2 million, $0.2 million, $1.0 million and $1.0 million for the year ended December 29, 2013, for the period November 15, 2012 through December 30, 2012, the period January 2, 2012 through November 14, 2012, and the year ended January 1, 2012 respectively.
The multi-employer plan is the Western Conference of Teamsters Pension Plan (the "Teamsters Plan"), which was established pursuant to the Western Conference of Teamsters Pension Agreement and Declaration of Trust dated April 26, 1955 ("Trust Agreement"). The Teamsters Plan (EIN 91-6145047; Plan Number 001) provides and maintains retirement, death and termination benefits for employees in collective bargaining units represented by local unions affiliated with the Western Conference of Teamsters. The Teamsters Plan is subject to the provisions of ERISA, as amended.
The Trust Agreement provides that the trustees of the Teamsters Plan shall establish and adjust the levels of prospective plan benefits so that employer contributions received by the Teamsters Plan will always meet the minimum funding standards of Section 302 of ERISA and Section 412 of the Internal Revenue Code of 1986. The trustees have established a funding policy that specifies funding targets that may result in more rapid funding than prescribed by the minimum funding standards and that provides for benefit adjustments based on specified funding targets. The Teamsters Plan's actuary has advised that the minimum funding requirements of ERISA are being met as of January 1, 2013 (based on the most recent information available).
As of January 1, 2013, the Teamsters Plan actuarial present value of accumulated plan benefits was $37,865.4 million and the actuarial value of assets for funding the standard account was $34,132.5 million, resulting in a funded percentage of 90.1%. The Teamsters Plan covered approximately 539,000 participants as of December 31, 2012. Approximately 1,620 employers participate in the Teamsters Plan and total employer contributions for the plan year ended December 31, 2012, aggregated $1,367.3 million.
F-43
Smart & Final Holdings, Inc. and Subsidiaries
Notes to Consolidated Financial Statements (Continued)
December 29, 2013
9. Retirement Benefit Plans and Postretirement and Postemployment Benefit Obligations (Continued)
Defined Contribution Plan
The Company offers all qualified employees the opportunity to participate in a defined contribution plan, which is qualified under the requirements of Section 401(k) of the Internal Revenue Code of 1986, as amended. The Smart & Final 401(k) Savings Plan (the "S&F Savings Plan") covers all of the Company's employees who have completed at least three months of service. The Company automatically enrolls newly eligible employees into the S&F Savings Plan at 3% of their eligible compensation unless they choose to opt out of such enrollment. The S&F Savings Plan allowed participants to contribute up to 75% of their eligible compensation, not exceeding $17,000 for participants under the age of 50 or $22,500 for employees at the age of 50 or over for 2013 and 2012. For Frozen Pension Participants, the Company matched 50% of each dollar contributed up to 6% of the participant's eligible compensation during 2013 and 2012. For Active Pension Participants, the Company matched 33% of each dollar contributed up to 6% of the participant's eligible compensation during 2013 and 2012. Contributions made to the S&F Savings Plan were $3.9 million, $0.4 million and $3.2 million for the year ended December 29, 2013, the period November 15, 2012 through December 30, 2012 and the period January 2, 2012 through November 14, 2012, respectively.
Deferred Compensation Plan
The Company maintains a contributory, nonqualified deferred compensation plan which, for each year, permits key employees and members of our board of directors to elect to defer up to 100% of their compensation for such year until retirement. The retirement benefit to be provided under the plan is a function of the participant's deferred compensation and earnings thereupon. The plan is designed to primarily fund the retirement benefit liability through maintenance of certain investments, including participant cash deferrals. The liability to the deferred compensation plan participants was $22.4 million and $7.4 million at December 29, 2013 and December 30, 2012, respectively, and is included in "Other long-term liabilities" in the Company's consolidated balance sheets. The Company has certain investments, including corporate-owned life insurance policies, which investments had a market value that offset the participant liabilities at each of these measurement dates.
Supplemental Executive Retirement Plan
The Company maintains a noncontributory, nonqualified supplemental executive retirement plan (the "SERP"), which provides supplemental income payments for certain current and former corporate officers in retirement. The SERP contains provisions that provide for an acceleration of vesting in the event of a change in control. As a result of the Apollo Acquisition, all SERP participants employed by the Predecessor Company, except for one participant, became fully vested in their respective retirement benefits as of May 31, 2007. No new participants were added after this date, and service and compensation accruals were frozen effective June 1, 2008. Accordingly, the retirement benefit for plan participants who remained employed by the Company was frozen, and future service or compensation increases will not adjust the SERP benefit amount.
The liability to SERP participants was $30.1 million and $33.4 million at December 29, 2013 and December 30, 2012, respectively, and is included in "Post-retirement and post-employment benefits" in the Company's consolidated balance sheets. The Company uses a measurement date of December 31 for the SERP. To provide partial funding for the SERP, the Company invests in corporate-owned life
F-44
Smart & Final Holdings, Inc. and Subsidiaries
Notes to Consolidated Financial Statements (Continued)
December 29, 2013
9. Retirement Benefit Plans and Postretirement and Postemployment Benefit Obligations (Continued)
insurance policies. The cash surrender value of these policies was $19.3 million and $16.5 million at December 29, 2013 and December 30, 2012, respectively, and is included in "Other assets" in the Company's consolidated balance sheets.
The following tables set forth the changes in benefit obligation and plan assets for each of the periods indicated (in thousands):
| |
Fiscal Year 2013 |
November 15 Through December 30, 2012 |
January 2 Through November 14, 2012 |
|||||||
|---|---|---|---|---|---|---|---|---|---|---|
| |
(Successor) |
(Successor) |
(Predecessor) |
|||||||
Benefit obligation, beginning of period |
$ | (33,201 | ) | $ | (33,724 | ) | $ | (31,636 | ) | |
Interest cost |
(992 | ) | (121 | ) | (1,001 | ) | ||||
Actuarial gain (loss) |
2,346 | 485 | (2,874 | ) | ||||||
Benefits paid |
1,904 | 159 | 1,787 | |||||||
| | | | | | | | | | | |
Benefit obligation, end of period |
(29,943 | ) | (33,201 | ) | (33,724 | ) | ||||
| | | | | | | | | | | |
Employer contribution |
1,904 | 159 | 1,787 | |||||||
Benefits paid |
(1,904 | ) | (159 | ) | (1,787 | ) | ||||
| | | | | | | | | | | |
Fair value of plan assets, end of period |
— | — | — | |||||||
| | | | | | | | | | | |
Funded status |
(29,943 | ) | (33,201 | ) | (33,724 | ) | ||||
Unrecognized net actuarial (gain) loss |
(2,831 | ) | (485 | ) | 10,079 | |||||
| | | | | | | | | | | |
Accrued benefit cost |
$ | (32,774 | ) | $ | (33,686 | ) | $ | (23,645 | ) | |
| | | | | | | | | | | |
| | | | | | | | | | | |
Amounts before income tax effect recognized in the consolidated balance sheets consist of the following (in thousands):
| |
December 29, 2013 |
December 30, 2012 |
|||||
|---|---|---|---|---|---|---|---|
Other accrued liabilities |
$ | (1,905 | ) | $ | (1,869 | ) | |
Postretirement and postemployment benefits |
(28,038 | ) | (31,332 | ) | |||
| | | | | | | | |
Net amount recognized |
$ | (29,943 | ) | $ | (33,201 | ) | |
| | | | | | | | |
| | | | | | | | |
Amounts before income tax effect recognized in accumulated other comprehensive income consist of the following (in thousands):
| |
December 29, 2013 |
December 30, 2012 |
January 1, 2012 |
|||||||
|---|---|---|---|---|---|---|---|---|---|---|
| |
(Successor) |
(Successor) |
(Predecessor) |
|||||||
Net actuarial gain (loss) |
$ | 2,831 | $ | 485 | $ | (7,613 | ) | |||
| | | | | | | | | | | |
Accumulated other comprehensive income (loss) |
$ | 2,831 | $ | 485 | $ | (7,613 | ) | |||
| | | | | | | | | | | |
| | | | | | | | | | | |
F-45
Smart & Final Holdings, Inc. and Subsidiaries
Notes to Consolidated Financial Statements (Continued)
December 29, 2013
9. Retirement Benefit Plans and Postretirement and Postemployment Benefit Obligations (Continued)
During 2014, no accumulated other comprehensive income is expected to be recognized as a component of net periodic benefit cost.
The projected benefit obligation for this plan was $29.9 million and $33.2 million at December 29, 2013 and December 30, 2012, respectively.
The components included in the net periodic benefit cost for each of the periods indicated are as follows (in thousands):
| |
Fiscal Year 2013 |
November 15 Through December 30, 2012 |
January 2 Through November 14, 2012 |
Fiscal Year 2011 |
|||||||||
|---|---|---|---|---|---|---|---|---|---|---|---|---|---|
| |
(Successor) |
(Successor) |
(Predecessor) |
(Predecessor) |
|||||||||
Interest cost component |
$ | 992 | $ | 121 | $ | 1,001 | $ | 1,333 | |||||
Amortization of actuarial losses |
— | — | 409 | 131 | |||||||||
| | | | | | | | | | | | | | |
Net periodic benefit cost |
$ | 992 | $ | 121 | $ | 1,410 | $ | 1,464 | |||||
| | | | | | | | | | | | | | |
| | | | | | | | | | | | | | |
The weighted-average assumptions used to determine benefit obligations at the fiscal year-ends indicated are as follows:
| |
December 29, 2013 |
December 30, 2012 |
January 1, 2012 |
|||||||
|---|---|---|---|---|---|---|---|---|---|---|
| |
(Successor) |
(Successor) |
(Predecessor) |
|||||||
Discount rate |
4.14 | % | 3.17 | % | 3.85 | % | ||||
Rate of compensation increase |
N/A | N/A | N/A | |||||||
The weighted-average assumptions used to determine net periodic benefit cost for each of the periods indicated are as follows:
| |
Fiscal Year 2013 |
November 15 Through December 30, 2012 |
January 2 Through November 14, 2012 |
Fiscal Year 2011 |
|||||||||
|---|---|---|---|---|---|---|---|---|---|---|---|---|---|
| |
(Successor) |
(Successor) |
(Predecessor) |
(Predecessor) |
|||||||||
Discount rate |
3.17 | % | 3.02 | % | 3.85 | % | 5.00 | % | |||||
Rate of compensation increase |
N/A | N/A | N/A | N/A | |||||||||
The following benefit payments, which reflect expected future service, as appropriate, are expected to be paid (in thousands):
Fiscal Year: |
||||
2014 |
$ | 1,905 | ||
2015 |
1,905 | |||
2016 |
1,920 | |||
2017 |
1,920 | |||
2018 |
1,993 | |||
2019 - 2023 |
12,096 |
F-46
Smart & Final Holdings, Inc. and Subsidiaries
Notes to Consolidated Financial Statements (Continued)
December 29, 2013
9. Retirement Benefit Plans and Postretirement and Postemployment Benefit Obligations (Continued)
Postretirement and Postemployment Benefit Obligations
The Company provides health care benefits for certain retired employees. Prior to June 1, 2008, substantially all full-time employees could become eligible for those benefits if they reached retirement age while still working for the Company. The Company froze the accruing of benefits for eligible participants effective June 1, 2008. Participants who were eligible for a retiree medical benefit and retired prior to June 1, 2009 continued to be eligible for retiree medical coverage. The Company retains the right to make further amendments to the benefit formula and eligibility requirements. This postretirement health care plan is contributory with participants' contributions adjusted annually. The plan limits benefits to the lesser of the actual cost for the medical coverage selected or a defined dollar benefit based on years of service, applicable to current retirees. The Company uses a measurement date of December 31 for this health care plan.
The reconciliation of benefit obligation and plan assets for 2013 and 2012 are aggregated as follows (in thousands):
| |
Fiscal Year 2013 |
November 15 Through December 30, 2012 |
January 2 Through November 14, 2012 |
|||||||
|---|---|---|---|---|---|---|---|---|---|---|
| |
(Successor) |
(Successor) |
(Predecessor) |
|||||||
Change in Benefit Obligation |
||||||||||
Benefit obligation, beginning of period |
$ | (15,397 | ) | $ | (15,501 | ) | $ | (13,863 | ) | |
Service cost |
(334 | ) | (44 | ) | (229 | ) | ||||
Interest cost |
(597 | ) | (77 | ) | (587 | ) | ||||
Plan participants' contributions |
(377 | ) | (90 | ) | (407 | ) | ||||
Actuarial gain (loss) |
1,710 | 168 | (1,554 | ) | ||||||
Benefits paid |
1,141 | 147 | 1,139 | |||||||
| | | | | | | | | | | |
Benefit obligation, end of period |
(13,854 | ) | (15,397 | ) | (15,501 | ) | ||||
| | | | | | | | | | | |
Change in Plan Assets |
||||||||||
Employer contribution |
764 | 57 | 732 | |||||||
Plan participants' contributions |
377 | 90 | 407 | |||||||
Benefits paid |
(1,141 | ) | (147 | ) | (1,139 | ) | ||||
| | | | | | | | | | | |
Fair value of plan assets, end of period |
— | — | — | |||||||
| | | | | | | | | | | |
Funded status |
(13,854 | ) | (15,397 | ) | (15,501 | ) | ||||
| | | | | | | | | | | |
Net amount recognized |
$ | (13,854 | ) | $ | (15,397 | ) | $ | (15,501 | ) | |
| | | | | | | | | | | |
| | | | | | | | | | | |
F-47
Smart & Final Holdings, Inc. and Subsidiaries
Notes to Consolidated Financial Statements (Continued)
December 29, 2013
9. Retirement Benefit Plans and Postretirement and Postemployment Benefit Obligations (Continued)
Amounts before income tax effect recognized in the consolidated balance sheets consist of the following (in thousands):
| |
December 29, 2013 |
December 30, 2012 |
|||||
|---|---|---|---|---|---|---|---|
Other accrued liabilities |
$ | (905 | ) | $ | (1,106 | ) | |
Postretirement and postemployment benefits |
(12,949 | ) | (14,291 | ) | |||
| | | | | | | | |
Net amount recognized |
$ | (13,854 | ) | $ | (15,397 | ) | |
| | | | | | | | |
| | | | | | | | |
Amounts before income tax effect recognized in accumulated other comprehensive income consist of the following (in thousands):
| |
December 29, 2013 |
December 30, 2012 |
January 1, 2012 |
|||||||
|---|---|---|---|---|---|---|---|---|---|---|
| |
(Successor) |
(Successor) |
(Predecessor) |
|||||||
Net actuarial gain (loss) |
$ | 1,878 | $ | 168 | $ | (1,260 | ) | |||
Prior service credit |
— | — | 431 | |||||||
| | | | | | | | | | | |
Accumulated other comprehensive income (loss) |
$ | 1,878 | $ | 168 | $ | (829 | ) | |||
| | | | | | | | | | | |
| | | | | | | | | | | |
During 2014, $43,000 of accumulated other comprehensive income is expected to be recognized as a component of net periodic benefit cost.
The components included in the postretirement benefit cost for each of the periods indicated are as follows (in thousands):
| |
Fiscal Year 2013 |
November 15 Through December 30, 2012 |
January 2 Through November 14, 2012 |
Fiscal Year 2011 |
|||||||||
|---|---|---|---|---|---|---|---|---|---|---|---|---|---|
| |
(Successor) |
(Successor) |
(Predecessor) |
(Predecessor) |
|||||||||
Service cost component |
$ | 334 | $ | 44 | $ | 229 | $ | 222 | |||||
Interest cost component |
597 | 77 | 587 | 719 | |||||||||
Prior service credit |
— | — | (36 | ) | (41 | ) | |||||||
| | | | | | | | | | | | | | |
Net periodic benefit cost |
$ | 931 | $ | 121 | $ | 780 | $ | 900 | |||||
| | | | | | | | | | | | | | |
| | | | | | | | | | | | | | |
The weighted-average discount rate used to determine benefit obligations for this plan was 4.80% for the year ended December 29, 2013 and 4.00% for the year ended December 30, 2012.
The weighted-average discount rate used to determine net periodic benefit cost was 4.00%, 3.90% and 5.05% for the year ended December 29, 2013, the period November 15, 2012 through December 30, 2012 and the period January 2, 2012 through November 14, 2012, respectively.
F-48
Smart & Final Holdings, Inc. and Subsidiaries
Notes to Consolidated Financial Statements (Continued)
December 29, 2013
9. Retirement Benefit Plans and Postretirement and Postemployment Benefit Obligations (Continued)
For measurement purposes, the Company used the following assumptions in regard to health care cost trends:
| |
2013 | 2012 | 2011 | |||||||
|---|---|---|---|---|---|---|---|---|---|---|
| |
(Successor) |
(Successor) |
(Predecessor) |
|||||||
Health care cost trend rate assumed for next year |
8.50 | % | 9.00 | % | 9.00 | % | ||||
Rate to which the cost trend rate is assumed to decline (ultimate trend rate) |
5.00 | % | 5.00 | % | 5.00 | % | ||||
Year that the rate reaches the ultimate trend rate |
2020 | 2020 | 2016 | |||||||
The annual rate of health care cost of covered claims is assumed to decrease by 0.5% per year until an ultimate trend rate of 5.00% is reached in 2020 and to remain at that level thereafter.
The Company offers a defined dollar benefit plan providing a maximum fixed dollar amount of coverage that does not increase with medical inflation. A one-percentage-point change in the assumed health care cost trend rates would have the following effects (in thousands):
| |
1-Percentage Point Increase |
1-Percentage Point Decrease |
|||||
|---|---|---|---|---|---|---|---|
Effect on total service and interest cost components of net periodic expense |
$ | 4 | $ | (5 | ) | ||
Effect on accumulated postretirement benefit obligation |
$ | 69 | $ | (94 | ) | ||
The following benefit payments, which reflect expected future service, as appropriate, are expected to be paid (in thousands):
Fiscal Year: |
||||
2014 |
$ | 840 | ||
2015 |
851 | |||
2016 |
868 | |||
2017 |
903 | |||
2018 |
944 | |||
2018 - 2023 |
4,973 |
10. Income Taxes
Deferred income taxes reflect the net tax effects of temporary differences between the carrying amounts of assets and liabilities for financial reporting purposes and the amounts used for income tax
F-49
Smart & Final Holdings, Inc. and Subsidiaries
Notes to Consolidated Financial Statements (Continued)
December 29, 2013
10. Income Taxes (Continued)
purposes. The significant components of the Company's deferred tax assets and liabilities are as follows (in thousands):
| |
December 29, 2013 |
December 30, 2012 |
|||||
|---|---|---|---|---|---|---|---|
Deferred tax assets: |
|||||||
Employee benefits, including postretirement reserves |
$ | 11,600 | $ | 31,530 | |||
Net operating and capital loss carryforwards |
11,183 | 14,972 | |||||
Operating reserves and accruals |
16,661 | 15,360 | |||||
Inventories |
3,025 | 2,915 | |||||
Other |
2,167 | 3,338 | |||||
| | | | | | | | |
Total gross deferred tax assets |
44,636 | 68,115 | |||||
Valuation allowance |
(1,014 | ) | (1,146 | ) | |||
| | | | | | | | |
Total deferred tax assets |
43,622 | 66,969 | |||||
Deferred tax liabilities: |
|||||||
Depreciation and amortization |
(37,317 | ) | (44,008 | ) | |||
Intangible assets |
(136,790 | ) | (137,720 | ) | |||
| | | | | | | | |
Total deferred tax liabilities |
(174,107 | ) | (181,728 | ) | |||
| | | | | | | | |
Net deferred tax liabilities |
$ | (130,485 | ) | $ | (114,759 | ) | |
| | | | | | | | |
| | | | | | | | |
The effective tax rate from continuing operations was 39.9% for the year ended December 29, 2013, 34.1% for the period November 15, 2012 through December 30, 2012, 1.7% for the period January 2, 2012 through November 14, 2012 and 39.9% for the year ended January 1, 2012. Reconciliation between the federal statutory income tax rate of 35% and the effective tax rate from continuing operations for each year is as follows (in thousands):
| |
Fiscal Year 2013 |
November 15 Through December 30, 2012 |
January 2 Through November 14, 2012 |
Fiscal Year 2011 |
|||||||||
|---|---|---|---|---|---|---|---|---|---|---|---|---|---|
| |
(Successor) |
(Successor) |
(Predecessor) |
(Predecessor) |
|||||||||
Income tax at federal statutory rate |
$ | 4,760 | $ | (4,932 | ) | $ | 5,099 | $ | 4,205 | ||||
Equity earnings not subject to U.S. tax |
(577 | ) | — | (287 | ) | (275 | ) | ||||||
State income taxes, net of federal tax benefit |
296 | (539 | ) | 139 | 528 | ||||||||
Federal tax credits |
(484 | ) | — | — | (57 | ) | |||||||
Foreign taxes, net of credits |
3,158 | 10 | (2,840 | ) | (1 | ) | |||||||
Foreign dividend received |
— | — | 4,138 | — | |||||||||
State EZ credits |
(549 | ) | — | (5,071 | ) | — | |||||||
Insurance cash surrender value |
(767 | ) | (66 | ) | (612 | ) | 62 | ||||||
Transaction costs |
— | 722 | — | — | |||||||||
Other items, net |
(408 | ) | 1 | (322 | ) | 333 | |||||||
| | | | | | | | | | | | | | |
Income taxes |
$ | 5,429 | $ | (4,804 | ) | $ | 244 | $ | 4,795 | ||||
| | | | | | | | | | | | | | |
| | | | | | | | | | | | | | |
F-50
Smart & Final Holdings, Inc. and Subsidiaries
Notes to Consolidated Financial Statements (Continued)
December 29, 2013
10. Income Taxes (Continued)
The significant components of the provision (benefit) for income taxes are as follows (in thousands):
| |
Fiscal Year 2013 |
November 15 Through December 30, 2012 |
January 2 Through November 14, 2012 |
Fiscal Year 2011 |
|||||||||
|---|---|---|---|---|---|---|---|---|---|---|---|---|---|
| |
(Successor) |
(Successor) |
(Predecessor) |
(Predecessor) |
|||||||||
Current: |
|||||||||||||
Federal |
$ | 6,222 | $ | 328 | $ | 12,566 | $ | 33,755 | |||||
State |
280 | 104 | (1,927 | ) | 13,105 | ||||||||
Foreign |
185 | 10 | 113 | (396 | ) | ||||||||
| | | | | | | | | | | | | | |
|
6,687 | 442 | 10,752 | 46,464 | |||||||||
Deferred: |
|||||||||||||
Federal |
(588 | ) | (4,313 | ) | (4,846 | ) | (29,374 | ) | |||||
State |
(538 | ) | (933 | ) | (5,082 | ) | (12,319 | ) | |||||
Valuation allowance |
(132 | ) | — | (580 | ) | 24 | |||||||
| | | | | | | | | | | | | | |
|
(1,258 | ) | (5,246 | ) | (10,508 | ) | (41,669 | ) | |||||
| | | | | | | | | | | | | | |
Total income tax provision (benefit) |
$ | 5,429 | $ | (4,804 | ) | $ | 244 | $ | 4,795 | ||||
| | | | | | | | | | | | | | |
| | | | | | | | | | | | | | |
At December 29, 2013, the Company had no federal net operating loss carryforwards, and approximately $77.0 million (gross) of net operating loss carryforwards for state income tax purposes, which begin to expire in 2017. The Tax Reform Act of 1986 (the "Act") limits the use of net operating loss and tax credit carryforwards in certain situations where changes occur in the stock ownership. The Successor completed its acquisition of the Predecessor on November 15, 2012, which resulted in a stock ownership change as defined by the Act. This transaction resulted in limitations on the annual utilization of state net operating loss carryforwards. The Company believes that such limitation will have no impact on its deferred tax assets available under the Act. The income tax provision for the year ended December 29, 2013, reflects the usage of $21.5 million of net operating loss carryforwards for state income tax purposes.
The total tax credits available were $7.1 million at December 29, 2013. These tax credits primarily include California state tax incentive programs designed to encourage employers hiring from targeted groups and foreign tax credits. The California state tax credits will begin to expire from 2023 onward. Certain of the foreign tax credits will begin to expire from 2016 onward.
In assessing the realizability of deferred tax assets included in the consolidated balance sheets, management considers whether it is more likely than not that some portion or all of the tax assets will not be realized. The ultimate realization of deferred tax assets is dependent upon the generation of future taxable income during the periods in which those temporary differences become deductible. Management considers the scheduled reversal of deferred tax liabilities, projected future taxable income and tax planning strategies in making this assessment. In accordance with this policy and the requirements of ASC 740, a valuation allowance of $1.0 million is retained against certain California tax credits and certain California and Florida net operating loss carryforwards.
F-51
Smart & Final Holdings, Inc. and Subsidiaries
Notes to Consolidated Financial Statements (Continued)
December 29, 2013
10. Income Taxes (Continued)
The Company has not recorded U.S. income tax expense for the undistributed earnings pertaining to the 2012 and 2013 Mexico operations. The Company intends to leave the 2012 and 2013 undistributed income permanently reinvested offshore. The amount of earnings designated as indefinitely reinvested offshore is based upon the actual deployment of such earnings in offshore assets and expectations of the future cash needs of the U.S. and foreign entities.
In July 2006, the FASB issued further guidance to clarify the accounting for income taxes by prescribing the minimum recognition threshold a tax position is required to meet before being recognized in the financial statements. It also provides guidance on derecognition, measurement, classification, interest and penalties, accounting in interim periods, disclosure and transition and applies to all tax positions related to income taxes. A reconciliation of the beginning and ending amount of unrecognized tax benefits, including accrued interest and penalties, is as follows (in thousands):
| |
Fiscal Year 2013 |
Fiscal Year 2012 |
|||||
|---|---|---|---|---|---|---|---|
Balance at beginning of fiscal year |
$ | 1,350 | $ | 1,350 | |||
Additions based on tax positions related to the current year |
— | — | |||||
Reductions for tax positions of prior years |
— | — | |||||
Reductions due to lapse of the applicable statute of limitations |
— | — | |||||
| | | | | | | | |
Balance at end of fiscal year |
$ | 1,350 | $ | 1,350 | |||
| | | | | | | | |
| | | | | | | | |
As of December 29, 2013 and December 30, 2012, the total amount of unrecognized tax benefits is $1.4 million. The entire liability, if recognized, would affect the effective tax rate.
While timing of the resolution and/or finalization of tax audits is uncertain, the Company does not believe that its unrecognized tax benefits, as disclosed above, will be settled in the next 12 months.
The Company's policy is to accrue any interest and penalties related to unrecognized tax benefits in its income tax expense. For the year ended December 29, 2013, December 30, 2012 and January 1, 2012, no such amounts were recorded.
The California Franchise Tax Board examined the tax return of Casino USA, Inc. for the tax year ended December 31, 2004. The Company, together with Casino USA, was included in the 2004 California Combined Franchise Tax Board return. The Company is not aware of any proposed adjustments, and does not expect that any proposed adjustments would result in a material change to its consolidated results of operations or financial condition. The Company's 2005 through 2007 tax returns are currently under audit by the California Franchise Tax Board. The Company is not aware of any proposed adjustments at this time.
The Internal Revenue Service (IRS) has completed examining the tax return of the Company and subsidiaries for tax years 2004 through May 30, 2007. In January 2011, the Company received notice from the IRS that there were no adjustments. The Company's federal tax returns for the periods ended January 1, 2012 and November 14, 2012 are currently under examination by the IRS. The audits are in the early stages.
F-52
Smart & Final Holdings, Inc. and Subsidiaries
Notes to Consolidated Financial Statements (Continued)
December 29, 2013
10. Income Taxes (Continued)
The Company or one of its subsidiaries files income tax returns in the U.S. federal jurisdiction, various U.S. state jurisdictions and Mexico. The Company is no longer subject to U.S. federal, state and local, or non-U.S. income tax examinations by tax authorities for years before 2004.
The tax years which remain subject to examination or are being examined by major tax jurisdictions as of December 29, 2013 include fiscal years 2005 through 2013.
11. Related Party Transactions
In conjunction with the Apollo Acquisition and effective as of May 31, 2007, the Predecessor entered into a Management Services Agreement with an Apollo affiliate, Apollo Management VI, L.P. (the Manager), whereby the Manager provided certain investment banking, management, consulting and financial planning services to the Predecessor. The Management Services Agreement was for a ten-year term and the Predecessor was obligated to pay the Manager an annual fee of $1.5 million, payable on a quarterly basis. The Predecessor paid the Manager $1.4 million and $1.5 million related to the annual fee for the period January 2, 2012 through November 14, 2012 and for the year ended January 1, 2012, respectively. Upon consummation of the Ares Acquisition, the Company paid a transaction fee of $4.0 million to the Manager. Effective November 15, 2012, the Management Services Agreement was terminated and the Company paid the Manager a termination fee of $5.5 million.
In addition, pursuant to the Management Services Agreement, the Predecessor paid a transaction fee including reimbursement of expenses of $9.0 million in the aggregate to the Manager for financial advisory services in connection with the Apollo Acquisition and the October 2007 acquisition of organic and natural food oriented supermarkets operated in California and Texas under the banners "Henry's Farmers Markets" and "Sun Harvest Markets" (the "Henry's Acquisition"). Of this fee, 50%, or $4.5 million, was included as part of the purchase price and the remaining 50%, or $4.5 million, had been included in deferred financing costs and was amortized to interest expense over the terms of the related debt through 2016. These services included assisting the Predecessor in the structuring and negotiation of the credit facilities and other services in connection with the Apollo Acquisition and Henry's Acquisition. No such fees were paid in conjunction with the sale of Henry's in the year ended January 1, 2012. The Company wrote off the remaining unamortized deferred financing costs in connection with the Ares Acquisition.
Funds affiliated with Ares hold approximately 10% of the outstanding loans under the Term Loan Facility and receive payments in respect of such loans representing their pro rata portion of such loans.
12. Employment Agreements
The Predecessor entered into an employment agreement with George Golleher effective May 29, 2007 to serve as the Predecessor's CEO (the "2007 Golleher Agreement"). The 2007 Golleher Agreement provided for the following among other provisions: a) executive to serve as CEO of the Predecessor for a three-year term with provision for mutual extension of the base term, b) executive to be compensated through base salary, bonus, benefits, and expense reimbursement, c) executive to be granted various stock option grants including an immediate vested option grant, a time-based option grant, and a performance-based option grant, d) executive will purchase a designated number of share of the Predecessor concurrent with the grant of the immediate vested option grant, and e) various other provisions. The grant of immediate vested options to the executive was for 387,697 shares at an
F-53
Smart & Final Holdings, Inc. and Subsidiaries
Notes to Consolidated Financial Statements (Continued)
December 29, 2013
12. Employment Agreements (Continued)
exercise price of $20.00 per share with a term of seven years. The grant was not made under the predecessor's stock incentive plan; however, it was governed by the general terms and conditions of the stock incentive plan. See Note 13, Share-Based Compensation. The Predecessor recorded share-based compensation expense of $3.7 million on the grant date of May 31, 2007 related to this immediate vested option grant. The 2007 Golleher Agreement was further amended on December 30, 2008, December 7, 2010 and again on December 23, 2011. Effective with the Ares Acquisition, George Golleher resigned from the Board and all executive positions of the Company.
The Predecessor entered into an employment agreement with David G. Hirz effective April 7, 2010, to serve as the Predecessor's President (the "2010 Hirz Agreement"). The 2010 Hirz Agreement provided for the following, among other provisions: a) executive to serve as President of the Predecessor for a three-year term, b) executive to be compensated through base salary, bonus, benefits, and expense reimbursement, and c) executive to be granted a stock option grant on the effective date of the employment agreement. The 2010 Hirz Agreement was amended on December 23, 2011, and provided for a) the executive to serve as the Predecessor's President and Chief Executive Officer effective January 1, 2012, b) adjustment to executive's base salary and bonus, and c) a stock option grant to the executive as of January 1, 2012.
Effective with the Ares Acquisition on November 15, 2012, SFHI entered into a new employment agreement with David G. Hirz (the "2012 Hirz Agreement"). The 2012 Hirz Agreement provided, among other provisions, for Mr. Hirz to: (a) serve as President and Chief Executive Officer of the Company for a three-year term, (b) serve as a director on SFHI's board of directors for so long as he remains employed by the Company, (c) be compensated through base salary, bonus, benefits, and expense reimbursement, and (d) be granted stock options as soon as practical following the Ares Acquisition. On February 1, 2013, a grant of stock options was made to Mr. Hirz pursuant to the 2012 Hirz Agreement.
On November 15, 2012, David G. Hirz also entered into a Fair Competition Agreement with SFHI wherein the executive agreed to various non-competition and non-solicitation covenants.
13. Share-Based Compensation
Successor Share-Based Compensation
Effective November 15, 2012, SFHI adopted the SF CC Holdings, Inc. 2012 Stock Incentive Plan (the "2012 Incentive Plan") which provides for the issuance of share grants not to exceed 60,000 shares.
Effective November 15, 2012, and in connection with the Ares Acquisition, certain management employees of the Predecessor Company elected to convert certain options to purchase common stock of the Predecessor into new stock options of SFHI in lieu of receiving a cash payment. The value of these options was approximately $11.1 million and they were converted into 19,082 fully vested option shares issued under the 2012 Incentive Plan (the "Rollover Options").
No options were granted during the period November 15, 2012 through December 30, 2012. In 2013, the Company made grants aggregating a total of 28,598 option shares to certain management employees. These grants were awards with time-based vesting terms, which vest over five years and are subject to continuous employment (the "Time-Based Options"). The option awards have a ten-year term.
F-54
Smart & Final Holdings, Inc. and Subsidiaries
Notes to Consolidated Financial Statements (Continued)
December 29, 2013
13. Share-Based Compensation (Continued)
The following table summarizes the Time-Based Options activity under the plan for the year ended December 29, 2013:
| |
Shares | Weighted- Average Exercise Price |
Weighted- Average Remaining Contractual Term |
|||||
|---|---|---|---|---|---|---|---|---|
Outstanding at December 30, 2012 |
— | $ | — | — | ||||
Granted |
28,598 | 1,250.00 | ||||||
Forfeitures |
— | — | ||||||
Exercised |
— | — | ||||||
Expired |
— | — | ||||||
| | | | | | | | | |
Outstanding at December 29, 2013 |
28,598 | $ | 1,250.00 | 9.11 years | ||||
| | | | | | | | | |
| | | | | | | | | |
Exercisable at December 29, 2013 |
5,720 | $ | 1,250.00 | 9.11 years | ||||
| | | | | | | | | |
| | | | | | | | | |
The fair value of the options was estimated on the date of grant using the Black-Scholes-Merton option-pricing model based on the assumptions in the following table:
| |
Fiscal Year 2013 |
|
|---|---|---|
Dividend yield |
0% | |
Expected volatility |
50% | |
Risk-free interest rates |
2.03% | |
Expected terms |
10.00 Years | |
Weighted-average fair value of options granted |
$579.83 |
The expected volatility for all stock options was based on utilizing comparable peer group share price volatility adjusted for the Company's debt to equity leverage including the effect of the Ares Acquisition. The risk-free interest rate was based on the traded zero-coupon U.S. Treasury bond with a term equal to the grant's expected life. Due to the Company's repurchase rights with respect to these options, the expected term was established at ten years as it is currently not probable that the employee's options will benefit from the appreciation of the Company's common stock within the option term. The estimated forfeiture rate of 5.0% was based on projected forfeitures primarily based on the historical experience of the Company. As of December 29, 2013, no options have been forfeited.
Under the 2012 Incentive Plan and the Company's standard form of option award agreement, the Company has a right to repurchase from the participant all or a portion of SFHI common stock issued upon the exercise of the options awarded to the participant. For SFHI common stock issued upon exercise of an option (but excluding SFHI common stock issued upon exercise of certain options issued prior to the Ares Acquisition), in the event of a participant's termination (i) for cause, (ii) voluntary termination for any reason, or (iii) upon discovery that the participant engaged in detrimental activity, the repurchase price is the lesser of the exercise price paid by the participant to exercise the option or the fair market value of the SFHI common stock issuable upon exercise. If the Company elects to exercise its repurchase rights for any SFHI common stock issued pursuant to the exercise of an option, it must do so within a one-year period commencing on the later of (x) the date of the participant's
F-55
Smart & Final Holdings, Inc. and Subsidiaries
Notes to Consolidated Financial Statements (Continued)
December 29, 2013
13. Share-Based Compensation (Continued)
termination, or (y) the date on which such option was exercised under the applicable option agreement. All of the options that the Company has granted to its employees and directors through December 29, 2013 contain such repurchase rights. 28,598 options outstanding as of December 29, 2013 were subject to such repurchase rights. If the Company exercised such repurchase right at the lesser of the exercise price paid by the participant to exercise the stock option or the fair market value of the SFHI common stock issuable upon exercise, the participant would receive no monetary benefit. Accordingly, as it is currently not assured nor probable that participants will realize any monetary benefit from the exercise of such options, the Company has not recorded any share-based compensation expense for these grants. As of December 29, 2013, the Company had $14.0 million of total unrecognized share-based compensation expense for these grants. Due to the terms of the Company's option grants, the Company is unable to determine the time period over which share-based compensation expense will be recognized. For SFHI common stock issued upon exercise of a Rollover Option, and in the event of a participant's termination (i) for cause or (ii) upon discovery that the participant engaged in detrimental activity, the repurchase price is the fair market value of SFHI common stock.
If the Company elects to exercise its repurchase right for any SFHI common stock issued pursuant to the exercise of a Rollover Option, it must do so within a 180-day period commencing on the later of (i) the date of the participant's termination or (ii) the date on which such Rollover Option was exercised under the applicable option agreement. In the event of a participant's termination for any other cause, the repurchase period for the Company must take place within the 90-day period following the date of the participant's termination.
During the period December 30, 2013 through June 20, 2014, the Company made grants aggregating a total of 4,747 option shares to certain management employees.
Predecessor Share-Based Compensation
Prior to the Apollo Acquisition, the Predecessor had granted stock options, stock appreciation rights, and restricted stock for a fixed number of SFI shares to various employees and directors under share-based compensation plans. The exercise prices of the stock options and stock appreciation rights (the "Options") were generally equal to the fair market value of the underlying shares at the date of grant. In connection with the Apollo Acquisition, on May 31, 2007, all of the SFI share-based awards became fully vested and the Options became immediately exercisable. For those Options exercised, the holders were paid amounts equal to the excess of $22.00 over the underlying Option exercise price, less applicable withholding taxes.
Effective May 31, 2007, the Predecessor established the Smart & Final Holdings Corp. Stock Incentive Plan (the "Predecessor Incentive Plan"), which provided for the issuance of share grants not to exceed 1,600,000 shares.
Effective May 31, 2007, and in conjunction with the Apollo Acquisition, certain management employees of SFI elected to convert certain SFI Options to new stock options of the Predecessor in lieu of receiving a cash payment for the excess of $22.00 over the underlying Option exercise price for each respective Option. The value of these respective SFI Options was approximately $3.9 million and they were converted into 194,250 fully vested option shares issued under the Predecessor Incentive Plan.
F-56
Smart & Final Holdings, Inc. and Subsidiaries
Notes to Consolidated Financial Statements (Continued)
December 29, 2013
13. Share-Based Compensation (Continued)
Effective May 31, 2007, certain management employees of the Predecessor elected to convert certain SFI restricted stock rights to new share rights of the Predecessor (the "Predecessor Share Rights") in lieu of receiving a cash payment of $22.00 per share held. The value of these respective SFI restricted stock rights was approximately $4.0 million and they were converted into 197,659 Predecessor Share Rights.
Effective May 31, 2007, the Predecessor granted 888,140 option shares pursuant to the Predecessor Incentive Plan. Effective November 19, 2007, the Predecessor granted an additional 122,621 option shares pursuant to the Predecessor Incentive Plan. In 2012, 2011, 2010, 2009 and 2008, the Predecessor granted an aggregate of 71,854, 238,417, 234,192, 157,867, and 86,058 option shares, respectively. Half of these grants were awards with time-based vesting terms and the other half of these grants were awards with performance-based vesting terms.
Time-Based Vesting Stock Options
During the period January 2, 2012 through November 14, 2012, the Predecessor granted a total of 35,927 option shares of time-based vesting stock options to employees, which vest over four years, subject to continuous employment or the realization of a liquidity event such as the sale of the Predecessor, and have a seven-year term (the "Time-Based Vesting Options"). During the year ended January 1, 2012, the Predecessor extended the termination date of all grants issued prior to March 11, 2009 to May 31, 2016. On November 7, 2012, and as a result of a change in control provision in the Predecessor Incentive Plan, the Predecessor's board of directors accelerated the vesting of its Time-Based Vesting Options. The accelerated vesting was effective immediately prior to the closing of the Ares Acquisition. Effective November 14, 2012, all Time-Based Vesting Options were fully vested and became immediately exercisable.
F-57
Smart & Final Holdings, Inc. and Subsidiaries
Notes to Consolidated Financial Statements (Continued)
December 29, 2013
13. Share-Based Compensation (Continued)
The following table summarizes the Time-Based Vesting Options activity under the plan for the period January 2, 2012 through November 14, 2012 and for the year ended January 1, 2012:
| |
Shares | Weighted- Average Exercise Price |
Weighted- Average Remaining Contractual Term |
|||||||
|---|---|---|---|---|---|---|---|---|---|---|
Outstanding at January 2, 2011 |
594,233 | $ | 20.00 | 4.32 years | ||||||
Granted |
119,209 | 21.68 | ||||||||
Forfeitures |
(80,896 | ) | 20.00 | |||||||
Exercised |
— | — | ||||||||
Expired |
— | — | ||||||||
| | | | | | | | | | | |
Outstanding at January 1, 2012 |
632,546 | 20.32 | 4.98 years | |||||||
Granted |
35,927 | 24.10 | ||||||||
Forfeitures |
— | — | ||||||||
Exercised |
— | — | ||||||||
Expired |
— | — | ||||||||
| | | | | | | | | | | |
Outstanding at November 14, 2012 |
668,473 | $ | 20.52 | 4.22 years | ||||||
| | | | | | | | | | | |
| | | | | | | | | | | |
Exercisable and vested at November 14, 2012 |
668,473 | $ | 20.52 | 4.22 years | ||||||
| | | | | | | | | | | |
| | | | | | | | | | | |
The fair value of the Time-Based Vesting Options was estimated on the date of grant using the Black-Scholes-Merton option-pricing model based on the assumptions in the following table for the period January 2, 2012 through November 14, 2012 and for the year ended January 1, 2012:
| |
January 2 Through November 14, 2012 |
Fiscal Year 2011 |
||
|---|---|---|---|---|
| |
(Predecessor) |
(Predecessor) |
||
Dividend yield |
0% | 0% | ||
Expected volatility |
50% | 59% | ||
Risk-free interest rates |
0.40% | 0.69% | ||
Expected terms |
4.75 Years | 4.75 Years | ||
Weighted-average fair value of options granted |
$10.03 | $11.64 |
The expected volatility for options granted effective May 31, 2007, was based on the historical share price volatility of SFI adjusted for the change in the Predecessor's debt to equity leverage as a result of the Apollo Acquisition. The expected volatility for all subsequently granted options was based on utilizing comparable peer group share price volatility adjusted for the Predecessor's debt to equity leverage including the effects of the Apollo Acquisition, the Henry's Acquisition, the sale of Henry's, and certain sale and leaseback transactions. The risk-free interest rate was based on the traded zero-coupon U.S. Treasury bond with a term equal to the grant's expected life. The expected term was based on the midpoint of the vesting date and contractual term of the granted options. The Predecessor had elected to use this "simplified" method to establish the expected term due to the limited history of option exercise subsequent to the Predecessor becoming a privately held corporation.
F-58
Smart & Final Holdings, Inc. and Subsidiaries
Notes to Consolidated Financial Statements (Continued)
December 29, 2013
13. Share-Based Compensation (Continued)
The estimated forfeiture rate of 5.0% was based on projected forfeitures primarily based on the historical experience of the Company. As of January 1, 2012, a total of 135,975 option shares related to the May 31, 2007, grant, a total of 25,819 option shares related to the November 19, 2007, grant, a total of 18,932 option shares related to the March 11, 2008, grant, a total of 24,097 option shares related to the July 18, 2008, grant, a total of 18,934 option shares related to the March 6, 2009, grant and a total of 1,721 option shares related to the September 3, 2010, grant have been forfeited. The Predecessor had adjusted the estimated forfeiture rates to 14.5%, 21.0%, 100.0%, 100.0%, 15.0% and 100.0% for these particular grants, respectively. All other stock awards granted by the Predecessor were consistent with the underlying assumption of a 5.0% forfeiture rate. On November 14, 2012, the Predecessor adjusted the estimated forfeiture rate to 14.41% for the March 6, 2009, grant, 20.71% for the November 19, 2007, grant, 14.10% for the May 31, 2007 grant and 0% on all other option grants in connection with the Ares Acquisition.
The Predecessor recognized the related compensation expense (the estimated fair value of the stock options) over the vesting period using the accelerated recognition method. During the period January 2, 2012 through November 14, 2012 and the year ended January 1, 2012, a total of approximately $0.7 million and $0.9 million, respectively, was recognized as compensation expense related to the Time-Based Vesting Option awards. As a result of the accelerated vesting effective immediately prior to the closing of the Ares Acquisition, the Predecessor expensed the unamortized compensation expense of $1.2 million.
Performance-Based Vesting Stock Options
During the period January 2, 2012 through November 14, 2012, the Predecessor granted a total of 35,927 option shares of performance-based vesting stock options to employees, which have a seven-year term (the "Performance-Based Vesting Options"). The Performance-Based Vesting Options vested: (a) in two equal annual installments commencing one year after meeting certain performance goals as outlined in the stock option agreements, subject to immediate vesting of any unvested installment in the event a change in control takes place after the performance goals have been met and the two-year vesting has commenced or (b) upon the realization of a liquidity event such as a sale of the Predecessor or an initial public offering wherein the performance goals as outlined in the stock option agreements were met. During the year ended January 2, 2011, the Predecessor modified the definition of "Measurement Date," "Target Stock Price," "Stretch Target Stock Price," and "Net Equity Value" for all grant agreements dated prior to April 1, 2010, and which remain outstanding in order to provide continued incentives for key employees to achieve business objectives. No compensation expense was recognized at the modification date as the original and modified awards were determined to be improbable of vesting. During the year ended January 1, 2012, the Predecessor modified certain performance goals required for vesting. Additionally, the Predecessor extended the termination date of all grants issued prior to March 11, 2009 to May 31, 2016. As a result of the modification, $1.2 million was recorded as compensation expense for the year ended January 1, 2012.
F-59
Smart & Final Holdings, Inc. and Subsidiaries
Notes to Consolidated Financial Statements (Continued)
December 29, 2013
13. Share-Based Compensation (Continued)
The following table below summarizes the Performance-Based Vesting Options activity under the plan for the period January 2, 2012 through November 14, 2012 and for the year ended January 1, 2012:
| |
Shares | Weighted- Average Exercise Price |
Weighted- Average Remaining Contractual Term |
|||||||
|---|---|---|---|---|---|---|---|---|---|---|
Outstanding at January 2, 2011 |
594,233 | $ | 20.00 | 4.32 years | ||||||
Granted |
119,209 | 21.68 | ||||||||
Forfeitures |
(80,896 | ) | 20.00 | |||||||
Exercised |
— | — | ||||||||
Expired |
— | — | ||||||||
| | | | | | | | | | | |
Outstanding at January 1, 2012 |
632,546 | 20.32 | 4.98 years | |||||||
Granted |
35,927 | 24.10 | ||||||||
Forfeitures |
— | — | ||||||||
Exercised |
— | — | ||||||||
Expired |
— | — | ||||||||
| | | | | | | | | | | |
Outstanding at November 14, 2012 |
668,473 | $ | 20.52 | 4.22 years | ||||||
| | | | | | | | | | | |
| | | | | | | | | | | |
Exercisable and vested at November 14, 2012 |
668,473 | $ | 20.52 | 4.22 years | ||||||
| | | | | | | | | | | |
| | | | | | | | | | | |
During the year ended January 1, 2012, as a result of improved performance, the Predecessor had determined that it was probable that the related performance conditions would be met and all Performance-Based Vesting Options, except for the January 1, 2012 grant, would vest in two equal annual installments subsequent to the performance condition measurement date. The Predecessor had also determined that it was probable that certain performance conditions would be met for the January 1, 2012 grant; therefore, half of the grant would vest on December 30, 2012. On November 7, 2012 and as a result of a change in control provision in the Predecessor Incentive Plan, the Predecessor's board of directors accelerated the vesting of its Performance-Based Vesting Options. The accelerated vesting was effective immediately prior to the closing of the Ares Acquisition. Effective November 14, 2012, all performance-based options were fully vested.
F-60
Smart & Final Holdings, Inc. and Subsidiaries
Notes to Consolidated Financial Statements (Continued)
December 29, 2013
13. Share-Based Compensation (Continued)
The fair value of the Performance-Based Vesting Options was estimated on the date of grant using the Black-Scholes-Merton option-pricing model based on the assumptions in the following table for the period January 2, 2012 through November 14, 2012 and for the year ended January 1, 2012:
| |
January 2 Through November 14, 2012 |
Fiscal Year 2011 |
||
|---|---|---|---|---|
| |
(Predecessor) |
(Predecessor) |
||
Dividend yield |
0% | 0% | ||
Expected volatility |
50% | 59.59% | ||
Risk-free interest rates |
0.40% | 1.10% | ||
Expected terms |
3.92 Years | 4.34 Years | ||
Weighted-average fair value of options granted |
$9.26 | $9.59 |
The expected volatility for all granted options was based on utilizing comparable peer group share price volatility adjusted for the Predecessor's debt to equity leverage including the effects of the Apollo Acquisition, the Henry's Acquisition, the sale of Henry's, and certain sale and elected to use this "simplified" method to establish the expected term due to the leaseback transactions. The risk-free interest rate was based on the traded zero-coupon U.S. Treasury bond with a term equal to the grant's expected life. The expected term was based on the midpoint of the vesting date and contractual term of the granted options. The Predecessor had limited history of options exercised subsequent to the Predecessor becoming a privately held corporation. During the year ended January 1, 2012, the estimated forfeiture rate for all Performance-Based Vesting Options, except for the January 1, 2012, grant, was 2% based on projected forfeitures primarily based on the historical experience of the Predecessor. The forfeiture rate for the January 1, 2012, grant was 0%. Effective November 14, 2012, the Predecessor adjusted the estimated forfeiture rate to 0% for all Performance-Based Vesting Options in connection with the Ares Acquisition.
The Predecessor recognized the related compensation expense (equal to the estimated fair value of awards for which vesting with respect to performance conditions is considered probable) using the accelerated recognition methods. During the period January 2, 2012 through November 14, 2012, a total of $1.8 million was recognized as compensation expense.
As a result of the accelerated vesting effective immediately prior to the closing of the Ares Acquisition, the Predecessor expensed the unamortized compensation expense of $3.4 million.
14. Stockholders' Equity
The primary stockholders of the Predecessor were Smart & Final Holdings LLC, an affiliate of Apollo, and Apollo Investment Fund VI, LP, which collectively owned 98.0% of the Predecessor's outstanding stock. Other stockholders included various members of the Predecessor's management and one additional stockholder who owned the remaining 2.0% of the Predecessor's outstanding stock. The stockholders had entered into stockholder subscription agreements and/or related agreements which set forth various provisions regarding the restriction and transfer of the Predecessor's stock as well as customary drag along rights, tag along rights, and registration rights.
The primary stockholders of SFHI are two affiliates of Ares Management, L.P., which collectively own 96.4% of SFHI's outstanding stock. Other stockholders include various members of SFHI's board of directors and Company management who own the remaining 3.6% of SFHI's outstanding stock.
F-61
Smart & Final Holdings, Inc. and Subsidiaries
Notes to Consolidated Financial Statements (Continued)
December 29, 2013
15. Earnings (Loss) Per Share
The computation of earnings (loss) per share is based on the net income (loss) for the period and the number of weighted average shares outstanding during the period. The computation of diluted earnings (loss) per share is based on the net income (loss) for the period and the number of weighted average shares outstanding during the period including the dilutive effect of share equivalents consisting of incremental shares deemed outstanding from the assumed exercise of options.
A reconciliation of the numerators and denominators of the basic and diluted earnings (loss) per share calculations is as follows (in thousands, except per share amounts):
| |
Successor | Successor | Predecessor | Predecessor | |||||||||
|---|---|---|---|---|---|---|---|---|---|---|---|---|---|
| |
Fiscal Year 2013 |
Period From November 15, 2012 Through December 30, 2012 |
Period From January 2, 2012 Through November 14, 2012 |
Fiscal Year 2011 |
|||||||||
Income (loss) from continuing operations |
$ | 8,171 | $ | (9,288 | ) | $ | 14,324 | $ | 7,219 | ||||
Income from discontinued operations, net of income taxes |
— | — | — | 3,260 | |||||||||
| | | | | | | | | | | | | | |
Net income (loss) |
$ | 8,171 | $ | (9,288 | ) | $ | 14,324 | $ | 10,479 | ||||
| | | | | | | | | | | | | | |
| | | | | | | | | | | | | | |
Weighted average shares outstanding for basic EPS |
300,158 | 299,201 | 13,363,635 | 13,362,665 | |||||||||
Effect of dilutive securities: |
|||||||||||||
Assumed exercise of time-based stock options |
12,408 | — | 382,971 | 62,805 | |||||||||
Assumed exercise of performance-based stock options |
— | — | 180,960 | — | |||||||||
| | | | | | | | | | | | | | |
Weighted average shares and share equivalents outstanding for diluted EPS |
312,566 | 299,201 | 13,927,566 | 13,425,470 | |||||||||
| | | | | | | | | | | | | | |
| | | | | | | | | | | | | | |
Basic earnings (loss) per share: |
|||||||||||||
Continuing operations |
$ | 27.22 | $ | (31.04 | ) | $ | 1.07 | $ | 0.54 | ||||
Discontinued operations |
— | — | — | 0.24 | |||||||||
| | | | | | | | | | | | | | |
Net earnings (loss) |
$ | 27.22 | $ | (31.04 | ) | $ | 1.07 | $ | 0.78 | ||||
| | | | | | | | | | | | | | |
| | | | | | | | | | | | | | |
Diluted earnings (loss) per share: |
|||||||||||||
Continuing operations |
$ | 26.14 | $ | (31.04 | ) | $ | 1.03 | $ | 0.54 | ||||
Discontinued operations |
— | — | — | 0.24 | |||||||||
| | | | | | | | | | | | | | |
Net earnings (loss) |
$ | 26.14 | $ | (31.04 | ) | $ | 1.03 | $ | 0.78 | ||||
| | | | | | | | | | | | | | |
| | | | | | | | | | | | | | |
There were no securities potentially dilutive to our common stock for Fiscal Year 2013, Period from November 15, 2012 through December 30, 2012, and Period from January 2, 2012 through November 14, 2012. Potentially dilutive securities representing 617,699 shares of common stock for Fiscal Year 2011 were excluded from the computation of diluted earnings per share for this period because the effect would have been antidilutive. The potentially dilutive securities for Fiscal Year 2013 do not include the 28,598 option shares that are subject to performance conditions for which the Company has not recorded any share-based compensation expense. See Note 13, Share-Based Compensation.
Subsequent to the issuance of the Company's consolidated financial statements for the year ended December 29, 2013, the Company identified an immaterial error in the calculation of diluted earnings (loss) per share, as the Rollover Options had been inadvertently excluded from the calculation. Accordingly, diluted earnings (loss) per share for the year ended December 29, 2013 has been corrected in the accompanying financial statements. Management has concluded that the correction of the error is immaterial.
F-62
Smart & Final Holdings, Inc. and Subsidiaries
Notes to Consolidated Financial Statements (Continued)
December 29, 2013
16. Discontinued Operations
In February 2011, the Predecessor entered into an agreement for the sale of Henry's (excluding the Riverside, California, Distribution center) to Sprouts Farmers Market, LLC ("Predecessor Sprouts"). Contemporaneously with this agreement, Predecessor Sprouts and an affiliate of Apollo entered into various agreements that resulted in the integrated acquisition by Sprouts of the businesses of Henry's and Predecessor Sprouts. These integrated transactions closed effective April 18, 2011 with Apollo holding a majority interest in Sprouts. At closing, the Predecessor received total consideration of $274.6 million related to the sale of Henry's which was deemed to be a taxable event for tax purposes. The Predecessor accounted for this as a transaction between entities under common control resulting in the excess of total consideration received less the divested net assets of Henry's and related taxation on the transaction of $68.1 million being reflected as a capital contribution from Parent in the Predecessor's consolidated statements of stockholders' equity.
Early in the third quarter of fiscal year 2010, the Predecessor opened five food stores in Colorado as a test of a potential store format. During the fourth quarter of fiscal year 2010, the Predecessor closed these five food stores in Colorado primarily due to operating results that fell well below the level required for profitable operations.
The Company's 2011 consolidated financial statements reflect the results of operations and cash flows of Henry's and SmartCo Foods stores separately as discontinued operations.
The following is a summary of operations and other information of the discontinued operations for the year ended January 1, 2012, in thousands:
| |
Fiscal Year 2011 |
|||
|---|---|---|---|---|
| |
(Predecessor) |
|||
Sales |
$ | 164,095 | ||
Pre-tax income from operations |
4,298 |
|||
Income tax provision |
(1,038 | ) | ||
| | | | | |
Net income from discontinued operations |
$ | 3,260 | ||
| | | | | |
| | | | | |
During the year ended January 1, 2012, four Colorado store properties with purchase commitments were sold and a gain of $0.5 million was recorded in connection with the sales. Costs associated with lease termination obligations were reduced by $3.3 million primarily due to the sale of the four Colorado store properties and sublease of the one remaining store. Costs associated with asset impairment charges were $0.9 million.
17. Commitments and Contingencies
Legal Actions
On March 17, 2008, a purported class action, Mike Garcia vs. Smart & Final, was filed in Los Angeles Superior Court by a former truck driver on behalf of all drivers assigned from the Company's Commerce, California distribution facility. This complaint alleged that with respect to the purported class, the Company failed to properly pay overtime wages and failed to provide meal and rest breaks. The plaintiff also asserted an individual claim for wrongful termination and discrimination, which was
F-63
Smart & Final Holdings, Inc. and Subsidiaries
Notes to Consolidated Financial Statements (Continued)
December 29, 2013
17. Commitments and Contingencies (Continued)
settled in May 2011. The complaint also asserted representative claims under California's Private Attorney General Act ("PAGA"). The Company denied liability with respect to all claims. At a hearing on a motion for class certification held on October 19, 2012, class certification was denied. Five individual plaintiffs remained in the case and plaintiffs subsequently filed a notice of appeal of this decision. A series of settlement conferences have been held and at a settlement conference in September 2013, the parties accepted a mediator's proposal to settle all residual claims. The settlement includes the remaining individual claims and any alleged representative claims, and dismisses the appeal. The final settlement and release agreements were fully executed in January 2014 and all settlement payments have been paid.
On December 11, 2012, a purported class action was filed in Los Angeles Superior Court entitled Matthew Thompson vs. Smart & Final Inc. by a former hourly store employee on behalf of a purported class of all California hourly store employees alleging various violations of California wage and hour laws including, among others, failure to pay for all hours worked, meal and rest break violations, failure to pay wages properly at termination and non-compliant wage statements. The plaintiff has also asserted claims under PAGA. The Company has denied liability for these allegations.
On June 19, 2013, a purported class action was filed in Los Angeles Superior Court entitled Raquel Manzo vs. Smart & Final by a former hourly store employee on behalf of a purported class of all California hourly store employees alleging various violations of California wage and hour laws including, among others, improper calculation of certain overtime rates. The Company has denied liability for these allegations.
The Thompson and Manzo cases were ordered to be combined for mediation. Following a mediation held in November 2013, the various parties to these actions accepted a mediator's proposal to settle these matters. The proposed settlements require court approval, which approval was preliminarily granted on April 22, 2014. Final court approval is scheduled for September 15, 2014. The Company recorded a loss accrual estimate of $3.0 million in its 2013 consolidated financial statements related to these matters.
In September 2007, the Company's 50% owned joint venture, SFDN, made a payment to the Company's joint venture partner, now known as Grupo Calimax, in the approximate amount of $11.6 million. The payment allegedly represented a distribution of retained profits and deferred income tax and profit sharing liabilities of SFDN. The Predecessor believed this distribution to be invalid and pursued various remedies to invalidate the payment. The Predecessor, Grupo Calimax, and certain of its stockholders pursued various claims and remedies in both U.S. and Mexican courts. In the first quarter of 2012, the Predecessor reached a negotiated settlement with all parties to the dispute. Accordingly, the Predecessor recorded a loss accrual estimate of $1.7 million in its 2011 consolidated financial statements. In the second quarter of 2012, the settlement was finalized among all the parties, and as a result, the Predecessor recorded an additional loss accrual of $0.3 million. The agreement settled all disputes among the parties and SFDN paid a dividend distribution to SF Mexico in the amount of $11.6 million. SFDN also declared a dividend in 2012 payable to SF Mexico and Grupo Calimax in an equal amount of $3.8 million; $0.6 million of this declared dividend was paid in 2013 to the joint venture partners.
F-64
Smart & Final Holdings, Inc. and Subsidiaries
Notes to Consolidated Financial Statements (Continued)
December 29, 2013
17. Commitments and Contingencies (Continued)
The Company is engaged in various legal actions, claims and proceedings in the ordinary course of business, including claims related to employment related matters, breach of contracts, products liabilities and intellectual property matters resulting from its business activities. We do not believe that the ultimate determination of these actions, claims and proceedings will either individually or in the aggregate have a material adverse effect on our consolidated results of operations or financial position.
18. Accumulated Other Comprehensive Income
The following table represents the changes in AOCI by each component for the year ended December 29, 2013, net of tax:
| (in thousands) |
Defined Benefit Retirement Plan |
Cash Flow Hedging Activity |
Foreign Currency Translation |
Total | |||||||||
|---|---|---|---|---|---|---|---|---|---|---|---|---|---|
Balance at December 30, 2012 |
$ | 6,019 | $ | — | $ | — | $ | 6,019 | |||||
OCI before reclassification |
22,505 | 2,898 | (420 | ) | 24,983 | ||||||||
Amounts reclassified out of AOCI |
— | (18 | ) | — | (18 | ) | |||||||
| | | | | | | | | | | | | | |
Net current year OCI |
$ | 22,505 | $ | 2,880 | $ | (420 | ) | $ | 24,965 | ||||
| | | | | | | | | | | | | | |
Balance at December 29, 2013 |
$ | 28,524 | $ | 2,880 | $ | (420 | ) | $ | 30,984 | ||||
| | | | | | | | | | | | | | |
| | | | | | | | | | | | | | |
The following table represents the items reclassified out of each component of AOCI and the related tax effects for the year ended December 29, 2013:
Details about AOCI Components
|
Amount Reclassified from AOCI |
Location within Statement of Operations and Comprehensive Income (Loss) |
|||
|---|---|---|---|---|---|
(in thousands) |
|||||
Gains and (losses) on cash flow hedges |
|||||
Interest rate swaps |
$ | (30 | ) | Interest income (expense) | |
| | | | | | |
|
(30 | ) | Total before income tax | ||
|
12 | Income tax (provision) benefit | |||
| | | | | | |
|
$ | (18 | ) | Reclassification of adjustments, net of tax | |
| | | | | | |
| | | | | | |
Total reclassifications for the year |
$ | (18 | ) | Total reclassifications, net of tax | |
| | | | | | |
| | | | | | |
19. Segment Information
The Company is a value-oriented retailer serving a diverse demographic of household and business customers through two complementary store banners. The "Smart & Final" business focuses on both household and business customers, and the "Cash & Carry" business focuses primarily on restaurants, caterers and a wide range of other foodservice businesses. The company's chief operating decision maker ("CODM") regularly reviews the operating performance of each of the store banners including measures of performance based on income (loss) from operations. We consider each of the store banners to be an operating segment and have further concluded that presenting disaggregated information of these two operating segments provides meaningful information as certain economic characteristics are dissimilar as well as the characteristics of the customer base served.
F-65
Smart & Final Holdings, Inc. and Subsidiaries
Notes to Consolidated Financial Statements (Continued)
December 29, 2013
19. Segment Information (Continued)
The "Corporate/Other" category is comprised primarily of corporate overhead support expenses and administrative expenses incidental to the activities of the reportable segments, interest expense and other costs associated with the Company's debt obligations, equity earnings in its joint venture, and income taxes.
For the year ended December 29, 2013, the operating information and total assets for the reportable segments are shown as follows (in thousands):
| |
Smart & Final | Cash & Carry | Corporate/ Other |
Consolidated | |||||||||
|---|---|---|---|---|---|---|---|---|---|---|---|---|---|
Net sales |
$ | 2,425,345 | $ | 784,947 | $ | — | $ | 3,210,293 | |||||
Cost of sales, distribution and store occupancy |
2,050,197 | 678,760 | 7,400 | 2,736,357 | |||||||||
Operating and administrative expenses |
284,025 | 53,240 | 49,868 | 387,133 | |||||||||
| | | | | | | | | | | | | | |
Income (loss) from operations |
$ | 91,123 | $ | 52,947 | $ | (57,268 | ) | $ | 86,803 | ||||
| | | | | | | | | | | | | | |
| | | | | | | | | | | | | | |
As of December 29, 2013 |
|||||||||||||
Total assets |
$ | 1,636,952 | $ | 220 420 | $ | (257,831 | ) | $ | 1,599,541 | ||||
| | | | | | | | | | | | | | |
| | | | | | | | | | | | | | |
Intercompany receivable (payable) |
$ | 432,105 | $ | (108,010 | ) | $ | (324 095 | ) | $ | — | |||
| | | | | | | | | | | | | | |
| | | | | | | | | | | | | | |
Investment in joint venture |
$ | — | $ | — | $ | 10,948 | $ | 10,948 | |||||
| | | | | | | | | | | | | | |
| | | | | | | | | | | | | | |
Goodwill |
$ | 406,662 | $ | 204,580 | $ | — | $ | 611,242 | |||||
| | | | | | | | | | | | | | |
| | | | | | | | | | | | | | |
Fiscal year ended December 29, 2013 |
|||||||||||||
Total capital expenditures |
$ | 48,053 | $ | 2,198 | $ | 4,842 | $ | 55,093 | |||||
| | | | | | | | | | | | | | |
| | | | | | | | | | | | | | |
Net sales product mix(a): |
|||||||||||||
Perishables |
31 | % | 45 | % | — | 34 | % | ||||||
Non-Perishables |
69 | % | 55 | % | — | 66 | % | ||||||
- (a)
- The Smart & Final and Cash & Carry banners sell about 1,300 varieties of products which we categorize into perishable and non-perishable. Perishable product categories include produce, floral, bulk items, fresh meat and seafood, dairy, deli and bakery ("Perishables"). Non-perishable product categories include grocery, janitorial, paper goods, beverage, liquor, frozen and health & body care ("Non-Perishables").
F-66
Smart & Final Holdings, Inc. and Subsidiaries
Notes to Consolidated Financial Statements (Continued)
December 29, 2013
19. Segment Information (Continued)
For the Successor period November 15, 2012 through December 30, 2012, the operating information and total assets for the reportable segments are shown as follows (in thousands):
| |
Smart & Final | Cash & Carry |
Corporate/ Other |
Consolidated | |||||||||
|---|---|---|---|---|---|---|---|---|---|---|---|---|---|
Net sales |
$ | 291,126 | $ | 87,424 | $ | — | $ | 378,550 | |||||
Cost of sales, distribution and store occupancy |
255,034 | 77,841 | 912 | 333,787 | |||||||||
Operating and administrative expenses |
33,391 | 6,418 | 11,913 | 51,722 | |||||||||
| | | | | | | | | | | | | | |
Income (loss) from operations |
$ | 2,701 | $ | 3,165 | $ | (12,825 | ) | $ | (6,959 | ) | |||
| | | | | | | | | | | | | | |
| | | | | | | | | | | | | | |
As of December 30, 2012 |
|||||||||||||
Total assets |
$ | 1,652,160 | $ | 188,988 | $ | (268,234 | ) | $ | 1,572,914 | ||||
| | | | | | | | | | | | | | |
| | | | | | | | | | | | | | |
Intercompany receivable (payable) |
$ | 489,083 | $ | (140,259 | ) | $ | (348,824 | ) | $ | — | |||
| | | | | | | | | | | | | | |
| | | | | | | | | | | | | | |
Investment in joint venture |
$ | — | $ | — | $ | 9,400 | $ | 9,400 | |||||
| | | | | | | | | | | | | | |
| | | | | | | | | | | | | | |
Goodwill |
$ | 406,662 | $ | 204,580 | $ | — | $ | 611,242 | |||||
| | | | | | | | | | | | | | |
| | | | | | | | | | | | | | |
Successor period November 15, 2012 through December 30, 2012 |
|||||||||||||
Total capital expenditures |
$ | 2,784 | $ | 336 | $ | 306 | $ | 3,426 | |||||
| | | | | | | | | | | | | | |
| | | | | | | | | | | | | | |
Net sales product mix: |
|||||||||||||
Perishables |
31 | % | 45 | % | — | 34 | % | ||||||
Non-Perishables |
69 | % | 55 | % | — | 66 | % | ||||||
For the Predecessor period January 2, 2012 through November 14, 2012, the operating information and total assets for the reportable segments are shown as follows (in thousands):
| |
Smart & Final | Cash & Carry |
Corporate/ Other |
Consolidated | |||||||||
|---|---|---|---|---|---|---|---|---|---|---|---|---|---|
Net sales |
$ | 2,011,617 | $ | 652,545 | $ | — | $ | 2,664,162 | |||||
Cost of sales, distribution and store occupancy |
1,692,963 | 567,142 | 5,049 | 2,265,154 | |||||||||
Operating and administrative expenses |
235,546 | 43,672 | 85,281 | 364,499 | |||||||||
| | | | | | | | | | | | | | |
Income (loss) from operations |
$ | 83,108 | $ | 41,731 | $ | (90,330 | ) | $ | 34,509 | ||||
| | | | | | | | | | | | | | |
| | | | | | | | | | | | | | |
Predecessor period January 2, 2012 through November 14, 2012 |
|||||||||||||
Total capital expenditures |
$ | 42,009 | $ | 869 | $ | 3,901 | $ | 46,779 | |||||
| | | | | | | | | | | | | | |
| | | | | | | | | | | | | | |
Net sales product mix: |
|||||||||||||
Perishables |
29 | % | 43 | % | — | 33 | % | ||||||
Non-Perishables |
71 | % | 57 | % | — | 67 | % | ||||||
F-67
Smart & Final Holdings, Inc. and Subsidiaries
Notes to Consolidated Financial Statements (Continued)
December 29, 2013
19. Segment Information (Continued)
For the Predecessor year ended January 1, 2012, the operating information and total assets for the reportable segments are shown as follows (in thousands):
| |
Smart & Final | Cash & Carry | Corporate/ Other |
Consolidated | |||||||||
|---|---|---|---|---|---|---|---|---|---|---|---|---|---|
Net sales |
$ | 2,138,338 | $ | 701,999 | $ | — | $ | 2,840,336 | |||||
Cost of sales, distribution and store occupancy |
1,803,714 | 612,232 | (3,766 | ) | 2,412,180 | ||||||||
Operating and administrative expenses |
258,847 | 47,958 | 74,518 | 381,323 | |||||||||
| | | | | | | | | | | | | | |
Income (loss) from operations |
$ | 75,777 | $ | 41,809 | $ | (70,752 | ) | $ | 46,833 | ||||
| | | | | | | | | | | | | | |
| | | | | | | | | | | | | | |
Fiscal year ended January 1, 2012 |
|||||||||||||
Total capital expenditures |
$ | 52,454 | $ | 1,293 | $ | 2,528 | $ | 56,275 | |||||
| | | | | | | | | | | | | | |
| | | | | | | | | | | | | | |
Net sales product mix: |
|||||||||||||
Perishables |
28 | % | 43 | % | — | 32 | % | ||||||
Non-Perishables |
72 | % | 57 | % | — | 68 | % | ||||||
20. Equity Method Investment
SFHI's wholly owned subsidiary, SF Mexico, is a Mexican holding company that owns 50 percent of SFDN. The other 50 percent of the joint venture is owned by Grupo Calimax S.A. de C.V., an entity comprising the investment interests of a family group who are also the owners of the Calimax grocery store chain in Mexico. At December 29, 2013, this joint venture operated 13 "Smart & Final" format stores in northwestern Mexico, similar in concept to the Company's U.S. stores. This joint venture operates the Mexico stores as a Mexican domestic corporation under the name Smart & Final del Noroeste, S.A. de C.V. ("SFDN"). The Company's equity method investment in SFDN is approximately $10.9 million and $9.4 million at December 29, 2013 and December 30, 2012, respectively, which is included in "Equity investment in joint venture" in the Consolidated Balance Sheets. Summarized financial information for SFDN is as follows (in thousands):
| |
2013 | 2012 | |||||
|---|---|---|---|---|---|---|---|
Current assets |
$ | 17,528 | $ | 14,700 | |||
Noncurrent assets |
3,802 | 4,648 | |||||
Current liabilities |
13,976 | 14,891 | |||||
Noncurrent liabilities |
2,517 | 2,514 | |||||
| |
Fiscal Year 2013 |
Fiscal Year 2012 |
Fiscal Year 2011 |
|||||||
|---|---|---|---|---|---|---|---|---|---|---|
Sales |
$ | 77,167 | $ | 72,945 | $ | 74,673 | ||||
Gross profit |
13,675 | 13,119 | 13,675 | |||||||
Income from continuing operations |
3,298 | 1,640 | 1,570 | |||||||
Net income |
3,298 | 1,640 | 1,570 | |||||||
21. Subsequent Events
The Company has performed an evaluation of subsequent events through June 20, 2014, which is the date the consolidated financial statements were available to be issued.
F-68
SCHEDULE I—CONDENSED FINANCIAL INFORMATION OF THE REGISTRANT
Smart & Final Holdings, Inc. (Parent Company Only)
CONDENSED BALANCE SHEETS
(amounts in thousands)
| |
December 29, 2013 |
December 30, 2012 |
|||||
|---|---|---|---|---|---|---|---|
Assets |
|||||||
Current assets: |
|||||||
Cash and cash equivalents |
$ | 50 | $ | 1,145 | |||
Intercompany receivable |
5,510 | 6 | |||||
| | | | | | | | |
Total current assets |
5,560 | 1,151 | |||||
Other intangible assets, net |
626 |
958 |
|||||
Investment in subsidiaries |
340,113 | 305,914 | |||||
| | | | | | | | |
Total assets |
$ | 346,299 | $ | 308,023 | |||
| | | | | | | | |
| | | | | | | | |
Liabilities and stockholders' equity |
|||||||
Current liabilities: |
|||||||
Accrued expenses |
$ | 26 | $ | — | |||
Intercompany payable |
4,414 | 1,000 | |||||
| | | | | | | | |
Total current liabilities |
4,440 | 1,000 | |||||
Commitments and contingencies |
|||||||
Stockholders' equity: |
|||||||
Issued and outstanding shares—300,901 at December 29, 2013 and 299,201 at December 30, 2012 |
— | — | |||||
Additional paid-in capital |
311,992 | 310,292 | |||||
Retained deficit |
(1,117 | ) | (9,288 | ) | |||
Accumulated other comprehensive income |
30,984 | 6,019 | |||||
| | | | | | | | |
Total stockholders' equity |
341,859 | 307,023 | |||||
| | | | | | | | |
Total liabilities and stockholders' equity |
$ | 346,299 | $ | 308,023 | |||
| | | | | | | | |
| | | | | | | | |
See accompanying notes.
F-69
SCHEDULE I—CONDENSED FINANCIAL INFORMATION OF THE REGISTRANT
Smart & Final Holdings, Inc. (Parent Company Only)
CONDENSED STATEMENTS OF OPERATIONS AND COMPREHENSIVE INCOME
(LOSS)
(amounts in thousands)
| |
Fiscal Year 2013 |
Period From November 15, 2012 Through December 30, 2012 |
|||||
|---|---|---|---|---|---|---|---|
Operating and administrative expenses |
$ | 1,714 | $ | 42 | |||
| | | | | | | | |
Loss before income taxes |
(1,714 | ) | (42 | ) | |||
Income tax benefit |
651 | — | |||||
| | | | | | | | |
Loss before equity in net income (loss) of subsidiaries |
(1,063 | ) | (42 | ) | |||
Equity in net income (loss) of subsidiaries, net of tax |
9,234 | (9,246 | ) | ||||
| | | | | | | | |
Net income (loss) |
8,171 | (9,288 | ) | ||||
Minimum pension obligation adjustment, net of tax of $15,066 and $4,029, respectively |
22,505 | 6,019 | |||||
Derivative instruments: |
|||||||
Gain, net of tax of $1,932 |
2,898 | — | |||||
Reclassification adjustments, net of tax of $12 included in net income |
(18 | ) | — | ||||
Foreign currency translation |
(420 | ) | — | ||||
| | | | | | | | |
Other comprehensive income |
24,965 | 6,019 | |||||
| | | | | | | | |
Comprehensive income (loss) |
$ | 33,136 | $ | (3,269 | ) | ||
| | | | | | | | |
| | | | | | | | |
See accompanying notes.
F-70
SCHEDULE I—CONDENSED FINANCIAL INFORMATION OF THE REGISTRANT
Smart & Final Holdings, Inc. (Parent Company Only)
CONDENSED STATEMENTS OF CASH FLOWS
(amounts in
thousands)
| |
Fiscal Year 2013 |
Period From November 15, 2012 Through December 30, 2012 |
|||||
|---|---|---|---|---|---|---|---|
Operating activities |
|||||||
Net cash used in operating activities |
$ | (1,360 | ) | $ | (6 | ) | |
Investing activities |
|||||||
Investment in subsidiaries |
(2,794 | ) | (298,050 | ) | |||
| | | | | | | | |
Net cash used in investing activities |
(2,794 | ) | (298,050 | ) | |||
Financing activities |
|||||||
Issuance of common stock |
1,700 | 299,201 | |||||
Change in intercompany financing activities |
1,359 | — | |||||
| | | | | | | | |
Net cash provided by financing activities |
3,059 | 299,201 | |||||
| | | | | | | | |
Net (decrease) increase in cash and cash equivalents |
(1,095 | ) | 1,145 | ||||
Cash and cash equivalents at beginning of period |
1,145 | — | |||||
| | | | | | | | |
Cash and cash equivalents at end of period |
$ | 50 | $ | 1,145 | |||
| | | | | | | | |
| | | | | | | | |
See accompanying notes.
F-71
SCHEDULE I—CONDENSED FINANCIAL INFORMATION OF THE REGISTRANT
Smart & Final Holdings, Inc. (Parent Company Only)
Notes to Condensed Financial Statements
Note 1: Basis of presentation
Smart & Final Holdings, Inc. (the "Parent Company") is a holding company with no material operations of its own and conducts substantially all of its activities through its direct wholly owned subsidiary, SF CC Intermediate Holdings, Inc. and its subsidiaries and affiliate. The Parent Company was incorporated in October 2012 and became the ultimate parent company of our business in November 2012, pursuant to the acquisition by Ares Management LLC ("Ares Management") on November 15, 2012 (the "Ares Acquisition").
The accompanying condensed financial statements include the accounts of the Parent Company and, on an equity basis, its direct and indirect subsidiaries and affiliate. Accordingly, these condensed financial statements have been presented on a "parent-only" basis. Under a parent-only presentation, the Parent Company's investment in subsidiaries is presented under the equity method of accounting.
The accompanying condensed financial statements are presented only for periods following the Ares Acquisition (the "Successor periods"). We have not presented parent-only condensed financial statements for periods prior to the Ares Acquisition (the "Predecessor periods"), as we believe the information will not be meaningful to investors due to differences in the legal entity structure and capitalization, and application of purchase accounting as of the closing date of the acquisition by Ares Management.
These parent-only financial statements should be read in conjunction with the consolidated financial statements of Smart & Final Holdings, Inc. and Subsidiaries and its Predecessor, Smart & Final Holdings Corp. and Subsidiaries (the "Company") included elsewhere herein.
Note 2: Guarantees and restrictions
Smart & Final Stores LLC, a subsidiary of the Company, has $716 million of principal amount of long-term debt outstanding under the First Lien Term Loan Facility as of December 29, 2013. Under the terms of the First Lien Term Loan Credit Agreement dated November 15, 2012 (the "Agreement"), SF CC Intermediate Holdings, Inc. guaranteed the payment of all principal and interest. The debt matures on November 15, 2019 and includes restrictions on the ability of Smart & Final Stores LLC and its subsidiaries to incur additional liens and indebtedness, make investments, loans and advances, pay dividends and enter into sale and lease back transactions, among other restrictions. Under the Agreement, provided no event of default has occurred and is continuing, Smart & Final Stores LLC is permitted to pay dividends to Smart & Final Holdings, Inc. in an amount not to exceed $50 million, at December 29, 2013, and pursuant to certain other limited exceptions. The restricted net assets of the Company's consolidated subsidiaries is approximately $343 million as of December 29, 2013.
F-72
SMART & FINAL HOLDINGS, INC. AND SUBSIDIARIES
SCHEDULE II—VALUATION AND QUALIFYING ACCOUNTS
(In thousands)
| |
Balance as of Beginning of Period |
Charged to Costs and Expenses |
Deductions | Other Changes |
Balance as of End of Period |
|||||||||||
|---|---|---|---|---|---|---|---|---|---|---|---|---|---|---|---|---|
Successor—Year ended December 29, 2013 |
||||||||||||||||
Allowance for doubtful accounts |
$ | 741 | $ | 89 | $ | (62 | ) | $ | (2 | ) | $ | 766 | ||||
Valuation allowance for deferred tax assets |
1,146 | — | — | (132 | ) | 1,014 | ||||||||||
| | | | | | | | | | | | | | | | | |
|
$ | 1,887 | $ | 89 | $ | (62 | ) | $ | (134 | ) | $ | 1,780 | ||||
| | | | | | | | | | | | | | | | | |
| | | | | | | | | | | | | | | | | |
| |
Balance as of Beginning of Period |
Charged to Costs and Expenses |
Deductions | Other Changes |
Balance as of End of Period |
|||||||||||
|---|---|---|---|---|---|---|---|---|---|---|---|---|---|---|---|---|
Successor—Period from November 15, 2012 Through December 30, 2012 |
||||||||||||||||
Allowance for doubtful accounts |
$ | 724 | $ | 18 | $ | (1 | ) | $ | — | $ | 741 | |||||
Valuation allowance for deferred tax assets |
1,146 | — | — | — | 1,146 | |||||||||||
| | | | | | | | | | | | | | | | | |
|
$ | 1,870 | $ | 18 | $ | (1 | ) | $ | — | $ | 1,887 | |||||
| | | | | | | | | | | | | | | | | |
| | | | | | | | | | | | | | | | | |
| |
Balance as of Beginning of Period |
Charged to Costs and Expenses |
Deductions | Other Changes |
Balance as of End of Period |
|||||||||||
|---|---|---|---|---|---|---|---|---|---|---|---|---|---|---|---|---|
Predecessor—Period from January 2, 2012 Through November 14, 2012 |
||||||||||||||||
Allowance for doubtful accounts |
$ | 861 | $ | (93 | ) | $ | (43 | ) | $ | (1 | ) | $ | 724 | |||
Valuation allowance for deferred tax assets |
1,725 | — | (579 | ) | — | 1,146 | ||||||||||
| | | | | | | | | | | | | | | | | |
|
$ | 2,586 | $ | (93 | ) | $ | (622 | ) | $ | (1 | ) | $ | 1,870 | |||
| | | | | | | | | | | | | | | | | |
| | | | | | | | | | | | | | | | | |
| |
Balance as of Beginning of Period |
Charged to Costs and Expenses |
Deductions | Other Changes |
Balance as of End of Period |
|||||||||||
|---|---|---|---|---|---|---|---|---|---|---|---|---|---|---|---|---|
Predecessor—Year ended January 1, 2012 |
||||||||||||||||
Allowance for doubtful accounts |
$ | 892 | $ | 45 | $ | (72 | ) | $ | (4 | ) | $ | 861 | ||||
Valuation allowance for deferred tax assets |
1,701 | 24 | — | — | 1,725 | |||||||||||
| | | | | | | | | | | | | | | | | |
|
$ | 2,593 | $ | 69 | $ | (72 | ) | $ | (4 | ) | $ | 2,586 | ||||
| | | | | | | | | | | | | | | | | |
| | | | | | | | | | | | | | | | | |
F-73
Smart & Final Stores, Inc. and Subsidiaries
Condensed Consolidated Balance Sheets
(Dollars in Thousands, Except Share Amounts)
| |
June 15, 2014 |
December 29, 2013 |
|||||
|---|---|---|---|---|---|---|---|
| |
(Unaudited) |
|
|||||
Assets |
|||||||
Current assets: |
|||||||
Cash and cash equivalents |
$ | 65,561 | $ | 53,699 | |||
Accounts receivable, less allowances of $850 and $766 at June 15, 2014 and December 29, 2013, respectively |
21,901 | 19,453 | |||||
Inventories |
203,320 | 209,502 | |||||
Prepaid expenses and other current assets |
12,422 | 17,938 | |||||
Deferred income taxes |
21,443 | 20,747 | |||||
| | | | | | | | |
Total current assets |
324,647 | 321,339 | |||||
Property, plant, and equipment: |
|||||||
Land |
11,165 | 10,394 | |||||
Buildings and improvements |
23,588 | 20,441 | |||||
Leasehold improvements |
139,321 | 119,306 | |||||
Fixtures and equipment |
169,682 | 148,271 | |||||
Construction in progress |
15,761 | 5,541 | |||||
| | | | | | | | |
|
359,517 | 303,953 | |||||
Less accumulated depreciation and amortization |
84,302 | 59,961 | |||||
| | | | | | | | |
|
275,215 | 243,992 | |||||
Capitalized software, net of accumulated amortization of $7,195 and $5,168 at June 15, 2014 and December 29, 2013, respectively |
11,410 |
12,664 |
|||||
Other intangible assets, net |
327,171 | 328,865 | |||||
Goodwill |
611,242 | 611,242 | |||||
Deferred financing costs, net |
7,592 | 8,272 | |||||
Equity investment in joint venture |
11,682 | 10,948 | |||||
Other assets |
58,472 | 62,219 | |||||
| | | | | | | | |
Total assets |
$ | 1,627,431 | $ | 1,599,541 | |||
| | | | | | | | |
| | | | | | | | |
Liabilities and Stockholders' equity |
|||||||
Current liabilities: |
|||||||
Accounts payable |
$ | 164,733 | $ | 153,644 | |||
Accrued salaries and wages |
21,693 | 22,337 | |||||
Accrued expenses |
75,895 | 69,174 | |||||
Current portion of long-term debt |
7,200 | 7,200 | |||||
| | | | | | | | |
Total current liabilities |
269,521 | 252,355 | |||||
Long-term debt, less current portion and debt discount |
696,076 |
698,991 |
|||||
Deferred income taxes |
151,516 | 151,232 | |||||
Postretirement and postemployment benefits |
80,936 | 84,155 | |||||
Other long-term liabilities |
75,492 | 70,949 | |||||
Commitments and contingencies |
|||||||
Stockholders' equity: |
|||||||
Preferred stock, $0.001 par value; |
|||||||
Authorized shares—375,000 Issued and outstanding shares—none |
— | — | |||||
Common stock, $0.001 par value; |
|||||||
Authorized shares—750,000 Issued and outstanding shares—303,195 at June 15, 2014; 300,901 at December 29, 2013 |
— | — | |||||
Additional paid-in capital |
312,324 | 311,992 | |||||
Retained earnings (deficit) |
12,505 | (1,117 | ) | ||||
Accumulated other comprehensive income |
29,061 | 30,984 | |||||
| | | | | | | | |
Total stockholders' equity |
353,890 | 341,859 | |||||
| | | | | | | | |
Total liabilities and stockholders' equity |
$ | 1,627,431 | $ | 1,599,541 | |||
| | | | | | | | |
| | | | | | | | |
See notes to condensed consolidated financial statements.
F-74
Smart & Final Stores, Inc. and Subsidiaries
Condensed Consolidated Statements of Operations and Comprehensive Income
(Unaudited)
(Dollars in Thousands, Except Share and Per Share Amounts)
| |
Twelve Weeks Ended | Twenty-Four Weeks Ended | |||||||||||
|---|---|---|---|---|---|---|---|---|---|---|---|---|---|
| |
June 15, 2014 |
June 16, 2013 |
June 15, 2014 |
June 16, 2013 |
|||||||||
Net sales |
$ | 828,071 | $ | 755,943 | $ | 1,563,087 | $ | 1,446,101 | |||||
Cost of sales, buying and occupancy |
699,886 | 642,528 | 1,330,313 | 1,232,778 | |||||||||
| | | | | | | | | | | | | | |
Gross margin |
128,185 | 113,415 | 232,774 | 213,323 | |||||||||
Operating and administrative expenses |
101,491 |
88,463 |
193,849 |
174,039 |
|||||||||
| | | | | | | | | | | | | | |
Income from operations |
26,694 | 24,952 | 38,925 | 39,284 | |||||||||
Interest expense, net |
8,922 |
12,467 |
17,758 |
25,429 |
|||||||||
Loss on early extinguishment of debt |
— | (7,139 | ) | — | (7,139 | ) | |||||||
Equity in earnings of joint venture |
262 | 172 | 714 | 521 | |||||||||
| | | | | | | | | | | | | | |
Income before income taxes |
18,034 | 5,518 | 21,881 | 7,237 | |||||||||
Income tax provision |
(6,919 |
) |
(1,920 |
) |
(8,259 |
) |
(2,110 |
) |
|||||
| | | | | | | | | | | | | | |
Net income |
$ | 11,115 | $ | 3,598 | $ | 13,622 | $ | 5,127 | |||||
| | | | | | | | | | | | | | |
| | | | | | | | | | | | | | |
Net income per share: |
|||||||||||||
Basic |
$ | 36.88 | $ | 12.02 | $ | 45.24 | $ | 17.13 | |||||
Diluted |
$ | 35.61 | $ | 11.55 | $ | 43.64 | $ | 16.48 | |||||
Weighted average shares outstanding: |
|||||||||||||
Basic |
301,365 | 299,407 | 301,133 | 299,304 | |||||||||
Diluted |
312,172 | 311,516 | 312,121 | 311,098 | |||||||||
Comprehensive income: |
|||||||||||||
Net income |
$ | 11,115 | $ | 3,598 | $ | 13,622 | $ | 5,127 | |||||
Foreign currency translation |
(11 | ) | (301 | ) | 15 | (302 | ) | ||||||
Derivative instrument (loss) gain, net of tax of $(790) and $920, respectively for the twelve weeks ended; $(1,304) and $920, respectively for the twenty-four weeks ended |
(1,185 | ) | 1,377 | (1,956 | ) | 1,377 | |||||||
Reclassification adjustments, net of tax of $14 for the twelve weeks ended and $12 for the twenty-four weeks ended |
21 | — | 18 | — | |||||||||
| | | | | | | | | | | | | | |
Other comprehensive income (loss) |
(1,175 | ) | 1,076 | (1,923 | ) | 1,075 | |||||||
| | | | | | | | | | | | | | |
Comprehensive income |
$ | 9,940 | $ | 4,674 | $ | 11,699 | $ | 6,202 | |||||
| | | | | | | | | | | | | | |
| | | | | | | | | | | | | | |
See notes to condensed consolidated financial statements.
F-75
Smart & Final Stores, Inc. and Subsidiaries
Condensed Consolidated Statements of Cash Flows
(Unaudited)
(Dollars in
Thousands)
| |
Twenty-four Weeks Ended | ||||||
|---|---|---|---|---|---|---|---|
| |
June 15, 2014 |
June 16, 2013 |
|||||
Operating activities |
|||||||
Net income |
$ | 13,622 | $ | 5,127 | |||
Adjustments to reconcile net income to net cash provided by operating activities: |
|||||||
Depreciation |
15,659 | 15,029 | |||||
Amortization |
12,794 | 12,346 | |||||
Amortization of deferred financing costs and debt discount |
1,534 | 1,951 | |||||
Share-based compensation |
1,740 | — | |||||
Excess tax benefits related to share-based payments |
(730 | ) | — | ||||
Deferred income taxes |
(696 | ) | — | ||||
Equity in earnings of joint venture |
(714 | ) | (521 | ) | |||
Loss on disposal of property, plant, and equipment |
32 | 30 | |||||
Asset impairment |
229 | 201 | |||||
Loss on early extinguishment of debt |
— | 7,139 | |||||
Changes in operating assets and liabilities: |
|||||||
Accounts receivable, net |
(2,448 | ) | 289 | ||||
Inventories, net |
6,182 | 9,127 | |||||
Prepaid expenses and other assets |
5,312 | 8,181 | |||||
Accounts payable |
11,089 | 15,603 | |||||
Accrued salaries and wages |
(644 | ) | (5,946 | ) | |||
Other accrued liabilities |
2,789 | (7,510 | ) | ||||
| | | | | | | | |
Net cash provided by operating activities |
65,750 | 61,046 | |||||
Investing activities |
|||||||
Purchases of property, plant, and equipment |
(47,478 | ) | (20,929 | ) | |||
Proceeds from disposal of property, plant, and equipment |
20 | 18 | |||||
Investment in capitalized software |
(968 | ) | (1,071 | ) | |||
Other |
(36 | ) | (297 | ) | |||
| | | | | | | | |
Net cash used in investing activities |
(48,462 | ) | (22,279 | ) | |||
Financing activities |
|||||||
Borrowings on bank line of credit |
— | 5,000 | |||||
Issuance of bank debt, net of issuance costs |
— | 50,055 | |||||
Issuance of common stock |
79 | 1,200 | |||||
Proceeds from exercise of stock options |
450 | — | |||||
Payment of minimum withholding taxes on net share settlement of stock option exercise |
(2,667 | ) | — | ||||
Fees paid in conjunction with debt financing |
(170 | ) | (148 | ) | |||
Payments on bank line of credit |
— | (7,000 | ) | ||||
Payments on bank debt |
(3,600 | ) | (56,313 | ) | |||
Excess tax benefits related to share-based payments |
730 | — | |||||
Contingent consideration related to acquisition of SFHC |
(248 | ) | — | ||||
| | | | | | | | |
Net cash used in financing activities |
(5,426 | ) | (7,206 | ) | |||
| | | | | | | | |
Net increase in cash and cash equivalents |
11,862 | 31,561 | |||||
Cash and cash equivalents at beginning of period |
53,699 | 35,987 | |||||
| | | | | | | | |
Cash and cash equivalents at end of period |
$ | 65,561 | $ | 67,548 | |||
| | | | | | | | |
| | | | | | | | |
Cash paid during the period for: |
|||||||
Interest |
$ | 15,789 | $ | 21,122 | |||
| | | | | | | | |
| | | | | | | | |
Income taxes |
$ | 5,222 | $ | 2,132 | |||
| | | | | | | | |
| | | | | | | | |
Non-cash investing and financing activities |
|||||||
Software development costs incurred but not paid |
$ | 206 | $ | 5 | |||
| | | | | | | | |
| | | | | | | | |
Construction in progress costs incurred but not paid |
$ | 12,047 | $ | 4,932 | |||
| | | | | | | | |
| | | | | | | | |
Other consideration payable for acquisition of Smart & Final Holdings Corp. |
$ | 2,359 | $ | 18,630 | |||
| | | | | | | | |
| | | | | | | | |
See notes to condensed consolidated financial statements.
F-76
Smart & Final Stores, Inc. and Subsidiaries
Condensed Consolidated Statements of Stockholders' Equity
(Unaudited)
(Dollars in Thousands, Except Share Amounts)
| |
Common Stock | |
|
|
|
||||||||||||||
|---|---|---|---|---|---|---|---|---|---|---|---|---|---|---|---|---|---|---|---|
| |
|
|
Accumulated Other Comprehensive Income |
|
|||||||||||||||
| |
Number of Shares | Amount | Additional Paid-In Capital |
Retained Earnings (Deficit) |
Total | ||||||||||||||
Balance at December 29, 2013 |
300,901 | $ | — | $ | 311,992 | $ | (1,117 | ) | $ | 30,984 | $ | 341,859 | |||||||
Net income |
— | — | — | 13,622 | — | 13,622 | |||||||||||||
Other comprehensive loss |
— | — | — | (1,923 | ) | (1,923 | ) | ||||||||||||
Issuance of common stock |
50 | — | 79 | — | — | 79 | |||||||||||||
Share-based compensation |
— | — | 1,740 | — | — | 1,740 | |||||||||||||
Stock option exercise, net of 2,623 shares net settled |
2,244 | — | (2,217 | ) | — | — | (2,217 | ) | |||||||||||
Excess tax benefit for exercise of stock options |
— | — | 730 | — | — | 730 | |||||||||||||
| | | | | | | | | | | | | | | | | | | | |
Balance at June 15, 2014 |
303,195 | $ | — | $ | 312,324 | $ | 12,505 | $ | 29,061 | $ | 353,890 | ||||||||
| | | | | | | | | | | | | | | | | | | | |
| | | | | | | | | | | | | | | | | | | | |
See notes to condensed consolidated financial statements.
F-77
Smart & Final Stores, Inc. and Subsidiaries
Notes to Unaudited Condensed Consolidated Financial Statements
June 15, 2014
1. Description of Business and Basis of Presentation
Business
Smart & Final Stores, Inc., a Delaware corporation, ("SFSI" and, collectively with its wholly owned consolidated subsidiaries, the "Company"), is engaged primarily in the business of selling fresh perishables and everyday grocery items, together with foodservice, packaging and janitorial products. The Company operates non-membership, warehouse-style stores offering products in a range of product sizes. On June 16, 2014, the Company changed its name to SFSI from Smart & Final Holdings, Inc.
SFSI was formed in connection with the acquisition of the "Smart & Final" and "Cash & Carry" store businesses through the purchase of all of the outstanding common stock of Smart & Final Holdings Corp. (the "Predecessor" or "SFHC") on November 15, 2012. The principal acquiring entities were affiliates of Ares Management, L.P. ("Ares") and the acquisition is referred to as the "Ares Acquisition."
The Company operates its stores under the "Smart & Final" banner and the "Cash & Carry" banner. As of June 15, 2014, the Company operated 246 stores throughout the Western U.S.
Basis of Presentation
The accompanying unaudited condensed consolidated financial statements have been prepared in accordance with accounting principles generally accepted in the United States ("U.S. GAAP") for interim financial statements, and Rule 10-01 of Regulation S-X of the Securities Act of 1933, as amended (the "Securities Act"). The unaudited condensed consolidated financial statements reflect all adjustments, consisting of normal recurring adjustments, considered necessary for a fair presentation of the Company's financial position, results of operations and cash flows for the periods indicated. All material intercompany accounts and transactions have been eliminated in consolidation. Interim results are not necessarily indicative of results for a full fiscal year. The information included in these unaudited condensed consolidated financial statements and notes thereto should be read in conjunction with the Company's audited consolidated financial statements as of and for the fiscal year ended December 29, 2013.
Fiscal Years
The Company's fiscal year is the 52- or 53-week period that ends on the Sunday closest to December 31. Each fiscal year consists of twelve-week periods in the first, second and fourth quarters and a sixteen-week period in the third quarter.
2. Significant Accounting Policies
The Company's significant accounting policies are described in Note 2, Summary of Significant Accounting Policies to the Company's audited consolidated financial statements as of and for the fiscal year ended December 29, 2013.
3. Recent Accounting Pronouncements
In June 2014, the Financial Accounting Standards Board issued Accounting Standards Update ("ASU") 2014-12, Accounting for Share-Based Payments When the Terms of an Award Provide That a
F-78
Smart & Final Stores, Inc. and Subsidiaries
Notes to Unaudited Condensed Consolidated Financial Statements (Continued)
June 15, 2014
3. Recent Accounting Pronouncements (Continued)
Performance Target Could Be Achieved after the Requisite Service Period. The standard provides guidance that a performance target that affects vesting of a share-based payment and that could be achieved after the requisite service condition is a performance condition. As a result, the target is not reflected in the estimation of the award's grant date fair value. Share-based compensation cost for such award would be recognized over the required service period, if it is probable that the performance condition will be achieved. ASU 2014-12 is effective for annual reporting periods beginning after December 15, 2015. Early adoption is permitted. The guidance should be applied on a prospective basis to awards that are granted or modified on or after the effective date of the standard. Companies also have the option to apply the guidance on a modified retrospective basis for awards with performance targets outstanding on or after the beginning of the first annual period presented after the effective date of the standard. The Company does not expect the adoption of ASU 2014-12 will have a material effect on the consolidated financial statements.
Also refer to Note 2, Summary of Significant Accounting Policies—Recently Issued Accounting Pronouncements Not Yet Adopted, to the Company's audited consolidated financial statements as of and for the fiscal year ended December 29, 2013.
4. Apollo Acquisition Restructuring Reserves
The Predecessor was formed in connection with the acquisition of the "Smart & Final" and "Cash & Carry" businesses through the purchase of the publicly traded stock of Smart & Final Inc. ("SFI") and the concurrent acquisition of SFI's majority stockholder Casino USA, Inc. ("Casino USA") on May 31, 2007. The principal acquiring entity in both the SFI acquisition and the Casino USA acquisition was an affiliate of Apollo Management, L.P. ("Apollo"). Together, the two acquisitions are referred to as the "Apollo Acquisition."
Upon consummation of the Apollo Acquisition in 2007, new management of the Predecessor initiated a review of the Predecessor's portfolio of operating stores and stores in development (the "Store Program"). A liability in the amount of $13.2 million was recorded for estimated costs to be incurred in connection with the Predecessor's exit from certain operating stores or store properties in development related to the Store Program. This cost was included in the acquisition cost allocation for the Apollo Acquisition. For the twenty-four weeks ended June 15, 2014, the reserves related to the Store Program were increased by $0.1 million, which are included in "Operating and administrative expenses" in the condensed consolidated statements of operations and comprehensive income of SFSI.
The following table summarizes the activity for the Store Program (in thousands):
Balance as of December 29, 2013 |
$ | 2,601 | ||
Adjustments to reserve included in net income for the period |
109 | |||
Lease termination costs paid |
(253 | ) | ||
| | | | | |
Balance as of June 15, 2014 |
$ | 2,457 | ||
| | | | | |
| | | | | |
F-79
Smart & Final Stores, Inc. and Subsidiaries
Notes to Unaudited Condensed Consolidated Financial Statements (Continued)
June 15, 2014
5. Debt
Long-term debt at June 15, 2014, and December 29, 2013 was as follows (in thousands):
| |
June 15, 2014 |
December 29, 2013 |
|||||
|---|---|---|---|---|---|---|---|
Term Loan Facility, at 4.75% and 4.75% |
$ | 712,188 | $ | 715,788 | |||
Less: |
|||||||
Discount on debt issuance |
(8,912 | ) | (9,597 | ) | |||
Current portion of long-term debt |
(7,200 | ) | (7,200 | ) | |||
| | | | | | | | |
Total long-term debt, less current portion |
$ | 696,076 | $ | 698,991 | |||
| | | | | | | | |
| | | | | | | | |
In conjunction with the Ares Acquisition, Smart & Final Stores LLC, an indirect wholly owned subsidiary of SFSI ("Smart & Final Stores"), entered into three new financing arrangements effective November 15, 2012, including two term loan agreements: the first lien term loan facility (the "Term Loan Facility") and a second lien term loan facility (the "Second Lien Term Loan Facility") and an asset-based lending facility (the "Revolving Credit Facility").
The Term Loan Facility has a term of seven years and originally provided financing of up to a maximum of $525.0 million in term loans. At November 15, 2012, the Term Loan Facility was drawn to provide $525.0 million in gross proceeds as a part of the funding for the Ares Acquisition.
All obligations under the Term Loan Facility are secured by (1) a first-priority security interest in substantially all of the property and assets of, as well as the equity interests owned by, Smart & Final Stores and SF CC Intermediate Holdings Inc., a direct wholly owned subsidiary of SFSI ("Intermediate Holdings"), and the other guarantors, with certain exceptions, and (2) a second-priority security interest in the Revolving Credit Facility collateral.
Initially, borrowings under the Term Loan Facility bore interest at an applicable margin of 3.50% plus, at Smart & Final Stores' option, a fluctuating rate equal to the highest of 1) the federal funds rate plus 0.50%, 2) a rate of interest published by The Wall Street Journal as the "Prime Rate," or 3) a LIBOR loan rate based on LIBOR plus 1.00%. Eurocurrency Borrowings (as defined in the credit agreement governing the Term Loan Facility) bore interest at the adjusted LIBOR rate, which is the greater of (a) the LIBOR rate in effect for the applicable interest period divided by one, minus the Statutory Reserves (as defined in the credit agreement governing the Term Loan Facility) applicable to such Eurocurrency Borrowing, if any, and (b) 1.25% plus the applicable Eurocurrency (as defined in the credit agreement governing the Term Loan Facility) loan rate margin of 4.50%. At June 15, 2014 and December 29, 2013, the weighted-average interest rate on the amount outstanding under the Term Loan Facility was 4.75%.
The Term Loan Facility contains a provision for quarterly amortization of principal in the amount of 0.25% of the aggregate principal amount of the term loans outstanding under the Term Loan Facility beginning March 31, 2013. The Term Loan Facility may be prepaid, in whole or in part, at any time but Smart & Final Stores must pay a prepayment premium of 1.00% of the principal amount of the term loans so prepaid if prepayment occurs as a result of a repricing transaction and is effective prior to the first anniversary of the facility. Mandatory prepayments are required (i) in the amount of the net proceeds of a sale of assets, subject to the priority of the Revolving Credit Facility collateral, and (ii) in
F-80
Smart & Final Stores, Inc. and Subsidiaries
Notes to Unaudited Condensed Consolidated Financial Statements (Continued)
June 15, 2014
5. Debt (Continued)
the amount of certain excess cash flows, adjusted by any voluntary prepayments. The Term Loan Facility has no financial covenant requirements.
The Second Lien Term Loan Facility had a term of eight years and provided $195.0 million in gross proceeds at November 15, 2012.
All obligations under the Second Lien Term Loan Facility were secured by (1) a second-priority security interest on all Term Loan Facility collateral and (2) a third-party security interest on the Revolving Credit Facility collateral.
Borrowings under the Second Lien Term Loan Facility bore interest at an applicable margin of 8.25% plus, at Smart & Final Stores' option, a fluctuating rate equal to the highest of (1) the federal funds rate plus 0.50%, (2) a rate of interest published by The Wall Street Journal as the "Prime Rate," or (3) a LIBOR loan rate based on LIBOR plus 1.00%. Eurocurrency Borrowings (as defined in the credit agreement governing the Second Lien Term Loan Facility) bore interest at the adjusted LIBOR rate, which is the greater of (a) the LIBOR rate in effect for the applicable interest period divided by one, minus the Statutory Reserves (as defined in the credit agreement governing the Second Lien Term Loan Facility) applicable to such Eurocurrency Borrowing, if any, and (b) 1.25% plus the applicable Eurocurrency (as defined in the credit agreement governing the Second Lien Term Loan Facility) loan rate margin of 9.25%.
The Second Lien Term Loan Facility could be prepaid, in whole or in part, at any time but Smart & Final Stores had to pay a prepayment premium of 2.00% of the principal amount of the term loans so prepaid through the first anniversary of the facility and 1.00% of the principal amount of the term loans so prepaid from the first anniversary through the second anniversary of the facility. Mandatory prepayments were required (1) in the amount of the net proceeds of a sale of assets, subject to the priority of the Revolving Credit Facility collateral, and (2) in the amount of certain excess cash flows, adjusted by any voluntary prepayments. Any mandatory prepayments for the Second Lien Term Loan Facility were reduced dollar-for- dollar by amounts required to prepay the Term Loan Facility. The Second Lien Term Loan Facility had no financial covenant requirements.
During the second quarter of 2013, the Company amended the Term Loan Facility, reducing the applicable margin from 4.50% to 3.50%. The definition of Adjusted LIBOR Rate was also amended to reduce the floor rate from 1.25% to 1.00%. Additionally, the Company increased the size of the Term Loan Facility by $55.0 million through an incremental facility. The proceeds of this additional borrowing were used to reduce the amounts outstanding under the Second Lien Term Loan Facility by $55.0 million, reducing the outstanding balance to $140.0 million. Consequently, during the second quarter of 2013, the Company recorded a loss on the early extinguishment of debt of $7.1 million related to fees and the write-off of unamortized debt discount and deferred financing costs. The Company incurred approximately $7.5 million of fees in connection with the amendment of the Term Loan Facility. Approximately $4.9 million of these fees were recorded as debt discount and are amortized over the term of the loan. Quarterly amortization of the principal amount increased to $1.5 million.
During the fourth quarter of 2013, the Company amended the Term Loan Facility, increasing the applicable margin from 3.50% to 3.75%, and reducing the size of the incremental borrowing facilities that can be incurred without regard to leverage-based limitations from $125.0 million to $75.0 million
F-81
Smart & Final Stores, Inc. and Subsidiaries
Notes to Unaudited Condensed Consolidated Financial Statements (Continued)
June 15, 2014
5. Debt (Continued)
(the "2nd Amendment"). Also, the Term Loan Facility may still be prepaid, in whole or in part, at any time but Smart & Final Stores must pay a prepayment premium of 1.00% of the principal amount of the term loans so prepaid if the prepayment occurs as a result of a repricing transaction and is effective within six months of the 2nd Amendment. Additionally, the Company increased the size of the Term Loan Facility by $140.0 million through an incremental facility. The proceeds of this borrowing were used to repay all amounts outstanding under the Second Lien Term Loan Facility. Consequently, during the fourth quarter of 2013, the Company recorded a loss on the early extinguishment of debt of $17.3 million related to fees and the write-off of unamortized debt discount and deferred financing costs. The Company incurred approximately $4.8 million of fees in connection with the 2nd Amendment. Approximately $1.1 million of these fees were recorded as debt discount and approximately $0.7 million of these fees were recorded as deferred financing costs. They are both amortized over the term of the Term Loan Facility. Quarterly amortization of the principal amount increased to $1.8 million.
During the twenty-four weeks ended June 15, 2014, the Company made principal amortization payments of $3.6 million.
The Revolving Credit Facility provides financing of up to $150 million (including up to $50.0 million for the issuance of letters of credit) subject to a borrowing base, for a term of five years. The borrowing base is a formula based on certain eligible inventory and receivables, minus certain reserves.
All obligations under the Revolving Credit Facility are secured by (1) a first-priority security interest in the accounts receivable, inventory, cash and cash equivalents, and related assets of Smart & Final Stores and Intermediate Holdings and the other guarantors under the facility, and (2) a second-priority security interest in substantially all of the other property and assets of, as well as the equity interests owned by, Smart & Final Stores and Intermediate Holdings and the other guarantors under the facility.
Borrowings under the Revolving Credit Facility bear interest at an applicable margin plus, at Smart & Final Stores' option, a fluctuating rate equal to either (1) adjusted LIBOR (defined as a rate equal to the LIBOR rate in effect for the applicable interest period, as adjusted for statutory reserves) or (2) the alternate base rate (defined as a fluctuating rate equal to the highest of (x) the federal funds effective rate plus 0.50%, (y) the interest rate announced by the administrative agent as its "Prime Rate" and (z) the adjusted LIBOR rate for an interest period of one month plus 1.00%). The applicable margin is determined by a pricing grid based on the facility availability. At June 15, 2014 and December 29, 2013, the alternate base rate was 3.25% and the applicable margin for alternate base rate loans was 0.25% for a total rate of 3.50%. The calculated borrowing base of the Revolving Credit Facility was $150.7 million and $147.8 million at June 15, 2014 and December 29, 2013, respectively. As of June 16, 2013 and December 29, 2013, there was no balance outstanding under the Revolving Credit Facility.
The Revolving Credit Facility also provides for a $50.0 million sub-limit for letters of credit, of which the Company had $26.6 million outstanding as of both June 15, 2014 and December 29, 2013. As of June 15, 2014 and December 29, 2013, the amount available for borrowing under the Revolving Credit Facility was $123.4 million and $121.2 million, respectively.
F-82
Smart & Final Stores, Inc. and Subsidiaries
Notes to Unaudited Condensed Consolidated Financial Statements (Continued)
June 15, 2014
5. Debt (Continued)
The Revolving Credit Facility does not include financial covenant requirements unless a defined covenant trigger event has occurred and is continuing. If a covenant trigger event has occurred, Smart & Final Stores must maintain a fixed charge coverage ratio of not less than 1.0 to 1.0 for the most recent period of four consecutive fiscal quarters for which required financial statements are available at the time of occurrence of such covenant trigger event. A covenant trigger event shall have occurred at any time that availability is less than the greater of (a) $12.5 million and (b) 10.0% of the line cap (the lesser of the aggregate commitments under the Revolving Credit Facility and the borrowing base then in effect) then in effect. Once commenced, a covenant trigger event shall be deemed to be continuing until such time as availability equals or exceeds the greater of (i) $12.5 million and (ii) 10.0% of the line cap then in effect for 20 consecutive days. As of June 15, 2014 and December 29, 2013, respectively, no trigger event had occurred.
6. Derivative Financial Instruments
On April 15, 2013, the Company entered into a five-year interest rate swap agreement (the "Swap") to fix the LIBOR component of interest under the Term Loan Credit Facility at 1.7325% on a variable notional amount starting at $422.7 million and declining to $359.7 million for the period from September 30, 2014 through March 29, 2018. The Swap has been designated as a cash flow hedge against LIBOR interest rate movements and formally assessed, both at inception and at least quarterly thereafter, as to whether it was effective in offsetting changes in cash flows of the hedged item. The portion of the change in fair value attributable to hedge ineffectiveness was recorded in "Interest expense, net" in the condensed consolidated statements of operations and comprehensive income of SFSI. The portion of the change in fair value attributable to hedge effectiveness, net of income tax effects, was recorded to "Accumulated other comprehensive income" in the condensed consolidated statements of stockholders' equity of SFSI.
On May 30, 2013, the Company entered into an amendment to the Swap to change the fixed LIBOR component to 1.5995% and the floor rate to 1.00%.
As of June 15, 2014 and December 29, 2013, respectively, the fair value carrying amount of the Company's interest rate swaps are recorded as follows (in thousands):
| |
June 15, 2014 |
December 29, 2013 |
|||||
|---|---|---|---|---|---|---|---|
Other assets |
$ | 3,461 | $ | 5,460 | |||
Accrued expenses |
(1,891 | ) | (629 | ) | |||
| | | | | | | | |
Total derivatives designated as hedging instruments |
$ | 1,570 | $ | 4,831 | |||
| | | | | | | | |
| | | | | | | | |
F-83
Smart & Final Stores, Inc. and Subsidiaries
Notes to Unaudited Condensed Consolidated Financial Statements (Continued)
June 15, 2014
6. Derivative Financial Instruments (Continued)
The following tables summarize the loss recognized in accumulated other comprehensive income ("AOCI") and the amount of gain reclassified from AOCI into earnings for the twenty-four weeks ended June 15, 2014 (in thousands):
| |
Amount of Loss Recognized in AOCI on Derivative, Net of Tax (Effective Portion) |
Amount of Gain Recognized in Earnings on Derivative, Net of Tax (Ineffective Portion) |
|||||
|---|---|---|---|---|---|---|---|
Interest rate swaps |
$ | (1,938 | ) | $ | 18 | ||
7. Fair Value Measurements
The Company applies the provisions of ASC 820, Fair Value Measurements and Disclosures ("ASC 820"), for its financial and nonfinancial assets and liabilities. ASC 820 defines fair value as the price that would be received to sell an asset or paid to transfer a liability in an orderly transaction between market participants at the measurement date. ASC 820 establishes a fair value hierarchy, which prioritizes the inputs used in measuring fair value into three broad levels as follows:
Level 1—Quoted prices for identical instruments in active markets
Level 2—Quoted prices for similar instruments in active markets; quoted prices for identical or similar instruments in markets that are not active; and model-derived valuations in which all significant inputs and significant value drivers are observable in active markets
Level 3—Valuations derived from valuation techniques in which one or more significant inputs or significant value drivers are unobservable
F-84
Smart & Final Stores, Inc. and Subsidiaries
Notes to Unaudited Condensed Consolidated Financial Statements (Continued)
June 15, 2014
7. Fair Value Measurements (Continued)
The Company's assets and liabilities measured at fair value on a recurring basis are summarized in the following table by the type of inputs applicable to the fair value measurements (in thousands):
| |
Fair Value Measurement at June 15, 2014 | ||||||||||||
|---|---|---|---|---|---|---|---|---|---|---|---|---|---|
Description
|
Total as of June 15, 2014 |
Quoted Prices in Active Markets for Identical Assets (Level 1) |
Significant Other Observable Inputs (Level 2) |
Significant Unobservable Inputs (Level 3) |
|||||||||
Financial assets |
|||||||||||||
Other assets—cash and cash equivalents that fund supplemental executive retirement plan and deferred compensation plan |
$ | 739 | $ | 739 | $ | — | $ | — | |||||
Other assets—assets that fund supplemental executive retirement plan |
2,587 | 2,587 | — | — | |||||||||
Other assets—deferred compensation plan investment in Sprouts |
7,630 | — | 7,630 | — | |||||||||
Derivatives |
1,570 | — | 1,570 | — | |||||||||
Financial liabilities |
|||||||||||||
Other long-term liabilities—deferred compensation plan |
(14,855 | ) | — | (14,855 | ) | — | |||||||
| | | | | | | | | | | | | | |
Total |
$ | (2,329 | ) | $ | 3,326 | $ | (5,655 | ) | $ | — | |||
| | | | | | | | | | | | | | |
| | | | | | | | | | | | | | |
Level 1 Investments include money market funds of $0.7 million and market index funds of $2.6 million. The fair values of these funds are based on quoted market prices in an active market.
Level 2 Assets and liabilities include $14.9 million of deferred compensation liabilities, of which the fair value is based on quoted prices of similar assets traded in active markets, and $1.6 million of derivatives, which are interest rate hedges. The fair values of the derivatives are primarily determined based on third-party pricing services with observable inputs, including interest rates and yield curves.
Level 2 Investments also include deferred compensation plan investments in an investment vehicle invested in Sprouts Farmers Market, Inc. ("Sprouts"). During the twenty-four weeks ended June 15, 2014, the Company adjusted the fair market value of the investment vehicle to $7.6 million, reflecting a fair market value decrease of $4.3 million from December 29, 2013. The valuation of this investment vehicle is based on the underlying asset of the entity that trades in observable markets.
F-85
Smart & Final Stores, Inc. and Subsidiaries
Notes to Unaudited Condensed Consolidated Financial Statements (Continued)
June 15, 2014
7. Fair Value Measurements (Continued)
| |
Fair Value Measurement at December 29, 2013 | ||||||||||||
|---|---|---|---|---|---|---|---|---|---|---|---|---|---|
Description
|
Total as of December 29, 2013 |
Quoted Prices in Active Markets for Identical Assets (Level 1) |
Significant Other Observable Inputs (Level 2) |
Significant Unobservable Inputs (Level 3) |
|||||||||
Financial assets |
|||||||||||||
Other assets—cash and cash equivalents that fund supplemental executive retirement plan and deferred compensation plan |
$ | 739 | $ | 739 | $ | — | $ | — | |||||
Other assets—assets that fund supplemental executive retirement plan |
2,490 | 2,490 | — | — | |||||||||
Other assets—deferred compensation plan investment in Sprouts |
11,919 | — | 11,919 | — | |||||||||
Derivatives |
4,831 | — | 4,831 | — | |||||||||
Financial liabilities |
|||||||||||||
Other long-term liabilities—deferred compensation plan |
(18,831 | ) | — | (18,831 | ) | — | |||||||
| | | | | | | | | | | | | | |
Total |
$ | 1,148 | $ | 3,229 | $ | (2,081 | ) | $ | — | ||||
| | | | | | | | | | | | | | |
| | | | | | | | | | | | | | |
Level 1 Investments include money market funds of $0.7 million and market index funds of $2.5 million. The fair values of these funds are based on quoted market prices in an active market.
Level 2 Assets and liabilities include $18.8 million of deferred compensation liabilities, of which the fair value is based on quoted prices of similar assets traded in active markets, and $4.8 million of derivatives, which are interest rate hedges. The fair values of the derivatives are primarily determined based on third-party pricing services with observable inputs, including interest rates and yield curves.
Level 2 Investments also include deferred compensation plan investments in an investment vehicle invested in Sprouts. During the fiscal year ended December 29, 2013, the Company adjusted the fair market value of the investment vehicle to reflect the fair market value increase of $10.7 million. The valuation of this investment vehicle is based on the underlying asset of the entity that trades in observable markets.
Certain assets are measured at fair value on a nonrecurring basis which means the assets are not measured at fair value on an ongoing basis but, rather, are subject to fair value adjustments only in certain circumstances (for example, when there is evidence of impairment).
8. Retirement Benefit Plans and Postretirement and Postemployment Benefit Obligations
Defined Benefit Retirement Plan
The Company has a funded noncontributory defined benefit retirement plan (the "Single-Employer Plan") that, prior to June 1, 2008, covered substantially all full-time employees following a vesting period of five years of service (the "Pension Participants") and provided defined benefits based on years of service and final average salary. The Predecessor froze the accruing of future benefits for the
F-86
Smart & Final Stores, Inc. and Subsidiaries
Notes to Unaudited Condensed Consolidated Financial Statements (Continued)
June 15, 2014
8. Retirement Benefit Plans and Postretirement and Postemployment Benefit Obligations (Continued)
Pension Participants (the "Frozen Pension Participants") effective June 1, 2008, with the exception of approximately 450 hourly paid employees in the Company's distribution and transportation operations who remain eligible for pension benefits under the prior terms. No new employees are eligible for participation in the Single-Employer Plan after June 1, 2008, with the exception of new hires in the Company's eligible distribution and transportation operations. Frozen Pension Participants will continue to accrue service for vesting purposes only and future payments from the Single-Employer Plan will be in accordance with the Single-Employer Plan's retirement payment provisions. The Company funds the Single-Employer Plan with annual contributions as required by the Employee Retirement Income Security Act of 1974, as amended ("ERISA"). The Company uses a measurement date of December 31 for the Single-Employer Plan.
The components included in the net periodic benefit cost for the periods indicated are as follows (in thousands):
| |
Twelve Weeks Ended | Twenty-Four Weeks Ended |
|||||||||||
|---|---|---|---|---|---|---|---|---|---|---|---|---|---|
| |
June 15, 2014 |
June 16, 2013 |
June 15, 2014 |
June 16, 2013 |
|||||||||
Service cost |
$ | 274 | $ | 276 | $ | 481 | $ | 539 | |||||
Interest cost |
2,092 | 1,680 | 3,672 | 3,279 | |||||||||
Expected return on plan assets |
(2,238 | ) | (1,586 | ) | (3,928 | ) | (3,095 | ) | |||||
Amortization of net actuarial gain |
(166 | ) | — | (292 | ) | — | |||||||
| | | | | | | | | | | | | | |
Net periodic benefit cost |
$ | (38 | ) | $ | 370 | $ | (67 | ) | $ | 723 | |||
| | | | | | | | | | | | | | |
| | | | | | | | | | | | | | |
During the twenty-four weeks ended June 15, 2014, the Company made a $3.1 million contribution to the Single-Employer Plan. The Company expects to fund a minimum required contribution of $10.7 million during fiscal year 2014.
Supplemental Executive Retirement Plan
The Company maintains a noncontributory supplemental executive retirement plan ("SERP"), which provides supplemental income payments for certain current and former corporate officers in retirement. Service and compensation accruals under the SERP were frozen effective June 1, 2008, and the accumulated SERP benefit for each participant was also frozen. Accordingly, SERP participants no longer accrue future service benefits nor will future compensation adjust the frozen SERP benefit.
The Company invests in corporate-owned life insurance policies, which provide partial funding for the SERP. The Company uses a measurement date of December 31 for the SERP.
F-87
Smart & Final Stores, Inc. and Subsidiaries
Notes to Unaudited Condensed Consolidated Financial Statements (Continued)
June 15, 2014
8. Retirement Benefit Plans and Postretirement and Postemployment Benefit Obligations (Continued)
The components included in the net periodic benefit cost for the periods indicated are as follows (in thousands):
| |
Twelve Weeks Ended |
Twenty-Four Weeks Ended |
|||||||||||
|---|---|---|---|---|---|---|---|---|---|---|---|---|---|
| |
June 15, 2014 |
June 16, 2013 |
June 15, 2014 |
June 16, 2013 |
|||||||||
Interest cost |
$ | 277 | $ | 229 | $ | 554 | $ | 458 | |||||
| | | | | | | | | | | | | | |
Net periodic benefit cost |
$ | 277 | $ | 229 | $ | 554 | $ | 458 | |||||
| | | | | | | | | | | | | | |
| | | | | | | | | | | | | | |
Postretirement and Postemployment Benefit Obligations
The Company provides health care benefits for certain retired employees. Prior to June 1, 2008, substantially all full-time employees could become eligible for these benefits if they reached retirement age while still working for the Company. The Predecessor froze the accruing of benefits for eligible participants effective June 1, 2008. Participants who were eligible for a retiree medical benefit and retired prior to June 1, 2009 continued to be eligible for retiree medical coverage. The Company retains the right to make further amendments to the benefit formula and eligibility requirements. This postretirement health care plan is contributory, and adjustments to participants' contributions are made annually. This plan limits benefits to the lesser of the actual cost for the medical coverage selected or a defined dollar benefit based on years of service. The Company uses a measurement date of December 31 for this health care plan.
The components included in the postretirement benefit cost for the periods indicated are as follows (in thousands):
| |
Twelve Weeks Ended |
Twenty-Four Weeks Ended |
|||||||||||
|---|---|---|---|---|---|---|---|---|---|---|---|---|---|
| |
June 15, 2014 |
June 16, 2013 |
June 15, 2014 |
June 16, 2013 |
|||||||||
Service cost |
$ | 70 | $ | 75 | $ | 140 | $ | 150 | |||||
Interest cost |
152 | 133 | 304 | 266 | |||||||||
Prior service credit |
(10 | ) | — | (20 | ) | — | |||||||
| | | | | | | | | | | | | | |
Net periodic benefit cost |
$ | 212 | $ | 208 | $ | 424 | $ | 416 | |||||
| | | | | | | | | | | | | | |
| | | | | | | | | | | | | | |
9. Income Taxes
The Company's effective tax rate for the twenty-four weeks ended June 15, 2014 and June 16, 2013 was 37.7% and 29.2%, respectively. The decrease in the effective tax rate for both periods was primarily due to equity earnings of the Mexico joint venture not subject to U.S. tax, permanent differences relating to changes in the cash surrender value of corporate-owned life insurance policies and job credits.
F-88
Smart & Final Stores, Inc. and Subsidiaries
Notes to Unaudited Condensed Consolidated Financial Statements (Continued)
June 15, 2014
9. Income Taxes (Continued)
The Company's policy is to accrue interest and penalties related to unrecognized tax benefits as a component of income tax expense. At June 15, 2014 and June 16, 2013, the Company had not accrued any interest and penalties related to unrecognized tax benefits.
The Company files income tax returns in the U.S. federal jurisdiction, various state jurisdictions and Mexico. The Company is subject to examinations by the major tax jurisdictions in which it files for the tax years 2005 and forward. Currently, the federal tax return for the periods ended January 1, 2012 and November 14, 2012 are under examination by the Internal Revenue Service. The Company's 2005 through 2007 tax returns are currently under audit by the California Franchise Tax Board.
10. Share-Based Compensation
Effective November 15, 2012, SFSI adopted the SF CC Holdings, Inc. 2012 Stock Incentive Plan (the "2012 Incentive Plan"), which provides for the issuance of equity-based incentive awards not to exceed 60,000 shares of common stock of SFSI, par value $0.001 per share ("Common Stock").
In 2013, SFSI made grants of stock options to purchase up to a total of 28,598 shares of Common Stock to certain management employees and directors. During the twenty-four weeks ended June 15, 2014, SFSI made grants of stock options to purchase up to a total of 4,747 shares of Common Stock to certain management employees. Collectively, these stock options to purchase up to 33,345 shares of Common Stock are referred to herein as the "Time-Based Options."
Of the Time-Based Options granted during the twenty-four weeks ended June 15, 2014, stock options to purchase up to 2,124 shares of Common Stock were granted with time-based vesting terms and vest over five years subject to continuous service by the participant. The remaining Time-Based Options granted during the twenty-four weeks ended June 15, 2014 (to purchase up to 2,623 shares of Common Stock) were granted to one management employee and vest on the earliest of (a) May 30, 2017, (b) a change in control of the Company, as defined, and (c) the earliest date on or after May 30, 2016 on which both (i) an initial public offering of SFSI has occurred and (ii) Ares no longer beneficially owns securities representing 50% or more of the total voting power of the securities of SFSI entitled to vote in the election of the Board of Directors of SFSI, in each case, subject to continuous service by the participant through the applicable vesting date. All of the Time Based Options granted during the twenty-four weeks ended June 15, 2014 have a 10-year term.
F-89
Smart & Final Stores, Inc. and Subsidiaries
Notes to Unaudited Condensed Consolidated Financial Statements (Continued)
June 15, 2014
10. Share-Based Compensation (Continued)
The following table summarizes the Time-Based Option activity under the 2012 Incentive Plan for the twenty-four weeks ended June 15, 2014:
| |
Shares | Weighted- Average Exercise Price |
Weighted- Average Remaining Contractual Term |
|||||||
|---|---|---|---|---|---|---|---|---|---|---|
Outstanding at December 29, 2013 |
28,598 | 1,250.00 | 9.11 years | |||||||
Granted |
4,747 | 1,685.93 | ||||||||
Forfeited |
— | — | ||||||||
Exercised |
— | — | ||||||||
Expired |
— | — | ||||||||
| | | | | | | | | | | |
Outstanding at June 15, 2014 |
33,345 | $ | 1,312.06 | 8.84 years | ||||||
| | | | | | | | | | | |
| | | | | | | | | | | |
Exercisable at June 15, 2014 |
5,720 | $ | 1,250.00 | 8.65 years | ||||||
| | | | | | | | | | | |
| | | | | | | | | | | |
Under the 2012 Incentive Plan and the Company's standard form of stock option award agreement, the Company has a right to repurchase from the participant all or a portion of the shares of Common Stock issued upon the exercise of a stock option. For Common Stock issued upon exercise of such stock options granted pursuant to the standard form of stock option award agreement, if a participant's employment is terminated for cause or due to a voluntary termination for any reason, or upon the discovery that the participant engaged in detrimental activity, the repurchase price of such shares of Common Stock is the lesser of the exercise price paid by the participant to exercise the stock option and the fair market value of the Common Stock as of the date of termination or the date on which such detrimental activity occurred, as applicable. If the Company elects to exercise its repurchase rights, it must do so within the one-year period commencing on the later of (i) the date of termination and (ii) the date on which the applicable stock option was exercised. As of June 15, 2014, Time-Based Options to purchase up to 18,878 shares of Common Stock (out of the total Time-Based Options to purchase up to 33,345 shares of Common Stock) were subject to such repurchase rights. If the Company exercises such repurchase right at the lesser of the exercise price paid by the participant to exercise the stock option and the fair market value of the Common Stock as of the date of termination, the participant will receive no monetary benefit from such exercise of his or her stock option. Accordingly, as it is currently not assured nor probable that participants will realize any monetary benefit from the exercise of such stock options, the Company (i) has not recorded any share-based compensation expense for these stock options and (ii) is unable to determine the time period over which share-based compensation expense will be recognized. As of June 15, 2014, the Company had $9.9 million of total unrecognized share-based compensation expense for these Time-Based Options.
The grants of Time-Based Options made during the twenty-four weeks ended June 15, 2014 to purchase up to 2,623 shares of Common Stock were made to one management employee on May 30, 2014 and June 6, 2014. The Company has a right to repurchase from such participant all or a portion of the Common Stock issued upon the exercise of such stock options in the manner described above; provided that if the participant's termination of employment is voluntary for any reason and the participant has not engaged in detrimental activity, the repurchase price is the fair market value of the Common Stock on the date of termination. The Company recognized share-based compensation
F-90
Smart & Final Stores, Inc. and Subsidiaries
Notes to Unaudited Condensed Consolidated Financial Statements (Continued)
June 15, 2014
10. Share-Based Compensation (Continued)
expense of $26,000 for the twelve and twenty-four weeks ended June 15, 2014 related to these grants. As of June 15, 2014, the unrecognized share-based compensation expense related to these grants was $1.8 million.
On May 30, 2014, the Company modified its repurchase rights related to grants of Time-Based Options to two management employee participants to purchase up to 11,844 shares of Common Stock originally awarded on February 1, 2013. Pursuant to the terms of the modified award agreements, the Company has a right to repurchase from such participant all or a portion of the Common Stock issued upon the exercise of such stock options in the manner described above; provided that if the participant's termination of employment is voluntary for any reason and the participant has not engaged in detrimental activity, the repurchase price is the fair market value of the Common Stock on the date of termination. The Company recognized share-based compensation expense of $1.7 million for the twelve and twenty-four weeks ended June 15, 2014 related to these grants. As of June 15, 2014, the unrecognized share-based compensation expense related to these modified grants was $6.4 million.
In connection with the Ares Acquisition on November 15, 2012, certain stock options to purchase shares of common stock of the Predecessor were converted into 19,082 stock options to purchase Common Stock (the "Rollover Options"). For Common Stock issued upon exercise of a Rollover Option, the repurchase price is the fair market value of the Common Stock on the date of termination. In the event of a participant's termination of employment for cause or upon discovery that the participant engaged in detrimental activity, if the Company elects to exercise its repurchase right, it must do so within a 180-day period commencing on the later of (i) the date of termination and (ii) the date on which such Rollover Option was exercised. In the event of a participant's termination of employment for any other reason, the repurchase right must be exercised by the Company during the 90-day period following the date of termination. On May 30, 2014, one management employee participant net settled a Rollover Option to purchase 4,867 shares of Common Stock to satisfy a portion of the required exercise price of the issued shares and to cover the minimum amount of required employee withholding taxes, resulting in the issuance of 2,244 shares of Common Stock.
11. Accumulated Other Comprehensive Income
The following table represents the changes in AOCI by each component net of tax for the twenty-four weeks ended June 15, 2014:
| (in thousands) |
Cash Flow Hedging Activity |
Defined Benefit Retirement Plan |
Foreign Currency Translation |
Total | |||||||||
|---|---|---|---|---|---|---|---|---|---|---|---|---|---|
Balance at December 29, 2013 |
$ | 2,880 | $ | 28,524 | $ | (420 | ) | $ | 30,984 | ||||
OCI before reclassification |
(1,956 | ) | — | 15 | (1,941 | ) | |||||||
Amounts reclassified out of AOCI |
18 | — | — | 18 | |||||||||
| | | | | | | | | | | | | | |
Net current period OCI |
(1,938 | ) | — | 15 | (1,923 | ) | |||||||
| | | | | | | | | | | | | | |
Balance at June 15, 2014 |
$ | 942 | $ | 28,524 | $ | (405 | ) | $ | 29,061 | ||||
| | | | | | | | | | | | | | |
| | | | | | | | | | | | | | |
F-91
Smart & Final Stores, Inc. and Subsidiaries
Notes to Unaudited Condensed Consolidated Financial Statements (Continued)
June 15, 2014
11. Accumulated Other Comprehensive Income (Continued)
The following table represents the items reclassified out of each component of AOCI and the related tax effects for the twenty-four weeks ended June 15, 2014 (in thousands).
Details about AOCI Components
|
Amount Reclassified from AOCI |
Location within Statement of Operations and Comprehensive Income |
|||
|---|---|---|---|---|---|
Gain on cash flow hedges |
|||||
Interest rate swaps |
$ | 30 | Interest expense, net | ||
| | | | | | |
|
30 | Total before income tax | |||
|
(12 | ) | Income tax provision | ||
| | | | | | |
|
$ | 18 | Reclassification of adjustments, net of tax | ||
| | | | | | |
| | | | | | |
Total reclassifications |
$ | 18 | Total reclassifications, net of tax | ||
| | | | | | |
| | | | | | |
12. Segment Information
The Company is a value-oriented retailer serving a diverse demographic of household and business customers through two complementary store banners. The "Smart & Final" business focuses on both household and business customers, and the "Cash & Carry" business focuses primarily on restaurants, caterers and a wide range of other foodservice businesses. The Company's chief operating decision maker ("CODM") regularly reviews the operating performance of each of the store banners including measures of performance based on income (loss) from operations. We consider each of the store banners to be an operating segment and have further concluded that presenting disaggregated information of these two operating segments provides meaningful information as certain economic characteristics are dissimilar as well as the characteristics of the customer base served.
The "Corporate/Other" category is comprised primarily of corporate overhead support expenses and administrative expenses incidental to the activities of the reportable segments, interest expense and other costs associated with the Company's debt obligations, equity earnings in its joint venture, and income taxes.
F-92
Smart & Final Stores, Inc. and Subsidiaries
Notes to Unaudited Condensed Consolidated Financial Statements (Continued)
June 15, 2014
12. Segment Information (Continued)
For the twelve weeks ended June 15, 2014, the operating information for the reportable segments is shown as follows (in thousands):
| |
Smart & Final | Cash & Carry | Corporate / Other |
Consolidated | |||||||||
|---|---|---|---|---|---|---|---|---|---|---|---|---|---|
Net sales |
$ | 623,107 | $ | 204,964 | $ | — | $ | 828,071 | |||||
Cost of sales, distribution and store occupancy |
520,907 | 177,058 | 1,921 | 699,886 | |||||||||
Operating and administrative expenses |
73,373 | 13,528 | 14,590 | 101,491 | |||||||||
| | | | | | | | | | | | | | |
Income (loss) from operations |
$ | 28,827 | $ | 14,378 | $ | (16,511 | ) | $ | 26,694 | ||||
| | | | | | | | | | | | | | |
| | | | | | | | | | | | | | |
As of June 15, 2014: |
|||||||||||||
Total assets |
$ | 1,645,766 | $ | 241,567 | $ | (259,902 | ) | $ | 1,627,431 | ||||
| | | | | | | | | | | | | | |
| | | | | | | | | | | | | | |
Intercompany receivable (payable) |
$ | 415,378 | $ | (89,219 | ) | $ | (326,159 | ) | $ | — | |||
| | | | | | | | | | | | | | |
| | | | | | | | | | | | | | |
Investment in joint venture |
$ | — | $ | — | $ | 11,682 | $ | 11,682 | |||||
| | | | | | | | | | | | | | |
| | | | | | | | | | | | | | |
Goodwill |
$ | 406,662 | $ | 204,580 | $ | — | $ | 611,242 | |||||
| | | | | | | | | | | | | | |
| | | | | | | | | | | | | | |
For the twelve weeks ended June 15, 2014: |
|||||||||||||
Capital expenditures |
$ | 32,865 | $ | 253 | $ | 1,084 | $ | 34,202 | |||||
| | | | | | | | | | | | | | |
| | | | | | | | | | | | | | |
For the twelve weeks ended June 16, 2013, the operating information for the reportable segments is shown as follows:
| |
Smart & Final | Cash & Carry | Corporate / Other |
Consolidated | |||||||||
|---|---|---|---|---|---|---|---|---|---|---|---|---|---|
Net sales |
$ | 570,462 | $ | 185,481 | $ | — | $ | 755,943 | |||||
Cost of sales, distribution and store occupancy |
479,410 | 161,403 | 1,715 | 642,528 | |||||||||
Operating and administrative expenses |
64,683 | 12,313 | 11,467 | 88,463 | |||||||||
| | | | | | | | | | | | | | |
Income (loss) from operations |
$ | 26,369 | $ | 11,765 | $ | (13,182 | ) | $ | 24,952 | ||||
| | | | | | | | | | | | | | |
| | | | | | | | | | | | | | |
For the twelve weeks ended June 16, 2013: |
|||||||||||||
Capital expenditures |
$ | 13,240 | $ | 238 | $ | 1,290 | $ | 14,768 | |||||
| | | | | | | | | | | | | | |
| | | | | | | | | | | | | | |
For the twenty-four weeks ended June 15, 2014, the operating information for the reportable segments is shown as follows:
| |
Smart & Final | Cash & Carry | Corporate / Other |
Consolidated | |||||||||
|---|---|---|---|---|---|---|---|---|---|---|---|---|---|
Net sales |
$ | 1,185,048 | $ | 378,039 | $ | — | $ | 1,563,087 | |||||
Cost of sales, distribution and store occupancy |
999,266 | 327,331 | 3,716 | 1,330,313 | |||||||||
Operating and administrative expenses |
140,960 | 25,829 | 27,060 | 193,849 | |||||||||
| | | | | | | | | | | | | | |
Income (loss) from operations |
$ | 44,822 | $ | 24,879 | $ | (30,776 | ) | $ | 38,925 | ||||
| | | | | | | | | | | | | | |
| | | | | | | | | | | | | | |
For the twenty-four weeks ended June 15, 2014: |
|||||||||||||
Capital expenditures |
$ | 45,060 | $ | 381 | $ | 3,005 | $ | 48,446 | |||||
| | | | | | | | | | | | | | |
| | | | | | | | | | | | | | |
F-93
Smart & Final Stores, Inc. and Subsidiaries
Notes to Unaudited Condensed Consolidated Financial Statements (Continued)
June 15, 2014
12. Segment Information (Continued)
For the twenty-four weeks ended June 16, 2013, the operating information for the reportable segments is shown as follows:
| |
Smart & Final | Cash & Carry | Corporate / Other |
Consolidated | |||||||||
|---|---|---|---|---|---|---|---|---|---|---|---|---|---|
Net sales |
$ | 1,097,497 | $ | 348,604 | $ | — | $ | 1,446,101 | |||||
Cost of sales, distribution and store occupancy |
926,318 | 303,001 | 3,459 | 1,232,778 | |||||||||
Operating and administrative expenses |
127,618 | 24,197 | 22,224 | 174,039 | |||||||||
| | | | | | | | | | | | | | |
Income (loss) from operations |
$ | 43,561 | $ | 21,406 | $ | (25,683 | ) | $ | 39,284 | ||||
| | | | | | | | | | | | | | |
| | | | | | | | | | | | | | |
For the twenty-four weeks ended June 16, 2013: |
|||||||||||||
Capital expenditures |
$ | 19,693 | $ | 374 | $ | 1,933 | $ | 22,000 | |||||
| | | | | | | | | | | | | | |
| | | | | | | | | | | | | | |
13. Commitments and Contingencies
Legal Actions
On December 11, 2012, a purported class action was filed in Los Angeles Superior Court entitled Matthew Thompson vs. Smart & Final Inc. by a former hourly store employee on behalf of a purported class of all California hourly store employees alleging various violations of California wage and hour laws including, among others, failure to pay for all hours worked, meal and rest break violations, failure to pay wages properly at termination and non-compliant wage statements. The plaintiff has also asserted claims under California's Private Attorney General Act. The Company has denied liability for all of these allegations.
On June 19, 2013, a purported class action was filed in Los Angeles Superior Court entitled Raquel Manzo vs. Smart & Final by a former hourly store employee on behalf of a purported class of all California hourly store employees alleging various violations of California wage and hour laws including, among others, improper calculation of certain overtime rates. The Company has denied liability for all of these allegations.
The Thompson and Manzo cases were ordered to be combined for mediation. Following a mediation held in November 2013, the various parties to these actions accepted a mediator's proposal to settle these matters. The proposed settlements require court approval, which approval was preliminarily granted on April 22, 2014. Final court approval is scheduled for September 15, 2014. SFSI recorded a loss accrual estimate of $3.0 million in its consolidated financial statements for the fiscal year ended December 29, 2013 related to these matters.
The Company is engaged in various legal actions, claims and proceedings in the ordinary course of business, including claims related to employment related matters, breach of contracts, products liabilities and intellectual property matters resulting from its business activities. We do not believe that the ultimate determination of these actions, claims and proceedings will either individually or in the aggregate have a material adverse effect on our consolidated results of operations or financial position.
F-94
Smart & Final Stores, Inc. and Subsidiaries
Notes to Unaudited Condensed Consolidated Financial Statements (Continued)
June 15, 2014
14. Earnings Per Share
Basic earnings per share represents net income for the period shares of Common Stock were outstanding, divided by the weighted average number of shares of Common Stock outstanding for the applicable period. Diluted earnings per share represents net income divided by the weighted average number of shares of Common Stock outstanding for the applicable period, inclusive of the effect of dilutive securities such as outstanding stock options.
A reconciliation of the components of basic and diluted earnings per share calculations is as follows (in thousands, except per share amounts):
| |
Twelve Weeks Ended | Twenty-Four Weeks Ended |
|||||||||||
|---|---|---|---|---|---|---|---|---|---|---|---|---|---|
| |
June 15, 2014 |
June 16, 2013 |
June 15, 2014 |
June 16, 2013 |
|||||||||
Net income |
$ | 11,115 | $ | 3,598 | $ | 13,622 | $ | 5,127 | |||||
| | | | | | | | | | | | | | |
| | | | | | | | | | | | | | |
Weighted average shares outstanding for basic EPS |
301,365 | 299,407 | 301,133 | 299,304 | |||||||||
Effect of dilutive securities: |
|||||||||||||
Assumed exercise of time-based stock options |
10,807 | 12,109 | 10,988 | 11,794 | |||||||||
| | | | | | | | | | | | | | |
Weighted average shares and share equivalents outstanding for diluted EPS |
312,172 | 311,516 | 312,121 | 311,098 | |||||||||
| | | | | | | | | | | | | | |
| | | | | | | | | | | | | | |
Basic earnings per share |
$ | 36.88 | $ | 12.02 | $ | 45.24 | $ | 17.13 | |||||
Diluted earnings per share |
$ | 35.61 | $ | 11.55 | $ | 43.64 | $ | 16.48 | |||||
Potentially dilutive securities representing 2,419 and 0 shares of Common Stock for the twelve weeks ended June 15, 2014 and June 16, 2013, respectively, were excluded from the computation of diluted earnings per share for these periods because their effect would have been antidilutive. Potentially dilutive securities representing 1,209 and 0 shares of Common Stock for the twenty-four weeks ended June 15, 2014 and June 16, 2013, respectively, were excluded from the computation of diluted earnings per share for these periods because their effect would have been antidilutive. The potentially dilutive securities representing 2,419 and 1,209 shares of Common Stock for the twelve weeks and twenty-four weeks ended June 15, 2014, respectively, do not include the 18,878 shares of Common Stock underlying options that are subject to performance conditions for which the Company has not recorded any share-based compensation expense. See Note 10, Share-Based Compensation.
15. Subsequent Events
The Company has performed an evaluation of subsequent events through August 27, 2014, which is the date the unaudited condensed consolidated financial statements of SFSI were available to be issued. No subsequent events were identified impacting the unaudited condensed consolidated financial statements as presented.
F-95

PART II
INFORMATION NOT REQUIRED IN PROSPECTUS
Item 13. Other Expenses of Issuance and Distribution
The following table sets forth the costs and expenses, other than underwriting discounts and commissions, payable by us in connection with the sale and distribution of the common stock being registered. All amounts are estimates except for the SEC registration fee, the FINRA filing fee and the NYSE listing fee.
SEC registration fee |
$ | 12,880 | ||
FINRA filing fee |
15,500 | |||
NYSE listing fee |
* | |||
Legal fees and expenses |
* | |||
Accounting fees and expenses |
* | |||
Printing and engraving expenses |
* | |||
Transfer agent and registrar fees and expenses |
* | |||
Blue sky fees and expenses |
* | |||
Miscellaneous fees and expenses |
* | |||
| | | | | |
Total |
$ | * | ||
| | | | | |
- *
- To be filed by amendment.
Item 14. Indemnification of Directors and Officers
Section 145 of the DGCL authorizes a court to award, or a corporation's board of directors to grant, indemnity to directors and officers in terms sufficiently broad to permit such indemnification under certain circumstances for liabilities, including reimbursement for expenses incurred, arising under the Securities Act.
Our certificate of incorporation provides for indemnification of our directors and officers to the maximum extent permitted by the DGCL, and our bylaws that will be in effect at the closing of this offering provide for indemnification of our directors and officers to the maximum extent permitted by the DGCL.
In addition, we expect to enter into indemnification agreements with our directors and officers containing provisions that we expect will be in some respects broader than the specific indemnification provisions contained in the DGCL. We expect that the indemnification agreements will require us, among other things, to indemnify our directors against certain liabilities that may arise by reason of their status or service as directors and to advance their expenses incurred as a result of any proceeding against them as to which they could be indemnified.
We maintain insurance policies that indemnify our directors and officers against various liabilities arising under the Securities Act and the Exchange Act that might be incurred by any director or officer in his capacity as such.
The underwriters are obligated, under certain circumstances, pursuant to the underwriting agreement filed as Exhibit 1.1 hereto, to indemnify us and our officers and directors against liabilities under the Securities Act.
Item 15. Recent Sales of Unregistered Securities
The following sets forth information regarding all unregistered securities sold since the formation of the registrant on October 5, 2012 and does not give effect to the conversion of each share of Smart & Final Stores, Inc. into shares of common stock of Smart & Final Stores, Inc. upon the
II-1
effectiveness of the -for-one stock split of our common stock to be effected prior to the closing of this offering:
On June 6, 2014, Eleanor E. Hong purchased 50 shares of common stock for an aggregate purchase price of $79,000.
On May 30, 2014, Richard N. Phegley exercised an option to purchase 2,243 shares of common stock for (i) an aggregate cash payment of $450,226.68 and the withholding of 935 shares of common stock to cover the exercise price of $396.04 per share and (ii) the withholding of 1,689 shares of common stock to cover withholding taxes.
On May 31, 2013, Norman H. Axelrod purchased 500 shares of common stock for an aggregate purchase price of $500,000.
On May 31, 2013, Andrew A. Giancamilli purchased 200 shares of common stock for an aggregate purchase price of $200,000.
On May 31, 2013, Robert A. Eckert and Kathleen M. Eckert, as trustees of The Eckert Family Trust, purchased 1,000 shares of common stock for an aggregate purchase price of $1,000,000.
On November 15, 2012, certain employees of the registrant and its subsidiaries purchased an aggregate of 9,201 shares of common stock for an aggregate purchase price of $9,201,000.
On November 15, 2012, Ares Corporate Opportunities Fund III, L.P. purchased 145,000 shares of common stock for an aggregate purchase price of $145,000,000.
On November 15, 2012, Ares Corporate Opportunities Fund IV, L.P. purchased 145,000 shares of common stock for an aggregate purchase price of $145,000,000.
Unless otherwise stated and except for the -for-one stock split of our common stock to be effected prior to the closing of this offering, the sales of the above securities were deemed to be exempt from registration under the Securities Act in reliance upon Section 4(2) of the Securities Act (or Regulation D promulgated thereunder) or Rule 701 promulgated under Section 3(b) of the Securities Act as transactions by an issuer not involving any public offering or pursuant to benefit plans and contracts relating to compensation as provided under Rule 701. We did not pay or give, directly or indirectly, any commission or other remuneration, including underwriting discounts or commissions, in connection with any of the issuances of securities listed above. The recipients of the securities in each of these transactions represented their intentions to acquire the securities for investment only and not with a view to or for sale in connection with any distribution thereof, and appropriate legends were placed upon the stock certificates issued in these transactions. All recipients had adequate access, through their employment or other relationship with us or through other access to information provided by us, to information about us. The sales of these securities were made without any general solicitation or advertising.
Item 16. Exhibits and Financial Statement Schedules
- (a)
- Exhibits
| Exhibit No. |
Description of Exhibit | ||
|---|---|---|---|
1.1 |
Form of Underwriting Agreement.* | ||
3.1 |
Form of Second Amended and Restated Certificate of Incorporation of Smart & Final Stores, Inc.† |
||
3.2 |
Form of Second Amended and Restated Bylaws of Smart & Final Stores, Inc.† |
||
5.1 |
Form of Opinion of Proskauer Rose LLP.† |
||
10.1 |
SF CC Holdings, Inc. 2012 Stock Incentive Plan.** |
||
II-2
| Exhibit No. |
Description of Exhibit | ||
|---|---|---|---|
10.2 |
Form of Non-Qualified Stock Option Agreement pursuant to the SF CC Holdings, Inc. 2012 Stock Incentive Plan.** |
||
10.3.1 |
Non-Qualified Stock Option Agreement Pursuant to the SF CC Holdings, Inc. 2012 Stock Incentive Plan, Co-Invest Option (Award No. 12-001), dated as of February 3, 2014, by and between Smart & Final Holdings, Inc. and David G. Hirz.** |
||
10.3.2 |
Non-Qualified Stock Option Agreement Pursuant to the SF CC Holdings, Inc. 2012 Stock Incentive Plan, Co-Invest Option (Award No. 12-002), dated as of February 3, 2014, by and between Smart & Final Holdings, Inc. and David G. Hirz.** |
||
10.3.3 |
Non-Qualified Stock Option Agreement Pursuant to the SF CC Holdings, Inc. 2012 Stock Incentive Plan, Co-Invest Option (Award No. 12-003), dated as of February 3, 2014, by and between Smart & Final Holdings, Inc. and Richard N. Phegley.** |
||
10.3.4 |
Non-Qualified Stock Option Agreement Pursuant to the SF CC Holdings, Inc. 2012 Stock Incentive Plan, Co-Invest Option (Award No. 12-004), dated as of February 3, 2014, by and between Smart & Final Holdings, Inc. and Scott R. Drew.** |
||
10.3.5 |
Non-Qualified Stock Option Agreement Pursuant to the SF CC Holdings, Inc. 2012 Stock Incentive Plan, Co-Invest Option (Award No. 12-005), dated as of February 3, 2014, by and between Smart & Final Holdings, Inc. and Scott R. Drew.** |
||
10.3.6 |
Non-Qualified Stock Option Agreement Pursuant to the SF CC Holdings, Inc. 2012 Stock Incentive Plan, Co-Invest Option (Award No. 12-006), dated as of February 3, 2014, by and between Smart & Final Holdings, Inc. and Scott R. Drew.** |
||
10.4 |
Form of Employment Agreement by and among Smart & Final Stores, Inc. and David G. Hirz.* |
||
10.5 |
Form of Indemnification Agreement.** |
||
10.6.1 |
Revolving Credit Agreement, dated as of November 15, 2012, among SF CC Intermediate Holdings, Inc., Smart & Final Inc., Smart & Final Stores LLC, the Co-Borrowers party thereto on the Closing Date and each Subsidiary of the Borrower that becomes a party thereto as a Co-Borrower pursuant to Section 5.13 thereof, the Lenders party thereto from time to time and Bank of America, N.A., as administrative agent, collateral agent, Swingline Lender, and as issuing bank.** |
||
10.6.2 |
Amendment No.1 to Credit Agreement, dated as of December 19, 2013 by and among SF CC Intermediate Holdings, Inc., Smart & Final LLC, Smart & Final Stores LLC, the Co-Borrowers, the subsidiaries of the Borrower listed on the signature pages thereto as Guarantors, Bank of America, N.A., as administrative agent for the lenders, collateral agent, Swingline Lender, and as issuing bank and the Consenting Lenders.** |
||
10.7.1 |
First Lien Term Loan Credit Agreement, dated as of November 15, 2012, among SF CC Intermediate Holdings, Inc., Smart & Final, Inc., the Lenders party thereto from time to time and Morgan Stanley Senior Funding, Inc., as administrative agent and as collateral agent.** |
||
10.7.2 |
Amendment No. 1 to Credit Agreement, dated as of May 29, 2013, by and among SF CC Intermediate Holdings, Inc., Smart & Final Stores LLC, the other Loan Parties listed on the signature pages thereto, Morgan Stanley Senior Funding, Inc., as administrative agent and collateral agent for the lenders under the Credit Agreement, joint lead arranger and joint book-runner, Deutsche Bank Securities Inc., as co-documentation agent, syndication agent, joint lead arranger and joint book-runner, Merrill Lynch, Pierce, Fenner & Smith Incorporated, as joint lead arranger and joint book-runner, Credit Suisse Securities (USA) LLC, as joint lead arranger and joint book-runner, Credit Suisse AG, as co-documentation agent and each of the undersigned banks and other financial institutions party thereto as lenders and the other Required Lenders party thereto.** |
||
|
|||
II-3
| Exhibit No. |
Description of Exhibit | ||
|---|---|---|---|
10.7.3 |
Amendment No. 2 to Credit Agreement and Incremental Facility Amendment, dated as of December 19, 2013, by and among SF CC Intermediate Holdings, Inc., Smart & Final Stores LLC, the subsidiaries of the Borrower listed on the signature pages thereto, Morgan Stanley Senior Funding, Inc., as administrative agent for the lenders under the Credit Agreement, as collateral agent for the lenders under the Credit Agreement and as joint lead arranger and joint book-runner, Deutsche Bank Securities Inc., as co-documentation agent, syndication agent, joint lead arranger and joint book-runner, Merrill Lynch, Pierce, Fenner & Smith Incorporated, as joint lead arranger and joint book-runner, Credit Suisse Securities (USA) LLC, as joint lead arranger and joint book-runner, Credit Suisse AG, as co-documentation agent, the Consenting Lenders, and the banks and other financial institutions that are parties thereto as Additional Lenders.** |
||
10.8 |
Guarantee and Collateral Agreement, dated as of November 15, 2012, among SF CC Intermediate Holdings, Inc., Smart & Final Stores LLC, each other Subsidiary of Parent identified therein and Morgan Stanley Senior Funding, Inc., as administrative agent and as collateral agent for the Secured Parties.** |
||
10.9 |
ABL Guarantee and Collateral Agreement, dated as of November 15, 2012, among SF CC Intermediate Holdings, Inc., Smart & Final Stores LLC, each other Subsidiary of Parent identified therein and Bank of America, N.A., as administrative agent and as collateral agent for the Secured Parties.** |
||
10.10.1 |
Joint Venture Agreement, dated as of December 15, 1992, by and between Treviño Hernandez, S. de R.L. de C.V. and Smart & Final, Inc.** |
||
10.10.2 |
Product Sales Agreement, dated as of June 12, 2012, by and between Smart & Final Stores LLC and Smart & Final del Noroeste, S.A. de C.V.** |
||
10.10.3 |
Trademark Authorized User Agreement, dated as of June 12, 2012, by and between Smart & Final, Inc. and Smart & Final del Noroeste, S.A. de C.V.** |
||
10.11 |
Form of Smart & Final Stores, Inc. 2014 Stock Incentive Plan.† |
||
10.12 |
Form of Non-Qualified Stock Option Agreement pursuant to the Smart & Final Stores, Inc. 2014 Stock Incentive Plan.† |
||
10.13 |
Form of Registration Rights Agreement.† |
||
10.14 |
Specimen Common Stock Certificate.* |
||
10.15 |
Form of Restricted Stock Agreement pursuant to the Smart & Final Stores, Inc. 2014 Stock Incentive Plan.† |
||
21.1 |
List of subsidiaries.** |
||
23.1 |
Consent of Proskauer Rose LLP (included in Exhibit 5.1).† |
||
23.2 |
Consent of Ernst & Young LLP, independent registered public accounting firm.† |
||
24.1 |
Power of Attorney.** |
||
- †
- Filed
herewith.
- *
- To
be filed by amendment.
- **
- Previously filed.
II-4
The undersigned Registrant hereby undertakes to provide to the underwriters at the closing specified in the underwriting agreement, certificates in such denominations and registered in such names as required by the underwriters to permit prompt delivery to each purchaser.
Insofar as indemnification for liabilities arising under the Securities Act may be permitted to directors, officers and controlling persons of the Registrant pursuant to the foregoing provisions, or otherwise, the Registrant has been advised that in the opinion of the Securities and Exchange Commission such indemnification is against public policy as expressed in the Securities Act and is, therefore, unenforceable. In the event that a claim for indemnification against such liabilities (other than the payment by the Registrant of expenses incurred or paid by a director, officer or controlling person of the Registrant in the successful defense of any action, suit or proceeding) is asserted by such director, officer or controlling person in connection with the securities being registered, the Registrant will, unless in the opinion of its counsel the matter has been settled by controlling precedent, submit to a court of appropriate jurisdiction the question whether such indemnification by it is against public policy as expressed in the Securities Act and will be governed by the final adjudication of such issue.
The undersigned Registrant hereby undertakes that:
(1) For purposes of determining any liability under the Securities Act of 1933, the information omitted from the form of prospectus filed as part of this registration statement in reliance upon Rule 430A and contained in a form of prospectus filed by the Registrant pursuant to Rule 424(b)(1) or (4) or 497(h) under the Securities Act shall be deemed to be part of this registration statement as of the time it was declared effective.
(2) For the purpose of determining any liability under the Securities Act of 1933, each post-effective amendment that contains a form of prospectus shall be deemed to be a new registration statement relating to the securities offered therein, and the offering of such securities at that time shall be deemed to be the initial bona fide offering thereof.
(3) For the purpose of determining liability of the registrant under the Securities Act of 1933 to any purchaser in the initial distribution of the securities, the undersigned registrant undertakes that in a primary offering of securities of the undersigned registrant pursuant to this registration statement, regardless of the underwriting method used to sell the securities to the purchaser, if the securities are offered or sold to such purchaser by means of any of the following communications, the undersigned registrant will be a seller to the purchaser and will be considered to offer or sell such securities to such purchaser:
(i) any preliminary prospectus or prospectus of the undersigned registrant relating to the offering required to be filed pursuant to Rule 424;
(ii) any free writing prospectus relating to the offering prepared by or on behalf of the undersigned registrant or used or referred to by the undersigned registrant;
(iii) the portion of any other free writing prospectus relating to the offering containing material information about the undersigned registrant or its securities provided by or on behalf of the undersigned registrant; and
(iv) any other communication that is an offer in the offering made by the undersigned registrant to the purchaser.
II-5
Pursuant to the requirements of the Securities Act of 1933, the registrant has duly caused this registration statement to be signed on its behalf by the undersigned, thereunto duly authorized, in the city of Commerce, State of California, on September 8, 2014.
| SMART & FINAL STORES, INC. | ||||
By: |
/s/ DAVID G. HIRZ David G. Hirz President and Chief Executive Officer |
|||
Pursuant to the requirements of the Securities Act of 1933, this registration statement has been signed by the following persons in the capacities and on the dates indicated.
Signature
|
Title
|
Date
|
||
|---|---|---|---|---|
| /s/ DAVID G. HIRZ David G. Hirz |
President, Chief Executive Officer and Director (Principal Executive Officer) |
September 8, 2014 | ||
/s/ RICHARD N. PHEGLEY Richard N. Phegley |
Senior Vice President and Chief Financial Officer (Principal Financial Officer) |
September 8, 2014 |
||
/s/ RICHARD A. LINK Richard A. Link |
Group Vice President and Controller (Principal Accounting Officer) |
September 8, 2014 |
||
* David B. Kaplan |
Chairman of the Board |
September 8, 2014 |
||
* Richard A. Anicetti |
Director |
September 8, 2014 |
||
* Norman Axelrod |
Director |
September 8, 2014 |
||
* Dennis Gies |
Director |
September 8, 2014 |
||
* Andrew A. Giancamilli |
Director |
September 8, 2014 |
Signature
|
Title
|
Date
|
||
|---|---|---|---|---|
| * Adam Stein |
Director | September 8, 2014 | ||
* Joseph S. Tesoriero |
Director |
September 8, 2014 |
| *By: | /s/ DAVID G. HIRZ David G. Hirz Attorney-in-Fact |
| Exhibit No. |
Description of Exhibit | ||
|---|---|---|---|
| 1.1 | Form of Underwriting Agreement.* | ||
3.1 |
Form of Second Amended and Restated Certificate of Incorporation of Smart & Final Stores, Inc.† |
||
3.2 |
Form of Second Amended and Restated Bylaws of Smart & Final Stores, Inc.† |
||
5.1 |
Form of Opinion of Proskauer Rose LLP.† |
||
10.1 |
SF CC Holdings, Inc. 2012 Stock Incentive Plan.** |
||
10.2 |
Form of Non-Qualified Stock Option Agreement pursuant to the SF CC Holdings, Inc. 2012 Stock Incentive Plan.** |
||
10.3.1 |
Non-Qualified Stock Option Agreement Pursuant to the SF CC Holdings, Inc. 2012 Stock Incentive Plan, Co-Invest Option (Award No. 12-001), dated as of February 3, 2014, by and between Smart & Final Holdings, Inc. and David G. Hirz.** |
||
10.3.2 |
Non-Qualified Stock Option Agreement Pursuant to the SF CC Holdings, Inc. 2012 Stock Incentive Plan, Co-Invest Option (Award No. 12-002), dated as of February 3, 2014, by and between Smart & Final Holdings, Inc. and David G. Hirz.** |
||
10.3.3 |
Non-Qualified Stock Option Agreement Pursuant to the SF CC Holdings, Inc. 2012 Stock Incentive Plan, Co-Invest Option (Award No. 12-003), dated as of February 3, 2014, by and between Smart & Final Holdings, Inc. and Richard N. Phegley.** |
||
10.3.4 |
Non-Qualified Stock Option Agreement Pursuant to the SF CC Holdings, Inc. 2012 Stock Incentive Plan, Co-Invest Option (Award No. 12-004), dated as of February 3, 2014, by and between Smart & Final Holdings, Inc. and Scott R. Drew.** |
||
10.3.5 |
Non-Qualified Stock Option Agreement Pursuant to the SF CC Holdings, Inc. 2012 Stock Incentive Plan, Co-Invest Option (Award No. 12-005), dated as of February 3, 2014, by and between Smart & Final Holdings, Inc. and Scott R. Drew.** |
||
10.3.6 |
Non-Qualified Stock Option Agreement Pursuant to the SF CC Holdings, Inc. 2012 Stock Incentive Plan, Co-Invest Option (Award No. 12-006), dated as of February 3, 2014, by and between Smart & Final Holdings, Inc. and Scott R. Drew.** |
||
10.4 |
Form of Employment Agreement by and among Smart & Final Stores, Inc. and David G. Hirz.* |
||
10.5 |
Form of Indemnification Agreement.** |
||
10.6.1 |
Revolving Credit Agreement, dated as of November 15, 2012, among SF CC Intermediate Holdings, Inc., Smart & Final Inc., Smart & Final Stores LLC, the Co-Borrowers party thereto on the Closing Date and each Subsidiary of the Borrower that becomes a party thereto as a Co-Borrower pursuant to Section 5.13 thereof, the Lenders party thereto from time to time and Bank of America, N.A., as administrative agent, collateral agent, Swingline Lender, and as issuing bank.** |
||
10.6.2 |
Amendment No.1 to Credit Agreement, dated as of December 19, 2013 by and among SF CC Intermediate Holdings, Inc., Smart & Final LLC, Smart & Final Stores LLC, the Co-Borrowers, the subsidiaries of the Borrower listed on the signature pages thereto as Guarantors, Bank of America, N.A., as administrative agent for the lenders, collateral agent, Swingline Lender, and as issuing bank and the Consenting Lenders.** |
||
| Exhibit No. |
Description of Exhibit | ||
|---|---|---|---|
| 10.7.1 | First Lien Term Loan Credit Agreement, dated as of November 15, 2012, among SF CC Intermediate Holdings, Inc., Smart & Final, Inc., the Lenders party thereto from time to time and Morgan Stanley Senior Funding, Inc., as administrative agent and as collateral agent.** | ||
10.7.2 |
Amendment No. 1 to Credit Agreement, dated as of May 29, 2013, by and among SF CC Intermediate Holdings, Inc., Smart & Final Stores LLC, the other Loan Parties listed on the signature pages thereto, Morgan Stanley Senior Funding, Inc., as administrative agent and collateral agent for the lenders under the Credit Agreement, joint lead arranger and joint book-runner, Deutsche Bank Securities Inc., as co-documentation agent, syndication agent, joint lead arranger and joint book-runner, Merrill Lynch, Pierce, Fenner & Smith Incorporated, as joint lead arranger and joint book-runner, Credit Suisse Securities (USA) LLC, as joint lead arranger and joint book-runner, Credit Suisse AG, as co-documentation agent and each of the undersigned banks and other financial institutions party thereto as lenders and the other Required Lenders party thereto.** |
||
10.7.3 |
Amendment No. 2 to Credit Agreement and Incremental Facility Amendment, dated as of December 19, 2013, by and among SF CC Intermediate Holdings, Inc., Smart & Final Stores LLC, the subsidiaries of the Borrower listed on the signature pages thereto, Morgan Stanley Senior Funding, Inc., as administrative agent for the lenders under the Credit Agreement, as collateral agent for the lenders under the Credit Agreement and as joint lead arranger and joint book-runner, Deutsche Bank Securities Inc., as co-documentation agent, syndication agent, joint lead arranger and joint book-runner, Merrill Lynch, Pierce, Fenner & Smith Incorporated, as joint lead arranger and joint book-runner, Credit Suisse Securities (USA) LLC, as joint lead arranger and joint book-runner, Credit Suisse AG, as co-documentation agent, the Consenting Lenders, and the banks and other financial institutions that are parties thereto as Additional Lenders.** |
||
10.8 |
Guarantee and Collateral Agreement, dated as of November 15, 2012, among SF CC Intermediate Holdings, Inc., Smart & Final Stores LLC, each other Subsidiary of Parent identified therein and Morgan Stanley Senior Funding, Inc., as administrative agent and as collateral agent for the Secured Parties.** |
||
10.9 |
ABL Guarantee and Collateral Agreement, dated as of November 15, 2012, among SF CC Intermediate Holdings, Inc., Smart & Final Stores LLC, each other Subsidiary of Parent identified therein and Bank of America, N.A., as administrative agent and as collateral agent for the Secured Parties.** |
||
10.10.1 |
Joint Venture Agreement, dated as of December 15, 1992, by and between Treviño Hernandez, S. de R.L. de C.V. and Smart & Final, Inc.** |
||
10.10.2 |
Product Sales Agreement, dated as of June 12, 2012, by and between Smart & Final Stores LLC and Smart & Final del Noroeste, S.A. de C.V.** |
||
10.10.3 |
Trademark Authorized User Agreement, dated as of June 12, 2012, by and between Smart & Final, Inc. and Smart & Final del Noroeste, S.A. de C.V.** |
||
10.11 |
Form of Smart & Final Stores, Inc. 2014 Stock Incentive Plan.† |
||
10.12 |
Form of Non-Qualified Stock Option Agreement pursuant to the Smart & Final Stores, Inc. 2014 Stock Incentive Plan.† |
||
10.13 |
Form of Registration Rights Agreement.† |
||
10.14 |
Specimen Common Stock Certificate.* |
||
10.15 |
Form of Restricted Stock Agreement pursuant to the Smart & Final Stores, Inc. 2014 Stock Incentive Plan.† |
||
| Exhibit No. |
Description of Exhibit | ||
|---|---|---|---|
| 21.1 | List of subsidiaries.** | ||
23.1 |
Consent of Proskauer Rose LLP (included in Exhibit 5.1).† |
||
23.2 |
Consent of Ernst & Young LLP, independent registered public accounting firm.† |
||
24.1 |
Power of Attorney.** |
||
- †
- Filed
herewith.
- *
- To
be filed by amendment.
- **
- Previously filed.