Attached files
| file | filename |
|---|---|
| 8-K - 8-K - Koppers Holdings Inc. | d785268d8k.htm |
 Investor Presentation
September 2014
Exhibit 99.1 |
 2
The following information contains forward-looking statements within the
meaning of the Private Securities Litigation Reform Act of 1995.
These
forward-looking statements are based on management’s current
expectations and beliefs, as well as a number of assumptions concerning
future events. These statements are subject to risks, uncertainties,
assumptions and other important factors. You are cautioned not to put
undue reliance on such forward-looking statements because actual
results may vary materially from those expressed or implied. Koppers
assumes
no
obligation
to,
and
expressly
disclaims
any
obligation
to,
update or revise any forward-looking statements, whether as a result of
new information, future events or otherwise. This presentation also
includes non-GAAP measures.
Forward Looking Statements |
 The
New Koppers: a Leading Global Supplier to Infrastructure and Construction
Markets 3
Top producer of carbon compounds, performance
chemicals and treated wood products
Unique product portfolio and niche end market focus
Strategic global presence
Long-term relationships with large blue chip customers
Focused on delivering sustainable profitable growth at
attractive returns |
 The
New Koppers: Three Core Complementary Business Segments
4
Carbon
Materials and
Chemicals
(CMC)
2013 Pro Forma
Revenue $906mm
Railroad and
Utility Products
and Services
(RUPS)
2013 Pro Forma
Revenue $628mm
Performance
Chemicals
(PC)
2013 Pro Forma
Revenue $334mm |
 Unique
Product Portfolio and Niche End Market Focus…
Specialty Products/Services Mix:
•
Railroad Bridge Services
•
Railroad Crossties
•
Rail Joint Bars
•
Utility Poles
•
Wood Preservation Chemicals
•
Carbon Pitch
•
Creosote
•
Naphthalene
•
Phthalic Anhydride
•
Carbon Black Feedstock
Performance:
•
2013 Pro Forma Sales: $1,868 mm
Diverse End Markets:
•
Railroad
•
Utilities
•
Construction
•
Agricultural
•
Aluminum/Steel
•
Rubber
Strategic Global Presence:
•
North America
•
Europe
•
Australia and New Zealand
•
Emerging Markets
•
Asia
•
Middle East
•
South and Central America
5
…Generate Stable Cash Flows and Provide Growth Opportunities
|
 Addition of Osmose Enhances Koppers
Diversity, Stability and Growth Potential
2013 Sales by End Market
6
$1,478mm
$1,478mm
$1,868mm
$1,868mm
Railroad crossties
27%
Carbon pitch
26%
Creosote and
carbon black
feedstock
15%
Naphthalene /
PAA
12%
Utility poles
8%
Other
12%
Railroad products
and services
32%
Aluminum / steel
28%
Construction
11%
Rubber
11%
Utility poles
8%
Other
10%
Railroad products
and services
27%
Aluminum / Steel
22%
Construction
19%
Rubber
9%
Utilities
8%
Agriculture
7%
Other
8%
Creosote and
carbon black
feedstock
12%
Naphthalene /
PAA
10%
Utility poles
6%
Other
12%
Railroad crossties
Carbon pitch
21%
Preservation
chemicals
18%
21%
2013 Sales by Product |
 The
acquired Osmose entities are comprised of (i) a global market leader in wood
preservative chemicals (Performance Chemicals) and (ii) a service provider to the
rail industry (Railroad Structures)
Performance Chemicals manufactures wood
preservation chemicals for use in treating wood
products
#1 global producer of wood preservation
chemicals
(2)
U.S. leader in residential treated lumber
(1)
Treated wood is used in a variety of products including
wood decking, fencing, construction materials, piers and
docks
Serves 6 of the top 10 largest lumber treating
companies in the US and 3 of the 4 largest lumber
wood treating companies in Canada
Railroad Structures offers a broad range of railroad
bridge inspection, treatment, repair, and construction
services throughout North America
Serves Class I and Short Line railroad operators
Key customers include Union Pacific, Genesee &
Wyoming, Canadian National Railway, and
BNSF Railway
Performance Chemicals
Railroad Structures
7
Osmose Overview
Performance
Chemicals & Railroad
Structures
2013 Revenue: $390mm
(1)
1.
Includes $16 million of residential treated lumber revenues that are added to RUPS
2. Management estimates
|
 8
Products Fulfill Industry Demand Across
Diverse End Markets…
.
Drivers
Coal
Tar
Carbon
Pitch
PAA
Naph-
thalene
CBF
Creosote
Railroad
Crossties
Treating
Chemicals
BF Steel
EAF Steel
Aluminum
Automotive
Rubber
Construction
Class I RR
Budgets
Crosstie
Insertions
…Providing Counter-Cyclical Earnings Stability
|
 Strategically Located Facilities to Best Serve
Clients and Meet Growing Demand
Facilities are well-positioned to capture worldwide growth in demand
Europe
4 facilities
North America
19 facilities
China
3 facilities
Carbon Materials and Chemicals
Railroad and Utility Products and Services
Performance Chemicals
Australasia
9 facilities
2013 Point of Sale
South America
2 facilities (1)
9
(1) Toll producing facilities
North
America, 60%
Europe,
14%
Australia,
11%
Emerging
Markets, 15% |
 10
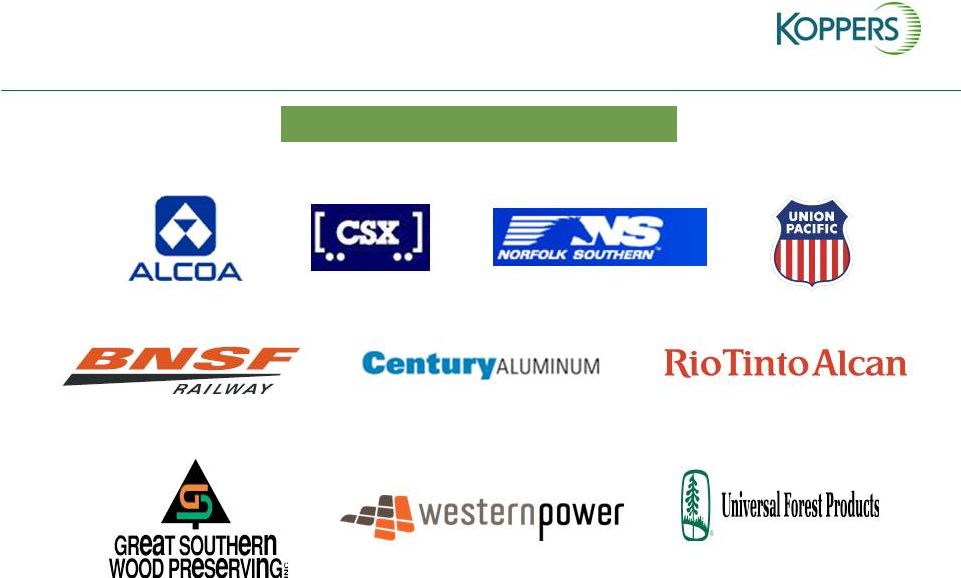
Long-Term Relationships with Large
Blue Chip Customers Create Revenue Visibility
Select Key Customers |
 Market Challenges
Depressed global aluminum market has resulted in a difficult pricing
environment for carbon pitch
Recessionary conditions in Europe have resulted in reduced volumes and
pricing for carbon pitch, naphthalene and CBF
North American CMC business continues to be challenged by difficult market
conditions
KCCC
joint
venture
in
China
is
being
closed
as
a
result
of
our
JV
partner
being
ordered
to
cease
operations
at
their
coke
ovens
due
to
pollution
concerns
In
the
Middle
East,
despite
the
growth
in
production
in
this
low
energy
cost
region, competition remains strong and pitch prices continue to be depressed
Railroad business negatively impacted in 2014 due to reduced crosstie
availability
11 |
 2014:
Transitional Year for Koppers 12
Adjusted EPS
$1.73
$2.32
$2.80
$3.27
$2.60
$2.08
($ millions except EPS)
(1) Calculations of historical Adjusted EPS can be found in our earnings press releases at www.koppers.com under Investor Relations |
 13
Focused on Delivering Long-Term Sustainable
Profitable Growth at Attractive Returns
Achieve above-market sales growth
Growth
Profitability
Improve margins by at least 200 basis
points
Execution of These Priorities Will Deliver Increased Shareholder
Value
Capital
Deployment
Maintain ROCE greater than WACC |
 Decisive Actions Have Been Taken…
14
Diversified business
risk through Osmose
acquisition
Completed
construction of new
distillation facility in
China (KJCC)
Added to scale of
RUPS business
through Ashcroft
acquisition
Ceased distillation
activities at Uithoorn
facility in The
Netherlands
Commenced
restructuring of
North American CMC
facilities
Continued
investments in
structural
improvements in
RUPS
…to Generate Substantial Sustainable Profit
Improvement Beginning in 2015 |
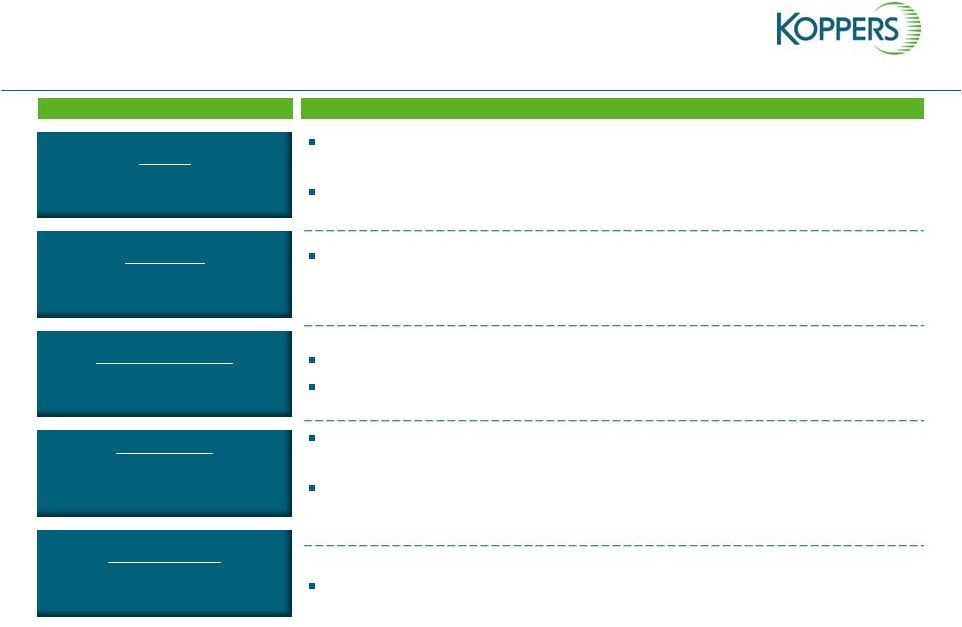 Osmose Enhances Koppers Strategic
Objectives
Growth
Achieve above-market sales
growth
Profitability
Improve margins by
at least 200 basis points
Capital Deployment
Maintain ROCE
higher than WACC
Target Market
Selective, complementary core
and near-adjacent acquisitions in
infrastructure space
Earnings
Impact
Must be accretive
in near term
Koppers Objectives
Commentary
Source: Management estimates.
(a) Koppers and Osmose management
estimates do not include synergies. 15
2010 –
2013 Sales CAGR of 8.1% exceeds Koppers Sales CAGR of 7.5%
over that same period
Ability to leverage Osmose geographic footprint to enhance Koppers sales
opportunities
Acquisition is expected to be accretive to consolidated EBITDA margins,
and consistent with the company’s goals of achieving at least a 12%
EBITDA
margin
by
the
end
of
2015
(a)
IRR exceeds Weighted Average Cost of Capital (WACC)
Lower cost financing will reduce WACC
Performance
Chemicals
business complements Koppers traditional
creosote wood treating chemical business
Railroad
Structures maintenance-of-way business serves same customer
base as Koppers Railroad and Utility Products and Services
(“RUPS”) business
Acquisition is expected to be accretive to earnings by the end of 2015
without
$12 million of estimated synergies |
 Strong Cash Flow and Liquidity
Financing Structure at
Close of Transaction
Advantages to Financing
Approach
Low debt service cost
Mix of fixed and floating debt
Pre-payment flexibility at no cost (term loan A)
Bridge-free financing solution
New five year $500 million revolver ($230 million drawn) to replace current $350
million revolver at initial interest rate of 3.25%
New five year amortizing term loan A of $300 million at initial interest rate of
3.25% Leave
the
existing
senior
notes
in
place
and
ratably
secure
with
the
revolver/term
loan
Pro
forma
net
leverage
of
~4x
(1)
with
near-term
focus
on
reduction
of
net
leverage
to
~3x
Will take advantage of market conditions to evaluate long term capital structure
options 1.
Net leverage defined as net debt (total debt less cash) divided by adjusted
EBITDA 16
Transaction Sources and Uses
Sources of Funds
Uses of Funds
New Revolver
$500
Osmose Purchase net of cash acquired
$467
New Term Loan A
300
Existing RCF Repayment, LCs & Fees
93
Liquidity
240
Total Sources
$800
Total Uses
$800 |
 Bond
Refinancing Opportunity •
Current outstanding bonds of $300 million
•
Coupon @ 7.785% with first call date at 12/1/2014
•
Call premium approximately $12 million at call date; earlier call
would cost additional $3-4 million
•
Expectation is to refinance in 2014 with 175-225 bp reduction
•
Intention is to upsize the bond issue with portion >$300 million
used to reduce existing term loan
•
Rate reduction would reduce interest expense and cost of capital
17 |
 2015
– Strong Prospects for New Koppers
•
Some industry headwinds beginning to abate
–
Positive signs of a stronger global aluminum market with higher LME pricing
European economy showing signs of recovery
Expect crosstie procurement volumes to rebound in the second half of 2014 as
sawmill capacity continues to grow in response to increased end-market
demand
•
Actions taking hold
Stopped distillation activities at our Uithoorn facility in The Netherlands in
April and moved those production volumes to remaining two European
facilities Restructuring of our North American CMC facilities is providing
cost savings Freezing and funding of US pension plans has reduced pension
expense by >$5 million on an annual basis
•
Osmose synergy and margin expectations
Addition of Osmose should have significant impact on progress towards
achieving
sustainable
12%
EBITDA
margins
on
a
consolidated
basis
and
be
accretive to existing margins in 2015
Synergies
from
the
acquisition
of
Osmose
businesses
are
expected
to
reach
an
annualized run rate of $12 million by 4Q 2015
18
–
–
–
–
–
–
– |
 The
New Koppers: A Leading Global Supplier to Infrastructure and Construction
Markets 19
•
Market
leadership
positions
and
long-term customer
relationships
provide
for
a
stable
base
business
and
recurring
revenue stream
•
Diversity
of products, end markets, and locations provides
counter-cyclical earnings stability
•
Proven
track
record
of creating shareholder value through
strategic
investments
that
generate
high
returns
on
capital
•
Comprehensive
long-term
business
strategy
with
specific
actions
targeted
to
significantly
grow
the
top
and
bottom
lines
•
Strong
cash
flow
and
liquidity
provides
ample
capital
for
execution of long-term business strategy |
 Appendix
20 |
 COAL TAR
Carbon Pitch 50%
Primary End Products
Chemical Oils 20%
Distillate 30%
Primary End Markets
Naphthalene
Phthalic Anhydride
Anodes, Electrodes
and Needle Coke
Vinyl, Paint, Concrete
and Fiberglass
Railroad Crossties and
Carbon Black
Aluminum and Steel
Construction, Housing
and Automotive
Railroads and Rubber
Koppers buys coal tar from over 60 suppliers in 16 countries
Vertically Integrated Operations:
A Competitive Advantage
Creosote
Carbon Black Feedstock
21 |
 Carbon Materials and Chemicals
Sales and EBITDA Summary
2013 Point of Sale
2013 Sales by End Market
Sales ($mm)
Adjusted EBITDA ($mm)
Aluminum/
Steel 46%
Construction
18%
Other
18%
Rubber
18%
North
America
38%
Europe
25%
Australia
10%
Emerging
Markets
27%
(1)
Other includes refined tar, petroleum pitch, benzole and misc. products.
(2)
Construction includes PAA and naphthalene,
Adjusted EBITDA Margin
22
$795
$1,016
$1,000
$906
$867
$655
2009
2010
2011
2012
2013
TTM
$97
$79
$69
$101
$105
$78
8.0%
8.7%
10.0%
10.3%
12.2%
11.9%
2009
2010
2011
2012
2013
TTM
6/2014
6/2014 |
 $35
$44
$59
$71
$64
$46
9.8%
7.8%
8.4%
10.7%
12.5%
11.4%
2009
2010
2011
2012
2013
TTM
6/2014
Railroad and Utility Products and Services
Sales and EBITDA Summary
2013 Point of Sale
2013 Sales by End Market
Adjusted EBITDA Margin
Sales ($mm)
Adjusted EBITDA ($mm)
Railroad Products
and Services 79%
Utility Poles
21%
North America
87%
$450
$523
$555
$572
$559
$469
2009
2010
2011
2012
2013
TTM
6/2014
Australia/NZ
13%
23 |
 24
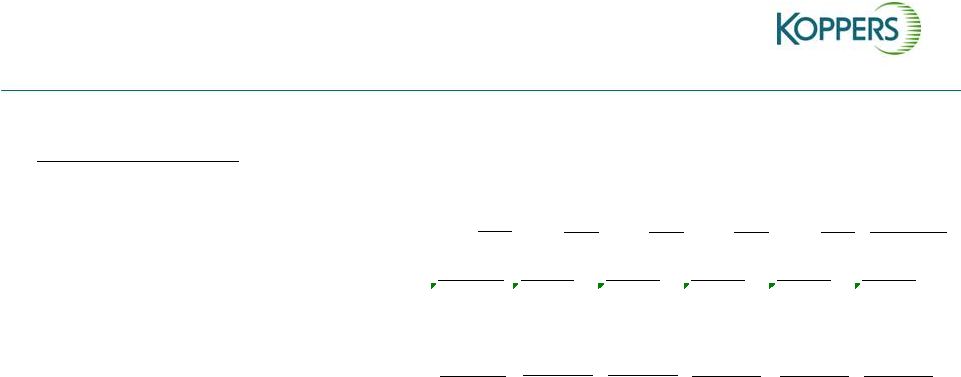
Return On Capital Employed (ROCE)
(not restated for discontinued operations)
($ in millions)
.
Return On Capital Employed
(Prior periods not restated for discontinued operations)
TTM
2009
2010
2011
2012
2013
6/30/2014
Interest expense
36.3
$
27.1
$
27.2
$
27.9
$
26.8
$
26.7
$
Loss/(gain) on debt extinguishment
22.4
-
-
-
-
-
Total interest expense
58.7
$
27.1
$
27.2
$
27.9
$
26.8
$
26.7
$
US Effective tax rate (including state)
40.0%
40.0%
40.0%
40.0%
40.0%
40.0%
Tax effected interest
35.2
$
16.3
$
16.3
$
16.7
$
16.1
$
16.0
$
Add:
Adjusted net income
37.7
48.0
58.3
68.7
54.1
42.9
A
Adjusted Net Operating Profit After Tax (A)
72.9
$
64.3
$
74.6
$
85.4
$
70.2
$
58.9
$
S/T debt and current portion of L/T debt
0.2
$
1.0
$
-
$
-
$
-
$
-
$
L/T debt
335.1
295.4
302.1
296.1
303.1
358.4
Stockholders' equity (less minority interest)
43.8
88.7
94.8
150.6
169.8
170.9
Add(Deduct) tax effected net income adjustments
18.6
3.7
21.4
3.0
13.6
23.9
Total Capital Employed
397.7
$
388.8
$
418.3
$
449.7
$
486.5
$
553.2
$
B
Average Capital Employed (B)
404.2
$
393.3
$
403.6
$
434.0
$
468.1
$
503.8
$
A/B
Return on Invested Capital (A/B)
18.0%
16.3%
18.5%
19.7%
15.0%
11.7% |
 25
Sales and EBITDA Reconciliation
(not restated for discontinued operations)
($ in millions)
.
Note:
Koppers believes that adjusted EBITDA provides information useful to investors in
understanding the underlying operational performance of the company, its
business and performance trends and facilitates comparisons between periods and with other
corporations in similar industries. The exclusion of certain items permits
evaluation and a comparison of results for ongoing business operations, and
it is on this basis that Koppers management internally assesses the company's performance. Although Koppers believes
that this non-GAAP measure enhances investors' understanding of its business
and performance, this non-GAAP financial measure should not be
considered an alternative to GAAP basis financial measures. TTM
2009
2010
2011
2012
2013
6/2014
$1,124.4
$1,245.5
$1,538.9
$1,555.0
$1,478.3
$1,425.2
18.8
44.1
36.9
65.6
42.8
21.2
58.7
27.1
27.2
27.9
26.8
26.7
24.8
28.1
48.8
28.2
37.6
41.6
13.8
29.1
14.9
33.3
36.8
21.2
0.3
0.2
–
0.1
0.1
0.2
116.4
128.6
127.8
155.1
144.1
110.9
2.6
0.4
0.7
1.6
1.3
-2.7
119.0
129.0
128.5
156.7
145.4
108.2
0.6
0.5
20.8
2.8
4.2
23.7
2.8
–
–
–
–
–
–
-1.6
-0.9
–
-1.8
-1.8
1.6
1.6
–
–
–
–
–
1.5
–
–
–
–
–
–
–
–
2.6
2.6
–
0.9
–
–
–
–
$124.0
$131.9
$148.4
$159.5
$150.4
$132.7
EBITDA with noncontrolling interests
Years Ended December 31
Net sales
Net income attributable to Koppers
Interest expense including refinancing
Depreciation and amortization
Income tax provision
Discontinued operations
EBITDA
Non-controlling interest
Tank and tank car cleaning
Legal settlements
Adjusted EBITDA with noncontrolling interests
Unusual items impacting net income
Plant closings and restructuring
Plant outages
Gain on sale
Acquisition cost write-off
Incremental 4
th
quarter LIFO and LCM |
 Carbon
Materials and Chemicals EBITDA Reconciliation
(prior years not restated for discontinued operations)
($ in millions)
Note: Koppers believes that adjusted EBITDA provides information useful to
investors in understanding the underlying operational performance of the
company, its business and performance trends and facilitates comparisons
between periods and with other corporations in similar industries. The exclusion of certain items
permits evaluation and a comparison of results for ongoing business operations,
and it is on this basis that Koppers management internally assesses the
company's performance. Although Koppers believes that this non-GAAP
measure enhances investors' understanding of its business and performance, this non-GAAP
financial measure should not be considered an alternative to GAAP basis financial
measures. 26
TTM
2009
2010
2011
2012
2013
6/2014
$58.5
$77.6
$45.4
$83.1
$43.9
$13.3
(0.6)
(0.8)
(0.6)
(0.8)
(1.0)
(3.1)
17.5
18.3
39.8
17.4
30.7
34.5
(1.3)
2.1
0.2
0.4
1.3
0.4
$74.1
$97.2
$84.8
$100.1
$74.9
$45.1
–
–
20.8
–
1.6
21.4
–
–
(0.9)
–
–
–
1.6
1.6
–
–
–
–
2.4
–
–
–
–
–
–
–
–
–
2.6
2.6
–
(2.1)
–
–
–
–
$78.1
$96.7
$104.7
$100.1
$79.1
$69.1
Depreciation and amortization
Allocated other income
EBITDA
Years Ended December 31
Operating profit
Allocated corporate operating profit
Tank and tank car cleaning
(Gain) on legal settlements
Adjusted EBITDA
Unusual items impacting net income
Plant closings and restructuring
(Gain) on sale of licensing
Acquisition cost write-off
Plant outages |
 RUPS
EBITDA Reconciliation (prior years not restated for discontinued
operations) Note: Koppers believes that adjusted EBITDA provides
information useful to investors in understanding the underlying operational
performance of the company, its business and performance trends and facilitates comparisons between
periods and with other corporations in similar industries. The exclusion of
certain items permits evaluation and a comparison
of
results
for
ongoing
business
operations,
and
it
is
on
this
basis
that
Koppers
management
internally
assesses the company's performance. Although Koppers believes that this
non-GAAP measure enhances investors' understanding of its business and
performance, this non-GAAP financial measure should not be considered an alternative
to GAAP basis financial measures.
27
($ in millions)
TTM
2009
2010
2011
2012
2013
6/2014
$38.2
$23.0
$34.8
$45.1
$58.3
$53.4
(1.2)
(0.8)
(0.6)
(0.8)
(0.9)
(2.9)
7.3
9.8
9.0
10.8
10.9
11.1
0.6
(0.2)
0.5
1.5
2.2
1.5
$44.9
$31.8
$43.7
$56.6
$70.5
$63.1
0.6
0.5
–
2.8
2.6
2.3
–
(1.6)
–
–
(1.8)
(1.8)
–
3.0
–
–
–
–
0.4
–
–
–
–
–
–
1.5
–
–
–
–
$45.9
$35.2
$43.7
$59.4
$71.3
$63.6
Depreciation and amortization
Years Ended December 31
Operating profit
Allocated corporate operating profit
Co-generation plant outage
Incremental LIFO charges
Adjusted EBITDA
Allocated other income
EBITDA
Unusual items impacting net income
Plant closings and restructuring
(Gain) on sale
Legal settlements |
