Attached files
| file | filename |
|---|---|
| 8-K - 8-K - ENPRO INDUSTRIES, INC | d785397d8k.htm |
| EX-99.2 - EX-99.2 - ENPRO INDUSTRIES, INC | d785397dex992.htm |
Exhibit 99.1
Information Excerpted from
Preliminary Offering Memorandum dated September 8, 2014
This summary highlights significant aspects of our business and this offering, but it is not complete and may not contain all of the information that may be important to you. You should read this entire offering memorandum carefully, including the historical financial statements and their related notes included elsewhere or incorporated by reference in this offering memorandum. Investing in the notes involves significant risks, as described in the “Risk Factors” section. In this offering memorandum, unless otherwise indicated or the context otherwise requires, references to the terms “we,” “us,” “our,” the “Issuer,” “EnPro” or the “Company” refer to EnPro Industries, Inc. and its subsidiaries. All financial data presented in this offering memorandum is the financial data of EnPro Industries, Inc. and its consolidated subsidiaries unless otherwise indicated.
Company Overview
We are a leader in the design, development, manufacture and marketing of proprietary engineered industrial products that primarily include: sealing products; heavy-duty truck wheel-end component systems; self-lubricating non-rolling bearing products; precision engineered components and lubrication systems for reciprocating compressors; and heavy-duty, medium-speed diesel, natural gas and dual fuel reciprocating engines, including parts and services. We serve a diverse set of end markets and customers with leading brands, including Garlock®, STEMCO®, GGB® and Fairbanks Morse Engine™. We believe our products are considered by our customers to be best-in-class due to a history of performance in critical and demanding applications where there is a high cost for failure. We manufacture our products at 63 manufacturing facilities in 13 countries. For the twelve months ended June 30, 2014 we generated $1,152 million of consolidated net sales and $142 million of Adjusted EBITDA, see “—Summary Historical Consolidated Financial Information and Other Data.”
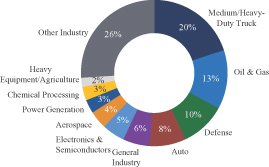
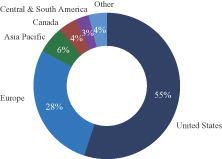
The charts below highlight our diversity of net sales by end market and geography:
| 2013 Consolidated Sales by End Use Market | 2013 Consolidated Sales by Geography | |
|
|
| |
2
Consolidated Operations
We manage our business as three segments: Sealing Products, Engineered Products, and Power Systems. Our reportable segments are managed separately based on differences in their products and services and their end-customers. Segment EBITDA is segment profit (which is the total segment revenue reduced by operating expenses and restructuring and other costs identifiable with the segment) before depreciation and amortization expense, see “—Summary Historical Consolidated Financial Information and Other Data.”
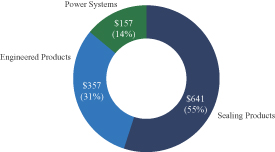
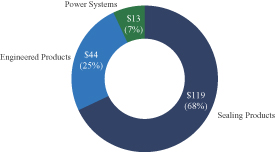
The following charts set forth the sales and Segment EBITDA of each of our segments for the last twelve months ended June 30, 2014.
LTM June 30, 2014
(dollars in millions)
| Segment Sales | Segment EBITDA | |
|
|
|
3
Segment Overview of EnPro Industries
| Segments |
Sealing Products |
Engineered Products |
Power Systems | |||||||||
| LTM June 30, 2014 |
Sales(1): $641 million Segment EBITDA(2): $119 million Segment EBITDA Margin(3): 19% |
Sales(1): $357 million Segment EBITDA(2): $44 million Segment EBITDA Margin(3): 12% |
Sales(1): $157 million Segment EBITDA(2): $13 million Segment EBITDA Margin(3): 8% | |||||||||
|
|
|
|
|
|
| |||||||
| Products |
• Gaskets & Packing • Oil Seals • Bearing Isolators • Expansion Joints • Flange Isolation Seal • Pipeline Products |
• Polymer Products • High Performance Metal Seals • Bellows • Brush Seals • Acoustic Media |
• Wheel End • Suspension • Brake Products • Intelligent Transportation Systems |
• Metal-polymer Plain Bearings • Bushing Blocks • Solid Polymer Bearings • Bearing Assemblies • Filament Wound Plain Bearings |
• Core Compressor Products • Sealing Components • Lubrication Systems • Reciprocating Compressor Reconditioning and Field Service |
• Medium-speed Diesel, Natural Gas and Dual Fuel Engines to 24MW • Parts & Service • Systems Packager | ||||||
| End Markets |
• General Industry • Oil & Gas • Basic Materials • Chemical Processing • Power Generation • Water/Wastewater • Pulp and Paper • Other Industries |
• Electronics & Semiconductors • Aerospace • Power Generation • General Industry • Oil & Gas • Food & Beverage |
• Medium/Heavy Duty Truck • Other Industries |
• Auto • General Industry • Agriculture Equipment • Fluid Power • Primary Metals • Other Industries |
• Oil & Gas • PET Bottle Manufacturing • Chemical Processing • Other Industries |
• Marine Power & Propulsion • Utility Standby Power Generation • Oil & Gas • Engine and Auxiliary Equipment Engineering | ||||||
| Representative |
• BASF • Chevron • Daewoo E&C • Dow • GE • Saudi Aramco • ThyssenKrupp |
• AREVA • Applied Materials • Cameron • Exelon • Honeywell • Schlumberger • Siemens |
• FedEx • H-E-B • Utility • Mack • UPS • Volvo • Wal-Mart |
• Alstom • Bosch • Caterpillar • Casappa • Emerson • United Technologies • John Deere |
• Apache • Air Products • Dow • GE • Graham Packaging • Shell • Tesoro |
• U.S. Navy • U.S. Coast Guard • Naval Shipyards • Ecopetrol • General Dynamics NASSCO • Petroecuador | ||||||
 (4)
(4)


| (1) | Sales for each segment include intersegment sales. Intersegment sales for the twelve months ended June 30, 2014 were $3.1 million. |
| (2) | Segment EBITDA is segment profit before depreciation and amortization. Segment profit does not include an allocation of corporate expenses. For a presentation of segment profit and the calculation of segment EBITDA, see “—Summary Historical Consolidated Financial Information and Other Data.” |
| (3) | Segment EBITDA Margin is Segment EBITDA divided by segment sales. |
| (4) | The Garlock column, and the discussion of the Sealing Products segment below, includes products, customers, competition, and raw materials for Garlock Sealing Technologies, LLC which is one of the three of our subsidiaries that filed voluntary petitions for reorganization under Chapter 11 of the United States Bankruptcy Code on June 4, 2010. The financial results of GST and subsidiaries are not included in our consolidated results after June 4, 2010 and are not included in the sales, Segment EBITDA, Segment EBITDA Margin or other financial measures of the Sealing Products segment for periods after June 4, 2010 included above or elsewhere in this offering memorandum. |
4
Sealing Products Segment
Our Sealing Products segment includes three operating divisions, Garlock, Technetics and Stemco, that serve a wide variety of industries where performance and durability are vital for safety and environmental protection. Our products are used in many demanding environments such as those characterized by high pressure, high temperature and chemical corrosion, and many of our products support critical applications with a low tolerance for failure.
The Garlock family of companies designs, manufactures and sells sealing products including: metallic, non-metallic and composite material gaskets; dynamic seals; compression packing; hydraulic components; expansion joints; flange sealing and isolation products; pipeline casing spacers/isolators; casing end seals; modular sealing systems for sealing pipeline penetrations; safety-related signage for pipelines; conveyor belting; and sheet rubber products. These products are used in a variety of industries, including chemical and petrochemical processing, petroleum extraction and refining, pulp and paper processing, power generation, food and pharmaceutical processing, primary metal manufacturing, mining, and water and waste treatment. Among the well-known brand names are Garlock®, Gylon®, Klozure®, Lubrikup®, Pikotek®, PSITM, and Gar-Seal®.
Technetics Group designs, manufactures and sells high performance metal seals; elastomeric seals; bellows and bellows assemblies; pedestals for semiconductor manufacturing; and a wide range of polytetrafluoroethylene (“PTFE”) products. These products are used in a variety of industries, including electronics and semiconductor, aerospace, power generation, oil and gas, food and beverage and other industries. Brands include Helicoflex®, Belfab®, Feltmetal®, PlastomerTM, and Bio-GuardianTM and Origraf®.
Stemco designs, manufactures and sells heavy-duty truck wheel-end component systems including: seals; hubcaps; mileage counters; bearings; locking nuts; brake products; suspension components; and RF-based tire pressure monitoring and inflation systems and automated mileage collection devices. Its products primarily serve the medium and heavy-duty truck market. Product brands include STEMCO®, STEMCO Kaiser®, STEMCO Duroline®, STEMCO Crewson®, STEMCO Motor Wheel®, Grit Guard®, Guardian HP®, Voyager®, Discover®, Endeavor®, Pro-Torq®, Sentinel®, Data Trac®, DataTrac®, QwikKit®, Centrifuse® and AerisTM.
Customers
Our Sealing Products segment sells products to industrial agents and distributors, original equipment manufacturers (“OEMs”), engineering and construction firms and end users worldwide. Sealing products are offered to global customers, with approximately 40% of sales delivered to customers outside the United States in 2013. Representative customers are shown in the segment overview table above. In 2013, no single customer accounted for more than 7% of segment revenues.
Raw Materials and Components
Our Sealing Products segment uses PTFE resins, aramid fibers, specialty elastomers, elastomeric compounds, graphite and carbon, common and exotic metals, cold-rolled steel, leather, aluminum die castings, nitrile rubber, powdered metal components, and various fibers and resins. We believe all of these raw materials and components are readily available from various suppliers.
Engineered Products Segment
Our Engineered Products segment includes two high performance industrial products businesses: GGB and Compressor Products International (CPI).
5
GGB designs, manufactures and sells self-lubricating, non-rolling, metal polymer, solid polymer, and filament wound bearing products, as well as aluminum bushing blocks for hydraulic applications. The bearing surfaces are made of PTFE or a mixture that includes PTFE to provide maintenance-free performance and reduced friction. GGB’s bearing products typically perform as sleeve bearings or thrust washers under conditions of no lubrication, minimal lubrication or pre-lubrication and are used in a wide variety of markets such as the automotive, pump and compressor, construction, power generation and general industrial markets. GGB has approximately 20,000 bearing part numbers of different designs and physical dimensions. GGB® is a leading and well recognized brand name and sells products under the DU®, DP®, DX®, DS™, HX™, EP™, SY™ and GAR-MAX™ names.
CPI designs, manufactures sells and services components for reciprocating compressors and engines. These components, which include, packing and wiper rings, piston and rider rings, compressor valve assemblies, divider block valves, compressor monitoring systems, lubrication systems and related components, are utilized primarily in the refining, petrochemical, natural gas gathering, storage and transmission, and general industrial markets. Brand names for our products include Hi-Flo™, Valvealert™, Mentor™, Triple Circle™, CPI Special Polymer Alloys™, Twin Ring™, Liard™, Pro Flo™, Neomag™, CVP™, XDC™, POPR™ and Protecting Compressor World Wide™.
Customers
The Engineered Products segment sells its products to a diverse customer base using a combination of direct sales and independent distribution networks worldwide, with approximately 73% of sales delivered to customers outside the United States in 2013. GGB has customers worldwide in all major industrial sectors, and supplies products directly to customers through GGB’s own local distribution system and indirectly to the market through independent agents and distributors with their own local networks. CPI sells its products and services globally through its internal salesforce, independent sales representatives, distributors and service centers. Representative customers are shown in the segment overview table above. In 2013, no single customer accounted for more than 3% of segment revenues.
Raw Materials
GGB’s major raw material purchases include steel coil, bronze powder, bronze coil, PTFE and aluminum. GGB sources components from a number of external suppliers. CPI’s major raw material purchases include PTFE, polyetheretherketone (“PEEK”), compound additives, bronze, steel, and stainless steel bar stock. We believe all of these raw materials and components are readily available from various suppliers.
Power Systems Segment
Our Power Systems segment designs, manufactures, sells and services heavy-duty, medium-speed diesel, natural gas and dual-fuel reciprocating engines. We market these products and services under the Fairbanks Morse Engine™ brand name. Products in this segment include licensed heavy-duty, medium-speed diesel, natural gas and dual fuel reciprocating engines, in addition to our own designs. The reciprocating engines range in size from 700 to 31,970 horsepower and from five to 20 cylinders. The government and the general industrial market for marine propulsion, power generation, and pump and compressor applications use these products. We have been building engines for over 115 years under the Fairbanks Morse Engine™ brand name and we have a large installed base of engines for which we supply aftermarket parts and service. Fairbanks Morse Engine has been a key supplier to the U.S. Navy for medium-speed diesel engines and has supplied engines to the U.S. Navy for over 70 years.
6
Customers
Our Power Systems segment sells its products and services to customers worldwide, including major shipyards, municipal utilities, institutional and industrial organizations, sewage treatment plants, nuclear power plants and offshore oil and gas platforms, with approximately 4% of sales delivered to customers outside the United States in 2013. We market our products through a direct sales force of engineers in North America and through independent agents worldwide. Representative customers are shown in the segment overview table above. In 2013, the largest customer accounted for approximately 21% of segment revenues.
Raw Materials and Components
The Power Systems segment purchases multiple ferrous and non-ferrous castings, forgings, plate stock and bar stock for fabrication and machining into engines. In addition, we buy a considerable amount of precision-machined engine components. We believe all of these raw materials and components are readily available from various suppliers, but may be subject to long and variable lead times.
Garlock Sealing Technologies
On June 5, 2010 (the “Petition Date”), three of our subsidiaries, GST LLC, Anchor and Garrison, filed voluntary petitions for reorganization under Chapter 11 of the United States Bankruptcy Code in the Bankruptcy Court. The filings were the initial step in an asbestos claims resolution process. The filings did not include EnPro Industries, Inc., or any other EnPro Industries, Inc. operating subsidiary. GST LLC now operates in the ordinary course under court protection from asbestos claims. All pending litigation against GST is stayed during the bankruptcy process. For the last twelve months ended June 30, 2014, GST generated $238 million in net sales and $58 million in Adjusted EBITDA, and at June 30, 2014 its aggregate cash and cash equivalents and investments in marketable securities were $216 million.
The financial results of GST and subsidiaries are included in our consolidated results through June 4, 2010, the day prior to the Petition Date. However, GAAP requires an entity that files for protection under the U.S. Bankruptcy Code, whether solvent or insolvent, whose financial statements were previously consolidated with those of its parent, as GST’s and its subsidiaries’ were with ours, generally must be prospectively deconsolidated from the parent and the resulting investment to be accounted for using the cost method. Prior to its deconsolidation effective on the Petition Date, GST LLC and its subsidiaries operated as part of the Garlock group of companies within EnPro’s Sealing Products segment. GST LLC designs, manufactures and sells sealing products, including metallic, non-metallic and composite material gaskets, rotary seals, compression packing, resilient metal seals, elastomeric seals, hydraulic components, and expansion joints. GST LLC and its subsidiaries operate five primary manufacturing facilities, including GST LLC’s operations in Palmyra, New York and Houston, Texas.
On May 29, 2014, GST filed an amended proposed plan of reorganization that provides $275 million in total funding for (a) the treatment of present and future asbestos claims against GST that have not been resolved by settlement or verdict prior to the Petition Date, and (b) administrative and litigation costs. The $275 million is to be funded by GST ($245 million) and Coltec ($30 million), through two facilities—a settlement facility (which would receive $245 million) and a litigation facility (which would receive $30 million). If the proposed plan is confirmed and consummated, funds contained in the settlement facility and the litigation facility would provide the exclusive remedies for current and future GST asbestos claimants other than claimants whose claims had been resolved by settlement or verdict prior to the Petition Date and were not paid prior to the Petition Date. The plan provides that GST will pay in full claims that had been resolved by settlement or verdict prior to the Petition Date that were not paid prior to the Petition Date (with respect to claims resolved by verdict, such payment will be made only to the extent the verdict becomes final). The amount of such claims resolved by verdict is $2.4 million. GST estimates the range of its aggregate liability for such unpaid settled asbestos claims
7
to be from $3.1 million to $16.4 million. The plan incorporates the Bankruptcy Court’s determination in January 2014 that $125 million is sufficient to satisfy GST’s aggregate liability for present and future mesothelioma claims (although such determination is currently the subject of the motion by the Official Committee of Asbestos Personal Injury Claimants representing current asbestos personal injury claimants in the bankruptcy proceeding to reopen the record); however, it also provides additional funds to provide full payment for non-mesothelioma claims and to support a feasibility determination. Under the terms of the plan, we would retain 100% of the equity interests of GST LLC.
If the plan is confirmed by the Bankruptcy Court and is consummated, GST will be re-consolidated with our results for financial reporting purposes. The plan is subject to confirmation by the Bankruptcy Court and we cannot assure you that GST will be able to obtain necessary Bankruptcy Court approval of the plan, including the settlement of asbestos claims and related releases of claims against us included therein, and that the plan will become effective or that the asbestos claimants will not be successful in their attempt to have the record on the Bankruptcy Court’s determination reopened or what the final terms of the plan will be at consummation. See “Risk Factors—We cannot assure you that GST will be able to obtain Bankruptcy Court approval of its amended plan of reorganization and the settlement and resolution of claims and related releases of liability embodied therein or what the final terms of such plan will be at consummation, and the time period for the resolution of the bankruptcy proceedings is not presently determinable.”
Competition
We compete with a number of competitors in each of our segments. Although it varies by products, competition is based primarily on performance of the product for specific applications, product reliability, availability and price. Our leading brand names, including Garlock® and STEMCO®, have been built upon long-standing reputations for reliability and durability. In addition, we believe the breadth, performance and quality of our product offerings allow us to achieve premium pricing and have made us a preferred supplier among our agents and distributors in many of our businesses. Key competitors for the Sealing Products segment include Federal-Mogul Corporation, A.W. Chesterton Company and SKF USA Inc. Key competitors for the Engineered Products segment include Federal-Mogul Corporation and Saint-Gobain’s Norglide division. Key competitors for the Power Systems segment include MTU, Caterpillar Inc., and Wartsila Corporation.
Competitive Strengths
We believe the following strengths provide us with significant competitive advantages as we execute our business strategy:
Our Brands Set Industry Standards and Drive a Portfolio of Highly Repeatable, Stable Businesses
Our leading brands, including Garlock®, STEMCO®, GGB® and Fairbanks Morse Engine™, have legacies ranging from 60 to 125 years. We believe that the products sold under these leading brands are well established and highly recognized in their respective markets, and, in our flagship product lines, we hold leading market positions. In many cases, we expect our products are the products of choice for our customers given our long-standing histories of reliable performance in demanding and critical applications. We believe many of our products set industry standards around safety, emissions control, reliability, and performance. And we were among the first to market with a number of products, including opposed piston engines, non-asbestos sealing products, high-performance PTFE gaskets, metal-polymer bearings, and zero-PFOA (perfluorooctanoic acid) bearings. A meaningful percentage of our sales is generated by products that are either sole-sourced or customer-specified. The focus of our brand and business model has been, and continues to be, developing premium quality products that meet demanding performance standards, providing customers with focused service and support, and developing and nurturing enduring customer relationships.
8
Many of Our Products Perform in Demanding Environments and Serve Critical Applications
Many of our products support critical applications in demanding environments such as those characterized by high pressure, high temperature, chemical corrosion and demand for zero failure. Notable examples include sealing products for nuclear reactor pressure vessels; seals, bearings and related products for aircraft engines and landing gear; wheel-end and brake products for Class 8 trucks; and engines that provide propulsion or auxiliary power for U.S. Navy vessels. We believe many of our products’ long-standing histories of performance reliability in demanding environments and for critical applications provide significant commercial advantages, leading to value-based pricing opportunities that drive premium margins and capital returns. In addition, some applications in which our products serve are characterized by high customer switching costs, due to both the critical nature of the application and the specification process.
Our Highly Diversified Business Portfolio Leads to Stable Cash Flows
Our sales are generated across a broad range of industries and geographies. We serve more than 30 end markets, and approximately 45% of our 2013 net sales were from sales of our products outside of the United States. A slowdown in a specific industry or economy can be offset by an uptick in other markets, providing confidence in our ability to sustain profitability and stable cash flows over time. We also have a strong mix of aftermarket and OEM customers. In 2013, approximately 48% of our net sales were to aftermarket customers and 52% to OEM customers. Much of our OEM business is platform-based and sole-sourced, resulting in very low product displacement. Additionally, our large installed base of products generates a steady recurring aftermarket revenue stream.
We Have Positioned Our Company for Growth and Continuous Improvement
Since our spin-off from Goodrich Corporation (“Goodrich”) in 2002, we have systematically refined our business mix and model, and we are well positioned for future growth and continuous operational improvement. Initiatives undertaken include the following:
| • | We have streamlined our mix of businesses, divesting a large division (Quincy Compressor) and several small, non-strategic business units. We have reinvested fully the proceeds of those divestitures into businesses that fit strategically with our operating divisions and that provide new products, new technologies and new or expanded geographic reach. In the process, we have refined our acquisition processes and developed a formal playbook for a strategy-driven conservative approach to managing our portfolio. We have expanded globally through both acquisitions and organic initiatives, particularly in Asia, South America and the Middle East. |
| • | We have developed a comprehensive supply chain management process and currently have 38 category teams managing 85% of our total spend, targeting annual savings of 3% through the business cycle. |
| • | We have developed a world-class safety program and culture and are one of only three companies to be recognized on two separate occasions by EHS Today as America’s Safest Company. |
| • | We have invested heavily in our infrastructure with major facility upgrades and ERP implementations in all of our operating divisions. And we have developed an EnPro global manufacturing and commercial business model through cross-division collaboration and external benchmarking. |
| • | On the commercial front, we recently added the roles of Chief Innovation Officer and Chief Customer Officer to the responsibilities of two of our senior executives. |
9
The EnPro Senior Executive Team is Composed of Members with Diverse Educational and Functional Backgrounds and Demonstrated Track Records of Success
Our executive management team is led by Steve Macadam, President and Chief Executive Officer, who has served in this capacity for the past six years. Prior to joining EnPro, Mr. Macadam was CEO of two other industrial companies and a senior operating executive at a third manufacturer, all following an earlier career as Principal with McKinsey & Company. Others on the EnPro senior team bring a diverse mix of educational and functional backgrounds and demonstrated records of success at both EnPro and in their roles prior to joining EnPro. The varied backgrounds include experience with companies such as W.L. Gore, General Electric, General Motors, Federal-Mogul and with professional consulting and accounting firms such as McKinsey and Ernst & Young. Dale Herold, President of the Garlock family of companies and Chief Customer Officer, and Ken Walker, Engineered Products Segment President, both have strong technical commercial backgrounds. Jon Cox, Stemco Group President and Chief Innovation and Information Officer, has deep experience in new product development. Marvin Riley, President of Fairbanks Morse Engine (the Power Systems segment), held senior manufacturing positions prior to his current role.
Business Strategy
We seek to take advantage of our competitive strengths to execute our growth and cost reduction strategies and, as a result, to maximize our free cash flow. Examples include:
Capitalize on Secular Growth Trends in Core Lines of Business
We serve a diverse group of markets and geographies and seek to invest in, and capture the benefits of, positive secular trends.
In our Sealing Products segment, our Garlock business has benefitted recently from its significant presence in domestic and international hydrocarbon processing markets and from market demands for products that protect the environment from leaks and emissions. Garlock is also focusing on expansion into less cyclical end markets such as food and pharmaceutical markets. Stemco is currently experiencing growth in its core trailer market as trailer build rates and truck loadings have been strong. Stemco is also capitalizing on its products that enhance highway safety and on regulatory trends addressing stopping distance, brake quality and fuel efficiency. At Technetics Group, we are benefitting from strength in the semiconductor and aerospace markets.
In our Engineered Products segment, we believe growth at GGB will be driven by more favorable conditions in the European automotive market and more generally as a result of economic strengthening in both North America and Europe. GGB will continue to pursue incremental growth through efforts to convert legacy roller bearing applications in the U.S. to high performing and less costly plain bearings. We also seek to gain share in China as premium quality auto production develops to serve a rising middle class. At CPI, we have grown historically through acquisition-driven geographic expansion and adjacent product line additions and are currently undergoing a broad-based business transformation to realize the full value of these prior strategic moves. We anticipate future benefits with positive secular trends in the hydrocarbon processing and natural gas markets.
In our Power Systems segment, Fairbanks Morse Engine is a significant supplier to the U.S. Navy and has a leading market share in the U.S. nuclear market. Future growth is anticipated to come primarily from new initiatives underway to expand in commercial markets. Currently, we are developing a next generation opposed piston engine (OP 2.0) that, if successful, will provide increased opportunities in commercial markets. In addition, Fairbanks Morse Engine recently announced a new agreement with MAN Diesel that will provide Fairbanks Morse Engine with additional products for sale to the U.S. power generation market. Fairbanks Morse Engine has entered into other agreements that provide access to products for sale to its core marine and power generation markets.
10
Drive Growth through Product Innovation
We seek to drive growth by enhancing our product and technology offerings. Within our Sealing Products segment, we are working to adapt the Garlock family of products to meet the needs of the food and pharmaceutical markets. At Stemco, we have an established track record of new product development and a number of product innovation initiatives underway in its wheel-end, brake and suspension components groups. At Technetics, we are expanding our product offerings for the aerospace, semiconductor, nuclear and oil & gas markets through close customer collaboration and active partnerships with companies like Airbus, Applied Materials, and the French nuclear agency (CEA). In our Power Systems segment, we are working to develop and commercialize the next generation opposed piston engine (OP 2.0). We plan to continue the development of proprietary products as a means to differentiate ourselves from our competitors and grow our business. These efforts are supported by an enterprise-wide focus on innovation led by our recently appointed Chief Innovation Officer.
Capture Growth via Geographic Expansion
While our primary markets are the developed economies of North America and Europe, we have expanded selectively in Eastern Europe, Asia, South America, the Middle East and Africa since the 2002 spin-off from Goodrich. All of our operating divisions other than Fairbanks Morse Engine now have a presence in Asia where our focus, with the exception of Stemco, is serving the local market. In the case of Stemco, we established a facility in China to produce wheel-end bearings for export to the U.S. We will continue to expand geographically in areas, and with customers, that value our high-performance products and service capabilities.
Supplement Organic Growth with Strategic Acquisitions
In addition to new product development and geographic expansion, acquisitions provide a means for expanding our addressable market through adding new products and technologies and helping us enter new markets. We maintain a disciplined and conservative acquisition approach that is grounded in business strategy and that incorporates all aspects of the acquisition process, including target identification, valuation and negotiation, due diligence, integration and post-closing business planning and execution. Our acquisition focus has led to a ten-fold increase in Stemco’s addressable market over the past five years, establishment of the Technetics Group to focus on high-performance sealing and related products, expansion of Garlock’s pipeline products business and expansion of Compressor Product International’s service capability and geographic reach. At Stemco, we have significant room to capture share in our expanded addressable market based on brand strength, channel strategy and sales excellence. Since the spinoff from Goodrich in 2002, we have invested approximately $580 million in acquisitions at an average price to EBITDA multiple of 7.1x before consideration of synergies.
Ongoing Focus on Cost Containment and Continuous Improvement
We continue to seek opportunities to lower manufacturing costs by optimizing our production footprint, implementing new manufacturing practices and processes and investing in capital equipment to increase manufacturing efficiencies and improve product quality. We will continue to manage our total supply spend through the work of our 38 category teams with the goal of realizing annual savings of 3% through the business cycle. In addition, we expect to benefit from the investments made in new ERP systems.
Recent Developments
Although we do not routinely report financial information other than with respect to our annual and quarterly fiscal periods, our preliminary unaudited net sales, income before income taxes and segment profit for the two-month period ended August 31, 2014 were approximately $188.3 million, $6.0 million and $20.4 million, respectively, compared to unaudited net sales, income before income taxes and segment profit for the two-month period ended August 31, 2013 of approximately $166.0 million, $0.9 million and $15.4 million, respectively.
11
Segment profit is the total of the segment revenue of each of our reportable segments reduced by operating, restructuring and other expenses identifiable with the segment. Expenses not directly attributable to the segments, corporate expenses (which include general corporate administrative costs), net interest expense, gains/losses related to the sale of assets, and income taxes are not included in the computation of segment profit. The accounting policies of our reportable segments are the same as those for EnPro.
The following table sets forth a reconciliation of segment profit to income before income taxes for the two-month periods ended August 31, 2014 and 2013.
| Two Months Ended August 31, | ||||||||
| 2013 | 2014 | |||||||
| (unaudited) | ||||||||
| (in millions) | ||||||||
| Segment profit |
$ | 15.4 | $ | 20.4 | ||||
| Corporate expenses |
(5.4 | ) | (7.5 | ) | ||||
| Other items |
(1.7 | ) | (0.8 | ) | ||||
| Interest expense |
(7.4 | ) | (6.1 | ) | ||||
|
|
|
|
|
|||||
| Income before income taxes |
$ | 0.9 | $ | 6.0 | ||||
|
|
|
|
|
|||||
We do not intend to provide future financial information for any period other than with respect to our annual and quarterly fiscal periods.
The preliminary unaudited financial information presented above for the two-month period ended August 31, 2014 reflects estimates based only upon preliminary information available to us as of the date of this offering memorandum, is subject to change pending finalization and is not a comprehensive statement of our financial results or position as of or for the two-months ended August 31, 2014. During the course of our financial statement closing process, we may identify items that would require us to make adjustments to our preliminary operating results described above. As a result, the foregoing discussion constitutes forward-looking statements and, therefore, we caution you that these statements are subject to risks and uncertainties, including possible adjustments to our preliminary operating results. The financial data for the two-month periods ended August 31, 2014 and 2013 included in this offering memorandum have been prepared by and is the responsibility of EnPro’s management. PricewaterhouseCoopers LLP has not audited, reviewed, compiled or performed any procedures with respect to such financial data. Accordingly, PricewaterhouseCoopers LLP does not express an opinion or any other form of assurance with respect thereto.
Refinancing Transactions
Cash Tender Offer for Convertible Debentures
On August 11, 2014, we commenced a cash tender offer (the “Tender Offer”) to purchase any and all of our outstanding $74.78 million in aggregate principal amount Convertible Debentures. In the Tender Offer, we are offering to purchase the Convertible Debentures at a cash purchase price, for each $1,000 principal amount of such Convertible Notes, equal to the sum of (i) the average volume-weighted-average price of our common stock over the 20 consecutive trading days beginning on August 13, 2014 in the manner described in the documents governing the terms of the Tender Offer multiplied by 29.5972 plus (ii) a fixed cash amount of $52.50, provided that in no event will the purchase price be less than $ 1,650.75 or more than $2,301.89 per $1,000 principal amount of the Convertible Debentures. In addition, we will pay all accrued and unpaid interest, to but not including the settlement date of the Tender Offer, on all Convertible Debentures purchased in the Tender Offer. The Tender Offer expires at midnight at the end of September 12, 2014, unless we extend the expiration to a later date and time (the “Expiration Date”).
12
There can be no assurance as to how many, if any, Convertible Debentures will be tendered in the Tender Offer. The Convertible Debentures are not redeemable at the option of the Company and, therefore, we anticipate that any Convertible Debentures that remain outstanding after the consummation of the Tender Offer will continue to be outstanding under the terms of the indenture governing the Convertible Debentures (and subject to any conversion rights set forth therein). See “Description of Other Indebtedness—Convertible Debentures” and “Capitalization.” To the extent that any Convertible Debentures remain outstanding following consummation of the Tender Offer, we currently intend to seek to retire such Convertible Debentures on acceptable terms, including through open market purchases, privately negotiated transactions or another tender offer.
Revolving Credit Facility
On August 28, 2014, we entered into an amendment and restatement (the “Credit Facility Amendment”) to the credit agreement governing our credit facility. The Credit Facility Amendment provides for a five year, $300.0 million senior secured revolving credit facility. Unlike our prior credit facility, borrowing availability under the amended credit facility is not limited by reference to a borrowing base. See “Description of Other Indebtedness—Senior Secured Revolving Credit Facility” for a more detailed description of our senior secured revolving credit facility as amended and restated by the Credit Facility Amendment. Unless otherwise noted, the term “Revolving Credit Facility” refers to the senior secured revolving credit facility as amended and restated by the Credit Facility Amendment.
Use of Proceeds
We intend to use the net proceeds from this offering: (i) to repay outstanding borrowings under the Revolving Credit Facility made to fund the purchase of any and all of our Convertible Debentures in the Tender Offer and related fees and expenses; (ii) to repay all remaining borrowings and accrued interest outstanding under the Revolving Credit Facility; and (iii) for other general corporate purposes. We currently intend to seek to retire any Convertible Debentures that remain outstanding after completion of the Tender Offer on acceptable terms, including through open market purchases, privately negotiated transactions or another tender offer.
We collectively refer to this offering and the use of proceeds therefrom, including the purchase of any and all of the Convertible Debentures in the Tender Offer and the entering into the Credit Facility Amendment, as the “Refinancing Transactions,” and information included in this offering memorandum after giving effect to the Refinancing Transactions assumes that all of the outstanding Convertible Debentures are tendered and purchased in the Tender Offer at the $2,301.89 maximum purchase price per $1,000 principal amount of the Convertible Debentures. See “Use of Proceeds” and “Capitalization.”
13
Ownership and Corporate Structure
The following chart summarizes our organizational structure and our principal outstanding debt obligations at June 30, 2014 on an as adjusted basis after giving effect to this offering and the application of the net proceeds as described in “Use of Proceeds” and the effectiveness of our Revolving Credit Facility. The notes will initially be guaranteed by all of our existing and future direct and indirect domestic subsidiaries that guarantee our indebtedness under the Revolving Credit Facility. Accordingly, the notes will initially be guaranteed by all of our direct and indirect domestic subsidiaries, other than GST and the respective subsidiaries of GST which do not initially guarantee indebtedness under the Revolving Credit Facility. This chart also shows the entities that are obligors with respect to promissory notes payable to GST LLC.
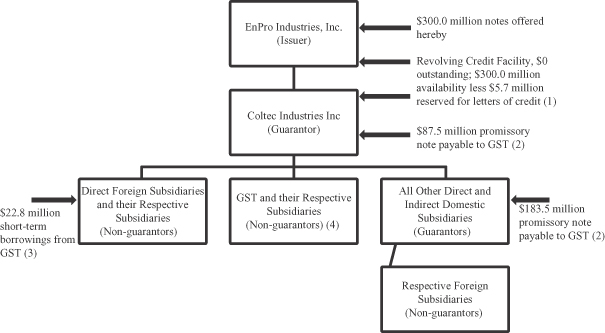
| (1) | As of June 30, 2014, after giving effect to the Refinancing Transactions, $300.0 million, representing the full amount of the Revolving Credit Facility, less $5.7 million reserved for outstanding letters of credit, would have been available for borrowing under the Revolving Credit Facility. Borrowers under the Revolving Credit Facility are EnPro Industries, Inc. and Coltec Industries Inc (“Coltec”), and the Revolving Credit Facility is guaranteed by all of our direct and indirect domestic subsidiaries, other than GST and the respective subsidiaries of GST. For a description of the material terms of the Revolving Credit Facility, see “Description of Other Indebtedness—Revolving Credit Facility.” |
| (2) | Respectively, includes approximately $87.5 million under a promissory note made by Coltec payable to GST LLC (the “Coltec Note”) and approximately $183.5 million under a promissory note made by Stemco LP , an indirect subsidiary of Coltec, payable to GST LLC (the “Stemco Note,” and together with the Coltec Note, the “Intercompany Notes”). The Coltec Note is secured by Coltec’s pledge of certain of its equity ownership in specified U.S. subsidiaries. The Stemco Note is guaranteed by Coltec and secured by Coltec’s pledge of its interest in Stemco LP and Stemco Holdings, Inc. The principal amount of each of these Intercompany Notes is subject to increase over time as a portion of the interest on these notes is added to the principal amount of the Intercompany Notes as payment-in-kind interest. The Intercompany Notes are subordinated to any obligations under the Revolving Credit Facility, pursuant to existing subordination |
14
| agreements which subordinate GST LLC’s right to receive payment of principal of the Intercompany Notes to the prior payment in full of all obligations under the Revolving Credit Facility but permit the payment of interest on the Intercompany Notes in the ordinary course of business so long as no event of default exists, or would occur as a result of any such payment, under the Revolving Credit Facility and there is availability of at least $20.0 million under the Revolving Credit Facility. In addition, under these subordination agreements GST LLC is prohibited from exercising any rights and remedies it may have against Coltec and Stemco LP with respect to the Intercompany Notes except for purposes of filing a claim during an insolvency proceeding. It will not be a default under the Revolving Credit Facility and the notes offered hereby if the Intercompany Notes are not repaid on their stated maturity date, January 1, 2017, to the extent such payment is prohibited by these subordination agreements. See “Other Indebtedness—Intercompany Notes.” |
| (3) | As of June 30, 2014, Coltec Finance Company Ltd., a wholly-owned foreign subsidiary of Coltec, had aggregate, short-term borrowings of $22.8 million from GST LLC’s subsidiaries in Mexico and Australia. These unsecured obligations were denominated in the currency of the lending party. |
| (4) | As described more fully in “Description of the Notes—Defaults,” it will be an event of default under the indenture that will govern the notes if, following notice and the expiration of a cure period, any of GST or their respective subsidiaries fails to execute and deliver a supplemental indenture pursuant to which it guarantees payment of the notes within ten Business Days (as defined) after it guarantees or becomes a borrower under the Revolving Credit Agreement or guarantees any other of our Capital Markets Indebtedness (as defined). It is an event of default under the Credit Facility Amendment governing the Revolving Credit Facility if the domestic entities of GST fail to become guarantors within 60 days after reconsolidation with EnPro Industries, Inc. for financial reporting purposes following GST’s exit from bankruptcy. See “Description of Other Indebtedness—Revolving Credit Facility—Events of Default.” |
Corporate Information
We were incorporated under the laws of the State of North Carolina on January 11, 2002, as a wholly owned subsidiary of Goodrich Corporation. The incorporation was in anticipation of Goodrich’s announced distribution of its Engineered Industrial Products segment to existing Goodrich shareholders. The distribution took place on May 31, 2002. Our principal executive offices are located at 5605 Carnegie Boulevard, Suite 500, Charlotte, North Carolina 28209 and our telephone number is (704) 731-1500. Our common stock is listed on the New York Stock Exchange under the symbol “NPO.” We maintain an Internet website at www.enproindustries.com; however, the information on our website is not part of this offering memorandum, and you should rely only on the information contained in this offering memorandum and in the documents incorporated by reference into this offering memorandum when making a decision whether to invest in the notes.
15
Summary Historical Consolidated Financial Information and Other Data
The following summary historical consolidated financial information and other data as of December 31, 2013 and 2012 and for the years ended December 31, 2013, 2012 and 2011 have been derived from and should be read together with the Audited Consolidated Financial Statements and related notes included elsewhere in this offering memorandum. The following summary historical consolidated financial information and other data as of December 31, 2011 have been derived from our audited consolidated financial statements which are not included or incorporated by reference in this offering memorandum. The following summary historical consolidated financial information and other data for the six months ended June 30, 2014 and 2013 and as of June 30, 2014 have been derived from and should be read together with the Unaudited Consolidated Financial Statements and related notes included elsewhere in this offering memorandum. The following summary historical consolidated financial information and other data as of June 30, 2013 have been derived from our unaudited consolidated financial statements as of June 30, 2013 which are not included or incorporated by reference in this offering memorandum. The following summary historical consolidated financial information and other data presented for the twelve months ended June 30, 2014 has been derived by taking the amounts from the historical Audited Consolidated Financial Statements for the year ended December 31, 2013, less the amounts from the historical Unaudited Consolidated Financial Statements for the six months ended June 30, 2013, plus the amounts from the historical Unaudited Consolidated Financial Statements for the six months ended June 30, 2014.
Our summary historical consolidated financial information and other data are not necessarily indicative of our future performance. The financial information and data provided in this table are only summary, do not provide all of the information or data contained in our financial statements, and should also be read in conjunction with the sections of this offering memorandum entitled “Use of Proceeds,” “Capitalization” and “Management’s Discussion and Analysis of Financial Condition and Results of Operations.”
16
| Year Ended December 31, |
Six Months Ended June 30, (unaudited) |
Twelve June 30, |
||||||||||||||||||||||
| 2011(1) |
2012(2) |
2013 |
2013 |
2014 |
2014 |
|||||||||||||||||||
| (dollars in millions) | ||||||||||||||||||||||||
| Statement of Operations Data: |
||||||||||||||||||||||||
| Net Sales |
$ | 1,105.5 | $ | 1,184.2 | $ | 1,144.2 | $ | 592.7 | $ | 600.3 | $ | 1,151.8 | ||||||||||||
| Cost of sales |
726.5 | 784.1 | 762.9 | 389.3 | 395.7 | 769.3 | ||||||||||||||||||
|
|
|
|
|
|
|
|
|
|
|
|
|
|||||||||||||
| Gross profit |
379.0 | 400.1 | 381.3 | 203.4 | 204.6 | 382.5 | ||||||||||||||||||
|
|
|
|
|
|
|
|
|
|
|
|
|
|||||||||||||
| Operating expenses: |
||||||||||||||||||||||||
| Selling, general and administrative |
275.0 | 286.1 | 285.8 | 148.2 | 162.4 | 300.0 | ||||||||||||||||||
| Other |
2.3 | 6.5 | 9.1 | 3.7 | 0.7 | 6.1 | ||||||||||||||||||
|
|
|
|
|
|
|
|
|
|
|
|
|
|||||||||||||
| Total operating expenses |
277.3 | 292.6 | 294.9 | 151.9 | 163.1 | 306.1 | ||||||||||||||||||
|
|
|
|
|
|
|
|
|
|
|
|
|
|||||||||||||
| Operating income (loss) |
101.7 | 107.5 | 86.4 | 51.5 | 41.5 | 76.4 | ||||||||||||||||||
| Interest expense |
(40.8 | ) | (43.2 | ) | (45.1 | ) | (22.4 | ) | (21.5 | ) | (44.2 | ) | ||||||||||||
| Interest income |
1.2 | 0.4 | 0.8 | 0.4 | 0.5 | 0.9 | ||||||||||||||||||
| Other income (expense) |
2.9 | (1.2 | ) | (6.3 | ) | (6.3 | ) | (6.7 | ) | (6.7 | ) | |||||||||||||
|
|
|
|
|
|
|
|
|
|
|
|
|
|||||||||||||
| Income before income taxes |
65.0 | 63.5 | 35.8 | 23.2 | 13.8 | 26.4 | ||||||||||||||||||
| Income tax expense |
(20.8 | ) | (22.5 | ) | (8.4 | ) | (6.6 | ) | (4.2 | ) | (6.0 | ) | ||||||||||||
|
|
|
|
|
|
|
|
|
|
|
|
|
|||||||||||||
| Net income |
$ | 44.2 | $ | 41.0 | $ | 27.4 | $ | 16.6 | $ | 9.6 | $ | 20.4 | ||||||||||||
|
|
|
|
|
|
|
|
|
|
|
|
|
|||||||||||||
| Balance Sheet Data: |
||||||||||||||||||||||||
| Cash and cash equivalents |
$ | 30.7 | $ | 53.9 | $ | 64.4 | $ | 58.2 | $ | 64.9 | $ | 64.9 | ||||||||||||
| Total current assets |
$ | 382.7 | $ | 394.2 | $ | 447.6 | $ | 427.7 | $ | 523.9 | $ | 523.9 | ||||||||||||
| Property, plant and equipment |
$ | 164.2 | $ | 185.5 | $ | 187.5 | $ | 185.7 | $ | 185.6 | $ | 185.6 | ||||||||||||
| Total assets |
$ | 1,252.1 | $ | 1,370.9 | $ | 1,392.7 | $ | 1,400.8 | $ | 1,466.2 | $ | 1,466.2 | ||||||||||||
| Total current liabilities |
$ | 225.1 | $ | 227.5 | $ | 417.5 | $ | 381.9 | $ | 333.6 | $ | 333.6 | ||||||||||||
| Long-term debt (including current portion) |
$ | 150.2 | $ | 185.3 | $ | 165.1 | $ | 201.3 | $ | 119.2 | $ | 119.2 | ||||||||||||
| Notes payable to GST (including current portion) |
$ | 237.4 | $ | 248.1 | $ | 259.3 | $ | 259.3 | $ | 271.0 | $ | 271.0 | ||||||||||||
| Total shareholders’ equity |
$ | 494.1 | $ | 547.1 | $ | 597.5 | $ | 536.6 | $ | 716.8 | $ | 716.8 | ||||||||||||
| Other Financial Data: |
||||||||||||||||||||||||
| EBITDA(3) |
$ | 153.0 | $ | 161.8 | $ | 136.7 | $ | 73.6 | $ | 63.7 | $ | 126.8 | ||||||||||||
| Adjusted EBITDA(3) |
$ | 155.2 | $ | 172.2 | $ | 154.8 | $ | 84.6 | $ | 71.5 | $ | 141.7 | ||||||||||||
| Ratio of total net debt, as adjusted, to Adjusted EBITDA(3)(4) |
3.2x | |||||||||||||||||||||||
| Percentage of total debt to total capitalization(5) |
19.2 | % | ||||||||||||||||||||||
| Net cash provided by operating activities |
$ | 81.4 | $ | 118.2 | $ | 69.9 | $ | 5.5 | $ | (13.8 | ) | $ | 50.6 | |||||||||||
| Net cash used in investing activities |
$ | (260.7 | ) | $ | (125.6 | ) | $ | (41.5 | ) | $ | (22.1 | ) | $ | (23.2 | ) | $ | (42.6 | ) | ||||||
| Net cash provided by (used in) financing activities |
$ | (9.4 | ) | $ | 29.5 | $ | (19.5 | ) | $ | 23.0 | $ | 36.4 | $ | (6.1 | ) | |||||||||
| Capital expenditures |
$ | 34.3 | $ | 40.9 | $ | 39.9 | $ | 20.3 | $ | 19.0 | $ | 38.6 | ||||||||||||
| Segment Data: |
||||||||||||||||||||||||
| Sales |
||||||||||||||||||||||||
| Sealing Products |
$ | 534.9 | $ | 609.1 | $ | 622.9 | $ | 312.5 | $ | 330.4 | $ | 640.8 | ||||||||||||
| Engineered Products |
386.7 | 363.0 | 356.4 | 186.9 | 187.3 | 356.8 | ||||||||||||||||||
| Power Systems(6) |
185.8 | 214.6 | 167.6 | 94.4 | 84.1 | 157.3 | ||||||||||||||||||
| Segment Profit |
||||||||||||||||||||||||
| Sealing Products |
81.2 | 88.8 | 97.1 | 49.0 | 39.9 | 88.0 | ||||||||||||||||||
| Engineered Products |
29.2 | 20.5 | 17.6 | 14.4 | 17.6 | 20.8 | ||||||||||||||||||
| Power Systems(6) |
30.6 | 39.2 | 14.0 | 11.2 | 6.7 | 9.5 | ||||||||||||||||||
| Segment EBITDA(3) |
||||||||||||||||||||||||
| Sealing Products |
104.1 | 119.1 | 127.5 | 64.3 | 55.3 | 118.5 | ||||||||||||||||||
| Engineered Products |
50.7 | 42.3 | 40.0 | 25.6 | 29.1 | 43.5 | ||||||||||||||||||
| Power Systems(6) |
34.2 | 42.3 | 17.6 | 13.0 | 8.5 | 13.1 | ||||||||||||||||||
17
| (1) | In August 2011, we acquired certain assets and assumed certain liabilities of PI Bearing Technologies, a privately held manufacturer of bearing blocks and other bearing products used in fluid power applications, and a distributor of high performance plain bearing products used in industrial applications. The business is part of our Engineered Products segment. In July 2011, we acquired Tara Technologies Corporation (“Tara”), a privately-held company that offers highly engineered products and solutions to the semiconductor, aerospace, energy and medical markets. The business is part of our Sealing Products segment. In February 2011, we acquired the Mid Western group of companies, a privately-owned business primarily serving the oil and gas drilling, production and processing industries of western Canada. Mid Western services and rebuilds reciprocating compressors, designs and installs lubrication systems, and services and repairs a variety of other equipment used in the oil and gas industry. The business is part of our Engineered Products segment. In February 2011, we acquired the business of Pipeline Seal and Insulator, Inc. and its affiliates (“PSI”), a privately-owned group of companies that manufacture products for the safe flow of fluids through pipeline transmission and distribution systems worldwide. The PSI business primarily serves the global oil and gas industry and water and wastewater infrastructure markets. The business’s products include flange sealing and flange isolation products; pipeline casing spacers/isolators; casing end seals; the original Link-Seal® modular sealing system for sealing pipeline penetrations into walls, floors, ceilings and bulkheads; hole forming products; manhole infiltration sealing systems; and safety-related signage for pipelines. The business is part of our Sealing Products segment. In January 2011, we acquired certain assets and assumed certain liabilities of Rome Tool & Die, Inc., a leading supplier of steel brake shoes to the North American heavy-duty truck market. The business is part of our Sealing Products segment. We paid for the acquisitions completed during 2011 with $228.2 million in cash, which included $99.2 million for the purchase of PSI. Additionally, there were approximately $2.2 million of acquisition-related costs recorded during 2011. We allocated the purchase prices of the acquired businesses to the assets acquired and liabilities assumed based on their estimated fair values. The excess of the purchase prices over the identifiable assets acquired less the liabilities assumed was reflected as goodwill. |
| (2) | In April 2012, we acquired Motorwheel Commercial Vehicle Systems, Inc. (“Motorwheel”). Motorwheel is a leading U.S. manufacturer of lightweight brake drums for heavy-duty trucks and other commercial vehicles. Motorwheel also sells wheel-end component assemblies for the heavy-duty market, sells fasteners for wheel-end applications and provides related services to its customers, including product development, testing and certification. The business is managed as part of the Stemco operations in the Sealing Products segment. We paid for the Motorwheel acquisition with approximately $85 million of cash, which was funded by additional borrowings from our revolving credit facility. We allocated the purchase price of the business to the assets acquired and liabilities assumed based on their estimated fair values. The excess of the purchase price over the identifiable assets acquired less the liabilities assumed was reflected as goodwill. |
| (3) | We define “EBITDA” for the periods presented above as net income before interest expense (net of interest income), income tax expense, and depreciation and amortization expense. EBITDA does not represent, and should not be considered as, an alternative to net income or cash flows from operating activities, each as determined in accordance with GAAP. We define “Adjusted EBITDA” for the periods presented above as net income before interest expense (net of interest income), income tax expense, depreciation and amortization expense, restructuring costs, environmental reserve adjustment, loss on debt exchange and other selected items. We define Segment EBITDA as segment profit before depreciation and amortization expense. We have presented EBITDA, Adjusted EBITDA and Segment EBITDA in this offering memorandum because we believe they are useful financial measurements for assessing operating performance as they provide investors with additional bases to evaluate our performance. In addition, we use these metrics to further our understanding of our historical and prospective consolidated operating performance and, with respect to Segment EBITDA, the operating performance of our segments before expenses incurred by our corporate activities. In addition, we use Adjusted EBITDA to evaluate the ordinary course of our operations, before certain selected items, even though those items may be recurring, because we believe to effectively compare our core operating performance from period to period on a historical and prospective basis, this metric should exclude items relating to restructuring costs, environmental reserve adjustment, loss on debt exchange and other selected items incurred outside the ordinary course of our operations. Other companies may calculate EBITDA, Adjusted EBITDA and Segment EBITDA differently than we do. EBITDA, Adjusted EBITDA and Segment EBITDA are not measures of performance under GAAP and should not be considered as a substitute for our net income, or the segment profit of our reporting segments, respectively, prepared in accordance with GAAP. Each of EBITDA, Adjusted EBITDA and Segment EBITDA has limitations as an analytical tool, and you should not consider it in isolation or as a substitute for analysis of our results as reported under GAAP. Some of these limitations are: EBITDA, Adjusted EBITDA and Segment EBITDA do not reflect our cash expenditures, |
18
| or future requirements, for capital expenditures or contractual commitments; EBITDA, Adjusted EBITDA and Segment EBITDA do not reflect interest expense or the cash requirements necessary to service interest or principal payments on our debt; EBITDA, Adjusted EBITDA and Segment EBITDA do not reflect income tax expense or the cash requirements necessary to pay for income tax obligations; and although depreciation and amortization are non-cash charges, the assets being depreciated and amortized will often have to be replaced in the future, and EBITDA, Adjusted EBITDA and Segment EBITDA do not reflect any cash requirements for such replacements. In addition, in evaluating Adjusted EBITDA you should be aware that in the future we may incur expenses that are the same as or similar to some of the adjustments in this presentation. Our presentation of Adjusted EBITDA should not be construed as an inference that our future results will not be unaffected by unusual or non-recurring items. |
The following table sets forth the reconciliation of net income to EBITDA and Adjusted EBITDA for the periods indicated:
| Year Ended December 31, |
Six Months Ended June 30, (unaudited) |
Twelve June 30, (unaudited) |
||||||||||||||||||||||
| 2011 |
2012 |
2013 |
2013 |
2014 |
2014 |
|||||||||||||||||||
| (in millions) | ||||||||||||||||||||||||
| Net income |
$ | 44.2 | $ | 41.0 | $ | 27.4 | $ | 16.6 | $ | 9.6 | $ | 20.4 | ||||||||||||
| Interest expense |
40.8 | 43.2 | 45.1 | 22.4 | 21.5 | 44.2 | ||||||||||||||||||
| Interest income |
(1.2 | ) | (0.4 | ) | (0.8 | ) | (0.4 | ) | (0.5 | ) | (0.9 | ) | ||||||||||||
| Income tax expense |
20.8 | 22.5 | 8.4 | 6.6 | 4.2 | 6.0 | ||||||||||||||||||
| Depreciation |
25.3 | 28.8 | 29.6 | 14.8 | 14.9 | 29.7 | ||||||||||||||||||
| Amortization |
23.1 | 26.7 | 27.0 | 13.6 | 14.0 | 27.4 | ||||||||||||||||||
|
|
|
|
|
|
|
|
|
|
|
|
|
|||||||||||||
| EBITDA |
153.0 | 161.8 | 136.7 | 73.6 | 63.7 | 126.8 | ||||||||||||||||||
| Restructuring costs |
1.4 | 5.0 | 6.7 | 2.9 | 0.6 | 4.4 | ||||||||||||||||||
| Environmental reserve adjustment |
— | 1.2 | 6.3 | 6.3 | 0.7 | 0.7 | ||||||||||||||||||
| Loss on debt exchange |
— | — | — | — | 6.0 | 6.0 | ||||||||||||||||||
| Other(a) |
0.8 | 4.2 | 5.1 | 1.8 | 0.5 | 3.8 | ||||||||||||||||||
|
|
|
|
|
|
|
|
|
|
|
|
|
|||||||||||||
| Adjusted EBITDA |
$ | 155.2 | $ | 172.2 | $ | 154.8 | $ | 84.6 | $ | 71.5 | $ | 141.7 | ||||||||||||
|
|
|
|
|
|
|
|
|
|
|
|
|
|||||||||||||
| (a) | “Other” represents intercompany managements fees and legal fees related to the GST bankruptcy. For the years ended December 31, 2013, 2012 and 2011 and the twelve months ended June 30, 2014, it includes $0.4 million, $1.2 million, $1.9 million and $0.4 million, respectively, of inventory adjustments primarily related to acquisition date fair value adjustments. For the year ended December 31, 2011, “Other” includes an adjustment to exclude a $2.9 million gain for a guaranteed investment contract, which is described in Note 19 to our Audited Consolidated Financial Statements included elsewhere in this offering memorandum. |
19
The following table sets forth the reconciliation of segment profit of each of our reporting segments to Segment EBITDA for the periods indicated:
| Year Ended December 31, |
Six Months Ended June 30, (unaudited) |
Twelve June 30, |
||||||||||||||||||||||
| 2011 |
2012 |
2013 |
2013 |
2014 |
2014 |
|||||||||||||||||||
| (in millions) | ||||||||||||||||||||||||
| Sealing Products |
||||||||||||||||||||||||
| Segment profit |
$ | 81.2 | $ | 88.8 | $ | 97.1 | $ | 49.0 | $ | 39.9 | $ | 88.0 | ||||||||||||
| Depreciation and amortization expense |
22.9 | 30.3 | 30.4 | 15.3 | 15.4 | 30.5 | ||||||||||||||||||
|
|
|
|
|
|
|
|
|
|
|
|
|
|||||||||||||
| Segment EBITDA |
$ | 104.1 | $ | 119.1 | $ | 127.5 | $ | 64.3 | $ | 55.3 | $ | 118.5 | ||||||||||||
|
|
|
|
|
|
|
|
|
|
|
|
|
|||||||||||||
| Engineered Products |
||||||||||||||||||||||||
| Segment profit |
$ | 29.2 | $ | 20.5 | $ | 17.6 | $ | 14.4 | $ | 17.6 | $ | 20.8 | ||||||||||||
| Depreciation and amortization expense |
21.5 | 21.8 | 22.4 | 11.2 | 11.5 | 22.7 | ||||||||||||||||||
|
|
|
|
|
|
|
|
|
|
|
|
|
|||||||||||||
| Segment EBITDA |
$ | 50.7 | $ | 42.3 | $ | 40.0 | $ | 25.6 | $ | 29.1 | $ | 43.5 | ||||||||||||
|
|
|
|
|
|
|
|
|
|
|
|
|
|||||||||||||
| Power Systems |
||||||||||||||||||||||||
| Segment profit |
$ | 30.6 | $ | 39.2 | $ | 14.0 | $ | 11.2 | $ | 6.7 | $ | 9.5 | ||||||||||||
| Depreciation and amortization expense |
3.6 | 3.1 | 3.6 | 1.8 | 1.8 | 3.6 | ||||||||||||||||||
|
|
|
|
|
|
|
|
|
|
|
|
|
|||||||||||||
| Segment EBITDA |
$ | 34.2 | $ | 42.3 | $ | 17.6 | $ | 13.0 | $ | 8.5 | $ | 13.1 | ||||||||||||
|
|
|
|
|
|
|
|
|
|
|
|
|
|||||||||||||
| (4) | Ratio of total net debt, as adjusted, to Adjusted EBITDA is calculated as the ratio of our total debt less cash and cash equivalents at June 30, 2014, in each case as adjusted to give effect to the Refinancing Transactions, to Adjusted EBITDA for the twelve months ended June 30, 2014. See “Capitalization” for a presentation of our total debt and cash and cash equivalents as adjusted to give effect to the Refinancing Transactions. |
| (5) | Ratio of total debt to total capitalization is our total debt at June 30, 2014 divided by the product of the number of shares of our common stock outstanding on June 30, 2014 (less treasury shares) multiplied by the closing price per share of our common on the New York Stock Exchange on June 30, 2014 ($73.16). |
| (6) | Effective the first quarter of 2014, we changed the name of what had previously been called the Engine Products and Services segment to the Power Systems segment to more accurately reflect that the segment’s products are the principal components of systems that generate electrical power and other types of energy. There was no change to the composition of this segment and there is no impact on the sales, segment profit or Segment EBITDA of the previously reported segment. |
20
The table below sets forth, as of June 30, 2014, (i) our actual historical cash and capitalization, (ii) our cash and capitalization as adjusted to give effect to the Refinancing Transactions other than the offering of notes and the application of the net proceeds therefrom as contemplated hereby, as if such events occurred on June 30, 2014 and (iii) our cash and cash capitalization as further adjusted to give effect to the Refinancing Transactions, including the offering of the notes and the application of the net proceeds therefrom as contemplated hereby, as if such events occurred on June 30, 2014. See “Use of Proceeds” for additional detail on the use of net proceeds from the issuance of the notes.
You should read this table along with our audited and unaudited consolidated financial statements and related notes and other financial information included in this offering memorandum.
| As of June 30, 2014 |
||||||||||||
| Actual |
As |
As Further Adjusted(2) |
||||||||||
| (unaudited) | ||||||||||||
| (in millions) | ||||||||||||
| Cash and cash equivalents |
$ | 64.9 | $ | 64.9 | $ | 136.8 | ||||||
|
|
|
|
|
|
|
|||||||
| Short-term debt: |
||||||||||||
| Short-term borrowings from GST |
$ | 22.8 | $ | 22.8 | $ | 22.8 | ||||||
| 3.9375% Convertible Senior Debentures due 2015 |
74.8 | (3) | — | — | ||||||||
| Notes payable to GST(4) |
11.7 | 11.7 | 11.7 | |||||||||
| Long-term debt: |
||||||||||||
| Senior secured revolving credit facility |
$ | 48.7 | 222.1 | — | (5) | |||||||
| Notes payable to GST(4) |
259.3 | 259.3 | 259.3 | |||||||||
| Senior Notes due 2022 offered hereby |
— | — | 300.0 | |||||||||
| Other long-term debt |
0.8 | 0.8 | 0.8 | |||||||||
|
|
|
|
|
|
|
|||||||
| Total debt |
418.1 | 516.7 | 594.6 | |||||||||
| Total shareholders’ equity |
716.8 | 613.7 | (6) | 613.7 | (6) | |||||||
|
|
|
|
|
|
|
|||||||
| Total capitalization |
$ | 1,134.9 | $ | 1,130.4 | $ | 1,208.3 | ||||||
|
|
|
|
|
|
|
|||||||
| (1) | The “As Adjusted” column gives effect to the effectiveness of the Credit Facility Amendment, the purchase of all of our outstanding Convertible Debentures in the Tender Offer at a price per $1,000 principal amount of the Convertible Debentures equal to the maximum $2,301.89 purchase price, plus payment of accrued and unpaid interest, for an aggregate amount of $173.4 million (assuming a payment date of September 15, 2014), and borrowings under the Revolving Credit Facility to fully fund such purchase of the Convertible Debentures. In the event that less than all of the Convertible Debentures are purchased in the Tender Offer, the “As Adjusted” amount of Convertible Debentures would be the aggregate principal amount of the Convertible Debentures not purchased in the Tender Offer and the amount of cash and cash equivalents would be increased by $2,318.30 (which reflects accrued interest assuming a payment date of September 15, 2014) per $1,000 principal amount of the Convertible Debentures not purchased in the Tender Offer. |
| (2) | The “As Further Adjusted” column gives effect to the Refinancing Transactions after the payment of the initial purchasers’ commissions and estimated fees and expenses payable by us and reflects the purchase of all of our outstanding Convertible Debentures in the Tender Offer at a price per $1,000 principal amount of the Convertible Debentures equal to the maximum $2,301.89 purchase price, plus payment of accrued and unpaid interest, for an aggregate amount $173.4 million (assuming a payment date of September 15, 2014). In the event that less than all of the Convertible Debentures are purchased in the Tender Offer, the “As Further Adjusted” amount of Convertible Debentures would be the aggregate principal amount of the Convertible Debentures not purchased in the Tender Offer and the amount of cash and cash equivalents |
21
| would be increased by $2,318.30 (which reflects accrued interest assuming a payment date of September 15, 2014) per $1,000 principal amount of the Convertible Debentures not purchased in the Tender Offer. |
| (3) | The amount shown is equal to the $69.7 million debt associated with the liability component of the Convertible Debentures plus the $5.1 million unamortized debt discount associated with the equity component of the Convertible Debentures. Because the Convertible Debentures were convertible at June 30, 2014, the amount is reflected in current maturities as of June 30, 2014. |
| (4) | Includes indebtedness under an a promissory note made by Coltec payable to GST LLC with an aggregate principal balance of $87.5 million at June 30, 2014 and under a promissory note made by Stemco LP , an indirect subsidiary of Coltec, payable to GST LLC with an aggregate principal balance of $183.5 million at June 30, 2014. The Coltec Note is secured by Coltec’s pledge of certain of its equity ownership in specified U.S. subsidiaries. The Stemco Note is guaranteed by Coltec and secured by Coltec’s pledge of its interest in Stemco LP and Stemco Holdings, Inc. The principal amount of each of these Intercompany Notes is subject to increase over time as a portion of the interest on these notes is added to the principal amount of the Intercompany Notes as payment-in-kind (PIK) interest. The Intercompany Notes provide that if GST LLC is unable to pay ordinary course operating expenses, under certain conditions, GST LLC can require Coltec and Stemco to pay the accrued and unpaid PIK interest in cash to the extent necessary to meet such ordinary course operating expenses, subject to certain caps. The PIK interest is payable on January 31 of each year. Accordingly, such amount of accrued and unpaid PIK interest on the Intercompany Notes is reflected as short-term debt. The Intercompany Notes are subordinated to any obligations under the Revolving Credit Facility, pursuant to existing subordination agreements which subordinate GST LLC’s right to receive payment of principal of the Intercompany Notes to the prior payment in full of all obligations under the Revolving Credit Facility but permit the payment of interest on the Intercompany Notes in the ordinary course of business so long as no event of default exists, or would occur as a result of any such payment, under the Revolving Credit Facility and there is availability of at least $20.0 million under the Revolving Credit Facility. In addition, under these subordination agreements GST LLC is prohibited from exercising any rights and remedies it may have against Coltec and Stemco LP with respect to the Intercompany Notes except for purposes of filing a claim during an insolvency proceeding. It will not be an event of default under the Revolving Credit Facility and the notes offered hereby if, as required by the subordination agreements, the Intercompany Notes are not repaid on their stated maturity date, January 1, 2017. See “Other Indebtedness—Intercompany Notes.” |
| (5) | As of June 30, 2014, after giving effect to the Refinancing Transactions, an additional $300.0 million, representing the full amount of the Revolving Credit Facility, less $5.7 million reserved for outstanding letters of credit would have been available for borrowing under the Revolving Credit Facility. For a description of the material terms of the Revolving Credit Facility, see “Description of Other Indebtedness—Revolving Credit Facility.” |
| (6) | The premium included in the assumed purchase price for all of the Convertible Debentures in the Tender Offer of $3.9 million would be charged to expense and the remaining excess of the purchase price over the premium and the debt component of the Convertible Debentures, or $97.5 million, would reduce additional paid in capital included in shareholders’ equity. Unamortized debt issuance costs of $0.6 million and the excess of the amount paid for the debt component over the carrying value of such Convertible Debentures would be charged to expense. Shareholders’ equity has not been adjusted for fees paid in connection with the Credit Facility Amendment as such fees are capitalized and will reduce shareholders’ equity as the fees are expensed over the life of the Revolving Credit Facility. |
22
MANAGEMENT’S DISCUSSION AND ANALYSIS OF FINANCIAL CONDITION AND RESULTS OF OPERATIONS
The following is management’s discussion and analysis of certain significant factors that have affected our consolidated financial condition and operating results during the periods included in the accompanying audited Consolidated Financial Statements and the related notes. You should read the following discussion in conjunction with our audited Consolidated Financial Statements and the related notes, included elsewhere in this offering memorandum.
Forward-Looking Statements
This offering memorandum contains certain statements that are “forward-looking statements” as that term is defined under the Private Securities Litigation Reform Act of 1995 (the “Act”) and releases issued by the Securities and Exchange Commission. The words “may,” “hope,” “will,” “should,” “could,” “expect,” “plan,” “anticipate,” “intend,” “believe,” “estimate,” “predict,” “potential,” “continue,” and other expressions which are predictions of or indicate future events and trends and which do not relate to historical matters identify forward-looking statements. We believe that it is important to communicate our future expectations to our shareholders, and we therefore make forward-looking statements in reliance upon the safe harbor provisions of the Act. However, there may be events in the future that we are not able to accurately predict or control, and our actual results may differ materially from the expectations we describe in our forward-looking statements. Forward-looking statements involve known and unknown risks, uncertainties and other factors, which may cause our actual results, performance or achievements to differ materially from anticipated future results, performance or achievements expressed or implied by such forward-looking statements. We advise you to read further about certain of these and other risk factors set forth in Item 1A of this annual report, entitled “Risk Factors.” We undertake no obligation to publicly update or revise any forward-looking statement, either as a result of new information, future events or otherwise. Whenever you read or hear any subsequent written or oral forward-looking statements attributed to us or any person acting on our behalf, you should keep in mind the cautionary statements contained or referred to in this section.
Overview and Outlook
Overview
We design, develop, manufacture, service and market proprietary engineered industrial products. We have 60 primary manufacturing facilities located in 13 countries, including the United States.
We manage our business as three segments: a Sealing Products segment, an Engineered Products segment, and a Power Systems segment.
Our Sealing Products segment designs, manufactures and sells sealing products, including: metallic, non-metallic and composite material gaskets; dynamic seals; compression packing; resilient metal seals; elastomeric seals; hydraulic components; expansion joints; heavy-duty truck wheel-end component systems, including brake products; flange sealing and isolation products; pipeline casing spacers/isolators; casing end seals; modular sealing systems for sealing pipeline penetrations; hole forming products; manhole infiltration sealing systems; safety-related signage for pipelines; bellows and bellows assemblies; pedestals for semiconductor manufacturing; PTFE products; conveyor belting; and sheeted rubber products. These products are used in a variety of industries, including chemical and petrochemical processing, petroleum extraction and refining, pulp and paper processing, heavy-duty trucking, power generation, food and pharmaceutical processing, primary metal manufacturing, mining, water and waste treatment, aerospace, medical, filtration and semiconductor fabrication. In many of these industries, performance and durability are vital for safety and environmental protection. Many of our products are used in applications that are highly demanding, e.g., where extreme temperatures, extreme pressures, corrosive environments, strict tolerances, and/or worn equipment make product performance difficult.
23
Our Engineered Products segment includes operations that design, manufacture and sell self-lubricating, non-rolling, metal-polymer, solid polymer and filament wound bearing products, aluminum blocks for hydraulic applications and precision engineered components and lubrication systems for reciprocating compressors. These products are used in a wide range of applications, including the automotive, pharmaceutical, pulp and paper, natural gas, health, power generation, machine tools, air treatment, refining, petrochemical and general industrial markets.
Our Power Systems segment designs, manufactures, sells and services heavy-duty, medium-speed diesel, natural gas and dual fuel reciprocating engines. The United States government and the general markets for marine propulsion, power generation, and pump and compressor applications use these products and services. Effective the first quarter of 2014, we changed the name of what had previously been called the Engine Products and Services segment to the Power Systems segment to more accurately reflect that the segment’s products are the principal components of systems that generate electrical power and other types of energy. There was no change to the composition of this segment and there is no impact on the sales, segment profit, assets or cash flows of the previously reported segment.
The historical business operations of certain subsidiaries of our subsidiary, Coltec, principally GST LLC and Anchor, have resulted in a substantial volume of asbestos litigation in which plaintiffs have alleged personal injury or death as a result of exposure to asbestos fibers. Information about GST LLC’s asbestos litigation is contained in this Management’s Discussion and Analysis of Financial Condition and Results of Operations in the “Asbestos” subsection of the “Contingencies” section.
On June 5, 2010, GST LLC, Anchor and Garrison filed voluntary petitions for reorganization under Chapter 11 of the United States Bankruptcy Code in the U.S. Bankruptcy Court for the Western District of North Carolina in Charlotte. GST LLC, Anchor and Garrison are sometimes referred to collectively as “GST” in this offering memorandum. The filings were the initial step in an asbestos claims resolution process. GST LLC is one of the businesses in our broader Garlock group. GST LLC and its subsidiaries operate five significant manufacturing facilities, including operations in Palmyra, New York and Houston, Texas. The filings did not include EnPro Industries, Inc., or any other EnPro Industries, Inc. operating subsidiary.
GST LLC now operates in the ordinary course under court protection from asbestos claims. All pending litigation against GST is stayed during the process. We address our actions to permanently resolve GST LLC’s asbestos litigation in this Management’s Discussion and Analysis of Financial Condition and Results of Operations in the “Garlock Sealing Technologies LLC and Garrison Litigation Management Group, Ltd.” section.
The financial results of GST and subsidiaries are included in our consolidated results through June 4, 2010, the day prior to the Petition Date. However, U.S. generally accepted accounting principles require an entity that files for protection under the U.S. Bankruptcy Code, whether solvent or insolvent, whose financial statements were previously consolidated with those of its parent, as GST’s and its subsidiaries’ were with ours, generally must be prospectively deconsolidated from the parent and the investment accounted for using the cost method. At deconsolidation, our investment was recorded at its estimated fair value as of June 4, 2010. The cost method requires us to present our ownership interests in the net assets of GST at the Petition Date as an investment and not recognize any income or loss from GST and subsidiaries in our results of operations during the reorganization period. Our investment of $236.9 million as of June 30, 2014 and December 31, 2013 and 2012, was subject to periodic reviews for impairment. When GST emerges from the jurisdiction of the Bankruptcy Court, the subsequent accounting will be determined based upon the applicable facts and circumstances at such time, including the terms of any plan of reorganization. See Note 18 to the Audited Consolidated Financial Statements and Note 15 to the Unaudited Consolidated Financial Statements included elsewhere in this offering memorandum for condensed financial information of GST and subsidiaries.
During 2013, 2012, and 2011, we completed a number of acquisitions and a disposition of a business. Please refer to the footnotes to the table included in “Selected Historical Consolidated Financial Information” for additional discussion regarding these transactions.
24
In March 2014, we acquired the remaining interest of the Stemco Crewson LLC joint venture. We now own all of the ownership interests in Stemco Crewson LLC. The joint venture was formed in 2009 with joint venture partner Tramec, LLC to expand our brake product offering to include automatic brake adjusters. The purchase of the remaining interest in the joint venture will allow us to accelerate investment in new product development and commercial strategies focused on market share growth for these products. In March 2014, we acquired the business of Strong-Tight Co. Ltd., a manufacturer and seller of gaskets and industrial sealing products by acquiring certain assets and assuming certain liabilities of the business. This acquisition adds an established Asian marketing presence and manufacturing facilities from which we can serve the Asian market. Both of the acquired businesses are included in our Sealing Products segment. The total purchase price of these acquisitions was $5.6 million, of which $1.9 million was paid in March 2014, net of cash acquired, with the remainder to be paid in several installments later in 2014 and subsequent to 2014.
We completed our required annual impairment test of goodwill as of October 1, 2013. The estimated fair value of our CPI reporting unit, included in our Engineered Products segment, exceeded its book value by 24%, 10%, and 37% in 2013, 2012, and 2011, respectively. There is $54.2 million of goodwill allocated to CPI. The fair value of the CPI reporting unit was calculated using both discounted cash flow and market valuation approaches. The key assumptions used for the discounted cash flow approach include business projections, growth rates, and a discount rate of 10.3%. The discount rate we use is based on our weighted average cost of capital. For the market approach, we chose a group of 14 companies we believe are representative of our diversified industrial peers. We used a 70% weighting for the discounted cash flow valuation approach and a 30% weighting for the market valuation approach, reflecting our belief that the discounted cash flow valuation approach provides a better indicator of value since it reflects the specific cash flows anticipated to be generated in the future by the business. For sensitivity purposes, a 100-basis-point increase in the discount rate would result in this reporting unit exceeding its 2013 book value by 20%. Conversely, a 100-basis-point decrease in the discount rate would result in this reporting unit exceeding its 2013 book value by 29%.
The future cash flows modeled for CPI are dependent on certain cost saving restructuring initiatives and a customer-focused organizational realignment, both launched in 2012. Non-recurring restructuring expenses in 2013 and 2012 were $4.1 million and $2.3 million, respectively. In addition, approximately $7.0 million of labor and facilities cost was removed from our future cost structure. The customer-focused organizational realignment during 2012 and 2013 was critical to price and volume opportunities identified while developing the 2014 forecast. While there is uncertainty associated with the customer price and volume opportunities, only a portion of these opportunities were forecasted in the future cash flow model utilized for goodwill impairment testing.
Finally, we are dependent on the strength of our customers and their respective industries to achieve sales forecasted for 2014. Except for 2014, which is based on a detailed forecast, the remaining years in the cash flow model are based on the 2014 forecast, adjusted for assumed macro-economic forecasts for Industrial Production changes at each of our major geographic markets per the DuPont Economic outlook as of September 2013. Since our products serve a variety of industries, Industrial Production is a good indicator for demand changes for our products and services. The nominal growth rates for 2015 and beyond, are approximately 5%, 4%, and 12% for North America, Europe, and Asia, respectively.
Management believes that all assumptions used were reasonable based on historical operating results and expected future trends. However, if future operating results are unfavorable as compared with forecasts, the results of future goodwill impairment evaluations could be negatively affected.
We determined all other reporting units had fair values substantially in excess of carrying values and there were no subsequent indicators of impairment through December 31, 2013.
25
Outlook
We expect improving conditions in most of our markets for the balance of the year. Order activity has remained robust in semiconductor, aerospace and trucking markets, and has improved in some of the process industries served by our businesses. We expect second half revenues and segment profits in the Power Systems segment to increase over the first half of 2014 and the second half of 2013, primarily as a result of higher engine revenues and stronger aftermarket sales.
Our effective tax rate is directly impacted by the relative proportions of revenue and income before taxes in the jurisdictions in which we operate. Based on the expected mix of domestic and foreign earnings, we anticipate our annual effective tax rate for 2014 will be between 30% and 33%. Discrete tax events may cause our effective rate to fluctuate on a quarterly basis. Certain events, including, for example, acquisitions and other business changes, which are difficult to predict, may also cause our effective tax rate to fluctuate. The anticipated effective tax rate is higher than prior results primarily due to the expiration of certain US federal tax provisions that have not been renewed for 2014. These include the research and development credit, certain employment credits, and an exclusion for passive income earned by controlled foreign corporations. The absence of an exclusion for passive income earned between our affiliated foreign subsidiaries results in such income being taxed in the US as a dividend, in addition to being taxed in the local jurisdiction. If these tax incentives are renewed during the year, it could have a significant positive effect on tax expense in the period when renewed. We are subject to changing tax laws, regulations, and interpretations in multiple jurisdictions. Corporate tax reform continues to be a priority in the U.S. and other jurisdictions. Changes to the tax system in the U.S. could have significant effects, positive and negative, on our effective tax rate, and on our deferred tax assets and liabilities.
Our U.S. defined benefit plans continue to be underfunded. Based on currently available data, which is subject to change, we have estimated we will be required to contribute $15.3 million to our U.S. defined benefit pension plans in 2014, of which $10.2 million was contributed during the first six months of 2014. Additional significant contributions are likely to be required in 2015. Future contribution requirements depend on pension asset returns, pension valuation assumptions, plan design, and legislative actions. We estimate annual pension expense for the full year of 2014 will be $2.2 million, which would be $8.3 million less than in 2013. The expected decrease in pension expense is primarily due to a higher discount rate used in the actuarial computations, contributions made during 2013 and expected in 2014, and the strong performance of the pension assets. We continue to make regular pension contributions in excess of the minimum required amounts and expect to contribute a total of $20.4 million in 2014.
In connection with our growth strategy, we plan to evaluate additional acquisition opportunities in 2014. However, the effects of such acquisitions, if any, cannot be predicted and therefore are not reflected in this outlook.
We address our outlook regarding our actions to permanently resolve GST LLC’s asbestos litigation in “—Garlock Sealing Technologies LLC and Garrison Litigation Management Group, Ltd.” and “—Subsidiary Bankruptcy,” below.
26
Results of Operations
The following table does not include results for GST and its subsidiaries after the day preceding the Petition Date. See Note 18 to the Audited Consolidated Financial Statements and Note 15 to the Unaudited Consolidated Financial Statements included elsewhere in this offering memorandum for condensed financial information of GST and subsidiaries.
| Years Ended December 31, |
Six Months Ended June 30, |
|||||||||||||||||||
| 2011 |
2012 |
2013 |
2013 |
2014 |
||||||||||||||||
| (in millions) | ||||||||||||||||||||
| Sales |
||||||||||||||||||||
| Sealing Products |
$ | 534.9 | $ | 609.1 | $ | 622.9 | $ | 312.5 | $ | 330.4 | ||||||||||
| Engineered Products |
386.7 | 363.0 | 356.4 | 186.9 | 187.3 | |||||||||||||||
| Power Systems |
185.8 | 214.6 | 167.6 | 94.4 | 84.1 | |||||||||||||||
|
|
|
|
|
|
|
|
|
|
|
|||||||||||
| 1,107.4 | 1,186.7 | 1,146.9 | 593.8 | 601.8 | ||||||||||||||||
| Intersegment sales |
(1.9 | ) | (2.5 | ) | (2.7 | ) | (1.1 | ) | (1.5 | ) | ||||||||||
| Total sales |
$ | 1,105.5 | $ | 1,184.2 | $ | 1,144.2 | $ | 592.7 | $ | 600.3 | ||||||||||
|
|
|
|
|
|
|
|
|
|
|
|||||||||||
| Segment Profit |
||||||||||||||||||||
| Sealing Products |
$ | 81.2 | $ | 88.8 | $ | 97.1 | $ | 49.0 | $ | 39.9 | ||||||||||
| Engineered Products |
29.2 | 20.5 | 17.6 | 14.4 | 17.6 | |||||||||||||||
| Power Systems |
30.6 | 39.2 | 14.0 | 11.2 | 6.7 | |||||||||||||||
|
|
|
|
|
|
|
|
|
|
|
|||||||||||
| Total segment profit |
141.0 | 148.5 | 128.7 | 74.6 | 64.2 | |||||||||||||||
| Corporate expenses |
(32.6 | ) | (32.3 | ) | (33.3 | ) | (17.6 | ) | (20.8 | ) | ||||||||||
| Interest expense, net |
(39.6 | ) | (42.8 | ) | (44.3 | ) | (22.0 | ) | (21.0 | ) | ||||||||||
| Other expense, net |
(3.8 | ) | (9.9 | ) | (15.3 | ) | (11.8 | ) | (8.6 | ) | ||||||||||
|
|
|
|
|
|
|
|
|
|
|
|||||||||||
| Income before income taxes |
$ | 65.0 | $ | 63.5 | $ | 35.8 | $ | 23.2 | $ | 13.8 | ||||||||||
|
|
|
|
|
|
|
|
|
|
|
|||||||||||
Segment profit is total segment revenue reduced by operating, restructuring and other expenses identifiable with the segment. Corporate expenses include general corporate administrative costs. Expenses not directly attributable to the segments, corporate expenses, net interest expense, asbestos-related expenses, gains/losses related to the sale of assets, and income taxes are not included in the computation of segment profit. The accounting policies of the reportable segments are the same as those for EnPro.
Other expense, net in the table above contains all items included in other (operating) expense and other expense (non-operating) on our Consolidated Statements of Operations for six months ended June 30, 2013 and 2014 (included in the Unaudited Consolidated Financial Statements appearing elsewhere in this offering memorandum) with the exception of $2.9 million and $0.6 million, respectively, of restructuring costs and all items included in other (operating) expense and other expense (non-operating) on our Consolidated Statements of Operations for the years ended December 31, 2011, 2012 and 2013 (included in the Audited Consolidated Financial Statements appearing elsewhere in this offering memorandum) with the exception of $1.4 million, $5.0 million and $6.7 million, respectively, of restructuring costs. As noted previously, restructuring costs are considered to be a part of segment profit. Additionally, other expense, net in the table above for the six months ended June 30, 2013 and 2014 also includes $4.7 million and $1.8 million, respectively, of miscellaneous expenses that are either not associated with a particular segment or not considered part of administering the corporate headquarters. These expenses are included in selling, general and administrative expense on our Unaudited Consolidated Statements of Operations for six months ended June 30, 2013 and 2014 (included in the Unaudited Consolidated Financial Statements appearing elsewhere in this offering memorandum). Other expense, net in the table above for the years ended December 31, 2011, 2012 and 2013 also includes $5.8 million, $7.2 million and $6.6 million, respectively, of miscellaneous expenses that are either not associated with a particular segment or not considered part of administering the corporate headquarters. These expenses are
27
included in selling, general and administrative expense on our Consolidated Statements of Operations for the years ended December 31, 2011, 2012 and 2013 (included in the Audited Consolidated Financial Statements appearing elsewhere in this offering memorandum).
Six Months Ended June 30, 2014 Compared to Six Months Ended June 30, 2013
Sales of $600.3 million in the first six months of 2014 increased 1.3% from $592.7 million in the first six months of 2013. The following table summarizes the impact of acquisitions, foreign currency, and engine sales, by segment:
| Sales |
Percent Change First Six Months of 2014 vs. First Six Months of 2013 |
|||||||||||||||||||
| increase/(decrease) |
Acquisitions |
Foreign Currency |
Engine Sales |
Other |
Total |
|||||||||||||||
| EnPro Industries, Inc. |
0.3 | % | 1.1 | % | (0.5 | )% | 0.4 | % | 1.3 | % | ||||||||||
|
|
|
|
|
|
|
|
|
|
|
|||||||||||
| Sealing Products |
0.7 | % | 1.0 | % | n/a | 4.0 | % | 5.7 | % | |||||||||||
| Engineered Products |
— | % | 1.7 | % | n/a | (1.5 | )% | 0.2 | % | |||||||||||
| Power Systems |
— | % | — | % | (3.2 | )% | (7.7 | )% | (10.9 | )% | ||||||||||
Following are the key points regarding changes in sales for the six months ended June 30, 2014 compared to the same period in 2013:
| • | Favorable foreign currency exchange rate fluctuations in the first six months of 2014 as compared to the same period in 2013 |
| • | The acquisitions in the first quarter of 2014 included in the Sealing Products segment |
| • | Increased sales in the Sealing Products segment |
| • | Decreased engine sales in the Power Systems segment |
See below for additional discussion on segment sales and segment profits.
Corporate expenses for the first six months of 2014 were $3.2 million higher than the first six months of 2013. The increase was primarily driven by an increase in purchased services ($1.6 million), employee medical costs ($0.8 million), professional fees ($0.4 million), and director’s fees ($0.4 million), partially offset by lower employee incentive compensation ($1.0 million).
Interest expense, net for the first six months of 2014 was $1.0 million lower than the first six months of 2013, primarily due to a reduction in the aggregate principal of convertible debentures outstanding following the privately negotiated exchange transactions completed in March 2014 and June 2014 and lower average borrowings against the senior secured revolving credit facility partially offset by increased interest expense due to payment-in-kind interest being added to the note payable to GST principal balance.
Other expense, net for the first six months of 2014 was $3.2 million lower than the first six months of 2013, primarily due to lower environmental reserve adjustments recorded during the period ($5.6 million), decreased legal and other fees as activity related to GST’s asbestos liability estimation trial slowed ($1.2 million), and pension expense related to previously owned businesses ($1.2 million), partially offset by a loss on exchange of debt ($6.0 million).
Income tax expense during the first six months of 2014 was $4.2 million compared to $6.6 million in the comparable period of 2013, resulting in a 2014 year-to-date effective tax rate of 30.3%. During the first six months of 2013, our effective tax rate was 28.5%. The effective tax rate the first six months of 2013 reflected a discrete benefit related to the January 2013 passage of the American Taxpayer Relief Act of 2012, which
28
retroactively extended previously expired tax provisions. As a result, the entire 2012 benefit of these expired provisions was recorded in January 2013. The effective tax rate in the first six months of 2014 is higher than our normal effective annual rate because many of those same provisions expired again at the end of 2013. Our effective tax rate is generally lower than U.S. statutory rates primarily due to the earnings in lower rate foreign jurisdictions where a significant portion of our income is taxed.
Net income was $9.6 million, or $0.38 per share, for the first six months of 2014 compared to $16.6 million, or $0.74 per share, in the same period last year. Earnings per share are expressed on a diluted basis.
Following is a discussion of operating results for each segment during the quarter:
Sealing Products. Sales of $330.4 million in the first half of 2014 reflect a 5.7% increase compared to the $312.5 million reported in the same period of 2013. Excluding the benefit of acquisitions ($2.3 million) and favorable foreign exchange ($3.0 million), sales were up 4.0% or $12.6 million. Higher demand in the nuclear markets ($2.4 million), aerospace markets ($2.5 million), semiconductor markets ($4.6 million), and North American heavy-duty truck markets ($8.6 million) and selected price increases at the consolidated Garlock operations and Stemco ($1.6 million) more than offset lower volumes at the consolidated Garlock operations ($5.3 million) due to lower activity in oil and gas, pipeline, and infrastructure project spending and net price decreases at Technetics ($0.6 million).
Segment profit of $39.9 million in the first half of 2014 decreased 19% from $49.0 million reported in the same period of 2013. Excluding the effects of acquisitions and foreign exchange, profit was down $9.3 million or 19%. The decrease in segment profit was primarily due to lower volumes at the consolidated Garlock operations ($4.4 million), increased manufacturing costs across the segment ($10.0 million) due to shift in products with higher cost and increased overtime, increased headcount across the segment ($1.9 million), higher R&D spending across the segment ($2.3 million), and net price decreases ($0.6 million), partially offset by increased volumes at Technetics and Stemco ($8.6 million) and selected price increases ($1.6 million). Operating margins for the segment declined from 15.7% in 2013 to 12.1% in 2014.
Engineered Products. Sales in the first half of 2014 were relatively flat at $187.3 million compared to the $186.9 million reported in the same period of 2013. Excluding the impact of favorable foreign exchange ($3.2 million), sales were down 1.5% or $2.8 million due to weakness in the North American oil and gas markets ($6.3 million) partially offset by selected price increases across the segment ($2.3 million) and higher demand in European markets ($1.4 million).
Segment profit in the first half of 2014 was $17.6 million compared to $14.4 million in the same period last year. Excluding the effect of foreign exchange, profit was up $2.5 million or 18% due to selected price increases across the segment ($2.3 million), manufacturing efficiencies across the segment ($1.9 million), lower restructuring costs at CPI ($0.9 million), and higher volumes in our European markets ($0.5 million), partially offset by lower volumes in North American oil and gas markets ($3.3 million). Operating margins for the segment were 9.4%, which increased from the 7.7% reported in the comparable quarter last year.
Power Systems. Sales of $84.1 million in the first half of 2014 decreased 10.9% from the $94.4 million reported in the same period of 2013. The decrease in sales was due to lower engine sales ($4.7 million), lower environmental upgrades ($4.5 million), and lower parts and service sales ($1.3 million).
The segment reported a profit of $6.7 million in the first half of 2014 compared to $11.2 million in the same period of 2013. The decline in segment profit was primarily due to a less favorable mix in engine programs ($4.5 million), increased R&D spend ($1.7 million), and higher manufacturing costs ($0.8 million), partially offset by a restructuring charge related to an early retirement program in 2013 ($1.9 million). Operating margins for the segment decreased from 11.9% in 2013 to 8.0% in 2014.
29
2013 Compared to 2012
Sales of $1,144.2 million in 2013 decreased 3% from $1,184.2 million in 2012. The following table illustrates the effects of key factors resulting in the change in sales by segment:
| Sales |
Percent Change 2013 vs. 2012 |
|||||||||||||||||||
| increase/(decrease) |
Acquisitions |
Foreign Currency |
Engine Revenue |
Other |
Total |
|||||||||||||||
| EnPro Industries, Inc. |
1.4 | % | 0.6 | % | (2.6 | )% | (2.8 | )% | (3.4 | )% | ||||||||||
|
|
|
|
|
|
|
|
|
|
|
|||||||||||
| Sealing Products |
2.7 | % | 0.7 | % | n/a | (1.1 | )% | 2.3 | % | |||||||||||
| Engineered Products |
— | % | 0.8 | % | n/a | (2.6 | )% | (1.8 | )% | |||||||||||
| Power Systems |
— | % | — | % | (14.5 | )% | (7.4 | )% | (21.9 | )% | ||||||||||
Following are key points regarding changes in sales for 2013 compared to 2012:
| • | The acquisition of Motorwheel in April 2012 and the acquisition of certain assets and assumption of certain liabilities of a small distributor of industrial seals in January 2013; both included in the Sealing Products segment |
| • | Favorable foreign currency exchange rate fluctuations in 2013 compared to 2012 |
| • | Lower revenues in the Power Systems segment, which is discussed further in the discussion of segment results following |
Segment profit, management’s primary measure of how our operations perform, decreased 13% to $128.7 million in 2013 from $148.5 million in 2012. Earnings from acquisitions contributed $2.7 million, favorable exchange fluctuations increased segment profit $1.0 million, and selected price increases generated $11.2 million. These favorable changes were more than offset by volume reductions of $23.7 million and increased costs of $11.0 million.
Corporate expenses for 2013 increased by $1.0 million compared to 2012. The increase was primarily driven by an increase in inventory valuation allowance reserve ($0.7 million), workers’ compensation costs ($0.4 million), employee incentive compensation ($0.7 million), salaries/severance ($0.9 million), travel costs ($0.5 million) and board of directors expenses ($0.4 million), partially offset by lower employee medical costs ($2.6 million).
Net interest expense in 2013 was $44.3 million compared to $42.8 million in 2012. The increase was due to an increase in the note payable to GST because of capitalized PIK interest partially offset by lower borrowings against the senior secured revolving credit facility.
Other expense, net in 2013 was $15.3 million compared to $9.9 million in 2012. The increase was due to higher environmental reserves ($5.1 million) and increased legal and intercompany management fees as activity in relation to GST’s asbestos liability estimation trial increased ($1.7 million), partially offset by lower health-care and other benefits expense relating to previously owned businesses ($3.0 million).
Income tax expense in 2013 was $8.4 million compared to $22.5 million reported in 2012. The decrease in tax expense reflects a similar decrease in pre-tax income over both periods, as well as a larger proportion of our 2013 earnings in foreign jurisdictions that carry an effective tax rate significantly lower than the U.S. The overall effective tax rate in 2013 is 23.4%, substantially lower than the 35.3% reported in 2012. In the U.S., we historically have benefited from federal income tax incentives such as the deduction for domestic production activities and credits for research and development. However, as of December 31, 2012, certain tax incentives expired and were not renewed before the end of 2012. These include the research and experimentation credit,
30
certain employment credits, and an exclusion for passive income earned by controlled foreign corporations. In January 2013, the United States Congress passed the American Taxpayer Relief Act (ATRA) of 2012 which retroactively extended these tax provisions. The effective tax rate for 2012 reflects the tax law that was in place as of December 31, 2012. Had the ATRA been enacted prior to January 1, 2013, our overall tax expense in 2012 would have been approximately $20.9 million, resulting in an overall 2012 effective tax rate of 32.7%. This $1.6 million difference was reflected in tax expense during the first quarter of 2013, lowering the 2013 annual effective tax rate by 4.4%.
Income from continuing operations was $27.4 million, or $1.17 per share, in 2013 compared to $41.0 million, or $1.90 per share, in 2012. Earnings per share are expressed on a diluted basis.
Following is a discussion of operating results for each segment during the year:
Sealing Products. Sales of $622.9 million in 2013 were 2% higher than the $609.1 million reported in 2012. Excluding the benefit from the acquisitions of Motorwheel ($14.4 million) and a small product line ($2.6 million) and favorable foreign exchange ($3.8 million), sales were down 1% or $7.0 million. Higher demand in the North American heavy-duty truck markets ($8.6 million) and price increases across the segment ($2.1 million) were more than offset by lower volumes at Technetics ($11.2 million) and Garlock ($7.0 million).
Segment profit increased to $97.1 million in 2013 from $88.8 million in 2012. Excluding the benefit from acquisitions ($2.7 million) and foreign exchange ($0.6 million), profit was up 6% or $5.0 million due to selected price increases across the segment ($1.5 million) and various factors at each division. At Garlock, lower volumes ($3.4 million) were offset by improved product mix ($3.1 million), cost savings due to restructuring activities in the prior year ($0.6 million), and lower restructuring costs in 2013 ($0.8 million). At Technetics, lower volumes due to weaker overall markets ($7.8 million) were offset by lower manufacturing costs ($4.7 million), R&D tax credits in France ($2.9 million), and the release of an acquisition earnout provision ($2.0 million). At Stemco, higher volumes ($5.7 million) were offset by increased costs ($5.4 million) due to the increased activity and opening of the distribution center. Including the acquisition and foreign exchange effects, operating margins for the segment increased to 15.6% in 2013 from 14.6% in 2012.
Engineered Products. Sales of $356.4 million in 2013 were 2% lower than the $363.0 million reported in 2012. Excluding the favorable foreign exchange ($2.9 million), sales were down 3% or $9.5 million due to lower demand in the European automotive markets and in CPI’s North American markets partially offset by price increases across the segment.
Segment profit in 2013 was $17.6 million compared to $20.5 million in 2012. Excluding the benefit from foreign exchange ($0.4 million), profit was down 16% or $3.3 million. Lower volumes at both GGB and CPI ($9.7 million) and higher restructuring costs at CPI ($1.8 million) more than offset price increases at both GGB and CPI ($6.6 million), lower restructuring costs at GGB ($1.2 million), and manufacturing increases at CPI ($0.3 million). Including foreign exchange effects, operating margins for the segment decreased to 4.9% in 2013 from 5.6% in 2012.
Power Systems. Sales decreased 22% to $167.6 million in 2013 from $214.6 million in 2012, due primarily to a decrease in engine revenue. Although ten engines were shipped in 2013 compared to fourteen in 2012, revenue for six of the engines shipped in 2012 was recognized under the completed contract method ($28.1 million) versus zero in 2013. The remaining decrease in sales was driven by lower parts and service revenue due to the U.S. government sequestration and the timing of scheduled maintenance ($19.8 million) and lower percentage-of-completion engine revenue ($7.0 million) partially offset by strong year-over-year sales of new environmental upgrade products ($5.2 million) and price increases ($2.5 million).
The segment reported a profit of $14.0 million in 2013 compared to $39.2 million in 2012. The year-over-year decline in segment profit was primarily due to volume decreases and a less attractive product mix as parts and service sales declined. Operating margins decreased to 8.4% in 2013 from 18.3% in 2012.
31
2012 Compared to 2011
Sales of $1,184.2 million in 2012 increased 7% from $1,105.5 million in 2011. The following table illustrates the effects of key factors resulting in the change in sales by segment:
| Sales |
Percent Change 2012 vs. 2011 |
|||||||||||||||||||
| increase/(decrease) |
Acquisitions |
Foreign Currency |
Engine Revenue |
Other |
Total |
|||||||||||||||
| EnPro Industries, Inc. |
8.2 | % | (2.5 | )% | 1.4 | % | — | % | 7.1 | % | ||||||||||
|
|
|
|
|
|
|
|
|
|
|
|||||||||||
| Sealing Products |
15.2 | % | (2.1 | )% | n/a | 0.8 | % | 13.9 | % | |||||||||||
| Engineered Products |
2.5 | % | (4.2 | )% | n/a | (4.4 | )% | (6.1 | )% | |||||||||||
| Power Systems |
— | % | — | % | 8.2 | % | 7.3 | % | 15.5 | % | ||||||||||
Following are key points regarding changes in sales for 2012 compared to 2011:
| • | A discussion of the following acquisitions is included in the “Acquisitions and Dispositions” subsection of Item 1 “Business” of our Annual Report on Form 10-K for the year ended December 31, 2013, which is incorporated by reference into this offering memorandum: Motorwheel Commercial Vehicle Systems, Inc. (“Motorwheel”)—acquired in April 2012 and included in the Sealing Products segment; Tara Technologies Corporation (“Tara”)—acquired in July 2011 and included in the Sealing Products segment; Pipeline Seal and Insulator, Inc. (“PSI”)—acquired in February 2011 and included in the Sealing Products segment; PI Bearing Technologies (“PI Bearings”)—acquired in August 2011 and included in the Engineered Products segment and the Mid Western group of companies (“Mid Western”)—acquired in February 2011 and included in Engineered Products segment. |
| • | The reported U.S. dollar value of sales was 3% lower than last year due to the unfavorable effect of foreign currency exchange rate fluctuations. This was primarily the result of a weakening euro, as compared to the US dollar. Garlock and Technetics in the Sealing Products segment and GGB and CPI in the Engineered Products segment have significant operations in Europe. |
Segment profit, management’s primary measure of how our operations perform, increased 5% to $148.5 million in 2012 from $141.0 million in 2011. Earnings from acquisitions contributed $9.0 million while selected price increases generated $13.4 million. These favorable changes were partially offset by unfavorable foreign exchange fluctuations of $3.2 million, an increase in restructuring costs of $3.6 million, volume reductions of $4.4 million and higher SG&A costs.
Corporate expenses for 2012 declined by $0.3 million compared to 2011. The decline was driven by a decrease in employee incentive compensation of $3.1 million, offset by higher consulting and management expenses of $1.9 million and higher directors’ share-based compensation of $0.9 million.
Net interest expense in 2012 was $42.8 million compared to $39.6 million in 2011. The increase in net interest expense was caused primarily by higher borrowings on the senior secured revolving credit facility.
Other expense, net in 2012 was $9.9 million compared to $3.8 million in 2011. The increase was caused primarily by a $2.9 million gain recorded on the guaranteed investment contract (“GIC”) in 2011 and a current year increase in environmental-related expenses of $1.2 million and in our expenses associated with GST’s bankruptcy proceedings of $0.5 million as compared to 2011. Refer to Note 19, “Commitments and Contingencies—Crucible Steel Corporation a/k/a Crucible, Inc.” in our Audited Consolidated Financial Statements included elsewhere in this offering memorandum for additional information about the GIC and the Crucible Back-Up Trust.
32
Income tax expense in 2012 was $22.5 million compared to $20.8 million reported in 2011. The increase in tax expense reflects an increase in the effective tax rate to 35.3% in 2012 from 32.1% in 2011, when applied to comparable pre-tax income in both periods. In the U.S., we historically have benefited from federal income tax incentives such as the deduction for domestic production activities and credits for research and development. However, as of December 31, 2012, certain tax incentives expired and were not renewed before the end of 2012. These include the research and experimentation credit, certain employment credits, and an exclusion for passive income earned by controlled foreign corporations. In January 2013, the United States Congress passed the American Taxpayer Relief Act (ATRA) of 2012 which retroactively extended these tax provisions. The effective tax rate above reflects the tax law that was in place as of December 31, 2012. Had the ATRA been enacted prior to January 1, 2013, our overall tax expense would have been approximately $20.9 million, resulting in an overall effective tax rate of 32.7%. This $1.6 million difference will be reflected in tax expense during the first quarter of 2013.
Income from continuing operations was $41.0 million, or $1.90 per share, in 2012 compared to $44.2 million, or $2.06 per share, in 2011. Earnings per share are expressed on a diluted basis.
Following is a discussion of operating results for each segment during the year:
Sealing Products. Sales of $609.1 million in 2012 were 14% higher than the $534.9 million reported in 2011. The increase in sales includes 15 percentage points due to the acquisitions of Tara ($41.7 million), Motorwheel ($33.0 million), and PSI ($6.8 million) and one percentage point due to price increases. These increases were partially offset by a two percentage point decline in sales due to unfavorable foreign currency exchange rates.
Segment profit increased to $88.8 million in 2012 from $81.2 million in 2011. Acquisitions contributed $9.0 million toward the increase in segment profit, primarily due to Tara ($4.4 million) and Motorwheel ($4.2 million) and selected net price increases contributed $8.4 million. These increases were partially offset by unfavorable foreign currency fluctuations of $1.7 million and an unfavorable change in volume and mix of $5.2 million. Selling, general, and administrative costs increased by $2.7 million, driven mainly by increased payroll costs and travel. Operating margins for the segment declined to 14.6% in 2012 from 15.2% in 2011.
Engineered Products. Sales of $363.0 million in 2012 were 6% lower than the $386.7 million reported in 2011. Sales volumes were down a net six percentage points due primarily to declines in European automotive and industrial manufacturing segments at GGB and continued weak demand at CPI in European industrial and refining markets and in certain North American markets, including the natural gas region of Western Canada; these unfavorable changes in sales were partially offset by improvements in China and Australia. Unfavorable foreign exchange rates hurt segment sales by four percent, or $16.1 million. The acquisitions of PI Bearings ($6.3 million) and Mid Western ($3.5 million) in 2011 favorably affected 2012 sales by 2 percentage points. Selected price increases also contributed two percent to segment sales.
Segment profit in 2012 was $20.5 million, down by $8.7 million from $29.2 million in 2011. Segment profit was negatively impacted by $10.2 million, primarily as a result of a decline in sales volumes. In addition, increased restructuring costs of $3.4 million and unfavorable foreign exchange rate fluctuations of $1.6 million, as compared to 2011, were also unfavorable to segment profit. Selected price increases, net of higher costs, contributed $3.7 million to segment profit and decreases in selling, general, and administrative costs contributed an additional $2.8 million to segment profits. Operating margins for the segment were 5.6% in 2012, which declined from the 7.6% reported last year.
Power Systems. Sales increased 15% to $214.6 million in 2012 from $185.8 million in 2011, due primarily to an increase in engine revenue of eight percent. Although 14 engines were shipped in each year, revenue for eight of the engines shipped in 2012 was recognized over the past 18 months under percentage of completion accounting, which began in the third quarter of 2011 for new engine programs. Revenues for six
33
engines shipped in 2012 and all engines shipped in 2011 were accounted for under the completed contract method. Sales of aftermarket parts in the government and nuclear generation industries contributed six percentage points to the increased sales. New environmental upgrade products, developed in late 2011, generated two percent in additional sales, partially offset by lower service revenue.
The segment reported a profit of $39.2 million in 2012 compared to $30.6 million in 2011. Segment profit improved by $6.6 million due to higher engine revenue. In addition, the segment recorded a $1.4 million estimated warranty expense in 2011 to repair a specific engine component in a series of U.S. Navy ships. The segment also recorded a $3.0 million estimated loss on an engine contract in 2011. These large costs during 2011 were partly offset by benefits booked in the same period of 2011 related to reimbursements on the canceled South Texas Project (nuclear business) of $1.8 million and the favorable resolution of a legal matter amounting to $0.5 million. Operating margins increased to 18.3% in 2012 from 16.5% in 2011.
Restructuring and Other Costs
We incurred $0.6 million and $2.9 million of restructuring costs during the six months ended June 30, 2014 and 2013, respectively. The restructuring costs for the first six months of 2014 were primarily associated with consolidating North American manufacturing facilities at our Garlock and Technetics operations. During the first six months of 2013, we initiated a number of restructuring activities throughout our operations, the most significant of which were at our CPI and Fairbanks Morse Engine (“FME”) businesses. At CPI, we consolidated several of our North American manufacturing operations and service centers into other existing sites. At FME, we offered a voluntary early retirement package to all salaried and hourly employees that were at least 60 years old.
We incurred $6.7 million, $5.0 million and $1.4 million of restructuring costs during the years ended December 31, 2013, 2012 and 2011, respectively. During 2013, we initiated a number of restructuring activities throughout our operations, the most significant of which were at our Technetics, CPI and FME businesses. At Technetics and CPI, we consolidated several of our North American and European manufacturing operations and service centers into other existing sites. As discussed above, at FME, we offered a voluntary early retirement package to all salaried and hourly employees that were at least 60 years old. There was an additional reduction in workforce at FME in reaction to declining market conditions. Workforce reductions announced as a result of our 2013 restructuring activities totaled 98 salaried administrative and hourly manufacturing positions, most of which had been terminated by December 31, 2013.
Liquidity and Capital Resources
Cash requirements for, but not limited to, working capital, capital expenditures, acquisitions, pension contributions, and debt repayments have been funded from cash balances on hand, revolver borrowings and cash generated from operations. We are proactively pursuing acquisition opportunities. It is possible our cash requirements for one or more of these acquisition opportunities could exceed our cash balance at the time of closing. Should we need additional capital, we have other resources available, which are discussed in this section under the heading of “—Capital Resources.”
As of June 30, 2014, we held no cash and cash equivalents in the United States and approximately $65 million in cash and cash equivalents outside of the United States. If the funds held outside the United States were needed for our operations in the U.S., we have several methods to repatriate without significant tax effects, including repayment of intercompany loans or distributions of previously taxed income. Other distributions may require us to incur U.S. or foreign taxes to repatriate these funds. However, our intent is to permanently reinvest these funds outside the U.S. and our current plans do not demonstrate a need to repatriate cash to fund our U.S. operations.
34
Cash Flows
Operating activities used cash in the amount of $13.8 million in the first six months of 2014 compared to providing cash of $5.5 million in the same period last year. The increase in cash used was due to lower segment earnings of approximately $10 million, higher working capital requirements of approximately $14 million in 2014 as compared to 2013, and higher income taxes paid of approximately $5 million, partially offset by approximately $3 million received from insurance proceeds in 2014 and approximately $8 million of payments related to incentive compensation plans in 2013. The higher working capital requirements, primarily accounts receivable and inventories, resulted from increased business activity during the quarter.
Investing activities used $23.2 million of cash during the first six months of 2014, primarily to fund capital expenditures and enterprise resource and planning system implementations. Investing activities used $22.1 million of cash in the first six months of 2013, primarily to fund capital expenditures and enterprise resource and planning system implementations.
Financing activities provided $36.4 million in cash in the first six months of 2014, primarily from net proceeds on borrowings from our revolving credit facility. Financing activities in the first six months of 2013 provided cash of $23.0 million, primarily consisting of net proceeds on borrowings from our revolving credit facility.
Capital Resources
Prior Senior Secured Revolving Credit Facility. At June 30, 2014, our primary U.S. operating subsidiaries, other than GST LLC, had a senior secured revolving credit facility with a maximum availability of $175 million. Actual borrowing availability under that credit facility was determined by reference to a borrowing base of specified percentages of eligible accounts receivable, inventory, equipment and real property elected to be pledged, and was reduced by usage of the facility, including outstanding letters of credit and any reserves. The actual borrowing availability at June 30, 2014, under that senior secured revolving credit facility was $79.8 million after giving consideration to $5.7 million of letters of credit outstanding and $48.7 million of outstanding revolver borrowings. The maximum amount borrowed under this facility was $74.7 million during 2013 and $52.6 million during the six months ended June 30, 2014.
Amended Senior Secured Revolving Credit Facility. On August 28, 2014, we entered into the Credit Facility Amendment to amend and restate the credit agreement governing our credit facility. The Credit Facility Amendment became effective on August 28, 2014. The Credit Facility Amendment provides for a five year, $300.0 million senior secured revolving credit facility. Unlike our prior credit facility, borrowing availability under the Revolving Credit Facility established by the Credit Facility Amendment is not limited by reference to a borrowing base. Initially, borrowings under the Revolving Credit Facility bear interest at an annual rate of LIBOR plus 1.75% or base rate plus 0.75%, although the interest rates under the Revolving Credit Facility are subject to incremental increases based on a consolidated total leverage ratio. In addition, a commitment fee accrues with respect to the unused amount of the Revolving Credit Facility at an annual rate of 0.20%, which rate is also subject to incremental increases based on a consolidated total leverage ratio.
EnPro and Coltec are the permitted borrowers under the Revolving Credit Facility. Each of our domestic, consolidated subsidiaries (other than GST and their respective subsidiaries, unless they elect to guarantee upon becoming consolidated subsidiaries in the future) are required to guarantee the obligations of the borrowers under the Revolving Credit Facility, and each of our existing domestic, consolidated subsidiaries (which does not include the domestic entities of GST) has entered into the Credit Facility Amendment to provide such a guarantee.
The Credit Facility Amendment permits the issuance of the notes and borrowings to fund the purchase the Convertible Debentures in the Tender Offer.
35
Collateral. Borrowings under the Revolving Credit Facility are secured by a first priority pledge of the following assets (which in each case excludes those assets related to the entities that comprise GST unless otherwise elected upon those entities becoming consolidated subsidiaries in the future):
| • | 100% of the capital stock of each domestic, consolidated subsidiary of EnPro Industries, Inc.; |
| • | 65% of the capital stock of any first tier foreign subsidiary of EnPro Industries, Inc. and its domestic, consolidated subsidiaries; and |
| • | substantially all of the assets (including, without limitation, machinery and equipment, inventory and other goods, accounts receivable, certain owned real estate and related fixtures, bank accounts, general intangibles, financial assets, investment property, license rights, patents, trademarks, trade names, copyrights, chattel paper, insurance proceeds, contract rights, hedge agreements, documents, instruments, indemnification rights, tax refunds and cash) of EnPro Industries, Inc. and its domestic, consolidated subsidiaries. |
Financial Covenants. The Credit Facility Amendment contains certain financial covenants and required financial ratios, including:
| • | a maximum consolidated total net leverage ratio of not more than 4.0 to 1.0 (with total debt, for the purposes of such ratio, to exclude the intercompany notes payable to GST and to be net of up to $100 million, for any measurement period ending prior to the first anniversary of the closing date of the Credit Facility Amendment, and thereafter, up to $75 million, in each case of unrestricted cash of EnPro Industries, Inc. and its domestic, consolidated subsidiaries); and |
| • | a minimum consolidated interest coverage ratio of at least 2.5 to 1.0. |
Affirmative and negative covenants. The Credit Facility Amendment contains affirmative and negative covenants (subject, in each case, to customary exceptions and qualifications), including covenants that limit our ability to, among other things:
| • | grant liens on our assets; |
| • | incur additional indebtedness (including guarantees and other contingent obligations); |
| • | make certain investments (including loans and advances); |
| • | merge or make other fundamental changes; |
| • | sell or otherwise dispose of property or assets; |
| • | pay dividends and other distributions and prepay certain indebtedness; |
| • | make changes in the nature of our business; |
| • | enter into transactions with our affiliates; |
| • | enter into burdensome contracts; |
| • | make certain capital expenditures; and |
| • | modify or terminate documents related to certain indebtedness. |
36
Events of Default. The Credit Facility Amendment contains events of default including, but not limited to, nonpayment of principal or interest, violation of covenants, breaches of representations and warranties, cross-default to other debt, bankruptcy and other insolvency events, material judgments, certain ERISA events, actual or asserted invalidity of loan documentation, certain changes of control of EnPro Industries, Inc., the invalidity of subordination provisions of subordinated indebtedness, the failure of the domestic entities of GST to become guarantors following their exit from bankruptcy and reconsolidation with EnPro Industries, Inc. for financial reporting purposes and, upon the same event, the failure to pledge the equity interests of GST (on the same basis on which the equity of other consolidated subsidiaries of EnPro Industries, Inc. is pledged) as collateral to secure obligations under the Credit Facility Amendment.
See “Description of Other Indebtedness—Revolving Credit Facility.”
Convertible Debentures. In October 2005, we issued $172.5 million in aggregate principal amount of Convertible Debentures, net of an original issue discount of $61.3 million. The Convertible Debentures bear interest at the annual rate of 3.9375%, with interest due on April 15 and October 15 of each year, and will mature on October 15, 2015, unless they are converted prior to that date. The Convertible Debentures are direct, unsecured and unsubordinated obligations and rank equal in priority with all unsecured and unsubordinated indebtedness and senior in right of payment to all subordinated indebtedness. They effectively rank junior to our secured indebtedness to the extent of the value of the assets securing such indebtedness. The Convertible Debentures do not contain any financial covenants.
Holders may convert the Convertible Debentures into cash and shares of our common stock at an initial conversion rate of 29.5972 shares of common stock per $1,000 principal amount of the Convertible Debentures, which is equal to an initial conversion price of $33.79 per share, subject to adjustment, before the close of business on October 15, 2015. Upon conversion, we would deliver (i) cash equal to the lesser of the aggregate principal amount of the Convertible Debentures to be converted or our total conversion obligation, and (ii) shares of our common stock in respect of the remainder, if any, of our conversion obligation. The Convertible Debentures become subject to conversion in the succeeding quarter, upon notice by the holders, when the closing price per share of our common stock exceeds $43.93, or 130% of the conversion price of $33.79, for at least twenty (20) trading days during the last thirty (30) consecutive trading days of any calendar quarter (such amounts are subject to adjustment for specified events as set forth in the indenture). This conversion condition was satisfied at June 30, 2014. Thus the Convertible Debentures will remain convertible through the quarter ending September 30, 2014, and beyond that as long as the above condition is met. Through the date of this offering memorandum, no Convertible Debentures have been converted.
We used a portion of the net proceeds from the sale of the Convertible Debentures to enter into call options, i.e., hedge and warrant transactions, which entitle us to acquire shares of our stock from a financial institution at $33.79 per share and entitle the financial institution to acquire shares of our stock from us at $46.78 per share. This will reduce potential dilution to our common stockholders from conversion of the Convertible Debentures and have the effect to us of increasing the conversion price of the debentures to $46.78 per share.
In March 2014, we entered into privately negotiated transactions with certain holders of approximately $56.1 million in aggregate principal amount of the Convertible Debentures to exchange them for an aggregate of approximately 1.7 million shares of EnPro’s common stock, plus cash payments of accrued and unpaid interest and for fractional shares. We recognized a $3.6 million pre-tax loss on the exchange ($2.3 million net of tax) which is included in other (non-operating) expense in the accompanying Consolidated Statement of Operations. There was also a $0.8 million additional tax benefit recorded directly to equity.
In June 2014, we entered into an additional privately negotiated transaction with certain holders of approximately $41.6 million in aggregate principal amount of the Convertible Debentures to exchange them for an aggregate of approximately 1.25 million shares of EnPro’s common stock, plus cash payments of accrued and unpaid interest and for fractional shares. We recognized a $2.4 million pre-tax loss on the exchange ($1.5 million net of tax) which is included in other (non-operating) expense in the accompanying Consolidated Statement of
37
Operations. In addition, there was a $0.6 million tax benefit recorded directly to equity. The transaction reduces the aggregate principal amount of the Convertible Debentures outstanding at June 30, 2014 to approximately $74.8 million. None of the exchange transactions reduced the respective obligations under the hedge and warrant transactions entered into in connection with the original sale of the Convertible Debentures, which remain in force with respect to the original amount of the Convertible Debentures.
Our prior credit facility limited borrowings under the facility to fund the payment of the principal amount of the Convertible Debentures upon conversion to the extent we would fail to maintain (i) pro forma average availability of at least $20 million or (ii) pro forma average availability of at least $17.5 million and a minimum pro forma fixed charge coverage ratio. After applying these limitations, at June 30, 2014, approximately $63 million was available for borrowing under the senior secured revolving credit facility to fund the payment of cash amounts upon the conversion of Convertible Debentures. Existing cash from sources including repayment of intercompany loans or distributions of previously taxed income at June 30, 2014 would have been available as a source of liquidity to fund the additional cash payment upon conversion of the remaining Convertible Debentures. Because the Convertible Debentures have consistently traded at prices in excess of their implied conversion value, we believe that the likelihood of conversion of the Convertible Debentures prior to maturity is remote.
Intercompany Notes. Effective as of January 1, 2010, Coltec entered into a $73.4 million Amended and Restated Promissory Note due January 1, 2017 in favor of GST LLC, and our subsidiary Stemco LP entered into a $153.8 million Amended and Restated Promissory Note due January 1, 2017, in favor of GST LLC. These Intercompany Notes amended and replaced promissory notes in the same principal amounts which were initially issued in March 2005, and which expired on January 1, 2010.
The Intercompany Notes bear interest at 11% per annum, of which 6.5% is payable in cash and 4.5% is added to the principal amount of the Intercompany Notes as payment-in-kind interest. If GST LLC is unable to pay ordinary course operating expenses, under certain conditions, GST LLC can require Coltec and Stemco to pay in cash the accrued PIK interest necessary to meet such ordinary course operating expenses, subject to a cap of 1% of the principal balance of each Intercompany Note in any calendar month and 4.5% of the principal balance of each Intercompany Note in any year. The interest due under the Intercompany Notes may be satisfied through offsets of amounts due under intercompany services agreements pursuant to which the Company provides certain corporate services, makes available access to group insurance coverage to GST, makes advances to third party providers related to payroll and certain benefit plans sponsored by GST, and permits employees of GST to participate in certain of the Company’s benefit plans. In the six months ended June 30, 2014 and in the years ended December 31, 2013, 2012, and 2011, PIK interest of $6.1 million, $11.2 million, $10.7 million, and $10.2 million, respectively, was added to the principal balance of the Intercompany Notes, resulting in a total Notes Payable to GST balance of $271.0 million at June 30, 2014.
The Coltec Note is secured by Coltec’s pledge of certain of its equity ownership in specified U.S. subsidiaries. The Stemco Note is guaranteed by Coltec and secured by Coltec’s pledge of its interest in Stemco LP and Stemco Holdings, Inc. The Intercompany Notes are subordinated to any obligations under the Company’s senior secured revolving credit facility.
Garlock Sealing Technologies LLC and Garrison Litigation Management Group, Ltd.
The historical business operations of GST LLC and Anchor resulted in a substantial volume of asbestos litigation in which plaintiffs alleged personal injury or death as a result of exposure to asbestos fibers. Those subsidiaries manufactured and/or sold industrial sealing products, predominately gaskets and packing, containing encapsulated asbestos fibers. Anchor is an inactive and insolvent indirect subsidiary of Coltec. The Company’s subsidiaries’ exposure to asbestos litigation and their relationships with insurance carriers have been managed through another Coltec subsidiary, Garrison.
38
On the Petition Date, GST LLC, Anchor and Garrison filed voluntary petitions for reorganization under Chapter 11 of the United States Bankruptcy Code in Bankruptcy Court. The filings were the initial step in an asbestos claims resolution process, which is ongoing. The goal of the process is an efficient and permanent resolution of all current and future asbestos claims through court approval of a plan of reorganization, which is expected to establish a trust to which all asbestos claims will be channeled for resolution. GST intends to seek an agreement with asbestos claimants and other creditors on the terms of a plan for the establishment of such a trust and repayment of other creditors in full, or in the absence of such an agreement an order of the Bankruptcy Court confirming such a plan.
Prior to its deconsolidation effective on the Petition Date, GST LLC and its subsidiaries operated as part of the Garlock group of companies within EnPro’s Sealing Products segment. GST LLC designs, manufactures and sells sealing products, including metallic, non-metallic and composite material gaskets, rotary seals, compression packing, resilient metal seals, elastomeric seals, hydraulic components, and expansion joints. GST LLC and its subsidiaries operate five primary manufacturing facilities, including GST LLC’s operations in Palmyra, New York and Houston, Texas.
Garrison’s principal business historically has been to manage the defense of all asbestos-related litigation affecting the Company’s subsidiaries, principally GST LLC and Anchor, arising from their sale or use of products or materials containing asbestos, and to manage, bill and collect available insurance proceeds. When it commenced business in 1996, Garrison acquired certain assets of GST LLC and assumed certain liabilities stemming from asbestos-related claims against GST LLC. Garrison is not itself a defendant in asbestos-related litigation and has no direct liability for asbestos-related claims. Rather, it has assumed GST LLC’s liability for such claims and agreed to indemnify GST LLC from liability with respect to such claims. Anchor was a distributor of products containing asbestos and was acquired by GST LLC in 1987. Anchor has been inactive and insolvent since 1993.
The financial results of GST and subsidiaries have been excluded from our consolidated results since the Petition Date. The investment in GST is presented using the cost method during the reorganization period and is subject to periodic reviews for impairment. The cost method requires us to present our ownership interests in the net assets of GST at the Petition Date as an investment and to not recognize any income or loss from GST and subsidiaries in our results of operations during the reorganization period. When GST emerges from the jurisdiction of the Bankruptcy Court, the subsequent accounting will be determined based upon the applicable circumstances and facts at such time, including the terms of any plan of reorganization. See Note 18 to the Audited Consolidated Financial Statements and Note 15 to the Unaudited Consolidated Financial Statements included elsewhere in this offering memorandum for condensed financial information of GST and subsidiaries.
GST is included in our consolidated U.S. federal income tax return and certain state combined income tax returns. As the parent of these consolidated tax groups, we are liable for, and pay, income taxes owed by the entire group. We have agreed with GST to allocate group taxes to GST based on the U.S. consolidated tax return regulations and current accounting guidance. This method generally allocates current and deferred taxes to GST as if it were a separate taxpayer. As a result, we carry an income tax receivable from GST related to this allocation. At June 30, 2014, this amount was $66.6 million. This receivable is expected to be collected at a future date.
We have assessed GST LLC’s and Garrison’s liquidity position as a result of the bankruptcy filing and believe they can continue to fund their operating activities, and those of their subsidiaries’, and meet their capital requirements for the foreseeable future. However, the ability of GST LLC and Garrison to continue as going concerns is dependent upon their ability to resolve their ultimate asbestos liability in the bankruptcy from their net assets, future cash flows, and available insurance proceeds, whether through the confirmation of a plan of reorganization or otherwise. As a result of the bankruptcy filing and related events, there can be no assurance the carrying values of the assets, including the carrying value of the business and the tax receivable, will be realized or that liabilities will be liquidated or settled for the amounts recorded. In addition, a plan of reorganization, or rejection thereof, could change the amounts reported in the GST LLC and Garrison financial statements and
39
cause a material change in the carrying amount of our investment. For additional information about GST’s bankruptcy proceeding, see Note 18 to the Audited Consolidated Financial Statements and Note 15 to the Unaudited Consolidated Financial Statements included elsewhere in this offering memorandum and the sections entitled “Contingencies—Subsidiary Bankruptcy,” and “—Asbestos” in this Management’s Discussion and Analysis of Financial Condition and Results of Operation.
Dividends
To date, we have not paid dividends and we do not intend to pay a dividend in the foreseeable future. Under the terms of the Revolving Credit Facility, as long as no default exists or would exist, EnPro is permitted to pay dividends of up to $30 million per fiscal year, to pay dividends up to the sum of 50% of our cumulative consolidated net income for the period from July 1, 2014 to the end of the most recent fiscal quarter prior to paying such dividend plus the aggregate amount of net cash proceeds received from equity issuances by EnPro after August 28, 2014 (to the extent such amounts are not used to make other restricted payments or investments), and to make other restricted payments, which would include dividends, in an aggregate amount not exceeding $75 million over the term of the Revolving Credit Facility. The indenture that governs the Convertible Debentures does not restrict us from paying dividends. The indenture governing the notes will include restrictions on our ability to pay dividends. See “Description of the Notes—Limitation on Restricted Payments.”
Critical Accounting Policies and Estimates
The preparation of our Consolidated Financial Statements, in accordance with accounting principles generally accepted in the United States, requires us to make estimates and judgments that affect the reported amounts of assets, liabilities, revenues and expenses, and related disclosures pertaining to contingent assets and liabilities. Note 1, “Overview, Significant Accounting Policies and Recently Issued Pronouncements,” to the Audited Consolidated Financial Statements describes the significant accounting policies used to prepare the Consolidated Financial Statements. On an ongoing basis we evaluate our estimates, including, but not limited to, those related to bad debts, inventories, intangible assets, income taxes, warranty obligations, restructuring, pensions and other postretirement benefits, and contingencies and litigation. We base our estimates on historical experience and on various other assumptions we believe to be reasonable under the circumstances. Actual results may differ from our estimates.
We believe the following accounting policies and estimates are the most critical. Some of them involve significant judgments and uncertainties and could potentially result in materially different results under different assumptions and conditions.
Revenue Recognition
For the Sealing Products and Engineered Products segments, revenue is recognized at the time title and risk of product ownership is transferred or when services are rendered, and shipping costs billed to customers are recognized as revenue and expensed in cost of goods sold.
We generally use the percentage-of-completion (“POC”) accounting method to account for our long-term contracts associated with the design, development, manufacture, or modification of complex engines under fixed price or cost plus contracts. During the third quarter of 2011, the Power Systems segment began using POC for prospective engine contracts. We made this change because, as a result of enhancements to our financial management and reporting systems, we are able to reasonably estimate the revenue, costs, and progress towards completion of engine builds. If we are not able to meet those conditions for a particular engine contract, we recognize revenues using the completed-contract method. Additionally, engines that were in production at June 30, 2011 will continue to use the completed-contract method.
Under POC, revenue is recognized based on the extent of progress towards completion of the long-term contract. We generally use the cost-to-cost measure for our long-term contracts unless we believe another method more clearly measures progress towards completion of the contract. Under the cost-to-cost measure, the extent of
40
progress towards completion is measured based on the ratio of costs incurred to date to the total estimated costs at completion of the contract. Contract costs include labor, material and subcontracting costs, as well as an allocation of indirect costs. Revenues, including estimated fees or profits, are recorded as costs are incurred.
Due to the nature of the work required to be performed on many of our contracts, the estimation of total revenue and cost at completion is complex and subject to many variables. Management must make assumptions and estimates regarding labor productivity, the complexity of the work to be performed, the availability of materials, the length of time to complete the contract (to estimate increases in wages and prices for materials and related support cost allocations), performance by our subcontractors and overhead cost rates, among other variables. Based on our analysis, any quarterly adjustments to net sales, cost of sales, and the related impact to operating income are recorded as necessary in the period they become known. These adjustments may result in an increase or a decrease in operating income. Changes in estimates of net sales, cost of sales, and the related impact to operating income are recognized quarterly on a cumulative catch-up basis, which recognizes in the current period the cumulative effect of the changes on current and prior periods based on a contract’s percentage of completion. A significant change in one or more of these estimates could affect the profitability of one or more of our contracts. When estimates of total costs to be incurred on a contract exceed total estimates of revenue to be earned, a provision for the entire loss on the contract is recorded in the period the loss is determined.
Pensions and Postretirement Benefits
We and certain of our subsidiaries sponsor domestic and foreign defined benefit pension and other postretirement plans. Major assumptions used in the accounting for these employee benefit plans include the discount rate, expected return on plan assets, rate of increase in employee compensation levels and assumed health care cost trend rates. Assumptions are determined based on data available to us and appropriate market indicators, and are evaluated each year as of the plans’ measurement date. A change in any of these assumptions could have a material effect on net periodic pension and postretirement benefit costs reported in the Consolidated Statements of Operations, as well as amounts recognized in the Consolidated Balance Sheets. See Note 14 to the Audited Consolidated Financial Statements and Note 10 to the Unaudited Consolidated Financial Statements included elsewhere in this offering memorandum for a discussion of pension and postretirement benefits.
Income Taxes
We use the asset and liability method of accounting for income taxes. Temporary differences arising between the tax basis of an asset or liability and its carrying amount on the Consolidated Balance Sheet are used to calculate future income tax assets or liabilities. This method also requires the recognition of deferred tax benefits, such as net operating loss carryforwards. A valuation allowance is recorded to reduce deferred tax assets when it is more likely than not that a tax benefit will not be realized. Deferred tax assets and liabilities are measured using enacted tax rates expected to apply to the taxable income (losses) in the years in which those temporary differences are expected to be recovered or settled. The effect on deferred tax assets and liabilities of a change in tax rates is recognized in income in the period that includes the enactment date. A tax benefit from an uncertain tax position is recognized only if we believe it is more likely than not that the position will be sustained on its technical merits. If the recognition threshold for the tax position is met, only the portion of the tax benefit that we believe is greater than 50 percent likely to be realized is recorded. See Note 4 to the Audited Consolidated Financial Statements included elsewhere in this offering memorandum for a discussion of income taxes.
Goodwill and Other Intangible Assets
We do not amortize goodwill, but instead it is subject to annual impairment testing. The goodwill asset impairment test involves comparing the fair value of a reporting unit to its carrying amount. If the carrying amount of a reporting unit exceeds its fair value, a second step of comparing the implied fair value of the reporting unit’s goodwill to the carrying amount of that goodwill is required to measure the potential goodwill impairment loss. There are inherent assumptions and estimates used in developing future cash flows which
41
require management to apply judgment to the analysis of intangible asset impairment, including projecting revenues, interest rates, cost of capital, royalty rates and tax rates. Many of the factors used in assessing fair value are outside the control of management, and it is reasonably likely that assumptions and estimates will change in future periods. These changes can result in future impairments. For additional information, see “Management’s Discussion and Analysis of Financial Condition and Results of Operations – Overview and Outlook” as well as Notes 1 and 9 to the Audited Consolidated Financial Statements and Note 6 to the Unaudited Consolidated Financial Statements included elsewhere in this offering memorandum.
Contingencies
General
A detailed description of certain environmental, asbestos and other legal matters relating to certain of our subsidiaries is included in this section. In addition to the matters noted herein, we are from time to time subject to, and are presently involved in, other litigation and legal proceedings arising in the ordinary course of business. We believe the outcome of such other litigation and legal proceedings will not have a material adverse effect on our financial condition, results of operations and cash flows. Expense for administrative and legal proceedings are recorded when incurred.
Environmental
Our facilities and operations are subject to federal, state and local environmental and occupational health and safety requirements of the U.S. and foreign countries. We take a proactive approach in our efforts to comply with environmental, health and safety laws as they relate to our manufacturing operations and in proposing and implementing any remedial plans that may be necessary. We also regularly conduct comprehensive environmental, health and safety audits at our facilities to maintain compliance and improve operational efficiency.
Although we believe past operations were in substantial compliance with the then applicable regulations, we or one or more of our subsidiaries is involved with various remediation activities at 15 sites where the future cost per site for us or our subsidiary is expected to exceed $100,000. Investigations have been completed for 11 sites and are in progress at the other four sites. The majority of these sites relate to remediation projects at former operating facilities that were sold or closed and primarily deal with soil and groundwater contamination.
During 2013, we accrued a liability of $6.3 million related to environmental remediation costs associated with the pre-1983 site ownership and operation of the former Trent Tube facility in East Troy, Wisconsin. This amount is included in other (non-operating) expense on the accompanying Consolidated Statements of Operations. The Trent Tube facility was operated by Crucible Materials Corporation from 1983 until its closure in 1998. Crucible Materials Corporation commenced environmental remediation activities at the site in 1999. In connection with the bankruptcy of Crucible Materials Corporation, a trust was established to fund the remediation of the site. We have reviewed the trust’s assets and have valued them at $750,000 for our internal purposes. During 2013, the Wisconsin Department of Natural Resources first notified us of potential liability for remediation of the site as a potentially responsible party under Wisconsin’s “Spill Act” which provides that potentially responsible parties may be jointly and severally liable for site remediation. Based on our evaluation of the site, we believe our estimated costs to remediate the site will range between $7 million and $10 million, reduced by the value of the trust’s remaining assets.
As of June 30, 2014 and December 31, 2013, we had accrued liabilities of $14.5 million and $15.1 million, respectively, for estimated future expenditures relating to environmental contingencies. Given the uncertainties regarding the status of laws, regulations, enforcement policies, the impact of other parties potentially being liable, technology and information related to individual sites, we do not believe it is possible to develop an estimate of the range of reasonably possible environmental loss in excess of our recorded liabilities.
42
In addition, based on our prior ownership of Crucible Steel Corporation a/k/a Crucible, Inc. (“Crucible”), we may have additional contingent liabilities in one or more significant environmental matters. One such matter, which is included in the 15 sites referred to above, is the Lower Passaic River Study Area of the Diamond Alkali Superfund Site in New Jersey. Crucible operated a steel mill abutting the Passaic River in Harrison, New Jersey from the 1930s until 1974, which was one of many industrial operations on the river dating back to the 1800s. Certain contingent environmental liabilities related to this site were retained by Coltec when Coltec sold a majority interest in Crucible Materials Corporation (the successor of Crucible) in 1985. The United States Environmental Protection Agency (the “EPA”) has notified Coltec that it is a potentially responsible party (“PRP”) for Superfund response actions in the lower 17-mile stretch of the Passaic River known as the Lower Passaic River Study Area. Coltec and approximately 70 of the numerous other PRPs, known as the Cooperating Parties Group, are parties to a May 2007 Administrative Order on Consent with the EPA to perform a Remedial Investigation/Feasibility Study (“RI/FS”) of the contaminants in the Lower Passaic River Study Area. The RI/FS is ongoing and has not been completed. Separately, on April 11, 2014, the EPA released its Focused Feasibility Study (the “FFS”) with its proposed plan for remediating the lower eight miles of the Lower Passaic River Study Area. The FFS calls for bank-to-bank dredging and capping of the riverbed of that portion of the river and estimates a range of the present value of aggregate remediation costs of approximately $953 million to approximately $1.731 billion, although estimates of the costs and the timing of costs are inherently imprecise. The FFS is subject to a 90-day public comment period and revision, including the adoption of a less extensive remedy, in light of comments that may be received. No final allocations of responsibility have been made among the numerous PRPs that have received notices from the EPA, there are numerous identified PRPs that have not yet received PRP notices from the EPA, and there are likely many PRPs that have not yet been identified. At this time, we cannot estimate a reasonably possible range of loss related to the remediation of the Lower Passaic River Study Area because the ultimate remedial approach has not been determined and the parties that will participate in funding the remediation and their respective allocations are not yet known. In addition, except with respect to specific Crucible environmental matters for which we have accrued a portion of the liability set forth above, we are unable to estimate a reasonably possible range of loss related to any other contingent environmental liability based on our prior ownership of Crucible. See Note 19 to the Audited Consolidated Financial Statements and Note 16 to the Unaudited Consolidated Financial Statements included elsewhere in this offering memorandum for additional information regarding our environmental contingencies and see “—Crucible Steel Corporation a/k/a Crucible, Inc.”
Colt Firearms and Central Moloney
We may have contingent liabilities related to divested businesses for which certain of our subsidiaries retained liability or are obligated under indemnity agreements. These contingent liabilities include, but are not limited to, potential product liability and associated claims related to firearms manufactured prior to March 1990 by Colt Firearms, a former operation of Coltec, and for electrical transformers manufactured prior to May 1994 by Central Moloney, another former Coltec operation. We believe that these potential contingent liabilities are not material to the Company’s financial condition, results of operation and cash flows. Coltec also has ongoing obligations, which are included in other liabilities in our Consolidated Balance Sheets, with regard to workers’ compensation, retiree medical and other retiree benefit matters that relate to Coltec’s periods of ownership of these operations.
Crucible Steel Corporation a/k/a Crucible, Inc.
Crucible, which was engaged primarily in the manufacture and distribution of high technology specialty metal products, was a wholly owned subsidiary of Coltec until 1983 when its assets and liabilities were distributed to a new Coltec subsidiary, Crucible Materials Corporation. Coltec sold a majority of the outstanding shares of Crucible Materials Corporation in 1985 and divested its remaining minority interest in 2004. Crucible Materials Corporation filed for Chapter 11 bankruptcy protection in May 2009 and is no longer conducting operations. We have certain ongoing obligations, which are included in other liabilities in our Consolidated Balance Sheets, including workers’ compensation, retiree medical and other retiree benefit matters, related to Coltec’s period of ownership of Crucible. Based on Coltec’s prior ownership of Crucible, we may have certain
43
other contingent liabilities, including liabilities in one or more significant environmental matters included in the matters discussed in “Environmental,” above. We are investigating these matters. Except with respect to those matters for which we have an accrued liability as discussed in “Environmental” above, we are unable to estimate a reasonably possible range of loss related to these contingent liabilities. See Note 19 to the Audited Consolidated Financial Statements and Note 16 to the Unaudited Consolidated Financial Statements included elsewhere in this offering memorandum for information about certain liabilities relating to Coltec’s ownership of Crucible.
Borg Warner
A subsidiary of BorgWarner Inc. (“BorgWarner”) has asserted claims against GGB France E.U.R.L. (“GGB France”) with respect to certain bearings supplied by GGB France to BorgWarner and used by BorgWarner in manufacturing hydraulic control units included in motor vehicle automatic transmission units. BorgWarner and GGB France are participating in a technical review before a panel of experts to determine, among other things, whether there were any defects in the bearings and whether any defect caused the damages claimed by BorgWarner, which technical review is a required predicate to the commencement of a legal proceeding for damages. There is no fixed deadline for the completion of the technical review and the presentation of the expert panel’s findings. We believe that GGB France has valid factual and legal defenses to these claims and we are vigorously defending these claims. At this point in the technical review process we are unable to estimate a reasonably possible range of loss related to these claims.
Subsidiary Bankruptcy
Three of our subsidiaries filed voluntary Chapter 11 bankruptcy petitions on the Petition Date as a result of tens of thousands of pending and estimated future asbestos personal injury claims. The filings were the initial step in an asbestos claims resolution process, which is ongoing. The goal of the process is an efficient and permanent resolution of all pending and future asbestos claims through court approval of a plan of reorganization that will establish a trust to which all asbestos claims will be channeled for resolution and payment.
In November 2011, GST filed a proposed plan of reorganization with the Bankruptcy Court. GST’s initial proposed plan called for a trust to be formed, to which GST and affiliates would contribute $200 million and which would be the exclusive remedy for future asbestos personal injury claimants—those whose claims arise after confirmation of the plan. The initial proposed plan provided that each present personal injury claim (any pending claim or one that arises between the Petition Date and plan confirmation) would be assumed by reorganized GST and resolved either by settlement pursuant to a matrix contained in the proposed plan or as otherwise agreed, or by payment in full of any judgment entered after trial in federal court. The initial proposed plan was revised and replaced by GST’s first amended proposed plan of reorganization filed in May 2014.
On April 13, 2012, the Bankruptcy Court granted a motion by GST for the Bankruptcy Court to estimate the allowed amount of present and future asbestos claims against GST for mesothelioma, a rare cancer attributed to asbestos exposure, for purposes of determining the feasibility of a proposed plan of reorganization. The estimation trial began on July 22, 2013 and concluded on August 22, 2013.
On January 10, 2014, Bankruptcy Judge George Hodges announced his estimation decision in a 65-page order. Citing with approval the methodology put forth by GST at trial, the judge determined that $125 million is the amount sufficient to satisfy GST’s liability for present and future mesothelioma claims. Judge Hodges adopted GST’s “legal liability” approach to estimation, focused on the merits of claims, and rejected asbestos claimant representatives’ approach, which focused solely on GST’s historical settlement history. The judge’s liability determination is for mesothelioma claims only. The court has not yet determined amounts for GST’s liability for other asbestos claims and for administrative costs that would be required to review and process claims and payments, which will add to the amount.
44
In his opinion, Judge Hodges writes, “The best evidence of Garlock’s aggregate responsibility is the projection of its legal liability that takes into consideration causation, limited exposure and the contribution of exposures to other products.”
The decision validates the positions that GST has been asserting for the more than three years it has been in this process. Following are several important findings in the opinion:
| • | Garlock’s products resulted in a relatively low exposure to asbestos to a limited population, and its legal responsibility for causing mesothelioma is relatively de minimis. |
| • | Chrysotile, the asbestos fiber type used in almost all of Garlock’s asbestos products, is far less toxic than other forms of asbestos. The court found reliable and persuasive Garlock’s expert epidemiologist, who testified that there is no statistically significant association between low dose chrysotile exposure and mesothelioma. |
| • | The population that was exposed to Garlock’s products was necessarily exposed to far greater quantities of higher potency asbestos from the products of others. |
| • | The estimates of Garlock’s aggregate liability that are based on its historic settlement values are not reliable because those values are infected with the impropriety of some law firms and inflated by the cost of defense. |
In June 2014, the Current Asbestos Claimants Committee representing current asbestos claimants filed a motion with the Bankruptcy Court asking the court to re-open the estimation process for further discovery and alleging that GST misled the court in various respects during the estimation trial. A hearing on the Current Asbestos Claimants Committee’s motion has not yet been scheduled.
On May 29, 2014, GST filed an amended proposed plan of reorganization and a proposed disclosure statement. The plan provides $275 million in total funding for (a) the treatment of present and future asbestos claims against GST that have not been resolved by settlement or verdict prior to the Petition Date, and (b) administrative and litigation costs. The $275 million is to be funded by GST ($245 million) and the Company’s subsidiary, Coltec ($30 million), through two facilities—a settlement facility and a litigation facility. Funds contained in the settlement facility and the litigation facility would provide the exclusive remedies for current and future GST asbestos claimants, other than claimants whose claims had been resolved by settlement or verdict prior to the Petition Date and were not paid prior to the Petition Date. The plan provides that GST will pay in full claims that had been resolved by settlement or verdict prior to the Petition Date and that were not paid prior to the Petition Date (with respect to claims resolved by verdict, such payments will be made only to the extent the verdict becomes final). The $275 million amount is more than double the $125 million that the Bankruptcy Court found to be a reasonable and reliable measure of the amount sufficient to satisfy present and future mesothelioma claims against GST, and was determined based on an economic analysis of the feasibility of the proposed plan (although such determination is currently the subject of the motion by the Current Asbestos Claimants Committee to reopen the record).
The amended plan also provides that GST will pay settled asbestos claims (those settled but not yet paid prior to the Petition Date) in full. The Bankruptcy Court has set September 30, 2014 as the bar date for filing proofs of claim for settled asbestos claims. GST estimates its aggregate liability for settled asbestos claims to be less than $10 million.
The purpose of the disclosure statement is to provide material information about GST and the plan to creditors, who will decide whether or not to support the plan. The disclosure statement must be approved by the Bankruptcy Court before GST can send it to creditors to solicit their support for confirmation of the plan. The Bankruptcy Court has scheduled a hearing on the disclosure statement in September 2014.
45
In June, GST also moved the Bankruptcy Court to approve plan solicitation, voting and confirmation procedures and to set a schedule for confirmation proceedings. The motion requests that the Bankruptcy Court approve GST’s proposed program for providing notice of the process to known and unknown claimants, GST’s proposed rules for eligibility to cast votes on the plan, GST’s proposed form of ballots that must be cast by each class of claimants, and GST’s proposed schedule. The hearing on this solicitation and scheduling motion is also scheduled for September 2014.
GST asked the Bankruptcy Court to schedule the plan confirmation hearing to begin on July 15, 2015. GST anticipates that the plan will be vigorously opposed by the Current Asbestos Claimants Committee.
GST continues to hope that it can reach a consensual resolution with representatives of current and future claimants. GST has stated that it continues to be willing to engage in discussions with claimant representatives, recognizing that an agreed settlement would provide the best path to certainty and finality through section 524(g) of the Bankruptcy Code, provide for faster and more efficient completion of the case, save significant future costs, and allow for the attainment of complete finality.
Confirmation and consummation of the plan are subject to a number of risks and uncertainties, including the actions and decisions of creditors and other third parties that have an interest in the bankruptcy proceedings, delays in the confirmation or effective date of a plan of reorganization due to factors beyond GST’s or our control, which would result in greater costs and the impairment of value of GST, appeals and other challenges to the plan, and risks and uncertainties affecting GST and Coltec’s ability to fund anticipated contributions under the plan as a result of adverse changes in their results of operations, financial condition and capital resources, including as a result of economic factors beyond their control. Accordingly, we cannot assure you that GST will be able to obtain Bankruptcy Court approval of its amended plan of reorganization and the settlement and resolution of claims and related releases of liability embodied therein or what the final terms of such plan will be at consummation, and the time period for the resolution of the bankruptcy proceedings is not presently determinable.
During the course of the Chapter 11 proceedings, the claimant representatives have asserted that affiliates of the filed entities, including the Company and Coltec, should be held responsible for the asbestos liabilities of the filed entities under various theories of derivative corporate responsibility including veil-piercing and alter ego. Claimant representatives filed a motion with the Bankruptcy Court asking for permission to sue us based on those theories. In a decision dated June 7, 2012, the Bankruptcy Court denied the claimant representatives’ motion without prejudice, thereby potentially allowing the representatives to re-file the motion after the estimation trial. We believe there is no reason for the claimant representatives to re-file the motion because the judge’s estimation decision leaves no doubt that GST is capable of fully funding any plan of reorganization in the case.
From time to time during the case we have engaged in settlement discussions with asbestos claimant representatives and we anticipate that we will continue to do so; however, there can be no assurance that a settlement will be reached and, if so, when that might occur.
From the Petition Date through June 30, 2014, GST has recorded Chapter 11 case-related fees and expenses totaling $109.9 million. The total includes $56.2 million for fees and expenses of GST’s counsel and experts; $43.2 million for fees and expenses of counsel and experts for the Current Asbestos Claimants Committee, and $10.5 million for the fees and expenses of the future claims representative and his counsel and experts. GST recorded $7.9 million of those case-related fees and expenses in the first half of 2014 and $5.0 million in the second quarter of 2014, compared to $22.8 million and $12.4 million, respectively, in the first half and second quarter of 2013. While GST believes the fees and expenses in its Chapter 11 case continue to be higher than warranted, it attributes the significant decline in case-related costs, and thus the favorable comparison to 2013, to the non-recurrence of the substantial fees and expenses of lawyers and experts incurred in connection with preparation for the estimation trial held in the summer of 2013.
46
See the additional information provided earlier under the heading “—Garlock Sealing Technologies LLC and Garrison Litigation Management Group, Ltd.”, the discussion under the heading “—Asbestos”, which follows, and Notes 18 and 19 to the Audited Consolidated Financial Statements and Notes 15 and 16 to the Unaudited Consolidated Financial Statements included elsewhere in this offering memorandum.
Asbestos
Background on Asbestos-Related Litigation. The historical business operations of GST LLC and Anchor resulted in a substantial volume of asbestos litigation in which plaintiffs alleged personal injury or death as a result of exposure to asbestos fibers in products produced or sold by GST LLC or Anchor, together with products produced and sold by numerous other companies. GST LLC and Anchor manufactured and/or sold industrial sealing products that contained encapsulated asbestos fibers. Other of our subsidiaries that manufactured or sold equipment that may have at various times in the past contained asbestos-containing components have also been named in a number of asbestos lawsuits, but only GST LLC and Anchor have ever paid an asbestos claim.
Since the first asbestos-related lawsuits were filed against GST LLC in 1975, GST LLC and Anchor have processed more than 900,000 claims to conclusion, and, together with insurers, have paid over $1.4 billion in settlements and judgments and over $400 million in fees and expenses. Our subsidiaries’ exposure to asbestos litigation and their relationships with insurance carriers have been managed through Garrison.
Beginning in 2000, the top-tier asbestos defendants—companies that paid most of the plaintiffs’ damages because they produced and sold huge quantities of highly friable asbestos products—sought bankruptcy protection and stopped paying asbestos claims in the tort system. The bankruptcies of many additional producers of friable asbestos products followed. The plaintiffs could no longer pursue actions against these large defendants during the pendency of their bankruptcy proceedings, even though these defendants had historically been determined to be the largest contributors to asbestos-related injuries. Many plaintiffs pursued GST LLC in civil court actions to recover compensation formerly paid by top-tier bankrupt companies under state law principles of joint and several liability and began identifying GST LLC’s non-friable sealing products as a primary cause of their asbestos diseases, while generally denying exposure to the friable products of companies in bankruptcy. GST LLC believes this targeting strategy effectively shifted damages caused by top-tier defendants that produced friable asbestos products to GST LLC, thereby materially increasing GST LLC’s cost of defending and resolving claims.
Almost all of the top-tier defendants that sought bankruptcy relief in the early 2000s have now emerged, or are positioning to emerge, from bankruptcy. Their asbestos liabilities have been assumed by wealthy 524(g) trusts created in the bankruptcies with assets contributed by the emerging former defendants and their affiliates. With the emergence of these companies from bankruptcy, many plaintiffs seek compensation from the 524(g) trusts. These trusts have aggregate assets exceeding $30 billion ($36.8 billion according to a study released in September 2011 by the United States Government Accountability Office) specifically set aside to compensate individuals with asbestos diseases caused by the friable products of those defendants. We believe that as billions of dollars of 524(g) trust assets continue to become available to claimants, defendants will obtain significant reductions in their costs to defend and resolve claims. As of the Petition Date, however, the establishment of these 524(g) trusts had taken longer than anticipated and the trusts had a significant backlog of claims that accumulated while the trusts were being established. Additionally, procedures adopted for the submissions of asbestos claims in bankruptcy cases and against 524(g) trusts make it difficult for GST LLC and other tort-system co-defendants to gain access to information about claims made against bankrupt defendants or the accompanying evidence of exposure to the asbestos-containing products of such bankrupt defendants. We believe that these procedures enable claimants to “double dip” by collecting payments from remaining defendants in the tort system under joint-and-several-liability principles for injuries caused by the former top-tier defendants while also collecting substantial additional amounts from 524(g) trusts established by those former defendants to pay asbestos claims. Because of these factors, while several 524(g) trusts had begun making substantial payments to claimants prior to the Petition Date, GST LLC had not yet experienced a significant reduction in damages being sought from GST LLC.
47
Subsidiary Chapter 11 Filing and Its Effect. In light of GST LLC’s experience that (a) its cost of defending and resolving claims had not yet declined as anticipated although 524(g) trusts had begun making substantial payments to claimants, and (b) new mesothelioma claims filings against it in recent years had not declined at a rate similar to the rate of decline in disease incidence, GST initiated voluntary proceedings under Chapter 11 of the United States Bankruptcy Code as a means to determine and comprehensively resolve their asbestos liability. The filings were the initial step in an ongoing claims resolution process, which is ongoing.
During the pendency of the Chapter 11 proceedings, certain actions proposed to be taken by GST not in the ordinary course of business are subject to approval by the Bankruptcy Court. As a result, during the pendency of these proceedings, we do not have exclusive control over these companies. Accordingly, as required by GAAP, GST was deconsolidated beginning on the Petition Date.
As a result of the initiation of the Chapter 11 proceedings, the resolution of asbestos claims is subject to the jurisdiction of the Bankruptcy Court. The filing of the Chapter 11 cases automatically stayed the prosecution of pending asbestos bodily injury and wrongful death lawsuits, and initiation of new such lawsuits, against GST. Further, the Bankruptcy Court issued an order enjoining plaintiffs from bringing or further prosecuting asbestos products liability actions against affiliates of GST, including EnPro, Coltec and all their subsidiaries, during the pendency of the Chapter 11 proceedings, subject to further order. As a result, except as a result of the resolution of appeals from verdicts rendered prior to the Petition Date and the elimination of claims as a result of information obtained in the Chapter 11 proceedings, the numbers of asbestos claims pending against our subsidiaries have not changed since the Petition Date, and those numbers continue to be as reported in our Form 10-K for the year ended December 31, 2009 and our quarterly reports for the first and second quarters of 2010. See “—Subsidiary Bankruptcy” for additional information and an update on the GST asbestos claims resolution process.
Pending Claims. On the Petition Date, according to Garrison’s claim records, there were more than 90,000 total claims pending against GST LLC, of which approximately 5,800 were claims alleging the disease mesothelioma. Mesothelioma is a rare cancer of the protective lining of many of the body’s internal organs, principally the lungs. The primary cause of mesothelioma is believed to be exposure to asbestos. As a result of asbestos tort reform during the 2000s, most active asbestos-related lawsuits, and a large majority of the amount of payments made by our subsidiaries in the years immediately preceding the Petition Date, have been of claims alleging mesothelioma. In total, GST LLC has paid $563.2 million to resolve a total of 15,300 mesothelioma claims, and another 5,700 mesothelioma claims have been dismissed without payment.
In order to estimate the allowed amount for mesothelioma claims against GST, the Bankruptcy Court approved a process whereby all current GST LLC mesothelioma claimants were required to respond to a questionnaire about their claims. Questionnaires were distributed to the mesothelioma claimants identified in Garrison’s claims database. Many of the 5,800 claimants (over 500) did not respond to the questionnaire at all; many others (more than 1,900) clarified that: claimants do not have mesothelioma, claimants cannot establish exposure to GST products, claims were dismissed, settled or withdrawn, claims were duplicates of other filed claims, or claims were closed or inactive. Still others responded to the questionnaire but their responses were deficient in some material respect. As a result of this process, less than 3,300 claimants presented questionnaires asserting mesothelioma claims against GST LLC as of the Petition Date and many of them did not establish exposure to GST products or have claims that are otherwise deficient.
Since the Petition Date, many asbestos-related lawsuits have been filed by claimants against other companies in state and federal courts, and many of those claimants might also have included GST LLC as a defendant but for the bankruptcy injunction. Many of those claimants likely will make claims against GST in the bankruptcy proceeding.
Product Defenses. We believe that the asbestos-containing products manufactured or sold by GST could not have been a substantial contributing cause of any asbestos-related disease. The asbestos in the products was encapsulated, which means the asbestos fibers incorporated into the products during the manufacturing process
48
were sealed in binders. The products were also non-friable, which means they could not be crumbled by hand pressure. The U.S. Occupational Safety and Health Administration, which began generally requiring warnings on asbestos-containing products in 1972, has never required that a warning be placed on products such as GST LLC’s gaskets. Even though no warning label was required, GST LLC included one on all of its asbestos-containing products beginning in 1978. Further, gaskets such as those previously manufactured and sold by GST LLC are one of the few asbestos-containing products still permitted to be manufactured under regulations of the U.S. Environmental Protection Agency. Nevertheless, GST LLC discontinued all manufacture and distribution of asbestos-containing products in the U.S. during 2000 and worldwide in mid-2001.
Appeals. GST LLC has a record of success in trials of asbestos cases, especially before the bankruptcies of many of the historically significant asbestos defendants that manufactured raw asbestos, asbestos insulation, refractory products or other dangerous friable asbestos products. However, it has on occasion lost jury verdicts at trial. GST has consistently appealed when it has received an adverse verdict and has had success in a majority of those appeals. We believe that GST LLC will continue to be successful in the appellate process, although there can be no assurance of success in any particular appeal. At June 30, 2014, three GST LLC appeals are pending from adverse decisions totaling $2.4 million.
GST LLC won reversals of adverse verdicts in one of two recent appellate decisions. In September 2011, the United States Court of Appeals for the Sixth Circuit overturned a $500,000 verdict against GST LLC that was handed down in 2009 by a Kentucky federal court jury. The federal appellate court found that GST LLC’s motion for judgment as a matter of law should have been granted because the evidence was not sufficient to support a determination of liability. The Sixth Circuit’s chief judge wrote that, “On the basis of this record, saying that exposure to Garlock gaskets was a substantial cause of [claimant’s] mesothelioma would be akin to saying that one who pours a bucket of water into the ocean has substantially contributed to the ocean’s volume.” In May 2011, a three-judge panel of the Kentucky Court of Appeals upheld GST LLC’s $700,000 share of a jury verdict, which included punitive damages, in a lung cancer case against GST LLC in Kentucky state court. This verdict, which was secured by a bond pending the appeal, was paid in June 2012.
Insurance Coverage. At June 30, 2014, we had $100.7 million of insurance coverage we believe is available to cover current and future asbestos claims payments and certain expense payments. GST has collected insurance payments totaling $95.4 million since the Petition Date. Of the $100.7 million of available insurance coverage remaining, we consider $100.0 million (99%) to be of high quality because the insurance policies are written or guaranteed by U.S.-based carriers whose credit rating by S&P is investment grade (BBB-) or better, and whose AM Best rating is excellent (A-) or better. Of the $100.7 million, $64.6 million is allocated to claims that were paid by GST LLC prior to the initiation of the Chapter 11 proceedings and submitted to insurance companies for reimbursement, and the remainder is allocated to pending and estimated future claims. There are specific agreements in place with carriers covering $66.2 million of the remaining available coverage. Based on those agreements and the terms of the policies in place and prior decisions concerning coverage, we believe that substantially all of the $100.7 million of insurance proceeds will ultimately be collected, although there can be no assurance that the insurance companies will make the payments as and when due. The $100.7 million is in addition to the $21.3 million collected in the first six months of 2014. Based on those agreements and policies, some of which define specific annual amounts to be paid and others of which limit the amount that can be recovered in any one year, we anticipate that $38.7 million will become collectible at the conclusion of GST’s Chapter 11 proceeding and, assuming the insurers pay according to the agreements and policies, that the following amounts should be collected in the years set out below regardless of when the case concludes:
2015 – $20 million
2016 – $18 million
2017 – $13 million
2018 – $11 million
49
GST LLC has received $8.1 million of insurance recoveries from insolvent carriers since 2007 and may receive additional payments from insolvent carriers in the future, including a $900,000 payment received in the quarter. No anticipated insolvent carrier collections are included in the $100.7 million of anticipated collections. The insurance available to cover current and future asbestos claims is from comprehensive general liability policies that cover Coltec and certain of its other subsidiaries in addition to GST LLC for periods prior to 1985 and therefore could be subject to potential competing claims of other covered subsidiaries and their assignees.
Liability Estimate. Our recorded asbestos liability as of the Petition Date was $472.1 million. We based that recorded liability on an estimate of probable and estimable expenditures to resolve asbestos personal injury claims under generally accepted accounting principles, made with the assistance of Garrison and an estimation expert, Bates White, retained by GST LLC’s counsel. The estimate developed was an estimate of the most likely point in a broad range of potential amounts that GST LLC might pay to resolve asbestos claims (by settlement in the majority of the cases except those dismissed or tried) over the ten-year period following the date of the estimate in the state court system, plus accrued but unpaid legal fees. The estimate, which was not discounted to present value, did not reflect GST LLC’s views of its actual legal liability; GST LLC has continuously maintained that its products could not have been a substantial contributing cause of any asbestos disease. Instead, the liability estimate reflected GST LLC’s recognition that most claims would be resolved more efficiently and at a significantly lower total cost through settlements without any actual liability determination.
From the Petition Date through the first quarter of 2014, neither we nor GST endeavored to update the accrual since the Petition Date except as necessary to reflect payments of accrued fees and the disposition of cases on appeal. In each asbestos-driven Chapter 11 case that has been resolved previously, the amount of the debtor’s liability has been determined as part of a consensual plan of reorganization agreed to by the debtor, its asbestos claimants and a legal representative for its potential future claimants. GST did not believe that there was a reliable process by which an estimate of such a consensual resolution could be made and therefore believed that there was no basis upon which it could revise the estimate last updated prior to the Petition Date.
Given the Bankruptcy Court’s January 2014 decision estimating GST’s liability for present and future mesothelioma claims at $125 million and GST’s filing of its first amended proposed plan of reorganization setting out its intention to fund a plan with total consideration of $275 million, GST believes that its ultimate payment to resolve all present and future asbestos claims against it will be no less than the amounts required under its amended proposed plan. Similarly, while GST believes it to be an unlikely worst case scenario, GST believes its ultimate costs to resolve all asbestos claims against it could be no more than the total value of GST. As a result, GST believes that its ultimate asbestos liability will be somewhere in that range between those two values and therefore believes it is appropriate to revise its estimate to the low end of the range. Accordingly, GST revised its estimate of its ultimate payment to resolve all present and future asbestos claims. As described below, the amended plan provides $275 million in total funding for (a) the treatment of present and future asbestos claims against GST that have not been resolved by settlement or verdict prior to the Petition Date, and (b) administrative and litigation costs. The amended plan also provides that GST will pay in full claims that had been resolved by settlement or verdict prior to the Petition Date and were not paid prior to the Petition Date. GST estimates the range of its aggregate liability for unpaid settled asbestos claims to be from $3.1 million to $16.4 million. Therefore, in accordance with applicable accounting rules, GST recorded a liability for claims settled but not paid prior to the Petition Date at the low end of the range, which is $3.1 million. GST also accrued $2.4 million for claims resolved by verdict prior to the Petition Date that were not paid prior to the Petition Date. Therefore, the liability accrual at June 30, 2014 for present and future asbestos claims, including claims resolved by settlement or verdict prior to the Petition Date and were not paid prior to the Petition Date, was $280.5 million.
GST’s First Amended Proposed Plan of Reorganization. On May 29, 2014, GST filed an amended proposed plan of reorganization and a proposed disclosure statement for such amended plan. The plan provides $275 million in total funding for (a) the treatment of present and future asbestos claims against GST that have not been resolved by settlement or verdict prior to the Petition Date, and (b) administrative and litigation costs. The $275 million is to be funded by GST ($245 million) and the Company’s subsidiary, Coltec ($30 million), through
50
two facilities—a settlement facility (which would receive $245 million) and a litigation facility (which would receive $30 million). Funds contained in the settlement facility and the litigation facility would provide the exclusive remedies for current and future GST asbestos claimants, other than claimants whose claims had been resolved by settlement or verdict prior to the Petition Date and were not paid prior to the Petition Date. The $275 million amount is more than double the $125 million that the Bankruptcy Court found to be a reasonable and reliable measure of the amount sufficient to satisfy present and future mesothelioma claims against GST (although such determination is currently the subject of the motion by the Current Asbestos Claimants Committee to reopen the record), and was determined based on an economic analysis of the feasibility of the proposed plan.
The amended plan also provides that GST will pay in full claims that had been resolved by settlement or verdict prior to the Petition Date and were not paid prior to the Petition Date (with respect to claims resolved by verdict, such payments will be made only to the extent the verdict becomes final). The amount of such claims resolved by final verdict is $2.4 million. The Bankruptcy Court has set September 30, 2014 as the bar date for filing proofs of claim for settled asbestos claims. GST estimates the range of its aggregate liability for unpaid settled asbestos claims to be from $3.1 million to $16.4 million.
The plan includes provisions referred to as the “Parent Settlement” for the resolution and extinguishment of any and all alleged derivative claims against us based on GST asbestos products and entry of an injunction permanently protecting us from the assertion of such claims. As consideration for the Parent Settlement, Coltec would contribute $30 million of the amount proposed to be paid into the settlement facility to pay future claimants and $500,000 to fund certain plan implementation expenses and would consent to subordinate our rights to any insurance coverage described above in favor of a first-priority lien securing $25 million of funding for the litigation facility. Those provisions are incorporated into the terms of the proposed plan only in the context of the specifics of that plan, which would result in the equity interests of GST being retained by the reconsolidation of GST into the Company with substantial equity above the amount of equity currently included in our consolidated financial statements, and an injunction protecting us from future GST claims.
Confirmation and consummation of the plan are subject to a number of risks and uncertainties, including the actions and decisions of creditors and other third parties that have an interest in the bankruptcy proceedings, delays in the confirmation or effective date of a plan of reorganization due to factors beyond GST’s or our control, which would result in greater costs and the impairment of value of GST, appeals and other challenges to the plan, and risks and uncertainties affecting GST and Coltec’s ability to fund anticipated contributions under the plan as a result of adverse changes in their results of operations, financial condition and capital resources, including as a result of economic factors beyond their control. Accordingly, we cannot assure you that GST will be able to obtain Bankruptcy Court approval of its amended plan of reorganization and the settlement and resolution of claims and related releases of liability embodied therein or what the final terms of such plan will be at consummation, and the time period for the resolution of the bankruptcy proceedings is not presently determinable. See “Risk Factors—We cannot assure you that GST will be able to obtain Bankruptcy Court approval of its amended plan of reorganization and the settlement and resolution of claims and related releases of liability embodied therein or what the final terms of such plan will be at consummation, and the time period for the resolution of the bankruptcy proceedings is not presently determinable.”
Off Balance Sheet Arrangements
Lease Agreements
We have a number of operating leases primarily for real estate, equipment and vehicles. Operating lease arrangements are generally utilized to secure the use of assets from time to time if the terms and conditions of the lease or the nature of the asset makes the lease arrangement more favorable than a purchase. As of December 31, 2013, approximately $51.8 million of future minimum lease payments were outstanding under these agreements. See Note 19, “Commitments and Contingencies—Other Commitments,” to the Audited Consolidated Financial Statements for additional disclosure.
51
Contractual Obligations
A summary of our contractual obligations and commitments at December 31, 2013, is as follows:
| Payments Due by Period (in millions) |
||||||||||||||||||||
| Contractual Obligations |
Total |
Less than 1 Year |
1-3 Years |
3-5 Years |
More than 5 Years |
|||||||||||||||
| Long-term debt |
$ | 181.0 | $ | 0.2 | $ | 180.3 | $ | 0.2 | $ | 0.3 | ||||||||||
| Notes payable to GST |
309.2 | — | — | 309.2 | — | |||||||||||||||
| Interest on long-term debt |
12.7 | 6.9 | 5.7 | 0.1 | — | |||||||||||||||
| Interest on notes payable to GST |
72.2 | 16.9 | 36.0 | 19.3 | — | |||||||||||||||
| Operating leases |
51.8 | 12.7 | 19.4 | 13.9 | 5.8 | |||||||||||||||
| Other liabilities |
24.4 | 4.1 | 6.4 | 5.6 | 8.3 | |||||||||||||||
|
|
|
|
|
|
|
|
|
|
|
|||||||||||
| Total |
$ | 651.3 | $ | 40.8 | $ | 247.8 | $ | 348.3 | $ | 14.4 | ||||||||||
|
|
|
|
|
|
|
|
|
|
|
|||||||||||
Payment for long-term debt may be accelerated under certain circumstances because the convertible debentures due in 2015 may be converted earlier, requiring payment of the principal amount thereof in cash. The payments for long-term debt shown in the table above reflect the contractual principal amount for the Convertible Debentures. In our Consolidated Balance Sheet, this amount is shown net of a debt discount pursuant to the applicable accounting rules. Additional discussion regarding the convertible debentures is included in this Management’s Discussion and Analysis of Financial Condition and Results of Operations in “Liquidity and Capital Resources—Capital Resources,” and in Note 12 to the Audited Consolidated Financial Statements and Note 9 to the Unaudited Consolidated Financial Statements included elsewhere in this offering memorandum. On August 11, 2014, we commenced a cash Tender Offer to purchase any and all of our outstanding Convertible Debentures. See “Summary—Refinancing Transactions—Cash Tender Offer for Convertible Debentures.” The interest on long-term debt represents the contractual interest coupon. It does not include the debt discount accretion, which also is a component of interest expense.
The Intercompany Notes payable to GST LLC bear interest at 11% per annum, of which 6.5% is payable in cash and 4.5% is added to the principal amount as PIK interest. If GST LLC is unable to pay ordinary course operating expenses, under certain conditions, GST LLC can require us to pay in cash the accrued PIK interest necessary to meet such ordinary course operating expenses, subject to a cap of 1% of the principal balance of each note in any calendar month and 4.5% of the principal balance of each note in any year. The interest due under the notes payable to GST LLC may be satisfied through offsets of amounts due under intercompany services agreements pursuant to which we provide certain corporate services and insurance coverages to GST LLC, make advances to third party providers related to payroll and certain benefit plans sponsored by GST LLC, and permit employees of GST LLC to participate in certain of our benefit plans. The table above reflects $82.0 million of total PIK interest as principal payments at the due date of the Intercompany Notes.
Payments for other liabilities are estimates of amounts to be paid for environmental and retained liabilities of previously owned businesses included in the Consolidated Balance Sheets at December 31, 2013. These estimated payments are based on information currently known to us. However, it is possible that these estimates will vary from actual results and it is possible that these estimates may be updated in the future if new information becomes available in the future or if there are changes in the facts and circumstances related to these liabilities. Additional discussion regarding these liabilities is included earlier in this Management’s Discussion and Analysis of Financial Condition and Results of Operations in “Contingencies—Environmental, Contingencies—Colt Firearms and Central Moloney,” “Contingencies—Crucible Steel Corporation a/k/a Crucible, Inc.,” and in Note 19 to the Audited Consolidated Financial Statements.
The table does not include obligations under our pension and postretirement benefit plans, which are included in Note 14 to the Audited Consolidated Financial Statements included elsewhere in this offering memorandum.
52
Company Overview
We are a leader in the design, development, manufacture and marketing of proprietary engineered industrial products that primarily include: sealing products; heavy-duty truck wheel-end component systems; self-lubricating non-rolling bearing products; precision engineered components and lubrication systems for reciprocating compressors; and heavy-duty, medium-speed diesel, natural gas and dual fuel reciprocating engines, including parts and services. We serve a diverse set of end markets and customers with leading brands, including Garlock®, STEMCO®, GGB® and Fairbanks Morse Engine™. We believe our products are considered by our customers to be best-in-class due to a history of performance in critical and demanding applications where there is a high cost for failure. We manufacture our products at 63 manufacturing facilities in 13 countries. For the twelve months ended June 30, 2014 we generated $1,152 million of consolidated net sales and $142 million of Adjusted EBITDA.
The charts below highlight our diversity of net sales by end market and geography:
| 2013 Consolidated Sales by End Use Market | 2013 Consolidated Sales by Geography | |
|
|
| |
Consolidated Operations
We manage our business as three segments: Sealing Products, Engineered Products, and Power Systems. Our reportable segments are managed separately based on differences in their products and services and their end-customers. Segment EBITDA is segment profit (which is the total segment revenue reduced by operating expenses and restructuring and other costs identifiable with the segment) before depreciation and amortization expense.
The following charts set forth the sales and Segment EBITDA of each of our segments for the last twelve months ended June 30, 2014.
LTM June 30, 2014
(dollars in millions)
| Segment Sales | Segment EBITDA | |
|
|
|
53
Segment Overview of EnPro Industries
| Segments |
Sealing Products |
Engineered Products |
Power Systems | |||||||||
| LTM June 30, 2014 |
Sales(1): $641 million Segment EBITDA(2): $119 million Segment EBITDA Margin(3): 19% |
Sales(1): $357 million Segment EBITDA(2): $44 million Segment EBITDA Margin(3): 12% |
Sales(1): $157 million Segment EBITDA(2): $13 million Segment EBITDA Margin(3): 8% | |||||||||
|
|
|
|
|
|
| |||||||
| Products |
• Gaskets & Packing • Oil Seals • Bearing Isolators • Expansion Joints • Flange Isolation Seal • Pipeline Products |
• Polymer Products • High Performance Metal Seals • Bellows • Brush Seals • Acoustic Media |
• Wheel End • Suspension • Brake Products • Intelligent Transportation Systems |
• Metal-polymer Plain Bearings • Bushing Blocks • Solid Polymer Bearings • Bearing Assemblies • Filament Wound Plain Bearings |
• Core Compressor Products • Sealing Components • Lubrication Systems • Reciprocating Compressor Reconditioning and Field Service |
• Medium-speed Diesel, Natural Gas and Dual Fuel Engines to 24MW • Parts & Service • Systems Packager | ||||||
| End Markets |
• General Industry • Oil & Gas • Basic Materials • Chemical Processing • Power Generation • Water/ Wastewater • Pulp and Paper • Other Industries |
• Electronics & Semiconductors • Aerospace • Power Generation • General Industry • Oil & Gas • Food & Beverage |
• Medium/ Heavy Duty Truck • Other Industries |
• Auto • General Industry • Agriculture Equipment • Fluid Power • Primary Metals • Other Industries |
• Oil & Gas • PET Bottle Manufacturing • Chemical Processing • Other Industries |
• Marine Power & Propulsion • Utility Standby Power Generation • Oil & Gas • Engine and Auxiliary Equipment Engineering | ||||||
| Representative Customers |
• BASF • Chevron • Daewoo E&C • Dow • GE • Saudi Aramco • ThyssenKrupp |
• AREVA • Applied Materials • Cameron • Exelon • Honeywell • Schlumberger • Siemens |
• FedEx • H-E-B • Utility • Mack • UPS • Volvo • Wal-Mart |
• Alstom • Bosch • Caterpillar • Casappa • Emerson • United Technologies • John Deere |
• Apache • Air Products • Dow • GE • Graham Packaging • Shell • Tesoro |
• U.S. Navy • U.S. Coast Guard • Naval Shipyards • Ecopetrol • General Dynamics NASSCO • Petroecuador | ||||||
| (1) | Sales for each segment include intersegment sales. Intersegment sales for the twelve months ended June 30, 2014 were $3.1 million. |
| (2) | Segment EBITDA is segment profit before depreciation and amortization. Segment profit does not include an allocation of corporate expenses. For a presentation of segment profit and the calculation of segment EBITDA, see “—Summary Historical Consolidated Financial Information and Other Data.” |
| (3) | Segment EBITDA Margin is Segment EBITDA divided by segment sales. |
54
| (4) | The Garlock column, and the discussion of the Sealing Products segment below, includes products, customers, competition, and raw materials for Garlock Sealing Technologies, LLC which is one of the three of our subsidiaries that filed voluntary petitions for reorganization under Chapter 11 of the United States Bankruptcy Code on June 4, 2010. The financial results of GST and subsidiaries are not included in our consolidated results after June 4, 2010 and are not included in the sales, Segment EBITDA, Segment EBITDA Margin or other financial measures of the Sealing Products segment for periods after June 4, 2010 included above or elsewhere in this offering memorandum. |
Sealing Products Segment
Our Sealing Products segment includes three operating divisions, Garlock, Technetics and Stemco, that serve a wide variety of industries where performance and durability are vital for safety and environmental protection. Our products are used in many demanding environments such as those characterized by high pressure, high temperature and chemical corrosion, and many of our products support critical applications with a low tolerance for failure.
The Garlock family of companies designs, manufactures and sells sealing products including: metallic, non-metallic and composite material gaskets; dynamic seals; compression packing; hydraulic components; expansion joints; flange sealing and isolation products; pipeline casing spacers/isolators; casing end seals; modular sealing systems for sealing pipeline penetrations; safety-related signage for pipelines; conveyor belting; and sheet rubber products. These products are used in a variety of industries, including chemical and petrochemical processing, petroleum extraction and refining, pulp and paper processing, power generation, food and pharmaceutical processing, primary metal manufacturing, mining, and water and waste treatment. Among the well-known brand names are Garlock®, Gylon®, Klozure®, Lubrikup®, Pikotek®, PSITM, and Gar-Seal®.
Technetics Group designs, manufactures and sells high performance metal seals; elastomeric seals; bellows and bellows assemblies; pedestals for semiconductor manufacturing; and a wide range of polytetrafluoroethylene (“PTFE”) products. These products are used in a variety of industries, including electronics and semiconductor, aerospace, power generation, oil and gas, food and beverage and other industries. Brands include Helicoflex®, Belfab®, Feltmetal®, PlastomerTM, and Bio-GuardianTM and Origraf®.
Stemco designs, manufactures and sells heavy-duty truck wheel-end component systems including: seals; hubcaps; mileage counters; bearings; locking nuts; brake products; suspension components; and RF-based tire pressure monitoring and inflation systems and automated mileage collection devices. Its products primarily serve the medium and heavy-duty truck market. Product brands include STEMCO®, STEMCO Kaiser®, STEMCO Duroline®, STEMCO Crewson®, STEMCO Motor Wheel®, Grit Guard®, Guardian HP®, Voyager®, Discover®, Endeavor®, Pro-Torq®, Sentinel®, Data Trac®, DataTrac®, QwikKit®, Centrifuse® and AerisTM.
Customers
Our Sealing Products segment sells products to industrial agents and distributors, original equipment manufacturers (“OEMs”), engineering and construction firms and end users worldwide. Sealing products are offered to global customers, with approximately 40% of sales delivered to customers outside the United States in 2013. Representative customers are shown in the segment overview table above. In 2013, no single customer accounted for more than 7% of segment revenues.
Raw Materials and Components
Our Sealing Products segment uses PTFE resins, aramid fibers, specialty elastomers, elastomeric compounds, graphite and carbon, common and exotic metals, cold-rolled steel, leather, aluminum die castings, nitrile rubber, powdered metal components, and various fibers and resins. We believe all of these raw materials and components are readily available from various suppliers.
55
Engineered Products Segment
Our Engineered Products segment includes two high performance industrial products businesses: GGB and Compressor Products International (CPI).
GGB designs, manufactures and sells self-lubricating, non-rolling, metal polymer, solid polymer, and filament wound bearing products, as well as aluminum bushing blocks for hydraulic applications. The bearing surfaces are made of PTFE or a mixture that includes PTFE to provide maintenance-free performance and reduced friction. GGB’s bearing products typically perform as sleeve bearings or thrust washers under conditions of no lubrication, minimal lubrication or pre-lubrication and are used in a wide variety of markets such as the automotive, pump and compressor, construction, power generation and general industrial markets. GGB has approximately 20,000 bearing part numbers of different designs and physical dimensions. GGB® is a leading and well recognized brand name and sells products under the DU®, DP®, DX®, DS™, HX™, EP™, SY™ and GAR-MAX™ names.
CPI designs, manufactures sells and services components for reciprocating compressors and engines. These components, which include packing and wiper rings, piston and rider rings, compressor valve assemblies, divider block valves, compressor monitoring systems, lubrication systems and related components, are utilized primarily in the refining, petrochemical, natural gas gathering, storage and transmission, and general industrial markets. Brand names for our products include Hi-Flo™, Valvealert™, Mentor™, Triple Circle™, CPI Special Polymer Alloys™, Twin Ring™, Liard™, Pro Flo™, Neomag™, CVP™, XDC™, POPR™ and Protecting Compressor World Wide™.
Customers
The Engineered Products segment sells its products to a diverse customer base using a combination of direct sales and independent distribution networks worldwide, with approximately 73% of sales delivered to customers outside the United States in 2013. GGB has customers worldwide in all major industrial sectors, and supplies products directly to customers through GGB’s own local distribution system and indirectly to the market through independent agents and distributors with their own local networks. CPI sells its products and services globally through its internal salesforce, independent sales representatives, distributors and service centers. Representative customers are shown in the segment overview table above. In 2013, no single customer accounted for more than 3% of segment revenues.
Raw Materials
GGB’s major raw material purchases include steel coil, bronze powder, bronze coil, PTFE and aluminum. GGB sources components from a number of external suppliers. CPI’s major raw material purchases include PTFE, PEEK, compound additives, bronze, steel, and stainless steel bar stock. We believe all of these raw materials and components are readily available from various suppliers.
Power Systems Segment
Our Power Systems segment designs, manufactures, sells and services heavy-duty, medium-speed diesel, natural gas and dual-fuel reciprocating engines. We market these products and services under the Fairbanks Morse Engine™ brand name. Products in this segment include licensed heavy-duty, medium-speed diesel, natural gas and dual fuel reciprocating engines, in addition to our own designs. The reciprocating engines range in size from 700 to 31,970 horsepower and from five to 20 cylinders. The government and the general industrial market for marine propulsion, power generation, and pump and compressor applications use these products. We have been building engines for over 115 years under the Fairbanks Morse Engine™ brand name and we have a large installed base of engines for which we supply aftermarket parts and service. Fairbanks Morse Engine has been a key supplier to the U.S. Navy for medium-speed diesel engines and has supplied engines to the U.S. Navy for over 70 years.
56
Customers
Our Power Systems segment sells its products and services to customers worldwide, including major shipyards, municipal utilities, institutional and industrial organizations, sewage treatment plants, nuclear power plants and offshore oil and gas platforms, with approximately 4% of sales delivered to customers outside the United States in 2013. We market our products through a direct sales force of engineers in North America and through independent agents worldwide. Representative customers are shown in the segment overview table above. In 2013, the largest customer accounted for approximately 21% of segment revenues.
Raw Materials and Components
The Power Systems segment purchases multiple ferrous and non-ferrous castings, forgings, plate stock and bar stock for fabrication and machining into engines. In addition, we buy a considerable amount of precision-machined engine components. We believe all of these raw materials and components are readily available from various suppliers, but may be subject to long and variable lead times.
Garlock Sealing Technologies
On June 5, 2010, three of our subsidiaries, GST LLC, Anchor and Garrison, filed voluntary petitions for reorganization under Chapter 11 of the United States Bankruptcy Code in the Bankruptcy Court. The filings were the initial step in an asbestos claims resolution process. The filings did not include EnPro Industries, Inc., or any other EnPro Industries, Inc. operating subsidiary. GST LLC now operates in the ordinary course under court protection from asbestos claims. All pending litigation against GST is stayed during the bankruptcy process. For the last twelve months ended June 30, 2014, GST generated $238 million in net sales and $58 million in Adjusted EBITDA, and at June 30, 2014 its aggregate cash and cash equivalents and investments in marketable securities were $216 million.
The financial results of GST and subsidiaries are included in our consolidated results through June 4, 2010, the day prior to the Petition Date. However, GAAP requires an entity that files for protection under the U.S. Bankruptcy Code, whether solvent or insolvent, whose financial statements were previously consolidated with those of its parent, as GST’s and its subsidiaries’ were with ours, generally must be prospectively deconsolidated from the parent and the resulting investment to be accounted for using the cost method. Prior to its deconsolidation effective on the Petition Date, GST LLC and its subsidiaries operated as part of the Garlock group of companies within EnPro’s Sealing Products segment. GST LLC designs, manufactures and sells sealing products, including metallic, non-metallic and composite material gaskets, rotary seals, compression packing, resilient metal seals, elastomeric seals, hydraulic components, and expansion joints. GST LLC and its subsidiaries operate five primary manufacturing facilities, including GST LLC’s operations in Palmyra, New York and Houston, Texas.
On May 29, 2014, GST filed an amended proposed plan of reorganization that provides $275 million in total funding for (a) the treatment of present and future asbestos claims against GST that have not been resolved by settlement or verdict prior to the Petition Date, and (b) administrative and litigation costs. The $275 million is to be funded by GST ($245 million) and Coltec ($30 million), through two facilities—a settlement facility (which would receive $245 million) and a litigation facility (which would receive $30 million). Funds contained in the settlement facility and the litigation facility would provide the exclusive remedies for current and future GST asbestos claimants other than claimants whose claims had been resolved by settlement or verdict prior to the Petition Date and were not paid prior to the Petition Date. The plan provides that GST will pay in full claims that had been resolved by settlement or verdict prior to the Petition Date that were not paid prior to the Petition Date (with respect to claims resolved by verdict, such payment will be made only to the extent the verdict becomes final). The amount of such claims resolved by verdict is $2.4 million. GST estimates the range of its aggregate liability for such unpaid settled asbestos claims to be from $3.1 million to $16.4 million. The plan incorporates the Bankruptcy Court’s determination in January 2014 that $125 million is sufficient to satisfy GST’s aggregate
57
liability for present and future mesothelioma claims (although such determination is currently the subject of the motion by the Current Asbestos Claimants Committee to reopen the record); however, it also provides additional funds to provide full payment for non-mesothelioma claims and to support a feasibility determination. Under the terms of the plan, we would retain 100% of the equity interests of GST LLC.
If the plan is confirmed by the Bankruptcy Court and is consummated, GST will be re-consolidated with our results for financial reporting purposes. The plan is subject to confirmation by the Bankruptcy Court and we cannot assure you that GST will be able to obtain necessary Bankruptcy Court approval of the plan, including the settlement of asbestos claims and related releases of claims against us included therein or what the final terms of such plan will be at consummation, and that the plan will become effective or that the asbestos claimants will not be successful in their attempt to have the record on the Bankruptcy Court’s determination reopened. See “Risk Factors—We cannot assure you that GST will be able to obtain Bankruptcy Court approval of its amended plan of reorganization and the settlement and resolution of claims and related releases of liability embodied therein or what the final terms of such plan will be at consummation, and the time period for the resolution of the bankruptcy proceedings is not presently determinable.”
Competition
We compete with a number of competitors in each of our segments. Although it varies by products, competition is based primarily on performance of the product for specific applications, product reliability, availability and price. Our leading brand names, including Garlock® and STEMCO®, have been built upon long-standing reputations for reliability and durability. In addition, we believe the breadth, performance and quality of our product offerings allow us to achieve premium pricing and have made us a preferred supplier among our agents and distributors in many of our businesses. Key competitors for the Sealing Products segment include Federal-Mogul Corporation, A.W. Chesterton Company and SKF USA Inc. Key competitors for the Engineered Products segment include Federal-Mogul Corporation and Saint-Gobain’s Norglide division. Key competitors for the Power Systems segment include MTU, Caterpillar Inc., and Wartsila Corporation.
Competitive Strengths
We believe the following strengths provide us with significant competitive advantages as we execute our business strategy:
Our Brands Set Industry Standards and Drive a Portfolio of Highly Repeatable, Stable Businesses
Our leading brands, including Garlock®, STEMCO®, GGB® and Fairbanks Morse Engine™, have legacies ranging from 60 to 125 years. We believe that the products sold under these leading brands are well established and highly recognized in their respective markets, and, in our flagship product lines, we hold leading market positions. In many cases, we expect our products are the products of choice for our customers given our long-standing histories of reliable performance in demanding and critical applications. We believe many of our products set industry standards around safety, emissions control, reliability, and performance. And we were among the first to market with a number of products, including opposed piston engines, non-asbestos sealing products, high-performance PTFE gaskets, metal-polymer bearings, and zero-PFOA (perfluorooctanoic acid) bearings. A meaningful percentage of our sales is generated by products that are either sole-sourced or customer-specified. The focus of our brand and business model has been, and continues to be, developing premium quality products that meet demanding performance standards, providing customers with focused service and support, and developing and nurturing enduring customer relationships.
Many of Our Products Perform in Demanding Environments and Serve Critical Applications
Many of our products support critical applications in demanding environments such as those characterized by high pressure, high temperature, chemical corrosion and demand for zero failure. Notable examples include sealing products for nuclear reactor pressure vessels; seals, bearings and related products for
58
aircraft engines and landing gear; wheel-end and brake products for Class 8 trucks; and engines that provide propulsion or auxiliary power for U.S. Navy vessels. We believe many of our products’ long-standing histories of performance reliability in demanding environments and for critical applications provide significant commercial advantages, leading to value-based pricing opportunities that drive premium margins and capital returns. In addition, some applications in which our products serve are characterized by high customer switching costs, due to both the critical nature of the application and the specification process.
Our Highly Diversified Business Portfolio Leads to Stable Cash Flows
Our sales are generated across a broad range of industries and geographies. We serve more than 30 end markets, and approximately 45% of our 2013 net sales were from sales of our products outside of the United States. A slowdown in a specific industry or economy can be offset by an uptick in other markets, providing confidence in our ability to sustain profitability and stable cash flows over time. We also have a strong mix of aftermarket and OEM customers. In 2013, approximately 48% of our net sales were to aftermarket customers and 52% to OEM customers. Much of our OEM business is platform-based and sole-sourced, resulting in very low product displacement. Additionally, our large installed base of products generates a steady recurring aftermarket revenue stream.
We Have Positioned Our Company for Growth and Continuous Improvement
Since our spin-off from Goodrich Corporation (“Goodrich”) in 2002, we have systematically refined our business mix and model, and we are well positioned for future growth and continuous operational improvement. Initiatives undertaken include the following:
| • | We have streamlined our mix of businesses, divesting a large division (Quincy Compressor) and several small, non-strategic business units. We have reinvested fully the proceeds of those divestitures into businesses that fit strategically with our operating divisions and that provide new products, new technologies and new or expanded geographic reach. In the process, we have refined our acquisition processes and developed a formal playbook for a strategy-driven conservative approach to managing our portfolio. We have expanded globally through both acquisitions and organic initiatives, particularly in Asia, South America and the Middle East. |
| • | We have developed a comprehensive supply chain management process and currently have 38 category teams managing 85% of our total spend, targeting annual savings of 3% through the business cycle. |
| • | We have developed a world-class safety program and culture and are one of only three companies to be recognized on two separate occasions by EHS Today as America’s Safest Company. |
| • | We have invested heavily in our infrastructure with major facility upgrades and ERP implementations in all of our operating divisions. And we have developed an EnPro global manufacturing and commercial business model through cross-division collaboration and external benchmarking. |
| • | On the commercial front, we recently added the roles of Chief Innovation Officer and Chief Customer Officer to the responsibilities of two of our senior executives. |
The EnPro Senior Executive Team is Composed of Members with Diverse Educational and Functional Backgrounds and Demonstrated Track Records of Success
Our executive management team is led by Steve Macadam, President and Chief Executive Officer, who has served in this capacity for the past six years. Prior to joining EnPro, Mr. Macadam was CEO of two other industrial companies and a senior operating executive at a third manufacturer, all following an earlier career as Principal with McKinsey & Company. Others on the EnPro senior team bring a diverse mix of educational and
59
functional backgrounds and demonstrated records of success at both EnPro and in their roles prior to joining EnPro. The varied backgrounds include experience with companies such as W.L. Gore, General Electric, General Motors, Federal-Mogul and with professional consulting and accounting firms such as McKinsey and Ernst & Young. Dale Herold, President of the Garlock family of companies and Chief Customer Officer, and Ken Walker, Engineered Products Segment President, both have strong technical commercial backgrounds. Jon Cox, Stemco Group President and Chief Innovation and Information Officer, has deep experience in new product development. Marvin Riley, President of Fairbanks Morse Engine (the Power Systems segment), held senior manufacturing positions prior to his current role.
Business Strategy
We seek to take advantage of our competitive strengths to execute our growth and cost reduction strategies and, as a result, to maximize our free cash flow. Examples include:
Capitalize on Secular Growth Trends in Core Lines of Business
We serve a diverse group of markets and geographies and seek to invest in, and capture the benefits of, positive secular trends.
In our Sealing Products segment, our Garlock business has benefitted recently from its significant presence in domestic and international hydrocarbon processing markets and from market demands for products that protect the environment from leaks and emissions. Garlock is also focusing on expansion into less cyclical end markets such as food and pharmaceutical markets. Stemco is currently experiencing growth in its core trailer market as trailer build rates and truck loadings have been strong. Stemco is also capitalizing on its products that enhance highway safety and on regulatory trends addressing stopping distance, brake quality and fuel efficiency. At Technetics Group, we are benefitting from strength in the semiconductor and aerospace markets.
In our Engineered Products segment, we believe growth at GGB will be driven by more favorable conditions in the European automotive market and more generally as a result of economic strengthening in both North America and Europe. GGB will continue to pursue incremental growth through efforts to convert legacy roller bearing applications in the U.S. to high performing and less costly plain bearings. We also seek to gain share in China as premium quality auto production develops to serve a rising middle class. At CPI, we have grown historically through acquisition-driven geographic expansion and adjacent product line additions and are currently undergoing a broad-based business transformation to realize the full value of these prior strategic moves. We anticipate future benefits with positive secular trends in the hydrocarbon processing and natural gas markets.
In our Power Systems segment, Fairbanks Morse Engine is a significant supplier to the U.S. Navy and has a leading market share in the U.S. nuclear market. Future growth is anticipated to come primarily from new initiatives underway to expand in commercial markets. Currently, we are developing a next generation opposed piston engine (OP 2.0) that, if successful, will provide increased opportunities in commercial markets. In addition, Fairbanks Morse Engine recently announced a new agreement with MAN Diesel that will provide Fairbanks Morse Engine with additional products for sale to the U.S. power generation market. Fairbanks Morse Engine has entered into other agreements that provide access to products for sale to its core marine and power generation markets.
Drive Growth through Product Innovation
We seek to drive growth by enhancing our product and technology offerings. Within our Sealing Products segment, we are working to adapt the Garlock family of products to meet the needs of the food and pharmaceutical markets. At Stemco, we have an established track record of new product development and a number of product innovation initiatives underway in the business’s wheel-end, brake and suspension components groups. At Technetics, we are expanding our product offerings for the aerospace, semiconductor,
60
nuclear and oil & gas markets through close customer collaboration and active partnerships with companies like Airbus, Applied Materials, and the French nuclear agency (CEA). In our Power Systems segment, we are working to develop and commercialize the next generation opposed piston engine (OP 2.0). We plan to continue the development of proprietary products as a means to differentiate ourselves from our competitors and grow our business. These efforts are supported by an enterprise-wide focus on innovation led by our recently appointed Chief Innovation Officer.
Capture Growth via Geographic Expansion
While our primary markets are the developed economies of North America and Europe, we have expanded selectively in Eastern Europe, Asia, South America, the Middle East and Africa since the 2002 spin-off from Goodrich Corporation. All of our operating divisions other than Fairbanks Morse Engine now have a presence in Asia where our focus, with the exception of Stemco, is serving the local market. In the case of Stemco, we established a facility in China to produce wheel-end bearings for export to the U.S. We will continue to expand geographically in areas, and with customers, that value our high-performance products and service capabilities.
Supplement Organic Growth with Strategic Acquisitions
In addition to new product development and geographic expansion, acquisitions provide a means for expanding our addressable market through adding new products and technologies and helping us enter new markets. We maintain a disciplined and conservative acquisition approach that is grounded in business strategy and that incorporates all aspects of the acquisition process, including target identification, valuation and negotiation, due diligence, integration and post-closing business planning and execution. Our acquisition focus has led to a ten-fold increase in Stemco’s addressable market over the past five years, establishment of the Technetics Group to focus on high-performance sealing and related products, expansion of Garlock’s pipeline products business and expansion of Compressor Product International’s service capability and geographic reach. At Stemco, we have significant room to capture share in our expanded addressable market based on brand strength, channel strategy and sales excellence. Since the spinoff from Goodrich in 2002, we have invested approximately $580 million in acquisitions at an average price to EBITDA multiple of 7.1x.
Ongoing Focus on Cost Containment and Continuous Improvement
We continue to seek opportunities to lower manufacturing costs by optimizing our production footprint, implementing new manufacturing practices and processes and investing in capital equipment to increase manufacturing efficiencies and improve product quality. We will continue to manage our total supply spend through the work of our 38 category teams with the goal of realizing annual savings of 3% through the business cycle. In addition, we expect to benefit from the investments made in new ERP systems.
Corporate Information
We were incorporated under the laws of the State of North Carolina on January 11, 2002, as a wholly owned subsidiary of Goodrich Corporation. The incorporation was in anticipation of Goodrich’s announced distribution of its Engineered Industrial Products segment to existing Goodrich shareholders. The distribution took place on May 31, 2002. Our principal executive offices are located at 5605 Carnegie Boulevard, Suite 500, Charlotte, North Carolina 28209 and our telephone number is (704) 731-1500. Our common stock is listed on the New York Stock Exchange under the symbol “NPO.” We maintain an Internet website at www.enproindustries.com; however, the information on our website is not part of this offering memorandum, and you should rely only on the information contained in this offering memorandum and in the documents incorporated by reference into this offering memorandum when making a decision whether to invest in the notes.
61
Acquisitions and Dispositions
In March 2014, we acquired the remaining interest of the Stemco Crewson LLC joint venture. We now own all of the ownership interests in Stemco Crewson LLC. The joint venture was formed in 2009 with joint venture partner Tramec, LLC to expand our brake product offering to include automatic brake adjusters. The purchase of the remaining interest in the joint venture will allow us to accelerate investment in new product development and commercial strategies focused on market share growth for these products.
In March 2014, we also acquired the business of Strong-Tight Co. Ltd., a manufacturer and seller of gaskets and industrial sealing products by acquiring certain assets and assuming certain liabilities of the business. This acquisition adds an established Asian marketing presence and manufacturing facilities from which we can serve the Asian market.
Both of the acquired businesses are included in our Sealing Products segment. The total purchase price of these acquisitions was $5.6 million, of which $1.9 million was paid in March 2014, net of cash acquired, with the remainder to be paid in several installments later in 2014 and subsequent to 2014.
In January 2013, we acquired certain assets and assumed certain liabilities of a small distributor of industrial seals in Singapore which is managed as part of the Garlock operations in the Sealing Products segment. The acquisition was paid for with $2.0 million of cash.
In April 2012, the Company acquired Motorwheel Commercial Vehicle Systems, Inc. (“Motorwheel”). Motorwheel is a leading U.S. manufacturer of lightweight brake drums for heavy-duty trucks and other commercial vehicles. Motorwheel also sells wheel-end component assemblies for the heavy-duty market, sells fasteners for wheel-end applications and provides related services to its customers, including product development, testing and certification. The business operates manufacturing facilities in Chattanooga, Tennessee and Berea, Kentucky. Motorwheel is managed as part of the Stemco operations in the Sealing Products segment.
We paid for the Motorwheel acquisition with approximately $85 million of cash, which was funded by additional borrowings from our revolving credit facility. We allocated the purchase price of the business to the assets acquired and liabilities assumed based on their estimated fair values. The excess of the purchase price over the identifiable assets acquired less the liabilities assumed was reflected as goodwill.
In August 2011, we acquired certain assets and assumed certain liabilities of PI Bearing Technologies, a privately held manufacturer of bearing blocks and other bearing products used in fluid power applications, and a distributor of high performance plain bearing products used in industrial applications. The business is located in Waukegan, Illinois and is part of our Engineered Products segment.
In July 2011, we acquired Tara Technologies Corporation (“Tara”), a privately-held company that offers highly engineered products and solutions to the semiconductor, aerospace, energy and medical markets. The business, part of our Sealing Products segment, has facilities in Daytona Beach, Florida, San Carlos, California and Singapore.
In February 2011, we acquired the Mid Western group of companies, a privately-owned business primarily serving the oil and gas drilling, production and processing industries of western Canada. Mid Western services and rebuilds reciprocating compressors, designs and installs lubrication systems, and services and repairs a variety of other equipment used in the oil and gas industry. The business has locations in Calgary, Edmonton and Grand Prairie, Alberta and is part of our Engineered Products segment.
In February 2011, we acquired the business of Pipeline Seal and Insulator, Inc. and its affiliates (“PSI”), a privately-owned group of companies that manufacture products for the safe flow of fluids through pipeline transmission and distribution systems worldwide. The PSI business primarily serves the global oil and gas industry and water and wastewater infrastructure markets. The business’s products include flange sealing and
62
flange isolation products; pipeline casing spacers/isolators; casing end seals; the original Link-Seal® modular sealing system for sealing pipeline penetrations into walls, floors, ceilings and bulkheads; hole forming products; manhole infiltration sealing systems; and safety-related signage for pipelines. The business has manufacturing locations in the United States, Germany and the United Kingdom, and is part of our Sealing Products Segment.
In January 2011, we acquired certain assets and assumed certain liabilities of Rome Tool & Die, Inc., a leading supplier of steel brake shoes to the North American heavy-duty truck market. The business is part of our Sealing Products segment and is located in Rome, Georgia.
We paid for the acquisitions completed during 2011 with $228.2 million in cash, which included $99.2 million for the purchase of PSI. Additionally, there were approximately $2.2 million of acquisition-related costs recorded during 2011. We allocated the purchase prices of the acquired businesses to the assets acquired and liabilities assumed based on their estimated fair values. The excess of the purchase prices over the identifiable assets acquired less the liabilities assumed was reflected as goodwill.
Research and Development
The goal of our research and development effort is to strengthen our product portfolios for traditional markets while simultaneously creating distinctive and breakthrough products. We utilize a process to move product innovations from concept to commercialization, and to identify, analyze, develop and implement new product concepts and opportunities aimed at business growth.
We employ scientists, engineers and technicians throughout our operations to develop, design and test new and improved products. We work closely with our customers to identify issues and develop technical solutions. The majority of our research and development spending typically is directed toward the development of new sealing products for the most demanding environments, the development of truck and trailer fleet information systems, the development of bearing products and materials with increased load carrying capability and superior friction and wear characteristics, and the development of engine products to meet current and future emissions requirements while improving fuel efficiencies.
Quality Assurance
We believe product quality is among the most important factors in developing and maintaining strong, long-term relationships with our customers. In order to meet the exacting requirements of our customers, we maintain stringent standards of quality control. We routinely employ in-process inspection by using testing equipment as a process aid during all stages of development, design and production to ensure product quality and reliability. These include state-of-the-art CAD/CAM equipment, statistical process control systems, laser tracking devices, failure mode and effect analysis, and coordinate measuring machines. We are able to extract numerical quality control data as a statistical measurement of the quality of the parts being manufactured from our CNC machinery. In addition, we perform quality control tests on parts that we outsource. As a result, we are able to significantly reduce the number of defective parts and therefore improve efficiency, quality and reliability.
As of June 30, 2014, 44 of our manufacturing facilities were ISO 9000, QS 9000 and/or TS 16949 certified. Seventeen of our facilities are ISO 14001 certified. OEMs are increasingly requiring these standards in lieu of individual certification procedures and as a condition of awarding business.
Patents, Trademarks and Other Intellectual Property
We maintain a number of patents and trademarks issued by the U.S. and other countries relating to the name and design of our products and have granted licenses to some of these patents and trademarks. We routinely evaluate the need to protect new and existing products through the patent and trademark systems in the U.S. and other countries. We also have unpatented proprietary information, consisting of know-how and trade secrets relating to the design, manufacture and operation of our products and their use. We do not consider our
63
business as a whole to be materially dependent on any particular patent, patent right, trademark, trade secret or license granted or group of related patents, patent rights, trademarks, trade secrets or licenses granted.
In general, we are the owner of the rights to the products that we manufacture and sell. However, we also license patented and other proprietary technology and processes from various companies and individuals in order to broaden our product offerings. We are dependent on the ability of these third parties to diligently protect their intellectual property rights. In several cases, the intellectual property licenses are integral to the manufacture of our products. For example, Fairbanks Morse Engine licenses technology from MAN Diesel and its subsidiaries for certain of the four-stroke reciprocating engines it produces. The terms of the licenses vary by engine type, with one set of licenses set to expire in 2014 currently in the process of being renewed for a multi-year period, while licenses for the remaining engine types have terms, subject to potential renewal, expiring in 2018 or 2019. A loss of these licenses or a failure on the part of the licensor to protect its own intellectual property could reduce our revenues. These licenses are subject to renewal and it is possible we may not successfully renegotiate these licenses or they could be terminated for a material breach. If this were to occur, our business, financial condition, results of operations and cash flows could be adversely affected.
Employees and Labor Relations
At December 31, 2013, we had approximately 4,600 employees worldwide in our consolidated operations. Approximately 2,400 employees are located within the U.S., and approximately 2,200 employees are located outside the U.S., primarily in Europe, Canada and China. At December 31, 2013, approximately 15% of the U.S. employees of our consolidated operations were members of trade unions covered by three collective bargaining agreements, which agreements provide for contract termination dates from August 2014 to November 2018. Union agreements relate, among other things, to wages, hours, and conditions of employment. The wages and benefits furnished are generally comparable to industry and area practices. Our deconsolidated subsidiaries, primarily GST LLC, have about 1,000 additional employees worldwide.
Facilities
We are headquartered in Charlotte, North Carolina and have 60 primary manufacturing facilities in 13 countries, including the U.S. The following table outlines the location, business segment and size of our largest facilities, along with whether we own or lease each facility:
| Location |
Segment |
Owned/ Leased |
Size (Square Feet) |
|||||||
| U.S. |
||||||||||
| Palmyra, New York* |
Sealing Products | Owned | 690,000 | |||||||
| Berea, Kentucky |
Sealing Products | Owned | 240,000 | |||||||
| Longview, Texas |
Sealing Products | Owned | 219,000 | |||||||
| Rome, Georgia |
Sealing Products | Leased | 160,000 | |||||||
| Paragould, Arkansas |
Sealing Products | Owned | 142,000 | |||||||
| Thorofare, New Jersey |
Engineered Products | Owned | 120,000 | |||||||
| Beloit, Wisconsin |
Power Systems | Owned | 433,000 | |||||||
| Foreign |
||||||||||
| Mexico City, Mexico* |
Sealing Products | Owned | 131,000 | |||||||
| Neuss, Germany |
Sealing Products | Leased | 146,000 | |||||||
| Saint Etienne, France |
Sealing Products | Owned | 108,000 | |||||||
| Annecy, France |
Engineered Products | Owned | 196,000 | |||||||
| Heilbronn, Germany |
Engineered Products | Owned | 127,000 | |||||||
| Sucany, Slovakia |
Engineered Products | Owned | 109,000 | |||||||
| * | These facilities are owned by GST LLC or one of its subsidiaries, which were deconsolidated from our Consolidated Financial Statements on the Petition Date. |
64
Our manufacturing capabilities are flexible and allow us to customize the manufacturing process to increase performance and value for our customers and meet particular specifications. We also maintain numerous sales offices and warehouse facilities in strategic locations in the U.S., Canada and other countries. We believe our facilities and equipment are generally in good condition and are well maintained and able to continue to operate at present levels.
65