Attached files
| file | filename |
|---|---|
| EX-10.13 - EX-10.13 - Dave & Buster's Entertainment, Inc. | d735753dex1013.htm |
| EX-21.1 - EX-21.1 - Dave & Buster's Entertainment, Inc. | d735753dex211.htm |
| EX-10.11 - EX-10.11 - Dave & Buster's Entertainment, Inc. | d735753dex1011.htm |
| EX-23.1 - EX-23.1 - Dave & Buster's Entertainment, Inc. | d735753dex231.htm |
| EX-10.8 - EX-10.8 - Dave & Buster's Entertainment, Inc. | d735753dex108.htm |
| EX-10.14 - EX-10.14 - Dave & Buster's Entertainment, Inc. | d735753dex1014.htm |
Table of Contents
As filed with the Securities and Exchange Commission on September 8, 2014
Registration No. 333-
UNITED STATES
SECURITIES AND EXCHANGE COMMISSION
WASHINGTON, D.C. 20549
FORM S-1
REGISTRATION STATEMENT
UNDER
THE SECURITIES ACT OF 1933
Dave & Buster’s Entertainment, Inc.
(Exact name of registrant as specified in its charter)
| Delaware | 5812 | 35-2382255 | ||
| (State or other jurisdiction of incorporation or organization) |
(Primary Standard Industrial Classification Code Number) |
(I.R.S. Employer Identification Number) |
2481 Mañana Drive
Dallas, Texas 75220
(214) 357-9588
(Address, including zip code, and telephone number, including area code, of registrant’s principal executive offices)
Stephen M. King
Chief Executive Officer
Dave & Buster’s Entertainment, Inc.
2481 Mañana Drive
Dallas, Texas 75220
(214) 357-9588
(Name, address, including zip code, and telephone number, including area code, of agent for service)
Copies to:
| Corey R. Chivers, Esq. Alexander D. Lynch, Esq. Weil, Gotshal & Manges LLP 767 Fifth Avenue New York, New York 10153 (212) 310-8000 (Phone) (212) 310-8007 (Fax) |
Marc D. Jaffe, Esq. Ian D. Schuman, Esq. Latham & Watkins LLP 885 Third Avenue, Suite 1000 New York, New York 10022 (212) 906-1200 (Phone) (212) 751-4864 (Fax) |
Approximate date of commencement of proposed sale to the public: As soon as practicable after the effective date of this registration statement.
If any of the securities being registered on this Form are to be offered on a delayed or continuous basis pursuant to Rule 415 under the Securities Act of 1933, check the following box. ¨
If this Form is filed to register additional securities for an offering pursuant to Rule 462(b) under the Securities Act, check the following box and list the Securities Act registration statement number of the earlier effective registration statement for the same offering. ¨
If this Form is a post effective amendment filed pursuant to Rule 462(c) under the Securities Act, check the following box and list the Securities Act registration statement number of the earlier effective registration statement for the same offering. ¨
If this Form is a post effective amendment filed pursuant to Rule 462(d) under the Securities Act, check the following box and list the Securities Act registration statement number of the earlier effective registration statement for the same offering. ¨
Indicate by check mark whether the registrant is a large accelerated filer, an accelerated filer, a non-accelerated filer, or a smaller reporting company. See the definitions of “large accelerated filer,” “accelerated filer” and “smaller reporting company” in Rule 12b-2 of the Exchange Act.
| Large accelerated filer ¨ | Accelerated filer ¨ | Non-accelerated filer x | Smaller reporting company ¨ |
CALCULATION OF REGISTRATION FEE
|
| ||||
| TITLE OF EACH CLASS OF SECURITIES TO BE REGISTERED |
PROPOSED MAXIMUM AGGREGATE |
AMOUNT OF REGISTRATION FEE (3) | ||
| Common Stock, $0.01 par value |
$100,000,000 | $12,880 | ||
|
| ||||
|
| ||||
| (1) | Includes shares of common stock that may be purchased by the underwriters under their option to purchase additional shares of common stock, if any. |
| (2) | Estimated solely for the purpose of calculating the registration fee in accordance with Rule 457(o) promulgated under the Securities Act of 1933, as amended. |
| (3) | A registration fee in the amount of $17,415 was previously paid by the registrant in connection with the filing of a Registration Statement on Form S-1 (Registration No. 333-175616) on July 15, 2011. Pursuant to Rule 457(p) under the Securities Act of 1933, as amended, the filing fee of $17,415 previously paid by the registrant is being used to offset the filing fee of $12,880 required for the filing of this Registration Statement. |
The registrant hereby amends this registration statement on such date or dates as may be necessary to delay its effective date until the registrant shall file a further amendment which specifically states that this registration statement shall thereafter become effective in accordance with Section 8(a) of the Securities Act of 1933 or until the registration statement shall become effective on such date as the Commission, acting pursuant to Section 8(a), may determine.
Table of Contents
The information in this preliminary prospectus is not complete and may be changed. These securities may not be sold until the registration statement filed with the Securities and Exchange Commission is effective. This preliminary prospectus is not an offer to sell nor does it seek an offer to buy these securities in any state where the offer or sale is not permitted.
Subject to Completion Dated September 8, 2014
PRELIMINARY PROSPECTUS
Shares

Dave & Buster’s Entertainment, Inc.
Common Stock
We are offering shares of our common stock. This is our initial public offering and no public market currently exists for our common stock. We expect the initial public offering price to be between $ and $ per share. We have applied to list our common stock on The NASDAQ Stock Market LLC (“NASDAQ”) under the symbol “PLAY.”
Dave & Buster’s Entertainment, Inc. is an “emerging growth company” as defined in the Jumpstart Our Business Startups Act of 2012 (the “JOBS Act”).
Investing in our common stock involves a high degree of risk. See “Risk Factors” beginning on page 19 of this prospectus.
Neither the Securities and Exchange Commission nor any state securities commission has approved or disapproved of these securities or determined if this prospectus is truthful or complete. Any representation to the contrary is a criminal offense.
| PER SHARE | TOTAL | |||||||
| Initial public offering price |
$ | $ | ||||||
| Underwriting discounts and commissions (1) |
$ | $ | ||||||
| Proceeds to us, before expenses |
$ | $ | ||||||
| (1) | We refer you to “Underwriting” beginning on page 119 of this prospectus for additional information regarding total underwriter compensation. |
Delivery of the shares of common stock is expected to be made on or about , 2014. We have granted the underwriters an option for a period of 30 days to purchase an additional shares of our common stock. If the underwriters exercise the option in full, the total underwriting discounts and commissions payable by us will be $ , and the total proceeds to us, before expenses, will be $ .
| Jefferies | Piper Jaffray | |||
| William Blair | Raymond James | Stifel |
| LOYAL3 Securities |
Preliminary Prospectus dated , 2014.
Table of Contents

Table of Contents

Table of Contents

Table of Contents
| PAGE | ||||
| 1 | ||||
| 19 | ||||
| 35 | ||||
| 36 | ||||
| 37 | ||||
| 38 | ||||
| 39 | ||||
| 41 | ||||
| MANAGEMENT’S DISCUSSION AND ANALYSIS OF FINANCIAL CONDITION AND RESULTS OF OPERATIONS |
47 | |||
| 71 | ||||
| 83 | ||||
| 90 | ||||
| 104 | ||||
| 106 | ||||
| 110 | ||||
| 114 | ||||
| CERTAIN MATERIAL UNITED STATES FEDERAL INCOME AND ESTATE TAX CONSIDERATIONS |
116 | |||
| 119 | ||||
| 125 | ||||
| 125 | ||||
| 125 | ||||
| F-1 | ||||
You should rely only on the information contained in this prospectus. We have not, and the underwriters have not, authorized any other person to provide you with different information. If anyone provides you with different or inconsistent information, you should not rely on it. We are not, and the underwriters are not, making an offer to sell these securities in any jurisdiction where the offer or sale is not permitted. You should assume that the information appearing in this prospectus is only accurate as of the date on the front cover of this prospectus. Our business, financial condition, results of operations and prospects may have changed since that date.
No dealer, salesperson or other person is authorized to give any information or to represent anything not contained in this prospectus. You must not rely on any unauthorized information or representations. This prospectus is an offer to sell only the shares offered hereby, but only under circumstances and in jurisdictions where it is lawful to do so. The information contained in this prospectus is current only as of its date.
Table of Contents
BASIS OF PRESENTATION
Certain financial measures presented in this prospectus, such as Adjusted EBITDA, Adjusted EBITDA Margin, Store-level EBITDA and Store-level EBITDA margin, are not recognized terms under accounting principles generally accepted in the United States (“GAAP”). These measures exclude a number of significant items, including our interest expense and depreciation and amortization expense. For a discussion of the use of these measures and a reconciliation to the most directly comparable GAAP measures, see pages 13-18 “—Summary Historical Financial and Other Data.” We define high-volume dining and entertainment venues as those open for at least one full year and with average store revenues in excess of $5.0 million and define year one cash-on-cash return as year one Store-level EBITDA exclusive of allocated national marketing costs divided by net development costs. Net development costs include equipment, building, leaseholds and site costs, net of tenant improvement allowances received or receivable from landlords and excludes pre-opening costs and capitalized interest.
We operate on a 52 or 53 week fiscal year that ends on the Sunday after the Saturday closest to January 31. Each quarterly period has 13 weeks, except in a 53 week year when the fourth quarter has 14 weeks. All fiscal years presented herein consist of 52 weeks, except fiscal year 2012, which consisted of 53 weeks. All references to “2014,” “fiscal 2014,” “fiscal year 2014” or similar references relate to the 52 week period ending February 1, 2015. All references to “2013,” “fiscal 2013,” “fiscal year 2013” or similar references relate to the 52 week period ended February 2, 2014. All references to “2012,” “fiscal 2012,” “fiscal year 2012” or similar references relate to the 53 week period ended February 3, 2013. All references to “2011,” “fiscal 2011,” “fiscal year 2011” or similar references relate to the 52 week period ended January 29, 2012. All references to “2010,” “fiscal 2010,” “fiscal year 2010” or similar references relate to the combined results of the 244 day period ended January 30, 2011 and the 120 day period ended May 31, 2010. All references to “2009,” “fiscal 2009,” “fiscal year 2009” or similar references relate to the 52 week period ended January 31, 2010.
On June 1, 2010, Dave & Buster’s Entertainment, Inc. (“D&B Entertainment”), a newly-formed Delaware corporation owned by Oak Hill Capital Partners III, L.P. and Oak Hill Capital Management Partners III, L.P. (collectively, the “Oak Hill Funds”) acquired all of the outstanding common stock of Dave & Buster’s Holdings, Inc. (“D&B Holdings”). As a result of the acquisition and certain post-acquisition activity, the Oak Hill Funds directly control approximately 95.4% of D&B Entertainment’s outstanding common stock. GAAP requires operating results prior to the acquisition completed on June 1, 2010 to be presented as Predecessor’s results in the historical financial statements. Operating results subsequent to the acquisition are presented or referred to as Successor’s results in the historical financial statements. The presentation of combined Predecessor and Successor operating results (which is simply the arithmetic sum of the Predecessor and Successor amounts) is a non-GAAP presentation, which is provided as a convenience solely for the purpose of facilitating comparisons of the combined results with other annual periods presented.
Comparable store data presented in this prospectus relate to stores open at least 18 months as of the beginning of each of the relevant fiscal years and excludes information for our one franchised store located in Canada, which ceased operation as a Dave & Buster’s on May 31, 2013. Our store count data also excludes the one franchised store located in Canada. See “Management’s Discussion and Analysis of Financial Condition and Results of Operations.”
This prospectus also contains information regarding customer feedback, customer satisfaction, customer demographics and other similar items. This information is based upon data collected by us during the periods presented. This information is reported voluntarily by our customers and thus represents responses from only a portion of the total number of our customers. We have not independently verified any of the demographic information collected from our customers. Over the periods presented, we have changed the form of reward for completing a survey, which resulted in an increase in the percentage of completed surveys, but we do not believe this has materially impacted the results. In addition, over the periods presented, we have added and deleted questions from the questionnaires, but have not made any changes to questions eliciting responses relating to the results presented in the prospectus. We use the information collected as one measure of the performance of our stores and use it to assess the success of our initiatives to improve the quality of the product we offer.
ii
Table of Contents
TRADEMARKS, SERVICE MARKS AND TRADE NAMES
We own or have rights to use the trademarks, service marks and trade names that we use in connection with the operation of our businesses. Our registered trademarks include Dave & Buster’s®, Power Card®, Eat Drink Play® and Eat & Play Combo®. Other trademarks, service marks and trade names used in this prospectus are the property of their respective owners.
Solely for convenience, the trademarks, service marks and trade names referred to in this prospectus are listed without the ® and ™ symbols, but such references are not intended to indicate, in any way, that we will not assert, to the fullest extent under applicable law, our rights (or the rights of the applicable licensors) to these trademarks, service marks and trade names.
INDUSTRY AND MARKET DATA
This prospectus includes industry and market data that we derived from internal company records, publicly available information and industry publications and surveys such as reports from KNAPP-TRACK™. Industry publications and surveys generally state that the information contained therein has been obtained from sources believed to be reliable. We believe this data is accurate in all material respects as of the date of this prospectus. You should carefully consider the inherent risks and uncertainties associated with the industry and market data contained in this prospectus.
KNAPP-TRACK is a monthly sales and customer count tracking service for the full-service restaurant industry in the United States, which tracks over 10,400 restaurants with over $32.1 billion in total sales. Each monthly KNAPP-TRACK report aggregates the change in comparable restaurant sales and customer counts compared to the same month in the preceding year from the competitive set of participants in the full service restaurant industry. We, as well as other restaurants, use the data included in the monthly KNAPP-TRACK report as one way of benchmarking our performance.
iii
Table of Contents
This summary highlights information contained elsewhere in this prospectus and may not contain all of the information that may be important to you. Before making an investment decision, you should read this entire prospectus, including our consolidated financial statements and the related notes included elsewhere herein. You should also carefully consider the information set forth under “Risk Factors.” In addition, certain statements include forward-looking information that is subject to risks and uncertainties. See “Cautionary Statement Regarding Forward-Looking Statements.” In this prospectus, unless the context otherwise requires, “we,” “us,” “our,” the “Company” and “Dave & Buster’s” refers to Dave & Buster’s Entertainment, Inc., its subsidiaries and any predecessor companies, collectively.
Company Overview
We are a leading owner and operator of high-volume venues in North America that combine dining and entertainment for both adults and families. The core of our concept is to offer our customers the opportunity to “Eat Drink Play and Watch” all in one location. Eat and Drink are offered through a full menu of “Fun American New Gourmet” entrées and appetizers and a full selection of non-alcoholic and alcoholic beverages. Our Play and Watch offerings provide an extensive assortment of entertainment attractions centered around playing games and watching live sports and other televised events. Our customers are a balanced mix of men and women, primarily between the ages of 21 and 39, and we believe we also serve as an attractive venue for families with children and teenagers. We believe we appeal to a diverse customer base by providing a highly customizable experience in a dynamic and fun setting.
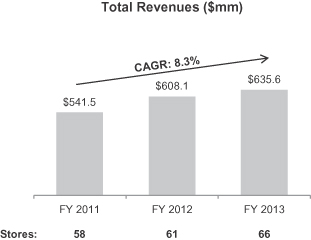
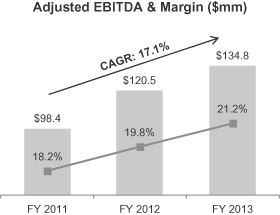
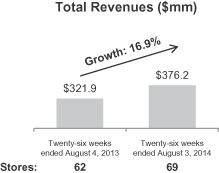
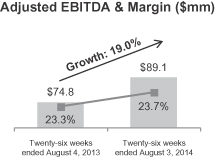
As of September 2, 2014, we owned and operated 69 stores in 26 states and Canada. For the twelve months ended August 3, 2014, we generated total revenues of $689.9 million, Adjusted EBITDA of $149.0 million (representing an Adjusted EBITDA margin of 21.6%) and a net loss of $7.7 million. For the twenty-six weeks ended August 3, 2014 and August 4, 2013, we generated total revenues of $376.2 million and $321.9 million, respectively, Adjusted EBITDA of $89.1 million and $74.8 million, respectively, and net income (loss) of $(2.4) million and $7.5 million, respectively. For fiscal 2013, we generated total revenues of $635.6 million, Adjusted EBITDA of $134.8 million (representing an Adjusted EBITDA margin of 21.2%) and net income of $2.2 million. For fiscal 2012 and fiscal 2011, we generated total revenues of $608.1 million and $541.5 million, respectively, Adjusted EBITDA of $120.5 million and $98.4 million, respectively, and net income (loss) of $8.8 million and $(7.0) million, respectively. From fiscal 2011 to fiscal 2013, total revenues and Adjusted EBITDA grew at a compound annual growth rate (“CAGR”) of 8.3% and 17.1%, respectively. We generated comparable store sales increases of 5.2%, 1.0%, 3.0% and 2.2% in the twenty-six weeks ended August 3, 2014 and fiscal 2013, 2012 and 2011, respectively.
|
|
1
Table of Contents
|
|
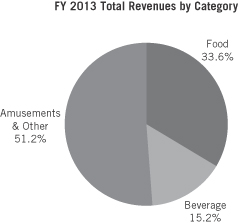
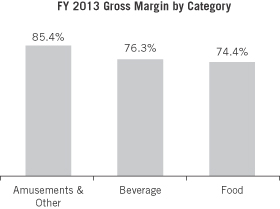
As a key feature of our business model, 51.2% of our total revenues for fiscal 2013 were from our amusement offerings, which have a relatively low variable cost component and contributed a gross margin of 85.4%. Combined with our food and beverage revenues, which comprised 48.8% of our total revenues and contributed a gross margin of 75.0% for fiscal 2013, we generated a total gross margin of 80.3%.
|
|
The formats and square footage of our stores are flexible, which we believe allows us to size new stores appropriately for each market as we grow. Our stores average 45,000 square feet and range in size between 16,000 and 66,000 square feet. We believe we have an attractive store economic model that enables us to generate high average store revenues and Store-level EBITDA. For our 55 comparable stores in fiscal 2013, our average revenues per store were $10.1 million, average Store-level EBITDA was $2.6 million and average Store-level EBITDA margin was 25.9%. Furthermore, for that same period, all of our comparable stores had positive Store-level EBITDA, with 89.1% of our stores generating more than $1.0 million of Store-level EBITDA each and 61.8% of our stores generating more than $2.0 million of Store-level EBITDA each.
Eat Drink Play and Watch—All Under One Roof
When our founders opened our first location in Dallas, Texas in 1982, they sought to create a brand with a fun, upbeat atmosphere providing interactive entertainment options for adults and families, while serving high-quality food and beverages. Since then we have followed the same principle for each new store, and in doing so we believe we have developed a distinctive brand based on our customer value proposition: “Eat Drink Play and Watch.” The interaction between playing games, watching sports, dining and enjoying our full-service bar areas is the defining feature of the Dave & Buster’s customer experience, and the layout of each store is designed to promote crossover between these activities. We believe this combination creates an experience that cannot be easily replicated at home or elsewhere without having to visit multiple destinations. Our locations are also designed to accommodate private parties, business functions and other corporate-sponsored events.
2
Table of Contents
Eat
We seek to distinguish our food menu from other casual dining concepts with our strategy of offering “Fun American New Gourmet” entrées and appetizers. Our “Fun American New Gourmet” menu is intended to appeal to a broad spectrum of customers and include classic “American” offerings with a fun twist. We believe we offer high-quality meals, including gourmet pastas, choice-grade steaks, premium sandwiches, decadent desserts and health-conscious entrée options that compare favorably to those of other higher end casual dining operators. We believe our broad menu offers something for everyone and captures full meal, snacking and sports-viewing occasions. We plan to introduce new menu items three times per year that we believe reinforce the fun of the Dave & Buster’s brand. Our food revenues accounted for 33.6% of our total revenues during fiscal 2013.
Drink
Each of our locations also offers full bar service, including a variety of beers, signature cocktails, premium spirits and non-alcoholic beverages. We continually strive to innovate our beverage offering, adding new beverages three times per year, including the introduction of fun beverage platforms such as our adult Snow Cones, CoronaRitas and Berry Blocks cocktails. Beverage service is typically available throughout the entire store, allowing for multiple sales opportunities. We believe that our high margin beverage offering is complementary to each of the Eat, Play and Watch aspects of our brand. Our beverage revenues accounted for 31.1% of our total food and beverage revenues and 15.2% of our total revenues during fiscal 2013.
Play
A key aspect of the entertainment experience at Dave & Buster’s is the games in our Midway, which we believe are the core differentiating feature of our brand. The Midway in each of our stores is an area where we offer a wide array of amusement and entertainment options, typically with over 150 redemption and simulation games. Our amusement and other revenues accounted for 51.2% of our total revenues during fiscal 2013. Redemption games, which represented 78.7% of our amusement and other revenues in fiscal 2013, offer our customers the opportunity to win tickets that are redeemable at our “Winner’s Circle,” a retail-style space in our stores where customers can redeem the tickets won through play of our redemption games for prizes ranging from branded novelty items to high-end electronics. We believe this “opportunity to win” creates a fun and highly energized social experience that is an important aspect of the Dave & Buster’s in-store experience and cannot be easily replicated at home. Our video and simulation games, many of which can be played by multiple customers simultaneously and include some of the latest high-tech games commercially available, represented 16.7% of our amusement and other revenues in fiscal 2013. Other traditional amusements represented the remainder of our amusement and other revenues in fiscal 2013.
Watch
Sports-viewing is another key component of the entertainment experience at Dave & Buster’s. All of our stores have multiple large screen televisions and high quality audio systems providing customers with a venue for watching live sports and other televised events. In fiscal 2010, we initiated a program that evolved into “D&B Sports,” which is a more immersive viewing environment that provides customers with 100+ inch high definition televisions to watch televised events and enjoy our full bar and extensive food menu. We believe that we have created an attractive and comfortable environment that includes a differentiated and interactive viewing experience that offers a new reason for customers to visit Dave & Buster’s. Through continued development of the D&B Sports concept in new stores and additional renovations of existing stores, our goal is to build awareness of D&B Sports as “the best place to watch sports” and the “only place to watch the games and play the games.”
3
Table of Contents
Our Company’s Core Strengths
We believe we benefit from the following strengths:
Strong, Distinctive Brand With Broad Customer Appeal. We believe that the multi-faceted customer experience of “Eat Drink Play and Watch” at Dave & Buster’s, supported by our national marketing, has helped us create a widely recognized brand with no direct national competitor that combines all four elements in the same way. In markets where we have stores, over 95% of casual dining consumers stated that they are aware of our brand as a dining and entertainment venue. Our customer research shows that our brand appeals to a balanced mix of male and female adults, primarily between the ages of 21 and 39, as well as families and teenagers. Based on customer survey results, we also believe that the average household income of our customers is approximately $80,000, which we believe represents an attractive demographic.
Multi-Faceted Customer Experience Highlights Our Value Proposition. We believe that our combination of interactive games, attractive television viewing areas, high-quality dining and full-service beverage offerings, delivered in a highly-energized atmosphere, provides a multi-faceted customer experience that cannot be easily replicated at home or elsewhere without having to visit multiple destinations. We aim to offer our customers a value proposition comparable or superior to many of the separately available dining and entertainment options. We are continuously working with game manufacturers and food providers to create new games and food items at compelling price points to retain and generate customer traffic and improve the customer experience. Our value proposition is enhanced by what we consider to be innovative marketing initiatives, including our Eat & Play Combo (a promotion that provides a discounted Power Card in combination with select entrées), Super Charge Power Card offerings (when purchasing or adding value to a Power Card, the customer is given the opportunity to add 25% more chips to the Power Card for a small upcharge), Half-Price Game Play (every Wednesday, from open to close, we reduce the price of every game in the Midway by one-half), Everyone’s a Winner (a limited-time offer providing a prize to every customer that purchases or adds value to a Power Card in the amount of $10 or more) and free game play promotions to feature the introduction of our new games. We believe these initiatives have helped increase customer visits and encourage customers to participate more fully across our broad range of food, beverage and entertainment offerings.
Vibrant, Contemporary Store Design That Integrates Entertainment and Dining. We believe we continue to benefit from enhancements to the Dave & Buster’s brand through our store design and D&B Sports initiatives, which began in fiscal 2011. Our new store design provides a contemporary, engaging atmosphere for our customers that includes clearly differentiated spaces designed to convey each component of our customer value proposition: “Eat Drink Play and Watch.” These store design changes include a modern approach to the finishes and layout of the store, which we believe encourages participation across each of the store’s elements. The oversized graphics and images throughout the store are intended to communicate our brand personality by being fun, contemporary and larger-than-life. The dining room décor includes booth seating and table seating and colorful artwork, often featuring local landmarks. Our Winner’s Circle provides a retail-like environment where customers can redeem their tickets for prizes. All of our new locations opened since the beginning of fiscal 2011 incorporate our new store design. We believe the introduction and continued expansion of our D&B Sports concept, currently incorporated in approximately half of our store base, provides an attractive opportunity to market our broader platform to new and existing customers through a year-round calendar of programming and promotions tied to popular sporting events and sport-related activities. The large television screens, comfortable seating, a full menu of food and beverages and artwork often featuring images of local sports teams and sports icons help create what we believe to be an exciting environment for watching sports programming. We have also strategically invested over $52.8 million since the beginning of fiscal 2011 to introduce D&B Sports and modernize the exteriors, front lobbies, bars, dining areas and “Winner’s Circles” of select locations. As of September 2, 2014, we have remodeled three stores during fiscal 2014 and by the end of fiscal 2014, approximately 65% of our stores will either be new or remodeled to adopt our new store design. All of the new or remodeled stores contain an upgraded venue for watching live sports and other televised events, and approximately 87% of these stores contain the D&B Sports concept.
4
Table of Contents
History of Margin Improvement. We have a proven track record of identifying operational efficiencies and implementing cost saving initiatives and have increased our Adjusted EBITDA margins by approximately 510 basis points from fiscal 2010 to the twelve months ended August 3, 2014. We expect our continued focus on operating margins at individual locations and the deployment of best practices across our store base to yield incremental margin improvements, although there is no guarantee that this will occur. We believe we are well-positioned to continue to increase margins and remain focused on identifying additional opportunities to reduce costs. We are currently testing an eTicket initiative, which is a paperless ticket distribution system that we plan to roll out to all of our stores during fiscal 2015. We estimate that our eTicket initiative will result in annual savings in excess of $3.0 million. We leverage our investments in technology, such as our labor scheduling system and our proprietary technology linking games with Power Cards, to increase the overall performance of our stores while also enhancing the customer experience. Power Cards are magnetic stripe cards that enable a customer to play our games. A customer purchases “chips” that are used to play our games and are loaded to a Power Card at an automated kiosk or by an employee. Our business model has a relatively lower proportion of variable costs versus fixed costs compared to our competitors. We believe this creates operating leverage and gives us the potential to further improve margins and deliver greater earnings from expected future increases in comparable store sales and new store growth. Under our current cost structure, we estimate that we will realize more than 50% flow through to Adjusted EBITDA from any comparable store sales growth.
Store Model Generates Favorable Store Economics and Strong Returns. We believe our store model offering entertainment, food and beverages provides certain benefits in comparison to traditional restaurant concepts, as reflected by our average store revenues of $10.1 million and average Store-level EBITDA margins of 25.9% for comparable stores in fiscal 2013. Our entertainment offerings have low variable costs and produced gross margins of 85.4% for fiscal 2013. With approximately half of our revenues from entertainment, we have less exposure than traditional restaurant concepts to food costs, which represented only 8.6% of our revenues in fiscal 2013. Our business model generates strong cash flow that we can use to execute our growth strategy. We believe the combination of our Store-level EBITDA margins, our refined new store formats and the fact that our stores open with high volumes that drive margins in year one will help us achieve our targeted average year one cash-on-cash returns of approximately 35% and five-year average cash-on-cash returns in excess of 25% for both our large format and small format store openings, although there is no guarantee such results will occur. The 15 stores that we have opened since the beginning of 2008 (that have been open for more than 12 months as of August 3, 2014) have generated average year one cash-on-cash returns of 42.9%. For stores opened since 2009 that have been open for more than 12 months, we have also experienced an increase in average year one cash-on-cash returns, by vintage, including our six stores opened in fiscal 2011 and fiscal 2012, which have generated average year one cash-on-cash returns of 52.4%.
Commitment to Customer Satisfaction. We aim to enhance our combination of food, beverage and entertainment offerings through our service philosophy of providing a high quality and consistent customer experience through dedicated training and development of our team members and a corporate culture that encourages employee engagement. As a result, we have experienced significant improvement in our Guest Satisfaction Survey results since we began the surveys in 2007. In 2013, 82.0% of respondents to our Guest Satisfaction Survey rated us “Top Box” (score of 5 out of a possible 5) in “Overall Experience” and 83.8% of respondents rated us “Top Box” in “Intent to Recommend.” By comparison, in 2007, 44.0% of respondents rated us “Top Box” in “Overall Experience” and 64.8% of respondents rated us “Top Box” in “Intent to Recommend.” We utilize our loyalty program to market directly to members with promotional emails and location-based marketing. Through our loyalty program, we email offers and coupons to members and notify them of new games, food, drinks and local events. In addition, members can earn game play credits based on the dollar amount of qualifying purchases at our stores. We expect that as our loyalty program grows it will be an important method of maintaining customers’ connection with our brand and further drive customer satisfaction.
5
Table of Contents
Experienced Management Team. We believe we are led by a strong senior management team averaging over 25 years of experience with national brands in all aspects of casual dining and entertainment operations. In 2006, we hired our Chief Executive Officer, Stephen King. From fiscal 2006 to the twelve months ended August 3, 2014, under the leadership of Mr. King, Adjusted EBITDA has grown by 111.4%, Adjusted EBITDA margins have increased by approximately 780 basis points and employee turnover and customer satisfaction metrics have improved significantly. Our management team has invested approximately $4.0 million of cash in the equity of Dave & Buster’s and currently owns 2.7% of our outstanding common stock. We believe that our management team’s prior experience in the restaurant and entertainment industries combined with its experience at Dave & Buster’s provides us with insights into our customer base and enables us to create the dynamic environment that is core to our brand.
Our Growth Strategies
The operating strategy that underlies the growth of our concept is built on the following key components:
Pursue New Store Growth. We will continue to pursue what we believe to be a disciplined new store growth strategy in both new and existing markets where we feel we are capable of achieving consistently high store revenues and Store-level EBITDA margins as well as strong cash-on-cash returns. We believe that the Dave & Buster’s brand is currently significantly under-penetrated, as internal studies and third-party research suggests a total store potential in the United States and Canada in excess of 200 stores (including our 69 existing stores), approximately three times our current store base. We believe our new store opportunity is split fairly evenly between large format and small format stores. We plan to open seven to eight stores in fiscal 2014, including four stores we have already opened, which we expect will be financed with available cash and operating cash flows. Thereafter, we believe that we can continue opening new stores at an annual rate of approximately 10% of our then existing store base.
Our new store expansion strategy is driven by a site selection process that allows us to evaluate and select the location, size and design of our stores based on consumer research and analysis of operating data from sales in our existing stores. Our site selection process and flexible store design enable us to customize each store with the objective of maximizing return on capital given the characteristics of the market and the location. Our large format stores are 30,001 to 45,000 square feet in size and our small format stores span 25,000 to 30,000 square feet, which provides us the flexibility to enter new smaller markets and further penetrate existing markets. These formats also provide us with the ability to strategically choose between building new stores and converting existing space, which can be more cost efficient for certain locations. We are targeting average year one cash-on-cash returns of approximately 35% for both our large format and small format stores. To achieve this return for large format stores, we target average net development costs of approximately $8.3 million and first year store revenues of approximately $11.6 million. For small format stores, we target average net development costs of approximately $6.0 million and average first year store revenues of approximately $7.5 million. Additionally, we target average year one Store-level Adjusted EBITDA margins, excluding allocated national marketing costs, of approximately 28%, for both large format and small format stores.
Grow Our Comparable Store Sales. We intend to grow our comparable store sales by seeking to differentiate the Dave & Buster’s brand from other food and entertainment alternatives, through the following strategies:
| n | Provide our customers the latest exciting games. We believe that our Midway games are the core differentiating feature of the Dave & Buster’s brand, and staying current with the latest offerings creates new content and excitement to drive repeat visits and increase length of customer stay. We plan to continue to update approximately 10% of our games each year and seek to buy games that will resonate with our customers and drive brand relevance due to a variety of factors, including their large scale, eye-catching appearance, virtual reality features, association with recognizable brands or the fact that they cannot be easily replicated at home. We aim to leverage our investment in games by packaging our new game introductions and focusing our marketing spending to promote these events. We also plan to continually elevate the redemption experience in our “Winner’s Circle” with prizes that |
6
Table of Contents
| we believe customers will find more attractive, which we expect will favorably impact customer visitation and game play. |
| n | Leverage D&B Sports. In 2010, we initiated a program to improve our sports-viewing as part of our strategy to enhance our entertainment offering and increase customer traffic and frequency by creating another reason to visit Dave & Buster’s. This initiative evolved into the D&B Sports concept, which has been incorporated into all new stores opened since the beginning of fiscal 2013 and will continue to be incorporated into all new stores. In the fall of 2013, we launched a national advertising campaign for D&B Sports promoting Dave & Buster’s as the “only place to watch the games and play the games.” We intend to continue leveraging our investments in D&B Sports by building awareness of Dave & Buster’s as “the best place to watch sports” through national cable advertising. In addition, we are strategically expanding our year-round sporting and pay-per-view content to drive increased traffic and capture a higher share of the sports-viewing customer base. |
| n | Food and beverage offerings with broad appeal. Our menu has a variety of items, from hamburgers to steaks to seafood, that represent our “Fun American New Gourmet” strategy. We aim to ensure a pipeline for three new product launches each year, aligning with the timing of our new game launches. This strategy has been well received by our customers as the percentage of customers rating our food quality as “Excellent” was 79.6% in fiscal 2013, an increase of 480 basis points compared to fiscal 2011, and an increase of 4,170 basis points since fiscal 2007. Similarly, the percentage of customers rating our beverage quality as “Excellent” in fiscal 2013 was 82.3%, an increase of 490 basis points compared to fiscal 2011, and an increase of 4,250 basis points since fiscal 2007. |
| n | Grow our special events usage. The special events portion of our business represented 12.3% of our total revenues in fiscal 2013. We believe our special events business is an important sampling and promotional opportunity for our customers because many customers are experiencing Dave & Buster’s for the first time. We plan to leverage our existing special events sales force and call center to attract new corporate customers. In addition, we introduced online booking for social parties in order to provide additional convenience in booking events for our customers and look to expand its functionality over time. |
| n | Enhance brand awareness and generate additional visits to our stores through marketing and promotions. We believe offering new items from each of the “Eat Drink Play and Watch” pillars will keep the brand relevant to customers and drive traffic and frequency. We have identified five key promotional periods throughout the year when we feature this “New News” in national advertising. To increase national awareness of our brand, we plan to continue to invest a significant portion of our marketing expenditures in national cable television and radio advertising focused on promoting our capital investments in new games, D&B Sports and new food and beverage offerings. We also have customized local store marketing programs to increase new visits and repeat visits to individual locations. We will continue to utilize our loyalty program and digital efforts to communicate promotional offers directly to our most passionate brand fans, and we are aggressively optimizing our search engine and social marketing efforts. We also leverage our investments in technology across our marketing platform, including in-store marketing initiatives to drive incremental sales throughout the store. |
| n | Drive Customer Frequency Through Greater Digital and Mobile Connectivity. We believe that there is a significant potential to increase customer frequency by enhancing the in-store and out-of-store customer experience via digital and mobile strategic initiatives as well as through implementing enhanced technology. We intend to leverage our growing loyalty database as well as continue to invest in mobile game systems (game applications for mobile devices, such as smartphones and tablets), second screen sports-watching apps (applications for mobile devices, allowing our customers to enhance their sports-watching experience by, for example, accessing information about the live sporting event being watched or by playing along with the live sporting event) and social games (game applications that allow our customers to play online together, whether competitively or cooperatively) to create customer connections and drive recurring customer visitation. |
7
Table of Contents
Expand the Dave & Buster’s Brand Internationally. We believe that in addition to the growth potential that exists in North America, the Dave & Buster’s brand can also have significant appeal in certain international markets. We are currently assessing these opportunities while maintaining a conservative and disciplined approach towards the execution of our international development strategy. As such, we have retained the services of a third-party consultant to assist in identifying and prioritizing potential markets for expansion as well as potential franchise or joint venture partners. Thus far, we have identified our international market priorities and begun the process of identifying potential international partners within select markets. The market priorities were developed based on a specific set of criteria to ensure we expand our brand into the most attractive markets. Our goal is to sign an agreement with our first international partner by the end of fiscal 2014 and we are targeting our first international opening outside of Canada in 2016.
The Refinancing
On July 25, 2014, we entered into a new senior secured credit facility that provides a $530.0 million term loan facility and a $50.0 million revolving credit facility. The proceeds of the new senior secured credit facility were used to refinance in whole the prior senior secured credit facility (of which $143.5 million was outstanding as of July 25, 2014), repay in full $200 million aggregate principal amount of the 11.0% senior notes due June 1, 2018, repay all outstanding 12.25% senior discount notes due February 15, 2016 ($150.2 million accreted value as of July 25, 2014) and pay related premiums, interest and expenses. We refer to these transactions collectively as the “Refinancing.”
Use of Proceeds
We intend to use the net proceeds from this offering to repay a portion of term loan debt outstanding under the new senior secured credit facility, as well as to pay accrued interest and related expenses. After giving effect to the application of the proceeds from this offering, our aggregate indebtedness will be approximately $ million on an as adjusted basis as of August 3, 2014. See “Use of Proceeds” and “Management’s Discussion and Analysis of Financial Condition and Results of Operations—Liquidity and Capital Resources.”
Corporate History
We opened our first store in Dallas, Texas in 1982 and since then we have expanded our portfolio nationally to 69 company-owned stores across 26 states and Canada as of September 2, 2014.
From 1997 to early 2006, we operated as a public company under the leadership of our founders, David “Dave” Corriveau and James “Buster” Corley. In March 2006, Dave & Buster’s, Inc. was acquired by Dave & Buster’s Holdings, Inc. (“D&B Holdings”), a holding company controlled by affiliates of Wellspring Capital Partners III, L.P. (“Wellspring”) and HBK Main Street Investors L.P. (“HBK”). In connection with the acquisition of Dave & Buster’s, Inc. by Wellspring and HBK, Dave & Buster’s, Inc.’s common stock was delisted from the New York Stock Exchange. In addition, since 2006, our management team has been led by our Chief Executive Officer, Stephen King.
On June 1, 2010, Dave & Buster’s Entertainment, Inc., a newly-formed Delaware corporation owned by Oak Hill Capital Partners III, L.P. and Oak Hill Capital Management Partners III, L.P. (collectively, the “Oak Hill Funds” and together with their manager, Oak Hill Capital Management, LLC, and its related funds, “Oak Hill Capital Partners”), acquired all of the outstanding common stock (the “Acquisition”) of D&B Holdings from Wellspring and HBK. In connection therewith, Games Merger Corp., a newly-formed Missouri corporation and an indirect wholly owned subsidiary of Dave & Buster’s Entertainment, Inc., merged (the “Merger”) with and into D&B Holdings’ wholly owned, direct subsidiary, Dave & Buster’s, Inc. (with Dave & Buster’s, Inc. being the surviving corporation in the Merger). As a result of the Acquisition and certain post-acquisition activity, the Oak Hill Funds directly control approximately 95.4% of our outstanding common stock and have the right to appoint certain members of our Board of Directors, and certain members of our Board of Directors and management control approximately 4.5% of our outstanding common stock. The remaining 0.1% is owned by a former member of management. Upon completion of this offering, the Oak Hill Funds will beneficially own
8
Table of Contents
approximately % of our outstanding common stock, or % if the underwriters exercise their option to purchase additional shares in full, and certain members of our Board of Directors and our management will beneficially own approximately % of our common stock, or % if the underwriters exercise their option to purchase additional shares in full. The Oak Hill Funds will continue to own a majority of the voting power of our outstanding common stock. As a result, we will be a “controlled company” within the meaning of the corporate governance standards of NASDAQ. See “Principal Stockholders.”
Ownership Structure
The following chart gives effect to our ownership structure after this offering and the use of net proceeds therefrom(1):
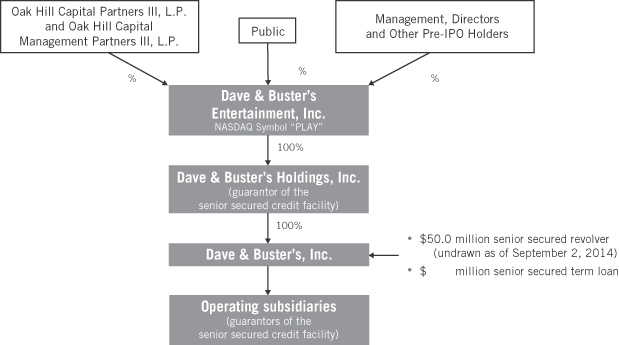
| (1) | Assumes an offering at a price per share of $ , the midpoint of the price range set forth on the cover of this prospectus, and excludes the exercise of the option to purchase additional shares. See also “Use of Proceeds.” |
Oak Hill Capital Partners
Oak Hill Capital Partners is a private equity firm managing funds with more than $8 billion of initial capital commitments from leading entrepreneurs, endowments, foundations, corporations, pension funds and global financial institutions. Since its inception 28 years ago, the professionals at Oak Hill Capital Partners and its predecessors have invested in more than 70 significant private equity transactions across broad segments of the U.S. and global economies. Oak Hill Capital Partners applies an industry-focused approach to investing across four core sectors: Consumer, Retail & Distribution; Industrials; Media & Communications; and Services. Oak Hill Capital Partners works actively in partnership with management teams to implement strategic and operational initiatives to create franchise value. Dave & Buster’s represents a core investment theme of the firm’s Consumer, Retail & Distribution team, which has experience investing in the restaurant and specialty retail sectors, including prior investments in Duane Reade, Caribbean Restaurants, The Container Store, NSA International and TravelCenters of America, and a current investment in Earth Fare.
After completion of this offering, the Oak Hill Funds will continue to own a majority of the voting power of our outstanding common stock. See “Principal Stockholders.” We will also enter into a new stockholders’ agreement with the Oak Hill Funds in connection with this offering. As a result, the Oak Hill Funds will hold
9
Table of Contents
the power to elect a majority of the seats on our Board of Directors and will have certain designation and nomination rights upon the completion of this offering. The Oak Hill Funds will be entitled to designate directors to serve on the Board of Directors proportionate to the Oak Hill Funds’ (or one or more of their affiliates, to the extent assigned thereto) aggregate ownership of the outstanding shares of our common stock, at any meeting of stockholders at which directors are to be elected to the extent that the Oak Hill Funds do not have such proportionate number of director designees then serving on the Board of Directors; provided that for so long as the Oak Hill Funds (or one or more of their affiliates, to the extent assigned thereto), individually or in the aggregate, own 5% or more of the voting power of the outstanding shares of our common stock, the Oak Hill Funds will be entitled to designate one director designee to serve on the Board of Directors at any meeting of stockholders at which directors are to be elected to the extent that the Oak Hill Funds do not have a director designee then serving on the Board of Directors. Such proportionate number of director designees will be determined by taking the product of the Oak Hill Funds’ (or one or more of their affiliates, to the extent assigned thereto) aggregate ownership of the outstanding shares of our common stock multiplied by the then current number of directors on our Board of Directors (rounded up to the next whole number to the extent the product does not equal a whole number). The Oak Hill Funds’ director designees will initially be J. Taylor Crandall, Kevin M. Mailender and Tyler J. Wolfram and, therefore, the Oak Hill Funds will be entitled to designate additional directors in order for Oak Hill to have its proportionate number of director designees. We will expand the size of our Board of Directors if necessary to provide for such proportionate representation. Subject to applicable law and applicable NASDAQ rules, the stockholders’ agreement will also provide that the Oak Hill Funds will be entitled to nominate the members of the Nominating and Corporate Governance Committee. In addition, subject to applicable law and applicable NASDAQ rules, each other committee of our Board of Directors, other than the Audit Committee, will consist of at least one member designated by the Oak Hill Funds. When conflicts arise between the interests of the Oak Hill Funds or their affiliates and the interests of our stockholders, these directors may not be disinterested. The representatives of the Oak Hill Funds on our Board of Directors, by the terms of our amended and restated certificate of incorporation and stockholders’ agreement, are not required to offer us any transaction opportunity of which they become aware and could take any such opportunity for themselves or offer it to other companies in which they have an investment, unless such opportunity is expressly offered to them solely in their capacity as our directors (and therefore may be free to compete with us in the same business or similar business). Pursuant to the new stockholders’ agreement, the Oak Hill Funds and their affiliates will be reimbursed for certain costs and expenses. See “Certain Relationships and Related Transactions—New Stockholders’ Agreement” and “Risk Factors—Risks Related to our Capital Structure—Conflicts of interest may arise because some of our directors are principals of our principal stockholder.”
Corporate Information
Our corporate headquarters is located at 2481 Mañana Drive, Dallas, Texas, and our telephone number is (214) 357-9588. Our website is www.daveandbusters.com. Information contained on our website does not constitute a part of this prospectus.
10
Table of Contents
THE OFFERING
| Shares of Common Stock Offered by us |
shares ( shares if the underwriters’ option to purchase additional shares is exercised in full). |
| Shares of Common Stock to be Outstanding After This Offering |
shares ( shares if the underwriters’ option to purchase additional shares is exercised in full). |
| Option to Purchase Additional Shares |
The underwriters have an option to purchase from us up to a maximum of additional shares of our common stock. The underwriters can exercise this option at any time within 30 days from the date of this prospectus. |
| Use of Proceeds |
We estimate that the net proceeds to us from the offering of shares, after deducting underwriting discounts and estimated offering expenses, will be approximately $ million, assuming the shares are offered at $ (the midpoint of the price range set forth on the cover of this prospectus). We intend to use the net proceeds from this offering to repay a portion of term loan debt outstanding under the new senior secured credit facility, as well as to pay accrued interest and related expenses. See “Use of Proceeds.” |
| Dividend Policy |
We do not anticipate paying any dividends on our common stock, however, we may change this policy in the future. See “Dividend Policy.” |
| Proposed NASDAQ Symbol |
“PLAY” |
| LOYAL3 platform |
At our request, the underwriters have reserved up to % of the common stock to be sold by us in this offering to be offered through the LOYAL3 platform at the initial public offering price. See “Underwriting.” |
| Risk Factors |
You should carefully read and consider the information set forth under “Risk Factors” beginning on page 19 of this prospectus and all other information set forth in this prospectus before investing in our common stock. |
Unless otherwise indicated, the number of shares of common stock to be outstanding after this offering:
| n | excludes shares of our common stock issuable upon exercise of outstanding stock options under the Dave & Buster’s Entertainment, Inc. 2010 Management Incentive Plan (the “2010 Stock Incentive Plan”); and |
| n | excludes shares of our common stock reserved for issuances under our 2014 Omnibus Incentive Plan (the “2014 Stock Incentive Plan”) and issuable upon the exercise of options that we intend to grant to certain executive officers as of the time of this offering, including the named executive officers as described in “Executive Compensation—Compensation Discussion and Analysis—Elements of Compensation—Long-term Incentive Plan.” |
Unless otherwise noted, the information in this prospectus:
| n | gives effect to a for 1 stock split of our common stock prior to the consummation of this offering (rounded to the nearest whole share); |
11
Table of Contents
| n | gives effect to our amended and restated certificate of incorporation, which will be in effect prior to the consummation of this offering; |
| n | assumes no exercise of the underwriters’ option to purchase from us up to additional shares; and |
| n | assumes an initial public offering price of $ per share, the midpoint of the price range set forth on the cover of this prospectus. |
Risks Associated With Our Business
Our business is subject to numerous risks, which are highlighted in the section entitled “Risk Factors.” These risks represent challenges to the successful implementation of our strategy and the growth of our business. Some of these risks are:
| n | our ability to open new stores and operate them profitably; |
| n | changes in discretionary spending by consumers and general economic conditions; |
| n | our ability to compete favorably in the out-of-home and home-based entertainment and restaurant markets; |
| n | unauthorized use of our intellectual property; |
| n | potential claims for infringing the intellectual property right of others and the costs related to such claims; |
| n | damage to our brand or reputation; |
| n | failure or destruction of our information systems and other technology that support our business; |
| n | seasonality of our business and the timing of new openings and other events; |
| n | availability and cost of food and other supplies; and |
| n | our ability to operate our stores and obtain and maintain licenses and permits necessary for such operation in compliance with applicable laws and regulations. |
For a discussion of these and other risks you should consider before making an investment in our common stock, see the section entitled “Risk Factors.”
12
Table of Contents
SUMMARY HISTORICAL FINANCIAL AND OTHER DATA
Set forth below are our summary consolidated historical and as adjusted financial and other data for the periods ending on and as of the dates indicated.
Dave & Buster’s Entertainment, Inc. has no material assets or operations other than 100% ownership of the outstanding common stock of D&B Holdings. D&B Holdings has no material assets or operations other than 100% ownership of the outstanding common stock of Dave & Buster’s, Inc.
The statement of operations and cash flows data for each of the fiscal years ended February 2, 2014, February 3, 2013 and January 29, 2012 were derived from our audited consolidated financial statements included elsewhere in this prospectus. The statement of operations and cash flows data for each of the twenty-six week periods ended August 3, 2014 and August 4, 2013 and the balance sheet data as of August 3, 2014 were derived from our unaudited consolidated financial statements included elsewhere in this prospectus. In the opinion of management, the unaudited consolidated financial statements include all normal recurring adjustments necessary to present fairly the data for such periods and as of such dates.
We operate on a 52 or 53 week fiscal year that ends on the Sunday after the Saturday closest to January 31. Each quarterly period has 13 weeks, except in a 53 week year when the fourth quarter has 14 weeks. All fiscal years presented herein consist of 52 weeks, except fiscal year 2012, which consisted of 53 weeks.
Our historical results are not necessarily indicative of future results of operations. The summary of historical financial and other data should be read in conjunction with “Selected Consolidated Financial Data,” “Management’s Discussion and Analysis of Financial Condition and Results of Operations” and our historical consolidated financial statements and the notes related thereto, included elsewhere in this prospectus. All dollar amounts are presented in thousands except per share amounts.
13
Table of Contents
| TWENTY-SIX WEEKS ENDED |
FISCAL YEAR ENDED | |||||||||||||||||||
| AUGUST 3, 2014 |
AUGUST 4, 2013 |
FEBRUARY 2, 2014 |
FEBRUARY 3, 2013 |
JANUARY 29, 2012 |
||||||||||||||||
| Statement of Operations Data: |
||||||||||||||||||||
| Revenues: |
||||||||||||||||||||
| Food and beverage revenues |
$ | 177,898 | $ | 153,272 | $ | 310,111 | $ | 298,421 | $ | 272,606 | ||||||||||
| Amusement and other revenues |
198,310 | 168,606 | 325,468 | 309,646 | 268,939 | |||||||||||||||
|
|
|
|
|
|
|
|
|
|
|
|||||||||||
| Total revenues |
376,208 | 321,878 | 635,579 | 608,067 | 541,545 | |||||||||||||||
|
|
|
|
|
|
|
|
|
|
|
|||||||||||
| Operating costs: |
||||||||||||||||||||
| Cost of products: |
||||||||||||||||||||
| Cost of food and beverage |
45,690 | 38,273 | 77,577 | 73,019 | 65,751 | |||||||||||||||
| Cost of amusement and other |
27,244 | 24,263 | 47,437 | 46,098 | 41,417 | |||||||||||||||
|
|
|
|
|
|
|
|
|
|
|
|||||||||||
| Total cost of products |
72,934 | 62,536 | 125,014 | 119,117 | 107,168 | |||||||||||||||
| Operating payroll and benefits |
85,120 | 72,546 | 150,172 | 145,571 | 130,875 | |||||||||||||||
| Other store operating expenses |
114,142 | 98,761 | 199,537 | 192,792 | 175,993 | |||||||||||||||
| General and administrative expenses |
20,069 | 17,922 | 36,440 | 40,356 | 34,896 | |||||||||||||||
| Depreciation and amortization expense |
34,673 | 33,650 | 66,337 | 63,457 | 54,277 | |||||||||||||||
| Pre-opening costs |
4,292 | 2,842 | 7,040 | 3,060 | 4,186 | |||||||||||||||
|
|
|
|
|
|
|
|
|
|
|
|||||||||||
| Total operating costs |
331,230 | 288,257 | 584,540 | 564,353 | 507,395 | |||||||||||||||
|
|
|
|
|
|
|
|
|
|
|
|||||||||||
| Operating income |
44,978 | 33,621 | 51,039 | 43,714 | 34,150 | |||||||||||||||
| Interest expense, net |
23,696 | 23,861 | 47,809 | 47,634 | 44,931 | |||||||||||||||
| Loss on debt retirement |
25,986 | — | — | — | — | |||||||||||||||
|
|
|
|
|
|
|
|
|
|
|
|||||||||||
| Income (loss) before provision (benefit) for income taxes |
(4,704 | ) | 9,760 | 3,230 | (3,920 | ) | (10,781 | ) | ||||||||||||
| Provision (benefit) for income taxes |
(2,287 | ) | 2,308 | 1,061 | (12,702 | ) | (3,796 | ) | ||||||||||||
|
|
|
|
|
|
|
|
|
|
|
|||||||||||
| Net income (loss) |
$ | (2,417 | ) | $ | 7,452 | $ | 2,169 | $ | 8,782 | $ | (6,985 | ) | ||||||||
|
|
|
|
|
|
|
|
|
|
|
|||||||||||
| Net income (loss) per share of common stock: |
||||||||||||||||||||
| Basic |
$ | (16.38 | ) | $ | 50.52 | $ | 14.70 | $ | 59.54 | $ | (45.58 | ) | ||||||||
| Diluted |
$ | (16.38 | ) | $ | 49.40 | $ | 14.34 | $ | 58.55 | $ | (45.58 | ) | ||||||||
| Weighted average number of shares outstanding: |
||||||||||||||||||||
| Basic |
147,586 | 147,506 | 147,512 | 147,506 | 153,250 | |||||||||||||||
| Diluted |
147,586 | 150,850 | 151,256 | 150,000 | 153,250 | |||||||||||||||
14
Table of Contents
| TWENTY-SIX WEEKS ENDED |
FISCAL YEAR ENDED | |||||||||||||||||||
| AUGUST 3, 2014 |
AUGUST 4, 2013 |
FEBRUARY 2, 2014 |
FEBRUARY 3, 2013 |
JANUARY 29, 2012 |
||||||||||||||||
| As Adjusted Consolidated Statements of Operations Data (1): |
||||||||||||||||||||
| As adjusted net income (loss) |
$ | $ | ||||||||||||||||||
| As adjusted net income (loss) per share: |
||||||||||||||||||||
| Basic |
$ | $ | ||||||||||||||||||
| Diluted |
$ | $ | ||||||||||||||||||
| As adjusted weighted average shares outstanding: |
||||||||||||||||||||
| Basic |
||||||||||||||||||||
| Diluted |
||||||||||||||||||||
| Statement of Cash Flow Data: |
||||||||||||||||||||
| Cash provided by (used in): |
||||||||||||||||||||
| Operating activities |
$ | 10,451 | $ | 66,332 | $ | 109,878 | $ | 82,796 | $ | 72,777 | ||||||||||
| Investing activities |
(59,352 | ) | (45,559 | ) | (105,677 | ) | (78,488 | ) | (70,502 | ) | ||||||||||
| Financing activities |
76,172 | (1,568 | ) | (2,238 | ) | (1,875 | ) | (2,998 | ) | |||||||||||
| AS OF AUGUST 3, 2014 | ||||||
| ACTUAL | AS ADJUSTED (2) | |||||
| Balance Sheet Data: |
||||||
| Cash and cash equivalents |
$ | 65,351 | ||||
| Net working capital (3) |
9,486 | |||||
| Property and equipment, net |
406,411 | |||||
| Total assets |
908,124 | |||||
| Total debt, net of unamortized discount |
528,681 | |||||
| Stockholders’ equity |
148,600 | |||||
| TWENTY-SIX WEEKS ENDED |
FISCAL YEAR ENDED | |||||||||||||||||||
| AUGUST 3, 2014 |
AUGUST 4, 2013 |
FEBRUARY 2, 2014 |
FEBRUARY 3, 2013 |
JANUARY 29, 2012 |
||||||||||||||||
| Store-level Data: |
||||||||||||||||||||
| Stores open at end of period (4) |
69 | 62 | 66 | 61 | 58 | |||||||||||||||
| Comparable stores (5) |
57 | 55 | 55 | 54 | 52 | |||||||||||||||
| Comparable store sales increase (6) |
5.2 | % | 0.5 | % | 1.0 | % | 3.0 | % | 2.2 | % | ||||||||||
| Store-level EBITDA (7) |
$ | 104,012 | $ | 88,035 | $ | 160,856 | $ | 150,587 | $ | 127,509 | ||||||||||
| Store-level EBITDA margin (8) |
27.6 | % | 27.4 | % | 25.3 | % | 24.8 | % | 23.5 | % | ||||||||||
15
Table of Contents
| TWENTY-SIX WEEKS ENDED |
FISCAL YEAR ENDED | |||||||||||||||||||
| AUGUST 3, 2014 |
AUGUST 4, 2013 |
FEBRUARY 2, 2014 |
FEBRUARY 3, 2013 |
JANUARY 29, 2012 |
||||||||||||||||
| Other Data: |
||||||||||||||||||||
| Adjusted EBITDA (9) |
$ | 89,059 | $ | 74,838 | $ | 134,790 | $ | 120,478 | $ | 98,372 | ||||||||||
| Adjusted EBITDA margin (10) |
23.7 | % | 23.3 | % | 21.2 | % | 19.8 | % | 18.2 | % | ||||||||||
| Capital additions (11): |
||||||||||||||||||||
| New store |
$ | 30,082 | $ | 27,375 | $ | 72,301 | $ | 32,795 | $ | 43,951 | ||||||||||
| Operating initiatives, including remodels |
9,920 | 13,094 | 21,930 | 21,946 | 10,380 | |||||||||||||||
| Games |
7,601 | 6,384 | 11,413 | 10,090 | 7,196 | |||||||||||||||
| Maintenance |
5,122 | 4,254 | 14,238 | 13,858 | 11,419 | |||||||||||||||
|
|
|
|
|
|
|
|
|
|
|
|||||||||||
| Total capital additions |
$ | 52,725 | $ | 51,107 | $ | 119,882 | $ | 78,689 | $ | 72,946 | ||||||||||
|
|
|
|
|
|
|
|
|
|
|
|||||||||||
| (1) | As adjusted consolidated statement of operations data gives effect to (i) a for 1 stock split of our common stock prior to the completion of this offering, (ii) the Refinancing as described in “—The Refinancing” and (iii) the receipt and application of $ of net proceeds to us from this offering based on an initial public offering price of $ per share (the mid-point of the range set forth on the cover of this prospectus) as described in “Use of Proceeds,” as if they had occurred on February 4, 2013 with respect to fiscal year 2013 and February 3, 2014 with respect to the twenty-six weeks ended August 3, 2014. As adjusted net income (loss) reflects (i) the net decrease in interest expense resulting from the prepayment of $ principal amount of our indebtedness as described in “Use of Proceeds, ” (ii) premiums, interest and expenses related to the Refinancing of $ and (iii) the tax effects of these changes on income before taxes. The as adjusted consolidated statements of operations data is not necessarily indicative of what our results of operations would have been if the transaction had been completed as of the date indicated, nor is such data necessarily indicative of our results of operations for any future period. |
The table below provides a summary of net income (loss) used in the calculation of basic and diluted net income per common share calculated on an as adjusted basis (in thousands).
| TWENTY-SIX WEEKS ENDED |
FISCAL YEAR ENDED |
|||||||
| AUGUST 3, 2014 |
FEBRUARY 2, 2014 |
|||||||
| Net income (loss) |
$ | (2,417 | ) | $ | 2,169 | |||
| Reduction of interest expense |
||||||||
| Loss on debt retirement |
25,986 | — | ||||||
| Increase in income tax expense |
||||||||
|
|
|
|
|
|||||
| As adjusted net income |
$ | $ | ||||||
|
|
|
|
|
|||||
| (2) | The as adjusted balance sheet data gives effect to the receipt and application of $ of net proceeds to us from this offering as described in “Use of Proceeds,” as if it had occurred as of August 3, 2014. The as adjusted balance sheet data is not necessarily indicative of what our financial position would have been if the transaction had been completed as of the date indicated, nor is such data necessarily indicative of our financial position for any future date. |
| (3) | Defined as total current assets minus total current liabilities. |
| (4) | Our location in Nashville, Tennessee, which temporarily closed from May 2, 2010 to November 28, 2011 due to flooding, is included in our store count for all periods presented. Our Kensington/Bethesda, Maryland location (which permanently closed on August 12, 2014) is included in store counts for all periods presented. Also included in the store counts as of January 29, 2012 is a store in Dallas, Texas which permanently closed on December 17, 2012. |
| (5) | “Comparable stores” are stores open at least 18 months as of the beginning of each of the relevant fiscal years, excluding our one franchised store located in Canada, which ceased operation as a Dave & Buster’s on May 31, 2013. Our fiscal 2014 comparable stores exclude the Kensington/Bethesda, Maryland location, which permanently closed on August 12, 2014. |
| (6) | “Comparable store sales increases” reflect the year-over-year changes, on a calendar week basis, for the stores as defined as comparable in (5) above. |
16
Table of Contents
| (7) | “Store-level EBITDA” is defined by us as net income (loss), plus interest expense (net), loss on debt retirement, provision (benefit) for income taxes, depreciation and amortization expense, general and administrative expenses and pre-opening costs, as shown in the table below. We use Store-level EBITDA to measure operating performance and returns from opening new stores. Similar to Adjusted EBITDA, Store-level EBITDA is not defined under GAAP and does not purport to be an alternative to net income as a measure of operating performance. |
| We believe that Store-level EBITDA is another useful measure in evaluating our operating performance because it removes the impact of general and administrative expenses, which are not incurred at the store level, and the costs of opening new stores, which are non-recurring at the store-level, and thereby enables the comparability of the operating performance of our stores for the periods presented. We also believe that Store-level EBITDA is a useful measure in evaluating our operating performance within the entertainment and dining industry because it permits the evaluation of store-level productivity, efficiency and performance, and we use Store-level EBITDA as a means of evaluating store financial performance compared with our competitors. However, because this measure excludes significant items such as general and administrative expenses and pre-opening costs, as well as our interest expense and depreciation and amortization expense, which are important in evaluating our consolidated financial performance from period to period, the value of this measure is limited as a measure of our consolidated financial performance. Our calculation of Store-level EBITDA for the periods is presented below: |
| TWENTY-SIX WEEKS ENDED |
FISCAL YEAR ENDED | |||||||||||||||||||
| AUGUST 3, 2014 |
AUGUST 4, 2013 |
FEBRUARY 2, 2014 |
FEBRUARY 3, 2013 |
JANUARY 29, 2012 |
||||||||||||||||
| Net income (loss) |
$ | (2,417 | ) | $ | 7,452 | $ | 2,169 | $ | 8,782 | $ | (6,985 | ) | ||||||||
| Interest expense, net |
23,696 | 23,861 | 47,809 | 47,634 | 44,931 | |||||||||||||||
| Loss on debt retirement |
25,986 | — | — | — | — | |||||||||||||||
| Provision (benefit) for income taxes |
(2,287 | ) | 2,308 | 1,061 | (12,702 | ) | (3,796 | ) | ||||||||||||
| Depreciation and amortization expense |
34,673 | 33,650 | 66,337 | 63,457 | 54,277 | |||||||||||||||
| General and administrative expenses |
20,069 | 17,922 | 36,440 | 40,356 | 34,896 | |||||||||||||||
| Pre-opening costs |
4,292 | 2,842 | 7,040 | 3,060 | 4,186 | |||||||||||||||
|
|
|
|
|
|
|
|
|
|
|
|||||||||||
| Store-level EBITDA |
$ | 104,012 | $ | 88,035 | $ | 160,856 | $ | 150,587 | $ | 127,509 | ||||||||||
|
|
|
|
|
|
|
|
|
|
|
|||||||||||
| (8) | “Store-level EBITDA margin” represents Store-level EBITDA divided by total revenues. Store-level EBITDA margin allows us to evaluate operating performance of each store across stores of varying size and volume. |
| (9) | “Adjusted EBITDA” is calculated as net income (loss), plus interest expense (net), loss on debt retirement, provision (benefit) for income taxes, depreciation and amortization expense, loss on asset disposal, share-based compensation, currency transaction (gain) loss, pre-opening costs, reimbursement of affiliate and other expenses, change in deferred amusement revenue and ticket liability estimations, transaction and other costs. |
Adjusted EBITDA is presented because we believe that it provides useful information to investors regarding our operating performance and our capacity to incur and service debt and fund capital expenditures. We believe that Adjusted EBITDA is used by many investors, analysts and rating agencies as a measure of performance. In addition, Adjusted EBITDA is approximately equal to “EBITDA” as defined in our senior secured credit facility and our presentation of Adjusted EBITDA is consistent with that reported to our lenders to allow for leverage-based assessments. By reporting Adjusted EBITDA, we provide a basis for comparison of our business operations between current, past and future periods by excluding items that we do not believe are indicative of our core operating performance. Adjusted EBITDA is a metric utilized to measure performance-based bonuses paid to our executive officers and certain managers.
Adjusted EBITDA, however, is not defined by GAAP and should not be considered in isolation or as an alternative to other financial data prepared in accordance with GAAP or as an indicator of the Company’s operating performance. Adjusted EBITDA does not represent and should not be considered as an alternative to net income or cash flow from operations, as determined in accordance with GAAP, and our calculations thereof may not be comparable to similarly entitled measures reported by other companies. Although we use Adjusted EBITDA as a measure to assess the operating performance of our business, Adjusted EBITDA has significant limitations as an analytical tool because it excludes certain material costs. For example, Adjusted EBITDA and Adjusted EBITDA margin do not take into account a number of significant items, including our interest expense and depreciation and amortization expense. Because Adjusted EBITDA does not account for these expenses, its utility as a measure of our operating performance has material limitations. In addition, Adjusted EBITDA excludes pre-opening costs and adjustments for changes in the accruals for deferred amusement revenue and ticket liability, which we expect customers to redeem in future periods and which may be important in analyzing our GAAP results. Our calculations of Adjusted EBITDA adjust for these amounts because they vary from period to period and do not directly relate to the ongoing operations of the current underlying business of our stores and therefore complicate comparisons of the underlying business between periods. Nevertheless, because of the limitations described above management does not view Adjusted EBITDA in isolation and also uses other measures, such as net sales, gross margin, operating income and net income (loss), to measure operating performance.
17
Table of Contents
Our calculation of Adjusted EBITDA for the periods presented is set forth below:
| TWENTY-SIX WEEKS ENDED |
FISCAL YEAR ENDED | |||||||||||||||||||
| AUGUST 3, 2014 |
AUGUST 4, 2013 |
FEBRUARY 2, 2014 |
FEBRUARY 3, 2013 |
JANUARY 29, 2012 |
||||||||||||||||
| Net income (loss) |
$ | (2,417 | ) | $ | 7,452 | $ | 2,169 | $ | 8,782 | $ | (6,985 | ) | ||||||||
| Interest expense, net |
23,696 | 23,861 | 47,809 | 47,634 | 44,931 | |||||||||||||||
| Loss on debt retirement |
25,986 | — | — | — | — | |||||||||||||||
| Provision (benefit) for income taxes |
(2,287 | ) | 2,308 | 1,061 | (12,702 | ) | (3,796 | ) | ||||||||||||
| Depreciation and amortization expense |
34,673 | 33,650 | 66,337 | 63,457 | 54,277 | |||||||||||||||
| Loss on asset disposal (a) |
622 | 938 | 2,631 | 2,640 | 1,279 | |||||||||||||||
| Share-based compensation (b) |
503 | 622 | 1,207 | 1,099 | 1,038 | |||||||||||||||
| Currency transaction loss (gain) (c) |
(20 | ) | 150 | 622 | (13 | ) | 103 | |||||||||||||
| Pre-opening costs (d) |
4,292 | 2,842 | 7,040 | 3,060 | 4,186 | |||||||||||||||
| Reimbursement of affiliate and other expenses (e) |
303 | 374 | 722 | 799 | 854 | |||||||||||||||
| Change in deferred amusement revenue and ticket liability (f) |
2,547 | 2,490 | 4,936 | 2,470 | 1,539 | |||||||||||||||
| Transaction and other costs (g) |
1,161 | 151 | 256 | 3,252 | 946 | |||||||||||||||
|
|
|
|
|
|
|
|
|
|
|
|||||||||||
| Adjusted EBITDA |
$ | 89,059 | $ | 74,838 | $ | 134,790 | $ | 120,478 | $ | 98,372 | ||||||||||
|
|
|
|
|
|
|
|
|
|
|
|||||||||||
| (a) | Represents the net book value of assets (less proceeds received) disposed of during the year. Primarily relates to assets replaced in ongoing operation of business. |
| (b) | Represents stock compensation expense under our 2010 Stock Incentive Plan. |
| (c) | Represents the effect of foreign currency transaction (gains) or losses related to our store in Canada. |
| (d) | Represents costs incurred prior to the opening of our new stores. |
| (e) | Represents fees and expenses paid directly to our Board of Directors and certain non-recurring payments to management and compensation consultants. It also includes the reimbursement of expenses made to Oak Hill Capital Management, LLC in the amount of $35, $95, $115, $76 and $297 in the twenty-six weeks ended August 3, 2014 and August 4, 2013 and fiscal years 2013, 2012 and 2011, respectively. See “Certain Relationships and Related Transactions—Expense Reimbursement Agreement.” |
| (f) | Represents quarterly increases or decreases to accrued liabilities established for future amusement game play and the fulfillment of tickets won by customers on our redemption games. |
| (g) | Primarily represents costs related to capital markets transactions, severance costs associated with the departure of key executives/organizational restructuring initiatives and store closure costs. |
| (10) | “Adjusted EBITDA margin” represents Adjusted EBITDA divided by total revenues. Adjusted EBITDA margin allows us to evaluate our overall operating performance over time by excluding items that we do not believe are indicative of our core operating performance. |
| (11) | “Capital additions” is defined as total accrual based additions to property and equipment. Capital additions do not include any reductions for tenant improvement allowances received or receivable from landlords. Tenant improvement allowances received from landlords totaled $7,454, $2,600, $15,786, $10,882 and $6,911 in the twenty-six weeks ended August 3, 2014 and August 4, 2013 and fiscal years 2013, 2012 and 2011, respectively. |
18
Table of Contents
An investment in our common stock involves a high degree of risk. You should carefully consider the following risks, as well as the other information contained in this prospectus, before making an investment in our company. If any of the following risks actually occur, our business, results of operations or financial condition may be materially adversely affected. In such an event, the trading price of our common stock could decline and you could lose part or all of your investment.
Risks Related to Our Business
The economic uncertainty in the United States and Canada impacts our business and financial results and a renewed recession could materially affect us in the future.
Any significant decrease in consumer confidence, or periods of economic slowdown or recession, could lead to a curtailing of discretionary spending, which in turn could reduce our revenues and results of operations and adversely affect our financial position. Our business is dependent upon consumer discretionary spending and therefore is affected by consumer confidence as well as the future performance of the United States and global economies. As a result, our results of operations are susceptible to economic slowdowns and recessions. Increases in job losses, home foreclosures, investment losses in the financial markets, personal bankruptcies, credit card debt and home mortgage and other borrowing costs, declines in housing values and reduced access to credit, amongst other factors, may result in lower levels of customer traffic in our stores, a decline in consumer confidence and a curtailing of consumer discretionary spending. We believe that consumers generally are more willing to make discretionary purchases during periods in which favorable economic conditions prevail. If economic conditions worsen, whether in the United States or in the communities in which our stores are located, we could see deterioration in customer traffic or a reduction in the average amount customers spend in our stores. A reduction in revenues will result in sales de-leveraging (spreading our fixed costs across the lower level of sales) and will in turn cause downward pressure on our profit margins. This could result in reduction of staff levels, asset impairment charges and potential store closures, a deceleration of new store openings and an inability to comply with the covenants under our senior secured credit facility.
Future economic downturns similar to the economic crisis that began in 2008 could have a material adverse impact on our landlords or other tenants in shopping centers in which we are located, which in turn could negatively affect our financial results.
If we experience another economic downturn in the future, our landlords may be unable to obtain financing or remain in good standing under their existing financing arrangements, resulting in failures to pay required tenant improvement allowances or satisfy other lease covenants to us. In addition, tenants at shopping centers in which we are located or have executed leases, or to which our locations are near, may fail to open or may cease operations. Decreases in total tenant occupancy in shopping centers in which we are located, or to which our locations are near, may affect traffic at our stores. All of these factors could have a material adverse impact on our operations.
Our growth strategy depends on our ability to open new stores and operate them profitably.
As of September 2, 2014, there were 69 company-owned locations in the United States and Canada. A key element of our growth strategy is to open additional stores in locations that we believe will provide attractive returns on investment. We have identified a number of additional sites for potential future Dave & Buster’s stores. Our ability to open new stores on a timely and cost-effective basis, or at all, is dependent on a number of factors, many of which are beyond our control, including our ability to:
| n | find quality locations; |
| n | reach acceptable agreements regarding the lease or purchase of locations; |
| n | comply with applicable zoning, licensing, land use and environmental regulations; |
| n | raise or have available an adequate amount of cash or currently available financing for construction and opening costs; |
| n | timely hire, train and retain the skilled management and other employees necessary to meet staffing needs; |
| n | obtain, for acceptable cost, required permits and approvals, including liquor licenses; and |
| n | efficiently manage the amount of time and money used to build and open each new store. |
19
Table of Contents
If we succeed in opening new stores on a timely and cost-effective basis, we may nonetheless be unable to attract enough customers to new stores because potential customers may be unfamiliar with our stores or concept, or our entertainment and menu options might not appeal to them. Our new large and small format stores may not meet or exceed the performance of our existing stores or meet or exceed our performance targets, including target cash-on-cash returns. New stores may even operate at a loss, which could have a significant adverse effect on our overall operating results. If the expected future cash flows for a store are less than the asset carrying amount (an indication that the carrying amount may not be recoverable), we may recognize an impairment loss in an amount equal to the excess of the asset carrying amount over the fair value. Opening a new store in an existing market could reduce the revenue at our existing stores in that market. In addition, historically, new stores experience a drop in revenues after their first year of operation. Typically, this drop has been temporary and has been followed by increases in comparable store revenue in line with the rest of our comparable store base, but there can be no assurance that this will be the case in the future or that a new store will succeed in the long term.
Our expansion into new markets may present increased risks due to our unfamiliarity with the area.
Some of our new stores will be located in areas where we have little or no meaningful experience. Those markets may have different competitive conditions, consumer tastes and discretionary spending patterns than our existing markets, which may cause our new stores to be less successful than stores in our existing markets. In addition, our national advertising program may not be successful in generating brand awareness in all local markets, and the lack of market awareness of the Dave & Buster’s brand can pose an additional risk in expanding into new markets. Stores opened in new markets may open at lower average weekly revenues than stores opened in existing markets, and may have higher store-level operating expense ratios than stores in existing markets. Sales at stores opened in new markets may take longer to reach average store revenues, if at all, thereby adversely affecting our overall profitability.
In addition, we may in the future establish stores outside of the United States and Canada. In addition to the risks posed by new markets generally, the operating conditions in overseas markets may vary significantly from those we have experienced in the past, including in relation to consumer preferences, regulatory environment, currency risk, the presence and cooperation of suitable local partners and availability of vendors or commercial and physical infrastructure, among others. There is no guarantee that we will be successful in integrating these new stores into our operations, achieving market acceptance, operating these stores profitably, and maintaining compliance with the rapidly changing business and regulatory requirements of new markets. If we are unable to do so, we could suffer a material adverse effect on our business, financial condition and results of operations.
We may not be able to compete favorably in the highly competitive out-of-home and home-based entertainment and restaurant markets, which could have a material adverse effect on our business, results of operations or financial condition.
The out-of-home entertainment market is highly competitive. We compete for customers’ discretionary entertainment dollars with theme parks, as well as with providers of out-of-home entertainment, including localized attraction facilities such as movie theatres, sporting events, bowling alleys, nightclubs and restaurants. Many of the entities operating these businesses are larger and have significantly greater financial resources, a greater number of stores, have been in business longer, have greater name recognition and are better established in the markets where our stores are located or are planned to be located. As a result, they may be able to invest greater resources than we can in attracting customers and succeed in attracting customers who would otherwise come to our stores. The legalization of casino gambling in geographic areas near any current or future store would create the possibility for entertainment alternatives, which could have a material adverse effect on our business and financial condition. We also face competition from local establishments that offer entertainment experiences similar to ours and restaurants that are highly competitive with respect to price, quality of service, location, ambience and type and quality of food. We also face competition from increasingly sophisticated home-based forms of entertainment, such as internet and video gaming and home movie delivery. Our failure to compete favorably in the competitive out-of-home and home-based entertainment and restaurant markets could have a material adverse effect on our business, results of operations and financial condition.
Our quarterly results of operations are subject to fluctuations due to the seasonality of our business and other events.
Our operating results fluctuate significantly from quarter to quarter as a result of seasonal factors. Typically, we have higher first and fourth quarter revenues associated with the spring and year-end holidays. Our third quarter, which encompasses the back-to-school fall season, has historically had lower revenues as compared to the other quarters.
20
Table of Contents
We expect seasonality will continue to be a factor in our results of operations. As a result, factors affecting peak seasons could have a disproportionate effect on our results. For example, the number of days between Thanksgiving and New Year’s Day and the days of the week on which Christmas and New Year’s Eve fall affect the volume of business we generate during the December holiday season and can affect our results for the full fiscal year. In addition, adverse weather during the winter and spring seasons can have a significant impact on our first and fourth quarters, and therefore our results for the full fiscal year. See “Management’s Discussion and Analysis of Financial Condition and Results of Operations—Seasonality.”
Our operating results may also fluctuate significantly because of non-seasonal factors. Due to our relatively limited number of locations, poor results of operations at any single store could materially affect our overall profitability.
Our quarterly results of operations are subject to fluctuations due to the timing of new store openings.
The timing of new store openings may result in significant fluctuations in our quarterly performance. We typically incur most cash pre-opening costs for a new store within the two months immediately preceding, and the month of, the store’s opening. In addition, the labor and operating costs for a newly opened store during the first three to six months of operation are materially greater than what can be expected after that time, both in aggregate dollars and as a percentage of revenues. We expect to spend approximately $79.0 million to $86.0 million ($59.0 million to $66.0 million net of tenant improvement allowances from landlords) for new store construction in fiscal 2014. A portion of the fiscal 2014 new store expenditures is related to stores that will be under construction in fiscal 2014 and are not expected to open until 2015. Due to these substantial up-front financial requirements to open new stores, the investment risk related to any single store is much larger than that associated with many other restaurants or entertainment venues.
We may not be able to maintain profitability.
Maintaining profitability depends upon numerous factors, including our ability to generate increased revenues and our ability to control expenses. We may incur significant losses in the future for a number of reasons, including the other risks described in this prospectus and our ongoing depreciation and amortization expense, and we may encounter unforeseen expenses, difficulties, complications, delays and other unknown events. Accordingly, we can make no assurances that we will be able to achieve, sustain or increase profitability in the future. Failure to achieve and maintain profitability could have an adverse impact on the trading prices of our common stock.
Our operations are susceptible to the availability and cost of food and other supplies, in most cases from a limited number of suppliers, which subject us to possible risks of shortages, interruptions and price fluctuations.
Our profitability depends in part on our ability to anticipate and react to changes in product costs. Cost of food and beverage as a percentage of food and beverage revenue was 25.0% in fiscal 2013, 24.5% in fiscal 2012 and 24.1% in fiscal 2011. Cost of food as a percentage of total revenue was approximately 8.6% in fiscal 2013. Cost of amusement and other costs as a percentage of amusement and other revenue was 14.6% in fiscal 2013, 14.9% in fiscal 2012 and 15.4% in fiscal 2011. If we have to pay higher prices for food or other supplies, our operating costs may increase, and, if we are unable or unwilling to pass such cost increases on to our customers, our operating results could be adversely affected.
The unplanned loss of a major distributor could adversely affect our business by disrupting our operations as we seek out and negotiate a new distribution contract. We also have multiple short-term supply contracts with a limited number of suppliers. If any of these suppliers do not perform adequately or otherwise fail to distribute products or supplies to our stores, we may be unable to replace the suppliers in a short period of time on acceptable terms, which could increase our costs, cause shortages of food and other items at our stores and cause us to remove certain items from our menu. Other than forward purchase contracts for certain food items, we currently do not engage in futures contracts or other financial risk management strategies with respect to potential price fluctuations in the cost of food and other supplies.
We may not be able to anticipate and react to changing food, beverage and amusement costs by adjusting purchasing practices or menu and game prices, and a failure to do so could have a material adverse effect on our operating results.
Our procurement of games and amusement offerings is dependent upon a few suppliers.
Our ability to continue to procure new games, amusement offerings, and other entertainment-related equipment is important to our business strategy. The number of suppliers from which we can purchase games, amusement
21
Table of Contents
offerings and other entertainment-related equipment is limited. To the extent that the number of suppliers declines, we could be subject to the risk of distribution delays, pricing pressure, lack of innovation and other associated risks.
In addition, any increase in cost or decrease in availability of new amusement offerings that appeal to customers could adversely impact the cost to acquire and operate new amusements which could have a material adverse effect on our operating results. We may not be able to anticipate and react to changing amusement offerings cost by adjusting purchasing practices or game prices, and a failure to do so could have a material adverse effect on our operating results.
Instances of food-borne illness and outbreaks of disease, as well as negative publicity relating thereto, could result in reduced demand for our menu offerings and reduced traffic in our stores and negatively impact our business.
We cannot guarantee that our supply chain and food safety controls and training will be fully effective in preventing all food safety issues at our stores, including any occurrences of foodborne illnesses such as salmonella, E. coli and hepatitis A. In addition, we rely on third-party vendors, making it difficult to monitor food safety compliance and increasing the risk that foodborne illness would affect multiple locations rather than a single store. Some foodborne illness incidents could be caused by third-party vendors and distributors outside of our control. New illnesses resistant to our current precautions may develop in the future, or diseases with long incubation periods could arise, that could give rise to claims or allegations on a retroactive basis. One or more instances of foodborne illness in any of our stores or markets or related to food products we sell could negatively affect our store sales nationwide if highly publicized on national media outlets or through social media. This risk exists even if it were later determined that the illness was wrongly attributed to us or one of our stores. A number of restaurant chains have experienced incidents related to foodborne illnesses that have had a material adverse effect on their operations. The occurrence of a similar incident at one or more of our stores, or negative publicity or public speculation about an incident, could reduce customer visits to our stores and negatively impact demand for our menu offerings.
We may not be able to operate our stores, or obtain and maintain licenses and permits necessary for such operation, in compliance with laws, regulations and other requirements, which could adversely affect our business, results of operations or financial condition.
We are subject to various federal, state and local laws affecting our business. Each store is subject to licensing and regulation by a number of governmental authorities, which may include alcoholic beverage control, amusement, health and safety and fire agencies in the state, county or municipality in which the store is located. Each store is required to obtain a license to sell alcoholic beverages on the premises from a state authority and, in certain locations, county and municipal authorities. Typically, licenses must be renewed annually and may be revoked or suspended for cause at any time. In the past, we have had licenses temporarily suspended. The most recent example is our license to sell alcoholic beverages was suspended for two days in 2011 in our Maple Grove, Minnesota store, due to violations of the terms of our licenses. In some states, the loss of a license for cause with respect to one location may lead to the loss of licenses at all locations in that state and could make it more difficult to obtain additional licenses in that state. Alcoholic beverage control regulations relate to numerous aspects of the daily operations of each store, including minimum age of patrons and employees, hours of operation, advertising, wholesale purchasing, inventory control and handling and storage and dispensing of alcoholic beverages. The failure to receive or retain a liquor license, or any other required permit or license, in a particular location, or to continue to qualify for, or renew licenses, could have a material adverse effect on operations and our ability to obtain such a license or permit in other locations.
As a result of operating certain entertainment games and attractions, including skill-based games that offer redemption prizes, we are subject to amusement licensing and regulation by the states, counties and municipalities in which our stores are located. These laws and regulations can vary significantly by state, county, and municipality and, in some jurisdictions, may require us to modify our business operations or alter the mix of redemption games and simulators we offer. Moreover, as more states and local communities implement legalized gambling, the laws and corresponding enabling regulations may also be applicable to our redemption games and regulators may create new licensing requirements, taxes or fees, or restrictions on the various types of redemption games we offer. For example, the State of Florida has adopted a more restrictive definition of legal redemption games. Furthermore, the states of Florida (omnibus bill governing legalized gaming), Ohio (broad regulation of games of skill) and Maryland (regulation of electronic gaming devices), and the city of Honolulu, Hawaii (regulation of simulated gambling devices), are
22
Table of Contents
considering changes to existing laws to further regulate legalized gaming and illegal gambling. Adoption of these laws, or adverse interpretation of existing laws, could require our existing stores in these jurisdictions to alter the mix of games, modify certain games, limit the number of tickets that may be won by a customer from a redemption game, change the mix of prizes that we may offer at our “Winner’s Circle” or terminate the use of specific games, any of which could adversely affect our operations. If we fail to comply with such laws and regulations, we may be subject to various sanctions and/or penalties and fines or may be required to cease operations until we achieve compliance, which could have an adverse effect on our business and our financial results.
Changes in laws, regulations and other requirements could adversely affect our business, results of operations or financial condition.
We are also subject to federal, state and local environmental laws, regulations and other requirements. More stringent and varied requirements of local and state governmental bodies with respect to zoning, land use and environmental factors could delay or prevent development of new stores in particular locations. Environmental laws and regulations also govern, among other things, discharges of pollutants into the air and water as well as the presence, handling, release and disposal of and exposure to hazardous substances. These laws provide for significant fines and penalties for noncompliance. Third parties may also make personal injury, property damage or other claims against us associated with actual or alleged release of, or exposure to, hazardous substances at our properties. We could also be strictly liable, without regard to fault, for certain environmental conditions at properties we formerly owned or operated as well as at our current properties.
In addition, we are subject to the Fair Labor Standards Act (which governs such matters as minimum wages and overtime), the Americans with Disabilities Act, various family-leave mandates and other federal, state and local laws and regulations that govern working conditions. From time-to-time, the U.S. Congress and the states consider increases in the applicable minimum wage. Several states in which we operate have enacted increases in the minimum wage, which have taken effect during the past several years, and further increases are anticipated. Although we expect increases in payroll expenses as a result of federal and state mandated increases in the minimum wage, such increases are not expected to be material. However, we are uncertain of the repercussions, if any, of increased minimum wages on other expenses. For example, our suppliers may be more severely impacted by higher minimum wage standards, which could result in increased costs to us. If we are unable to offset these costs through increased costs to our customers, our business, results of operations and financial condition could be adversely affected. Moreover, although none of our employees have been or are now represented by any unions, labor organizations may seek to represent certain of our employees in the future, and if they are successful, our payroll expenses and other labor costs may be increased in the course of collective bargaining, and/or there may be strikes or other work disruptions that may adversely affect our business.
The Patient Protection and Affordable Care Act, as amended by the Health Care and Education Reconciliation Act of 2010 (collectively, the “Patient Act”), as well as other healthcare reform legislation being considered by Congress and state legislatures, may have an adverse effect on our business. Although the Patient Act does not mandate that employers offer health insurance to all employees who are eligible under the legislation, beginning in 2015, penalties will be assessed on employers who do not offer health insurance that meets certain affordability or benefit coverage requirements. Providing health insurance benefits to employees that are more extensive than the health insurance benefits we currently provide and to a potentially larger proportion of our employees, or the payment of penalties if the specified level of coverage is not provided at an affordable cost to employees, will increase our expenses. Additionally, our distributors and suppliers also may be affected by higher health care-related costs, which could result in higher costs for goods and services supplied to us. We believe our plans will meet these requirements, however, providing health insurance benefits to a potentially larger proportion of our employees, or the payment of penalties if the specified level of coverage is not provided at an affordable cost to employees, could have a significant, negative impact on our business.
The Patient Act also requires us to comply with federal nutritional disclosure requirements. Although the Food and Drug Administration published proposed regulations to implement the nutritional menu labeling provisions of the Patient Act in April 2011, the agency has delayed the release of final regulations implementing these requirements. A number of states, counties and cities have also enacted menu labeling laws requiring multi-unit operators to disclose certain nutritional information to customers, or have enacted legislation restricting the use of certain types of ingredients in restaurants. Although the federal legislation is intended to preempt conflicting state or local laws on
23
Table of Contents
nutrition labeling, until the Food and Drug Administration issues final regulations implementing the new provisions, we will be subject to a patchwork of state and local laws and regulations regarding nutritional content disclosure requirements. The effect of such labeling requirements on consumer choices, if any, is unclear at this time.
Our sales and results of operations may be adversely affected by climate change and the passage of other environmental legislation and regulations. The costs and other effects of new legal requirements cannot be determined with certainty. For example, new legislation or regulations may result in increased costs directly for our compliance or indirectly to the extent that such requirements increase prices charged to us by vendors because of increased compliance costs. At this point, we are unable to determine the impact that climate change and other environmental legislation and regulations could have on our overall business.
We face potential liability with our gift cards under the property laws of some states.
Our gift cards, which may be used to purchase food, beverages, merchandise and game play credits in our stores, may be considered stored value cards. Certain states include gift cards under their abandoned and unclaimed property laws, and require companies to remit to the state cash in an amount equal to all or a designated portion of the unredeemed balance on the gift cards based on certain card attributes and the length of time that the cards are inactive. To date we have not remitted any amounts relating to unredeemed gift cards to states based upon our assessment of applicable laws. We recognize income from unredeemed cards when we determine that the likelihood of the cards being redeemed is remote and that recognition is appropriate based on governing state statutes.
The analysis of the potential application of the abandoned and unclaimed property laws to our gift cards is complex, involving an analysis of constitutional, statutory provisions and factual issues. In the event that one or more states change their existing abandoned and unclaimed property laws or successfully challenge our position on the application of its abandoned and unclaimed property laws to our gift cards, or if the estimates that we use in projecting the likelihood of the cards being redeemed prove to be inaccurate, our liabilities with respect to unredeemed gift cards may be materially higher than the amounts shown in our financial statements. If we are required to materially increase the estimated liability recorded in our financial statements with respect to unredeemed gift cards, our net income could be materially and adversely affected.
Our Power Cards may raise similar concerns to gift cards in terms of the applicability of states’ abandoned and unclaimed property laws. However, based on our analysis of abandoned and unclaimed property laws, we believe that our Power Cards are not stored value cards and such laws do not apply, although there can be no assurance that states will not take a different position.
Customer complaints or litigation on behalf of our customers or employees may adversely affect our business, results of operations or financial condition.
Our business may be adversely affected by legal or governmental proceedings brought by or on behalf of our customers or employees. In recent years, a number of restaurant companies, including ours, have been subject to lawsuits, including class action lawsuits, alleging violations of federal and state law regarding workplace and employment matters, discrimination and similar matters, and a number of these lawsuits have resulted in the payment of substantial damages by the defendants. We could also face potential liability if we are found to have misclassified certain employees as exempt from the overtime requirements of the federal Fair Labor Standards Act and state labor laws. We have had from time to time and now have such lawsuits pending against us. In addition, from time to time, customers file complaints or lawsuits against us alleging that we are responsible for some illness or injury they suffered at or after a visit to a store. We are also subject to a variety of other claims in the ordinary course of business, including personal injury, lease and contract claims. The restaurant industry has also been subject to a growing number of claims that the menus and actions of restaurant chains have led to the obesity of certain of their customers.
We are also subject to “dram shop” statutes in certain states in which our stores are located. These statutes generally provide a person injured by an intoxicated person the right to recover damages from an establishment that wrongfully served alcoholic beverages to the intoxicated individual. We are currently the subject of one lawsuit that alleges a violation of these statutes. Recent litigation against restaurant chains has resulted in significant judgments and settlements under dram shop statutes. Because these cases often seek punitive damages, which may not be covered by insurance, such litigation could have an adverse impact on our business, results of operations or financial condition. Regardless of whether any claims against us are valid or whether we are liable, claims may be expensive
24
Table of Contents
to defend and may divert time and money away from operations and hurt our financial performance. A judgment significantly in excess of our insurance coverage or not covered by insurance could have a material adverse effect on our business, results of operations or financial condition. As approximately 31.1% of our food and beverage revenues were derived from the sale of alcoholic beverages during fiscal 2013, adverse publicity resulting from these allegations may materially affect our stores and us.
We may face labor shortages that could slow our growth and adversely impact our ability to operate our stores.
The successful operation of our business depends upon our ability to attract, motivate and retain a sufficient number of qualified executives, managers and skilled employees. From time-to-time, there may be a shortage of skilled labor in certain of the communities in which our stores are located. Shortages of skilled labor may make it increasingly difficult and expensive to attract, train and retain the services of a satisfactory number of qualified employees and could delay the planned openings of new stores or adversely impact our existing stores. Any such delays, material increases in employee turnover rates in existing stores or widespread employee dissatisfaction could have a material adverse effect on our business and results of operations. Competition for qualified employees could require us to pay higher wages, which could result in higher labor costs and could have a material adverse effect on our results of operations.
Immigration reform continues to attract significant attention in the public arena and the U.S. Congress. If new immigration legislation is enacted, such laws may contain provisions that could increase our costs in recruiting, training and retaining employees. Also, although our hiring practices comply with the requirements of federal law in reviewing employees’ citizenship or authority to work in the United States, increased enforcement efforts with respect to existing immigration laws by governmental authorities may disrupt a portion of our workforce or our operations at one or more of our stores, thereby negatively impacting our business.
We depend on the services of key executives, the loss of whom could materially harm our business and our strategic direction if we were unable to replace them with executives of equal experience and capabilities.
Our future success significantly depends on the continued service and performance of our key management personnel. With the exception of Kevin Bachus, we have employment agreements with all members of senior management. However, we cannot prevent members of senior management from terminating their employment with us. Losing the services of members of senior management could materially harm our business until a suitable replacement is found, and such replacement may not have equal experience and capabilities. In addition, we have not purchased life insurance on any members of our senior management.
Local conditions, events, terrorist attacks, adverse weather conditions and natural disasters could adversely affect our business.
Certain of the regions in which our stores are located have been, and may in the future be, subject to adverse local conditions, events, terrorist attacks, adverse weather conditions, or natural disasters, such as earthquakes, floods and hurricanes. For example, nine of our stores are located in California and are particularly subject to earthquake risk, and our five stores in Florida, our two stores in Houston, Texas and our one store in Hawaii are particularly subject to hurricane risk. Depending upon its magnitude, a natural disaster could severely damage our stores, which could adversely affect our business, results of operations or financial condition. We currently maintain property and business interruption insurance through the aggregate property policy for each of the stores. However, such coverage may not be sufficient if there is a major disaster. In addition, upon the expiration of our current insurance policies, adequate insurance coverage may not be available at reasonable rates, or at all.
Damage to our brand or reputation could adversely affect our business.
Our brand and our reputation are among our most important assets. Our ability to attract and retain customers depends, in part, upon the external perception of our company, the quality of our food service and facilities and our integrity. Multi-store businesses, such as ours, can be adversely affected by unfavorable publicity resulting from poor food quality, illness or health concerns, or a variety of other operating issues stemming from one or a limited number of stores. Adverse publicity involving any of these factors could make our stores less appealing, reduce our customer traffic and/or impose practical limits on pricing. In the future, our stores may be operated by franchisees. Any such franchisees will be independent third parties that we do not control. Although our franchisees will be contractually obligated to operate the store in accordance with our standards, we would not oversee their daily operations. If one or more of our stores were the subject of unfavorable publicity, our overall brand could be adversely affected, which could have a material adverse effect on our business, results of operations and financial condition.
25
Table of Contents
We may not be able to renew real property leases on favorable terms, or at all, which may require us to close a store or relocate, either of which could have a material adverse effect on our business, results of operations or financial condition.
All 69 stores operated by us as of September 2, 2014 are operated on leased property. The leases typically provide for a base rent plus additional rent based on a percentage of the revenue generated by the stores on the leased premises once certain thresholds are met. A decision not to renew a lease for a store could be based on a number of factors, including an assessment of the area in which the store is located. We may choose not to renew, or may not be able to renew, certain of such existing leases if the capital investment then required to maintain the stores at the leased locations is not justified by the return on the required investment. If we are not able to renew the leases at rents that allow such stores to remain profitable as their terms expire, the number of such stores may decrease, resulting in lower revenue from operations, or we may relocate a store, which could subject us to construction and other costs and risks, and, in either case, could have a material adverse effect on our business, results of operations or financial condition.
Fixed rental payments account for a significant portion of our operating expenses, which increases our vulnerability to general adverse economic and industry conditions and could limit our operating and financial flexibility.
Payments under our operating leases account for a significant portion of our operating expenses. For example, total rental payments, including additional rental payments based on sales at some of our stores, under operating leases were approximately $55.2 million, or 8.7% of our total revenues, in fiscal 2013. In addition, as of August 3, 2014, we were a party to operating leases requiring future minimum lease payments aggregating approximately $121.4 million through the next two years and approximately $530.0 million thereafter. Future minimum lease payments exclude lease payments after August 31, 2014 related to our Kensington/Bethesda, Maryland location, which permanently closed on August 12, 2014. We expect that we will lease any new stores we open under operating leases. Our substantial operating lease obligations could have significant negative consequences, including:
| n | increasing our vulnerability to general adverse economic and industry conditions; |
| n | limiting our ability to obtain additional financing; |
| n | requiring a substantial portion of our available cash to be applied to pay our rental obligations, thus reducing cash available for other purposes; |
| n | limiting our flexibility in planning for or reacting to changes in our business or the industry in which we compete; and |
| n | placing us at a disadvantage with respect to our competitors. |
We depend on cash flow from operations to pay our lease obligations and to fulfill our other cash needs. If our business does not generate sufficient cash flow from operating activities and sufficient funds are not otherwise available to us from borrowings under bank loans or from other sources, we may not be able to service our operating lease obligations, grow our business, respond to competitive challenges or fund our other liquidity and capital needs, which would have a material adverse effect on us.
We may not be able to adequately protect our intellectual property.
Our intellectual property is essential to our success and competitive position. We use a combination of intellectual property rights, such as trademarks and trade secrets, to protect our brand and certain other proprietary processes and information material to our business. The success of our business strategy depends, in part, on our continued ability to use our intellectual property rights to increase brand awareness and further develop our branded products in both existing and new markets. If we fail to protect our intellectual property rights adequately, we may lose an important advantage in the markets in which we compete. If third parties misappropriate or infringe our intellectual property, the value of our image, brand and the goodwill associated therewith may be diminished, our brand may fail to achieve and maintain market recognition, and our competitive position may be harmed, any of which could have a material adverse effect on our business, including our revenues. Policing unauthorized use of our intellectual property is difficult, and we cannot be certain that the steps we have taken will prevent the violation or misappropriation of such intellectual property rights by others. To protect our intellectual property, we may become involved in litigation, which could result in substantial expenses, divert the attention of management and adversely affect our revenue, financial condition and results of operations.
26
Table of Contents
We cannot be certain that our products and services do not and will not infringe on the intellectual property rights of others. Any such claims, regardless of merit, could be time-consuming and expensive to litigate or settle, divert the attention of management, cause significant delays, materially disrupt the conduct of our business and have a material adverse effect on our financial condition and results of operations. As a consequence of such claims, we could be required to pay a substantial damage award, take a royalty-bearing license, discontinue the use of third-party products used within our operations and/or rebrand our business and products.
Failure to establish and maintain effective internal control over financial reporting could have a material adverse effect on our business and operating results.
Maintaining effective internal control over financial reporting is necessary for us to produce reliable financial reports and is important in helping to prevent financial fraud. If we are unable to maintain adequate internal controls, our business and operating results could be harmed. Any failure to remediate deficiencies noted by our management or our independent registered public accounting firm or to implement required new or improved controls or difficulties encountered in their implementation could cause us to fail to meet our reporting obligations or result in material misstatements in our financial statements.
Disruptions in our information technology systems or security breaches of confidential customer information or personal employee information could have an adverse impact on our operations.
Our operations are dependent upon the integrity, security and consistent operation of various systems and data centers, including the point-of-sale, kiosk and amusement operations systems in our stores, data centers that process transactions, communication systems and various other software applications used throughout our operations. Disruptions in these systems could have an adverse impact on our operations. We could encounter difficulties in developing new systems or maintaining and upgrading existing systems. Such difficulty could lead to significant expenses or to losses due to disruption in our business operations.
In addition, our information technology systems are subject to the risk of infiltration or data theft. The techniques used to obtain unauthorized access, disable or degrade service, or sabotage information technology systems change frequently and may be difficult to detect for long periods of time. As such, we may be unable to anticipate these techniques or implement adequate preventive measures. The hardware, software or applications we develop or procure from third parties may also contain defects in design or manufacture or other problems that could unexpectedly compromise information security. Unauthorized parties may also attempt to gain access to our systems or facilities through fraud, trickery or other methods of deceiving our team members, contractors and temporary staff. In 2007, there was an external breach of our credit card processing systems, which led to fraudulent credit card activity and resulted in the payment of fines and reimbursements for the fraudulent credit card activity. As part of a settlement with the Federal Trade Commission, we have implemented a series of corrective measures in order to ensure that our computer systems are secure and that our customers’ personal information is protected. Despite our considerable efforts and investment in technology to secure our computer network, security could still be compromised, confidential information could be misappropriated or system disruptions could occur in the future. This could cause significant harm to our reputation, lead to a loss of sales or profits or cause us to incur significant costs to reimburse third parties for damages.
Our current insurance policies may not provide adequate levels of coverage against all claims and we may incur losses that are not covered by our insurance.
We believe we maintain insurance coverage that is customary for businesses of our size and type. However, there are types of losses we may incur that cannot be insured against or that we believe are not commercially reasonable to insure. For example, we maintain business interruption insurance, but there can be no assurance that the coverage for a severe or prolonged business interruption at one or more of our stores would be adequate. Given the limited number of stores we operate, such a loss could have a material adverse effect on our results of operations. Similarly, although we carry insurance for breaches of our computer network security, there can be no assurance that all types of potential loss or liability will be covered by such insurance or that we have enough insurance to provide coverage against all claims. Moreover, we believe that insurance covering liability for violations of wage and hour laws is generally not available. These losses, if they occur, could have a material adverse effect on our business and results of operations.
27
Table of Contents
Risks Related to this Offering
Our stock price may fluctuate significantly, and you may not be able to resell your shares at or above the initial public offering price.
The trading price of our common stock may be volatile and subject to wide price fluctuations in response to various factors, including:
| n | market conditions in the broader stock market; |
| n | actual or anticipated fluctuations in our quarterly financial condition and results of operations; |
| n | actual or anticipated strategic, technological or regulatory threats, whether or not warranted by actual events; |
| n | issuance of new or changed securities analysts’ reports or recommendations; |
| n | investor perceptions of our company or the media and entertainment industries; |
| n | sales, or anticipated sales, of large blocks of our stock; |
| n | additions or departures of key management personnel, creative or other talent; |
| n | regulatory or political developments; |
| n | litigation and governmental investigations; and |
| n | macroeconomic conditions. |
Furthermore, the stock market has experienced extreme volatility that in some cases has been unrelated or disproportionate to the operating performance of particular companies. These and other factors may cause the market price and demand for our common stock to fluctuate substantially, which may limit or prevent investors from readily selling their shares of common stock and may otherwise negatively affect the liquidity of our common stock. In addition, in the past, when the market price of a stock has been volatile, holders of that stock have sometimes instituted securities class action litigation against the company that issued the stock. If any of our stockholders were to bring a lawsuit against us, we could incur substantial costs defending the lawsuit. Such a lawsuit could also divert the time and attention of our management from our business.
There is no existing market for our common stock, and we do not know if one will develop to provide you with adequate liquidity.
Prior to this offering, there has been no public market for shares of our common stock. We cannot predict the extent to which investor interest in our company will lead to the development of a trading market on NASDAQ, or how liquid that market may become. If an active trading market does not develop or is not sustained, you may have difficulty selling any of our common stock that you purchase at an attractive price or at all. The initial public offering price of shares of our common stock will be determined by negotiation between us and the underwriters and may not be indicative of prices that will prevail in the open market following the completion of this offering. The market price of shares of our common stock may decline below the initial public offering price, and you may not be able to resell your shares of our common stock at or above the initial offering price, or at all.
We do not anticipate paying dividends on our common stock in the foreseeable future.
We do not anticipate paying any dividends in the foreseeable future on our common stock. We intend to retain all future earnings for the operation and expansion of our business and the repayment of outstanding debt. Our senior secured credit facility contains, and any future indebtedness likely will contain, restrictive covenants that impose significant operating and financial restrictions on us, including restrictions on our ability to pay dividends and make other restricted payments. As a result, capital appreciation, if any, of our common stock may be your major source of gain for the foreseeable future. While we may change this policy at some point in the future, we cannot assure you that we will make such a change. See “Dividend Policy.”
If securities or industry analysts do not publish research or reports about our business, if they adversely change their recommendations regarding our stock or if our results of operations do not meet their expectations, our stock price and trading volume could decline.
The trading market for our common stock will be influenced by the research and reports that securities or industry analysts publish about us or our business. If one or more of these analysts cease coverage of our company or fail to publish reports on us regularly, we could lose visibility in the financial markets, which in turn could cause our stock
28
Table of Contents
price or trading volume to decline. Moreover, if one or more of the analysts who cover us downgrade recommendations regarding our stock, or if our results of operations do not meet their expectations, our stock price could decline and such decline could be material.
You will experience immediate and substantial dilution as a result of this offering and may experience additional dilution in the future.
The initial public offering price is substantially higher than the book value per share of our outstanding common stock. As a result, you will incur immediate and substantial dilution of $ per share. We also have a large number of outstanding stock options to purchase common stock with exercise prices that are below the estimated initial public offering price of our common stock. To the extent that these options are exercised, you will experience further dilution. For additional information, see the section of this prospectus entitled “Dilution.”
You may be diluted by the future issuance of additional common stock in connection with our incentive plans, acquisitions or otherwise.
After this offering, we will have shares of common stock authorized but unissued (assuming no exercise of the underwriters’ option to purchase additional shares). Our amended and restated certificate of incorporation authorizes us to issue these shares of common stock and options, rights, warrants and appreciation rights relating to common stock for the consideration and on the terms and conditions established by our Board of Directors in its sole discretion, whether in connection with acquisitions or otherwise. We have reserved shares for issuance upon exercise of outstanding stock options and for issuances under our 2014 Stock Incentive Plan. See “Executive Compensation—Elements of Compensation—Long-term Incentive Plan.” Any common stock that we issue, including under our 2014 Stock Incentive Plan or other equity incentive plans that we may adopt in the future, as well as under outstanding options would dilute the percentage ownership held by the investors who purchase common stock in this offering.
Sales of substantial amounts of our common stock in the public markets, or the perception that such sales might occur, could reduce the price of our common stock and may dilute your voting power and your ownership interest in us.
If our existing stockholders sell substantial amounts of our common stock in the public market following this offering, the market price of our common stock could decrease significantly. The perception in the public market that our existing stockholders might sell shares of common stock could also depress our market price. Upon the completion of this offering, we will have shares of common stock outstanding. We, our directors and our executive officers and our significant stockholders will be subject to the lock-up agreements described in “Underwriting” and are subject to the Rule 144 holding period requirements described in “Shares Eligible for Future Sale.” Following the expiration of the lock-up period, our principal stockholders will have the right, subject to certain conditions, to require us to register the sale of their shares of our common stock under the Securities Act. After the lock-up period has expired and the holding periods have elapsed, additional shares will be eligible for sale in the public market. The market price of shares of our common stock may drop significantly when the restrictions on resale by our existing stockholders lapse or when we are required to register the sale of our stockholders’ remaining shares of our common stock. A decline in the price of shares of our common stock might impede our ability to raise capital through the issuance of additional shares of our common stock or other equity securities.
Our costs could increase significantly as a result of operating as a public company, and our management will be required to devote substantial time to complying with public company regulations.
As a public company and particularly after we cease to be an “emerging growth company” (to the extent that we take advantage of certain exceptions from reporting requirements that are available under the JOBS Act as an “emerging growth company”), we could incur significant legal, accounting and other expenses not presently incurred. In addition, the Sarbanes-Oxley Act of 2002 (“Sarbanes-Oxley”), as well as rules promulgated by the Securities and Exchange Commission (the “SEC”) and NASDAQ, require us to adopt corporate governance practices applicable to U.S. public companies. These rules and regulations may increase our legal and financial compliance costs.
Sarbanes-Oxley, as well as rules and regulations subsequently implemented by the SEC and NASDAQ, have imposed increased disclosure and enhanced corporate governance practices for public companies. We are committed to maintaining high standards of corporate governance and public disclosure, and our efforts to comply with evolving laws, regulations and standards are likely to result in increased expenses and a diversion of management’s time and attention from revenue-generating activities to compliance activities. We may not be successful in implementing
29
Table of Contents
these requirements and implementing them could adversely affect our business, results of operations and financial condition. In addition, if we fail to implement the requirements with respect to our internal accounting and audit functions, our ability to report our financial results on a timely and accurate basis could be impaired.
We are an “emerging growth company” and may elect to comply with reduced reporting requirements applicable to emerging growth companies, which could make our common stock less attractive to investors.
We are an “emerging growth company,” as defined in the JOBS Act, and we may take advantage of certain exemptions from various reporting requirements that are applicable to other public companies that are not emerging growth companies, including, but not limited to, not being required to comply with the auditor attestation requirements of Section 404 of Sarbanes-Oxley, reduced disclosure obligations regarding executive compensation in our periodic reports and proxy statements, and exemptions from the requirements of holding a nonbinding advisory vote on executive compensation and shareholder approval of any golden parachute payments not previously approved. In addition, even if we comply with the greater obligations of public companies that are not emerging growth companies immediately after the initial public offering, we may avail ourselves of the reduced requirements applicable to emerging growth companies from time to time in the future. We cannot predict if investors will find our common stock less attractive if we choose to rely on these exemptions. If some investors find our common stock less attractive as a result, there may be a less active trading market for our common stock and our stock price may be more volatile.
Section 107 of the JOBS Act also provides that an “emerging growth company” can take advantage of the extended transition period provided in Section 7(a)(2)(B) of the Securities Act for complying with new or revised accounting standards. However, we are choosing to opt out of any extended transition period, and as a result we will comply with new or revised accounting standards on the relevant dates on which adoption of such standards is required for non-emerging growth companies. Section 107 of the JOBS Act provides that our decision to opt out of the extended transition period for complying with new or revised accounting standards is irrevocable.
We will remain an “emerging growth company” for up to five years, or until the earliest of (i) the last day of the first fiscal year in which our annual gross revenues exceed $1 billion, (ii) the date that we become a “large accelerated filer” as defined in Rule 12b-2 under the Securities Exchange Act of 1934, as amended (the “Exchange Act”), which would occur if the market value of our common stock that is held by non-affiliates exceeds $700 million as of the last business day of our most recently completed second fiscal quarter, or (iii) the date on which we have issued more than $1 billion in non-convertible debt during the preceding three year period.
Failure to maintain effective internal control over financial reporting in accordance with Section 404 of Sarbanes-Oxley could have a material adverse effect on our business and stock price.
We are not currently required to comply with the SEC rules that implement Sections 302 and 404 of Sarbanes-Oxley and are therefore not required to make a formal assessment of the effectiveness of our internal controls over financial reporting for that purpose. Upon becoming a public company, we will be required to comply with certain of these rules, which will require management to certify financial and other information in our quarterly and annual reports and provide an annual management report on the effectiveness of our internal control over financial reporting. Though we will be required to disclose changes made in our internal control procedures on a quarterly basis, if we take advantage of certain exceptions from reporting requirements that are available to “emerging growth companies” under the JOBS Act, each public accounting firm that prepares an audit for us will not be required to attest to and report on our annual assessment of our internal controls over financial reporting pursuant to Section 404 until the later of the year following our first annual report required to be filed with the SEC or the date we are no longer an “emerging growth company” as defined in the JOBS Act.
Our independent registered public accounting firm is not required to formally attest to the effectiveness of our internal control over financial reporting until the later of the year following our first annual report required to be filed with the SEC or the date we are no longer an “emerging growth company.” At such time, our independent registered public accounting firm may issue a report that is adverse in the event it is not satisfied with the level at which our controls are documented, designed or operating.
30
Table of Contents
Provisions in our amended and restated certificate of incorporation and amended and restated bylaws and Delaware law may discourage, delay or prevent a change of control of our company or changes in our management and, therefore, may depress the trading price of our stock.
Our amended and restated certificate of incorporation and amended and restated bylaws include certain provisions that could have the effect of discouraging, delaying or preventing a change of control of our company or changes in our management, including, among other things:
| n | restrictions on the ability of our stockholders to fill a vacancy on the Board of Directors; |
| n | our ability to issue preferred stock with terms that the Board of Directors may determine, without stockholder approval, which could be used to significantly dilute the ownership of a hostile acquirer; |
| n | the inability of our stockholders other than the Oak Hill Funds to call a special meeting of stockholders; |
| n | specify that special meetings of our stockholders can be called only upon the request of a majority of our Board of Directors or our Chief Executive Officer; |
| n | our directors may only be removed from the Board of Directors for cause by the affirmative vote of (i) a majority of the remaining members of the Board of Directors or (ii) the holders of at least 66 2/3% of the voting power of outstanding shares of our common stock entitled to vote thereon; |
| n | the absence of cumulative voting in the election of directors, which may limit the ability of minority stockholders to elect directors; and |
| n | advance notice requirements for stockholder proposals and nominations, which may discourage or deter a potential acquirer from soliciting proxies to elect a particular slate of directors or otherwise attempting to obtain control of us. |
These provisions in our amended and restated certificate of incorporation and our amended and restated bylaws may discourage, delay or prevent a transaction involving a change of control of our company that is in the best interest of our minority stockholders. Even in the absence of a takeover attempt, the existence of these provisions may adversely affect the prevailing market price of our common stock if they are viewed as discouraging future takeover attempts.
Section 203 of the Delaware General Corporation Law may affect the ability of an “interested stockholder” to engage in certain business combinations, including mergers, consolidations or acquisitions of additional shares, for a period of three years following the time that the stockholder becomes an “interested stockholder.” An “interested stockholder” is defined to include persons owning directly or indirectly 15% or more of the outstanding voting stock of a corporation. Accordingly, Section 203 could have an anti-takeover effect with respect to certain transactions that the Board of Directors does not approve in advance. The provisions of Section 203 may encourage companies interested in acquiring the company to negotiate in advance with the Board of Directors because the stockholder approval requirement would be avoided if the Board of Directors approves either the business combination or the transaction that results in the stockholder becoming an interested stockholder.
However, Section 203 also could discourage attempts that might result in a premium over the market price for the shares held by stockholders. These provisions also may make it more difficult to accomplish transactions that stockholders may otherwise deem to be in their best interests. Our amended and restated certificate of incorporation provides that we will not be governed by Section 203 of the Delaware General Corporation Law. Our amended and restated certificate of incorporation will contain a provision that provides us with protections similar to Section 203 of the Delaware General Corporation Law, and will prevent us from engaging in a business combination with an interested stockholder for a period of three years from the date such person acquired such common stock unless (with certain exceptions) the business combination is approved in a prescribed manner, including if Board of Directors approval or stockholder approval is obtained prior to the business combination, except that they will provide that the Oak Hill Funds, or any affiliate thereof or any person or entity which acquires from any of the foregoing stockholders beneficial ownership of 5% or more of the then outstanding shares of our voting stock in a transaction or any person or entity which acquires from such transferee beneficial ownership of 5% or more of the then outstanding shares of our voting stock other than through a registered public offering or through any broker’s transaction executed on any securities exchange or other over-the-counter market, shall not be deemed an “interested stockholder” for purposes of this provision of our amended and restated certificate of incorporation and therefore not subject to the restrictions set forth in this provision.
31
Table of Contents
Risks Related to Our Capital Structure
Our indebtedness could adversely affect our ability to raise additional capital to fund operations, limit our ability to react to changes in the economy or our industry and prevent us from meeting our financial obligations.
As of August 3, 2014, as adjusted to give effect to this offering and the application net proceeds thereof (see “Use of Proceeds”), we had $ million ($ million net of discount) of borrowings under our term loan facility, no borrowings under our revolving credit facility and $6.1 million in letters of credit outstanding. If we cannot generate sufficient cash flow from operations to service our debt, we may need to further refinance our debt, dispose of assets or issue equity to obtain necessary funds. We do not know whether we will be able to do any of this on a timely basis or on terms satisfactory to us, or at all.
Our substantial indebtedness could have important consequences, including:
| n | our ability to obtain additional debt or equity financing for working capital, capital expenditures, debt service requirements, acquisitions, new store growth and general corporate or other purposes may be limited; |
| n | a portion of our cash flows from operations will be dedicated to the payment of principal and interest on the indebtedness and will not be available for other purposes, including operations, capital expenditures and future business opportunities; |
| n | certain of our borrowings are at variable rates of interest, exposing us to the risk of increased interest rates; |
| n | our ability to adjust to changing market conditions may be limited and may place us at a competitive disadvantage compared to less-leveraged competitors; and |
| n | we may be vulnerable in a downturn in general economic conditions or in business, or may be unable to carry on capital spending that is important to our growth. |
The terms of our senior secured credit facility restrict our current and future operations, which could adversely affect our ability to respond to changes in our business and to manage our operations.
Our senior secured credit facility contains, and any future indebtedness will likely contain, a number of restrictive covenants that impose significant operating and financial restrictions on us, including restrictions on our ability to, among other things:
| n | incur additional debt; |
| n | pay dividends and make other restricted payments; |
| n | create liens; |
| n | make investments and acquisitions; |
| n | engage in sales of assets and subsidiary stock; |
| n | enter into sale-leaseback transactions; |
| n | enter into transactions with affiliates; |
| n | transfer all or substantially all of our assets or enter into merger or consolidation transactions; |
| n | hedge currency and interest rate risk; and |
| n | make capital expenditures. |
Our senior secured credit facility requires us to meet a maximum total leverage ratio if outstanding revolving loans and letters of credit (other than letters of credit that have been backstopped or cash collateralized) are in excess of 30% of the outstanding revolving commitments. Failure by us to comply with the covenants or financial ratios contained in the instruments governing our indebtedness could result in an event of default under the facility, which could adversely affect our ability to respond to changes in our business and manage our operations. In the event of any default under our senior secured credit facility, the lenders will not be required to lend any additional amounts to us. Our lenders also could elect to declare all amounts outstanding to be due and payable and require us to apply all of our available cash to repay these amounts. If our indebtedness were to be accelerated, our assets may not be sufficient to repay this indebtedness in full.
32
Table of Contents
After this offering, our principal stockholder will continue to have substantial control over us.
After the consummation of this offering, the Oak Hill Funds will collectively beneficially own approximately % of our outstanding common stock, and approximately % of our outstanding common stock if the underwriters’ option to purchase additional shares is exercised in full. See “Principal Stockholders.” As a consequence, the Oak Hill Funds or their affiliates will be able to control matters requiring stockholder approval, including the election of directors, a merger, consolidation or sale of all or substantially all of our assets, and any other significant transaction. The interests of this stockholder may not always coincide with our interests or the interests of our other stockholders. For instance, this concentration of ownership may have the effect of delaying or preventing a change of control of us otherwise favored by our other stockholders and could depress our stock price.
As a result of affiliates of the Oak Hill Funds continuing to control a majority of our outstanding common stock after the consummation of this offering, we are a “controlled company” within the meaning of NASDAQ corporate governance standards. Under these rules, a “controlled company” may elect not to comply with certain NASDAQ corporate governance standards, including:
| n | the requirement that a majority of the Board of Directors consist of independent directors; |
| n | the requirement that we have a nominating and corporate governance committee that is composed entirely of independent directors with a written charter addressing the committee’s purpose and responsibilities; |
| n | the requirement that we have a compensation committee that is composed entirely of independent directors with a written charter addressing the committee’s purpose and responsibilities; and |
| n | the requirement for an annual performance evaluation of the nominating and corporate governance committee and compensation committee. |
Following this offering, we may utilize these exemptions or elect to utilize them in the future. As a result, we may not have a majority of independent directors, our nominating and corporate governance committee and compensation committee may not consist entirely of independent directors and such committees will not be subject to annual performance evaluations. Accordingly, our stockholders may not have the same protections afforded to shareholders of companies that are subject to all of the NASDAQ corporate governance requirements.
In addition, so long as affiliates of the Oak Hill Funds own at least 40% of our outstanding common stock, stockholders will be able to take action by written consent. During such time, affiliates of the Oak Hill Funds, along with a limited number of other stockholders (if the Oak Hill Funds hold less than a majority of our outstanding common stock), could take action by written consent and prevent other stockholders the opportunity to attend a meeting of stockholders and vote on a particular matter.
The Oak Hill Funds and their affiliates will be reimbursed for certain costs and expenses pursuant to the new stockholders’ agreement. See “Certain Relationships and Related Transactions—New Stockholders’ Agreement.”
Conflicts of interest may arise because some of our directors are principals of our principal stockholder.
The Oak Hill Funds or their affiliates could invest in entities that directly or indirectly compete with us. As a result of these relationships, when conflicts arise between the interests of the Oak Hill Funds or their affiliates and the interests of our stockholders, these directors may not be disinterested. The representatives of the Oak Hill Funds on our Board of Directors, by the terms of our amended and restated certificate of incorporation and a stockholders’ agreement that will be entered into in connection with this offering, are not required to offer us any transaction opportunity of which they become aware and could take any such opportunity for themselves or offer it to other companies in which they have an investment, unless such opportunity is expressly offered to them solely in their capacity as our directors. In addition, under the stockholders’ agreement, the Oak Hill Funds will be permitted to disclose our confidential information to their affiliates, representatives and advisors and the Oak Hill Funds and their affiliates will be permitted to disclose our confidential information if requested or required by law. The Oak Hill Funds and their affiliates will also be permitted to disclose our confidential information to any potential purchaser of Dave & Buster’s Entertainment, Inc. that executes a customary confidentiality agreement.
The Oak Hill Funds will be entitled to designate directors to serve on the Board of Directors proportionate to the Oak Hill Funds’ (or one or more of their affiliates, to the extent assigned thereto) aggregate ownership of the outstanding shares of our common stock, at any meeting of stockholders at which directors are to be elected to the extent that
33
Table of Contents
the Oak Hill Funds do not have such proportionate number of director designees then serving on the Board of Directors; provided that for so long as the Oak Hill Funds (or one or more of their affiliates, to the extent assigned thereto), individually or in the aggregate, own 5% or more of the voting power of the outstanding shares of our common stock, the Oak Hill Funds will be entitled to designate one director designee to serve on the Board of Directors at any meeting of stockholders at which directors are to be elected to the extent that the Oak Hill Funds do not have a director designee then serving on the Board of Directors. Such proportionate number of director designees will be determined by taking the product of the Oak Hill Funds’ (or one or more of their affiliates, to the extent assigned thereto) aggregate ownership of the outstanding shares of our common stock multiplied by the then current number of directors on our Board of Directors (rounded up to the next whole number to the extent the product does not equal a whole number). The Oak Hill Funds’ director designees will initially be J. Taylor Crandall, Kevin M. Mailender and Tyler J. Wolfram, and, therefore, the Oak Hill Funds will be entitled to designate additional directors in order for Oak Hill to have its proportionate number of director designees. We will expand the size of our Board of Directors if necessary to provide for such proportionate representation. Subject to applicable law and applicable NASDAQ rules, the stockholders’ agreement will also provide that the Oak Hill Funds will be entitled to nominate the members of the Nominating and Corporate Governance Committee. In addition, subject to applicable law and applicable NASDAQ rules, each other committee of our Board of Directors, other than the Audit Committee, will consist of at least one member designated by the Oak Hill Funds.
34
Table of Contents
CAUTIONARY STATEMENT REGARDING FORWARD-LOOKING STATEMENTS
This prospectus includes statements that are, or may deemed to be, forward-looking statements. These forward-looking statements can be identified by the use of forward-looking terminology, including the terms “believes,” “estimates,” “anticipates,” “expects,” “intends,” “may,” “will” or “should” or, in each case, their negative or other variations or comparable terminology. These forward-looking statements include all matters that are not historical facts. They appear in a number of places throughout this prospectus and include statements regarding our intentions, beliefs or current expectations concerning, among other things, our results of operations, financial condition, liquidity, prospects, growth, operating leverage strategies and the industry in which we operate.
By their nature, forward-looking statements involve risks and uncertainties because they relate to events and depend on circumstances that may or may not occur in the future. We caution you that forward-looking statements are not guarantees of future performance and that actual results of operations, financial condition and liquidity, and the development of the industry in which we operate may differ materially from those made in or suggested by the forward-looking statements contained in this prospectus. In addition, even if results of operations, financial condition and liquidity, and the development of the industry in which we operate are consistent with the forward-looking statements contained in this prospectus, those results or developments may not be indicative of results or developments in subsequent periods. As a result we caution you against relying on any forward-looking statement.
The following listing represents some, but not necessarily all, of the factors that may cause actual results to differ from those anticipated or predicted:
| n | the impact of the global economic crisis on our business and financial results; |
| n | our ability to open new stores and operate them profitably; |
| n | our ability to achieve our targeted cash-on-cash return, first year store revenues, net development costs or Store-level EBITDA margin for new store openings; |
| n | changes in consumer preferences, general economic conditions or consumer discretionary spending; |
| n | the effect of competition in our industry; |
| n | potential fluctuations in our quarterly operating results due to seasonality and other factors; |
| n | the impact of potential fluctuations in the availability and cost of food and other supplies; |
| n | the impact of instances of food-borne illness and outbreaks of disease; |
| n | the impact of federal, state or local government regulations relating to our entertainment, games and attractions, personnel or the sale of food or alcoholic beverages; |
| n | legislative or regulatory changes; |
| n | the continued service of key management personnel; |
| n | our ability to attract, motivate and retain qualified personnel; |
| n | the impact of litigation; |
| n | changes in accounting principles, policies or guidelines; |
| n | changes in general economic conditions or conditions in securities markets or the banking industry; |
| n | a materially adverse change in our financial condition; |
| n | adverse local conditions, events, terrorist attacks, weather and natural disasters; and |
| n | other economic, competitive, governmental, regulatory, geopolitical and technological factors affecting operations, pricing and services. |
You should also read carefully the factors described in the “Risk Factors” section of this prospectus to better understand the risks and uncertainties inherent in our business and underlying any forward-looking statements.
Any forward-looking statements that we make in this prospectus speak only as of the date of such statements, and we undertake no obligation to update such statements. Comparisons of results for current and any prior periods are not intended to express any future trends or indications of future performance, unless expressed as such, and should only be viewed as historical data.
35
Table of Contents
We estimate that the net proceeds to us from our sale of shares of our common stock in this offering will be approximately $ million, after deducting underwriting discounts and commissions and estimated expenses payable by us in connection with this offering. This assumes a public offering price of $ per share, which is the midpoint of the price range set forth on the cover of this prospectus. We intend to use the net proceeds from this offering to repay approximately $ million principal amount of term loan debt outstanding under the new senior secured credit facility and $ million to pay accrued interest and related expenses.
The term loan debt to be repaid has a maturity date of July 25, 2020 and the effective rate of interest on borrowings under our term loan debt was 4.7% per annum for the twenty-six weeks ended August 3, 2014.
A $1.00 increase (decrease) in the assumed initial public offering price of $ per share (the midpoint of the price range set forth on the cover page of this prospectus) would increase (decrease) the net proceeds to us from this offering by $ million, assuming the number of shares offered by us, as set forth on the cover page of this prospectus, remains the same and after deducting underwriting discounts and commissions and estimated expenses payable by us.
36
Table of Contents
We have not historically declared or paid any cash dividends on our common stock. After this offering, we intend to retain all available funds and any future earnings to reduce debt and fund the development and growth of our business, and we do not anticipate paying any dividends on our common stock. However, in the future, subject to the factors described below and our future liquidity and capitalization, we may change this policy and choose to pay dividends. Our ability to pay dividends on our common stock is currently restricted directly or indirectly by the terms of our new senior secured credit facility and may be further restricted by any future indebtedness we incur. Our business is conducted through our principal operating subsidiary, Dave & Buster’s, Inc. Dividends from, and cash generated by, Dave & Buster’s, Inc. will be our principal sources of cash to repay indebtedness, fund operations and pay dividends. Accordingly, our ability to pay dividends to our stockholders is dependent on the earnings and distributions of funds from Dave & Buster’s, Inc.
Any future determination to pay dividends will be at the discretion of our Board of Directors and will take into account:
| n | restrictions in agreements governing our indebtedness; |
| n | general economic and business conditions; |
| n | our financial condition and results of operations; |
| n | our capital requirements; |
| n | the ability of Dave & Busters, Inc. to pay dividends and make distributions to us; and |
| n | such other factors as our Board of Directors may deem relevant. |
See “Management’s Discussion and Analysis of Financial Condition and Results of Operations.”
37
Table of Contents
The following table sets forth our consolidated capitalization as of August 3, 2014:
| n | on an actual basis; and |
| n | as adjusted to give effect to (1) this offering and the use of proceeds therefrom as if it had occurred on August 3, 2014; (2) a for 1 stock split of our common stock prior to the consummation of this offering; and (3) our amended and restated certificate of incorporation, which will be in effect prior to the consummation of this offering; and assumes (1) no exercise of the underwriters’ option to purchase up to additional shares from us; and (2) an initial public offering price of $ per share, the midpoint of the price range set forth on the cover of this prospectus. |
This table should be read in conjunction with “Use of Proceeds,” “Selected Consolidated Financial Data,” “Management’s Discussion and Analysis of Financial Condition and Results of Operations” and our consolidated financial statements and the notes thereto included in this prospectus.
| AS OF AUGUST 3, 2014 | ||||||||
| ACTUAL | AS ADJUSTED FOR OFFERING |
|||||||
| (Dollars in thousands) | ||||||||
| Cash and cash equivalents |
$ | 65,351 | $ | |||||
|
|
|
|
|
|||||
| Debt (1): |
||||||||
| Senior secured credit facility: |
||||||||
| Revolving credit facility (2) |
$ | — | $ | — | ||||
| Term loan, net of unamortized discount |
528,681 | |||||||
|
|
|
|
|
|||||
| Total debt |
528,681 | |||||||
|
|
|
|
|
|||||
| Stockholders’ equity: |
||||||||
| Common stock, $0.01 par value, 500,000 shares authorized and 148,690 shares issued on an actual basis; shares authorized and shares issued on an as adjusted basis |
1 | |||||||
| Preferred stock, 10,000,000 authorized and none issued on an actual basis; shares authorized and none issued on an as adjusted basis |
— | |||||||
| Paid-in capital |
153,497 | |||||||
| Treasury stock, 1,104 shares ( shares as adjusted) |
(1,189 | ) | ||||||
| Accumulated other comprehensive loss |
(101 | ) | ||||||
| Accumulated deficit (3) |
(3,608) | |||||||
|
|
|
|
|
|||||
| Total stockholders’ equity |
148,600 | |||||||
|
|
|
|
|
|||||
| Total capitalization |
$ | 677,281 | $ | |||||
|
|
|
|
|
|||||
| (1) | This presentation shows amounts that are net of original issue discount. |
| (2) | As of August 3, 2014, there were no outstanding borrowings under the revolving credit facility, and $43,886 was available for borrowing after taking into account $6,114 of outstanding letters of credit. |
| (3) | As adjusted accumulated deficit reflects the estimated loss (net of tax effect) on the extinguishment of a portion of our outstanding senior credit facility as described in “Use of Proceeds.” |
38
Table of Contents
If you invest in our common stock in this offering, your ownership interest will be diluted to the extent of the difference between the initial public offering price per share and the as adjusted net tangible book value per share of our common stock upon the completion of this offering.
As of August 3, 2014 our book value was $148.6 million or $1,006.87 per share (or $ per share as adjusted for the stock split) and our net tangible book value was approximately $(207.1) million, or $(1,403.51) per share (or $ per share as adjusted for the stock split). Our net tangible book value per share represents the amount of our total tangible assets less total liabilities, divided by the total number of shares of common stock outstanding as of August 3, 2014. Dilution in net tangible book value per share represents the difference between the amount per share paid by purchasers of common stock in this offering and the as adjusted net tangible book value per share of common stock immediately after the completion of this offering.
After giving effect to (1) the for 1 stock split of our common stock, (2) the sale of our common stock at an assumed initial public offering price of $ per share (the midpoint of the price range set forth on the cover of this prospectus), after deducting underwriting discounts and commissions and estimated offering expenses payable by us, and (3) the application of the net proceeds from this offering as described in “Use of Proceeds,” our as adjusted net tangible book value as of August 3, 2014 would have been approximately $( ) million, or $( ) per share.
This represents an immediate increase in net tangible book value of $ per share to our existing stockholders and an immediate dilution in net tangible book value of $ per share to new investors purchasing shares of our common stock in this offering at the initial public offering price.
The following table illustrates the dilution to new investors on a per share basis:
| Assumed initial public offering price per share |
$ | |||
| Net tangible book value per share as of August 3, 2014 (as adjusted for the stock split) |
||||
| Increase in net tangible book value per share attributable to the sale of shares in this offering |
||||
| As adjusted net tangible book value per share after this offering |
||||
|
|
|
|||
| Dilution per share to new investors |
$ | |||
|
|
|
A $1.00 increase (decrease) in the assumed initial public offering price of $ per share (the midpoint of the price range set forth on the cover of this prospectus) would increase (decrease) our as adjusted net tangible book value after this offering by $ million and increase (decrease) the dilution to new investors by $ per share, assuming the number of shares offered by us, as set forth on the cover page of this prospectus, remains the same and after deducting the estimated underwriting discounts and commissions and estimated offering expenses payable by us.
The following table summarizes, as of August 3, 2014, the total number of shares of our common stock we issued and sold, the total consideration we received and the average price per share paid to us by our existing stockholders and to be paid by new investors purchasing shares of our common stock in this offering. The table gives effect to the for 1 stock split of our common stock and is based on the initial public offering price of $ per share (the midpoint of the price range set forth on the cover of this prospectus), before underwriting discounts and commissions and estimated offering expenses payable by us:
| SHARES PURCHASED |
TOTAL CONSIDERATION (IN THOUSANDS) |
AVERAGE PRICE PER |
||||||||||||||||
| NUMBER | PERCENT | AMOUNT | PERCENT | SHARE | ||||||||||||||
| Existing stockholders |
% | $ | % | $ | ||||||||||||||
| New investors |
% | $ | % | $ | ||||||||||||||
|
|
|
|
|
|
|
|
|
|
||||||||||
| Total |
% | $ | % | $ | ||||||||||||||
39
Table of Contents
A $1.00 increase (decrease) in the assumed initial public offering price of $ per share (the midpoint of the price range set forth on the cover of this prospectus) would increase (decrease) the total consideration paid by new investors by $ million and the total consideration paid by all stockholders by $ million.
The number of shares held by the new investors will be increased to the extent the underwriters exercise their option to purchase additional shares. If the underwriters fully exercise their option, the new investors will own a total of shares, or approximately % of our total outstanding shares.
In addition, we may choose to raise additional capital due to market conditions or strategic considerations even if we believe we have sufficient funds for our current or future operating plans. To the extent that additional capital is raised through the sale of equity or convertible debt securities, or option grants are made to employees, the issuance of such securities could result in further dilution to our stockholders.
40
Table of Contents
SELECTED CONSOLIDATED FINANCIAL DATA
Set forth below are our selected consolidated financial data for the periods ending on and as of the dates indicated. GAAP requires operating results for D&B Holdings prior to the acquisition completed June 1, 2010 to be presented as the results of the Predecessor in the historical financial statements. Operating results of Dave & Buster’s Entertainment, Inc. subsequent to the acquisition are presented as the results of the Successor and include all periods including and subsequent to June 1, 2010.
Dave & Buster’s Entertainment, Inc. has no material assets or operations other than 100% ownership of the outstanding common stock of D&B Holdings. D&B Holdings has no material assets or operations other than 100% ownership of the outstanding common stock of Dave & Buster’s, Inc.
The statement of operations and cash flows data for each of the fiscal years ended February 2, 2014 (Successor), February 3, 2013 (Successor) and January 29, 2012 (Successor) and the balance sheet data as of February 2, 2014 (Successor) and February 3, 2013 (Successor) were derived from our audited consolidated financial statements included elsewhere in this prospectus. The statement of operations and cash flows data for each of the 244 day period from June 1, 2010 to January 30, 2011 (Successor), the 120 day period from February 1, 2010 to May 31, 2010 (Predecessor) and the fiscal year ended January 31, 2010 (Predecessor) and the balance sheet data as of January 29, 2012 (Successor), January 30, 2011 (Successor) and January 31, 2010 (Predecessor) were derived from the Successor’s and Predecessor’s audited consolidated financial statements that are not included elsewhere in this prospectus. The statement of operations and cash flows data for each of the twenty-six week periods ended August 3, 2014 (Successor) and August 4, 2013 (Successor), and the balance sheet data as of August 3, 2014 (Successor) were derived from our unaudited consolidated financial statements included elsewhere in this prospectus. The balance sheet as of August 4, 2013 (Successor) was derived from our unaudited consolidated financial statements, which are not included in this prospectus. In the opinion of management, the unaudited consolidated financial statements include all normal recurring adjustments necessary to present fairly the data for such periods and as of such dates.
We operate on a 52 or 53 week fiscal year that ends on the Sunday after the Saturday closest to January 31. Each quarterly period has 13 weeks, except in a 53 week year when the fourth quarter has 14 weeks. All fiscal years presented herein consist of 52 weeks, except fiscal year 2012, which consisted of 53 weeks.
Our historical results are not necessarily indicative of future results of operations. The selected consolidated financial data should be read in conjunction with “Management’s Discussion and Analysis of Financial Condition and Results of Operations” and our historical consolidated financial statements and the notes related thereto, included elsewhere in this prospectus. All dollar amounts are presented in thousands except per share amounts.
This table should be read in conjunction with “Management’s Discussion and Analysis of Financial Condition and Results of Operations,” our historical consolidated financial statements and the notes related thereto, included elsewhere in this prospectus. All dollar amounts are presented in thousands except per share amounts.
41
Table of Contents
| TWENTY-SIX WEEKS ENDED |
FISCAL YEAR ENDED | FISCAL YEAR ENDED | ||||||||||||||||||||||||||||||||||
| AUGUST 3, 2014 |
AUGUST 4, 2013 |
FEBRUARY 2, 2014 |
FEBRUARY 3, 2013 |
JANUARY 29, 2012 |
FOR THE 244 DAY PERIOD FROM JUNE 1, 2010 TO JANUARY 30, 2011 |
FOR THE 120 DAY PERIOD FROM FEBRUARY 1, 2010 TO MAY 31, 2010 |
JANUARY 30, 2011 (1) |
JANUARY 31, 2010 |
||||||||||||||||||||||||||||
| (Successor) | (Successor) | (Successor) | (Successor) | (Successor) | (Successor) | (Predecessor) | (Combined) (Non-GAAP) |
(Predecessor) | ||||||||||||||||||||||||||||
| Statement of operations data: |
||||||||||||||||||||||||||||||||||||
| Revenues: |
||||||||||||||||||||||||||||||||||||
| Food and beverage revenues |
$ | 177,898 | $ | 153,272 | $ | 310,111 | $ | 298,421 | $ | 272,606 | $ | 177,044 | $ | 90,470 | $ | 267,514 | $ | 269,973 | ||||||||||||||||||
| Amusement and other revenues |
198,310 | 168,606 | 325,468 | 309,646 | 268,939 | 166,489 | 87,536 | 254,025 | 250,810 | |||||||||||||||||||||||||||
|
|
|
|
|
|
|
|
|
|
|
|
|
|
|
|
|
|
|
|||||||||||||||||||
| Total revenues |
376,208 | 321,878 | 635,579 | 608,067 | 541,545 | 343,533 | 178,006 | 521,539 | 520,783 | |||||||||||||||||||||||||||
|
|
|
|
|
|
|
|
|
|
|
|
|
|
|
|
|
|
|
|||||||||||||||||||
| Operating costs: |
||||||||||||||||||||||||||||||||||||
| Cost of products: |
||||||||||||||||||||||||||||||||||||
| Cost of food and beverage |
45,690 | 38,273 | 77,577 | 73,019 | 65,751 | 41,890 | 21,817 | 63,707 | 65,349 | |||||||||||||||||||||||||||
| Cost of amusement and other |
27,244 | 24,263 | 47,437 | 46,098 | 41,417 | 26,832 | 13,442 | 40,274 | 38,788 | |||||||||||||||||||||||||||
|
|
|
|
|
|
|
|
|
|
|
|
|
|
|
|
|
|
|
|||||||||||||||||||
| Total cost of products |
72,934 | 62,536 | 125,014 | 119,117 | 107,168 | 68,722 | 35,259 | 103,981 | 104,137 | |||||||||||||||||||||||||||
| Operating payroll and benefits |
85,120 | 72,546 | 150,172 | 145,571 | 130,875 | 85,271 | 43,969 | 129,240 | 132,114 | |||||||||||||||||||||||||||
| Other store operating expenses |
114,142 | 98,761 | 199,537 | 192,792 | 175,993 | 111,456 | 59,802 | 171,258 | 174,685 | |||||||||||||||||||||||||||
| General and administrative expenses (2) |
20,069 | 17,922 | 36,440 | 40,356 | 34,896 | 25,670 | 17,064 | 42,734 | 30,437 | |||||||||||||||||||||||||||
| Depreciation and amortization expense (3) |
34,673 | 33,650 | 66,337 | 63,457 | 54,277 | 33,794 | 16,224 | 50,018 | 53,658 | |||||||||||||||||||||||||||
| Pre-opening costs |
4,292 | 2,842 | 7,040 | 3,060 | 4,186 | 842 | 1,447 | 2,289 | 3,881 | |||||||||||||||||||||||||||
|
|
|
|
|
|
|
|
|
|
|
|
|
|
|
|
|
|
|
|||||||||||||||||||
| Total operating costs |
331,230 | 288,257 | 584,540 | 564,353 | 507,395 | 325,755 | 173,765 | 499,520 | 498,912 | |||||||||||||||||||||||||||
|
|
|
|
|
|
|
|
|
|
|
|
|
|
|
|
|
|
|
|||||||||||||||||||
| Operating income |
44,978 | 33,621 | 51,039 | 43,714 | 34,150 | 17,778 | 4,241 | 22,019 | 21,871 | |||||||||||||||||||||||||||
| Interest expense, net |
23,696 | 23,861 | 47,809 | 47,634 | 44,931 | 25,486 | 6,976 | 32,462 | 22,122 | |||||||||||||||||||||||||||
| Loss on debt retirement |
25,986 | — | — | — | — | — | — | — | — | |||||||||||||||||||||||||||
|
|
|
|
|
|
|
|
|
|
|
|
|
|
|
|
|
|
|
|||||||||||||||||||
| Income (loss) before provision (benefit) for income taxes |
(4,704 | ) | 9,760 | 3,230 | (3,920 | ) | (10,781 | ) | (7,708 | ) | (2,735 | ) | (10,443 | ) | (251 | ) | ||||||||||||||||||||
| Provision (benefit) for income taxes |
(2,287 | ) | 2,308 | 1,061 | (12,702 | ) | (3,796 | ) | (2,551 | ) | (597 | ) | (3,148 | ) | 99 | |||||||||||||||||||||
|
|
|
|
|
|
|
|
|
|
|
|
|
|
|
|
|
|
|
|||||||||||||||||||
| Net income (loss) |
$ | (2,417 | ) | $ | 7,452 | $ | 2,169 | $ | 8,782 | $ | (6,985 | ) | $ | (5,157 | ) | $ | (2,138 | ) | $ | (7,295 | ) | $ | (350 | ) | ||||||||||||
|
|
|
|
|
|
|
|
|
|
|
|
|
|
|
|
|
|
|
|||||||||||||||||||
| Net income (loss) per share of common stock: |
||||||||||||||||||||||||||||||||||||
| Basic |
$ |
(16.38 |
) |
$ |
50.52 |
|
$ | 14.70 | $ | 59.54 | $ | (45.58 | ) | $ | (21.07 | ) | * | * | * | |||||||||||||||||
| Diluted |
$ | (16.38 | ) | $ | 49.40 | $ | 14.34 | $ | 58.55 | $ | (45.58 | ) | $ | (21.07 | ) | * | * | * | ||||||||||||||||||
| Weighted average number of shares outstanding: |
||||||||||||||||||||||||||||||||||||
| Basic |
147,586 | 147,506 | 147,512 | 147,506 | 153,250 | 244,748 | * | * | * | |||||||||||||||||||||||||||
| Diluted |
147,586 | 150,850 | 151,256 | 150,000 | 153,250 | 244,748 | * | * | * | |||||||||||||||||||||||||||
| As adjusted Consolidated Statements of Operations Data (4): |
||||||||||||||||||||||||||||||||||||
| As adjusted net income |
$ | $ | ||||||||||||||||||||||||||||||||||
| As adjusted earnings per share: |
||||||||||||||||||||||||||||||||||||
| Basic |
$ | $ | ||||||||||||||||||||||||||||||||||
| Diluted |
$ | $ | ||||||||||||||||||||||||||||||||||
| As adjusted weighted average shares outstanding: |
||||||||||||||||||||||||||||||||||||
| Basic |
||||||||||||||||||||||||||||||||||||
| Diluted |
||||||||||||||||||||||||||||||||||||
| Statement of cash flow data: |
||||||||||||||||||||||||||||||||||||
| Cash provided by (used in): |
||||||||||||||||||||||||||||||||||||
| Operating activities |
$ | 10,451 | $ | 66,332 | $ | 109,878 | $ | 82,796 | $ | 72,777 | $ | 25,240 | $ | 11,295 | $ | 36,535 | $ | 59,054 | ||||||||||||||||||
| Investing activities |
(59,352 | ) | (45,559 | ) | (105,677 | ) | (78,488 | ) | (70,502 | ) | (102,744 | ) | (12,975 | ) | (115,719 | ) | (48,406 | ) | ||||||||||||||||||
| Financing activities |
76,172 | (1,568 | ) | (2,238 | ) | (1,875 | ) | (2,998 | ) | 97,034 | (125 | ) | 96,909 | (2,500 | ) | |||||||||||||||||||||
| Balance sheet data (as of end of period): |
||||||||||||||||||||||||||||||||||||
| Cash and cash equivalents |
$ | 65,351 | 55,322 | $ | 38,080 | $ | 36,117 | $ | 33,684 | $ | 34,407 | $ | 16,682 | |||||||||||||||||||||||
| Net working capital (deficit) (5) |
9,486 | 3,224 | (13,700 | ) | 5,863 | (9,584 | ) | (5,186 | ) | (33,922 | ) | |||||||||||||||||||||||||
| Property and equipment, net |
406,411 | 353,799 | 388,093 | 337,239 | 323,342 | 304,819 | 294,151 | |||||||||||||||||||||||||||||
| Total assets |
908,124 | 837,666 | 861,758 | 813,610 | 786,142 | 764,542 | 483,640 | |||||||||||||||||||||||||||||
| Total debt, net of unamortized discount |
528,681 | 478,117 | 485,677 | 471,050 | 458,497 | 347,918 | 227,250 | |||||||||||||||||||||||||||||
| Stockholders’ equity |
148,600 | 155,322 | 150,448 | 147,411 | 137,515 | 239,830 | 92,646 | |||||||||||||||||||||||||||||
| * | Not meaningful. |
42
Table of Contents
| TWENTY-SIX WEEKS ENDED |
FISCAL YEAR ENDED | |||||||||||||||||||||||||||
| AUGUST 3, 2014 |
AUGUST 4, 2013 |
FEBRUARY 2, 2014 |
FEBRUARY 3, 2013 |
JANUARY 29, 2012 |
JANUARY 30, 2011 |
JANUARY 31, 2010 |
||||||||||||||||||||||
| (Combined) | ||||||||||||||||||||||||||||
| Store-level Data: |
||||||||||||||||||||||||||||
| Stores open at end of period (6) |
69 | 62 | 66 | 61 | 58 | 57 | 55 | |||||||||||||||||||||
| Comparable stores (7) |
57 | 55 | 55 | 54 | 52 | 48 | 47 | |||||||||||||||||||||
| Comparable store sales increase (decrease) (8) |
5.2 | % | 0.5 | % | 1.0 | % | 3.0 | % | 2.2 | % | (1.9 | )% | (7.8 | )% | ||||||||||||||
| Store-level EBITDA (9) |
$ | 104,012 | $ | 88,035 | $ | 160,856 | $ | 150,587 | $ | 127,509 | $ | 117,060 | $ | 109,847 | ||||||||||||||
| Store-level EBITDA margin (10) |
27.6 | % | 27.4 | % | 25.3 | % | 24.8 | % | 23.5 | % | 22.4 | % | 21.1 | % | ||||||||||||||
| TWENTY-SIX WEEKS ENDED |
FISCAL YEAR ENDED | |||||||||||||||||||||||||||
| AUGUST 3, 2014 |
AUGUST 4, 2013 |
FEBRUARY 2, 2014 |
FEBRUARY 3, 2013 |
JANUARY 29, 2012 |
JANUARY 30, 2011 |
JANUARY 31, 2010 |
||||||||||||||||||||||
| (Combined) | ||||||||||||||||||||||||||||
| Other Data: |
||||||||||||||||||||||||||||
| Adjusted EBITDA (11) |
$ | 89,059 | $ | 74,838 | $ | 134,790 | $ | 120,478 | $ | 98,372 | $ | 86,280 | $ | 83,145 | ||||||||||||||
| Adjusted EBITDA margin (12) |
23.7 | % | 23.3 | % | 21.2 | % | 19.8 | % | 18.2 | % | 16.5 | % | 16.0 | % | ||||||||||||||
| Capital additions (13): |
||||||||||||||||||||||||||||
| New store |
$ | 30,082 | $ | 27,375 | $ | 72,301 | $ | 32,795 | $ | 43,951 | $ | 10,745 | $ | 27,267 | ||||||||||||||
| Operating initiatives, including remodels |
9,920 | 13,094 | 21,930 | 21,946 | 10,380 | 5,500 | 6,560 | |||||||||||||||||||||
| Games |
7,601 | 6,384 | 11,413 | 10,090 | 7,196 | 7,238 | 3,894 | |||||||||||||||||||||
| Maintenance |
5,122 | 4,254 | 14,238 | 13,858 | 11,419 | 11,750 | 10,702 | |||||||||||||||||||||
|
|
|
|
|
|
|
|
|
|
|
|
|
|
|
|||||||||||||||
| Total capital additions |
$ | 52,725 | $ | 51,107 | $ | 119,882 | $ | 78,689 | $ | 72,946 | $ | 35,233 | $ | 48,423 | ||||||||||||||
|
|
|
|
|
|
|
|
|
|
|
|
|
|
|
|||||||||||||||
| (1) | Affiliates of the Oak Hill Funds acquired all of the outstanding common stock of D&B Holdings as part of the June 1, 2010 acquisition. GAAP in the United States requires operating results for D&B Holdings prior to the June 1, 2010 acquisition to be presented as Predecessor’s results in the historical financial statements. Operating results for Dave & Buster’s Entertainment, Inc. subsequent to the June 1, 2010 acquisition are presented or referred to as Successor’s results in our historical financial statements. References to the 52 week period ended January 30, 2011, included in this prospectus relate to the combined 244 day period ended January 30, 2011 of the Successor and the 120 day period ended May 31, 2010 of the Predecessor. The financial results for the Successor periods include the impacts of applying purchase accounting. The presentation of combined Predecessor and Successor operating results (which is simply the arithmetic sum of the Predecessor and Successor amounts) is a Non-GAAP presentation, which is provided as a convenience solely for the purpose of facilitating comparisons of the combined results with other annual periods presented. |
| (2) | General and administrative expenses during the fiscal year ended January 30, 2011 includes $4.6 million and $4.3 million of transaction costs in the Successor and Predecessor periods, respectively. The Predecessor period of fiscal 2010 also includes $1.4 million acceleration of stock-based compensation charges related to the Predecessor’s stock plan. |
| (3) | Fair value adjustments made in connection with accounting for the Acquisition resulted in a $29.1 million increase in depreciable asset values. The fair value adjustments and changes in useful lives to certain assets contributed to higher post-acquisition depreciation expense. The impacts on these fair value adjustments will continue to contribute to higher depreciation for approximately the next fifteen years. However, the impact diminishes over time due to the expiration of useful lives or disposition of the underlying assets. |
| (4) | As adjusted consolidated statement of operations data gives effect to (i) a for 1 stock split of our common stock prior to the completion of this offering, (ii) the Refinancing as described in “Prospectus Summary—The Refinancing” and (iii) the receipt and application of $ of net proceeds to us from this offering based on an initial public offering price of $ per share (the mid- |
43
Table of Contents
| point of the range set forth on the cover of this prospectus) as described in “Use of Proceeds,” as if they had occurred on February 4, 2013 with respect to fiscal year 2013 and February 3, 2014 with respect to the twenty-six weeks ended August 3, 2014. As adjusted net income reflects (i) the net decrease in interest expense resulting from the early extinguishment of $ principal amount of our indebtedness as described in “Use of Proceeds,” (ii) premiums, interest and expenses related to the Refinancing of $ and (iii) the tax effects of these changes on income before taxes. The as adjusted consolidated statements of operations data is not necessarily indicative of what our results of operations would have been if the transaction had been completed as of the date indicated, nor is such data necessarily indicative of our results of operations for any future period. |
| (5) | Defined as total current assets minus total current liabilities. |
| (6) | Our location in Nashville, Tennessee, which temporarily closed from May 2, 2010 to November 28, 2011 due to flooding is included in our store count for all periods presented. Included in our January 30, 2011 and January 31, 2010 store counts is a store in Dallas, Texas, which permanently closed on May 2, 2011. Our Kensington/Bethesda, Maryland location (which permanently closed on August 12, 2014) is included in store counts for all periods presented. Also included in the store counts as of January 29, 2012, January 30, 2011 and January 31, 2010 is a second store in Dallas, Texas, which permanently closed on December 17, 2012. |
| (7) | “Comparable stores” are stores open at least 18 months as of the beginning of each of the relevant fiscal years, excluding our one franchised store located in Canada, which ceased operation as a Dave & Buster’s on May 31, 2013. Fiscal 2014 comparable stores exclude the Kensington/Bethesda, Maryland location, which permanently closed on August 12, 2014. |
| (8) | “Comparable store sales increase (decrease)” reflects the year-over-year changes, on a calendar week basis, for the stores defined as comparable in (7) above. |
| (9) | “Store-level EBITDA” is defined by us as net income (loss), plus interest expense (net), loss on debt retirement, provision (benefit) for income taxes, depreciation and amortization expense, general and administrative expenses and pre-opening costs, as shown in the table below. We use Store-level EBITDA to measure operating performance and returns from opening new stores. Similar to Adjusted EBITDA, Store-level EBITDA is not defined under GAAP and does not purport to be an alternative to net income as a measure of operating performance. |
| We believe that Store-level EBITDA is another useful measure in evaluating our operating performance because it removes the impact of general and administrative expenses, which are not incurred at the store level, and the costs of opening new stores, which are non-recurring at the store-level, and thereby enables the comparability of the operating performance of our stores for the periods presented. We also believe that Store-level EBITDA is a useful measure in evaluating our operating performance within the entertainment and dining industry because it permits the evaluation of store-level productivity, efficiency and performance, and we use Store-level EBITDA as a means of evaluating store financial performance compared with our competitors. However, because this measure excludes significant items such as general and administrative expenses and preopening costs, as well as our interest expense and depreciation and amortization expense, which are important in evaluating our consolidated financial performance from period to period, the value of this measure is limited as a measure of our consolidated financial performance. Our calculation of Store-level EBITDA for the periods is presented below: |
| TWENTY-SIX WEEKS ENDED |
FISCAL YEAR ENDED | |||||||||||||||||||||||||||
| AUGUST 3, 2014 |
AUGUST 4, 2013 |
FEBRUARY 2, 2014 |
FEBRUARY 3, 2013 |
JANUARY 29, 2012 |
JANUARY 30, 2011 |
JANUARY 31, 2010 |
||||||||||||||||||||||
| (Combined) | ||||||||||||||||||||||||||||
| Net income (loss) |
$ | (2,417 | ) | $ | 7,452 | $ | 2,169 | $ | 8,782 | $ | (6,985 | ) | $ | (7,295 | ) | $ | (350 | ) | ||||||||||
| Interest expense, net |
23,696 | 23,861 | 47,809 | 47,634 | 44,931 | 32,462 | 22,122 | |||||||||||||||||||||
| Loss on debt retirement |
25,986 | — | — | — | — | — | — | |||||||||||||||||||||
| Provision (benefit) for income taxes |
(2,287 | ) | 2,308 | 1,061 | (12,702 | ) | (3,796 | ) | (3,148 | ) | 99 | |||||||||||||||||
| Depreciation and amortization expense |
34,673 | 33,650 | 66,337 | 63,457 | 54,277 | 50,018 | 53,658 | |||||||||||||||||||||
| General and administrative expenses |
20,069 | 17,922 | 36,440 | 40,356 | 34,896 | 42,734 | 30,437 | |||||||||||||||||||||
| Pre-opening costs |
4,292 | 2,842 | 7,040 | 3,060 | 4,186 | 2,289 | 3,881 | |||||||||||||||||||||
|
|
|
|
|
|
|
|
|
|
|
|
|
|
|
|||||||||||||||
| Store-level EBITDA |
$ | 104,012 | $ | 88,035 | $ | 160,856 | $ | 150,587 | $ | 127,509 | $ | 117,060 | $ | 109,847 | ||||||||||||||
|
|
|
|
|
|
|
|
|
|
|
|
|
|
|
|||||||||||||||
| (10) | “Store-level EBITDA margin” represents Store-level EBITDA divided by total revenues. Store-level EBITDA margin allows us to evaluate operating performance of each store across stores of varying size and volume. |
| (11) | “Adjusted EBITDA” is calculated as net income (loss), plus interest expense (net), loss on debt retirement, provision (benefit) for income taxes, depreciation and amortization expense, loss (gain) on asset disposal, gain on acquisition of limited partnership, share-based compensation, currency transaction (gain) loss, pre-opening costs, reimbursement of affiliate and other expenses, change in deferred amusement revenue and ticket liability estimations, transaction and other costs. |
| Adjusted EBITDA is presented because we believe that it provides useful information to investors regarding our operating performance and our capacity to incur and service debt and fund capital expenditures. We believe that Adjusted EBITDA is used by many investors, analysts and rating agencies as a measure of performance. In addition, Adjusted EBITDA is approximately equal to “Consolidated EBITDA” as defined in our senior secured credit facility and the indentures governing the senior discount notes and the senior notes, and our presentation of Adjusted EBITDA is consistent with that reported to our lenders and holders of notes to |
44
Table of Contents
| allow for leverage-based assessments. By reporting Adjusted EBITDA, we provide a basis for comparison of our business operations between current, past and future periods by excluding items that we do not believe are indicative of our core operating performance. Adjusted EBITDA is a metric utilized to measure performance-based bonuses paid to our executive officers and certain managers. |
| Adjusted EBITDA, however, is not defined by GAAP and should not be considered in isolation or as an alternative to other financial data prepared in accordance with GAAP or as an indicator of the Company’s operating performance. Adjusted EBITDA does not represent and should not be considered as an alternative to net income or cash flow from operations, as determined in accordance with GAAP, and our calculations thereof may not be comparable to similarly entitled measures reported by other companies. Although we use Adjusted EBITDA as a measure to assess the operating performance of our business, Adjusted EBITDA has significant limitations as an analytical tool because it excludes certain material costs. For example, Adjusted EBITDA and Adjusted EBITDA margin do not take into account a number of significant items, including our interest expense and depreciation and amortization expense. Because Adjusted EBITDA does not account for these expenses, its utility as a measure of our operating performance has material limitations. In addition, Adjusted EBITDA excludes pre-opening costs and adjustments for changes in the accruals for deferred amusement revenue and ticket liability, which we expect customers to redeem in future periods and which may be important in analyzing our GAAP results. Our calculations of Adjusted EBITDA adjust for these amounts because they vary from period to period and do not directly relate to the ongoing operations of the current underlying business of our stores and therefore complicate comparisons of the underlying business between periods. Nevertheless, because of the limitations described above management does not view Adjusted EBITDA in isolation and also uses other measures, such as net sales, gross margin, operating income and net income (loss), to measure operating performance. |
| Our calculation of Adjusted EBITDA for the periods presented is set forth below: |
| TWENTY-SIX WEEKS ENDED |
FISCAL YEAR ENDED | |||||||||||||||||||||||||||
| AUGUST 3, 2014 |
AUGUST 4, 2013 |
FEBRUARY 2, 2014 |
FEBRUARY 3, 2013 |
JANUARY 29, 2012 |
JANUARY 30, 2011 |
JANUARY 31, 2010 |
||||||||||||||||||||||
| (Combined) | ||||||||||||||||||||||||||||
| Net income (loss) |
$ | (2,417 | ) | $ | 7,452 | $ | 2,169 | $ | 8,782 | $ | (6,985 | ) | $ | (7,295 | ) | $ | (350 | ) | ||||||||||
| Interest expense, net |
23,696 | 23,861 | 47,809 | 47,634 | 44,931 | 32,462 | 22,122 | |||||||||||||||||||||
| Loss on debt retirement |
25,986 | — | — | — | — | — | — | |||||||||||||||||||||
| Provision (benefit) for income taxes |
(2,287 | ) | 2,308 | 1,061 | (12,702 | ) | (3,796 | ) | (3,148 | ) | 99 | |||||||||||||||||
| Depreciation and amortization expense |
34,673 | 33,650 | 66,337 | 63,457 | 54,277 | 50,018 | 53,658 | |||||||||||||||||||||
| Loss (gain) on asset disposal (a) |
622 | 938 | 2,631 | 2,640 | 1,279 | (2,397 | ) | 1,361 | ||||||||||||||||||||
| Gain on acquisition of limited partnership (b) |
— | — | — | — | — | — | (357 | ) | ||||||||||||||||||||
| Share-based compensation (c) |
503 | 622 | 1,207 | 1,099 | 1,038 | 2,491 | 722 | |||||||||||||||||||||
| Currency transaction loss (gain) (d) |
(20) | 150 | 622 | (13 | ) | 103 | (143 | ) | (123 | ) | ||||||||||||||||||
| Pre-opening costs (e) |
4,292 | 2,842 | 7,040 | 3,060 | 4,186 | 2,289 | 3,881 | |||||||||||||||||||||
| Reimbursement of affiliate and other expenses (f) |
303 | 374 | 722 | 799 | 854 | 626 | 905 | |||||||||||||||||||||
| Change in deferred amusement revenue and ticket liability (9) |
2,547 | 2,490 | 4,936 | 2,470 | 1,539 | 1,276 | 932 | |||||||||||||||||||||
| Transaction and other costs (h) |
1,161 | 151 | 256 | 3,252 | 946 | 10,101 | 295 | |||||||||||||||||||||
|
|
|
|
|
|
|
|
|
|
|
|
|
|
|
|||||||||||||||
| Adjusted EBITDA |
$ | 89,059 | $ | 74,838 | $ | 134,790 | $ | 120,478 | $ | 98,372 | $ | 86,280 | $ | 83,145 | ||||||||||||||
|
|
|
|
|
|
|
|
|
|
|
|
|
|
|
|||||||||||||||
| (a) | Represents the net book value of assets (less proceeds received) disposed of during the year. Primarily relates to assets replaced in ongoing operation of business. |
| (b) | Represents gain recognized in connection with our acquisition of a 49.9% limited partnership interest in a limited partnership that owns a Dave & Buster’s store in the Discover Mills Mall near Atlanta, Georgia. |
| (c) | Represents stock compensation expense under our 2010 Stock Incentive Plan. |
| (d) | Represents the effect of foreign currency transaction (gains) or losses related to our store in Canada. |
45
Table of Contents
| (e) | Represents costs incurred prior to the opening of our new stores. |
| (f) | Represents fees and expenses paid directly to our Board of Directors and certain non-recurring payments to management and compensation consultants. It also includes the reimbursement of expenses made to Oak Hill Capital Management, LLC in the amount of $35, $95, $115, $76, $297 and $0 in the twenty-six weeks ended August 3, 2014 and August 4, 2013 and fiscal years 2013, 2012, 2011 and 2010, respectively. See “Certain Relationships and Related Transactions—Expense Reimbursement Agreement.” |
| (g) | Represents quarterly increases or decreases to accrued liabilities established for future amusement game play and the fulfillment of tickets won by customers on our redemption games. |
| (h) | Primarily represents costs related to capital markets transactions, severance costs associated with the departure of key executives/organizational restructuring initiatives and store closure costs. |
| (12) | “Adjusted EBITDA margin” represents Adjusted EBITDA divided by total revenues. Adjusted EBITDA margin allows us to evaluate our overall operating performance over time by excluding items that we do not believe are indicative of our core operating performance. |
| (13) | “Capital additions” is defined as total accrual based additions to property and equipment. Capital additions do not include any reductions for tenant improvement allowances received or receivable from landlords. Tenant improvement allowances toward new store construction totaled $7,454, $2,600, $15,786, $10,882, $6,911, $3,165 and $8,342 in the twenty-six weeks ended August 3, 2014 and August 4, 2013 and fiscal years 2013, 2012, 2011, 2010 and 2009, respectively. |
46
Table of Contents
MANAGEMENT’S DISCUSSION AND ANALYSIS OF FINANCIAL CONDITION AND
RESULTS OF OPERATIONS
The following discussion and analysis of our financial condition and results of operations should be read together with our audited consolidated financial statements and related notes included herein. Unless otherwise specified, the meanings of all defined terms in Management’s Discussion and Analysis of Financial Condition and Results of Operations (“MD&A”) are consistent with the meanings of such terms as defined in the Notes to Consolidated Financial Statements. This discussion includes forward-looking statements and assumptions. Please see “Cautionary Statement Regarding Forward-Looking Statements” for a discussion of the risks, uncertainties and assumptions relating to our forward-looking statements. We define high-volume dining and entertainment venues as those open for at least one full year and with average store revenues in excess of $5,000 and define year one cash-on-cash return as year one Store-level EBITDA exclusive of national marketing costs divided by net development costs. All dollar amounts in the MD&A are presented in thousands.
General
We are a leading owner and operator of high-volume venues in North America that combine dining and entertainment for both adults and families. Founded in 1982, the core of our concept is to offer our customers the opportunity to “Eat Drink Play and Watch” all in one location. Eat and Drink are offered through a full menu of “Fun American New Gourmet” entrées and appetizers and a full selection of non-alcoholic and alcoholic beverages. Our Play and Watch offerings provide an extensive assortment of entertainment attractions centered around playing games and watching live sports and other televised events. Our customers are a balanced mix of men and women, primarily between the ages of 21 and 39, and we believe we also serve as an attractive venue for families with children and teenagers. We believe we appeal to a diverse customer base by providing a highly customizable experience in a dynamic and fun setting.
Our Growth Strategies and Outlook
Our growth is based primarily on the following strategies:
| n | Pursue New Store Growth; |
| n | Grow Our Comparable Store Sales; and |
| n | Expand the Dave & Buster’s Brand Internationally. |
For further information about our growth strategies and outlook, see “Business—Our Growth Strategies.”
Key Events
On June 1, 2010, Dave & Buster’s Entertainment, Inc. (“D&B Entertainment”), a newly-formed Delaware corporation owned by Oak Hill Capital Partners III, L.P. and Oak Hill Capital Management Partners III, L.P. (collectively, the “Oak Hill Funds” and together with their manager, Oak Hill Capital Management, LLC, and its related funds, “Oak Hill Capital Partners”), acquired all of the outstanding common stock (the “Acquisition”) of D&B Holdings from Wellspring Capital Partners III, L.P. and HBK Main Street Investors L.P. In connection therewith, Games Merger Corp. a newly-formed Missouri corporation and an indirect wholly owned subsidiary of D&B Entertainment, merged (the “Merger”) with and into D&B Holdings’ wholly owned, direct subsidiary, Dave & Buster’s, Inc. (with Dave & Buster’s, Inc. being the surviving corporation in the Merger). As a result of the Acquisition and certain post-acquisition activity, the Oak Hill Funds directly control approximately 95.4% of D&B Entertainment’s outstanding common stock and have the right to appoint certain members of our Board of Directors, and certain members of our Board of Directors and management control approximately 4.5% of our outstanding common stock. The remaining 0.1% is owned by a former member of management. Upon the completion of this offering, the Oak Hill Funds will beneficially own approximately % of our outstanding stock, or % if the underwriters exercise their option to purchase additional shares in full, and certain members of our Board of Directors and our management will beneficially own approximately % of our outstanding stock, or % if the underwriters exercise their option to purchase additional shares in full. The Oak Hill Funds will continue to own a majority of the voting power of our outstanding common stock. As a result, we will be a “controlled company” within the meaning of the corporate governance standards of NASDAQ. See “Principal Stockholders.”
47
Table of Contents
D&B Entertainment has no material assets or operations other than 100% ownership of the outstanding common stock of D&B Holdings. D&B Holdings has no material assets or operations other than 100% ownership of the outstanding common stock of Dave & Buster’s, Inc. As such, the following discussion, unless specifically identified otherwise, addresses the operations of Dave & Buster’s, Inc.
Key Measures of Our Performance
We monitor and analyze a number of key performance measures to manage our business and evaluate financial and operating performance. These measures include:
Comparable Store Sales. Comparable store sales are a year-over-year comparison of sales at stores open at the end of a period which have been opened for at least 18 months as of the beginning of each of the fiscal years. It is a key performance indicator used within the industry and is indicative of acceptance of our initiatives as well as local economic and consumer trends. The total number of stores included in our comparable store set was 57, 55, 55, 54 and 52 stores as of the end of our twenty-six weeks ended August 3, 2014 and August 4, 2013 and 2013, 2012 and 2011 fiscal years, respectively. Comparable store counts as of August 3, 2014 exclude our Kensington/Bethesda, Maryland location, which permanently closed on August 12, 2014.
New Store Openings. Our ability to expand our business and reach new customers is influenced by the opening of additional stores in both new and existing markets. The success of our new stores is indicative of our brand appeal and the efficacy of our site selection and operating models.
Our new locations typically open with sales volumes in excess of their run-rate levels, which we refer to as a “honeymoon” effect. We expect our new store volumes in year two to be 15% to 20% lower and our Store-level Adjusted EBITDA margins to be two to five percentage points lower in the second full year of operations than our year one targets, and to grow in line with the rest of our comparable store base thereafter. As a result of the substantial revenues associated with each new store and the seasonality of our business, the number and timing of new store openings will result in significant fluctuations in quarterly results.
Store-level EBITDA Margin. We define “Store-level EBITDA” as net income (loss), plus interest expense (net), loss on debt retirement, provision (benefit) for income taxes, depreciation and amortization expense, general and administrative expenses and pre-opening costs. “Store-level EBITDA margin” is defined as Store-level EBITDA divided by total revenues.
Store-level EBITDA margin allows us to evaluate operating performance and returns of each store across stores of varying size and volume. We believe that Store-level EBITDA Margin is a useful measure in evaluating our operating performance because it removes the impact of general and administrative expenses, which are not incurred at the store level, and the costs of opening new stores, which are non-recurring at the store-level, and thereby enables the comparability of the operating performance of our stores during the period. We also believe that Store-level EBITDA Margin is a useful measure in evaluating our operating performance within the entertainment and dining industry because it permits the evaluation of store-level productivity, efficiency and performance, and we use Store-level EBITDA Margin as a means of evaluating store financial performance compared with our competitors.
Adjusted EBITDA. We define Adjusted EBITDA as net income (loss), plus interest expense (net), loss on debt retirement, provision (benefit) for income taxes, depreciation and amortization expense, loss on asset disposal, gain on acquisition of limited partnership, share-based compensation, currency transaction (gain) loss, pre-opening costs, reimbursement of affiliate and other expenses, change in deferred amusement revenue and ticket liability estimations, transaction and other costs.
We believe that Adjusted EBITDA is helpful in evaluating our operating performance and our capacity to incur and service debt and fund capital expenditures. Adjusted EBITDA, provides a basis for comparison of our business operations between current, past and future periods by excluding items that we do not believe are indicative of our core operating performance. Adjusted EBITDA is also a metric utilized to measure performance based bonuses paid to our executive officers and certain managers. In addition, Adjusted EBITDA is approximately equal to “EBITDA” as defined in our senior secured credit facility.
Adjusted EBITDA Margin. “Adjusted EBITDA Margin” is defined as Adjusted EBITDA divided by total revenues. Adjusted EBITDA Margin allows us to evaluate our overall operating performance over time by excluding items that we do not believe are indicative of our core operating performance.
48
Table of Contents
Seasonality
We also expect seasonality to be a factor in the operation or results of the business in the future with higher first and fourth quarter revenues associated with the spring and year-end holidays. These quarters will continue to be susceptible to the impact of severe weather on customer traffic and sales during that period. Our third quarter, which encompasses the back-to-school fall season, has historically had lower revenues as compared to the other quarters.
Presentation of Operating Results
We operate on a 52 or 53 week fiscal year that ends on the Sunday after the Saturday closest to January 31. Each quarter consists of 13 weeks, except for a 53 week year when the fourth quarter consists of 14 weeks. Our 2012 fiscal year consisted of 53 weeks and all other years presented consist of 52 weeks. All references to “2014,” “fiscal 2014,” “fiscal year 2014” or similar references relate to the 52 week period ending February 1, 2015. All references to “2013,” “fiscal 2013,” “fiscal year 2013” or similar references relate to the 52 week period ended February 2, 2014. All references to “2012,” “fiscal 2012,” “fiscal year 2012” or similar references relate to the 53 week period ended February 3, 2013. All references to “2011,” “fiscal 2011,” “fiscal year 2011” or similar references relate to the 52 week period ended January 29, 2012.
As a result of the 53 week fiscal year in 2012, our 2013 fiscal year began one week later than our 2012 fiscal year. In order to provide useful information to investors to better analyze our business, we have provided comparable store sales presented on a calendar week basis. Comparable store sales for year-to-date on a calendar week basis compares the results for the period from February 4, 2013 through February 2, 2014 (weeks 1 through 52 of our 2013 fiscal year) to the results for the period from February 6, 2012 through February 3, 2013 (weeks 2 through 53 of our 2012 fiscal year). The fiscal year 2012 comparable store sales have been adjusted to remove the impact of the 53rd week prior to calculating the year-over-year comparable sales change percentage. We believe comparable store sales calculated on a calendar week basis is more indicative of the health of our business. However, we also recognize that comparable store sales growth calculated on a fiscal week basis is a useful measure when analyzing year-over-year changes in our financial statements.
Key Line Item Descriptions
Revenues. Total revenues consist of food and beverage revenues as well as amusement and other revenues. Beverage revenues refer to alcoholic beverages. For the twenty-six weeks ended August 3, 2014, we derived 32.5% of our total revenue from food sales, 14.8% from beverage sales, 51.9% from amusement sales and 0.8% from other sources. For the year ended February 2, 2014, we derived 33.6% of our total revenue from food sales, 15.2% from beverage sales, 50.4% from amusement sales and 0.8% from other sources. For the year ended February 3, 2013, we derived 33.9% of our total revenue from food sales, 15.2% from beverage sales, 50.1% from amusement sales and 0.8% from other sources. Our revenues are primarily influenced by the number of stores in operation and comparable store revenue. Comparable store revenue growth reflects the change in year-over-year revenue for the comparable store base and is an important measure of store performance. Comparable store sales growth can be generated by an increase in customer traffic counts or by increases in average dollars spent per customer.
Cost of Products. Cost of products includes the cost of food, beverages and the “Winner’s Circle” redemption items. For the twenty-six weeks ended August 3, 2014, the cost of food products averaged 26.5% of food revenue and the cost of beverage products averaged 23.9% of beverage revenue. The amusement and other cost of products averaged 13.7% of amusement and other revenues for the twenty-six weeks ended August 3, 2014. For the fiscal year ended February 2, 2014, the cost of food products averaged 25.6% of food revenue and the cost of beverage products averaged 23.7% of beverage revenue. The amusement and other cost of products averaged 14.6% of amusement and other revenues for fiscal year 2013. For the fiscal year ended February 3, 2013, the cost of food products averaged 24.9% of food revenue and the cost of beverage products averaged 23.4% of beverage revenue. The amusement and other cost of products averaged 14.9% of amusement and other revenues for fiscal year 2012. The cost of products is driven by product mix and pricing movements from third-party suppliers. We continually strive to gain efficiencies in both the acquisition and use of products while maintaining high standards of product quality.
Operating Payroll and Benefits. Operating payroll and benefits consist of wages, employer taxes and benefits for store personnel. We continually review the opportunity for efficiencies, principally through scheduling refinements.
49
Table of Contents
Other Store Operating Expenses. Other store operating expenses consist primarily of store-related occupancy, supply and outside service expenses, utilities, repair and maintenance and marketing and promotional costs.
General and Administrative Expenses. General and administrative expenses consist primarily of personnel, facilities and professional expenses for the various departments of our corporate headquarters. Following this offering, we expect to incur a number of other one-time charges in connection with the transactions contemplated by this prospectus that will adversely affect our results of operations. Additionally, we may incur a charge related to the compensation expense associated with the vesting of the options held by certain members of our management and directors. This vesting may occur in connection with the consummation of this offering or with a modification of the terms of the existing stock-based compensation arrangements.
Depreciation and Amortization Expense. Depreciation and amortization expense includes the depreciation of fixed assets and the amortization of trademarks with finite lives.
Pre-opening Costs. Pre-opening costs include costs associated with the opening and organizing of new stores, including pre-opening rent, staff training and recruiting, and travel costs for employees engaged in such pre-opening activities.
Interest Expense. Interest expense includes the cost of our debt obligations including the amortization of loan fees and original issue discounts, net of any interest income earned.
Results of Operations
Twenty-Six Weeks Ended August 3, 2014 Compared to Twenty-Six Weeks Ended August 4, 2013
The following tables set forth selected data, in thousands of dollars and as a percentage of total revenues (unless otherwise noted) for the periods indicated. All information is derived from the accompanying consolidated statements of operations. The following table presents the results of operations for the twenty-six weeks ended August 3, 2014 and August 4, 2013.
| TWENTY-SIX WEEKS ENDED | ||||||||||||||||
| AUGUST 3, 2014 | AUGUST 4, 2013 | |||||||||||||||
| Food and beverage revenues |
$ | 177,898 | 47.3 | % | $ | 153,272 | 47.6 | % | ||||||||
| Amusement and other revenues |
198,310 | 52.7 | 168,606 | 52.4 | ||||||||||||
|
|
|
|
|
|
|
|
|
|||||||||
| Total revenues |
376,208 | 100.0 | 321,878 | 100.0 | ||||||||||||
|
|
|
|
|
|
|
|
|
|||||||||
| Cost of food and beverage (as a percentage of food and beverage revenues) |
45,690 | 25.7 | 38,273 | 25.0 | ||||||||||||
| Cost of amusement and other (as a percentage of amusement and other revenues) |
27,244 | 13.7 | 24,263 | 14.4 | ||||||||||||
|
|
|
|
|
|
|
|
|
|||||||||
| Total cost of products |
72,934 | 19.4 | 62,536 | 19.4 | ||||||||||||
| Operating payroll and benefits |
85,120 | 22.6 | 72,546 | 22.5 | ||||||||||||
| Other store operating expenses |
114,142 | 30.4 | 98,761 | 30.7 | ||||||||||||
| General and administrative expenses |
20,069 | 5.3 | 17,922 | 5.6 | ||||||||||||
| Depreciation and amortization expense |
34,673 | 9.2 | 33,650 | 10.5 | ||||||||||||
| Pre-opening costs |
4,292 | 1.1 | 2,842 | 0.9 | ||||||||||||
|
|
|
|
|
|
|
|
|
|||||||||
| Total operating costs |
331,230 | 88.0 | 288,257 | 89.6 | ||||||||||||
|
|
|
|
|
|
|
|
|
|||||||||
| Operating income |
44,978 | 12.0 | 33,621 | 10.4 | ||||||||||||
| Interest expense, net |
23,696 | 6.4 | 23,861 | 7.4 | ||||||||||||
| Loss on debt retirement |
25,986 | 6.9 | — | — | ||||||||||||
|
|
|
|
|
|
|
|
|
|||||||||
| Income (loss) before provision (benefit) for income taxes |
(4,704 | ) | (1.3 | ) | 9,760 | 3.0 | ||||||||||
| Provision (benefit) for income taxes |
(2,287 | ) | (0.7 | ) | 2,308 | 0.7 | ||||||||||
|
|
|
|
|
|
|
|
|
|||||||||
| Net income (loss) |
$ | (2,417 | ) | (0.6 | )% | $ | 7,452 | 2.3 | % | |||||||
|
|
|
|
|
|
|
|
|
|||||||||
| Change in comparable store sales(1) |
5.2 | % | 0.5 | % | ||||||||||||
| Stores open at end of period(2) |
69 | 62 | ||||||||||||||
| Comparable stores open at end of period(1) |
57 | 55 | ||||||||||||||
| (1) | “Comparable store sales” (year-over-year comparison of stores operating at the end of the fiscal period and open at least 18 months as of the beginning of each of the fiscal years) is a key performance indicator used within the industry and is indicative of acceptance |
50
Table of Contents
| of our initiatives as well as local economic and consumer trends. Fiscal year 2014 comparable stores exclude the Kensington/Bethesda, Maryland location, which permanently closed on August 12, 2014. |
| (2) | Our Kensington/Bethesda, Maryland location (which permanently closed on August 12, 2014) is included in store counts for all periods presented. |
Store openings during the twenty-six week periods ended August 3, 2014 and August 4, 2013 were as follows:
| TWENTY-SIX WEEKS ENDED AUGUST 3, 2014 |
TWENTY-SIX WEEKS ENDED AUGUST 4, 2013 |
|||||||||
| LOCATION |
OPENING DATE | LOCATION |
OPENING DATE | |||||||
| Westchester, CA (Los Angeles) |
February 19, 2014 | Virginia Beach, VA | July 20, 2013 | |||||||
| Vernon Hills, IL (Chicago) |
March 26, 2014 | |||||||||
| Panama City Beach, FL |
May 26, 2014 | |||||||||
Revenues
Total revenues increased $54,330, or 16.9%, in the twenty-six weeks ended August 3, 2014 compared to the twenty-six weeks ended August 4, 2013.
The increased revenues were derived from the following sources:
| TWENTY-SIX WEEKS ENDED |
||||
| AUGUST 3, 2014 | ||||
| Non-comparable stores-operating |
$ | 39,540 | ||
| Comparable stores |
15,708 | |||
| Other |
(918 | ) | ||
|
|
|
|||
| Total |
$ | 54,330 | ||
|
|
|
|||
Comparable store revenue increased $15,708, or 5.2% in the twenty-six weeks ended August 3, 2014 compared to the twenty-six weeks ended August 4, 2013. Comparable store walk-in revenues, which accounted for 89.4% of consolidated comparable store revenue in the twenty-six weeks ended August 3, 2014, increased $14,134, or 5.3% compared to the twenty-six weeks ended August 4, 2013. The increase in comparable walk-in sales is attributable to strong marketing initiatives including continued advertising during sporting events and the addition of a new cable television network to our national media campaign. Comparable store special events revenues, which accounted for 10.6% of consolidated comparable store revenue in the twenty-six weeks ended August 3, 2014, increased $1,574 or 4.9% compared to the twenty-six weeks ended August 4, 2013.
Food sales at comparable stores increased by $2,678, or 2.7%, to $102,718 in the twenty-six weeks ended August 3, 2014 from $100,040 in the same period of 2013. Beverage sales at comparable stores increased by $3,624, or 8.3%, to $47,057 in the twenty-six weeks ended August 3, 2014 from $43,433 in the twenty-six weeks ended August 4, 2013. Comparable store amusement and other revenues in the twenty-six weeks ended August 3, 2014 increased by $9,406, or 6.0%, to $166,960 from $157,554 in the twenty-six weeks ended August 4, 2013. The growth over 2013 in amusement sales was driven by increased national advertising highlighting our amusement products, our “Half-Price Game Play” on Wednesdays offer and Power Card up-sell initiatives.
The non-comparable store revenue increased $39,540, or 183.0%, in the twenty-six weeks ended August 3, 2014 compared to the twenty-six weeks ended August 4, 2013. The increase in non-comparable store revenue was primarily driven by 179 additional store weeks contributed by our 2013 and 2014 store openings compared to the similar period in fiscal 2013. This increase was partially offset by revenue decreases in our stores opened in fiscal 2012, due to those stores coming out of the “honeymoon” period, and decreased revenue at our Kensington/Bethesda, Maryland store which permanently closed on August 12, 2014.
Our revenue mix was 32.5% for food, 14.8% for beverage, and 52.7% for amusements and other for the twenty-six weeks ended August 3, 2014. This compares to 33.3%, 14.3%, and 52.4%, respectively, for the twenty-six weeks ended August 4, 2013.
51
Table of Contents
Cost of Products
Cost of food and beverage products increased to $45,690 in the twenty-six weeks ended August 3, 2014 compared to $38,273 in the twenty-six weeks ended August 4, 2013 due primarily to the increased sales volume. Cost of food and beverage products, as a percentage of food and beverage revenues, increased 70 basis points to 25.7% for the twenty-six weeks ended August 3, 2014 from 25.0% for the twenty-six weeks ended August 4, 2013. Increased cost in our meat and seafood categories and an unfavorable shift in sales mix to beverage items which have higher cost of products were partially offset by reduced poultry costs.
Cost of amusement and other increased to $27,244 in the twenty-six weeks ended August 3, 2014 compared to $24,263 in the twenty-six weeks ended August 4, 2013. The costs of amusement and other, as a percentage of amusement and other revenues decreased 70 basis points to 13.7% for the twenty-six weeks ended August 3, 2014 from 14.4% for the twenty-six weeks ended August 4, 2013. This decrease was driven by a reduction in the redemption cost per ticket redeemed as a result of Winner’s Circle price increases and efficiencies in procurement of items available for redemption in our Winner’s Circle.
Operating Payroll and Benefits
Operating payroll and benefits increased by $12,574, or 17.3%, to $85,120 in the twenty-six weeks ended August 3, 2014 compared to $72,546 in the twenty-six weeks ended August 4, 2013, primarily due to new store openings during the second half of fiscal 2013 and fiscal 2014. The total cost of operating payroll and benefits, as a percent of total revenues, increased 10 basis points to 22.6% for the twenty-six weeks ended August 3, 2014 compared to 22.5% for the twenty-six weeks ended August 4, 2013. The increase in operating payroll and benefits, as a percentage of revenues was driven primarily by increased incentive compensation and higher initial operating labor in our new stores partially offset by improved labor efficiencies in our comparable store base.
Other Store Operating Expenses
Other store operating expenses increased by $15,381, or 15.6%, to $114,142 in the twenty-six weeks ended August 3, 2014 compared to $98,761 in the twenty-six weeks ended August 4, 2013, primarily due to new store openings and higher cost of marketing due to increases in the underlying price of the media, strategic shifts in media purchasing and increased subscription costs associated with sports related viewing events. Other store operating expenses as a percentage of total revenues decreased 30 basis points to 30.4% in the twenty-six weeks ended August 3, 2014 compared to 30.7% for the same period of 2013 due primarily to favorable operating leverage of operating costs on increased revenue.
General and Administrative Expenses
General and administrative expenses increased by $2,147, or 12.0%, to $20,069 in the twenty-six weeks ended August 3, 2014 compared to $17,922 in the twenty-six weeks ended August 4, 2013. The increase in general and administrative expenses was primarily driven by increased legal fees related to litigation regarding our Kensington/Bethesda location which permanently closed on August 12, 2014, incentive compensation and other benefits, higher claims experience on our self-funded medical plan and increased travel expenses associated with our annual store management meeting. General and administrative expenses, as a percentage of total revenues, decreased 30 basis points to 5.3% in the twenty-six weeks ended August 3, 2014 from 5.6% in the twenty-six weeks ended August 4, 2013, primarily due to the leveraging impact of higher store sales.
Depreciation and Amortization Expense
Depreciation and amortization expense increased by $1,023, or 3.0%, to $34,673 in the twenty-six weeks ended August 3, 2014 compared to $33,650 in the comparable period of 2013. Increased depreciation on our 2013 and 2014 capital expenditures was partially offset by the absence of accelerated depreciation charges associated with our Kensington/Bethesda, Maryland store and other assets reaching the end of their depreciable lives.
Pre-opening Costs
Pre-opening costs increased by $1,450 to $4,292 in the twenty-six weeks ended August 3, 2014 compared to $2,842 in the twenty-six weeks ended August 4, 2013 due to the timing of new store openings.
52
Table of Contents
Interest Expense
Interest expense decreased by $165 to $23,696 in the twenty-six weeks ended August 3, 2014 compared to $23,861 in the twenty-six weeks ended August 4, 2013. This decrease was due to the refinancing described in “—Liquidity and Capital Resources” and a lower interest rate, prior to the Refinancing, in the first twenty-six weeks of 2014 due to an amendment to the prior senior credit facility, executed in May 2013. These decreases were partially offset by increased interest accretion on the senior discount notes, recognized prior to the Refinancing.
Loss on Debt Retirement
In connection with the July 25, 2014 debt refinancing (see “—Liquidity and Capital Resources” for further discussion), we recorded a pre-tax charge of $25,986. This charge includes non-cash charges of $6,994 resulting from the write-off of certain unamortized debt issuance costs and the unamortized discount associated with the prior credit facility, $12,833 related to the early redemption of the senior notes, $6,124 related to the early redemption of the senior discount notes and $35 of legal expenses related to the prior credit facility.
Income Tax Provision (Benefit)
The income tax benefit for the twenty-six weeks ended August 3, 2014 was $2,287 compared to an income tax provision of $2,308 for the twenty-six weeks ended August 4, 2013. Our effective tax rate differs from the statutory rate due to the FICA tip credits, state income taxes and the impact of certain expenses, which are not deductible for income tax purposes.
In assessing the realizability of deferred tax assets, at August 3, 2014 we considered whether it is more likely than not that some or all of the deferred tax assets will not be realized. Accordingly, we have established a valuation allowance of $1,392 for deferred tax assets associated with state taxes and uncertain tax positions. The ultimate realization of our deferred tax assets is dependent on the generation of future taxable income during periods in which temporary differences and carryforwards become deductible.
We follow established accounting guidance for uncertainty in income taxes. This guidance limits the recognition of income tax benefits to those items that meet the “more likely than not” threshold on the effective date. As of August 3, 2014, we have accrued approximately $451 of unrecognized tax benefits and approximately $308 of penalties and interest. During the twenty-six weeks ended August 3, 2014, we decreased our unrecognized provision by $25 and increased our accrual for interest and penalties by $17. Because of the impact of deferred tax accounting, $324 of unrecognized tax benefits, if recognized, would affect the effective tax rate.
We file income tax returns, which are periodically audited by various federal, state and foreign jurisdictions. We are generally no longer subject to federal, state, or foreign income tax examinations for years prior to fiscal 2009.
In fiscal 2014, we expect to utilize approximately $6,730 of available stand-alone federal tax credit carryforwards to offset our estimated consolidated cash tax liability for the 2014 fiscal year. We anticipate having approximately $3,518 of federal tax credit carryforwards at February 1, 2015, including $2,848 of general business credits and $670 of Alternative Minimum Tax (“AMT”) credit carryforwards. There is a 20-year carryforward on general business credits and AMT credits can be carried forward indefinitely. We expect to fully utilize all federal tax credit carryforwards in fiscal 2015.
53
Table of Contents
Fiscal 2013 Compared to Fiscal 2012
The following table sets forth selected data in thousands of dollars and as a percentage of total revenues (unless otherwise noted) for the periods indicated. All information is derived from the consolidated statements of operations included in our consolidated financial statements. The following table presents the results of operations for fiscal year 2013 and fiscal year 2012:
| FISCAL YEAR ENDED | ||||||||||||||||
| FEBRUARY 2, 2014 | FEBRUARY 3, 2013 | |||||||||||||||
| Food and beverage revenues |
$ | 310,111 | 48.8 | % | $ | 298,421 | 49.1 | % | ||||||||
| Amusement and other revenues |
325,468 | 51.2 | 309,646 | 50.9 | ||||||||||||
|
|
|
|
|
|
|
|
|
|||||||||
| Total revenues |
635,579 | 100.0 | 608,067 | 100.0 | ||||||||||||
|
|
|
|
|
|
|
|
|
|||||||||
| Cost of food and beverage (as a percentage of food and beverage revenues) |
77,577 | 25.0 | 73,019 | 24.5 | ||||||||||||
| Cost of amusement and other (as a percentage of amusement and other revenues) |
47,437 | 14.6 | 46,098 | 14.9 | ||||||||||||
|
|
|
|
|
|
|
|
|
|||||||||
| Total cost of products |
125,014 | 19.7 | 119,117 | 19.6 | ||||||||||||
| Operating payroll and benefits |
150,172 | 23.6 | 145,571 | 23.9 | ||||||||||||
| Other store operating expenses |
199,537 | 31.4 | 192,792 | 31.7 | ||||||||||||
| General and administrative expenses |
36,440 | 5.8 | 40,356 | 6.8 | ||||||||||||
| Depreciation and amortization expense |
66,337 | 10.4 | 63,457 | 10.4 | ||||||||||||
| Pre-opening costs |
7,040 | 1.1 | 3,060 | 0.5 | ||||||||||||
|
|
|
|
|
|
|
|
|
|||||||||
| Total operating costs |
584,540 | 92.0 | 564,353 | 92.9 | ||||||||||||
|
|
|
|
|
|
|
|
|
|||||||||
| Operating income |
51,039 | 8.0 | 43,714 | 7.1 | ||||||||||||
| Interest expense, net |
47,809 | 7.5 | 47,634 | 7.8 | ||||||||||||
|
|
|
|
|
|
|
|
|
|||||||||
| Income (loss) before provision (benefit) for income taxes |
3,230 | 0.5 | (3,920 | ) | (0.7 | ) | ||||||||||
| Provision (benefit) for income taxes |
1,061 | 0.2 | (12,702 | ) | (2.1 | ) | ||||||||||
|
|
|
|
|
|
|
|
|
|||||||||
| Net income |
$ | 2,169 | 0.3 | % | $ | 8,782 | 1.4 | % | ||||||||
|
|
|
|
|
|
|
|
|
|||||||||
| Change in comparable store sales (1) |
1.0 | % | 3.0 | % | ||||||||||||
| Stores open at end of period (2) |
66 | 61 | ||||||||||||||
| Comparable stores open at end of period (1) |
55 | 54 | ||||||||||||||
| (1) | “Comparable store sales” (year-over-year comparison of stores open at the end of the period which have been opened for at least 18 months as of the beginning of each of the fiscal years) is a key performance indicator used within the industry and is indicative of acceptance of our initiatives as well as local economic and consumer trends. The change in comparable store sales for fiscal 2013 has been calculated on a comparable calendar week basis as described previously. |
| (2) | The number of stores open excludes one franchise location in Canada that ceased operations as Dave & Buster’s on May 31, 2013. Our location in Dallas, Texas, which was permanently closed on December 17, 2012, was excluded from our 2012 store count. Our new store openings during the last two fiscal years were as follows: |
| FISCAL YEAR ENDED |
FISCAL YEAR ENDED |
|||||||||
| LOCATION |
OPENING DATE | LOCATION |
OPENING DATE | |||||||
| Virginia Beach, VA |
7/20/2013 | Oklahoma City, OK | 1/30/2012 | |||||||
| Syracuse, NY |
8/21/2013 | Orland Park, IL (Chicago) | 9/22/2012 | |||||||
| Albany, NY |
8/24/2013 | Dallas, TX (a) | 12/2/2012 | |||||||
| Cary, NC (Raleigh) |
11/6/2013 | Boise, ID | 1/12/2013 | |||||||
| Livonia, MI (Detroit) |
12/16/2013 | |||||||||
| (a) | This new store opening replaced a store in the same market, Dallas, Texas, which closed on December 17, 2012. |
Revenues
Total revenues increased $27,512, or 4.5%, to $635,579 in fiscal year 2013 compared to total revenues of $608,067 in fiscal year 2012.
54
Table of Contents
The increased revenues were derived from the following sources:
| FISCAL 2013 | ||||
| Non-comparable stores |
$ | 34,198 | ||
| Comparable stores |
5,260 | |||
| Shift in fiscal year impact (week 1 of fiscal 2013) |
(10,746 | ) | ||
| Other |
(1,200 | ) | ||
|
|
|
|||
| Total |
$ | 27,512 | ||
|
|
|
|||
The following discussion of comparable store sales has been prepared by comparing fiscal 2013 revenues to adjusted fiscal 2012 revenues. Fiscal 2012 revenues have been adjusted to reflect the impact of the shift in our fiscal 2013 calendar due to the 53rd week in our fiscal 2012, as discussed above in “—Presentation of Operating Results.” We have estimated the shift in comparable store revenues from the 53rd week in fiscal 2012 to be a decrease in sales of $9,796. Comparable store revenue increased $5,260, or 1.0% for fiscal 2013 compared to the comparable period in 2012. Comparable walk-in revenues, which accounted for 87.1% of consolidated comparable store revenue for fiscal 2013, increased $2,587, or 0.5% compared to the similar period in 2012. Comparable store special events revenues, which accounted for 12.9% of consolidated comparable store revenue for fiscal 2013, increased $2,673, or 3.9% compared to the comparable period in 2012.
Sales growth was led by amusement and other revenues. Comparable store amusement and other revenues for fiscal 2013 increased by $3,581, or 1.3%, to $283,009 from $279,428 in the 2012 comparison period. The growth over 2012 in amusement sales was driven by Power Card up-sell initiatives and buy-ins at higher denominations. Beverage sales at comparable stores increased by $1,327, or 1.6%, to $84,986 for fiscal 2013 from $83,659 in the comparable period in 2012. Food sales increased by $352, or 0.2%, to $187,579 for fiscal 2013 from $187,227 in the comparable period in 2012. The increased food and beverage revenues are due to televised sports-viewing and related promotions in fiscal 2013.
We have estimated the shift in non-comparable store revenue from the 53rd week in fiscal 2012 to be a reduction in sales of $950. The non-comparable store revenue increased by a total of $34,198, or 72.7%, for fiscal 2013 compared to the comparable period in 2012. The increase in non-comparable store revenue was primarily driven by sales at our Orland Park, Illinois store, which opened for business in the third quarter of 2012, our Dallas, Texas and Boise, Idaho stores, which opened for business in the fourth quarter of 2012, our Virginia Beach, Virginia store, which opened for business in the second quarter of 2013, our Syracuse, New York and Albany, New York stores, which opened for business in the third quarter of 2013 and our Cary, North Carolina and Livonia, Michigan stores, which opened for business in the fourth quarter of 2013. The revenue gains achieved in our stores opening in the second half of fiscal 2012 were partially offset by revenue decreases in our stores opened in fiscal 2011 and early fiscal 2012, due to those stores coming out of the “honeymoon” period, and the December 2012 closure of one store in Dallas, Texas.
Our revenue mix was 33.6% for food, 15.2% for beverage and 51.2% for amusements and other for fiscal 2013. This compares to 33.9%, 15.2% and 50.9%, respectively, for fiscal 2012.
Cost of Products
The total cost of products was $125,014 for fiscal 2013 and $119,117 for fiscal 2012. The total cost of products as a percentage of total revenues was 19.7% and 19.6% for fiscal 2013 and fiscal 2012, respectively.
Cost of food and beverage products increased to $77,577 in fiscal 2013 compared to $73,019 for fiscal 2012 due primarily to the increased sales volume. Cost of food and beverage products, as a percentage of food and beverage revenues, increased 50 basis points to 25.0% for fiscal 2013 from 24.5% for fiscal 2012. Increased cost in our meat and grocery categories was partially offset by reduced poultry costs.
Cost of amusement and other increased to $47,437 in fiscal 2013 compared to $46,098 in fiscal 2012. The costs of amusement and other, as a percentage of amusement and other revenues, decreased 30 basis points to 14.6% for
55
Table of Contents
fiscal 2013 from 14.9% for fiscal 2012. This decrease was primarily driven by a reduction in the redemption cost per ticket redeemed as a result of “Winner’s Circle” price increases.
Operating Payroll and Benefits
Operating payroll and benefits increased by $4,601, or 3.2%, to $150,172 in fiscal 2013 compared to $145,571 in fiscal 2012, primarily due to new store openings. The total cost of operating payroll and benefits, as a percent of total revenues, decreased 30 basis points to 23.6% in fiscal 2013 compared to 23.9% for fiscal 2012. The decrease in operating payroll and benefits, as a percentage of revenues, was driven primarily by decreased hourly labor and incentive compensation expense and favorable health insurance claims experience. These decreases were partially offset by higher management labor costs.
Other Store Operating Expenses
Other store operating expenses increased by $6,745, or 3.5%, to $199,537 in fiscal 2013 compared to $192,792 in fiscal 2012, primarily due to new store openings and increased costs associated with higher subscriptions for televised sports-viewing. These increases were partially offset by favorable claims experiences in general liability insurance. Other store operating expenses as a percentage of total revenues decreased 30 basis points to 31.4% in fiscal 2013 compared to 31.7% for the same period of 2012.
General and Administrative Expenses
General and administrative expenses decreased by $3,916, or 9.7%, to $36,440 in fiscal 2013 compared to $40,356 in fiscal 2012. The decrease in general and administrative expenses was primarily driven by recognition of approximately $2,940 of cost related to the withdrawn initial public offering of D&B Entertainment’s common stock in the third quarter of 2012.
Depreciation and Amortization Expense
Depreciation and amortization expense increased by $2,880, or 4.5%, to $66,337 in fiscal 2013 compared to $63,457 in fiscal 2012. The increase was driven by higher depreciation associated with new store openings, major remodeling projects at sixteen stores during fiscal 2012 and 2013, several smaller scale remodels in fiscal 2013 and maintenance capital expenditures. These increases were partially offset by the absence of depreciation related to our location in Dallas, Texas which closed in December 2012.
Pre-opening Costs
Pre-opening costs increased by $3,980 to $7,040 in fiscal 2013 compared to $3,060 in fiscal 2012 due to the timing of new store openings. During fiscal 2013, our pre-opening costs were primarily attributable to new stores located in Virginia Beach, Virginia, which opened for business in the second quarter of 2013, Albany, New York and Syracuse, New York, which opened for business in the third quarter of 2013, Cary, North Carolina and Livonia, Michigan, which opened for business in the fourth quarter of 2013, and Westchester, California, which opened for business in February 2014. During the same period of 2012, our pre-opening costs consisted primarily of expenses incurred in connection with our Orland Park, Illinois store, which opened for business during the third quarter of 2012 and our Dallas, Texas and Boise, Idaho stores, which opened for business during the fourth quarter of 2012.
Interest Expense
Interest expense increased by $175 to $47,809 in fiscal 2013 compared to $47,634 in fiscal 2012 due to increased accretion on the senior discount notes, offset by reduced rates on the senior secured credit facility based on the second amendment to our senior secured credit facility executed on May 14, 2013 as discussed in “—Liquidity and Capital Resources—Indebtedness.”
Income Tax Provision (Benefit)
The income tax expense for fiscal year 2013 was $1,061 compared to an income tax benefit of $12,702 for fiscal year 2012. Our effective tax rate differs from the statutory rate due to the FICA tip credits, state income taxes and the impact of certain expenses, which are not deductible for income tax purposes.
In assessing the realizability of deferred tax assets, we considered whether it is more likely than not that some or all of the deferred tax assets will not be realized. Accordingly, we have established a valuation allowance of $1,388 for deferred tax assets associated with state taxes and uncertain tax positions as of February 2, 2014. The ultimate realization of our deferred tax assets is dependent on the generation of future taxable income during periods in which temporary differences and carryforwards become deductible. During the third quarter of fiscal 2012, we
56
Table of Contents
recorded a $6,662 reduction to our previously established valuation allowance related to the assessed realization of federal tax benefits associated with our deferred tax assets.
We previously adopted the accounting guidance for uncertainty in income taxes. This guidance limits the recognition of income tax benefits to those items that meet the “more likely than not” threshold on the effective date. As of February 2, 2014, we had accrued approximately $476 of unrecognized tax benefits and approximately $291 of penalties and interest. During fiscal 2013, we increased our unrecognized provision by $5 and increased our accrual for interest and penalties by $1. Because of the impact of deferred tax accounting, $349 of unrecognized tax benefits, if recognized, would affect the effective tax rate.
We file a consolidated tax return with all our domestic subsidiaries. Our income tax returns are periodically audited by various federal, state and foreign jurisdictions. We are generally no longer subject to federal, state, or foreign income tax examinations for years prior to fiscal 2009.
In fiscal year 2013, we expect to utilize approximately $860 of available federal tax credit carryforwards to offset our estimated consolidated cash tax liability. As of February 2, 2014, we expect to have approximately $10,248 of available federal tax credit carryforwards. We anticipate that we will fully utilize all available federal tax carryforwards prior to their expirations.
Fiscal 2012 Compared to Fiscal 2011
The following table sets forth selected data in thousands of dollars and as a percentage of total revenues (unless otherwise noted) for the periods indicated. All information is derived from the consolidated statements of operations included in our consolidated financial statements. The following table presents the results of operations for fiscal year 2012 and fiscal year 2011:
| FISCAL YEAR ENDED | ||||||||||||||||
| FEBRUARY 3, 2013 | JANUARY 29, 2012 | |||||||||||||||
| Food and beverage revenues |
$ | 298,421 | 49.1 | % | $ | 272,606 | 50.3 | % | ||||||||
| Amusement and other revenues |
309,646 | 50.9 | 268,939 | 49.7 | ||||||||||||
|
|
|
|
|
|
|
|
|
|||||||||
| Total revenues |
608,067 | 100.0 | 541,545 | 100.0 | ||||||||||||
|
|
|
|
|
|
|
|
|
|||||||||
| Cost of food and beverage (as a percentage of food and beverage revenues) |
73,019 | 24.5 | 65,751 | 24.1 | ||||||||||||
| Cost of amusement and other (as a percentage of amusement and other revenues) |
46,098 | 14.9 | 41,417 | 15.4 | ||||||||||||
|
|
|
|
|
|
|
|
|
|||||||||
| Total cost of products |
119,117 | 19.6 | 107,168 | 19.8 | ||||||||||||
| Operating payroll and benefits |
145,571 | 23.9 | 130,875 | 24.2 | ||||||||||||
| Other store operating expenses |
192,792 | 31.7 | 175,993 | 32.5 | ||||||||||||
| General and administrative expenses |
40,356 | 6.8 | 34,896 | 6.4 | ||||||||||||
| Depreciation and amortization expense |
63,457 | 10.4 | 54,277 | 10.0 | ||||||||||||
| Pre-opening costs |
3,060 | 0.5 | 4,186 | 0.8 | ||||||||||||
|
|
|
|
|
|
|
|
|
|||||||||
| Total operating costs |
564,353 | 92.9 | 507,395 | 93.7 | ||||||||||||
|
|
|
|
|
|
|
|
|
|||||||||
| Operating income |
43,714 | 7.1 | 34,150 | 6.3 | ||||||||||||
| Interest expense, net |
47,634 | 7.8 | 44,931 | 8.3 | ||||||||||||
|
|
|
|
|
|
|
|
|
|||||||||
| Loss before benefit for income taxes |
(3,920 | ) | (0.7 | ) | (10,781 | ) | (2.0 | ) | ||||||||
| Benefit for income taxes |
(12,702 | ) | (2.1 | ) | (3,796 | ) | (0.7 | ) | ||||||||
|
|
|
|
|
|
|
|
|
|||||||||
| Net income (loss) |
$ | 8,782 | 1.4 | % | $ | (6,985 | ) | (1.3 | )% | |||||||
|
|
|
|
|
|
|
|
|
|||||||||
| Change in comparable store sales (1) |
3.0 | % | 2.2 | % | ||||||||||||
| Stores open at end of period (2) |
61 | 58 | ||||||||||||||
| Comparable stores open at end of period (1) |
54 | 52 | ||||||||||||||
| (1) | “Comparable store sales” (year-over-year comparison of stores open at the end of the period which have been opened for at least 18 months as of the beginning of each of the fiscal years) is a key performance indicator used within the industry and is indicative of acceptance of our initiatives as well as local economic and consumer trends. The fiscal year 2012 comparable store sales have been adjusted to remove the impact of the 53rd week prior to calculating the year-over-year change percentage. |
57
Table of Contents
| (2) | Excluded from our store count as of January 29, 2012, is one store in Dallas, Texas, which was permanently closed on May 2, 2011. Excluded from our store count as of February 3, 2013, is a second store in Dallas, Texas, which was permanently closed on December 17, 2012. Store count also excludes one franchise store in Canada that ceased operations as Dave & Buster’s on May 31, 2013. Our new store openings during the last two fiscal years were as follows: |
| FISCAL YEAR ENDED |
FISCAL YEAR ENDED |
|||||||||
| LOCATION |
OPENING DATE | LOCATION |
OPENING DATE | |||||||
| Oklahoma City, OK |
1/30/2012 | Orlando, FL | 7/18/2011 | |||||||
| Orland Park, IL (Chicago) |
9/22/2012 | Braintree, MA (Boston) | 12/7/2011 | |||||||
| Dallas, TX (a) |
12/2/2012 | |||||||||
| Boise, ID |
1/12/2013 | |||||||||
| (a) | This new store opening replaced a store in the same market, Dallas, Texas, which closed on December 17, 2012. |
Our fiscal year 2012 consisted of 53 weeks compared to 52 weeks in fiscal 2011. We have estimated the changes in fiscal year 2012 revenues compared to fiscal year 2011 revenues on a comparable 52 week basis under the caption “53rd week impact.” All other comparisons are discussed as a percentage of revenue and therefore are not impacted by the additional 53rd week.
Revenues
Total revenues were $608,067 for fiscal year 2012 and $541,545 for fiscal year 2011. We have estimated the revenues during the 53rd week of fiscal year 2012 to be $10,355 ($8,987 for comparable stores and $1,368 for non-comparable stores). The fiscal year 2012 revenue mix was 49.1% food and beverage and 50.9% amusement and other. The fiscal year 2011 revenue mix was 50.3% food and beverage and 49.7% amusement and other.
Total revenues increased $66,522, or 12.3%, to $608,067 in fiscal year 2012 compared to total revenues of $541,545 in fiscal year 2011.
The net increase in revenues were derived from the following sources:
| ADJUSTED FISCAL 2012 |
||||
| Non comparable stores-operating |
$ | 42,859 | ||
| Non comparable stores-closure of store in Dallas, Texas |
(639 | ) | ||
| Comparable stores (1) |
15,254 | |||
| 53rd week impact-comparable stores |
8,987 | |||
| Other |
61 | |||
|
|
|
|||
| Total |
$ | 66,522 | ||
|
|
|
|||
| (1) | Revenue increase for comparable stores has been adjusted to remove the impact of the 53rd week of sales. |
The following discussion on comparable store sales has been prepared by comparing fiscal 2012 revenues on a 52 week basis to fiscal 2011 revenues. Comparable stores revenue increased by $15,254, or 3.0%, for fiscal 2012 compared to fiscal 2011. We have estimated the comparable stores revenues during the 53rd week of fiscal 2012 to be $8,987. Comparable store walk-in revenues, which accounted for 87.4% of consolidated comparable stores revenue for fiscal 2012, increased $14,433, or 3.2%, compared to fiscal 2011. The special events component of our comparable store sales for fiscal 2012, increased by $821, or 1.2%, compared to fiscal 2011.
Comparable store amusements and other revenues increased by $13,390, or 5.2%, to $269,203 in fiscal 2012 from $255,813 in fiscal 2011. The growth was led by amusement sales, which increased primarily due to strategic investments in new games, up-sell initiatives and television advertising promoting the new games. Such investments and initiatives were designed to increase the appeal and consumption of our amusement offerings. Beverage sales at comparable stores increased by $2,700, or 3.4%, to $81,360 in fiscal 2012 from $78,660 in fiscal 2011. Food sales at comparable store decreased $836, or 0.5%, to $181,171 in fiscal 2012 from $182,007 in fiscal 2011.
58
Table of Contents
Non-comparable store revenues increased by a total of $42,220. Non-comparable store revenues includes the revenues associated with our last seven store openings and the pre-closure revenues of our store located in Dallas, Texas, which closed on December 17, 2012. Revenues from our four fiscal 2012 store openings totaled $16,975, but were partially offset by the loss of revenues from the store closure mentioned above of $639.
Our revenue mix was 33.9% for food, 15.2% for beverage and 50.9% for amusement and other for fiscal 2012. This compares to 35.1%, 15.2% and 49.7%, respectively, for fiscal 2011.
Cost of Products
The total cost of products was $119,117 for fiscal 2012 and $107,168 for fiscal 2011. The total cost of products as a percentage of total revenues was 19.6% and 19.8% for fiscal 2012 and fiscal 2011, respectively.
Cost of food and beverage revenues increased to $73,019 for fiscal 2012 compared to $65,751 for fiscal 2011. Cost of food and beverage products, as a percent of food and beverage revenues, increased 40 basis points to 24.5% of revenues for fiscal 2012 compared to 24.1% of revenues for fiscal 2011. Increased cost pressure in our meat, grocery and most beverage categories was partially offset by reduced poultry and produce costs.
Cost of amusement and other revenues increased to $46,098 in fiscal 2012 compared to $41,417 in fiscal 2011. The costs of amusement and other, as a percentage of amusement and other revenues, decreased by 50 basis points to 14.9% of revenues in fiscal 2012 compared to 15.4% of revenues in fiscal 2011. This decrease is due primarily to less discounting of our amusement offerings in fiscal 2012.
Operating Payroll and Benefits
Operating payroll and benefits increased by $14,696 to $145,571 in fiscal 2012 compared to $130,875 in fiscal 2011. The total cost of operating payroll and benefits, as a percentage of total revenues, decreased 30 basis points to 23.9% of revenues for fiscal 2012 from 24.2% of revenues for fiscal 2011. This decrease in the percentage of revenues was primarily driven by a continued focus on labor scheduling, efficiency improvement and favorable sales leverage in 2012. Partially offsetting this favorable trend in fiscal 2012 were higher benefit costs, due in part, to unfavorable health insurance claims experience as compared to fiscal 2011, and higher incentive compensation expense related to our store management team.
Other Store Operating Expenses
Other store operating expenses increased by $16,799 or 9.5%, to $192,792 in fiscal 2012 compared to $175,993 in fiscal 2011, driven primarily by additional occupancy expenses as a result of new store openings, increased marketing activity, unfavorable claims experience in workers’ compensation, general liability insurance and the impact of the 53rd week in 2012. Additionally, during fiscal 2011, other store operating expenses were reduced by the recognition of business interruption recoveries and gains from property related recoveries of $4,170 related to the Nashville store reopened in November 2011. The other store operating expenses, as a percentage of total revenues, decreased by 80 basis points to 31.7% of revenues for fiscal 2012 from 32.5% of revenues for fiscal 2011. Other store operating expenses, as a percentage of total revenues, were lower primarily as a result of the leveraging impact of higher store sales and favorable trends in utility costs, partially offset by higher losses on fixed asset disposals as a result of strategic investments in new games and the remodel of 9 of our 61 stores.
General and Administrative Expenses
General and administrative expenses increased by $5,460, or 15.6%, to $40,356 in fiscal 2012 compared to $34,896 in fiscal 2011. The increase in general and administrative expenses was primarily driven by the recognition of approximately $2,940 of cost related to the withdrawn initial public offering of D&B Entertainment common stock. The expenses related to this transaction were pushed down to Dave & Buster’s, Inc. as the funds from the offering were to have been substantially used to reduce their senior notes. The increase in general and administrative expenses was also driven by increased incentive compensation and salary expense at our corporate headquarters and the impact of the 53rd week in 2012, partially offset by decreases in consulting and professional fees.
Depreciation and Amortization Expense
Depreciation and amortization expense increased by $9,180, or 16.9%, to $63,457 for fiscal 2012 compared to $54,277 for fiscal 2011. This increase is primarily a result of higher depreciation associated with new store openings, major remodeling projects at nine of our stores and maintenance capital expenditures. Additionally, we
59
Table of Contents
estimate the impact of the 53rd week to be an increase to depreciation expense of $1,447. These increases were partially offset by the absence of depreciation related to assets located in our Dallas, Texas location that were suspended due to the closure of our store and subsequent sale of the assets during fiscal 2011.
Pre-opening Costs
Pre-opening costs decreased by $1,126 to $3,060 in fiscal 2012 compared to $4,186 for fiscal 2011 due to the timing and size of new store openings. During fiscal 2012, our pre-opening costs consisted primarily of expenses incurred in connection with the openings of our two small store formats located in Orland Park, Illinois and Boise, Idaho and our one large store format, which opened in Dallas, Texas. During fiscal 2011, our pre-opening costs consisted primarily of expenses incurred in connection with the openings of our two large store formats located in Orlando, Florida and Braintree (Boston), Massachusetts. Additionally during fiscal 2011, we incurred substantially all the pre-opening costs related to our small store format located in Oklahoma City, Oklahoma, which opened in early fiscal 2012.
Interest Expense
Interest expense increased by $2,703, or 6.0%, to $47,634 for fiscal 2012 compared to $44,931 for fiscal 2011, driven primarily by higher interest accretion related our senior discount notes, the impact of the 53rd week, which we estimate to be $904 and decreased capitalized interest associated with our fiscal 2012 construction as compared to our fiscal 2011 construction. Partially offsetting these increases are debt costs recognized in the second quarter of fiscal 2011 related to the amendment to our senior secured credit facility executed on May 13, 2011 as discussed in “Indebtedness.”
Income Tax Benefit
The income tax benefit for 2012 was $12,702 as compared to an income tax benefit of $3,796 for fiscal 2011. Our effective tax rate differs from statutory rates due to the deduction of FICA tip credits, state income taxes, and the impact of the change in the valuation allowance against our deferred tax assets.
In assessing the realizability of our deferred tax assets, at February 3, 2013 we considered whether it is more likely than not that some or all of the deferred tax assets will not be realized. Based on the level of recent historical taxable income; consistent generation of annual taxable income, and estimations of future taxable income we have concluded that it is more likely than not that we will realize the federal tax benefits associated with our deferred tax assets. During fiscal 2012 we utilized all $14,172 of federal net operating loss carryforwards that existed at the end of fiscal 2011. These net operating losses resulted from stock-based compensation tax deductions realized by our predecessor from the consummation of the June 1, 2010 acquisition and were not from operating results. Accordingly, we have reduced our previously established valuation allowance related to our deferred tax assets for federal taxes by $6,662. We assessed the realizability of the deferred tax assets associated with state taxes, foreign taxes and uncertain tax positions and have concluded that it is more likely than not that we will realize a portion of these benefits. Accordingly, we have reduced our previously established valuation allowance against our deferred tax assets for state taxes and uncertain tax positions by $3,429. The ultimate realization of our deferred tax assets is dependent on the generation of future taxable income during periods in which temporary differences and carryforwards become deductible.
We follow accounting guidance for uncertainty in income taxes. This guidance limits the recognition of income tax benefits to those items that meet the “more likely than not” threshold on the effective date. As of February 3, 2013, we had accrued approximately $471 of unrecognized tax benefits and approximately $290 of penalties and interest. During fiscal 2012, we decreased our unrecognized tax benefit by $469 and decreased our accrual for interest and penalties by $819 based upon lapsing of time and settlement with taxing jurisdictions. Future recognition of potential interest or penalties, if any, will be recorded as a component of income tax expense. Because of the impact of deferred tax accounting, $412 of unrecognized tax benefits, if recognized, would impact the effective tax rate.
60
Table of Contents
Quarterly Results of Operations
The following table sets forth certain unaudited financial and operating data in each fiscal quarter during fiscal 2014, fiscal 2013 and fiscal 2012. The unaudited quarterly information includes all normal recurring adjustments that we consider necessary for a fair presentation of the information shown. This information should be read in conjunction with our audited consolidated financial statements and notes thereto appearing elsewhere in this prospectus.
| FISCAL 2014 (1) | FISCAL 2013 (1) | FISCAL 2012 (1) | ||||||||||||||||||||||||||||||||||||||
| AUGUST 3, 2014 |
MAY 4, 2014 |
FEBRUARY 2, 2014 |
NOVEMBER 3, 2013 |
AUGUST 4, 2013 |
MAY 5, 2013 |
FEBRUARY 3, 2013 (1) |
OCTOBER 28, 2012 |
JULY 29, 2012 |
APRIL 29, 2012 |
|||||||||||||||||||||||||||||||
| Food and beverage revenues |
$ | 84,916 | $ | 92,982 | $ | 87,603 | $ | 69,236 | $ | 72,361 | $ | 80,911 | $ | 84,687 | $ | 63,159 | $ | 71,431 | $ | 79,144 | ||||||||||||||||||||
| Amusement and other revenues |
96,469 | 101,841 | 83,768 | 73,094 | 81,362 | 87,244 | 80,899 | 67,907 | 76,510 | 84,330 | ||||||||||||||||||||||||||||||
|
|
|
|
|
|
|
|
|
|
|
|
|
|
|
|
|
|
|
|
|
|||||||||||||||||||||
| Total revenues |
181,385 | 194,823 | 171,371 | 142,330 | 153,723 | 168,155 | 165,586 | 131,066 | 147,941 | 163,474 | ||||||||||||||||||||||||||||||
|
|
|
|
|
|
|
|
|
|
|
|
|
|
|
|
|
|
|
|
|
|||||||||||||||||||||
| Cost of food and beverage |
21,832 | 23,858 | 21,589 | 17,715 | 18,122 | 20,151 | 20,573 | 15,716 | 17,523 | 19,207 | ||||||||||||||||||||||||||||||
| Cost of amusement and other |
14,049 | 13,195 | 12,182 | 10,992 | 12,050 | 12,213 | 11,981 | 10,505 | 11,865 | 11,747 | ||||||||||||||||||||||||||||||
|
|
|
|
|
|
|
|
|
|
|
|
|
|
|
|
|
|
|
|
|
|||||||||||||||||||||
| Total costs of products |
35,881 | 37,053 | 33,771 | 28,707 | 30,172 | 32,364 | 32,554 | 26,221 | 29,388 | 30,954 | ||||||||||||||||||||||||||||||
| Operating payroll and benefits |
42,330 | 42,790 | 41,456 | 36,170 | 35,107 | 37,439 | 39,867 | 33,735 | 35,359 | 36,610 | ||||||||||||||||||||||||||||||
| Other store operating expenses |
57,589 | 56,553 | 49,430 | 51,346 | 50,580 | 48,181 | 48,919 | 44,595 | 50,397 | 48,881 | ||||||||||||||||||||||||||||||
| General and administrative expense |
9,604 | 10,465 | 9,535 | 8,983 | 8,198 | 9,724 | 10,257 | 12,242 | 8,840 | 9,017 | ||||||||||||||||||||||||||||||
| Depreciation and amortization expense |
17,386 | 17,287 | 17,004 | 15,683 | 16,740 | 16,910 | 17,884 | 15,746 | 15,032 | 14,795 | ||||||||||||||||||||||||||||||
| Pre-opening costs |
1,848 | 2,444 | 1,865 | 2,333 | 1,970 | 872 | 1,262 | 1,089 | 559 | 150 | ||||||||||||||||||||||||||||||
|
|
|
|
|
|
|
|
|
|
|
|
|
|
|
|
|
|
|
|
|
|||||||||||||||||||||
| Total operating costs |
164,638 | 166,592 | 153,061 | 143,222 | 142,767 | 145,490 | 150,743 | 133,628 | 139,575 | 140,407 | ||||||||||||||||||||||||||||||
|
|
|
|
|
|
|
|
|
|
|
|
|
|
|
|
|
|
|
|
|
|||||||||||||||||||||
| Operating income (loss) |
16,747 | 28,231 | 18,310 | (892 | ) | 10,956 | 22,665 | 14,843 | (2,562 | ) | 8,366 | 23,067 | ||||||||||||||||||||||||||||
| Interest expense, net |
11,684 | 12,012 | 11,930 | 12,018 | 11,750 | 12,111 | 12,637 | 11,618 | 11,624 | 11,755 | ||||||||||||||||||||||||||||||
| Loss on debt retirement |
25,986 | — | — | — | — | — | — | — | — | — | ||||||||||||||||||||||||||||||
|
|
|
|
|
|
|
|
|
|
|
|
|
|
|
|
|
|
|
|
|
|||||||||||||||||||||
| Income (loss) before provision (benefit) for income taxes |
(20,923 | ) | 16,219 | 6,380 | (12,910 | ) | (794 | ) | 10,554 | 2,206 | (14,180 | ) | (3,258 | ) | 11,312 | |||||||||||||||||||||||||
| Provision (benefit) for Income taxes |
(7,045 | ) | 4,758 | 1,503 | (2,750 | ) | (696 | ) | 3,004 | (3,216 | ) | (10,286 | ) | (1,655 | ) | 2,455 | ||||||||||||||||||||||||
|
|
|
|
|
|
|
|
|
|
|
|
|
|
|
|
|
|
|
|
|
|||||||||||||||||||||
| Net income (loss) |
$ | (13,878 | ) | $ | 11,461 | $ | 4,877 | $ | (10,160 | ) | $ | (98 | ) | $ | 7,550 | $ | 5,422 | $ | (3,894 | ) | $ | (1,603 | ) | $ | 8,857 | |||||||||||||||
|
|
|
|
|
|
|
|
|
|
|
|
|
|
|
|
|
|
|
|
|
|||||||||||||||||||||
| Stores open at end of period (2) |
69 | 68 | 66 | 64 | 62 | 61 | 61 | 60 | 59 | 59 | ||||||||||||||||||||||||||||||
| Quarterly total revenues as a percentage of annual total revenues |
N/A | N/A | 27.0 | % | 22.4 | % | 24.2 | % | 26.4 | % | 27.2 | % | 21.6 | % | 24.3 | % | 26.9 | % | ||||||||||||||||||||||
| Change in comparable store sales |
5.7 | % | 4.7 | % | 0.7 | % | 2.4 | % | (0.9 | )% | 1.8 | % | 3.7 | % | 3.9 | % | 5.4 | % | (0.3 | )% | ||||||||||||||||||||
| (1) | We operate on a 52 or 53 week fiscal year. Each quarterly period has 13 weeks, except for a 53 week year when the fourth quarter has 14 weeks. Our fiscal year ended February 3, 2013 consisted of 53 weeks. As such, the quarter ended February 3, 2013 consisted of 14 weeks. |
61
Table of Contents
| (2) | The number of stores open excludes one franchised store in Canada that ceased operations as a Dave & Buster’s on May 31, 2013. Our location in Nashville, Tennessee, which temporarily closed from May 2, 2010 to November 28, 2011, due to flooding is included in our store count for all periods. Our Kensington/Bethesda, Maryland location (which permanently closed on August 12, 2014) is included in store counts for all periods presented. Our store count has been adjusted downward for the two store closures in Dallas, Texas, one in fiscal 2011 and one in fiscal 2012. |
Liquidity and Capital Resources
Overview
We have financed our activities through cash flow from operations, borrowings under our senior secured credit facility and, prior to the Refinancing, our former senior notes and former senior discount notes, which have been repaid in connection with the Refinancing. As of August 3, 2014, we had cash and cash equivalents of $65,351, net working capital of $9,486 and outstanding debt obligations of $530,000 ($528,681 net of discount). We also had $43,886 in borrowing availability under our revolving senior secured credit facility.
We have had in the past, and anticipate that in the future we may have, negative working capital balances. We are able to operate with a working capital deficit because cash from sales is usually received before related liabilities for product, supplies, labor and services become due. Funds available from sales not needed immediately to pay for operating expenses have typically been used for noncurrent capital expenditures and payment of long-term debt obligations under our senior secured credit facility.
Short-term Liquidity Requirements. We generally consider our short-term liquidity requirements to consist of those items that are expected to be incurred within the next twelve months and believe those requirements to consist primarily of funds necessary to pay operating expenses, interest and principal payments on our debt, capital expenditures related to the new store construction and other expenditures associated with acquiring new games, remodeling facilities and recurring replacement of equipment and improvements.
As of August 3, 2014, we expect our short-term liquidity requirements to include (a) approximately $114,000 to $124,000 of capital expenditures (net of tenant improvement allowances from landlords), (b) scheduled debt service payments of $28,944, including $3,975 in principal payments and $24,969 in interest, (c) lease obligation payments of $61,682 and (d) estimated cash tax payments of approximately $21,000.
Long-term Liquidity Requirements. We generally consider our long-term liquidity requirements to consist of those items that are expected to be incurred beyond the next twelve months and believe these requirements consist primarily of funds necessary for new store development and construction, replacement of games and equipment, performance-necessary renovations and other non-recurring capital expenditures that need to be made periodically to our stores and payments of scheduled debt and lease obligations. We intend to satisfy our long-term liquidity requirements through various sources of capital, including our existing cash on hand, cash provided by operations and borrowings under our senior secured credit facility.
We believe that the sources of capital described above will continue to be available to us in the future and will be sufficient to meet our long-term liquidity requirements.
Based on our current business plan, we believe the cash flows from operations, together with our existing cash balances and availability of borrowings under the senior secured credit facility described below, will be sufficient to meet our anticipated cash needs for working capital, capital expenditures and debt service needs for the foreseeable future. Our ability to make scheduled payments of principal or interest on, or to refinance, our indebtedness, or to fund planned capital expenditures, will depend on future performance, which is subject to the general economic conditions, competitive environment and other factors, including those described in the “Risk Factors” section of this prospectus. If our estimates of revenues, expenses or capital or liquidity requirements change or are inadequate or if cash generated from operations is insufficient to satisfy our liquidity requirements, we may seek to sell additional equity or arrange additional debt financing. In addition, we may seek to sell additional equity or arrange debt financing to give us financial flexibility to pursue attractive opportunities that may arise in the future.
Indebtedness
This Offering. We intend to use the net proceeds from this offering to repay approximately $ principal amount of term loan debt outstanding under the new senior secured credit facility. See “Use of Proceeds.”
62
Table of Contents
New Senior Secured Credit Facility. D&B Holdings together with Dave & Buster’s, Inc. entered into a senior secured credit facility that provides a $530,000 term loan facility with a maturity date of July 25, 2020 and a $50,000 revolving credit facility with a maturity date of July 25, 2019. The $50,000 revolving credit facility includes a $20,000 letter of credit sub-facility and a $5,000 swingline sub-facility. The revolving credit facility will be used to provide financing for general purposes.
The senior secured credit facility is secured by the assets of Dave & Buster’s, Inc. and is unconditionally guaranteed by each of its direct and indirect, existing and future domestic subsidiaries (with certain agreed-upon exceptions). We originally received proceeds from the term loan facility of $528,675, net of a $1,325 discount. The discount is being amortized to interest expense over the six-year life of the term loan facility. As of August 3, 2014, we had no borrowings under the revolving credit facility, borrowings of $530,000 ($528,681, net of discount) under the term facility and $6,114 in letters of credit outstanding. We believe that the carrying amount of our term credit facility approximates its fair value because the interest rates are adjusted regularly based on current market conditions. The fair value of our new senior secured credit facility was determined to be a Level Two instrument as defined by GAAP.
The interest rates per annum applicable to loans, other than swingline loans, under our senior secured credit facility are currently set based on a defined LIBOR rate plus an applicable margin. Swingline loans bear interest at a base rate plus an applicable margin. The loans bear interest subject to a pricing grid based on a secured leverage ratio, at LIBOR plus a spread ranging from 3.25% to 3.50% for the term loans and LIBOR plus a spread ranging from 3.00% to 3.50% for the revolving loans. The effective rate of interest on borrowings under our senior secured credit facility was 4.7% for the twenty-six weeks ended August 3, 2014.
Proceeds from the new senior secured credit facility were used as follows:
| Repayment of Dave & Buster’s, Inc. senior credit facility |
||||
| Outstanding principal |
$ | 143,509 | ||
| Accrued and unpaid interest |
460 | |||
| Legal expenses |
35 | |||
|
|
|
|||
| 144,004 | ||||
|
|
|
|||
| Repayment of Dave & Buster’s, Inc. 11% senior notes |
||||
| Outstanding principal |
200,000 | |||
| Accrued and unpaid interest |
3,239 | |||
| Premium for early redemption |
11,000 | |||
| Additional interest paid to trustee |
1,833 | |||
|
|
|
|||
| 216,072 | ||||
|
|
|
|||
| Repayment of 12.25% senior discount notes |
||||
| Issue price outstanding, net of original issue discount |
100,000 | |||
| Previously accreted interest expense |
41,852 | |||
| Current year interest accretion included in Interest expense, net |
8,341 | |||
| Premium for early redemption |
4,646 | |||
| Additional interest paid to trustee |
1,478 | |||
|
|
|
|||
| 156,317 | ||||
|
|
|
|||
| Total payments to retire prior debt |
516,393 | |||
|
|
|
|||
| Payments of costs associated with new debt issuance |
8,128 | |||
| Administrative fee paid to administrative agent |
31 | |||
|
|
|
|||
| 8,159 | ||||
|
|
|
|||
| Retained cash |
4,123 | |||
|
|
|
|||
| Net proceeds received |
$ | 528,675 | ||
|
|
|
|||
63
Table of Contents
The loss on debt retirement is comprised of the following:
| Non-cash charges |
||||
| Write-off of unamortized debt issuance cost |
$ | 6,559 | ||
| Write-off of unamortized debt discount |
435 | |||
|
|
|
|||
| 6,994 | ||||
|
|
|
|||
| Direct costs associated with debt retirement |
||||
| Premium for early redemption: |
||||
| Dave & Buster’s, Inc. senior notes |
11,000 | |||
| D&B Entertainment senior discount notes |
4,646 | |||
| Additional interest paid to trustee: |
||||
| Dave & Buster’s, Inc. senior notes |
1,833 | |||
| D&B Entertainment senior discount notes |
1,478 | |||
| Legal expenses |
35 | |||
|
|
|
|||
| 18,992 | ||||
|
|
|
|||
| Loss on debt retirement |
$ | 25,986 | ||
|
|
|
Funds managed by Oak Hill Advisors, L.P. (the “OHA Funds”) collectively comprise one of the creditors participating in the term loan portion of our senior secured credit facility. As of August 3, 2014, OHA Funds held approximately 10.0%, or $53,000, of our total term loan obligation. Oak Hill Advisors, L.P. is an independent investment firm that is not an affiliate of the Oak Hill Funds and is not under common control with the Oak Hill Funds. Oak Hill Advisors, L.P. and an affiliate of Oak Hill Capital Management, LLC co-manage Oak Hill Special Opportunities Fund, L.P., a private fund. Certain employees of the Oak Hill Funds, in their individual capacities, have passive investments in Oak Hill Advisors, L.P. and/or the funds it manages. See “Certain Relationships and Related Transactions—Relationship with OHA Funds.”
Our senior secured credit facility contains restrictive covenants that, among other things, limit our ability and the ability of our subsidiaries to: incur additional indebtedness, make loans or advances to subsidiaries and other entities, make initial capital expenditures in relation to new stores, declare dividends, acquire other businesses or sell assets. In addition, under our senior secured credit facility, we are required to meet a maximum total leverage ratio if outstanding revolving loans and letters of credit (other than letters of credit that have been backstopped or cash collateralized) are in excess of 30% of the outstanding revolving commitments. As of August 3, 2014, we were not required to maintain any of the financial ratios under the senior secured credit facility and we were in compliance with the other restrictive covenants.
Repaid Debt
Senior Secured Credit Facility. On July 25, 2014, the new senior secured credit facility refinanced our prior senior secured credit facility. As of July 25, 2014, we had no borrowings under the prior revolving credit facility, borrowings of $143,509 outstanding under the prior term facility due June 1, 2016 and $5,822 in letters of credit outstanding.
Senior Notes. In connection with the Refinancing, all of the $200,000 outstanding Dave & Buster’s, Inc. 11% senior notes due June 1, 2018 were repaid.
Senior Discount Notes. In connection with the Refinancing, all outstanding Dave & Buster’s Parent, Inc. (now known as D&B Entertainment) 12.25% senior discount notes due February 15, 2016 were repaid. As of July 25, 2014, our senior discount notes had a carrying value of approximately $150,193.
64
Table of Contents
Historical Cash Flows
The following table presents a summary of our net cash provided by (used in) operating, investing and financing activities:
| TWENTY-SIX WEEKS ENDED |
FISCAL YEAR ENDED | |||||||||||||||||||
| AUGUST 3, 2014 |
AUGUST 4, 2013 |
FEBRUARY 2, 2014 |
FEBRUARY 3, 2013 |
JANUARY 29, 2012 |
||||||||||||||||
| Net cash provided by (used in): |
||||||||||||||||||||
| Operating activities |
$ | 10,451 | $ | 66,332 | $ | 109,878 | $ | 82,796 | $ | 72,777 | ||||||||||
| Investing activities |
(59,352 | ) | (45,559 | ) | (105,677 | ) | (78,488 | ) | (70,502 | ) | ||||||||||
| Financing activities |
76,172 | (1,568 | ) | (2,238 | ) | (1,875 | ) | (2,998 | ) | |||||||||||
Twenty-six Weeks Ended August 3, 2014 Compared to Twenty-six Weeks Ended August 4, 2013
Net cash provided by operating activities was $10,451 for the twenty-six weeks ended August 3, 2014 compared to cash provided by operating activities of $66,332 for the twenty-six weeks ended August 4, 2013. Decreased cash flows from operations were driven primarily by the costs paid for debt refinancing, premium paid on early redemption of the senior notes and senior discount notes, the payment of accreted interest and higher pre-opening costs due to the timing of new store openings. This decrease was partially offset by increased cash flows from additional non-comparable store sales, increased comparable store sales and improved operating margins.
Net cash used in investing activities was $59,352 for the twenty-six weeks ended August 3, 2014 compared to $45,559 for the twenty-six weeks ended August 4, 2013. Capital expenditures increased $13,690 to $59,374 (excluding approximately $6,649 impact of changes in fixed asset related accrued liabilities) in the twenty-six weeks of fiscal 2014 from $45,684 in the first twenty-six weeks of fiscal 2013 primarily due to new store openings and game refresh initiatives. During the first twenty-six weeks of fiscal 2014, we spent approximately $32,685 ($25,231 net of tenant improvement allowances from landlords) for new store construction, $7,241 related to the major remodel project on three existing stores and several smaller scale remodel projects, $2,924 on operating improvement initiatives, $9,497 for game refreshment and $7,027 for maintenance capital. New store capital expenditures increased $7,968 related primarily to the construction of two large store formats which opened during the first quarter of 2014, a third large store format which opened during the second quarter of 2014 and a fourth large store format which opened on August 25, 2014. Capital expenditures on game refreshment increased $3,175 over the same period in 2013, due to the timing of game purchases for the launch of our “Summer of Games 2014.”
Net cash provided by financing activities was $76,172 for the twenty-six weeks ended August 3, 2014 compared to cash used in the twenty-six weeks ended August 4, 2013 of $1,568. Net cash provided by financing activities increased $77,740 due to the debt refinancing. Cash flow from financing activities increased $528,675, net of a $1,325 discount from the proceeds of the new term loan facility. This increase was offset by repayment of $144,375 principal balance of the prior senior secured credit facility, repayment of $200,000 principal balance of the senior notes, repayment of senior discount notes of $100,000 and payment of transaction fees and expenses of $8,128 associated with the refinancing. The excess cash was used to pay the early redemption premium on the senior notes and the senior discount notes, accumulated accreted interest on the senior discount notes, and accrued and unpaid interest on the senior notes and outstanding term loans, all of which are included in operating activities.
We plan on financing future growth through existing cash on hand, future operating cash flows, debt facilities and tenant improvement allowances from landlords. We expect to spend between $118,000 and $128,000 ($98,000 to $108,000 net of tenant improvement allowances from landlords) in capital expenditures during fiscal 2014. The fiscal 2014 expenditures are expected to include approximately $94,000 to $104,000 ($74,000 to $84,000 net of tenant improvement allowances from landlords) for new store construction and operating improvement initiatives, including three store remodels, $11,000 for game refreshment and $13,000 in maintenance capital. A portion of the 2014 new store expenditures is related to stores that will be under construction in 2014 but will not be open until 2015.
65
Table of Contents
Fiscal 2013 Compared to Fiscal 2012
Net cash provided by operating activities was $109,878 for fiscal 2013 compared to cash provided by operating activities of $82,796 for fiscal 2012. Improved cash flows from operations were driven primarily by additional non-comparable store sales, increased comparable stores sales, lower operating payroll and benefits expenses due to a decrease in hourly labor costs offset by higher management labor, higher pre-opening costs due to the timing of new store openings and one less week of operations in fiscal 2013.
Net cash used in investing activities was $105,677 for fiscal 2013 compared to $78,488 for fiscal 2012. Net cash used in investing activities increased in fiscal 2013 due to increased capital expenditures. Capital expenditures increased $27,205 to $105,894 (excluding approximately $13,988 in fixed asset related accrued liabilities) in fiscal 2013 from $78,689 in fiscal 2012 primarily due to new store openings, remodeling projects and game refresh initiatives. During the 2013 fiscal year, we spent approximately $63,929 ($48,143 net of tenant improvement allowances from landlords) for new store construction, $18,094 related to the major remodel project on seven of our existing stores and several small scale remodel projects, $1,758 on operating improvement initiatives, $9,441 for game refreshment and $12,672 for maintenance capital. During the 2012 fiscal year, we spent approximately $32,795 ($21,913 net of tenant improvement allowances from landlords) for new store construction, $15,962 related to the major remodel project on nine of our existing stores, $5,985 on operating improvement initiatives, $10,090 for game refreshment and $13,857 for maintenance capital. New store capital expenditures increased $31,134 during fiscal 2013 related primarily to construction of our Virginia Beach, Virginia store (large store format), which opened during the second quarter of 2013, our Albany, New York (large store format) and Syracuse, New York (small store format) stores which opened in the third quarter of 2013, our Cary, North Carolina (small store format) and Livonia, Michigan (large store format) stores which opened in the fourth quarter of 2013, our Westchester, California (large store format) store which opened in February 2014 and our Vernon Hills, Illinois (large store format) store which opened in March 2014. New store capital expenditures during fiscal 2012 related to construction of our Orland Park, Illinois store (small store format), which opened during the third quarter of fiscal 2012 and our Dallas, Texas and Boise, Idaho stores (one large and one small format store) which both opened in the fourth quarter of fiscal 2012.
Net cash used by financing activities was $2,238 for fiscal 2013 compared to cash used in financing activities of $1,875 for fiscal 2012. Net cash used in investing activities increased due to the costs related to the Second Amendment to the senior secured credit facility in the second quarter of fiscal 2013 partially offset by one additional required principal payment on our term loan facility in fiscal 2012 and proceeds from the sale of common stock in 2013.
Fiscal 2012 Compared to Fiscal 2011
Net cash provided by operating activities was $82,796 for fiscal 2012 compared to cash provided by operating activities of $72,777 for fiscal 2011. Improved cash flows from operations were driven primarily by additional non-comparable store sales, growth in comparable store sales and additional sales related to the 53rd week in fiscal 2012. Also contributing to the improved operating cash flows was margin improvements over the comparable period in fiscal 2011.
Net cash used in investing activities was $78,488 for fiscal 2012 compared to $70,502 for fiscal 2011. Net cash used in investing activities increased in fiscal 2012 due to increased capital expenditures. Capital expenditures increased $5,743 to $78,689 in fiscal 2012 from $72,946 in fiscal 2011 primarily due to remodeling projects and game refresh initiatives, partially offset by decreased spending related to new store openings. During the 2012 fiscal year, we spent approximately $32,795 ($21,913 net of tenant improvement allowances from landlords) for new store construction, $15,962 related to the major remodel project on nine of its existing stores, $5,985 on operating improvement initiatives, $10,090 for game refreshment and $13,857 for maintenance capital. During the 2011 fiscal year, we spent approximately $43,951 ($37,040 net of tenant improvement allowances from landlords) for new store construction, $4,002 related to the major remodel project on one of its existing stores, $6,378 on operating improvement initiatives, $7,196 for game refreshment and $11,419 for maintenance capital. Capital expenditures related to new store openings decreased in fiscal 2012 due primarily to the timing and size of new construction. New store capital expenditures during fiscal 2012 related to construction of our Orland Park, Illinois store (small store format), which opened during the third quarter of fiscal 2012 and our Dallas, Texas and Boise, Idaho stores (one large
66
Table of Contents
and one small format store) which both opened in the fourth quarter of fiscal 2012. New store capital expenditures during fiscal 2011 related to construction of our Orlando, Florida store (large store format), which opened during the second quarter of fiscal 2011, our Braintree, Massachusetts and Nashville, Tennessee stores (both large format stores) which both opened in the fourth quarter of fiscal 2011 and our Oklahoma City, Oklahoma store (small format store) which opened during the first quarter of fiscal 2012. The Company received insurance proceeds of $798 for reimbursement of certain leasehold improvements damaged in the flooding that occurred at our Nashville, Tennessee location which are included in investing activities for fiscal 2011.
Net cash used by financing activities was $1,875 for fiscal 2012 compared to $2,998 for fiscal 2011. One additional required principal payment on our term loan facility was made in fiscal 2012. Financing activities for fiscal 2011 included net cash received of $100,000 from the issuance of the senior discount notes. Proceeds from the issuance of the senior discount notes were used to repurchase a portion of our common stock from certain stockholders of $96,888 and pay debt issuance cost of $3,120. Activity also includes the required principal payments under our term loan facility totaling $1,500.
Kensington/Bethesda Store Litigation
On November 14, 2013, Dave & Buster’s, Inc. filed a complaint in federal court seeking declaratory and injunctive relief related to actions taken by a landlord attempting to terminate the lease agreement for our store in Kensington/Bethesda, Maryland. The landlord alleged that the Company is in default of certain lease agreement provisions which restrict our ability to operate other Dave & Buster’s facilities within a prescribed distance of the Kensington/Bethesda location. We believed that the lease provisions cited by the landlord were not legally enforceable and that the Company had the right to operate all facilities for the duration of the original lease term and any available lease extension periods. On July 21, 2014, the court issued its final ruling against the Company and the Kensington/Bethesda location permanently closed on August 12, 2014. As of the closing date, we believe that all of our fixed assets from the Kensington/Bethesda store are either fully depreciated or can be transferred to other locations. With past store closures, we have experienced customer migration to other stores within the same market.
Revenues for our Kensington/Bethesda, Maryland stores were $5,231 and $6,384 in the twenty-six weeks ended August 3, 2014 and August 4, 2013, respectively. We have recorded depreciation and net lease expense of $243 and $331, respectively, in the twenty-six weeks ended August 3, 2014 and $403 and $422, respectively, in the twenty-six weeks ended August 4, 2013. Annual revenues for our Kensington/Bethesda, Maryland stores were $12,036, $12,751 and $12,676 in fiscal 2013, 2012 and 2011, respectively. We have recorded depreciation expense of $1,889, $1,030 and $687 in fiscal 2013, 2012 and 2011, respectively. Net lease expense was $1,120, $908 and $822 for fiscal 2013, 2012 and 2011, respectively.
Contractual Obligations and Commercial Commitments
The following tables set forth the historical contractual obligations and commercial commitments as of August 3, 2014, prior to the transactions described in “Use of Proceeds.”
Payments Due by Period—Historical
| TOTAL | 1 YEAR OR LESS |
2-3 YEARS | 4-5 YEARS | AFTER 5 YEARS |
||||||||||||||||
| Secured credit facility (1) |
$ | 530,000 | $ | 3,975 | $ | 10,600 | $ | 10,600 | $ | 504,825 | ||||||||||
| Interest requirements (2) |
142,628 | 24,969 | 47,912 | 47,389 | 22,358 | |||||||||||||||
| Operating leases (3) |
652,917 | 61,682 | 120,616 | 110,802 | 359,817 | |||||||||||||||
|
|
|
|
|
|
|
|
|
|
|
|||||||||||
| Total |
$ | 1,325,545 | $ | 90,626 | $ | 179,128 | $ | 168,791 | $ | 887,000 | ||||||||||
|
|
|
|
|
|
|
|
|
|
|
|||||||||||
| (1) | Our secured credit facility includes a $530,000 term loan facility and $50,000 revolving credit facility, a letter of credit sub-facility and a swingline sub-facility. As of August 3, 2014, we had no borrowings under the revolving credit facility, borrowings of $530,000 ($528,681 net of discount) under the term facility and $6,114 in letters of credit outstanding. |
| (2) | The cash obligations for interest requirements consist of variable rate debt obligations at rates in effect at August 3, 2014. |
67
Table of Contents
| (3) | Our operating leases generally provide for one or more renewal options. These renewal options allow us to extend the term of the lease for a specified time at an established annual lease payment. Future obligations related to lease renewal options that have been exercised, or were reasonably assured to be exercised as of the lease origination date, have been included. The operating lease obligations exclude those after August 31, 2014 related to our location in Kensington/Bethesda, Maryland, which permanently closed on August 12, 2014. See Note 13 to the accompanying consolidated financial statements for a description of events pertaining to the Kensington/Bethesda, Maryland location and “—Kensington/Bethesda Store Litigation” above. |
The following table represents our as adjusted contractual obligations and commercial commitments associated with our debt and other obligations disclosed above as of August 3, 2014, on a pro forma as adjusted basis to give effect to the Refinancing and assuming our receipt of the proceeds from the sale of our common stock in this offering and the use of a portion of the net proceeds of this offering to repay $ principal amount of the term loan debt outstanding under the new senior secured credit facility, as if those transactions had occurred at that date. See “Use of Proceeds.”
Payments Due by Period—Pro Forma as Adjusted
| TOTAL | 1 YEAR OR LESS |
2-3 YEARS | 4-5 YEARS | AFTER 5 YEARS |
||||||||||||||||
| Senior secured credit facility |
$ | $ | $ | $ | $ | |||||||||||||||
| Interest requirements |
||||||||||||||||||||
| Operating leases |
||||||||||||||||||||
|
|
|
|
|
|
|
|
|
|
|
|||||||||||
| Total |
$ | $ | $ | $ | $ | |||||||||||||||
|
|
|
|
|
|
|
|
|
|
|
|||||||||||
Off-Balance Sheet Arrangements
We have no material off-balance sheet arrangements.
Quantitative and Qualitative Disclosures About Market Risk
We are exposed to market risk from interest rate changes on our senior secured credit facility. This exposure relates to the variable component of the interest rate on our $530,000 senior secured credit facility. As of August 3, 2014, we had borrowings of $530,000 ($528,681, net of discount) under the term facility, based on a defined Eurodollar rate plus an applicable margin. A hypothetical 10% increase in the interest rate associated with our term facility would increase our interest expense by approximately $530. As of August 3, 2014 we had no borrowings under our revolving credit facility. Therefore, we had no exposure to interest rate fluctuations on our revolving credit facility as of that date.
Critical Accounting Policies and Estimates
The above discussion and analysis of our financial condition and results of operations is based upon our consolidated financial statements. The preparation of these financial statements requires us to make estimates and judgments that affect the reported amounts of assets, liabilities, revenue and expenses, and disclosures of contingent assets and liabilities. Our significant accounting policies are described in Note 1 to the accompanying consolidated financial statements for the year ended February 2, 2014. Critical accounting policies are those that we believe are most important to portraying our financial condition and results of operations and also require the greatest amount of judgments by management. Judgments or uncertainties regarding the application of these policies may result in materially different amounts being reported under different conditions or using different assumptions. We consider the following policies to be the most critical in understanding the judgments that are involved in preparing the consolidated financial statements.
Property and Equipment. Property and equipment are recorded at cost. Expenditures that substantially increase the useful lives of the property and equipment are capitalized, whereas costs incurred to maintain the appearance and functionality of such assets are charged to repair and maintenance expense. Interest costs incurred during construction are capitalized and depreciated based on the estimated useful life of the underlying asset. These costs are depreciated using the straight-line method over the estimate of the depreciable life, resulting in a charge to the operating results. Our actual results may differ from these estimates under different assumptions or conditions.
68
Table of Contents
We review our property and equipment for impairment when events or circumstances indicate the carrying value of the assets may not be recoverable. In determining the recoverability of the asset value, an analysis is performed at the individual store level, since this is the lowest level of identifiable cash flows and primarily includes an assessment of historical cash flows and other relevant factors and circumstances. The other factors and circumstances include the maturity of the store, changes in the economic environment, unfavorable changes in legal factors or business climate and future operating plans.
Our impairment assessment process requires the use of estimates and assumptions regarding future undiscounted cash flows and operating outcomes, which are based upon a significant degree of management’s judgment. At any given time, we may be monitoring a small number of locations, and future impairment charges could be required if individual store performance is deemed inadequate to recover the value of its assets. We forecast our future cash flows by considering a variety of factors, including the maturity of the store, recent store level performance, store level operating plans, sales trends, and cost trends for cost of sales, labor and operating expenses. We believe that this combination of information gives us a fair benchmark to predict future undiscounted cash flows. However, the future cash flow forecast may be incorrect due to factors such as unanticipated variations in our sales, cost of goods sold, labor expenses, the impact of competition, macroeconomic trends and issues related to the market in which the store is located. We compare this cash flow forecast to the carrying value of the assets of the store. Based on this analysis, if we believe that the carrying amount of the assets is not recoverable, an impairment charge would be recognized based upon the amount by which the carrying value of the assets exceeds fair value. We recognized an impairment loss of $200 during fiscal 2011 on one of our stores located in Dallas, Texas, which permanently closed on May 2, 2011. No impairment charges were recognized during the first twenty-six weeks of fiscal 2014 or in fiscal years 2013 or 2012.
Goodwill and Intangible Assets. We account for our goodwill and intangible assets in accordance with accounting guidance for business combinations and accounting guidance for goodwill and other intangible assets. In accordance with accounting guidance for business combinations, goodwill of approximately $272,359 and intangible assets of $79,000 representing trade names were recognized in connection with the acquisition of D&B Holdings by the Oak Hill Funds that occurred on June 1, 2010. Goodwill and trade names, which have an indefinite useful life, are not being amortized. However, both goodwill and trade names are subject to annual impairment testing.
We perform step one of the impairment test in our fourth quarter unless circumstances require this analysis to be completed sooner. Step one of the impairment test is based upon a comparison of the carrying value of our net assets, including goodwill balances, to the fair value of our net assets. Fair value is measured using a combination of the guideline company method, external transaction method and the income approach. The guideline company method uses valuation multiples from selected publicly-traded companies that we believe are exposed to market forces that are similar to those faced by the Company. The external transaction involves analyzing previous mergers or acquisitions involving private or public companies that are similar to the Company. The income approach consists of utilizing the discounted cash flow method that incorporates our estimates of future revenues and costs, discounted using a risk-adjusted discount rate. Key assumptions used in our testing include future store openings, revenue growth, operating expenses and discount rate. Estimates of revenue growth and operating expenses are based on internal projections considering our past performance and forecasted growth, market economics and the business environment impacting our Company’s performance. Discount rates are determined by using a weighted average cost of capital (“WACC”). The WACC considers market and industry data as well as company-specific risk factors. These estimates are highly subjective judgments and can be significantly impacted by changes in the business or economic conditions. Our estimates used in the income approach are consistent with the plans and estimates used to manage operations. We do evaluate all methods to ensure reasonably consistent results. Based on the completion of the step one test, we determined that goodwill was not impaired.
The evaluation of the carrying amount of other intangible assets with indefinite lives is made at least annually by comparing the carrying amount of these assets to their estimated fair value. The estimated fair value is generally determined on the basis of discounted future cash flows. If the estimated fair value is less than the carrying amount of the other intangible assets with indefinite lives, then an impairment charge is recorded to reduce the asset to its estimated fair value.
We assess the potential impairment of definite lived intangibles, including trademarks and other long-lived assets whenever events or changes in circumstances indicate that the carrying value may not be recoverable. In evaluating
69
Table of Contents
long-lived restaurant assets for impairment, we consider a number of factors relevant to the assets’ current market value.
Income Taxes. We file consolidated returns with all our domestic subsidiaries. We use the asset/liability method for recording income taxes, which recognizes the amount of current and deferred taxes payable or refundable at the date of the financial statements as a result of all events that are recognized in the financial statements and as measured by the provisions of enacted tax laws. We have adopted accounting guidance for uncertainty in income taxes. This guidance limits the recognition of income tax benefits to those items that meet the “more likely than not” threshold on the effective date.
The calculation of tax liabilities involves significant judgment and evaluation of uncertainties in the interpretation of federal and state tax regulations. As a result, we have established reserves for taxes that may become payable in future years as a result of audits by tax authorities. Tax reserves are reviewed regularly pursuant to accounting guidance for uncertainty in income taxes. Tax reserves are adjusted as events occur that affect the potential liability for additional taxes, such as the expiration of statutes of limitations, conclusion of tax audits, identification of additional exposure based on current calculations, identification of new issues, or the issuance of statutory or administrative guidance or rendering of a court decision affecting a particular issue. Accordingly, we may experience significant changes in tax reserves in the future, if or when such events occur.
Deferred Tax Assets. A deferred income tax asset or liability is established for the expected future consequences resulting from temporary differences in the financial reporting and tax bases of assets and liabilities. As of August 3, 2014, we have recorded a valuation allowance against a portion of our deferred tax assets, primarily state tax assets. The valuation allowance was established in accordance with accounting guidance for income taxes.
If our taxable income decreases in future periods or if the facts and circumstances on which our estimates and assumptions are based were to change, thereby impacting the likelihood of realizing the deferred tax assets, judgment would have to be applied in determining if an addition to the allowance would be required or the amount of the valuation allowance no longer required.
Accounting for Amusement Operations. The majority of our amusement revenue is derived from customer purchases of game play credits which allow our customers to play the video and redemption games in our Midways. We have recognized a liability for the estimated amount of unused game play credits, which we believe our customers will utilize in the future based on credits remaining on Power Cards, historic utilization patterns and revenue per game play credit sold. Certain Midway games allow customers to earn coupons, which may be redeemed for prizes. The cost of these prizes is included in the cost of amusement products and is generally recorded when coupons are utilized by the customer by either redeeming the coupons for a prize in our “Winner’s Circle” or storing the coupon value on a Power Card for future redemption. We have accrued a liability for the estimated amount of outstanding coupons that will be redeemed in subsequent periods based on tickets outstanding, historic redemption patterns and the estimated redemption cost of products per ticket.
Insurance Reserves. We use a combination of insurance and self-insurance mechanisms to provide for potential liabilities for workers’ compensation, healthcare benefits, general liability, property insurance, director and officers’ liability and vehicle liability. Liabilities associated with the risks that are retained by us are estimated, in part, by considering historical claims experience, demographic factors, severity factors and other actuarial assumptions. Portions of the estimated accruals for these liabilities are calculated by third-party actuarial firms. The estimated accruals for these liabilities could be significantly affected if future occurrences and claims differ from these assumptions and historical trends.
70
Table of Contents
Company Overview
We are a leading owner and operator of high-volume venues in North America that combine dining and entertainment for both adults and families. The core of our concept is to offer our customers the opportunity to “Eat Drink Play and Watch” all in one location. Eat and Drink are offered through a full menu of “Fun American New Gourmet” entrées and appetizers and a full selection of non-alcoholic and alcoholic beverages. Our Play and Watch offerings provide an extensive assortment of entertainment attractions centered around playing games and watching live sports and other televised events. Our customers are a balanced mix of men and women, primarily between the ages of 21 and 39, and we believe we also serve as an attractive venue for families with children and teenagers. We believe we appeal to a diverse customer base by providing a highly customizable experience in a dynamic and fun setting.
As of September 2, 2014, we owned and operated 69 stores in 26 states and Canada. For the twelve months ended August 3, 2014, we generated total revenues of $689.9 million, Adjusted EBITDA of $149.0 million (representing an Adjusted EBITDA margin of 21.6%) and a net loss of $7.7 million. For the twenty-six weeks ended August 3, 2014 and August 4, 2013, we generated total revenues of $376.2 million and $321.9 million, respectively, Adjusted EBITDA of $89.1 million and $74.8 million, respectively, and net income (loss) of $(2.4) million and $7.5 million, respectively. For fiscal 2013, we generated total revenues of $635.6 million, Adjusted EBITDA of $134.8 million (representing an Adjusted EBITDA margin of 21.2%) and net income of $2.2 million. For fiscal 2012 and fiscal 2011, we generated total revenues of $608.1 million and $541.5 million, respectively, Adjusted EBITDA of $120.5 million and $98.4 million, respectively, and net income (loss) of $8.8 million and $(7.0) million, respectively. From fiscal 2011 to fiscal 2013, total revenues and Adjusted EBITDA grew at a CAGR of 8.3% and 17.1%, respectively. We generated comparable store sales increases of 5.2%, 1.0%, 3.0% and 2.2% in the twenty-six weeks ended August 3, 2014 and fiscal 2013, 2012 and 2011, respectively. Based on the KNAPP-TRACK index, an index tracking year-over-year changes in comparable store sales in the casual dining restaurant industry, the overall casual dining restaurant industry’s comparable store sales growth was -.9%, -1.5%, 0.2% and 1.7% for the twenty-six weeks ended August 3, 2014 and fiscal 2013, 2012 and 2011, respectively. As such, we outperformed the KNAPP-TRACK index by approximately 610, 240, 270 and 40 basis points in the twenty-six weeks ended August 3, 2014 and fiscal 2013, 2012 and 2011, respectively.
|
|
|
71
Table of Contents
|
|
|
As a key feature of our business model, 51.2% of our total revenues for fiscal 2013 were from our amusement offerings, which have a relatively low variable cost component and contributed a gross margin of 85.4%. Combined with our food and beverage revenues, which comprised 48.8% of our total revenues and contributed a gross margin of 75.0% for fiscal 2013, we generated a total gross margin of 80.3%.
|
|
|
The formats and square footage of our stores are flexible, which we believe allows us to size new stores appropriately for each market as we grow. Our stores average 45,000 square feet and range in size between 16,000 and 66,000 square feet. We believe we have an attractive store economic model that enables us to generate high average store revenues and Store-level EBITDA. For our 55 comparable stores in fiscal 2013, our average revenues per store were $10.1 million, average Store-level EBITDA was $2.6 million and average Store-level EBITDA margin was 25.9%. Furthermore, for that same period, all of our comparable stores had positive Store-level EBITDA, with 89.1% of our stores generating more than $1.0 million of Store-level EBITDA each and 61.8% of our stores generating more than $2.0 million of Store-level EBITDA each.
Eat Drink Play and Watch—All Under One Roof
When our founders opened our first location in Dallas, Texas in 1982, they sought to create a brand with a fun, upbeat atmosphere providing interactive entertainment options for adults and families, while serving high-quality food and beverages. Since then we have followed the same principle for each new store, and in doing so we believe we have developed a distinctive brand based on our customer value proposition: “Eat Drink Play and Watch.” The interaction between playing games, watching sports, dining and enjoying our full-service bar areas is the defining feature of the Dave & Buster’s customer experience, and the layout of each store is designed to promote crossover between these activities. We believe this combination creates an experience that cannot be easily replicated at home or elsewhere without having to visit multiple destinations. Our locations are also designed to accommodate private parties, business functions and other corporate-sponsored events.
72
Table of Contents
Eat
We seek to distinguish our food menu from other casual dining concepts with our strategy of offering “Fun American New Gourmet” entrées and appetizers. Our “Fun American New Gourmet” menu is intended to appeal to a broad spectrum of customers and include classic “American” offerings with a fun twist. We believe we offer high-quality meals, including gourmet pastas, choice-grade steaks, premium sandwiches, decadent desserts and health-conscious entrée options that compare favorably to those of other higher end casual dining operators. We believe our broad menu offers something for everyone and captures full meal, snacking and sports-viewing occasions. We plan to introduce new menu items three times per year that we believe reinforce the fun of the Dave & Buster’s brand. Our food revenues accounted for 33.6% of our total revenues during fiscal 2013.
Drink
Each of our locations also offers full bar service, including a variety of beers, signature cocktails, premium spirits and non-alcoholic beverages. We continually strive to innovate our beverage offering, adding new beverages three times per year, including the introduction of fun beverage platforms such as our adult Snow Cones, CoronaRitas and Berry Blocks cocktails. Beverage service is typically available throughout the entire store, allowing for multiple sales opportunities. We believe that our high margin beverage offering is complementary to each of the Eat, Play and Watch aspects of our brand. Our beverage revenues accounted for 31.1% of our total food and beverage revenues and 15.2% of our total revenues during fiscal 2013.
Play
A key aspect of the entertainment experience at Dave & Buster’s is the games in our Midway, which we believe are the core differentiating feature of our brand. The Midway in each of our stores is an area where we offer a wide array of amusement and entertainment options, typically with over 150 redemption and simulation games. Our amusement and other revenues accounted for 51.2% of our total revenues during fiscal 2013. Redemption games, which represented 78.7% of our amusement and other revenues in fiscal 2013, offer our customers the opportunity to win tickets that are redeemable at our “Winner’s Circle,” a retail-style space in our stores where customers can redeem the tickets won through play of our redemption games for prizes ranging from branded novelty items to high-end electronics. We believe this “opportunity to win” creates a fun and highly energized social experience that is an important aspect of the Dave & Buster’s in-store experience and cannot be easily replicated at home. Our video and simulation games, many of which can be played by multiple customers simultaneously and include some of the latest high-tech games commercially available, represented 16.7% of our amusement and other revenues in fiscal 2013. Other traditional amusements represented the remainder of our amusement and other revenues in fiscal 2013.
Watch
Sports-viewing is another key component of the entertainment experience at Dave & Buster’s. All of our stores have multiple large screen televisions and high quality audio systems providing customers with a venue for watching live sports and other televised events. In fiscal 2010, we initiated a program that evolved into “D&B Sports,” which is a more immersive viewing environment that provides customers with 100+ inch high definition televisions to watch televised events and enjoy our full bar and extensive food menu. We believe that we have created an attractive and comfortable environment that includes a differentiated and interactive viewing experience that offers a new reason for customers to visit Dave & Buster’s. Through continued development of the D&B Sports concept in new stores and additional renovations of existing stores, our goal is to build awareness of D&B Sports as “the best place to watch sports” and the “only place to watch the games and play the games.”
Our Company’s Core Strengths
We believe we benefit from the following strengths:
Strong, Distinctive Brand With Broad Customer Appeal. We believe that the multi-faceted customer experience of “Eat Drink Play and Watch” at Dave & Buster’s, supported by our national marketing, has helped us create a widely recognized brand with no direct national competitor that combines all four elements in the same way. In markets where we have stores, over 95% of casual dining consumers stated that they are aware of our brand as a dining and entertainment venue. Our customer research shows that our brand appeals to a balanced mix of male and female adults, primarily between the ages of 21 and 39, as well as families and teenagers. Based on customer survey results, we also believe that the average household income of our customers is approximately $80,000, which we believe represents an attractive demographic.
73
Table of Contents
Multi-Faceted Customer Experience Highlights Our Value Proposition. We believe that our combination of interactive games, attractive television viewing areas, high-quality dining and full-service beverage offerings, delivered in a highly-energized atmosphere, provides a multi-faceted customer experience that cannot be easily replicated at home or elsewhere without having to visit multiple destinations. We aim to offer our customers a value proposition comparable or superior to many of the separately available dining and entertainment options. We are continuously working with game manufacturers and food providers to create new games and food items at compelling price points to retain and generate customer traffic and improve the customer experience. Our value proposition is enhanced by what we consider to be innovative marketing initiatives, including our Eat & Play Combo (a promotion that provides a discounted Power Card in combination with select entrées), Super Charge Power Card offerings (when purchasing or adding value to a Power Card, the customer is given the opportunity to add 25% more chips to the Power Card for a small upcharge), Half-Price Game Play (every Wednesday, from open to close, we reduce the price of every game in the Midway by one-half), Everyone’s a Winner (a limited-time offer providing a prize to every customer that purchases or adds value to a Power Card in the amount of $10 or more) and free game play promotions to feature the introduction of our new games. We believe these initiatives have helped increase customer visits and encourage customers to participate more fully across our broad range of food, beverage and entertainment offerings.
Vibrant, Contemporary Store Design That Integrates Entertainment and Dining. We believe we continue to benefit from enhancements to the Dave & Buster’s brand through our store design and D&B Sports initiatives, which began in fiscal 2011. Our new store design provides a contemporary, engaging atmosphere for our customers that includes clearly differentiated spaces designed to convey each component of our customer value proposition: “Eat Drink Play and Watch.” These store design changes include a modern approach to the finishes and layout of the store, which we believe encourages participation across each of the store’s elements. The oversized graphics and images throughout the store are intended to communicate our brand personality by being fun, contemporary and larger-than-life. The dining room décor includes booth seating and table seating and colorful artwork, often featuring local landmarks. Our Winner’s Circle provides a retail-like environment where customers can redeem their tickets for prizes. All of our new locations opened since the beginning of fiscal 2011 incorporate our new store design. We believe the introduction and continued expansion of our D&B Sports concept, currently incorporated in approximately half of our store base, provides an attractive opportunity to market our broader platform to new and existing customers through a year-round calendar of programming and promotions tied to popular sporting events and sport-related activities. The large television screens, comfortable seating, a full menu of food and beverages and artwork often featuring images of local sports teams and sports icons help create what we believe to be an exciting environment for watching sports programming. We have also strategically invested over $52.8 million since the beginning of fiscal 2011 to introduce D&B Sports and modernize the exteriors, front lobbies, bars, dining areas and “Winner’s Circles” of select locations. As of September 2, 2014, we have remodeled three stores during fiscal 2014 and by the end of fiscal 2014, approximately 65% of our stores will either be new or remodeled to adopt our new store design. All of the new or remodeled stores contain an upgraded venue for watching live sports and other televised events, and approximately 87% of these stores contain the D&B Sports concept.
History of Margin Improvement. We have a proven track record of identifying operational efficiencies and implementing cost saving initiatives and have increased our Adjusted EBITDA margins by approximately 510 basis points from fiscal 2010 to the twelve months ended August 3, 2014. In 2010, we initiated the strategic selection and sourcing of our Winner’s Circle merchandise and centralized management of store-level Winner’s Circle inventory, helping contribute to a reduction in our amusement costs of approximately 120 basis points since fiscal year 2010. We have also improved margins through initiatives directed at labor performance and management. In 2010, we launched an integrated labor management system, which we have continued to enhance through new labor efficiency and overtime management tools. Hourly labor has improved by approximately 100 basis points since fiscal year 2010, representing annual cost savings of approximately $6.4 million. We expect our continued focus on operating margins at individual locations and the deployment of best practices across our store base to yield incremental margin improvements, although there is no guarantee that this will occur. We believe we are well-positioned to continue to increase margins and remain focused on identifying additional opportunities to reduce costs. We are currently testing an eTicket initiative, which is a paperless ticket distribution system that we plan to roll out to all of our stores during fiscal 2015. We estimate that our eTicket initiative will result in annual savings in excess of $3.0 million. We leverage our investments in technology, such as our labor scheduling system and our proprietary technology linking games with Power Cards, to increase the overall performance of our stores while also
74
Table of Contents
enhancing the customer experience. Power Cards are magnetic stripe cards that enable a customer to play our games. A customer purchases “chips” that are used to play our games and are loaded to a Power Card at an automated kiosk or by an employee. Our business model has a relatively lower proportion of variable costs versus fixed costs compared to our competitors. We believe this creates operating leverage and gives us the potential to further improve margins and deliver greater earnings from expected future increases in comparable store sales and new store growth. Under our current cost structure, we estimate that we will realize more than 50% flow through to Adjusted EBITDA from any comparable store sales growth.
Store Model Generates Favorable Store Economics and Strong Returns. We believe our store model offering entertainment, food and beverages provides certain benefits in comparison to traditional restaurant concepts, as reflected by our average store revenues of $10.1 million and average Store-level EBITDA margins of 25.9% for comparable stores in fiscal 2013. Our entertainment offerings have low variable costs and produced gross margins of 85.4% for fiscal 2013. With approximately half of our revenues from entertainment, we have less exposure than traditional restaurant concepts to food costs, which represented only 8.6% of our revenues in fiscal 2013. Our business model generates strong cash flow that we can use to execute our growth strategy. We believe the combination of our Store-level EBITDA margins, our refined new store formats and the fact that our stores open with high volumes that drive margins in year one will help us achieve our targeted average year one cash-on-cash returns of approximately 35% and five-year average cash-on-cash returns in excess of 25% for both our large format and small format store openings, although there is no guarantee such results will occur. The 15 stores that we have opened since the beginning of 2008 (that have been open for more than 12 months as of August 3, 2014) have generated average year one cash-on-cash returns of 42.9%. For stores opened since 2009 that have been open for more than 12 months, we have also experienced an increase in average year one cash-on-cash returns, by vintage, including our six stores opened in fiscal 2011 and fiscal 2012, which have generated average year one cash-on-cash returns of 52.4%.
Commitment to Customer Satisfaction. We aim to enhance our combination of food, beverage and entertainment offerings through our service philosophy of providing a high quality and consistent customer experience through dedicated training and development of our team members and a corporate culture that encourages employee engagement. As a result, we have experienced significant improvement in our Guest Satisfaction Survey results since we began the surveys in 2007. In 2013, 82.0% of respondents to our Guest Satisfaction Survey rated us “Top Box” (score of 5 out of a possible 5) in “Overall Experience” and 83.8% of respondents rated us “Top Box” in “Intent to Recommend.” By comparison, in 2007, 44.0% of respondents rated us “Top Box” in “Overall Experience” and 64.8% of respondents rated us “Top Box” in “Intent to Recommend.” We utilize our loyalty program to market directly to members with promotional emails and location-based marketing. Through our loyalty program, we email offers and coupons to members and notify them of new games, food, drinks and local events. In addition, members can earn game play credits based on the dollar amount of qualifying purchases at our stores. We expect that as our loyalty program grows it will be an important method of maintaining customers’ connection with our brand and further drive customer satisfaction.
Experienced Management Team. We believe we are led by a strong senior management team averaging over 25 years of experience with national brands in all aspects of casual dining and entertainment operations. In 2006, we hired our Chief Executive Officer, Stephen King. From fiscal 2006 to the twelve months ended August 3, 2014, under the leadership of Mr. King, Adjusted EBITDA has grown by 111.4%, Adjusted EBITDA margins have increased by approximately 780 basis points and employee turnover and customer satisfaction metrics have improved significantly. Our management team has invested approximately $4.0 million of cash in the equity of Dave & Buster’s and currently owns 2.7% of our outstanding common stock. We believe that our management team’s prior experience in the restaurant and entertainment industries combined with its experience at Dave & Buster’s provides us with insights into our customer base and enables us to create the dynamic environment that is core to our brand.
Our Growth Strategies
The operating strategy that underlies the growth of our concept is built on the following key components:
Pursue New Store Growth. We will continue to pursue what we believe to be a disciplined new store growth strategy in both new and existing markets where we feel we are capable of achieving consistently high store revenues and
75
Table of Contents
Store-level EBITDA margins as well as strong cash-on-cash returns. We believe that the Dave & Buster’s brand is currently significantly under-penetrated, as internal studies and third-party research suggests a total store potential in the United States and Canada in excess of 200 stores (including our 69 existing stores), approximately three times our current store base. We believe our new store opportunity is split fairly evenly between large format and small format stores. We plan to open seven to eight stores in fiscal 2014, including four stores we have already opened, which we expect will be financed with available cash and operating cash flows. Thereafter, we believe that we can continue opening new stores at an annual rate of approximately 10% of our then existing store base.
Our new store expansion strategy is driven by a site selection process that allows us to evaluate and select the location, size and design of our stores based on consumer research and analysis of operating data from sales in our existing stores. Our site selection process and flexible store design enable us to customize each store with the objective of maximizing return on capital given the characteristics of the market and the location. Our large format stores are 30,001 to 45,000 square feet in size and our small format stores span 25,000 to 30,000 square feet, which provides us the flexibility to enter new smaller markets and further penetrate existing markets. These formats also provide us with the ability to strategically choose between building new stores and converting existing space, which can be more cost efficient for certain locations. We are targeting average year one cash-on-cash returns of approximately 35% for both our large format and small format stores. To achieve this return for large format stores, we target average net development costs of approximately $8.3 million and first year store revenues of approximately $11.6 million. For small format stores, we target average net development costs of approximately $6.0 million and average first year store revenues of approximately $7.5 million. Additionally, we target average year one Store-level Adjusted EBITDA margins, excluding allocated national marketing costs, of approximately 28%, for both large format and small format stores.
Grow Our Comparable Store Sales. We intend to grow our comparable store sales by seeking to differentiate the Dave & Buster’s brand from other food and entertainment alternatives, through the following strategies:
| n | Provide our customers the latest exciting games. We believe that our Midway games are the core differentiating feature of the Dave & Buster’s brand, and staying current with the latest offerings creates new content and excitement to drive repeat visits and increase length of customer stay. We plan to continue to update approximately 10% of our games each year and seek to buy games that will resonate with our customers and drive brand relevance due to a variety of factors, including their large scale, eye-catching appearance, virtual reality features, association with recognizable brands or the fact that they cannot be easily replicated at home. We aim to leverage our investment in games by packaging our new game introductions and focusing our marketing spending to promote these events. We also plan to continually elevate the redemption experience in our “Winner’s Circle” with prizes that we believe customers will find more attractive, which we expect will favorably impact customer visitation and game play. |
| n | Leverage D&B Sports. In 2010, we initiated a program to improve our sports-viewing as part of our strategy to enhance our entertainment offering and increase customer traffic and frequency by creating another reason to visit Dave & Buster’s. This initiative evolved into the D&B Sports concept which has been incorporated into all new stores opened since the beginning of fiscal 2013 and will continue to be incorporated into all new stores. In the fall of 2013, we launched a national advertising campaign for D&B Sports promoting Dave & Buster’s as the “only place to watch the games and play the games.” We intend to continue leveraging our investments in D&B Sports by building awareness of Dave & Buster’s as “the best place to watch sports” through national cable advertising. In addition, we are strategically expanding our year-round sporting and pay-per-view content to drive increased traffic and capture a higher share of the sports-viewing customer base. |
| n | Food and beverage offerings with broad appeal. Our menu has a variety of items, from hamburgers to steaks to seafood, that represent our “Fun American New Gourmet” strategy. We aim to ensure a pipeline for three new product launches each year, aligning with the timing of our new game launches. This strategy has been well received by our customers as the percentage of customers rating our food quality as “Excellent” was 79.6% in fiscal 2013, an increase of 480 basis points compared to fiscal 2011, and an increase of 4,170 basis points since fiscal 2007. Similarly, the percentage of customers rating our beverage quality as “Excellent” in fiscal 2013 was 82.3%, an increase of 490 basis points compared to fiscal 2011, and an increase of 4,250 basis points since fiscal 2007. |
| n | Grow our special events usage. The special events portion of our business represented 12.3% of our total revenues in fiscal 2013. We believe our special events business is an important sampling and promotional |
76
Table of Contents
| opportunity for our customers because many customers are experiencing Dave & Buster’s for the first time. We plan to leverage our existing special events sales force and call center to attract new corporate customers. In addition, we introduced online booking for social parties in order to provide additional convenience in booking events for our customers and look to expand its functionality over time. |
| n | Enhance brand awareness and generate additional visits to our stores through marketing and promotions. We believe offering new items from each of the “Eat Drink Play and Watch” pillars will keep the brand relevant to customers and drive traffic and frequency. We have identified five key promotional periods throughout the year when we feature this “New News” in national advertising. To increase national awareness of our brand, we plan to continue to invest a significant portion of our marketing expenditures in national cable television and radio advertising focused on promoting our capital investments in new games, D&B Sports and new food and beverage offerings. We also have customized local store marketing programs to increase new visits and repeat visits to individual locations. We will continue to utilize our loyalty program and digital efforts to communicate promotional offers directly to our most passionate brand fans, and we are aggressively optimizing our search engine and social marketing efforts. We also leverage our investments in technology across our marketing platform, including in-store marketing initiatives to drive incremental sales throughout the store. |
| n | Drive Customer Frequency Through Greater Digital and Mobile Connectivity. We believe that there is a significant potential to increase customer frequency by enhancing the in-store and out-of-store customer experience via digital and mobile strategic initiatives as well as through implementing enhanced technology. We intend to leverage our growing loyalty database as well as continue to invest in mobile game systems (game applications for mobile devices, such as smartphones and tablets), second screen sports-watching apps (applications for mobile devices, allowing our customers to enhance their sports-watching experience by, for example, accessing information about the live sporting event being watched or by playing along with the live sporting event) and social games (game applications that allow our customers to play online together, whether competitively or cooperatively) to create customer connections and drive recurring customer visitation. |
Expand the Dave & Buster’s Brand Internationally. We believe that in addition to the growth potential that exists in North America, the Dave & Buster’s brand can also have significant appeal in certain international markets. We are currently assessing these opportunities while maintaining a conservative and disciplined approach towards the execution of our international development strategy. As such, we have retained the services of a third-party consultant to assist in identifying and prioritizing potential markets for expansion as well as potential franchise or joint venture partners. Thus far, we have identified our top five international market priorities and begun the process of identifying potential international partners within select markets. The market priorities were developed based on a specific set of criteria to ensure we expand our brand into the most attractive markets. Our goal is to sign an agreement with our first international partner by the end of fiscal 2014, and we are targeting our first international opening outside of Canada in 2016.
Site Selection
We believe that the location of stores is critical to our long-term success. In 2012, we made strategic additions to our development team to better align our resources with our new store model and growth strategy. The prior experience and relationships of our current development team has enabled us to focus our attention on the most relevant network of real estate brokers, which has given us access to a larger pool of qualified potential store sites. In addition, we believe the more contemporary look of our stores has been one of the key drivers in attracting new developers and building our new store pipeline. We have also improved our site selection, design and approval process. We devote significant time and resources to strategically analyze each prospective market, trade area and site. We continually identify, evaluate and update our database of potential locations for expansion. We have recently conducted extensive demographic and market analyses to determine the key drivers of successful new store performance. We base new site selection on an analytical evaluation of a set of drivers we believe increase the probability of successful, high-volume stores.
During fiscal 2014 to date, we opened four new stores utilizing our large format design in Westchester, California (1st quarter), Vernon Hills, Illinois (1st quarter), Panama City Beach, Florida (2nd quarter) and Los Angeles, California (3rd quarter).
77
Table of Contents
During fiscal 2013, we opened two stores utilizing our small format design in Syracuse, New York (3rd quarter) and Cary, North Carolina (4th quarter). We also opened three stores utilizing our large format design in Virginia Beach, Virginia (2nd quarter), Albany, New York (3rd quarter) and Livonia, Michigan (4th quarter).
During fiscal 2012, we opened three stores utilizing our small format design in Oklahoma City, Oklahoma (1st quarter), Orland Park, Illinois (3rd quarter) and Boise, Idaho (4th quarter). We also opened a store utilizing our large format design in Dallas, Texas (4th quarter), which replaced an existing large format store in the same trade area.
During fiscal 2011, we opened two stores utilizing our large format design in Orlando, Florida (2nd quarter) and Braintree, Massachusetts (4th quarter). We also reopened our store in Nashville, Tennessee (4th quarter), which had been closed since May 2, 2010 due to a flood.
Our Store Formats
We have historically operated stores varying in size from 16,000 to 66,000 square feet. In order to optimize sales per square foot and further enhance our store economics, the target size of our future large format stores is expected to be between 30,001 and 45,000 square feet. We may take advantage of local market and economic conditions to open stores that are larger or smaller than this target size. To accomplish this, we have reduced the back-of-house space, and optimized the sales area allocated to billiards and other traditional games in favor of space dedicated to more profitable redemption and simulation games. As a result, we expect to generate significantly higher sales per square foot than the average of our current store base, although there is no guarantee that this will occur.
To facilitate further growth of our brand, we have developed a small store format specifically designed to penetrate less densely populated markets and backfill existing markets. In addition to more square footage as compared to our small format stores, our large format store offers billiard tables and a larger special events space. All of the other components of the large format store are present in the small format store but have been proportionately reduced to meet the building dimensions. We opened our initial new small store format in Tulsa, Oklahoma in January 2009. Since the initial small store format opening, we have subsequently opened eight additional small store formats: two in fiscal 2009, one in fiscal 2010, three in fiscal 2012 and two in fiscal 2013. We believe that the small store format will maintain the dynamic customer experience that is the foundation of our brand and allow us flexibility in our site selection process. We also believe that the small store format will allow us to take less capital investment risk per store. As a result, we expect these smaller format stores to achieve our target returns and achieve more efficient sales per square foot, and enable us to expand into additional markets. We anticipate that roughly half of our new store openings will be large format and half will be small format.
We have completed major remodel projects at 20 locations as of September 2, 2014 (one in fiscal 2011, nine in fiscal 2012, seven in fiscal 2013 and three in fiscal 2014). Our focus in the remodeling initiative is to introduce D&B Sports and modernize the exteriors, front lobbies, bars, dining areas and “Winner’s Circle.” We have received positive customer feedback related to the remodel projects completed to date.
Our stores are located on land that is leased. Our lease terms, including renewal options, range from 10 to 40 years. Our leases typically provide for a minimum annual rent plus contingent rent to be determined as a percentage of the applicable store’s annual gross revenues. Forty-six of our leases include provisions for contingent rent and most have measurement periods that differ from our fiscal year. As of August 3, 2014, only 17 locations had revenues that exceeded their pro-rata contingent rent revenue threshold. Generally, leases are “net leases” that require us to pay our pro rata share of taxes, insurance and maintenance costs.
Marketing, Advertising and Promotion
Our corporate marketing department manages all consumer-focused initiatives for the Dave & Buster’s brand. In order to drive sales and expand our customer base, we focus our efforts in three key areas:
| n | Marketing: national advertising, media, promotions, in-store merchandising, pricing, local and digital marketing programs |
| n | Food and beverage: menu and product development, in-store execution |
| n | Customer insights: research, brand health and tracking |
78
Table of Contents
We spent $27.5 million in marketing efforts in fiscal 2013, $28.5 million in marketing efforts in fiscal 2012 and $26.6 million in fiscal 2011. Our annual marketing expenditures include the cost of national television and radio advertising media totaling $18.6 million, $18.9 million and $17.9 million in fiscal years 2013, 2012 and 2011, respectively. We have improved marketing effectiveness through a number of initiatives. Over the last three years, we:
| n | refined our marketing strategy to better reach both young adults and families; |
| n | created new advertising campaigns; |
| n | invested in menu research and development to differentiate our food and beverage offerings from our competition and improve key product attributes (quality, consistency, value and overall customer satisfaction) and execution; |
| n | developed product/promotional strategies to attract new customers and increase spending/length of stay; |
| n | invested more in our customer loyalty program to create stronger relationships with consumers; and |
| n | defined a consistent brand identity that reflects our quality, heritage and energy. |
To drive traffic and increase visit frequency and average check size, the bulk of our marketing budget is allocated to our national cable television media. To enhance that effort, we also develop:
| n | local marketing plans, including radio and out-of-home; |
| n | in-store promotions and point-of-purchase materials; |
| n | customer loyalty programs, including promotional and trigger emails; and |
| n | digital programs, including social, search, website, mobile and display. |
We work with external advertising, digital, media and design agencies in the development and execution of these programs.
Special Event Marketing
Our corporate and group sales programs are managed by our sales department, which provides direction, training and support to the special events managers and their teams within each location. They are supported by a Special Events Sales Center located at our Corporate Office, targeted print and online media plans, as well as promotional incentives at appropriate times during the year. In addition, we introduced online booking for social parties in order to provide additional convenience in booking events for our customers.
Operations
Management
The management of our store base is divided into eight regions, each of which is overseen by a Regional Operations Manager, Regional Operations Director or Regional Vice President who reports to the President and Chief Operating Officer. Our Regional Operations Directors oversee five to thirteen Company-owned stores each, which we believe enables them to better support the General Managers and achieve sales and profitability targets for each store within their region. In addition, we have one Regional Operations Director whose primary focus is on new store openings.
Our typical store team consists of a General Manager supported by an average of nine additional management positions. There is a defined structure of development and progression of job responsibilities from Area Operations Manager through various positions up to the General Manager role. This structure ensures that an adequate succession plan exists within each store. Each management member handles various departments within the location including responsibility for hourly employees. A typical store employs approximately 140 hourly employees, many of whom work part time. The General Manager and the management team are responsible for the day-to-day operation of that store, including the hiring, training and development of team members, as well as financial and operational performances. Our stores are generally open seven days a week, from 11:30 a.m. to midnight on Sunday through Thursday and 11:30 a.m. to 2:00 a.m. on Friday and Saturday.
Operational Tools and Programs
We utilize a customized food and beverage analysis program that determines the theoretical food and beverage costs for each store and provides additional tools and reports to help us identify opportunities, including waste
79
Table of Contents
management. We perform weekly “test drives” on our games to ensure that our amusement offerings are consistent with Dave & Buster’s standards and are operational. Consolidated reporting tools for key drivers of our business exist for our Regional Operations Directors to be able to identify and troubleshoot any systemic issues.
Management Information Systems
We utilize a number of proprietary and third-party management information systems. These systems are designed to enable our games’ functionality, improve operating efficiencies, provide us with timely access to financial and marketing data and reduce store and corporate administrative time and expense. We believe our management information systems are sufficient to support our store expansion plans.
Training
We strive to maintain quality and consistency in each of our stores through the careful training and supervision of our team members and the establishment of, and adherence to, high standards relating to personnel performance, food and beverage preparation, game playability and maintenance of our stores. We provide all new team members with complete orientation and one-on-one training for their positions to help ensure they are able to meet our high standards. All of our new team members are trained by partnering with a certified trainer to assure that the training and information they receive is complete and accurate. Team members are certified for their positions by passing a series of tests, including alcohol awareness training.
We require our new store managers to complete an eight-week training program that includes front-of-house service, kitchen, amusements and management responsibilities. Newly trained managers are then assigned to their home store where they receive additional training with their General Manager. We place a high priority on our continuing management development programs in order to ensure that qualified managers are available for our future openings. We conduct semi-annual evaluations with each manager to discuss prior performance and future performance goals. We hold an annual General Manager conference in which our General Managers share best practices and also receive an update on our business plan.
When we open a new store, we provide varying levels of training to team members in each position to ensure the smooth and efficient operation of the store from the first day it opens to the public. Prior to opening a new store, our dedicated training and opening team travels to the location to prepare for an intensive two week training program for all team members hired for the new store opening. Part of the training team stays on site during the first week of operation. We believe this additional investment in our new stores is important, because it helps us provide our customers with a quality experience from day one.
After a store has been opened and is operating smoothly, the managers supervise the training of new team members.
Recruiting and Retention
We seek to hire experienced restaurant managers and team members, and offer competitive wage and benefit programs. Our store managers all participate in a performance based incentive program that is based on sales and profit goals. In addition, our salaried and hourly employees are also eligible to participate in a 401(k) plan, medical/dental/vision insurance plans and receive vacation/paid time off based on tenure.
Food Preparation, Quality Control and Purchasing
We strive to maintain high food quality standards. To ensure our quality standards are met, we negotiate directly with independent producers of food products. We provide detailed quality and yield specifications to suppliers for our purchases. Our systems are designed to protect the safety and quality of our food supply throughout the procurement and preparation process. Within each store, the Kitchen Manager is primarily responsible for ensuring the timely and correct preparation of food products, per the recipes we specify. We provide each of our stores with various tools and training to facilitate these activities.
Foreign Operations
We own and operate one store outside of the United States, in Toronto, Canada. This store generated revenue of approximately $10.6 million USD in fiscal 2013, $11.0 million USD in fiscal 2012 on a 52 week basis and $10.7 million USD in fiscal 2011, representing approximately 1.7%, 1.8% and 1.5%, respectively, of our consolidated revenue. As of February 2, 2014, less than 1.2% of our long-lived assets were located outside of the United States. Additionally, our lone franchise store located in Niagara Falls, Ontario, Canada which opened on June 25, 2009 ceased operations as Dave & Buster’s on May 31, 2013. This change and the associated termination
80
Table of Contents
of the related franchise and development agreements did not have a material impact on our financial position or results of operations.
The foreign activities are subject to various risks of doing business in a foreign country, including currency fluctuations, changes in laws and regulations and economic and political stability. We do not believe there is any material risk associated with the Canadian operations or any dependence by the domestic business upon the Canadian operations.
Store-Level Quarterly Fluctuations and Seasonality
We expect seasonality to be a factor in the operation or results of the business in the future with higher first and fourth quarter revenues associated with the spring and year-end holidays. These quarters will continue to be susceptible to the impact of severe weather on customer traffic and sales during that period. Our third quarter, which encompasses the back-to-school fall season, has historically had lower revenues as compared to the other quarters.
Suppliers
The principal goods used by us are redemption game prizes and food and beverage products, which are available from a number of suppliers. We have expanded our contacts with amusement merchandise suppliers through the direct import program, a program in which we purchase “Winner’s Circle” merchandise and certain glassware, plateware and furniture directly from offshore manufacturers. We are a large buyer of traditional and amusement games and as a result believe we receive discounted pricing arrangements. Federal and state health care mandates and mandated increases in the minimum wage and other macro-economic pressures could have the repercussion of increasing expenses, as suppliers may be adversely impacted and seek to pass on higher costs to us.
Competition
The out-of-home entertainment market is highly competitive. We compete for customers’ discretionary entertainment dollars with theme parks, as well as providers of out-of-home entertainment, including localized attraction facilities such as movie theaters, sporting events, bowling alleys and night clubs and restaurants. We also face competition from local establishments that offer entertainment experiences similar to ours and restaurants that are highly competitive with respect to price, quality of service, location, ambience and type and quality of food. Some of these establishments may exist in multiple locations, and we may also face competition on a national basis in the future from other concepts that are similar to ours. We also face competition from increasingly sophisticated home-based forms of entertainment, such as internet and video gaming and home movie delivery.
Intellectual Property
We have registered the trademarks Dave & Buster’s®, Power Card®, Eat & Play Combo® and Eat Drink Play®, and have registered or applied to register certain additional trademarks with the United States Patent and Trademark Office and in various foreign countries. We consider our trade name and our logo to be important features of our operations and seek to actively monitor and protect our interest in this property in the various jurisdictions where we operate. We also have certain trade secrets, such as our recipes, processes, proprietary information and certain software programs that we protect by requiring all of our employees to sign a code of ethics, which includes an agreement to keep trade secrets confidential.
Employees
As of September 2, 2014, we employed 11,040 persons, 186 of whom served at our corporate headquarters, 711 of whom served as management personnel and the remainder of whom were hourly personnel.
None of our employees are covered by collective bargaining agreements and we have never experienced an organized work stoppage, strike or labor dispute. We believe working conditions and compensation packages are competitive with those offered by competitors and consider our relations with our employees to be good.
Legal Proceedings
We are subject to certain legal proceedings and claims that arise in the ordinary course of our business, including intellectual property disputes and miscellaneous premises liability and dram shop claims. In the opinion of management, based upon consultation with legal counsel, the amount of ultimate liability with respect to, or an adverse outcome in any such legal proceedings or claims will not materially affect our business, the consolidated results of our operations or our financial condition.
81
Table of Contents
Properties
As of September 2, 2014, we lease the building or site of all 69 company-owned stores. Our lone franchised store operating in Canada ceased operations as Dave & Buster’s on May 31, 2013. We had no financial obligation relating to the franchisee’s property. We permanently closed our Kensington/Bethesda, Maryland location on August 12, 2014. The following table sets forth the number of stores that are located in each state/country as of September 2, 2014.
| LOCATION/MARKET |
SQUARE FOOTAGE |
LOCATION/MARKET |
SQUARE FOOTAGE |
|||||||
| Phoenix, AZ |
65,000 | Cary, NC (Raleigh) |
30,000 | |||||||
| Tempe, AZ (Phoenix) |
50,000 | Concord, NC (Charlotte) |
53,000 | |||||||
| Irvine, CA (Los Angeles) |
55,000 | Omaha, NE |
29,000 | |||||||
| Westchester, CA (Los Angeles) |
40,000 | Albany, NY |
33,000 | |||||||
| Milpitas, CA (San Jose) |
64,000 | Williamsville, NY (Buffalo) |
37,000 | |||||||
| Ontario, CA (Los Angeles) |
60,000 | Farmingdale, NY (Long Island) |
60,000 | |||||||
| Orange, CA (Los Angeles) |
58,000 | Islandia, NY (Long Island) |
48,000 | |||||||
| Roseville, CA (Sacramento) |
17,000 | Syracuse, NY |
27,000 | |||||||
| San Diego, CA |
44,000 | West Nyack, NY (Palisades) |
49,000 | |||||||
| Arcadia, CA (Los Angeles) |
50,000 | New York, NY |
33,000 | |||||||
| Los Angeles, CA |
35,000 | Westbury, NY (Long Island) |
46,000 | |||||||
| Denver, CO |
48,000 | West Lake, OH (Cleveland) |
58,000 | |||||||
| Westminster, CO (Denver) |
40,000 | Hilliard, OH (Columbus) |
38,000 | |||||||
| Hollywood, FL (Miami) |
58,000 | Polaris, OH (Columbus) |
17,000 | |||||||
| Jacksonville, FL |
40,000 | Springdale, OH (Cincinnati) |
64,000 | |||||||
| Orlando, FL |
46,000 | Oklahoma City, OK |
24,000 | |||||||
| Miami, FL |
60,000 | Tulsa, OK |
17,000 | |||||||
| Panama City Beach, FL |
40,000 | Franklin Mills, PA (Philadelphia) |
60,000 | |||||||
| Marietta, GA (Atlanta) |
59,000 | Philadelphia, PA |
65,000 | |||||||
| Duluth, GA (Atlanta) |
57,000 | Homestead, PA (Pittsburgh) |
60,000 | |||||||
| Lawrenceville, GA (Atlanta) |
61,000 | Plymouth Meeting, PA (Philadelphia) |
41,000 | |||||||
| Honolulu, HI |
44,000 | Providence, RI |
40,000 | |||||||
| Boise, ID |
25,000 | Nashville, TN |
57,000 | |||||||
| Addison, IL (Chicago) |
50,000 | Arlington, TX (Dallas) |
33,000 | |||||||
| Chicago, IL |
58,000 | Austin, TX |
40,000 | |||||||
| Orland Park, IL (Chicago) |
24,000 | Dallas, TX |
45,000 | |||||||
| Vernon Hills, IL (Chicago) |
40,000 | Frisco, TX (Dallas) |
50,000 | |||||||
| Indianapolis, IN |
33,000 | Houston I, TX |
53,000 | |||||||
| Kansas City, KS |
49,000 | Houston II, TX |
66,000 | |||||||
| Braintree, MA (Boston) |
35,000 | San Antonio, TX |
50,000 | |||||||
| Hanover, MD (Baltimore) |
64,000 | Glen Allen, VA (Richmond) |
16,000 | |||||||
| Livonia, MI (Detroit) |
41,000 | Virginia Beach, VA |
42,000 | |||||||
| Utica, MI (Detroit) |
56,000 | Wauwatosa, WI (Milwaukee) |
34,000 | |||||||
| Maple Grove, MN (Minneapolis) |
32,000 | Toronto, Canada |
60,000 | |||||||
| St. Louis, MO |
55,000 | |||||||||
All of our stores are located on land that is leased. The contracted lease terms, including renewal options, generally range from 20 to 40 years. Our leases typically provide for a minimum annual rent plus contingent rent to be determined as a percentage of the applicable store’s annual gross revenues. We currently pay contingent rent in 17 of our stores. Generally, leases are “net leases” that require us to pay our pro rata share of taxes, insurance and maintenance costs. Our current store lease in Farmingdale, New York (Long Island) expires in February 2015 without an option to renew. Our current store leases in Franklin Mills, Pennsylvania (Philadelphia) and Concord, North Carolina (Charlotte) will expire in 2019, and we do not have any remaining options to extend the lease terms. All of our other leases include renewal options that give us the opportunity to extend the lease terms beyond 2019.
In addition to our leased stores, we lease a 47,000 square foot office building and 30,000 square foot warehouse facility in Dallas, Texas for use as our corporate headquarters and distribution center. This lease expires in October 2021, with options to renew until October 2041. We also lease a 31,000 square foot warehouse facility in Dallas, Texas for use as additional warehouse space. This lease will expire in January 2019, with options to renew until January 2028.
82
Table of Contents
Directors, Executive Officers and Other Key Employees
The following table sets forth information regarding our directors and executive officers as of September 2, 2014. Executive officers serve at the request of the Board of Directors.
| NAME |
AGE | POSITION | ||||
| Stephen M. King |
56 | Chief Executive Officer and Director | ||||
| Kevin Bachus |
46 | Senior Vice President of Entertainment and Game Strategy | ||||
| Dolf Berle |
51 | President and Chief Operating Officer | ||||
| Joe DeProspero |
40 | Vice President Finance | ||||
| Sean Gleason |
49 | Senior Vice President and Chief Marketing Officer | ||||
| Brian A. Jenkins |
52 | Senior Vice President and Chief Financial Officer | ||||
| Margo L. Manning |
49 | Senior Vice President of Human Resources | ||||
| Michael J. Metzinger |
57 | Vice President—Accounting and Controller | ||||
| John B. Mulleady |
53 | Senior Vice President of Real Estate and Development | ||||
| J. Michael Plunkett |
63 | Senior Vice President of Purchasing and International Operations | ||||
| Jay L. Tobin |
56 | Senior Vice President, General Counsel and Secretary | ||||
| J. Taylor Crandall |
60 | Director | ||||
| Michael J. Griffith (1)(2) |
57 | Director | ||||
| Jonathan S. Halkyard (1)(2) |
49 | Director | ||||
| David A. Jones (4) |
64 | Director | ||||
| Alan J. Lacy (1)(3)(7) |
60 | Chairman of the Board of Directors | ||||
| Kevin M. Mailender (3) |
36 | Director | ||||
| Kevin M. Sheehan (5) |
61 | Director | ||||
| Tyler J. Wolfram (1)(6) |
48 | Director | ||||
| (1) | Member of the Compensation Committee |
| (2) | Member of the Audit Committee |
| (3) | Member of the Nominating and Corporate Governance Committee |
| (4) | Chair of the Compensation Committee |
| (5) | Chair of the Audit Committee |
| (6) | Chair of the Nominating and Corporate Governance Committee |
| (7) | Lead Independent Director |
Set forth below is biographical information regarding our directors and executive officers:
Stephen M. King has served as our Chief Executive Officer and Director since September 2006. From March 2006 until September 2006, Mr. King served as our Senior Vice President and Chief Financial Officer. From 1984 to 2006, he served in various capacities for Carlson Restaurants Worldwide Inc., a company that owns and operates casual dining restaurants worldwide, including Chief Financial Officer, Chief Administrative Officer, Chief Operating Officer and, most recently, as President and Chief Operating Officer of International. Mr. King brings substantial industry, financial and leadership experience to our Board of Directors.
Kevin Bachus has served as our Senior Vice President of Entertainment and Games Strategy since November 2012. Previously, he served as Chief Product Officer of Bebo, Inc., an international social networking site, from September 2010 to November 2012, Executive Vice President and Chief Product Officer of IMO Entertainment LLC, from May 2009 to August 2010, Senior Vice President and Chief Architect of Virrata Games, Inc./PlayDay TV from March 2008 to April 2009, Chief Executive Officer of Uprising Studios from November 2006 to March 2008, Chief Executive Officer of Nival Interactive, Inc. from December 2005 to November 2006, Chief Executive Officer and President of Infinium Labs, Inc. from January 2004 to November 2005, Vice President of Publishing of Capital Entertainment Group, Inc. from October 2001 to September 2003, Director of Third Party Relations-Xbox of Microsoft Corporation from September 1999 to May 2001 and Group Product Manager-DirectX of Microsoft Corporation from June 1997 to September 1999.
83
Table of Contents
Dolf Berle has served as our President and Chief Operating Officer since February 2011. From August 2009 until January 2011, Mr. Berle served as Executive Vice President of Hospitality and Business and Sports Club Division Head for ClubCorp USA, Inc., the largest owner and operator of golf, country club and business clubs. Previously, Mr. Berle served as President of Lucky Strike Entertainment, an upscale chain of bowling alleys, from December 2006 to July 2009 and Chief Operating Officer of House of Blues Entertainment, Inc., a chain of live music venues, from April 2004 to December 2006.
Joe DeProspero has served as our Vice President of Finance since May 2010. Previously, he served as our Assistant Vice President of Finance from August 2006 to May 2010. Mr. DeProspero served as Director of Financial Analysis for Arby’s Restaurant Group, a company that owns and operates quick-serve sandwich restaurants, from 2005 to 2006 and for Carlson Restaurants Worldwide, Inc., a company that owns and operates casual dining restaurants worldwide, from 2001 to 2005.
Sean Gleason has served as our Senior Vice President and Chief Marketing Officer since August 2009. From June 2005 until October 2008, Mr. Gleason was the Senior Vice President of Marketing Communications at Cadbury Schweppes where he led initiatives for brands such as Dr Pepper, 7UP and Snapple. From May 1995 until May 2005, he served in various capacities (most recently as Vice President, Advertising/Media/Brand Identity) at Pizza Hut for Yum! Brands, the world’s largest restaurant company.
Brian A. Jenkins has served as our Senior Vice President and Chief Financial Officer since December 2006. From 1996 until August 2006, he served in various capacities (most recently as Senior Vice President—Finance) at Six Flags, Inc., an amusement park operator.
Margo L. Manning has served as our Senior Vice President of Human Resources since November 2010. Previously, she served as our Senior Vice President of Training and Special Events from September 2006 until November 2010, our Vice President of Training and Sales from June 2005 until September 2006 and as Vice President of Management Development from September 2001 until June 2005. From December 1999 until September 2001, she served as our Assistant Vice President of Team Development, and from 1991 until December 1999, she served in various positions of increasing responsibility for us and our predecessors.
Michael J. Metzinger has served as our Vice President—Accounting and Controller since January 2005. From 1986 until January 2005, Mr. Metzinger served in various capacities (most recently as Executive Director—Financial Reporting) at Carlson Restaurants Worldwide, Inc., a company that owns and operates casual dining restaurants worldwide.
John B. Mulleady has served as our Senior Vice President of Real Estate and Development since April 2012. Mr. Mulleady had been Senior Vice President, Director of Real Estate of BJ’s Wholesale Club, Inc. a leading operator of warehouse clubs in the eastern United States, from June 2008 to April 2012. Previously, Mr. Mulleady served as Vice President of Real Estate at Circuit City Stores, Inc., a consumer electronics retailer, from February 2006 to June 2008.
J. Michael Plunkett has served as our Senior Vice President of Purchasing and International Operations since September 2006. Previously, he served as our Senior Vice President—Food, Beverage and Purchasing/Operations Strategy from June 2003 until June 2004 and from January 2006 until September 2006. Mr. Plunkett also served as Senior Vice President of Operations for Jillian’s from June 2004 to January 2006, as Vice President of Kitchen Operations from November 2000 until June 2003, as Vice President of Information Systems from November 1996 until November 2000 and as Vice President and Director of Training from November 1994 until November 1996. From 1982 until November 1994, he served in operating positions of increasing responsibility for us and our predecessors.
Jay L. Tobin has served as our Senior Vice President, General Counsel and Secretary since May 2006. From 1988 to 2005, he served in various capacities (most recently as Senior Vice President and Deputy General Counsel) at Brinker International, Inc., a company that owns and operates casual dining restaurants worldwide.
J. Taylor Crandall is a founding Managing Partner of Oak Hill Capital Management, LLC and has been with the firm and its predecessor entities since 1986. He has senior responsibility for originating, structuring and managing
84
Table of Contents
investments in Oak Hill Capital Management, LLC’s Media and Communications sector. Mr. Crandall has also served as Chief Operating Officer of Keystone, Inc., the primary investment vehicle for Robert M. Bass. Prior to joining Oak Hill, Mr. Crandall was Vice President with First National Bank of Boston. Mr. Crandall serves on the Board of Directors of SWS Group, Inc. (a full-service securities and banking firm), subsidiaries of Firth Rixson Limited (a privately-held owner aluminum parts manufacturer), Intermedia.net, Inc. (a privately-held provider of cloud services to small and mid-size businesses), WaveDivision Holdings, LLC (a privately-held, business-class fiber optic and broadband services company), and Viawest, Inc. (a privately-held data center, managed services and cloud provider). Mr. Crandall is the Secretary-Treasurer of the Anne T. and Robert M. Bass Foundation, the Trustee of the Lucille Packard Foundation for Children’s Health and serves on the board of trustees of the Cystic Fibrosis Foundation, The Park City Foundation, Powdr Corporation and the U.S. Ski and Snowboard Team Foundation. Mr. Crandall has served on our Board of Directors since June 2013. Mr. Crandall brings substantial business, financial and leadership experience to our Board of Directors.
Michael J. Griffith has served as Vice Chairman of Activision Blizzard, Inc., a worldwide online, personal computer, console, handheld, and mobile game publisher since March 2010. Previously, Mr. Griffith served as President and Chief Executive Officer of Activision Publishing, Inc., prior to its merging with Blizzard Entertainment, Inc., from June 2005 to March 2010. Prior to joining Activision, Mr. Griffith served in a number of executive level positions at The Procter & Gamble Company from 1981 to 2005, including President of the Global Beverage Division from 2002 to 2005, Vice President and General Manager of Coffee Products from 1999 to 2002, and Vice President and General Manager of Fabric & Home Care—Japan and Korea and Fabric & Home Care Strategic Planning—Asia from 1997 to 1999. Mr. Griffith has served on our Board of Directors since October 2011. Mr. Griffith brings substantial industry, financial and leadership experience to our Board of Directors.
Jonathan S. Halkyard has served as Chief Operating Officer of Extended Stay America Inc., the largest owner/operator of company branded hotels in North America, since September 2013. From July 2012 to September 2013, Mr. Halkyard served as Executive Vice President and Chief Financial Officer of NV Energy, Inc., a holding company providing energy services and products in Nevada, and its wholly owned utility subsidiaries, Nevada Power Company and Sierra Pacific Power Company. Mr. Halkyard served as Executive Vice President of Caesars Entertainment Corporation (formerly known as Harrah’s Entertainment, Inc.), one of the largest casino entertainment providers in the world (“Caesars”), from July 2005 until May 2012, and Chief Financial Officer from August 2006 until May 2012. Previously, Mr. Halkyard served Caesars as Treasurer from November 2003 through July 2010, Vice President from November 2002 to July 2005, Assistant General Manager-Harrah’s Las Vegas from May 2002 until November 2002 and Vice President and Assistant General Manager-Harrah’s Lake Tahoe from September 2001 to May 2002. Mr. Halkyard has served on our Board of Directors since October 2011. Mr. Halkyard brings substantial industry, financial and leadership experience to our Board of Directors.
David A. Jones serves as a Senior Advisor to the Oak Hill Funds, and has been providing consulting services to the Oak Hill Funds and various portfolio companies since 2008. He also currently serves as a director of Pentair, Ltd. and Earth Fare, Inc. and is a trustee emeritus of Union College. From 2005 until 2007, Mr. Jones was the Chairman and Global Chief Executive Officer of Spectrum Brands, Inc., a $4.3 billion publicly traded consumer products company with operations in over 120 countries worldwide and whose brand names include Rayovac, Varta, Remington, Cutter, Tetra and over fifty other major consumer brands. From 1996 to 2005, Mr. Jones was the Chairman and Chief Executive Officer of Rayovac Corporation (the predecessor to Spectrum Brands), a $1.4 billion publicly traded global consumer products company with major product offerings in batteries, lighting, shaving/grooming, personal care, lawn and garden, household insecticide and pet supply product categories. After Mr. Jones was no longer an executive officer of Spectrum Brands, it filed a voluntary petition for reorganization under Chapter 11 of the United States Bankruptcy Code in March 2009 and exited from bankruptcy proceedings in August 2009. In aggregate, Mr. Jones has over 35 years of experience in senior leadership roles at several leading public and private global consumer products companies. Mr. Jones has served on our Board of Directors since June 2010 and serves as Chair of our Compensation Committee. He brings substantial industry, financial and leadership experience to our Board of Directors.
Alan J. Lacy serves as a Senior Advisor to the Oak Hill Funds and has been providing consulting services to the Oak Hill Funds and various portfolio companies since 2007. Mr. Lacy also currently serves as a director of Bristol-Myers Squibb Company and Earth Fare, Inc., Mr. Lacy is also currently Trustee of Fidelity Funds and a Trustee and former
85
Table of Contents
Chairman of the Board of the National Parks Conservation Association. Previously, he was Vice Chairman and Chief Executive Officer of Sears Holdings Corporation, a large broad line retailer, and Chairman and Chief Executive Officer of Sears Roebuck and Co. (“Sears”), a large retail company. During Mr. Lacy’s tenure as Chief Executive Officer of Sears, the company created significant value for shareholders by executing major restructuring and growth initiatives, including the merger of Sears and Kmart, the acquisition of Lands’ End and the sale of Sears’ credit business. Prior to that, Mr. Lacy was employed in a number of executive level positions at major retail and consumer products companies, including Sears, Kraft, Philip Morris and Minnetonka Corporation. Mr. Lacy has served on our Board of Directors since June 2010, serves as Lead Independent Director and has served as Chairman since September 2014. He brings substantial industry, financial and leadership experience to our Board of Directors.
Kevin M. Mailender is a Partner of Oak Hill Capital Management, LLC and has been with the firm since 2002. Mr. Mailender is responsible for originating, structuring and managing investments in the Consumer, Retail and Distribution sectors. He currently serves as a director of The Hillman Companies, Inc. and Earth Fare, Inc. Mr. Mailender has served on our Board of Directors since June 2010 and brings substantial financial, investment and business experience to our Board of Directors.
Kevin M. Sheehan serves as President and Chief Executive Officer of NCL Corporation Ltd., a leading global cruise line operator (“Norwegian”). Mr. Sheehan has served as President of Norwegian since August 2010 (and previously from August 2008 through March 2009) and Chief Executive Officer of Norwegian since November 2008. Mr. Sheehan also served as Chief Financial Officer of Norwegian from November 2007 until September 2010. Before joining Norwegian, Mr. Sheehan spent two and one-half years consulting to private equity firms including Cerberus Capital Management LP (2006-2007) and Clayton Dubilier & Rice (2005-2006). From August 2005 to January 2008, Mr. Sheehan served on the faculty of Adelphi University as Distinguished Visiting Professor—Accounting, Finance and Economics. Prior to that, Mr. Sheehan served a nine-year career with Cendant Corporation, most recently serving as Chairman and Chief Executive Officer of its Vehicle Services Division (including global responsibility for Avis Rent A Car, Budget Rent A Car, Budget Truck, PHH Fleet Management and Wright Express). Mr. Sheehan serves on the Board of Directors, as Chairman of the Audit Committee, and as a member of the Compensation Committee of New Media, Inc. (one of the largest publishers of locally based print and online media in the United States) and serves on the Board of Directors of XOJET, Inc. (a private aviation company). Mr. Sheehan has served on our Board of Directors since October 2011 and is the Chair of our Audit Committee. Mr. Sheehan brings substantial investment, financial and business experience to our Board of Directors.
Tyler J. Wolfram is Managing Partner of Oak Hill Capital Management, LLC and has been with the firm since 2001. He has senior responsibility for originating, structuring, and managing investments in Oak Hill Capital Management, LLC’s Consumer, Retail and Distribution sector. He currently serves as a director of The Hillman Companies, Inc. and Earth Fare, Inc. Mr. Wolfram served as Chairman of our Board of Directors from June 2010 to September 2014, and he brings substantial financial, investment and business experience to our Board of Directors.
2013 Director Compensation
The following table sets forth the information concerning all compensation paid by the Company during fiscal 2013 to our directors.
| NAME (1) |
YEAR | FEES EARNED ($) (2) |
OPTION AWARDS ($) (3) |
TOTAL ($) |
||||||||||||
| Alan J. Lacy |
2013 | 125,000 | — | 125,000 | ||||||||||||
| Kevin M. Sheehan |
2013 | 115,000 | — | 115,000 | ||||||||||||
| David A. Jones |
2013 | 110,000 | — | 110,000 | ||||||||||||
| Michael J. Griffith |
2013 | 100,000 | — | 100,000 | ||||||||||||
| Jonathan S. Halkyard |
2013 | 100,000 | — | 100,000 | ||||||||||||
| (1) | Messrs. King, Crandall, Mailender and Wolfram were omitted from the Director Compensation Table as they do not receive compensation for service on our Board of Directors. Mr. King’s compensation is reflected in the Summary Compensation Table. |
86
Table of Contents
| (2) | Reflects the annual stipend received for service on the Board of Directors during 2013. Board members are also reimbursed for out-of-pocket expenses incurred in connection with their board service. Such reimbursements are not included in this Table. There are no other fees earned for service on the Board of Directors. |
| (3) | As of the end of our 2013 fiscal year, Mr. Jones held zero vested and 822 unvested stock options, and Mr. Lacy held zero vested and 1,644 unvested stock options. All of such stock options are exercisable at a price of $1,000 per share and expire on June 1, 2020. Additionally, at the end of our 2013 fiscal year, Messrs. Sheehan, Griffith, and Halkyard each held 106.38 vested and zero unvested stock options. All of such stock options are exercisable at a price of $1,410.09 per share and expire on December 5, 2022. |
The members of our Board of Directors, other than Messrs. Griffith, Halkyard, Jones, Lacy and Sheehan, are not separately compensated for their services as directors, other than reimbursement for out-of-pocket expenses incurred in connection with rendering such services. In addition to reimbursement for out-of-pocket expenses incurred in connection with their board service, Messrs. Griffith, Halkyard, Jones, Lacy and Sheehan receive an annual stipend of $100,000 per year for serving as members of our Board of Directors. Mr. Jones receives an additional annual stipend of $10,000 for serving as Chair of our Compensation Committee. Mr. Lacy receives an additional annual stipend of $25,000 for serving as our Lead Independent Director. Mr. Sheehan receives an additional annual stipend of $15,000 for serving as Chair of our Audit Committee. Each of Messrs. Griffith, Halkyard, Jones, Lacy and Sheehan participate in the 2010 Stock Incentive Plan and has received an option grant in consideration of his service on our Board of Directors.
Following the consummation of this offering, the members of the Board of Directors will be compensated for their services as directors, through a stipend of $14,375 per quarter in cash, annual stock option grants with a value of $57,500, annual restricted stock unit grants with a value of $57,500, and reimbursement for out-of-pocket expenses incurred in connection with rendering such services for so long as they serve as directors. The Lead Independent Director in lieu of the stipend set forth above, will receive a stipend of $21,250 per quarter in cash. The chairman of the Audit Committee will receive an annual stipend of $17,500 in cash, the chairman of the Compensation Committee will receive an annual stipend of $12,500 in cash and the chairman of the Nominating and Corporate Governance Committee will receive an annual stipend of $7,500 in cash.
Stock Ownership Guidelines
We believe that, to align the long-term financial interests of our independent directors with those of our stockholders, our directors should hold a financial stake in us. Our Board of Directors adopted a policy in September 2014 requiring our independent directors to own our stock equal to a minimum of five times such director’s annual cash retainer, as well as other requirements for certain executive officers (the “Stock Ownership Guidelines”). See “Executive Compensation—Compensation Discussion and Analysis—Elements of Compensation—Stock Ownership Guidelines.” The Stock Ownership Guidelines provide that our independent directors have five years from the date of this offering or, with respect to newly elected independent directors, five years from the date of their appointment, to comply with the Stock Ownership Guidelines. For the purposes of such Stock Ownership Guidelines with respect to independent directors, stock includes (i) directly held shares of our common stock, (ii) vested and unexercised stock options, (iii) time-based restricted stock and (iv) stock beneficially owned in a trust.
Director Independence and Controlled Company Exception
Our Board of Directors has affirmatively determined that all of our directors other than our Chief Executive Officer will be independent directors under the applicable rules of NASDAQ. In addition, our Board of Directors has affirmatively determined that each member of the Audit Committee, Messrs. Griffith, Halkyard and Sheehan, satisfies the independence requirements for members of an audit committee as set forth in Rule 10A-3(b)(1) of the Exchange Act.
After completion of this offering, affiliates of the Oak Hill Funds will continue to control a majority of our outstanding common stock. As a result, we are a “controlled company” within the meaning of NASDAQ corporate governance standards. Under these rules, a “controlled company” may elect not to comply with certain NASDAQ corporate governance standards, including:
| n | the requirement that we have a nominating and corporate governance committee that is composed entirely of independent directors with a written charter addressing the committee’s purpose and responsibilities; |
| n | the requirement that we have a compensation committee that is composed entirely of independent directors with a written charter addressing the committee’s purpose and responsibilities; and |
87
Table of Contents
| n | the requirement for an annual performance evaluation of the Nominating and Corporate Governance Committee and Compensation Committee. |
Following this offering, we may elect to utilize these exemptions. In addition, as a “controlled company” we may in the future elect not to comply with the requirement that a majority of the Board of Directors consist of independent directors, although currently a majority are independent. As a result, we may not have a majority of independent directors, and our nominating and Corporate Governance Committee and Compensation Committee may not consist entirely of independent directors and such committees would not be subject to annual performance evaluations. Accordingly, our stockholders may not have the same protections afforded to shareholders of companies that are subject to all of the NASDAQ corporate governance requirements.
Corporate Governance
The Board of Directors met four times in fiscal 2013, including regular and special meetings. During this period, no individual director, from the date they became a board member, attended fewer than 75% of the aggregate of (1) the total number of meetings of the Board of Directors and (2) the total number of meetings held by all committees on which such director served.
The Board of Directors has an Audit Committee and a Compensation Committee. In connection with this offering, we intend to establish a Nominating and Corporate Governance Committee. The charters for each of these committees to be in effect after this offering will be posted on our website at www.daveandbusters.com/about-us/corporate-governance. The Board of Directors does not have a policy with regard to the consideration of any director candidates recommended by our debt holders or other parties.
The Audit Committee, comprised of Messrs. Griffith, Halkyard and Sheehan, and chaired by Mr. Sheehan, recommends to the Board of Directors the appointment of the Company’s independent auditors, reviews and approves the scope of the annual audits of the Company’s financial statements, reviews our internal control over financial reporting, reviews and approves any non-audit services performed by the independent auditors, reviews the findings and recommendations of the independent auditors and periodically reviews major accounting policies. It operates pursuant to a charter that was amended and restated in December 2006. In connection with this offering, the Board of Directors will adopt an Audit Committee charter that complies with the rules of NASDAQ. The Audit Committee held five meetings during fiscal 2013. In addition, the Board of Directors has determined that each of the members of the Audit Committee is qualified as a “financial expert” under the provisions of the Sarbanes-Oxley Act of 2002 and the rules and regulations of the SEC.
The Compensation Committee comprised of Messrs. Griffith, Halkyard, Jones, Lacy and Wolfram, and chaired by Mr. Jones, reviews the Company’s compensation philosophy and strategy, administers incentive compensation and stock option plans, reviews the Chief Executive Officer’s performance and compensation, reviews recommendations on compensation of other executive officers, and reviews other special compensation matters, such as executive employment agreements. It operates pursuant to a charter that was amended and restated in December 2006. The Compensation Committee formed a subcommittee, the Plan Subcommittee, comprised of Messrs. Griffith and Halkyard, to administer and make awards under our performance or incentive based plans and stock option or equity-based compensation plans. In connection with this offering, the Board of Directors will adopt a Compensation Committee charter that complies with the rules of NASDAQ. The Compensation Committee held four meetings during fiscal 2013.
In connection with this offering, we intend to establish a Nominating and Corporate Governance Committee, comprised of Messrs. Wolfram, Lacy and Mailender, and chaired by Mr. Wolfram, which identifies and recommends the individuals qualified to be nominated for election to the Board of Directors, recommends the member of the Board of Directors qualified to be nominated for election as its Chairperson, recommends the members and chairperson for each committee of the Board of Directors, periodically reviews and assesses our Corporate Governance Guidelines and Principles and Code of Business Conduct and Ethics and oversees the annual self-evaluation of the performance of the Board of Directors and the annual evaluation of the performance of our management. In connection with this offering, the Board of Directors will adopt a Nominating and Corporate Governance Committee charter that complies with the rules of NASDAQ. Under the stockholders’ agreement, the Oak Hill Funds have the right to nominate the members of the Nominating and Corporate Governance Committee.
88
Table of Contents
The entire Board of Directors is engaged in risk management oversight. At the present time, the Board of Directors has not established a separate committee to facilitate its risk oversight responsibilities. The Board of Directors will continue to monitor and assess whether such a committee would be appropriate. The Audit Committee assists the Board of Directors in its oversight of our risk management and the process established to identify, measure, monitor, and manage risks, in particular major financial risks. The Board of Directors receives regular reports from management, as well as from the Audit Committee, regarding relevant risks and the actions taken by management to adequately address those risks.
Our board leadership structure separates the Chairman and Chief Executive Officer roles into two positions. We established this leadership structure based on our ownership structure and other relevant factors. The Chief Executive Officer is responsible for our strategic direction and our day-to-day leadership and performance, while the Chairman of the Board provides guidance to the Chief Executive Officer and presides over meetings of the Board of the Directors. We believe that this structure is appropriate under current circumstances, because it allows management to make the operating decisions necessary to manage the business, while helping to keep a measure of independence between the oversight function of our Board of Directors and operating decisions.
Code of Business Ethics and Whistle Blower Policy
In April 2006, the Board of Directors adopted a Code of Business Ethics that applies to our directors, officers (including our Chief Executive Officer, Chief Financial Officer, Controller and other persons performing similar functions) and management employees. The Code of Business Ethics is available on our website at www.daveandbusters.com/about-us/corporate-governance/#codeofbusiness. We intend to post any material amendments or waivers of our Code of Business Ethics that apply to our executive officers on this website. In addition, our Whistle Blower Policy is available on our website at www.daveandbusters.com/about-us/corporate-governance/#whistleblower.
Communications with the Board of Directors
If security holders wish to communicate with the Board of Directors or with an individual director, they may direct such communications in care of the General Counsel, 2481 Mañana Drive, Dallas, Texas 75220. The communication must be clearly addressed to the Board of Directors or to a specific director. The Board of Directors has instructed the General Counsel to review and forward any such correspondence to the appropriate person or persons for response.
Compensation Committee Interlocks and Insider Participation
During 2013, the members of our Compensation Committee were Messrs. Griffith, Jones, Lacy, Halkyard and Wolfram. Messrs. Jones and Lacy are Senior Advisors to the Oak Hill Funds. Mr. Wolfram is a partner at Oak Hill Capital Management, LLC. We entered into an expense reimbursement agreement with Oak Hill Capital Management, LLC concurrently with the consummation of the Acquisition. The expense reimbursement agreement provides for the reimbursement of expenses of Oak Hill Capital Management, LLC. Upon the consummation of an initial public offering (including this offering), the expense reimbursement agreement will automatically terminate.
The Oak Hill Funds and their affiliates will be reimbursed for certain costs and expenses pursuant to the new stockholders’ agreement. See “Certain Relationships and Related Transactions—New Stockholders’ Agreement.”
Upon the completion of this offering, none of our executive officers will serve on the compensation committee or board of directors of any other company of which any of the members of our Compensation Committee or any of our directors is an executive officer.
89
Table of Contents
Compensation Discussion and Analysis
The Compensation Committee of our Board of Directors is responsible for establishing the compensation philosophy and ensuring each element of the compensation program encourages high levels of performance among the executive officers and positions the Company for growth. The Compensation Committee ensures our compensation program is fair, competitive, and closely aligns the interests of our executive officers with the Company’s short and long-term business objectives. Through a strategic combination of base pay, cash-based short-term incentive plans, and an equity-based long-term incentive plan, our Compensation Committee strives to reward executive officers for meeting certain strategic objectives and increasing shareholder value.
Under the leadership of the executive officers, the Company had a great deal of success in 2013, delivering strong EBITDA results, launching five new locations and continuing to strengthen the foundation required to position the Company for long-term growth. The Compensation Committee believes each component of the compensation program was effective at aligning the executive officers with the Company’s objectives and at recognizing the success the Company achieved as a result of their leadership.
This section describes our compensation program for our named executive officers (“NEOs”) for fiscal 2013. Our named executive officers are:
| n | Stephen M. King—Chief Executive Officer |
| n | John B. Mulleady—Senior Vice President of Real Estate and Development |
| n | Dolf Berle—President and Chief Operating Officer |
| n | Kevin Bachus—Senior Vice President of Entertainment and Games Strategy |
| n | Brian A. Jenkins—Senior Vice President and Chief Financial Officer |
The following discussion focuses on our compensation program and compensation-related decisions for fiscal 2013 and also addresses why we believe our compensation program supports our business strategy and operational plans. Except with respect to the disclosure set forth below under “—2014 Equity Incentive Plan” and related to awards granted in connection with this offering, all share numbers, stock options and option exercise prices in this section do not give effect to the for 1 stock split that will occur prior to the consummation of this offering.
Compensation Philosophy and Overall Objectives of Executive Compensation Programs
It is our philosophy to link executive compensation to corporate performance and to create incentives for management to enhance our value both in the short and long-term. The following objectives have been adopted by the Compensation Committee as guidelines for compensation decisions:
| n | provide a competitive total executive compensation package that enables us to attract, motivate and retain key executives; |
| n | integrate the compensation arrangements with our annual and long-term business objectives and strategy, and focus executives on the fulfillment of these objectives; |
| n | provide variable compensation opportunities that are directly linked with our financial and strategic performance; and |
| n | ensure appropriate governance of our plans to ensure they are managed appropriately and truly adding value. |
Procedures for Determining Compensation
Our Compensation Committee has the overall responsibility for designing and evaluating the salaries, incentive plan compensation, policies and programs for our NEOs. The Compensation Committee relies on input from our Chief Executive Officer regarding the NEOs’ individual performance (other than for himself) and an analysis of our corporate performance. With respect to the compensation for the Chief Executive Officer, the Compensation Committee evaluates the Chief Executive Officer’s performance and sets his compensation. With respect to our corporate performance as a factor in compensation decisions, the Compensation Committee considers, among other factors, our long-term and short-term strategic goals, revenue goals, profitability, and return to our investors.
90
Table of Contents
Our Chief Executive Officer plays a significant role in the compensation-setting process of the other NEOs. Mr. King evaluates the performance of the other NEOs and makes recommendations to the Compensation Committee concerning performance objectives and salary and bonus levels for the other NEOs. The Compensation Committee annually discusses the recommendations with the Chief Executive Officer. The Compensation Committee may, in its sole discretion, approve, in whole or in part, the recommendations of the Chief Executive Officer. By a delegation of authority from the Board of Directors, the Compensation Committee has final authority regarding the overall compensation structure for the NEOs (other than stock option awards). In fiscal 2013, the Compensation Committee approved Mr. King’s recommendations for salary and bonus with respect to each of the other NEOs.
In 2013, the Compensation Committee engaged the compensation consulting firm Aon Hewitt to conduct a benchmarking study of executive compensation programs. The results of this study, together with the experience of Oak Hill Capital Partners in managing other portfolio companies, guided our compensation decisions, including compensation of our NEOs. Aon Hewitt evaluated our market competitiveness against (a) a custom peer group and (b) Aon Hewitt’s Total Compensation Measurement survey of retail companies. The peer group against which we compared ourselves in fiscal 2013 includes casual dining restaurants that offer an “experience” and companies that focus on entertainment, including casino & gaming companies; hotels, resorts & cruise lines; and leisure facilities. All are publicly-traded companies that (a) have revenues between $409 million and $1.42 billion (approximately 0.6 times to 2.2 times our revenue), (b) have a median revenue of $968 million, which is above our fiscal 2013 revenue of $635.6 million, and (c) in aggregate, have a restaurant/entertainment mix similar to our income mix:
| BJ’s Restaurants, Inc. | Texas Roadhouse, Inc. | Cedar Fair, L.P. | ||
| Bravo Brio Restaurant Group, Inc. | Ameristar Casinos, Inc. | International Speedway Corp. | ||
| Buffalo Wild Wings, Inc. | Churchill Downs, Inc. | SeaWorld Entertainment, Inc. | ||
| CEC Entertainment, Inc. | Isle of Capri Casinos, Inc. | Six Flags Entertainment Corp | ||
| DineEquity, Inc. | MTR Gaming Group, Inc. | Speedway Motorsports, Inc. | ||
| Ignite Restaurant Group, Inc. | Pinnacle Entertainment, Inc. | Vail Resorts, Inc. | ||
| Red Robin Gourmet Burgers, Inc. | The Marcus Corporation | |||
Due to the size differences among the peer group and us, Aon Hewitt used regression analysis to size-adjust the results.
Elements of Compensation
The compensation of our NEOs consists primarily of four major components:
| n | base salary; |
| n | annual incentive awards; |
| n | long-term incentive awards; and |
| n | other benefits. |
Base Salary
The base salary of each of our NEOs is determined based on an evaluation of the responsibilities of that position, each NEO’s historical salary earned in similar management positions and Oak Hill Capital Partners’ experience in managing other portfolio companies. A significant portion of each NEO’s total compensation is in the form of base salary. In alignment with our compensation philosophy, the Compensation Committee believes that ensuring base salary levels position us appropriately relative to the market and reflect the performance and level of responsibility of each NEO, which they believe is key to providing a competitive total compensation package. The salary component was designed to provide the NEOs with consistent income and to attract and retain talented and experienced executives capable of managing our operations and strategic growth. Annually, the performance of each NEO is reviewed by the Compensation Committee using information and evaluations provided by the Chief Executive Officer, taking into account our operating and financial results for the year, an assessment of the contribution of each NEO
91
Table of Contents
to such results, the achievement of our strategic growth and any changes in our NEOs’ roles and responsibilities. In addition, the Compensation Committee considers the results of the benchmarking study and the market competitiveness of each NEO’s base salary to determine appropriate merit- and market-based increases to each NEO’s base salary. During fiscal 2013, Messrs. King, Mulleady, Berle, Bachus, and Jenkins received merit-based increases in base salary of 3.9%, 3.5%, 3.9%, 3.0%, and 3.5%, respectively.
Annual Incentive Plan
The Dave & Buster’s, Inc. Executive Incentive Plan (the “Executive Incentive Plan”) is designed to recognize and reward our employees for contributing towards the achievement of our annual business plan. The Compensation Committee believes the Executive Incentive Plan provides a valuable short-term incentive program for delivering a cash bonus opportunity for our employees upon achievement of targeted operating results as determined by the Compensation Committee and the Board of Directors. The Executive Incentive Plan also supports our efforts to integrate our compensation philosophies with our annual business objectives and focus our executives on the fulfillment of those objectives.
The fiscal 2013 Executive Incentive Plan for most employees was based on our targeted Adjusted EBITDA for fiscal 2013. “Adjusted EBITDA” is calculated as net income (loss), plus interest expense (net), provision (benefit) for income taxes, depreciation and amortization expense, loss on asset disposal, share-based compensation, currency transaction (gain) loss, pre-opening costs, reimbursement of affiliate and other expenses, severance, change in deferred amusement revenue and ticket liability estimations, transaction costs and other non-cash or non-recurring charges. Substantially all of the NEOs received a bonus based on achievement of various corporate objectives (including items such as Adjusted EBITDA, revenues, and similar measures) as determined by the Compensation Committee. With the exception of Mr. Mulleady, bonus payouts for our NEOs are based 75% on the achievement of a target based on Adjusted EBITDA, 12.5% on the achievement of revenue targets, and 12.5% on the achievement of targeted comparable store revenue growth. Mr. Mulleady’s bonus was based on Adjusted EBITDA, the achievement of targets related to signed leases, and the achievement of targets related to new store construction costs. The Compensation Committee reviews and modifies the performance goals for the Executive Incentive Plan as necessary to ensure reasonableness, support of our strategy and consistency with our overall objectives. The Adjusted EBITDA target for fiscal 2013 (a 52 week period) was 9.4% higher than fiscal 2012 (a 53 week period) and the revenue target was 4.7% higher than 2012 revenues. With respect to Mr. Mulleady’s objectives, the targets for signed leases and new store construction were aligned with our development strategy and intended to build the pipeline for future growth. In setting Mr. Mulleady’s targets, the Compensation Committee considered prior results and the level of performance needed to achieve development goals and set the targets at levels the Committee believed were challenging but attainable.
| TARGET | ACTUAL | % OF TARGET |
PAYOUT % |
|||||||||||||
| Adjusted EBITDA |
$ | 131,768 | $ | 134,790 | 102.3 | % | 122.9 | % | ||||||||
| Adjusted Revenue |
$ | 637,873 | $ | 637,952 | 100.0 | % | 100.1 | % | ||||||||
| Comparable Store Revenue Growth |
3.0 | % | 0.95 | % | 31.9 | % | 0.0 | % | ||||||||
Under each NEO’s employment agreement and the Executive Incentive Plan, a target bonus opportunity is expressed as a percentage of an NEO’s annualized base salary as of the end of the fiscal year, prorated according to the percentage of the fiscal year the NEO is employed by the Company. Target levels are established based upon a review of market practices and align to our compensation philosophy. Bonuses in excess or below the target level may be paid subject to a prescribed maximum or minimum. Below a minimum threshold level of performance, no awards will be granted under the Executive Incentive Plan.
| % OF SALARY AT THRESHOLD |
% OF SALARY AT TARGET |
% OF SALARY AT MAXIMUM |
||||||||||
| Stephen M. King |
20.0 | % | 80.0 | % | 160.0 | % | ||||||
| John B. Mulleady |
11.3 | % | 60.0 | % | 120.0 | % | ||||||
| Dolf Berle |
17.5 | % | 70.0 | % | 140.0 | % | ||||||
| Kevin Bachus |
12.5 | % | 50.0 | % | 100.0 | % | ||||||
| Brian A. Jenkins |
15.0 | % | 60.0 | % | 120.0 | % | ||||||
92
Table of Contents
At the close of the performance period, the Compensation Committee determined the bonuses for the NEOs following the annual audit and reporting of financial results for fiscal 2013 and reported the awards to the Board of Directors. The Compensation Committee authorized bonuses to the NEOs in amounts that were commensurate with the results achieved during fiscal 2013. In reviewing fiscal 2013 Executive Incentive Plan results, the Compensation Committee recognized that we exceeded the target Adjusted EBITDA, Total Revenues and adjusted revenues but did not achieve threshold performance for Comparable Store Revenue Growth, which resulted in an award above target level performance for substantially all employees, including the NEOs. With the exception of Mr. Mulleady, our NEOs were paid 104.7% of their target bonus opportunity for fiscal 2013 based on the achievement of performance in excess of target on Adjusted EBITDA and adjusted revenues growth. Mr. Mulleady achieved above target performance on the portion of his bonus linked to the attainment of restaurant development objectives; therefore, he was paid 129.9% of his target bonus opportunity for fiscal 2013.
| TARGET BONUS |
BONUS PAID |
% OF TARGET |
||||||||||
| Stephen M. King |
$ | 532,000 | $ | 556,926 | 104.7 | % | ||||||
| John B. Mulleady |
$ | 223,500 | $ | 290,283 | 129.9 | % | ||||||
| Dolf Berle |
$ | 281,750 | $ | 294,951 | 104.7 | % | ||||||
| Kevin Bachus |
$ | 136,500 | $ | 142,896 | 104.7 | % | ||||||
| Brian A. Jenkins |
$ | 223,500 | $ | 233,972 | 104.7 | % | ||||||
The Compensation Committee believes the incentive awards were warranted and consistent with the performance of such executives during fiscal 2013 based on the Compensation Committee’s evaluation of each individual’s overall contribution to accomplishing our fiscal 2013 corporate goals and of each individual’s achievement of strategic and individual performance goals during the year.
Long-term Incentive Plan
The Compensation Committee believes that it is essential to align the interests of the executives and other key management personnel responsible for our growth with the interests of our stockholders. The Compensation Committee has also identified the need to retain tenured, high-performing executives. The Compensation Committee believes that these objectives are accomplished through the provision of stock-based incentives that align the interests of management personnel with the long-term objectives of enhancing our value, as set forth in the 2010 Stock Incentive Plan.
During fiscal 2013, the Board of Directors of D&B Entertainment awarded service-based stock options with time-based vesting schedules to Mr. Mulleady in recognition of his outstanding performance and to Mr. Bachus in connection with his hire. The exercise price of the stock option awards was established by the Board of Directors of D&B Entertainment and supported by an independent valuation assessment. The Compensation Committee granted equity awards to the other NEOs prior to 2013 and determined that the size and design of those awards were sufficient at this time. Therefore, no additional awards were made to other NEOs in 2013. Prior to 2013, we generally awarded our NEOs with a combination of service-based stock options with time-based vesting schedules and performance-based stock options that vest upon the attainment of a pre-established performance target. A greater number of stock options were granted to our more senior officers who have more strategic responsibilities.
With respect to service-based options, the options vest ratably (20% per year) over a five-year period commencing one year following the grant date. With respect to performance-based options, there are various performance-based vesting provisions depending on the type of performance option granted. Adjusted EBITDA vesting options vest over a three-year, four-year or five-year period based on D&B Entertainment meeting certain profitability targets for each fiscal year, as determined by the Compensation Committee (the profitability target for fiscal 2013 was Adjusted EBITDA of $126,201 and for fiscal 2014 was Adjusted EBITDA of $147,822); provided, that if, in any fiscal year such Adjusted EBITDA target is not achieved, the options that would vest in such fiscal year will vest if the Adjusted EBITDA in the succeeding year aggregated with the Adjusted EBITDA in such fiscal year exceeds the sum of the Adjusted EBITDA target for both fiscal years.
93
Table of Contents
For performance-based stock options that vest upon the attainment of a pre-established performance target based on the Oak Hill Funds’ internal rate of return (the interest rate, compounded annually, calculated at the times and in the manner set forth in the stock option agreement), in each case described below, there are two tranches of options. One tranche of options vest and become exercisable if and only if a change of control (where prior to an initial public offering any person owns a greater percentage of common stock than the Oak Hill Funds, or following an initial public offering, a sale of the Company’s stock to the public that when aggregated with other public sales by the Oak Hill Funds, results in the sale of at least 75% of the stock held by the Oak Hill Funds prior to the initial public offering) occurs in which the internal rate of return with respect to the Oak Hill Funds’ investment in the common stock of the Company made on June 1, 2010 is greater than or equal to 20% as determined by the Compensation Committee. The other tranche of options vest and become exercisable if and only if a change of control occurs in which the internal rate of return with respect to the Oak Hill Funds’ investment in the common stock of the Company made on June 1, 2010 is greater than or equal to 25% as determined by the Compensation Committee. Vesting of options in each case is subject to the grantee’s continued employment with or service to the Company or its subsidiaries (subject to certain conditions in the event of grantee termination) as of the vesting date. Any options that have not vested prior to a change of control or do not vest in connection with the change of control will be forfeited by the grantee upon a change of control for no consideration.
There were 18,342.43 shares available for issuance under the 2010 Stock Incentive Plan as of September 2, 2014. All other shares have previously been granted. The only other option grants that could be made in the future would be the re-allocation of options that may be forfeited by a participant. Following this offering, we will not grant new awards under the 2010 Stock Incentive Plan.
In addition, our board of directors will adopt a new equity benefit plan as described under “—2014 Equity Incentive Plan” subject to the occurrence of this offering pursuant to which a total of shares of our common stock will be authorized for issuance. In connection with this offering and under the 2014 Stock Incentive Plan, we intend to grant certain officers options to purchase shares of our common stock based on a dollar value. Assuming the shares are offered at $ (the midpoint of the price range set forth on the cover of this prospectus), a total of shares of our common stock at an exercise price equal to the initial public offering price will be granted under the 2014 Stock Incentive Plan, including option grants to Messrs. King, Mulleady, Berle, Bachus and Jenkins of , , , and , respectively. Half of these options will vest three years after the grant date and the other half will vest four years after the grant date. Similar grants will also be made to other executive officers. See “Certain Relationships and Related Transactions—IPO Option Grants.”
The Compensation Committee annually reviews long-term incentives to assure that our executive officers and other key employees are appropriately motivated and rewarded based on our long-term financial success.
Other Benefits
Retirement Benefits. Our employees, including our NEOs, are eligible to participate in the 401(k) retirement plan on the same basis as other employees. However, tax regulations impose a limit on the amount of compensation that may be deferred for purposes of retirement savings. As a result, we established the Select Executive Retirement Plan (the “SERP”). See “—2013 Nonqualified Deferred Compensation” for a discussion of the SERP.
Perquisites and Other Benefits. We offer our NEOs modest perquisites and other personal benefits that we believe are reasonable and round out a competitive compensation program that enhances our ability to attract and retain executive talent in our best interest, including car allowances, country club memberships and Company-paid financial counseling and tax preparation services. See “—2013 Summary Compensation Table.”
Severance Benefits. We have entered into employment agreements with each of our NEOs, with the exception of Kevin Bachus. These agreements provide our NEOs with certain severance benefits in the event of involuntary termination or adverse job changes and are key to attracting and retaining key executives. See “—Employment Agreements.”
Deductibility of Executive Compensation
Section 162(m) of the Internal Revenue Code of 1986, as amended from time to time (the “Code”) under the Omnibus Budget Reconciliation Act of 1993 limits the deductibility of certain compensation over $1.0 million paid by a company to an executive officer. The Compensation Committee will take action to qualify most compensation approaches to ensure deductibility, except in those limited cases in which the Compensation Committee believes
94
Table of Contents
stockholder interests are best served by retaining flexibility. In such cases, the Compensation Committee will consider various alternatives to preserving the deductibility of compensation payments and benefits to the extent reasonably practicable and to the extent consistent with its compensation objectives.
Stock Ownership Guidelines
We believe that, to align the long-term financial interests of our executive officers with those of our stockholders, our executives should hold a financial stake in us. Our Board of Directors adopted Stock Ownership Guidelines in September 2014 requiring our Chief Executive Officer, Chief Operating Officer, Chief Financial Officer and Senior Vice Presidents to own our stock equal to a minimum of seven times, four times, three times and two times, respectively, such executive officer’s annual base salary. The Stock Ownership Guidelines provide that our executive officers have five years from the date of this offering or, with respect to newly appointed executive officers, five years from the date of their appointment, to comply with the Stock Ownership Guidelines. For the purposes of such Stock Ownership Guidelines with respect to executive officers, stock includes (i) directly held shares of our common stock, (ii) vested and unexercised stock options, (iii) time-based restricted stock, (iv) 401(k) or other similar plan holdings and (v) stock beneficially owned in a trust.
Risk Assessment Disclosure
Our Compensation Committee assessed the risk associated with our compensation practices and policies for employees, including a consideration of the balance between risk-taking incentives and risk-mitigating factors in our practices and policies. The assessment determined that any risks arising from our compensation practices and policies are not reasonably likely to have a material adverse effect on our business or financial condition.
2013 Summary Compensation Table
The following table sets forth information concerning all compensation that we paid or accrued during fiscal 2013 to or for each person serving as an NEO at the end of fiscal 2013.
| NAME AND PRINCIPAL POSITION |
YEAR | SALARY (5) ($) |
BONUS ($) |
OPTION AWARDS (6) ($) |
NON-EQUITY INCENTIVE PLAN COMPENSATION ($) |
ALL OTHER COMPENSATION (7) ($) |
TOTAL ($) |
|||||||||||||||||||||
| Stephen M. King |
2013 | 646,250 | — | — | 556,926 | 39,709 | 1,242,885 | |||||||||||||||||||||
| (CEO) |
2012 | 622,308 | — | — | 939,283 | 45,822 | 1,607,413 | |||||||||||||||||||||
| 2011 | 600,000 | — | — | 416,664 | 35,094 | 1,051,758 | ||||||||||||||||||||||
| John B. Mulleady (1) |
2013 | 363,125 | — | 404,000 | 290,283 | 15,900 | 1,073,308 | |||||||||||||||||||||
| (SVP, Real Estate and Development) |
2012 | 285,385 | 75,000 | 228,032 | 249,623 | 77,441 | 915,481 | |||||||||||||||||||||
| Dolf Berle (2) |
2013 | 391,250 | — | — | 294,951 | 16,767 | 702,968 | |||||||||||||||||||||
| (President and COO) |
2012 | 378,135 | — | — | 497,618 | 15,279 | 891,032 | |||||||||||||||||||||
| 2011 | 336,539 | 69,304 | 235,290 | 233,706 | 13,207 | 888,046 | ||||||||||||||||||||||
| Kevin Bachus (3) |
2013 | 267,000 | — | 278,700 | 142,896 | 13,120 | 701,716 | |||||||||||||||||||||
| (SVP Entertainment and Games Strategy) |
2012 | 61,154 | 100,000 | — | 55,036 | 3,028 | 219,218 | |||||||||||||||||||||
| Brian A. Jenkins (4) |
2013 | 363,933 | — | — | 233,972 | 34,030 | 631,935 | |||||||||||||||||||||
| (SVP and CFO) |
2012 | 351,115 | 13,596 | — | 396,260 | 35,738 | 796,709 | |||||||||||||||||||||
| 2011 | 328,750 | — | — | 236,110 | 31,656 | 596,516 | ||||||||||||||||||||||
| (1) | Mr. Mulleady joined the Company on April 16, 2012, and received a sign-on bonus in the amount of $75,000. |
| (2) | Mr. Berle joined the Company in February 2011 and received a sign-on bonus in the amount of $69,304 to defray certain costs and expenses incurred by him. |
| (3) | Mr. Bachus joined the Company on November 12, 2012 and received a sign-on bonus in the amount of $100,000. |
| (4) | In fiscal 2012, Mr. Jenkins received a project bonus outside of the Executive Incentive Plan. This bonus amount was recommended by Mr. King and approved by the Compensation Committee prior to payment. |
| (5) | The following salary deferrals were made under the SERP in 2013: Mr. King, $38,775 and Mr. Jenkins, $36,393. |
95
Table of Contents
| (6) | Amounts in this column reflect the aggregate grant date fair value of options calculated in accordance with ASC 718. The discussion of the assumptions used for purposes of valuation of options granted in 2013, 2012 and 2011 appear in Note 1 in the accompanying consolidated financial statements. |
| (7) | The following table sets forth the components of “All Other Compensation:” |
| NAME |
YEAR | CAR ALLOWANCE ($) |
FINANCIAL PLANNING/ LEGAL FEES ($) |
CLUB DUES ($) |
COMPANY CONTRIBUTIONS TO RETIREMENT & 401(K) PLANS ($)(a) |
RELOCATION EXPENSES ($) |
TOTAL ($)(a) |
|||||||||||||||||||||
| Stephen M. King (a) |
2013 | 10,000 | 1,544 | 3,120 | 25,045 | — | 39,709 | |||||||||||||||||||||
| 2012 | 10,192 | 5,000 | 3,180 | 27,450 | — | 45,822 | ||||||||||||||||||||||
| 2011 | 10,000 | — | 3,120 | 21,974 | — | 35,094 | ||||||||||||||||||||||
| John B. Mulleady |
2013 | 10,000 | 962 | 3,120 | 1,818 | — | 15,900 | |||||||||||||||||||||
| 2012 | 8,077 | — | 2,520 | 2,381 | 64,463 | 77,441 | ||||||||||||||||||||||
| Dolf Berle |
2013 | 10,000 | 1,809 | 3,120 | 1,838 | — | 16,767 | |||||||||||||||||||||
| 2012 | 10,192 | — | 3,180 | 1,907 | — | 15,279 | ||||||||||||||||||||||
| 2011 | 9,616 | — | 3,000 | 591 | — | 13,207 | ||||||||||||||||||||||
| Kevin Bachus |
2013 | 10,000 | — | 3,120 | — | — | 13,120 | |||||||||||||||||||||
| 2012 | 2,308 | — | 720 | — | — | 3,028 | ||||||||||||||||||||||
| Brian A. Jenkins (a) |
2013 | 10,000 | 5,000 | 3,120 | 15,910 | — | 34,030 | |||||||||||||||||||||
| 2012 | 10,192 | 5,000 | 3,180 | 17,366 | — | 35,738 | ||||||||||||||||||||||
| 2011 | 10,000 | 5,000 | 3,120 | 13,536 | — | 31,656 | ||||||||||||||||||||||
| (a) | Amounts include Company contributions to the 401(k) plan and SERP that were based on the Company’s performance during the 2013 fiscal year and accrued as of February 2, 2014, although such contributions were not made until the 2014 fiscal year. Amounts also include the Company’s fixed contributions to the 401(k) plan and SERP that were made during the 2013 fiscal year. |
Grants of Plan-Based Awards in Fiscal 2013
The following table shows the grants of plan-based awards to the named executive officers in fiscal 2013.
| ESTIMATED FUTURE PAYOUTS UNDER NON-EQUITY INCENTIVE PLAN AWARDS (1) |
||||||||||||||||||||||||||||
| NAME |
GRANT DATE |
THRESHOLD ($) |
TARGET ($) |
MAXIMUM ($) |
ALL OTHER OPTION AWARDS: NUMBER OF SECURITIES UNDERLYING OPTIONS (#) |
EXERCISE OR BASE PRICE OF OPTION AWARDS ($/SHARE) |
GRANT DATE FAIR VALUE OF OPTION AWARDS ($) |
|||||||||||||||||||||
| Stephen M. King |
133,000 | 532,000 | 1,064,000 | — | — | — | ||||||||||||||||||||||
| John B. Mulleady |
5/3/2013 | 41,906 | 223,500 | 447,000 | 300 | 1,867 | 278,700 | |||||||||||||||||||||
| 9/27/2013 | 100 | 2,102 | 125,300 | |||||||||||||||||||||||||
| Dolf Berle |
70,438 | 281,750 | 563,500 | — | — | — | ||||||||||||||||||||||
| Kevin Bachus |
5/3/2013 | 34,125 | 136,500 | 273,000 | 300 | 1,867 | 278,700 | |||||||||||||||||||||
| Brian A. Jenkins |
55,875 | 223,500 | 447,000 | — | — | — | ||||||||||||||||||||||
| (1) | All such payouts are pursuant to the Executive Incentive Plan, as more particularly described under “—Annual Incentive Plan” above and actual payouts are recorded under “Non-Equity Incentive Plan Compensation” in the “—Summary Compensation Table.” |
96
Table of Contents
Outstanding Equity Awards at Fiscal Year-End 2013
| NAME |
NUMBER OF SECURITIES UNDERLYING UNEXERCISED OPTIONS(#) (1) |
NUMBER OF SECURITIES UNDERLYING UNEXERCISED UNEARNED OPTIONS (#) (3) |
OPTION EXERCISE PRICE ($) |
OPTION EXPIRATION DATE |
||||||||||||||||
| EXERCISABLE (1) | UNEXERCISABLE (2) | |||||||||||||||||||
| Stephen M. King |
1,512.00 | 504.00 | 1,764.00 | 1,000 | 6/1/2020 | |||||||||||||||
| John B. Mulleady |
80.00 | 120.00 | 250.00 | 1,140 | 4/16/2022 | |||||||||||||||
| 300.00 | 1,867 | 5/3/2023 | ||||||||||||||||||
| 100.00 | 2,102 | 9/27/2023 | ||||||||||||||||||
| Dolf Berle |
731.70 | 487.80 | 1,219.50 | 1,000 | 3/23/2021 | |||||||||||||||
| Kevin Bachus |
— | 300.00 | — | 1,867 | 5/3/2023 | |||||||||||||||
| Brian A. Jenkins |
789.00 | 263.20 | 919.80 | 1,000 | 6/1/2020 | |||||||||||||||
| (1) | These options represent (a) vested service-based options and (b) the vested portion of performance-based options granted under the 2010 Stock Incentive Plan. With the exception of options granted to Messrs. Mulleady, Berle and Bachus, service-based options vest ratably over a five-year period, commencing on June 1, 2011, the first anniversary of the date of grant. Service-based options granted to Mr. Mulleady vest ratably over a five-year period commencing on April 16, 2013, May 3, 2014, and September 27, 2014, the first anniversary of the date of each grant. Service-based options granted to Mr. Berle vest ratably over a five-year period commencing on March 23, 2012, the first anniversary of the date of grant. Service-based options granted to Mr. Bachus vest ratably over a five-year period commencing on May 3, 2014, the first anniversary of the date of the grant. |
| (2) | These options represent the unvested service-based options granted under the 2010 Stock Incentive Plan. These options will vest as described in (1) above. |
| (3) | These options are unvested performance-based options granted under the 2010 Stock Incentive Plan and shall vest (a) in the event the Company achieves certain annual earnings targets and (b) upon a change of control of the Company in which the Oak Hill Funds achieve a designated internal rate of return on their initial investment. |
Equity Compensation Plan Information
The following table sets forth information concerning the shares of common stock that may be issued upon exercise of options under the 2010 Stock Incentive Plan as of February 2, 2014:
| PLAN CATEGORY |
NUMBER OF SECURITIES TO BE ISSUED UPON EXERCISE OF OUTSTANDING OPTIONS, WARRANTS AND RIGHTS |
WEIGHTED- AVERAGE EXERCISE PRICE OF OUTSTANDING OPTIONS, WARRANTS AND RIGHTS |
NUMBER OF SECURITIES REMAINING AVAILABLE FOR FUTURE ISSUANCE UNDER EQUITY COMPENSATION PLANS |
|||||||||
| Equity compensation plans approved by security holders |
17,752.57 | $ | 1,084.75 | 18,342.43 | ||||||||
| Equity compensation plans not approved by security holders |
— | — | — | |||||||||
|
|
|
|
|
|
|
|||||||
| Total |
17,752.57 | $ | 1,084.75 | 18,342.43 | ||||||||
|
|
|
|
|
|
|
|||||||
2013 Nonqualified Deferred Compensation
The SERP is a defined contribution plan designed to permit a select group of management or highly compensated employees to set aside base salary on a pre-tax basis. The SERP has a variety of investment options similar in type to our 401(k) plan. Any employer contributions to a participant’s account vest in equal portions over a five-year period, and become immediately vested upon termination of a participant’s employment on or after age 65 or by reason of the participant’s death or disability, and upon a change of control (as defined in the SERP). Pursuant to Section 409A of the Code, however, such distribution cannot be made to certain employees of a publicly traded corporation before the earlier of six months following the employee’s termination date or the death of the employee. Withdrawals from the SERP may be permitted in the event of an unforeseeable emergency.
97
Table of Contents
The following table shows contributions to each NEO’s deferred compensation account in 2013 and the aggregate amount of such officer’s deferred compensation as of February 2, 2014.
| NAME |
EXECUTIVE CONTRIBUTIONS IN LAST FISCAL YEAR (1) ($) |
REGISTRANT CONTRIBUTIONS IN LAST FISCAL YEAR (2)(3) ($) |
AGGREGATE EARNINGS IN LAST FISCAL YEAR (3) ($) |
AGGREGATE BALANCE AT LAST FISCAL YEAR-END (4) ($) |
||||||||||||
| Stephen M. King |
38,775 | 25,045 | 24,138 | 260,332 | ||||||||||||
| John B. Mulleady |
— | — | — | — | ||||||||||||
| Dolf Berle |
— | — | — | — | ||||||||||||
| Kevin Bachus |
— | — | — | — | ||||||||||||
| Brian A. Jenkins |
36,393 | 14,093 | 13 | 163,602 | ||||||||||||
| (1) | Amounts are included in the “Salary” column of the “—Summary Compensation Table.” |
| (2) | Amounts shown are matching contributions pursuant to the deferred compensation plan. These amounts are included in the “All Other Compensation” column of the “—Summary Compensation Table.” |
| (3) | No amount reported in this column was reported as compensation to the officer in the “—Summary Compensation Table” in previous years. |
| (4) | The portion of these amounts derived from executive contributions made in previous years were included in the “Salary” column of the “—Summary Compensation Table” in the years when the contributions were made. |
Employment Agreements
We have entered into employment agreements with our NEOs (with the exception of Kevin Bachus) to reflect the then current compensation arrangements of each of the NEOs and to include additional restrictive covenants, including a one-year non-compete provision and a two-year non-solicitation and non-hire provision. The employment agreement for each NEO provides for an initial term of two years, subject to automatic one-year renewals unless terminated earlier by the NEO or us. Under the terms of the employment agreements, each NEO is entitled to a minimum base salary and may receive an annual salary increase commensurate with such officer’s performance during the year, as determined by the Board of Directors of Dave & Buster’s Management Corporation, Inc. Our NEOs are also entitled to participate in the 2010 Stock Incentive Plan and in any profit sharing, qualified and nonqualified retirement plans and any health, life, accident, disability insurance, sick leave, supplemental medical reimbursement insurance, or benefit plans or programs as we may choose to make available now or in the future. NEOs are entitled to receive an annual automobile allowance, an allowance for club membership and paid vacation. In addition, the employment agreements contain provisions providing for severance payments and continuation of benefits under certain circumstances including termination by us without Cause (as defined in the employment agreement), upon execution of a general release of claims in favor of us. Each employment agreement also contains a confidentiality covenant.
We executed an offer letter with Kevin Bachus on October 1, 2012, which reflected his then current salary and target bonus opportunity in our executive bonus program. Pursuant to the offer letter, Mr. Bachus is entitled to participate in our 401(k) plan and SERP and to receive an annual automobile allowance, an allowance for club membership and paid vacation. Mr. Bachus’s employment is at-will.
Potential Payments Upon Termination or Change of Control
The following is a discussion of the rights of the NEOs under the 2010 Stock Incentive Plan and the employment agreements with the NEOs following a termination of employment or change of control.
2010 Stock Incentive Plan
Pursuant to the 2010 Stock Incentive Plan, certain vested stock options shall terminate on the earliest of (a) the day on which the executive officer is no longer employed by us due to the termination of such employment for cause, (b) the thirty-first day following the date the executive officer is no longer employed by us due to the termination of such employment upon notice to us by the executive officer without good reason having been shown, (c) the 366th day following the date the executive officer is no longer employed by us by reason of death, disability, or due to the
98
Table of Contents
termination of such employment (i) by the executive officer for good reason having been shown or (ii) by us for reason other than for cause, or (d) the tenth anniversary of the date of grant. Subject to the provisions of the immediately following sentence, all options that are not vested and exercisable on the date of termination of employment shall immediately terminate and expire on such termination date. A portion of the performance-based stock options shall become vested and exercisable subject to the satisfaction of certain performance requirements set forth in the 2010 Stock Incentive Plan. Upon a sale or change of control as more particularly described in the 2010 Stock Incentive Plan, certain performance-based stock options shall become vested and exercisable, subject to certain performance requirements set forth in the 2010 Stock Incentive Plan.
Employment Agreements
Deferred Compensation. All contributions made by an executive officer to a deferred compensation account, and all vested portions of our contributions to such deferred compensation account, shall be disbursed to the executive officer upon termination of employment for any reason. See “—2013 Nonqualified Deferred Compensation.”
Resignation. If an executive officer resigns from employment with us, such officer is not eligible for any further payments of salary, bonus, or benefits and such officer shall only be entitled to receive that compensation which has been earned by the officer through the date of termination.
Involuntary Termination Not for Cause. In the event of involuntary termination of employment other than for Cause (as defined in the employment agreements), an executive officer would be entitled to 12 months of severance pay at such officer’s then-current base salary, the pro rata portion of the annual bonus, if any, earned by the officer for the then-current fiscal year, 12 months continuation of such officer’s automobile allowance, and monthly payments for a period of six months equal to the monthly premium required by such officers to maintain health insurance benefits provided by our group health insurance plan, in accordance with the requirements of the Consolidated Omnibus Budget Reconciliation Act of 1985.
Termination for Cause. In the event of termination for Cause, the officer is not eligible for any further payments of salary, bonus, or benefits and shall be only entitled to receive that compensation which has been earned by the officer through the date of termination.
Termination for Good Reason. In the event the employee chooses to terminate his or her employment for reasons such as material breach of the employment agreement by us, relocation of the office where the officer performs his or her duties, assignment to the officer of any duties, authority, or responsibilities that are materially inconsistent with such officer’s position, authority, duties or responsibilities or other similar actions, such officer shall be entitled to the same benefits described above under “—Involuntary Termination Not for Cause.”
Death or Disability. The benefits to which an officer (or such officer’s estate or representative) would be entitled in the event of death or disability are as described above under “—Involuntary Termination Not for Cause.” However, the amount of salary paid to any such disabled officer shall be reduced by any income replacement benefits received from the disability insurance we provide.
99
Table of Contents
Information concerning the potential payments upon a termination of employment or change of control is set forth in tabular form below for each NEO. Information is provided as if the termination, death, disability or change of control (as defined in the 2010 Stock Incentive Plan) and certain other liquidity events had occurred as of February 2, 2014 (the last day of fiscal 2013).
| NAME |
BENEFIT | RESIGNATION ($) |
TERMINATION W/OUT CAUSE ($) |
TERMINATION WITH CAUSE ($) |
TERMINATION FOR GOOD REASON ($) |
DEATH/ DISABILITY ($) |
CHANGE OF CONTROL ($) |
|||||||||||||||||||
| Stephen M. King |
Salary | — | 665,000 | — | 665,000 | 665,000 | — | |||||||||||||||||||
| Bonus (1) | — | 532,000 | — | 532,000 | 532,000 | — | ||||||||||||||||||||
| Car | — | 10,000 | — | 10,000 | 10,000 | — | ||||||||||||||||||||
| H & W Benefits | — | 9,284 | — | 9,284 | 9,284 | — | ||||||||||||||||||||
| Deferred Compensation |
260,332 | 260,332 | 260,332 | 260,332 | 260,332 | 260,332 | ||||||||||||||||||||
| John B. Mulleady |
Salary | — | 372,500 | — | 372,500 | 372,500 | — | |||||||||||||||||||
| Bonus (1) | — | 223,500 | — | 223,500 | 223,500 | — | ||||||||||||||||||||
| Car | — | 10,000 | — | 10,000 | 10,000 | — | ||||||||||||||||||||
| H & W Benefits | — | 8,829 | — | 8,829 | 8,829 | — | ||||||||||||||||||||
| Deferred Compensation |
— | — | — | — | — | — | ||||||||||||||||||||
| Dolf Berle |
Salary | — | 402,500 | — | 402,500 | 402,500 | — | |||||||||||||||||||
| Bonus (1) | — | 281,750 | — | 281,750 | 281,750 | — | ||||||||||||||||||||
| Car | — | 10,000 | — | 10,000 | 10,000 | — | ||||||||||||||||||||
| H & W Benefits | — | 9,284 | — | 9,284 | 9,284 | — | ||||||||||||||||||||
| Deferred Compensation |
— | — | — | — | — | — | ||||||||||||||||||||
| Kevin Bachus |
Salary | — | 273,300 | — | 273,300 | 273,300 | — | |||||||||||||||||||
| Bonus (1) | — | 136,500 | — | 136,500 | 136,500 | — | ||||||||||||||||||||
| Car | — | 10,000 | — | 10,000 | 10,000 | — | ||||||||||||||||||||
| H & W Benefits | — | 6,140 | — | 6,140 | 6,140 | — | ||||||||||||||||||||
| Deferred Compensation |
— | — | — | — | — | — | ||||||||||||||||||||
| Brian A. Jenkins |
Salary | — | 372,500 | — | 372,500 | 372,500 | — | |||||||||||||||||||
| Bonus (1) | — | 223,500 | — | 223,500 | 223,500 | — | ||||||||||||||||||||
| Car | — | 10,000 | — | 10,000 | 10,000 | — | ||||||||||||||||||||
| H & W Benefits | — | 9,284 | — | 9,284 | 9,284 | — | ||||||||||||||||||||
| Deferred Compensation |
163,602 | 163,602 | 163,602 | 163,602 | 163,602 | 163,602 | ||||||||||||||||||||
| (1) | Accrued and unpaid non-equity incentive compensation payable assuming target performance pursuant to our 2013 Executive Incentive Plan. |
2014 Equity Incentive Plan
The Board of Directors will adopt the 2014 Stock Incentive Plan subject to the occurrence of this offering. Under the 2014 Stock Incentive Plan, the Compensation Committee, the Plan Subcommittee of the Compensation Committee or any other committee or subcommittee designated by the Board of Directors to administer the 2014 Stock Incentive Plan (the “Committee”) may authorize grants of stock options, stock appreciation rights (“SARs”), restricted stock, other stock-based awards and cash-based awards.
The following summary describes the material terms of the 2014 Stock Incentive Plan but does not include all provisions of the 2014 Stock Incentive Plan. For additional information regarding the 2014 Stock Incentive Plan, we refer you to a complete copy of the 2014 Stock Incentive Plan, which has been filed as an exhibit to the registration statement of which this prospectus forms a part.
100
Table of Contents
Description of the Plan
The purpose of the 2014 Stock Incentive Plan is to attract, retain and motivate officers, employees, non-employee directors and consultants providing services to the Company and its subsidiaries and affiliates and to promote the success of the Company’s business by providing participants with appropriate incentives.
The 2014 Stock Incentive Plan will become effective on the later of (i) the date of adoption by the Board of Directors and (ii) the effectiveness of the Form 8-A in connection with the Company’s initial public offering, and will terminate 10 years later unless sooner terminated.
Plan and Participant Share Limits
Subject to adjustment as described in the 2014 Stock Incentive Plan, the maximum number of shares of common stock issuable under the 2014 Stock Incentive Plan is shares, of which a maximum of shares may be issued pursuant to the exercise of incentive stock options. Any shares of common stock delivered to or withheld by the Company in payment of the purchase price of an award or in order to satisfy the Company’s withholding obligation with respect to an Award shall again be available for issuance under the 2014 Stock Incentive Plan.
The maximum number of shares of common stock with respect to any awards denominated in shares that may be granted to any participant in any calendar year under the 2014 Stock Incentive Plan is 500,000, subject to adjustment under the terms of the 2014 Stock Incentive Plan. The maximum aggregate grant of cash-based awards to any participant in any calendar year is $1,000,000, subject to adjustment under the terms of the 2014 Stock Incentive Plan.
In the event of any corporate event or transaction involving the Company, a subsidiary and/or an affiliate (including, but not limited to, a change in the shares of the Company or the capitalization of the Company) such as a merger, consolidation, reorganization, recapitalization, separation, extraordinary stock dividend, stock split, reverse stock split, split up, spin-off, combination of shares, exchange of shares, dividend in kind, amalgamation or other like change in capital structure (other than regular cash or stock dividends to shareholders of the Company), or any similar corporate event or transaction, the Committee shall substitute or adjust, in its sole discretion, the number and kind of shares or other property that may be issued under the 2014 Stock Incentive Plan or under particular forms of awards; the number and kind of shares or other property subject to outstanding awards; the option price, grant price or purchase price applicable to outstanding awards; the annual award limits; and/or other value determinations applicable to the plan or outstanding awards.
Administration
The Committee is responsible for administering the 2014 Stock Incentive Plan and has the power to interpret the terms and intent of the 2014 Stock Incentive Plan and any related documentation; to determine eligibility for awards and the terms and conditions of awards; and to adopt rules, forms, instruments and guidelines. Determinations of the Committee made under the 2014 Stock Incentive Plan are final and binding. The Committee may delegate administrative duties and powers to one or more of its members or to one or more officers, agents or advisors.
Eligibility
Employees, directors and consultants of the Company and its subsidiaries and affiliates who are selected by the Committee are eligible to participate in the 2014 Stock Incentive Plan.
Stock Options
Under the 2014 Stock Incentive Plan, the Committee may grant both incentive stock options (“ISOs”) and nonqualified stock options (“NQSOs”). Eligibility for ISOs is limited to employees of the Company and its subsidiaries (or any parent corporations). The exercise price for options and the term of any option is determined by the Committee at the time of the grant. With regard to any stock option, the per-share exercise price of such stock option shall not be less than 100% of the fair market value of a share (or, if the stock option is intended to qualify as an ISO and the recipient is a 10% stockholder, then not less than 110%) and the latest expiration date of such stock option is the tenth anniversary of the date of the grant (or, if the stock option is intended to qualify as an ISO and the recipient is a 10% stockholder, then the fifth anniversary). Fair market value as of any date that the Company is publicly traded is generally, as determined by the Committee, any of the average high and low trading
101
Table of Contents
price, the 30-day average high and low trading price, the closing price as reported on NASDAQ or other national exchange or established over-the-counter trading system on which dealings take place or, if there is no trading of shares on such date, on the immediately preceding date on which there was trading in the shares, or as otherwise reasonably determined by the Committee in good faith based on actual transactions in shares. The exercise price is to be paid with cash or by other means approved by the Committee.
Stock Appreciation Rights
Under the 2014 Stock Incentive Plan, the Committee may grant SARs, either alone or in tandem with stock options. Upon exercise of a SAR, the holder will have a right to receive the difference between the fair market value of one share on the date of the exercise and the grant price as specified by the Committee on the date of such grant. The grant price, methods of exercise and methods of settlement will be determined by the Committee; however, a tandem SAR is exercisable only to the extent and during the period that the related portion of the tandem option is exercisable and must be exercised by relinquishing the related portion of the tandem option and when a share is acquired pursuant to the exercise of a tandem option, the equivalent portion of the related tandem SAR is forfeited.
Restricted Stock
Under the 2014 Stock Incentive Plan, the Committee may award restricted stock. Restricted stock awards consist of shares of stock that are transferred to the participant subject to restrictions that may result in forfeiture if specified conditions are not satisfied. A holder of restricted stock is not entitled to voting rights unless the Committee so determines in the applicable award agreement and a holder has no right to receive current dividends while the restrictions are in force. The Committee will determine the restrictions and conditions applicable to each award of restricted stock. The grant of, lapse of restrictions on or conditions applicable to an award of restricted stock may depend upon the achievement of performance goals, including over a performance period.
Other Stock-Based Awards
Under the 2014 Stock Incentive Plan, the Committee may grant other equity-based or equity-related awards including, without limitation, restricted stock units and phantom awards, referred to as “other stock-based awards.” The terms and conditions of each other stock-based award shall be determined by the Committee.
Cash-Based Awards
Under the 2014 Stock Incentive Plan, the Committee may grant awards denominated in cash or shares, or a combination of cash and shares, in amounts and subject to terms and conditions determined by the Committee.
Performance-Based Compensation
The Committee may design any award such that the amounts or shares payable or distributed are treated as “qualified performance based compensation” within the meaning of Section 162(m) of the Code, and related regulations. Such awards will be earned only if performance goals over performance periods established by the Committee are met; awards may only be granted, vested or paid if the Committee certifies in writing that such performance goals and any other material terms applicable to such performance periods have been satisfied. The performance goals will be based upon one or more of the following performance measurements: (a) consolidated earnings before or after taxes (including earnings before interest, taxes, depreciation and amortization (“EBITDA”)); (b) net income before or after taxes; (c) operating income; (d) earnings per Share; (e) book value per Share; (f) return on shareholders’ equity; (g) expense management; (h) return on investment; (i) improvements in capital structure; (j) profitability of an identifiable business unit or product; (k) maintenance or improvement of profit margins; (l) stock price; (m) market share; (n) revenues or sales; (o) costs; (p) cash flow (including, but not limited to, operating cash flow and free cash flow); (q) working capital; (r) return on assets; (s) store openings or refurbishment plans; (t) staff training; (u) corporate social responsibility policy implementation; (v) economic value added; (w) debt reduction; (x) completion of acquisitions or divestitures; (y) operating efficiency; (z) sales per square foot; (aa) revenue mix; (bb) capital expenditures versus budgeted expenditures (total, exclusive of information technology and games, or maintenance only); (cc) operating income; (dd) income from franchise units; (ee) unit-level EBITDA less general and administrative expenses; (ff) manager’s operating contribution; (gg) regional operating contribution; (hh) profitability of various revenue streams; (ii) cash flow per share (before and after dividends or before and after debt payments); (jj) total shareholder return (absolute and/or relative to industry/peer group); (kk) lease executions; (ll) franchise unit growth; (mm) employee turnover/retention (for entire population or a subset of employee population); (nn) employee satisfaction; (oo) customer satisfaction (overall and/or specific metrics); (pp) customer
102
Table of Contents
traffic; (qq) customer loyalty participation; (rr) attainment of strategic and operational initiatives; (ss) marketing/brand awareness scores; (tt) third-party operational/compliance audits; and (uu) balanced scorecard.
No later than 90 days after the commencement of a performance period (but in no event after 25% of such performance period has elapsed), the Committee shall establish in writing the performance goals, performance measures, method of computing compensation and participants to which such performance goals apply. Subject to Section 162(m) of the Code, the Committee may adjust the performance goals (including to prorate goals and payments for a partial plan year) in the event of certain non-recurring events, financing transactions and mergers and acquisitions.
Awards that are designed to qualify as performance-based compensation may not be adjusted upward. However, the Committee has the discretion to adjust these awards downward.
Termination of Employment
Each award agreement will specify the effect of a holder’s termination of employment with, or service for, the Company, including the extent to which unvested portions of the award will be forfeited and the extent to which options, SARs or other awards requiring exercise will remain exercisable. Such provisions will be determined in the Committee’s sole discretion.
Treatment of Awards upon a Change of Control
If there is a change of control of the Company, then, unless prohibited by law, the Committee is authorized (but not obligated) to make adjustments to the terms and conditions of outstanding awards, including, without limitation, continuation or assumption of outstanding awards; substitution of new awards with substantially the same terms as outstanding awards; accelerated exercisability, vesting and/or lapse of restrictions for outstanding awards immediately prior to the occurrence of such event; upon written notice, provision that any outstanding awards must be exercised, to the extent then exercisable, during a specified period determined by the Committee (contingent upon the consummation of the change of control), following which unexercised awards shall terminate; and cancellation of all or any portion of outstanding awards for fair market value (which may be the intrinsic value of an option or SAR and may be zero).
Under the 2014 Stock Incentive Plan, a change of control generally is triggered by the occurrence of any of the following: (i) an acquisition of 30% or more of the outstanding shares or the voting power of the outstanding securities generally entitled to vote in the election of directors; (ii) with certain exceptions, individuals on the Board of Directors on the date of effectiveness of the plan cease to constitute a majority of the Board of Directors; (iii) consummation of a reorganization, merger, amalgamation, statutory share exchange, consolidation or like event to which the Company is a party or a sale or disposition of all or substantially all of the Company’s assets, unless the Company’s shareholders continue to own more than 50% of the outstanding voting securities, no person beneficially owns 30% or more of the outstanding securities of the Company and at least a majority of the members of the Board of Directors after such event were members of the Board of Directors prior to the event; or (iv) a complete liquidation or dissolution of the Company.
Amendment of Awards or Plan and Adjustment of Awards
The Committee may at any time amend, alter, suspend, discontinue or terminate the 2014 Stock Incentive Plan or any portion thereof or any award or award agreement thereunder. However, shareholder approval is required: (i) if necessary under applicable law; (ii) if such action changes the eligibility requirements for or increases the number of shares available or benefits permitted under the 2014 Stock Incentive Plan, subject to certain exceptions; or (iii) if such action would result in the reduction of the option price or grant price per share, as applicable, of any outstanding options or SARs or cancellation of any outstanding options or SARs in exchange for cash or for other awards with an option price or grant price per share that is less than the price of the original options or SARs. The written consent of any affected participant is required if such participant’s rights would be materially diminished with regard to a previously granted award. However, the Committee may amend the 2014 Stock Incentive Plan and awards and award agreements thereunder without the consent of participants in such manner as it deems necessary to comply with applicable laws.
103
Table of Contents
As of , 2014, shares of our common stock were outstanding. The following table shows the ownership of our common stock (1) immediately prior to and (2) as adjusted to give effect to this offering by (a) all persons known by us to beneficially own more than 5% of our common stock, (b) each present director, (c) the named executive officers and (d) all executive officers and directors as a group as of the date of this prospectus. This table gives effect to a for 1 stock split of our common stock prior to the consummation of this offering.
| NUMBER OF SHARES OF COMMON STOCK BENEFICIALLY OWNED BEFORE THE OFFERING |
NUMBER OF SHARES ATTRIBUTABLE TO OPTIONS EXERCISABLE WITHIN 60 DAYS OF , 2014 |
PERCENT (9) | NUMBER OF SHARES OF COMMON STOCK BENEFICIALLY OWNED AFTER THIS OFFERING (10) |
NUMBER OF SHARES ATTRIBUTABLE TO OPTIONS EXERCISABLE WITHIN 60 DAYS OF THIS OFFERING (11) |
PERCENT (10) | |||||||||
| Oak Hill Capital Partners III, L.P. (1) |
(2) | |||||||||||||
| Oak Hill Capital Management Partners III, L.P. (1) |
(2) | |||||||||||||
| Directors (3) |
||||||||||||||
| Stephen M. King (5) |
(4) | |||||||||||||
| J. Taylor Crandall |
— | |||||||||||||
| Michael J. Griffith |
(4) | |||||||||||||
| Jonathan S. Halkyard |
(4) | |||||||||||||
| David A. Jones (6) |
(4) | |||||||||||||
| Alan J. Lacy |
(4) | |||||||||||||
| Kevin M. Mailender |
— | |||||||||||||
| Kevin M. Sheehan |
(4) | |||||||||||||
| Tyler J. Wolfram |
— | |||||||||||||
| Named Executive Officers (3)(7) |
||||||||||||||
| John B. Mulleady |
(8) | |||||||||||||
| Dolf Berle |
(8) | |||||||||||||
| Kevin Bachus |
(8) | |||||||||||||
| Brian A. Jenkins |
(8) | |||||||||||||
| All Executive Officers and Directors as a Group (19 Persons) |
||||||||||||||
| * | Less than 1% |
| (1) | The business address of Oak Hill Capital Partners III, L.P. and Oak Hill Capital Management Partners III, L.P. (collectively, the “Oak Hill Funds”) is 201 Main Street, Suite 1018, Fort Worth, Texas 76102. OHCP MGP III, Ltd. is the sole general partner of OHCP MGP Partners III, L.P., which is the sole general partner of OHCP GenPar III, L.P., which is the sole general partner of each of the Oak Hill Funds. OHCP MGP III, Ltd. exercises voting and dispositive control over the shares held by each of the Oak Hill Funds. Investment and voting decisions with regard to the shares of the Purchaser’s common stock owned by the Oak Hill Funds are made by an Investment Committee of the Board of Directors of OHCP MGP III, Ltd. The members of the Board of Directors are J. Taylor Crandall, Steven B. Gruber, Denis J. Nayden and Tyler J. Wolfram. Each of these individuals disclaims beneficial ownership of the shares owned by the Oak Hill Funds. |
| (2) | Not applicable. |
| (3) | We determined beneficial ownership in accordance with the rules of the SEC. Except as noted, and except for any community property interests owned by spouses, the listed individuals have sole investment power and sole voting power as to all shares of stock of which they are identified as being the beneficial owners. |
| (4) | Mr. King owns stock options under the 2010 Stock Incentive Plan, of which have vested, or will vest, within 60 days of , 2014. Mr. Lacy owns stock options under the 2010 Stock Incentive Plan, of which have vested, or will vest, within 60 days of , 2014. Mr. Jones owns stock options under the 2010 Stock Incentive Plan, of which have |
104
Table of Contents
| vested, or will vest, within 60 days of , 2014. Mr. Griffith owns stock options under the 2010 Stock Incentive Plan, none of which have vested, or will vest, within 60 days of , 2014. Mr. Halkyard owns stock options under the 2010 Stock Incentive Plan, of which have vested, or will vest, within 60 days of , 2014. Mr. Sheehan owns stock options under the 2010 Stock Incentive Plan, none of which have vested, or will vest, within 60 days of , 2014. |
| (5) | Shares reflected in the table include shares owned by the Steve and Shauna King Investment Partnership L.P. (the “Investment Partnership”). Currently, Mr. King has sole voting and investment power over all of the shares owned by the Investment Partnership. |
| (6) | Shares reflected in the table include shares owned by Mr. Jones; plus shares owned by each of the eight David A. Jones 2006 Grandchildren’s Trusts Dated 12/30/2006, trusts established for the benefit of Mr. Jones’s eight grandchildren; shares owned by each of the two David A. Jones 2013 Grandchildren’s Trusts dated 6/30/13, trusts established for the benefit of two of Mr. Jones’ grandchildren; shares owned by Brenton Alan Kindle; shares owned by Brooke Nicole Kindle Stephens; shares owned by Leslie Ann Jones Acosta; shares owned by Jeffrey David Jones; and shares owned by Dana Michele Jones Smith. Currently, Mr. Jones has sole voting and investment power over all of the shares pursuant to the voting trust agreement and irrevocable proxies executed by the trustees of each trust on behalf of the ten trust beneficiaries and the individual owners of the shares. |
| (7) | In addition to Mr. King who serves as a director. |
| (8) | Mr. Mulleady owns stock options under the 2010 Stock Incentive Plan, of which have vested, or will vest, within 60 days of , 2014. Mr. Berle owns stock options under the 2010 Stock Incentive Plan, of which have vested, or will vest, within 60 days of , 2014. Mr. Bachus owns stock options under the 2010 Stock Incentive Plan, of which have vested, or will vest, within 60 days of , 2014. Mr. Jenkins owns stock options under the 2010 Stock Incentive Plan, of which have vested, or will vest, within 60 days of , 2014. |
| (9) | This percentage is based on the number of beneficially owned shares of common stock as of , 2014, determined in accordance with the rules of the SEC. |
| (10) | Gives effect to the sale of shares of common stock to the public. |
| (11) | Reflects an adjustment to the vesting criteria applicable to existing stock options under the 2010 Stock Incentive Plan that will occur in connection with this offering. For more information, see “Executive Compensation—Compensation Discussion and Analysis—Elements of Compensation—Long-term Incentive Plan.” |
105
Table of Contents
CERTAIN RELATIONSHIPS AND RELATED TRANSACTIONS
The share numbers and related strike prices set forth in this section do not give effect to the for 1 stock split that will occur prior to the consummation of this offering.
Relationship with Oak Hill Capital Partners
Our directors, J. Taylor Crandall, Kevin M. Mailender and Tyler J. Wolfram, are Partners of Oak Hill Capital Management, LLC. Our directors, Alan J. Lacy and David A. Jones, are Senior Advisors to the Oak Hill Funds.
IPO Option Grants
In connection with this offering and under the 2014 Stock Incentive Plan, we intend to grant certain executive officers options to purchase shares of our common stock based on a dollar value. Assuming the shares are offered at $ (the midpoint of the price range set forth on the cover of this prospectus), a total of shares of our common stock at an exercise price equal to the initial public offering price will be granted under the 2014 Stock Incentive Plan, including grants to Jay L. Tobin, Sean Gleason and Margo L. Manning of , and , respectively. Half of these options will vest three years after the grant date and the other half will vest four years after the grant date. See “Executive Compensation—Compensation Discussion and Analysis—Elements of Compensation—Long-term Incentive Plan” for the stock option grants being made to our named executive officers in connection with this offering.
Repurchase of Common Stock
In connection with the issuance of $180,790,000 aggregate principal amount at maturity of 12.25% senior discount notes due 2016 in February 2011, we used all of the net proceeds of the offering to purchase a portion of our common stock owned by certain of our stockholders and to pay debt issuance costs. We repurchased 92,022.849 shares from Oak Hill Capital Partners III, L.P., 3,022.245 shares from Oak Hill Capital Management Partners III, L.P., 774.321 shares from Stephen M. King, 138.981 shares from Jay L. Tobin, 282.925 shares from Brian A. Jenkins, 89.345 shares from Sean Gleason, 277.961 shares from Jeffrey C. Wood, 9.927 shares from Michael J. Metzinger, 14.891 shares from Gregory Clore, 23.825 shares from Margo L. Manning, 86.367 shares from Edward J. Forler, 37.723 shares from William J. Robertson, 59.563 shares from Joan Egeland, 27.796 shares from Lisa Warren and 19.854 shares from Joseph DeProspero. All of the above purchases were made at a price of $1,000 per share.
On September 30, 2010, we purchased 1,500 shares of our common stock from Starlette Johnson, a former member of management, for $1,500,000, of which $500,000 was paid in 2010 and $1,000,000 was paid in 2011. As described below, we subsequently resold 75 and 833 of the purchased shares on March 23, 2011 and January 18, 2012, respectively. We continue to retain 592 of the purchased shares as treasury stock.
On June 28, 2011, we purchased 90 shares of our common stock from Joan Egeland, a former member of management, for $90,437. The purchased shares are being retained as treasury stock by the Company.
On January 13, 2012, we purchased 422 shares of our common stock from Jeffrey C. Wood, a former member of management, for $506,447. The purchased shares are being retained as treasury stock by the Company.
All share amounts above are calculated before giving effect to our anticipated share split.
Subsequent to the transactions described above, the Oak Hill Funds control approximately 95.4% and certain members of our Board of Directors and management control approximately 4.5% of the outstanding common stock. The remaining 0.1% is owned by a former member of management.
Sale of Common Stock and Exercise of Options
On March 23, 2011, we sold to Dolf Berle, a member of management, 75 shares of our common stock held as treasury stock for an aggregate sale price equal to $75,000 the value based on an independent third party valuation prepared as of January 30, 2011.
106
Table of Contents
On January 18, 2012, we sold 833 shares of our common stock held as treasury stock to three outside directors. Kevin M. Sheehan purchased 500 shares for an aggregate price equal to $600,000. Jonathan S. Halkyard and Michael J. Griffith each purchased 166.67 shares for an aggregate price equal to $200,004. Proceeds from the sales were used to repay funds that had been advanced to us by Dave & Buster’s, Inc. The per share sales price in each of those transactions approximates the value per share as determined by an independent third party valuation prepared as of October 30, 2011.
On January 6, 2014, William J. Robertson, a former member of management, exercised his option for 80 shares at a strike price of $1,000. We issued new shares in satisfaction of this exercise. Proceeds from the exercise were allocated to Dave & Buster’s, Inc. in anticipation of future expenses.
All share amounts above are calculated before giving effect to our anticipated share split.
Expense Reimbursement Agreement
We entered into an expense reimbursement agreement with Oak Hill Capital Management, LLC, concurrently with the consummation of the Acquisition. Pursuant to this agreement, we reimbursed Oak Hill Capital Management, LLC approximately $35,000, $95,000, $115,000, $76,000 and $297,000 in the twenty-six weeks ended August 3, 2014, the twenty-six weeks ended August 4, 2013 and fiscal 2013, 2012 and 2011, respectively, for costs and expenses.
The expense reimbursement agreement will automatically terminate upon the consummation of an initial public offering (including this offering). The Oak Hill Funds and their affiliates will be reimbursed for certain costs and expenses pursuant to the new stockholders’ agreement.
Existing Stockholders’ Agreement
We, certain members of management and the Oak Hill Funds entered into a stockholders’ agreement as of June 1, 2010. The stockholders’ agreement contains, among other things, certain restrictions on the ability of the parties thereto to freely transfer our securities held by such parties. In addition, the stockholders’ agreement provides that the Oak Hill Funds may compel a sale of all or a portion of the equity in us to a third party (commonly known as drag-along rights) and, alternatively, that our stockholders may participate in certain sales of stock by the Oak Hill Funds to third parties (commonly known as tag-along rights). The stockholders’ agreement also contains certain corporate governance provisions regarding the nomination of our directors and officers by the parties thereto. The stockholders’ agreement also provides that our stockholders, under certain circumstances, will have the ability to cause us to register our common equity securities under the Securities Act, and provide for procedures by which certain of our equity holders may participate in such registrations.
In connection with this offering, the stockholders’ agreement will be terminated; however, the provisions that provide that our stockholders, under certain circumstances, will have the ability to cause us to register our common equity securities under the Securities Act, and provide for procedures by which certain of our equity holders may participate in such registration, will be included in a registration rights agreement among us, certain members of management and the Oak Hill Funds in connection with this offering.
New Stockholders’ Agreement
In connection with this offering, we and the Oak Hill Funds will enter into a stockholders’ agreement. The stockholders’ agreement will set the number of directors of our Board of Directors initially at , and the Oak Hill Funds (or one or more of their affiliates, to the extent assigned thereto), individually or in the aggregate, will be entitled to designate directors to serve on the Board of Directors proportionate to the Oak Hill Funds’ (or one or more of their affiliates, to the extent assigned thereto) aggregate ownership of the outstanding shares of our common stock, at any meeting of stockholders at which directors are to be elected to the extent that the Oak Hill Funds do not have such proportionate number of director designees then serving on the Board of Directors; provided that for so long as the Oak Hill Funds (or one or more of their affiliates, to the extent assigned thereto), individually or in the aggregate, own 5% or more of the voting power of the outstanding shares of our common stock, the Oak Hill Funds will be entitled to designate one director designee to serve on the Board of Directors at any meeting of
107
Table of Contents
stockholders at which directors are to be elected to the extent that the Oak Hill Funds do not have a director designee then serving on the Board of Directors. Such proportionate number of director designees will be determined by taking the product of the Oak Hill Funds’ (or one or more of their affiliates, to the extent assigned thereto) aggregate ownership of the outstanding shares of our common stock multiplied by the then current number of directors on our Board of Directors (rounded up to the next whole number to the extent the product does not equal a whole number). The Oak Hill Funds’ director designees will initially be J. Taylor Crandall, Kevin M. Mailender and Tyler J. Wolfram, and, therefore, the Oak Hill Funds will be entitled to designate additional directors in order for Oak Hill to have its proportionate number of director designees. We will expand the size of our Board of Directors if necessary to provide for such proportionate representation.
Subject to applicable law and applicable NASDAQ rules, the stockholders’ agreement will also provide that the Oak Hill Funds will be entitled to nominate the members of the Nominating and Corporate Governance Committee. In addition, subject to applicable law and applicable NASDAQ rules, each other committee of our Board of Directors, other than the Audit Committee, will consist of at least one member designated by the Oak Hill Funds. The stockholders’ agreement will also provide that the Oak Hill Funds and their affiliates will be reimbursed for costs and out of pocket expenses incurred in connection with (i) counsel retained by Oak Hill to advise its nominees and/or us in connection with matters related to or arising out of meetings of the Board of Directors (or committees thereof) or otherwise raised by management, (ii) any review, amendment or enforcement of the stockholders’ agreement, (iii) the agreements entered into in connection with this offering and transactions contemplated thereby and (iv) any of our regulatory filings involving the Oak Hill Funds or its affiliates. In furtherance of our amended and restated certificate of incorporation, the stockholders’ agreement will provide that the Oak Hill Funds and their affiliates have no obligation to offer us an opportunity to participate in business opportunities presented to Oak Hill Funds or their respective affiliates even if the opportunity is one that we might reasonably have pursued (and therefore may be free to compete with us in the same business or similar businesses), and that neither the Oak Hill Funds nor their respective affiliates will be liable to us or our stockholders for breach of any duty by reason of any such activities unless, in the case of any person who is a director or officer of our company, such business opportunity is expressly offered to such director or officer in writing solely in his or her capacity as an officer or director of our company. The Oak Hill Funds, as part of a privately negotiated sale of its shares, may assign all or any portion of its rights under the stockholders’ agreement to any transferee. The stockholders’ agreement will terminate upon the written request of the Oak Hill Funds or at such time as the Oak Hill Funds own less than 5% of our common stock.
Registration Rights Agreement
In connection with this offering, we and the Oak Hill Funds will enter into a registration rights agreement. The registration rights agreement will provide that our stockholders, under certain circumstances, will have the ability to cause us to register our common equity securities under the Securities Act, and provide for procedures by which certain of our equity holders may participate in such registrations. The Oak Hill Funds will have an unlimited amount of demand registrations and all holders of registrable securities will have customary piggyback registration rights providing them with the right to require us to include shares of common stock held by them in each such registration. The Oak Hill Funds may, to any of their respective affiliates or as part of a privately negotiated sale of their respective shares, in each case, assign all or any portion of their rights under the registration rights agreement to any transferee who agrees to be bound by the agreement.
Relationship with OHA Funds
Funds managed by Oak Hill Advisors, L.P. (the “OHA Funds”) collectively comprise one of 22 creditors participating in the term loan portion of our senior secured credit facility. As of September 2, 2014, the OHA Funds held approximately 10.00%, or $53.0 million, of our total term loan obligation. Oak Hill Advisors, L.P. is an independently managed investment firm that is not an affiliate of Oak Hill Capital Partners. Oak Hill Advisors, L.P. and an affiliate of Oak Hill Capital Management, LLC co-manage Oak Hill Special Opportunities Fund, L.P., a private fund. Certain employees of Oak Hill Capital Management, LLC, in their individual capacities, have passive investments in Oak Hill Advisors, L.P. and/or the funds it manages.
108
Table of Contents
Related Transactions
Contemporaneously with this offering, the Board of Directors will adopt a Related Party Transaction Policy to provide for timely internal review of prospective transactions with related persons, as well as approval or ratification, and appropriate oversight and public disclosure, of such transactions. The Related Party Transaction Policy will generally cover transactions with the company, on the one hand, and a director or executive officer of the company, a nominee for election as a director of the company, any security holder of the company that owns (owns of record or beneficially) five percent or more of any class of the company’s voting securities and any immediate family member of any of the foregoing persons, on the other hand. The Related Party Transaction Policy will exempt certain transactions or arrangements (including, among others, (i) reimbursement or payment of business expenses pursuant to the stockholders’ agreement to be entered into between us and the Oak Hill Funds and (ii) certain corporate opportunities permitted by our amended and restated certificate of incorporation) from its coverage because of their nature, size and/or degree of significance and such exempted transactions are not required to be reported to, reviewed by, and approved or ratified pursuant to the terms of such policy.
The Related Party Transaction Policy will supplement the provisions of our Code of Business Conduct and Ethics concerning potential conflict of interest situations, which, pursuant to its terms, provides that unless a written waiver is granted (as explained below), employees may not (a) perform services for or have a financial interest in a private company that is, or may become, a supplier, customer or competitor of us; (b) perform services for or own more than 1% of the equity of a publicly traded company that is, or may become, a supplier, customer or competitor of us or (c) perform outside work or otherwise engage in any outside activity or enterprise that may interfere in any way with job performance or create a conflict with our best interests. Employees are under a continuing obligation to disclose to their supervisors any situation that presents the possibility of a conflict or disparity of interest between the employee and us. An employee’s conflict of interest may only be waived if both the Legal Department and the employee’s supervisor waive the conflict in writing. An officer’s conflict of interest may only be approved pursuant to the Related Party Transaction Policy.
109
Table of Contents
The following is a description of the material terms of our amended and restated certificate of incorporation and amended and restated bylaws as they will be in effect immediately prior to the consummation of this offering. This summary is qualified in its entirety by reference to the actual terms and provisions of our amended and restated certificate of incorporation and amended and restated bylaws, copies of which will be filed as exhibits to the registration statement of which this prospectus is a part.
Authorized Capitalization
Our shares of common stock are currently held by 19 holders. Immediately prior to the consummation of this offering, our authorized capital stock will consist of shares of common stock, par value $0.01 per share, and shares of preferred stock, par value $0.01 per share. Immediately following the completion of this offering, shares of common stock, or shares if the underwriters exercise their option to purchase additional shares in full, will be outstanding, and there will be no outstanding shares of preferred stock.
Common Stock
The holders of our common stock are entitled to the following rights:
Voting Rights
Each share of common stock entitles the holder to one vote with respect to each matter presented to our stockholders on which the holders of common stock are entitled to vote. Our common stock votes as a single class on all matters relating to the election and removal of directors on our Board of Directors and as provided by law, with each share of common stock entitling its holder to one vote. Holders of our common stock will not have cumulative voting rights. Accordingly, a plurality of votes cast by holders of our common stock entitled to vote in any election of directors may elect all of the directors standing for election. Except with respect to the election of directors and as otherwise provided in our amended and restated certificate of incorporation or required by law, all matters to be voted on by our stockholders must be approved by a majority of the shares present in person or by proxy at the meeting and entitled to vote on the subject matter.
Pursuant to the stockholders’ agreement, the Oak Hill Funds will be entitled to designate directors to serve on the Board of Directors proportionate to the Oak Hill Funds’ (or one or more of their affiliates, to the extent assigned thereto) aggregate ownership of the outstanding shares of our common stock, at any meeting of stockholders at which directors are to be elected to the extent that the Oak Hill Funds do not have such proportionate number of director designees then serving on the Board of Directors; provided that for so long as the Oak Hill Funds (or one or more of their affiliates, to the extent assigned thereto), individually or in the aggregate, own 5% or more of the voting power of the outstanding shares of our common stock, the Oak Hill Funds will be entitled to designate one director designee to serve on the Board of Directors at any meeting of stockholders at which directors are to be elected to the extent that the Oak Hill Funds do not have a director designee then serving on the Board of Directors. Such proportionate number of director designees will be determined by taking the product of the Oak Hill Funds’ (or one or more of their affiliates, to the extent assigned thereto) aggregate ownership of the outstanding shares of our common stock and multiplied by the then current number of directors on our Board of Directors (rounded up to the next whole number to the extent the product does not equal a whole number). The Oak Hill Funds’ director designees will initially be J. Taylor Crandall, Kevin M. Mailender and Tyler J. Wolfram, and, therefore, the Oak Hill Funds will be entitled to designate additional directors in order for the Oak Hill Funds to have its proportionate number of director designees. We will expand the size of our Board of Directors if necessary to provide for such proportionate representation. Subject to applicable law and applicable NASDAQ rules, the stockholders’ agreement will also provide that the Oak Hill Funds will be entitled to nominate the members of the Nominating and Corporate Governance Committee. In addition, subject to applicable law and applicable NASDAQ rules, each other committee of our Board of Directors, other than the Audit Committee, will consist of at least one member designated by the Oak Hill Funds.
Dividend Rights
Holders of common stock will share equally in any dividend declared out of legally available funds by our Board of Directors, subject to any preferential rights of the holders of any outstanding preferred stock.
110
Table of Contents
Liquidation Rights
In the event of any voluntary or involuntary liquidation, dissolution or winding up of our affairs, holders of our common stock would be entitled to share ratably in our assets that are legally available for distribution to stockholders after payment of liabilities. If we have any preferred stock outstanding at such time, holders of the preferred stock may be entitled to distribution and/or liquidation preferences. In either such case, we must pay the applicable distribution to the holders of our preferred stock before we may pay distributions to the holders of our common stock.
Other Rights
Our stockholders have no subscription, redemption or conversion privileges. Our common stock does not entitle its holders to preemptive rights for additional shares and does not have any sinking fund provisions. All of the outstanding shares of our common stock are fully paid and nonassessable. The rights, preferences and privileges of the holders of our common stock are subject to the rights of the holders of shares of any series of preferred stock which we may issue.
Registration Rights
Our existing stockholders have certain registration rights with respect to our common stock pursuant to the existing stockholders’ agreement and will continue to have certain registration rights pursuant to the registration rights agreement. For further information regarding these agreements, see “Certain Relationships and Related Transactions—Existing Stockholders’ Agreement,” “Certain Relationships and Related Transactions—Registration Rights Agreement” and “Shares Eligible for Future Sale.”
Preferred Stock
Our Board of Directors is authorized to provide for the issuance of preferred stock in one or more series and to fix the preferences, powers and relative, participating, optional or other special rights, and qualifications, limitations or restrictions thereof, including the dividend rate, conversion rights, voting rights, redemption rights and liquidation preference and to fix the number of shares to be included in any such series without any further vote or action by our stockholders. Any preferred stock so issued may rank senior to our common stock with respect to the payment of dividends or amounts upon liquidation, dissolution or winding up, or both. In addition, any such shares of preferred stock may have class or series voting rights. The issuance of preferred stock may have the effect of delaying, deferring or preventing a change of control of our company without further action by the stockholders and may adversely affect the voting and other rights of the holders of our common stock. Our Board of Directors has not authorized the issuance of any shares of preferred stock, and we have no agreements or current plans for the issuance of any shares of preferred stock.
Anti-takeover Effects of our Amended and Restated Certificate of Incorporation and Amended and Restated Bylaws
Upon the closing of this offering, our amended and restated certificate of incorporation and amended and restated bylaws will contain provisions that may delay, defer or discourage another party from acquiring control of us. We expect that these provisions, which are summarized below, will discourage coercive takeover practices or inadequate takeover bids. These provisions are also designed to encourage persons seeking to acquire control of us to first negotiate with our Board of Directors, which we believe may result in an improvement of the terms of any such acquisition in favor of our stockholders. However, they also give our Board of Directors the power to discourage acquisitions that some stockholders may favor.
Our amended and restated certificate of incorporation will provide that directors may be removed only for cause by the affirmative vote of a majority of the remaining members of the Board of Directors or the holders of at least 66 2/3% of the voting power of all shares of capital stock then entitled to vote on the election of directors, voting together as a single class. Furthermore, any vacancy on our Board of Directors, however occurring, including a vacancy resulting from an increase in the size of our Board of Directors, may only be filled by the affirmative vote of a majority of our directors then in office even if less than a quorum and in accordance with the stockholders’ agreement.
No Stockholder Action by Written Consent. Our amended and restated certificate of incorporation will provide that, subject to the rights of any holders of preferred stock to act by written consent instead of a meeting, stockholder
111
Table of Contents
action may be taken only at an annual meeting or special meeting of stockholders and may not be taken by written consent instead of a meeting, unless affiliates of the Oak Hill Funds own at least 40% of our outstanding common stock or the action to be taken by written consent of stockholders and the taking of this action by written consent has been expressly approved in advance by the Board of Directors. Failure to satisfy any of the requirements for a stockholder meeting could delay, prevent or invalidate stockholder action.
Requirements for Advance Notification of Stockholder Meetings, Nominations and Proposals. Our amended and restated bylaws will provide that special meetings of the stockholders may be called only upon the request of a majority of our Board of Directors or by our Chief Executive Officer. Our amended and restated bylaws will prohibit the conduct of any business at a special meeting other than as specified in the notice for such meeting. These provisions may have the effect of deferring, delaying or discouraging hostile takeovers or changes in control or management of our company.
Our amended and restated bylaws will establish advance notice procedures with respect to stockholder proposals and the nomination of candidates for election as directors, other than nominations made by or at the direction of our Board of Directors or a committee of the Board of Directors. In order for any matter to be “properly brought” before a meeting, a stockholder will have to comply with the advance notice requirements of directors, which may be filled only by a vote of a majority of directors then in office, even though less than a quorum, and not by the stockholders. Our amended and restated bylaws will allow the presiding officer at a meeting of the stockholders to adopt rules and regulations for the conduct of meetings which may have the effect of precluding the conduct of certain business at a meeting if the rules and regulations are not followed. These provisions may also defer, delay or discourage a potential acquirer from conducting a solicitation of proxies to elect the acquirer’s own slate of directors or otherwise attempting to obtain control of our company.
Amendment to Amended and Restated Bylaws and Amended and Restated Certificate of Incorporation. Any amendment to our amended and restated certificate of incorporation must first be approved by a majority of our Board of Directors and (i) if required by law, thereafter be approved by a majority of the outstanding shares entitled to vote on the amendment or (ii) if related to provisions regarding the classification of the Board of Directors, the removal of directors, indemnification, corporate opportunities, business combinations, forum, severability, the provision opting-out of Section 203 of the Delaware General Corporation Law (“DGCL”), or the amendment of our amended and restated bylaws or amended and restated certificate of incorporation, thereafter be approved by 66 2/3% of the outstanding shares entitled to vote on the amendment. Our amended and restated bylaws may be amended subject to any limitations set forth in the bylaws (x) by the affirmative vote of a majority of the directors then in office, without further stockholder action or (y) by the affirmative vote of at least 66 2/3% of the outstanding shares entitled to vote generally in the election of directors.
Authorized but Unissued Shares. The authorized but unissued shares of our common stock and our preferred stock will be available for future issuance without any further vote or action by our stockholders. These additional shares may be utilized for a variety of corporate purposes, including future public offerings to raise additional capital, corporate acquisitions and employee benefit plans. The existence of authorized but unissued shares of our common stock and our preferred stock could render more difficult or discourage an attempt to obtain control over us by means of a proxy contest, tender offer, merger or otherwise.
Exclusive Forum. Our amended and restated certificate of incorporation will provide that, subject to certain exceptions, the Court of Chancery of the State of Delaware shall be the sole and exclusive forum for certain stockholder litigation matters. However, it is possible that a court could rule that this provision is unenforceable or inapplicable.
Delaware Anti-Takeover Statute
Upon the closing of this offering, our amended and restated certificate of incorporation will provide that the provisions of Section 203 of the DGCL, which relate to business combinations with interested stockholders, do not apply to us. Section 203 of the DGCL prohibits a publicly held Delaware corporation from engaging in a business combination transaction with an interested stockholder (a stockholder who owns more than 15% of our common stock) for a period of three years after the interested stockholder became such unless the transaction fits within an
112
Table of Contents
applicable exemption, such as board approval of the business combination or the transaction that resulted in such stockholder becoming an interested stockholder. These provisions would apply even if the business combination could be considered beneficial by some shareholders. However, our amended and restated certificate of incorporation will contain provisions that have the same effect as Section 203 of the DGCL, except that they will provide that the Oak Hill Funds, or any affiliate thereof or any person or entity which acquires from any of the foregoing stockholders beneficial ownership of 5% or more of the then outstanding shares of our voting stock in a transaction or any person or entity which acquires from such transferee beneficial ownership of 5% or more of the then outstanding shares of our voting stock other than through a registered public offering or through any broker’s transaction executed on any securities exchange or other over-the-counter market, shall not be deemed an “interested stockholder” for purposes of this provision of our amended and restated certificate of incorporation and therefore not subject to the restrictions set forth in this provision.
Indemnification of Officers and Directors
Our amended and restated certificate of incorporation will provide that we will indemnify our directors and officers to the fullest extent permitted by the DGCL.
Our amended and restated certificate of incorporation will provide that our directors will not be liable for monetary damages for breach of fiduciary duty. Our amended and restated bylaws will provide that we will indemnify our directors and officers to the fullest extent permitted by the DGCL.
In addition, prior to the completion of our initial public offering, we will enter into indemnification agreements with each of our executive officers and directors. The indemnification agreements will provide the executive officers and directors with contractual rights to indemnification, expense advancement and reimbursement to the fullest extent permitted under the DGCL, subject to certain exceptions contained in those agreements.
We have customary directors’ and officers’ indemnity insurance in place for our directors and executive officers.
There is no pending litigation or proceeding naming any of our directors or officers for which indemnification is being sought, and we are not aware of any pending or threatened litigation that may result in claims for indemnification by any director or officer.
Insofar as indemnification for liabilities arising under the Securities Act may be permitted to directors, officers or persons controlling the registrant pursuant to the foregoing provisions, the registrant has been informed that in the opinion of the SEC such indemnification is against public policy as expressed in the Act and is therefore unenforceable.
Corporate Opportunities
Our amended and restated certificate of incorporation and the stockholders’ agreement will provide that the Oak Hill Funds and their affiliates have no obligation to offer us an opportunity to participate in business opportunities presented to the Oak Hill Funds or their respective affiliates even if the opportunity is one that we might reasonably have pursued (and therefore may be free to compete with us in the same business or similar businesses), and that neither the Oak Hill Funds nor their respective affiliates will be liable to us or our stockholders for breach of any duty by reason of any such activities unless, in the case of any person who is a director or officer of our company, such business opportunity is expressly offered to such director or officer in writing solely in his or her capacity as an officer or director of our company.
Listing
We intend to apply to have our common stock listed on NASDAQ under the symbol “PLAY.”
Transfer Agent and Registrar
The transfer agent and registrar for our common stock is Computershare Trust Company, N.A.
113
Table of Contents
SHARES ELIGIBLE FOR FUTURE SALE
Prior to this offering, there was no public market for our common stock.
Sale of Restricted Securities
After this offering, there will be outstanding shares (assuming no exercise of the underwriters’ option to purchase additional shares), or shares (assuming full exercise of the underwriters’ option to purchase additional shares), of our common stock, in each case including shares of restricted stock and stock awards we intend to grant to our named executive officers and other employees and certain of our directors at the time of this offering. Of these shares, all of the shares of our common stock sold in this offering will be freely tradable in the public market, unless purchased by our “affiliates” as that term is defined in Rule 144 under the Securities Act. Subject to the lock-up agreements described below, shares held by our affiliates that are not “restricted securities” as defined in Rule 144 under the Securities Act may be sold subject to compliance with Rule 144 of the Securities Act without regard to the prescribed one-year holding period under Rule 144. shares of our common stock held by our existing shareholders will be “restricted securities.”
Lock-up Arrangements
In connection with this offering, we, each of our directors, executive officers and certain of our significant stockholders, representing shares of our common stock, will enter into lock-up agreements as described under “Underwriting” that restrict the sale of shares of our common stock for up to 180 days after the date of this prospectus, subject to an extension in certain circumstances.
In addition, following the expiration of the lock-up period, certain stockholders will have the right, subject to certain conditions, to require us to register the sale of their shares of our common stock under federal securities laws. If these stockholders exercise this right, our other existing stockholders may require us to register their registrable securities. By exercising their registration rights, and selling a large number of shares, these existing stockholders could cause the prevailing market price of our common stock to decline.
Following the lock-up periods described above, all of the shares of our common stock that are restricted securities or are held by our affiliates as of the date of this prospectus will be eligible for sale in the public market in compliance with Rule 144 under the Securities Act.
Rule 144
The shares of our common stock sold in this offering will generally be freely transferable without restriction or further registration under the Securities Act, except that any shares of our common stock held by an “affiliate” of ours may not be resold publicly except in compliance with the registration requirements of the Securities Act or under an exemption under Rule 144 or otherwise. Rule 144 permits our common stock that has been acquired by a person who is an affiliate of ours, or has been an affiliate of ours within the past three months, to be sold into the market in an amount that does not exceed, during any three-month period, the greater of:
| n | one percent of the total number of shares of our common stock outstanding; or |
| n | the average weekly reported trading volume of our common stock for the four calendar weeks prior to the sale. |
Such sales are also subject to specific manner of sale provisions, a six-month holding period requirement, notice requirements and the availability of current public information about us.
All shares of our common stock held by existing shareholders are subject to the lock-up arrangements described above and will not be eligible for sale under Rule 144 immediately upon closing this offering.
Rule 144 also provides that a person who is not deemed to have been an affiliate of ours at any time during the three months preceding a sale, and who has for at least six months beneficially owned shares of our common stock that are restricted securities, will be entitled to freely sell such shares of our common stock subject only to the
114
Table of Contents
availability of current public information regarding us. A person who is not deemed to have been an affiliate of ours at any time during the three months preceding a sale, and who has beneficially owned for at least one year shares of our common stock that are restricted securities, will be entitled to freely sell such shares of our common stock under Rule 144 without regard to the current public information requirements of Rule 144.
Equity Compensation Plan
We intend to file one or more registration statements on Form S-8 under the Securities Act to register shares of our common stock issued or reserved for issuance under the equity compensation plan, referred to under “Executive Compensation—Compensation Discussion and Analysis—Annual Incentive Plan.” The first such registration statement is expected to be filed soon after the date of this prospectus and will automatically become effective upon filing with the SEC. Accordingly, shares registered under such registration statement will be available for sale in the open market, unless such shares are subject to vesting restrictions with us or the lock-up restrictions described above.
Registration Rights
Upon the closing of this offering, the holders of an aggregate of shares of our common stock will be entitled to rights with respect to the registration of these shares under the Securities Act. Registration of these shares under the Securities Act would result in these shares becoming freely tradable without restriction under the Securities Act immediately upon the effectiveness of registration, except for shares purchased by affiliates. For more information, see “Certain Relationships and Related Transactions—Existing Stockholders’ Agreement” and “Certain Relationships and Related Transactions—Registration Rights Agreement.”
115
Table of Contents
CERTAIN MATERIAL UNITED STATES FEDERAL INCOME AND ESTATE TAX CONSIDERATIONS
The following is a general discussion of the material United States federal income and estate tax consequences of the purchase, ownership and disposition of common stock that may be relevant to you if you are a non-U.S. Holder (as defined below), and is based upon the Code, the Treasury Department regulations promulgated thereunder, and administrative and judicial interpretations thereof, all as of the date hereof and all of which are subject to change, possibly with retroactive effect. This discussion is limited to non-U.S. Holders who hold shares of common stock as capital assets within the meaning of Section 1221 of the Code. Moreover, this discussion is for general information only and does not address all the tax consequences that may be relevant to you in light of your particular circumstances, such as the Medicare tax on certain investment income, nor does it discuss special tax provisions, which may apply to you if you relinquished U.S. citizenship or residence, are a “controlled foreign corporation,” “passive foreign investment company” or a partnership or other pass-through entity for United States federal income tax purposes.
As used in this discussion, the term “non-U.S. Holder” means a beneficial owner of our common stock that is not, for United States federal income tax purposes:
| n | any individual who is a citizen or resident of the United States, |
| n | any corporation (or other entity taxable as a corporation for United States federal income tax purposes) created or organized in or under the laws of the United States, any state thereof or the District of Columbia, |
| n | any estate the income of which is subject to United States federal income taxation regardless of its source, or |
| n | any trust if (i) a court within the United States is able to exercise primary supervision over the administration of the trust and one or more U.S. persons have the authority to control all substantial decisions of the trust or (ii) it was in existence on August 20, 1996 and has a valid election in effect under applicable Treasury Department regulations to be treated as a domestic trust for United States federal income tax purposes. |
If you are an individual, you may, in many cases, be deemed to be a resident alien, as opposed to a nonresident alien, by virtue of being present in the United States (1) for at least 183 days during the calendar year, or (2) for at least 31 days in the calendar year and for an aggregate of at least 183 days during a three-year period ending in the current calendar year. For purposes of (2), all the days present in the current year, one-third of the days present in the immediately preceding year, and one-sixth of the days present in the second preceding year are counted. Resident aliens are subject to United States federal income tax as if they were U.S. citizens.
If a partnership, including any entity or arrangement treated as a partnership for United States federal income tax purposes, is a holder of our common stock, the tax treatment of a partner in the partnership will generally depend upon the status of the partner, the activities of the partnership and certain determinations made at the partner level. A holder that is a partnership, and the partners in such partnership, should consult their own tax advisors regarding the tax consequences of the purchase, ownership and disposition of our common stock.
EACH PROSPECTIVE PURCHASER OF COMMON STOCK IS ADVISED TO CONSULT A TAX ADVISOR WITH RESPECT TO CURRENT AND POSSIBLE FUTURE TAX CONSEQUENCES OF PURCHASING, OWNING AND DISPOSING OF OUR COMMON STOCK, AS WELL AS ANY TAX CONSEQUENCES THAT MAY ARISE UNDER THE LAWS OF ANY U.S. STATE, MUNICIPALITY OR OTHER TAXING JURISDICTION, IN LIGHT OF THE PROSPECTIVE PURCHASER’S PARTICULAR CIRCUMSTANCES.
Dividends
We do not anticipate making any distributions on our common stock. See “Dividend Policy.” If distributions are paid on shares of our common stock, such distributions will constitute dividends for United States federal income tax purposes to the extent paid from our current or accumulated earnings and profits, as determined under United States federal income tax principles. If a distribution exceeds our current and accumulated earnings and profits, such excess will constitute a return of capital that reduces, but not below zero, a non-U.S. Holder’s tax basis in our
116
Table of Contents
common stock. Any remainder will constitute gain from the sale or exchange of our common stock. If dividends are paid, as a non-U.S. Holder, you will be subject to withholding of United States federal income tax at a 30% rate, or a lower rate as may be specified by an applicable income tax treaty, on the gross amount of the dividends paid to you. To claim the benefit of a lower rate under an income tax treaty, you must properly file with the payor an Internal Revenue Service (“IRS”) Form W-8BEN or W-8BEN-E, as applicable, or other applicable form, claiming an exemption from or reduction in withholding under the applicable tax treaty.
If dividends are considered effectively connected with the conduct of a trade or business by you within the United States and, if required by an applicable income tax treaty, are attributable to a United States permanent establishment of yours, those dividends will be subject to United States federal income tax on a net basis at applicable graduated individual or corporate rates, but you will not be subject to withholding tax provided an IRS Form W-8ECI, or other applicable form, is filed with the payor. If you are a foreign corporation, any effectively connected dividends may, under certain circumstances, be subject to an additional “branch profits tax” at a rate of 30% or a lower rate as may be specified by an applicable income tax treaty.
You must comply with the certification procedures described above, or, in the case of payments made outside the United States with respect to an offshore account, certain documentary evidence procedures, directly or, under certain circumstances, through an intermediary, to obtain the benefits of a reduction in the rate of, or exemption from, withholding under an income tax treaty with respect to dividends paid with respect to your common stock. In addition, if you are required to provide an IRS Form W-8ECI or other applicable form, as discussed above, you must also provide your United States taxpayer identification number.
If you are eligible for a reduced rate of U.S. federal withholding tax pursuant to an income tax treaty, you may obtain a refund of any excess amounts withheld by timely filing an appropriate claim for refund with the IRS.
Gain on Disposition of Common Stock
Subject to the discussion below on backup withholding and other withholding requirements, as a non-U.S. Holder, you generally will not be subject to United States federal income or withholding tax on any gain recognized on a sale or other disposition of common stock unless:
| n | the gain is considered effectively connected with the conduct of a trade or business by you within the United States and, if required by an applicable income tax treaty, is attributable to a United States permanent establishment of yours (in which case the gain will be subject to United States federal income tax on a net basis at applicable individual or corporate rates and, if you are a foreign corporation, the gain may, under certain circumstances, be subject to an additional branch profits tax equal to 30% or a lower rate as may be specified by an applicable income tax treaty); |
| n | you are an individual who is present in the United States for 183 or more days in the taxable year of the sale or other disposition and certain other conditions are met (in which case, except |
| n | as otherwise provided by an applicable income tax treaty, the gain, which may be offset by U.S. source capital losses, generally will be subject to a flat 30% United States federal income tax, even though you are not considered a resident alien); or |
| n | we are or become a United States real property holding corporation (“USRPHC”) at any time during the shorter of the five-year period ending on the date of the disposition of our common stock or your holding period for our common stock (the “applicable period”). We believe that we are not currently, and are not likely not to become, a USRPHC. Even if we are or were to become a USRPHC, gain on the sale or other disposition of common stock by you generally would not be subject to United States federal income tax provided: |
| n | the common stock was “regularly traded on an established securities market”; and |
| n | you do not actually or constructively own more than 5% of our outstanding common stock during the applicable period. |
117
Table of Contents
Federal Estate Tax
The estates of nonresident alien individuals generally are subject to U.S. federal estate tax on property with a U.S. situs. Because we are a U.S. corporation, our common stock will be U.S. situs property and therefore will be included in the taxable estate of a nonresident alien decedent, unless an applicable estate tax treaty between the United States and the decedent’s country of residence provides otherwise.
Information Reporting and Backup Withholding Tax
We must report annually to the IRS and to each of you the amount of dividends paid to you and any tax withheld with respect to those dividends, regardless of whether withholding was required. Copies of the information returns reporting those dividends and withholding may also be made available to the tax authorities in the country in which you reside under the provisions of an applicable income tax treaty or other applicable agreements.
Backup withholding is generally imposed (currently at a 28% rate) on certain payments to persons that fail to furnish the necessary identifying information to the payor. You generally will be subject to backup withholding tax with respect to dividends paid on your common stock unless you certify to the payor your non-U.S. status. Dividends subject to withholding of United States federal income tax as described above in “—Dividends” would not be subject to backup withholding.
The payment of proceeds of a sale of common stock effected by or through a United States office of a broker is subject to both backup withholding and information reporting unless you provide the payor with your name and address and you certify your non-U.S. status or you otherwise establish an exemption. In general, backup withholding and information reporting will not apply to the payment of the proceeds of a sale of common stock by or through a foreign office of a broker. If, however, such broker is a U.S. person, a controlled foreign corporation, a foreign person that derives 50% or more of its gross income for certain periods from the conduct of a trade or business in the United States or a foreign partnership that at any time during its tax year either is engaged in the conduct of a trade or business in the United States or has as partners one or more U.S. persons that, in the aggregate, hold more than 50% of the income or capital interest in the partnership, backup withholding will not apply but such payments will be subject to information reporting, unless such broker has documentary evidence in its records that you are a non-U.S. Holder and certain other conditions are met or you otherwise establish an exemption.
Backup withholding is not an additional tax. Any amounts withheld under the backup withholding rules generally will be allowed as a refund or a credit against your United States federal income tax liability provided the required information is furnished in a timely manner to the IRS.
Other Withholding Requirements
Non-U.S. Holders of our common stock may be subject to U.S. withholding tax at a rate of 30% under sections 1471 through 1474 of the Code (commonly referred to as “FATCA”). This withholding tax may apply if a non-U.S. Holder (or any foreign intermediary that receives a payment on a non-U.S. Holder’s behalf) does not comply with certain U.S. information reporting requirements and does not otherwise qualify for an exemption from these rules. The payments potentially subject to this withholding tax include dividends on, and gross proceeds from the sale or other disposition of, our common stock. If FATCA is not complied with, the withholding tax described above will apply to dividends paid on or after July 1, 2014, and to gross proceeds from the sale or other disposition of our common stock on or after January 1, 2017. Certain non-U.S. Holders located in jurisdictions that have an intergovernmental agreement with the United States governing FATCA may be subject to different rules. Non-U.S. Holders should consult their tax advisors regarding the possible implications of FATCA on their investment in our common stock.
118
Table of Contents
Subject to the terms and conditions set forth in the underwriting agreement, dated , 2014, among us and Jefferies LLC and Piper Jaffray & Co., as the representatives of the underwriters named below and the joint book-running managers of this offering, we have agreed to sell to the underwriters, and each of the underwriters has agreed, severally and not jointly, to purchase from us, the respective number of shares of common stock shown opposite its name below:
| UNDERWRITER |
NUMBER OF SHARES | |
| Jefferies LLC |
||
| Piper Jaffray & Co. |
||
| William Blair & Company, L.L.C. |
||
| Raymond James & Associates Inc. |
||
| Stifel, Nicolaus & Company, Incorporated |
||
| LOYAL3 Securities, Inc. |
||
|
| ||
| Total |
||
|
|
The underwriting agreement provides that the obligations of the several underwriters are subject to certain conditions precedent such as the receipt by the underwriters of officers’ certificates and legal opinions and approval of certain legal matters by their counsel. The underwriting agreement provides that the underwriters will purchase all of the shares of common stock if any of them are purchased. If an underwriter defaults, the underwriting agreement provides that the purchase commitments of the nondefaulting underwriters may be increased or the underwriting agreement may be terminated. We have agreed to indemnify the underwriters and certain of their controlling persons against certain liabilities, including liabilities under the Securities Act, and to contribute to payments that the underwriters may be required to make in respect of those liabilities.
The underwriters have advised us that, following the completion of this offering, they currently intend to make a market in the common stock as permitted by applicable laws and regulations. However, the underwriters are not obligated to do so, and the underwriters may discontinue any market-making activities at any time without notice in their sole discretion. Accordingly, no assurance can be given as to the liquidity of the trading market for the common stock, that you will be able to sell any of the common stock held by you at a particular time or that the prices that you receive when you sell will be favorable.
The underwriters are offering the shares of common stock subject to their acceptance of the shares of common stock from us and subject to prior sale. The underwriters reserve the right to withdraw, cancel or modify offers to the public and to reject orders in whole or in part.
Commission and Expenses
The underwriters have advised us that they propose to offer the shares of common stock to the public at the initial public offering price set forth on the cover page of this prospectus and to certain dealers, which may include the underwriters, at that price less a concession not in excess of $ per share of common stock. The underwriters may allow, and certain dealers may reallow, a discount from the concession not in excess of $ per share of common stock to certain brokers and dealers. After the offering, the initial public offering price, concession and reallowance to dealers may be reduced by the representatives. No such reduction will change the amount of proceeds to be received by us as set forth on the cover page of this prospectus.
119
Table of Contents
The following table shows the public offering price, the underwriting discounts and commissions that we are to pay the underwriters and the proceeds, before expenses, to us in connection with this offering. Such amounts are shown assuming both no exercise and full exercise of the underwriters’ option to purchase additional shares.
| PER SHARE | TOTAL | |||||||||||||||
| WITHOUT OPTION TO PURCHASE ADDITIONAL SHARES |
WITH OPTION TO PURCHASE ADDITIONAL SHARES |
WITHOUT OPTION TO PURCHASE ADDITIONAL SHARES |
WITH OPTION TO PURCHASE ADDITIONAL SHARES |
|||||||||||||
| Public offering price |
$ | $ | $ | $ | ||||||||||||
| Underwriting discounts and commissions paid by us |
$ | $ | $ | $ | ||||||||||||
| Proceeds to us, before expenses |
$ | $ | $ | $ | ||||||||||||
We estimate expenses payable by us in connection with this offering, other than the underwriting discounts and commissions referred to above, will be approximately $ . We have also agreed to reimburse the underwriters for certain of their expenses, in an amount up to $ , incurred in connection with review by the Financial Industry Regulatory Authority, Inc. of the terms of this offering, as set forth in the Underwriting Agreement.
Determination of Offering Price
Prior to this offering, there has not been a public market for our common stock. Consequently, the initial public offering price for our common stock will be determined by negotiations between us and the representatives. Among the factors to be considered in these negotiations will be prevailing market conditions, our financial information, market valuations of other companies that we and the underwriters believe to be comparable to us, estimates of our business potential, the present state of our development and other factors deemed relevant.
We offer no assurances that the initial public offering price will correspond to the price at which the common stock will trade in the public market subsequent to the offering or that an active trading market for the common stock will develop and continue after the offering.
Listing
We have applied to have our common stock listed on NASDAQ under the trading symbol “PLAY.”
Option to Purchase Additional Shares
We have granted to the underwriters an option, exercisable for 30 days from the date of this prospectus, to purchase, from time to time, in whole or in part, up to an aggregate of shares from us at the public offering price set forth on the cover page of this prospectus, less underwriting discounts and commissions. If the underwriters exercise this option, each underwriter will be obligated, subject to specified conditions, to purchase a number of additional shares proportionate to that underwriter’s initial purchase commitment as indicated in the table above. This option may be exercised only if the underwriters sell more shares than the total number set forth on the cover page of this prospectus.
No Sales of Similar Securities
We, our officers, directors and holders of all or substantially all our outstanding capital stock have agreed, subject to specified exceptions, not to directly or indirectly:
| n | sell, offer, contract or grant any option to sell (including any short sale), pledge, transfer, or |
| n | otherwise dispose of any shares of common stock, options or warrants to acquire shares of common stock, or securities exchangeable for or convertible into shares of common stock currently or hereafter beneficially owned, or |
| n | publicly announce an intention to do any of the foregoing for a period of 180 days after the date of this prospectus without the prior written consent of Jefferies LLC and Piper Jaffray & Co. |
120
Table of Contents
This restriction terminates after the close of trading of the common stock on and including the 180th day after the date of this prospectus.
Jefferies LLC and Piper Jaffray & Co. may, at any time or from time to time before the termination of the 180-day period release all or any portion of the securities subject to lock-up agreements. There are no existing agreements between the underwriters and any of our shareholders who will execute a lock-up agreement, providing consent to the sale of shares prior to the expiration of the lock-up period.
At our request, the underwriters have reserved up to % of the shares of common stock offered by this prospectus to be offered through the LOYAL3 platform at the initial public offering price. Purchases through the LOYAL3 platform will be in dollar amounts and may include fractional shares. The LOYAL3 platform is designed to facilitate participation of individual purchasers in initial public offerings in amounts starting at $100. Any purchase of our common shares in this offering through the LOYAL3 platform will be at the same initial public offering price, and at the same time, as purchases by institutions and other large investors. Individual investors, including employees, partners and consumers, in the United States who are interested in purchasing common shares in this offering through the LOYAL3 platform may go to LOYAL3’s website for information about how to become a customer of LOYAL3, which is required to purchase common shares through the LOYAL3 platform. The LOYAL3 platform is available fee-free to investors. Sales of our common stock by investors using the LOYAL3 platform will be completed through a batch or combined order process typically only once per day. The LOYAL3 platform and information on the LOYAL3 website do not form a part of this prospectus. The LOYAL3 platform is administered by LOYAL3 Securities, Inc., which is a U.S.-registered broker-dealer unaffiliated with the Company. LOYAL3 Securities, Inc. is acting as a co-manager for our offering.
Stabilization
The underwriters have advised us that they, pursuant to Regulation M under the Securities Exchange Act of 1934, as amended, or certain persons participating in the offering may engage in short sale transactions, stabilizing transactions, syndicate covering transactions or the imposition of penalty bids in connection with this offering. These activities may have the effect of stabilizing or maintaining the market price of the common stock at a level above that which might otherwise prevail in the open market. Establishing short sales positions may involve either “covered” short sales or “naked” short sales.
“Covered” short sales are sales made in an amount not greater than the underwriters’ option to purchase additional shares of our common stock in this offering. The underwriters may close out any covered short position by either exercising their option to purchase additional shares of our common stock or purchasing shares of our common stock in the open market. In determining the source of shares to close out the covered short position, the underwriters will consider, among other things, the price of shares available for purchase in the open market as compared to the price at which they may purchase shares through the option to purchase additional shares.
“Naked” short sales are sales in excess of the option to purchase additional shares of our common stock. The underwriters must close out any naked short position by purchasing shares in the open market. A naked short position is more likely to be created if the underwriters are concerned that there may be downward pressure on the price of the shares of our common stock in the open market after pricing that could adversely affect investors who purchase in this offering.
A stabilizing bid is a bid for the purchase of shares of common stock on behalf of the underwriters for the purpose of fixing or maintaining the price of the common stock. A syndicate covering transaction is the bid for or the purchase of shares of common stock on behalf of the underwriters to reduce a short position incurred by the underwriters in connection with the offering. Similar to other purchase transactions, the underwriter’s purchases to cover the syndicate short sales may have the effect of raising or maintaining the market price of our common stock or preventing or retarding a decline in the market price of our common stock. As a result, the price of our common stock may be higher than the price that might otherwise exist in the open market. A penalty bid is an arrangement permitting the underwriters to reclaim the selling concession otherwise accruing to a syndicate member in connection with the offering if the common stock originally sold by such syndicate member are purchased in a syndicate covering transaction and therefore have not been effectively placed by such syndicate member.
121
Table of Contents
Neither we, nor any of the underwriters make any representation or prediction as to the direction or magnitude of any effect that the transactions described above may have on the price of our common stock. The underwriters are not obligated to engage in these activities and, if commenced, any of the activities may be discontinued at any time.
Electronic Distribution
A prospectus in electronic format may be made available by e-mail or through online services maintained by one or more of the underwriters or their affiliates. In those cases, prospective investors may view offering terms online and may be allowed to place orders online. The underwriters may agree with us to allocate a specific number of shares of common stock for sale to online brokerage account holders. Any such allocation for online distributions will be made by the underwriters on the same basis as other allocations. Other than the prospectus in electronic format, the information on the underwriters’ web sites and any information contained in any other web site maintained by any of the underwriters is not part of this prospectus, has not been approved and/or endorsed by us or the underwriters and should not be relied upon by investors.
Other Activities and Relationships
The underwriters and certain of their respective affiliates are full service financial institutions engaged in various activities, which may include securities trading, commercial and investment banking, financial advisory, investment management, investment research, principal investment, hedging, financing and brokerage activities. The underwriters and certain of their respective affiliates have, from time to time, performed, and may in the future perform, various commercial and investment banking and financial advisory services for us and our affiliates, for which they received or will receive customary fees and expenses. In particular, Jefferies Finance LLC, an affiliate of Jefferies LLC, and Raymond James Bank, N.A., an affiliate of Raymond James & Associates Inc., are lenders under our senior secured credit facility and Jefferies LLC was an initial purchaser of our senior notes and senior discount notes. They have received, or may in the future receive, customary fees and commissions for these transactions.
In the ordinary course of their various business activities, the underwriter and certain of its affiliates may make or hold a broad array of investments and actively trade debt and equity securities (or related derivative securities) and financial instruments (including bank loans) for their own account and for the accounts of their customers, and such investment and securities activities may involve securities and/or instruments issued by us and our affiliates. If the underwriters or their respective affiliates have a lending relationship with us, they routinely hedge their credit exposure to us consistent with their customary risk management policies. The underwriters and their respective affiliates may hedge such exposure by entering into transactions which consist of either the purchase of credit default swaps or the creation of short positions in our securities or the securities of our affiliates, including potentially the common stock offered hereby. Any such short positions could adversely affect future trading prices of the common stock offered hereby. The underwriters and certain of their respective affiliates may also communicate independent investment recommendations, market color or trading ideas and/or publish or express independent research views in respect of such securities or instruments and may at any time hold, or recommend to clients that they acquire, long and/or short positions in such securities and instruments.
Disclaimers About Non-U.S. Jurisdictions
Australia
(a) This prospectus is not a disclosure document for the purposes of Australia’s Corporations Act 2001 (Cth) of Australia, or Corporations Act, has not been lodged with the Australian Securities & Investments Commission and is only directed to the categories of exempt persons set out below. Accordingly, if you receive this prospectus in Australia:
You confirm and warrant that you are either:
a “sophisticated investor” under section 708(8)(a) or (b) of the Corporations Act;
a “sophisticated investor” under section 708(8)(c) or (d) of the Corporations Act and that you have provided an accountant’s certificate to the Company which complies with the requirements of section 708(8)(c)(i) or (ii) of the Corporations Act and related regulations before the offer has been made;
a person associated with the Company under Section 708(12) of the Corporations Act; or
122
Table of Contents
a “professional investor” within the meaning of section 708(11)(a) or (b) of the Corporations Act.
To the extent that you are unable to confirm or warrant that you are an exempt sophisticated investor, associated person or professional investor under the Corporations Act any offer made to you under this prospectus is void and incapable of acceptance.
You warrant and agree that you will not offer any of the securities issued to you pursuant to this prospectus for resale in Australia within 12 months of those securities being issued unless any such resale offer is exempt from the requirement to issue a disclosure document under section 708 of the Corporations Act.
European Economic Area
(b) In relation to each member state of the European Economic Area which has implemented the Prospectus Directive (each, a “Relevant Member State”), an offer to the public of any common shares which are the subject of the offering contemplated by this prospectus may not be made in that Relevant Member State except that an offer to the public in that Relevant Member State of any common shares may be made at any time under the following exemptions under the Prospectus Directive, if they have been implemented in that Relevant Member State:
(a) to any legal entity which is a “qualified investor” as defined in the Prospectus Directive;
(b) to fewer than 100 or, if the Relevant Member State has implemented the relevant provision of the 2010 PD Amending Directive, 150, natural or legal persons (other than qualified investors as defined in the Prospectus Directive), as permitted under the Prospectus Directive, subject to obtaining the prior consent of the underwriters or the underwriters nominated by us for any such offer; or
(c) in any other circumstances falling within Article 3(2) of the Prospectus Directive,
provided that no such offer of common shares shall require us or any of the underwriters to publish a prospectus pursuant to Article 3 of the Prospectus Directive or supplement a prospectus pursuant to Article 16 of the Prospectus Directive.
(c) For the purposes of this provision, the expression an “offer common shares to the public” in relation to the common shares in any Relevant Member State means the communication in any form and by any means of sufficient information on the terms of the offer and the common shares to be offered so as to enable an investor to decide to purchase or subscribe to the common shares, as the same may be varied in that Relevant Member State by any measure implementing the Prospectus Directive in that Relevant Member State and the expression “Prospectus Directive” means Directive 2003/71/EC (and amendments thereto, including the 2010 PD Amending Directive, to the extent implemented in the Relevant Member State), and includes any relevant implementing measure in the Relevant Member State and the expression “2010 PD Amending Directive” means Directive 2010/73/EU.
Hong Kong
(d) No securities have been offered or sold, and no securities may be offered or sold, in Hong Kong, by means of any document, other than to persons whose ordinary business is to buy or sell shares or debentures, whether as principal or agent; or to “professional investors” as defined in the Securities and Futures Ordinance (Cap. 571) of Hong Kong (“SFO”) and any rules made under that Ordinance; or in other circumstances which do not result in the document being a “prospectus” as defined in the Companies Ordinance (Cap. 32) of Hong Kong (“CO”) or which do not constitute an offer or invitation to the public for the purpose of the CO or the SFO. No document, invitation or advertisement relating to the securities has been issued or may be issued or may be in the possession of any person for the purpose of issue (in each case whether in Hong Kong or elsewhere), which is directed at, or the contents of which are likely to be accessed or read by, the public of Hong Kong (except if permitted under the securities laws of Hong Kong) other than with respect to securities which are or are intended to be disposed of only to persons outside Hong Kong or only to “professional investors” as defined in the SFO and any rules made under that Ordinance.
(e) This prospectus has not been registered with the Registrar of Companies in Hong Kong. Accordingly, this prospectus may not be issued, circulated or distributed in Hong Kong, and the securities may not be offered for subscription to members of the public in Hong Kong. Each person acquiring the securities will be required, and is deemed by the acquisition of the securities, to confirm that he is aware of the restriction on offers of the securities described in this prospectus and the relevant offering documents and that he is not acquiring, and has not been offered any securities in circumstances that contravene any such restrictions.
123
Table of Contents
Japan
(f) The offering has not been and will not be registered under the Financial Instruments and Exchange Law of Japan (Law No. 25 of 1948 of Japan, as amended), or FIEL, and the underwriters will not offer or sell any securities, directly or indirectly, in Japan or to, or for the benefit of, any resident of Japan (which term as used herein means any person resident in Japan, including any corporation or other entity organized under the laws of Japan), or to others for re-offering or resale, directly or indirectly, in Japan or to, or for the benefit of, any resident of Japan, except pursuant to an exemption from the registration requirements of, and otherwise in compliance with, the FIEL and any other applicable laws, regulations and ministerial guidelines of Japan.
Singapore
(g) This prospectus has not been and will not be lodged or registered as a prospectus with the Monetary Authority of Singapore. Accordingly, this prospectus and any other document or material in connection with the offer or sale, or invitation for subscription or purchase, of the shares may not be circulated or distributed, nor may the shares be offered or sold, or be made the subject of an invitation for subscription or purchase, whether directly or indirectly, to persons in Singapore other than (i) to an institutional investor under Section 274 of the Securities and Futures Act, Chapter 289 of Singapore (the “SFA”), (ii) to a relevant person pursuant to Section 275(1), or any person pursuant to Section 275(1A), and in accordance with the conditions specified in Section 275, of the SFA, or (iii) otherwise pursuant to, and in accordance with the conditions of, any other applicable provision of the SFA.
(h) Where the shares are subscribed or purchased under Section 275 of the SFA by a relevant person which is:
| (a) | a corporation (which is not an accredited investor (as defined in Section 4A of the SFA)) the sole business of which is to hold investments and the entire share capital of which is owned by one or more individuals, each of whom is an accredited investor; or |
| (b) | a trust (where the trustee is not an accredited investor) whose sole purpose is to hold investments and each beneficiary of the trust is an individual who is an accredited investor, |
securities (as defined in Section 239(1) of the SFA) of that corporation or the beneficiaries’ rights and interest (howsoever described) in that trust shall not be transferred within six months after that corporation or that trust has acquired the shares pursuant to an offer made under Section 275 of the SFA except:
| (i) | to an institutional investor or to a relevant person defined in Section 275(2) of the SFA, or to any person arising from an offer referred to in Section 275(1A) or Section 276(4)(i)(B) of the SFA; |
| (ii) | where no consideration is or will be given for the transfer; |
| (iii) | where the transfer is by operation of law; |
| (iv) | as specified in Section 276(7) of the SFA; or |
| (v) | as specified in Regulation 32 of the Securities and Futures (Offers of Investments) (Shares and Debentures) Regulations 2005 of Singapore. |
Switzerland
The shares may not be publicly offered in Switzerland and will not be listed on the SIX Swiss Exchange (“SIX”) or on any other stock exchange or regulated trading facility in Switzerland. This prospectus has been prepared without regard to the disclosure standards for issuance prospectuses under art. 652a or art. 1156 of the Swiss Code of Obligations or the disclosure standards for listing prospectuses under art. 27 ff. of the SIX Listing Rules or the listing rules of any other stock exchange or regulated trading facility in Switzerland. Neither this prospectus nor any other offering or marketing material relating to the shares or the offering may be publicly distributed or otherwise made publicly available in Switzerland.
Neither this prospectus nor any other offering or marketing material relating to the offering, the Company or the shares have been or will be filed with or approved by any Swiss regulatory authority. In particular, this prospectus will not be filed with, and the offer of shares will not be supervised by, the Swiss Financial Market Supervisory Authority FINMA, and the offer of shares has not been and will not be authorized under the Swiss Federal Act on Collective Investment Schemes (“CISA”). The investor protection afforded to acquirers of interests in collective investment schemes under the CISA does not extend to acquirers of securities.
124
Table of Contents
United Kingdom
This prospectus is only being distributed to, and is only directed at, persons in the United Kingdom that are qualified investors within the meaning of Article 2(1)(e) of the Prospectus Directive that are also (i) investment professionals falling within Article 19(5) of the Financial Services and Markets Act 2000 (Financial Promotion) Order 2005, as amended (the “Order”) and/or (ii) high net worth entities falling within Article 49(2)(a) to (d) of the Order and other persons to whom it may lawfully be communicated (each such person being referred to as a “relevant person”).
This prospectus and its contents are confidential and should not be distributed, published or reproduced (in whole or in part) or disclosed by recipients to any other persons in the United Kingdom. Any person in the United Kingdom that is not a relevant person should not act or rely on this document or any of its contents.
The validity of the common stock offered hereby will be passed upon for us by Weil, Gotshal & Manges LLP, New York, New York. Certain legal matters in connection with the offering of the common stock will be passed upon for the underwriters by Latham & Watkins LLP, New York, New York.
The consolidated financial statements of Dave & Buster’s Entertainment, Inc. and its subsidiaries as of February 2, 2014 and February 3, 2013 and for the fiscal years ended February 2, 2014, February 3, 2013 and January 29, 2012 have been included herein in reliance upon the report of KPMG LLP, independent registered public accounting firm, appearing elsewhere herein and upon the authority of said firm as experts in accounting and auditing.
We have filed with the SEC a registration statement on Form S-1 under the Securities Act with respect to the shares of common stock offered hereby. This prospectus does not contain all of the information set forth in the registration statement and the exhibits and schedules thereto. For further information with respect to Dave & Buster’s Entertainment, Inc. and the shares of common stock offered hereby, you should refer to the registration statement and to the exhibits and schedules filed therewith. A copy of the Dave & Buster’s Entertainment, Inc. registration statement and the exhibits and schedules thereto may be inspected without charge at the public reference room maintained by the SEC located at 100 F Street, N.E., Room 1580, Washington, D.C. 20549. Copies of all or any portion of the registration statements and the filings may be obtained from such offices upon payment of prescribed fees. The public may obtain information on the operation of the public reference room by calling the SEC at 1-800-SEC-0330 or (202) 551-8090. The SEC maintains a website at www.sec.gov that contains reports, proxy and information statements and other information regarding registrants that file electronically with the SEC.
You may request copies of the SEC filings of Dave & Buster’s Entertainment, Inc. and Dave & Buster’s, Inc. and forms of documents pertaining to the securities offered hereby referred to in this prospectus without charge, by written or telephonic request directed to us at Dave & Buster’s Entertainment, Inc., 2481 Mañana Drive, Dallas, Texas 75220, Attention: Investor Relations, Telephone: (214) 357-9588.
125
Table of Contents
INDEX TO CONSOLIDATED FINANCIAL STATEMENTS
| PAGE | ||||
| Audited Consolidated Financial Statements for the fiscal years ended February 2, 2014, February 3, 2013 and January 29, 2012 |
||||
| Report of KPMG LLP, independent registered public accounting firm |
F-2 | |||
| Consolidated Balance Sheets as of February 2, 2014 and February 3, 2013 |
F-3 | |||
| F-4 | ||||
| F-5 | ||||
| F-6 | ||||
| F-7 | ||||
| Unaudited Consolidated Financial Statements for the twenty-six week periods ended August 3, 2014 and August 4, 2013 |
||||
| Consolidated Balance Sheets as of August 3, 2014 and February 2, 2014 |
F-28 | |||
| F-29 | ||||
| F-30 | ||||
| F-31 | ||||
| F-32 | ||||
F-1
Table of Contents
REPORT OF INDEPENDENT REGISTERED PUBLIC ACCOUNTING FIRM
The Board of Directors and Stockholders
Dave & Buster’s Entertainment, Inc.:
We have audited the accompanying consolidated balance sheets of Dave & Buster’s Entertainment, Inc. and subsidiaries (the Company) as of February 2, 2014 and February 3, 2013 and the related consolidated statements of comprehensive income (loss), stockholders’ equity, and cash flows for the fiscal years ended February 2, 2014, February 3, 2013, and January 29, 2012. These consolidated financial statements are the responsibility of the Company’s management. Our responsibility is to express an opinion on these consolidated financial statements based on our audits.
We conducted our audits in accordance with the standards of the Public Company Accounting Oversight Board (United States). Those standards require that we plan and perform the audit to obtain reasonable assurance about whether the financial statements are free of material misstatement. An audit also includes examining, on a test basis, evidence supporting the amounts and disclosures in the financial statements. An audit also includes assessing the accounting principles used and significant estimates made by management, as well as evaluating the overall financial statement presentation. We believe that our audits provide a reasonable basis for our opinion.
In our opinion, the consolidated financial statements referred to above present fairly, in all material respects, the financial position of Dave & Buster’s Entertainment, Inc. and subsidiaries as of February 2, 2014 and February 3, 2013, and the results of their operations and their cash flows for the fiscal years ended February 2, 2014, February 3, 2013, and January 29, 2012 in conformity with U.S. generally accepted accounting principles.
(signed) KPMG LLP
Dallas, Texas
March 28, 2014
F-2
Table of Contents
DAVE & BUSTER’S ENTERTAINMENT, INC.
CONSOLIDATED BALANCE SHEETS
(in thousands, except share amounts)
| FEBRUARY 2, 2014 |
FEBRUARY 3, 2013 |
|||||||
| ASSETS |
||||||||
| Current assets: |
||||||||
| Cash and cash equivalents |
$ | 38,080 | $ | 36,117 | ||||
| Inventories (Note 3) |
15,354 | 14,849 | ||||||
| Prepaid expenses |
9,670 | 9,371 | ||||||
| Deferred income taxes (Note 8) |
24,802 | 25,137 | ||||||
| Income taxes receivable |
2,445 | 1,120 | ||||||
| Other current assets |
8,993 | 12,152 | ||||||
|
|
|
|
|
|||||
| Total current assets |
99,344 | 98,746 | ||||||
| Property and equipment (net of $195,339 and $139,457 accumulated depreciation as of February 2, 2014 and February 3, 2013, respectively) (Note 4) |
388,093 | 337,239 | ||||||
| Tradenames (Note 5) |
79,000 | 79,000 | ||||||
| Goodwill (Note 5) |
272,428 | 272,278 | ||||||
| Other assets and deferred charges |
22,893 | 26,347 | ||||||
|
|
|
|
|
|||||
| Total assets |
$ | 861,758 | $ | 813,610 | ||||
|
|
|
|
|
|||||
| LIABILITIES AND STOCKHOLDERS’ EQUITY |
||||||||
| Current liabilities: |
||||||||
| Current installments of long-term debt (Note 7) |
$ | 1,500 | $ | 1,500 | ||||
| Accounts payable |
36,092 | 23,878 | ||||||
| Accrued liabilities (Note 6) |
74,379 | 67,124 | ||||||
| Income taxes payable |
1,073 | 192 | ||||||
| Deferred income taxes (Note 8) |
— | 189 | ||||||
|
|
|
|
|
|||||
| Total current liabilities |
113,044 | 92,883 | ||||||
| Deferred income taxes (Note 8) |
23,654 | 24,887 | ||||||
| Deferred occupancy costs |
81,743 | 69,544 | ||||||
| Other liabilities |
8,692 | 9,335 | ||||||
| Long-term debt, less current installments, net of unamortized discount (Note 7) |
484,177 | 469,550 | ||||||
| Commitments and contingencies (Note 12) |
||||||||
| Stockholders’ equity: |
||||||||
| Common stock, $0.01 par value, 500,000 authorized; 148,690 and 148,610 issued as of February 2, 2014 and February 3, 2013, respectively |
1 | 1 | ||||||
| Preferred stock, 10,000,000 authorized; none issued |
— | — | ||||||
| Paid-in capital |
152,994 | 151,707 | ||||||
| Treasury stock, 1,104 and 1,104 shares as of February 2, 2014 and February 3, 2013, respectively (Note 10) |
(1,189 | ) | (1,189 | ) | ||||
| Accumulated other comprehensive income (loss) |
(167 | ) | 252 | |||||
| Accumulated deficit |
(1,191 | ) | (3,360 | ) | ||||
|
|
|
|
|
|||||
| Total stockholders’ equity |
150,448 | 147,411 | ||||||
|
|
|
|
|
|||||
| Total liabilities and stockholders’ equity |
$ | 861,758 | $ | 813,610 | ||||
|
|
|
|
|
|||||
See accompanying notes to consolidated financial statements.
F-3
Table of Contents
DAVE & BUSTER’S ENTERTAINMENT, INC.
CONSOLIDATED STATEMENTS OF COMPREHENSIVE INCOME (LOSS)
(in thousands, except share amounts)
| FISCAL YEAR ENDED FEBRUARY 2, 2014 |
FISCAL YEAR ENDED FEBRUARY 3, 2013 |
FISCAL YEAR ENDED JANUARY 29, 2012 |
||||||||||
| Food and beverage revenues |
$ | 310,111 | $ | 298,421 | $ | 272,606 | ||||||
| Amusement and other revenues |
325,468 | 309,646 | 268,939 | |||||||||
|
|
|
|
|
|
|
|||||||
| Total revenues |
635,579 | 608,067 | 541,545 | |||||||||
| Cost of food and beverage |
77,577 | 73,019 | 65,751 | |||||||||
| Cost of amusement and other |
47,437 | 46,098 | 41,417 | |||||||||
|
|
|
|
|
|
|
|||||||
| Total cost of products |
125,014 | 119,117 | 107,168 | |||||||||
| Operating payroll and benefits |
150,172 | 145,571 | 130,875 | |||||||||
| Other store operating expenses |
199,537 | 192,792 | 175,993 | |||||||||
| General and administrative expenses |
36,440 | 40,356 | 34,896 | |||||||||
| Depreciation and amortization expense |
66,337 | 63,457 | 54,277 | |||||||||
| Pre-opening costs |
7,040 | 3,060 | 4,186 | |||||||||
|
|
|
|
|
|
|
|||||||
| Total operating costs |
584,540 | 564,353 | 507,395 | |||||||||
|
|
|
|
|
|
|
|||||||
| Operating income |
51,039 | 43,714 | 34,150 | |||||||||
| Interest expense, net (Note 7) |
47,809 | 47,634 | 44,931 | |||||||||
|
|
|
|
|
|
|
|||||||
| Income (loss) before provision (benefit) for income taxes |
3,230 | (3,920 | ) | (10,781 | ) | |||||||
| Provision (benefit) for income taxes (Note 8) |
1,061 | (12,702 | ) | (3,796 | ) | |||||||
|
|
|
|
|
|
|
|||||||
| Net income (loss) |
2,169 | 8,782 | (6,985 | ) | ||||||||
|
|
|
|
|
|
|
|||||||
| Unrealized foreign currency translation gain (loss) |
(419 | ) | 15 | 42 | ||||||||
|
|
|
|
|
|
|
|||||||
| Total comprehensive income (loss) |
$ | 1,750 | $ | 8,797 | $ | (6,943 | ) | |||||
|
|
|
|
|
|
|
|||||||
| Net Income (loss) per share: |
||||||||||||
| Basic |
$ | 14.70 | $ | 59.54 | $ | (45.58 | ) | |||||
| Diluted |
$ | 14.34 | $ | 58.55 | $ | (45.58 | ) | |||||
| Weighted average shares used in per share calculations: |
||||||||||||
| Basic |
147,512 | 147,506 | 153,250 | |||||||||
| Diluted |
151,256 | 150,000 | 153,250 | |||||||||
See accompanying notes to consolidated financial statements.
F-4
Table of Contents
DAVE & BUSTER’S ENTERTAINMENT, INC.
CONSOLIDATED STATEMENTS OF STOCKHOLDERS’ EQUITY
(in thousands, except share amounts)
| COMMON STOCK | PAID-IN CAPITAL |
TREASURY STOCK AT COST |
ACCUMULATED OTHER COMPREHENSIVE INCOME (LOSS) |
ACCUMULATED DEFICIT |
TOTAL | |||||||||||||||||||||||||||
| SHARES | AMT. | SHARES | AMT. | |||||||||||||||||||||||||||||
| Balance January 30, 2011 |
245,498 | $ | 2 | $ | 246,290 | 1,500 | $ | (1,500 | ) | $ | 195 | $ | (5,157 | ) | $ | 239,830 | ||||||||||||||||
|
|
|
|
|
|
|
|
|
|
|
|
|
|
|
|
|
|||||||||||||||||
| Net loss |
— | — | — | — | — | — | (6,985 | ) | (6,985 | ) | ||||||||||||||||||||||
| Unrealized foreign currency translation gain |
— | — | — | — | — | 42 | — | 42 | ||||||||||||||||||||||||
| Stock-based compensation |
— | — | 1,038 | — | — | — | — | 1,038 | ||||||||||||||||||||||||
| Purchase of common stock (see Note 10) |
(96,888 | ) | (1 | ) | (96,887 | ) | — | — | — | — | (96,888 | ) | ||||||||||||||||||||
| Purchase of treasury stock (see Note 10) |
— | — | — | 512 | (597 | ) | — | — | (597 | ) | ||||||||||||||||||||||
| Sale of treasury stock (see Note 10) |
— | — | 167 | (908 | ) | 908 | — | — | 1,075 | |||||||||||||||||||||||
|
|
|
|
|
|
|
|
|
|
|
|
|
|
|
|
|
|||||||||||||||||
| Balance January 29, 2012 |
148,610 | 1 | 150,608 | 1,104 | (1,189 | ) | 237 | (12,142 | ) | 137,515 | ||||||||||||||||||||||
|
|
|
|
|
|
|
|
|
|
|
|
|
|
|
|
|
|||||||||||||||||
| Net income |
— | — | — | — | — | — | 8,782 | 8,782 | ||||||||||||||||||||||||
| Unrealized foreign currency translation gain |
— | — | — | — | — | 15 | — | 15 | ||||||||||||||||||||||||
| Stock-based compensation |
— | — | 1,099 | — | — | — | — | 1,099 | ||||||||||||||||||||||||
|
|
|
|
|
|
|
|
|
|
|
|
|
|
|
|
|
|||||||||||||||||
| Balance February 3, 2013 |
148,610 | 1 | 151,707 | 1,104 | (1,189 | ) | 252 | (3,360 | ) | 147,411 | ||||||||||||||||||||||
|
|
|
|
|
|
|
|
|
|
|
|
|
|
|
|
|
|||||||||||||||||
| Net income |
— | — | — | — | — | — | 2,169 | 2,169 | ||||||||||||||||||||||||
| Unrealized foreign currency translation loss |
— | — | — | — | — | (419 | ) | — | (419 | ) | ||||||||||||||||||||||
| Stock-based compensation |
— | — | 1,207 | — | — | — | — | 1,207 | ||||||||||||||||||||||||
| Sale of Stock (see Note 10) |
80 | — | 80 | — | — | — | — | 80 | ||||||||||||||||||||||||
|
|
|
|
|
|
|
|
|
|
|
|
|
|
|
|
|
|||||||||||||||||
| Balance February 2, 2014 |
148,690 | $ | 1 | $ | 152,994 | 1,104 | $ | (1,189 | ) | $ | (167 | ) | $ | (1,191 | ) | $ | 150,448 | |||||||||||||||
|
|
|
|
|
|
|
|
|
|
|
|
|
|
|
|
|
|||||||||||||||||
See accompanying notes to consolidated financial statements.
F-5
Table of Contents
DAVE & BUSTER’S ENTERTAINMENT, INC.
CONSOLIDATED STATEMENTS OF CASH FLOWS
(in thousands)
| FISCAL YEAR ENDED FEBRUARY 2, 2014 |
FISCAL YEAR ENDED FEBRUARY 3, 2013 |
FISCAL YEAR ENDED JANUARY 29, 2012 |
||||||||||
| Cash flows from operating activities: |
||||||||||||
| Net income (loss) |
$ | 2,169 | $ | 8,782 | $ | (6,985 | ) | |||||
| Adjustments to reconcile net income (loss) to net cash provided by operating activities: |
||||||||||||
| Depreciation and amortization expense |
66,337 | 63,457 | 54,277 | |||||||||
| Debt cost and discount amortization (Note 7) |
3,189 | 2,946 | 2,914 | |||||||||
| Accretion of note discount (Note 7) |
15,881 | 14,141 | 11,830 | |||||||||
| Deferred income tax benefit (Note 8) |
(801 | ) | (13,548 | ) | (4,004 | ) | ||||||
| Loss on sale of fixed assets |
2,631 | 2,640 | 1,279 | |||||||||
| Stock-based compensation charges |
1,207 | 1,099 | 1,038 | |||||||||
| Business interruption reimbursement (Note 2) |
— | — | (1,629 | ) | ||||||||
| Other, net |
676 | (1,181 | ) | 707 | ||||||||
| Changes in assets and liabilities: |
||||||||||||
| Inventories |
(505 | ) | (9 | ) | (609 | ) | ||||||
| Prepaid expenses |
(157 | ) | 1,502 | (1,017 | ) | |||||||
| Income tax receivable |
(1,325 | ) | (1,120 | ) | 5,861 | |||||||
| Other current assets |
3,015 | (8,461 | ) | (1,561 | ) | |||||||
| Other assets and deferred charges |
(364 | ) | 924 | 442 | ||||||||
| Accounts payable |
(1,774 | ) | (96 | ) | 5,280 | |||||||
| Accrued liabilities |
6,782 | 1,574 | 2,563 | |||||||||
| Income taxes payable |
291 | (711 | ) | (578 | ) | |||||||
| Deferred occupancy costs |
12,214 | 6,691 | 4,089 | |||||||||
| Other liabilities |
412 | 4,166 | (1,120 | ) | ||||||||
|
|
|
|
|
|
|
|||||||
| Net cash provided by operating activities |
109,878 | 82,796 | 72,777 | |||||||||
|
|
|
|
|
|
|
|||||||
| Cash flows from investing activities: |
||||||||||||
| Capital expenditures |
(105,894 | ) | (78,689 | ) | (72,946 | ) | ||||||
| Insurance proceeds on Nashville property (Note 2) |
— | — | 798 | |||||||||
| Proceeds from sales of property and equipment |
217 | 201 | 1,646 | |||||||||
|
|
|
|
|
|
|
|||||||
| Net cash used in investing activities |
(105,677 | ) | (78,488 | ) | (70,502 | ) | ||||||
|
|
|
|
|
|
|
|||||||
| Cash flows from financing activities: |
||||||||||||
| Borrowings under senior discount notes, net of unamortized discount |
— | — | 100,000 | |||||||||
| Repayments of senior secured credit facility |
(1,500 | ) | (1,875 | ) | (1,500 | ) | ||||||
| Repurchase of shares from former executives (Note 10) |
— | — | (1,597 | ) | ||||||||
| Proceeds from sale of treasury stock (Note 10) |
— | — | 1,075 | |||||||||
| Debt issuance costs |
(818 | ) | — | (4,088 | ) | |||||||
| Sale of common stock (Note 10) |
80 | — | — | |||||||||
| Purchase of common stock (Note 10) |
— | — | (96,888 | ) | ||||||||
|
|
|
|
|
|
|
|||||||
| Net cash used by financing activities |
(2,238 | ) | (1,875 | ) | (2,998 | ) | ||||||
|
|
|
|
|
|
|
|||||||
| Increase (decrease) in cash and cash equivalents |
1,963 | 2,433 | (723 | ) | ||||||||
| Beginning cash and cash equivalents |
36,117 | 33,684 | 34,407 | |||||||||
|
|
|
|
|
|
|
|||||||
| Ending cash and cash equivalents |
$ | 38,080 | $ | 36,117 | $ | 33,684 | ||||||
|
|
|
|
|
|
|
|||||||
| Supplemental disclosures of cash flow information: |
||||||||||||
| Cash paid (refunds received) for income taxes, net |
$ | 2,151 | $ | 2,515 | $ | (5,380 | ) | |||||
| Cash paid for interest and related debt fees, net of amounts capitalized |
29,096 | 32,435 | 30,723 | |||||||||
See accompanying notes to consolidated financial statements.
F-6
Table of Contents
DAVE & BUSTER’S ENTERTAINMENT, INC.
NOTES TO CONSOLIDATED FINANCIAL STATEMENTS
(in thousands, except share amounts)
Note 1: Description of Business and Summary of Significant Accounting Policies
Description of Business—On June 1, 2010, Dave & Buster’s Entertainment, Inc. (“D&B Entertainment”), a newly-formed Delaware corporation owned by Oak Hill Capital Partners III, L.P. and Oak Hill Capital Management Partners III, L.P. (collectively, the “Oak Hill Funds”) acquired all of the outstanding common stock of Dave & Buster’s Holding, Inc. (“D&B Holdings”) from Wellspring Capital Partners III, L.P and HBK Main Street Investors L.P. (collectively, “Predecessor”). In connection therewith, Games Merger Corp., a newly-formed Missouri corporation and an indirect wholly-owned subsidiary of D&B Entertainment, merged with and into D&B Holdings’ wholly-owned, direct subsidiary, Dave & Buster’s, Inc. (“Dave & Buster’s”) (with Dave & Buster’s being the surviving corporation in the merger). Dave & Buster’s owns, operates and licenses high-volume venues that combine dining and entertainment in North America for both adults and families.
D&B Entertainment owns no significant assets or operations other than the ownership of all the common stock of D&B Holdings. D&B Holdings owns no significant assets or operations other than the ownership of all the common stock of Dave & Buster’s. References to the “Company”, “we”, “us”, and “our” refers to D&B Entertainment and its subsidiaries and any predecessor companies. All material intercompany accounts and transactions have been eliminated in consolidation.
Our one industry segment is the operation and licensing of high-volume entertainment and dining venues under the names “Dave & Buster’s” and “Dave & Buster’s Grand Sports Café.” As of February 2, 2014, there were 66 company-owned locations in the United States and Canada. Subsequent to February 2, 2014, we opened new stores in Westchester, California and Vernon Hills, Illinois. On May 31, 2013, our lone franchise store ceased operation as Dave & Buster’s. This change and the associated termination of the related franchise and development agreements did not have a material impact on our financial position or results of operations. Dave & Buster’s operates its business as one operating and one reportable segment. We operate on a 52 or 53 week fiscal year that ends on the Sunday after the Saturday closest to January 31. Each quarterly period has 13 weeks, except for a 53-week year when the fourth quarter has 14 weeks. Our fiscal year ended February 3, 2013 consists of 53 weeks. All other fiscal years presented herein consist of 52 weeks.
Basis of Presentation—The accompanying audited financial statements have been prepared in accordance with generally accepted accounting principles (“GAAP”) in the United States as prescribed by the Securities and Exchange Commission.
The financial statements include our accounts after elimination of all significant intercompany balances and transactions. All dollar amounts are presented in thousands, unless otherwise noted, except share amounts.
Seasonality—Our revenues and operations are influenced by seasonal shifts in consumer spending. Revenues associated with spring and year-end holidays during our first and fourth quarters have historically been higher as compared to the other quarters and will continue to be susceptible to the impact of severe spring and winter weather on customer traffic and sales during those periods. Our third quarter, which encompasses the back-to-school fall season, has historically had lower revenues as compared to the other quarters.
Use of estimates—The preparation of financial statements in conformity with GAAP requires us to make certain estimates and assumptions that affect the amounts reported in the financial statements and accompanying notes. Actual results could differ from those estimates.
Cash and cash equivalents—We consider transaction settlements in process from credit card companies and all highly liquid temporary investments with original maturities of three months or less to be cash equivalents.
Concentration of Credit Risk—Financial instruments which potentially subject us to a concentration of credit risk are cash and cash equivalents. We currently maintain our day-to-day operating cash balances with major financial
F-7
Table of Contents
DAVE & BUSTER’S ENTERTAINMENT, INC.
NOTES TO CONSOLIDATED FINANCIAL STATEMENTS (continued)
(in thousands, except share amounts)
institutions. At times, our operating cash balances may be in excess of the Federal Deposit Insurance Corporation (“FDIC”) insurance limit. From time to time, we invest temporary excess cash in overnight investments with expected minimal volatility, such as money market funds. Although we maintain balances that exceed the FDIC insured limit, we have not experienced any losses related to this balance, and we believe credit risk to be minimal.
Inventories—Inventories of food, beverages, merchandise and other supplies needed for our food service and amusement operations are stated at the lower of cost or market determined on a first-in, first-out method.
Deferred tax assets—A deferred income tax asset or liability is established for the expected future consequences resulting from temporary differences in the financial reporting and tax basis of assets and liabilities. As of February 2, 2014, we have recorded $1,388 as a valuation allowance against a portion of our deferred tax assets. The valuation allowance was established in accordance with accounting guidance for income taxes. If our taxable income decreases in future periods or if the facts and circumstances on which our estimates and assumptions are based were to change, thereby impacting the likelihood of realizing the deferred tax assets, judgment would have to be applied in determining if an addition to the allowance would be required or the amount of the valuation allowance no longer required.
Property and equipment—Property and equipment are stated at cost, net of accumulated depreciation. Depreciation is charged to operations using the straight-line method over the assets’ estimated useful lives, which are as follows:
| ESTIMATED DEPRECIABLE LIVES (IN YEARS) | ||
| Buildings |
Shorter of 40 or expected ground lease term | |
| Leasehold and building improvements |
Shorter of 20 or expected lease term | |
| Furniture, fixtures and equipment |
3-10 | |
| Games |
5-20 |
Expenditures that substantially increase the useful lives of the property and equipment are capitalized, whereas costs incurred to maintain the appearance and functionality of such assets are charged to repair and maintenance expense. Interest costs incurred during construction are capitalized and depreciated based on the estimated useful life of the underlying asset.
We review our property and equipment annually, on a store-by-store basis to determine whether facts or circumstances exist that may indicate the carrying values of these long-lived assets are impaired. We compare store-level undiscounted operating cash flows (which exclude interest, general and administrative and other allocated expenses) to the carrying amount of property and equipment allocated to each store. If the expected future cash flows are less than the asset carrying amount (an indication that the carrying amount may not be recoverable), we may recognize an impairment loss. Any impairment loss recognized equals the amount by which the asset carrying amount exceeds its fair value. We recognized an impairment loss of $200 during fiscal 2011 related to one of our stores in Dallas, Texas, which we permanently closed on May 2, 2011. No impairment charges were recognized in fiscal years 2013 or 2012.
Goodwill and other intangible assets—In accordance with accounting guidance for goodwill and other intangible assets, goodwill and indefinite lived intangibles, such as tradenames, are not amortized, but are reviewed for impairment at least annually. We perform step one of the impairment test in our fourth quarter unless circumstances require this analysis to be completed sooner. Step one of the impairment test is based upon a comparison of the
F-8
Table of Contents
DAVE & BUSTER’S ENTERTAINMENT, INC.
NOTES TO CONSOLIDATED FINANCIAL STATEMENTS (continued)
(in thousands, except share amounts)
carrying value of our net assets, including goodwill balances, to the fair value of our net assets. Fair value is measured using a combination of the guideline company method, external transaction method, and the income approach. The guideline company method uses valuation multiples from selected publicly-traded companies that we believe are exposed to market forces that are similar to those faced by the Company. The external transaction method involves analyzing previous mergers or acquisitions involving private or public companies that are similar to the Company. The income approach consists of utilizing the discounted cash flow method that incorporates our estimates of future revenues and costs, discounted using a risk-adjusted discount rate. Key assumptions used in our testing include future store openings, revenue growth, operating expenses and discount rate. Estimates of revenue growth and operating expenses are based on internal projections considering our past performance and forecasted growth, market economics and the business environment impacting our Company’s performance. Discount rates are determined by using a weighted average cost of capital (“WACC”). The WACC considers market and industry data as well as company-specific risk factors. These estimates are highly subjective judgments and can be significantly impacted by changes in the business or economic conditions. Our estimates used in the income approach are consistent with the plans and estimates used to manage operations. We evaluate all methods to ensure reasonably consistent results. Based on the completion of the step one test, we determined that goodwill was not impaired.
The evaluation of the carrying amount of other intangible assets with indefinite lives is made at least annually by comparing the carrying amount of these assets to their estimated fair value. The estimated fair value is generally determined on the basis of discounted future cash flows. If the estimated fair value is less than the carrying amount of the other intangible assets with indefinite lives, then an impairment charge is recorded to reduce the asset to its estimated fair value.
Based on our analysis, we determined that our intangible assets with an indefinite life, our tradename, was not impaired.
We have developed and acquired certain trademarks that are utilized in our business and have been determined to have finite lives. We also have intangible assets related to our non-compete agreements and customer relationships. These intangible assets are included in “Other assets and deferred charges” on the Consolidated Balance Sheet and are amortized over their useful lives.
Deferred financing costs—The Company capitalizes costs incurred in connection with borrowings or establishment of credit facilities. These costs are included in “Other assets and deferred charges” and are amortized as an adjustment to interest expense over the life of the borrowing or life of the credit facility. In the case of early debt principal repayments, the Company adjusts the value of the corresponding deferred financing costs with a charge to interest expense, and similarly adjusts the future amortization expense. The following table details amounts relating to those assets:
| FISCAL YEAR ENDED FEBRUARY 2, 2014 |
FISCAL YEAR ENDED FEBRUARY 3, 2013 |
FISCAL YEAR ENDED JANUARY 29, 2012 |
||||||||||
| Balance at beginning of period |
$ | 10,076 | $ | 12,735 | $ | 11,312 | ||||||
| Additional deferred financing costs |
726 | — | 4,088 | |||||||||
| Amortization during period |
(2,848 | ) | (2,659 | ) | (2,665 | ) | ||||||
|
|
|
|
|
|
|
|||||||
| Balance at end of period |
$ | 7,954 | $ | 10,076 | $ | 12,735 | ||||||
|
|
|
|
|
|
|
|||||||
Self-Insurance Accruals—We are self-insured for certain losses related to workers’ compensation claims, general liability matters and our company sponsored employee health insurance programs. We estimate the accrued liabilities for our self-insurance programs using historical claims experience and loss reserves, assisted by independent third-party actuaries. To limit our exposure to losses, we maintain stop-loss coverage through third-party insurers.
F-9
Table of Contents
DAVE & BUSTER’S ENTERTAINMENT, INC.
NOTES TO CONSOLIDATED FINANCIAL STATEMENTS (continued)
(in thousands, except share amounts)
Comprehensive income (loss)—Comprehensive income is defined as the change in equity of a business enterprise during a period from transactions and other events and circumstances from non-owner sources. In addition to net income (loss), unrealized foreign currency translation gain (loss) is included in comprehensive income. Unrealized translation loss for fiscal 2013 was $419. Unrealized translation gains for fiscal 2012 and fiscal 2011 were $15, and $42, respectively.
Foreign currency translation—The financial statements related to the operations of our Toronto store are prepared in Canadian dollars. Income statement amounts are translated at average exchange rates for each period, while the assets and liabilities are translated at year-end exchange rates. Translation adjustments for assets and liabilities are included in stockholders’ equity as a component of accumulated comprehensive income (loss).
Fair Value Disclosures—Fair value is defined as the price that we would receive to sell an asset or pay to transfer a liability (an exit price) in an orderly transaction between market participants on the measurement date. In determining fair value, U.S. GAAP establishes a three-level hierarchy used in measuring fair value, as follows:
| n | Level 1 inputs are quoted prices available for identical assets and liabilities in active markets. |
| n | Level 2 inputs are observable for the asset or liability, either directly or indirectly, including quoted prices for similar assets and liabilities in active markets or other inputs that are observable or can be corroborated by observable market data. |
| n | Level 3 inputs are less observable and reflect our own assumptions. |
Our financial instruments consist of cash and cash equivalents, accounts receivable, accounts payable, our senior secured credit facility, our senior notes and our senior discount notes. The carrying amount of cash and cash equivalents, accounts receivable and accounts payable approximates fair value because of their short maturities. We believe that the carrying amount of our term credit facility approximates its fair value because the interest rates are adjusted regularly based on current market conditions. The fair value disclosures for our senior notes and senior discount notes are presented in Note 7.
We may adjust the carrying amount of certain nonfinancial assets to fair value on a non-recurring basis when they are impaired. No such adjustments were made in fiscal 2013 or 2012.
Share-based expense—The expense associated with share-based equity awards granted as more fully described in Note 10 have been calculated as required by current accounting standards related to stock compensation. The grant date fair values of the options granted in 2013, 2012 and 2011 have been determined based on the option pricing method prescribed in AICPA Practice Aid, Valuation of Privately-Held-Company Equity Securities Issued as Compensation. The expected term of the options were based on the weighted average of anticipated exercise dates. Since we do not have publicly traded equity securities, the volatility of our options has been estimated using peer group volatility information. The risk-free interest rate was based on the implied yield on U.S. Treasury zero-coupon issues with a remaining term equivalent to the expected term. The significant assumptions used in determining the underlying fair value of the weighted-average options granted in fiscal 2013, 2012 and 2011 were as follows:
| FISCAL 2013 | FISCAL 2012 | FISCAL 2011 | ||||||||||||||||||||||
| SERVICE BASED |
PERFORMANCE BASED |
SERVICE BASED |
PERFORMANCE BASED |
SERVICE BASED |
PERFORMANCE BASED |
|||||||||||||||||||
| Volatility |
48.2 | % | 47.0 | % | 44.7 | % | 50.0 | % | 55.0 | % | 55.0 | % | ||||||||||||
| Risk free interest rate |
1.15 | % | 1.06 | % | 0.78 | % | 0.33 | % | 1.46 | % | 1.47 | % | ||||||||||||
| Expected dividend yield |
0.00 | % | 0.00 | % | 0.00 | % | 0.00 | % | 0.00 | % | 0.00 | % | ||||||||||||
| Expected term—in years |
6.5 | 6.5 | 4.9 | 3.0 | 4.0 | 4.0 | % | |||||||||||||||||
| Weighted average calculated value |
$ | 1,060.88 | $ | 937.00 | $ | 545.76 | $ | 506.15 | $ | 220.59 | $ | 117.98 | ||||||||||||
F-10
Table of Contents
DAVE & BUSTER’S ENTERTAINMENT, INC.
NOTES TO CONSOLIDATED FINANCIAL STATEMENTS (continued)
(in thousands, except share amounts)
The options granted in fiscal years 2013, 2012 and 2011 have been issued pursuant to the terms of the Dave & Buster’s Entertainment, Inc. 2010 Management Incentive Plan (“2010 D&B Entertainment Incentive Plan”). The 2010 D&B Entertainment Incentive Plan allows the granting of nonqualified stock options to members of management, outside board members and consultants. Grantees may receive (i) time vesting options, which vest ratably on the first through fifth anniversary of the date of grant and/or (ii) performance vesting options which include Adjusted EBITDA vesting options that vest over a prescribed time period based on D&B Entertainment meeting certain profitability targets for each fiscal year and IRR vesting options which vest upon a change in control of D&B Entertainment if the Oak Hill Fund’s internal rate of return is greater than or equal to certain percentages set forth in the applicable option agreement, in each case subject to the grantee’s continued employment with or service to D&B Entertainment or its subsidiaries (subject to certain conditions in the event of grantee termination).
Revenue recognition—Food and beverage revenues are recorded at point of service. Amusement revenues consist primarily of credits on Power Cards purchased and used by customers to activate most of the video and redemption games in our midway. Amusement revenues are primarily recognized upon utilization of these game play credits. We have recognized a liability for the estimated amount of unused game play credits which we believe our customers will utilize in the future based on credits remaining on Power Cards, historic utilization patterns and revenue per game play credit sold.
Amusements costs of products—Certain midway games allow customers to earn coupons, which may be redeemed for prizes. The cost of these prizes is included in the cost of amusement products and is generally recorded when coupons are utilized by the customers by redeeming the coupons for a prize in our “Winner’s Circle.” Customers may also store the coupon value on a Power Card for future redemption. We have accrued a liability for the estimated amount of outstanding coupons we believe that will be redeemed in subsequent periods based on coupons outstanding, historic redemption patterns and the estimated redemption cost of products per coupon.
Advertising costs—Advertising costs are recorded as an expense in the period in which we incur the costs or the first time the advertising takes place. Advertising costs expensed were $27,475, $28,502 and $26,612 in fiscal year 2013, 2012 and 2011, respectively.
Lease accounting—Rent expense is recorded on a straight-line basis over the lease term. The lease term commences on the date when we take possession and have the right to control the use of the leased premises. The lease term includes the initial non-cancelable lease term plus any periods covered by renewal options that we consider reasonably assured of exercising. The difference between rent payments and rent expense in any period is recorded as Deferred occupancy costs in the Consolidated Balance Sheets. Construction allowances we receive from the lessor to reimburse us for the cost of leasehold improvements are recorded as deferred occupancy costs and amortized as a reduction of rent over the term of the lease.
We had construction allowance receivables of $5,677 and $8,893 as of February 2, 2014 and February 3, 2013, respectively, related to our new store openings. Such balances are included in “Other current assets” in the Company’s Consolidated Balance Sheet. All receivable amounts are expected to be collected.
Related party transaction—We have an expense reimbursement agreement with Oak Hill Capital Management, LLC, which provides for the reimbursement of certain costs and expenses of Oak Hill Capital Management, LLC. We made payments to Oak Hill Capital Management, LLC of $115 during fiscal 2013, $76 during fiscal 2012, and $297 during fiscal 2011 under the terms of the expense reimbursement agreement.
We paid board compensation of $235, $235 and $153 in fiscal 2013, 2012 and 2011, respectively, David Jones and Alan Lacy, two board members who serve as Senior Advisors to the Oak Hill Funds.
F-11
Table of Contents
DAVE & BUSTER’S ENTERTAINMENT, INC.
NOTES TO CONSOLIDATED FINANCIAL STATEMENTS (continued)
(in thousands, except share amounts)
From time to time we temporarily borrow funds from Dave & Buster’s for payment of expenditures for our corporate purposes. Additionally, Dave & Buster’s owes us for certain tax-related matters. We had a net receivable of $6,907 and $3,349 as of February 2, 2014 and February 3, 2013, respectively. These intercompany amounts have been eliminated in the Consolidated Balance Sheets.
Pre-opening costs—Pre-opening costs include costs associated with the opening and organizing of new stores, including pre-opening rent, staff training and recruiting, and travel costs for employees engaged in such pre-opening activities. All pre-opening costs are expensed as incurred.
Income taxes—We use the asset/liability method for recording income taxes, which recognizes the amount of current and deferred taxes payable or refundable at the date of the financial statements as a result of all events that are recognized in the financial statements and as measured by the provisions of enacted tax laws. We also recognize liabilities for uncertain income tax positions for those items that meet the “more likely than not” threshold.
The calculation of tax liabilities involves significant judgment and evaluation of uncertainties in the interpretation of state and federal tax regulations. As a result, we have established accruals for taxes that may become payable in future years as a result of audits by tax authorities. Tax accruals are reviewed regularly pursuant to accounting guidance for uncertainty in income taxes. Tax accruals are adjusted as events occur that affect the potential liability for taxes such as the expiration of statutes of limitations, conclusion of tax audits, identification of additional exposure based on current calculations, identification of new issues, or the issuance of statutory or administrative guidance or rendering of a court decision affecting a particular issue. Accordingly, we may experience significant changes in tax accruals in the future, if or when such events occur.
As of February 2, 2014, we have accrued approximately $767 of unrecognized tax benefits, including approximately $291 of penalties and interest. During fiscal 2013, we recognized approximately $5 of tax benefits and an additional $1 of benefits related to penalties and interest based upon lapsing of time and settlement with taxing jurisdictions. Future recognition of potential interest or penalties, if any, will be recorded as a component of income tax expense. Because of the impact of deferred income tax accounting, $349 of unrecognized tax benefits, if recognized, would impact the effective tax rate.
Recent Accounting Pronouncements
Accounting Guidance Adopted—In July 2012, the Financial Accounting Standards Board (“FASB”) issued Accounting Standards Update (“ASU’) No. 2012-02, “Intangibles-Goodwill and Other (Topic 350): Testing Indefinite-Lived Intangible Assets for Impairment”. The revised standard is intended to reduce the cost and complexity of testing indefinite-lived intangible assets other than goodwill for impairment. It allows companies to perform a “qualitative” assessment to determine whether further impairment testing of indefinite-lived intangible assets is necessary, similar in approach to the goodwill impairment test. This amendment is effective for annual and interim impairment tests performed for fiscal years beginning after September 15, 2012. We review our intangible assets for impairment in our fourth quarter unless circumstances require this analysis to be completed sooner. The adoption of ASU No. 2012-02 did not have an impact on the Company’s financial position, results of operations or cash flows.
In February 2013, the FASB issued ASU No. 2013-02, “Comprehensive Income (Topic 220): Reporting of Amounts Reclassified Out of Accumulated Other Comprehensive Income,” which requires an entity to provide information about the amounts reclassified out of accumulated other comprehensive income by component. This guidance requires the disclosure of significant amounts reclassified from each component of accumulated other comprehensive income and the income statement line items affected by the reclassification. ASU No. 2013-02 is effective for the Company prospectively for reporting periods beginning after December 15, 2012. The adoption of ASU No. 2013-02 did not have an impact on the Company’s financial position, results of operations or cash flows.
F-12
Table of Contents
DAVE & BUSTER’S ENTERTAINMENT, INC.
NOTES TO CONSOLIDATED FINANCIAL STATEMENTS (continued)
(in thousands, except share amounts)
Accounting Guidance Not Yet Adopted—In July 2013, the FASB issued ASU No. 2013-11, “Income Taxes (Topic 740): Presentation of an Unrecognized Tax Benefit When a Net Operating Loss Carryforward, a Similar Tax Loss, or a Tax Credit Carryforward Exists.” This amendment requires an unrecognized tax benefit related to a net operating loss carryforward, a similar tax loss or a tax credit carryforward to be presented as a reduction to a deferred tax asset, unless the tax benefit is not available at the reporting date to settle any additional income taxes under the tax law of the applicable tax jurisdiction. The amendment is effective for fiscal years, and interim periods within those years, beginning after December 15, 2013. Early adoption is permitted. We do not expect the provisions of ASU No. 2013-11 to have a material effect on the Company’s financial position, results of operations or cash flows.
Note 2: Casualty loss
On May 2, 2010, flooding occurred in Nashville, Tennessee, causing considerable damage to our Nashville store and the retail mall where our store is located. The store is covered by up to $25,000 in property and business interruption insurance subject to an overall deductible of one thousand dollars.
During fiscal 2011, we recorded $3,215 as a reduction to “Other store operating expenses” in the Consolidated Statement of Operations related to the recovery of business interruption losses from our insurance carrier, of which $1,629 was received in fiscal 2010. Additionally, during fiscal 2011, we have received $2,414 from our insurance carrier which settled in full the casualty related receivables we recorded in 2010. $798 of the funds received relates to property and equipment, $156 relates to inventories, $778 relates to pre-opening costs, and $682 relates to remediation expenses and other costs incurred as a result of the flood. The build-out of our leased facility was completed prior to January 29, 2012, and our landlord delivered to us assets with a fair value of $2,443, which resulted in a gain that we recorded in “Other store operating expenses” of $955. As of January 29, 2012, all receivables casualty related have been collected and we expect no further collections related to this casualty loss. The store reopened on November 28, 2011.
Note 3: Inventories
Inventories consist of the following:
| FEBRUARY 2, 2014 |
FEBRUARY 3, 2013 |
|||||||
| Operating store—food and beverage |
$ | 3,961 | $ | 3,581 | ||||
| Operating store—amusement |
6,214 | 6,125 | ||||||
| Corporate supplies, warehouse and other |
5,179 | 5,143 | ||||||
|
|
|
|
|
|||||
| $ | 15,354 | $ | 14,849 | |||||
|
|
|
|
|
|||||
Amusement inventory includes electronic equipment, stuffed animals and small novelty items used as redemption prizes for certain midway games, as well as supplies needed for midway operations.
F-13
Table of Contents
DAVE & BUSTER’S ENTERTAINMENT, INC.
NOTES TO CONSOLIDATED FINANCIAL STATEMENTS (continued)
(in thousands, except share amounts)
Note 4: Property and Equipment
Property and equipment consist of the following:
| FEBRUARY 2, 2014 |
FEBRUARY 3, 2013 |
|||||||
| Buildings and building improvements |
$ | 14,176 | $ | 13,919 | ||||
| Leasehold improvements |
330,641 | 288,555 | ||||||
| Furniture, fixtures and equipment |
117,194 | 93,693 | ||||||
| Games |
88,310 | 73,094 | ||||||
| Construction in progress |
33,111 | 7,435 | ||||||
|
|
|
|
|
|||||
| Total cost |
583,432 | 476,696 | ||||||
| Accumulated depreciation |
(195,339 | ) | (139,457 | ) | ||||
|
|
|
|
|
|||||
| Property and equipment, net |
$ | 388,093 | $ | 337,239 | ||||
|
|
|
|
|
|||||
Interest costs capitalized during the construction of facilities were $602 for fiscal 2013, $510 for fiscal 2012, and $759 for fiscal 2011.
Property and equipment are depreciated using the straight-line method over the estimated useful life of the assets. Depreciation expense totaled $64,933 for fiscal 2013, $61,957 for fiscal 2012, and $52,623 for fiscal 2011.
Note 5: Goodwill and Other Intangible Assets
Changes in the carrying amount of goodwill for the year ended February 2, 2014 and February 3, 2013 are as follows:
| GROSS AMOUNT | ||||
| Goodwill Balance at January 29, 2012 |
$ | 272,286 | ||
| Foreign exchange differences |
(8 | ) | ||
|
|
|
|||
| Goodwill Balance at February 3, 2013 |
272,278 | |||
| Foreign exchange differences |
150 | |||
|
|
|
|||
| Goodwill Balance at February 2, 2014 |
$ | 272,428 | ||
|
|
|
|||
F-14
Table of Contents
DAVE & BUSTER’S ENTERTAINMENT, INC.
NOTES TO CONSOLIDATED FINANCIAL STATEMENTS (continued)
(in thousands, except share amounts)
The following table presents our goodwill and intangible assets at February 2, 2014 and February 3, 2013:
| FEBRUARY 2, 2014 | FEBRUARY 3, 2013 | |||||||||||||||||||
| USEFUL LIVES | GROSS CARRYING AMOUNT |
ACCUMULATED AMORTIZATION |
GROSS CARRYING AMOUNT |
ACCUMULATED AMORTIZATION |
||||||||||||||||
| Not subject to amortization: |
||||||||||||||||||||
| Goodwill |
$ | 272,428 | $ | — | $ | 272,278 | $ | — | ||||||||||||
| Tradenames |
79,000 | — | 79,000 | — | ||||||||||||||||
|
|
|
|
|
|
|
|
|
|||||||||||||
| Total not subject to amortization |
351,428 | — | 351,278 | — | ||||||||||||||||
|
|
|
|
|
|
|
|
|
|||||||||||||
| Subject to amortization: |
||||||||||||||||||||
| Trademarks |
7 years | 8,500 | (4,471 | ) | 8,500 | (3,255 | ) | |||||||||||||
| Customer relationships |
9 years | 1,700 | (694 | ) | 1,700 | (506 | ) | |||||||||||||
| Non-compete agreements |
2 years | 500 | (500 | ) | 500 | (500 | ) | |||||||||||||
|
|
|
|
|
|
|
|
|
|||||||||||||
| Total subject to amortization |
10,700 | (5,665 | ) | 10,700 | (4,261 | ) | ||||||||||||||
|
|
|
|
|
|
|
|
|
|||||||||||||
| Total goodwill and intangibles |
$ | 362,128 | $ | (5,665 | ) | $ | 361,978 | $ | (4,261 | ) | ||||||||||
|
|
|
|
|
|
|
|
|
|||||||||||||
The remaining weighted-average amortization period for intangibles subject to amortization is 3.7 years. Amortization expense was $1,404, $1,500, and $1,654 for the fiscal year 2013, the fiscal year 2012, and the fiscal year 2011, respectively. Estimated amortization expense relating to intangible assets subject to amortization for each of the five succeeding years and beyond is as follows:
| AMORTIZATION EXPENSE |
||||
| 2014 |
$ | 1,399 | ||
| 2015 |
1,399 | |||
| 2016 |
1,399 | |||
| 2017 |
588 | |||
| 2018 |
188 | |||
| Thereafter |
62 | |||
|
|
|
|||
| Total future amortization expense |
$ | 5,035 | ||
|
|
|
|||
F-15
Table of Contents
DAVE & BUSTER’S ENTERTAINMENT, INC.
NOTES TO CONSOLIDATED FINANCIAL STATEMENTS (continued)
(in thousands, except share amounts)
Note 6: Accrued Liabilities
Accrued liabilities consist of the following:
| FEBRUARY 2, 2014 |
FEBRUARY 3, 2013 |
|||||||
| Compensation and benefits |
$ | 14,459 | $ | 15,205 | ||||
| Deferred amusement revenue |
14,047 | 11,675 | ||||||
| Amusement redemption liability |
9,707 | 7,144 | ||||||
| Rent |
9,040 | 8,902 | ||||||
| Deferred gift card revenue |
4,709 | 4,028 | ||||||
| Sales and use taxes |
4,408 | 4,282 | ||||||
| Interest |
4,214 | 4,242 | ||||||
| Current portion of long-term insurance reserves |
3,358 | 3,000 | ||||||
| Property taxes |
3,159 | 2,884 | ||||||
| Other |
7,278 | 5,762 | ||||||
|
|
|
|
|
|||||
| Total accrued liabilities |
$ | 74,379 | $ | 67,124 | ||||
|
|
|
|
|
|||||
Note 7: Long-Term Debt
Long-term debt consisted of the following:
| FEBRUARY 2, 2014 |
FEBRUARY 3, 2013 |
|||||||
| Senior secured credit facility—term |
$ | 144,375 | $ | 145,875 | ||||
| Senior notes |
200,000 | 200,000 | ||||||
| Senior discount notes |
180,790 | 180,790 | ||||||
|
|
|
|
|
|||||
| Total debt outstanding |
525,165 | 526,665 | ||||||
| Unamortized debt discount—senior secured credit facility |
(550 | ) | (796 | ) | ||||
| Unamortized debt discount—senior discount notes |
(38,938 | ) | (54,819 | ) | ||||
| Less current installments |
(1,500 | ) | (1,500 | ) | ||||
|
|
|
|
|
|||||
| Long-term debt, less current installments, net of unamortized discount |
$ | 484,177 | $ | 469,550 | ||||
|
|
|
|
|
|||||
Senior Secured Credit Facility—The Dave & Buster’s senior secured credit facility provides (a) a $150,000 term loan facility with a maturity date of June 1, 2016, and (b) a $50,000 revolving credit facility with a maturity date of June 1, 2015. The $50,000 revolving credit facility includes (i) a $20,000 letter of credit sub-facility (ii) a $5,000 swingline sub-facility and (iii) a $1,000 (in US Dollar equivalent) sub-facility available in Canadian dollars to the Canadian subsidiary. The revolving credit facility will be used to provide financing for general purposes. The senior secured credit facility is secured by virtually all of Dave & Buster’s assets and is unconditionally guaranteed by each of its direct and indirect, existing and future domestic subsidiaries (with certain agreed-upon exceptions) and by certain specified guarantors with respect to the obligations of its Canadian subsidiary. Dave & Buster’s originally received proceeds on the term loan facility of $148,500, net of a $1,500 discount. The discount is being amortized to interest expense over the life of the term loan facility. As of February 2, 2014, we had no borrowings under the revolving credit facility, borrowings of $144,375 ($143,825, net of discount) under the term facility and $5,670 in letters of credit outstanding. We believe that the carrying amount of our term credit facility approximates its fair value because the interest rates are adjusted regularly based on current market conditions. The
F-16
Table of Contents
DAVE & BUSTER’S ENTERTAINMENT, INC.
NOTES TO CONSOLIDATED FINANCIAL STATEMENTS (continued)
(in thousands, except share amounts)
interest rate on the term loan facility at February 2, 2014 was 4.5%. The fair value of Dave & Buster’s senior secured credit facility was determined to be a Level Two instrument as defined by GAAP.
The interest rates per annum applicable to loans, other than swingline loans, under our senior secured credit facility are currently set based on a defined Eurodollar rate plus an applicable margin. Swingline loans bear interest at a base rate plus an applicable margin.
The senior secured credit facility requires compliance with financial covenants including a minimum fixed charge coverage ratio test and a maximum leverage ratio test. The Company is required to maintain a minimum fixed charge coverage ratio of 1.15:1.00 and a maximum leverage ratio of 4.00:1.00 as of February 2, 2014. The financial covenants will become more restrictive over time. The required minimum fixed charge coverage ratio increases annually to a required ratio of 1.30:1.00 in the fourth quarter of fiscal year 2014 and thereafter. The maximum leverage ratio decreases annually to a required ratio of 3.25:1.00 in the fourth quarter of fiscal year 2014 and thereafter. In addition, the senior secured credit facility includes negative covenants restricting or limiting, D&B Holdings, Dave & Buster’s and its subsidiaries’ ability to, among other things, incur additional indebtedness, pay dividends, make capital expenditures and sell or acquire assets. Virtually all of the Company’s assets are pledged as collateral for the senior secured credit facility.
On May 13, 2011, D&B Holdings and Dave & Buster’s executed an amendment (the “Amendment”) to the senior secured credit facility. The Amendment reduced the applicable term loan margins and LIBOR floor used in setting interest rates, as well as limited Dave & Buster’s requirement to meet the covenant ratios, as stipulated in the Amendment, until such time as we make a draw on our revolving credit facility or issue letters of credit in excess of $12,000. As of February 2, 2014, we have had no draws on our revolving credit facility and outstanding letters of credit have not exceeded $12,000, and as such we were not required to maintain financial ratios under our senior secured credit facility.
On May 14, 2013, D&B Holdings and Dave & Buster’s executed a second amendment (the “Second Amendment”) to the senior secured credit facility. The primary modification included in the Second Amendment is a reduction in the applicable term loan margin based on a consolidated leverage ratio greater than or equal to 2.75:1.00. If our consolidated leverage ratio is less than 2.75:1.00, the applicable term loan margin will be reduced for periods subsequent to fiscal 2013. As of February 2, 2014, Dave & Buster’s consolidated leverage ratio was 2.55:1.00
The Dave & Buster’s senior secured credit facility also contains certain customary representations and warranties, affirmative covenants and events of default, including: payment defaults, breaches of representations and warranties, covenant defaults, cross-defaults and cross-acceleration to certain indebtedness, certain events of bankruptcy, certain events under the Employee Retirement Income Security Act of 1974 as amended from time to time (“ERISA”), material judgments, actual or asserted failures of any guarantee or security document supporting the senior secured credit facility to be in full force and effect and a change of control. If an event of default occurs, the lenders under the senior secured credit facility would be entitled to take various actions, including acceleration of amounts due under the senior secured credit facility and all other actions permitted to be taken by a secured creditor.
Funds managed by Oak Hill Advisors, L.P. (the “OHA Funds”) collectively comprise one of twenty-two creditors participating in the term loan portion of our senior secured credit facility. As of February 2, 2014, the OHA Funds held approximately 9.97%, or $14,394, of our total term loan obligation. Oak Hill Advisors, L.P. is an independent investment firm that is not an affiliate of the Oak Hill Funds and is not under common control with the Oak Hill Funds. Oak Hill Advisors, L.P. and an affiliate of Oak Hill Capital Management, LLC co-manage Oak Hill Special Opportunities Fund, L.P., a private fund. Certain employees of the Oak Hill Funds, in their individual capacities, have passive investments in Oak Hill Advisors, L.P. and/or the funds it manages.
F-17
Table of Contents
DAVE & BUSTER’S ENTERTAINMENT, INC.
NOTES TO CONSOLIDATED FINANCIAL STATEMENTS (continued)
(in thousands, except share amounts)
Senior notes—The Dave & Buster’s senior notes are general unsecured, unsubordinated obligations of Dave & Buster’s and mature on June 1, 2018. Interest on the notes is paid semi-annually and accrues at the rate of 11.0% per annum. On or after June 1, 2014, Dave & Buster’s may redeem all, or from time-to-time, a part of the senior notes at redemption prices (expressed as a percentage of principal amount) ranging from 105.5% to 100.0% plus accrued and unpaid interest. As of February 2, 2014, our $200,000 of senior notes had an approximate fair value of $214,500 based on quoted market price. The fair value of the Dave & Buster’s senior notes was determined to be a Level One instrument as defined by GAAP.
The senior notes restrict Dave & Buster’s ability to incur indebtedness, outside of the senior secured credit facility, unless the consolidated coverage ratio exceeds 2.00:1.00 or other financial and operational requirements are met. Additionally, the terms of the notes restrict Dave & Buster’s ability to make certain payments to affiliated entities. Dave & Buster’s was in compliance with the debt covenants as of February 2, 2014.
Senior Discount Notes—On February 22, 2011, D&B Entertainment issued principal amount $180,790 of 12.25% senior discount notes. The notes will mature on February 15, 2016. No cash interest will be paid on the notes prior to maturity, but the value of the notes will accrete (representing the amortization of original issue discount) between the date of original issue and the maturity date of the senior discount notes, at a rate of 12.25% per annum, such that the accreted value will equal the principal amount on the maturity date.
On or after August 15, 2013, the Company may redeem all, or from time-to-time, a part of the senior discount notes at redemption prices (expressed as a percentage of accreted value) ranging from 106.125% to 100.0%. As of February 2, 2014, our senior discount notes had an approximate fair value of $150,100 (carrying value of $141,852) based on quoted market prices. The fair value of the Company’s senior discount notes was determined to be a Level Two instrument as defined by GAAP.
The Company received net proceeds of $100,000, which we used to pay debt issuance costs and to repurchase a portion of the common stock owned by our stockholders. We did not retain any proceeds from the note issuance. D&B Entertainment is the sole obligor of the notes. D&B Holdings, Dave & Buster’s nor any of its subsidiaries are guarantors of these notes. However, neither D&B Holdings nor D&B Entertainment has any material assets or operations separate from Dave & Buster’s.
The senior discount notes restrict the Company’s ability to incur indebtedness, outside of the senior secured credit facility, unless the consolidated coverage ratio exceeds 2.00:1.00 or other financial and operational requirements are met. Additionally, the terms of the senior discount notes restrict the Company’s ability to make certain payments to affiliated entities. The Company was in compliance with the debt covenants as of February 2, 2014.
Future debt obligations—The following table sets forth our future debt principal payment obligations as of February 2, 2014 (excluding repayment obligations under the revolving portion of our senior secured credit facility).
| DEBT OUTSTANDING AS OF FEBRUARY 2, 2014 |
||||
| 1 year or less |
$ | 1,500 | ||
| 2 years |
1,500 | |||
| 3 years |
322,165 | |||
| 4 years |
— | |||
| 5 years |
200,000 | |||
| Thereafter |
— | |||
|
|
|
|||
| Total future payments |
$ | 525,165 | ||
|
|
|
|||
F-18
Table of Contents
DAVE & BUSTER’S ENTERTAINMENT, INC.
NOTES TO CONSOLIDATED FINANCIAL STATEMENTS (continued)
(in thousands, except share amounts)
The following tables set forth our recorded interest expense, net:
| FISCAL YEAR ENDED FEBRUARY 2, 2014 |
FISCAL YEAR ENDED FEBRUARY 3, 2013 |
FISCAL YEAR ENDED JANUARY 29, 2012 |
||||||||||
| Dave & Buster’s debt-based interest expense |
$ | 29,675 | $ | 31,393 | 31,196 | |||||||
| D&B Entertainment Interest accretion |
15,881 | 14,141 | 11,830 | |||||||||
| Amortization of issuance cost and discount |
3,189 | 2,946 | 3,031 | |||||||||
| Capitalized interest |
(602 | ) | (510 | ) | (759 | ) | ||||||
| Interest income |
(334 | ) | (336 | ) | (367 | ) | ||||||
|
|
|
|
|
|
|
|||||||
| Total interest expense, net |
$ | 47,809 | $ | 47,634 | 44,931 | |||||||
|
|
|
|
|
|
|
|||||||
Note 8: Income Taxes
The provision (benefit) for income taxes is as follows:
| FISCAL YEAR ENDED FEBRUARY 2, 2014 |
FISCAL YEAR ENDED FEBRUARY 3, 2013 |
FISCAL YEAR ENDED JANUARY 29, 2012 |
||||||||||
| Current expense |
||||||||||||
| Federal |
$ | 615 | $ | 536 | $ | — | ||||||
| Foreign |
97 | 361 | (175 | ) | ||||||||
| State and local |
1,150 | (51 | ) | 383 | ||||||||
| Deferred expense (benefit) |
(801 | ) | (13,548 | ) | (4,004 | ) | ||||||
|
|
|
|
|
|
|
|||||||
| Total provision (benefit) for income taxes |
$ | 1,061 | $ | (12,702 | ) | $ | (3,796 | ) | ||||
|
|
|
|
|
|
|
|||||||
F-19
Table of Contents
DAVE & BUSTER’S ENTERTAINMENT, INC.
NOTES TO CONSOLIDATED FINANCIAL STATEMENTS (continued)
(in thousands, except share amounts)
Significant components of the deferred tax liabilities and assets in the consolidated balance sheets are as follows:
| FEBRUARY 2, 2014 |
FEBRUARY 3, 2013 |
|||||||
| Deferred tax assets: |
||||||||
| Tax credit carryovers |
$ | 10,297 | $ | 10,155 | ||||
| Deferred revenue and redemption ticket liability |
9,540 | 7,252 | ||||||
| Leasing transactions |
5,585 | 3,838 | ||||||
| State net operating loss carryovers |
3,503 | 3,444 | ||||||
| Workers’ compensation and general liability insurance |
3,429 | 3,666 | ||||||
| Accrued liabilities |
1,985 | 2,770 | ||||||
| Deferred compensation |
1,610 | 1,140 | ||||||
| Smallware supplies |
714 | 713 | ||||||
| Indirect benefit of unrecognized tax benefits |
225 | 216 | ||||||
| Other |
1,567 | 1,391 | ||||||
|
|
|
|
|
|||||
| Total deferred tax assets |
38,455 | 34,585 | ||||||
|
|
|
|
|
|||||
| Valuation allowance for deferred tax assets—US |
(1,388 | ) | (1,158 | ) | ||||
|
|
|
|
|
|||||
| Total deferred tax assets net of valuation allowance |
37,067 | 33,427 | ||||||
|
|
|
|
|
|||||
| Deferred tax liabilities: |
||||||||
| Trademark/trade name |
31,578 | 31,928 | ||||||
| Property and equipment |
4,109 | 963 | ||||||
| Prepaid expenses |
232 | 189 | ||||||
|
|
|
|
|
|||||
| Total deferred tax liabilities |
35,919 | 33,080 | ||||||
|
|
|
|
|
|||||
| Net deferred tax asset |
$ | 1,148 | $ | 347 | ||||
|
|
|
|
|
|||||
The Net deferred tax asset is presented in the Consolidated Balance Sheets as follows:
| FEBRUARY 2, 2014 |
FEBRUARY 3, 2013 |
|||||||
| Deferred income taxes—current |
$ | 24,802 | $ | 25,137 | ||||
| Other assets and deferred charge |
— | 286 | ||||||
|
|
|
|
|
|||||
| Deferred tax assets |
24,802 | 25,423 | ||||||
|
|
|
|
|
|||||
| Deferred income taxes—current |
— | 189 | ||||||
| Deferred income taxes |
23,654 | 24,887 | ||||||
|
|
|
|
|
|||||
| Deferred tax liabilities |
23,654 | 25,076 | ||||||
|
|
|
|
|
|||||
| Net deferred tax asset |
$ | 1,148 | $ | 347 | ||||
|
|
|
|
|
|||||
At February 2, 2014, we had a $1,388 valuation allowance against our deferred tax assets. The ultimate realization of our deferred tax assets is dependent on the generation of future taxable income during periods in which temporary differences become deductible. In assessing the realizability of our deferred tax assets, at February 2, 2014 we considered whether it is more likely than not that some or all of the deferred tax assets will not be realized. Based on the level of recent historical taxable income; consistent generation of annual taxable income, recent payments of
F-20
Table of Contents
DAVE & BUSTER’S ENTERTAINMENT, INC.
NOTES TO CONSOLIDATED FINANCIAL STATEMENTS (continued)
(in thousands, except share amounts)
income taxes currently due, and estimations of future taxable income we have concluded that it is more likely than not that we will realize the federal tax benefits associated with our deferred tax assets. We assessed the realizability of the deferred tax assets associated with state taxes, foreign taxes and uncertain tax positions and have concluded that it is more likely than not that a portion of these assets will not be realized. Accordingly, we have increased our previously established valuation allowance against our deferred tax assets for state taxes and uncertain tax positions by $230.
As of February 2, 2014, we had federal tax credit carryforwards of $10,248, including $9,578 of general business credits and $670 of AMT credit carryovers. There is a 20-year carryforward on general business credits and net AMT credits can be carried forward indefinitely. The general business credits do not begin to expire until 2028 and are expected to be utilized over the next three fiscal years.
As of February 2, 2014, we no longer had any Federal net operating loss carryforwards available to reduce current income taxes due. During fiscal year 2012 we utilized all $14,172 million of federal net operating loss carryforwards that existed at the end of fiscal year 2011. These net operating losses resulted from stock-based compensation tax deductions realized by our Predecessor from the consummation of the June 2010 acquisition and were not from operating results.
The State of Texas has enacted legislation which established a tax based on taxable margin. As a result of the legislation and in accordance with accounting guidance for income taxes, we recorded an income tax expense of $246, $269 and $228 for the fiscal years ended February 2, 2014, February 3, 2013 and January 29, 2012, respectively.
We currently anticipate that approximately $46 of unrecognized tax benefits will be settled through federal and state audits or will be recognized as a result of the expiration of statute of limitations during fiscal 2014. Future recognition of potential interest or penalties, if any, will be recorded as a component of income tax expense. Because of the impact of deferred tax accounting, $349 of unrecognized tax benefits, if recognized, would affect the effective tax rate.
We file income tax returns, which are periodically audited by various federal, state and foreign jurisdictions. We are generally no longer subject to federal, state, or foreign income tax examinations for years prior to 2009. In fiscal 2011 the Internal Revenue Service (“IRS”) commenced an examination of D&B Entertainment’s U.S. income tax returns for fiscal 2009. As of February 2, 2014, the audit has been closed and the examination resulted in an immaterial change related to tax inventory carrying value.
The change in unrecognized tax benefits excluding interest, penalties and related income tax benefits were as follows:
| FISCAL YEAR ENDED FEBRUARY 2, 2014 |
FISCAL YEAR ENDED FEBRUARY 3, 2013 |
FISCAL YEAR ENDED JANUARY 29, 2012 |
||||||||||
| Balance at beginning of year |
$ | 471 | $ | 940 | $ | 881 | ||||||
| Additions for tax positions of prior years |
176 | 108 | 118 | |||||||||
| Reductions for tax positions of prior years |
(32 | ) | (1 | ) | — | |||||||
| Settlements |
— | (576 | ) | — | ||||||||
| Lapse of statute of limitations |
(139 | ) | — | (59 | ) | |||||||
|
|
|
|
|
|
|
|||||||
| Balance at end of year |
$ | 476 | $ | 471 | $ | 940 | ||||||
|
|
|
|
|
|
|
|||||||
F-21
Table of Contents
DAVE & BUSTER’S ENTERTAINMENT, INC.
NOTES TO CONSOLIDATED FINANCIAL STATEMENTS (continued)
(in thousands, except share amounts)
As of February 2, 2014, the accrued interest and penalties on the unrecognized tax benefits were $147 and $144, respectively, excluding any related income tax benefits. As of February 3, 2013, the accrued interest and penalties on the unrecognized tax benefits were $156 and $134, respectively, excluding any related income tax benefits. The Company recognized interest accrued related to the unrecognized tax benefits and penalties as a component of the provision for income taxes recognized in the Consolidated Statements of Operations.
The reconciliation of the federal statutory rate to the effective income tax rate follows:
| FISCAL YEAR ENDED FEBRUARY 2, 2014 |
FISCAL YEAR ENDED FEBRUARY 3, 2013 |
FISCAL YEAR ENDED JANUARY 29, 2012 |
||||||||||
| Federal corporate statutory rate |
35.0 | % | 35.0 | % | 35.0 | % | ||||||
| State and local income taxes, net of federal income tax benefit |
30.8 | % | 1.2 | % | 4.1 | % | ||||||
| Foreign taxes |
1.8 | % | 0.9 | % | 1.2 | % | ||||||
| Nondeductible expenses |
24.9 | % | (23.5 | )% | (7.1 | )% | ||||||
| Tax credits |
(74.8 | )% | 65.8 | % | 20.1 | % | ||||||
| Valuation allowance |
7.1 | % | 257.4 | % | (7.8 | )% | ||||||
| Change in reserve |
0.2 | % | 32.9 | % | (2.1 | )% | ||||||
| Other |
1.7 | % | (45.7 | )% | (8.2 | )% | ||||||
|
|
|
|
|
|
|
|||||||
| Effective tax rate |
26.7 | % | 324.0 | % | 35.2 | % | ||||||
|
|
|
|
|
|
|
|||||||
Note 9: Leases
We lease certain property and equipment under various non-cancelable operating leases. Some of the leases include options for renewal or extension on various terms. Most of the leases require us to pay property taxes, insurance and maintenance of the leased assets. Certain leases also have provisions for additional contingent rentals based on revenues. For fiscal 2013, rent expense for operating leases was $54,450, including contingent rentals of $2,858. For fiscal 2012, rent expense for operating leases was $50,561, including contingent rentals of $2,620. For fiscal 2011, rent expense for operating leases was $47,342, including contingent rentals of $2,310. At February 2, 2014 future minimum lease payments, including any periods covered by renewal options we are reasonably assured of exercising (including the sale/leaseback transactions described below), are:
| 2014 |
2015 | 2016 | 2017 | 2018 | THEREAFTER | TOTAL | ||||||||||||||||||
| $57,024 |
$ | 56,068 | $ | 54,947 | $ | 53,125 | $ | 49,603 | $ | 284,780 | $ | 555,547 | ||||||||||||
At February 2, 2014, we also had lease commitments on equipment as follows:
| 2014 |
2015 | 2016 | 2017 | 2018 | THEREAFTER | TOTAL | ||||||||||||||||||
| $797 |
$ | 606 | $ | 167 | $ | 14 | $ | — | $ | — | $ | 1,584 | ||||||||||||
We have signed operating lease agreements for our stores located in Westchester, California and Vernon Hills, Illinois which opened in February and March 2014 respectively, and a future site in Panama City Beach, Florida which is expected to open in the second quarter of fiscal 2014. The landlord has fulfilled the obligations to commit us to the lease terms under these agreements and therefore, the future obligations related to these locations are included in the table above. Lease obligations related to the Company’s location in Kensington/Bethesda, Maryland have also
F-22
Table of Contents
DAVE & BUSTER’S ENTERTAINMENT, INC.
NOTES TO CONSOLIDATED FINANCIAL STATEMENTS (continued)
(in thousands, except share amounts)
been included in the table above. See Note 13, “Subsequent events” to our Consolidated Financial Statements for a description of events pertaining to the Kensington/Bethesda, Maryland location.
As of February 2, 2012 we currently have signed eleven additional lease agreements for future sites. Our commitments under these agreements are contingent upon among other things, the landlord’s delivery of access to the premises for construction. Future obligations related to these agreements are not included in the table above. Subsequent to February 2, 2014, future sites in Los Angeles, CA and Manchester, CT were delivered by their respective landlords resulting in future commitments of approximately $38,000.
During 2000 and 2001, we completed the sale/leaseback of three stores and the corporate headquarters. Cash proceeds of $24,774 were received along with twenty-year notes aggregating $6,750. The notes bear interest of 7% to 7.5%. At the end of fiscal years 2013 and 2012, the aggregate balance of the notes receivable due from the lessors under the sale/leaseback agreements was $2,936 and $3,201, respectively. Future minimum principal and interest payments due to us under these notes are as follows:
| 2014 |
2015 | 2016 | 2017 | 2018 | THEREAFTER | TOTAL | ||||||||||||||||||
| $489 |
$ | 489 | $ | 489 | $ | 489 | $ | 489 | $ | 1,424 | $ | 3,869 | ||||||||||||
Note 10: Common Stock
Stock Option Plans-Successor
In June 2010 the members of D&B Entertainment board of directors approved the adoption of the 2010 D&B Entertainment Incentive Plan. The 2010 D&B Entertainment Incentive Plan provides for the granting of options to acquire stock in D&B Entertainment to certain of our employees, outside directors and consultants. The options are subject to either time-based vesting or performance-based vesting. Options granted under the 2010 D&B Entertainment Incentive Plan terminate on the ten-year anniversary of the grants.
The various options provided for in the 2010 D&B Entertainment Incentive Plan are as follows, in each case subject to the grantees continued employment with or service to D&B Entertainment or its subsidiaries (subject to certain conditions in the event of grantee termination):
Service-based options
These options contain a service-based (or time-based) vesting provision, whereby the options will vest annually in five equal amounts. Upon sale of the Company or change in control, all service-based options will fully vest.
Performance-based options
These options contain various performance-based vesting provisions depending on the type of performance option granted. Adjusted EBITDA vesting options vest over a prescribed time period based on D&B Entertainment meeting certain profitability targets for each fiscal year during the vesting period. Adjusted EBITDA vesting options also vest upon a D&B Entertainment change of control provided that internal rate of return (IRR) conditions stipulated by the Oak Hill Funds are met. IRR vesting options vest upon a change in control of D&B Entertainment if the Oak Hill Fund’s internal rate of return is greater than or equal to certain percentages set forth in the applicable option agreement. Any options that have not vested prior to a change of control or do not vest in connection with a change of control will be forfeited by the grantee upon a change of control for no consideration.
F-23
Table of Contents
DAVE & BUSTER’S ENTERTAINMENT, INC.
NOTES TO CONSOLIDATED FINANCIAL STATEMENTS (continued)
(in thousands, except share amounts)
Transactions during fiscal 2013 under the 2010 D&B Entertainment Incentive Plan were as follows:
| SERVICE BASED OPTIONS | PERFORMANCE BASED OPTIONS | |||||||||||||||
| NUMBER OF OPTIONS |
WEIGHTED AVERAGE EXERCISE PRICE |
NUMBER OF OPTIONS |
WEIGHTED AVERAGE EXERCISE PRICE |
|||||||||||||
| Options outstanding at beginning of year |
4,966 | $ | 1,056 | 12,162 | $ | 1,015 | ||||||||||
| Granted |
1,012 | 1,963 | 75 | 2,233 | ||||||||||||
| Exercised |
(44 | ) | 1,000 | (36 | ) | 1,000 | ||||||||||
| Forfeited |
(141 | ) | 1,135 | (241 | ) | 1,000 | ||||||||||
|
|
|
|
|
|
|
|
|
|||||||||
| Options outstanding at end of year |
5,793 | 1,213 | 11,960 | 1,023 | ||||||||||||
|
|
|
|
|
|
|
|
|
|||||||||
| Options exercisable at end of year |
2,620 | $ | 1,060 | 3,333 | $ | 1,046 | ||||||||||
|
|
|
|
|
|
|
|
|
|||||||||
We recorded share-based compensation expense related to our stock option plan of $1,207, $1,099 and $1,038 during the fiscal year ended February 2, 2014, February 3, 2013 and January 29, 2012 respectively. The unrecognized expense related to our stock option plan totaled approximately $1,504 as of February 2, 2014 and will be expensed over a weighted average 1.6 years. The weighted average grant date fair value per option granted in fiscal year 2013 was $1,052. The average remaining term for all options outstanding at February 2, 2014 is 6.6 years.
In the event that vesting of the previously unvested options is accelerated for any reason, the remaining unamortized share-based compensation would be accelerated. In addition, assumptions made regarding forfeitures in determining the remaining unamortized share-based compensation would be re-evaluated to determine if additional share-based compensation expense would be required for any changes in the underlying assumptions.
Other Information—Related Party Transactions
On September 30, 2010, we repurchased one thousand five hundred shares of our common stock from a former member of management for $1,500, of which $500 was paid in fiscal 2010 and $1,000 was paid in fiscal 2011 by Dave & Buster’s, Inc. on behalf of us prior to January 29, 2012. As described below, we subsequently resold approximately seventy-five and eight hundred thirty-three of the purchased shares on March 23, 2011 and January 18, 2012, respectively. We continue to retain approximately five hundred ninety-two of the purchased shares as treasury stock.
On March 23, 2011, we sold to a member of management seventy-five shares of our common stock held as treasury stock for an aggregate price of $75, the value based on an independent third party valuation prepared as of January 30, 2011.
On June 28, 2011, we repurchased approximately ninety shares of our common stock from a former member of management for approximately $90, of which the Dave & Buster’s, Inc., on behalf of us, paid $15. The purchased shares are being retained as treasury stock by the Company.
On January 13, 2012, we repurchased approximately four hundred twenty-two shares of our common stock from a former member of management for approximately $507, all of which was paid by Dave & Buster’s, Inc. on behalf of us. The purchased shares are being retained as treasury stock by the Company.
On January 18, 2012, we sold approximately eight hundred thirty-three shares of our common stock previously held as treasury stock to three outside directors for an aggregate price of approximately $1,000. Proceeds from the sale were used to repay funds that had been advanced to us by Dave & Buster’s, Inc. The per share sales price approximates the value per share as determined by an independent third party valuation prepared as of October 30, 2011.
F-24
Table of Contents
DAVE & BUSTER’S ENTERTAINMENT, INC.
NOTES TO CONSOLIDATED FINANCIAL STATEMENTS (continued)
(in thousands, except share amounts)
On January 6, 2014, a former member of management exercised his option for eighty shares at a strike price of $1,000. The Company issued new shares in satisfaction of this exercise. Proceeds from the exercise were allocated to Dave & Buster’s in anticipation of future expenses.
Subsequent to the transactions described above, the Oak Hill Funds controls approximately 95.4% and certain members of our Board of Directors and management control approximately 4.5% of the outstanding common stock. The remaining 0.1% is owned by a former member of management.
Note 11: Employee Benefit Plan
We sponsor a plan to provide retirement benefits under the provisions of Section 401(k) of the Internal Revenue Code (the “401(k) Plan”) for all employees who have completed a specified term of service. Our contributions may range from 0% to 100% of employee contributions, up to a maximum of 6% of eligible employee compensation, as defined by the 401(k) Plan. Employees may elect to contribute up to 50% of their eligible compensation on a pretax basis. Benefits under the 401(k) Plan are limited to the assets of the 401(k) Plan. Expenses related to our contributions to the 401(k) plan were $370, $382, and $273 for fiscal 2013, 2012, and 2011, respectively.
Note 12: Contingencies
We are subject to certain legal proceedings and claims that arise in the ordinary course of our business. In the opinion of management, based upon consultation with legal counsel, the amount of ultimate liability with respect to such legal proceedings and claims will not materially affect the consolidated results of our operations or our financial condition.
We are subject to the terms of a settlement agreement with the Federal Trade Commission (FTC) that requires us, on an ongoing basis, to establish, implement, and maintain a comprehensive information security program that is reasonably designed to protect the security, confidentiality, and integrity of personal information collected from or about consumers. The agreement does not require us to pay any fines or other monetary assessments and we do not believe that the terms of the agreement will have a material adverse effect on our business, operations, or financial performance.
Note 13: Subsequent events
On November 14, 2013, the Company filed a complaint in federal court seeking declaratory and injunctive relief related to actions taken by a landlord attempting to terminate the lease agreement for our store in Kensington/Bethesda, Maryland (“Bethesda”). The landlord alleged that the Company is in default of certain lease agreement provisions which restrict our ability to operate other Dave & Buster’s facilities within a prescribed distance of the Bethesda location. We believed that the lease provisions cited by the landlord were not legally enforceable and that the Company had the right to operate all facilities for the duration of the original lease term and any available lease extension periods. On March 21, 2014, the court ruled against the Company. The Company is evaluating all options available to it, including the filing of motions or appeals in an effort to overturn this decision. However, it is probable the store will close before the end of the first quarter of fiscal 2014. As of March 28, 2014, we believe that all of our fixed assets from the Bethesda store are either fully depreciated or can be transferred to other locations. With past store closures, we have experienced customer migration to other stores within the same market. We believe that some customers will choose to visit our store in Hanover, Maryland, which is approximately 30 miles from our Bethesda store.
F-25
Table of Contents
DAVE & BUSTER’S ENTERTAINMENT, INC.
NOTES TO CONSOLIDATED FINANCIAL STATEMENTS (continued)
(in thousands, except share amounts)
Note 14: Quarterly Financial Information (unaudited)
| FISCAL YEAR ENDED FEBRUARY 2, 2014 | ||||||||||||||||
| FIRST QUARTER 5/5/2013 |
SECOND QUARTER 8/4/2013 |
THIRD QUARTER 11/3/2013 |
FOURTH QUARTER 2/2/2014 |
|||||||||||||
| Total revenues |
$ | 168,155 | $ | 153,723 | $ | 142,330 | $ | 171,371 | ||||||||
| Income (loss) before provision (benefit) for income taxes |
10,554 | (794 | ) | (12,910 | ) | 6,380 | ||||||||||
| Net income (loss) |
7,550 | (98 | ) | (10,160 | ) | 4,877 | ||||||||||
| FISCAL YEAR ENDED FEBRUARY 3, 2013 | ||||||||||||||||
| FIRST QUARTER 4/29/2012 |
SECOND QUARTER 7/29/2012 |
THIRD QUARTER 10/28/2012 |
FOURTH QUARTER 2/3/2013(1) |
|||||||||||||
| Total revenues |
$ | 163,474 | $ | 147,941 | $ | 131,066 | $ | 165,586 | ||||||||
| Income (loss) before provision (benefit) for income taxes |
11,312 | (3,258 | ) | (14,180 | ) | 2,206 | ||||||||||
| Net income (loss) |
8,857 | (1,603 | ) | (3,894 | ) | 5,422 | ||||||||||
| (1) | Our fiscal 2012 year consisted of 53 weeks. Each quarterly period has 13 weeks, except the fourth quarterly period ended February 3, 2013, which consists of 14 weeks. We have estimated the revenues during the 53rd week of fiscal 2012 to be $10,355. |
During 2013, we opened five locations: Virginia Beach, Virginia, in the second quarter, Syracuse, New York and Albany, New York, in the third quarter, Cary, North Carolina and Livonia, Michigan in the fourth quarter. During 2012, we opened four locations: Oklahoma City, Oklahoma in the first quarter, Orland Park, Illinois in the third quarter, Dallas, Texas and Boise, Idaho both in the fourth quarter. Additionally, during the fourth quarter of fiscal 2012, we permanently closed one store in Dallas, Texas. Pre-opening costs incurred in fiscal 2013 were $872, $1,970, $2,333 and $1,865 in the first, second, third and fourth quarters, respectively. Pre-opening costs incurred in fiscal 2012 were $150, $559, $1,089 and $1,262 in the first, second, third and fourth quarters, respectively.
Note 15: Earnings per share
Basic earnings per share (“EPS”) represents net income divided by the weighted average number of common shares outstanding during the period. Diluted EPS represents net income divided by the basic weighted average number of common shares plus, if dilutive, potential common shares outstanding during the period. Potential common shares consist of incremental common shares issuable upon the exercise of outstanding stock options. The dilutive effect of potential common shares is determined using the treasury stock method, whereby outstanding stock options are assumed exercised at the beginning of the reporting period and the exercise proceeds from such stock options, unamortized compensation cost, and excess tax benefits arising in connection with these stock-based awards are assumed to be used to repurchase our common stock at the average market price during the period.
F-26
Table of Contents
DAVE & BUSTER’S ENTERTAINMENT, INC.
NOTES TO CONSOLIDATED FINANCIAL STATEMENTS (continued)
(in thousands, except share amounts)
The following table sets forth the computation of EPS, basic and diluted for the fiscal year ended February 2, 2014, February 3, 2013, and January 29, 2012:
| (in thousands, except per share data) | FISCAL YEAR ENDED FEBRUARY 2, 2014 |
FISCAL YEAR ENDED FEBRUARY 3, 2013 |
FISCAL YEAR ENDED JANUARY 29, 2012 |
|||||||||
| Numerator: |
||||||||||||
| Net income (loss) |
$ | 2,169 | $ | 8,782 | $ | (6,985 | ) | |||||
| Denominator: |
||||||||||||
| Basic weighted average common shares outstanding |
147,512 | 147,506 | 153,250 | |||||||||
| Potential common shares for stock options |
3,744 | 2,494 | — | |||||||||
| Diluted weighted average common shares outstanding |
151,256 | 150,000 | 153,250 | |||||||||
| Earnings (loss) per shares: |
||||||||||||
| Basic |
$ | 14.70 | $ | 59.54 | $ | (45.58 | ) | |||||
| Diluted |
$ | 14.34 | $ | 58.55 | $ | (45.58 | ) | |||||
We had approximately 5,793 and 4,966 time-based stock option awards outstanding under our stock option plan as of February 2, 2014 and February 3, 2013, respectively. Performance based stock options under our stock option plan were not included in the earnings per share calculation as they did not meet the criteria for inclusion per GAAP guidance.
F-27
Table of Contents
DAVE & BUSTER’S ENTERTAINMENT, INC.
CONSOLIDATED BALANCE SHEETS
(in thousands, except share amounts)
| AUGUST 3, 2014 | FEBRUARY 2, 2014 | |||||||
| (unaudited) | (audited) | |||||||
| ASSETS |
||||||||
| Current assets: |
||||||||
| Cash and cash equivalents |
$ | 65,351 | $ | 38,080 | ||||
| Inventories |
15,254 | 15,354 | ||||||
| Prepaid expenses |
11,159 | 9,670 | ||||||
| Deferred income taxes |
26,489 | 24,802 | ||||||
| Income taxes receivable |
1,391 | 2,445 | ||||||
| Other current assets |
7,884 | 8,993 | ||||||
|
|
|
|
|
|||||
| Total current assets |
127,528 | 99,344 | ||||||
| Property and equipment (net of $224,429 and $195,339 accumulated depreciation as of August 3, 2014 and February 2, 2014, respectively) |
406,411 | 388,093 | ||||||
| Tradenames |
79,000 | 79,000 | ||||||
| Goodwill |
272,404 | 272,428 | ||||||
| Other assets and deferred charges |
22,781 | 22,893 | ||||||
|
|
|
|
|
|||||
| Total assets |
$ | 908,124 | $ | 861,758 | ||||
|
|
|
|
|
|||||
| LIABILITIES AND STOCKHOLDERS’ EQUITY |
||||||||
| Current liabilities: |
||||||||
| Current installments of long-term debt (Note 3) |
$ | 3,975 | $ | 1,500 | ||||
| Accounts payable |
34,768 | 36,092 | ||||||
| Accrued liabilities (Note 2) |
77,574 | 74,379 | ||||||
| Income taxes payable |
921 | 1,073 | ||||||
| Deferred income taxes |
804 | — | ||||||
|
|
|
|
|
|||||
| Total current liabilities |
118,042 | 113,044 | ||||||
| Deferred income taxes |
19,918 | 23,654 | ||||||
| Deferred occupancy costs |
87,576 | 81,743 | ||||||
| Other liabilities |
9,282 | 8,692 | ||||||
| Long-term debt, less current installments, net of unamortized discount (Note 3) |
524,706 | 484,177 | ||||||
| Commitments and contingencies (Note 5) |
||||||||
| Stockholders’ equity: |
||||||||
| Common stock, $0.01 par value, 500,000 authorized; 148,690 issued shares as of August 3, 2014 and February 2, 2014 |
1 | 1 | ||||||
| Preferred stock, 10,000,000 authorized; none issued |
— | — | ||||||
| Paid-in capital |
153,497 | 152,994 | ||||||
| Treasury stock, 1,104 shares as of August 3, 2014 and February 2, 2014 |
(1,189 | ) | (1,189 | ) | ||||
| Accumulated other comprehensive loss |
(101 | ) | (167 | ) | ||||
| Accumulated deficit |
(3,608 | ) | (1,191 | ) | ||||
|
|
|
|
|
|||||
| Total stockholders’ equity |
148,600 | 150,448 | ||||||
|
|
|
|
|
|||||
| Total liabilities and stockholders’ equity |
$ | 908,124 | $ | 861,758 | ||||
|
|
|
|
|
|||||
See accompanying notes to consolidated financial statements.
F-28
Table of Contents
DAVE & BUSTER’S ENTERTAINMENT, INC.
CONSOLIDATED STATEMENTS OF COMPREHENSIVE INCOME (LOSS)
(in thousands, unaudited)
| TWENTY-SIX WEEKS ENDED AUGUST 3, 2014 |
TWENTY-SIX WEEKS ENDED AUGUST 4, 2013 |
|||||||
| Food and beverage revenues |
$ | 177,898 | $ | 153,272 | ||||
| Amusement and other revenues |
198,310 | 168,606 | ||||||
|
|
|
|
|
|||||
| Total revenues |
376,208 | 321,878 | ||||||
| Cost of food and beverage |
45,690 | 38,273 | ||||||
| Cost of amusement and other |
27,244 | 24,263 | ||||||
|
|
|
|
|
|||||
| Total cost of products |
72,934 | 62,536 | ||||||
| Operating payroll and benefits |
85,120 | 72,546 | ||||||
| Other store operating expenses |
114,142 | 98,761 | ||||||
| General and administrative expenses |
20,069 | 17,922 | ||||||
| Depreciation and amortization expense |
34,673 | 33,650 | ||||||
| Pre-opening costs |
4,292 | 2,842 | ||||||
|
|
|
|
|
|||||
| Total operating costs |
331,230 | 288,257 | ||||||
|
|
|
|
|
|||||
| Operating income |
44,978 | 33,621 | ||||||
| Interest expense, net (Note 3) |
23,696 | 23,861 | ||||||
| Loss on debt retirement |
25,986 | — | ||||||
|
|
|
|
|
|||||
| Income (loss) before provision (benefit) for income taxes |
(4,704 | ) | 9,760 | |||||
| Provision (benefit) for income taxes |
(2,287 | ) | 2,308 | |||||
|
|
|
|
|
|||||
| Net income (loss) |
(2,417 | ) | 7,452 | |||||
|
|
|
|
|
|||||
| Unrealized foreign currency translation gain (loss) |
66 | (163 | ) | |||||
|
|
|
|
|
|||||
| Total comprehensive income (loss) |
$ | (2,351 | ) | $ | 7,289 | |||
|
|
|
|
|
|||||
| Net Income per share: |
||||||||
| Net Income (loss) |
$ | (2,417 | ) | $ | 7,452 | |||
| Basic |
$ | (16.38 | ) | $ | 50.52 | |||
| Diluted |
$ | (16.38 | ) | $ | 49.40 | |||
| Weighted average shares used in per share calculations: |
||||||||
| Basic shares |
147,586 | 147,506 | ||||||
| Diluted shares |
147,586 | 150,850 | ||||||
See accompanying notes to consolidated financial statements.
F-29
Table of Contents
DAVE & BUSTER’S ENTERTAINMENT, INC.
CONSOLIDATED STATEMENTS OF STOCKHOLDERS’ EQUITY
(in thousands, except share amounts)
| COMMON STOCK |
PAID-IN CAPITAL |
TREASURY STOCK AT COST |
ACCUMULATED OTHER COMPREHENSIVE INCOME (LOSS) |
ACCUMULATED DEFICIT |
TOTAL | |||||||||||||||||||||||||||
| SHARES | AMT. | SHARES | AMT. | |||||||||||||||||||||||||||||
| Balance February 2, 2014 |
148,690 | $ | 1 | $ | 152,994 | 1,104 | $ | (1,189 | ) | $ | (167 | ) | $ | (1,191 | ) | $ | 150,448 | |||||||||||||||
|
|
|
|
|
|
|
|
|
|
|
|
|
|
|
|
|
|||||||||||||||||
| Net loss |
— | — | — | — | — | — | (2,417 | ) | (2,417 | ) | ||||||||||||||||||||||
| Unrealized foreign currency translation gain |
— | — | — | — | — | 66 | — | 66 | ||||||||||||||||||||||||
| Stock-based compensation |
— | — | 503 | — | — | — | — | 503 | ||||||||||||||||||||||||
|
|
|
|
|
|
|
|
|
|
|
|
|
|
|
|
|
|||||||||||||||||
| Balance August 3, 2014 |
148,690 | $ | 1 | $ | 153,497 | 1,104 | $ | (1,189 | ) | $ | (101 | ) | $ | (3,608 | ) | $ | 148,600 | |||||||||||||||
|
|
|
|
|
|
|
|
|
|
|
|
|
|
|
|
|
|||||||||||||||||
See accompanying notes to consolidated financial statements.
F-30
Table of Contents
DAVE & BUSTER’S ENTERTAINMENT, INC.
CONSOLIDATED STATEMENTS OF CASH FLOWS
(in thousands, unaudited)
| TWENTY-SIX WEEKS ENDED AUGUST 3, 2014 |
TWENTY-SIX WEEKS ENDED AUGUST 4, 2013 |
|||||||
| Cash flows from operating activities: |
||||||||
| Net income (loss) |
$ | (2,417 | ) | $ | 7,452 | |||
| Adjustments to reconcile net income (loss) to net cash provided by operating activities: |
||||||||
| Depreciation and amortization expense |
34,673 | 33,650 | ||||||
| Debt costs and discount amortization (Note 3) |
1,556 | 1,605 | ||||||
| Payment of accreted interest (Note 3) |
(50,193 | ) | — | |||||
| Accretion of note discount |
8,341 | 7,694 | ||||||
| Deferred income tax expense (Note 4) |
(4,620 | ) | 1,890 | |||||
| Loss on disposal of fixed assets |
622 | 938 | ||||||
| Loss on debt retirement (Note 3) |
6,994 | — | ||||||
| Share-based compensation charges |
503 | 622 | ||||||
| Other, net |
(119 | ) | (3,345 | ) | ||||
| Changes in assets and liabilities: |
||||||||
| Inventories |
100 | (200 | ) | |||||
| Prepaid expenses |
(1,448 | ) | 29 | |||||
| Income tax receivable |
1,054 | 1,120 | ||||||
| Other current assets |
1,119 | 6,540 | ||||||
| Other assets and deferred charges |
(506 | ) | (163 | ) | ||||
| Accounts payable |
5,325 | 5,700 | ||||||
| Accrued liabilities |
2,903 | (172 | ) | |||||
| Income taxes payable |
(152 | ) | (757 | ) | ||||
| Deferred occupancy costs |
5,925 | 1,039 | ||||||
| Other liabilities |
791 | 2,690 | ||||||
|
|
|
|
|
|||||
| Net cash provided by operating activities |
10,451 | 66,332 | ||||||
|
|
|
|
|
|||||
| Cash flows from investing activities: |
||||||||
| Capital expenditures |
(59,374 | ) | (45,684 | ) | ||||
| Proceeds from sales of property and equipment |
22 | 125 | ||||||
|
|
|
|
|
|||||
| Net cash used in investing activities |
(59,352 | ) | (45,559 | ) | ||||
|
|
|
|
|
|||||
| Cash flows from financing activities: |
||||||||
| Repayments of senior secured credit facility (Note 3) |
(144,375 | ) | (750 | ) | ||||
| Repayment of senior notes (Note 3) |
(200,000 | ) | — | |||||
| Repayment of senior discount notes (Note 3) |
(100,000 | ) | — | |||||
| Borrowing under new senior credit facility (Note 3) |
528,675 | — | ||||||
| Debt issuance costs (Note 3) |
(8,128 | ) | (818 | ) | ||||
|
|
|
|
|
|||||
| Net cash provided by (used in) financing activities |
76,172 | (1,568 | ) | |||||
|
|
|
|
|
|||||
| Increase in cash and cash equivalents |
27,271 | 19,205 | ||||||
| Beginning cash and cash equivalents |
38,080 | 36,117 | ||||||
|
|
|
|
|
|||||
| Ending cash and cash equivalents |
$ | 65,351 | $ | 55,322 | ||||
|
|
|
|
|
|||||
| Supplemental disclosures of cash flow information: |
||||||||
| Cash paid for income taxes, net |
$ | 1,348 | $ | 1,421 | ||||
| Cash paid for interest and related debt fees, net of amounts capitalized |
$ | 17,474 | $ | 14,688 | ||||
| Cash paid for interest and related debt fees, related to debt retirement |
$ | 18,992 | $ | — | ||||
| Cash paid for settlement of accreted interest on senior discount notes |
$ | 50,193 | $ | — | ||||
See accompanying notes to consolidated financial statements.
F-31
Table of Contents
DAVE & BUSTER’S ENTERTAINMENT, INC.
NOTES TO CONSOLIDATED FINANCIAL STATEMENTS
(in thousands, except share and per share amounts)
Note 1: Description of Business and Basis of Presentation
Description of Business—On June 1, 2010, Dave & Buster’s Entertainment, Inc. (“D&B Entertainment”), a newly-formed Delaware corporation owned by Oak Hill Capital Partners III, L.P. and Oak Hill Capital Management Partners III, L.P. (collectively, the “Oak Hill Funds”) acquired all of the outstanding common stock of Dave & Buster’s Holding, Inc. (“D&B Holdings”) from Wellspring Capital Partners III, L.P and HBK Main Street Investors L.P. In connection therewith, Games Merger Corp., a newly-formed Missouri corporation and an indirect wholly-owned subsidiary of D&B Entertainment, merged with and into D&B Holdings’ wholly-owned, direct subsidiary, Dave & Buster’s, Inc. (with Dave & Buster’s, Inc. being the surviving corporation in the merger). Dave & Buster’s, Inc. owns and operates high-volume venues in North America that combine dining and entertainment for both adults and families.
D&B Entertainment owns no significant assets or operations other than the ownership of all the common stock of D&B Holdings. D&B Holdings owns no significant assets or operations other than the ownership of all the common stock of Dave & Buster’s, Inc. References to the “Company”, “we”, “us”, and “our” refers to D&B Entertainment, Inc. and its subsidiaries and any predecessor companies. All material intercompany accounts and transactions have been eliminated in consolidation.
Our one industry segment is the operation and licensing of high-volume entertainment and dining venues under the names “Dave & Buster’s” and “Dave & Buster’s Grand Sports Café.” Dave & Buster’s, Inc. operates its business as one operating and one reportable segment. We operate on a 52 or 53 week fiscal year that ends on the Sunday after the Saturday closest to January 31. Each quarterly period has 13 weeks, except for a 53 week year when the fourth quarter has 14 weeks. Our fiscal years ending February 1, 2015 and February 2, 2014, both consist of 52 weeks.
During the first twenty-six weeks of fiscal 2014, we opened three new stores. As of August 3, 2014, there were 69 company-owned stores in the United States and Canada. On August 12, 2014, we permanently closed our location in Kensington/Bethesda, Maryland. Revenues for our Kensington/Bethesda, Maryland store were $5,231 and $6,384 in the twenty-six weeks ended August 3, 2014 and the twenty-six weeks ended August 4, 2013, respectively. Operating income for the store was $865 for the twenty-six weeks ended August 3, 2014, and $1,654 for the same period of fiscal 2013. On August 25, 2014, we opened a new store in Los Angeles, California.
Related Party Transactions—Funds managed by Oak Hill Advisors, L.P. (the “OHA Funds”) comprise one of the creditors participating in the term loan portion of our new senior secured credit facility. As of August 3, 2014, the OHA Funds held approximately 10.0%, or $53,000 of our total term loan obligation. Oak Hill Advisors, L.P. is an independent investment firm that is not an affiliate of the Oak Hill Funds and is not under common control with the Oak Hill Funds. Oak Hill Advisors, L.P. and an affiliate of Oak Hill Capital Management, LLC co-manage Oak Hill Special Opportunities Fund, L.P., a private fund. Certain employees of the Oak Hill Funds, in their individual capacities, have passive investments in Oak Hill Advisors, L.P. and/or the funds it manages.
We have an expense reimbursement agreement with Oak Hill Capital Management, LLC, which provides for the reimbursement of certain costs and expenses of Oak Hill Capital Management, LLC. We made payments to Oak Hill Capital Management, LLC of $35 during the twenty-six weeks ended August 3, 2014 and $95 during the twenty-six weeks ended August 4, 2013.
We paid board compensation of $118 during the twenty-six weeks ended August 3, 2014, and August 4, 2013 to David Jones and Alan Lacy, two board members who serve as Senior Advisors to the Oak Hill Funds.
Interim financial statements—The accompanying unaudited financial statements have been prepared in accordance with generally accepted accounting principles (“GAAP”) in the United States for interim financial information as
F-32
Table of Contents
DAVE & BUSTER’S ENTERTAINMENT, INC.
NOTES TO CONSOLIDATED FINANCIAL STATEMENTS (continued)
(in thousands, except share and per share amounts)
prescribed by the Securities and Exchange Commission (“SEC”). Accordingly, they do not include all of the information and footnotes required by GAAP for complete financial statements. In the opinion of management, these financial statements contain all adjustments, consisting of normal recurring accruals, necessary to present fairly the financial position, results of operations and cash flows for the periods indicated. The preparation of financial statements in accordance with GAAP requires management to make estimates and assumptions that affect the amounts reported in the financial statements and accompanying notes. Operating results for the twenty-six weeks ended August 3, 2014 are not necessarily indicative of results that may be expected for any other interim period or for the year ending February 1, 2015.
The financial statements include our accounts after elimination of all significant intercompany balances and transactions. All dollar amounts are presented in thousands, unless otherwise noted, except share amounts.
Concentration of Credit Risk—Financial instruments which potentially subject us to a concentration of credit risk are cash and cash equivalents. We currently maintain our day-to-day operating cash balances with major financial institutions. At times, our operating cash balances may be in excess of the Federal Deposit Insurance Corporation (“FDIC”) insurance limit. From time to time, we invest temporary excess cash in overnight investments with expected minimal volatility, such as money market funds. Although we maintain balances that exceed the FDIC insured limit, we have not experienced any losses related to this balance, and we believe credit risk to be minimal.
Recent Accounting Pronouncements—In May 2014, the Financial Accounting Standards Board (“FASB”) issued guidance outlining a single comprehensive model for entities to use in accounting for revenue arising from contracts with customers. This guidance requires an entity to recognize revenue when it transfers promised goods or services to customers in an amount that reflects the consideration to which the entity expects to be entitled in exchange for those goods or services. Additionally, this guidance expands related disclosure requirements. This guidance is effective for reporting periods beginning after December 15, 2016. We are currently evaluating the impact this guidance will have on our consolidated financial position or results of operations.
Note 2: Accrued Liabilities
Accrued liabilities consist of the following:
| AUGUST 3, 2014 |
FEBRUARY 2, 2014 |
|||||||
| Deferred amusement revenue |
$ | 16,275 | $ | 14,047 | ||||
| Compensation and benefits |
15,706 | 14,459 | ||||||
| Amusement redemption liability |
10,026 | 9,707 | ||||||
| Rent |
9,511 | 9,040 | ||||||
| Sales and use tax |
4,166 | 4,408 | ||||||
| Deferred gift card revenue |
4,152 | 4,709 | ||||||
| Property taxes |
4,094 | 3,159 | ||||||
| Current portion of long-term insurance reserves |
3,358 | 3,358 | ||||||
| Accrued interest |
675 | 4,214 | ||||||
| Other |
9,611 | 7,278 | ||||||
|
|
|
|
|
|||||
| Total accrued liabilities |
$ | 77,574 | $ | 74,379 | ||||
|
|
|
|
|
|||||
F-33
Table of Contents
DAVE & BUSTER’S ENTERTAINMENT, INC.
NOTES TO CONSOLIDATED FINANCIAL STATEMENTS (continued)
(in thousands, except share and per share amounts)
Note 3: Long-Term Debt
Long-term debt consisted of the following:
| AUGUST 3, 2014 |
FEBRUARY 2, 2014 |
|||||||
| New Senior secured credit facility |
$ | 530,000 | — | |||||
| Repaid debt: |
||||||||
| Senior secured credit facility—term |
— | $ | 144,375 | |||||
| Senior notes |
— | 200,000 | ||||||
| Senior discount notes |
— | 180,790 | ||||||
|
|
|
|
|
|||||
| Total debt outstanding |
530,000 | 525,165 | ||||||
| Less: |
||||||||
| Unamortized debt discount—new senior secured credit facility |
(1,319 | ) | — | |||||
| Unamortized debt discount—senior secured credit facility |
— | (550 | ) | |||||
| Unamortized debt discount—senior discount notes |
— | (38,938 | ) | |||||
| Current installments |
(3,975 | ) | (1,500 | ) | ||||
|
|
|
|
|
|||||
| Long-term debt, less current installments, net of unamortized discount |
$ | 524,706 | $ | 484,177 | ||||
|
|
|
|
|
|||||
New Senior Secured Credit Facility—D&B Holdings together with Dave & Buster’s, Inc. entered into a senior secured credit facility that provides a $530,000 term loan facility with a maturity date of July 25, 2020 and a $50,000 revolving credit facility with a maturity date of July 25, 2019. The $50,000 revolving credit facility includes a $20,000 letter of credit sub-facility and a $5,000 swingline sub-facility. The revolving credit facility will be used to provide financing for general purposes.
The senior secured credit facility is secured by the assets of Dave & Buster’s, Inc. and is unconditionally guaranteed by each of its direct and indirect, existing and future domestic subsidiaries (with certain agreed-upon exceptions). The Company originally received proceeds from the term loan facility of $528,675, net of a $1,325 discount. The discount is being amortized to interest expense over the six-year life of the term loan facility. As of August 3, 2014, we had no borrowings under the revolving credit facility, borrowings of $530,000 ($528,681, net of discount) under the term facility and $6,114 in letters of credit outstanding. We believe that the carrying amount of our term loan facility approximates its fair value because the interest rates are adjusted regularly based on current market conditions. The fair value of the Company’s new senior secured credit facility was determined to be a Level Two instrument as defined by GAAP.
The interest rates per annum applicable to loans, other than swingline loans, under our new senior secured credit facility are currently set based on a defined LIBOR rate plus an applicable margin. Swingline loans bear interest at a base rate plus an applicable margin. The loans bear interest subject to a pricing grid based on a secured leveraged ratio, at LIBOR plus a spread ranging from 3.25% to 3.5% for the term loans and LIBOR plus a spread ranging from 3.0% to 3.5% for the revolving loans. The interest rate on the term loan facility at August 3, 2014 was 4.5%.
F-34
Table of Contents
DAVE & BUSTER’S ENTERTAINMENT, INC.
NOTES TO CONSOLIDATED FINANCIAL STATEMENTS (continued)
(in thousands, except share and per share amounts)
Proceeds from the new senior secured credit facility were used as follows:
| Repayment of Dave & Buster’s, Inc. senior credit facility |
||||
| Outstanding principal |
$ | 143,509 | ||
| Accrued and unpaid interest |
460 | |||
| Legal expenses |
35 | |||
|
|
|
|||
| 144,004 | ||||
|
|
|
|||
| Repayment of Dave & Buster’s, Inc. 11% senior notes |
||||
| Outstanding principal |
200,000 | |||
| Accrued and unpaid interest |
3,239 | |||
| Premium for early redemption |
11,000 | |||
| Additional interest paid to trustee |
1,833 | |||
|
|
|
|||
| 216,072 | ||||
|
|
|
|||
| Repayment of Dave & Buster’s Parent, Inc. (now known as D&B Entertainment) 12.25% senior discount notes |
||||
| Issue price outstanding, net of original issue discount |
100,000 | |||
| Previously accreted interest expense |
41,852 | |||
| Current year interest accretion included in Interest expense, net |
8,341 | |||
| Premium for early redemption |
4,646 | |||
| Additional interest paid to trustee |
1,478 | |||
|
|
|
|||
| 156,317 | ||||
|
|
|
|||
| Total payments to retire prior debt |
516,393 | |||
|
|
|
|||
| Payments of costs associated with new debt issuance |
8,128 | |||
| Administrative fee paid to administrative agent |
31 | |||
|
|
|
|||
| 8,159 | ||||
|
|
|
|||
| Retained cash |
4,123 | |||
|
|
|
|||
| Net proceeds received |
$ | 528,675 | ||
|
|
|
|||
In connection with the debt refinancing in July 2014, Dave & Buster’s, Inc. made a dividend distribution of $156,317 to us. The dividend was used to redeem our senior discount notes which were due to mature on February 15, 2016, plus pay the premium on early redemption and accreted and unpaid interest.
F-35
Table of Contents
DAVE & BUSTER’S ENTERTAINMENT, INC.
NOTES TO CONSOLIDATED FINANCIAL STATEMENTS (continued)
(in thousands, except share and per share amounts)
The loss on debt retirement is comprised of the following:
| Non-cash charges |
||||
| Write-off of unamortized debt issuance cost |
$ | 6,559 | ||
| Write-off of unamortized debt discount |
435 | |||
|
|
|
|||
| 6,994 | ||||
|
|
|
|||
| Direct costs associated with debt retirement |
||||
| Premium for early redemption: |
||||
| Dave & Buster’s, Inc. senior notes |
11,000 | |||
| D&B Entertainment senior discount notes |
4,646 | |||
| Additional interest paid to trustee: |
||||
| Dave & Buster’s, Inc. senior notes |
1,833 | |||
| D&B Entertainment senior discount notes |
1,478 | |||
| Legal expenses |
35 | |||
|
|
|
|||
| 18,992 | ||||
|
|
|
|||
| Loss on debt retirement |
$ | 25,986 | ||
|
|
|
Our senior secured credit facility contains restrictive covenants that, among other things, limit our ability and the ability of our subsidiaries to: incur additional indebtedness, make loans or advances to subsidiaries and other entities, make initial capital expenditures in relation to new stores, declare dividends, acquire other businesses or sell assets. In addition, under our senior secured credit facility, we are required to meet a maximum total leverage ratio if outstanding revolving loans and letters of credit (other than letters of credit that have been backstopped or cash collateralized) are in excess of 30% of the outstanding revolving commitments. As of August 3, 2014, we were not required to maintain any of the financial ratios under the senior secured credit facility and we were in compliance with the other restrictive covenants.
The following tables set forth our recorded interest expense, net for the periods indicated:
| TWENTY-SIX WEEKS ENDED AUGUST 3, 2014 |
TWENTY-SIX WEEKS ENDED AUGUST 4, 2013 |
|||||||
| Dave & Buster’s, Inc. debt-based interest expense |
$ | 14,173 | $ | 15,044 | ||||
| D&B Entertainment Interest accretion |
8,341 | 7,694 | ||||||
| Amortization of issuance cost and discount |
1,556 | 1,605 | ||||||
| Interest income |
(135 | ) | (140 | ) | ||||
| Less capitalized interest |
(239 | ) | (342 | ) | ||||
|
|
|
|
|
|||||
| Total interest expense, net |
$ | 23,696 | $ | 23,861 | ||||
|
|
|
|
|
|||||
F-36
Table of Contents
DAVE & BUSTER’S ENTERTAINMENT, INC.
NOTES TO CONSOLIDATED FINANCIAL STATEMENTS (continued)
(in thousands, except share and per share amounts)
Future debt obligations—The following table sets forth our future debt principal payment obligations as of August 3, 2014:
| DEBT OUTSTANDING AT AUGUST 3, 2014 |
||||
| 1 year or less |
$ | 3,975 | ||
| 2 years |
5,300 | |||
| 3 years |
5,300 | |||
| 4 years |
5,300 | |||
| 5 years |
5,300 | |||
| Thereafter |
504,825 | |||
|
|
|
|||
| Total future payments |
$ | 530,000 | ||
|
|
|
|||
Note 4: Income Taxes
The provision (benefit) for income taxes is as follows:
| TWENTY-SIX WEEKS ENDED AUGUST 3, 2014 |
TWENTY-SIX WEEKS ENDED AUGUST 4, 2013 |
|||||||
| Current Expense |
||||||||
| Federal |
$ | 982 | $ | (685 | ) | |||
| Foreign |
240 | (22 | ) | |||||
| State and local |
1,111 | 1,125 | ||||||
| Deferred expense (benefit) |
(4,620 | ) | 1,890 | |||||
|
|
|
|
|
|||||
| Total provision (benefit) for income taxes |
$ | (2,287 | ) | $ | 2,308 | |||
|
|
|
|
|
|||||
We use the asset/liability method for recording income taxes, which recognizes the amount of current and deferred taxes payable or refundable at the date of the financial statements as a result of all events that are recognized in the financial statements and as measured by the provisions of enacted tax laws. We also recognize liabilities for uncertain income tax positions for those items that meet the “more likely than not” threshold.
In assessing the realizability of deferred tax assets we consider whether it is more likely than not that some or all of the deferred tax assets will not be realized. Accordingly, as of August 3, 2014 we have established a valuation allowance of $1,392 for deferred tax assets associated with state taxes and uncertain tax positions. The ultimate realization of our deferred tax assets is dependent on the generation of future taxable income during periods in which temporary differences and tax credit carryforwards become deductible.
The calculation of tax liabilities involves significant judgment and evaluation of uncertainties in the interpretation of federal and state tax regulations. As a result, we have established accruals for taxes that may become payable in future years due to audits by tax authorities. Tax accruals are reviewed regularly pursuant to accounting guidance for uncertainty in income taxes. Tax accruals are adjusted as events occur that affect the potential liability for taxes, such as the expiration of statutes of limitations, conclusion of tax audits, identification of additional exposure based on current calculations, identification of new issues, the issuance of statutory or administrative guidance, or rendering of a court decision affecting a particular issue. Accordingly, we may experience significant changes in tax accruals in the future, if or when such events occur.
F-37
Table of Contents
DAVE & BUSTER’S ENTERTAINMENT, INC.
NOTES TO CONSOLIDATED FINANCIAL STATEMENTS (continued)
(in thousands, except share and per share amounts)
As of August 3, 2014, we have accrued approximately $451 of unrecognized tax benefits and approximately $308 of penalties and interest. Future recognition of potential interest or penalties, if any, will be recorded as a component of income tax expense. Because of the impact of deferred income tax accounting, $324 of unrecognized tax benefits, if recognized, would affect the effective tax rate.
D&B Entertainment files a consolidated tax return with all its domestic subsidiaries. As of August 3, 2014, Dave & Buster’s, Inc. owes approximately $13,727 of tax-related balances.
The Company expects to utilize approximately $6,730 of available federal tax credit carryforwards to offset our estimated consolidated cash tax liability for the 2014 fiscal year. We anticipate having approximately $3,518 of federal tax credit carryforwards at February 1, 2015, including $2,848 of general business credits and $670 of Alternative Minimum Tax (“AMT”) credit carryforwards. There is a 20-year carryforward on general business credits and AMT credits can be carried forward indefinitely.
Note 5: Commitments and Contingencies
We are subject to certain legal proceedings and claims that arise in the ordinary course of our business. In the opinion of management, based upon consultation with legal counsel, the amount of ultimate liability with respect to such legal proceedings and claims will not materially affect the consolidated results of our operations or our financial condition.
On November 14, 2013, the Dave & Buster’s, Inc. filed a complaint in federal court seeking declaratory and injunctive relief related to actions taken by a landlord attempting to terminate the lease agreement for our store in Kensington/Bethesda, Maryland. The landlord alleged that the Company was in default of certain lease agreement provisions which restrict our ability to operate other Dave & Buster’s facilities within a prescribed distance of the Kensington/Bethesda location. We believed that the lease provisions cited by the landlord were not legally enforceable and that the Company had the right to operate all facilities for the duration of the original lease term and any available lease extension periods. On July 21, 2014, the court issued its final ruling against the Company and the Kensington/Bethesda store permanently closed on August 12, 2014. As of the closing date, we believe that all of our fixed assets from the Kensington/Bethesda store are either fully depreciated or can be transferred to other locations. With past store closures, we have experienced customer migration to other stores within the same market.
We lease certain property and equipment under various non-cancelable operating leases. Some of the leases include options for renewal or extension on various terms. Most of the leases require us to pay property taxes, insurance, and maintenance of the leased assets. Certain leases also have provisions for additional percentage rentals based on revenues. Future lease obligations related to the Kensington/Bethesda, Maryland location are not included in the table below as our rent obligations terminated August 31, 2014.
F-38
Table of Contents
DAVE & BUSTER’S ENTERTAINMENT, INC.
NOTES TO CONSOLIDATED FINANCIAL STATEMENTS (continued)
(in thousands, except share and per share amounts)
The following table sets forth our lease commitments as of August 3, 2014:
| OPERATING LEASE OBLIGATIONS AT AUGUST 3, 2014 |
||||
| 1 year or less |
$ | 61,682 | ||
| 2 years |
61,045 | |||
| 3 years |
59,571 | |||
| 4 years |
57,680 | |||
| 5 years |
53,122 | |||
| Thereafter |
359,817 | |||
|
|
|
|||
| Total future payments |
$ | 652,917 | ||
|
|
|
|||
We have signed operating lease agreements for our store located in Los Angeles, California which opened for business on August 25, 2014 and future sites located in Albuquerque, New Mexico, Manchester (Hartford), Connecticut, Greenville, South Carolina, Clackamas (Portland), Oregon and Woburn (Boston), Massachusetts. The landlord has fulfilled the obligations to commit us to the lease terms and therefore, the future obligations related to these locations are included in the table above.
As of August 3, 2014, we have signed nine lease agreements which contain certain landlord obligations which remain unfulfilled as of that date. Our commitments under these agreements are contingent upon among other things, the landlord’s delivery of access to the premises for construction. Future obligations related to these agreements are not included in the table above. Subsequently, our future site located in Euless (Dallas), Texas, included in the nine signed leases noted above, has been delivered by the landlord resulting in future commitments of approximately $4,523.
Note 6: Earnings per share
Basic earnings per share (“EPS”) represents net income divided by the weighted average number of common shares outstanding during the period. Diluted EPS represents net income divided by the basic weighted average number of common shares plus, if dilutive, potential common shares outstanding during the period. Potential common shares consist of incremental common shares issuable upon the exercise of outstanding stock options. The dilutive effect of potential common shares is determined using the treasury stock method, whereby outstanding stock options are assumed exercised at the beginning of the reporting period and the exercise proceeds from such stock options, unamortized compensation cost, and excess tax benefits arising in connection with these stock-based awards are assumed to be used to repurchase our common stock at the average market price during the period.
F-39
Table of Contents
DAVE & BUSTER’S ENTERTAINMENT, INC.
NOTES TO CONSOLIDATED FINANCIAL STATEMENTS (continued)
(in thousands, except share and per share amounts)
The following tables set forth the computation of EPS, basic and diluted for the twenty-six weeks ended August 3, 2014 and August 4, 2013, respectively:
| (in thousands, except per share data) | TWENTY-SIX WEEKS ENDED AUGUST 3, 2014 |
TWENTY-SIX WEEKS ENDED AUGUST 4, 2013 |
||||||
| Numerator: |
||||||||
| Net income (loss) |
$ | (2,417 | ) | $ | 7,452 | |||
| Denominator: |
||||||||
| Basic weighted average common shares outstanding |
147,586 | 147,506 | ||||||
| Potential common shares for stock options |
3,344 | |||||||
| Diluted weighted average common shares outstanding |
147,586 | 150,850 | ||||||
| Earnings per shares: |
||||||||
| Basic |
$ | (16.38 | ) | $ | 50.52 | |||
| Diluted |
$ | (16.38 | ) | $ | 49.40 | |||
As of August 3, 2014, we had approximately 10,268 stock options awards outstanding under our stock option plan which were not included in the dilutive earnings per share calculation because the effect would have been anti-dilutive. We had approximately 9,093 stock option awards outstanding under our stock option plan which were included in the dilutive earnings per share calculation as of August 4, 2013. As of August 3, 2014 and August 4, 2013, respectively, 935 and 1,948 unvested Adjusted EBITDA performance-based stock options and 6,719 and 6,822 unvested internal rate of return (IRR) performance-based stock options granted under our stock option plan were not included in the earnings per share calculation as they did not meet the criteria for inclusion per GAAP guidance. Adjusted EBITDA vesting options vest over a prescribed time period based on D&B Entertainment meeting certain profitability targets for each fiscal year during the vesting period. Adjusted EBITDA vesting options also vest upon a D&B Entertainment change of control provided that internal rate of return (IRR) conditions stipulated by the Oak Hill Funds are met. IRR vesting options vest upon a change in control of D&B Entertainment if the Oak Hill Funds’ internal rate of return is greater than or equal to certain percentages set forth in the applicable option agreement. Any options that have not vested prior to a change of control or do not vest in connection with a change of control will be forfeited by the grantee upon a change of control for no consideration.
F-40
Table of Contents

Table of Contents
Shares
Dave & Buster’s Entertainment, Inc.
Common Stock
PRELIMINARY PROSPECTUS
Jefferies
Piper Jaffray
William Blair
Raymond James
Stifel
LOYAL3 Securities
, 2014
Until , 2014 (the 25th day after the date of this prospectus), all dealers that effect transactions in these securities, whether or not participating in this offering, may be required to deliver a prospectus. This is in addition to the dealers’ obligation to deliver a prospectus when acting as underwriters and with respect to their unsold allotments or subscriptions.
Table of Contents
PART II
Information Not Required in Prospectus
Item 13. Other expenses of issuance and distribution.
The expenses, other than underwriting commissions, expected to be incurred by Dave & Buster’s Entertainment, Inc. (the “Registrant”) in connection with the issuance and distribution of the securities being registered under this Registration Statement are estimated to be as follows:
| SEC Registration Fee |
$ | 12,880 | ||
| Financial Industry Regulatory Authority, Inc. Filing Fee |
15,500 | |||
| Listing Fee |
||||
| Printing and Engraving |
||||
| Legal Fees and Expenses |
||||
| Accounting Fees and Expenses |
||||
| Transfer Agent and Registrar Fees |
||||
| Miscellaneous |
||||
|
|
|
|||
| Total |
$ | |||
|
|
|
Item 14. Indemnification of directors and officers.
Section 145 of the Delaware General Corporation Law, or DGCL, provides that a corporation may indemnify any person who was or is a party or is threatened to be made a party to any threatened, pending or completed action, suit or proceeding whether civil, criminal, administrative or investigative (other than an action by or in the right of the corporation by reason of the fact that he is or was a director, officer, employee or agent of the corporation, or is or was serving at the request of the corporation as a director, officer, employee or agent of another corporation, partnership, joint venture, trust or other enterprise, against expenses (including attorneys’ fees)), judgments, fines and amounts paid in settlement actually and reasonably incurred by him in connection with such action, suit or proceeding if he acted in good faith and in a manner he reasonably believed to be in or not opposed to the best interests of the corporation, and, with respect to any criminal action or proceeding, had no reasonable cause to believe his conduct was unlawful. Section 145 further provides that a corporation similarly may indemnify any such person serving in any such capacity who was or is a party or is threatened to be made a party to any threatened, pending or completed action or suit by or in the right of the corporation to procure a judgment in its favor by reason of the fact that he is or was a director, officer, employee or agent of the corporation or is or was serving at the request of the corporation as a director, officer, employee or agent of another corporation, partnership, joint venture, trust or other enterprise, against expenses (including attorney’s fees) actually and reasonably incurred in connection with the defense or settlement of such action or suit if he acted in good faith and in a manner he reasonably believed to be in or not opposed to the best interests of the corporation and except that no indemnification shall be made in respect of any claim, issue or matter as to which such person shall have been adjudged to be liable to the corporation unless and only to the extent that the Delaware Court of Chancery or such other court in which such action or suit was brought shall determine upon application that, despite the adjudication of liability but in view of all of the circumstances of the case, such person is fairly and reasonably entitled to indemnity for such expenses which the Delaware Court of Chancery or such other court shall deem proper.
The Registrant’s Amended and Restated Bylaws authorize the indemnification of our officers and directors, consistent with Section 145 of the DGCL, as amended. The Registrant intends to enter into indemnification agreements with each of its directors and executive officers. These agreements, among other things, will require the Registrant to indemnify each director and executive officer to the fullest extent permitted by Delaware law, including indemnification of expenses such as attorneys’ fees, judgments, fines and settlement amounts incurred by the director or executive officer in any action or proceeding, including any action or proceeding by or in right of us, arising out of the person’s services as a director or executive officer.
Reference is made to Section 102(b)(7) of the DGCL which enables a corporation in its original certificate of incorporation or an amendment thereto to eliminate or limit the personal liability of a director for violations of the
II-1
Table of Contents
director’s fiduciary duty, except (i) for any breach of the director’s duty of loyalty to the corporation or its stockholders, (ii) for acts or omissions not in good faith or which involve intentional misconduct or a knowing violation of law, (iii) pursuant to Section 174 of the DGCL, which provides for liability of directors for unlawful payments of dividends of unlawful stock purchase or redemptions or (iv) for any transaction from which a director derived an improper personal benefit.
Reference is also made to Section 145 of the DGCL, which provides that a corporation may indemnify any person, including an officer or director, who is, or is threatened to be made, party to any threatened, pending or completed legal action, suit or proceeding, whether civil, criminal, administrative or investigative, other than an action by or in the right of such corporation, by reason of the fact that such person was an officer, director, employee or agent of such corporation or is or was serving at the request of such corporation as a director, officer, employee or agent of another corporation or enterprise. The indemnity may include expenses (including attorneys’ fees), judgments, fines and amounts paid in settlement actually and reasonably incurred by such person in connection with such action, suit or proceeding, provided such officer, director, employee or agent acted in good faith and in a manner he reasonably believed to be in, or not opposed to, the corporation’s best interest and, for criminal proceedings, had no reasonable cause to believe that his conduct was unlawful. A Delaware corporation may indemnify any officer or director in an action by or in the right of the corporation under the same conditions, except that no indemnification is permitted without judicial approval if the officer or director is adjudged to be liable to the corporation. Where an officer or director is successful on the merits or otherwise in the defense of any action referred to above, the corporation must indemnify him against the expenses that such officer or director actually and reasonably incurred.
The Registrant expects to maintain standard policies of insurance that provide coverage (i) to its directors and officers against loss rising from claims made by reason of breach of duty or other wrongful act and (ii) to the Registrant with respect to indemnification payments that it may make to such directors and officers.
The proposed form of Underwriting Agreement to be filed as Exhibit 1.1 to this Registration Statement provides for indemnification to the Registrant’s directors and officers by the underwriters against certain liabilities.
Item 15. Recent sales of unregistered securities.
On January 18, 2012, the Registrant sold approximately 833 shares of its common stock previously held as treasury stock to Michael J. Griffith, Jonathan S. Halkyard and Kevin M. Sheehan for an aggregate price of $1,000,008. Proceeds from the sale were used to repay funds that had been advanced to the Registrant by Dave & Buster’s, Inc. The per share sales price approximates the value per share as determined by an independent third party valuation prepared as of October 30, 2011.
On March 1, 2012, the Registrant granted 225 stock options at an exercise price of $1,400.00 per share to Joe Jackman, a consultant.
On March 8, 2012, the Registrant granted 427 stock options at an exercise price of $1,140.09 per share to Margo L. Manning.
On April 16, 2012, the Registrant granted 450 stock options at an exercise price of $1,140.09 per share to John B. Mulleady.
On December 5, 2012, the Registrant granted 567.92 stock options at an exercise price of $1,410.09 per share to employees Greg Clore, Peter Czizek, Joe DeProspero, Michael J. Metzinger, April Spearman, Lisa Warren, Mike Corbell, Gary Passardi, Sean McCullough, Chris Zenner and Rick Sackleh, and directors Michael J. Griffith, Jonathan S. Halkyard and Kevin M. Sheehan. Subsequent to the grant date, Messrs. Czizek and Zenner forfeited 46.24 of these stock options upon the termination of their employment.
On May 3, 2013, the Registrant granted 600 stock options at an exercise price of $1,867.00 per share to John B. Mulleady and Kevin Bachus.
On July 3, 2013, the Registrant granted 75 stock options at an exercise price of $2,233.00 per share to Joe Jackman, a consultant.
On September 23, 2013, the Registrant granted 11.89 stock options at an exercise price of $2,102.00 per share to Brian McCleary.
II-2
Table of Contents
On September 27, 2013, the Registrant granted 400 stock options at an exercise price of $2,102.00 per share to Kulsoom Klavon, Greg Clore, Joe DeProspero, Michael J. Metzinger, April Spearman, Lisa Warren and John B. Mulleady.
On January 6, 2014, William J. Robertson exercised his option for 80 shares at a strike price of $1,000. The Registrant issued new shares in satisfaction of this exercise. Proceeds from the exercise were allocated to Dave & Buster’s, Inc. in anticipation of future expenses.
The share and stock option numbers set forth above do not give effect to the for 1 stock split of the Registrant’s common stock in connection with the issuance and distribution of the securities being registered under this Registration Statement. Each of these transactions was exempt from registration pursuant to Section 4(a)(2) of the Securities Act, as it was a transaction by an issuer that did not involve a public offering of securities. The recipients of securities in each such transactions represented their intention to acquire the securities for investment only and not with a view to any distribution thereof. Appropriate legends were affixed to the share certificates and other instruments issued in such transactions. All recipients were given the opportunity to ask questions and receive answers from representatives of the Registrant concerning the business and financial affairs of the Registrant.
Item 16. Exhibits and financial statement schedules.
| EXHIBIT |
DESCRIPTION OF EXHIBITS | |
| 1.1† | Form of Underwriting Agreement | |
| 3.1† | Form of Second Amended and Restated Certificate of Incorporation of the Registrant | |
| 3.2† | Form of Second Amended and Restated Bylaws of the Registrant | |
| 4.1† | Form of Stock Certificate | |
| 4.2† | Form of Stockholders’ Agreement, among Dave & Buster’s Entertainment, Inc., Oak Hill Capital Partners III, L.P., and Oak Hill Capital Management Partners III, L.P. | |
| 4.3† | Form of Registration Rights Agreement, among Dave & Buster’s Entertainment, Inc., Oak Hill Capital Partners III, L.P., Oak Hill Capital Management Partners III, L.P. and the additional stockholders named therein | |
| 5.1† | Opinion of Weil, Gotshal & Manges LLP | |
| 10.1 | Second Amendment, dated as of May 14, 2013, to the Credit Agreement, dated as of June 1, 2010, among Dave & Buster’s Holdings, Inc., Dave & Buster’s, Inc., 6131646 Canada, Inc. and the several banks and other financial institutions or entities from time to time parties thereto (incorporated by reference to Exhibit 10.8 to the quarterly report on Form 10-Q filed by Dave & Buster’s, Inc. on June 17, 2013) | |
| 10.2 | Form of Amended and Restated Employment Agreement, dated as of May 2, 2010, by and among Dave & Buster’s Management Corporation, Dave & Buster’s, Inc., and the various executive officers of Dave & Buster’s, Inc. (incorporated by reference to Exhibit 10.2 to the Form S-4 Registration Statement filed by Dave & Buster’s, Inc. on August 11, 2010 (No. 333-168759)) | |
| 10.3 | Dave & Buster’s Parent, Inc. 2010 Management Incentive Plan (incorporated by reference to Exhibit 10.3 to the Form S-4 Registration Statement filed by Dave & Buster’s, Inc. on August 11, 2010 (No. 333-168759)) | |
| 10.4 | Amendment No. 1 to the Dave & Buster’s Parent, Inc. 2010 Management Incentive Plan (incorporated by reference to Exhibit 10.2 to the quarterly report on Form 10-Q filed by Dave & Buster’s, Inc. on June 15, 2011) | |
II-3
Table of Contents
| EXHIBIT |
DESCRIPTION OF EXHIBITS | |
| 10.5 | Amendment No. 2 to the Dave & Buster’s Parent, Inc. 2010 Management Incentive Plan (incorporated by reference to Exhibit 10.6 to the annual report on Form 10-K filed by Dave & Buster’s, Inc. on April 16, 2013) | |
| 10.6 | Expense Reimbursement Agreement, dated as of June 1, 2010, by and between Dave & Buster’s, Inc. and Oak Hill Capital Management LLC (incorporated by reference to Exhibit 10.6 to the annual report on Form 10-K filed by Dave & Buster’s, Inc. on April 12, 2012) | |
| 10.7† | Form of Dave & Buster’s Entertainment, Inc. 2014 Omnibus Incentive Plan | |
| 10.8 | Employment Agreement, dated as of February 14, 2011, by and among Dave & Buster’s Management Corporation, Dave & Buster’s, Inc. and Dolf Berle | |
| 10.9† | Form of Amended and Restated Nonqualified Stock Option Agreement, by and between Dave & Buster’s Entertainment, Inc. and each of Stephen M. King, Kevin Bachus, Dolf Berle, Joe DeProspero, Sean Gleason, Brian A. Jenkins, Margo L. Manning, Michael J. Metzinger, John B. Mulleady, J. Michael Plunkett, Jay L. Tobin, David A. Jones, Alan J. Lacy, Kevin M. Sheehan, Michael J. Griffith and Jonathan S. Halkyard | |
| 10.10† | Form of Nonqualified Stock Option Award Agreement under the Dave & Buster’s Entertainment, Inc. 2014 Omnibus Incentive Plan | |
| 10.11 | Dave & Buster’s Select Executive Retirement Plan as amended and restated by Dave & Buster’s I, L.P., effective January 1, 2005 | |
| 10.12† | Form of Indemnification Agreement for directors, executive officers and key employees | |
| 10.13 | Credit Agreement, dated as of July 25, 2014, among Dave & Buster’s Holdings, Inc., Dave & Buster’s, Inc., the other guarantors from time to time parties thereto, the lenders from time to time parties thereto and Jefferies Finance LLC, as administrative agent. | |
| 10.14 | Offer Letter, dated October 1, 2011, by and between Dave & Buster’s, Inc. and Kevin Bachus | |
| 11.1 | Statement regarding computation of per share earnings (incorporated by reference to Notes to the Financial Statements included in Part I of this Registration Statement) | |
| 21.1 | List of subsidiaries of the Registrant | |
| 23.1 | Consent of KPMG LLP, Independent Registered Public Accounting Firm | |
| 23.2† | Consent of Weil, Gotshal & Manges LLP (included in the opinion filed as Exhibit 5.1 hereto) | |
| 24.1 | Power of Attorney of Stephen M. King (included on signature page) | |
| 24.2 | Power of Attorney of Brian A. Jenkins (included on signature page) | |
| 24.3 | Power of Attorney of Tyler J. Wolfram (included on signature page) | |
| 24.4 | Power of Attorney of J. Taylor Crandall (included on signature page) | |
| 24.5 | Power of Attorney of Michael J. Griffith (included on signature page) | |
| 24.6 | Power of Attorney of Jonathan S. Halkyard (included on signature page) | |
| 24.7 | Power of Attorney of David A. Jones (included on signature page) | |
| 24.8 | Power of Attorney of Alan J. Lacy (included on signature page) | |
| 24.9 | Power of Attorney of Kevin M. Mailender (included on signature page) | |
| 24.10 | Power of Attorney of Kevin M. Sheehan (included on signature page) | |
| † | To be filed by amendment. |
No financial statement schedules are provided because the information called for is not applicable or is shown in the financial statements or notes thereto.
II-4
Table of Contents
Item 17. Undertakings.
The undersigned registrant hereby undertakes to provide to the underwriters at the closing specified in the underwriting agreements, certificates in such denominations and registered in such names as required by the underwriters to permit prompt delivery to each purchaser.
Insofar as indemnification for liabilities arising under the Securities Act of 1933 may be permitted to directors, officers and controlling persons of the registrant pursuant to the provisions referenced in Item 14 of this registration statement, or otherwise, the registrant has been advised that in the opinion of the Securities and Exchange Commission such indemnification is against public policy as expressed in the Securities Act and is, therefore, unenforceable. In the event that a claim for indemnification against such liabilities (other than the payment by the registrant of expenses incurred or paid by a director, officer, or controlling person of the registrant in the successful defense of any action, suit or proceeding) is asserted by such director, officer or controlling person in connection with the securities being registered hereunder, the registrant will, unless in the opinion of its counsel the matter has been settled by controlling precedent, submit to a court of appropriate jurisdiction the question of whether such indemnification by it is against public policy as expressed in the Securities Act and will be governed by the final adjudication of such issue.
For the purpose of determining liability of the registrant under the Securities Act of 1933 to any purchaser in the initial distribution of the securities: The undersigned registrant undertakes that in a primary offering of securities of the undersigned registrant pursuant to this registration statement, regardless of the underwriting method used to sell the securities to the purchaser, if the securities are offered or sold to such purchaser by means of any of the following communications, the undersigned registrant will be a seller to the purchaser and will be considered to offer or sell such securities to such purchaser:
i. Any preliminary prospectus or prospectus of the undersigned registrant relating to the offering required to be filed pursuant to Rule 424;
ii. Any free writing prospectus relating to the offering prepared by or on behalf of the undersigned registrant or used or referred to by the undersigned registrant;
iii. The portion of any other free writing prospectus relating to the offering containing material information about the undersigned registrant or its securities provided by or on behalf of the undersigned registrant; and
iv. Any other communication that is an offer in the offering made by the undersigned registrant to the purchaser.
The undersigned registrant hereby undertakes that:
(1) For purposes of determining any liability under the Securities Act of 1933, the information omitted from the form of prospectus filed as part of this registration statement in reliance upon Rule 430A and contained in a form of prospectus filed by the registrant pursuant to Rule 424(b)(1) or (4) or 497(h) under the Securities Act shall be deemed to be part of this registration statement as of the time it was declared effective.
(2) For the purpose of determining any liability under the Securities Act of 1933, each post-effective amendment that contains a form of prospectus shall be deemed to be a new registration statement relating to the securities offered therein, and the offering of such securities at that time shall be deemed to be the initial bona fide offering thereof.
(3) For the purpose of determining liability under the Securities Act to any purchaser, if the registrant is subject to Rule 430C, each prospectus filed pursuant to Rule 424(b) as part of a registration statement relating to an offering, other than registration statements relying on Rule 430B or other than prospectuses filed in reliance on Rule 430A, shall be deemed to be part of and included in the registration statement as of the date it is first used after effectiveness. Provided, however, that no statement made in a registration statement or prospectus that is part of the registration statement or made in a document incorporated or deemed incorporated by reference into the registration statement or prospectus that is part of the registration statement will, as to a purchaser with a time of contract of sale prior to such first use, supersede or modify any statement that was made in the registration statement or prospectus that was part of the registration statement or made in any such document immediately prior to such date of first use.
II-5
Table of Contents
SIGNATURES
Pursuant to the requirements of the Securities Act of 1933, as amended, the registrant has duly caused this registration statement to be signed on its behalf by the undersigned, thereunto duly authorized, in the City of Dallas, State of Texas, on the 8th day of September, 2014.
| DAVE & BUSTER’S ENTERTAINMENT, INC. | ||
| By: | /s/ Stephen M. King | |
| Name: Stephen M. King | ||
| Title: Chief Executive Officer | ||
POWER OF ATTORNEY
KNOW ALL MEN BY THESE PRESENTS, that each of the undersigned constitutes and appoints each of Stephen M. King and Jay L. Tobin, or either of them, each acting alone, his/her true and lawful attorney-in-fact and agent, with full power of substitution and resubstitution, for such person and in his/her name, place and stead, in any and all capacities, to sign this Registration Statement on Form S-1 (including all pre-effective and post-effective amendments and registration statements filed pursuant to Rule 462 under the Securities Act of 1933), and to file the same, with all exhibits thereto, and other documents in connection therewith, with the Securities and Exchange Commission, granting unto said attorneys-in-fact and agents, each acting alone, full power and authority to do and perform each and every act and thing requisite and necessary to be done in and about the premises, as fully to all intents and purposes as he/she might or could do in person, hereby ratifying and confirming that any such attorney-in-fact and agent, or his/her substitute or substitutes, may lawfully do or cause to be done by virtue hereof.
Pursuant to the requirements of the Securities Act of 1933, as amended, this registration statement has been signed below by the following persons in the capacities indicated on the 8th of September, 2014.
| SIGNATURE |
TITLE | |
| /s/ Stephen M. King |
Chief Executive Officer and Director | |
| Stephen M. King |
(Principal Executive Officer) | |
| /s/ Brian A. Jenkins |
Senior Vice President and | |
| Brian A. Jenkins |
Chief Financial Officer | |
| (Principal Financial and Accounting Officer) | ||
| /s/ Tyler J. Wolfram |
Director | |
| Tyler J. Wolfram |
||
| /s/ J. Taylor Crandall |
Director | |
| J. Taylor Crandall |
||
| /s/ Michael J. Griffith |
Director | |
| Michael J. Griffith |
||
| /s/ Jonathan S. Halkyard |
Director | |
| Jonathan S. Halkyard |
||
| /s/ David A. Jones |
Director | |
| David A. Jones |
||
| /s/ Alan J. Lacy |
Director | |
| Alan J. Lacy |
||
| /s/ Kevin M. Mailender |
Director | |
| Kevin M. Mailender |
||
| /s/ Kevin M. Sheehan |
Director | |
| Kevin M. Sheehan |
||
Table of Contents
| EXHIBIT |
DESCRIPTION OF EXHIBITS | |
| 1.1† | Form of Underwriting Agreement | |
| 3.1† | Form of Second Amended and Restated Certificate of Incorporation of the Registrant | |
| 3.2† | Form of Second Amended and Restated Bylaws of the Registrant | |
| 4.1† | Form of Stock Certificate | |
| 4.2† | Form of Stockholders’ Agreement, among Dave & Buster’s Entertainment, Inc., Oak Hill Capital Partners III, L.P., and Oak Hill Capital Management Partners III, L.P. | |
| 4.3† | Form of Registration Rights Agreement, among Dave & Buster’s Entertainment, Inc., Oak Hill Capital Partners III, L.P., Oak Hill Capital Management Partners III, L.P. and the additional stockholders named therein | |
| 5.1† | Opinion of Weil, Gotshal & Manges LLP | |
| 10.1 | Second Amendment, dated as of May 14, 2013, to the Credit Agreement, dated as of June 1, 2010, among Dave & Buster’s Holdings, Inc., Dave & Buster’s, Inc., 6131646 Canada, Inc. and the several banks and other financial institutions or entities from time to time parties thereto (incorporated by reference to Exhibit 10.8 to the quarterly report on Form 10-Q filed by Dave & Buster’s, Inc. on June 17, 2013) | |
| 10.2 | Form of Amended and Restated Employment Agreement, dated as of May 2, 2010, by and among Dave & Buster’s Management Corporation, Dave & Buster’s, Inc., and the various executive officers of Dave & Buster’s, Inc. (incorporated by reference to Exhibit 10.2 to the Form S-4 Registration Statement filed by Dave & Buster’s, Inc. on August 11, 2010 (No. 333-168759)) | |
| 10.3 | Dave & Buster’s Parent, Inc. 2010 Management Incentive Plan (incorporated by reference to Exhibit 10.3 to the Form S-4 Registration Statement filed by Dave & Buster’s, Inc. on August 11, 2010 (No. 333-168759)) | |
| 10.4 | Amendment No. 1 to the Dave & Buster’s Parent, Inc. 2010 Management Incentive Plan (incorporated by reference to Exhibit 10.2 to the quarterly report on Form 10-Q filed by Dave & Buster’s, Inc. on June 15, 2011) | |
| 10.5 | Amendment No. 2 to the Dave & Buster’s Parent, Inc. 2010 Management Incentive Plan (incorporated by reference to Exhibit 10.6 to the annual report on Form 10-K filed by Dave & Buster’s, Inc. on April 16, 2013) | |
| 10.6 | Expense Reimbursement Agreement, dated as of June 1, 2010, by and between Dave & Buster’s, Inc. and Oak Hill Capital Management LLC (incorporated by reference to Exhibit 10.6 to the annual report on Form 10-K filed by Dave & Buster’s, Inc. on April 12, 2012) | |
| 10.7† | Form of Dave & Buster’s Entertainment, Inc. 2014 Omnibus Incentive Plan | |
| 10.8 | Employment Agreement, dated as of February 14, 2011, by and among Dave & Buster’s Management Corporation, Dave & Buster’s, Inc. and Dolf Berle | |
| 10.9† | Form of Amended and Restated Nonqualified Stock Option Agreement, by and between Dave & Buster’s Entertainment, Inc. and each of Stephen M. King, Kevin Bachus, Dolf Berle, Joe DeProspero, Sean Gleason, Brian A. Jenkins, Margo L. Manning, Michael J. Metzinger, John B. Mulleady, J. Michael Plunkett, Jay L. Tobin, David A. Jones, Alan J. Lacy, Kevin M. Sheehan, Michael J. Griffith and Jonathan S. Halkyard | |
| 10.10† | Form of Nonqualified Stock Option Award Agreement under the Dave & Buster’s Entertainment, Inc. 2014 Omnibus Incentive Plan | |
| 10.11 | Dave & Buster’s Select Executive Retirement Plan as amended and restated by Dave & Buster’s I, L.P., effective January 1, 2005 | |
| 10.12† | Form of Indemnification Agreement for directors, executive officers and key employees | |
Table of Contents
| EXHIBIT |
DESCRIPTION OF EXHIBITS | |
| 10.13 | Credit Agreement, dated as of July 25, 2014, among Dave & Buster’s Holdings, Inc., Dave & Buster’s, Inc., the other guarantors from time to time parties thereto, the lenders from time to time parties thereto and Jefferies Finance LLC, as administrative agent. | |
| 10.14 | Offer Letter, dated October 1, 2011, by and between Dave & Buster’s, Inc. and Kevin Bachus | |
| 11.1 | Statement regarding computation of per share earnings (incorporated by reference to Notes to the Financial Statements included in Part I of this Registration Statement) | |
| 21.1 | List of subsidiaries of the Registrant | |
| 23.1 | Consent of KPMG LLP, Independent Registered Public Accounting Firm | |
| 23.2† | Consent of Weil, Gotshal & Manges LLP (included in the opinion filed as Exhibit 5.1 hereto) | |
| 24.1 | Power of Attorney of Stephen M. King (included on signature page) | |
| 24.2 | Power of Attorney of Brian A. Jenkins (included on signature page) | |
| 24.3 | Power of Attorney of Tyler J. Wolfram (included on signature page) | |
| 24.4 | Power of Attorney of J. Taylor Crandall (included on signature page) | |
| 24.5 | Power of Attorney of Michael J. Griffith (included on signature page) | |
| 24.6 | Power of Attorney of Jonathan S. Halkyard (included on signature page) | |
| 24.7 | Power of Attorney of David A. Jones (included on signature page) | |
| 24.8 | Power of Attorney of Alan J. Lacy (included on signature page) | |
| 24.9 | Power of Attorney of Kevin M. Mailender (included on signature page) | |
| 24.10 | Power of Attorney of Kevin M. Sheehan (included on signature page) | |
| † | To be filed by amendment. |