Attached files
| file | filename |
|---|---|
| EX-31.2 - EX-31.2 - Investcorp Credit Management BDC, Inc. | d780162dex312.htm |
| EX-32.1 - EX-32.1 - Investcorp Credit Management BDC, Inc. | d780162dex321.htm |
| EX-31.1 - EX-31.1 - Investcorp Credit Management BDC, Inc. | d780162dex311.htm |
| EX-32.2 - EX-32.2 - Investcorp Credit Management BDC, Inc. | d780162dex322.htm |
Table of Contents
UNITED STATES
SECURITIES AND EXCHANGE COMMISSION
WASHINGTON, D.C. 20549
FORM 10-K
| x | ANNUAL REPORT PURSUANT TO SECTION 13 OR 15(d) OF THE SECURITIES EXCHANGE ACT OF 1934 |
For the fiscal year ended June 30, 2014
OR
| ¨ | TRANSITION REPORT PURSUANT TO SECTION 13 OR 15(d) OF THE SECURITIES EXCHANGE ACT OF 1934 |
COMMISSION FILE NUMBER: 1-36300
CM FINANCE INC
(Exact name of registrant as specified in its charter)
| Maryland | 46-2883380 | |
| (State of Incorporation) | (I.R.S. Employer Identification Number) | |
| 601 Lexington Avenue 26th Floor |
10022 | |
| (Address of principal executive offices) | (Zip Code) | |
Registrant’s telephone number, including area code: (212) 257-5199
Securities registered pursuant to Section 12(b) of the Act:
| Title of Each Class |
Name of Each Exchange on Which Registered | |
| Common Stock, par value $0.001 per share | The NASDAQ Global Select Market |
Securities registered pursuant to Section 12(g) of the Act:
None
Indicate by check mark if the registrant is a well-known seasoned issuer, as defined in Rule 405 of the Securities Act. Yes ¨ No x.
Indicate by check mark if the registrant is not required to file reports pursuant to Section 13 or Section 15(d) of the Act. Yes ¨ No x.
Indicate by check mark whether the Registrant (1) has filed all reports required to be filed by Section 13 or 15(d) of the Securities Exchange Act of 1934 during the preceding 12 months (or for such shorter period that the Registrant was required to file such reports), and (2) has been subject to such filing requirements for the past 90 days. Yes x No ¨.
Indicate by check mark whether the registrant has submitted electronically and posted on its corporate Web site, if any, every Interactive Data File required to be submitted and posted pursuant to Rule 405 of Regulation S-T (§232.405 of this chapter) during the preceding 12 months (or for such shorter period that the registrant was required to submit and post such files). Yes ¨ No ¨
Indicate by check mark if disclosure of delinquent filers pursuant to Item 405 of Regulation S-K is not contained herein, and will not be contained, to the best of Registrant’s knowledge, in definitive proxy or information statements incorporated by reference in Part III of this Form 10-K or any amendment to this Form 10-K. ¨
Indicate by check mark whether the registrant is a large accelerated filer, an accelerated filer, a non-accelerated filer, or a smaller reporting company. See definition of “accelerated filer,” “large accelerated filer” and “smaller reporting company” in Rule 12b-2 of the Exchange Act. (Check one):
| Large accelerated filer | ¨ | Accelerated filer | ¨ | |||
| Non-accelerated filer | x (Do not check if a smaller reporting Company) | Smaller reporting company | ¨ |
Indicate by check mark whether the registrant is a shell company (as defined in Rule 12b-2 of the Act). Yes ¨ No x.
The aggregate market value of the Registrant’s common stock held by non-affiliates of the Registrant as of December 31, 2013 was: Not applicable because trading of the Registrant’s common stock on the NASDAQ Global Select Market did not commence until February 6, 2014.
There were 13,666,666 shares of the Registrant’s common stock outstanding as of September 5, 2014.
Documents Incorporated by Reference
Portions of the registrant’s definitive Proxy Statement relating to the registrant’s 2014 Annual Meeting of Stockholders, to be filed with the Securities and Exchange Commission within 120 days following the end of the Company’s fiscal year, are incorporated by reference in Part III of this Annual Report on Form 10-K as indicated herein.
Table of Contents
FORM 10-K FOR THE FISCAL YEAR
ENDED JUNE 30, 2014
TABLE OF CONTENTS
| Page | ||||||
| 1 | ||||||
| ITEM 1. |
1 | |||||
| ITEM 1A. |
29 | |||||
| ITEM 1B. |
56 | |||||
| ITEM 2. |
56 | |||||
| ITEM 3. |
56 | |||||
| ITEM 4. |
56 | |||||
| 57 | ||||||
| ITEM 5. |
57 | |||||
| ITEM 6. |
60 | |||||
| ITEM 7. |
MANAGEMENT’S DISCUSSION AND ANALYSIS OF FINANCIAL CONDITION AND RESULTS OF OPERATIONS |
60 | ||||
| ITEM 7A. |
74 | |||||
| ITEM 8. |
75 | |||||
| ITEM 9. |
109 | |||||
| ITEM 9A. |
109 | |||||
| ITEM 9B. |
109 | |||||
| 110 | ||||||
| ITEM 10. |
110 | |||||
| ITEM 11. |
110 | |||||
| ITEM 12. |
SECURITY OWNERSHIP OF CERTAIN BENEFICIAL OWNERS AND MANAGEMENT AND RELATED STOCKHOLDER MATTERS |
110 | ||||
| ITEM 13. |
CERTAIN RELATIONSHIPS AND RELATED TRANSACTIONS, AND DIRECTOR INDEPENDENCE |
110 | ||||
| ITEM 14. |
110 | |||||
| 111 | ||||||
| ITEM 15. |
111 | |||||
| 114 | ||||||
Table of Contents
| Item 1. | Business |
Except as otherwise indicated, the terms “we,” “us,” “our” and “CM Finance” refer to CM Finance Inc and “CM Investment Partners” and the “Adviser” refer to our investment adviser and administrator, CM Investment Partners LLC.
We were formed in February 2012 and commenced operations in March 2012 as CM Finance LLC, a Maryland limited liability company. Immediately prior to the pricing of our initial public offering, CM Finance LLC was merged with and into CM Finance Inc, a Maryland corporation (the “CM Finance Merger”). We are an externally managed, non-diversified closed-end management investment company that has elected to be regulated as a business development company (“BDC”) under the Investment Company Act of 1940, as amended (the “1940 Act”).
We are a specialty finance company that invests primarily in the debt of U.S. middle-market companies, which we generally define as those companies that have an enterprise value, which represents the aggregate of debt value and equity value of the entity, of less than $750 million. We are externally managed by CM Investment Partners. The Adviser is led by Michael C. Mauer and Christopher E. Jansen, who together have over 40 years of experience in the leveraged debt markets. Our investment objective is to maximize total return to stockholders in the form of current income and capital appreciation through debt and related equity investments by targeting investment opportunities with favorable risk-adjusted returns.
We seek to invest primarily in middle-market companies that have annual revenues of at least $50 million and EBITDA of at least $20 million. We focus on companies with leading market positions, significant asset or franchise values, strong free cash flow and experienced senior management teams, with emphasis on companies with high-quality sponsors. Our investments typically range in size from $5 million to $25 million. We expect that our portfolio companies will use our capital for organic growth, acquisitions, market or product expansion, refinancings, and/or recapitalizations. We invest, and intend to continue to invest, in unitranche loans and standalone second and first lien loans, with an emphasis on floating rate debt. Unitranche loans are loans structured as first lien loans with certain characteristics of mezzanine loan risk in one security. We also selectively invest in mezzanine loans/structured equity and in the equity of portfolio companies through warrants and other instruments, in most cases taking such upside participation interests as part of a broader investment relationship.
We strive to maintain a strong focus on credit quality, investment discipline and investment selectivity. We believe that investing in the debt of private middle-market companies generally provides a more attractive relative value proposition than investing in broadly syndicated debt due to the conservative capital structures and superior default and loss characteristics typically associated with middle-market companies. We believe that, because private middle-market companies have limited access to capital providers, debt investments in these companies typically carry above-market interest rates and include more favorable protections, resulting in attractive risk-adjusted returns across credit cycles while better preserving capital. The companies in which we invest typically are highly leveraged, and, in most cases, our investments in such companies are not rated by national rating agencies. If such investments were rated, we believe that they would likely receive a rating below investment grade (i.e., below BBB or Baa), which are often referred to as “junk.”
Immediately after the CM Finance Merger and prior to our election to be regulated as a BDC and the pricing of our initial public offering, Stifel Venture Corp. (“Stifel”), a wholly owned subsidiary of Stifel Financial Corp., made a capital contribution of $32.7 million in us, which we used to repurchase $32.7 million of the interests of certain funds (the “Cyrus Funds”) managed by Cyrus Capital Partners, L.P. (“Cyrus Capital”) in us at a per share price of $15.00, equal to our initial public offering price per share.
1
Table of Contents
We have, through CM Finance SPV Ltd. (“CM SPV”), our wholly owned subsidiary, a financing facility (the “Financing Facility”) with UBS AG, London Branch (together with its affiliates, “UBS”). The Financing Facility includes a $76.5 million term securitized financing facility (the “Term Financing”), which expires on May 22, 2016, and a $50.0 million revolving financing (the “Revolving Financing”), which expires on December 4, 2015. The Financing Facility is collateralized by a portion of the debt investments in our portfolio (the “Assets”). We pay interest on the face amount of the Term Financing monthly at a rate of one-month LIBOR plus 2.85% per annum. The Revolving Financing bears interest at a rate of (a) 2.10% per annum from December 4, 2013 through December 4, 2014 and (b) 1.60% per annum from December 5, 2014 through the term of the Revolving Financing. With respect to undrawn amounts, we will pay interest monthly on the daily average of amounts that are not drawn on the Revolving Financing at a rate of 0.50%.
As of June 30, 2014, our portfolio consisted of debt and equity investments in 24 portfolio companies with a fair value of $273.7 million. As of June 30, 2014, our portfolio consisted of 40.9% first lien investments, 48.8% second lien investments, 9.5% were senior secured notes, and 0.8% were warrant positions, and the debt investments had a weighted average annualized yield of approximately 10.44%. The weighted average yield was computed using the effective interest rates for all of our debt investments at fair value, plus the yield to maturity from June 30, 2014 of all of our debt investments, including our unfunded obligations as if our unfunded obligations were fully funded and is weighted based on each respective investment’s par amount. See “Management’s Discussion and Analysis of Financial Condition and Results of Operations”
The industry composition of our portfolio at fair value at June 30, 2014 was as follows:
| Percentage of Total Portfolio |
||||
| Telecommunications |
19.35 | % | ||
| Healthcare-Products/Services |
17.83 | |||
| Oil and Gas |
16.39 | |||
| Trucking and Leasing |
5.47 | |||
| Entertainment and Leisure |
5.40 | |||
| Industrial |
5.40 | |||
| Retail |
5.17 | |||
| Automobiles and Components |
4.73 | |||
| Airlines |
4.55 | |||
| Pipelines |
3.65 | |||
| Services |
3.14 | |||
| Oilfield Services |
3.13 | |||
| Diversified Financial Services |
2.18 | |||
| Construction & Building |
1.81 | |||
| Commercial Services |
1.80 | |||
|
|
|
|||
| Total |
100.00 | % | ||
|
|
|
|||
The Adviser
Upon our election to be regulated as a BDC, CM Investment Partners became our external investment adviser. Prior to our election to be regulated as a BDC, CM Investment Partners, LP served as our investment adviser. The Adviser is responsible for sourcing investment opportunities, conducting industry research, performing diligence on potential investments, structuring our investments and monitoring our portfolio companies on an ongoing basis. The Adviser is led by Mr. Mauer, our Chief Executive Officer, and Co-Chief Investment Officer of the Adviser, and Mr. Jansen, our President and Secretary, and the Co-Chief Investment Officer of the Adviser. Mr. Mauer was formerly Global Co-Head of Leveraged Finance and Global Co-Head of Fixed Income Currency and Commodity Distribution at Citigroup Inc. and a senior member of its credit
2
Table of Contents
committee responsible for all underwriting and principal commitments of leveraged finance capital worldwide. Mr. Jansen was a founding Managing Partner and Senior Portfolio Manager for Stanfield Capital Partners and had a leading role in planning its strategic direction. At Stanfield, Mr. Jansen was responsible for the management of 15 different portfolios aggregating in excess of $7 billion in assets consisting of large corporate loans, middle-market loans, second lien loans, high yield bonds and structured finance securities.
Messrs. Mauer and Jansen hold a 42% interest in the Adviser and Stifel holds a 20% interest in the Adviser. The Cyrus Funds also hold, in the aggregate, a 38% indirect economic interest, but no voting interest, in the Adviser.
The Adviser’s investment team is led by Messrs. Mauer and Jansen, who are supported by 16 additional investment professionals, which, together with Messrs. Mauer and Jansen, we refer to as the “Investment Team.” The members of the Investment Team have over 200 combined years of structuring customized debt solutions for middle-market companies, which we believe will enable us to generate favorable returns across credit cycles with an emphasis on preserving capital. The members of the Investment Team have extensive networks for sourcing investment opportunities through direct corporate relationships and relationships with private equity firms, investment banks, restructuring advisors, law firms, boutique advisory firms and distressed/specialty lenders. The members of the Investment Team also have extensive experience across various industries, including aviation, cable, defense, healthcare, media, mining, oil and gas, power, retail, telecommunications, trucking and asset-backed special situations. In addition, Mr. Jansen has extensive experience restructuring specific debt investments as a portfolio manager, including while at Stanfield Capital Partners, and Mr. Mauer has considerable managerial experience, including having led a restructuring and asset-based lending group at Citigroup Inc. Messrs. Mauer and Jansen have developed an investment process for reviewing lending opportunities, structuring transactions and monitoring investments throughout multiple credit cycles. As a result, we believe we will be able to achieve appropriate risk-adjusted returns by investing in companies that have restructured but do not have sufficient track records to receive traditional lending terms from a commercial bank or the broadly syndicated leveraged finance market. We believe the members of the Investment Team share a common investment philosophy built on a framework of rigorous business assessment, extensive due diligence and disciplined risk valuation methodology.
Upon the completion of the CM Finance Merger, we entered into the Investment Advisory Agreement with CM Investment Partners LLC, as our investment adviser. Under the Investment Advisory Agreement, we pay the Adviser a management fee equal to 1.75% of our gross assets, payable in arrears on a quarterly basis. In addition, pursuant to the Investment Advisory Agreement, we pay the Adviser an Incentive Fee equal to 20.0% of pre-incentive fee net investment income, subject to an annualized hurdle rate of 8.0% with a “catch up” fee for returns between the 8.0% hurdle and 10.0% as well as 20.0% of net capital gains. From the period commencing upon the consummation of our initial public offering to December 31, 2014, the Adviser has agreed to waive its fees (base management and incentive fee), without recourse against or reimbursement by us, to the extent required in order for us to earn a quarterly net investment income to support a minimum dividend payment on shares of common stock outstanding on the relevant dividend payment dates of 9.0% (to be paid on a quarterly basis). For the periods January 1, 2015 to December 31, 2015 and January 1, 2016 to December 31, 2016, the Adviser has agreed to waive its incentive fees, without recourse against or reimbursement by us, to the extent required in order for the Company to earn a quarterly net investment income to support minimum dividend payments on shares of common stock outstanding on the relevant dividend payment dates of 9.25% and 9.375%, respectively (to be paid on a quarterly basis).
Under an administration agreement with the Adviser (the “Administration Agreement”), through the Services Agreement, the Adviser provides us with accounting and back-office professionals, equipment and clerical, bookkeeping, recordkeeping and other administrative services at such facilities to assist the Adviser in fulfilling certain of its obligations to us under the Administration Agreement. The accounting and back-office professionals provided to us under the Services Agreement are Cyrus Capital employees who perform their duties on behalf of the Adviser pursuant to the Services Agreement.
3
Table of Contents
Market Opportunity
We believe that the current investment environment presents a compelling case for investing in secured debt (including unitranche debt and standalone second and first lien loans) and unsecured debt (including mezzanine/structured equity) of middle-market companies. The following factors represent the key drivers of our focus on this attractive market segment:
| • | Reduced Availability of Capital for Middle-Market Companies. We believe there are fewer providers of financing and less capital available for middle-market companies compared to prior to the recent economic downturn. We believe that, as a result of that downturn: |
| • | many financing providers have chosen to focus on large, liquid corporate loans and syndicated capital markets transactions rather than lending to middle-market businesses; |
| • | recent regulatory changes, including adoption of the Dodd–Frank Wall Street Reform and Consumer Protection Act of 2010, or the Dodd-Frank Act, and the introduction of new international capital and liquidity requirements under the 2012 Basel III Accords, or Basel III, have caused banks to curtail lending to middle-market companies; |
| • | hedge funds and collateralized loan obligation managers are less likely to pursue investment opportunities in our target market as a result of reduced availability of funding for new investments; and |
| • | consolidation of regional banks into money center banks has reduced their focus on middle-market lending. |
As a result, we believe that less competition facilitates higher quality deal flow and allows for greater selectivity throughout the investment process.
| • | Robust Demand for Debt Capital. According to Pitchbook, a market research firm, Private Equity firms had approximately $486 billion of uncalled capital as of December 31, 2013 and raised approximately $85 billion in additional funds during the first six months of 2014. They have expanded their focus to include middle market opportunities due to the lack of opportunities in large capital buyout transactions. We expect the large amount of uninvested capital and the expanded focus on middle market opportunities to drive buyout activity over the next several years, which should, in turn, continue to create lending opportunities for us. |
| • | Attractive Deal Pricing and Structures. We believe that, in general, middle-market debt investments are priced more attractively to lenders than larger, more liquid, public debt financings, due to the more limited universe of lenders as well as the highly negotiated nature of these financings. Middle-market transactions tend to offer stronger covenant packages, higher interest rates, lower leverage levels and better call protection compared to larger financings. In addition, middle-market loans typically offer other investor protections such as default penalties, lien protection, change of control provisions and information rights for lenders. |
| • | Specialized Lending Requirements. We believe that several factors render many U.S. financial institutions ill-suited to lend to U.S. middle-market companies. For example, based on the Investment Team’s experience, lending to private U.S. middle-market companies is generally more labor-intensive than lending to larger companies due to the smaller size of each investment and the fragmented nature of information for such companies. Lending to smaller capitalization companies requires due diligence and underwriting practices consistent with the demands and economic limitations of the middle-market and may also require more extensive ongoing monitoring by the lender. As a result, middle-market companies historically have been served by a limited segment of the lending community. |
4
Table of Contents
Competitive Strengths
We believe that the Adviser’s disciplined approach to origination, portfolio construction and risk management should allow us to achieve favorable risk-adjusted returns while preserving our capital. We believe that the following competitive strengths provide positive returns for our investors:
| • | Large and Experienced Team with Substantial Resources. The Adviser and its Investment Team is led by Michael C. Mauer and Christopher E. Jansen, who each has over 20 years of experience investing in, providing corporate finance services to, restructuring and consulting with middle-market companies. Messrs. Mauer and Jansen are supported by 16 additional investment professionals, who together have over 200 combined years of structuring strategic capital for business expansion, refinancings, capital restructuring, post-reorganization financing and servicing the general corporate needs of middle-market companies. We believe that the Investment Team and its resources provide a significant advantage and contribute to the strength of our business and enhance the quantity and quality of investment opportunities available to us. |
| • | Capitalize on the Investment Team’s Extensive Relationships with Middle-Market Companies, Private Equity Sponsors and Intermediaries. The members of the Investment Team have extensive networks for sourcing investment opportunities through corporate relationships and relationships with private equity firms, investment banks, restructuring advisors, law firms, boutique advisory firms and distressed/specialty lenders. We believe that the strength of these relationships in conjunction with the Investment Team’s ability to structure financing solutions for companies that incorporate credit protections at attractive returns for us provide us with a competitive advantage in identifying investment opportunities in our target market. In addition, pursuant to the Stifel arrangement and subject to certain restrictions, Stifel uses its commercially reasonable efforts to present to us to review and bid on, Stifel Nicolaus & Company, Incorporated-originated leveraged finance and high yield corporate debt opportunities consistent with our investment strategy. |
| • | Disciplined Underwriting Policies and Rigorous Portfolio Management. Messrs. Mauer and Jansen have an established credit analysis and investment process to analyze investment opportunities thoroughly. This process, followed by the Investment Team, includes structuring loans with appropriate covenants and pricing loans based on our knowledge of the middle market and our rigorous underwriting standards. We focus on capital preservation by extending loans to portfolio companies with assets that we believe will retain sufficient value to repay us even in depressed markets or under liquidation scenarios. Each investment is analyzed from its initial stages by either Mr. Mauer or Mr. Jansen, the Adviser’s Co-Chief Investment Officers, and a senior investment professional of the Investment Team. Every initial investment requires the unanimous approval of the Adviser’s investment committee, consisting of Messrs. Mauer, Jansen and Stephan Kuppenheimer, who is Stifel’s appointee to our board of directors, pursuant to the Stifel arrangement. Every follow-on investment decision in an existing portfolio company and any investment dispositions require approval by at least Messrs. Mauer and Jansen. Under the supervision of Messrs. Mauer and Jansen, the Investment Team’s senior investment professionals also monitor the portfolio for developments on a daily basis, perform credit updates on each investment, review financial performance on at least a quarterly basis, and have regular discussions with the management of portfolio companies. We believe the Adviser’s investment and monitoring process and the depth and experience of the Investment Team gives us a competitive advantage in identifying investments and evaluating risks and opportunities throughout the life cycle of an investment. |
| • | Ability to Structure Investments Creatively. Our Investment Team has the expertise and ability to structure investments across all levels of a company’s capital structure. These individuals have extensive experience in cash flow, asset-based lending, workout situations and investing in distressed debt, which should enable us to take advantage of attractive investments in recently restructured companies. Furthermore, with the capital raised in our initial public offering, we believe we are in a better position to leverage the existing knowledge and relationships that the Investment Team has |
5
Table of Contents
| developed to lead investments that meet our investment criteria. We believe that current market conditions allow us to structure attractively priced debt investments and may allow us to incorporate other return-enhancing mechanisms such as commitment fees, original issue discounts, early redemption premiums, payment-in-kind, or PIK, interest and certain forms of equity securities. |
Investment Strategy
We invest in unitranche loans, standalone second and first lien loans, and selectively in mezzanine loans/structured equity and in the equity of portfolio companies through warrants and other instruments, in most cases taking such upside participation interest as part of an overall relationship. We seek to invest primarily in middle-market companies that have annual revenues of at least $50 million and EBITDA of at least $20 million. Our investments typically range in size from $5 million to $25 million. We may invest in smaller or larger companies if there is an attractive opportunity, especially when there are dislocations in the capital markets, including the high yield and large syndicated loan markets. During such dislocations, we expect to see more deep value investment opportunities offering prospective returns that are disproportionate to the associated risk profile. We focus on companies with leading market positions, significant asset or franchise values, strong free cash flow and experienced senior management teams, with an emphasis on companies with high-quality sponsors. Our investment objective is to generate both current income and capital appreciation by targeting investment opportunities with favorable risk-adjusted returns.
The Adviser pursues debt investments that offer high cash yields, cash origination fees, and lower leverage levels. The Adviser seeks to structure our debt investments with strong protections, including default penalties, information rights, and affirmative and negative financial covenants, such as lien protection and restrictions concerning change of control. We believe these protections, coupled with the other features of our investments, allow us to reduce our risk of capital loss and achieve attractive risk-adjusted returns, although there can be no assurance that we are always able to structure our investments to minimize risk of loss and achieve attractive risk-adjusted returns.
Investment Criteria
The principals of the Adviser use the following investment criteria and guidelines to evaluate prospective portfolio companies. However, not all of these criteria and guidelines are used or met in connection with each of our investments.
| • | Established companies with a history of positive operating cash flow. We seek to invest in established companies with sound historical financial performance. We typically focus on companies with a history of profitability on an operating cash flow basis. We do not intend to invest in start-up companies or companies with speculative business plans. |
| • | Defensible and sustainable business. We seek to invest in companies with proven products and/or services that provide a competitive advantage versus its competitors or new entrants. The Adviser places an emphasis on the strength of historical operations and profitability and the generation of free cash flow to reinvest in the business or to utilize for debt service. The Adviser also focuses on the relative strength of the valuation and liquidity of collateral used to provide security for our investments, when applicable. |
| • | Seasoned management team with meaningful equity ownership. The Adviser generally requires that our portfolio companies have a seasoned management team, with strong corporate governance. The Adviser also seeks to invest in companies with management teams that have meaningful equity ownership. The Adviser believes that companies that have proper incentives in place, including having significant equity interests, motivate management teams to enhance enterprise value, which will act in accordance with our interests. |
6
Table of Contents
| • | Significant Invested Capital. The Adviser believes that the existence of significant underlying equity value provides important support to our debt investments. The Adviser seeks investments in portfolio companies where it believes that the aggregate enterprise value significantly exceeds aggregate indebtedness, after consideration of our investment. |
| • | Investment Partnerships. We seek to invest where private equity sponsors have demonstrated capabilities in building enterprise value. In addition, we seek to partner with specialty lenders and other financial institutions. The Adviser believes that private equity sponsors and specialty lenders can serve as committed partners and advisors that will actively work with the Adviser, the company and its management team to meet company goals and create value. |
| • | Ability to exert meaningful influence. We target investment opportunities in which we will be a significant investor in the tranche and in which we can add value through active participation in the direction of the company, sometimes through advisory positions. |
| • | Exit strategy. We generally seek to invest in companies that the Adviser believes possess attributes that will provide us with the ability to exit our investments. We typically expect to exit our investments through one of three scenarios: (i) the sale of the company resulting in repayment of all outstanding debt, (ii) the recapitalization of the company through which our loan is replaced with debt or equity from a third party or parties or (iii) the repayment of the initial or remaining principal amount of our loan then outstanding at maturity. In some investments, there may be scheduled amortization of some portion of our loan, which would result in a partial exit of our investment prior to the maturity of the loan. |
Deal Origination
The Adviser’s deal-originating efforts are focused on its direct corporate relationships and relationships with private equity firms, investment banks, restructuring advisers, law firms, boutique advisory firms and distressed/specialty lenders. The Adviser’s investment team continues to enhance and expand these relationships. In addition, pursuant to the Stifel arrangement and subject to certain restrictions, Stifel uses its commercially reasonable efforts to present to us to review and bid on Stifel Nicolaus & Company, Incorporated-originated leveraged finance and high yield corporate debt opportunities consistent with our investment strategy, subject to the approval of our board of directors as necessary, under the 1940 Act and certain other limitations.
The origination process is designed to thoroughly evaluate potential financings and to identify the most attractive of these opportunities on the basis of risk-adjusted returns. Each investment is analyzed from its initial stages through our investment by one of the Co-Chief Investment Officers of the Adviser and a senior investment professional. If an opportunity fits our criteria for investment and merits further review and consideration, the investment is presented to the investment committee. This first stage of analysis involves a preliminary, but detailed, description of the potential financing. An investment summary is then generated after preliminary due diligence. The opportunity may be discussed several times by members of the Investment Team. Prior to funding, every initial investment requires the unanimous approval of the Adviser’s investment committee consisting of the Adviser’s Co-Chief Investment Officers and one member appointed by Stifel, currently Stephan Kuppenheimer, who is also a member of our board of directors. Follow-on investment decisions in existing portfolio companies and investment dispositions require the approval of a majority of the Adviser’s investment committee.
If the Adviser decides to pursue an opportunity, a preliminary term sheet will be produced for the target portfolio company. This term sheet serves as a basis for the discussion and negotiation of the critical terms of the proposed financing. At this stage, the Adviser begins its formal underwriting and investment approval process as described below. After the negotiation of a transaction, the financing is presented to the investment committee of the Adviser for approval. Upon approval of a financing transaction, the parties will prepare the relevant loan documentation. An investment is funded only after all due diligence is satisfactorily completed and all closing conditions have been satisfied. Each of the investments in our portfolio is monitored on a daily basis by a
7
Table of Contents
member of our investment committee aided by the senior investment professionals of the Investment Team, who also perform credit updates on each investment quarterly.
Underwriting
Underwriting Process and Investment Approval
The Adviser makes investment decisions only after considering a number of factors regarding the potential investment including, but not limited to:
| • | historical and projected financial performance; |
| • | company and industry specific characteristics, such as strengths, weaknesses, opportunities and threats; |
| • | composition and experience of the management team; and |
| • | track record of the private equity sponsor leading the transaction, if applicable. |
This methodology is employed to screen a high volume of potential investment opportunities on a consistent basis.
If an investment is deemed appropriate to pursue, a more detailed and rigorous evaluation is made after considering relevant investment parameters. The following outlines the general parameters and areas of evaluation and due diligence for investment decisions, although not all are necessarily considered or given equal weighting in the evaluation process.
Business model and financial assessment
The Adviser undertakes a review and analysis of the financial and strategic plans for the potential investment. There is significant evaluation of and reliance upon the due diligence performed by the private equity sponsor, if applicable, and third party experts, including accountants and consultants. Areas of evaluation include:
| • | historical and projected financial performance; |
| • | quality of earnings, including source and predictability of cash flows; |
| • | customer and vendor interviews and assessments; |
| • | potential exit scenarios, including probability of a liquidity event; |
| • | internal controls and accounting systems; and |
| • | assets, liabilities and contingent liabilities. |
Industry dynamics
The Adviser evaluates the portfolio company’s industry, and may, if considered appropriate, consult or retain industry experts. The following factors are among those the Adviser analyzes:
| • | sensitivity to economic cycles; |
| • | competitive environment, including number of competitors, threat of new entrants or substitutes; |
| • | fragmentation and relative market share of industry leaders; |
| • | growth potential; and |
| • | regulatory and legal environment. |
8
Table of Contents
Management assessment
The Adviser makes an in-depth assessment of the management team, including evaluation along several key metrics:
| • | background checks; |
| • | the number of years in their current positions; |
| • | track record; |
| • | industry experience; |
| • | management incentive, including the level of direct investment in the enterprise; and |
| • | completeness of the management team (positions that need to be filled or added). |
Sponsor Assessment
Among critical due diligence investigations is the evaluation of a private equity sponsor or specialty lender that has, or is also making, an investment in the portfolio company. A private equity sponsor is typically a controlling stockholder upon completion of an investment and as such is considered critical to the success of the investment. In addition, a management team with meaningful equity ownership can serve as a committed partner to us and any private equity sponsor or specialty lender. The Adviser evaluates a private equity sponsor or specialty lender along several key criteria, including:
| • | investment track record; |
| • | industry experience; |
| • | capacity and willingness to provide additional financial support to the company through additional capital contributions, if necessary; and |
| • | reference checks. |
Investments
The following describes the types of loans we generally make:
Unitranche loans. Unitranche loans are loans structured as first lien loans with certain characteristics of mezzanine loan risk in one security, such as risk relating to the fact that the loans may be unsecured and will typically rank junior to secured lenders. Unitranche loans typically provide for moderate loan amortization in the initial years of the loan with the majority of the principal repayment deferred until loan maturity. Unitranche loans provide us with greater control over a portfolio company’s capital structure, as they provide a one-stop financing solution and limit “frictional costs” (e.g., negotiations with, and concessions to, other lien holders) in the event of a workout process. Consistent with our focus on capital preservation, unitranche loans typically have less volatile returns than standalone second lien or mezzanine loans.
Standalone second lien loans. Standalone second lien loans are loans that are typically senior on a lien basis to other liabilities in the issuer’s capital structure and have the benefit of a security interest over the assets of the borrower, although ranking junior to first lien loans. Standalone second lien loans may provide for moderate loan amortization in the early years of the loan, with the majority of the amortization deferred until loan maturity. Standalone second lien loans can incur greater “frictional costs” (e.g., increased professional costs relating to resolving conflicts among the lenders) in the event of a workout and, partly because of this possible impact on recovery rates, we expect to demand a significantly higher risk premium in the form of higher spreads, call protection and/or warrants for extending standalone second lien loans, compared to first lien loans of similar credit quality.
9
Table of Contents
Standalone first lien loans. Standalone first lien loans are loans that are typically senior on a lien basis to other liabilities in the issuer’s capital structure and have the benefit of a security interest on the assets of the portfolio company. Standalone first lien loans may provide for moderate loan amortization in the early years of the loan, with the majority of the amortization deferred until loan maturity.
Mezzanine loans/structured equity. Mezzanine loans are subordinated to senior secured loans on a payment basis, are typically unsecured and rank pari passu with other unsecured creditors of the issuer. As with standalone second lien loans, we expect to demand a significantly higher risk premium in the form of higher spreads, call protection and/or warrants for mezzanine loans, given the lower recovery rates for such securities due in part to the greater “frictional costs” (e.g., increased professional costs relating to resolving conflicts among the lenders) in a protracted workout. We may take mezzanine type risk in the form of “structured equity” investments. In cases where portfolio companies may be constrained in their ability to raise additional capital in the form of debt, we may have the opportunity to structure preferred equity or other equity-like instruments. These equity instruments typically have redemption rights and will either be convertible into common equity at our option, or will have detachable warrants compensating us for the additional risk inherent in such investments. In most cases, these equity instruments will have debt-like characteristics, which provide more downside protection than a typical equity instrument.
Equity components. In connection with some of our debt investments, we will also invest in preferred or common stock or receive nominally priced warrants or options to buy an equity interest in the portfolio company. As a result, as a portfolio company appreciates in value, we may achieve additional investment return from this equity interest. The Adviser may structure such equity investments and warrants to include provisions protecting our rights as a minority-interest holder, as well as a “put,” or right to sell such securities back to the issuer, upon the occurrence of specified events. In many cases, we may also seek to obtain registration rights in connection with these equity interests, which may include demand and “piggyback” registration rights.
Portfolio Management Strategy
Each of the investments in our portfolio is monitored on a daily basis by a member of our investment committee aided by the senior investment professionals of the Investment Team, who also perform credit updates on each investment quarterly.
Risk Ratings
In addition to various risk management and monitoring tools, we use the Adviser’s investment rating system to characterize and monitor the credit profile and expected level of returns on each investment in our portfolio. This investment rating system uses a five-level numeric rating scale. The following is a description of the conditions associated with each investment rating:
| Investment Rating 1 | Investments that are performing above expectations, and whose risks remain favorable compared to the expected risk at the time of the original investment. | |
| Investment Rating 2 | Investments that are performing within expectations and whose risks remain neutral compared to the expected risk at the time of the original investment. All new loans are initially rated 2. | |
| Investment Rating 3 | Investments that are performing below expectations and that require closer monitoring, but where no loss of return or principal is expected. Portfolio companies with a rating of 3 may be out of compliance with their financial covenants. | |
| Investment Rating 4 | Investments that are performing substantially below expectations and whose risks have increased substantially since the original investment. These investments are often in workout. Investments with a rating of 4 are those for which some loss of return but no loss of principal is expected. | |
10
Table of Contents
| Investment Rating 5 | Investments that are performing substantially below expectations and whose risks have increased substantially since the original investment. These investments are almost always in workout. Investments with a rating of 5 are those for which some loss of return and principal is expected. | |
If the Adviser determines that an investment is underperforming, or circumstances suggest that the risk associated with a particular investment has significantly increased, the Adviser will increase its monitoring intensity and will prepare regular updates for the investment committee, summarizing current operating results and material impending events and suggesting recommended actions. While the investment rating system identifies the relative risk for each investment, the rating alone does not dictate the scope and/or frequency of any monitoring that will be performed. The frequency of the Adviser’s monitoring of an investment is determined by a number of factors, including, but not limited to, the trends in the financial performance of the portfolio company, the investment structure and the type of collateral securing the investment.
The following table shows the investment rankings of the debt investments in our portfolio:
| As of June 30, 2014 | As of June 30, 2013 | |||||||||||||||||||||||
| Investment Rating |
Fair Value | % of Portfolio | Number of Investments |
Fair Value | % of Portfolio | Number of Investments |
||||||||||||||||||
| 1 |
$ | 4,925,000 | 1.8 | % | 1 | $ | 24,551,299 | 20.7 | % | 2 | ||||||||||||||
| 2 |
255,227,578 | 94.0 | 22 | 94,102,014 | 79.3 | 9 | ||||||||||||||||||
| 3 |
11,496,010 | 4.2 | 1 | — | — | — | ||||||||||||||||||
| 4 |
— | — | — | — | — | — | ||||||||||||||||||
| 5 |
— | — | — | — | — | — | ||||||||||||||||||
|
|
|
|
|
|
|
|
|
|
|
|
|
|||||||||||||
| Total |
$ | 271,648,588 | 100.0 | % | 24 | $ | 118,653,313 | 100 | % | 11 | ||||||||||||||
|
|
|
|
|
|
|
|
|
|
|
|
|
|||||||||||||
Realization of Investments
The potential exit scenarios of a portfolio company will play an important role in evaluating investment decisions. The Adviser will formulate specific exit strategies at the time of such investment. Our debt orientation will provide for increased potential exit opportunities, including the sale of investments in the private markets, the refinancing of investments held, often due to maturity or recapitalizations, and other liquidity events including the sale or merger of the portfolio company. Since we seek to maintain a debt orientation in our investments, we generally expect to receive interest income over the course of the investment period, receiving a significant return on invested capital well in advance of final exit.
Managerial Assistance
As a BDC, we offer, and must provide upon request, managerial assistance to our portfolio companies. This assistance could involve monitoring the operations of our portfolio companies, participating in board and management meetings, consulting with and advising officers of portfolio companies and providing other organizational and financial guidance. The Adviser will provide such managerial assistance on our behalf to portfolio companies that request this assistance. We may receive fees for these services and will reimburse the Adviser for its allocated costs in providing such assistance, subject to the review by our board of directors, including our independent directors.
SBIC License
We intend to apply for a license to form a small business investment company subsidiary, or SBIC subsidiary. The application is subject to approval by the United States Small Business Administration, or the SBA, and we can make no assurances that the SBA will approve our application. The SBIC subsidiary would be
11
Table of Contents
allowed to issue SBA-guaranteed debentures up to a maximum of $150 million under current SBIC regulations, subject to required capitalization of the SBIC subsidiary and other requirements. SBA-guaranteed debentures generally have longer maturities and lower interest rates than other forms of debt that may be available to us. Neither we nor the Adviser has ever operated an SBIC. See “Risk Factors—Risks Relating to Our Business and Structure—If we receive qualification from the SBA to be licensed as an SBIC but we are unable to comply with SBA regulations after the SBIC subsidiary is licensed as an SBIC, our business plan and investment objective could be adversely affected.”
Competition
Our primary competitors in providing financing to middle-market companies include public and private funds, other BDCs, commercial and investment banks, commercial finance companies and, to the extent they provide an alternative form of financing, private equity funds and hedge funds. Many of our competitors are substantially larger and have considerably greater financial, technical and marketing resources than we do. For example, we believe some competitors may have access to funding sources that are not available to us. In addition, some of our competitors may have higher risk tolerances or different risk assessments, which could allow them to consider a wider variety of investments and establish more relationships than us. Furthermore, many of our competitors are not subject to the regulatory restrictions that the 1940 Act imposes on us as a BDC or to the distribution and other requirements we must satisfy to maintain our qualification as a RIC.
We use the expertise of the investment professionals of the Adviser (including those provided to the Adviser under the Services Agreement) to assess investment risks and determine appropriate pricing for our investments in portfolio companies. In addition, we the relationships of these investment professionals will enable us to learn about, and compete effectively for, financing opportunities with attractive middle-market companies in the industries in which we seek to invest.
Employees
We do not have any direct employees, and our day-to-day investment operations are managed by the Adviser. We have a Chief Executive Officer, President, Chief Financial Officer and Chief Compliance Officer. To the extent necessary, our board of directors may hire additional personnel in the future. Our Officers, except for our Chief Compliance Officer, are employees of the Adviser and our allocable portion of the cost of our Chief Financial Officer and Chief Compliance Officer, and their respective staffs, is paid by us pursuant to the Administration Agreement with the Adviser. Edward J. Cook also serves as our chief compliance officer and is a Director of Alaric Compliance Services, LLC. Mr. Cook performs his functions as our chief compliance officer under the terms of an agreement between the Adviser and Alaric Compliance Services, LLC. The Adviser has retained Mr. Cook and Alaric Compliance Services, LLC pursuant to its obligations under our Administration Agreement.
Management Agreements
The Adviser was formed in July 2013 and is registered as an investment adviser under the Advisers Act.
Investment Advisory Agreement
Subject to the overall supervision of our board of directors and in accordance with the 1940 Act, the Adviser manages our day-to-day operations and provides investment advisory services to us. Under the terms of the Investment Advisory Agreement, the Adviser:
| • | determines the composition of our portfolio, the nature and timing of the changes to our portfolio and the manner of implementing such changes; |
| • | identifies, evaluate and negotiate the structure of the investments we make; |
12
Table of Contents
| • | executes, closes, services and monitors the investments we make; |
| • | determines the securities and other assets that we purchase, retain or sell; |
| • | performs due diligence on prospective portfolio companies; and |
| • | provides us with such other investment advisory, research and related services as we may, from time to time, reasonably require for the investment of our funds. |
Pursuant to the Investment Advisory Agreement, we have agreed to pay the Adviser a fee for investment advisory and management services consisting of two components—a base management fee and an incentive fee. The cost of both the base management fee and the incentive fee will ultimately be borne by our stockholders.
For the period commencing upon the consummation of our initial public offering to December 31, 2014, the Adviser has agreed to waive its fees (base management and incentive fee), without recourse against or reimbursement by us, to the extent required in order for the Company to earn a quarterly net investment income to support a minimum dividend payment on shares of common stock outstanding on the relevant dividend payment dates of 9.0% (to be paid on a quarterly basis). For the periods January 1, 2015 to December 31, 2015 and January 1, 2016 to December 31, 2016, the Adviser has agreed to waive its incentive fees, without recourse against or reimbursement by us, to the extent required in order for the Company to earn a quarterly net investment income to support minimum dividend payments on shares of common stock outstanding on the relevant dividend payment dates of 9.25% and 9.375%, respectively (to be paid on a quarterly basis). The annual dividend yield will be based on our initial public offering price per share. Net investment income is defined as GAAP net income before net realized and unrealized gains (losses).
Management Fee
The base management fee is calculated at an annual rate of 1.75% of our gross assets, including assets purchased with borrowed funds or other forms of leverage and excluding cash and cash equivalents. For services rendered under the Investment Advisory Agreement, the base management fee is payable quarterly in arrears. The base management fee is calculated based on the average value of our gross assets, excluding cash and cash equivalents, at the end of the two most recently completed calendar quarters. Base management fees for any partial month or quarter will be appropriately pro-rated.
Incentive Fee
We pay the Adviser an incentive fee. Incentive fees are calculated as below and payable quarterly in arrears (or, upon termination of the Investment Advisory Agreement, as of the termination date). The incentive fee, which provides the Adviser with a share of the income that it generates for us, has two components, ordinary income and capital gains, calculated as follows:
The ordinary income component is calculated and payable quarterly in arrears based on our pre-incentive fee net investment income for the immediately preceding calendar quarter, subject to a total return requirement and deferral of non-cash amounts, and is 20.0% of the amount, if any, by which our pre-incentive fee net investment income, expressed as a rate of return on the value of our net assets attributable to our common stock, for the immediately preceding calendar quarter, exceeds a 2.0% (which is 8.0% annualized) hurdle rate and a “catch-up” provision measured as of the end of each calendar quarter. Under this provision, in any calendar quarter, the Adviser receives no incentive fee until our pre-incentive fee net investment income equals the hurdle rate of 2.0%, but then receives, as a “catch-up,” 100% of our pre-incentive fee net investment income with respect to that portion of such pre-incentive fee net investment income, if any, that exceeds the hurdle rate but is less than 2.5% (which is 10.0% annualized). The effect of the “catch-up” provision is that, subject to the total return and deferral provisions discussed below, if pre-incentive fee net investment income exceeds 2.5% in any calendar quarter, the Adviser receives 20.0% of our pre-incentive fee net investment income as if a hurdle rate
13
Table of Contents
did not apply. For this purpose, pre-incentive fee net investment income means interest income, dividend income and any other income (including any other fees, such as commitment, origination, structuring, diligence, managerial assistance and consulting fees or other fees that we receive from portfolio companies) accrued during the calendar quarter, minus our operating expenses for the quarter (including the base management fee, expenses payable under the Administration Agreement and any interest expense and any distributions paid on any issued and outstanding preferred stock, but excluding the incentive fee). Pre-incentive fee net investment income includes, in the case of investments with a deferred interest feature (such as OID, debt instruments with PIK interest and zero coupon securities), accrued income that we have not yet received in cash. The foregoing incentive fee is subject to a total return requirement, which provides that no incentive fee in respect of the Company’s pre-incentive fee net investment income will be payable except to the extent 20.0% of the cumulative net increase in net assets resulting from operations over the then current and 11 preceding quarters exceeds the cumulative incentive fees accrued and/or paid for the 11 preceding quarters. In other words, any ordinary income incentive fee that is payable in a calendar quarter will be limited to the lesser of (i) 20.0% of the amount by which our pre-incentive fee net investment income for such calendar quarter exceeds the 2.0% hurdle, subject to the “catch-up” provision, and (ii) (x) 20.0% of the cumulative net increase in net assets resulting from operations for the then current and 11 preceding calendar quarters minus (y) the cumulative incentive fees accrued and/or paid for the 11 preceding calendar quarters. For the foregoing purpose, the “cumulative net increase in net assets resulting from operations” is the amount, if positive, of the sum of pre-incentive fee net investment income, realized gains and losses and unrealized appreciation and depreciation of the Company for the then current and 11 preceding calendar quarters. In addition, the portion of such incentive fee that is attributable to deferred interest (such as PIK interest or OID) will be paid to the Adviser only if and to the extent we actually receive such interest in cash, and any accrual thereof will be reversed if and to the extent such interest is reversed in connection with any write-off or similar treatment of the investment giving rise to any deferred interest accrual. Any reversal of such accounts would reduce net income for the quarter by the net amount of the reversal (after taking into account the reversal of incentive fees payable) and would result in a reduction and possible elimination of the incentive fees for such quarter. There is no accumulation of amounts on the hurdle rate from quarter to quarter, and accordingly there is no clawback of amounts previously paid if subsequent quarters are below the quarterly hurdle, and there is no delay of payment if prior quarters are below the quarterly hurdle.
Pre-incentive fee net investment income does not include any realized capital gains, realized capital losses or unrealized capital appreciation or depreciation. Because of the structure of the incentive fee, it is possible that we may pay an incentive fee in a quarter where we incur a loss, subject to the total return requirement and deferral of non-cash amounts. For example, if we receive pre-incentive fee net investment income in excess of the quarterly minimum hurdle rate, we will pay the applicable incentive fee even if we have incurred a loss in that quarter due to realized and unrealized capital losses. Our net investment income used to calculate this component of the incentive fee is also included in the amount of our gross assets used to calculate the 1.75% base management fee. These calculations will be appropriately prorated for any period of less than three months and adjusted for any share issuances or repurchases during the current quarter.
14
Table of Contents
The following is a graphic representation of the calculation of the income-related portion of the incentive fee:
Quarterly Incentive Fee Based on Net Investment Income
Pre-incentive Fee Net Investment Income
(expressed as a percentage of the value of net assets)
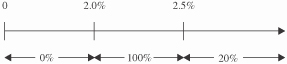
Percentage of Pre-incentive Fee Net Investment Income
Allocated to Income-Related Portion of Incentive Fee
The capital gains component of the incentive fee is determined and payable in arrears as of the end of each calendar year (or upon termination of the Investment Advisory Agreement, as of the termination date), commencing on December 31, 2014, and is equal to 20.0% of our cumulative aggregate realized capital gains from inception through the end of that calendar year, computed net of our aggregate cumulative realized capital losses and our aggregate cumulative unrealized capital depreciation through the end of such year, less the aggregate amount of any previously paid capital gains incentive fees, provided that the incentive fee determined as of December 31, 2014 will be calculated for a period of shorter than twelve calendar months to take into account any realized capital gains computed net of all realized capital losses and unrealized capital depreciation for the period ending December 31, 2014. If such amount is negative, then no capital gains incentive fee will be payable for such year. Additionally, if the Investment Advisory Agreement is terminated as of a date that is not a calendar year end, the termination date will be treated as though it were a calendar year end for purposes of calculating and paying the capital gains incentive fee.
Examples of Quarterly Incentive Fee Calculation
Example 1: Income Related Portion of Incentive Fee before Total Return Requirement Calculation:
Alternative 1
Assumptions
Investment income (including interest, dividends, fees, etc.) = 1.25%
Hurdle rate (1) = 2.0%
Management fee (2) = 0.4375%
Other expenses (legal, accounting, custodian, transfer agent, etc.) (3) = 0.2%
Pre-incentive fee net investment income
(investment income – (management fee + other expenses) = 0.6125%
15
Table of Contents
Pre-incentive fee net investment income does not exceed hurdle rate, therefore there is no income-related incentive fee.
Alternative 2
Assumptions
Investment income (including interest, dividends, fees, etc.) = 2.9%
Hurdle rate (1) = 2.0%
Management fee (2) = 0.4375%
Other expenses (legal, accounting, custodian, transfer agent, etc.) (3) = 0.2%
Pre-incentive fee net investment income
(investment income – (management fee + other expenses) = 2.2625%
Incentive fee = 100% × Pre-incentive fee net investment income (subject to “catch-up”) (4)
= 100% × (2.2625% – 2.0%)
= 0.2625%
Pre-incentive fee net investment income exceeds the hurdle rate, but does not fully satisfy the “catch-up” provision, therefore the income related portion of the incentive fee is 0.2625%.
Alternative 3
Assumptions
Investment income (including interest, dividends, fees, etc.) = 3.5%
Hurdle rate (1) = 2.0%
Management fee (2) = 0.4375%
Other expenses (legal, accounting, custodian, transfer agent, etc.) (3) = 0.2%
Pre-incentive fee net investment income
(investment income – (management fee + other expenses) = 2.8625%
| Incentive fee = | 100% × Pre-incentive fee net investment income | |
| (subject to “catch-up”) (4) | ||
| Incentive fee = | 100% × “catch-up” + (20.0% × (Pre-Incentive Fee Net Investment Income – 2.5%)) | |
| “Catch-up” = 2.5% – 2.0% | ||
| = 0.5% | ||
| Incentive fee = | (100% × 0.5%) + (20.0% × (2.8625% – 2.5%)) | |
| = 0.5% + (20.0% × 0.3625%) | ||
| = 0.5% + 0.725% | ||
| = 0.5725% | ||
Pre-incentive fee net investment income exceeds the hurdle rate, and fully satisfies the “catch-up” provision, therefore the income related portion of the incentive fee is 0.5725%.
| (1) | Represents 8.0% annualized hurdle rate. |
| (2) | Represents 1.75% annualized base management fee. |
| (3) | Excludes organizational and offering expenses. |
| (4) | The “catch-up” provision is intended to provide the Adviser with an incentive fee of 20.0% on all pre-incentive fee net investment income as if a hurdle rate did not apply when our net investment income exceeds 2.5% in any fiscal quarter. |
16
Table of Contents
Example 2: Income Portion of Incentive Fee with Total Return Requirement Calculation:
Alternative 1:
Assumptions
Investment income (including interest, dividends, fees, etc.) = 3.5%
Hurdle rate (1) = 2.0%
Management fee (2) = 0.4375%
Other expenses (legal, accounting, custodian, transfer agent, etc.) (3) = 0.2%
Pre-incentive fee net investment income
(investment income – (management fee + other expenses) = 2.8625%
Cumulative incentive compensation accrued and/or paid for preceding 11 calendar quarters = $9,000,000
20.0% of cumulative net increase in net assets resulting from operations over current and preceding 11 calendar quarters = $8,000,000
Although our pre-incentive fee net investment income exceeds the hurdle rate of 2.0% (as shown in Alternative 3 of Example 1 above), no incentive fee is payable because 20.0% of the cumulative net increase in net assets resulting from operations over the then current and 11 preceding calendar quarters did not exceed the cumulative income and capital gains incentive fees accrued and/or paid for the preceding 11 calendar quarters.
Alternative 2:
Assumptions
Investment income (including interest, dividends, fees, etc.) = 3.5%
Hurdle rate (1) = 2.0%
Management fee (2) = 0.4375%
Other expenses (legal, accounting, custodian, transfer agent, etc.) (3) = 0.2%
Pre-incentive fee net investment income
(investment income – (management fee + other expenses) = 2.8625%
Cumulative incentive compensation accrued and/or paid for preceding 11 calendar quarters = $9,000,000
20.0% of cumulative net increase in net assets resulting from operations over current and preceding 11 calendar quarters = $10,000,000
Because our pre-incentive fee net investment income exceeds the hurdle rate of 2.0% and because 20.0% of the cumulative net increase in net assets resulting from operations over the then current and 11 preceding calendar quarters exceeds the cumulative income and capital gains incentive fees accrued and/or paid for the preceding 11 calendar quarters, an incentive fee would be payable, as shown in Alternative 3 of Example 1 above.
| (1) | Represents 8.0% annualized hurdle rate. |
| (2) | Represents 1.75% annualized base management fee. |
| (3) | Excludes organizational and offering expenses. |
| (4) | The “catch-up” provision is intended to provide the Adviser with an incentive fee of 20.0% on all pre-incentive fee net investment income as if a hurdle rate did not apply when our net investment income exceeds 2.5% in any fiscal quarter. |
17
Table of Contents
Example 3: Capital Gains Portion of Incentive Fee(*):
Alternative 1:
Assumptions
Year 1: $2.0 million investment made in Company A (“Investment A”), and $3.0 million investment made in Company B (“Investment B”)
Year 2: Investment A sold for $5.0 million and fair market value (“FMV”) of Investment B determined to be $3.5 million
Year 3: FMV of Investment B determined to be $2.0 million
Year 4: Investment B sold for $3.25 million
The capital gains portion of the incentive fee would be:
Year 1: None
Year 2: Capital gains incentive fee of $0.6 million—($3.0 million realized capital gains on sale of Investment A multiplied by 20.0%)
Year 3: None—$0.4 million (20.0% multiplied by ($3.0 million cumulative capital gains less $1.0 million cumulative capital depreciation)) less $0.6 million (previous capital gains fee paid in Year 2)
Year 4: Capital gains incentive fee of $50,000—$0.65 million ($3.25 million cumulative realized capital gains multiplied by 20%) less $0.6 million (capital gains incentive fee taken in Year 2)
Alternative 2
Assumptions
Year 1: $2.0 million investment made in Company A (“Investment A”), $5.25 million investment made in Company B (“Investment B”) and $4.5 million investment made in Company C (“Investment C”)
Year 2: Investment A sold for $4.5 million, FMV of Investment B determined to be $4.75 million and FMV of Investment C determined to be $4.5 million
Year 3: FMV of Investment B determined to be $5.0 million and Investment C sold for $5.5 million
Year 4: FMV of Investment B determined to be $6.0 million
Year 5: Investment B sold for $4.0 million
18
Table of Contents
The capital gains incentive fee, if any, would be:
Year 1: None
Year 2: $0.4 million capital gains incentive fee—20.0% multiplied by $2.0 million ($2.5 million realized capital gains on Investment A less $0.5 million unrealized capital depreciation on Investment B)
Year 3: $0.25 million capital gains incentive fee (1)—$0.65 million (20.0% multiplied by $3.25 million ($3.5 million cumulative realized capital gains less $0.25 million unrealized capital depreciation)) less $0.4 million capital gains incentive fee received in Year 2
Year 4: $0.05 million capital gains incentive fee—$0.7 million ($3.50 million cumulative realized capital gains multiplied by 20.0%) less $0.65 million cumulative capital gains incentive fee paid in Year 2 and Year 3
Year 5: None—$0.45 million (20.0% multiplied by $2.25 million (cumulative realized capital gains of $3.5 million less realized capital losses of $1.25 million)) less $0.7 million cumulative capital gains incentive fee paid in Year 2, Year 3 and Year 4 (2)
| * | The hypothetical amounts of returns shown are based on a percentage of our total net assets and assume no leverage. There is no guarantee that positive returns will be realized and actual returns may vary from those shown in this example. |
| (1) | As illustrated in Year 3 of Alternative 1 above, if a portfolio company were to be wound up on a date other than its fiscal year end of any year, it may have paid aggregate capital gains incentive fees that are more than the amount of such fees that would be payable if such portfolio company had been wound up on its fiscal year end of such year. |
| (2) | As noted above, it is possible that the cumulative aggregate capital gains fee received by the Adviser ($0.70 million) is effectively greater than $0.45 million (20% of cumulative aggregate realized capital gains less net realized capital losses or net unrealized depreciation ($2.25 million)). |
Payment of Our Expenses
The base management fee and incentive compensation remunerates the Adviser for work in identifying, evaluating, negotiating, closing and monitoring our investments. We bear all other out-of-pocket costs and expenses of our operations and transactions, including, without limitation, those relating to:
| • | organization and offerings; |
| • | calculating our net asset value (including the cost and expenses of any independent valuation firm); |
| • | fees and expenses payable to third parties, including agents, consultants or other advisors, in monitoring financial and legal affairs for us and in monitoring our investments and performing due diligence on our prospective portfolio companies or otherwise relating to, or associated with, evaluating and making investments; |
| • | interest payable on debt, if any, incurred to finance our investments and expenses related to unsuccessful portfolio acquisition efforts; |
| • | offerings of our common stock and other securities; |
| • | administration fees and expenses, if any, payable under the Administration Agreement (including our allocable portion of the Adviser’s overhead in performing its obligations under the Administration Agreement, including rent and the allocable portion of the cost of our chief compliance officer, chief financial officer and their respective staffs); |
| • | transfer agent, dividend agent and custodial fees and expenses; |
| • | costs associated with our reporting and compliance obligations under the 1940 Act, as amended, and other applicable federal and state securities laws, and stock exchange listing fees; |
19
Table of Contents
| • | fees and expenses associated with independent audits and outside legal costs; |
| • | federal, state and local taxes; |
| • | independent directors’ fees and expenses; |
| • | costs of any reports, proxy statements or other notices to or communications and meetings with stockholders; |
| • | costs associated with investor relations; |
| • | costs and fees associated with any fidelity bond, directors and officers/errors and omissions liability insurance, and any other insurance premiums; |
| • | direct costs and expenses of administration, including printing, mailing, long distance telephone, copying, secretarial and other staff; and |
| • | all other expenses incurred by us or the Adviser in connection with administering our business. |
Duration and Termination
Unless terminated earlier as described below, the Investment Advisory Agreement will continue in effect for a period of two years from its effective date. It will remain in effect from year to year thereafter if approved annually by our board of directors or by the affirmative vote of the holders of a majority of our outstanding voting securities, and, in either case, if also approved by a majority of our directors who are not “interested persons.” The Investment Advisory Agreement automatically terminates in the event of its assignment, as defined in the 1940 Act, by the Adviser and may be terminated by either party without penalty upon not less than 60 days’ written notice to the other. The holders of a majority of our outstanding voting securities may also terminate the Investment Advisory Agreement without penalty upon 60 days’ written notice.
Indemnification
The Investment Advisory Agreement provides that, absent willful misfeasance, bad faith or gross negligence in the performance of its duties or by reason of the reckless disregard of its duties and obligations under the Investment Advisory Agreement, the Adviser and its officers, managers, partners, agents, employees, controlling persons and members, and any other person or entity affiliated with it, are entitled to indemnification from us for any damages, liabilities, costs and expenses (including reasonable attorneys’ fees and amounts reasonably paid in settlement) arising from the rendering of the Adviser’s services under the Investment Advisory Agreement or otherwise as the Adviser.
Board Approval of the Investment Advisory Agreement
Our board of directors approved the Investment Advisory Agreement at its first meeting, held on October 8, 2013. In its consideration of the investment advisory agreement, the board of directors focused on information it had received relating to, among other things: (a) the nature, quality and extent of the advisory and other services to be provided to us by our investment adviser; (b) comparative data with respect to advisory fees or similar expenses paid by other business development companies with similar investment objectives; (c) any existing and potential sources of indirect income to our investment adviser from its relationships with us and the profitability of those relationships; (d) information about the services to be performed and the personnel performing such services under the investment advisory agreement; (e) the organizational capability and financial condition of our investment adviser; and (f) various other factors.
Based on the information reviewed and the discussions, the board of directors, including a majority of the non-interested directors, concluded that the investment management fee rates and terms are reasonable in relation to the services to be provided and approved the Investment Advisory Agreement as being in the best interests of our stockholders.
20
Table of Contents
Administration Agreement
Under the Administration Agreement, the Adviser furnishes us with office facilities and equipment and provides us with clerical, bookkeeping, recordkeeping and other administrative services at such facilities. Under the Administration Agreement, the Adviser also performs, or oversees the performance of, our required administrative services, which include being responsible for the financial and other records that we are required to maintain and preparing reports to our stockholders and reports and other materials filed with the SEC. In addition, the Adviser assists us in determining and publishing our net asset value, oversees the preparation and filing of our tax returns and the printing and dissemination of reports and other materials to our stockholders, and generally oversees the payment of our expenses and the performance of administrative and professional services rendered to us by others. Pursuant to the Administration Agreement, the Adviser also provides managerial assistance on our behalf to those portfolio companies that have accepted our offer to provide such assistance. The Adviser satisfies certain of its obligations under the Administration Agreement to us through the Services Agreement with Cyrus Capital, including supplying us with accounting and back-office professionals.
Payments under the Administration Agreement are equal to an amount based upon our allocable portion (subject to the review of our board of directors) of the Adviser’s overhead in performing its obligations under the Administration Agreement, including rent, the fees and expenses associated with performing compliance functions and our allocable portion of the cost of our chief financial officer and chief compliance officer and their respective staffs. In addition, if requested to provide significant managerial assistance to our portfolio companies, the Adviser is paid an additional amount based on the services provided, which shall not exceed the amount we receive from such portfolio companies for providing this assistance. The Administration Agreement has an initial term of two years and may be renewed with the approval of our board of directors. The Administration Agreement may be terminated by either party without penalty upon 60 days’ written notice to the other party. To the extent that the Adviser outsources any of its functions, we will pay the fees associated with such functions on a direct basis without any incremental profit to the Adviser.
Indemnification
The Administration Agreement provides that, absent criminal conduct, willful misfeasance, bad faith or gross negligence in the performance of its duties or by reason of the reckless disregard of its duties and obligations, the Adviser and its officers, managers, partners, agents, employees, controlling persons and members, and any other person or entity affiliated with it, are entitled to indemnification from us for any damages, liabilities, costs and expenses (including reasonable attorneys’ fees and amounts reasonably paid in settlement) arising from the rendering of the Adviser’s services under the Administration Agreement or otherwise as our administrator.
License Agreement
We have entered into a license agreement with the Adviser under which the Adviser has agreed to grant us a non-exclusive, royalty-free license to use the name “CM Finance.” Under this agreement, we have a right to use the “CM Finance” name for so long as the Adviser or one of its affiliates remains the Adviser. Other than with respect to this limited license, we have no legal right to the “CM Finance” name. This license agreement will remain in effect for so long as the Investment Advisory Agreement with the Adviser is in effect.
Exchange Act Reports
We maintain a website at www.cmfn-inc.com. The information on our website is not incorporated by reference in this annual report on Form 10-K.
We make available on or through our website certain reports and amendments to those reports that we file with or furnish to the SEC in accordance with the Securities Exchange Act of 1934, or the “Exchange Act.”
21
Table of Contents
These include our annual reports on Form 10-K, our quarterly reports on Form 10-Q and our current reports on Form 8-K. We make this information available on our website free of charge as soon as reasonably practicable after we electronically file the information with, or furnish it to, the SEC.
Regulation as a Business Development Company
We are a business development company under the 1940 Act. The 1940 Act contains prohibitions and restrictions relating to transactions between business development companies and their affiliates (including any investment advisers), principal underwriters and affiliates of those affiliates or underwriters and requires that a majority of the directors be persons other than “interested persons,” as that term is defined in the 1940 Act. In addition, the 1940 Act provides that we may not change the nature of our business so as to cease to be, or to withdraw our election as, a business development company unless approved by a majority of our outstanding voting securities.
Qualifying Assets
Under the 1940 Act, a business development company may not acquire any asset other than assets of the type listed in section 55(a) of the 1940 Act, which are referred to as “qualifying assets,” unless, at the time the acquisition is made, qualifying assets represent at least 70% of the company’s total assets. The principal categories of qualifying assets relevant to our business are the following:
| (1) | Securities purchased in transactions not involving any public offering from the issuer of such securities, which issuer (subject to certain limited exceptions) is an eligible portfolio company, or from any person who is, or has been during the preceding 13 months, an affiliated person of an eligible portfolio company, or from any other person, subject to such rules as may be prescribed by the SEC. Under the 1940 Act and the rules thereunder, “eligible portfolio companies” include (1) private domestic operating companies, (2) public domestic operating companies whose securities are not listed on a national securities exchange (e.g., NASDAQ), and (3) public domestic operating companies having a market capitalization of less than $250 million. Public domestic operating companies whose securities are quoted on the over-the-counter bulletin board or through Pink Sheets LLC are not listed on a national securities exchange and therefore are eligible portfolio companies. |
| (2) | Securities of any eligible portfolio company which we control. |
| (3) | Securities purchased in a private transaction from a U.S. issuer that is not an investment company or from an affiliated person of the issuer, or in transactions incident to such a private transaction, if the issuer is in bankruptcy and subject to reorganization or if the issuer, immediately prior to the purchase of its securities, was unable to meet its obligations as they came due without material assistance other than conventional lending or financing arrangements. |
| (4) | Securities of an eligible portfolio company purchased from any person in a private transaction if there is no ready market for such securities and we already own 60% of the outstanding equity of the eligible portfolio company. |
| (5) | Securities received in exchange for or distributed on or with respect to securities described above, or pursuant to the exercise of warrants or rights relating to such securities. |
| (6) | Cash, cash equivalents, U.S. government securities or high-quality debt securities that mature in one year or less from the date of investment. |
The regulations defining qualifying assets may change over time. We may adjust our investment focus as needed to comply with and/or take advantage of any regulatory, legislative, administrative or judicial actions in this area.
22
Table of Contents
Managerial Assistance to Portfolio Companies
In order to count portfolio securities as qualifying assets for the purpose of the 70% test, a business development company must either control the issuer of the securities or must offer to make available to the issuer of the securities significant managerial assistance. However, when the business development company purchases securities in conjunction with one or more other persons acting together, one of the other persons in the group may make available such managerial assistance. Making available managerial assistance means any arrangement whereby the business development company, through its directors, officers, employees or agents, offers to provide, and, if accepted, does so provide, significant guidance and counsel concerning the management, operations or business objectives and policies of a portfolio company. The Adviser will provide such managerial assistance on our behalf to portfolio companies that request this assistance.
Temporary Investments
Pending investment in other types of qualifying assets, as described above, our investments may consist of cash, cash equivalents, U.S. government securities, repurchase agreements and high-quality debt investments that mature in one year or less from the date of investment, which we refer to, collectively, as temporary investments, so that 70% of our assets are qualifying assets or temporary investments. Typically, we will invest in U.S. Treasury bills or in repurchase agreements, so long as the agreements are fully collateralized by cash or securities issued by the U.S. government or its agencies. A repurchase agreement involves the purchase by an investor, such as us, of a specified security and the simultaneous agreement by the seller to repurchase it at an agreed-upon future date and at a price that is greater than the purchase price by an amount that reflects an agreed-upon interest rate. There is no percentage restriction on the proportion of our assets that may be invested in such repurchase agreements. However, if more than 25% of our total assets constitute repurchase agreements from a single counterparty, we would not meet the diversification tests in order to qualify as a RIC for U.S. federal income tax purposes. Accordingly, we do not intend to enter into repurchase agreements with a single counterparty in excess of this limit. The Adviser will monitor the creditworthiness of the counterparties with which we enter into repurchase agreement transactions.
Senior Securities
We are permitted, under specified conditions, to issue multiple classes of indebtedness and one class of stock senior to our common stock if our asset coverage, as defined in the 1940 Act, is at least equal to 200% immediately after each such issuance. In addition, while any senior securities remain outstanding, we must make provisions to prohibit any distribution to our stockholders or the repurchase of such securities or shares unless we meet the applicable asset coverage ratios at the time of the distribution or repurchase. We may also borrow amounts up to 5% of the value of our total assets for temporary or emergency purposes without regard to asset coverage. For a discussion of the risks associated with leverage, see “Risk Factors—Risks Relating to our Business and Structure—Regulations governing our operation as a BDC affect our ability to, and the way in which we, raise additional capital. As a BDC, the necessity of raising additional capital may expose us to risks, including the typical risks associated with leverage.”
Common Stock
We are not generally able to issue and sell our common stock at a price below net asset value per share. We may, however, sell our common stock at a price below the current net asset value of the common stock if our board of directors determines that such sale is in our best interests and that of our stockholders, and our stockholders approve such sale. In any such case, the price at which our securities are to be issued and sold may not be less than a price which, in the determination of our board of directors, closely approximates the market value of such securities (less any distributing commission or discount).
23
Table of Contents
Codes of Ethics
We and the Adviser have each adopted a code of ethics pursuant to Rule 17j-1 under the 1940 Act that establishes procedures for personal investments and restricts certain personal securities transactions. Personnel subject to each such code may invest in securities for their personal investment accounts, including securities that may be purchased or held by us, so long as such investments are made in accordance with such code’s requirements. You may read and copy our code of ethics at the SEC’s Public Reference Room in Washington, D.C. You may obtain information on the operation of the Public Reference Room by calling the SEC at (202) 551-8090. In addition, each code of ethics is available on the EDGAR Database on the SEC’s website at www.sec.gov. You may also obtain copies of each code of ethics, after paying a duplicating fee, by electronic request at the following e-mail address: publicinfo@sec.gov, or by writing the SEC’s Public Reference Section, 100 F Street, N.E., Washington, D.C. 20549.
Proxy Voting Policies and Procedures
We have delegated our proxy voting responsibility to the Adviser. The Proxy Voting Policies and Procedures of the Adviser are set out below. The guidelines will be reviewed periodically by the Adviser and our directors who are not “interested persons,” and, accordingly, are subject to change.
Introduction
As an investment adviser registered under the Advisers Act, the Adviser has a fiduciary duty to act solely in our best interests. As part of this duty, the Adviser recognizes that it must vote our securities in a timely manner free of conflicts of interest and in our best interests.
The Adviser’s policies and procedures for voting proxies for its investment advisory clients are intended to comply with Section 206 of, and Rule 206(4)-6 under, the Advisers Act.
Proxy Policies
The Adviser votes proxies relating to our portfolio securities in what it perceives to be the best interest of our stockholders. The Adviser reviews on a case-by-case basis each proposal submitted to a stockholder vote to determine its effect on the portfolio securities we hold. In most cases, the Adviser will vote in favor of proposals that the Adviser believes are likely to increase the value of the portfolio securities we hold. Although the Adviser will generally vote against proposals that may have a negative effect on our portfolio securities, the Adviser may vote for such a proposal if there exist compelling long-term reasons to do so.
The Adviser has established a proxy voting committee and adopted proxy voting guidelines and related procedures. The proxy voting committee establishes proxy voting guidelines and procedures, oversees the internal proxy voting process, and reviews proxy voting issues. To ensure that the Adviser’s vote is not the product of a conflict of interest, the Adviser requires that (1) anyone involved in the decision-making process disclose to our Chief Compliance Officer any potential conflict that he or she is aware of and any contact that he or she has had with any interested party regarding a proxy vote; and (2) employees involved in the decision-making process or vote administration are prohibited from revealing how the Adviser intends to vote on a proposal in order to reduce any attempted influence from interested parties. Where conflicts of interest may be present, the Adviser will disclose such conflicts to us, including our independent directors and may request guidance from us on how to vote such proxies.
Proxy Voting Records
You may obtain information about how the Adviser voted proxies by making a written request for proxy voting information to: CM Finance Inc, Attention: Investor Relations, 601 Lexington Avenue, 26th Floor,
24
Table of Contents
New York, New York 10022, or by calling us collect at (212) 257-5199. The SEC also maintains a website at www.sec.gov that contains this information.
Privacy Principles
We are committed to maintaining the privacy of our stockholders and to safeguarding their nonpublic personal information. The following information is provided to help you understand what personal information we collect, how we protect that information and why, in certain cases, we may share information with select other parties.
Generally, we do not receive any nonpublic personal information relating to our stockholders, although certain nonpublic personal information of our stockholders may become available to us. We do not disclose any nonpublic personal information about our stockholders or former stockholders to anyone, except as permitted by law or as is necessary in order to service stockholder accounts (for example, to a transfer agent or third-party administrator).
We restrict access to nonpublic personal information about our stockholders to employees of the Adviser and its affiliates with a legitimate business need for the information. We intend to maintain physical, electronic and procedural safeguards designed to protect the nonpublic personal information of our stockholders.
Other
We are required to provide and maintain a bond issued by a reputable fidelity insurance company to protect us against larceny and embezzlement. Furthermore, as a BDC, we are prohibited from protecting any director or officer against any liability to us or our stockholders arising from willful misfeasance, bad faith, gross negligence or reckless disregard of the duties involved in the conduct of such person’s office.
We and the Adviser are each required to adopt and implement written policies and procedures reasonably designed to prevent violation of relevant federal securities laws, review these policies and procedures annually for their adequacy and the effectiveness of their implementation, and designate a chief compliance officer to be responsible for administering the policies and procedures.
We may be prohibited under the 1940 Act from knowingly participating in certain transactions with our affiliates without the prior approval of our board of directors who are not interested persons and, in some cases, prior approval by the SEC. Thus, based on current SEC interpretations, co-investment transactions involving a BDC like us and an entity that is advised by the Adviser or an affiliated adviser generally could not be effected without SEC relief. The staff of the SEC has, however, granted no-action relief permitting purchases of a single class of privately placed securities, provided that the adviser negotiates no term other than price and certain other conditions are met.
Under the Stifel arrangement and subject to certain restrictions, Stifel uses its commercially reasonable efforts to present to us the opportunity to review and bid on Stifel Nicolaus & Company, Incorporated-originated leveraged finance and high yield corporate debt opportunities, consistent with our investment strategy and subject to the approval of our board of directors as necessary under the 1940 Act and certain other limitations. Stifel may invest in the same portfolio companies that we invest in (regardless of whether our investment arose from a Stifel-originated opportunity) and Stifel may, through such investments, have interests that conflict with ours, including receiving fees from the portfolio company directly as well as through its interest in the Adviser. We believe that we may co-invest with Stifel and its affiliates upon approval of a majority of our directors who are not “interested persons” as defined in Section 2(a)(19) of the 1940 Act. See “Risk Factors—Our relationship with Stifel may create conflicts of interest.”
25
Table of Contents
As a result of the relationship with Cyrus and the Cyrus Funds, we could be presumed to be an affiliate of the Cyrus Funds under the 1940 Act. However, a person’s status as an “affiliate” under the 1940 Act is a rebuttable assumption, which we believe we can successfully rebut. As a result, we believe that we may invest in the same portfolio companies that the Cyrus Funds invest in, without seeking exemptive relief from the SEC.
Sarbanes-Oxley Act of 2002
The Sarbanes-Oxley Act of 2002 imposes a wide variety of regulatory requirements on publicly held companies and their insiders. Many of these requirements affect us. For example:
| • | pursuant to Rule 13a-14 under the Exchange Act, our principal executive officer and principal financial officer must certify the accuracy of the financial statements contained in our periodic reports; |
| • | pursuant to Item 307 under Regulation S-K, our periodic reports must disclose our conclusions about the effectiveness of our disclosure controls and procedures; |
| • | pursuant to Rule 13a-15 under the Exchange Act, our management must prepare an annual report regarding its assessment of our internal control over financial reporting; and |
| • | pursuant to Item 308 of Regulation S-K and Rule 13a-15 under the Exchange Act, our periodic reports must disclose whether there were significant changes in our internal controls over financial reporting or in other factors that could significantly affect these controls subsequent to the date of their evaluation, including any corrective actions with regard to significant deficiencies and material weaknesses. |
Taxation as a Regulated Investment Company
As a business development company, we intend to elect to be treated as a RIC under Subchapter M of the Code. As a RIC, we generally do not have to pay corporate-level U.S. federal income taxes on any income that we distribute to our stockholders as dividends. To qualify as a RIC, we must, among other things, meet certain source-of-income and asset diversification requirements (as described below). In addition, to qualify for RIC tax treatment we must distribute to our stockholders, for each taxable year, at least 90% of our “investment company taxable income,” which is generally our ordinary income plus the excess of our realized net short-term capital gains over our realized net long-term capital losses (the “Annual Distribution Requirement”).
If we qualify as a RIC and satisfy the Annual Distribution Requirement, then we generally will not be subject to U.S. federal income tax on the portion of our income we distribute (or are deemed to distribute) to stockholders. We will be subject to U.S. federal income tax at the regular corporate rates on any income or capital gains not distributed (or deemed distributed) to our stockholders.
We will be subject to a 4% nondeductible U.S. federal excise tax on certain undistributed income unless we distribute in a timely manner an amount at least equal to the sum of (1) 98% of our net ordinary income for each calendar year, (2) 98.2% of our capital gain net income for the one-year period ending October 31 in that calendar year and (3) any income recognized, but not distributed, in preceding years (the “Excise Tax Avoidance Requirement”).
In order to qualify as a RIC for U.S. federal income tax purposes, we must, among other things:
| • | continue to qualify as a business development company under the 1940 Act at all times during each taxable year; |
| • | derive in each taxable year at least 90% of our gross income from dividends, interest, payments with respect to loans of certain securities, gains from the sale of stock or other securities, net income from certain “qualified publicly traded partnerships,” or other income derived with respect to our business of investing in such stock or securities (the “90% Income Test”); and |
26
Table of Contents
| • | diversify our holdings so that at the end of each quarter of the taxable year: |
| • | at least 50% of the value of our assets consists of cash, cash equivalents, U.S. Government securities, securities of other RICs, and other securities if such other securities of any one issuer do not represent more than 5% of the value of our assets or more than 10% of the outstanding voting securities of the issuer; and |
| • | no more than 25% of the value of our assets is invested in the securities, other than U.S. government securities or securities of other RICs, of one issuer, of two or more issuers that are controlled, as determined under applicable Code rules, by us and that are engaged in the same or similar or related trades or businesses or of certain “qualified publicly traded partnerships” (the “Diversification Tests”). |
We may be required to recognize taxable income in circumstances in which we do not receive cash. For example, if we hold debt obligations that are treated under applicable tax rules as having original issue discount (such as debt instruments with PIK interest or, in certain cases, increasing interest rates or issued with warrants), we must include in income each year a portion of the original issue discount that accrues over the life of the obligation, regardless of whether cash representing such income is received by us in the same taxable year. We may also have to include in income other amounts that we have not yet received in cash, such as PIK interest and deferred loan origination fees that are paid after origination of the loan or are paid in non-cash compensation such as warrants or stock. Because any original issue discount or other amounts accrued will be included in our investment company taxable income for the year of accrual, we may be required to make a distribution to our stockholders in order to satisfy the Annual Distribution Requirement, even though we will not have received any corresponding cash amount.
Although we do not presently expect to do so, we are authorized to borrow funds and to sell assets in order to satisfy the distribution requirements. However, under the 1940 Act, we are not permitted in certain circumstances to make distributions to our stockholders while our debt obligations and other senior securities are outstanding unless certain “asset coverage” tests are met. Moreover, our ability to dispose of assets to meet our distribution requirements may be limited by (1) the illiquid nature of our portfolio and/or (2) other requirements relating to our status as a RIC, including the Diversification Tests. If we dispose of assets in order to meet the Annual Distribution Requirement or the Excise Tax Avoidance Requirement, we may make such dispositions at times that, from an investment standpoint, are not advantageous.
In accordance with certain applicable Treasury regulations and private letter rulings issued by the Internal Revenue Service, a RIC may treat a distribution of its own stock as fulfilling its RIC distribution requirements if each stockholder may elect to receive his or her entire distribution in either cash or stock of the RIC, subject to a limitation that the aggregate amount of cash to be distributed to all stockholders must be at least 20% of the aggregate declared distribution. If too many stockholders elect to receive cash, each stockholder electing to receive cash must receive a pro rata amount of cash (with the balance of the distribution paid in stock). In no event will any stockholder, electing to receive cash, receive less than 20% of his or her entire distribution in cash. If these and certain other requirements are met, for U.S federal income tax purposes, the amount of the dividend paid in stock will be equal to the amount of cash that could have been received instead of stock. We have no current intention of paying dividends in shares of our stock in accordance with these Treasury regulations or private letter rulings.
Our Status as an Emerging Growth Company
We are an “emerging growth company,” as defined in the Jumpstart Our Business Startups Act of 2012, or the JOBS Act. As an emerging growth company, we may take advantage of specified reduced disclosure and other requirements that are otherwise applicable generally to public companies. These eased requirements include an exemption from certain financial disclosure and governance requirements and relaxed restrictions on the sale of securities. The JOBS Act provides scaled disclosure provisions for emerging growth companies,
27
Table of Contents
including, among other things, removing the requirement that emerging growth companies comply with Sarbanes-Oxley Act Section 404(b) auditor attestation of internal control over financial reporting. Section 107(b) of the JOBS Act also permits an emerging growth companies to elect an extended transition period for complying with new or revised accounting standards that have different effective dates for public and private companies until such time as these new or revised standards are made applicable to all private companies. We have elected to take advantage of the extended transition period for complying with new or revised accounting standards, which may make it more difficult for investors and securities analysts to evaluate us since our financial statements may not be comparable to companies that comply with public company effective dates. We will remain an emerging growth company until the earlier of (a) the last day of the fiscal year (i) following the fifth anniversary of the completion of our initial public offering, (ii) in which we have total annual gross revenue of at least $1.0 billion, or (iii) in which we are deemed to be a large accelerated filer, which means the market value of our common stock that is held by non-affiliates exceeds $700 million as of the prior June 30th, and (b) the date on which we have issued more than $1.0 billion in non-convertible debt during the prior three-year period.
The NASDAQ Stock Market Corporate Governance Regulations
The NASDAQ Stock Market has adopted corporate governance regulations that listed companies must comply with. We are in compliance with such corporate governance listing standards applicable to business development companies.
28
Table of Contents
| Item 1A. | Risk Factors |
Investing in our common stock involves a number of significant risks. Before you invest in our common stock, you should be aware of various risks, including those described below. You should carefully consider these risk factors, together with all of the other information included in this annual report on Form 10-K, before you decide whether to make an investment in our common stock. The risks set out below are not the only risks we face. Additional risks and uncertainties not presently known to us or not presently deemed material by us may also impair our operations and performance. If any of the following events occur, our business, financial condition, results of operations and cash flows could be materially and adversely affected. In such case, our net asset value and the trading price of our common stock could decline, and you may lose all or part of your investment.
Risks Relating to Our Business and Structure
We have a limited operating history as a BDC and we have not yet elected to be treated as a RIC. The Adviser has limited experience advising a BDC or a RIC, and we and our Adviser may not be able to operate our business successfully or generate sufficient revenue to make or sustain distributions to our stockholders.
We and the Adviser were formed in February 2012 and commenced operations in March 2012. Prior to the completion of our initial public offering in February 2014, we did not operate as a BDC and our Adviser had never managed a BDC. In addition, we had not qualified to be treated as a RIC. As a result of our limited operating history, we have limited operating results under these regulatory frameworks that can demonstrate to you either their effect on our business or our ability to manage our business under these frameworks. We are subject to the business risks and uncertainties associated with recently formed businesses, including the risk that we will not achieve our investment objective and that the value of your investment could decline substantially.
The 1940 Act and the Code impose numerous constraints on the operations of BDCs and RICs that do not apply to other investment vehicles previously managed by the Adviser. BDCs are required, for example, to invest at least 70% of their total assets primarily in securities of U.S. private or thinly traded public companies, cash, cash equivalents, U.S. government securities and other high-quality debt instruments that mature in one year or less from the date of investment. Moreover, qualification for taxation as a RIC requires satisfaction of source-of-income, asset diversification and distribution requirements. We and the Adviser have limited experience operating or advising under these constraints, which may hinder our ability to take advantage of attractive investment opportunities and to achieve our investment objective.
We depend upon key personnel of the Adviser for our future success. If the Adviser were to lose any of its key personnel, our ability to achieve our investment objective could be significantly harmed.
We depend on the diligence, skill, experience and network of business contacts of the investment professionals of the Adviser, in particular Messrs. Mauer and Jansen, who are also members of the Adviser’s investment committee, executive officers and members of our board of directors. We can offer no assurance that Messrs. Mauer and Jansen will continue to provide investment advice to us. The loss of either Mr. Mauer or Mr. Jansen would limit our ability to achieve our investment objective and operate as we anticipate.
Messrs. Mauer and Jansen are currently supported by 16 investment professionals of whom 10 support the Adviser pursuant to the Services Agreement as well as other accounting and back-office professionals provided by Cyrus Capital under the Services Agreement. The Services Agreement has an initial term of five years and may be terminated by Cyrus Capital at any time only under certain circumstances, including if the Adviser ceases to provide investment advisory service to us. The Services Agreement may also be terminated by either Cyrus Capital or the Adviser upon 90 days’ notice prior to the initial five-year term and the expiration of each one-year anniversary thereafter. Accordingly, we can offer no assurance that the Adviser will continue to be supported by sufficient investment personnel and other personnel directly or pursuant to the Services Agreement. In addition, the termination of the Services Agreement by Cyrus Capital could limit our ability to achieve our investment
29
Table of Contents
objective and operate as we anticipate. This could have a material adverse effect on our financial condition, results of operations and cash flows.
Our business model depends to a significant extent upon our Adviser’s network of relationships. Any inability of the Adviser to maintain or develop these relationships, or the failure of these relationships to generate investment opportunities, could adversely affect our business.
We depend upon the Adviser to maintain its relationships with private equity sponsors, placement agents, investment banks, management groups and other financial institutions, including Stifel and Cyrus Capital, and we expect to rely to a significant extent upon these relationships to provide us with potential investment opportunities. If the Adviser or members of the Investment Team fail to maintain such relationships, or to develop new relationships with other sources of investment opportunities, we will not be able to grow our investment portfolio. In addition, individuals with whom the Adviser has relationships are not obligated to provide us with investment opportunities, and we can offer no assurance that these relationships will generate investment opportunities for us in the future.
Our relationship with Cyrus Capital may create conflicts of interest.
The Cyrus Funds, managed by Cyrus Capital, own approximately 27.9% of our outstanding common stock. The Cyrus Funds also have a 38% indirect economic interest in the Adviser. The Investment Team currently includes 10 investment professionals who are employees of Cyrus Capital. These Cyrus Professionals also engage in investment advisory activities for the private investment funds managed by Cyrus Capital, including the Cyrus Funds, which could result in conflicts of interest with respect to, among other things, the allocation of investment opportunities, and may distract them from their responsibilities to us. Cyrus Capital also provides certain financial, accounting and administrative services to the Adviser pursuant to the Services Agreement with the Adviser upon which the Adviser relies to satisfy its obligations under the Administration Agreement, and is reimbursed by the Adviser for the expenses it incurs in connection with providing such services.
In addition, as a result of the relationship with Cyrus Capital and the Cyrus Funds, we could be presumed to be an affiliate of the Cyrus Funds under the 1940 Act. However, a person’s status as an “affiliate” under the 1940 Act is a rebuttable presumption, which we believe we can successfully refute. As a result, we believe that we may invest in the same portfolio companies that the Cyrus Funds invest in, without seeking exemptive relief from the SEC. However, we can provide no assurance that the SEC or its staff will not take a contrary position. If the SEC or its staff does deem us to be an affiliate of Cyrus Capital, we would be required to obtain an exemptive order from the SEC in order to co-invest with affiliates of Cyrus Capital. We can offer no assurance that we will successfully obtain such an order. If we cannot co-invest with affiliates of Cyrus Capital, our business, financial condition, results of operations and cash flows could be materially adversely affected. In addition, the Cyrus Funds may, through such co-investments, have interests that conflict with ours, including receiving fees from the portfolio company directly as well as through its economic interest in the Adviser.
Our relationship with Stifel may create conflicts of interest.
Stifel owns approximately 15.9% of our outstanding common stock. Stifel also has a 20% interest in the Adviser. Six members of the Adviser’s Investment Team are dual employees of the Adviser and Stifel, and also engage in investment advisory activities for Stifel, which could result in a conflict of interest and may distract them from their responsibilities to us. Mr. Kuppenheimer is a member of the Adviser’s investment committee and a member of our board of directors. Mr. Kuppenheimer is also an employee of Stifel, and will continue to engage in investment advisory activities for Stifel which could result in a conflict of interest and may distract Mr. Kuppenheimer from his responsibilities to us.
Under the Stifel arrangement and subject to certain restrictions, Stifel will use its commercially reasonable efforts to present to us to review and bid on, Stifel Nicolaus & Company, Incorporated-originated leveraged
30
Table of Contents
finance and high yield corporate debt opportunities consistent with our investment strategy, subject to the approval of our board of directors, as necessary under the 1940 Act, and certain other limitations. Stifel may invest in the same portfolio companies that we invest in (regardless of whether our investment arose from a Stifel-originated opportunity), and Stifel may, through such investments, have interests that conflict with ours, including receiving fees from the portfolio company directly as well as through its interest in the Adviser. We believe that we may co-invest with Stifel and its affiliates upon approval of a majority of our directors that are not “interested persons” as defined in Section 2(a)(19) of the 1940 Act. However, we can provide no assurance that the SEC or its staff will not take a contrary position. If the SEC or its staff takes a contrary position, we would be required to obtain an exemptive order from the SEC in order to co-invest with Stifel and its affiliates. We can offer no assurance that we will successfully obtain such an order. If we cannot co-invest with Stifel and its affiliates, our business, financial condition, results of operations and cash flows could be materially adversely affected.
In addition, Stifel, through Keefe, Bruyette & Woods, Inc., a subsidiary of Stifel’s parent, Stifel Financial Corp., will be a “principal underwriter,” as defined in the 1940 Act, by virtue of and during the term of, any future offering in which Stifel may be part of the underwriting syndicate. As a result, our ability to co-invest with Stifel will be limited during the term of any future offering in which Stifel acts as a “principal underwriter.” If we cannot co-invest with affiliates of Stifel, our business, financial condition, results of operations and cash flows could be materially adversely affected.
There are significant potential conflicts of interest that could negatively affect our investment returns.
There may be times when the Adviser or the members of the Investment Team have interests that differ from those of our stockholders, giving rise to conflicts of interest. The members of the Adviser’s investment committee and the Investment Team serve, or may serve, as officers, directors, members, or principals of entities that operate in the same or a related line of business as we do, such as Stifel or Cyrus Capital, or of investment funds, accounts, or investment vehicles managed by the Adviser, Stifel or Cyrus Capital. Similarly, the Adviser or the members of the Investment Team may have other clients with similar, different or competing investment objectives. In serving in these multiple capacities, they may have obligations to other clients or investors in those entities, the fulfillment of which may not be in the best interests of us or our stockholders. In addition, the Adviser and some of its affiliates, including our officers and our non-independent directors, are not prohibited from raising money for, or managing, another investment entity that makes the same types of investments as those we target. The members of the Investment Team who are employees of Cyrus Capital, manage the Cyrus Funds, and are not prohibited from raising money for, or managing another investment entity that makes the same types of investments as those we target. The members of the Investment Team who are dual employees of the Adviser and Stifel, as well as Mr. Kuppenheimer, who is also an employee of Stifel, may continue to engage in investment advisory activities for Stifel, which could result in a conflict of interest and may distract them from their responsibilities to us. As a result, and although the Adviser and its Investment Team are subject to a written conflicts of interest policy, the time and resources the Adviser’s Investment Team and certain members of the Adviser’s investment committee could devote to us may be diverted. In addition, we may compete with any such investment entity for the same investors and investment opportunities.
The members of the Investment Team may, from time to time, possess material non-public information, limiting our investment discretion.
The investment professionals of the Adviser may serve as directors of, or in a similar capacity with, portfolio companies in which we invest. In the event that material nonpublic information is obtained with respect to such companies, or we become subject to trading restrictions under the internal trading policies of those companies or as a result of applicable law or regulations, we could be prohibited for a period of time from purchasing or selling the securities of such companies, and this prohibition may have an adverse effect on us.
31
Table of Contents
There are conflicts related to other arrangements with the Adviser.
We have entered into a License Agreement with the Adviser under which the Adviser has agreed to grant us a non-exclusive, royalty-free license to use the name “CM Finance.” See “Business— Management Agreements—License Agreement.” In addition, we have entered into an Administration Agreement with the Adviser pursuant to which we are required to pay to the Adviser our allocable portion of overhead and other expenses incurred by the Adviser in performing its obligations under such Administration Agreement, such as rent and our allocable portion of the cost of our chief financial officer and our chief compliance officer and their respective staffs. This will create conflicts of interest that our board of directors will monitor. For example, under the terms of the license agreement, we will be unable to preclude the Adviser from licensing or transferring the ownership of the “CM Finance” name to third parties, some of whom may compete against us. Consequently, we will be unable to prevent any damage to goodwill that may occur as a result of the activities of the Adviser or others. Furthermore, in the event the license agreement is terminated, we will be required to change our name and cease using “CM Finance” as part of our name. Any of these events could disrupt our recognition in the market place, damage any goodwill we may have generated and otherwise harm our business.
Our financial condition, results of operations and cash flows will depend on our ability to manage our business effectively.
Our ability to achieve our investment objective will depend on our ability to manage our business and to grow our investments and earnings. This will depend, in turn, on the Adviser’s ability to identify, invest in and monitor portfolio companies that meet our investment criteria. The achievement of our investment objective on a cost-effective basis will depend upon the Adviser’s execution of our investment process, its ability to provide competent, attentive and efficient services to us and, to a lesser extent, our access to financing on acceptable terms. The Adviser’s investment professionals may have substantial responsibilities in connection with the management of other investment funds, accounts and investment vehicles. The personnel of the Adviser may also be called upon to provide managerial assistance to our portfolio companies. These activities may distract them from identifying new investment opportunities for us or slow our rate of investment. Any failure to manage our business and our future growth effectively could have a material adverse effect on our business, financial condition, results of operations and cash flows.
In addition, although CM Investment Partners, LP was led by Messrs. Mauer and Jansen, the remaining investment team of CM Investment Partners, LP was composed of different investment professionals than the current investment team of the Adviser, which may result in materially different investment performance.
The Adviser’s incentive fee structure may create incentives to it that are not fully aligned with the interests of our stockholders.
In the course of our investing activities, we pay management and incentive fees to the Adviser. We have entered into an Investment Advisory Agreement with the Adviser that provides that these fees will be based on the value of our gross assets. As a result, investors in our common stock will invest on a “gross” basis and receive distributions on a “net” basis after expenses, resulting in a lower rate of return than one might achieve through direct investments. Because these fees are based on the value of our gross assets, the Adviser will benefit when we incur debt or use leverage. This fee structure may encourage the Adviser to cause us to borrow money to finance additional investments. Under certain circumstances, the use of borrowed money may increase the likelihood of default, which would disfavor our stockholders.
Our board of directors is charged with protecting our interests by monitoring how the Adviser addresses these and other conflicts of interests associated with its management services and compensation. While our board of directors is not expected to review or approve each investment decision, borrowing or incurrence of leverage, our independent directors will periodically review the Adviser’s services and fees as well as its portfolio management decisions and portfolio performance. In connection with these reviews, our independent directors
32
Table of Contents
will consider whether our fees and expenses (including those related to leverage) remain appropriate. As a result of this arrangement, the Adviser may from time to time have interests that differ from those of our stockholders, giving rise to a conflict.
Our incentive fee may induce the Adviser to make speculative investments.
The Adviser receives an incentive fee based, in part, upon net capital gains realized on our investments. Unlike that portion of the incentive fee based on income, there is no hurdle rate applicable to the portion of the incentive fee based on net capital gains. Additionally, under the incentive fee structure, the Adviser may benefit when we recognize capital gains and, because the Adviser will determine when to sell a holding, the Adviser will control the timing of the recognition of such capital gains. As a result, the Adviser may have a tendency to invest more capital in investments likely to result in capital gains, compared to income-producing securities. Such a practice could result in our investing in more speculative securities than would otherwise be the case, which could result in higher investment losses, particularly during economic downturns.
We may be obligated to pay the Adviser incentive compensation even if we incur a loss and may pay more than 20.0% of our net capital gains because we cannot recover payments made in previous years.
The Adviser is entitled to incentive compensation for each fiscal quarter in an amount equal to a percentage of the excess of our investment income for that quarter (before deducting incentive compensation) above a threshold return for that quarter. Thus, we may be required to pay the Adviser incentive compensation for a fiscal quarter even if there is a decline in the value of our portfolio or we incur a net loss for that quarter. If we pay an incentive fee of 20% of our realized capital gains (net of all realized capital losses and unrealized capital depreciation on a cumulative basis) and thereafter experience additional realized capital losses or unrealized capital depreciation, we will not be able to recover any portion of the incentive fee previously paid.
PIK interest payments we receive will increase our assets under management and, as a result, will increase the amount of base management fees and incentive fees payable by us to the Adviser.
Certain of our debt investments contain provisions providing for the payment of PIK interest. Because PIK interest results in an increase in the size of the loan balance of the underlying loan, and receipt of PIK interest will have the effect of increasing our assets under management. As a result, because the base management fee that we pay to the Adviser is based on the value of our gross assets, and receipt of PIK interest will result in an increase in the amount of the base management fee payable by us. In addition, any such increase in a loan balance due to the receipt of PIK interest will cause such loan to accrue interest on the higher loan balance, which will result in an increase in our pre-incentive fee net investment income and, as a result, an increase in incentive fees that are payable to the Adviser.
The involvement of our interested directors in the valuation process may create conflicts of interest.
We expect to make most of our portfolio investments in the form of loans and securities that are not publicly traded and for which there are limited or no market based price quotation is available. As a result, our board of directors will determine the fair value of these loans and securities in good faith as described below in “—Most of our portfolio investments will be recorded at fair value as determined in good faith by our board of directors and, as a result, there may be uncertainty as to the value of our portfolio investments.” In connection with that determination, investment professionals from the Adviser may provide our board of directors with valuations based upon the most recent portfolio company financial statements available and projected financial results of each portfolio company. While the valuation for each portfolio investment will be reviewed by an independent valuation firm quarterly, the ultimate determination of fair value will be made by our board of directors and not by such third-party valuation firm. In addition, Messrs. Mauer and Jansen, each an interested member of our board of directors, has a direct or indirect pecuniary interest in the Adviser. The participation of the Adviser’s investment professionals in our valuation process, and the pecuniary interest in the Adviser by certain members
33
Table of Contents
of our board of directors, could result in a conflict of interest as the Adviser’s management fee is based, in part, on the value of our gross assets, and our incentive fees will be based, in part, on realized gains and realized and unrealized losses.
The Investment Advisory Agreement and the Administration Agreement with the Adviser were not negotiated on an arm’s length basis and may not be as favorable to us as if they had been negotiated with an unaffiliated third party.
The Investment Advisory Agreement and the Administration Agreement were negotiated between related parties. Consequently, their terms, including fees payable to the Adviser, may not be as favorable to us as if they had been negotiated with an unaffiliated third party. In addition, we may choose not to enforce, or to enforce less vigorously, our rights and remedies under these agreements because of our desire to maintain our ongoing relationship with the Adviser and its affiliates. Any such decision, however, would breach our fiduciary obligations to our stockholders.
Our incentive fee arrangements with the Adviser may vary from those of other investment funds, account or investment vehicles that the Adviser may manage in the future, which may create an incentive for the Adviser to devote time and resources to a higher fee-paying fund.
If the Adviser is paid a higher performance-based fee from any other fund that it may manage in the future, it may have an incentive to devote more research and development or other activities, and/or recommend the allocation of investment opportunities, to such higher fee-paying fund. For example, to the extent the Adviser’s incentive compensation is not subject to a hurdle or total return requirement with respect to another fund, it may have an incentive to devote time and resources to such other fund. As a result, the investment professionals of the Adviser may devote time and resources to a higher fee-paying fund.
The Adviser’s liability is limited under the Investment Advisory Agreement and we have agreed to indemnify the Adviser against certain liabilities, which may lead the Adviser to act in a riskier manner on our behalf than it would when acting for its own account.
Under the Investment Advisory Agreement, the Adviser has not assumed any responsibility to us other than to render the services called for under that agreement. It will not be responsible for any action of our board of directors in following or declining to follow the Adviser’s advice or recommendations. Under the Investment Advisory Agreement, the Adviser, its officers, members and personnel, and any person controlling or controlled by the Adviser will not be liable to us, any subsidiary of ours, our directors, our stockholders or any subsidiary’s stockholders or partners for acts or omissions performed in accordance with and pursuant to the Investment Advisory Agreement, except those resulting from acts constituting gross negligence, willful misconduct, bad faith or reckless disregard of the duties that the Adviser owes to us under the Investment Advisory Agreement. In addition, as part of the Investment Advisory Agreement, we have agreed to indemnify the Adviser and each of its officers, directors, members, managers and employees from and against any claims or liabilities, including reasonable legal fees and other expenses reasonably incurred, arising out of or in connection with our business and operations or any action taken or omitted on our behalf pursuant to authority granted by the Investment Advisory Agreement, except where attributable to gross negligence, willful misconduct, bad faith or reckless disregard of such person’s duties under the Investment Advisory Agreement. These protections may lead the Adviser to act in a riskier manner when acting on our behalf than it would when acting for its own account.
We operate in a highly competitive market for investment opportunities, which could reduce returns and result in losses.
A number of entities compete with us to make the types of investments that we plan to make. We will compete with public and private funds, other BDCs, commercial and investment banks, commercial financing companies and, to the extent they provide an alternative form of financing, private equity and hedge funds. Many
34
Table of Contents
of our competitors are substantially larger and have considerably greater financial, technical and marketing resources than we do. For example, we believe some of our competitors may have access to funding sources that are not available to us. In addition, some of our competitors may have higher risk tolerances or different risk assessments, which could allow them to consider a wider variety of investments and establish more relationships than us. Furthermore, many of our competitors are not subject to the regulatory restrictions that the 1940 Act imposes on us as a BDC or the source-of-income, asset diversification and distribution requirements we must satisfy to maintain our RIC qualification. The competitive pressures we face may have a material adverse effect on our business, financial condition, results of operations and cash flows. As a result of this competition, we may not be able to take advantage of attractive investment opportunities from time to time, and we may not be able to identify and make investments that are consistent with our investment objective.
With respect to the investments we make, we do not seek to compete based primarily on the interest rates we offer, and we believe that some of our competitors may make loans with interest rates that will be lower than the rates we offer. With respect to all investments, we may lose some investment opportunities if we do not match our competitors’ pricing, terms and structure. However, if we match our competitors’ pricing, terms and structure, we may experience decreased net interest income, lower yields and increased risk of credit loss.
We will be subject to corporate-level income tax if we are unable to qualify or maintain our qualification as a RIC under Subchapter M of the Code.
To qualify as a RIC under Subchapter M of the Code, we must meet certain source-of-income, asset diversification and distribution requirements. The distribution requirement for a RIC is satisfied if we distribute at least 90% of our net ordinary income and net short-term capital gains in excess of net long-term capital losses, if any, to our stockholders on an annual basis. Because we intend to incur debt, we will be subject to certain asset coverage ratio requirements under the 1940 Act and financial covenants under loan and credit agreements that could, under certain circumstances, restrict us from making distributions necessary to qualify as a RIC. If we are unable to obtain cash from other sources, we may fail to qualify as a RIC and, thus, may be subject to corporate-level income tax. To qualify as a RIC, we must also meet certain asset diversification requirements at the end of each calendar quarter. Failure to meet these tests may result in our having to dispose of certain investments quickly in order to prevent the loss of our qualification as a RIC. Because most of our investments will be in private or thinly traded public companies, any such dispositions may be made at disadvantageous prices and may result in substantial losses. If we fail to qualify as a RIC for any reason and become subject to corporate income tax, the resulting corporate income taxes could substantially reduce our net assets, the amount of income available for distributions to our stockholders and the amount of funds available for new investments. Such a failure would have a material adverse effect on us and our stockholders. See “Business— Taxation as a Regulated Investment Company.”
We may need to raise additional capital to grow because we must distribute most of our income.
We may need additional capital to fund new investments and grow our portfolio of investments. We intend to access the capital markets periodically to issue debt or equity securities or borrow from financial institutions in order to obtain such additional capital. Unfavorable economic conditions could increase our funding costs, limit our access to the capital markets or result in a decision by lenders not to extend credit to us. A reduction in the availability of new capital could limit our ability to grow. In addition, we will be required to distribute at least 90% of our net ordinary income and net short-term capital gains in excess of net long-term capital losses, if any, to our stockholders to maintain our qualification as a RIC. As a result, these earnings will not be available to fund new investments. An inability on our part to access the capital markets successfully could limit our ability to grow our business and execute our business strategy fully and could decrease our earnings, if any, which would have an adverse effect on the value of our securities.
35
Table of Contents
You may not receive distributions, or our distributions may not grow over time.
We intend to make distributions on a quarterly basis to our stockholders out of assets legally available for distribution. We cannot assure you that we will achieve investment results that will allow us to make a specified level of cash distributions or year-to-year increases in cash distributions. Our ability to pay distributions might be adversely affected by the impact of one or more of the risk factors described in this annual report on Form 10-K. Due to the asset coverage test applicable to us under the 1940 Act as a BDC, we may be limited in our ability to make distributions. All distributions will be made at the discretion of our board of directors and will depend on our earnings, financial condition, maintenance of RIC status, compliance with applicable BDC, SBA regulations (if applicable) and such other factors as our board of directors may deem relative from time to time. We cannot assure you that we will make distributions to our stockholders in the future.
We may have difficulty paying our required distributions if we recognize income before, or without, receiving cash representing such income.
For U.S. federal income tax purposes, we will include in income certain amounts that we have not yet received in cash, such as the accrual of OID. This may arise if we receive warrants in connection with the making of a loan and in other circumstances, or through contracted PIK interest, which represents contractual interest added to the loan balance and due at the end of the loan term. Such OID, which could be significant relative to our overall investment activities, and increases in loan balances as a result of contracted PIK arrangements will be included in income before we receive any corresponding cash payments. We also may be required to include in income certain other amounts that we will not receive in cash.
Since in certain cases we may recognize income before or without receiving cash representing such income, we may have difficulty meeting the requirement to distribute at least 90% of our net ordinary income and net short-term capital gains in excess of net long-term capital losses, if any, to maintain our qualification as a RIC. In such a case, we may have to sell some of our investments at times we would not consider advantageous, raise additional debt or equity capital or reduce new investment originations to meet these distribution requirements. If we are not able to obtain such cash from other sources, we may fail to qualify as a RIC and thus be subject to corporate-level income tax. See “Business— Taxation as a Regulated Investment Company.”
We may in the future choose to pay dividends in our own stock, in which case you may be required to pay tax in excess of the cash you receive.
We may distribute taxable dividends that are payable in part in our stock. Under certain applicable provisions of the Code and the Treasury regulations, distributions payable in cash or in shares of stock at the election of shareholders are treated as taxable dividends. The Internal Revenue Service has issued private rulings indicating that this rule will apply even if the total amount of cash that may be distributed is limited to no more than 20% of the total distribution. Under these rulings, if too many shareholders elect to receive their distributions in cash, each such shareholder would receive a pro rata share of the total cash to be distributed and would receive the remainder of their distribution in shares of stock. If we decide to make any distributions consistent with these rulings that are payable in part in our stock, taxable stockholders receiving such dividends will be required to include the full amount of the dividend (whether received in cash, our stock, or combination thereof) as ordinary income (or as long-term capital gain to the extent such distribution is properly designated as a capital gain dividend) to the extent of our current and accumulated earnings and profits for United States federal income tax purposes. As a result, a U.S. stockholder may be required to pay tax with respect to such dividends in excess of any cash received. If a U.S. stockholder sells the stock it receives as a dividend in order to pay this tax, the sales proceeds may be less than the amount included in income with respect to the dividend, depending on the market price of our stock at the time of the sale. Furthermore, with respect to non-U.S. stockholders, we may be required to withhold U.S. tax with respect to such dividends, including in respect of all or a portion of such dividend that is payable in stock. In addition, if a significant number of our stockholders determine to sell shares of our stock in order to pay taxes owed on dividends, it may put downward pressure on the trading price of our stock.
36
Table of Contents
If we form an SBIC subsidiary, such subsidiary may be unable to make distributions to us that could be necessary for us to maintain RIC status.
In order for us to continue to qualify for RIC tax treatment and to minimize corporate-level taxes, we are required to distribute substantially all of our net taxable income and net capital gain income, including income of any SBIC subsidiary that we form. If we form an SBIC subsidiary, we expect that we would be partially dependent on the SBIC subsidiary for cash distributions to enable us to meet the RIC distribution requirements. The SBIC subsidiary may be limited by the Small Business Investment Act of 1958, and SBA regulations governing SBICs, from making certain distributions to us that may be necessary to maintain our status as a RIC. We may have to request a waiver of the SBA’s restrictions for the SBIC subsidiary to make certain distributions to maintain our RIC status. We cannot assure you that the SBA will grant such waiver and if the SBIC subsidiary is unable to obtain a waiver, compliance with the SBA regulations may result in loss of RIC tax treatment and a consequent imposition of corporate-level federal income tax on us.
Regulations governing our operation as a BDC affect our ability to, and the way in which we raise additional capital. As a BDC, the necessity of raising additional capital may expose us to risks, including the typical risks associated with leverage.
We may issue debt securities or preferred stock and/or borrow money from banks or other financial institutions, which we refer to collectively as “senior securities,” up to the maximum amount permitted by the 1940 Act. Under the provisions of the 1940 Act, we will be permitted as a BDC to issue senior securities in amounts such that our asset coverage ratio, as defined in the 1940 Act, equals at least 200% of our gross assets less all liabilities and indebtedness not represented by senior securities, after each issuance of senior securities. If the value of our assets declines, we may be unable to satisfy this test. If that happens, we may be required to sell a portion of our investments at a time when such sales may be disadvantageous to us in order to repay a portion of our indebtedness. Also, any amounts that we use to service our indebtedness would not be available for distributions to our common stockholders. If we issue senior securities, we will be exposed to typical risks associated with leverage, including an increased risk of loss.
We are not generally able to issue and sell our common stock at a price below net asset value per share. We may, however, sell our common stock, or warrants, options or rights to acquire our common stock, at a price below then-current net asset value per share of our common stock if our board of directors determines that such sale is in our best interests, and if our stockholders approve such sale. In any such case, the price at which our securities are to be issued and sold may not be less than a price that, in the determination of our board of directors, closely approximates the market value of such securities (less any distributing commission or discount). If we raise additional funds by issuing common stock or senior securities convertible into, or exchangeable for, our common stock, then the percentage ownership of our stockholders at that time will decrease, and you may experience dilution. In addition, neither Stifel nor the Cyrus Funds are subject to these restrictions and may sell their respective shares of our common stock at a per share price that is below net asset value per share, which may negatively affect the prevailing market prices for our common stock and our ability to raise additional capital.
Pending legislation may allow us to incur additional leverage.
As a BDC, under the 1940 Act we generally are not permitted to incur indebtedness unless immediately after such borrowing we have an asset coverage for total borrowings of at least 200% (i.e., the amount of debt may not exceed 50% of the value of our assets). Recent legislation introduced in the U.S. House of Representatives, if passed, would modify this section of the 1940 Act and increase the amount of debt that BDCs may incur by reducing the asset coverage percentage from 200% to 150%. As a result, we may be able to incur additional indebtedness in the future and therefore your risk of an investment in us may increase.
37
Table of Contents
Because we finance our investments with borrowed money, the potential for gain or loss on amounts invested in us is magnified and may increase the risk of investing in us.
The use of leverage magnifies the potential for gain or loss on amounts invested. The use of leverage is generally considered a speculative investment technique and increases the risks associated with investing in our securities. If we continue to use leverage to partially finance our investments through banks, insurance companies and other lenders, you will experience increased risks of investment in our common stock. Lenders of these funds have fixed dollar claims on our assets that are superior to the claims of our common stockholders, and we would expect such lenders to seek recovery against our assets in the event of a default. As of June 30, 2014, substantially all of our assets were pledged as collateral under the Financing Facility. In addition, under the terms of the Financing Facility and any borrowing facility or other debt instrument we may enter into, we are likely to be required to use the net proceeds of any investments that we sell to repay a portion of the amount borrowed under such facility or instrument before applying such net proceeds to any other uses. If the value of our assets decreases, leveraging would cause net asset value to decline more sharply than it otherwise would have had we not leveraged, thereby magnifying losses or eliminating our stake in a leveraged investment. Similarly, any decrease in our revenue or income will cause our net income to decline more sharply than it would have had we not borrowed. Such a decline would also negatively affect our ability to make distributions with respect to our common stock or preferred stock. Our ability to service any debt will depend largely on our financial performance and will be subject to prevailing economic conditions and competitive pressures. Moreover, as the base management fee payable to the Adviser will be payable based on the value of our gross assets, including those assets acquired through the use of leverage, the Adviser will have a financial incentive to incur leverage, which may not be consistent with our stockholders’ interests. In addition, our common stockholders will bear the burden of any increase in our expenses as a result of our use of leverage, including interest expenses and any increase in the base management fee payable to the Adviser.
As a BDC, we generally are required to meet a coverage ratio of total assets to total borrowings and other senior securities, which include all of our borrowings (other than potential leverage in future SBIC subsidiaries, should we receive an SBIC license, subject to exemptive relief) and any preferred stock that we may issue in the future, of at least 200%. If this ratio declines below 200%, we will not be able to incur additional debt and could be required to sell a portion of our investments to repay some debt when it is otherwise disadvantageous for us to do so. This could have a material adverse effect on our operations, and we may not be able to make distributions. The amount of leverage that we employ will depend on the Adviser’s and our board of directors’ assessment of market and other factors at the time of any proposed borrowing. We cannot assure you that we will be able to obtain credit at all or on terms acceptable to us.
Illustration. The following table illustrates the effect of leverage on returns from an investment in our common stock assuming various annual returns, net of expenses. The calculations in the table below are hypothetical and actual results may be higher or lower than those appearing below.
Assumed Return on Our Portfolio(1)
(net of expenses)
| (10.0)% | (5.0)% | 0.0% | 5.0% | 10.0% | ||||||||||||||||
| Corresponding net return to common stockholder |
(15.2 | )% | (8.3 | )% | (1.3 | )% | 5.6 | % | 12.5 | % | ||||||||||
| (1) | Assumes $308.8 million in total assets, $85.6 million in debt outstanding, $200.2 million in net assets, and an average cost of funds of 3.15%. Actual interest payments may be different. |
In addition, our debt facilities may impose financial and operating covenants that restrict our business activities, including limitations that hinder our ability to finance additional loans and investments or to make the distributions required to maintain our qualification as a RIC under the Code.
38
Table of Contents
We may default under the Financing Facility or any future borrowing facility we enter into or be unable to amend, repay or refinance any such facility on commercially reasonable terms, or at all, which could have a material adverse effect on our business, financial condition, results of operations and cash flows.
In the event we default under the Financing Facility or any other future borrowing facility, our business could be adversely affected as we may be forced to sell a portion of our investments quickly and prematurely at prices that may be disadvantageous to us in order to meet our outstanding payment obligations and/or support working capital requirements under the Financing Facility or such future borrowing facility, any of which would have a material adverse effect on our business, financial condition, results of operations and cash flows. In addition, following any such default, the agent for the lenders under the Financing Facility or such future borrowing facility could assume control of the disposition of any or all of our assets, including the selection of such assets to be disposed and the timing of such disposition, which would have a material adverse effect on our business, financial condition, results of operations and cash flows.
Provisions in the Financing Facility or any other future borrowing facility may limit our discretion in operating our business.
The Financing Facility is, and any future borrowing facility may be, backed by all or a portion of our loans and securities on which the lenders will or, in the case of a future facility, may have a security interest. We may pledge up to 100% of our assets and may grant a security interest in all of our assets under the terms of any debt instrument we enter into with lenders. We expect that any security interests we grant will be set forth in a pledge and security agreement and evidenced by the filing of financing statements by the agent for the lenders. In addition, we expect that the custodian for our securities serving as collateral for such loan would include in its electronic systems notices indicating the existence of such security interests and, following notice of occurrence of an event of default, if any, and during its continuance, will only accept transfer instructions with respect to any such securities from the lender or its designee. If we were to default under the terms of any debt instrument, the agent for the applicable lenders would be able to assume control of the timing of disposition of any or all of our assets securing such debt, which would have a material adverse effect on our business, financial condition, results of operations and cash flows.
In addition, any security interests as well as negative covenants under the Financing Facility or any other borrowing facility may limit our ability to create liens on assets to secure additional debt and may make it difficult for us to restructure or refinance indebtedness at or prior to maturity or obtain additional debt or equity financing. In addition, if our borrowing base under the Financing Facility or any other borrowing facility were to decrease, we would be required to secure additional assets in an amount equal to any borrowing base deficiency. In the event that all of our assets are secured at the time of such a borrowing base deficiency, we could be required to repay advances under the Financing Facility or any other borrowing facility or make deposits to a collection account, either of which could have a material adverse impact on our ability to fund future investments and to make stockholder distributions.
In addition, under the Financing Facility or any future borrowing facility we will be subject to limitations as to how borrowed funds may be used, which may include restrictions on geographic and industry concentrations, loan size, payment frequency and status, average life, collateral interests and investment ratings, as well as regulatory restrictions on leverage, which may affect the amount of funding that may be obtained. There may also be certain requirements relating to portfolio performance, including required minimum portfolio yield and limitations on delinquencies and charge-offs, a violation of which could limit further advances and, in some cases, result in an event of default. An event of default under the Financing Facility or any other borrowing facility could result in an accelerated maturity date for all amounts outstanding thereunder, which could have a material adverse effect on our business and financial condition. This could reduce our revenues and, by delaying any cash payment allowed to us under the Financing Facility or any other borrowing facility until the lenders have been paid in full, reduce our liquidity and cash flow and impair our ability to grow our business and maintain our qualification as a RIC.
39
Table of Contents
Because we borrow money to make our investments, if market interest rates were to increase, our cost of capital could increase, which could reduce our net investment income.
Because we borrow money to make investments, our net investment income will depend, in part, upon the difference between the rate at which we borrow funds and the rate at which we invest those funds. As a result, we can offer no assurance that a significant change in market interest rates would not have a material adverse effect on our net investment income in the event we use debt to finance our investments. In periods of rising interest rates, our cost of funds would increase, which could reduce our net investment income. We may use interest rate risk management techniques in an effort to limit our exposure to interest rate fluctuations. Such techniques may include various interest rate hedging activities to the extent permitted by the 1940 Act. There is no limit on our ability to enter derivative transactions.
In addition, a rise in the general level of interest rates typically leads to higher interest rates applicable to our debt investments. Accordingly, an increase in interest rates may result in an increase of the amount of our pre-incentive fee net investment income and, as a result, an increase in incentive fees payable to the Adviser.
We are exposed to risks associated with changes in interest rates including potential effects on our cost of capital and net investment income.
General interest rate fluctuations and changes in credit spreads on floating rate loans may have a substantial negative impact on our investments and investment opportunities and, accordingly, may have a material adverse effect on our rate of return on invested capital. In addition, an increase in interest rates would make it more expensive to use debt to finance our investments. Decreases in credit spreads on debt that pays a floating rate of return would have an impact on the income generation of our floating rate assets. Trading prices for debt that pays a fixed rate of return tend to fall as interest rates rise. Trading prices tend to fluctuate more for fixed rate securities that have longer maturities. Although we have no policy governing the maturities of our investments, under current market conditions we expect that we will invest in a portfolio of debt generally having maturities of up to 6 years. This means that we will be subject to greater risk (other things being equal) than an entity investing solely in shorter-term securities.
Uncertainty relating to the LIBOR calculation process may adversely affect the value of our portfolio of LIBOR-indexed, floating-rate debt securities.
Concerns have been publicized that some of the member banks surveyed by the British Bankers’ Association (“BBA”) in connection with the calculation of LIBOR across a range of maturities and currencies may have been under-reporting or otherwise manipulating the inter-bank lending rate applicable to them in order to profit on their derivatives positions or to avoid an appearance of capital insufficiency or adverse reputational or other consequences that may have resulted from reporting inter-bank lending rates higher than those they actually submitted. A number of BBA member banks have entered into settlements with their regulators and law enforcement agencies with respect to alleged manipulation of LIBOR, but investigations and reviews of the framework for setting of LIBOR by regulators and governmental authorities in various jurisdictions are ongoing. In this regard, the recommendation of one governmental committee undertaking such a review will result in the transfer of the administration of LIBOR to NYSE Euronext Rates Administration Limited in early 2014.
Actions by the administrator of LIBOR, regulators or law enforcement agencies may result in changes to the manner in which LIBOR is determined. Uncertainty as to the nature of such potential changes may adversely affect the market for LIBOR-based securities, including our portfolio of LIBOR-indexed, floating-rate debt securities. In addition, any further changes or reforms to the determination or supervision of LIBOR may result in a sudden or prolonged increase or decrease in reported LIBOR, which could have an adverse impact on the market for LIBOR-based securities or the value of our portfolio of LIBOR-indexed, floating-rate debt securities.
40
Table of Contents
If we do not invest a sufficient portion of our assets in qualifying assets, we could fail to qualify as a BDC or be precluded from investing according to our current business strategy.
As a BDC, we may not acquire any assets other than “qualifying assets” unless, at the time of and after giving effect to such acquisition, at least 70% of our total assets are qualifying assets.
We believe that most of the investments that we may acquire in the future will constitute qualifying assets. However, we may be precluded from investing in what we believe to be attractive investments if such investments are not qualifying assets for purposes of the 1940 Act. If we do not invest a sufficient portion of our assets in qualifying assets, we could violate the 1940 Act provisions applicable to BDCs. As a result of such violation, specific rules under the 1940 Act could prevent us, for example, from making follow-on investments in existing portfolio companies (which could result in the dilution of our position) or could require us to dispose of investments at inappropriate times in order to come into compliance with the 1940 Act. If we need to dispose of such investments quickly, it could be difficult to dispose of such investments on favorable terms. We may not be able to find a buyer for such investments and, even if we do find a buyer, we may have to sell the investments at a substantial loss. Any such outcomes would have a material adverse effect on our business, financial condition, results of operations and cash flows.
If we do not maintain our status as a BDC, we would be subject to regulation as a registered closed-end investment company under the 1940 Act. As a registered closed-end investment company, we would be subject to substantially more regulatory restrictions under the 1940 Act, which would significantly decrease our operating flexibility.
Most of our portfolio investments are recorded at fair value as determined in good faith by our board of directors and, as a result, there may be uncertainty as to the value of our portfolio investments.
Most of our portfolio investments will take the form of securities that are not publicly traded. The fair value of loans, securities and other investments that are not publicly traded may not be readily determinable, and we will value these investments at fair value as determined in good faith by our board of directors, including to reflect significant events affecting the value of our investments. Most, if not all, of our investments (other than cash and cash equivalents) will be classified as Level 3 under the Financial Accountant Standards Board (“FASB”) Accounting Standards Codification Topic 820: Fair Value Measurements and Disclosures (“ASC 820”). This means that our portfolio valuations will be based on unobservable inputs and our own assumptions about how market participants would price the asset or liability in question. Inputs into the determination of fair value of our portfolio investments require significant management judgment or estimation. Even if observable market data are available, such information may be the result of consensus pricing information or broker quotes, which include a disclaimer that the broker would not be held to such a price in an actual transaction. The non-binding nature of consensus pricing and/or quotes accompanied by disclaimers materially reduces the reliability of such information. We have retained the services of independent service providers to review the valuation of these loans and securities. The types of factors that the board of directors may take into account in determining the fair value of our investments generally include, as appropriate, comparison to publicly traded securities including such factors as yield, maturity and measures of credit quality, the enterprise value of a portfolio company, the nature and realizable value of any collateral, the portfolio company’s ability to make payments and its earnings and discounted cash flow, the markets in which the portfolio company does business and other relevant factors. Because such valuations, and particularly valuations of private securities and private companies, are inherently uncertain, may fluctuate over short periods of time and may be based on estimates, our determinations of fair value may differ materially from the values that would have been used if a ready market for these loans and securities existed. Our net asset value could be adversely affected if our determinations regarding the fair value of our investments were materially higher than the values that we ultimately realize upon the disposal of such loans and securities.
We adjust quarterly the valuation of our portfolio to reflect our board of directors’ determination of the fair value of each investment in our portfolio. Any changes in fair value are recorded in our statement of operations as net change in unrealized appreciation or depreciation.
41
Table of Contents
We may experience fluctuations in our quarterly operating results.
We could experience fluctuations in our quarterly operating results due to a number of factors, including the interest rate payable on the loans and debt securities we acquire, the default rate on such loans and securities, the level of our expenses, variations in and the timing of the recognition of realized and unrealized gains or losses, the degree to which we encounter competition in our markets and general economic conditions. In light of these factors, results for any period should not be relied upon as being indicative of performance in future periods.
We are an “emerging growth company” under the JOBS Act, and we cannot be certain if the reduced disclosure requirements applicable to emerging growth companies will make our common stock less attractive to investors.
We are and we will remain an “emerging growth company” as defined in the JOBS Act until the earlier of (a) the last day of the fiscal year (i) following the fifth anniversary of the completion of our initial public offering, (ii) in which we have total annual gross revenue of at least $1.0 billion, or (iii) in which we are deemed to be a large accelerated filer, which means the market value of our common stock that is held by non-affiliates exceeds $700 million as of the prior June 30th, and (b) the date on which we have issued more than $1.0 billion in non-convertible debt during the prior three-year period. For so long as we remain an “emerging growth company” we may take advantage of certain exemptions from various reporting requirements that are applicable to other public companies that are not “emerging growth companies” including, but not limited to, not being required to comply with the auditor attestation requirements of Section 404 of the Sarbanes-Oxley Act. We cannot predict if investors will find our common stock less attractive because we will rely on some or all of these exemptions. If some investors find our common stock less attractive as a result, there may be a less active trading market for our common stock and our stock price may be more volatile.
In addition, Section 107 of the JOBS Act also provides that an “emerging growth company” can take advantage of the extended transition period provided in Section 7(a)(2)(B) of the Securities Act of 1933, as amended (the “Securities Act”) for complying with new or revised accounting standards. In other words, an “emerging growth company” can delay the adoption of certain accounting standards until those standards would otherwise apply to private companies. We will take advantage of the extended transition period for complying with new or revised accounting standards, which may make it more difficult for investors and securities analysts to evaluate us since our financial statements may not be comparable to companies that comply with public company effective dates and may result in less investor confidence.
If we fail to maintain an effective system of internal control over financial reporting, we may not be able to accurately report our financial results or prevent fraud. As a result, stockholders could lose confidence in our financial and other public reporting, which would harm our business and the trading price of our common stock.
Effective internal controls over financial reporting are necessary for us to provide reliable financial reports and, together with adequate disclosure controls and procedures, are designed to prevent fraud. Any failure to implement required new or improved controls, or difficulties encountered in their implementation could cause us to fail to meet our reporting obligations. In addition, any testing by us conducted in connection with Section 404 of the Sarbanes-Oxley Act, or the subsequent testing by our independent registered public accounting firm (when undertaken, as noted below), may reveal deficiencies in our internal controls over financial reporting that are deemed to be material weaknesses or that may require prospective or retroactive changes to our consolidated financial statements or identify other areas for further attention or improvement. Inferior internal controls could also cause investors to lose confidence in our reported financial information, which could have a negative effect on the trading price of our common stock.
We are required to disclose changes made in our internal control and procedures on a quarterly basis and our management is required to assess the effectiveness of these controls annually. However, for as long as we are an
42
Table of Contents
“emerging growth company” under the recently enacted JOBS Act, our independent registered public accounting firm will not be required to attest to the effectiveness of our internal control over financial reporting pursuant to Section 404. We could be an emerging growth company for up to five years. An independent assessment of the effectiveness of our internal controls could detect problems that our management’s assessment might not. Undetected material weaknesses in our internal controls could lead to financial statement restatements and require us to incur the expense of remediation.
Our status as an “emerging growth company” under the JOBS Act may make it more difficult to raise capital as and when we need it.
Because of the exemptions from various reporting requirements provided to us as an “emerging growth company” and because we will have an extended transition period for complying with new or revised financial accounting standards, we may be less attractive to investors and it may be difficult for us to raise additional capital as and when we need it. Investors may be unable to compare our business with other companies in our industry if they believe that our financial accounting is not as transparent as other companies in our industry. If we are unable to raise additional capital as and when we need it, our financial condition and results of operations may be materially and adversely affected.
New or amended laws or regulations governing our operations may adversely affect our business.
We and our portfolio companies will be subject to regulation by laws at the U.S. federal, state and local levels. These laws and regulations, as well as their interpretation, may change from time to time, and new laws, regulations and interpretations may also come into effect. Any such new or changed laws or regulations could have a material adverse effect on our business.
Additionally, changes to the laws and regulations governing our operations related to permitted investments may cause us to alter our investment strategy in order to avail ourselves of new or different opportunities. Such changes could result in material differences to the strategies and plans set forth in this annual report on Form 10-K and our filings with the SEC, and may shift our investment focus from the areas of expertise of the Adviser to other types of investments in which the Adviser may have little or no expertise or experience. Any such changes, if they occur, could have a material adverse effect on our results of operations and the value of your investment.
Our board of directors may change our investment objective, operating policies and strategies without prior notice or stockholder approval.
Our board of directors has the authority, except as otherwise provided in the 1940 Act, to modify or waive our investment objective or certain of our operating policies and strategies without prior notice and without stockholder approval. However, absent stockholder approval, we may not change the nature of our business so as to cease to be, or withdraw our election as, a BDC. We cannot predict the effect any changes to our current operating policies and strategies would have on our business, operating results and the market price of our common stock. Nevertheless, any such changes could adversely affect our business and impair our ability to make distributions to our stockholders.
If we receive qualification from the SBA to be licensed as an SBIC but we are unable to comply with SBA regulations thereafter, our business plan and investment objective could be adversely affected.
We intend to apply for license to form an SBIC subsidiary. The application is subject to SBA approval and we can make no assurances that the SBA will approve our application. If we receive this qualification, we will become subject to SBA regulations that may constrain our activities. We may need to make allowances in our investment activity to comply with SBA regulations. In addition, SBA regulations may impose parameters on our business operations and investment objectives that are different from those we otherwise would have if we were not subject to these regulations. Failure to comply with the SBA regulations could result in the loss of the SBIC
43
Table of Contents
license and the resulting inability to participate in the SBA-sponsored debenture program. The SBA also limits the maximum amount that may be borrowed by any single SBIC. The SBA also prohibits, without prior SBA approval, a “change of control” of an SBIC or transfers that would result in any person (or a group of persons acting in concert) owning 10% or more of a class of capital stock of a licensed SBIC. A “change of control” is any event that would result in the transfer of the power, direct or indirect, to direct the management and policies of an SBIC, whether through ownership, contractual arrangements or otherwise. To the extent that we obtain an SBIC license, this would prohibit a change of control of our SBIC subsidiary without prior SBA approval. If we are unable to comply with SBA regulations, our business plan and growth strategy could be materially adversely affected.
The Adviser can resign as the Adviser or administrator upon 60 days’ notice and we may not be able to find a suitable replacement within that time, or at all, resulting in a disruption in our operations that could adversely affect our financial condition, business and results of operations.
The Adviser has the right under the Investment Advisory Agreement to resign as the Adviser at any time upon not less than 60 days’ written notice, whether we have found a replacement or not. Similarly, the Adviser has the right under the Administration Agreement to resign at any time upon not less than 60 days’ written notice, whether we have found a replacement or not. If the Adviser were to resign, we may not be able to find a new investment adviser or administrator or hire internal management with similar expertise and ability to provide the same or equivalent services on acceptable terms within 60 days, or at all. If we are unable to do so quickly, our operations are likely to experience a disruption, our financial condition, business and results of operations as well as our ability to pay distributions to our stockholders are likely to be adversely affected and the market price of our shares may decline. In addition, the coordination of our internal management and investment or administrative activities, as applicable, is likely to suffer if we are unable to identify and reach an agreement with a single institution or group of executives having the expertise possessed by the Adviser. Even if we are able to retain comparable management, whether internal or external, the integration of such management and their lack of familiarity with our investment objective may result in additional costs and time delays that may adversely affect our business, financial condition, results of operations and cash flows.
Cyrus Capital can terminate the Services Agreement with the Adviser under certain conditions and we may not be able to find suitable replacement resources, resulting in a disruption in our operations that could adversely affect our financial condition, business and results of operations.
Our Services Agreement with Cyrus Capital is subject to an initial five-year period. However, Cyrus Capital may terminate the Services Agreement under certain circumstances prior to the expiration of its fifth anniversary whether we have found a replacement for the resources under the agreement or not. If Cyrus Capital were to terminate the Services Agreement, we may not be able to hire internal investment professionals with similar expertise and ability to provide the same or equivalent services on acceptable terms. If we are unable to do so quickly, our operations are likely to experience a disruption, our financial condition, business and results of operations as well as our ability to pay distributions to our stockholders are likely to be adversely affected and the market price of our shares may decline. In addition, the coordination of our internal management and investment or administrative activities, as applicable, is likely to suffer if we are unable to identify and reach an agreement with a single institution or group of executives having the expertise possessed by the investment professionals of Cyrus Capital. Even if we are able to retain comparable professionals, whether internal or external, the integration of such investment professionals and their lack of familiarity with our investment objective may result in additional costs and time delays that may adversely affect our business, financial condition, results of operations and cash flows.
44
Table of Contents
We are highly dependent on information systems, and systems failures could significantly disrupt our business, which may, in turn, negatively affect the market price of our common stock and our ability to make distributions to our stockholders.
Our business is highly dependent on the communications and information systems of the Adviser, which are provided to the Adviser by Cyrus Capital pursuant to the Services Agreement directly or through third party service providers. Any failure or interruption of such systems, including as a result of the termination of the Services Agreement or an agreement with any such third party service provider, could cause delays or other problems in our activities. This, in turn, could have a material adverse effect on our operating results and negatively affect the market price of our common stock and our ability to make distributions to our stockholders.
Adverse market conditions for debt and equity capital markets in the United States and around the world could limit the availability of debt capital to us on favorable terms, or at all, which could negatively affect our financial performance and results.
From 2007 through 2009, the global capital markets experienced a period of disruption resulting in increasing spreads between the yields realized on riskier debt securities and those realized on risk-free securities and a lack of liquidity in parts of the debt capital markets, significant write-offs in the financial services sector relating to subprime mortgages and the re-pricing of credit risk in the broadly syndicated market. These events, along with the deterioration of the housing market, illiquid market conditions, declining business and consumer confidence and the failure of major financial institutions in the United States, led to a decline of general economic conditions. As a result, many commercial banks and other financial institutions stopped lending or significantly curtailed their lending activity. In addition, in an effort to stem losses and reduce their exposure to segments of the economy deemed to be high risk, some financial institutions limited refinancing and loan modification transactions and reviewed the terms of existing facilities to identify bases for accelerating the maturity of existing lending facilities. This economic decline materially and adversely affected the broader financial and credit markets and reduced the availability of debt and equity capital for the market as a whole and to financial firms in particular during that time.
These conditions may recur, in which case, to the extent that we wish to use debt to fund our investments, the debt capital that will be available to us, if at all, may be at a higher cost, and on terms and conditions that may be less favorable, than what we expect, which could negatively affect our financial performance and results. In addition, if these conditions recur, it may be difficult for us to enter into a new borrowing facility, obtain other financing to finance the growth of our investments, or refinance any outstanding indebtedness on acceptable economic terms, or at all. A prolonged period of market illiquidity may cause us to reduce the volume of loans and debt securities we originate and/or fund and adversely affect the value of our portfolio investments, which could have a material and adverse effect on our business, financial condition, results of operations and cash flows.
Our board of directors is authorized to reclassify any unissued shares of common stock into one or more classes of preferred stock, which could convey special rights and privileges to its owners.
Under Maryland General Corporation Law and our charter, our board of directors is authorized to classify and reclassify any authorized but unissued shares of stock into one or more classes of stock, including preferred stock. Prior to issuance of shares of each class or series, the board of directors will be required by Maryland law and our charter to set the terms, preferences, conversion or other rights, voting powers, restrictions, limitations as to stockholder distributions, qualifications and terms or conditions of redemption for each class or series. Thus, the board of directors could authorize the issuance of shares of preferred stock with terms and conditions that could have the effect of delaying, deferring or preventing a transaction or a change in control that might involve a premium price for holders of our common stock or that otherwise might be in their best interest. The cost of any such reclassification would be borne by our common stockholders. The issuance of preferred shares convertible into shares of common stock may also reduce the net income and net asset value per share of our common stock
45
Table of Contents
upon conversion, provided, that we will only be permitted to issue such convertible preferred stock to the extent we comply with the requirements of Section 61 of the 1940 Act, including obtaining common stockholder approval. These effects, among others, could have an adverse effect on your investment in our common stock. Certain matters under the 1940 Act require the separate vote of the holders of any issued and outstanding preferred stock. For example, the 1940 Act provides that holders of preferred stock are entitled to vote separately from holders of common stock to elect two preferred stock directors. We currently have no plans to issue preferred stock.
Provisions of the Maryland General Corporation Law and of our charter and bylaws could deter takeover attempts and have an adverse impact on the price of our common stock.
Our board of directors is divided into three classes of directors serving staggered terms. A classified board may render a change in control of us or removal of our incumbent management more difficult. The Maryland General Corporation Law and our charter and bylaws contain additional provisions that may discourage, delay or make more difficult a change in control of CM Finance Inc or the removal of our directors. We are subject to the Maryland Business Combination Act, subject to any applicable requirements of the 1940 Act. Our board of directors has adopted a resolution exempting from the Business Combination Act any business combination between us and any other person, subject to prior approval of such business combination by our board of directors, including approval by a majority of our independent directors. If the resolution exempting business combinations is repealed or our board of directors does not approve a business combination, the Business Combination Act may discourage third parties from trying to acquire control of us and increase the difficulty of consummating such an offer. Our bylaws exempt from the Maryland Control Share Acquisition Act acquisitions of our stock by any person. If we amend our bylaws to repeal the exemption from the Control Share Acquisition Act, the Control Share Acquisition Act also may make it more difficult for a third party to obtain control of us and increase the difficulty of consummating such a transaction.
We have also adopted measures that may make it difficult for a third party to obtain control of us, including provisions of our charter classifying our board of directors in three classes serving staggered three-year terms, and authorizing our board of directors to classify or reclassify shares of our stock in one or more classes or series, to cause the issuance of additional shares of our stock, to amend our charter without stockholder approval and to increase or decrease the number of shares of stock that we have authority to issue. These provisions, as well as other provisions of our charter and bylaws, may delay, defer or prevent a transaction or a change in control that might otherwise be in the best interests of our stockholders.
Risks Relating to our Investments
Economic recessions or downturns could adversely affect our portfolio companies, leading to defaults on our investments, which would harm our operating results.
Many of the portfolio companies in which we expect to make investments, including those currently included in our initial portfolio, are likely to be susceptible to economic slowdowns or recessions and may be unable to repay our loans during such periods. In such event, the number of our non-performing assets is likely to increase and the value of our portfolio is likely to decrease during such periods. Adverse economic conditions may decrease the value of collateral securing some of our loans and debt securities and the value of our equity investments. Economic slowdowns or recessions could lead to financial losses in our portfolio and a decrease in revenues, net income and assets. Unfavorable economic conditions also could increase our funding costs, limit our access to the capital markets or result in a decision by lenders not to extend credit to us. These events could prevent us from increasing our investments and harm our operating results.
A portfolio company’s failure to satisfy financial or operating covenants imposed by us or other lenders could lead to defaults and, potentially, termination of its loans and foreclosure on its assets, which could trigger cross-defaults under other agreements and jeopardize our portfolio company’s ability to meet its obligations
46
Table of Contents
under the loans and debt securities that we hold. We may incur expenses to the extent necessary to seek recovery upon default or to negotiate new terms with a defaulting portfolio company.
We may hold the loans and debt securities of leveraged companies that may, due to the significant operating volatility typical of such companies, enter into bankruptcy proceedings, and we could lose all or part of our investment, which would harm our operating results.
Investment in leveraged companies involves a number of significant risks. Leveraged companies in which we invest may have limited financial resources and may be unable to meet their obligations under their loans and debt securities that we hold. Such developments may be accompanied by a deterioration in the value of any collateral and a reduction in the likelihood of our realizing any guarantees that we may have obtained in connection with our investment. Smaller leveraged companies also may have less predictable operating results and may require substantial additional capital to support their operations, finance their expansion or maintain their competitive position.
Leveraged companies may also experience bankruptcy or similar financial distress. The bankruptcy process has a number of significant inherent risks. Many events in a bankruptcy proceeding are the product of contested matters and adversarial proceedings and are beyond the control of the creditors. A bankruptcy filing by a portfolio company may adversely and permanently affect that company. If the proceeding is converted to a liquidation, the value of the portfolio company may not equal the liquidation value that was believed to exist at the time of the investment. The duration of a bankruptcy proceeding is also difficult to predict, and a creditor’s return on investment can be adversely affected by delays until the plan of reorganization or liquidation ultimately becomes effective. The administrative costs in connection with a bankruptcy proceeding are frequently high and would be paid out of the debtor’s estate prior to any return to creditors. Because the standards for classification of claims under bankruptcy law are vague, our influence with respect to the class of securities or other obligations we own may be lost by increases in the number and amount of claims in the same class or by different classification and treatment. In the early stages of the bankruptcy process, it is often difficult to estimate the extent of, or even to identify, any contingent claims that might be made. In addition, certain claims that have priority by law (for example, claims for taxes) may be substantial.
A portfolio company’s failure to satisfy financial or operating covenants imposed by us or other lenders could lead to defaults and, potentially, termination of its loans and foreclosure on its assets. This could trigger cross-defaults under other agreements and jeopardize such portfolio company’s ability to meet its obligations under the loans or debt or equity securities that we hold. We may incur expenses to the extent necessary to seek recovery upon default or to negotiate new terms, which may include the waiver of certain financial covenants, with a defaulting portfolio company.
Credit risk is the potential loss we may incur from a failure of a company to make payments according to the terms of a contract. We are subject to credit risk because of our strategy of investing in the debt of leveraged companies and our involvement in derivative instruments. Our exposure to credit risk on our investments is limited to the fair value of the investments. Our derivative contracts are executed pursuant to an International Swaps and Derivatives Association master agreement that we currently have in place with UBS with respect to the Financing Facility. Any material exposure due to counter-party risk under the Financing Facility could have a material adverse effect on our operating results.
There may be circumstances where our debt investments could be subordinated to claims of other creditors or we could be subject to lender liability claims.
If one of our portfolio companies were to go bankrupt, even though we may have structured our interest as senior debt, depending on the facts and circumstances, including the extent to which we may have actually provided managerial assistance to that portfolio company, a bankruptcy court might re-characterize our debt holding and subordinate all or a portion of our claim to that of other creditors. In addition, lenders can be subject
47
Table of Contents
to lender liability claims for actions taken by them where they become too involved in the borrower’s business or exercise control over the borrower. It is possible that we could become subject to a lender’s liability claim, including as a result of actions taken if we actually render significant managerial assistance.
Our investments in private and middle-market portfolio companies are risky, and we could lose all or part of our investment.
Investment in private and middle-market companies involves a number of significant risks. Generally, little public information exists about these companies, and we will rely on the ability of the Adviser’s investment professionals to obtain adequate information to evaluate the potential returns and risks from investing in these companies. If we are unable to uncover all material information about these companies, we may not make a fully informed investment decision, and we may lose money on our investments. Middle-market companies may have limited financial resources and may be unable to meet their obligations under their loans and debt securities that we hold, which may be accompanied by a deterioration in the value of any collateral and a reduction in the likelihood of our realizing any guarantees we may have obtained in connection with our investment. In addition, such companies typically have shorter operating histories, narrower product lines and smaller market shares than larger businesses, which tend to render them more vulnerable to competitors’ actions and market conditions, as well as general economic downturns. Additionally, middle-market companies are more likely to depend on the management talents and efforts of a small group of persons. Therefore, the death, disability, resignation or termination of one or more of these persons could have a material adverse impact on one or more of the portfolio companies we invest in and, in turn, on us. Middle-market companies also may be parties to litigation and may be engaged in rapidly changing businesses with products subject to a substantial risk of obsolescence. In addition, our executive officers, directors and investment adviser may, in the ordinary course of business, be named as defendants in litigation arising from our investments in portfolio companies.
We may expose ourselves to risks if we engage in hedging transactions.
If we engage in hedging transactions, we may expose ourselves to risks associated with such transactions. We may utilize instruments such as forward contracts, currency options and interest rate swaps, caps, collars and floors to seek to hedge against fluctuations in the relative values of our portfolio positions from changes in currency exchange rates and market interest rates. Hedging against a decline in the values of our portfolio positions does not eliminate the possibility of fluctuations in the values of such positions or prevent losses if the values of such positions decline. However, such hedging can establish other positions designed to gain from those same developments, thereby offsetting the decline in the value of such portfolio positions. Such hedging transactions may also limit the opportunity for gain if the values of the underlying portfolio positions should increase. Moreover, it may not be possible to hedge against an exchange rate or interest rate fluctuation that is so generally anticipated that we are not able to enter into a hedging transaction at an acceptable price.
The success of our hedging transactions will depend on our ability to correctly predict movements in currencies and interest rates. Therefore, while we may enter into such transactions to seek to reduce currency exchange rate and interest rate risks, unanticipated changes in currency exchange rates or interest rates may result in poorer overall investment performance than if we had not engaged in any such hedging transactions. In addition, the degree of correlation between price movements of the instruments used in a hedging strategy and price movements in the portfolio positions being hedged may vary. Moreover, for a variety of reasons, we may not seek to establish a perfect correlation between such hedging instruments and the portfolio holdings being hedged. Any such imperfect correlation may prevent us from achieving the intended hedge and expose us to risk of loss. In addition, it may not be possible to hedge fully or perfectly against currency fluctuations affecting the value of securities denominated in non-U.S. currencies because the value of those securities is likely to fluctuate as a result of factors not related to currency fluctuations.
48
Table of Contents
The lack of liquidity in our investments may adversely affect our business.
All of our assets may be invested in illiquid loans and securities, and a substantial portion of our investments in leveraged companies will be subject to legal and other restrictions on resale or will otherwise be less liquid than more broadly traded public securities. The illiquidity of these investments may make it difficult for us to sell such investments if the need arises. In addition, if we are required to liquidate all or a portion of our portfolio quickly, we may realize significantly less than the value at which we have previously recorded our investments. Also, as noted above, we may be limited or prohibited in our ability to sell or otherwise exit certain positions in our initial portfolio as such a transaction could be considered a joint transaction prohibited by the 1940 Act.
Price declines and illiquidity in the corporate debt markets may adversely affect the fair value of our portfolio investments, reducing our net asset value through increased net unrealized depreciation.
As a BDC, we are required to carry our investments at market value or, if no market value is ascertainable, at fair value as determined in good faith by our board of directors. As part of the valuation process, we may take into account the following types of factors, if relevant, in determining the fair value of our investments:
| • | available current market data, including relevant and applicable market trading and transaction comparables; |
| • | applicable market yields and multiples; |
| • | security covenants; |
| • | call protection provisions; |
| • | information rights; |
| • | the nature and realizable value of any collateral; |
| • | the portfolio company’s ability to make payments, its earnings and discounted cash flows and the markets in which it does business; |
| • | comparisons of financial ratios of peer companies that are public; |
| • | comparable merger and acquisition transactions; and |
| • | principal market and enterprise values. |
When an external event such as a purchase transaction, public offering or subsequent equity sale occurs, we use the pricing indicated by the external event to corroborate our valuation. We record decreases in the market values or fair values of our investments as unrealized depreciation. Declines in prices and liquidity in the corporate debt markets may result in significant net unrealized depreciation in our portfolio. The effect of all of these factors on our portfolio may reduce our net asset value by increasing net unrealized depreciation in our portfolio. Depending on market conditions, we could incur substantial realized losses and may suffer additional unrealized losses in future periods, which could have a material adverse effect on our business, financial condition, results of operations and cash flows.
We are a non-diversified investment company within the meaning of the 1940 Act, and therefore we are not limited with respect to the proportion of our assets that may be invested in securities of a single issuer.
We are classified as a non-diversified investment company within the meaning of the 1940 Act, which means that we are not limited by the 1940 Act with respect to the proportion of our assets that we may invest in securities of a single issuer. Beyond the asset diversification requirements associated with our qualification as a RIC under the Code, we do not have fixed guidelines for diversification. To the extent that we assume large positions in the securities of a small number of issuers or our investments are concentrated in relatively few
49
Table of Contents
industries, our net asset value may fluctuate to a greater extent than that of a diversified investment company as a result of changes in the financial condition or the market’s assessment of the issuer. We may also be more susceptible to any single economic or regulatory occurrence than a diversified investment company.
Our portfolio may be concentrated in a limited number of industries, which may subject us to a risk of significant loss if there is a downturn in a particular industry in which a number of our investments are concentrated.
Our portfolio may be concentrated in a limited number of industries. A downturn in any particular industry in which we are invested could significantly impact the aggregate returns we realize.
As of June 30, 2014, our investments in the oil and gas industry (including oilfield services) represented approximately 19.5% of the fair value of our portfolio, our investments in the telecommunications industry represented approximately 19.4% of the fair value of our portfolio, and our investments in the healthcare-products/services industry represented approximately 17.8% of the fair value of our portfolio. If an industry in which we have significant investments suffers from adverse business or economic conditions, as these industries have to varying degrees, a material portion of our investment portfolio could be affected adversely, which, in turn, could adversely affect our financial position and results of operations.
Our investments in the oil and gas industry face considerable uncertainties including substantial regulatory challenges.
Our investments in portfolio companies that operate in the oil and gas and oilfield industries represent approximately 19.5% of our total portfolio as of June 30, 2014. The revenues, income (or losses) and valuations of oil and gas companies can fluctuate suddenly and dramatically due to any one or more of the following factors:
Commodity Pricing Risk. In general, commodity prices directly affect oil and gas companies, especially for those who own the underlying commodity. In addition, the volatility of commodity prices can affect other oil and gas companies due to the impact of prices on the volume of commodities produced, transported, processed, stored or distributed and on the cost of fuel for power generation companies. The volatility of commodity prices can also affect oil and gas companies’ ability to access the capital markets in light of market perception that their performance may be directly tied to commodity prices. Historically, energy commodity prices have been cyclical and exhibited significant volatility.
Regulatory Risk. Changes in the regulatory environment could adversely affect the profitability of oil and gas companies. Federal, state and local governments heavily regulate the businesses of oil and gas companies in diverse matters, such as the way in which assets are constructed, maintained and operated and the prices oil and gas companies may charge for their products and services. Such regulation can change over time in scope and intensity.
Production Risk. The volume of crude oil, natural gas or other energy commodities available for producing, transporting, processing, storing, distributing or generating power may materially impact the profitability of energy companies. A significant decrease in the production of natural gas, crude oil, coal or other energy commodities, due to the decline of production from existing facilities, import supply disruption, depressed commodity prices, political events, OPEC actions or otherwise, could reduce revenue and operating income or increase operating costs of energy companies and, therefore, their ability to pay debt or dividends.
Demand Risk. A sustained decline in demand for crude oil, natural gas and refined petroleum products could materially affect revenues and cash flows of energy companies. Factors that could lead to a decrease in market demand include a recession or other adverse economic conditions, increases in the market price of the underlying commodity, higher taxes or other regulatory actions that increase costs, or shifts in consumer demand for such products.
50
Table of Contents
Depletion and Exploration Risk. Oil and gas companies’ commodities naturally deplete over time. Depletion could have a material adverse impact on such company’s ability to maintain its revenue. Further, estimates of reserves may not be accurate and, even if accurate, reserves may not be produced profitably. In addition, exploration of energy resources, especially of oil and natural gas, is inherently risky and requires large amounts of capital.
Weather Risk. Unseasonable extreme weather patterns could result in significant volatility in demand for energy and power or may directly affect the operations of individual companies. This weather-related risk may create fluctuations in earnings of energy companies.
Operational Risk. Oil and gas companies are subject to various operational risks, such as failed drilling or well development, unscheduled outages, underestimated cost projections, unanticipated operation and maintenance expenses, failure to obtain the necessary permits to operate and failure of third-party contractors to perform their contractual obligations. In
Competition Risk. The oil and gas companies in which we may invest will face substantial competition in acquiring properties, enhancing and developing their assets, marketing their commodities, securing trained personnel and operating their properties. Many of their competitors may have financial and other resources that substantially exceed their resources.
Valuation Risk. The valuation of our holdings in oil and gas portfolio companies is subject to uncertainties inherent in estimating quantities of reserves of oil, natural gas and coal and in projecting future rates of production and the timing of development expenditures, which are dependent upon many factors beyond our control. The estimates rely on various assumptions, including, for example, commodity prices, operating expenses, capital expenditures and the availability of funds, and are therefore inherently imprecise indications of future net cash flows. Actual future production, cash flows, taxes, operating expenses, development expenditures and quantities of recoverable reserves may vary substantially from those assumed in the estimates. Any significant variance in these assumptions could materially affect the value of our investments in oil and gas companies.
Climate Change. There may be evidence of global climate change. Climate change creates physical and financial risk and some of our portfolio companies may be adversely affected by climate change. For example, the needs of customers of oil and gas companies vary with weather conditions, primarily temperature and humidity. To the extent climate changes affect weather conditions, energy use could increase or decrease depending on the duration and magnitude of any changes. Increased oil and gas use due to weather changes may require additional investments by our portfolio companies in more pipelines and other infrastructure to serve increased demand. A decrease in oil and gas use due to weather changes may affect our portfolio companies’ financial condition through decreased revenues. Extreme weather conditions in general require more system backup, adding to costs, and can contribute to increased system stresses, including service interruptions. Potential lawsuits against or taxes or other regulatory costs imposed on greenhouse gas emitters could also affect oil and gas companies, based on links drawn between greenhouse gas emissions and climate change.
Our investments in the healthcare industry face considerable uncertainties including substantial regulatory challenges.
Our investments in portfolio companies that operate in the healthcare industry represent approximately 17.8% of our total portfolio as of June 30, 2014. Our investments in the healthcare sector are subject to substantial risks. The laws and rules governing the business of healthcare companies and interpretations of those laws and rules are subject to frequent change. Broad latitude is given to the agencies administering those regulations. Existing or future laws and rules could force our portfolio companies engaged in healthcare to change how they do business, restrict revenue, increase costs, change reserve levels and change business practices.
51
Table of Contents
Healthcare companies often must obtain and maintain regulatory approvals to market many of their products, change prices for certain regulated products and consummate some of their acquisitions and divestitures. Delays in obtaining or failing to obtain or maintain these approvals could reduce revenue or increase costs. Policy changes on the local, state and federal level, such as the expansion of the government’s role in the healthcare arena and alternative assessments and tax increases specific to the healthcare industry or healthcare products as part of federal health care reform initiatives, could fundamentally change the dynamics of the healthcare industry.
Our investments in the telecommunications industry face considerable uncertainties including substantial regulatory challenges.
Our investments in portfolio companies that operate in the telecommunications industry represent approximately 19.4% of our total portfolio as of June 30, 2014. Portfolio companies in the telecommunications sector are subject to many risks, including the negative impact of regulation, a competitive marketplace, difficulty in obtaining financing, rapid obsolescence, and agreements linking future rate increases to inflation or other factors not directly related to the active operating profits of the portfolio company. Adverse economic, business, or regulatory developments affecting the telecommunications sector could have a negative impact on the value of our investments in portfolio companies operating in this industry, and therefore could negatively impact our business and results of operations.
Our failure to make follow-on investments in our portfolio companies could impair the value of our portfolio.
Following an initial investment in a portfolio company, we may make additional investments in that portfolio company as “follow-on” investments, including exercising warrants, options or convertible securities that were acquired in the original or subsequent financing; in seeking to:
| • | increase or maintain in whole or in part our position as a creditor or our equity ownership percentage in a portfolio company; |
| • | preserve or enhance the value of our investment. |
We have discretion to make follow-on investments, subject to the availability of capital resources. Failure on our part to make follow-on investments may, in some circumstances, jeopardize the continued viability of a portfolio company and our initial investment, or may result in a missed opportunity for us to increase our participation in a successful operation. Even if we have sufficient capital to make a desired follow-on investment, we may elect not to make a follow-on investment because we may not want to increase our level of risk, because we prefer other opportunities or because we are inhibited by compliance with BDC requirements of the 1940 Act or the desire to maintain our qualification as a RIC.
Because we generally do not hold controlling equity interests in our portfolio companies, we may not be able to exercise control over our portfolio companies or to prevent decisions by management of our portfolio companies that could decrease the value of our investments.
We do not hold controlling equity positions in any of the portfolio companies included in our portfolio and, although we may do so in the future, we do not currently intend to hold controlling equity positions in our portfolio companies. As a result, we will be subject to the risk that a portfolio company may make business decisions with which we disagree, and that the management and/or stockholders of a portfolio company may take risks or otherwise act in ways that are adverse to our interests. Due to the lack of liquidity of the debt and equity investments that we expect to hold in our portfolio companies, we may not be able to dispose of our investments in the event we disagree with the actions of a portfolio company and may therefore suffer a decrease in the value of our investments.
52
Table of Contents
Prepayments of our debt investments by our portfolio companies could adversely impact our results of operations and ability to make stockholder distributions and result in a decline in the market price of our shares.
We are subject to the risk that the debt investments we make in our portfolio companies may be repaid prior to maturity. We expect that our investments will generally allow for repayment at any time subject to certain penalties. When this occurs, we intend to generally reinvest these proceeds in temporary investments, pending their future investment in accordance with our investment strategy. These temporary investments will typically have substantially lower yields than the debt being prepaid, and we could experience significant delays in reinvesting these amounts. Any future investment may also be at lower yields than the debt that was repaid. As a result, our results of operations could be materially adversely affected if one or more of our portfolio companies elects to prepay amounts owed to us. Additionally, prepayments could negatively impact our ability to make, or the amount of, stockholder distributions with respect to our common stock, which could result in a decline in the market price of our shares.
Our portfolio companies may incur debt that ranks equally with, or senior to, our investments in such companies.
We intend to invest a portion of our capital in second lien and subordinated loans issued by our portfolio companies. The portfolio companies usually have, or may be permitted to incur, other debt that ranks equally with, or senior to, the loans in which we invest. By their terms, such debt instruments may provide that the holders are entitled to receive payment of interest or principal on or before the dates on which we are entitled to receive payments in respect of the loans in which we invest. Also, in the event of insolvency, liquidation, dissolution, reorganization or bankruptcy of a portfolio company, holders of debt instruments ranking senior to our investment in that portfolio company would typically be entitled to receive payment in full before we receive any distribution in respect of our investment. After repaying senior creditors, a portfolio company may not have any remaining assets to use for repaying its obligation to us. In the case of debt ranking equally with loans in which we invest, we would have to share any distributions on an equal and ratable basis with other creditors holding such debt in the event of an insolvency, liquidation, dissolution, reorganization or bankruptcy of the relevant portfolio company.
Additionally, certain loans that we may make to portfolio companies may be secured on a second priority basis by the same collateral securing senior secured debt of such companies. The first priority liens on the collateral will secure the portfolio company’s obligations under any outstanding senior debt and may secure certain other future debt that may be permitted to be incurred by the portfolio company under the agreements governing the loans. The holders of obligations secured by first priority liens on the collateral will generally control the liquidation of, and be entitled to receive proceeds from, any realization of the collateral to repay their obligations in full before us. In addition, the value of the collateral in the event of liquidation will depend on market and economic conditions, the availability of buyers and other factors. There can be no assurance that the proceeds, if any, from sales of all of the collateral would be sufficient to satisfy the loan obligations secured by the second priority liens after payment in full of all obligations secured by the first priority liens on the collateral. If such proceeds were not sufficient to repay amounts outstanding under the loan obligations secured by the second priority liens, then we, to the extent not repaid from the proceeds of the sale of the collateral, will only have an unsecured claim against the portfolio company’s remaining assets, if any.
We may also make unsecured loans to portfolio companies, meaning that such loans will not benefit from any interest in collateral of such companies. Liens on such portfolio companies’ collateral, if any, will secure the portfolio company’s obligations under its outstanding secured debt and may secure certain future debt that is permitted to be incurred by the portfolio company under its secured loan agreements. The holders of obligations secured by such liens will generally control the liquidation of, and be entitled to receive proceeds from, any realization of such collateral to repay their obligations in full before us. In addition, the value of such collateral in the event of liquidation will depend on market and economic conditions, the availability of buyers and other
53
Table of Contents
factors. There can be no assurance that the proceeds, if any, from sales of such collateral would be sufficient to satisfy our unsecured loan obligations after payment in full of all secured loan obligations. If such proceeds were not sufficient to repay the outstanding secured loan obligations, then our unsecured claims would rank equally with the unpaid portion of such secured creditors’ claims against the portfolio company’s remaining assets, if any.
The rights we may have with respect to the collateral securing the loans we make to our portfolio companies with senior debt outstanding may also be limited pursuant to the terms of one or more intercreditor agreements that we enter into with the holders of such senior debt. Under a typical intercreditor agreement, at any time that obligations that have the benefit of the first priority liens are outstanding, any of the following actions that may be taken in respect of the collateral will be at the direction of the holders of the obligations secured by the first priority liens:
| • | the ability to cause the commencement of enforcement proceedings against the collateral; |
| • | the ability to control the conduct of such proceedings; |
| • | the approval of amendments to collateral documents; |
| • | releases of liens on the collateral; and |
| • | waivers of past defaults under collateral documents. |
We may not have the ability to control or direct such actions, even if our rights are adversely affected.
If we make subordinated investments, the obligors or the portfolio companies may not generate sufficient cash flow to service their debt obligations to us.
We may make subordinated investments that rank below other obligations of the obligor in right of payment. Subordinated investments are subject to greater risk of default than senior obligations as a result of adverse changes in the financial condition of the obligor or economic conditions in general. If we make a subordinated investment in a portfolio company, the portfolio company may be highly leveraged, and its relatively high debt-to-equity ratio may create increased risks that its operations might not generate sufficient cash flow to service all of its debt obligations.
If we make unsecured investments, those investments might not generate sufficient cash flow to service their debt obligations to us.
We may make unsecured investments. Unsecured investments may be subordinated to other obligations of the obligor. Unsecured investments often reflect a greater possibility that adverse changes in the financial condition of the obligor or general economic conditions (including, for example, a substantial period of rising interest rates or declining earnings) or both may impair the ability of the obligor to make payment of principal and interest. If we make an unsecured investment in a portfolio company that is highly leveraged, its relatively high debt-to-equity ratio could increase the risk that its operations might not generate sufficient cash to service its debt obligations, and we would have no right to seize assets to satisfy the obligations to us.
The disposition of our investments may result in contingent liabilities.
We currently expect that substantially all of our investments will involve loans and private securities. In connection with the disposition of such an investment, we may be required to make representations about the business and financial affairs of the portfolio company typical of those made in connection with the sale of a business. We may also be required to indemnify the purchasers of such investment to the extent that any such representations turn out to be inaccurate or with respect to potential liabilities. These arrangements may result in contingent liabilities that ultimately result in funding obligations that we must satisfy through our return of distributions previously made to us.
54
Table of Contents
We may not realize gains from our equity investments.
When we invest in loans and debt securities, we may acquire warrants or other equity securities of portfolio companies as well. We may also invest in equity securities directly. To the extent we hold equity investments, we will attempt to dispose of them and realize gains upon our disposition of them. However, the equity interests we receive may not appreciate in value and, may decline in value. As a result, we may not be able to realize gains from our equity interests, and any gains that we do realize on the disposition of any equity interests may not be sufficient to offset any other losses we experience.
Risks Relating to Our Common Stock
Shares of closed-end investment companies, including business development companies, may trade at a discount to their net asset value.
Shares of closed-end investment companies, including business development companies, may trade at a discount from net asset value. This characteristic of closed-end investment companies and business development companies is separate and distinct from the risk that our net asset value per share may decline. We cannot predict whether our common stock will trade at, above or below net asset value.
There is a risk that you may not receive distributions or that our distributions may not grow over time and a portion of our distributions may be a return of capital.
We intend to make distributions on a quarterly basis to our stockholders out of assets legally available for distribution. We cannot assure you that we will achieve investment results that will allow us to make a specified level of cash distributions or year-to-year increases in cash distributions. Our ability to pay distributions might be adversely affected by the impact of one or more of the risk factors described in this annual report on Form 10-K. Due to the asset coverage test applicable to us under the 1940 Act as a BDC, we may be limited in our ability to make distributions.
When we make distributions, we will be required to determine the extent to which such distributions are paid out of current or accumulated earnings and profits. Distributions in excess of current and accumulated earnings and profits will be treated as a non-taxable return of capital to the extent of an investor’s basis in our stock and, assuming that an investor holds our stock as a capital asset, thereafter as a capital gain.
Investing in our common stock may involve an above average degree of risk.
The investments we make in accordance with our investment objective may result in a higher amount of risk, and higher volatility or loss of principal, than alternative investment options. Our investments in portfolio companies may be speculative and, therefore, an investment in our common stock may not be suitable for someone with lower risk tolerance.
The market price of our common stock may fluctuate significantly.
The market price and liquidity of the market for shares of our common stock may be significantly affected by numerous factors, some of which are beyond our control and may not be directly related to our operating performance. These factors include:
| • | significant volatility in the market price and trading volume of securities of BDCs or other companies in our sector, which is not necessarily related to the operating performance of these companies; |
| • | changes in regulatory policies or tax guidelines, particularly with respect to RICs or BDCs; |
| • | loss of our qualification as a RIC or BDC; |
| • | changes in earnings or variations in operating results; |
55
Table of Contents
| • | changes in the value of our portfolio of investments; |
| • | increases in the interest rates we pay; |
| • | changes in accounting guidelines governing valuation of our investments; |
| • | any shortfall in revenue or net income or any increase in losses from levels expected by investors or securities analysts; |
| • | departure of the Adviser’s key personnel; |
| • | change in the Adviser’s relationship with Cyrus Capital under the Services Agreement; |
| • | change in the Adviser’s relationship with Stifel under the Stifel arrangement; |
| • | sales of our shares by the Cyrus Funds; |
| • | sales of our shares by Stifel; |
| • | operating performance of companies comparable to us; and |
| • | general economic trends and other external factors. |
Sales of substantial amounts of our common stock in the public market may have an adverse effect on the market price of our common stock.
Stifel owns approximately 15.9% of our total outstanding common stock, and the Cyrus Funds own, in the aggregate, approximately 27.9% of our total outstanding common stock. Upon expiration or waiver of any applicable lock-up periods, shares issued by us to Stifel and the Cyrus Funds in connection with the CM Finance Merger will generally be freely tradable in the public market, subject to the volume limitations, applicable holding periods and other provisions of Rule 144 under the Securities Act. Sales of substantial amounts of our common stock, the availability of such common stock for sale or the registration of such common stock for sale and the ability of our stockholders, including Stifel and the Cyrus Funds to sell their respective shares at a price per share that is below our then current net asset value per share could adversely affect the prevailing market prices for our common stock. If this occurs and continues, it could impair our ability to raise additional capital through the sale of securities should we desire to do so and negatively impact the market of our common stock.
| Item 1B. | Unresolved Staff Comments |
Not applicable.
| Item 2. | Properties |
We do not own any real estate. Our principal executive offices are currently located at 601 Lexington Avenue, 26th Floor, New York, New York 10022. All locations are provided to us by the Adviser pursuant to the Administration Agreement and indirectly by Cyrus Capital through the Services Agreement. We believe that our office facilities are and will be suitable and adequate for our business as we contemplate conducting it.
| Item 3. | Legal Proceedings |
We are not currently subject to any material legal proceedings, nor, to our knowledge, is any material legal proceeding threatened against us. From time to time, we may be a party to certain legal proceedings in the ordinary course of business, including proceedings relating to the enforcement of our rights under contracts with our portfolio companies. While the outcome of these legal proceedings cannot be predicted with certainty, we do not expect that these proceedings will have a material effect upon our financial condition or results of operations.
| Item 4. | Mine Safety Disclosures |
Not applicable.
56
Table of Contents
| Item 5. | Market for Registrant’s Common Equity, Related Stockholder Matters and Issuer Purchases of Equity Securities |
Price Range of Common Stock
Our common stock is traded on the NASDAQ Global Select Market under the symbol “CMFN.” The following table sets forth the range of high and low sales prices of our common stock as reported on the NASDAQ Global Select Market for each fiscal quarter since our initial public offering on February 5, 2014:
| Price Range | ||||||||
| High | Low | |||||||
| Fiscal 2014 |
||||||||
| Third quarter (from February 6, 2014) |
$ | 17.04 | $ | 14.92 | ||||
| Fourth quarter |
$ | 15.67 | $ | 12.60 | ||||
| Fiscal 2015 |
||||||||
| First quarter (through September 5, 2014) |
$ | 14.84 | $ | 13.00 | ||||
The last reported sale price for our common stock on the NASDAQ Global Select Market on September 5, 2014 was $13.80 per share. As of September 5, 2014, we had 33 shareholders of record.
Shares of BDCs may trade at a market price that is less than the value of the net assets attributable to those shares. The possibility that our shares of common stock will trade at a discount from net asset value per share or at premiums that are unsustainable over the long term are separate and distinct from the risk that our net asset value per share will decrease. It is not possible to predict whether the common stock will trade at, above, or below net asset value per share.
Dividends
Our dividends, if any, are determined by our board of directors. We intend to elect to be treated for federal income tax purposes as a RIC under Subchapter M of the Code. If we qualify as a RIC, we will not be taxed on our investment company taxable income or realized net capital gains, to the extent that such taxable income or gains are distributed, or deemed to be distributed, to stockholders on a timely basis.
To qualify for RIC tax treatment, we must, among other things, distribute at least 90% of our net ordinary income and realized net short-term capital gains in excess of realized net long-term capital losses, if any. Depending on the level of taxable income earned in a tax year, we may choose to carry forward taxable income in excess of current year distributions into the next tax year and pay a 4% excise tax on such income. Any such carryover taxable income must be distributed through a dividend declared prior to filing the final tax return related to the year which generated such taxable income. We may, in the future, make actual distributions to our stockholders of our net capital gains. We can offer no assurance that we will achieve results that will permit the payment of any cash distributions and, if we issue senior securities, we may be prohibited from making distributions if doing so causes us to fail to maintain the asset coverage ratios stipulated by the 1940 Act or if distributions are limited by the terms of any of our borrowings.
We have adopted an “opt out” dividend reinvestment plan (“DRIP”) for our common stockholders. As a result, if we make cash distributions, then stockholders’ cash distributions will be automatically reinvested in additional shares of our common stock, unless they specifically “opt out” of the dividend reinvestment plan so as to receive cash distributions.
57
Table of Contents
The following table reflects the distributions per share that our board of directors has declared on our common stock since our initial public offering in February 2014:
| Date Declared |
Record Date | Payment Date | Amount Per Share |
|||||
| Fiscal 2014 |
||||||||
| May 14, 2014 |
June 16, 2014 | July 1, 2014 | $ | 0.3375 | ||||
| March 14, 2014 |
March 24, 2014 | March 31, 2014 | $ | 0.1812 | ||||
|
|
|
|||||||
| Total (2014) |
$ | 0.5187 | ||||||
| Fiscal 2015 |
||||||||
| September 4, 2014 |
September 18, 2014 | October 1, 2014 | $ | 0.3375 | ||||
|
|
|
|||||||
| Total (2015) |
$ | 0.3375 | ||||||
Recent Sales of Unregistered Securities
On February 5, 2014, in connection with the merger of CM Finance LLC with and into CM Finance Inc, we issued 6,000,000 shares of common stock at a per share price of $15.00 and $39.8 million in debt to the Cyrus Funds as members of CM Finance LLC for an aggregate value of $129.8 million in exchange for the membership interests held by the members of CM Finance LLC. The issuance of such shares was deemed to be exempt from registration under the Securities Act of 1933 in reliance on Section 4(a)(2) thereunder as a transaction by an issuer not involving a public offering.
In addition, on February 5, 2014, we issued 2,181,818 shares of our common stock at a per share price of $15.00 in a private placement to Stifel Venture Corp. for an aggregate purchase price of $32.7 million. The issuance of such shares was deemed to be exempt from registration under the Securities Act of 1933 in reliance on Section 4(a)(2) and Rule 506 thereunder as transactions by an issuer not involving a public offering. We used the proceeds from the sale of shares of our common stock to Stifel to repurchase 2,181,818 shares from the Cyrus Funds.
Use of Proceeds from Recent Sales of Registered Securities
On February 5, 2014, our registration statement on Form N-2 (SEC File No. 333-192370) for the initial public offering of shares of our common stock became effective. On February 11, 2014, we closed our initial public offering of 7,666,666 shares of common stock, including 1,000,000 shares pursuant to the full exercise of the overallotment option granted to the underwriters, at a public offering price of $15.00 per share for total gross proceeds of $115.0 million.
The Adviser paid 50% of the underwriting fees and commissions and offering expenses incurred by us that exceeded $1,200,000 without recourse or reimbursement by us. None of these expenses were paid directly or indirectly to our directors, officers or associates, or to persons owning 10% or more of our common stock or that of other affiliates, other than the underwriting fees and commissions paid to Keefe, Brueytte & Woords, a Stifel Company, which is an affiliate of Stifel Venture Corp. Stifel Venture Corp. holds a 20% interest in the Adviser and owns 15.9% of our common stock. The net proceeds to us of the initial public offering, after deducting the underwriting fees and commissions, were approximately $111.5 million.
We used a portion of the net proceeds of our initial public offering to repay, in full, the outstanding indebtedness to the Cyrus Funds of $39.8 million. We have invested in and expect to use the remaining net proceeds to invest in unitranche loans and standalone second and first lien loans, along with investing selectively in mezzanine loans/structured equity and in the equity of portfolio companies through warrants and other instruments. Raymond James, Keefe, Bruyette & Woods, a Stifel Company, and Oppenheimer & Co. acted as joint book-running managers for the offering. Stephens Inc. and Wunderlich Securities acted as co-managers.
58
Table of Contents
Purchases of Equity Securities
None.
Stock Performance Graph
This graph compares the return on our common stock with that of the Russell 2000 Financial Services Index, the NASDAQ Financial Index and a customized peer group of six companies that includes Alcentra Capital Corp, Garrison Capital Inc., OFS Capital Corp., Stellus Capital Investment Corp, THL Credit, Inc., and WhiteHorse Finance Inc, for the period from February 6, 2014 (initial public offering) through June 30, 2014. The graph assumes that, on February 6, 2014, an investment of $100 (with reinvestment of all dividends) was made in our common stock (at the initial public offering price of $15.0 per share), in each index and in the peer group. The graph measures total stockholder return, which takes into account both changes in stock price and dividends. It assumes that dividends paid are invested in like securities.
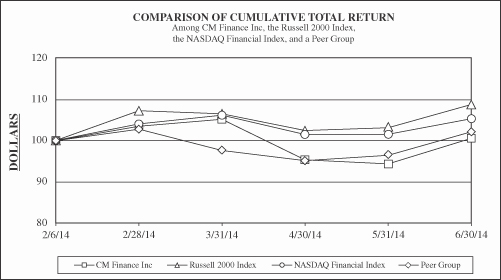
The graph and other information furnished under this Part II Item 5 of this Form 10- K shall not be deemed to be “soliciting material” or to be “filed” with the SEC or subject to Regulation 14A or 14C, or to the liabilities of Section 18 of the 1934 Act. The stock price performance included in the above graph is not necessarily indicative of future stock price performance.
59
Table of Contents
| Item 6. | Selected Financial Data |
The following selected financial data for the years ended June 30, 2014 and June 30, 2013 is derived from our financial statements which have been audited by Ernst and Young, LLP, our independent registered public accounting firm. The data should be read in conjunction with our financial statements and related notes thereto and “Management’s Discussion and Analysis of Financial Condition and Results of Operations” included elsewhere in this report.
| Statement of Operations Data: |
For the year ended June 30, 2014 |
For the year ended June 30, 2013 |
||||||
| Total investment income |
$ | 21,134,061 | $ | 6,772,816 | ||||
| Total expenses, net of fee waiver |
$ | 5,135,934 | $ | 630,686 | ||||
| Net investment income |
$ | 15,998,127 | $ | 6,142,130 | ||||
| Net increase in net assets resulting from operations |
$ | 16,176,034 | $ | 7,996,171 | ||||
| Per Share Data(1): |
||||||||
| Net asset value |
$ | 14.65 | N.A. | |||||
| Net investment income |
$ | 0.47 | N.A. | |||||
| Net increase in net assets resulting from operations |
$ | 0.51 | N.A. | |||||
| Distributions declared |
$ | 0.5187 | N.A. | |||||
| Balance Sheet Data: |
At June 30, 2014 | At June 30, 2013 | ||||||
| Investments at fair value |
$ | 273,710,465 | $ | 119,209,284 | ||||
| Cash and cash equivalents |
$ | 24,698,073 | $ | — | ||||
| Total assets |
$ | 308,759,998 | $ | 186,938,136 | ||||
| Total liabilities |
$ | 108,543,177 | $ | 99,687,499 | ||||
| Total net assets |
$ | 200,216,821 | $ | 87,250,637 | ||||
| Other Data: |
||||||||
| Number of portfolio companies at period end |
24 | 11 | ||||||
| Weighted average yield on debt investments at period end(1) |
10.44 | % | 10.72 | % | ||||
| (1) | For the period from February 6, 2014 through June 30, 2014. |
| Item 7. | Management’s Discussion and Analysis of Financial Condition and Results of Operations |
Some of the statements in this annual report on Form 10-K constitute forward-looking statements, which relate to future events or our future performance or financial condition. The forward-looking statements contained in this annual report on Form 10-K involve risks and uncertainties, including statements as to:
| • | our future operating results; |
| • | our business prospects and the prospects of our portfolio companies; |
| • | the effect of investments that we expect to make; |
| • | our contractual arrangements and relationships with Stifel and Cyrus Capital; |
| • | our contractual arrangements and relationships with lenders and other third parties; |
| • | actual and potential conflicts of interest with the Adviser; |
60
Table of Contents
| • | the dependence of our future success on the general economy, interest rates and the effects of each on the industries in which we invest; |
| • | the ability of our portfolio companies to achieve their objectives or service their debt obligations to us; |
| • | the use of borrowed money to finance a portion of our investments; |
| • | the adequacy of our financing sources and working capital; |
| • | the timing of cash flows, if any, from the operations of our portfolio companies; |
| • | the ability of the Adviser to locate suitable investments for us and to monitor and administer our investments; |
| • | the ability of the Adviser to attract and retain highly talented professionals; |
| • | our ability to qualify and maintain our qualification as a RIC and as a BDC; |
| • | our ability to obtain exemptive relief from the SEC; |
| • | our ability to obtain an SBIC license; and |
| • | the effect of changes to tax legislation and our tax position and other legislative and regulatory changes. |
Such forward-looking statements may include statements preceded by, followed by or that otherwise include the words “may,” “might,” “will,” “intend,” “should,” “could,” “can,” “would,” “expect,” “believe,” “estimate,” “anticipate,” “predict,” “potential,” “plan” or similar words.
We have based the forward-looking statements included in this annual report on Form 10-K on information available to us on the date of this annual report on Form 10-K. Actual results could differ materially from those anticipated in our forward-looking statements, and future results could differ materially from historical performance. We undertake no obligation to revise or update any forward-looking statements, whether as a result of new information, future events or otherwise, unless required by law or SEC rule or regulation. You are advised to consult any additional disclosures that we may make directly to you or through reports that we in the future may file with the SEC, including annual reports on Form 10-K, quarterly reports on Form 10-Q and current reports on Form 8-K.
Overview
CM Finance Inc (“CMFN,” the “Company”, “us”, “we” or “our”), a Maryland corporation formed in May 2013, is a closed-end, externally managed, non-diversified management investment company that has elected to be regulated as a business development company (“BDC”) under the Investment Company Act of 1940, as amended (the “1940 Act”), and intends to elect to be treated as a regulated investment company (“RIC”) under Subchapter M of the Internal Revenue Code, or the Code, for U.S. federal income tax purposes.
The Company’s investment objective is to generate both current income and capital appreciation through debt and equity investments by targeting investment opportunities with favorable risk-adjusted returns. The Company invests primarily in middle-market companies in the form of mezzanine, unitranche loans and standalone first and second lien loans. The Company may also invest in unsecured debt, bonds and in the equity of portfolio companies through warrants and other instruments.
On February 5, 2014, CM Finance Inc priced its initial public offering (the “Offering”), selling 7,666,666 shares, including the underwriters’ over-allotment, at a price of $15.00 per share with net proceeds of approximately $111.5 million.
61
Table of Contents
CM Finance LLC, a Maryland limited liability company, commenced operations in March 2012. Immediately prior to the Offering, CM Finance LLC was merged with and into CM Finance Inc (the “Merger”). In connection with the Merger, CM Finance Inc issued 6,000,000 shares of common stock and $39.8 million in debt to the pre-existing CM Finance LLC investors, comprised of funds (the “Original Investors” or “Cyrus Funds”) managed by Cyrus Capital Partners, L.P. CM Finance Inc had no assets or operations prior to completion of the Merger and, as a result, the books and records of CM Finance LLC have become the books and records of CM Finance Inc, as the surviving entity. Immediately after the Merger, CM Finance Inc issued 2,181,818 shares of its common stock to Stifel Venture Corp. in exchange for $32.7 million in cash. CM Finance Inc used all of the proceeds of the sale of shares to Stifel Venture Corp., to repurchase 2,181,818 shares of common stock from the Original Investors. Immediately after the completion of the Offering, the Company had 13,666,666 shares outstanding. The Company also used a portion of the net proceeds of the Offering to repay 100% of the debt issued to the Original Investors in connection with the Merger.
Upon its election to be regulated as a BDC, on February 5, 2014, the Company entered into an investment advisory agreement (the “Advisory Agreement”) and an administrative agreement with CM Investment Partners LLC (the “Investment Manager”) as its investment manager and administrator, respectively.
The Company consolidates the operations of its wholly-owned subsidiary, CM Finance SPV, Ltd. (“SPV”), a special purpose vehicle used to finance certain investments.
Market Conditions
The global economy has experienced economic uncertainty, which impacts our business in many ways, including changing spreads, structures and purchase multiples as well as the overall supply of investment capital. See “Risk Factors—Risks Relating to Economic Conditions.”
Despite the economic uncertainty, we believe that the current investment environment presents a compelling case for investing in secured debt (including unitranche debt and standalone second and first lien loans) and unsecured debt (including mezzanine/structured equity) of middle-market companies. As always, we remain cautious in selecting new investment opportunities, and will only deploy capital in deals which we believe are consistent with our disciplined underwriting policies and rigorous portfolio management.
Critical accounting policies
Our discussion and analysis of our financial condition and results of operations are based upon our financial statements, which have been prepared in accordance with generally accepted accounting principles (“GAAP”). The preparation of these financial statements requires management to make estimates and assumptions that affect the reported amounts of assets, liabilities, revenues and expenses. Changes in the economic environment, financial markets and any other parameters used in determining such estimates could cause actual results to differ. Management considers the following critical accounting policies important to understanding the financial statements. In addition to the discussion below, our critical accounting policies are further described in the notes to our consolidated financial statements.
Valuation of portfolio investments
We value our portfolio investments at fair value based upon the principles and methods of valuation set forth in policies adopted by our board of directors. Fair value is defined as the price that would be received to sell an asset in an orderly transaction between market participants at the measurement date. Market participants are buyers and sellers in the principal (or most advantageous) market for the asset that (a) are independent of us, (b) are knowledgeable, having a reasonable understanding about the asset based on all available information (including information that might be obtained through due diligence efforts that are usual and customary), (c) are able to transact for the asset, and (d) are willing to transact for the asset or liability (that is, they are motivated but not forced or otherwise compelled to do so).
62
Table of Contents
Investments for which market quotations are readily available are valued at such market quotations unless the quotations are deemed not to represent fair value. We generally obtain market quotations from recognized exchanges, market quotation systems, independent pricing services or one or more broker dealers or market makers.
Debt and equity securities for which market quotations are not readily available or for which market quotations are deemed not to represent fair value are valued at fair value as determined in good faith by our board of directors. Because a readily available market value for many of the investments in our portfolio is often not available, we value many of our portfolio investments at fair value as determined in good faith by our board of directors using a consistently applied valuation process in accordance with a documented valuation policy that has been reviewed and approved by our board of directors. Due to the inherent uncertainty and subjectivity of determining the fair value of investments that do not have a readily available market value, the fair value of our investments may differ significantly from the values that would have been used had a readily available market value existed for such investments and may differ materially from the values that we may ultimately realize. In addition, changes in the market environment and other events may have differing impacts on the market quotations used to value some of our investments than on the fair values of our investments for which market quotations are not readily available. Market quotations may also be deemed not to represent fair value in certain circumstances where we believe that facts and circumstances applicable to an issuer, a seller or purchaser, or the market for a particular security causes current market quotations not to reflect the fair value of the security. Examples of these events could include cases where a security trades infrequently, causing a quoted purchase or sale price to become stale, where there is a “forced” sale by a distressed seller, where market quotations vary substantially among market makers, or where there is a wide bid-ask spread or significant increase in the bid ask spread.
With respect to investments for which market quotations are not readily available, our board of directors undertakes a multi-step valuation process each quarter, as described below:
| • | our quarterly valuation process begins with each portfolio company or investment being initially valued by the investment professionals of the Investment Manager responsible for the portfolio investment; |
| • | preliminary valuation conclusions are then documented and discussed with our senior management and the Investment Manager; |
| • | on a periodic basis, at least once annually, the valuation for each portfolio investment is reviewed by an independent valuation firm engaged by our board of directors; |
| • | the valuation committee of our board of directors then reviews these preliminary valuations; and |
| • | the board of directors then discusses these preliminary valuations and determines the fair value of each investment in our portfolio in good faith, based on the input of the Investment Manager, the independent valuation firm and the valuation committee. |
Those investments for which market quotations are not readily available or for which market quotations are deemed not to represent fair value are valued utilizing a market approach, an income approach, or both approaches, as appropriate. The market approach uses prices and other relevant information generated by market transactions involving identical or comparable assets or liabilities (including a business). The income approach uses valuation techniques to convert future amounts (for example, cash flows or earnings) to a single present amount (discounted). The measurement is based on the value indicated by current market expectations about those future amounts. In following these approaches, the types of factors that we may take into account in determining the fair value of our investments include, as relevant and among other factors: available current market data, including relevant and applicable market trading and transaction comparables, applicable market yields and multiples, security covenants, call protection provisions, information rights, the nature and realizable value of any collateral, the portfolio company’s ability to make payments, its earnings and discounted cash flows,
63
Table of Contents
the markets in which the portfolio company does business, comparisons of financial ratios of peer companies that are public, merger and acquisition comparables, our principal market (as the reporting entity) and enterprise values.
When valuing all of our investments, we strive to maximize the use of observable inputs and minimize the use of unobservable inputs. Inputs refer broadly to the assumptions that market participants would use in pricing an asset, including assumptions about risk. Inputs may be observable or unobservable. Observable inputs are inputs that reflect the assumptions market participants would use in pricing an asset or liability developed based on market data obtained from sources independent of us. Unobservable inputs are inputs that reflect our assumptions about the assumptions market participants would use in pricing an asset or liability developed based on the best information available in the circumstances.
Our investments are categorized based on the types of inputs used in their valuation. The level in the GAAP valuation hierarchy in which an investment falls is based on the lowest level input that is significant to the valuation of the investment in its entirety. Investments are classified by GAAP into the three broad levels as follows:
| Level I | Investments valued using unadjusted quoted prices in active markets for identical assets. | |
| Level II | Investments valued using other unadjusted observable market inputs, e.g. quoted prices in markets that are not active or quotes for comparable instruments. | |
| Level III | Investments that are valued using quotes and other observable market data to the extent available, but which also take into consideration one or more unobservable inputs that are significant to the valuation taken as a whole. | |
As of June 30, 2014 and June 30, 2013, all of our investments were Level III investments valued based on valuations by our board of directors and the Investment Manager, respectively.
Determination of fair value involves subjective judgments and estimates. Accordingly, the notes to our financial statements express the uncertainty with respect to the possible effect of such valuations, and any change in such valuations, on the consolidated financial statements.
Revenue recognition
Our revenue recognition policies are as follows:
Net realized gains (losses) on investments: Gains or losses on the sale of investments are calculated by using the specific identification method.
Interest Income: Interest income, adjusted for amortization of premium and accretion of discount, is recorded on an accrual basis. Origination, closing, commitment, and amendment fees, purchase and original issue discounts associated with loans to portfolio companies are accreted into interest income over the respective terms of the applicable loans. Accretion of discounts or premiums is calculated by the effective interest or straight-line method, as applicable, as of the purchase date and adjusted only for material amendments or prepayments. Upon the prepayment of a loan or debt security, any prepayment penalties and unamortized fees and discounts are recorded as interest income.
Structuring fees and similar fees are recognized as income as earned, usually when received. Structuring fees, excess deal deposits, net profits interests and overriding royalty interests are included in other fee income.
The Company may hold debt investments in its portfolio that contain a payment-in-kind (“PIK”) interest provision. The PIK interest, which represents contractually deferred interest added to the investment balance that
64
Table of Contents
is generally due at maturity, is recorded on the accrual basis to the extent such amounts are expected to be collected. PIK interest is not accrued if the Company does not expect the issuer to be able to pay all principal and interest when due. During the twelve months ended June 30, 2014 and June 30, 2013, the Company earned $1,723,676 and $641,008 in PIK interest, respectively. As of June 30, 2014 and June 30, 2013, there were no investments on which we had ceased the accrual of cash or PIK interest income.
Non-accrual: Loans are placed on non-accrual status when principal or interest payments are past due 90 days or more or when there is reasonable doubt that principal or interest will be collected. Accrued interest is generally reversed when a loan is placed on non-accrual status. Interest payments received on non-accrual loans may be recognized as income or applied to principal depending upon management’s judgment about ultimate collectability of principal. Non-accrual loans are restored to accrual status when past due principal and interest is paid and, in management’s judgment, are likely to remain current. As of June 30, 2014 and June 30, 2013, we had no loans on non-accrual.
Financing Facility
On May 23, 2013, as amended on June 6, 2013 and December 4, 2013, we, through CM Finance SPV Ltd. (“SPV”), our wholly owned subsidiary, entered into a financing facility (the “Financing Facility”) with UBS AG, London Branch (together with its affiliates, “UBS”). The Financing Facility includes a $76.5 million term securitized financing facility (the “Term Financing”), which expires on May 22, 2016, and a $50.0 million revolving financing (the “Revolving Financing”), which expires on December 4, 2015. We paid interest on the face amount of the Term Financing monthly at a rate of one-month LIBOR plus a spread of 1.63% per annum from May 23, 2013 to July 14, 2013. We paid interest on the face amount of the Term Financing monthly at a rate of LIBOR plus 1.97% per annum from July 15, 2013 to August 14, 2013. As of August 14, 2013, through the term of the Term Financing, we pay interest on the face amount of the term portion of the Term Financing monthly at a rate of 2.85% per annum. The Revolving Financing bears interest at a rate of (a) 2.10% per annum from December 4, 2013 through December 4, 2014 and (b) 1.60% per annum from December 5, 2014 through the term of the Revolving Financing. With respect to undrawn amounts, we will pay interest monthly on the daily average of amounts that are not drawn on the Revolving Financing at a rate of 0.50%. The Financing Facility is collateralized by a portion of our assets (the “SPV Assets”).
The Financing Facility was executed in four steps:
First, the Company organized CM SPV, a consolidated wholly owned bankruptcy remote special purpose vehicle in the Cayman Islands to purchase the SPV Assets through (i) the issuance and sale of notes secured by the SPV Assets (the “Notes”) to UBS and the Company and (ii) the transfer of cash to the Company. UBS purchased Notes with a face value of $76.5 million, which represent 51% of the Notes issued and outstanding, for $76.5 million in cash. The Company purchased Notes with a face value of $73.5 million (which are eliminated in consolidation), which represent 49% of the Notes issued and outstanding and received $18.7 million in cash, in exchange for assets with a fair market value of $92.2 million. Under the terms of the indenture under which the Notes were issued (the “Indenture”), the holders of the Notes are entitled to (i) periodic interest payments equal to their pro rata portion of the interest collected on the assets held by SPV and (ii) their pro-rata portion of the net appreciation (depreciation) on the SPV Assets at maturity (the “Total Return of the Notes”) This represents the embedded derivative in the Note Payable from SPV to UBS.
Second, the Company and UBS entered into a TRS transaction whereby the Company will receive the Total Return of the Notes purchased by UBS and pay the Financing Rate.
Third, SPV issued and sold an additional $50 million notes (the “Revolving Notes”), secured by the SPV Assets to UBS. Since the Revolving Notes have not been drawn, no cash was exchanged. Under the terms of the indenture under which the Revolving Notes were issued (the “Revolver Indenture”), the holders of the Revolving Notes are entitled to (i) periodic interest payments equal to their pro rata portion of the interest collected on the
65
Table of Contents
assets held by SPV and (ii) their pro-rata portion of the net appreciation (depreciation) on the SPV Assets at maturity (the “Total Return of the Revolving Notes”). This represents the embedded derivative in the Note Payable from SPV to UBS.
Fourth, the Company and UBS entered into another TRS transaction whereby the Company will receive the Total Return of the Revolving Notes purchased by UBS and pay the revolver financing rate.
Contractual Obligations
As of June 30, 2014, our future fixed commitments for cash payments on contractual obligations for each of the next five years and thereafter are as follows:
| Twelve months ending June 30, | ||||||||||||||||||||||||||||
| Total | 2015 | 2016 | 2017 | 2018 | 2019 | 2020 and thereafter |
||||||||||||||||||||||
| Notes Payable: |
||||||||||||||||||||||||||||
| Term Loan |
$ | 76,500,000 | — | $ | 76,500,000 | — | — | — | — | |||||||||||||||||||
| Revolving credit facility |
9,091,314 | — | 9,091,314 | — | — | — | — | |||||||||||||||||||||
|
|
|
|
|
|
|
|
|
|
|
|
|
|
|
|||||||||||||||
| $ | 85,591,314 | — | $ | 85,591,314 | — | — | — | — | ||||||||||||||||||||
|
|
|
|
|
|
|
|
|
|
|
|
|
|
|
|||||||||||||||
Investments
Our level of investment activity can and does vary substantially from period to period depending on many factors, including the amount we have available to invest as well as the amount of debt and equity capital available to middle-market companies, the level of merger and acquisition activity, the general economic environment and the competitive environment for the types of investments we make.
To qualify as a RIC, we must, among other things, meet certain source-of-income and asset diversification requirements. As a RIC, we generally will not have to pay corporate-level taxes on any income we distribute to our stockholders.
As a BDC, we will be required to comply with certain regulatory requirements. For instance, we generally will have to invest at least 70% of our total assets in “qualifying assets,” including securities of private or thinly traded public U.S. companies, cash, cash equivalents, U.S. government securities and high-quality debt investments that mature in one year or less.
As a BDC, we must not acquire any assets other than “qualifying assets” specified in the 1940 Act unless, at the time the acquisition is made, at least 70% of our total assets are qualifying assets (with certain limited exceptions). Qualifying assets include investments in “eligible portfolio companies.” Under the relevant SEC rules, the term “eligible portfolio company” includes all private companies, companies whose securities are not listed on a national securities exchange, and certain public companies that have listed their securities on a national securities exchange and have a market capitalization of less than $250 million. In each case, the company must be organized in the United States.
Revenues
We generate revenues primarily in the form of interest on the debt we hold. We also generate revenue from dividends on our equity interests and capital gains on the sale of warrants and other debt or equity interests that we acquire. Our investments in fixed income instruments generally have an expected maturity of three to five years, although we have no lower or upper constraint on maturity. Interest on our debt investments is generally payable quarterly or semi-annually. Payments of principal of our debt investments may be amortized over the stated term of the investment, deferred for several years or due entirely at maturity. In some cases, our debt
66
Table of Contents
investments and preferred stock investments may defer payments of cash interest or dividends or PIK interest. Any outstanding principal amount of our debt investments and any accrued but unpaid interest will generally become due at the maturity date. In addition, we may generate revenue in the form of prepayment fees, commitment, origination, structuring or due diligence fees, fees for providing significant managerial assistance, consulting fees and other investment related income.
Expenses
Our primary operating expenses include the payment of a base management fee and, depending on our operating results, incentive fees, expenses reimbursable under the investment advisory agreement (the “Investment Advisory Agreement”) between us and the Investment Manager, and administration fees and the allocable portion of overhead under the administration agreement (“Administration Agreement”) between us and the Investment Manager. The base management fee and incentive compensation remunerates the Investment Manager for work in identifying, evaluating, negotiating, closing and monitoring our investments. We bear all other out-of-pocket costs and expenses of our operations and transactions, including, without limitation, those relating to:
| • | our organization, the formation transactions and our initial public offering; |
| • | calculating our net asset value (including the cost and expenses of any independent valuation firm); |
| • | fees and expenses payable to third parties, including agents, consultants or other advisors, in monitoring financial and legal affairs for us and in monitoring our investments and performing due diligence on our prospective portfolio companies or otherwise relating to, or associated with, evaluating and making investments; |
| • | interest payable on debt, if any, incurred to finance our investments and expenses related to unsuccessful portfolio acquisition efforts; |
| • | offerings of our common stock and other securities; |
| • | administration fees and expenses, if any, payable under the Administration Agreement (including our allocable portion of the Investment Manager’s overhead in performing its obligations under the Administration Agreement, including rent and the allocable portion of the cost of our chief compliance officer, chief financial officer and their respective staffs); |
| • | transfer agent, dividend agent and custodial fees and expenses; |
| • | costs associated with our reporting and compliance obligations under the 1940 Act, the Securities Exchange Act of 1934 (the “Exchange Act”), and other applicable federal and state securities laws, and stock exchange listing fees; |
| • | fees and expenses associated with independent audits and outside legal costs; |
| • | federal, state and local taxes; |
| • | independent directors’ fees and expenses; |
| • | costs of any reports, proxy statements or other notices to or communications and meetings with stockholders; |
| • | costs associated with investor relations; |
| • | costs and fees associated with any fidelity bond, directors and officers/errors and omissions liability insurance, and any other insurance premiums; |
| • | direct costs and expenses of administration, including printing, mailing, long distance telephone, copying, secretarial and other staff; and |
| • | all other expenses incurred by us or the Investment Manager in connection with administering our business. |
67
Table of Contents
Portfolio and investment activity
Portfolio composition
At June 30, 2014, our investment portfolio of $273.7 million (at fair value) consisted of investments in 24 portfolio companies, of which 40.9% were first lien investments, 48.8% were second lien investments, 9.5% were senior secured notes, and 0.8% were warrant positions. At June 30, 2014, our average and largest portfolio company investment at fair value was $11.4 million and $20.0 million, respectively.
At June 30, 2014, 89.0% of our debt investments bore interest based on floating rates based on indices such as LIBOR (in certain cases, subject to interest rate floors), and 11.0% bore interest at fixed rates. The weighted average yield on our debt portfolio at June 30, 2014 was approximately 10.44%. The weighted average yield was computed using the effective interest rates for all of our debt investments to maturity from June 30, 2014.
The industry composition of our portfolio at fair value at June 30, 2014 was as follows:
| Percentage of Total Portfolio |
||||
| Telecommunications |
19.35 | % | ||
| Oil and Gas |
16.39 | |||
| Healthcare-Products/Services |
17.83 | |||
| Trucking and Leasing |
5.47 | |||
| Entertainment and Leisure |
5.40 | |||
| Industrial |
5.40 | |||
| Retail |
5.17 | |||
| Automobiles and Components |
4.73 | |||
| Airlines |
4.55 | |||
| Pipelines |
3.65 | |||
| Services |
3.14 | |||
| Oilfield Services |
3.13 | |||
| Diversified Financial Services |
2.18 | |||
| Construction & Building |
1.81 | |||
| Commercial Services |
1.80 | |||
|
|
|
|||
| Total |
100.0 | % | ||
|
|
|
|||
During the twelve months ended June 30, 2014, we made investments in 21 portfolio companies, totaling approximately $278.9 million, of which 14 were to new portfolio companies. Of these new investments, 46.3% consisted of first lien investments, 47.0% second lien investments, 1.3% senior secured notes and 5.4% unsecured debt investments.
At June 30, 2013, our investment portfolio of $119.2 million (at fair value) consisted of investments in eleven portfolio companies, of which 67.3% were first lien investments, 32.2% were second lien investments and 0.5% were warrant positions. Our average portfolio company investment at fair value was approximately $10.8 million. Our largest portfolio company investment by fair value was $18.1 million.
At June 30, 2013, 68.0% of our debt investments bore interest based on floating rates (subject to interest rate floors), such as LIBOR, and 32.0% bore interest at fixed rates. The weighted average yield on all of our debt investments at June 30, 2013 was approximately 10.72%. The weighted average yield was computed using the effective interest rates for all of our debt investments at fair value, plus the yield to maturity from June 30, 2013 of all of our debt investments, including our unfunded obligations, as if our unfunded obligations were fully funded and is weighted based on each respective investment’s par amount.
68
Table of Contents
The industry composition of our portfolio at fair value at June 30, 2013 was as follows:
| Percentage of Total Investments |
||||
| Airlines |
9.08 | % | ||
| Automobiles and Components |
13.15 | |||
| Diversified Financial Services |
5.51 | |||
| Oil and Gas |
23.56 | |||
| Pipelines |
8.43 | |||
| Telecommunications |
30.31 | |||
| Trucking and Leasing |
9.96 | |||
|
|
|
|||
| Total |
100.00 | % | ||
|
|
|
|||
During the year ended June 30, 2013, we invested approximately $100.8 million in eleven new portfolio companies. Of these new investments, 60.9% consisted of first lien investments and 39.1% consisted of second lien investments at fair value.
Asset Quality
In addition to various risk management and monitoring tools, we use the Investment Manager’s investment rating system to characterize and monitor the credit profile and expected level of returns on each investment in our portfolio. This investment rating system uses a five-level numeric rating scale. The following is a description of the conditions associated with each investment rating:
| Investment Rating 1 | Investments that are performing above expectations, and whose risks remain favorable compared to the expected risk at the time of the original investment. | |
| Investment Rating 2 | Investments that are performing within expectations and whose risks remain neutral compared to the expected risk at the time of the original investment. All new loans will initially be rated 2. | |
| Investment Rating 3 | Investments that are performing below expectations and that require closer monitoring, but where no loss of return or principal is expected. Portfolio companies with a rating of 3 may be out of compliance with their financial covenants. | |
| Investment Rating 4 | Investments that are performing substantially below expectations and whose risks have increased substantially since the original investment. These investments are often in workout. Investments with a rating of 4 will be those for which some loss of return but no loss of principal is expected. | |
| Investment Rating 5 | Investments that are performing substantially below expectations and whose risks have increased substantially since the original investment. These investments are almost always in workout. Investments with a rating of 5 will be those for which some loss of return and principal is expected. | |
If the Investment Manager determines that an investment is underperforming, or circumstances suggest that the risk associated with a particular investment has significantly increased, the Investment Manager will increase its monitoring intensity and prepare regular updates for the investment committee, summarizing current operating results and material impending events and suggesting recommended actions. While the investment rating system identifies the relative risk for each investment, the rating alone does not dictate the scope and/or frequency of any monitoring that will be performed. The frequency of the Investment Manager’s monitoring of an investment will be determined by a number of factors, including, but not limited to, the trends in the financial performance of the portfolio company, the investment structure and the type of collateral securing the investment.
69
Table of Contents
The following table shows the investment rankings of the debt investments in our portfolio:
| As of June 30, 2014 | As of June 30, 2013 | |||||||||||||||||||||||
| Fair Value | % of Portfolio |
Number of Investments |
Fair Value | % of Portfolio |
Number of Investments |
|||||||||||||||||||
| 1 |
$ | 4,925,000 | 1.8 | % | 1 | $ | 24,551,299 | 20.7 | % | 2 | ||||||||||||||
| 2 |
255,227,578 | 94.0 | 22 | 94,102,014 | 79.3 | 9 | ||||||||||||||||||
| 3 |
11,496,010 | 4.2 | 1 | — | — | — | ||||||||||||||||||
| 4 |
— | — | — | — | — | — | ||||||||||||||||||
| 5 |
— | — | — | — | — | — | ||||||||||||||||||
|
|
|
|
|
|
|
|
|
|
|
|
|
|||||||||||||
| Total |
$ | 271,648,588 | 100.0 | % | 24 | $ | 118,653,313 | 100.0 | % | 11 | ||||||||||||||
|
|
|
|
|
|
|
|
|
|
|
|
|
|||||||||||||
Results of Operations
Comparison of the twelve months ended June 30, 2014 and June 30, 2013
Investment income
Investment income, attributable to interest and fees on our debt investments, for the twelve months ended June 30, 2014 increased to $21.1 million from $6.8 million for the twelve months ended June 30, 2013, primarily due to the growth of our investment portfolio from the comparable period.
Expenses
Total expenses for the twelve months ended June 30, 2014 increased to $5.1 million from $630,686 for the twelve months ended June 30, 2013, due primarily to the interest expense on the Financing Facility and increased operating expenses due to growth in our investment portfolio.
Net investment income
Net investment income increased to $16.0 million for the twelve months ended June 30, 2014 from $6.1 million for the twelve months ended June 30, 2013, primarily due to an increase in investment income resulting from the increase in invested assets over the prior year period.
Net realized gain or loss
The net realized loss on investments totaled $783,978 for the twelve months ended June 30, 2014, compared to a net realized gain of $781,262 for the twelve months ended June 30, 2013, due to gains or losses on sales activity during the periods.
Net change in unrealized (depreciation) appreciation on investments
We recorded a net change in unrealized appreciation of $961,885 for the twelve months ended June 30, 2014, compared to net unrealized appreciation of $1.1 million for the twelve months ended June 30, 2013, which reflects the net change in the fair value of our investment portfolio relative to its cost basis over this period.
Comparison of the twelve months ended June 30, 2013 and the period from March 7, 2012 to June 30, 2012
Investment income
Investment income, attributable to interest and fees on our debt investments, for the year ended June 30, 2013 increased to $6.8 million from $501,856 for the partial year ended June 30, 2012, due to the growth of the portfolio during the full fiscal year 2013 and as compared to a partial fiscal year for 2012.
70
Table of Contents
Expenses
Total expenses, consisting primarily of legal fees and professional fees, increased to $630,686 for the year ended June 30, 2013 from $197,817 for the partial year ended June 30, 2012, due in part to fiscal 2013 being a full fiscal year as opposed to a partial fiscal year in 2012.
Net investment income
Net investment income increased to $6.1 million for the year ended June 30, 2013 from $304,039 for the partial year ended June 30, 2012 resulting from the increase in invested assets as compared to the prior partial year period.
Net realized gain or loss
The net realized gain on investments increased to $781,262 for the year ended June 30, 2013 from $110 for the partial year ended June 30, 2012 due to gains or losses on sales activity during the periods.
Net change in unrealized appreciation (depreciation) on investments
We recorded an increase in net unrealized appreciation of $1.1 million for the year ended June 30, 2013, and an increase in net unrealized depreciation of $(6,457) for the year ended June 30, 2012, which reflects the net change in the fair value of our investment portfolio relative to its cost basis over these periods.
Net increase in net assets resulting from operations
Net increase in net assets resulting from operations totaled $8.0 million and $297,692 for the years ended June 30, 2013 and 2012, and is primarily related to interest income and an increase in net unrealized appreciation generated from our investment portfolio offset by our operating expenses and a decrease in net unrealized appreciation on our investment portfolio.
Liquidity and capital resources
Cash flows
For the twelve months ended June 30, 2014, our cash balance increased by $24.7 million. During that period, we used $63.8 million in cash towards operating activities, primarily due to new investments in portfolio companies of $278.9 million, partially offset by $125.1 million in repayments and sales of investments in portfolio companies. During the same period, we generated $88.5 million from financing activities, consisting primarily of proceeds from the Offering and borrowings partially offset by distributions to our Original Investors and to our stockholders.
For the twelve months ended June 30, 2013, we experienced no change in cash. During that period, we used $159.6 million in cash towards operating activities primarily to fund $133.9 million in investments, which were partially offset by $38.2 million in repayments and sales. During the same period, we generated $159.6 million from financing activities, consisting primarily of capital contributions from our Original Investors and borrowings under our term loan and revolving credit facility.
Capital Resources
As of June 30, 2014, we had $24.7 million of cash and $7.1 million in restricted cash and our net assets totaled $200.2 million. We intend to generate additional cash primarily from future offerings of securities, future borrowings under the Financing Facility as well as cash flows from operations, including income earned from investments in our portfolio companies and, to a lesser extent, from the temporary investment of cash in U.S.
71
Table of Contents
government securities and other high-quality debt investments that mature in one year or less. Our primary liquidity needs include interest and principal repayments on our Financing Facility, our unfunded loan commitments, investments in portfolio companies, dividend distributions to our shareholders and operating expenses.
As discussed below in further detail, we intend to elect to be treated as a RIC, for the fiscal year ending June 30, 2014. To maintain our RIC status, we generally must distribute substantially all of our net taxable income to shareholders in the form of dividends. Our net taxable income does not necessarily equal our net income as calculated in accordance with GAAP.
Regulated Investment Company Status and Distributions
We intend to elect to be treated as a RIC under Subchapter M of the Code for the fiscal year ending June 30, 2014. If we qualify as a RIC, we will not be taxed on our investment company taxable income or realized net capital gains, to the extent that such taxable income or gains are distributed, or deemed to be distributed, to stockholders on a timely basis.
Taxable income generally differs from net income for financial reporting purposes due to temporary and permanent differences in the recognition of income and expenses, and generally excludes net unrealized appreciation or depreciation until realized. Dividends declared and paid by us in a year may differ from taxable income for that year as such dividends may include the distribution of current year taxable income or the distribution of prior year taxable income carried forward into and distributed in the current year. Distributions also may include returns of capital.
To qualify for RIC tax treatment, we must, among other things, distribute, with respect to each taxable year, at least 90% of our investment company net taxable income (i.e., our net ordinary income and our realized net short-term capital gains in excess of realized net long-term capital losses, if any). If we qualify as a RIC, we will also be subject to a federal excise tax, based on distributive requirements of our taxable income on a calendar year basis.
We intend to distribute to our stockholders between 90% and 100% of our annual taxable income (which includes our taxable interest and fee income). However, the covenants contained in the Financing Facility may prohibit us from making distributions to our stockholders, and, as a result, could hinder our ability to satisfy the distribution requirement. In addition, we may retain for investment some or all of our net taxable capital gains (i.e., realized net long-term capital gains in excess of realized net short-term capital losses) and treat such amounts as deemed distributions to our stockholders. If we do this, our stockholders will be treated as if they received actual distributions of the capital gains we retained and then reinvested the net after-tax proceeds in our common stock. Our stockholders also may be eligible to claim tax credits (or, in certain circumstances, tax refunds) equal to their allocable share of the tax we paid on the capital gains deemed distributed to them. To the extent our taxable earnings for a fiscal taxable year fall below the total amount of our dividends for that fiscal year, a portion of those dividend distributions may be deemed a return of capital to our stockholders.
We may not be able to achieve operating results that will allow us to make distributions at a specific level or to increase the amount of these distributions from time to time. In addition, we may be limited in our ability to make distributions due to the asset coverage test for borrowings applicable to us as a BDC under the 1940 Act and due to provisions in Financing Facility. We cannot assure stockholders that they will receive any distributions or distributions at a particular level.
In accordance with certain applicable Treasury regulations and private letter rulings issued by the Internal Revenue Service, a RIC may treat a distribution of its own stock as fulfilling its RIC distribution requirements if each stockholder may elect to receive his or her entire distribution in either cash or stock of the RIC, subject to a limitation that the aggregate amount of cash to be distributed to all stockholders must be at least 20% of the aggregate declared distribution. If too many stockholders elect to receive cash, each stockholder electing to
72
Table of Contents
receive cash must receive a pro rata amount of cash (with the balance of the distribution paid in stock). In no event will any stockholder, electing to receive cash, receive less than 20% of his or her entire distribution in cash. If these and certain other requirements are met, for U.S. federal income tax purposes, the amount of the dividend paid in stock will be equal to the amount of cash that could have been received instead of stock. We have no current intention of paying dividends in shares of our stock in accordance with these Treasury regulations or private letter rulings.
Investment Advisory Agreement
On February 5, 2014, upon our election to be regulated as a BDC, we entered into an Investment Advisory Agreement with the Investment Manager. Pursuant to this agreement, we have agreed to pay to the Investment Manager a base management fee of 1.75% of gross assets, including assets purchased with borrowed funds or other forms of leverage and excluding cash and cash equivalents and fair value of derivatives associated with our financing, and an incentive fee consisting of two parts.
The first part, which is calculated and payable quarterly in arrears, equals 20.0% of the “pre-incentive fee net investment income” (as defined in the agreement) for the immediately preceding quarter, subject to a hurdle rate of 2.0% per quarter (8.0% annualized), and is subject to a “catch-up” feature. The incentive fee is subject to a total return requirement, which provides that no incentive fee in respect of the Company’s pre-incentive fee net investment income will be payable except to the extent 20.0% of the cumulative net increase in net assets resulting from operations over the then current and 11 preceding quarters exceeds the cumulative incentive fees accrued and/or paid for the 11 preceding quarters. The net pre-incentive fee investment income used to calculate this part of the incentive fee is also included in the amount of our gross assets used to calculate the 1.75% base management fee.
The second part is calculated and payable in arrears as of the end of each calendar year and equals 20.0% of the aggregate cumulative realized capital gains from inception through the end of each calendar year, computed net of aggregate cumulative realized capital losses and aggregate cumulative unrealized capital depreciation through the end of such year, less the aggregate amount of any previously paid capital gain incentive fees.
The Investment Manager has agreed to permanently waive: (i) all or portions of base management fees through December 31, 2014, to the extent required to support an annualized dividend yield of 9.0% per annum based on the price per share of our common stock in the Offering, and (ii) all or portions of the incentive fee for 2014, 2015 and 2016, to the extent required to support an annualized dividend yield of 9.0%, 9.25% and 9.375% per annum, respectively, based on the price per share of our common stock in of the Offering. For the period from February 6, 2014 through June 30, 2014, $1.46 million in base management fees were earned by the Investment Manager, of which $1.14 million was waived. No incentive management fees were earned for the period from February 6, 2014 through June 30, 2014.
Board Approval of the Investment Advisory Agreement
Our board of directors approved the Investment Advisory Agreement at its first meeting, held on October 8, 2013. In its consideration of the investment advisory agreement, the board of directors focused on information it had received relating to, among other things: (a) the nature, quality and extent of the advisory and other services to be provided to us by our Investment Manager; (b) comparative data with respect to advisory fees or similar expenses paid by other business development companies with similar investment objectives; (c) any existing and potential sources of indirect income to our Investment Manager from its relationships with us and the profitability of those relationships; (d) information about the services to be performed and the personnel performing such services under the investment advisory agreement; (e) the organizational capability and financial condition of our Investment Manager; and (f) various other factors.
73
Table of Contents
Based on the information reviewed and the discussions, the board of directors, including a majority of the non-interested directors, concluded that the investment management fee rates and terms are reasonable in relation to the services to be provided and approved the Investment Advisory Agreement as being in the best interests of our stockholders.
Off-Balance Sheet Arrangements
As of June 30, 2014 and June 30, 2013, we did not engage in any off-balance sheet financing or hedging arrangements, other than the commitments and contingencies described above.
| Item 7A. | Quantitative and Qualitative Disclosure about Market Risk |
We are subject to financial market risks, including changes in interest rates. At June 30, 2014, 89.0% of our debt investments bore interest based on floating rates, such as LIBOR, EURIBOR, the Federal Funds Rate or the Prime Rate. The interest rates on such investments generally reset by reference to the current market index after one to six months. Floating rate investments subject to a floor generally reset by reference to the current market index after one to six months only if the index exceeds the floor.
Generally, we believe higher yielding assets such as those in our investment portfolio do not necessarily follow a linear interest rate relationship and are less sensitive in price to interest rate changes than many other debt investments. Our investments in fixed rate assets are generally exposed to changes in value due to interest rate fluctuations, and our floating rate assets are generally exposed to cash flow variability from fluctuation in rates. Consequently, our net interest income (interest income less interest expense) is exposed to risks related to interest rate fluctuations. Based on our in-place portfolio with certain interest rate floors and our financing at June 30, 2014, a 1.00% increase in interest rates would decrease our net interest income by approximately 1.2% and a 2.00% increase in interest rates would increase our net interest income by approximately 5.3%. Variable-rate instruments subject to a floor generally reset periodically to the applicable floor and, in the case of investments in our portfolio, quarterly to a floor based on LIBOR, only if the floor exceeds the index. Under these loans, we do not benefit from increases in interest rates until such rates exceed the floor and thereafter benefit from market rates above any such floor.
Although management believes that this analysis is indicative of our existing sensitivity to interest rate changes, it does not adjust for changes in the credit markets, the size, credit quality or composition of the assets in our portfolio and other business developments, including borrowing, that could affect the net increase in net assets resulting from operations, or net income. It also does not adjust for the effect of the time lag between a change in the relevant interest rate index and the rate adjustment under the applicable loan. Accordingly, we can offer no assurances that actual results would not differ materially from the statement above.
74
Table of Contents
| Item 8. | Financial Statements and Supplementary Data |
| Page | ||||
| 76 | ||||
| Consolidated Statements of Assets and Liabilities as of June 30, 2014 and June 30, 2013 |
77 | |||
| 78 | ||||
| 79 | ||||
| 80 | ||||
| 81 | ||||
| 83 | ||||
| 85 | ||||
75
Table of Contents
Report of Independent Registered Public Accounting Firm
The Board of Directors and Stockholders of
CM Finance Inc
We have audited the accompanying consolidated statements of assets and liabilities of CM Finance Inc (the “Company”), including the consolidated schedule of investments as of June 30, 2014 and 2013, and the related consolidated statements of operations, changes in net assets and cash flows for the years then ended and for the period from March 7, 2012 (commencement of operations) to June 30, 2012. These consolidated financial statements are the responsibility of the Company’s management. Our responsibility is to express an opinion on these consolidated financial statements based on our audits.
We conducted our audits in accordance with the standards of the Public Company Accounting Oversight Board (United States). Those standards require that we plan and perform the audit to obtain reasonable assurance about whether the consolidated financial statements are free of material misstatement. We were not engaged to perform an audit of the Company’s internal control over financial reporting. Our audit included consideration of internal control over financial reporting as a basis for designing audit procedures that are appropriate in the circumstances, but not for the purpose of expressing an opinion on the effectiveness of the Company’s internal control over financial reporting. Accordingly, we express no such opinion. An audit also includes examining, on a test basis, evidence supporting the amounts and disclosures in the financial statements, assessing the accounting principles used and significant estimates made by management, and evaluating the overall financial statement presentation. Our procedures included confirmation of securities owned as of June 30, 2014 and 2013, by correspondence with the custodian and brokers. We believe that our audits provide a reasonable basis for our opinion.
In our opinion, the consolidated financial statements referred to above present fairly, in all material respects, the consolidated financial position of the Company at June 30, 2014 and 2013, and the consolidated results of their operations, changes in their net assets and their cash flows for the years then ended and for the period from March 7, 2012 (commencement of operations) to June 30, 2012 in conformity with U.S. generally accepted accounting principles.
/s/ Ernst & Young LLP
September 8, 2014
New York, NY
76
Table of Contents
Consolidated Statements of Assets and Liabilities
| June 30, 2014 | June 30, 2013 | |||||||
| Assets |
||||||||
| Non-controlled, non-affiliated investments, at fair value (amortized cost of $271,682,258 and $118,142,962, respectively) |
$ | 273,710,465 | $ | 119,209,284 | ||||
| Derivatives, at fair value (cost $0 and $0, respectively) |
563,866 | 843,864 | ||||||
| Cash |
24,698,073 | — | ||||||
| Cash, restricted |
7,139,313 | 42,601,338 | ||||||
| Due from broker |
— | 22,975,552 | ||||||
| Interest receivable |
1,458,043 | 1,012,042 | ||||||
| Deferred debt issuance costs |
459,676 | 296,056 | ||||||
| Prepaid expenses and other assets |
730,562 | — | ||||||
|
|
|
|
|
|||||
| Total Assets |
$ | 308,759,998 | $ | 186,938,136 | ||||
|
|
|
|
|
|||||
| Liabilities |
||||||||
| Notes Payable: |
||||||||
| Term loan |
$ | 76,500,000 | $ | 76,500,000 | ||||
| Revolving credit facility |
9,091,314 | — | ||||||
| Payable for investments purchased |
16,660,000 | — | ||||||
| Distributions payable |
4,612,500 | 22,000,000 | ||||||
| Derivatives, at fair value (cost $0 and $0, respectively) |
563,866 | 843,864 | ||||||
| Base management fees payable |
313,237 | — | ||||||
| Interest payable |
108,117 | 149,198 | ||||||
| Accrued expenses and other liabilities |
694,143 | 194,437 | ||||||
|
|
|
|
|
|||||
| Total Liabilities |
108,543,177 | 99,687,499 | ||||||
| Commitments and Contingencies (Note 7) |
||||||||
| Net Assets |
||||||||
| Members’ capital |
— | 87,250,637 | ||||||
| Common Stock, par value $0.001 per share (100,000,000 shares authorized, 13,666,666 shares issued and outstanding) |
13,667 | — | ||||||
| Additional paid-in capital |
198,810,786 | — | ||||||
| Distributions in excess of net investment income |
(635,839 | ) | — | |||||
| Net unrealized appreciation on investments |
2,028,207 | — | ||||||
|
|
|
|
|
|||||
| Total Net Assets |
200,216,821 | 87,250,637 | ||||||
|
|
|
|
|
|||||
| Total Liabilities and Net Assets |
$ | 308,759,998 | $ | 186,938,136 | ||||
|
|
|
|
|
|||||
| Net Asset Value Per Share |
$ | 14.65 | N.A. | |||||
See notes to consolidated financial statements.
77
Table of Contents
Consolidated Statements of Operations
| For the twelve months ended June 30, |
Period from March 7, 2012 to June 30, 2012 |
|||||||||||
| 2014 | 2013 | |||||||||||
| Investment Income: |
||||||||||||
| Interest income |
$ | 18,808,795 | $ | 5,890,673 | $ | 486,894 | ||||||
| Payment in-kind interest income |
1,723,676 | 641,008 | — | |||||||||
| Other fee income |
601,590 | 241,135 | 14,962 | |||||||||
|
|
|
|
|
|
|
|||||||
| Total investment income |
21,134,061 | 6,772,816 | 501,856 | |||||||||
| Expenses: |
||||||||||||
| Base management fees |
1,461,770 | — | — | |||||||||
| Performance-based incentive fees |
— | — | — | |||||||||
| Custodian and administrator fees |
88,707 | — | — | |||||||||
| Directors’ fees |
201,500 | — | — | |||||||||
| Professional fees |
561,961 | 250,000 | — | |||||||||
| Allocation of administrative costs from advisor |
267,809 | — | — | |||||||||
| Insurance expense |
176,953 | — | — | |||||||||
| Interest expense |
2,466,792 | 149,198 | — | |||||||||
| Amortization of deferred debt issuance costs |
461,380 | 10,924 | — | |||||||||
| Organization costs |
— | — | 197,779 | |||||||||
| Other expenses |
597,595 | 220,564 | 38 | |||||||||
|
|
|
|
|
|
|
|||||||
| Total expenses |
6,284,467 | 630,686 | 197,817 | |||||||||
| Waiver of base management fees from Investment Manager |
(1,148,533 | ) | — | — | ||||||||
|
|
|
|
|
|
|
|||||||
| Net expenses |
5,135,934 | 630,686 | 197,817 | |||||||||
|
|
|
|
|
|
|
|||||||
| Net investment income(1) |
15,998,127 | 6,142,130 | 304,039 | |||||||||
| Net realized and unrealized gains (losses) on investment transactions: |
||||||||||||
| Net realized (losses) gains on investments attributable to CM Finance LLC |
(946,608 | ) | 781,262 | 110 | ||||||||
| Net realized gains on investments attributable to CM Finance Inc |
162,630 | — | — | |||||||||
| Net change in unrealized appreciation (depreciation) on investments attributable to CM Finance LLC |
549,814 | 1,072,779 | (6,457 | ) | ||||||||
| Net change in unrealized appreciation on investments attributable to CM Finance Inc |
412,071 | — | — | |||||||||
|
|
|
|
|
|
|
|||||||
| Net realized and unrealized gains (losses) |
177,907 | 1,854,041 | (6,347 | ) | ||||||||
|
|
|
|
|
|
|
|||||||
| Net increase in net assets resulting from operations |
$ | 16,176,034 | $ | 7,996,171 | $ | 297,692 | ||||||
|
|
|
|
|
|
|
|||||||
| Net increase in net assets resulting from operations attributable to CM Finance LLC |
$ | 9,219,852 | $ | 7,996,171 | $ | 297,692 | ||||||
|
|
|
|
|
|
|
|||||||
| Net increase in net assets resulting from operations attributable to CM Finance Inc |
$ | 6,956,182 | N.A. | N.A. | ||||||||
|
|
|
|
|
|
|
|||||||
| CM Finance Inc: |
||||||||||||
| Basic and diluted: |
||||||||||||
| Net investment income per share |
$ | 0.47 | N.A. | N.A. | ||||||||
| Earnings per share |
$ | 0.51 | N.A. | N.A. | ||||||||
| Weighted Average Shares of Common Stock Outstanding |
13,666,666 | N.A. | N.A. | |||||||||
| (1) | Net investment income attribution: |
| For the twelve months ended June 30, |
Period from March 7, 2012 to June 30, 2012 |
|||||||||||
| 2014 | 2013 | |||||||||||
| Net investment income attributable to CM Finance LLC |
$ | 9,616,646 | $ | 6,142,130 | $ | 304,039 | ||||||
|
|
|
|
|
|
|
|||||||
| Net investment income attributable to CM Finance Inc |
$ | 6,381,481 | N.A. | N.A. | ||||||||
|
|
|
|
|
|
|
|||||||
See notes to consolidated financial statements.
78
Table of Contents
Consolidated Statements of Changes in Net Assets
| For the twelve months ended June 30, |
Period from March 7, 2012 to June 30, 2012 |
|||||||||||
| 2014 | 2013 | |||||||||||
| CM Finance LLC: |
||||||||||||
| Members capital at beginning of period |
$ | 87,250,637 | $ | 18,141,667 | $ | — | ||||||
| Contributions from members |
48,606,009 | 84,453,413 | 17,843,975 | |||||||||
| Distributions to members |
(55,076,498 | ) | (23,340,614 | ) | — | |||||||
| Net investment income |
9,616,646 | 6,142,130 | 304,039 | |||||||||
| Net realized gains (losses) on investments |
(946,608 | ) | 781,262 | 110 | ||||||||
| Net change in unrealized appreciation (depreciation) on investments |
549,814 | 1,072,779 | (6,457 | ) | ||||||||
|
|
|
|
|
|
|
|||||||
| Members’ capital at February 5, 2014 (BDC conversion date), June 30, 2013 and June 30, 2012, respectively |
90,000,000 | $ | 87,250,637 | $ | 18,141,667 | |||||||
|
|
|
|
|
|||||||||
| CM Finance Inc: |
||||||||||||
| Capital transactions |
||||||||||||
| Proceeds from shares sold |
111,549,990 | |||||||||||
| Common stock offering costs |
(1,200,000 | ) | ||||||||||
|
|
|
|||||||||||
| Net increase in net assets resulting from capital transactions |
110,349,990 | |||||||||||
| Total capital - CM Finance Inc (BDC conversion) |
200,349,990 | |||||||||||
| Increase (decrease) in net assets resulting from operations attributable to CM Finance Inc |
||||||||||||
| Net investment income |
6,381,481 | |||||||||||
| Net realized gain on investments |
162,630 | |||||||||||
| Net change in unrealized appreciation (depreciation) on investments |
412,071 | |||||||||||
|
|
|
|||||||||||
| Net increase in net assets from operations |
6,956,182 | |||||||||||
| Dividends |
(7,089,351 | ) | ||||||||||
|
|
|
|||||||||||
| Total decrease in net assets |
(133,169 | ) | ||||||||||
|
|
|
|||||||||||
| Net assets at end of year (including distributions in excess of net investment income of $635,839, $0, $0) |
$ | 200,216,821 | ||||||||||
|
|
|
|||||||||||
| Dividends declared per common share |
$ | 0.5187 | ||||||||||
|
|
|
|||||||||||
| Net asset value per share |
$ | 14.65 | ||||||||||
|
|
|
|||||||||||
See notes to consolidated financial statements.
79
Table of Contents
Consolidated Statements of Cash Flows
| For the twelve months ended June 30, |
Period from March 7, 2012 to June 30, 2012 |
|||||||||||
| 2014 | 2013 | |||||||||||
| Cash Flows from Operating Activities |
||||||||||||
| Net increase in net assets resulting from operations attributable to CM Finance LLC |
$ | 9,219,852 | $ | 7,996,171 | $ | 297,692 | ||||||
| Net increase in net assets resulting from operations attributable to CM Finance Inc |
6,956,182 | — | — | |||||||||
| Adjustments to reconcile net increase in net assets resulting from operations to net cash used in operating activities: |
||||||||||||
| Origination and purchases of investments |
(277,126,747 | ) | (133,314,667 | ) | (25,573,961 | ) | ||||||
| Payment in kind interest |
(1,723,676 | ) | (641,008 | ) | — | |||||||
| Sales and repayments of investments |
125,129,039 | 38,236,069 | 4,007,538 | |||||||||
| Net realized loss (gain) on investments in securities attributable to CM Finance LLC |
946,608 | (781,262 | ) | (110 | ) | |||||||
| Net realized gain on investments in securities attributable to CM Finance Inc |
(162,630 | ) | — | — | ||||||||
| Net change in unrealized (appreciation) depreciation on investments attributable to CM Finance LLC |
(549,814 | ) | (1,072,779 | ) | 6,457 | |||||||
| Net change in unrealized appreciation on investments attributable to CM Finance Inc |
(412,071 | ) | — | — | ||||||||
| Amortization of premium on investments |
(601,890 | ) | (64,158 | ) | (11,403 | ) | ||||||
| Amortization of deferred debt issuance costs |
461,380 | 10,924 | — | |||||||||
| Net (increase) decrease in operating assets: |
||||||||||||
| Cash, restricted |
35,462,025 | (42,601,338 | ) | — | ||||||||
| Due from broker |
22,975,552 | (22,975,552 | ) | — | ||||||||
| Interest receivable |
(446,001 | ) | (715,899 | ) | (296,143 | ) | ||||||
| Payment for deferred debt issuance costs |
(625,000 | ) | (306,980 | ) | — | |||||||
| Prepaid expenses and other assets |
(730,562 | ) | — | — | ||||||||
| Net increase (decrease) in operating liabilities: |
||||||||||||
| Due to broker |
— | (3,528,138 | ) | 3,528,138 | ||||||||
| Payable for investments purchased |
16,660,000 | — | — | |||||||||
| Interest payable |
(41,081 | ) | 149,198 | — | ||||||||
| Accrued expenses and other liabilities |
476,533 | (3,380 | ) | 197,817 | ||||||||
| Increase in management fees payable |
313,237 | — | — | |||||||||
|
|
|
|
|
|
|
|||||||
| Net Cash Used in Operating Activities |
(63,819,064 | ) | (159,612,799 | ) | (17,843,975 | ) | ||||||
| Cash Flows from Financing Activities |
||||||||||||
| Proceeds from shares sold |
111,549,990 | — | — | |||||||||
| Common stock offering costs paid |
(1,176,827 | ) | — | — | ||||||||
| Contributions from members of CM Finance LLC |
48,606,009 | 84,453,413 | 17,843,975 | |||||||||
| Distributions to members of CM Finance LLC |
(77,076,498 | ) | (1,340,614 | ) | — | |||||||
| Distributions to shareholders paid |
(2,476,851 | ) | — | — | ||||||||
| Proceeds from borrowing on term loan |
— | 76,500,000 | — | |||||||||
| Proceeds from borrowing on revolving credit facility |
49,121,937 | — | — | |||||||||
| Repayments of borrowing on revolving credit facility |
(40,030,623 | ) | — | — | ||||||||
|
|
|
|
|
|
|
|||||||
| Net Cash Provided by Financing Activities |
88,517,137 | 159,612,799 | 17,843,975 | |||||||||
|
|
|
|
|
|
|
|||||||
| Net Change in Cash |
24,698,073 | — | — | |||||||||
| Cash |
||||||||||||
| Beginning of period |
— | — | — | |||||||||
|
|
|
|
|
|
|
|||||||
| End of period |
$ | 24,698,073 | $ | — | $ | — | ||||||
|
|
|
|
|
|
|
|||||||
| Supplemental cash flow information: |
||||||||||||
| Cash paid for interest |
$ | 2,425,711 | $ | — | $ | — | ||||||
|
|
|
|
|
|
|
|||||||
See notes to consolidated financial statements.
80
Table of Contents
Consolidated Schedule of Investments
June 30, 2014
| Investments(1) |
Industry | Interest Rate | Base Floor Rate |
Maturity Date |
Principal Amount/ Shares(2) |
Amortized Cost |
Fair Value | % of Net Assets |
||||||||||||||||||
| Non-Controlled/Non-Affiliates |
||||||||||||||||||||||||||
| Senior Secured First Lien Term Loans |
||||||||||||||||||||||||||
| Active Media Services, Inc. |
Commercial Services |
1M L + 9.00%(3) | — | 2/1/2018 | $ | 5,000,000 | $ | 4,888,563 | $ | 4,925,000 | 2.46 | % | ||||||||||||||
| AM General, LLC |
Automobiles and Components |
3M L + 9.00%(3) | 1.25 | % | 3/22/2018 | 14,400,000 | 14,234,958 | 12,960,000 | 6.47 | % | ||||||||||||||||
| American Gaming Systems, Inc. |
Entertainment and Leisure |
3M L + 8.25%(3) | 1.00 | % | 12/20/2020 | 14,925,000 | 14,511,107 | 14,775,750 | 7.38 | % | ||||||||||||||||
| Butler Burgher Group LLC |
Services | 1M L + 11.75% | 0.25 | % | 6/30/2017 | 8,750,000 | 8,592,500 | 8,596,876 | 4.29 | % | ||||||||||||||||
| Crestwood Holdings, LLC |
Pipelines | 3M L + 6.00%(3) | 1.00 | % | 6/19/2019 | 9,898,788 | 9,857,978 | 9,997,775 | 4.99 | % | ||||||||||||||||
| Endeavour International Holding B.V.(4) |
Oil and Gas | 3M L + 7.00%(3) | 1.25 | % | 11/30/2017 | 4,930,716 | 4,864,519 | 4,807,448 | 2.40 | % | ||||||||||||||||
| 3M L + 7.00%(3) | 1.25 | % | 11/30/2017 | 6,860,064 | 6,767,964 | 6,688,562 | 3.34 | % | ||||||||||||||||||
|
|
|
|
|
|
|
|
|
|||||||||||||||||||
| Total |
11,790,780 | 11,632,483 | 11,496,010 | 5.74 | % | |||||||||||||||||||||
| MF Global Holdings, Ltd.(4) |
Diversified Financial Services |
3M L + 6.50%(3) | 2.00 | % | 12/4/2014 | 5,976,129 | 5,965,083 | 5,976,129 | 2.99 | % | ||||||||||||||||
| New Standard Energy Texas LLC |
Oil and Gas | 7.00% cash, 6.00% PIK(2)(5) |
— | 11/28/2016 | 4,524,411 | 4,524,411 | 4,524,411 | 2.26 | % | |||||||||||||||||
| PR Wireless, Inc.(6) |
Telecommunications | 3M L + 9.00% | 1.00 | % | 6/27/2020 | 17,000,000 | 15,285,991 | 15,285,991 | 7.64 | % | ||||||||||||||||
| U.S. Well Services, LLC |
Oilfield Services | 1M L + 11.50% | 0.50 | % | 5/2/2019 | 8,752,841 | 8,540,885 | 8,577,783 | 4.29 | % | ||||||||||||||||
| YRC Worldwide, Inc.(4) |
Trucking and Leasing |
3M L + 7.00%(3) | 1.00 | % | 2/13/2019 | 14,925,000 | 14,787,021 | 14,962,313 | 7.47 | % | ||||||||||||||||
|
|
|
|
|
|
|
|
|
|||||||||||||||||||
| Total Senior Secured First Lien Term Loans |
115,942,949 | 112,820,980 | 112,078,038 | 55.98 | % | |||||||||||||||||||||
| Senior Secured Second Lien Term Loans |
||||||||||||||||||||||||||
| Bennu Oil & Gas, LLC |
Oil and Gas | 3M L + 7.50%(7) | 1.25 | % | 11/1/2018 | 14,912,125 | 14,840,295 | 15,061,246 | 7.52 | % | ||||||||||||||||
| Caelus Energy Alaska 03 LLC |
Oil and Gas | 3M L + 7.50% | 1.25 | % | 4/15/2020 | 14,000,000 | 13,726,110 | 13,720,000 | 6.85 | % | ||||||||||||||||
| CT Technologies Intermediate Holdings, Inc. |
Healthcare- Products/Services |
3M L + 8.00%(3) | 1.25 | % | 10/5/2020 | 12,000,000 | 11,839,053 | 12,000,000 | 5.99 | % | ||||||||||||||||
| Ikaria Acquisition, Inc. |
Healthcare- Products/Services |
3M L + 7.75%(3) | 1.00 | % | 2/12/2022 | 2,000,000 | 1,985,880 | 2,034,000 | 1.02 | % | ||||||||||||||||
| North American Lifting Holdings, Inc. |
Industrial | 3M L + 9.00% | 1.00 | % | 11/27/2021 | 15,000,000 | 13,888,676 | 14,775,000 | 7.38 | % | ||||||||||||||||
| RCHP, Inc. |
Healthcare- Products/Services |
3M L + 9.50% | 1.00 | % | 10/23/2019 | 15,000,000 | 14,780,919 | 14,775,000 | 7.38 | % | ||||||||||||||||
| Road Infrastructure Investment, LLC |
Construction & Building |
3M L + 6.75%(3) | 1.00 | % | 9/30/2021 | 5,000,000 | 4,975,918 | 4,950,000 | 2.47 | % | ||||||||||||||||
| Telecommunications Management, LLC |
Telecommunications | 3M L + 8.00%(3) | 1.00 | % | 10/30/2020 | 11,539,815 | 11,463,166 | 11,620,593 | 5.81 | % | ||||||||||||||||
| Telular Corp. |
Telecommunications | 3M L + 8.00%(3) | 1.25 | % | 6/24/2020 | 7,500,000 | 7,404,490 | 7,387,500 | 3.69 | % | ||||||||||||||||
| TNS, Inc. |
Telecommunications | 1M L + 8.00%(3) | 1.00 | % | 8/14/2020 | 17,112,500 | 17,118,479 | 17,283,625 | 8.63 | % | ||||||||||||||||
| Trident USA Health Services, Inc. |
Healthcare- Products/Services |
3M L + 9.00%(3) | 1.25 | % | 7/31/2020 | 20,000,000 | 19,948,051 | 20,000,000 | 9.99 | % | ||||||||||||||||
|
|
|
|
|
|
|
|
|
|||||||||||||||||||
| Total Senior Secured Second Lien Term Loans |
134,064,440 | 131,971,037 | 133,606,964 | 66.73 | % | |||||||||||||||||||||
| Senior Secured Notes |
||||||||||||||||||||||||||
| Capital Petroleum Group |
Retail | 11.00% cash, 3.00% PIK(2)(3) |
— | 9/30/2019 | 14,152,936 | 13,726,001 | 14,152,936 | 7.07 | % | |||||||||||||||||
| Virgin America, Inc. |
Airlines | 17.00% PIK(2) | — | 6/9/2016 | 5,924,520 | 5,808,385 | 5,924,520 | 2.96 | % | |||||||||||||||||
| 8.50% cash, | — | 6/9/2016 | 5,886,125 | 5,584,289 | 5,886,125 | 2.94 | % | |||||||||||||||||||
| 8.50% PIK(2) | ||||||||||||||||||||||||||
|
|
|
|
|
|
|
|
|
|||||||||||||||||||
| Total |
11,810,645 | 11,392,674 | 11,810,645 | 5.90 | % | |||||||||||||||||||||
|
|
|
|
|
|
|
|
|
|||||||||||||||||||
| Total Senior Secured Notes |
25,963,581 | 25,118,675 | 25,963,581 | 12.97 | % | |||||||||||||||||||||
See notes to consolidated financial statements.
81
Table of Contents
CM Finance Inc and subsidiary
Consolidated Schedule of Investments (continued)
June 30, 2014
| Investments(1) |
Industry | Maturity Date |
Principal Amount/ Shares(2) |
Amortized Cost |
Fair Value | % of Net Assets |
||||||||||||||||
| Warrants |
||||||||||||||||||||||
| Endeavour International Holding B.V., $3.01 strike |
Oil and Gas | 4/30/2018 | $ | 160,000 | $ | 160,000 | $ | 50,000 | 0.02 | % | ||||||||||||
| PR Wireless, Inc., $0.01 strike |
Telecommunications | 6/19/2019 | 201 | 1,374,009 | 1,374,009 | 0.69 | % | |||||||||||||||
| Virgin America, Inc., $2.50 strike(8) |
Airlines | 5/10/2043 | 513,333 | 184,116 | 424,116 | 0.21 | % | |||||||||||||||
| Virgin America, Inc., $3.50 strike(8) |
Airlines | 12/9/2041 | 385,000 | 53,441 | 213,757 | 0.11 | % | |||||||||||||||
|
|
|
|
|
|
|
|
|
|||||||||||||||
| Total Warrants |
1,058,534 | 1,771,566 | 2,061,882 | 1.03 | % | |||||||||||||||||
|
|
|
|
|
|
|
|
|
|||||||||||||||
| Total Non-Controlled/Non-Affiliates |
$ | 277,029,504 | $ | 271,682,258 | $ | 273,710,465 | 136.71 | % | ||||||||||||||
|
|
|
|
|
|
|
|
|
|||||||||||||||
| Liabilities in excess of other assets |
(73,493,644 | ) | (36.71 | %) | ||||||||||||||||||
| Net Assets |
$ | 200,216,821 | 100.00 | % | ||||||||||||||||||
| Industry | Interest Rate |
Maturity Date |
Notional Amount |
Amortized Cost |
Fair Value |
% of Net Assets |
||||||||||||||||||
| Derivatives |
||||||||||||||||||||||||
| Assets |
||||||||||||||||||||||||
| Total Return Swap(9) |
Diversified Financial Services | L + 2.85% | 5/22/2016 | $ | 76,500,000 | $ | — | $ | 471,137 | 0.23 | % | |||||||||||||
| Total Return Swap(9) |
Diversified Financial Services | 0.50% | 12/4/2015 | 50,000,000 | — | 92,729 | 0.05 | % | ||||||||||||||||
|
|
|
|
|
|
|
|
|
|||||||||||||||||
| Total Assets |
126,500,000 | — | 563,866 | 0.28 | % | |||||||||||||||||||
|
|
|
|
|
|
|
|
|
|||||||||||||||||
| Liabilities |
||||||||||||||||||||||||
| Embedded derivative - Notes Payable(9) |
Diversified Financial Services | 76,500,000 | — | (471,137 | ) | (0.23 | %) | |||||||||||||||||
| Embedded derivative - Notes Payable(9) |
Diversified Financial Services | 50,000,000 | — | (92,729 | ) | (0.05 | %) | |||||||||||||||||
|
|
|
|
|
|
|
|
|
|||||||||||||||||
| Total Liabilities |
126,500,000 | — | (563,866 | ) | (0.28 | %) | ||||||||||||||||||
|
|
|
|
|
|
|
|
|
|||||||||||||||||
| Total Derivatives |
$ | 253,000,000 | $ | — | $ | — | — | |||||||||||||||||
|
|
|
|
|
|
|
|
|
|||||||||||||||||
| (1) | All investments are in non-controlled and non-affiliated issuers. All investments are valued in good faith by the investment advisor and approved by the board of directors. |
| (2) | Principal amount includes capitalized PIK interest and is net of repayments and unfunded commitments. |
| (3) | Held by the Company indirectly through CM Finance SPV, Ltd. and pledged as collateral for the Total Return Swaps. |
| (4) | The investment is not a qualifying asset under Section 55 of the Investment Company Act of 1940, as amended. Non-qualifying assets represent 10.6% of total assets. |
| (5) | In addition to interest, the borrower pays an overriding royalty interest of 1.25% of gross sales proceeds, subject to certain maximum amounts. |
| (6) | Position or portion thereof unsettled as of June 30, 2014. |
| (7) | $10,972,500 held by the Company indirectly through CM Finance SPV, Ltd. and pledged as collateral for the Total Return Swaps. |
| (8) | Security is non-income producing. |
| (9) | Refer to Note 6 for more detail on the Total Return Swaps and the Embedded derivatives - Notes Payable. |
| 1M L - | 1 month LIBOR (as of June 30, 2014 this rate was 0.15%) | |
| 3M L - | 3 month LIBOR (as of June 30, 2014 this rate was 0.23%) | |
| PIK - | Payment-In-Kind |
See notes to consolidated financial statements.
82
Table of Contents
Consolidated Schedule of Investments
June 30, 2013
| Investments(1) |
Industry | Principal Amount(2) |
Amortized Cost |
Fair Value | % of Members’ Capital(3) |
|||||||||||||
| Investments: |
||||||||||||||||||
| Senior Secured First Lien Term Loans |
||||||||||||||||||
| Alcatel-Lucent USA Term Loan C, |
Telecommunications | |||||||||||||||||
| L+6.25%, due 1/30/2019(5) |
$ | 12,680,639 | $ | 12,621,632 | $ | 12,680,639 | 14.53 | % | ||||||||||
| AM General, LLC Term Loan B, |
Automobiles and Components |
|||||||||||||||||
| L+9.00%, due 3/22/2018(5) |
16,000,000 | 15,766,198 | 15,680,000 | 17.97 | % | |||||||||||||
| Crestwood Holdings, LLC Term Loan B-1, |
Pipelines | |||||||||||||||||
| L+6.00%, due 6/19/2019(5) |
10,000,000 | 9,950,368 | 10,050,000 | 11.52 | % | |||||||||||||
| Endeavour International Corporation |
Oil and Gas | |||||||||||||||||
| Letter of Credit, 13%, due 6/30/2014(5) |
17,953,305 | 17,972,433 | 17,953,305 | 20.59 | % | |||||||||||||
| MF Global Holdings, Ltd. Exit Facility, |
Diversified Financial Services |
|||||||||||||||||
| L+6.50%, due 12/4/2014(4),(5) |
6,679,814 | 6,496,119 | 6,613,016 | 7.58 | % | |||||||||||||
| YRCW Receivables, LLC ABL Term Loan B, |
Trucking and Leasing |
|||||||||||||||||
| L+9.75%, due 9/30/2014(5) |
12,074,283 | 12,139,434 | 12,255,397 | 14.05 | % | |||||||||||||
|
|
|
|
|
|
|
|||||||||||||
| Total Senior Secured First Lien Term Loans |
74,946,184 | 75,232,357 | 86.24 | % | ||||||||||||||
| Senior Secured Second Lien Term Loans |
||||||||||||||||||
| Telecommunications Management LLC 2nd lien, |
Telecommunications | |||||||||||||||||
| L+8.00%, due 10/30/2020(5) |
8,000,000 | 7,922,272 | 8,100,000 | 9.28 | % | |||||||||||||
| Telular Corporation 2nd Lien, |
Telecommunications | |||||||||||||||||
| L+8.00%, due 6/24/2020(5) |
7,500,000 | 7,388,551 | 7,387,500 | 8.47 | % | |||||||||||||
| TNS Inc., 2nd Lien, |
Telecommunications | |||||||||||||||||
| L+8.00%, due 8/14/2020(5) |
7,862,500 | 7,920,381 | 7,960,781 | 9.12 | % | |||||||||||||
|
|
|
|
|
|
|
|||||||||||||
| Total Senior Secured Second Lien Term Loans |
23,231,204 | 23,448,281 | 26.87 | % | ||||||||||||||
| Senior Secured Notes |
||||||||||||||||||
| Capitol Petroleum Group, |
Oil and Gas | |||||||||||||||||
| 11.00% cash, 3.00% PIK, due 12/3/2019(5) |
10,175,935 | 9,990,986 | 9,972,417 | 11.43 | % | |||||||||||||
| Virgin America, Inc. |
Airlines | |||||||||||||||||
| Notes, 17.00% PIK due 6/9/2016 |
5,000,000 | 4,824,216 | 5,000,000 | 5.73 | % | |||||||||||||
| Virgin America, Inc. |
Airlines | |||||||||||||||||
| Notes, 8.50% cash, 8.50% PIK, due 6/9/2016 |
5,425,073 | 4,968,213 | 5,425,074 | 6.22 | % | |||||||||||||
|
|
|
|
|
|
|
|||||||||||||
| Total Senior Secured Notes |
19,783,415 | 20,397,491 | 23.38 | % | ||||||||||||||
See notes to unaudited consolidated financial statements.
83
Table of Contents
| Investments(1) |
Industry |
Principal Amount(2) |
Amortized Cost |
Fair Value | % of Members’ Capital(3) |
|||||||||||||
| Warrants |
||||||||||||||||||
| Endeavour International Corporation |
Oil and Gas |
$ | 160,000 | $ | 160,000 | $ | 160,000 | 0.18 | % | |||||||||
| $3.01 strike, due 4/30/18 |
||||||||||||||||||
| Virgin America, Inc. |
Airlines |
|||||||||||||||||
| $2.50 strike, due 5/10/43 |
513,333 | 184,116 | 299,955 | 0.34 | % | |||||||||||||
| $3.50 strike, due 5/10/43 |
385,000 | 53,441 | 96,016 | 0.11 | % | |||||||||||||
|
|
|
|
|
|
|
|||||||||||||
| Total Warrants |
397,557 | 555,971 | 0.63 | % | ||||||||||||||
|
|
|
|
|
|
|
|||||||||||||
| Total Term Loans and Warrants |
118,358,360 | 119,634,100 | 137.12 | % | ||||||||||||||
| Unfunded Obligations |
||||||||||||||||||
| MF Global Holdings, Ltd. Exit Facility 5.00%, due 12/4/2014(5) |
Diversified Financial Services |
(4,007,888 | ) | (109,645 | ) | (40,079 | ) | -0.05 | % | |||||||||
| YRC Worldwide, Inc. Letter of Credit 7.50%, due 3/31/2015 |
Trucking and Leasing |
(12,824,547 | ) | (105,753 | ) | (384,737 | ) | -0.44 | % | |||||||||
|
|
|
|
|
|
|
|||||||||||||
| Total Unfunded Obligations |
(215,398 | ) | (424,816 | ) | -0.49 | % | ||||||||||||
|
|
|
|
|
|
|
|||||||||||||
| Total Investments |
$ | 118,142,962 | $ | 119,209,284 | 136.63 | % | ||||||||||||
|
|
|
|
|
|
|
|||||||||||||
| Industry |
Notional Amount |
Amortized Cost | Fair Value | % of Members’ Capital(3) |
||||||||||||||
| Derivatives: |
||||||||||||||||||
| Assets |
||||||||||||||||||
| Total Return Swap, L+1.63% due 5/22/16(6) |
Diversified Financial Services |
76,500,000 | $ | — | $ | 843,864 | 0.97 | % | ||||||||||
|
|
|
|
|
|
|
|||||||||||||
| Total Assets |
— | 843,864 | 0.97 | % | ||||||||||||||
| Liabilities |
||||||||||||||||||
| Embedded derivative - Note Payable(6) |
Diversified Financial Services |
76,500,000 | — | 843,864 | 0.97 | % | ||||||||||||
|
|
|
|
|
|
|
|||||||||||||
| Total Assets |
— | 843,864 | 0.97 | % | ||||||||||||||
|
|
|
|
|
|
|
|||||||||||||
| Total Derivatives |
$ | — | $ | — | 0.00 | % | ||||||||||||
|
|
|
|
|
|
|
|||||||||||||
| (1) | All investments are in non-controlled and non-affiliated issuers. All investments are in U.S. based issuers. |
| (2) | Principal amount includes capitalized PIK interest and is net of repayments and unfunded commitments. |
| (3) | Percentage is based on members’ capital of $87,250,637 as of June 30, 2013. |
| (4) | At the option of the issuer, this rate may be either 5.50% + the greater of the prime rate and the fed funds effective rate or L+6.50%. |
| (5) | Held by the Company indirectly through CM Finance SPV and pledged as collateral for the Total Return Swap. |
| (6) | Refer to Note 6 for more detail on the Total Return Swap and the Embedded derivative—Note Payable. |
See notes to unaudited consolidated financial statements.
84
Table of Contents
Notes to Consolidated Financial Statements
June 30, 2014
Note 1. Organization
CM Finance Inc (“CMFN,” the “Company”), a Maryland corporation formed in May 2013, is a closed-end, externally managed, non-diversified management investment company that has elected to be regulated as a business development company (“BDC”) under the Investment Company Act of 1940, as amended (the “1940 Act”), and intends to elect to be treated as a regulated investment company (“RIC”) under Subchapter M of the Internal Revenue Code, or the Code, for U.S. federal income tax purposes.
On February 5, 2014, CM Finance Inc priced its initial public offering (the “Offering”), selling 7,666,666 shares, including the underwriters’ over-allotment, at a price of $15.00 per share with net proceeds of approximately $111.5 million.
CM Finance LLC, a Maryland limited liability company, commenced operations in March 2012. Immediately prior to the Offering, CM Finance LLC was merged with and into CM Finance Inc (the “Merger”). In connection with the Merger, CM Finance Inc issued 6,000,000 shares of common stock and $39.8 million in debt to the pre-existing CM Finance LLC investors, comprised of funds managed by Cyrus Capital Partners, L.P. (the “Original Investors” or “Cyrus Funds”). CM Finance Inc had no assets or operations prior to completion of the Merger and, as a result, the books and records of CM Finance LLC have become the books and records of CM Finance Inc, as the surviving entity. Immediately after the Merger, CM Finance Inc issued 2,181,818 shares of its common stock to Stifel Venture Corp. in exchange for $32.7 million in cash. CM Finance Inc used all of the proceeds of the sale of shares to Stifel Venture Corp., to repurchase 2,181,818 shares of common stock from the Original Investors. Immediately after the completion of the Offering, the Company had 13,666,666 shares outstanding. The Company also used a portion of the net proceeds of the Offering to repay 100% of the debt issued to the Original Investors in connection with the Merger.
Upon its election to be regulated as a BDC, on February 5, 2014, the Company entered into an investment advisory agreement (the “Advisory Agreement”) and an administrative agreement with CM Investment Partners LLC (the “Investment Manager”) as its investment manager and administrator, respectively.
The Company’s investment objective is to generate both current income and capital appreciation through debt and equity investments by targeting investment opportunities with favorable risk-adjusted returns. The Company invests primarily in middle-market companies in the form of mezzanine, unitranche loans and standalone first and second lien loans. The Company may also invest in unsecured debt, bonds and in the equity of portfolio companies through warrants and other instruments.
The Company consolidates the operations of its wholly-owned subsidiary, CM Finance SPV, Ltd. (“SPV”), a special purpose vehicle used to finance certain investments.
Note 2. Significant Accounting Policies
The following is a summary of significant accounting policies followed by the Company.
a. Basis of Presentation
The accompanying consolidated financial statements are prepared in conformity with U.S. generally accepted accounting principles (“U.S. GAAP”) and all values are stated in United States dollars, unless noted
85
Table of Contents
otherwise. The financial statements reflect all adjustments that are, in the opinion of management, necessary for a fair presentation of the results for the periods included herein as required by U.S. GAAP. These adjustments are normal and recurring in nature.
The preparation of consolidated financial statements in conformity with U.S. GAAP requires management to make estimates and assumptions that affect the fair value of investments and other amounts reported in the consolidated financial statements and accompanying notes. Management believes that the estimates utilized in preparing the Company’s consolidated financial statements are reasonable and prudent. Actual results could differ materially from these estimates.
The Company consolidates its controlled and wholly owned subsidiaries. Accordingly, the Company consolidated SPV, since the Company owns 100% of the equity of SPV. All material inter-company balances and transactions have been eliminated.
b. Revenue Recognition, Security Transactions, and Realized/Unrealized Gains or Losses
Interest income, adjusted for amortization of premium and accretion of discount, is recorded on an accrual basis.
Dividend income is recorded on the ex-dividend date.
Origination, closing, commitment, and amendment fees, purchase and original issue discounts associated with loans to portfolio companies are accreted into interest income over the respective terms of the applicable loans. Accretion of discounts or premiums is calculated by the effective interest or straight-line method, as applicable, as of the purchase date and adjusted only for material amendments or prepayments. Upon the prepayment of a loan or debt security, any prepayment penalties and unamortized fees and discounts are recorded as interest income. During the twelve months ended June 30, 2014 $178,853 of prepayment penalties and unamortized discounts upon prepayment were recorded as interest income.
Structuring fees and similar fees are recognized as income as earned, usually when received. Structuring fees, excess deal deposits, net profits interests and overriding royalty interests are included in other fee income.
Investment transactions are accounted for on a trade-date basis. Realized gains or losses on investments are measured by the difference between the net proceeds from the disposition and the amortized cost basis of the investments, without regard to unrealized gains or losses previously recognized. Realized gains or losses on the sale of investments are calculated using the specific identification method. The Company reports changes in fair value of investments as a component of the net change in unrealized appreciation (depreciation) on investments in the Consolidated Statements of Operations.
Management reviews all loans that become 90 days or more past due on principal or interest or when there is reasonable doubt that principal or interest will be collected for possible placement on non-accrual status. Accrued interest is generally reserved when a loan is placed on nonaccrual status. Interest payments received on non-accrual loans may be recognized as income or applied to principal depending upon management’s judgment regarding collectability. Non-accrual loans are restored to accrual status when past due principal and interest is paid and, in management’s judgment, are likely to remain current, although the Investment Manager may make exceptions to this general rule if the loan has sufficient collateral value and is in the process of collection.
The Company may hold debt investments in its portfolio that contain a payment-in-kind (“PIK”) interest provision. The PIK interest, which represents contractually deferred interest added to the investment balance that is generally due at maturity, is recorded on the accrual basis to the extent such amounts are expected to be collected. PIK interest is not accrued if the Company does not expect the issuer to be able to pay all principal and interest when due. During the twelve months ended June 30, 2014 and June 30, 2013, the Company earned $1,723,676 and $641,008 in PIK interest, respectively.
86
Table of Contents
c. Paid In Capital
The Company records the proceeds from the sale of its common stock to (i) common stock and (ii) additional paid-in capital, excluding all commissions and marketing support fees.
d. Earnings per Share
Earnings per share is calculated based upon the weighted average number of shares of common stock outstanding during the reporting period.
e. Dividends
Dividends and distributions to common stockholders are recorded on the ex-dividend date. The amount to be paid out as a dividend is determined by the board of directors each quarter and is generally based upon the earnings estimated by management. Net realized capital gains, if any, are distributed at least annually, although the Company may decide to retain such capital gains for investment.
The Company has adopted a dividend reinvestment plan that provides for reinvestment of any distributions the Company declares in cash on behalf of the Company’s stockholders, unless a stockholder elects to receive cash. As a result, if the Company’s board of directors authorizes, and the Company declares, a cash dividend, then the Company’s stockholders who have not “opted out” of the Company’s dividend reinvestment plan will have their cash dividends automatically reinvested in additional shares of the Company’s common stock, rather than receiving the cash dividend.
f. Cash and restricted cash
Cash and restricted cash consists of bank demand deposits. The Company deposits its cash in a financial institution and, at times, such balance may be in excess of the Federal Deposit Insurance Corporation insurance limits. The Company has restrictions on the uses of the cash held by SPV based on the terms of the Notes Payable. For more information on the Notes Payable, see Note 6.
g. Investment Transactions and Expenses
Purchases of loans, including revolving credit agreements, are recorded on a fully committed basis until the funded and unfunded portions are known or estimable, which in many cases may not be until settlement.
Expenses are accrued as incurred.
Organizational expenses consist principally of legal and accounting fees incurred in connection with the organization of the Company and have been expensed as incurred.
Deferred debt issuance costs, incurred in connection with the Company’s Notes Payable, are amortized using the straight line method over the life of the notes.
Offering costs have been charged to paid-in capital upon sale of shares in the Offering.
h. Investment Valuation
The Company applies fair value accounting to all of its financial instruments in accordance with the 1940 Act and ASC Topic 820 – Fair Value Measurements and Disclosures (“ASC 820”). ASC 820 defines fair value, establishes a framework used to measure fair value and requires disclosures for fair value measurements. In accordance with ASC 820, the Company has categorized its investments and financial instruments carried at fair
87
Table of Contents
value, based on the priority of the valuation technique, into a three-level fair value hierarchy as discussed in Note 5. Fair value is a market-based measure considered from the perspective of the market participant who holds the financial instrument rather than an entity specific measure. Therefore, when market assumptions are not readily available, the Company’s own assumptions are set to reflect those that management believes market participants would use in pricing the financial instrument at the measurement date.
Fair value is defined as the price that would be received to sell an asset in an orderly transaction between market participants at the measurement date. Market participants are buyers and sellers in the principal (or most advantageous) market for the asset that (a) are independent of us, (b) are knowledgeable, having a reasonable understanding about the asset based on all available information (including information that might be obtained through due diligence efforts that are usual and customary), (c) are able to transact for the asset, and (d) are willing to transact for the asset or liability (that is, they are motivated but not forced or otherwise compelled to do so).
Securities that are traded on securities exchanges (including such securities traded in the afterhours market) are valued on the basis of the closing price on the valuation date (if such prices are available). Securities that are traded on more than one securities exchange are valued at the closing price on the primary securities exchange on which such securities are traded on the valuation date (or if reported on the consolidated tape, then their last sales price on the consolidated tape). Listed options for which the last sales price falls between the last “bid” and “ask” prices for such options, are valued at their last sales price on the date of the valuation on the primary securities exchange on which such options are traded. Options for which the last sales price on the valuation date does not fall between the last “bid” and “ask” prices are valued at the average of the last “bid” and “ask” prices for such options on that date. To the extent these securities are actively traded, and valuation adjustments are not applied, they are categorized in Level 1 of the fair value hierarchy. The Company did not hold any Level 1 investments as of June 30, 2014 or June 30, 2013.
Investments that are not traded on securities exchanges but are traded on the over-the-counter (“OTC”) markets (such as term loans, notes and warrants) are valued using various techniques, which may consider recently executed transactions in securities of the issuer or comparable issuers, market price quotations (when observable) and fundamental data relating to the issuer. These investments are categorized in Level 2 of the fair value hierarchy, or in instances when lower relative weight is placed on transaction prices, quotations, or similar observable inputs, they are categorized in Level 3.
The embedded derivatives in the Notes Payable from SPV to UBS, AG (“UBS”) and the Total Return Swaps (the “TRS”) referencing the terms of the Notes Payable are valued based on the change in fair value and the underlying accrued interest of the portfolio of assets held in SPV less the accrued interest payable on the financing due to the TRS counterparty, UBS. Consideration has been given to counterparty risk. The Company has assessed the unsecured risk of the counterparty, UBS, in the form of credit ratings and the trading levels of that risk and has determined that the counterparty risk is minimal. The Company also notes that counterparty risk is further mitigated due to the monthly settlement of both the interest portion of the embedded derivatives referencing the Notes Payable and the TRS. If the Company were to determine that counterparty risk were material, an adjustment to the fair value of the TRS would be made. The embedded derivatives in the Notes Payable and the TRS have been categorized in Level 3 of the fair value hierarchy. See Note 5 and Note 6 for more detail.
Investments for which market quotations are not readily available or may be considered unreliable are fair valued, in good faith, using a method determined to be appropriate in the given circumstances. The valuation methods used include the Cost Approach, the Market Approach and the Income Approach. Inputs used in these approaches may include, but are not limited to, interest rate yield curves, credit spreads, recovery rates, comparable company transactions, trading multiples, and volatilities. The valuation method of the Company may change as changes in the underlying company dictates, such as moving from the Cost Approach to Market Approach when underlying conditions change at the company. Because of the inherent uncertainty of valuation
88
Table of Contents
in these circumstances, the estimated fair values for the aforementioned investments may differ significantly from values that would have been used had a ready and liquid market for such investments existed or from the amounts that might ultimately be realized, and such differences could be material.
The Company’s valuation policies and procedures are developed by the Investment Manager, which is also responsible for ensuring that the valuation policies and procedures are consistently applied across all investments of the Company and adopted by the board of directors. The valuations are continuously monitored and the valuation process for Level 3 investments is completed on a quarterly basis and is designed to subject the valuation of Level 3 investments to an appropriate level of consistency, oversight and review. The valuation process begins with each portfolio company or investment being initially valued by the investment professionals of the Investment Manager responsible for the portfolio investment. These investment professionals prepare the preliminary valuations based on their evaluation of financial and operating data, company specific developments, market valuations of comparable securities from the same company or that of comparable companies as well as any other relevant factors including recent purchases and sales that may have occurred preceding month-end.
Valuation models are typically calibrated upon initial funding, and are re-calibrated as necessary upon subsequent material events (including, but not limited to additional financing activity, changes in comparable companies, and recent trades). The preliminary valuation conclusions are then documented and discussed with senior management of the Investment Manager. On a periodic basis and at least once annually, independent valuation firm(s) engaged by the Company conduct independent appraisals and review the Investment Manager’s preliminary valuations and make their own independent assessment. The Valuation Committee of the Company’s board of directors then reviews the preliminary valuations of the Investment Manager and that of the independent valuation firm. The Valuation Committee discusses the valuations and makes a recommendation to the Company’s Board of Directors regarding the fair value of each investment in good faith based on the input of the Investment Manager and the independent valuation firm. Upon recommendation by the Valuation Committee and a review of the valuation materials of the Investment Manager and the third party independent valuation firm, the Board of Directors of the Company determines the fair value of each investment.
For more information on the classification of the Company’s investments by major categories, see Note 5.
The fair value of the Company’s assets and liabilities that qualify as financial instruments under U.S. GAAP approximates the carrying amounts presented in the Consolidated Statements of Assets and Liabilities.
i. Income Taxes
The Company intends to elect to be treated for federal income tax purposes as a RIC under Subchapter M of the Internal Revenue Code. To qualify and maintain qualification as a RIC, the Company must, among other things, meet certain source of income and asset diversification requirements and distribute to shareholders, for each taxable year, at least 90% of the Company’s “investment company taxable income,’’ which is generally the Company’s net ordinary income plus the excess, if any, of realized net short-term capital gains over realized net long-term capital losses. If the Company continues to qualify as a RIC and continues to satisfy the annual distribution requirement, the Company will not have to pay corporate level federal income taxes on any income that the Company distributes to its shareholders. The Company intends to make distributions in an amount sufficient to maintain RIC status each year and to avoid any federal income taxes on income. The company will also be subject to nondeductible federal excise taxes if the Company does not distribute at least 98% of net ordinary income, 98.2% of any capital gains, if any, and any recognized and undistributed income from prior year for which it paid no federal income taxes.
U.S. GAAP requires the evaluation of tax positions taken or expected to be taken in the course of preparing the Company’s tax returns to determine whether the tax positions are “more-likely-than-not” of being sustained by the applicable tax authority. Tax positions not deemed to meet a more-likely-than-not threshold would be recorded as a tax expense in the current year. The Company’s policy is to recognize accrued interest and penalties associated with uncertain tax positions as part of the tax provision.
89
Table of Contents
The Company has analyzed such tax positions and has concluded that no unrecognized tax benefits should be recorded for uncertain tax positions for any tax year since inception. Each of the tax years since inception remain subject to examination by taxing authorities. This conclusion may be subject to review and adjustment at a later date based on factors, including but not limited to, ongoing analysis and changes to laws, regulations, and interpretations thereof.
Permanent differences between investment company taxable income and net investment income for financial reporting purposes are reclassified among capital accounts in the financial statements to reflect their tax character. Differences in classification may also result from the treatment of short-term gains as ordinary income for tax purposes. During the year ended June 30, 2014, the Company reclassified for book purposes amounts arising from permanent book/tax differences related to the different tax treatment of paydown gains and losses, distribution re-designations and premium amortization as follows:
| As of June 30, 2014 |
||||
| Capital in excess of par value |
$ | 90,599 | ||
| Distributions in excess of net investment income |
72,031 | |||
| Accumulated net realized gain |
(162,630 | ) | ||
The tax character of distributions paid by the Company were all ordinary income.
At June 30, 2014, the components of distributable earnings on a tax basis detailed below differ from the amounts reflected in the Company’s Consolidated Statement of Assets and Liabilities by temporary and other book/tax differences, primarily relating to the tax treatment of dividends payable and premium amortization accruals, as follows:
| As of June 30, 2014 |
||||
| Undistributed net investment income |
$ | 3,976,661 | ||
| Accumulated capital gains (losses) |
— | |||
| Other temporary differences |
— | |||
| Unrealized appreciation (depreciation) |
482,682 | |||
| Distributions payable |
(4,612,500 | ) | ||
|
|
|
|||
| Components of tax distributable earnings at year end |
$ | (153,157 | ) | |
|
|
|
|||
j. Reclassifications
Certain 2012 and 2013 amounts have ben reclassified to conform to the 2014 presentation.
Note 3. New Accounting Pronouncements
During the twelve months ended June 30, 2014, the Company adopted Accounting Standards Update 2011-11, “Disclosures about Offsetting Assets and Liabilities” (“ASU 2011-11”). The amendments in ASU 2011-11 are intended to create a converged offsetting model that would eliminate a significant quantitative difference between statements of assets and liabilities prepared under U.S. GAAP and IFRS. ASU 2011-11 requires additional disclosures for recognized financial and derivative instruments that are either offset on the Consolidated Statement of Assets and Liabilities or are subject to an enforceable master netting agreement. The adoption of ASU 2011-11 did not have a material impact on the Company’s disclosures.
In June 2013, the Financial Accounting Standards Board issued Accounting Standards Update (“ASU”) 2013-08, Financial Services—Investment Companies (Topic 946): Amendments to the Scope, Measurement, and Disclosure Requirements (“ASU 2013-08”). ASU 2013-08 amends the criteria that define an investment
90
Table of Contents
company, clarifies the measurement guidance and requires certain additional disclosures, including (i) the type and amount of financial support provided to investee companies, including situations in which the Company assisted an investee in obtaining financial support, (ii) the primary reasons for providing the financial support, (iii) the type and amount of financial support the Company is contractually required to provide to an investee, but has not yet provided, and (iv) the primary reasons for the contractual requirement to provide the financial support. The amendments in ASU 2013-08 are effective for an entity’s interim and annual reporting periods in fiscal years that begin after December 15, 2013. Earlier application is prohibited. The Company is currently evaluating the impact this accounting standards update will have on the Company’s financial statements.
From time to time, new accounting pronouncements are issued by the Financial Accounting Standards Board (“FASB”) or other standards setting bodies that are adopted by the Company as of the specified effective date. The Company believes that the impact of recently issued standards that are not yet effective will not have a material impact on its financial statements upon adoption.
Note 4. Due from and due to Broker
Due from and due to brokers consists of cash in U.S. dollars held as collateral and payments due from UBS in connection with the TRS.
The Company’s principal trading activities are primarily with brokers and other financial institutions located in North America.
Note 5. Investments
The Company’s investments at any time may include securities and other financial instruments or other assets of any sort, including, without limitation, corporate and government bonds, convertible securities, collateralized loan obligations, term loans, trade claims, equity securities, privately negotiated securities, direct placements, working interests, warrants and investment derivatives (such as credit default swaps, recovery swaps, total return swaps, options, forward contracts, and futures) (all of the foregoing collectively referred to in these financial statements as “investments”).
a. Certain Risk Factors
In the ordinary course of business, the Company manages a variety of risks including market risk, liquidity risk and credit risk. The Company identifies, measures and monitors risk through various control mechanisms, including trading limits and diversifying exposures and activities across a variety of instruments, markets and counterparties.
Market risk is the risk of potential adverse changes to the value of financial instruments because of changes in market conditions, including as a result of changes in the credit quality of a particular issuer, credit spreads, interest rates, and other movements and volatility in security prices or commodities. In particular, the Company may invest in issuers that are experiencing or have experienced financial or business difficulties (including difficulties resulting from the initiation or prospect of significant litigation or bankruptcy proceedings), which involves significant risks. The Company manages its exposure to market risk through the use of risk management strategies and various analytical monitoring techniques.
The Company’s assets may, at any time, include securities and other financial instruments or obligations that are illiquid or thinly traded, making purchase or sale of such securities and financial instruments at desired prices or in desired quantities difficult. Furthermore, the sale of any such investments may be possible only at substantial discounts, and it may be extremely difficult to value any such investments accurately.
91
Table of Contents
Credit risk is the potential loss the Company may incur from a failure of an issuer to make payments according to the terms of a contract. The Company is subject to credit risk because of its strategy of investing in the debt of leveraged companies and its involvement in derivative instruments. The Company’s exposure to credit risk on its investments is limited to the fair value of the investments. The Company’s TRS contracts are executed pursuant to an International Swaps and Derivatives Association (“ISDA”) master agreement that the Company currently has in place with UBS. At June 30, 2014, the Company had all of its counterparty credit risk associated with non-performance for swaps with UBS. With regard to derivatives, the Company attempts to limit its credit risk by considering its counterparty’s (or its guarantor’s) credit rating. The Company’s policy is to not hold counterparty collateral on ISDA agreements, but would do so if the exposure were material.
b. Investments
Investment purchases, sales and principal payments/paydowns are summarized below for the twelve months ended June 30, 2014 and June 30, 2013 and from March 7, 2012 (inception) through June 30, 2012. These purchase and sale amounts exclude derivative instruments.
| Period Ended June 30, | ||||||||||||
| 2014 | 2013 | 2012 | ||||||||||
| Investment purchases, at cost (including PIK interest) |
$ | 278,850,423 | $ | 133,955,675 | $ | 25,573,961 | ||||||
| Investment sales and repayments |
125,129,039 | 38,236,069 | 4,007,538 | |||||||||
The composition of the Company’s investments as of June 30, 2014 as a percentage of the total portfolio, at amortized cost and fair value are as follows:
| Investments at Amortized Cost |
Percentage | Investments at Fair Value |
Percentage | |||||||||||||
| Senior Secured First Lien Term Loans |
$ | 112,820,980 | 41.53 | % | $ | 112,078,038 | 40.95 | % | ||||||||
| Senior Secured Second Lien Term Loans |
131,971,037 | 48.57 | 133,606,964 | 48.81 | ||||||||||||
| Senior Secured Notes |
25,118,675 | 9.25 | 25,963,581 | 9.49 | ||||||||||||
| Warrants |
1,771,566 | 0.65 | 2,061,882 | 0.75 | ||||||||||||
| Total Return Swaps |
— | — | 563,866 | 0.21 | ||||||||||||
| Embedded derivatives - Notes Payable |
— | — | (563,866 | ) | (0.21 | ) | ||||||||||
|
|
|
|
|
|
|
|
|
|||||||||
| Total |
$ | 271,682,258 | 100.00 | % | $ | 273,710,465 | 100.00 | % | ||||||||
|
|
|
|
|
|
|
|
|
|||||||||
The composition of the Company’s investments as of June 30, 2013 as a percentage of the total portfolio, at amortized cost and fair value are as follows:
| Investments at Amortized Cost |
Percentage | Investments at Fair Value |
Percentage | |||||||||||||
| Senior Secured First Lien Term Loans |
$ | 74,730,786 | 63.25 | % | $ | 74,807,541 | 62.75 | % | ||||||||
| Senior Secured Second Lien Term Loans |
23,231,204 | 19.66 | 23,448,281 | 19.67 | ||||||||||||
| Senior Secured Notes |
19,783,415 | 16.75 | 20,397,491 | 17.11 | ||||||||||||
| Warrants |
397,557 | 0.34 | 555,971 | 0.47 | ||||||||||||
| Total Return Swaps |
— | — | 843,864 | 0.71 | ||||||||||||
| Embedded derivatives - Notes Payable |
— | — | (843,864 | ) | (0.71 | ) | ||||||||||
|
|
|
|
|
|
|
|
|
|||||||||
| Total |
$ | 118,142,962 | 100.00 | % | $ | 119,209,284 | 100.00 | % | ||||||||
|
|
|
|
|
|
|
|
|
|||||||||
92
Table of Contents
The following table shows the portfolio composition by industry grouping at fair value at June 30, 2014:
| Investments at Fair Value |
Percentage of Total Portfolio |
|||||||
| Telecommunications |
$ | 52,951,718 | 19.35 | % | ||||
| Healthcare-Products/Services |
48,809,000 | 17.83 | ||||||
| Oil and Gas |
44,851,667 | 16.39 | ||||||
| Trucking and Leasing |
14,962,313 | 5.47 | ||||||
| Entertainment and Leisure |
14,775,750 | 5.40 | ||||||
| Industrial |
14,775,000 | 5.40 | ||||||
| Retail |
14,152,936 | 5.17 | ||||||
| Automobiles and Components |
12,960,000 | 4.73 | ||||||
| Airlines |
12,448,518 | 4.55 | ||||||
| Pipelines |
9,997,775 | 3.65 | ||||||
| Services |
8,596,876 | 3.14 | ||||||
| Oilfield Services |
8,577,783 | 3.13 | ||||||
| Diversified Financial Services |
5,976,129 | 2.18 | ||||||
| Commercial Services |
4,925,000 | 1.80 | ||||||
| Construction & Building |
4,950,000 | 1.81 | ||||||
|
|
|
|
|
|||||
| Total |
$ | 273,710,465 | 100.00 | % | ||||
|
|
|
|
|
|||||
The following table shows the portfolio composition by industry grouping at fair value at June 30, 2013:
| Investments at Fair Value |
Percentage of Total Portfolio |
|||||||
| Telecommunications |
$ | 36,128,920 | 30.31 | % | ||||
| Oil and Gas |
28,085,722 | 23.56 | ||||||
| Automobiles and Components |
15,680,000 | 13.15 | ||||||
| Trucking and Leasing |
11,870,660 | 9.96 | ||||||
| Airlines |
10,821,045 | 9.08 | ||||||
| Pipelines |
10,050,000 | 8.43 | ||||||
| Diversified Financial Services |
6,572,937 | 5.51 | ||||||
|
|
|
|
|
|||||
| Total |
$ | 119,209,284 | 100.00 | % | ||||
|
|
|
|
|
|||||
The following table shows the portfolio composition by geographic grouping at fair value at June 30, 2014:
| Investments at Fair Value |
Percentage of Total Portfolio |
|||||||
| U.S. Southwest |
$ | 69,260,200 | 25.30 | % | ||||
| U.S. Mid-Atlantic |
64,371,690 | 23.52 | ||||||
| U.S. Southeast |
48,385,000 | 17.68 | ||||||
| U.S. Midwest |
46,930,406 | 17.15 | ||||||
| U.S. West |
34,765,394 | 12.70 | ||||||
| U.S. Northeast |
9,997,775 | 3.65 | ||||||
|
|
|
|
|
|||||
| Total |
$ | 273,710,465 | 100.00 | % | ||||
|
|
|
|
|
|||||
93
Table of Contents
The following table shows the portfolio composition by geographic grouping at fair value at June 30, 2013:
| Investments at Fair Value |
Percentage of Total Portfolio |
|||||||
| U.S. Midwest |
$ | 43,038,160 | 36.11 | % | ||||
| U.S. Mid-Atlantic |
37,186,774 | 31.19 | ||||||
| U.S. Southwest |
18,113,305 | 15.19 | ||||||
| U.S. West |
10,821,045 | 9.08 | ||||||
| U.S. Northeast |
10,050,000 | 8.43 | ||||||
|
|
|
|
|
|||||
| Total |
$ | 119,209,284 | 100.00 | % | ||||
|
|
|
|
|
|||||
c. Derivatives
Derivative contracts include total return swaps and embedded derivatives in Notes Payable. The Company enters into derivative contracts as part of its investment strategies.
The Company and UBS entered into two TRS transactions whereby the Company will receive the Total Return of the Notes and the Revolving Notes (as defined in Note 6) purchased by UBS and pay the Financing Rate and the Revolver Financing Rate (both as defined in Note 6). Therefore, amounts required for the future satisfaction of the swaps may be greater or less than the amount recorded. Realized and change in unrealized gains and losses on total return swaps, if any, are included in the net realized gain or loss on derivatives, and net change in unrealized appreciation (depreciation) on derivatives in the Consolidated Statement of Operations.
In connection with the TRS transactions the Company entered into an International Swaps and Derivatives Association, Inc. Master Agreements (“ISDA Agreement”) with UBS. The ISDA Agreement includes provisions for general obligations, representations, collateral and events of default or termination. Under an ISDA Agreement, the Company typically may offset with the counterparty certain derivative payable and/or receivable with collateral held and/or posted and create one single net payment (close-out netting) in the event of default or termination.
The Company’s ISDA Agreements may contain provisions for early termination of OTC derivative transactions in the event the net assets of the Company decline below specific levels (“net asset contingent features”). If these levels are triggered, the Company’s counterparty has the right to terminate such transaction and require the Company to pay or receive a settlement amount in connection with the terminated transaction.
The Company has determined that each of the Notes Payable from SPV to UBS (discussed further in Note 6) contain an embedded derivative. SPV is obligated to pay UBS the net appreciation (depreciation) of the SPV Assets as well as pay any income generated by the SPV Assets until maturity. Therefore, amounts required for the future satisfaction of the note may be greater or less than the amount recorded. Realized and change in unrealized gains and losses on the embedded derivatives are included in the net realized gain or loss on derivatives, and net change in unrealized appreciation (depreciation) on derivatives in the Consolidated Statement of Operations.
94
Table of Contents
The following table reflects the fair value and notional amount or number of contracts of the Company’s derivative contracts, none of which were designated as hedging instruments under U.S. GAAP, which are presented on a gross basis, at June 30, 2014.
| Assets | Liabilities | Notional | Contracts | |||||||||||||
| Credit Risk: |
||||||||||||||||
| Total Return Swaps |
$ | 563,866 | $ | — | 126,500,000 | 2 | ||||||||||
| Embedded derivatives |
||||||||||||||||
| Notes Payable |
— | 563,866 | 126,500,000 | 2 | ||||||||||||
|
|
|
|
|
|||||||||||||
| Gross fair value of derivative contracts |
$ | 563,866 | $ | 563,866 | ||||||||||||
| Counterparty netting |
— | — | ||||||||||||||
|
|
|
|
|
|||||||||||||
| Net fair value of derivative contracts |
563,866 | 563,866 | ||||||||||||||
| Collateral not offset |
— | — | ||||||||||||||
|
|
|
|
|
|||||||||||||
| Net amount |
$ | 563,866 | $ | 563,866 | ||||||||||||
|
|
|
|
|
|||||||||||||
In the preceding table, the number of contracts as of June 30, 2014 is reflective of the volume of derivatives activity during the period.
The following table reflects the fair value and notional amount or number of contracts of the Company’s derivative contracts, none of which were designated as hedging instruments under U.S. GAAP, which are presented on a gross basis, at June 30, 2013.
| Assets | Liabilities | Notional | Contracts | |||||||||||||
| Credit Risk: |
||||||||||||||||
| Total Return Swaps |
$ | 843,864 | $ | — | 76,500,000 | 1 | ||||||||||
| Embedded derivatives |
||||||||||||||||
| Note Payable |
— | (843,864 | ) | 76,500,000 | 1 | |||||||||||
|
|
|
|
|
|||||||||||||
| Gross fair value of derivative contracts |
$ | 843,864 | $ | (843,864 | ) | |||||||||||
|
|
|
|
|
|||||||||||||
In the preceding table, the number of contracts as of June 30, 2013 is reflective of the volume of derivatives activity during the period.
The following table reflects the amount of gains (losses) on derivatives included in the Consolidated Statement of Operations for the years ended June 30, 2014 and June 30, 2013, respectively. None of the derivatives were designated as hedging instruments under U.S. GAAP.
| Included in net change in unrealized (depreciation) appreciation on investments and derivatives as of June 30, 2014 |
Included in net change in unrealized (depreciation) appreciation on investments and derivatives as of June 30, 2013 |
|||||||
| Total Return Swaps |
$ | 279,998 | $ | (843,864 | ) | |||
| Embedded derivatives Notes Payable |
(279,998 | ) | 843,864 | |||||
|
|
|
|
|
|||||
| Total |
$ | — | $ | — | ||||
|
|
|
|
|
|||||
d. Fair Value Measurements
ASC 820 defines fair value as the price that would be received to sell an asset, or paid to transfer a liability, in an orderly transaction between market participants at the measurement date. ASC 820 also establishes a framework for measuring fair value and a valuation hierarchy that prioritizes the inputs used in the valuation of
95
Table of Contents
an asset or liability based upon their transparency. The valuation hierarchy gives the highest priority to unadjusted quoted prices in active markets for identical assets or liabilities (Level 1) and the lowest priority to unobservable inputs (Level 3). Classification within the hierarchy is based upon the lowest level of input that is significant to the fair value measurement. The Company’s assets and liabilities measured at fair value have been classified in the following three categories:
Level 1—valuation is based on unadjusted quoted prices in active markets for identical assets or liabilities that the Company has the ability to access at the measurement date.
Level 2—valuation is based on inputs other than quoted prices included within Level 1 that are observable for the asset or liability, either directly or indirectly, such as (a) quoted prices for similar assets or liabilities in active markets; (b) quoted prices for identical or similar assets or liabilities in markets that are not active, that is, markets in which there are few transactions for the asset or liability, the prices are not current, or price quotations vary substantially either over time or among market makers, or in which little information is released publicly; (c) inputs other than quoted prices that are observable for the asset or liability; or (d) inputs that are derived principally from or corroborated by observable market data by correlation or other means.
Level 3—valuation is based on unobservable inputs for the asset or liability. Unobservable inputs are used to measure fair value to the extent that observable inputs are not available, thereby allowing for situations in which there is little, if any, market activity for the asset or liability at the measurement date. However, the fair value measurement objective remains the same, that is, an exit price from the perspective of a market participant that holds the asset or owes the liability. Therefore, unobservable inputs reflect the Company’s own assumptions about the assumptions that market participants would use in pricing the asset or liability, including assumptions about risk. Unobservable inputs are developed based on the best information available in the circumstances, which might include the Company’s own data. The Company’s own data used to develop unobservable inputs is adjusted if information is reasonably available without undue cost and effort that indicates that market participants would use different assumptions.
The availability of observable inputs can vary from security to security and is affected by a wide variety of factors, including, for example, the type of security, whether the security is new and not yet established in the marketplace, the liquidity of the market and other characteristics particular to the security. To the extent that valuation is based on models or inputs that are less observable or unobservable in the market, the determination of fair value requires more judgment. Accordingly, the degree of judgment exercised in determining fair value is greatest for instruments categorized in Level 3.
Estimates of fair value for cash and restricted cash are measured using observable, quoted market prices, or Level 1 inputs. All other fair value significant estimates are measured using unobservable inputs, or Level 3 inputs.
96
Table of Contents
The following table summarizes the classifications within the fair value hierarchy of the Company’s assets and liabilities measured at fair value as of June 30, 2014:
| Fair Value Measurements as of June 30, 2014 | ||||||||||||||||
| Level 1 | Level 2 | Level 3 | Total | |||||||||||||
| Assets |
||||||||||||||||
| Investments |
||||||||||||||||
| Senior Secured First Lien Term Loans |
$ | — | $ | — | $ | 112,078,038 | $ | 112,078,038 | ||||||||
| Senior Secured Second Lien Term Loans |
— | — | 133,606,964 | 133,606,964 | ||||||||||||
| Senior Secured Notes |
— | — | 25,963,581 | 25,963,581 | ||||||||||||
| Warrants |
— | — | 2,061,882 | 2,061,882 | ||||||||||||
|
|
|
|
|
|
|
|
|
|||||||||
| Total Investments |
— | — | 273,710,465 | 273,710,465 | ||||||||||||
| Derivatives |
||||||||||||||||
| Total Return Swaps |
— | — | 563,866 | 563,866 | ||||||||||||
|
|
|
|
|
|
|
|
|
|||||||||
| Total Derivatives |
— | — | 563,866 | 563,866 | ||||||||||||
|
|
|
|
|
|
|
|
|
|||||||||
| Total Assets |
$ | — | $ | — | $ | 274,274,331 | $ | 274,274,331 | ||||||||
|
|
|
|
|
|
|
|
|
|||||||||
| Liabilities |
||||||||||||||||
| Derivatives |
||||||||||||||||
| Embedded derivative |
||||||||||||||||
| Note Payable |
— | — | 563,866 | 563,866 | ||||||||||||
|
|
|
|
|
|
|
|
|
|||||||||
| Total Derivatives |
— | — | 563,866 | 563,866 | ||||||||||||
|
|
|
|
|
|
|
|
|
|||||||||
| Total Liabilities |
$ | — | $ | — | $ | 563,866 | $ | 563,866 | ||||||||
|
|
|
|
|
|
|
|
|
|||||||||
The following table summarizes the classifications within the fair value hierarchy of the Company’s assets and liabilities measured at fair value as of June 30, 2013:
| Fair Value Measurements as of June 30, 2013 | ||||||||||||||||
| Level 1 | Level 2 | Level 3* | Total | |||||||||||||
| Assets |
||||||||||||||||
| Investments |
||||||||||||||||
| Senior Secured First Lien Term Loans |
$ | — | $ | — | $ | 74,807,541 | $ | 74,807,541 | ||||||||
| Senior Secured Second Lien Term Loans |
— | — | 23,448,281 | 23,448,281 | ||||||||||||
| Senior Secured Notes |
— | — | 20,397,491 | 20,397,491 | ||||||||||||
| Warrants |
— | — | 555,971 | 555,971 | ||||||||||||
|
|
|
|
|
|
|
|
|
|||||||||
| Total Investments |
— | — | 119,209,284 | 119,209,284 | ||||||||||||
| Derivatives |
||||||||||||||||
| Total Return Swaps |
— | — | 843,864 | 843,864 | ||||||||||||
|
|
|
|
|
|
|
|
|
|||||||||
| Total Derivatives |
— | — | 843,864 | 843,864 | ||||||||||||
|
|
|
|
|
|
|
|
|
|||||||||
| Total Assets |
$ | — | $ | — | $ | 120,053,148 | $ | 120,053,148 | ||||||||
|
|
|
|
|
|
|
|
|
|||||||||
| Liabilities |
||||||||||||||||
| Derivatives |
||||||||||||||||
| Embedded derivative |
||||||||||||||||
| Note Payable |
— | — | 843,864 | 843,864 | ||||||||||||
|
|
|
|
|
|
|
|
|
|||||||||
| Total Derivatives |
— | — | 843,864 | 843,864 | ||||||||||||
|
|
|
|
|
|
|
|
|
|||||||||
| Total Liabilities |
$ | — | $ | — | $ | 843,864 | $ | 843,864 | ||||||||
|
|
|
|
|
|
|
|
|
|||||||||
| * | Total Level 3 includes fair value of unfunded commitments of $16,832,435 on revolving credit facilities and delayed draw term loan facilities. |
97
Table of Contents
The following table provides a reconciliation of the beginning and ending balances for investments that use Level 3 inputs for the twelve months ended June 30, 2014:
| Senior Secured First Lien Term Loans |
Senior Secured Second Lien Term Loans |
Senior Secured Notes |
Unsecured Debt |
Warrants | Total Investments |
|||||||||||||||||||
| Balance as of June 30, 2013 |
$ | 74,807,541 | $ | 23,448,281 | $ | 20,397,491 | $ | — | $ | 555,971 | $ | 119,209,284 | ||||||||||||
| Purchases (including PIK interest) |
107,476,264 | 129,506,004 | 25,681,646 | 14,812,500 | 1,374,009 | 278,850,423 | ||||||||||||||||||
| Sales |
(68,829,644 | ) | (20,919,860 | ) | (20,256,000 | ) | (15,123,535 | ) | — | (125,129,039 | ) | |||||||||||||
| Amortization |
279,676 | 130,914 | 3,800 | 187,500 | — | 601,890 | ||||||||||||||||||
| Net realized gains (losses) |
(836,102 | ) | 22,775 | (94,186 | ) | 123,535 | — | (783,978 | ) | |||||||||||||||
| Net change in unrealized (depreciation) appreciation |
(819,697 | ) | 1,418,850 | 230,830 | — | 131,902 | 961,885 | |||||||||||||||||
|
|
|
|
|
|
|
|
|
|
|
|
|
|||||||||||||
| Balance as of June 30, 2014 |
$ | 112,078,038 | $ | 133,606,964 | $ | 25,963,581 | $ | — | $ | 2,061,882 | $ | 273,710,465 | ||||||||||||
|
|
|
|
|
|
|
|
|
|
|
|
|
|||||||||||||
| Change in unrealized gains (losses) relating to assets and liabilities still held as of June 30, 2014 |
$ | (1,008,131 | ) | $ | 1,197,899 | $ | 230,830 | $ | — | $ | 131,902 | $ | 552,500 | |||||||||||
|
|
|
|
|
|
|
|
|
|
|
|
|
|||||||||||||
| Total Return Swaps |
Embedded derivatives - Notes Payable |
Total Derivatives |
||||||||||
| Balance as of June 30, 2013 |
$ | 843,864 | $ | (843,864 | ) | $ | — | |||||
| Purchases |
— | — | — | |||||||||
| Sales |
— | — | — | |||||||||
| Amortization |
— | — | — | |||||||||
| Net realized gains (losses) |
— | — | — | |||||||||
| Net change in unrealized (depreciation) appreciation |
(279,998 | ) | 279,998 | — | ||||||||
|
|
|
|
|
|
|
|||||||
| Balance as of June 30, 2014 |
$ | 563,866 | $ | (563,866 | ) | $ | — | |||||
|
|
|
|
|
|
|
|||||||
| Change in unrealized gains (losses) relating to assets and liabilities still held as of June 30, 2014 |
$ | (279,998 | ) | $ | 279,998 | $ | — | |||||
|
|
|
|
|
|
|
|||||||
98
Table of Contents
The following table provides a reconciliation of the beginning and ending balances for investments that use Level 3 inputs for the twelve months ended June 30, 2013:
| Senior Secured First Lien Term Loans |
Senior Secured Second Lien Term Loans |
Senior Secured Notes |
Warrants | Total Investments |
||||||||||||||||
| Balance as of June 30, 2012 |
$ | 21,571,479 | $ | — | $ | — | $ | — | $ | 21,571,479 | ||||||||||
| Purchases (including PIK interest) |
86,991,984 | 26,829,052 | 19,737,082 | 397,557 | 133,955,675 | |||||||||||||||
| Sales |
(34,543,042 | ) | (3,693,027 | ) | — | — | (38,236,069 | ) | ||||||||||||
| Amortization |
14,935 | 2,889 | 46,334 | — | 64,158 | |||||||||||||||
| Net realized gains (losses) |
688,972 | 92,290 | — | — | 781,262 | |||||||||||||||
| Net change in unrealized appreciation (depreciation) |
83,213 | 217,077 | 614,075 | 158,414 | 1,072,779 | |||||||||||||||
|
|
|
|
|
|
|
|
|
|
|
|||||||||||
| Balance as of June 30, 2013 |
$ | 74,807,541 | $ | 23,448,281 | $ | 20,397,491 | $ | 555,971 | $ | 119,209,284 | ||||||||||
|
|
|
|
|
|
|
|
|
|
|
|||||||||||
| Change in unrealized gains (losses) relating to assets and liabilities still held as of June 30, 2013 |
$ | 171,819 | $ | 217,077 | $ | 614,075 | $ | 158,414 | $ | 1,161,385 | ||||||||||
|
|
|
|
|
|
|
|
|
|
|
|||||||||||
| Total Return Swaps |
Embedded derivatives - Notes Payable |
Total Derivatives |
||||||||||
| Balance as of June 30, 2012 |
$ | — | $ | — | $ | — | ||||||
| Purchases |
— | — | — | |||||||||
| Sales |
— | — | — | |||||||||
| Amortization |
— | — | — | |||||||||
| Net realized gains (losses) |
— | — | — | |||||||||
| Net change in unrealized (depreciation) appreciation |
843,864 | (843,864 | ) | — | ||||||||
|
|
|
|
|
|
|
|||||||
| Balance as of June 30, 2013 |
$ | 843,864 | $ | (843,864 | ) | $ | — | |||||
|
|
|
|
|
|
|
|||||||
| Change in unrealized gains (losses) relating to assets and liabilities still held as of June 30, 2013 |
$ | 843,864 | $ | (843,864 | ) | $ | — | |||||
|
|
|
|
|
|
|
|||||||
Transfers into Level 3 during or at the end of the reporting period are reported under Level 1 or Level 2 as of the beginning of the period. Transfers out of Level 3 during or at the end of the reporting period are reported under Level 3 as of the beginning of the period. Changes in unrealized gains (losses) relating to Level 3 instruments are included in net change in unrealized (depreciation) appreciation on investments and derivatives on the Consolidated Statement of Operations.
During the twelve months ended June 30, 2014 and June 30, 2013, the Company did not transfer any investments between Levels 1 and 2 and 3.
The following tables present the ranges of significant unobservable inputs used to value the Company’s Level 3 investments as of June 30, 2014 and June 30, 2013. These ranges represent the significant unobservable inputs that were used in the valuation of each type of investment. These inputs are not representative of the inputs that could have been used in the valuation of any one investment. For example, the highest market yield presented in the table for senior secured notes is appropriate for valuing a specific investment but may not be
99
Table of Contents
appropriate for valuing any other investment. Accordingly, the ranges of inputs presented below do not represent uncertainty in, or possible ranges of, fair value measurements of the Company’s Level 3 investments.
| Fair Value as of June 30, 2014 |
Valuation Methodology |
Unobservable Input(s) |
Weighted Average |
Range | ||||||||||
| Senior Secured First Lien Term Loans |
$ | 112,078,038 | Yield Analysis | Market Yields | 12.7 | % | 9.9% - 14.5% | |||||||
| Broker Quoted | ||||||||||||||
| Collateral Coverage | ||||||||||||||
| Senior Secured Second Lien Term Loans |
133,606,964 | Yield Analysis | Market Yields | 11.4 | % | 9.6% - 12.4% | ||||||||
| Broker Quoted | ||||||||||||||
| Collateral Coverage | ||||||||||||||
| Senior Secured Notes |
25,963,581 | Yield Analysis | Market Yields | 16.4 | % | 15.0% - 18.1% | ||||||||
| Broker Quoted | ||||||||||||||
| Collateral Coverage | ||||||||||||||
| Warrants |
2,061,882 | EV Multiple | LTM EBITDA | 7.6x | 7.5x - 7.8x | |||||||||
| Option Analysis | Asset Volatility | 25 | % | N/A | ||||||||||
| Equity Volatility | 87 | % | N/A | |||||||||||
| Illiquidity Discount | 21 | % | 9% - 50% | |||||||||||
| Total Return Swaps |
563,866 | Other Approach | Intrinsic value | N/A | N/A | |||||||||
| Embedded derivatives - Note Payable |
(563,866 | ) | Other Approach | Intrinsic value | N/A | N/A | ||||||||
| Fair Value as of June 30, 2013 |
Valuation Methodology |
Unobservable Input(s) |
Weighted Average |
Range | ||||||||||
| Senior Secured First Lien Term Loans |
$ | 74,807,541 | Indicative Market Quotes | Broker quotes | N/A | N/A | ||||||||
| Senior Secured Second Lien Term Loans |
23,448,281 | Indicative Market Quotes | Broker quotes | N/A | N/A | |||||||||
| Senior Secured Notes |
10,425,074 | Market Comparables | Illiquidity discount | 3 | % | 3% | ||||||||
| PIK discount | 2.2 | % | 1.5% - 3% | |||||||||||
| Yield | 7.3 | % | 7.3% | |||||||||||
| 9,972,417 | Indicative Market Quotes |
Broker quotes |
N/A | N/A | ||||||||||
| Warrants |
395,971 | Market Comparables | Implied volatility | 37 | % | 37% | ||||||||
| 160,000 | Other Approach | Recent funding | N/A | N/A | ||||||||||
| Total Return Swaps |
843,864 | Other Approach | Intrinsic value | N/A | N/A | |||||||||
| Embedded derivatives - Note Payable |
(843,864 | ) | Other Approach | Intrinsic value | N/A | N/A | ||||||||
Fair value measurements categorized within Level 3 are sensitive to changes in the assumptions or methodology used to determine fair value and such changes could result in a significant increase or decrease in the fair value. Significant increases in illiquidity discounts, PIK discounts and market yields would result in significantly lower fair value measurements. Significant increases in implied volatility would result in significantly higher fair value measurements.
100
Table of Contents
Note 6. Notes Payable
On May 23, 2013, as amended on June 6, 2013, the Company, through SPV, entered into a $76.5 million financing transaction (the “Financing Facility”) due May 22, 2016 with UBS. The Financing Facility is collateralized by the portion of the Company’s assets held by SPV (the “SPV Assets”) and pledged as collateral as noted in the Consolidated Schedule of Investments. The Company will pay interest on the face amount of the Financing Facility monthly at a rate of one month LIBOR plus a spread that increases from 1.63% per annum from May 23, 2013 to July 14, 2013 to 1.97% per annum from July 15, 2013 to August 14, 2013 to 2.85% per annum from August 15, 2013 through the end of the term (the “Financing Rate”).
On December 5, 2013, the Company amended the terms of the Financing Facility to add a $50.0 million revolving financing (the “Revolving Financing”), which expires on December 4, 2015. The Revolving Financing bears interest at a rate of (a) 2.10% per annum from December 4, 2013 through December 4, 2014 and (b) 1.60% per annum from December 5, 2014 through the term of the Revolving Financing. With respect to undrawn amounts, the Company will pay interest monthly on the daily average of amounts that are not drawn on the Revolving Financing at a rate of 0.50% per annum (the “Revolver Financing Rate”). As of June 30, 2014, $9.1 million was outstanding on the Revolving Financing.
This financing transaction was executed in four steps:
First, the Company organized SPV, a consolidated wholly owned bankruptcy remote special purpose vehicle in the Cayman Islands to purchase the SPV Assets through (i) the issuance and sale of notes secured by the SPV Assets (the “Notes”) to UBS and the Company and (ii) the transfer of cash to the Company. UBS purchased Notes with a face value of $76.5 million, which represent 51% of the Notes issued and outstanding, for $76.5 million in cash. The Company purchased Notes with a face value of $73.5 million (which are eliminated in consolidation), which represent 49% of the Notes issued and outstanding. Under the terms of the indenture under which the Notes were issued (the “Indenture”), the holders of the Notes are entitled to (i) periodic interest payments equal to their pro rata portion of the interest collected on the assets held by SPV and (ii) their pro-rata portion of the net appreciation (depreciation) on the SPV Assets at maturity (the “Total Return of the Notes”) This represents the embedded derivative in the Note Payable from SPV to UBS.
Second, the Company and UBS entered into a TRS transaction whereby the Company will receive the Total Return of the Notes purchased by UBS and pay the Financing Rate.
Third, SPV issued and sold an additional $50 million notes (the “Revolving Notes”), secured by the SPV Assets to UBS. Cash is only exchanged when the revolving notes are drawn. Under the terms of the indenture under which the Revolving Notes were issued (the “Revolver Indenture”), the holders of the Revolving Notes are entitled to (i) periodic interest payments equal to their pro rata portion of the interest collected on the SPV Assets and (ii) their pro-rata portion of the net appreciation (depreciation) on the SPV Assets at maturity (the “Total Return of the Revolving Notes”). This represents the embedded derivative in the Note Payable from SPV to UBS.
Fourth, the Company and UBS entered into another TRS transaction whereby the Company will receive the Total Return of the Revolving Notes purchased by UBS and pay the Revolver Financing Rate.
The fair value of the Company’s notes payable is estimated based on the rate at which similar facilities would be priced. At June 30, 2014, the fair value of the notes payable was estimated at $85.6 million, which the Company concluded was a Level 3 fair value.
Cash, restricted (as shown on the Consolidated Statement of Assets and Liabilities) is held by the trustee of the Financing Facility and is restricted to purchases of investments by SPV that must meet certain eligibility criteria identified by the Indenture. As of June 30, 2014, SPV had assets of $184.8 million, which included
101
Table of Contents
$177.2 million of the Company’s portfolio investments at fair value, $0.5 million of accrued interest receivable and $7.1 million in cash held by the trustee of the Financing Facility. At June 30, 2014 and June 30, 2013, the carrying amount of the Notes approximates the fair value, which the Company concluded was a Level 3 fair value. For the twelve months ended June 30, 2014, the weighted average outstanding debt balance and the weighted average stated interest rate was $78.9 million and 2.44%, respectively.
Note 7. Indemnification, Guarantees, Commitments and Contingencies
In the normal course of business, the Company enters into contracts which provide a variety of representations and warranties, and that provide general indemnifications. Such contracts include those with certain service providers, brokers and trading counterparties. Any exposure to the Company under these arrangements is unknown as it would involve future claims that may be made against the Company; however, based on the Company’s experience, the risk of loss is remote and no such claims are expected to occur. As such, the Company has not accrued any liability in connection with such indemnifications.
Loans purchased by the Company may include revolving credit agreements or other financing commitments obligating the Company to advance additional amounts on demand. As of June 30, 2014, the Company held unfunded commitments in the amount of approximately $1.4 million and as of June 30, 2013, the Company held unfunded commitments in the amount of approximately $16.8 million.
The following table details the unfunded commitments as of June 30, 2014:
| Investments |
Amount | Non-use Fee | ||||||
| Butler Burgher Group LLC |
$ | 250,000 | 0.50 | % | ||||
| U.S. Well Services, LLC |
1,136,364 | 0.50 | % | |||||
|
|
|
|||||||
| Total Unfunded Commitments |
$ | 1,386,364 | ||||||
|
|
|
|||||||
The following table details the unfunded commitments as of June 30, 2013:
| Investments |
Amount | Non-use Fee | ||||||
| MF Global Holdings, Ltd. Exit Facility |
$ | 4,007,888 | 5.0 | % | ||||
| YRC Worldwide, Inc. Letter of Credit |
12,824,547 | 7.5 | % | |||||
|
|
|
|||||||
| Total Unfunded Commitments |
$ | 16,832,435 | ||||||
|
|
|
|||||||
Note 8. Agreements and Related Party Transactions
Related Party Transactions
Mr. Michael C. Mauer, the Company’s Chief Executive Officer, and Mr. Christopher E. Jansen, the Company’s President and Secretary and members of the Company’s board of directors together own 1.1% of the Company’s outstanding common stock, and Messrs. Mauer and Jansen also hold a 42.0% interest in the Investment Manager.
Stifel Venture Corp. (“Stifel”) owns 16.0% of the Company’s outstanding common stock, and also holds a 20.0% interest in the Investment Manager, and Mr. Stephan Kuppenheimer, an employee of Stifel, is a member of the Company’s board of directors and a member of the investment committee of the Investment Manager.
The Cyrus Funds own 27.9% of the Company’s outstanding common stock and a 38.0% economic interest in the Investment Manager.
102
Table of Contents
In connection with the Offering, the Investment Manager, paid (i) $3.45 million or 50% of the total underwriting costs, and (ii) offering costs in excess of the $1.2 million paid by Company.
Investment Advisory Agreement
On February 5, 2014, upon the Company’s election to be regulated as a BDC, the Company entered into an Investment Advisory Agreement with the Investment Manager. Pursuant to this agreement, the Company has agreed to pay to the Investment Manager a base management fee of 1.75% of gross assets, as adjusted, including assets purchased with borrowed funds or other forms of leverage and excluding cash and cash equivalents and “fair value of derivatives associated with the Company’s financing”, and an incentive fee consisting of two parts.
The first part which is calculated and payable quarterly in arrears, equals 20.0% of the “pre-incentive fee net investment income” (as defined in the agreement) for the immediately preceding quarter, subject to a hurdle rate of 2.0% per quarter (8.0% annualized), and is subject to a “catch-up” feature. The incentive fee is subject to a total return requirement, which provides that no incentive fee in respect of the Company’s pre-incentive fee net investment income will be payable except to the extent 20.0% of the cumulative net increase in net assets resulting from operations over the then current and 12 preceding quarters exceeds the cumulative incentive fees accrued and/or paid for the 12 preceding quarters. The net pre-incentive fee investment income used to calculate this part of the incentive fee is also included in the amount of the Company’s gross assets used to calculate the 1.75% base management fee.
The second part is calculated and payable in arrears as of the end of each calendar year and equals 20.0% of the aggregate cumulative realized capital gains from inception through the end of each calendar year, computed net of aggregate cumulative realized capital losses and aggregate cumulative unrealized capital depreciation through the end of such year, less the aggregate amount of any previously paid capital gain incentive fees.
The Investment Manager has agreed to permanently waive: (i) all or portions of base management fees through December 31, 2014, to the extent required to support an annualized dividend yield of 9.0% per annum based on the price per share of the Company’s common stock in the Offering, and (ii) all or portions of the incentive fee for 2014, 2015 and 2016, to the extent required to support an annualized dividend yield of 9.0%, 9.25% and 9.375% per annum, respectively, based on the price per share of the Company’s common stock in of the Offering. For the period from February 6, 2014 through June 30, 2014, $1.46 million in base management fees were earned by the Investment Manager, of which $1.14 million were waived. No incentive fees were earned by the Investment Manager during that period.
The Investment Advisory Agreement provides that, absent willful misfeasance, bad faith or gross negligence in the performance of its duties or by reason of the reckless disregard of its duties and obligations under the Investment Advisory Agreement, the Investment Manager and its officers, managers, partners, agents, employees, controlling persons and members, and any other person or entity affiliated with it, are entitled to indemnification from the Company for any damages, liabilities, costs and expenses (including reasonable attorneys’ fees and amounts reasonably paid in settlement) arising from the rendering of the Investment Manager’s services under the Investment Advisory Agreement or otherwise as the Investment Manager.
Prior to the Company’s election to be regulated as a BDC on February 5, 2014, no base or incentive management fees were due and payable.
Administration Agreement
The Company entered into an administration agreement with the Investment Manager pursuant to which the Investment Manager furnishes the Company with office facilities and equipment and will provide the Company with the clerical, bookkeeping, recordkeeping and other administrative services necessary to conduct day-to-day operations. Under this administration agreement, the Investment Manager will perform, or oversee the
103
Table of Contents
performance of, its required administrative services, which includes, among other things, being responsible for the financial records which it is required to maintain and preparing reports to its stockholders and reports filed with the SEC. There were $267,809 of such costs incurred under the administration agreement for the period from February 6, 2014 through June 30, 2014.
As of June 30, 2014, the Company recorded $132,619 in accrued expenses and other liabilities on its Consolidated Statement of Assets and Liabilities for reimbursement of expenses owed to the Investment Manager and $200,125 in prepaid expenses and other assets on its Consolidated Statement of Assets and Liabilities for reimbursement of expenses owed from the Investment Manager.
Under an administration agreement with the Investment Manager, the Investment Manager provides the Company with the Company’s chief financial officer, other accounting and back-office professionals, equipment and clerical, bookkeeping, recordkeeping and other administrative services at such facilities. The Investment Adviser has retained the services of accounting and back office professionals, including the Company’s chief financial officer, through a services agreement with the Cyrus Funds to assist the Investment Manager in fulfilling certain of its obligations to the Company under the administration agreement.
License Agreement
The Company has entered into a license agreement with the Investment Manager under which the Investment Manager has agreed to grant the Company a non-exclusive, royalty-free license to use the name “CM Finance.” Under this agreement, the Company has a right to use the “CM Finance” name for so long as the Investment Manager or one of its affiliates remains the Investment Manager. Other than with respect to this limited license, the Company has no legal right to the “CM Finance” name. This license agreement will remain in effect for so long as the Investment Advisory Agreement with the Investment Manager is in effect.
Stifel Arrangement
In December 2013, the Company entered into the Stifel Arrangement pursuant to which Stifel made a capital contribution to the Company on February 5, 2014 and has certain rights, such as a right to nominate for election a member of the Company’s board of directors. Stifel does not have any rights to exercise a controlling influence over the Company’s operations or the operations of the Company’s Investment Manager.
Six of the investment professionals employed by the Investment Manager as part of the investment team are also employees of Stifel. Although these investment professionals dedicate a majority of their time to the business and activities of the Investment Manager, they are dual employees of both Stifel and the Investment Manager, and as a result, may continue to engage in investment advisory activities for Stifel.
Note 9. Directors Fees
Each of the Company’s four independent directors receive (i) an annual fee of $75,000, and (ii) $2,500 plus reimbursement of reasonable out-of-pocket expenses incurred in connection with attending in person or telephonically each regular board of directors meeting and each special telephonic meeting. The Company’s independent directors also receive $1,000 plus reimbursement of reasonable out-of-pocket expenses incurred in connection with each committee meeting attended in person and each telephonic committee meeting. The chairman of the audit committee receives an annual fee of $7,500. The chairperson of the valuation committee, the nominating and corporate governance committee and the compensation committee received an annual fee of $2,500, $2,500 and $2,500, respectively. The Company has obtained directors’ and officers’ liability insurance on behalf of the Company’s directors and officers. Independent directors have the option of having their directors’ fees paid in shares of the Company’s common stock issued at a price per share equal to the greater of net asset value or the market price at the time of payment. For the twelve months ended June 30, 2014 and June 30, 2013, the Company recorded directors’ fees of $201,500 and $0, respectively, of which $0 and $0 was payable at June 30, 2014 and June 30, 2013, respectively.
104
Table of Contents
Note 10. Earnings Per Share
In accordance with the provisions of ASC Topic 260 – Earnings per Share (“ASC 260”), basic earnings per share is computed by dividing earnings available to common shareholders by the weighted average number of shares outstanding during the period. Other potentially dilutive common shares, and the related impact to earnings, are considered when calculating earnings per share on a diluted basis.
The following table sets forth the computation of the weighted average basic and diluted net increase in net assets per share from operations:
| Basic and Diluted Net Increase (Decrease) in Net Assets Per Share |
||||
| For the period from February 6, 2014 through June 30, 2014 |
||||
| Net increase in net assets resulting from operations attributable to CM Finance Inc |
$ | 6,956,182 | ||
| Weighted average shares outstanding |
13,666,666 | |||
| Basic/diluted net increase in net assets from operations per share |
$ | 0.51 | ||
Note 11. Distributions
On March 14, 2014, the Company’s board of directors declared a quarterly dividend of $0.1812 per share payable on March 31, 2014 to holders of record as of March 24, 2014. On May 14, 2014, the Company’s board of directors declared a quarterly dividend of $0.3375 per share payable on July 1, 2014 to holders of record as of June 16, 2014. The Company expects the dividend to be paid from taxable earnings with specific tax characteristics reported to stockholders after the end of the calendar year.
Note 12. Share Transactions
The following table summarizes the total shares issued and proceeds received in connection with the Company’s Offering and other formation transactions for the twelve months ended June 30, 2014.
| Shares | Amount | |||||||
| Issuance of shares to Original Investors |
6,000,000 | $ | 90,000,000 | |||||
| Issuance of shares to Stifel |
2,181,818 | 32,727,270 | ||||||
| Repurchase of shares from Original Investors |
(2,181,818 | ) | (32,727,270 | ) | ||||
| Issuance of shares in the Offering |
7,666,666 | 114,999,990 | ||||||
|
|
|
|
|
|||||
| Total Shares issued |
13,666,666 | 204,999,990 | ||||||
| Underwriting costs |
— | (3,450,000 | ) | |||||
| Offering costs |
— | (1,200,000 | ) | |||||
|
|
|
|
|
|||||
| Total shares outstanding/net proceeds to Company |
13,666,666 | $ | 200,349,990 | |||||
|
|
|
|
|
|||||
As of June 30, 2014, the Company has issued 13,666,666 shares of common stock through issuance to Original Investors and Stifel, net of a repurchase of shares from the Original Investors, and the Offering.
105
Table of Contents
Note 13. Financial Highlights
The following represents the per share data and the ratios to average net assets for CM Finance Inc:
| For the period from February 6, 2014 through June 30, 2014 |
||||
| Per Share Data:(1) |
||||
| Net asset value, beginning of period |
$ | 15.00 | ||
| Net investment income |
0.47 | |||
| Net realized and unrealized gains (losses) |
0.04 | |||
|
|
|
|||
| Net increase in net assets resulting from operations |
0.51 | |||
| Dividends declared(2) |
(0.52 | ) | ||
|
|
|
|||
| Offering costs |
(0.09 | ) | ||
| Sales load |
(0.25 | ) | ||
|
|
|
|||
| Net decrease in net assets resulting from capital share transactions |
(0.34 | ) | ||
| Net asset value, end of period |
$ | 14.65 | ||
| Market value per share, end of period |
$ | 14.56 | ||
| Total return based on net asset value(3)(5) |
2.86 | % | ||
| Total return based on market value(4)(5) |
0.57 | % | ||
| Shares outstanding at end of period |
13,666,666 | |||
| Ratio/Supplemental Data: |
||||
| Net assets, at end of period |
$ | 200,216,821 | ||
| Ratio of total expenses to average net assets(6) |
5.46 | % | ||
| Ratio of net expenses to average net assets(6) |
4.02 | % | ||
| Ratio of interest expense and fees to average net assets(6) |
1.27 | % | ||
| Ratio of net investment income before fee waiver to average net assets(6) |
6.58 | % | ||
| Ratio of net investment income after fee waiver to average net assets(6) |
8.03 | % | ||
| Total Notes Payable |
85,591,314 | |||
| Asset Coverage Ratio(7) |
3.34 | |||
| Portfolio Turnover Rate(5)(8) |
67 | % | ||
| (1) | The per share data was derived by using the shares outstanding during the period. |
| (2) | The per share data for distributions declared reflects the actual amount of distributions declared per share during the period. |
| (3) | The total return based on net asset value is based on the change in net asset value per share assuming an investment at $14.75 per share (the initial public offering price of $15.00 per share, less sales load of $0.25 per share). |
| (4) | Total return based on market value is based on the change in market price per share assuming an investment at the initial public offering price of $15.00 per share. |
| (5) | Not annualized. |
| (6) | Annualized. |
| (7) | Asset coverage ratio is equal to (i) the sum of (A) net assets at the end of the period and (B) debt outstanding at the end of the period, divided by (ii) total debt outstanding at the end of the period. |
| (8) | For the twelve months ended June 30, 2014. |
106
Table of Contents
The following represents supplemental ratios and data for CM Finance LLC:
| Period from July 1, 2013 to February 5, 2014 |
Twelve months ended June 30, 2013 |
Period from March 7, 2012 to June 30, 2012 |
||||||||||
| Total return |
7.86 | % | 16.16 | % | 2.58 | % | ||||||
| Ratio of net investment income to average members’ capital |
8.40 | % | 11.11 | % | 2.06 | % | ||||||
| Ratio of operating expenses to average members’ capital |
(2.37 | %) | (1.12 | %) | (1.34 | %) | ||||||
| Ratio of credit facility related expenses to average members’ capital |
(1.54 | %) | (0.29 | %) | 0.00 | % | ||||||
| Ratio of total expenses to average members’ capital |
(2.53 | %) | (1.14 | %) | (1.34 | %) | ||||||
| Portfolio turnover rate |
41.76 | % | 68.37 | % | 69.68 | % | ||||||
| Supplemental Data: |
||||||||||||
| Members’ capital at end of period |
$ | 90,000,000 | $ | 87,250,637 | $ | 18,141,667 | ||||||
| Average members’ capital |
$ | 105,716,373 | $ | 55,294,030 | $ | 14,790,409 | ||||||
Total return is calculated based on a time-weighted rate of return methodology for the members, and is not annualized. Total return is reflected after all investment-related and operating expenses. An individual member’s return may vary from these returns based on the timing of capital transactions. The ratios to average members’ capital are calculated based on the monthly average members’ capital during the period.
The ratios to average members’ capital are calculated based on the monthly average members’ capital during the period. Credit facility related expenses include interest expense and amortization of deferred debt issuance costs.
Note 14. Tax Information
As of June 30, 2014, the Company’s aggregate investment unrealized appreciation and depreciation based on cost for U.S. federal income tax purposes were as follows:
| Tax Basis |
||||
| Amortized cost |
$ | 273,227,783 | ||
|
|
|
|||
| Gross unrealized appreciation |
$ | 1,218,578 | ||
| Gross unrealized depreciation |
(735,896 | ) | ||
|
|
|
|||
| Net unrealized investment appreciation |
$ | 482,682 | ||
|
|
|
|||
107
Table of Contents
Note 15. Selected Quarterly Financial Data (unaudited)
| For the Quarter Ended June 30, 2014 |
For the Period From February 6, 2014 through March 31, 2014 |
For the Period From January 1, 2014 through February 5, 2014 |
For the Quarter Ended December 31, 2013 |
For the Quarter Ended September 30, 2013 |
||||||||||||||||
| Total Investment Income |
$ | 6,605,710 | $ | 2,969,801 | $ | 2,564,297 | $ | 5,194,169 | $ | 3,800,084 | ||||||||||
| Total Investment Income per Common Share |
0.48 | 0.22 | N.A. | N.A. | N.A. | |||||||||||||||
| Net Investment Income |
4,612,500 | 1,768,981 | 2,382,530 | 4,105,328 | 3,128,788 | |||||||||||||||
| Net Investment Income per Common Share |
0.34 | 0.13 | N.A. | N.A. | N.A. | |||||||||||||||
| Net Realized and Unrealized Gain |
280,158 | 294,543 | 1,251,447 | (1,024,872 | ) | (623,369 | ) | |||||||||||||
| Net Realized and Unrealized Gain per Common Share |
0.02 | 0.02 | N.A. | N.A. | N.A. | |||||||||||||||
| Net Increase in Net Assets Resulting from Operations |
4,892,658 | 2,063,524 | 3,633,977 | 3,080,456 | 2,505,419 | |||||||||||||||
| Basic and Diluted Earnings per Common Share |
0.36 | 0.15 | N.A. | N.A. | N.A. | |||||||||||||||
| Net Asset Value per Common Share at End of Quarter |
14.65 | 14.63 | N.A. | N.A. | N.A. | |||||||||||||||
| Quarter Ended | ||||||||||||||||
| June 30, 2013 |
March 31, 2013 |
December 31, 2012 |
September 30, 2012 |
|||||||||||||
| Total Investment Income |
$ | 3,245,919 | $ | 1,534,952 | $ | 990,011 | $ | 1,001,934 | ||||||||
| Total Investment Income per Common Share |
N.A | N.A | N.A | N.A | ||||||||||||
| Net Investment Income |
$ | 2,771,812 | $ | 1,528,068 | $ | 946,927 | $ | 895,323 | ||||||||
| Net Investment Income per Common Share |
N.A | N.A | N.A | N.A | ||||||||||||
| Net Realized and Unrealized Gain |
$ | 1,284,897 | $ | 374,216 | $ | 182,521 | $ | 12,407 | ||||||||
| Net Realized and Unrealized Gain per Common Share |
N.A | N.A | N.A | N.A | ||||||||||||
| Net Increase in Net Assets Resulting from Operations |
$ | 4,056,709 | $ | 1,902,284 | $ | 1,129,448 | $ | 907,730 | ||||||||
| Basic and Diluted Earnings per Common Share |
N.A | N.A | N.A | N.A | ||||||||||||
| Net Assets per Common Share at End of Quarter |
N.A | N.A | N.A | N.A | ||||||||||||
Note 16. Subsequent Events
The Company has evaluated the need for disclosures and/or adjustments resulting from subsequent events through the date the consolidated financial statements were issued.
On September 4, 2014, the Company’s Board of Directors declared a third calendar quarter dividend of $.3375 per share payable on October 1, 2014 to shareholders of record as of September 18, 2014.
Subsequent to June 30, 2014, the Company invested $14.9 million and received repayment or sales proceeds of $29.4 million.
108
Table of Contents
| Item 9. | Changes in and Disagreements with Independent Registered Public Accounting Firm on Accounting and Financial Disclosure |
There were no changes in or disagreements on accounting or financial disclosure with Ernst & Young, LLP, the Company’s independent registered public accounting firm, during the fiscal year ended June 30, 2014.
| Item 9A. | Controls and Procedures. |
(a) Evaluation of Disclosure Controls and Procedures
As of June 30, 2014 (the end of the period covered by this report), we, including our Chief Executive Officer and Chief Financial Officer, evaluated the effectiveness of the design and operation of our disclosure controls and procedures (as defined in Rule 13a-15(e) of the 1934 Act). Based on that evaluation, our management, including our Chief Executive Officer and Chief Financial Officer, concluded that our disclosure controls and procedures were effective and provided reasonable assurance that information required to be disclosed in our periodic SEC filings is recorded, processed, summarized and reported within the time periods specified in the SEC’s rules and forms, and that such information is accumulated and communicated to our management, including our Chief Executive Officer and Chief Financial Officer, as appropriate, to allow timely decisions regarding required disclosure. However, in evaluating the disclosure controls and procedures, management recognized that any controls and procedures, no matter how well designed and operated can provide only reasonable assurance of achieving the desired control objectives, and management necessarily was required to apply its judgment in evaluating the cost-benefit relationship of possible controls and procedures.
(b) Changes in Internal Control Over Financial Reporting
Management did not identify any change in the Company’s internal control over financial reporting that occurred during the quarter ended June 30, 2014 that has materially affected, or is reasonably likely to materially affect, the Company’s internal control over financial reporting.
This annual report on Form 10-K does not include a report of management’s assessment regarding internal control over financial reporting or an attestation report of our registered public accounting firm due to a transition period established by rules of the SEC for newly reporting companies and provisions in the JOBS Act applicable to emerging growth companies.
| Item 9B. | Other Information. |
None.
109
Table of Contents
We will file a definitive Proxy Statement for our 2014 Annual Meeting of Stockholders with the SEC, pursuant to Regulation 14A, not later than 120 days after the end of our fiscal year. Accordingly, certain information required by Part III has been omitted under General Instruction G(3) to the annual report on Form 10-K. Only those sections of our definitive Proxy Statement that specifically address the items set forth herein are incorporated by reference.
| Item 10. | Directors, Executive Officers and Corporate Governance |
The information required by Item 10 is hereby incorporated by reference from the Company’s definitive Proxy Statement relating to the Company’s 2014 Annual Meeting of Stockholders, to be filed with the Securities and Exchange Commission within 120 days following the end of the Company’s fiscal year.
We have adopted a code of business conduct and ethics that applies to our directors, officers and employees. This code of ethics is published on our website at www.cmfn-inc.com. We intend to disclose any future amendments to, or waivers from, this code of conduct within four business days of the waiver or amendment through a Web site posting.
| Item 11. | Executive Compensation |
The information required by Item 11 is hereby incorporated by reference from the Company’s definitive Proxy Statement relating to the Company’s 2014 Annual Meeting of Stockholders, to be filed with the Securities and Exchange Commission within 120 days following the end of the Company’s fiscal year.
| Item 12. | Security Ownership of Certain Beneficial Owners and Management and Related Stockholder Matters |
The information required by Item 12 is hereby incorporated by reference from the Company’s definitive Proxy Statement relating to the Company’s 2014 Annual Meeting of Stockholders, to be filed with the Securities and Exchange Commission within 120 days following the end of the Company’s fiscal year.
| Item 13. | Certain Relationships and Related Transactions, and Director Independence |
The information required by Item 13 is hereby incorporated by reference from the Company’s definitive Proxy Statement relating to the Company’s 2014 Annual Meeting of Stockholders, to be filed with the Securities and Exchange Commission within 120 days following the end of the Company’s fiscal year.
| Item 14. | Principal Accountant Fees and Services |
The information required by Item 14 is hereby incorporated by reference from the Company’s definitive Proxy Statement relating to the Company’s 2014 Annual Meeting of Stockholders, to be filed with the Securities and Exchange Commission within 120 days following the end of the Company’s fiscal year.
110
Table of Contents
| Item 15. | Exhibits, Financial Statement Schedules |
a. Documents Filed as Part of this Report
The following financial statements are set forth in Item 8:
| Page | ||||
| 76 | ||||
| Consolidated Statements of Assets and Liabilities as of June 30, 2014 and June 30, 2013 |
77 | |||
| 78 | ||||
| 79 | ||||
| 80 | ||||
| 81 | ||||
| 83 | ||||
| 85 | ||||
111
Table of Contents
b. Exhibits
The following exhibits are filed as part of this report or hereby incorporated by reference to exhibits previously filed with the SEC:
| 3.1 | Amended and Restated Articles of Incorporation(1) | |
| 3.3 | Bylaws(1) | |
| 4.1 | Irrevocable Proxy of the Cyrus Funds(2) | |
| 4.2 | Form of Stock Certificate(1) | |
| 10.1 | Form of Investment Advisory Agreement between Registrant and CM Investment Partners LLC(1) | |
| 10.2 | Collateral Management Agreement, dated as of May 23, 2013, by and between CM Finance SPV Ltd and CM Investment Partners, LP(1) | |
| 10.3 | Form of Letter Agreement between the Registrant and CM Investment Partners LLC(3) | |
| 10.4 | Form of Dividend Reinvestment Plan(2) | |
| 10.5 | Form of Custody Agreement(2) | |
| 10.6 | Form of Administration Agreement between Registrant and CM Investment Partners LLC(1) | |
| 10.7 | Form of License Agreement between the Registrant and CM Investment Partners LLC(1) | |
| 10.8 | Form of Indemnification Agreement between the Registrant and the Directors(1) | |
| 10.9 | 2002 Master Agreement, dated as of May 20, 2013, between Registrant and UBS AG(1) | |
| 10.10 | Indenture, dated as of May 23, 2013, between CM Finance SPV Ltd., as Issuer and State Street Bank and Trust Company, as Trustee(1) | |
| 10.11 | Master Assignment and Participation Agreement, dated as of May 23, 2013 between Registrant and CM Finance SPV Ltd.(1) | |
| 10.12 | Collateral Administration Agreement, dated as of May 23, 2013 by and among CM Finance SPV Ltd., CM Investment Partners, LP and State Street Bank and Trust Company(1) | |
| 10.13 | Amended and Restated Confirmation Letter Agreement, dated as of May 23, 2013, between UBS, AG and CM Finance LLC(1) | |
| 10.14 | Contribution Agreement, dated as of May 23, 2013, between CM Finance LLC and State Street Bank and Trust Company(1) | |
| 10.15 | First Supplemental Indenture, dated as of June 6, 2013, between CM Finance SPV Ltd., as Issuer and State Street Bank and Trust Company, as Trustee(1) | |
| 10.16 | Amended and Restated Indenture, dated as of December 4, 2013, between CM Finance SPV Ltd., as Issuer and State Street Bank and Trust Company, as Trustee(2) | |
| 10.17 | Revolving Credit Note Agreement, dated as of December 4, 2013, by and among CM Finance SPV Ltd., State Street Bank and Trust Company and the noteholders party thereto(2) | |
| 10.18 | Amendment Agreement, dated as of December 4, 2013, between CM Finance SPV Ltd. and State Street Bank and Trust Company(2) | |
| 10.19 | Amendment Agreement to 2002 ISDA Master Agreement, dated as of December 4, 2013 between Registrant and UBS AG(2) | |
| 10.20 | Omnibus Amendment Agreement, dated as of December 4, 2013, by and between CM Finance SPV Ltd. and State Street Bank and Trust Company(2) | |
112
Table of Contents
| 10.21 | Form of Assignment of Collateral Management Agreement by and among CM Investment Partners, LP and CM Investment Partners LLC(3) | |
| 10.22 | Form of Assignment of Collateral Administration Agreement by and among CM Investment Partners, LP and CM Investment Partners LLC(3) | |
| 10.23 | Registration Right Agreement, dated as of December 17, 2013, between Registrant and certain stockholders(2) | |
| 10.24 | Stockholder Agreement, dated as of December 17, 2013, between the Registrant and Stifel Venture Corp.(2) | |
| 11.1 | Computation of Per Share Earnings (included in the notes to the audited financial statements contained in this report) | |
| 14.1 | Code of Ethics of CM Finance Inc(1) | |
| 21.1 | Subsidiaries of CM Finance Inc CM Finance SPV Ltd. | |
| 31.1* | Certification of Chief Executive Officer pursuant to Rule 13a-14 of the Securities Exchange Act of 1934, as amended. | |
| 31.2* | Certification of Chief Financial Officer pursuant to Rule 13a-14 of the Securities Exchange Act of 1934, as amended. | |
| 32.1* | Certification of Chief Executive Officer pursuant to Section 906 of The Sarbanes-Oxley Act of 2002. | |
| 32.2* | Certification of Chief Financial Officer pursuant to Section 906 of The Sarbanes-Oxley Act of 2002. | |
| * | Filed herewith |
| (1) | Incorporated by reference to Registrant’s Registration Statement on Form N-2 (File No. 333-192370), filed on November 15, 2013. |
| (2) | Incorporated by reference to Registrant’s Amendment No. 1 to the Registration Statement on Form N-2 (File No. 333-192370), filed on December 20, 2013. |
| (3) | Incorporated by reference to Registrant’s Amendment No. 2 to the Registration Statement on Form N-2 (File No. 333-192370), filed on January 24, 2014. |
c. Financial statement schedules
No financial statement schedules are filed herewith because (1) such schedules are not required or (2) the information has been presented in the aforementioned financial statements.
113
Table of Contents
Pursuant to the requirements of Section 13 or 15(d) of the Securities Exchange Act of 1934, the registrant has duly caused this report to be signed on its behalf by the undersigned, thereunto duly authorized.
| CM FINANCE INC | ||||
| Date: September 8, 2014 | /s/ Michael C. Mauer | |||
| Michael C. Mauer Chief Executive Officer | ||||
| Date: September 8, 2014 | /s/ Jai Agarwal | |||
| Jai Agarwal Chief Financial Officer | ||||
Pursuant to the requirements of the Securities Exchange Act of 1934, this report has been signed below by the following persons on behalf of the registrant and in the capacity and on the dates indicated.
| Date: September 8, 2014 | /s/ Michael C. Mauer | |||
| Michael C. Mauer Chief Executive Officer | ||||
| Date: September 8, 2014 | /s/ Jai Agarwal | |||
| Jai Agarwal Chief Financial Officer (Principal Accounting and Financial Officer) | ||||
| Date: September 8, 2014 | /s/ Christopher E. Jansen | |||
| Christopher E. Jansen President, Treasurer, Secretary and Director | ||||
| Date: September 8, 2014 | /s/ Stephan Kuppenheimer | |||
| Stephan Kuppenheimer Director | ||||
| Date: September 8, 2014 | /s/ Keith Lee | |||
| Keith Lee Director | ||||
| Date: September 8, 2014 | /s/ Julie Persily | |||
| Julie Persily Director | ||||
| Date: September 8, 2014 | /s/ Robert P. Ryder | |||
| Robert P. Ryder Director | ||||
| Date: September 8, 2014 | /s/ Robert T. Wagner | |||
| Robert T. Wagner Director | ||||
114