Attached files
| file | filename |
|---|---|
| EX-1.1 - EX-1.1 - CITIZENS FINANCIAL GROUP INC/RI | d723158dex11.htm |
| EX-3.2 - EX-3.2 - CITIZENS FINANCIAL GROUP INC/RI | d723158dex32.htm |
| EX-10.1 - EX-10.1 - CITIZENS FINANCIAL GROUP INC/RI | d723158dex101.htm |
| EX-10.2 - EX-10.2 - CITIZENS FINANCIAL GROUP INC/RI | d723158dex102.htm |
| EX-10.3 - EX-10.3 - CITIZENS FINANCIAL GROUP INC/RI | d723158dex103.htm |
| EX-10.37 - EX-10.37 - CITIZENS FINANCIAL GROUP INC/RI | d723158dex1037.htm |
| EX-21.1 - EX-21.1 - CITIZENS FINANCIAL GROUP INC/RI | d723158dex211.htm |
| EX-10.5 - EX-10.5 - CITIZENS FINANCIAL GROUP INC/RI | d723158dex105.htm |
| EX-10.39 - EX-10.39 - CITIZENS FINANCIAL GROUP INC/RI | d723158dex1039.htm |
| EX-23.1 - EX-23.1 - CITIZENS FINANCIAL GROUP INC/RI | d723158dex231.htm |
| EX-10.38 - EX-10.38 - CITIZENS FINANCIAL GROUP INC/RI | d723158dex1038.htm |
| EX-3.1 - EX-3.1 - CITIZENS FINANCIAL GROUP INC/RI | d723158dex31.htm |
| EX-5.1 - EX-5.1 - CITIZENS FINANCIAL GROUP INC/RI | d723158dex51.htm |
| EX-10.4 - EX-10.4 - CITIZENS FINANCIAL GROUP INC/RI | d723158dex104.htm |
Table of Contents
As filed with the Securities and Exchange Commission on September 8, 2014
Registration No. 333-195900
SECURITIES AND EXCHANGE COMMISSION
Washington, D.C. 20549
Amendment No. 3
to
FORM S-1
REGISTRATION STATEMENT
UNDER
THE SECURITIES ACT OF 1933
CITIZENS FINANCIAL GROUP, INC.
(Exact Name of Registrant as Specified in Its Charter)
| Delaware | 6021 | 05-0412693 | ||
| (State or Other Jurisdiction of Incorporation or Organization) |
(Primary Standard Industrial Classification Code Number) |
(I.R.S. Employer Identification Number) |
One Citizens Plaza
Providence, RI 02903
(401) 456-7000
(Address, Including Zip Code, and Telephone Number, Including Area Code, of Registrant’s Principal Executive Offices)
Stephen T. Gannon
General Counsel and Chief Legal Officer
Citizens Financial Group, Inc.
One Citizens Plaza
Providence, RI 02903
(401) 456-7000
(Name, Address, Including Zip Code, and Telephone Number, Including Area Code, of Agent For Service)
Copies to:
| Nicholas A. Kronfeld Luigi L. De Ghenghi |
Leslie N. Silverman Derek M. Bush Cleary Gottlieb Steen & Hamilton LLP One Liberty Plaza New York, NY 10006 (212) 225-2000 |
Approximate date of commencement of proposed sale to the public: As soon as practicable after the effective date of this Registration Statement.
If any of the securities being registered on this form are to be offered on a delayed or continuous basis pursuant to Rule 415 under the Securities Act of 1933, check the following box. ¨
If this form is filed to register additional securities for an offering pursuant to Rule 462(b) under the Securities Act, check the following box and list the Securities Act registration statement number of the earlier effective registration statement for the same offering. ¨
If this form is a post-effective amendment filed pursuant to Rule 462(c) under the Securities Act, check the following box and list the Securities Act registration statement number of the earlier effective registration statement for the same offering. ¨
If this form is a post-effective amendment filed pursuant to Rule 462(d) under the Securities Act, check the following box and list the Securities Act registration statement number of the earlier effective registration statement for the same offering. ¨
Indicate by check mark whether the registrant is a large accelerated filer, an accelerated filer, a non-accelerated filer, or a smaller reporting company. See the definitions of “large accelerated filer,” “accelerated filer” and “smaller reporting company” in Rule 12b-2 of the Exchange Act.
| Large accelerated filer | ¨ | Accelerated filer | ¨ | |||
| Non-accelerated filer | x (Do not check if a smaller reporting company) | Smaller reporting company | ¨ |
CALCULATION OF REGISTRATION FEE
|
| ||||||||
| Title of Each Class of Securities to Be Registered |
Amount to Be Registered |
Proposed Maximum Offering Price |
Proposed Maximum Aggregate Offering Price |
Amount of Registration Fee(3) | ||||
| Common Stock, par value $0.01 per share |
161,000,000(1) | $25.00(2) | $4,025,000,000 | $518,420.00 | ||||
|
| ||||||||
|
| ||||||||
| (1) | Includes shares which the underwriters have the right to purchase to cover over-allotments. |
| (2) | Estimated solely for the purpose of computing the amount of the registration fee pursuant to Rule 457(a) under the Securities Act of 1933. |
| (3) | A registration fee in the amount of $12,880 was previously paid in connection with a prior filing of this Registration Statement on May 12, 2014. Pursuant to Rule 457(a) under the Securities Act of 1933, an additional filing fee of $505,540 is being paid in connection with this amendment to the Registration Statement. |
The Registrant hereby amends this Registration Statement on such date or dates as may be necessary to delay its effective date until the Registrant shall file a further amendment which specifically states that this Registration Statement shall thereafter become effective in accordance with Section 8(a) of the Securities Act of 1933 or until the Registration Statement shall become effective on such date as the Commission, acting pursuant to said Section 8(a), may determine.
Table of Contents
The information in this prospectus is not complete and may be changed. We may not sell these securities until the registration statement filed with the Securities and Exchange Commission is effective. This prospectus is not an offer to sell these securities and we are not soliciting offers to buy these securities in any jurisdiction where the offer or sale is not permitted.
PROSPECTUS (Subject to Completion)
Issued September 8, 2014
140,000,000 SHARES

COMMON STOCK
The selling stockholders are offering 140,000,000 shares of common stock of Citizens Financial Group, Inc. We will not receive any of the proceeds from the sale of shares of common stock by the selling stockholders. This is our initial public offering and no public market exists for our shares. We anticipate that the initial public offering price will be between $23.00 and $25.00 per share.
We have applied to list our shares of common stock on the New York Stock Exchange (the “NYSE”) under the symbol “CFG.”
Investing in our common stock involves risks. See “Risk Factors” beginning on page 16.
PRICE $ A SHARE
| Price to Public |
Underwriting Discounts and Commissions(1) |
Proceeds to Selling Stockholders |
||||||||||
| Per Share |
$ | $ | $ | |||||||||
| Total |
$ | $ | $ | |||||||||
| (1) | The selling shareholders have also agreed to reimburse the underwriters for certain expenses related to review and qualification of this offering by the Financial Industry Regulatory Authority, Inc. See “Underwriting.” |
The selling stockholders have granted the underwriters the right to purchase an additional 21,000,000 shares of common stock to cover over-allotments.
The underwriters expect to deliver the shares of common stock to purchasers on , 2014.
Neither the Securities and Exchange Commission (the “SEC”) nor any state securities commission has approved or disapproved of these securities, or determined if this prospectus is truthful or complete. Any representation to the contrary is a criminal offense.
Joint Global Coordinators
| Morgan Stanley | Goldman, Sachs & Co. |
Joint Book-Running Managers
J.P. Morgan
| Barclays |
Citigroup | Deutsche Bank Securities | RBS | Wells Fargo Securities |
Co-Managers
| Credit Suisse |
UBS Investment Bank |
Jefferies |
|
Keefe, Bruyette & Woods A Stifel Company |
|
| Oppenheimer & Co. |
RBC Capital Markets | Sandler O’Neill + Partners, L.P. |
| Evercore |
ING | Sanford C. Bernstein | Guggenheim Securities | Lebenthal Capital Markets | The Williams Capital Group, L.P. |
Prospectus dated , 2014.
Table of Contents
CERTAIN IMPORTANT INFORMATION
In this prospectus, “we,” “us,” “our” and “CFG” refer to Citizens Financial Group, Inc. together with its consolidated subsidiaries, “CBNA” means Citizens Bank, N.A., “CBPA” means Citizens Bank of Pennsylvania, “our banking subsidiaries” means CBNA and CBPA, “RBS” means The Royal Bank of Scotland Group plc and the “RBS Group” means RBS together with its subsidiaries (other than CFG). Unless otherwise noted, when we refer to our “peers” or “peer regional banks,” we refer to BB&T, Comerica, Fifth Third, KeyCorp, M&T, PNC, Regions, SunTrust and U.S. Bancorp. When we refer to our approximately 18,050 employees, we include the full-time equivalent of our approximately 17,400 full-time employees, 760 part-time employees, including employees on leave, and 575 positions filled by temporary employees.
We and the selling stockholders have not authorized anyone to provide any information other than that contained or incorporated by reference in this prospectus or in any free writing prospectus prepared by or on behalf of us or to which we have referred you. We take no responsibility for, and can provide no assurance as to the reliability of, any other information that others may give you. The selling stockholders are offering to sell, and seeking offers to buy, shares of common stock only in jurisdictions where such offers and sales are permitted. The information contained in this prospectus is accurate only as of the date of this prospectus, regardless of the time of delivery of this prospectus or of any sale of the common stock.
Until , 2014 (25 days after commencement of this offering), all dealers that effect transactions in our common stock, whether or not participating in this offering, may be required to deliver a prospectus. This delivery requirement is in addition to the dealers’ obligation to deliver a prospectus when acting as underwriters and with respect to their unsold allotments or subscriptions.
i
Table of Contents
We have proprietary rights to trademarks, trade names and service marks appearing in this prospectus that are important to our business. This prospectus also contains additional trade names, trademarks and service marks belonging to the RBS Group. Solely for convenience, the trademarks, service marks and trade names referred to in this prospectus are without the ® and ™ symbols, but such references are not intended to indicate, in any way, that we will not assert, to the fullest extent under applicable law, our rights or the rights of the applicable licensors to these trademarks, service marks and trade names. All trademarks, service marks and trade names appearing in this prospectus are the property of their respective owners.
Within this prospectus, we reference certain industry and sector information and statistics. We have obtained this information and statistics from various independent third-party sources, including independent industry publications, reports by market research firms and other independent sources. Nothing in the data used or derived from third-party sources should be construed as advice. The SNL Financial LC, or SNL Financial, data included in this prospectus excludes all non-retail bank holding companies. The scope of “non-retail banks” is subject to the discretion of SNL Financial, but typically includes: industrial bank and non-depository trust charters, institutions with over 20% brokered deposits (of total deposits), institutions with over 20% credit card loans (of total loans) and institutions deemed not to broadly participate in the banking services market. Some data and other information are also based on our good faith estimates, which are derived from our review of internal surveys and independent sources. We believe that these external sources and estimates are reliable, but have not independently verified them.
Percentage changes, per share amounts, and ratios presented in this prospectus are calculated using whole dollars.
ii
Table of Contents
This summary highlights selected information contained elsewhere in this prospectus. This summary may not contain all of the information that you should consider before investing in our common stock. Therefore, you should read the entire prospectus carefully, including the section entitled “Risk Factors,” as well the consolidated financial statements and related notes included in this prospectus, before making an investment decision to invest in our common stock.
Company Overview
We are the 13th largest retail bank holding company in the United States according to SNL Financial with $130.3 billion of total assets as of June 30, 2014. Headquartered in Providence, Rhode Island, we deliver a broad range of retail and commercial banking products and services to more than five million individuals, institutions and companies. Our approximately 18,050 employees strive to meet the financial needs of customers and prospects through approximately 1,230 branches and approximately 3,215 ATMs operated in an 11-state footprint across the New England, Mid-Atlantic and Midwest regions and through our online, telephone and mobile banking platforms. We have 90 retail and commercial non-branch offices located both in our geographic footprint and in nine states and the District of Columbia outside our branch footprint. Our 11-state branch banking footprint contains approximately 29.9 million households and 3.1 million businesses according to SNL Financial.
As of June 30, 2014, we had loans of $88.8 billion, deposits of $91.7 billion and stockholders’ equity of $19.6 billion, and we generated revenues of $5.0 billion for the twelve months ended June 30, 2014. We operate our business through two operating segments: Consumer Banking and Commercial Banking. As of June 30, 2014, the contributions of Consumer Banking and Commercial Banking to the loans in our operating segments were approximately 56% and 44%, respectively.
Consumer Banking serves retail customers and small businesses with annual revenues of up to $25 million. Consumer Banking products and services include deposit products, mortgage and home equity lending, student loans, auto financing, credit cards, business loans and wealth management and investment services. Product strengths and significant growth developments in Consumer Banking include:
| • | Home equity lines of credit (HELOCs): With $16.2 billion in HELOC loans outstanding as of June 30, 2014, we ranked sixth nationally according to SNL Financial; |
| • | Auto financing: Through a network of over 6,500 automotive dealerships in 43 states, auto finance represented $11.0 billion of loans as of June 30, 2014, ranking 12th nationally among regulated depository institutions according to SNL Financial; |
| • | Mortgage lending: We have improved our mortgage origination capabilities from an unranked position as of December 31, 2009, to 27th among retail originators nationally as of June 30, 2014 according to Inside Mortgage Finance; and |
| • | Private student lending: We launched our education finance business in 2009 and have expanded to partner with over 1,200 higher education schools in all 50 states, which resulted in loan origination volume more than doubling to $253 million in 2013 from $112 million in 2010. Loan origination volume was $147 million during the first six months of 2014. |
Commercial Banking primarily targets companies and institutions with annual revenues of $25 million to $2.5 billion. Commercial Banking offers a broad complement of financial products and solutions, including lending and leasing, trade financing, deposit and treasury management, foreign
1
Table of Contents
exchange and interest rate risk management, corporate finance and debt and equity capital markets capabilities. Product strengths and significant growth developments in Commercial Banking products include:
| • | Commercial and industrial loans: We generated an 11% compound annual growth rate in our commercial and industrial loan portfolio from year-end 2009 through the second quarter of 2014; |
| • | Capital markets: We have built out our capital markets capabilities over the past few years and now offer broad, multifaceted financial solutions to meet our clients’ more sophisticated needs. These capabilities include expertise in areas like debt syndication which enhances our ability to meet the growing capital needs of clients while limiting balance sheet risk and better positioning us to compete for other banking products. Since 2010, we have completed 409 syndicated bookrunner transactions, including 186 lead-left roles; |
| • | Franchise finance: Through our franchise finance business we provide financing to owners of franchised and chain restaurants, such as premier brands like McDonalds, Taco Bell, Applebee’s, Wendy’s and Dunkin Donuts, as well as convenience stores and gas stations on a national basis; and |
| • | Commercial real estate: Following the recent cycle of real estate market stress, we took steps to reposition our commercial real estate business, which represented $6.8 billion in loans at June 30, 2014, to enhance our focus on originating higher-quality assets in more attractive segments including institutional developers and real estate investment trusts. |
The following tables present certain financial information for our segments as of and for the six months ended June 30, 2014 and as of and for the year ended December 31, 2013:
| As of and for the Six Months Ended June 30, 2014 |
As of and for the Year Ended December 31, 2013 |
|||||||||||||||||||||||||||||||
| Consumer Banking |
Commercial Banking |
Other(1) | Consolidated | Consumer Banking |
Commercial Banking |
Other(1) | Consolidated | |||||||||||||||||||||||||
| (in millions) | ||||||||||||||||||||||||||||||||
| Total loans and leases and loans held for sale (average) |
$ | 46,876 | $ | 36,997 | $ | 4,527 | $ | 88,400 | $ | 45,106 | $ | 34,647 | $ | 6,044 | $ | 85,797 | ||||||||||||||||
| Total deposits and deposits held for sale (average) |
70,473 | 17,901 | 3,509 | 91,883 | 72,158 | 17,516 | 3,662 | 93,336 | ||||||||||||||||||||||||
| Net interest income |
1,083 | 520 | 38 | 1,641 | 2,176 | 1,031 | (149 | ) | 3,058 | |||||||||||||||||||||||
| Noninterest income |
455 | 214 | 329 | 998 | 1,025 | 389 | 218 | 1,632 | ||||||||||||||||||||||||
|
|
|
|
|
|
|
|
|
|
|
|
|
|
|
|
|
|||||||||||||||||
| Total revenue |
$ | 1,538 | $ | 734 | $ | 367 | $ | 2,639 | $ | 3,201 | $ | 1,420 | $ | 69 | $ | 4,690 | ||||||||||||||||
| Net Income (loss)(2) |
76 | 282 | 121 | 479 | 242 | 514 | (4,182 | ) | (3,426 | ) | ||||||||||||||||||||||
| (1) | Includes the financial impact of non-core, liquidating loan portfolios and other non-core assets, our treasury activities, wholesale funding activities, securities portfolio, community development assets and other unallocated assets, liabilities, revenues, provision for credit losses and expenses not attributed to our Consumer Banking or Commercial Banking segments. For a description of non-core assets, see “Management’s Discussion and Analysis of Financial Condition and Results of Operation—Analysis of Financial Condition.” |
| (2) | Includes a goodwill impairment charge of $4.4 billion ($4.1 billion after tax) in the second quarter of 2013. For more information, see “Management’s Discussion and Analysis of Financial Condition and Results of Operations—Results of Operations—Year Ended December 31, 2013 Compared with Year Ended December 31, 2012—Net Income (Loss),” Note 8 “Goodwill” to our audited consolidated financial statements and Note 5 “Goodwill” to our unaudited interim consolidated financial statements included elsewhere in this prospectus. |
2
Table of Contents
History and Recent Strategic Initiatives
Our history dates back to High Street Bank, founded in 1828, which established Citizens Savings Bank in 1871. By 1981, we had grown to 29 branches in Rhode Island with approximately $1.0 billion of assets, and in 1988 we became a wholly owned subsidiary of the RBS Group. Over the following two decades, we grew substantially through a series of over 25 strategic bank acquisitions, including the purchase of the Bank of New York Mellon’s retail branch network in 2001, which included $14.4 billion in deposits, and the 2004 acquisition of Charter One, which had $41.3 billion in assets. These acquisitions greatly expanded our footprint throughout New England and into the Mid-Atlantic and the Midwest, transforming us from a local retail bank into one of the largest retail U.S. bank holding companies with nearly $170.0 billion in assets at the start of the global financial crisis.
Following this period of expansion and the subsequent global financial crisis, we took a number of decisive steps to begin repositioning and strengthening our business profile, including:
| • | Transformed business mix: Refocused our efforts to transform our business model toward a more balanced and diversified platform with a greater emphasis on higher-growth, higher-return businesses. As of June 30, 2014, we had expanded the contribution of Commercial Banking relative to Consumer Banking to approximately 44% and 56% of the loans in our operating segments, respectively, as compared to 36% and 64%, respectively, as of December 31, 2009; |
| • | Improved deposit mix: Increased lower cost and more stable demand, checking, money market and savings accounts to 89% from 74% of total deposits at June 30, 2014 compared to December 31, 2009. This improvement in our core deposit funding mix, as well as our efforts to aggressively lower the rates paid on our time deposits, resulted in a more beneficial cost of total deposits, which decreased to 0.16% for the first half of 2014 from 0.23% for the year ended December 31, 2013 and 1.32% for the year ended December 31, 2009; |
| • | Reduced reliance on wholesale funding: Since the start of the financial crisis in 2009, we have aggressively worked to reduce the higher cost wholesale funding component of our balance sheet. We reduced wholesale borrowings from $23.7 billion as of December 31, 2009 to $16.2 billion as of June 30, 2014 and as of that date the balances were principally lower cost and more stable secured Federal Home Loan Bank and repurchase agreement borrowings; |
| • | Improved strategic focus: Identified and began running down certain non-core assets deemed to be inconsistent with our strategic goals, generally as a result of geographic location, industry, product type or risk level. The non-core portfolio decreased to $3.5 billion at June 30, 2014 from $20.5 billion when it was designated on June 30, 2009; |
| • | Optimized our geographic footprint: Exited certain geographies where we had underperforming market share positions and redeployed the capital into businesses with more attractive growth and return characteristics. In 2008, we sold 18 branches in the New York Adirondacks region, and in 2009, we sold our Indiana branch franchise, which consisted of 65 branches. In 2012, we sold 57 mostly in-store branches in Long Island and Westchester County, New York, and on June 20, 2014, we closed the sale of our 103 Chicago retail branches along with certain assets and deposits. Additionally, we have routinely sought to optimize the branch footprint through a process of consolidation and rationalization, which has resulted in the closure of another 232 branches since the beginning of 2009; |
| • | Refined our branch service delivery model: Proactively addressed evolving consumer preferences for banking interactions through expansion of alternative distribution channels. We have reduced our branch footprint while building out self-service channels through online and mobile banking including remote deposit capture and person-to-person payments. Our |
3
Table of Contents
| mobile banking channel has experienced rapid growth with a 40% increase in active mobile customers since year-end 2012. We have continued to optimize the distribution network by migrating staffing in our branches toward a universal banker model, which involves training bankers to handle both teller and traditional banker functions, with a goal of further improving the efficiency of our network and allowing frontline employees to become more sales and solutions oriented; and |
| • | Increased infrastructure investment: Invested more than $1.0 billion in infrastructure and technology from 2009 to year end 2013, with an additional $250 million planned for each of 2014 and 2015. These investments, intended to lower our costs and improve our customer experience, include significant programs to enhance our information technology resiliency, upgrade customer-facing technology and streamline operations. Significant investments included the 2013 launch of our new teller system, new commercial loan platform and new auto loan platform and the 2013 upgrade of the majority of our ATM network, including by equipping more than 1,450 ATMs with advanced deposit-taking functionality. These investments also involved spending to prepare for the planned rollout of our new mortgage platform. |
These steps have helped provide a strong foundation for our ongoing transformation from a wholly owned subsidiary of a global financial group into a stand-alone U.S. regional bank. We have brought together a seasoned management team with an average of over 20 years of banking experience at large international financial institutions. The team was bolstered by the May 2013 announcement of Bruce Van Saun’s appointment as our Chairman and CEO. The team is focused on delivering improved returns, through implementation of growth and efficiency initiatives, along with a more disciplined allocation of capital and resources. This performance-driven culture is designed to enhance our competitiveness by rigorously analyzing the risk-return profiles of our diversified businesses and selectively investing in those that are well positioned to gain market share, improve efficiency and generate long-term growth and sustainable profitability. In prior years, many of our strategies around risk management, capital and investments were heavily influenced by our status as a subsidiary of a larger global financial institution.
Our Competitive Strengths
Our long operating history, through a range of challenging economic cycles, forms the basis for our competitive strengths. From our community bank roots, we bring a commitment to strong customer relationships, local service and an active involvement in the communities we serve. Our acquisitions enabled us to develop material scale in highly desirable markets and broad product capabilities. The actions taken since the global financial crisis have resulted in a business model with solid asset quality, a stable core deposit mix and a superior capital position. In particular, we believe that the following strengths differentiate us from our competitors and provide a strong foundation from which to execute our strategy to deliver enhanced growth, profitability and returns.
| • | Significant Scale with Strong Market Penetration in Attractive Geographic Markets: We believe our market share and scale in our footprint is central to our success and growth. With approximately 1,230 branches and 90 non-branch offices, approximately 3,215 ATMs and 18,050 employees, as well as our online, telephone and mobile banking platforms, we serve more than five million individuals, institutions and companies. As of June 30, 2013, we ranked second by deposit market share in the New England region1 and in the top five in nine of our key metropolitan statistical areas, or MSAs, including Boston, Providence, Philadelphia, Pittsburgh and Cleveland according to SNL Financial. We believe this strong market share in |
| 1 | The New England region consists of the states of Maine, New Hampshire, Vermont, Massachusetts, Rhode Island and Connecticut. |
4
Table of Contents
| our core regions, which have relatively diverse economies and affluent demographics, will help us achieve our long-term growth objectives. The following table sets forth information regarding our competitive position in our principal MSAs. |
| MSA |
Total Branches |
Deposits ($ in Millions) |
Market Rank(1) |
Market Share (%)(1) |
||||||||||||
| Boston, MA |
212 | $ | 28,343 | 2 | 16.4 | % | ||||||||||
| Philadelphia, PA |
188 | 17,012 | 4 | 8.1 | ||||||||||||
| Providence, RI |
100 | 12,854 | 1 | 34.6 | ||||||||||||
| Pittsburgh, PA |
131 | 7,130 | 2 | 8.8 | ||||||||||||
| Detroit, MI |
95 | 4,563 | 6 | 4.6 | ||||||||||||
| Cleveland, OH |
64 | 4,105 | 5 | 7.9 | ||||||||||||
| Manchester, NH |
28 | 4,014 | 1 | 38.7 | ||||||||||||
| Albany, NY |
29 | 1,590 | 4 | 7.1 | ||||||||||||
| Buffalo, NY |
43 | 1,573 | 4 | 4.8 | ||||||||||||
| Rochester, NY |
34 | 1,540 | 4 | 10.3 | ||||||||||||
| (1) | Source: FDIC, June 2013. Excludes “non-retail banks” as defined by SNL Financial. See “Certain Important Information.” |
| • | Strong Customer Relationships: We focus on building strong customer relationships by delivering a consistent, high quality level of service supported by a wide range of products and services. We believe that we provide a distinctive customer experience characterized by the personal touch of a local bank with the product selection of a larger financial institution. Our Consumer Banking cross-sell efforts have improved to 4.9 products and services per retail household as of June 30, 2014 compared to 4.2 products and services as of December 31, 2009. Additionally, Consumer Banking improved overall customer satisfaction as measured by J.D. Power and Associates by 5% from 2012 to 2013, while the industry average score improved by 3% during the same period. Our ability to provide a unique customer experience is also evidenced by our Commercial Banking middle market team ranking among the top five in customer and lead bank penetration, with a 10% market penetration in our footprint based on Greenwich Associates’ rolling four-quarter data as of June 30, 2014. |
| • | Stable, Low-Cost Core Deposit Base: We have a strong funding profile, with $91.7 billion of total deposits as of June 30, 2014, consisting of 29% in noninterest-bearing deposits and 71% in interest-bearing deposits. Noninterest-bearing deposits provide a lower-cost funding base, and we grew this base to $26.7 billion at June 30, 2014, up 40% from $19.0 billion at December 31, 2009. For the six months ended June 30, 2014, our total average cost of deposits was 0.16%, down from 0.23% for the year ended December 31, 2013, 0.40% for the year ended December 31, 2012 and 1.32% for the year ended December 31, 2009. |
| • | Superior Capital Position: We are among the most well capitalized large regional banks in the United States, with a Tier 1 common equity ratio of 13.3% as of June 30, 2014, ranking highest among peer regional banks (listed under “Certain Important Information”), which had an average Tier 1 common equity ratio of 10.3% at that date according to SNL Financial. Our Common Equity Tier 1 ratio at June 30, 2014 under Basel III rules was 13.0% (on a fully phased-in basis). Our strong capital position provides us the financial flexibility to continue to invest in our businesses and execute our strategic growth initiatives. Through recent capital optimization efforts, we have sought to better align our Tier 1 common equity capital base with peer regional banks, while maintaining a solid total capital position, by reducing Tier 1 common equity capital and increasing other Tier 1 and Tier 2 capital. On August 1, 2014, we exchanged $333 million of Tier 1 common equity for Tier 2 subordinated debt, and we plan to continue our strategy of capital optimization by |
5
Table of Contents
| issuing to RBS $334 million of preferred stock and concurrently repurchasing $334 million of shares of our common stock from RBS in the fourth quarter of 2014, subject to regulatory approval and assuming completion of this offering. Pro forma for these exchanges, our Tier 1 common equity ratio would have been 12.6% as of June 30, 2014. See “Our Relationship with the RBS Group and Certain Other Related Party Transactions—Relationship with the RBS Group—Other” for further details of the planned fourth quarter exchange transaction. We plan to repurchase approximately $500 million of shares of our common stock and $250 million of shares of our common stock in 2015 and 2016, respectively, with proceeds from the issuance of subordinated debt or another lesser form of capital, subject to regulatory approval. |
| • | Solid Asset Quality Throughout a Range of Credit Cycles: Our experienced credit risk professionals and conservative credit culture, combined with centralized processes and consistent underwriting standards across all business lines, have allowed us to maintain strong asset quality through a variety of business cycles. As a result, we weathered the global financial crisis better than our peers: for the two-year period ending December 31, 2009, net charge-offs averaged 1.63% of average loans compared to a peer average of 1.76% according to SNL Financial. More recently, the credit quality of our loan portfolio has continued to improve; nonperforming assets as a percentage of total assets were 0.95% at June 30, 2014 compared to 1.20% and 1.55% as of December 31, 2013 and 2012, respectively. Net charge-offs declined substantially to an annualized 0.36% of average loans in the six months ended June 30, 2014 versus 0.60% for the six months ended June 30, 2013. Our allowance for loan and lease losses was 1.36% of total loans at June 30, 2014. We believe the high quality of our loan portfolio provides us with significant capacity to prudently seek to add more attractive, higher yielding risk-adjusted returns while still maintaining appropriate risk discipline and solid asset quality. |
| • | Experienced Management Team Supported by a High-Performing, Talented Workforce: Our leadership team of seasoned industry professionals is supported by a highly motivated, diverse set of managers and employees committed to delivering a strong customer value proposition. Our highly experienced and talented executive management team, whose members have more than 20 years of banking experience on average, provide strong leadership to deliver on our overall business objectives. We have recently made selective additions to our management team and added key business line leaders, including the Head of Distribution and Head of Everyday Banking in Consumer Banking, as well as the Head of Technology Lending and Head of Loan Trading for Commercial Banking. Bruce Van Saun, who was announced as our Chairman and CEO in May 2013, has more than 30 years of financial services experience including four years as the RBS Group Finance Director. Earlier in his career, Mr. Van Saun held a number of senior positions at The Bank of New York Mellon, Deutsche Bank, Wasserstein Perella Group and Kidder Peabody & Co. |
| • | Commitment to Communities: Community involvement is one of our principal values and we strive to contribute to a better quality of life by serving the communities across our footprint through employee volunteer efforts, a foundation that funds a range of non-profit organizations and executives that provide board leadership to community organizations. These efforts contribute to a culture that seeks to promote positive employee morale and provide differentiated brand awareness in the community relative to peer banks, while also making a positive difference within the communities we serve. Employee engagement increased during 2013 as highlighted by a 27% increase in employee volunteerism to more than 76,000 hours companywide. In addition, employees serve on approximately 480 community boards across our footprint. We believe our strong commitment to our communities provides a competitive advantage by strengthening customer relationships and increasing loyalty. |
6
Table of Contents
Business Strategy
Building on our core strengths, we intend to become a top-performing regional bank as viewed through the lenses of our five major stakeholders: customers, investors, regulators, colleagues and communities. We have identified a series of fundamental strategic initiatives designed to maximize the full potential of our business and drive sustainable growth and enhanced profitability. The core measure of our success in executing our strategic initiatives will be our ability to deliver higher Return on Average Tangible Common Equity, or ROTCE. We aim for our strategic initiatives to increase our ROTCE from 5% in 2013, excluding our $4.1 billion after-tax goodwill impairment charge, to a run-rate target of greater than 10% over a two- to three-year period.2 We plan to accomplish this goal through: (a) driving revenue growth in both the Consumer Banking and Commercial Banking segments; (b) enhancing cost reduction efforts across the company; (c) leveraging capital actions aimed at better aligning our capital structure with those of regional bank peers; and (d) the beneficial impact of a rising interest rate environment on our asset-sensitive balance sheet. We also expect these efforts to result in a targeted run-rate efficiency ratio (noninterest expense divided by the sum of net interest income and noninterest income) in the 60% range over a two- to three-year period.
| • | Revenue Growth: We are committed to generating profitable revenue growth in a disciplined manner by placing greater emphasis on reallocating resources toward businesses that will further increase and diversify our revenue base in order to deliver more attractive risk-adjusted returns to stockholders. |
Increasing Loan Origination—We expect to prudently expand our balance sheet and drive increased loan origination volume. In our Consumer business, we plan to hire more than 550 sales professionals in mortgage, small business and auto finance over a two- to three-year period. In our Commercial business, we will continue to build out industry-focused teams, expand our origination efforts in mid-corporate with geographic expansion and grow in franchise finance.
Focus on Higher Return Assets—Given our scale, expertise and current geographic reach, we believe we are well positioned to further diversify our asset base by prudently seeking higher yielding risk-adjusted assets with a more balanced mix of commercial and consumer loans and appropriate risk discipline.
Driving Additional Fee Income—We also intend to transition to a more balanced revenue profile by taking steps to further grow our noninterest income through an expansion of our wealth management, capital markets and cash management services to reduce our overall reliance on net interest income.
Our target is to increase our run-rate ROTCE in a two- to three-year period by approximately 160 to 200 basis points through these revenue growth initiatives.
| • | Cost Initiatives: We are focused on streamlining our processes and improving our cost structures. As a result of the initiative launched in late 2013 to improve efficiency and effectiveness, we expect to generate aggregate annualized expense savings of approximately $200 million over a two- to three-year period. Noninterest expense savings from this initiative are targeted to benefit our run-rate ROTCE in a two- to three-year period by approximately 90 to 100 basis points and to achieve a targeted efficiency ratio in the 60% range. |
| 2 | For information regarding the calculation of ROTCE and efficiency ratio, see “Management’s Discussion and Analysis of Financial Condition and Results of Operation—Principal Components of Operations and Key Performance Metrics Used By Management—Key Performance Metrics and Non-GAAP Financial Measures.” |
7
Table of Contents
| • | Reduction of Tier 1 Common Equity Ratio: Given the elevated level of common equity in our capital structure compared to peers, we intend to continue to pursue various capital actions, subject to regulatory approval, that are expected to reduce our Tier 1 common equity ratio to a level that is more consistent with that of other peer regional banks. We expect lower levels of tangible common equity to facilitate a 70 to 80 basis point improvement to our run- rate ROTCE over a two- to three-year period. |
| • | Rising Interest Rate Environment: Net interest income growth has been challenged by the relatively persistent low interest rate environment. We remain well positioned for a rising rate environment, which would be beneficial to our net interest margin because our asset sensitive balance sheet would react favorably to an increase in both short-term and long-term rates. As of June 30, 2014, the estimated impact on our net interest income over the next twelve months based on a 200 basis point gradual increase in rates would be 6.6%. See “Management’s Discussion and Analysis of Financial Condition and Results of Operations—Risk Governance and Quantitative and Qualitative Disclosures About Risk—Market Risk—Non-Trading Risk” for further details. Based on management’s expectations, which utilized the market implied forward rates based on the yield curve as of February 28, 2014, the benefit to our net interest income from a gradually rising rate environment would be expected to increase our run-rate ROTCE in a two- to three-year period by 130 to 160 basis points. |
While our strategic plan and our ROTCE target and its components are presented with numerical specificity, and we believe such targets to be reasonable as of the date of this prospectus, given the uncertainties surrounding our assumptions, including possible regulatory restrictions on activities we intend to pursue, there are significant risks that these assumptions may not be realized and thus our goals may not be achieved. Accordingly, our actual results may differ from these targets and the differences may be material and adverse, particularly if actual events adversely differ from one or more of our key assumptions. We caution investors not to place undue reliance on any of these assumptions or targets. See “Special Note Regarding Forward-Looking Statements,” “Risk Factors” and “Business—Business Strategy.”
Customer Focus
In addition to the strategies outlined above, we strive to develop stronger and higher value customer relationships through an intense focus on delivering a differentiated experience across all of our distribution platforms, including our robust online, telephone and mobile banking platforms. We expect this focus to continue to drive improved customer loyalty across our businesses and distinguish us from our competitors. As an example of our approach, in January 2014, we launched our new One Deposit Checking product and our $5 Overdraft Pass offering, which exemplify our Consumer Banking’s new “Simple. Clear. Personal.” value proposition. We believe this approach will enable us to win, retain and expand customer relationships, as well as increase cross-sell and share of wallet penetration across our business segments.
Our Parent and Selling Stockholders
Prior to the completion of this offering, we are a wholly owned subsidiary of RBS. We became a wholly owned subsidiary of RBS in 1988. RBS is the holding company of a large global banking and financial services group. Headquartered in Edinburgh, RBS operates in the United Kingdom, the United States and internationally through its two principal subsidiaries, The Royal Bank of Scotland plc and National Westminster Bank Plc (“NatWest”), both of which are major U.K. clearing banks. Globally, the RBS Group has a diversified customer base and provides a wide range of products and services to personal, commercial and large corporate and institutional customers. RBS acquired all of our
8
Table of Contents
outstanding common stock in 1988 and owns all of our outstanding common stock through two wholly owned subsidiaries, RBSG International Holdings Limited, a private limited company organized under the laws of Scotland, and RBS CBFM North America Corporation, a Delaware corporation, which are selling 135,363,704 shares and 4,636,296 shares, respectively, of our common stock in this offering or 156,363,704 and 4,636,296 shares, respectively, if the underwriters exercise their option to purchase additional shares in full. The selling stockholders acquired all our outstanding common stock in the ordinary course of business and, at the time of acquisition, neither selling stockholder had any agreement or understanding, directly or indirectly, with any person to distribute the shares of our common stock. RBS also holds approximately $1.3 billion of our outstanding subordinated indebtedness as of June 30, 2014. See “Management’s Discussion and Analysis of Financial Condition and Results of Operations—Capital.”
Following completion of this offering, we expect that RBS will indirectly own, through RBSG International Holdings Limited, approximately 75.0% of our common stock, assuming no exercise by the underwriters of their option to purchase additional shares, and approximately 71.2% of our common stock if the underwriters exercise their option to purchase additional shares in full. As part of its obligations under the European Commission’s State Aid Amendment Decision of April 9, 2014, RBS has committed to dispose of its remaining ownership of our common stock by December 31, 2016, with an automatic 12-month extension depending on market conditions. RBS’s current intention for disposal of its remaining ownership of our common stock is to sell, over time, such remaining shares in a series of tranches, subject to market conditions and the terms of the lock-up provisions discussed under “Underwriting.”
As a result of RBS’s continued ownership of our common stock following completion of this offering, RBS will continue to have significant control of our business. We and RBS intend to enter into, or have entered into, certain agreements that will provide a framework for our ongoing relationship with the RBS Group. For further information about risks relating to our separation from the RBS Group, including RBS’s control over us, see “Risk Factors—Risks Related to Our Separation from the RBS Group.” For more information regarding the agreements setting out the framework for our ongoing relationship with the RBS Group, see “Our Relationship with the RBS Group and Certain Other Related Party Transactions.”
Following completion of this offering and as part of our transition to a stand-alone company, we expect to incur one-time expenditures of approximately $55 million, including capitalized costs of $18 million, as well as ongoing incremental expenses of approximately $34 million per year. We expect these ongoing costs will include higher local charges associated with exiting worldwide vendor relationships and incremental expenses to support information technology, corporate governance, compliance, regulatory, financial and risk infrastructure that are necessary to enable us to operate as a fully stand-alone public company. For more information regarding incremental expenses relating to our separation from the RBS Group, see “Risk Factors—Risks Related to Our Separation from the RBS Group—Our separation from the RBS Group could adversely affect our business and profitability due to the RBS Group’s recognizable brand and reputation” and “Management’s Discussion and Analysis of Financial Condition and Results of Operations—Factors Affecting Comparability of Our Results—Operating expenses to operate as a fully independent public company.”
Risks
An investment in shares of our common stock involves substantial risks and uncertainties that may adversely affect our business, financial condition and results of operations. Some of the more significant challenges and risks relating to an investment in our common stock include:
| • | We may not be able to successfully execute our strategic plan or achieve our performance targets; |
9
Table of Contents
| • | Supervisory requirements and expectations, our need to make improvements and devote resources to various aspects of our controls, processes, policies and procedures, and any regulator-imposed limits on our activities, could limit our ability to implement our strategic plan, expand our business, improve our financial performance and make distributions to our stockholders; |
| • | A continuation of the current low interest rate environment or subsequent movements in interest rates may have an adverse effect on our profitability; |
| • | We could fail to attract or retain senior management, other key employees or members of our board of directors, which would adversely affect our business; |
| • | RBS will be our controlling stockholder and its interests may conflict with ours or yours in the future; |
| • | As of June 30, 2014, RBS was 79.5% owned by the UK government and its interests may conflict with ours or yours in the future; |
| • | The RBS Group may face the risk of full nationalization or other resolution procedures under the UK Banking Act 2009, as amended by the UK Financial Services (Banking Reform) Act 2013, which could impact the RBS Group’s contractual arrangements with us or result in other material effects on us; |
| • | Any deterioration in national economic conditions could have a material adverse effect on our business, financial condition and results of operations; |
| • | We operate in an industry that is highly competitive, which could result in losing business or margin declines and have a material adverse effect on our business, financial condition and results of operations; |
| • | Volatility in the global financial markets continued throughout 2013 as a result of the Eurozone crisis and any recurrence of such volatility could have a material adverse effect on our business, financial condition and results of operations; |
| • | As a financial holding company and a bank holding company, we are subject to comprehensive regulation that could have a material adverse effect on our business and results of operations; |
| • | We may be unable to disclose some restrictions or limitations on our operations imposed by our regulators; |
| • | We are subject to capital adequacy and liquidity standards, and if we fail to meet these standards, our financial condition and results of operations would be adversely affected; |
| • | Our stock price could decline due to the large number of outstanding shares of our common stock eligible for future sale, and RBS has committed to sell its remaining beneficial ownership of our common stock by the end of 2016 with a possible 12 month extension in certain circumstances. The exact timing of such sale or sales remains uncertain; and |
| • | If RBS sells a controlling interest in our company to a third party in a private transaction, you may not realize any change-of-control premium on shares of our common stock and we may become subject to the control of a presently unknown third party. |
10
Table of Contents
Other Information
We are subject to the supervision and regulation of the Board of Governors of the Federal Reserve System (“Federal Reserve Board”). We are distinct from and independent of the RBS Group’s other businesses in the United States and have our own board of directors (“Board”) and executive management team. Our principal executive offices are located at One Citizens Plaza in Providence, Rhode Island, and our telephone number is (401) 456-7000.
11
Table of Contents
| The offering |
140,000,000 common stock offered by the selling stockholders. |
| Common stock outstanding |
559,998,324 shares. |
| Option to purchase additional shares of common stock to cover over-allotments |
21,000,000 shares from the selling stockholders. |
| Voting rights |
Each holder of our common stock will be entitled to one vote per share with respect to all matters on which stockholders generally are entitled to vote, except as otherwise required by law. |
| Use of proceeds |
We will not receive any proceeds from the sale of common stock in the offering; the selling stockholders will receive all of the proceeds from the sale of shares of our common stock. |
| Dividend policy |
We intend to pay quarterly cash dividends on our common stock at an initial amount of approximately $0.10 per share, although any declaration of dividends will be at the discretion of our Board and will depend on our financial condition, earnings, cash needs, regulatory constraints, capital requirements (including requirements of our subsidiaries) and any other factors that our Board deems relevant in making such a determination. We are not currently permitted to increase our capital distributions above 2013 levels because the Federal Reserve Board objected to our capital plan, owing to identified deficiencies in our capital planning processes. See “Regulation and Supervision—Dividends” for more information. Therefore, there can be no assurance that we will pay any dividends to holders of our common stock, or as to the amount of any such dividends. |
| Dividends from our banking subsidiaries are the principal source of funds for the payment of dividends on our common stock. Our banking subsidiaries are subject to certain restrictions that may limit their ability to pay dividends to us. See “Dividend Policy” for more information. |
| Risk factors |
See “Risk Factors” for a discussion of risks you should carefully consider before deciding to invest in our common stock. |
| Controlling stockholder |
Prior to the completion of this offering, we are an indirect wholly owned subsidiary of RBS, and have been a part of the RBS Group’s consolidated business operations. Upon completion of this offering, RBS will beneficially own approximately 75.0% of our outstanding shares of common stock (71.2% if the underwriters’ over-allotment option is exercised in full). |
| For further information regarding our relationship with the RBS Group in the past and following the offering, see “Our Relationship with the RBS Group and Certain Other Related Party Transactions.” |
12
Table of Contents
| Directed share program |
At our request, the underwriters have reserved approximately 2% of the shares of common stock to be offered by this prospectus for sale, at the initial public offering price, to directors, officers, employees and business associates of the Company. The number of shares of common stock available for sale to the general public will be reduced to the extent these individuals purchase such reserved shares. Any reserved shares that are not so purchased will be offered by the underwriters to the general public on the same basis as the other shares offered by this prospectus. |
| Preemptive and other rights |
Purchasers of the shares sold in this offering will not have any preemptive rights. Our common stock is not subject to redemption. |
| Listing |
We have applied to list our shares of common stock on the NYSE under the symbol “CFG.” |
| Conflicts of Interest |
Because RBS Securities Inc., an underwriter for this offering, is under common control with us and the selling stockholders and because affiliates of RBS Securities Inc. will receive at least 5% of the proceeds of this offering, a conflict of interest under Financial Industry Regulatory Authority, Inc. (“FINRA”) Rule 5121 is deemed to exist. Accordingly, this offering will be conducted in accordance with that rule. See “Underwriting—Conflicts of Interest.” |
All share information, including historical financial results, reflects a 165,582-for-1 forward stock split effective on August 22, 2014. Unless we specifically state otherwise, the information in this prospectus does not take into account the:
| • | 5,087,770 shares (based principally on the midpoint of the range set forth on the cover page of this prospectus) of common stock underlying CFG equity awards following the conversion of (i) outstanding RBS deferred share awards, (ii) outstanding RBS long-term incentive awards (assuming maximum achievement of the performance conditions applicable to the long-term incentive awards) and (iii) special IPO awards, in each case, into awards on shares of our common stock upon completion of this offering. For further details, see “Compensation Discussion and Analysis”; or |
| • | 62,112,029 shares of common stock that may be granted under our new equity compensation plans (including our employee stock purchase plan) following this offering. |
13
Table of Contents
SUMMARY CONSOLIDATED FINANCIAL AND OTHER DATA
We derived the summary consolidated operating data for the years ended December 31, 2013, 2012 and 2011 and the summary consolidated balance sheet data as of December 31, 2013 and 2012 from our audited consolidated financial statements included elsewhere in this prospectus. We derived the summary consolidated balance sheet data as of December 31, 2011 from our consolidated financial statements, which are not included in this prospectus. We derived the summary consolidated operating data for the six months ended June 30, 2014 and 2013 and the summary consolidated balance sheet data as of June 30, 2014 from our unaudited interim consolidated financial statements included elsewhere in this prospectus. Our historical results are not necessarily indicative of the results expected for any future period.
In our opinion, the unaudited interim consolidated financial statements have been prepared on the same basis as the audited consolidated financial statements and include all adjustments, consisting of normal recurring adjustments, necessary for a fair presentation of the information set forth herein. Our operating results for the six months ended June 30, 2014 are not necessarily indicative of those to be expected for the year ending December 31, 2014 or for any future period. You should read the following summary consolidated financial data in conjunction with the sections of this prospectus entitled “Selected Consolidated Financial Data,” “Management’s Discussion and Analysis of Financial Condition and Results of Operations” and “Selected Statistical Information” and our consolidated financial statements and the notes thereto included elsewhere in this prospectus.
| For the Six Months Ended June 30, |
For the Year Ended December 31, |
|||||||||||||||||||
| 2014 | 2013 | 2013 | 2012 | 2011 | ||||||||||||||||
| (dollars in millions, except per share amounts) | ||||||||||||||||||||
| Operating Data: |
||||||||||||||||||||
| Net interest income |
$ | 1,641 | $ | 1,509 | $ | 3,058 | $ | 3,227 | $ | 3,320 | ||||||||||
| Noninterest income |
998 | 870 | 1,632 | 1,667 | 1,711 | |||||||||||||||
|
|
|
|
|
|
|
|
|
|
|
|||||||||||
| Total revenue |
2,639 | 2,379 | 4,690 | 4,894 | 5,031 | |||||||||||||||
| Provision for credit losses |
170 | 202 | 479 | 413 | 882 | |||||||||||||||
| Noninterest expense |
1,758 | 6,073 | 7,679 | 3,457 | 3,371 | |||||||||||||||
| Noninterest expense, excluding goodwill impairment(1) |
1,758 | 1,638 | 3,244 | 3,457 | 3,371 | |||||||||||||||
| Income (loss) before income tax expense (benefit) |
711 | (3,896 | ) | (3,468 | ) | 1,024 | 778 | |||||||||||||
| Income tax expense (benefit) |
232 | (174 | ) | (42 | ) | 381 | 272 | |||||||||||||
| Net income (loss) |
479 | (3,722 | ) | (3,426 | ) | 643 | 506 | |||||||||||||
| Net income, excluding goodwill impairment(1) |
479 | 358 | 654 | 643 | 506 | |||||||||||||||
| Net income (loss) per average common share—basic and diluted(2) |
0.86 | (6.65 | ) | (6.12 | ) | 1.15 | 0.90 | |||||||||||||
| Net income per average common share—basic and diluted, excluding goodwill impairment(1)(2) |
0.86 | 0.64 | 1.17 | 1.15 | 0.90 | |||||||||||||||
| Other Operating Data: |
||||||||||||||||||||
| Return on average common equity(3)(12) |
4.96 | % | (13.87 | )% | (15.69 | )% | 2.69 | % | 2.19 | % | ||||||||||
| Return on average common equity, excluding goodwill impairment(1)(12) |
4.96 | % | 2.98 | % | 3.00 | % | 2.69 | % | 2.19 | % | ||||||||||
| Return on average tangible common equity(1)(12) |
7.45 | % | (24.96 | )% | (25.91 | )% | 4.86 | % | 4.18 | % | ||||||||||
| Return on average tangible common equity, excluding goodwill impairment(1)(12) |
7.45 | % | 5.37 | % | 4.95 | % | 4.86 | % | 4.18 | % | ||||||||||
| Return on average total assets(4)(12) |
0.77 | % | (2.73 | )% | (2.83 | )% | 0.50 | % | 0.39 | % | ||||||||||
| Return on average total assets, excluding goodwill impairment(1)(12) |
0.77 | % | 0.59 | % | 0.54 | % | 0.50 | % | 0.39 | % | ||||||||||
| Return on average total tangible assets(1)(12) |
0.81 | % | (2.99 | )% | (3.05 | )% | 0.55 | % | 0.43 | % | ||||||||||
| Return on average total tangible assets, excluding goodwill impairment(1)(12) |
0.81 | % | 0.64 | % | 0.58 | % | 0.55 | % | 0.43 | % | ||||||||||
| Efficiency ratio(1) |
66.58 | % | 255.24 | % | 163.73 | % | 70.64 | % | 67.00 | % | ||||||||||
| Efficiency ratio, excluding goodwill impairment(1) |
66.58 | % | 68.80 | % | 69.17 | % | 70.64 | % | 67.00 | % | ||||||||||
| Net interest margin(5)(12) |
2.88 | % | 2.83 | % | 2.85 | % | 2.89 | % | 2.97 | % | ||||||||||
14
Table of Contents
| As of June 30, 2014 |
As of December 31, |
|||||||||||||||
| 2013 | 2012 | 2011 | ||||||||||||||
| (dollars in millions) | ||||||||||||||||
| Balance Sheet Data: |
||||||||||||||||
| Total assets |
$ | 130,279 | $ | 122,154 | $ | 127,053 | $ | 129,654 | ||||||||
| Loans and leases(6) |
88,829 | 85,859 | 87,248 | 86,795 | ||||||||||||
| Allowance for loan and lease losses |
1,210 | 1,221 | 1,255 | 1,698 | ||||||||||||
| Total securities |
24,823 | 21,245 | 19,417 | 23,352 | ||||||||||||
| Goodwill |
6,876 | 6,876 | 11,311 | 11,311 | ||||||||||||
| Total liabilities |
110,682 | 102,958 | 102,924 | 106,261 | ||||||||||||
| Deposits(7) |
91,656 | 86,903 | 95,148 | 92,888 | ||||||||||||
| Federal funds purchased and securities sold under agreements to repurchase |
6,807 | 4,791 | 3,601 | 4,152 | ||||||||||||
| Other short-term borrowed funds |
7,702 | 2,251 | 501 | 3,100 | ||||||||||||
| Long-term borrowed funds |
1,732 | 1,405 | 694 | 3,242 | ||||||||||||
| Stockholders’ equity |
19,597 | 19,196 | 24,129 | 23,393 | ||||||||||||
| Other Balance Sheet Data: |
||||||||||||||||
| Asset Quality Ratios: |
||||||||||||||||
| Allowance for loan and lease losses as a percentage of total loans and leases |
1.36 | % | 1.42 | % | 1.44 | % | 1.96 | % | ||||||||
| Allowance for loan and lease losses as a percentage of nonperforming loans and leases |
101 | % | 86 | % | 67 | % | 95 | % | ||||||||
| Nonperforming loans and leases as a percentage of total loans and leases |
1.35 | % | 1.65 | % | 2.14 | % | 2.06 | % | ||||||||
| Capital ratios: |
||||||||||||||||
| Tier 1 capital ratio(8) |
13.3 | % | 13.5 | % | 14.2 | % | 13.9 | % | ||||||||
| Total capital ratio(9) |
16.2 | % | 16.1 | % | 15.8 | % | 15.1 | % | ||||||||
| Tier 1 common equity ratio(10) |
13.3 | % | 13.5 | % | 13.9 | % | 13.3 | % | ||||||||
| Leverage ratio(11) |
11.1 | % | 11.6 | % | 12.1 | % | 11.6 | % | ||||||||
| (1) | These measures are not recognized under generally accepted accounting principles in the United States, or GAAP. For more information on the computation of these non-GAAP financial measures, see “Management’s Discussion and Analysis of Financial Condition and Results of Operations—Principal Components of Operations and Key Performance Metrics Used By Management—Key Performance Metrics and Non-GAAP Financial Measures.” |
| (2) | Earnings per share information reflects a 165,582-for-1 forward stock split effective on August 22, 2014. |
| (3) | We define “Return on average common equity” as net income (loss) divided by average common equity. |
| (4) | We define “Return on average total assets” as net income (loss) divided by total average assets. |
| (5) | We define “Net interest margin” as net interest income divided by average total interest-earning assets. |
| (6) | Excludes loans held for sale of $262 million, $1.3 billion, $646 million, and $564 million as of June 30, 2014 and December 31, 2013, 2012 and 2011, respectively. |
| (7) | Excludes deposits held for sale of $5.3 billion as of December 31, 2013. |
| (8) | We define “Tier 1 capital ratio” as Tier 1 capital balance divided by total risk-weighted assets as defined under Basel I. |
| (9) | We define “Total capital ratio” as total capital balance divided by total risk-weighted assets as defined under Basel I. |
| (10) | We define “Tier 1 common equity ratio” as Tier 1 capital balance, minus preferred stock, divided by total risk-weighted assets as defined under Basel I. |
| (11) | We define “Leverage ratio” as Tier 1 capital balance divided by quarterly average total assets as defined under Basel I. |
| (12) | Operating ratios for the periods ended June 30, 2014 and 2013 are presented on an annualized basis. |
15
Table of Contents
We are subject to a number of risks potentially impacting our business, financial condition, results of operations and cash flows. As a financial services organization, certain elements of risk are inherent in our transactions and operations and are present in the business decisions we make. We, therefore, encounter risk as part of the normal course of our business and we design risk management processes to help manage these risks. Our success is dependent on our ability to identify, understand and manage the risks presented by our business activities so that we can appropriately balance revenue generation and profitability. These risks include, but are not limited to, credit risk, market risks, liquidity risks, operational risks, model risks, technology, regulatory and legal risks and strategic and reputational risks. We discuss our principal risk management processes and, in appropriate places, related historical performance in the “Management’s Discussion and Analysis of Financial Condition and Results of Operations” section of this prospectus.
You should carefully consider the following risk factors that may affect our business, future operating results and financial condition, as well as the other information set forth in this prospectus before making a decision to invest in our common stock. If any of the following risks actually occur, our business, financial condition or results of operations would likely be materially adversely affected. In such case, the trading price of our common stock would likely decline due to any of these risks, and you may lose all or part of your investment. The following risks are not the only risks we face. Additional risks that are not presently known or that we presently deem to be immaterial also could have a material adverse effect on our financial condition, results of operations and business.
Risks Related to Our Business
We may not be able to successfully execute our strategic plan or achieve our performance targets.
Our strategic plan, which we began to implement in the second half of 2013, involves four principal elements: (a) increasing revenue in both Consumer Banking and Commercial Banking; (b) enhancing cost reduction efforts across the company; (c) leveraging capital actions aimed at better aligning our capital structure with those of regional bank peers; and (d) the beneficial impact of a rising interest rate environment on our asset-sensitive balance sheet. Our future success and the value of our stock will depend, in part, on our ability to effectively implement our strategic plan. There are risks and uncertainties, many of which are not within our control, associated with each element of our plan discussed further below.
In addition, certain of our key initiatives require regulatory approval, which may not be obtained on a timely basis, if at all. Moreover, even if we do obtain required regulatory approval, it may be conditioned on certain organizational changes, such as those discussed below, that could reduce the profitability of those initiatives.
Revenue Generation Component of Strategic Plan, Assumptions and Associated Risks. Our plans to increase revenue involve reallocating resources toward business that will further increase and diversify our revenue base, including by prudently growing higher-return earning assets, identifying and capitalizing on more fee income opportunities and selectively expanding our balance sheet through increased loan origination volume principally in mortgage, small business and auto. Our revenue growth plans are based on a number of assumptions, many of which involve factors that are outside our control. Our key assumptions include:
| • | that we will be able to attract and retain the requisite number of skilled and qualified personnel required to increase our loan origination volume in mortgage, business banking, auto and wealth. The marketplace for skilled personnel is competitive, which means hiring, training and |
16
Table of Contents
| retaining skilled personnel is costly and challenging and we may not be able to increase the number of our loan professionals sufficiently to achieve our loan origination targets successfully; |
| • | that we will be able to grow higher-return earning assets with acceptable risk performance and increase fee income in part by means of increased management discipline, industry focus, expansion of target markets, focus on higher-return yielding assets and increased origination efforts; |
| • | that we will be able to fund asset growth by growing deposits with our cost of funds increasing at a rate consistent with our expectations; |
| • | that we will be able to successfully identify and purchase high-quality interest-earning assets that perform over time in accordance with our projected models; |
| • | that our expansion into specialized industries, as well as our efforts to expand nationally in the mid-corporate space, will not materially alter our risk profile from existing business operations in ways that our existing risk models cannot effectively or accurately model; |
| • | that there will be no material change in competitive dynamics, including as a result of our seeking to increase market share and enter into new markets (as discussed below, we operate in a highly competitive industry and any change in our ability to retain deposits or attract new customers in line with our current expectations would adversely affect our ability to grow our revenue); and |
| • | that software we have recently licensed and implemented throughout our business, including an automated loan origination platform, will function consistent with our expectations. |
If one or more of our assumptions prove incorrect, we may not be able to successfully execute our strategic plan, we may never achieve our indicative performance targets and any shortfall may be material.
Cost Savings and Efficiency Component of Strategic Plan and Associated Risks. In order for us to execute our strategic plan successfully, we must implement a number of cost reduction and efficiency improvement initiatives, including streamlining processes, reducing redundancy and improving cost structures, which we believe will allow us to reduce overall expenses. There may be unanticipated difficulties in implementing our efficiency initiatives, and there can be no assurance that we will fully realize our target expense reductions, or be able to sustain any annual cost savings achieved by our efficiency initiative. Reducing costs may prove difficult in light of our efforts to establish and maintain our stand-alone operational and infrastructural capabilities as a banking institution fully separate from the RBS Group, including our rebranding efforts associated with our separation from the RBS Group. Reducing our structural costs also may be difficult owing to our efforts to make organizational improvements in risk management and various policies and procedures in order to comply with new regulations, as well as requirements imposed by and guidance from our regulators. In addition, any significant unanticipated or unusual charges, provisions or impairments, including as a result of any ongoing legal and regulatory proceedings or industry regulatory changes, would adversely affect our ability to reduce our cost structure in any particular period. If we are unable to reduce our cost structure as we anticipate, we may not be able to successfully execute our strategic plan, we may never achieve our indicative performance targets and any shortfall may be material.
Reduction of Our Tier 1 Common Equity Ratio. Our strategic plan requires us to complete capital initiatives that would result in a lower overall Tier 1 common equity ratio. Because our capital structure is subject to extensive regulatory scrutiny, including under the Federal Reserve Board’s Comprehensive Capital Analysis and Review, or CCAR, process, we may not able to consummate the capital initiatives required to bring our Tier 1 common equity ratio in line with our expectations. This
17
Table of Contents
could prevent us from achieving our ROTCE targets. For more information about risks relating to our ability to obtain the requisite approval from the Federal Reserve Board, see “—Supervisory requirements and expectations on us as a financial holding company and a bank holding company, our need to make improvements and devote resources to various aspects of our controls, processes, policies and procedures, and any regulator-imposed limits on our activities, could limit our ability to implement our strategic plan, expand our business, improve our financial performance and make capital distributions to our stockholders.”
Rising Interest Rate Environment. Net interest income growth has been challenged by the relatively persistent low interest rate environment. Our strategic plan includes assumptions about rising interest rates in the coming periods. In particular, our strategic plan assumes that interest rates will evolve consistent with the market implied forward rates based on the yield curve as of February 28, 2014. We do not control interest rates and there is no guarantee that interest rates will rise consistent with our expectations. If the current low interest rate environment were to continue or if interest rates do not rise as much or as quickly as we expect, then we may not be able to achieve our ROTCE targets. For further information about our interest rate sensitivity, see “Management’s Discussion and Analysis of Financial Condition and Results of Operations—Risk Governance and Quantitative and Qualitative Disclosures About Risk—Market Risk.”
In addition to the four principal elements of our strategic plan, we also anticipate that our ROTCE will be affected by a number of additional factors. We anticipate a benefit to our ROTCE from runoff of our non-core portfolio and existing pay-fixed interest rate swaps, which we expect will be offset by the negative impact on our ROTCE of some deterioration in the credit environment as they return to historical levels and a decline in gains on investments in securities. We do not control many aspects of these factors (or others) and actual results could differ from our expectations materially, which could impair our ability to achieve our strategic ROTCE goals.
Supervisory requirements and expectations on us as a financial holding company and a bank holding company, our need to make improvements and devote resources to various aspects of our controls, processes, policies and procedures, and any regulator-imposed limits on our activities, could limit our ability to implement our strategic plan, expand our business, improve our financial performance and make capital distributions to our stockholders.
As a result of and in addition to new legislation aimed at regulatory reform, such as the Dodd-Frank Wall Street Reform and Consumer Protection Act (the “Dodd-Frank Act”), and the increased capital and liquidity requirements introduced by the U.S. implementation of the Basel III framework, the federal banking agencies, such as the Federal Reserve Board, the Office of the Comptroller of the Currency (“OCC”) and the Federal Deposit Insurance Corporation (“FDIC”), as well as the Consumer Financial Protection Bureau (“CFPB”), have taken a stricter approach to supervising and regulating financial institutions and financial products and services over which they exercise their respective supervisory authorities. We, our two banking subsidiaries and our products and services are all subject to greater supervisory scrutiny and enhanced supervisory requirements and expectations and face significant challenges in meeting them. We expect to continue to face greater supervisory scrutiny and enhanced supervisory requirements in the foreseeable future.
Our two banking subsidiaries are currently subject to consent orders issued by the OCC and the FDIC in connection with their findings of deceptive marketing and implementation of some of our checking account and funds transfer products and services. Among other things, the consent orders require us to remedy deficiencies and develop stronger compliance controls, policies and procedures. We have made progress and continue to make progress in addressing these requirements, but the consent orders remain in place and we are unable to predict when they may be terminated. CBNA is also making improvements to its compliance management systems, fair lending compliance, risk management, deposit reconciliation practices and overdraft fees in order to address deficiencies in
18
Table of Contents
those areas. CBPA is making improvements to address deficiencies in its deposit reconciliation practices, overdraft fees, identity theft add-on products, third-party payment processor activities, oversight of third-party service providers, compliance program, policies, procedures and training, consumer complaints process and anti-money laundering controls. These efforts require us to make investments in additional resources and systems and also require a significant commitment of managerial time and attention.
The OCC recently determined that CBNA currently does not meet the condition—namely, that CBNA must be both well capitalized and well managed, as those terms are defined in applicable regulations, based on certain minimum capital ratios and supervisory ratings, respectively—to own a financial subsidiary. A financial subsidiary is permitted to engage in a broader range of activities, similar to those of a financial holding company, than those permissible for a national bank. CBNA has two financial subsidiaries, Citizens Securities, Inc., a registered broker-dealer, and RBS Citizens Insurance Agency, Inc., a dormant entity, although it continues to collect commissions on certain outstanding policies. CBNA has entered into an agreement with the OCC (the “OCC Agreement”) pursuant to which it must develop a remediation plan, which must be submitted to the OCC, setting forth the specific actions it will take to bring itself back into compliance with the condition to own a financial subsidiary and the schedule for achieving that objective. Until CBNA satisfactorily addresses the deficiencies, it will be subject to restrictions on its ability to acquire control of or hold an interest in any new financial subsidiary and to commence new activities in any existing financial subsidiary, without the prior consent of the OCC. If CBNA fails to remediate the deficiencies within 180 days from March 13, 2014, or such longer period as the OCC may permit, it may have to divest itself of its financial subsidiaries and comply with any additional limitations or conditions on its conduct as the OCC may impose. CBNA has implemented a comprehensive enterprise-wide program that seeks to address these deficiencies.
In March 2014, the Federal Reserve Board objected on qualitative grounds to our capital plan submitted as part of the CCAR process. In its public report entitled “Comprehensive Capital Analysis and Review 2014: Assessment Framework and Results,” the Federal Reserve Board cited significant deficiencies in our capital planning processes, including inadequate governance, weak internal controls and deficiencies in our practices for estimating revenues and losses under a stress scenario and for ensuring the appropriateness of loss estimates across our business lines in a specific stress scenario. Although the Federal Reserve Board acknowledged that bank holding companies such as ours that are new to the CCAR process are subject to different expectations, our weaknesses were considered serious enough to warrant the Federal Reserve Board’s objection based on its qualitative assessment of our capital planning process. As a result, we are not permitted to increase our capital distributions above 2013 levels until a new capital plan is approved by the Federal Reserve Board. The deadline for our next capital plan submission is January 5, 2015, and we cannot assure you that the Federal Reserve Board will not object to our next capital plan or that, even if it does not object to it, our planned capital distributions will not be significantly modified from 2013 levels.
We are also required to make improvements to our overall compliance and operational risk management programs and practices in order to comply with enhanced supervisory requirements and expectations and to address weaknesses in retail credit risk management, liquidity risk management, model risk management, outsourcing and vendor risk management and related oversight and monitoring practices and tools. Our and our banking subsidiaries’ consumer compliance program and controls also require improvement, particularly with respect to deposit reconciliation processes, fair lending and mortgage servicing. In addition to all of the foregoing, as part of our and our banking subsidiaries’ regular examination process, from time to time we and our banking subsidiaries may become, and currently are, subject to prudential restrictions on our activities. The restrictions that apply to CBNA are described above. Similarly, under the Bank Holding Company Act of 1956 (the “Bank Holding Company Act”), currently we may not be able to engage in certain categories of new activities or acquire shares or control of other companies other than in connection with internal reorganizations.
19
Table of Contents
In order to remedy these weaknesses and meet these regulatory and supervisory challenges, we need to make substantial improvements to our compliance, risk management and other processes, systems and controls. We expect to continue to dedicate significant resources and managerial time and attention and to make significant investments in enhanced compliance, risk management and other processes, systems and controls. We also expect to make restitution payments to our banking subsidiaries’ customers, which could be significant, arising from certain of the consumer compliance deficiencies described above and may be required to pay civil money penalties in connection with certain of these deficiencies. We have established reserves in respect of these future payments, but the amounts that we are ultimately obligated to pay could be in excess of our reserves.
The remediation efforts and other matters described above will increase our operational costs and may limit our ability to implement aspects of our strategic plan or otherwise pursue certain business opportunities. Moreover, if we are unsuccessful in remedying these weaknesses and meeting the enhanced supervisory requirements and expectations that apply to us and our banking subsidiaries, we could remain subject to existing restrictions or become subject to additional restrictions on our activities, informal (non-public) or formal (public) supervisory actions or public enforcement actions, including the payment of civil money penalties. Any such actions or restrictions, if and in whatever manner imposed, would likely increase our costs and could limit our ability to implement our strategic plans and expand our business, and as a result could have a material adverse effect on our business, results of operations or financial condition.
A continuation of the current low interest rate environment or subsequent movements in interest rates may have an adverse effect on our profitability.
Historically, and in the near-to-medium term, we anticipate that net interest income will remain a significant component of our total revenue. This is due to the fact that a high percentage of our assets and liabilities have been and will likely continue to be in the form of interest-bearing or interest-related instruments. Our net interest income was $1.6 billion for the six months ended June 30, 2014 and $3.1 billion for the year ended December 31, 2013. Changes in interest rates can have a material effect on many areas of our business, including the following:
Net Interest Income. In recent years, it has been the policy of the Federal Reserve Board and the U.S. Treasury to maintain interest rates at historically low levels through its targeted federal funds rate and the purchase of U.S. Treasury and mortgage-backed securities. As a result, yields on securities we have purchased, and market rates on the loans we have originated, have been at levels lower than were available prior to 2008. Consequently, the average yield on our interest-earning assets has decreased during the recent low interest rate environment. If a low interest rate environment persists, our net interest income may further decrease. This would be the case because our ability to lower our interest expense has been limited at these interest rate levels, while the average yield on our interest-earning assets has continued to decrease. Moreover, if our floating rate interest-earning assets do not reprice faster than our interest-bearing liabilities, our net interest income could be adversely affected. If our net interest income further decreases, this could have an adverse effect on our profitability.
Deposit Costs. Our net interest margin would narrow if our cost of funding increases without a correlative increase in the interest we earn from loans and investments. Because we rely extensively on deposits to fund our operations, our cost of funding would increase if there is an increase in the interest rate we are required to pay our customers to retain their deposits. This could occur, for instance, if we are faced with competitive pressures to increase rates on deposits. In addition, if the interest rates we are required to pay for other sources of funding (for example, in the interbank or capital markets) increases, our cost of funding would increase. If any of the foregoing risks occurs, our net interest margin would narrow unless there was a correlative increase in the interest we earn from our loans and investments. Although our assets currently reprice faster than our liabilities (which would result in a benefit to net interest income as interest rates rise), the benefit from rising rates could be less than we assume, which may have an adverse effect on our profitability.
20
Table of Contents
Loan Volume and Delinquency. Increases in interest rates may decrease customer demand for loans as the higher cost of obtaining credit may deter customers from new loans. Further, higher interest rates might also lead to an increased number of delinquent loans and defaults, which would impact the value of our loans.
Value of Our Mortgage Servicing Rights. As a residential mortgage servicer, we have a portfolio of mortgage servicing rights (“MSRs”). MSRs are subject to interest rate risk in that their fair value will fluctuate as a result of changes in the interest rate environment. When interest rates fall, borrowers are generally more likely to prepay their mortgage loans by refinancing them at a lower rate. As the likelihood of prepayment increases, the fair value of MSRs can decrease. Decrease in the fair value below the carrying value of MSRs will reduce earnings in the period in which the decrease occurs.
We cannot control or predict with certainty changes in interest rates. Global, national, regional and local economic conditions, competitive pressures and the policies of regulatory authorities, including monetary policies of the Federal Reserve Board, affect interest income and interest expense. Although we have policies and procedures designed to manage the risks associated with changes in market interest rates, as further discussed under “Management’s Discussion and Analysis of Financial Condition and Results of Operations—Risk Governance,” changes in interest rates still may have an adverse effect on our profitability.
If our assumptions regarding borrower behavior are wrong or overall economic conditions are significantly different than we anticipate, then our risk mitigation may be insufficient to protect against interest rate risk and our net income would be adversely affected.
We could fail to attract, retain or motivate highly skilled and qualified personnel, including our senior management, other key employees or members of our Board, which could impair our ability to successfully execute our strategic plan and otherwise adversely affect our business.
A key cornerstone of our strategic plan involves the hiring of a large number of highly skilled and qualified personnel. Accordingly, our ability to implement our strategic plan and our future success depends on our ability to attract, retain and motivate highly skilled and qualified personnel, including our senior management and other key employees and directors, competitively with our peers. The marketplace for skilled personnel is becoming more competitive, which means the cost of hiring, incentivizing and retaining skilled personnel may continue to increase. The failure to attract or retain a sufficient number of appropriately skilled personnel could place us at a significant competitive disadvantage and prevent us from successfully implementing our strategy, which could impair our ability to implement our strategic plan successfully, achieve our performance targets and otherwise have a material adverse effect on our business, financial condition and results of operations.
Governmental scrutiny with respect to matters relating to compensation and other business practices in the financial services industry has increased dramatically in the past several years and has resulted in more aggressive and intense regulatory supervision and the application and enforcement of more stringent standards. For example, in June 2010, the Federal Reserve Board and other federal banking regulators jointly issued comprehensive final guidance designed to ensure that incentive compensation policies do not undermine the safety and soundness of banking organizations by encouraging employees to take imprudent risks. The recent financial crisis and the current political and public sentiment regarding financial institutions has resulted in a significant amount of adverse press coverage, as well as adverse statements or charges by regulators and elected officials. Future legislation or regulation or government views on compensation may result in us altering compensation practices in ways that could adversely affect our ability to attract and retain talented employees.
21
Table of Contents
In addition to complying with U.S. laws relating to compensation, we are also required to comply with United Kingdom (UK) and European Union (EU) remuneration requirements for so long as we remain subject to the supervision of the UK Prudential Regulatory Authority (PRA), which supervision will continue until the PRA determines that RBS Group ceases to control us. As a result of the implications of the EU Capital Requirements Directive IV (CRD IV), certain of our most senior employees, including our CEO, may not receive variable compensation in excess of 100% of fixed compensation (200% with shareholder approval) starting with performance year 2014. Because shareholder approval was not sought by RBS, a 100% limitation applies for 2014. We intend to maintain competitive total compensation levels for affected employees, although it is possible that the structure of our compensation packages may not be considered in line with our peers.
Our ability to meet our obligations, and the cost of funds to do so, depend on our ability to access sources of liquidity and the particular sources available to us.
Liquidity risk is the risk that we will not be able to meet our obligations, including funding commitments, as they come due. This risk is inherent in our operations and can be heightened by a number of factors, including an over-reliance on a particular source of funding (including, for example, short-term and overnight funding), changes in credit ratings or market-wide phenomena such as market dislocation and major disasters. Like many banking groups, our reliance on customer deposits to meet a considerable portion of our funding has grown over recent years, and we continue to seek to increase the proportion of our funding represented by customer deposits. However, these deposits are subject to fluctuation due to certain factors outside our control, such as a loss of confidence by customers in us or the banking sector generally, increasing competitive pressures for retail or corporate customer deposits, changes in interest rates and returns on other investment classes, which could result in a significant outflow of deposits within a short period of time. To the extent that in the future there is heavy competition among U.S. banks for retail customer deposits, this competition may increase the cost of procuring new deposits and otherwise negatively affect our ability to grow our deposit base. An inability to grow, or any material decrease in, our deposits could have a material adverse effect on our ability to satisfy our liquidity needs.
In addition, volatility in the interbank funding market can negatively impact our ability to fund our operations. For example, funding in the interbank markets, a traditional source of unsecured short-term funding, was severely disrupted throughout the global economic and financial crisis. If market disruption or significant volatility returns to the interbank or wholesale funding market, our ability to access capital in these funding markets could be materially impaired. Additionally, other factors outside our control, such as an operational problem that affects third parties, could impair our ability to access capital markets or create an unforeseen outflow of cash or deposits. Our inability to access adequate funding, whether from bank deposits, the interbank funding market or capital markets, would constrain our ability to make new loans, to meet our existing lending commitments and ultimately jeopardize our overall liquidity and capitalization.
Maintaining a diverse and appropriate funding strategy for our assets consistent with our wider strategic plan remains challenging, and any tightening of credit markets could have a material adverse impact on us. In particular, there is a risk that corporate and financial institution counterparties may seek to reduce their credit exposures to banks and other financial institutions (for example, reflected in reductions in unsecured deposits supplied by these counterparties), which may cause funding from these sources to no longer be available. Under these circumstances, we may need to seek funds from alternative sources, potentially at higher costs than has previously been the case, or may be required to consider disposals of other assets not previously identified for disposal to reduce our funding commitments.
22
Table of Contents
A reduction in our credit ratings, which are based on a number of factors, including the credit ratings of RBS or other members of the RBS Group, could have a material adverse effect on our business, financial condition and results of operations.
Credit ratings affect the cost and other terms upon which we are able to obtain funding. Rating agencies regularly evaluate us, and their ratings are based on a number of factors, including our financial strength. Other factors considered by rating agencies include the financial strength of and other factors relating to RBS and the RBS Group, as well as conditions affecting the financial services industry generally. Any downgrade in our ratings would likely increase our borrowing costs and could limit our access to capital markets and adversely affect our business. For example, a ratings downgrade could adversely affect our ability to sell or market in the capital markets certain of our securities, including subordinated debt, engage in certain longer-term and derivatives transactions and retain our customers, particularly corporate customers who need a minimum rating threshold in order to invest or deposit. In addition, under the terms of certain of our derivatives contracts, we may be required to maintain a minimum credit rating or have to post additional collateral or terminate such contracts. Any of these results of a rating downgrade could increase our cost of funding, reduce our liquidity and have adverse effects on our business, financial condition and results of operations.
Any downgrade in the credit rating of RBS, which will own 75.0% of our stock after completion of this offering (or 71.2% if the underwriters’ option to purchase additional shares of common stock is exercised in full), or other members of the RBS Group may negatively impact the rating agencies’ evaluation of us and our business which could ultimately result in a downgrade of our credit ratings. The credit ratings of RBS and other members of the RBS Group, along with a number of other European financial institutions, were downgraded during the course of the last three years as part of the rating agencies’ rating methodology changes, review of systemic support assumptions incorporated into bank ratings and the likelihood, in the case of banks located in the United Kingdom, that the UK government is more likely in the future to make greater use of its regulatory tools to allow burden sharing among bank creditors. Rating agencies continue to evaluate the rating methodologies applicable to European financial institutions, including RBS and other members of the RBS Group, and any change in such methodologies could ultimately impact our credit ratings. Separately, adverse changes in the credit ratings of the United Kingdom could adversely affect the credit ratings of RBS or other members of the RBS Group which may ultimately have an adverse impact on our credit ratings. In December 2012, Standard & Poor’s placed the United Kingdom’s AAA credit rating on credit watch, with negative outlook and, in February 2013, Moody’s downgraded the United Kingdom’s credit rating one notch to Aa1.
On November 29, 2011, Standard & Poor’s lowered its long-term debt rating of RBS to “A-” and, at the same time, lowered our long-term debt rating to “A.” On June 22, 2012, Moody’s downgraded the long-term bank deposit rating of our banking subsidiaries to A3 following its downgrade of RBS on June 21, 2012. On November 11, 2013, Standard & Poor’s lowered its ratings on 20 of CBNA’s letter of credit-backed U.S. public finance issues. This action followed Standard & Poor’s’ November 7, 2013 downgrade of the long-term debt of RBS to BBB+ and its simultaneous lowering of our long-term debt rating to BBB+. On November 3, 2013, Fitch downgraded our long-term debt rating to BBB+ following RBS’s announcement of its intention to fully divest us by 2016. On August 21, 2014, Fitch affirmed our long-term debt rating of BBB+. Although Moody’s confirmed the long-term bank deposit rating of our banking subsidiaries on March 13, 2014, its ratings outlook is negative. On May 7, 2014, Standard & Poor’s lowered our stand-alone credit profile to “a-” from “a.” These ratings could be further downgraded as a result of a number of factors, such as our financial strength and economic conditions generally. Under current rating methodologies, the ratings could also be further downgraded due to RBS’s continued ownership interest in us, reflecting the potential adverse effects of challenges faced by the RBS Group, including uncertainty around political developments in the United Kingdom and Europe, or in connection with our separation from the RBS Group, if the rating agencies perceive that
23
Table of Contents
we would not benefit from the support of the RBS Group. Any further reductions in our credit ratings or those of our banking subsidiaries could adversely affect our access to liquidity, our competitive position, increase our funding costs or otherwise have a material adverse effect on our business, financial condition and results of operations.
We are subject to certain risks related to originating and selling mortgages and we may be required to repurchase mortgage loans or indemnify mortgage loan purchasers, which could adversely impact our business, financial condition and results of operations.
We originate and often sell mortgage loans. When we sell mortgage loans, whether as whole loans or pursuant to a securitization, we are required to make customary representations and warranties to the purchaser about the mortgage loans and the manner in which they were originated. Our loan sale agreements require us to repurchase or substitute mortgage loans in the event of certain breaches of these representations or warranties. In addition, we may be required to repurchase mortgage loans as a result of borrower fraud or in the event of early payment default of the borrower on a mortgage loan. Likewise, we are required to repurchase or substitute mortgage loans if we breach certain representations or warranties in connection with our securitizations, whether or not we were the originator of the loan. While in many cases we may have a remedy available against certain parties, often these may not be as broad as the remedies available to a purchaser of mortgage loans against us, and we face the further risk that such parties may not have the financial capacity to satisfy remedies that may be available to us. Therefore, if a purchaser enforces its remedies against us, we may not be able to recover our losses from third parties. We have received repurchase and indemnity demands from purchasers in the past, which have resulted in an increase in the amount of losses for repurchases. In particular, between January 1, 2009 and June 30, 2014, we received approximately $146 million in repurchase demands and $97 million in indemnification payment requests in respect of loans originated, for the most part, since 2003. Of those claims presented, $81 million was paid to repurchase residential mortgage loans, and $32 million was incurred in indemnification costs to make investors whole. We repurchased mortgage loans totaling $35 million and $13 million for the years ended December 31, 2013 and 2012, respectively, and $17 million and $26 million for the six months ended June 30, 2014 and 2013, respectively. We incurred indemnification costs of $12 million and $5 million for the years ended December 31, 2013 and 2012, respectively, and $7 million and $6 million for the six months ended June 30, 2014 and 2013, respectively. We have also been responding to subpoenas issued by the Office of the Inspector General for the Federal Housing Authority Agency seeking information about loans sold to The Federal National Mortgage Association and The Federal Home Loan Mortgage Corporation from 2003 to 2011. We cannot estimate what the future level of repurchase demands will be or our ultimate exposure, and cannot give any assurance that the historical experience will or will not continue in the future. It is possible that the volume of repurchase demands will increase, which could have a material adverse effect on our business, financial condition and results of operations.
We face risks as a servicer of loans. We may be terminated as a servicer or master servicer, be required to repurchase a mortgage loan or reimburse investors for credit losses on a mortgage loan, or incur costs, liabilities, fines and other sanctions if we fail to satisfy our servicing obligations, including our obligations with respect to mortgage loan foreclosure actions.
We act as servicer or master servicer for mortgage loans included in securitizations and for unsecuritized mortgage loans owned by investors. As a servicer or master servicer for those loans, we have certain contractual obligations to the securitization trusts, investors or other third parties, including, in our capacity as a servicer, foreclosing on defaulted mortgage loans or, to the extent consistent with the applicable securitization or other investor agreement, considering alternatives to foreclosure (such as loan modifications, short sales and deed-in-lieu of foreclosures), and, in our capacity as a master servicer, overseeing the servicing of mortgage loans by the servicer. Generally,
24
Table of Contents
our servicing obligations as a servicer or master servicer described above are set by contract, for which we receive a contractual fee. However, the costs to perform contracted-for services has been increasing, which reduces our profitability. In addition, we serve as a servicer for government sponsored enterprises (GSEs) under servicing guides. The GSEs can amend their servicing guides, which can increase the scope or costs of the services we are required to perform without any corresponding increase in our servicing fee. Further, the CFPB has issued two regulations that amended the mortgage servicing provisions of Regulation Z and Regulation X, which became effective on January 10, 2014 and which may further increase the scope and costs of services we are required to perform, including as it relates to servicing loans that we own. In addition, there has been a significant increase in state laws that impose additional servicing requirements that increase the scope and cost of our servicing obligations.
If we commit a material breach of our obligations as servicer or master servicer, we may be subject to termination if the breach is not cured within a specified period of time following notice, which can generally be given by the securitization trustee or a specified percentage of security holders, causing us to lose servicing income. In addition, we may be required to indemnify the securitization trustee against losses from any failure by us, as a servicer or master servicer, to perform our servicing obligations or any act or omission on our part that involves willful misfeasance, bad faith or gross negligence. For certain investors and/or certain transactions, we may be contractually obligated to repurchase a mortgage loan or reimburse the investor for credit losses incurred on the loan as a remedy for servicing errors with respect to the loan. If we experience increased repurchase obligations because of claims that we did not satisfy our obligations as a servicer or master servicer, or increased loss severity on such repurchases, we may have to materially increase our repurchase reserve.
We rely on the mortgage secondary market and GSEs for some of our liquidity.
We sell most of the mortgage loans we originate to reduce our credit risk and to provide funding for additional loans. We rely on GSEs to purchase loans that meet their conforming loan requirements. Strategically, we may originate and hold nonconforming loans on-balance sheet for investment purposes, or from time to time, we will rely on other capital markets investors to purchase nonconforming loans (i.e., loans that do not meet GSE requirements). Since the onset of the global economic and financial crisis, investor demand for nonconforming loans has fallen sharply, increasing credit spreads and reducing the liquidity of those loans. In response to the reduced liquidity in the capital markets, we may retain more nonconforming loans, negatively impacting reserves, or we may originate fewer mortgages, which would negatively impact revenue. When we retain a loan not only do we keep the credit risk of the loan but we also do not receive any sale proceeds that could be used to generate new loans. However, we receive net interest margin as our income stream as loan payments are received on a monthly basis in lieu of sale proceeds. Depending on balance sheet capacity, a persistent lack of liquidity could limit our ability to fund and thus originate new mortgage loans, reducing the fees we earn from originating and servicing loans. In addition, we cannot provide assurance that GSEs will not materially limit their purchases of conforming loans due to capital constraints or change their criteria for conforming loans (e.g., maximum loan amount or borrower eligibility). We note that proposals have been presented to reform the housing finance market in the United States, including the role of the GSEs in the housing finance market. The extent and timing of any such regulatory reform regarding the housing finance market and the GSEs, as well as any effect on our business and financial results, are uncertain.
We are subject to increased risk of credit losses associated with HELOCs originated prior to the global financial and economic crisis.
During the years prior to the global financial and economic crisis, financial institutions, including us, originated a significant number of HELOCs. The terms of HELOCs generally provided for the
25
Table of Contents
deferral of borrowers’ obligations to begin to repay principal until a specified future date. As of June 30, 2014, approximately 33% of our $16.2 billion HELOC portfolio, or $5.3 billion in drawn balances, and $4.5 billion in undrawn balances, were subject to a payment reset or balloon payment between July 1, 2014 and December 31, 2017, including $350 million in balloon balances where full payment is due at the end of a ten-year interest only draw period. Although we launched a program in September 2013 to manage the exposure by providing heightened outreach to borrowers, there remains a risk of increased credit losses as borrowers become obligated to make principal and interest payments. For further information regarding the expected HELOC payment shock, see “Management’s Discussion and Analysis of Financial Condition and Results of Operations—Key Factors Affecting Our Business—HELOC Payment Shock.”
Our financial performance may be adversely affected by deteriorations in borrower credit quality, particularly in the New England, Mid-Atlantic and Midwest regions, where our operations are concentrated.
We have exposure to many different industries and risks arising from actual or perceived changes in credit quality and uncertainty over the recoverability of amounts due from borrowers is inherent in our businesses. For example, we have exposure to certain business sectors and geographic markets that were weakened by the global economic and financial crisis. Our exposure may be exacerbated by the geographic concentration of our operations, which are predominately located in the New England, Mid-Atlantic and Midwest regions. The credit quality of our borrowers may deteriorate for a number of reasons that are outside our control, including as a result of prevailing economic and market conditions and asset valuation. The trends and risks affecting borrower credit quality, particularly in the New England, Mid-Atlantic and Midwest regions, have caused, and in the future may cause, us to experience impairment charges, increased repurchase demands, higher costs, additional write-downs and losses and an inability to engage in routine funding transactions, which could have a material adverse effect on our business, financial condition and results of operations.
Our framework for managing risks may not be effective in mitigating risk and loss and our use of models presents risks to our risk management framework.
Our risk management framework is made up of various processes and strategies to manage our risk exposure. The framework to manage risk, including the framework’s underlying assumptions, may not be effective under all conditions and circumstances. If the risk management framework proves ineffective, we could suffer unexpected losses and could be materially adversely affected.
One of the main types of risks inherent in our business is credit risk. An important feature of our credit risk management system is to employ an internal credit risk control system through which we identify, measure, monitor and mitigate existing and emerging credit risk of our customers. As this process involves detailed analyses of the customer or credit risk, taking into account both quantitative and qualitative factors, it is subject to human error. In exercising their judgment, our employees may not always be able to assign an accurate credit rating to a customer or credit risk, which may result in our exposure to higher credit risks than indicated by our risk rating system.
In addition, we have undertaken a strategic initiative to enhance our credit policies and guidelines to address potential risks associated with particular industries or types of customers, as discussed in more detail under “Management’s Discussion and Analysis of Financial Condition and Results of Operations—Risk Governance and Quantitative and Qualitative Disclosures About Risk.” However, we may not be able to effectively implement these initiatives, or consistently follow and refine our credit risk management system. If any of the foregoing were to occur, it may result in an increase in the level of nonperforming loans and a higher risk exposure for us, which could have a material adverse effect on us.
26
Table of Contents
Some of our tools and metrics for managing risk are based upon our use of observed historical market behavior. We rely on quantitative models to measure risks and to estimate certain financial values. Models may be used in such processes as determining the pricing of various products, grading loans and extending credit, measuring interest rate and other market risks, predicting losses, assessing capital adequacy and calculating regulatory capital levels, as well as estimating the value of financial instruments and balance sheet items. Poorly designed or implemented models present the risk that our business decisions based on information incorporating such models will be adversely affected due to the inadequacy of that information. Moreover, our models may fail to predict future risk exposures if the information used in the model is incorrect, obsolete or not sufficiently comparable to actual events as they occur. We seek to incorporate appropriate historical data in our models, but the range of market values and behaviors reflected in any period of historical data is not at all times predictive of future developments in any particular period and the period of data we incorporate into our models may turn out to be inappropriate for the future period being modeled. In such case, our ability to manage risk would be limited and our risk exposure and losses could be significantly greater than our models indicated. For example, we experienced certain technical issues relating to our market risk measurement processes when we began incorporating trade level detail for foreign exchange contracts in 2013. Despite rigorous pilot testing of our processes, during the initial phase of implementation our processes failed to incorporate certain positions we maintained to offset client exposure, which led to an immaterial overstatement of foreign exchange currency rate risk positions during 2013 compared to our position at year end. We have adjusted our processes and have experienced no further issues. In addition, if existing or potential customers believe our risk management is inadequate, they could take their business elsewhere. This could harm our reputation as well as our revenues and profits. Finally, information we provide to our regulators based on poorly designed or implemented models could also be inaccurate or misleading. Some of the decisions that our regulators make, including those related to capital distributions to our stockholders, could be affected adversely due to their perception that the quality of the models used to generate the relevant information is insufficient.
The preparation of our financial statements requires the use of estimates that may vary from actual results. Particularly, various factors may cause our allowance for loan and lease losses to increase.
The preparation of consolidated financial statements in conformity with GAAP requires management to make significant estimates that affect the financial statements. Our most critical accounting estimate is the allowance for loan and lease losses. The allowance for loan and lease losses is a reserve established through a provision for loan and lease losses charged to expense and represents our estimate of losses within the existing portfolio of loans. The allowance is necessary to reserve for estimated loan and lease losses and risks inherent in the loan portfolio. The level of the allowance reflects our ongoing evaluation of industry concentrations, specific credit risks, loan and lease loss experience, current loan portfolio quality, present economic, political and regulatory conditions and incurred losses inherent in the current loan portfolio.
The determination of the appropriate level of the allowance for loan and lease losses inherently involves a degree of subjectivity and requires that we make significant estimates of current credit risks and future trends, all of which may undergo material changes. Changes in economic conditions affecting borrowers, the stagnation of certain economic indicators that we are more susceptible to, such as unemployment and real estate values, new information regarding existing loans, identification of additional problem loans and other factors, both within and outside our control, may require an increase in the allowance for loan and lease losses. In addition, bank regulatory agencies periodically review our allowance for loan and lease losses and may require an increase in the allowance for loan and lease losses or the recognition of further loan charge-offs, based on judgments that can differ from those of our own management. In addition, if charge-offs in future periods exceed the allowance for loan and lease losses—that is, if the allowance for loan and lease losses is inadequate—we will need
27
Table of Contents
additional loan and lease loss provisions to increase the allowance for loan and lease losses. Should such additional provisions become necessary, they would result in a decrease in net income and capital and may have a material adverse effect on us.
We could also sustain credit losses that are significantly higher than the amount of our allowance for loan and lease losses, and therefore have an adverse impact on earnings. Higher credit losses could arise for a variety of reasons. A severe downturn in the economy would generate increased charge-offs and a need for higher reserves. In particular, a severe decrease in housing prices or spike in unemployment would cause higher losses and a larger allowance for loan and lease losses, particularly in the residential real estate secured portfolios. Within the residential real estate portfolios, we have HELOCs for which the end of draw is happening over the next two years. If there is a spike in interest rates, these customers will not only have to deal with an increased or first time principal payment but also an increase in interest payments, potentially leading to larger losses and allowance for loan and lease losses. For more information about risks related to HELOCs, see “—We are subject to increased risk of credit losses associated with HELOCs originated prior to the global financial and economic crisis.” While we believe that our allowance for loan and lease losses was adequate on June 30, 2014, there is no assurance that it will be sufficient to cover all incurred loan and lease credit losses, particularly if economic conditions worsen. In the event of deterioration in economic conditions, we may be required to increase reserves in future periods, which would reduce our earnings.
The value of certain financial instruments recorded at fair value is determined using financial models incorporating assumptions, judgments and estimates that may change over time or may ultimately not turn out to be accurate.
Under GAAP, we recognize at fair value: (i) financial instruments classified as held for trading or designated at fair value through profit or loss; (ii) financial assets classified as available for sale; and (iii) derivatives. Generally, to establish the fair value of these instruments, we rely on quoted market prices. If such market prices are not available, we rely on internal valuation models that utilize observable market data and/or independent third-party pricing. For example, observable market data may not be available for certain individual financial instruments or classes of financial instruments, such as venture capital investments. In such circumstances, we utilize complex internal valuation models to establish fair value; these models require us to make assumptions, judgments and estimates regarding matters that are inherently uncertain. When practical, we would supplement internal models using independent price verification in order to lessen the uncertainties in our models. These assumptions, judgments and estimates are periodically updated to reflect changing facts, trends and market conditions. The resulting change in the fair values of the financial instruments may have a material adverse effect on our earnings and financial condition.
Operational risks are inherent in our businesses.
Our operations depend on our ability to process a very large number of transactions efficiently and accurately while complying with applicable laws and regulations. Operational risk and losses can result from internal and external fraud; errors by employees or third parties; failure to document transactions properly or to obtain proper authorization; failure to comply with applicable regulatory requirements and conduct of business rules; equipment failures, including those caused by natural disasters or by electrical, telecommunications or other essential utility outages; business continuity and data security system failures, including those caused by computer viruses, cyber-attacks or unforeseen problems encountered while implementing major new computer systems or upgrades to existing systems; or the inadequacy or failure of systems and controls, including those of our suppliers or counterparties. Although we have implemented risk controls and loss mitigation actions, and substantial resources are devoted to developing efficient procedures, identifying and rectifying weaknesses in existing procedures and training staff, it is not possible to be certain that such actions have been or will be
28
Table of Contents
effective in controlling each of the operational risks faced by us. Any weakness in these systems or controls, or any breaches or alleged breaches of such laws or regulations, could result in increased regulatory supervision, enforcement actions and other disciplinary action, and have an adverse impact on our business, applicable authorizations and licenses, reputation and results of operations.
The financial services industry, including the banking sector, is undergoing rapid technological changes as a result of competition and changes in the legal and regulatory framework, and we may not be able to compete effectively as a result of these changes.
The financial services industry, including the banking sector, is continually undergoing rapid technological change with frequent introductions of new technology-driven products and services. In addition, new, unexpected technological changes could have a disruptive effect on the way banks offer products and services. We believe our success depends, to a great extent, on our ability to use technology to offer products and services that provide convenience to customers and to create additional efficiencies in our operations. However, we may not be able to, among other things, keep up with the rapid pace of technological changes, effectively implement new technology-driven products and services or be successful in marketing these products and services to our customers. As a result, our ability to compete effectively to attract or retain new business may be impaired, and our business, financial condition or results of operations may be adversely affected.
In addition, changes in the legal and regulatory framework under which we operate require us to update our information systems to ensure compliance. Our need to review and evaluate the impact of ongoing rule proposals, final rules and implementation guidance from regulators further complicates the development and implementation of new information systems for our business. Also, recent regulatory guidance has focused on the need for financial institutions to perform increased due diligence and ongoing monitoring of third-party vendor relationships, thus increasing the scope of management involvement and decreasing the efficiency otherwise resulting from our relationships with third-party technology providers. Given the significant number of ongoing regulatory reform initiatives, it is possible that we incur higher than expected information technology costs in order to comply with current and impending regulations. See “—Supervisory requirements and expectations on us as a financial holding company and a bank holding company, our need to make improvements and devote resources to various aspects of our controls, processes, policies and procedures, and any regulator-imposed limits on our activities, could limit our ability to implement our strategic plan, expand our business, improve our financial performance and make capital distributions to our stockholders.”
Cyber-attacks, distributed denial of service attacks and other cyber-security matters, if successful, could adversely affect how we conduct our business.
We are under continuous threat of loss due to cyber-attacks, especially as we continue to expand customer capabilities to utilize the Internet and other remote channels to transact business. Two of the most significant cyber-attack risks that we face are e-fraud and loss of sensitive customer data. Loss from e-fraud occurs when cybercriminals breach and extract funds directly from customers’ or our accounts. We have been subject to a number of attacks historically. The attempts to breach sensitive customer data, such as account numbers and social security numbers, are less frequent but could present significant reputational, legal and regulatory costs to us if successful.
Recently, there has been a series of distributed denial of service attacks on financial services companies, including us. Distributed denial of service attacks are designed to saturate the targeted online network with excessive amounts of network traffic, resulting in slow response times, or in some cases, causing the site to be temporarily unavailable. Generally, these attacks are conducted to interrupt or suspend a company’s access to Internet service. The attacks can adversely affect the performance of a company’s website and in some instances prevent customers from accessing a
29
Table of Contents
company’s website. We are implementing certain technology protections such as Customer Profiling and Step-Up Authentication to be in compliance with the Federal Financial Institutions Examination Council (FFIEC) Authentication in Internet Banking Environment (AIBE) guidelines. However, cyber threats are rapidly evolving and we may not be able to anticipate or prevent all such attacks. In the event that a cyber-attack is successful, our business, financial condition or results of operations may be adversely affected.
We rely heavily on communications and information systems to conduct our business.
We rely heavily on communications and information systems to conduct our business. Any failure, interruption or breach in security of these systems could result in failures or disruptions in our customer relationship management, general ledger, deposit, loan and other systems. Although we have established policies and procedures designed to prevent or limit the effect of the possible failure, interruption or security breach of our information systems, there can be no assurance that these policies and procedures will be successful and that any such failure, interruption or security breach will not occur or, if they do occur, that they will be adequately addressed. The occurrence of any failure, interruption or security breach of our information systems could damage our reputation, result in a loss of customer business, subject us to additional regulatory scrutiny, or expose us to civil litigation and possible financial liability.
We rely on third parties for the performance of a significant portion of our information technology.
We rely on third parties for the performance of a significant portion of our information technology functions and the provision of information technology and business process services. For example, (i) certain components and services relating to our online banking system rely on data communications networks operated by unaffiliated third parties, (ii) many of our applications are hosted or maintained by third parties, including our Commercial Loan System, which is hosted and maintained by Automated Financial Systems, Inc. and (iii) our core deposits system is maintained by Fidelity Information Services, Inc. The success of our business depends in part on the continuing ability of these (and other) third parties to perform these functions and services in a timely and satisfactory manner. If we experience a disruption in the provision of any functions or services performed by third parties, we may have difficulty in finding alternate providers on terms favorable to us and in reasonable timeframes. If these services are not performed in a satisfactory manner, we would not be able to serve our customers well. In either situation, our business could incur significant costs and be adversely affected.
We are exposed to reputational risk and the risk of damage to our brands and the brands of our affiliates, including the RBS Group.
Our success and results depend, in part, on our reputation and the strength of our brands. We are vulnerable to adverse market perception as we operate in an industry where integrity, customer trust and confidence are paramount. We are exposed to the risk that litigation, employee misconduct, operational failures, the outcome of regulatory or other investigations or actions, press speculation and negative publicity, among other factors, could damage our brands or reputation. Our brands and reputation could also be harmed if we sell products or services that do not perform as expected or customers’ expectations for the product are not satisfied.
Negative publicity could result, for example, from an allegation or determination that we have failed to comply with regulatory or legislative requirements, from failure in business continuity or performance of our information technology systems, loss of customer data or confidential information, fraudulent activities, unsatisfactory service and support levels or insufficient transparency or disclosure of information. Negative publicity adversely affecting our brands or reputation could also result from
30
Table of Contents
misconduct or malpractice by partners or other third parties with whom we have relationships. In particular, because of our relationship with the RBS Group, negative publicity about the RBS Group could have a negative effect on us. Adverse publicity, governmental scrutiny, any pending future investigations by regulators or law enforcement agencies involving us, any of our affiliates or the RBS Group can also have a negative impact on our reputation and business, which could adversely affect our results of operations.
Any damage to our brands or reputation could cause existing customers or other third parties to terminate their business relationships with us and potential customers or other third parties to be reluctant to do business with us. Such damage to our brands or reputation could cause disproportionate damage to our business, even if the negative publicity is factually inaccurate or unfounded. Furthermore, negative publicity could result in greater regulatory scrutiny and influence market or rating agencies’ perceptions of us, which could make it more difficult for us to maintain our credit rating. The occurrence of any of these events could have an adverse effect on our business, financial condition and results of operations.
We may be adversely affected by unpredictable catastrophic events or terrorist attacks and our business continuity and disaster recovery plans may not adequately protect us from serious disaster.
The occurrence of catastrophic events such as hurricanes, tropical storms, tornadoes and other large-scale catastrophes and terrorist attacks could adversely affect our business, financial condition or results of operations if a catastrophe rendered both our production data center in East Providence, Rhode Island, and our recovery data center in Medford, Massachusetts unusable. The distance between the data center locations (approximately 45 miles) provides diversity in resources, but not sufficient diversity in the event of a catastrophe as described above. Although we are building a new, out-of-region backup data center in North Carolina, scheduled for completion in 2015, we do not currently have a backup data center outside New England.
Our principal communications and information systems are housed in the East Providence primary datacenter and our operations are concentrated in the New England, Mid-Atlantic and Midwest regions. If a natural disaster, severe weather, power outage or other event were to occur in New England or if we were subject to a terrorist attack prior to the opening of the North Carolina recovery data center that prevented us from using all or a significant portion of our communications and information systems, damaged critical infrastructure or otherwise disrupted our operations, it may be difficult or, in certain cases, impossible for us to continue our business for a substantial period of time. Although we have implemented disaster recovery and business continuity plans, these plans may prove inadequate in the event of a disaster or similar event that seriously compromises our information systems. We may incur substantial expenses as a result of any limitations relating to our disaster recovery and business continuity plans, which, particularly when taken together with the geographic concentration of our operations, could have a material adverse effect on our business.
An inability to realize the value of our deferred tax assets could adversely affect operating results.
Our net deferred tax assets (“DTAs”) are subject to an evaluation of whether it is more likely than not that they will be realized for financial statement purposes. In making this determination, we consider all positive and negative evidence available, including the impact of recent operating results, as well as potential carryback of tax to prior years’ taxable income, reversals of existing taxable temporary differences, tax planning strategies and projected earnings within the statutory tax loss carryover period. We have determined that the DTAs are more likely than not to be realized at June 30, 2014 (except for $134 million related to state DTAs for which a valuation allowance was established). If
31
Table of Contents
we were to conclude that a significant portion of the DTAs were not more likely than not to be realized, the required valuation allowance could adversely affect our financial condition and results of operations.
We maintain a significant investment in projects that generate tax credits, which we may not be able to fully utilize, or, if utilized, may be subject to recapture or restructuring.
At June 30, 2014, we maintained an investment of approximately $277 million in entities for which we receive allocations of tax credits, which we utilize to offset our taxable income. We accrued $13 million and $14 million in credits for the six months ended June 30, 2014 and the year ended December 31, 2013, respectively. As of June 30, 2014, all tax credits have been utilized to offset taxable income. Substantially all of these tax credits are related to development projects that are subject to ongoing compliance requirements over certain periods of time to fully realize their value. If these projects are not operated in full compliance with the required terms, the tax credits could be subject to recapture or restructuring. Further, we may not be able to utilize any future tax credits. If we are unable to utilize our tax credits or, if our tax credits are subject to recapture or restructuring, it could have a material adverse effect on our business, financial condition and results of operations.
We may have exposure to greater than anticipated tax liabilities.
The tax laws applicable to our business activities, including the laws of the United States and other jurisdictions, are subject to interpretation. The taxing authorities in the jurisdictions in which we operate may challenge our tax positions, which could increase our effective tax rate and harm our financial position and results of operations. In addition, our future income taxes could be adversely affected by earnings being lower than anticipated in jurisdictions that have lower statutory tax rates and higher than anticipated in jurisdictions that have higher statutory tax rates, or by changes in tax laws, regulations, or accounting principles. We are subject to regular review and audit by U.S. federal and state tax authorities. Any adverse outcome of such a review or audit could have a negative effect on our financial position and results of operations. In addition, the determination of our provision for income taxes and other tax liabilities requires significant judgment by management. Although we believe that our estimates are reasonable, the ultimate tax outcome may differ from the amounts recorded in our financial statements and may materially affect our financial results in the period or periods for which such determination is made.
If we are unable to implement and maintain effective internal control over financial reporting in the future, investors may lose confidence in the accuracy and completeness of our financial reports and the market price of our common stock may be negatively affected.
We are required to maintain internal controls over financial reporting and to report any material weaknesses in such internal controls. As a subsidiary of RBS, we are currently subject to the requirements of the Sarbanes-Oxley Act, and as a U.S. bank holding company, we are also subject to the FDIC Part 363 Annual Report rules, which incorporates certain items from the Sarbanes-Oxley Act Section 404 into FDICIA requirements. In addition, beginning with our second annual report on Form 10-K, we will be required to furnish a report by management on the effectiveness of our internal control over financial reporting, pursuant to Section 404 of the Sarbanes-Oxley Act. Our independent registered public accounting firm is required to express an opinion as to the effectiveness of our internal control over financial reporting beginning with our second annual report on Form 10-K. The process of designing, implementing and testing the internal control over financial reporting required to comply with this obligation is time consuming, costly and complicated. If we identify material weaknesses in our internal control over financial reporting, if we are unable to comply with the requirements of Section 404 of the Sarbanes-Oxley Act in a timely manner or to assert that our internal control over financial reporting is effective, or if our independent registered public accounting firm is
32
Table of Contents
unable to express an opinion as to the effectiveness of our internal control over financial reporting, investors may lose confidence in the accuracy and completeness of our financial reports and the market price of our common stock could be negatively affected, and we could become subject to investigations by the stock exchange on which our securities are listed, the SEC, or other regulatory authorities, which could require additional financial and management resources.
We depend on the accuracy and completeness of information about clients and counterparties.
In deciding whether to extend credit or enter into other transactions with clients and counterparties, we rely on information furnished by or on behalf of clients and counterparties, including financial statements and other financial information. We also may rely on representations of clients and counterparties as to the accuracy and completeness of that information and, with respect to financial statements, on reports of independent auditors. If any of such information is incorrect, then the creditworthiness of our clients and counterparties may be misrepresented, which would increase our credit risk and expose us to possible write-downs and losses.
We may not be able to successfully manage our intellectual property and may be subject to infringement claims.
We rely on a combination of owned and licensed trademarks, service marks, trade names, logos and other intellectual property rights. Third parties may challenge, invalidate, infringe or misappropriate our intellectual property, or such intellectual property may not be sufficient to provide us with competitive advantages, which could result in costly redesign efforts, discontinuance of certain services or other competitive harm. For example, words contained in our trademarks and trade names (including the word “Citizens”) are also found in the trade names of a significant number of third parties, including other banks. This has resulted in, and may in the future result in, challenges to our ability to use our trademarks and trade names in particular geographical areas or lines of business. Such challenges could impede our future expansion into new geographic areas or lines of business and could limit our ability to realize the full value of our trademarks and trade names. We may have to litigate to enforce or determine the scope and enforceability of our intellectual property rights, which is expensive, could cause a diversion of resources and may not prove successful. Existing use by others of trademarks and trade names that are similar to ours could limit our ability to challenge third parties when their use of such marks or names may cause consumer confusion, negatively affect consumers’ perception of our brand and products or dilute our brand identity. In addition, certain aspects of our business and our services rely on technologies licensed by third parties, and we may not be able to obtain or continue to obtain licenses and technologies from these third parties on reasonable terms or at all. The loss or diminution of our intellectual property protection or the inability to obtain third party intellectual property could harm our business and ability to compete.
We may also be subject to costly litigation in the event our services infringe upon or otherwise violate a third party’s proprietary rights. Third parties may have, or may eventually be granted, intellectual property rights, including trademarks, that could be infringed by our services or other aspects of our business. Third parties have made, and may make, claims of infringement against us with respect to our services or business. As we rebrand CFG and our banking subsidiaries following the consummation of this offering and expand our business, the likelihood of receiving third party challenges or claims of infringement related to our intellectual property may increase. Any claim from third parties may result in a limitation on our ability to use the intellectual property subject to these claims. Even if we believe that intellectual property related claims are without merit, defending against such claims is time consuming and expensive and could result in the diversion of the time and attention of our management and employees. Claims of intellectual property infringement also might require us to redesign affected services, enter into costly settlement or license agreements, pay costly damage
33
Table of Contents
awards, or face a temporary or permanent injunction prohibiting us from marketing or selling certain of our services. Any intellectual property related dispute or litigation could have a material adverse effect on our business, financial condition and results of operations.
Risks Related to Our Separation from the RBS Group
RBS will be our controlling stockholder and its interests may conflict with ours or yours in the future.
Immediately following this offering, RBS will beneficially own approximately 75.0% of our common stock (or 71.2% if the underwriters’ option to purchase additional shares of common stock is exercised in full). As a result, the RBS Group will have significant power to control our affairs and policies including with respect to the election of directors (and through the election of directors the appointment of management), the entering into of mergers, sales of substantially all of our assets and other extraordinary transactions. In particular, under the separation and shareholder agreement that we intend to enter into with RBS in connection with this offering (the “Separation Agreement”), for so long as RBS maintains beneficial ownership of our outstanding common stock in excess of certain thresholds, we will be required to obtain the consent of RBS to complete certain significant transactions, including our merger or consolidation, entrance into joint ventures in excess of certain thresholds or similar corporate transactions, issuance of common stock (other than pursuant to our equity incentive plans), issuance or the guarantee of indebtedness in excess of certain thresholds, the termination or appointment of a replacement of our Chief Executive Officer, Chief Financial Officer or Chief Risk Officer and certain other significant transactions. The interests of the RBS Group may not align with our or your interests and we may not be able to manage our business in a manner that is in your best interests, which could cause the price of our stock to decline.
As of June 30, 2014, RBS was 79.5% owned by the UK government and its interests may conflict with ours or yours in the future.
Following placing and open offers in December 2008 and in April 2009, Her Majesty’s Treasury (“HM Treasury”) owned approximately 70.3% of the enlarged ordinary share capital of RBS. In December 2009, RBS issued a further £25.5 billion of new capital to HM Treasury. This new capital took the form of B shares, which do not generally carry voting rights at general meetings of ordinary stockholders but are convertible into ordinary shares. Following the issuance of the B shares, HM Treasury’s holding of ordinary shares of the company remained at 70.3%, although its economic interest rose to 84.4%. As of June 30, 2014, HM Treasury held 62.9% of the voting rights in RBS and had an economic interest of 79.5%.
HM Treasury’s stockholder relationship with RBS is managed on its behalf by UK Financial Investments Limited (“UKFI”) and, although HM Treasury has indicated that it intends to respect the commercial decisions of RBS and that RBS will continue to have its own independent board of directors and management team determining its own strategy, should its current intentions change, HM Treasury’s position as a majority stockholder (and UKFI’s position as manager of this stockholding) means that HM Treasury or UKFI may be able to exercise a significant degree of influence over RBS. The manner in which HM Treasury or UKFI exercises HM Treasury’s rights as majority stockholder could give rise to conflict between the interests of HM Treasury and the interests of our stockholders, and RBS may make decisions impacting our operations and the value of our common stock based on UK policy imperatives rather than traditional stockholder economic considerations. We cannot accurately predict whether any restrictions and limitations imposed on RBS on account of HM Treasury’s ownership position, or the implementation of RBS’s restructuring plan agreed to with HM Treasury, will have a negative effect on our businesses and financial flexibility or result in conflicts between the interests of RBS and our interests. In addition, it is difficult for us to predict whether any
34
Table of Contents
changes to, or termination of, HM Treasury’s current relationship with RBS will have any effect on our business. We also note that we cannot predict the possible effect of RBS not satisfying its commitment to divest CFG as agreed with HM Treasury, for instance, by having a remaining ownership interest in CFG and its subsidiaries beyond any deadline agreed with HM Treasury.
The RBS Group and its UK bank subsidiaries are subject to the provisions of the UK Banking Act 2009, as amended by the UK Financial Services (Banking Reform) Act 2013, which includes special resolution powers including nationalization and bail-in.
Under the Banking Act 2009, substantial powers have been granted to UK banking regulators as part of a special resolution regime. These powers enable such regulators to deal with and stabilize certain deposit-taking UK incorporated institutions that are failing, or are likely to fail, to satisfy the “FSMA threshold conditions” (within the meaning of section 41 of the Financial Services and Markets Act 2000, or the “FSMA,” which are the conditions that a relevant entity must satisfy in order to obtain its authorization to perform regulated activities). The special resolution regime consists of three stabilization options: (i) transfer of all or part of the business of the relevant entity and/or the securities of the relevant entity to a private sector purchaser, (ii) transfer of all or part of the business of the relevant entity to a “bridge bank” wholly owned by the Bank of England and (iii) temporary public ownership (nationalization) of the relevant entity. If the UK regulators determine that the RBS Group has failed, or is likely to fail, to satisfy the FSMA threshold conditions, then HM Treasury could decide to take the RBS Group into temporary public ownership pursuant to the powers granted under the Banking Act 2009, and it may then take various actions in relation to any securities without the consent of holders of the securities. In each case, the UK banking regulators would have the authority to modify contractual arrangements of the RBS Group and disapply or modify laws (with possible retrospective effect) to enable their powers under UK law to be used effectively.
Among the changes introduced by the Financial Services (Banking Reform) Act 2013, the Banking Act 2009 was amended to insert a bail-in option as part of the powers of the UK regulators. This option will come into force on such date as shall be stipulated by HM Treasury (HM Treasury has indicated an intention to apply the bail-in provisions from January 1, 2015, which is ahead of the deadline of January 1, 2016 that is set out in the European Bank Recovery and Resolution Directive (“BRRD”)). The bail-in option will be introduced as an additional power available to the Bank of England to enable it to recapitalize a failed institution by allocating losses first to its shareholders and then to eligible unsecured creditors in a manner that seeks to respect the hierarchy of claims in liquidation. The bail-in option includes the power to cancel a liability, to modify the form of a liability (including the power to convert a liability from one form to another) or to provide that a contract under which the institution has a liability is to have effect as if a specified right had been exercised under it, each for the purposes of reducing, deferring or canceling the liabilities of the bank under resolution, as well as to transfer a liability. The Financial Services (Banking Reform) Act 2013 is consistent with the range of tools that European Member States will be required to make available to their resolution authorities under the BRRD, although some amendments are expected to the current UK bail-in provisions to ensure that they are fully compliant with the requirements of the BRRD.
If the UK regulators were to take such stabilization actions with respect to the RBS Group due to a failure, or likely failure, by the RBS Group to satisfy the FSMA threshold conditions, it could result in the creation, modification or canceling of certain of our contractual arrangements that we intend to enter into with the RBS Group prior to the completion of this offering, including the Transitional Services Agreement and Separation Agreement. In addition, the UK regulators could seek to impose additional obligations on us, including the provision of services to third parties who may purchase some or all of the RBS Group’s assets. The UK regulators could also materially modify the RBS Group’s restructuring efforts, including the acceleration of its disclosed intention to sell its remaining shares of
35
Table of Contents
our common stock. Any of these actions could have a material adverse effect on our business, contractual obligations and the value of our common stock.
Conflicts of interest and disputes may arise between the RBS Group and us that could be resolved in a manner unfavorable to us.
Questions relating to conflicts of interest and actual disputes may arise between the RBS Group and us in a number of areas relating to our past and ongoing relationships. Areas in which conflicts of interest or disputes between the RBS Group and us could arise include, but are not limited to, the following:
| • | Competing business activities. The RBS Group is a large global banking and financial services group principally engaged in the business of providing banking and financial services. In the ordinary course of its business activities, the RBS Group may engage in activities where their interests conflict with our interests or those of our stockholders. Our amended and restated certificate of incorporation will provide that none of the RBS Group, any of its affiliates or any director who is not employed by us or his or her affiliates will have any duty to refrain from engaging, directly or indirectly, in the same business activities or similar business activities or lines of business in which we operate. See “Description of Capital Stock.” The RBS Group also may pursue acquisition opportunities that may be complementary to our business, and, as a result, those acquisition opportunities may not be available to us. As a result, our future competitive position and growth potential could be adversely affected. |
| • | Cross officerships, directorships and stock ownership. The ownership interests of our directors or executive officers in the common stock of RBS or service as a director or officer of both RBS and us could create, or appear to create, conflicts of interest when directors and executive officers are faced with decisions that could have different implications for the two companies. For example, these decisions could relate to (i) the nature, quality and cost of services rendered to us by the RBS Group, (ii) disagreement over the desirability of a potential business or acquisition opportunity or business plans, (iii) employee retention or recruiting or (iv) our dividend policy. |
| • | Separation Agreement. We will enter into a Separation Agreement immediately prior to the completion of this offering that will govern the relationship between the RBS Group and us following this offering. The Separation Agreement will provide the RBS Group with certain governance rights over our business, as well as obligate us to comply with certain covenants including certain information rights, access privileges and confidentiality matters. Disagreements regarding the rights and obligations of the RBS Group or us under the Separation Agreement could create conflicts of interest for certain of our directors and officers, as well as actual disputes that may be resolved in a manner unfavorable to us. See “Our Relationship with the RBS Group and Certain Other Related Party Transactions—Relationship with the RBS Group—Separation and Shareholder Agreement.” |
| • | Transitional Services Agreement. We will enter into a Transitional Services Agreement with the RBS Group for the continued provision of certain services by the RBS Group to us (including specified information technology, operations, compliance, business continuity, legal, human resources, back office and web services) and by us to the RBS Group. The services that are to be provided under the Transitional Services Agreement generally will continue to be provided until December 31, 2016, although certain services may have an earlier termination date or be terminated prior to that time. Interruptions to or problems with services provided under the Transitional Services Agreement could result in conflicts between us and the RBS Group that increase our costs both for the processing of business and the potential remediation of disputes. See “Our Relationship with the RBS Group and Certain |
36
Table of Contents
| Other Related Party Transactions—Relationship with the RBS Group—Transitional Services Agreement.” |
| • | Commercial Matters. In addition to the agreements that we intend to enter into as part of our separation from the RBS Group, we expect to continue certain of our commercial relationships with the RBS Group for which we intend to continue or enter into one or more commercial matters agreements. The principal commercial activities to be covered by such agreements include certain swap agreements and foreign exchange risk contracts with the RBS Group for the purpose of reducing our exposure to interest rate fluctuations or to meet the financing needs of our customers, as well as commercial and referral arrangements related to transaction services, debt capital markets transactions, underwriting of loan syndications, commercial mortgage securitization transactions, mortgage servicing, asset finance and loan syndications and corporate credit card services. Despite our current expectation, there is no guarantee that the RBS Group will continue to provide such commercial services to us or that the prices at which they are willing to provide such services will remain consistent with historical periods. If the RBS Group were to terminate any of these arrangements, our financial results may be adversely affected. Moreover, disagreements may arise between us and the RBS Group regarding the provision or quality of any such services rendered, which may materially adversely affect this portion of our business. See “Our Relationship with the RBS Group and Certain Other Related Party Transactions—Relationship with the RBS Group—Commercial Matters.” |
| • | Business opportunities. Our directors nominated by RBS and the RBS Group may have or make investments in other companies that may compete with us. Our Amended and Restated Certificate of Incorporation will provide that, to the fullest extent permitted by law, none of RBS or any of its affiliates or any director who is not employed by us or his or her affiliates will have any duty to refrain from (i) engaging in a corporate opportunity in the same or similar lines of business in which we or our affiliates now engage or propose to engage or (ii) otherwise competing with us or our affiliates. As a result of these charter provisions, our future competitive position and growth potential could be adversely affected. See “Description of Capital Stock.” |
Our separation from the RBS Group could adversely affect our business and profitability due to the RBS Group’s recognizable brand and reputation.
Prior to the completion of this offering, as a wholly owned indirect subsidiary of RBS, we have marketed our products and services using the “RBS” brand name and logo. We believe the association with the RBS Group has provided us with preferred status among certain of our customers, vendors and other persons due to the RBS Group’s globally recognized brand, perceived high-quality products and services and strong capital base and financial strength.
Our separation from the RBS Group could adversely affect our ability to attract and retain customers, which could result in reduced sales of our products. In connection with this offering, although we expect to enter into a trademark license agreement pursuant to which we will be granted a limited license to use certain RBS trademarks (including the daisywheel logo) for an initial term of 5 years, and, at our option, up to 10 years, following the completion of the offering, we will be required under the agreement to remove the “RBS” brand name from all of our products and services by the time RBS beneficially owns less than 50% of our outstanding common stock (but in no event earlier than October 1, 2015), and we will lose the right to use the RBS trademarks in connection with the marketing of any product or service once we rebrand and cease using RBS trademarks in connection with such product or service. See “Our Relationship with the RBS Group and Certain Other Related Party Transactions—Relationship with the RBS Group—Trademark License Agreement.” After the consummation of this offering, we intend to change the legal names of any of our subsidiaries that continue to include “RBS” and to continue operational and legal work to rebrand CFG and its banking
37
Table of Contents
subsidiaries. The process of changing all marketing materials, operational materials, signage, systems, and legal entities containing “RBS” to our new brand name will take approximately 14 months and cost approximately $14 million, excluding any incremental advertising and customer communication expenses. We expect to shift the majority of our advertising and marketing budget to our new brand progressively as the different legal entities complete their individual brand name changes; we expect the shift in advertising and marketing investment to be completed no later than July 31, 2015. As a result of this rebranding, some of our existing customers may choose to stop doing business with us, which could increase customer withdrawals. In addition, other potential customers may decide not to purchase our products and services because we no longer will be a part of the RBS Group. We may also receive decreased referrals of business from the RBS Group. Our separation from the RBS Group could prompt some third parties to reprice, modify or terminate their distribution or vendor relationships with us. We cannot accurately predict the effect that our separation from the RBS Group will have on our business, customers or employees.
The risks relating to our separation from the RBS Group could materialize or evolve at any time, including:
| • | immediately upon the completion of this offering, when RBS’s beneficial ownership in our common stock will decrease to approximately 75.0% (approximately 71.2% if the underwriters’ option to purchase additional shares is exercised in full); |
| • | when RBS reduces its beneficial ownership in our common stock to a level below 50%; and |
| • | when we cease using the “RBS” name or the daisywheel logo in our sales and marketing materials, particularly when we deliver notices to our distributors and customers that the names of some of our subsidiaries will change. |
Any failure by us to successfully replicate or replace certain functions, systems and infrastructure provided by the RBS Group prior to this offering could have a material adverse effect on us.
We will need to replicate or replace certain functions, systems and infrastructure to which we will no longer have the same access after this offering, including services we will receive pursuant to the Transitional Services Agreement. We will also need to make infrastructure investments in order to operate without the same access to the RBS Group’s existing operational and administrative infrastructure. Any failure to successfully implement these initiatives or to do so in a timely manner could have an adverse effect on us.
The RBS Group currently performs or supports certain corporate functions for our operations, including investor relations, advertising and brand management, corporate audit, certain risk management functions, corporate insurance, corporate governance and other services. There is no assurance that, following the completion of this offering, these services will be sustained at the same levels as when we were receiving such services from the RBS Group or that we will obtain the same benefits. When we begin to operate these functions independently, if we do not have our own adequate systems and business functions in place, or are unable to obtain them from other providers, we may not be able to operate our business effectively or at comparable costs and our profitability may decline.
Also, we expect to make an investment of approximately $25 million in our systems to complete the migration of technological services following our separation from the RBS Group. In particular, we will separate our shared global network and where services such as corporate risk, back office, audit and human resources are being provided by the RBS Group, we will establish those services for CFG. These initiatives may not be completed on the expected timetable or within the expected budget and
38
Table of Contents
may not provide the system functionality or performance levels required to support the current and future needs of our business. Further, the systems and services provided to us by the RBS Group under the Transitional Services Agreement will need to be replaced on or before the date of the expiration of the Transitional Services Agreement. The terms on which we purchase these new systems and services, or the functionality of the systems themselves, may be inferior to those of the systems provided by the RBS Group or those available elsewhere in the market and, in relation to third-party suppliers, may be on terms that are less favorable than the terms on which services were previously provided by third parties to the RBS Group, and from which we have historically benefited and will continue to benefit during the period of the Transitional Services Agreement. For more information regarding the Transitional Services Agreement, see “Our Relationship with the RBS Group and Certain Other Related Party Transactions—Relationship with the RBS Group—Transitional Services Agreement.”
Any failure by the RBS Group to deliver the services to be provided under the Transitional Services Agreement could have a material adverse effect on our business, financial condition and results of operations.
In connection with our separation from the RBS Group, we intend to enter into a Transitional Services Agreement with the RBS Group for the continued provision of certain services to us for a specified period. Services provided for under the Transitional Services Agreement include certain information technology, operations, compliance, business continuity, legal, human resources, back office and web services. In particular, we will rely on the RBS Group to provide hosting, support and maintenance services that are critical to maintaining the level of support for the ongoing needs of our business. Although the majority of the systems run under the Transitional Services Agreement are independent of the RBS Group’s other systems, any technical problems occurring within the RBS Group could have an adverse effect on us. As with all of our systems, interruptions to or problems with our systems and services provided under the Transitional Services Agreement or as a result of migration from the RBS Group infrastructure could cause material damage to our business and reputation. If the RBS Group fails to provide or procure the services envisaged or provide them in a timely manner, it could have a material adverse effect on our business, financial condition and results of operations.
The RBS Group maintains a number of defined benefit pension schemes under which we could be subject to liability.
The RBS Group maintains a number of defined benefit pension schemes for certain former and current employees, and as of December 31, 2013, had a reported net pension deficit of approximately £3 billion under certain international financial reporting standards assumptions. The UK Pensions Regulator has the powers to require that CFG, as an employer connected with the RBS Group, make a contribution to a UK defined benefit pension scheme if there has been an act or failure to act, one of the main purposes of which was to avoid or reduce the RBS Group’s statutory obligations under the scheme or if the UK Pensions Regulator considers that an act or omission is materially detrimental to the likelihood of a member receiving their accrued scheme benefits.
39
Table of Contents
Risks Related to Our Industry
Any deterioration in national economic conditions could have a material adverse effect on our business, financial condition and results of operations.
Our business is affected by national economic conditions, as well as perceptions of those conditions and future economic prospects. Changes in such economic conditions are not predictable and cannot be controlled. Adverse economic conditions that could affect us include:
| • | reduced consumer spending; |
| • | lower wage income levels; |
| • | declines in the market value of residential or commercial real estate; |
| • | inflation or deflation; |
| • | fluctuations in the value of the U.S. dollar; |
| • | volatility in short-term and long-term interest rates; and |
| • | higher bankruptcy filings. |
These scenarios could require us to charge off a higher percentage of loans and increase provision for credit losses, which would reduce our net income and otherwise have a material adverse effect on our business, financial condition and results of operations. For example, our business was significantly affected by the global economic and financial crisis that began in 2008. The falling home prices, increased rate of foreclosure and high levels of unemployment in the United States triggered significant write-downs by us and other financial institutions. These write-downs adversely impacted our financial results in material respects. Although the U.S. economy continues to recover, an interruption or reversal of this recovery would adversely affect the financial services industry and banking sector. In particular, although the ongoing general economic recovery has positively impacted the real estate market, the fundamentals within the real estate sector, including asset values, high vacancy rates and rent values, remain relatively weak compared to prior to the global economic and financial crisis. Should the recovery of real estate asset values, reduction in vacancies and improvement in rents be interrupted for an extended period of time, it could have a material adverse effect on our business, financial condition and results of operations.
We operate in an industry that is highly competitive, which could result in losing business or margin declines and have a material adverse effect on our business, financial condition and results of operations.
We operate in a highly competitive industry. The industry could become even more competitive as a result of reform of the financial services industry resulting from the Dodd-Frank Act and other legislative, regulatory and technological changes, as well as continued consolidation. We face aggressive competition from other domestic and foreign lending institutions and from numerous other providers of financial services, including the following:
| • | Non-banking financial institutions. The ability of these institutions to offer services previously limited to commercial banks has intensified competition. Because non-banking financial institutions are not subject to the same regulatory restrictions as banks and bank holding companies, they can often operate with greater flexibility and lower cost structures. |
| • | Securities firms and insurance companies. These companies, if they elect to become financial holding companies, can offer virtually any type of financial service. This may significantly change the competitive environment in which we conduct our business. |
| • | Competitors that have greater financial resources. Some of our larger competitors, including certain national and international banks that have a significant presence in our market area, |
40
Table of Contents
| may have greater capital and resources, higher lending limits and may offer products, services and technology that we do not. We cannot predict the reaction of our customers and other third parties with respect to our financial or commercial strength relative to our competition, including our larger competitors. |
As a result of these and other sources of competition, we could lose business to competitors or be forced to price products and services on less advantageous terms to retain or attract clients, either of which would adversely affect our profitability and business.
Volatility in the global financial markets resulting from relapse of the Eurozone crisis, geopolitical developments in Eastern Europe or otherwise could have a material adverse effect on our business, financial condition and results of operations.
Volatility in the global financial markets could have an adverse effect on the economic recovery in the United States and could result from a number of causes, including a relapse in the Eurozone crisis, geopolitical developments in Eastern Europe or otherwise. The effects of the Eurozone crisis, which began in late 2009 as part of the global economic and financial crisis, continued to impact the global financial markets through 2013. Numerous factors continued to fuel the Eurozone crisis, including continued high levels of government debt, the undercapitalization and liquidity problems of many banks in the Eurozone and relatively low levels of economic growth. These factors made it difficult or impossible for some countries in the Eurozone to repay or refinance their debt without the assistance of third parties. As a combination of austerity programs, debt write-downs and the European Central Bank’s commitment to restore financial stability to the Eurozone and the finalization of the primary European Stability Mechanism bailout fund, in 2013 and into 2014 interest rates began to fall and stock prices began to increase. Although these trends have helped to stabilize the effects of the Eurozone crisis, the underlying causes of the crisis have not been completely eliminated. In particular, Italy slid into recession for the third time since 2008 in the second quarter of 2014, underscoring the residual weakness of certain Eurozone economies. If other economies experience similar trends in the coming periods, volatility in the global financial markets could return to levels seen in the peak of the Eurozone crisis. In addition, Russian intervention in Ukraine during 2014 significantly increased regional geopolitical tensions. In response to Russian actions, U.S. and European governments have imposed sanctions on a limited number of Russian individuals and business entities. The situation remains fluid with potential for further escalation of geopolitical tensions, increased severity of sanctions against Russian interests, and possible Russian counter-measures. Further economic sanctions could destabilize the economic environment and result in increased volatility. Should the economic recovery in the United States be adversely impacted by a return in volatility in the global financial markets caused by a relapse in the Eurozone crisis or developments in respect of the Russian sanctions or for any other reason, loan and asset growth and liquidity conditions at U.S. financial institutions, including us, may deteriorate. Moreover, until RBS divests its interest in us, adverse trends in the Eurozone and Eastern Europe could increase investor concern or, even if not accurate, stimulate perceptions of funding difficulties for our business because RBS is based in the United Kingdom and has significant exposure to European economies. If any of these factors were to materialize, it could have a material adverse effect on our business, financial condition and results of operations.
Further downgrades to the U.S. government’s credit rating, or the credit rating of its securities, by one or more of the credit ratings agencies could have a material adverse effect on general economic conditions, as well as our operations, earnings and financial condition.
On August 5, 2011, Standard & Poor’s cut the U.S. government’s sovereign credit rating of long-term U.S. federal debt from AAA to AA+ while also keeping its outlook negative. Moody’s also lowered its outlook to “Negative” on August 2, 2011, and Fitch lowered its outlook to “Negative” on November 28, 2011. During 2013, both Moody’s and Standard & Poor’s revised their outlook from
41
Table of Contents
“Negative” to “Stable,” and on March 21, 2014, Fitch revised its outlook from “Negative” to “Stable.” Further downgrades of the U.S. government’s sovereign credit rating, and the perceived creditworthiness of U.S. government-related obligations, could impact our ability to obtain funding that is collateralized by affected instruments. Such downgrades could also affect the pricing of funding when it is available. A downgrade may also adversely affect the market value of such instruments. A downgrade of the sovereign credit ratings of the U.S. government or the credit ratings of related institutions, agencies or instrumentalities would significantly exacerbate the other risks to which we are subject and any related adverse effects on its business, financial condition and results of operations.
The conditions of other financial institutions or of the financial services industry could adversely affect our operations and financial conditions.
Financial services institutions that deal with each other are interconnected as a result of trading, investment, liquidity management, clearing, counterparty and other relationships. Within the financial services industry, the default by any one institution could lead to defaults by other institutions. Concerns about, or a default by, one institution could lead to significant liquidity problems and losses or defaults by other institutions, as the commercial and financial soundness of many financial institutions are closely related as a result of these credit, trading, clearing and other relationships. Even the perceived lack of creditworthiness of, or questions about, a counterparty may lead to market-wide liquidity problems and losses or defaults by various institutions. This systemic risk may adversely affect financial intermediaries, such as clearing agencies, banks and exchanges with which we interact on a daily basis, or key funding providers such as the Federal Home Loan Banks (“FHLBs”), any of which could have a material adverse effect on our access to liquidity or otherwise have a material adverse effect on our business, financial condition and results of operations.
Risks Related to Regulations Governing Our Industry
As a financial holding company and a bank holding company, we are subject to comprehensive regulation that could have a material adverse effect on our business and results of operations.
As a financial holding company and a bank holding company, we are subject to comprehensive regulation, supervision and examination by the Federal Reserve Board. In addition, CBNA is subject to comprehensive regulation, supervision and examination by the OCC and CBPA is subject to comprehensive regulation, supervision and examination by the FDIC and the PA Banking Department. Our regulators supervise us through regular examinations and other means that allow the regulators to gauge management’s ability to identify, assess and control risk in all areas of operations in a safe and sound manner and to ensure compliance with laws and regulations. In the course of their supervision and examinations, our regulators may require improvements in various areas. If we are unable to implement and maintain any required actions in a timely and effective manner, we could become subject to informal (non-public) or formal (public) supervisory actions and public enforcement orders that could lead to significant restrictions on our existing business or on our ability to engage in any new business. Such forms of supervisory action could include, without limitation, written agreements, cease and desist orders, and consent orders and may, among other things, result in restrictions on our ability to pay dividends, requirements to increase capital, restrictions on our activities, the imposition of civil monetary penalties, and enforcement of such action through injunctions or restraining orders. We could also be required to dispose of certain assets and liabilities within a prescribed period. The terms of any such supervisory or enforcement action could have a material adverse effect on our business, financial condition and results of operations.
We are a bank holding company that has elected to become a financial holding company pursuant to the Bank Holding Company Act. As such, we are allowed to engage in certain financial activities in
42
Table of Contents
which a bank holding company is not otherwise permitted to engage. However, to maintain our financial holding company status, we (and all of our subsidiaries) must be “well capitalized” and “well managed.” If we cease to meet these capital and management requirements, there are many penalties we would be faced with, including (i) the Federal Reserve Board may impose limitations or conditions on the conduct of our activities, and (ii) we may not undertake any of the broader financial activities permissible for financial holding companies or acquire a company engaged in such financial activities without prior approval of the Federal Reserve Board. If a company does not return to compliance within 180 days, which period may be extended, the Federal Reserve Board may require divestiture of that company’s depository institutions.
We may be unable to disclose some restrictions or limitations on our operations imposed by our regulators.
From time to time, bank regulatory agencies take supervisory actions that restrict or limit a financial institution’s activities. In some instances, we are not permitted to publicly disclose these actions. In addition, as part of our regular examination process, our and our banking subsidiaries’ respective regulators may advise us or our banking subsidiaries to operate under various restrictions as a prudential matter. Any such actions or restrictions, if and in whatever manner imposed, could adversely affect our costs and revenues. Moreover, efforts to comply with any such nonpublic supervisory actions or restrictions may require material investments in additional resources and systems, as well as a significant commitment of managerial time and attention. As a result, such supervisory actions or restrictions, if and in whatever manner imposed, could have a material adverse effect on our business and results of operations; and, in certain instances, we may not be able to publicly disclose these matters.
The regulatory environment in which we operate could have a material adverse effect on our business and earnings.
We are heavily regulated by bank and other regulatory agencies at the federal and state levels. This regulatory oversight is established to protect depositors, the FDIC’s Deposit Insurance Fund, and the banking system as a whole, not security holders. Changes to statutes, regulations, rules or policies including the interpretation or implementation of statutes, regulations, rules or policies could affect us in substantial and unpredictable ways including limiting the types of financial services and other products we may offer, limiting our ability to pursue acquisitions and increasing the ability of third parties to offer competing financial services and products.
We are subject to capital adequacy and liquidity standards, and if we fail to meet these standards our financial condition and operations would be adversely affected.
We are subject to several capital adequacy and liquidity standards. To the extent that we are unable to meet these standards, our ability to make distributions of capital will be limited and we may be subject to additional supervisory actions and limitations on our activities. The capital adequacy and liquidity standards that we must meet include the following:
| • | Current capital requirements. Under regulatory capital adequacy guidelines and other regulatory requirements, CFG and its banking subsidiaries must meet guidelines that include quantitative measures of assets, liabilities and certain off-balance sheet items, subject to qualitative judgments by regulators about components of qualifying capital, risk weightings and other factors. We are regulated as a bank holding company and subject to consolidated regulatory capital requirements administered by the Federal Reserve. Our banking subsidiaries are subject to similar capital requirements, administered by the OCC in the case of CBNA and by the FDIC in the case of CBPA. Failure by us or one of our banking |
43
Table of Contents
| subsidiaries to maintain its status as “adequately capitalized” would lead to regulatory sanctions and limitations and could lead the federal banking agencies to take “prompt corrective action.” Furthermore, a failure by our banking subsidiaries to be “well capitalized” under applicable regulatory guidelines could lead to higher FDIC assessments. |
| • | Basel III. The U.S. Basel III final rule and provisions in the Dodd-Frank Act, including the Collins Amendment, will increase capital requirements for banking organizations such as us. Consistent with the Basel Committee’s Basel III capital framework, the U.S. Basel III final rule includes a new minimum ratio of Common Equity Tier 1 capital to risk-weighted assets of 4.5% and a Common Equity Tier 1 capital conservation buffer of greater than 2.5% of risk-weighted assets. We have established capital ratio targets that align with U.S. regulatory expectations under fully phased-in Basel III rules. Although we currently have capital ratios that exceed these minimum levels and a strategic plan to keep them at least at these levels, failure to maintain the capital conservation buffer would result in increasingly stringent restrictions on our ability to make dividend payments and other capital distributions and pay discretionary bonuses to executive officers. As to us, the U.S. Basel III final rule will phase in over time beginning on January 1, 2015, and will become fully effective on January 1, 2019. |
| • | Capital Plans. We are required to submit an annual capital plan to the Federal Reserve Board. The capital plan must include an assessment of our expected uses and sources of capital over a forward-looking planning horizon of at least nine quarters, a detailed description of our process for assessing capital adequacy, our capital policy and a discussion of any expected changes to our business plan that are likely to have a material impact on our capital adequacy or liquidity. Based on a qualitative and quantitative assessment, including a supervisory stress test conducted as part of the CCAR process, the Federal Reserve Board will either object to our capital plan, in whole or in part, or provide a notice of non-objection to us by March 31 of a calendar year. If the Federal Reserve Board objects to a capital plan, we may not make any capital distribution other than those with respect to which the Federal Reserve Board has indicated its non-objection. Although we were permitted to continue capital actions at a level consistent with those executed in 2013, the Federal Reserve Board objected to certain qualitative aspects of our 2014 capital plan and we are not permitted to increase our capital distributions above 2013 levels until a new capital plan is approved by the Federal Reserve Board. The deadline for our next capital plan submission is January 5, 2015, and we cannot assure you that the Federal Reserve Board will not object to our next capital plan or that, even if it does not object to it, our planned capital distributions will not be significantly modified from 2013 levels. |
| • | Stress Tests. In addition to capital planning, we and our banking subsidiaries are subject to capital stress testing requirements imposed by the Dodd-Frank Act that will likely require us to hold more capital than the minimum requirements applicable to us. The stress testing requirements are designed to show that we can meet our capital requirements even under stressed economic conditions. |
| • | Liquidity Coverage Ratio. The federal banking regulators also evaluate our liquidity as part of the supervisory process. In September 2014, the U.S. federal banking regulators issued a final rule with respect to the U.S. implementation of the Liquidity Coverage Ratio (“LCR”). This rule includes a modified version of the Basel Committee’s LCR in the United States, which applies to bank holding companies with more than $50 billion but less than $250 billion in total assets, and less than $10 billion in on-balance sheet foreign exposure, such as us. The modified version of the LCR differs in certain respects from the Basel Committee’s version of the LCR, including a narrower definition of high-quality liquid assets, different prescribed cash inflow and outflow assumptions for certain types of instruments and transactions and a shorter phase-in schedule that begins on January 1, 2016 and ends on January 1, 2017. |
44
Table of Contents
See “Regulation and Supervision” for further discussion of the capital adequacy and liquidity standards to which we are subject.
We could be required to act as a “source of strength” to our banking subsidiaries, which would have a material adverse effect on our business, financial condition and results of operations.
Federal Reserve Board policy historically required bank holding companies to act as a source of financial and managerial strength to their subsidiary banks. The Dodd-Frank Act codified this policy as a statutory requirement. This support may be required by the Federal Reserve Board at times when we might otherwise determine not to provide it or when doing so is not otherwise in the interests of CFG or our stockholders or creditors, and may include one or more of the following:
| • | Any extensions of credit from us to our banking subsidiaries that are included in the relevant bank’s capital would be subordinate in right of payment to depositors and certain other indebtedness of such subsidiary banks. |
| • | In the event of a bank holding company’s bankruptcy, any commitment that the bank holding company had been required to make to a federal bank regulatory agency to maintain the capital of a subsidiary bank will be assumed by the bankruptcy trustee and entitled to priority of payment. |
| • | In certain circumstances one of our banking subsidiaries could be assessed for losses incurred by the other. In addition, in the event of impairment of the capital stock of one of our banking subsidiaries, we, as our banking subsidiary’s stockholder, could be required to pay such deficiency. |
We depend on our banking subsidiaries for most of our revenue, and restrictions on dividends and other distributions by our banking subsidiaries could affect our liquidity and ability to fulfill our obligations.
As a bank holding company, we are a separate and distinct legal entity from our banking subsidiaries: CBNA and CBPA. We typically receive substantially all of our revenue from dividends from our banking subsidiaries. These dividends are the principal source of funds to pay dividends on our equity and interest and principal on our debt. Various federal and/or state laws and regulations, as well as regulatory expectations, limit the amount of dividends that our banking subsidiaries may pay. For example:
| • | CBNA is required by federal law to obtain the prior approval of the OCC for the payment of cash dividends if the total of all dividends declared by CBNA in the calendar year is in excess of its current year net income combined with its retained net income of the two preceding years, less any required transfers to surplus (the “recent earnings test”). |
| • | CBNA may pay dividends only to the extent that retained net profits (including the portion transferred to surplus) exceed bad debts (as defined by regulation). |
| • | CBPA may only pay dividends out of accumulated net earnings and dividends may not be declared unless surplus is at least equal to contributed capital. |
| • | Neither CBNA nor CBPA may pay a dividend if, in the opinion of the applicable federal regulatory agency, either is engaged in or is about to engage in an unsafe or unsound practice, which would include a dividend payment that would reduce either bank’s capital to an inadequate level. |
45
Table of Contents
As a result of the goodwill impairment recognized by CBNA in the second quarter of 2013, CBNA does not meet the recent earnings test and must obtain specific prior approval from the OCC before making a capital distribution. We expect the recent earnings test to remain negative through 2015. As a result, we expect that CBNA will be required to obtain specific prior approval from the OCC before making a capital distribution through 2015. Since the goodwill impairment in 2013, the OCC has approved each request by CBNA to distribute to us up to 30% of its prior quarter after-tax net income. However, CBNA may not rely on past or current approvals as a guarantee of future approvals. Under the Pennsylvania Banking Code of 1965, as amended (the “PA Code”), CBPA is restricted from paying dividends in excess of accumulated net earnings. As of June 30, 2014, CBPA’s accumulated net earnings were $227 million.
In addition, on February 18, 2014, the Federal Reserve Board approved a final rule implementing certain enhanced prudential standards for bank holding companies with $50 billion or more in total consolidated assets. The rules will subject a foreign banking organization with at least $50 billion in non-branch U.S. assets as of June 30, 2015 to various requirements, including a requirement to establish by July 1, 2016 a U.S. intermediate holding company (an “IHC”) to hold all of the foreign banking organization’s interests in U.S. companies which it controls for U.S. bank regulatory purposes. An IHC will have to comply with U.S. risk-based capital, leverage, liquidity and risk-management requirements, as well as other regulations. Although the timing of our separation from the RBS Group is uncertain, the RBS Group will be subject to the enhanced prudential standards for foreign banking organizations, including the requirement to create an IHC, owing in part to the fact that we are an indirect subsidiary of RBS. If we become a subsidiary of the RBS Group IHC, even if we receive dividends from our banking subsidiaries, our ability to pay dividends or make capital distributions could be constrained by the IHC’s capital requirements, which will be affected by any interests it holds in other of the RBS Group’s U.S. companies.
We are and may be subject to regulatory actions that may have a material impact on our business.
We are involved, from time to time, in reviews, investigations and proceedings (both formal and informal) by governmental and self-regulatory agencies regarding our business. These regulatory actions involve, among other matters, accounting and operational matters, certain of which may result in adverse judgments, settlements, fines, penalties, injunctions or other relief that may require changes to our business or otherwise materially impact our business. For example, in April 2013, our banking subsidiaries consented to the issuance of orders by the OCC and the FDIC (the “Consent Orders”). In the Consent Orders (which are publicly available and will remain in effect until terminated by the regulators), our banking subsidiaries neither admitted nor denied the regulators’ findings that they had engaged in deceptive marketing and implementation of the bank’s overdraft protection program, checking rewards programs and stop-payment process for pre-authorized recurring electronic fund transfers. Under the Consent Orders, our banking subsidiaries paid a total of $10 million in civil monetary penalties and are required to develop plans to provide restitution to affected customers (the amount of which is anticipated to be approximately $8 million), cease and desist any operations in violation of Section 5 of the Federal Trade Commission Act and submit to the regulators’ periodic written progress reports regarding compliance with the Consent Orders. For more information regarding ongoing significant regulatory actions in which we are involved and certain identified past practices and policies for which we could face potential formal administrative enforcement actions, see “Business—Legal and Regulatory Proceedings.”
In regulatory actions, such as those referred to above, it is inherently difficult to determine whether any loss is probable or even possible or to estimate the amount of any loss. We cannot predict with certainty if, how or when such proceedings will be resolved or what the eventual fine, penalty or other relief, conditions or restrictions, if any, may be, particularly for actions that are in their early stages of
46
Table of Contents
investigation. We expect to make significant restitution payments to our banking subsidiaries’ customers arising from certain of the consumer compliance issues and also expect to pay civil money penalties in connection with certain of these issues. Adverse regulatory actions could have a material adverse effect on our business, financial condition and results of operations.
We are and may be subject to litigation that may have a material impact on our business.
Our operations are diverse and complex and we operate in legal and regulatory environments that expose us to potentially significant litigation risk. In the normal course of business, we have been named, from time to time, as a defendant in various legal actions, including arbitrations, class actions and other litigation, arising in connection with our activities as a financial services institution, including with respect to unfair or deceptive business practices and mis-selling of certain products. Certain of the actual or threatened legal actions include claims for substantial compensatory and/or punitive damages or claims for indeterminate amounts of damages. In some cases, the entities that would otherwise be the primary defendants in such cases are bankrupt or in financial distress. We recently settled legal actions alleging violations under the Fair Labor Standards Act and certain state fair wage laws. Moreover, a number of recent judicial decisions have upheld the right of borrowers to sue lending institutions on the basis of various evolving legal theories, collectively termed “lender liability.” Generally, lender liability is founded on the premise that a lender has either violated a duty, whether implied or contractual, of good faith and fair dealing owed to the borrower or has assumed a degree of control over the borrower resulting in the creation of a fiduciary duty owed to the borrower or its other creditors or stockholders. This could increase the amount of private litigation to which we are subject. For more information regarding ongoing significant legal proceedings in which we are involved and certain identified past practices and policies for which we could face potential civil litigation, see “Business—Legal and Regulatory Proceedings.”
In disputes and legal proceedings, such as those referred to above, it is inherently difficult to determine whether any loss is probable or even possible or to estimate the amount of any loss. We cannot predict with certainty if, how or when such proceedings will be resolved or what the eventual settlement, fine, penalty or other relief, if any, may be, particularly for proceedings that are in their early stages of development or where plaintiffs seek substantial or indeterminate damages. Numerous issues may need to be resolved, including through potentially lengthy discovery and determination of important factual matters, determination of issues related to class certification and the calculation of damages and by addressing novel or unsettled legal questions relevant to the proceedings in question, before a loss or additional loss or range of loss or additional loss can be reasonably estimated for any proceeding. Adverse judgments in litigation or adverse regulatory actions could have a material adverse effect on our business, financial condition and results of operations.
The Dodd-Frank Act has changed and will likely continue to substantially change the legal and regulatory framework under which we operate our business.
On July 21, 2010, President Obama signed into law the Dodd-Frank Act, which has changed and will likely continue to substantially change the legal and regulatory framework under which we operate. The Dodd-Frank Act represents a significant overhaul of many aspects of the regulation of the financial-services industry, addressing, among other things, (i) systemic risk, (ii) capital adequacy, (iii) consumer financial protection, (iv) interchange fees and (v) mortgage lending practices. A significant number of the provisions of the Dodd-Frank Act still require extensive rulemaking and interpretation by regulatory authorities. In several cases, authorities have extended implementation periods and delayed effective dates. Accordingly, in many respects the ultimate impact of the Dodd-Frank Act and its effects on the U.S. financial system and on us will not be known for an extended period of time.
47
Table of Contents
The following are some of the current provisions of the Dodd-Frank Act that may affect our operations:
| • | Creation of the CFPB with centralized authority for consumer protection in the banking industry. |
| • | New limitations on federal preemption. |
| • | Application of heightened capital, liquidity, single counterparty credit limits, stress testing, risk management and other enhanced prudential standards. |
| • | Changes to the assessment base for deposit insurance premiums. |
| • | Creation of a new framework for the regulation of over-the-counter derivatives and new regulations for the securitization market and the strengthening of the regulatory oversight of securities and capital markets by the SEC. |
Some of these and other major changes under the Dodd-Frank Act could materially impact the profitability of our business, the value of assets we hold or the collateral available for coverage under our loans, require changes to our business practices or force us to discontinue businesses and expose us to additional costs, taxes, liabilities, enforcement actions and reputational risk.
The Dodd-Frank Act’s provisions and related rules that restrict bank interchange fees may negatively impact our revenues and earnings.
Pursuant to the Dodd-Frank Act, the Federal Reserve Board adopted rules effective October 1, 2011, limiting the interchange fees that may be charged with respect to electronic debit transactions. Interchange fees, or “swipe” fees, are charges that merchants pay to us and other credit card companies and card-issuing banks for processing electronic payment transactions. Since taking effect, these limitations have reduced our debit card interchange revenues and have created meaningful compliance costs. Additional limits may further reduce our debit card interchange revenues and create additional compliance costs. In July 2013, a decision by a Washington D.C. District Court judge invalidated the Federal Reserve Board’s interchange rule, ruling in favor of a group of retailers who argued that the new, lower interchange fees had been inappropriately set too high by the Federal Reserve Board. The Federal Reserve Board has successfully appealed the decision but it is uncertain whether the group of retailers will further appeal. If the rule were to be revised so that interchange fees were even lower, it would further adversely impact our noninterest income.
The CFPB’s residential mortgage regulations could adversely affect our business, financial condition or results of operations.
The CFPB finalized a number of significant rules that will impact nearly every aspect of the lifecycle of a residential mortgage. These rules implement the Dodd-Frank Act amendments to the Equal Credit Opportunity Act, the Truth in Lending Act and the Real Estate Settlement Procedures Act. The final rules require banks to, among other things: (i) develop and implement procedures to ensure compliance with a new “reasonable ability to repay” test and identify whether a loan meets a new definition for a “qualified mortgage,” (ii) implement new or revised disclosures, policies and procedures for servicing mortgages including, but not limited to, early intervention with delinquent borrowers and specific loss mitigation procedures for loans secured by a borrower’s principal residence, (iii) comply with additional restrictions on mortgage loan originator compensation, and (iv) comply with new disclosure requirements and standards for appraisals and escrow accounts maintained for “higher priced mortgage loans.” These new rules create operational and strategic challenges for us, as we are both a mortgage originator and a servicer. For example, business models for cost, pricing, delivery, compensation and risk management will need to be reevaluated and potentially revised, perhaps
48
Table of Contents
substantially. Additionally, programming changes and enhancements to systems will be necessary to comply with the new rules. We also expect additional rulemaking affecting our residential mortgage business to be forthcoming. These rules and any other new regulatory requirements promulgated by the CFPB and state regulatory authorities could require changes to our business, in addition to the changes we have been required to make thus far. Such changes would result in increased compliance costs and potential changes to our product offerings, which would have an adverse effect on the revenue derived from such business.
The Dodd-Frank Act’s consumer protection regulations could adversely affect our business, financial condition or results of operations.
The Federal Reserve Board enacted consumer protection regulations related to automated overdraft payment programs offered by financial institutions. Prior to the enactment of these regulations, our overdraft and insufficient funds fees represented a significant amount of noninterest fees. Since taking effect on July 1, 2010, the fees received by us for automated overdraft payment services have decreased, thereby adversely impacting our noninterest income. Complying with these regulations has resulted in increased operational costs for us, which may continue to rise. The actual impact of these regulations in future periods could vary due to a variety of factors, including changes in customer behavior, economic conditions and other factors, which could adversely affect our business, financial condition or results of operations.
The consumer protection provisions of the Dodd-Frank Act and the examination, supervision and enforcement of those laws and implementing regulations by the CFPB have created a more intense and complex environment for consumer finance regulation. The CFPB is authorized to engage in consumer financial education, track consumer complaints, request data and promote the availability of financial services to underserved consumers and communities. We expect increased oversight of financial services products by the CFPB, which is likely to affect our operations. The CFPB has significant authority to implement and enforce federal consumer finance laws, including the Truth in Lending Act, the Equal Credit Opportunity Act, the Fair Credit Billing Act and new requirements for financial services products provided for in the Dodd-Frank Act, as well as the authority to identify and prohibit unfair, deceptive or abusive acts and practices (“UDAAP”). The review of products and practices to prevent UDAAP is a continuing focus of the CFPB, and of banking regulators more broadly. The ultimate impact of this heightened scrutiny is uncertain but could result in changes to pricing, practices, products and procedures. It could also result in increased costs related to regulatory oversight, supervision and examination, additional remediation efforts and possible penalties.
In addition, the Dodd-Frank Act provides the CFPB with broad supervisory, examination and enforcement authority over various consumer financial products and services, including the ability to require reimbursements and other payments to customers for alleged legal violations, and to impose significant penalties, as well as injunctive relief that prohibits lenders from engaging in allegedly unlawful practices. The CFPB also has the authority to obtain cease and desist orders providing for affirmative relief and/or monetary penalties. The Dodd-Frank Act and accompanying regulations, including regulations to be promulgated by the CFPB, are being phased in over time, and while some regulations have been promulgated, many others have not yet been proposed or finalized. We cannot predict the terms of all of the final regulations, their intended consequences or how such regulations will affect us or our industry.
The Dodd-Frank Act does not prevent states from adopting stricter consumer protection standards. State regulation of financial products and potential enforcement actions could also adversely affect our business, financial condition or results of operations.
49
Table of Contents
Compliance with anti-money laundering and anti-terrorism financing rules involve significant cost and effort.
We are subject to rules and regulations regarding money laundering and the financing of terrorism. Monitoring compliance with anti-money laundering and anti-terrorism financing rules can put a significant financial burden on banks and other financial institutions and poses significant technical challenges. Although we believe our current policies and procedures are sufficient to comply with applicable rules and regulations, we cannot guarantee that our anti-money laundering and anti-terrorism financing policies and procedures completely prevent situations of money laundering or terrorism financing. Any such failure events may have severe consequences, including sanctions, fines and reputational consequences, which could have a material adverse effect on our business, financial condition or results of operations.
We may become subject to more stringent regulatory requirements and activity restrictions, or have to restructure, if the Federal Reserve Board and FDIC determine that our resolution plan is not credible.
Federal Reserve Board and FDIC regulations require bank holding companies with more than $50 billion in assets to submit resolution plans that, in the event of material financial distress or failure, establish the rapid, orderly and systemically safe liquidation of the company under the U.S. Bankruptcy Code. Insured depository institutions with more than $50 billion in assets must submit to the FDIC a resolution plan whereby they can be resolved in a manner that is orderly and that ensures that depositors will receive access to insured funds within certain required timeframes. If the Federal Reserve Board and the FDIC jointly determine that a company’s resolution plan is not credible, and the company fails to cure the deficiencies in a timely manner, then the Federal Reserve Board and the FDIC may jointly impose on the company, or on any of its subsidiaries, more stringent capital, leverage or liquidity requirements or restrictions on growth, activities or operations, or require the divestment of certain assets or operations. If the Federal Reserve Board and the FDIC determine that our resolution plan is not credible or would not facilitate our orderly resolution under the U.S. Bankruptcy Code, we could become subject to more stringent regulatory requirements or business restrictions, or have to divest certain of our assets or businesses. Any such measures could have a material adverse effect on our business, financial condition or results of operations.
Risks Related to our Common Stock
Our stock price could decline due to the large number of outstanding shares of our common stock eligible for future sale, and RBS has committed to sell its remaining beneficial ownership of our common stock by the end of 2016 with a possible 12 month extension in certain circumstances. The exact timing of such sale or sales remains uncertain.
The sale of substantial amounts of shares of our common stock in the public market, or the perception that such sales could occur, could harm the prevailing market price of common stock. These sales, or the possibility that these sales may occur, also might make it more difficult for us to sell equity securities in the future at a time and at a price that we deem appropriate. Upon completion of this offering we will have a total of 559,998,324 outstanding shares of common stock. Of the outstanding shares, the 140,000,000 shares sold in this offering (or 161,000,000 shares if the underwriters exercise their option to purchase additional shares in full) will be freely tradable without restriction or further registration under the Securities Act, except that any shares held by our affiliates, as that term is defined under Rule 144 of the Securities Act, may be sold only in compliance with the limitations described in “Shares Eligible for Future Sale.”
The remaining 419,998,324 shares outstanding will be held indirectly by RBSG International Holdings Limited, a wholly owned subsidiary of RBS. After this offering, these shares will be subject to certain restrictions on resale. We, our officers, directors and the selling stockholders that will collectively
50
Table of Contents
own 419,998,324 shares following this offering (or 398,998,324 shares if the underwriters exercise their option to purchase additional shares in full), will sign lock-up agreements with the underwriters that will, subject to certain customary exceptions, restrict the sale of the shares of our common stock held by them for 180 days following the date of this prospectus, subject to extension in the case of an earnings release or material news or a material event relating to us. Morgan Stanley & Co. LLC, Goldman, Sachs & Co. and J.P. Morgan Securities LLC may, in their sole discretion, release all or any portion of the shares of common stock subject to lock-up agreements. See “Underwriting” for a description of these lock-up agreements.
Upon the expiration of the lock-up agreements described above, all such shares will be eligible for resale in a public market, subject, in the case of shares held by our affiliates, to volume, manner of sale and other limitations under Rule 144. We expect that the selling stockholders and other members of the RBS Group will be considered affiliates 180 days after this offering based on their expected share ownership (consisting of 419,998,324 shares, or 398,998,324 shares if the underwriters exercise their option to purchase additional shares in full), as well as their veto and board nomination rights under the Separation Agreement we intend to enter into with RBS prior to the completion of this offering. However, commencing 180 days following this offering, RBS will have the right, subject to certain exceptions and conditions, to require us to register its shares of common stock under the Securities Act, and it will have the right to participate in future registrations of securities by us. Registration of any of these outstanding shares of common stock would result in such shares becoming freely tradable without compliance with Rule 144 upon effectiveness of the registration statement. See “Shares Eligible for Future Sale.”
As restrictions on resale end, the market price of our shares of common stock could drop significantly as RBS has publicly stated its intent to sell its remaining shares in the short to medium term. The RBS Group, which is currently controlled by the UK government, is undertaking a restructuring plan to facilitate its eventual privatization. As part of its obligations under the European Commission’s State Aid Amendment Decision of April 9, 2014, RBS has committed to dispose of its remaining ownership of our common stock by December 31, 2016, with an automatic 12-month extension depending on market conditions. RBS’s current intention for disposal of its remaining ownership of our common stock is to sell, over time, such remaining shares in a series of tranches, subject to market conditions and the terms of the lock-up provisions discussed above. The timing and manner of the sale of RBS’s remaining ownership of our common stock remains uncertain, and we have no control over the manner in which RBS may seek to divest such remaining shares. RBS could elect to sell its common stock in a number of different ways, including in a number of tranches via future registrations or, alternatively, by the sale of all or a significant tranche of such remaining shares to a single third-party purchaser. Any such sale would impact the price of our shares of common stock and there can be no guarantee that the price at which RBS is willing to sell its remaining shares will be at a level that our Board would be prepared to recommend to holders of our common stock or that you determine adequately values our shares of common stock.
In addition, these factors could also make it more difficult for us to raise additional funds through future offerings of our shares of common stock or other securities.
If RBS sells a controlling interest in our company to a third party in a private transaction, you may not realize any change-of-control premium on shares of our common stock and we may become subject to the control of a presently unknown third party.
Following the completion of this offering, RBS will continue to beneficially own a significant equity interest of our company. RBS will have the ability, should it choose to do so, to sell some or all of its shares of our common stock in a privately negotiated transaction, which, if sufficient in size, could result in a change of control of our company.
51
Table of Contents
The ability of RBS to privately sell its shares of our common stock, with no requirement for a concurrent offer to be made to acquire all of the shares of our outstanding common stock that will be publicly traded hereafter, could prevent you from realizing any change-of-control premium on your shares of our common stock that may otherwise accrue to RBS on its private sale of our common stock. Additionally, if RBS privately sells its significant equity interest in our company, we may become subject to the control of a presently unknown third party. Such third party may have conflicts of interest with those of other stockholders. In addition, if RBS sells a controlling interest in our company to a third party, RBS may terminate the license agreement and other transitional arrangements, and our other commercial agreements and relationships could be impacted, all of which may adversely affect our ability to run our business as described in this prospectus and may have a material adverse effect on our business, operating results and financial condition.
There is no prior public market for our common stock and one may not develop.
Prior to this offering, there has not been a public trading market for our common stock. An active trading market may not develop or be sustained after this offering. If an active trading market does not develop, you may have difficulty selling your shares of common stock at an attractive price, or at all. The initial public offering price for our common stock sold in this offering will be determined by negotiations among the selling stockholders and the underwriters. This price may not be indicative of the price at which our common stock will trade after this offering. The market price of our common stock may decline below the initial offering price, and you may not be able to sell your common stock at or above the price you paid in this offering, or at all.
Our stock price may be volatile, and you could lose all or part of your investment as a result.
You should consider an investment in our common stock to be risky, and you should invest in our common stock only if you can withstand a significant loss and wide fluctuation in the market value of your investment. The market price of our common stock could be subject to wide fluctuations in response to, among other things, the factors described in this “Risk Factors” section, and other factors, some of which are beyond our control. These factors include:
| • | quarterly variations in our results of operations or the quarterly financial results of companies perceived to be similar to us; |
| • | changes in expectations as to our future financial performance, including financial estimates by securities analysts and investors; |
| • | our announcements or our competitors’ announcements regarding new products or services, enhancements, significant contracts, acquisitions or strategic investments; |
| • | fluctuations in the market valuations of companies perceived by investors to be comparable to us; |
| • | future sales of our common stock; |
| • | additions or departures of members of our senior management or other key personnel; |
| • | changes in industry conditions or perceptions; and |
| • | changes in applicable laws, rules or regulations and other dynamics. |
Furthermore, the stock markets have experienced price and volume fluctuations that have affected and continue to affect the market price of equity securities of many companies. These fluctuations have often been unrelated or disproportionate to the operating performance of these companies.
52
Table of Contents
These broad market fluctuations, as well as general economic, systemic, political and market conditions, such as recessions, loss of investor confidence, interest rate changes or international currency fluctuations, may negatively affect the market price of our common stock.
If any of the foregoing occurs, it could cause our stock price to fall and may expose us to securities class action litigation that, even if unsuccessful, could be costly to defend and a distraction to management.
We may not pay cash dividends on our common stock.
Although we intend to pay dividends to our stockholders, we have no obligation to do so and may change our dividend policy at any time without notice to our stockholders. Holders of our common stock are only entitled to receive such cash dividends as our Board may declare out of funds legally available for such payments. Any decision to declare and pay dividends will be dependent on a variety of factors, including our financial condition, earnings, legal requirements and other factors that our Board deems relevant, as well as obtaining applicable regulatory consents and approvals as described under “Regulation and Supervision,” including the CCAR process. In addition, our ability to pay dividends may be limited by covenants of any future indebtedness we or our subsidiaries incur. As a result, you may not receive any return on an investment in our common stock unless you sell our common stock for a price greater than that which you paid for it. In addition, since we are a holding company with no significant assets other than the capital stock of our banking subsidiaries, we depend upon dividends from our banking subsidiaries for substantially all of our income. Accordingly, our ability to pay dividends depends primarily upon the receipt of dividends or other capital distributions from our banking subsidiaries. The ability of our banking subsidiaries to pay dividends to us is subject to, among other things, their earnings, financial condition and need for funds, as well as federal and state governmental policies and regulations applicable to us and our banking subsidiaries, which limit the amount that may be paid as dividends without prior regulatory approval. See “—We depend on our banking subsidiaries for most of our revenue, and restrictions on dividends and other distributions by our banking subsidiaries could affect our liquidity and ability to fulfill our obligations” and “Regulation and Supervision.”
You may incur immediate and substantial dilution in the net tangible book value of the shares you purchase in this offering.
The initial public offering price may be substantially higher than the net tangible book value per share of our common stock based on the total value of our tangible assets less our total liabilities divided by our shares of common stock outstanding immediately following this offering. In that case, if you purchase common stock in this offering, you will experience immediate and substantial dilution in net tangible book value per share after completion of this offering. To the extent outstanding options to purchase our common stock are exercised, there will be further dilution. For further details see “Dilution.”
“Anti-takeover” provisions and the regulations to which we are subject may make it more difficult for a third party to acquire control of us, even if the change in control would be beneficial to stockholders.
We are a bank holding company incorporated in the state of Delaware. Anti-takeover provisions in Delaware law and our amended and restated certificate of incorporation and amended and restated bylaws, as well as regulatory approvals that would be required under federal law, could make it more difficult for a third party to take control of us and may prevent stockholders from receiving a premium for their shares of our common stock. These provisions could adversely affect the market price of our common stock and could reduce the amount that stockholders might get if we are sold.
53
Table of Contents
These provisions include the following, some of which may only become effective when RBS no longer owns shares of our common stock representing at least 50% of our issued and outstanding capital stock:
| • | the sole ability of our Board to fill a director vacancy on our Board; |
| • | advance notice requirements for stockholder proposals and director nominations; |
| • | provisions limiting the stockholders’ ability to call special meetings of stockholders, to require special meetings of stockholders to be called and to take action by written consent; |
| • | the approval of holders of at least 75% of the shares entitled to vote generally to amend, alter, change or repeal specified provisions, including those relating to actions by written consent of stockholders, calling of special meetings of stockholders, business combinations and amendment of our amended and restated certificate of incorporation and amended and restated bylaws; and |
| • | the ability of our Board to designate the terms of and issue new series of preferred stock without stockholder approval, which could be used, among other things, to institute a rights plan that would have the effect of significantly diluting the stock ownership of a potential hostile acquirer, likely preventing acquisitions that have not been approved by our Board. |
For further details see “Description of Capital Stock—Anti-Takeover Effects of Some Provisions.” We believe these provisions protect our stockholders from coercive or otherwise unfair takeover tactics by requiring potential acquirers to negotiate with our Board and by providing our Board with more time to assess any acquisition proposal. However, these provisions apply even if the offer may be determined to be beneficial by some stockholders and could delay or prevent an acquisition that our Board determines is not in our best interest and that of our stockholders.
Furthermore, banking laws impose notice, approval and ongoing regulatory requirements on any stockholder or other party that seeks to acquire direct or indirect “control” of an FDIC-insured depository institution. These laws include the Bank Holding Company Act and the Change in Bank Control Act. These laws could delay or prevent an acquisition.
54
Table of Contents
SPECIAL NOTE REGARDING FORWARD-LOOKING STATEMENTS
We have made statements under the captions “Prospectus Summary,” “Risk Factors,” “Management’s Discussion and Analysis of Financial Condition and Results of Operations,” “Business” and in other sections of this prospectus that are forward-looking statements. In some cases, you can identify these statements by forward-looking words such as “may,” “might,” “will,” “should,” “expects,” “plans,” “anticipates,” “believes,” “estimates,” “predicts,” “potential” or “continue,” the negative of these terms and other comparable terminology. These forward-looking statements may relate to our financial condition, results of operations, plans, objectives, future performance and business, including, but not limited to, statements with respect to expected earnings levels, the adequacy of the allowance for credit losses, delinquency trends, market risk and the impact of interest rate changes, capital market conditions, capital composition and adequacy and liquidity, the effect of legal proceedings and new accounting standards on our financial condition and results of operations. Forward-looking statements are not guarantees of future performance, are based on management’s current expectations and, by their nature, involve certain risks, uncertainties, estimates and assumptions by management that are difficult to predict. Various factors, some of which are beyond our control, could cause actual results to differ materially from those expressed in, or implied by, such forward-looking statements, including those factors discussed under the caption entitled “Risk Factors.” You should specifically consider the numerous risks outlined under “Risk Factors.” Other factors that might cause such a difference include, but are not limited to:
| • | Our ability to successfully execute our strategic plan, including by increasing revenue, reducing costs and executing our capital initiatives; |
| • | Our ability to remedy regulatory deficiencies and meet supervisory requirements and expectations; |
| • | The rate of growth in the economy and employment levels, as well as general business and economic conditions; |
| • | Changes in interest rates and market liquidity, as well as the magnitude of such changes, which may reduce interest margins, impact funding sources and affect the ability to originate and distribute financial products in the primary and secondary markets; |
| • | Changes in federal bank regulatory and supervisory policies, including required levels of capital; |
| • | The impact of the Dodd-Frank Act on our businesses, business practices and costs of operations; |
| • | The relative strength or weakness of the consumer and commercial credit sectors and of the real estate markets in the markets in which our borrowers are located; |
| • | Competition in the financial services industry; and |
| • | Legislative, tax, accounting or regulatory changes. |
Other possible events or factors that could cause results or performance to differ materially from those expressed in such forward-looking statements include the following:
| • | Negative economic conditions that adversely affect the general economy, housing prices, the job market, consumer confidence and spending habits which may affect, among other things, the level of nonperforming assets, charge-offs and provision for credit losses; |
| • | Adverse movements and volatility in debt and equity capital markets; |
| • | Changes in market rates and prices, which may adversely impact the value of financial assets and liabilities; |
55
Table of Contents
| • | Liabilities resulting from litigation and regulatory investigations; |
| • | Our ability to grow our core businesses; |
| • | Decisions to downsize, sell or close units or otherwise change our business mix; and |
| • | Management’s ability to identify and manage these and other risks. |
Although we believe the expectations reflected in the forward-looking statements are reasonable, we cannot guarantee future results, level of activity, performance or achievements. Moreover, neither we nor any other person assumes responsibility for the accuracy and completeness of any of these forward-looking statements. We are under no duty to update any of these forward-looking statements after the date of this prospectus to conform to our prior statements as to actual results or revised expectations.
56
Table of Contents
The selling stockholders are selling all of the shares of common stock in this offering and we will not receive any proceeds from the sale of the common stock in the offering.
57
Table of Contents
We intend to pay quarterly cash dividends on our common stock at an initial amount of approximately $0.10 per share. Any declaration of dividends will be at the discretion of our Board and will depend on our financial condition, earnings, cash needs, regulatory constraints, capital requirements (including requirements of our subsidiaries) and any other factors that our Board deems relevant in making such a determination. Therefore, there can be no assurance that we will pay any dividends to holders of our common stock, or as to the amount of any such dividends. See “Our Relationship with the RBS Group and Certain Other Related Party Transactions—Relationship with the RBS Group—Other” for further information regarding capital distributions.
Dividend payments to our stockholders are subject to the oversight, regulatory policies and requirements of the Federal Reserve Board, including requirements to maintain adequate capital above regulatory minima. As described in the section entitled “Regulation and Supervision,” dividends generally may only be paid or made under a capital plan as to which the Federal Reserve Board has not objected, including in respect of the CCAR process. In March 2014, the Federal Reserve Board objected on qualitative grounds to our capital plan submitted as part of the CCAR process. In its public report entitled “Comprehensive Capital Analysis and Review 2014: Assessment Framework and Results,” the Federal Reserve Board cited significant deficiencies in our capital planning processes, including inadequate governance, weak internal controls and deficiencies in our practices for estimating revenues and losses under a stress scenario and for ensuring the appropriateness of loss estimates across our business lines in a specific stress scenario. Although the Federal Reserve Board acknowledged that bank holding companies such as ours that are new to the CCAR process are subject to different expectations, our weaknesses were considered serious enough to warrant the Federal Reserve Board’s objection based on its qualitative assessment of our capital planning process. As a result, we are not permitted to increase our capital distributions above 2013 levels until a new capital plan is approved by the Federal Reserve Board. The deadline for our next capital plan submission is January 5, 2015, and we cannot assure you that the Federal Reserve Board will not object to our next capital plan or that, even if it does not object to it, our planned capital distributions will not be significantly modified from 2013 levels.
We are a legal entity separate and distinct from our banking subsidiaries and other subsidiaries. Our principal source of liquidity is dividends from CBNA and CBPA. Various federal and state statutes and regulations limit the amount of dividends that may be paid to us by our banking subsidiaries without regulatory consent.
In particular, dividends payable by CBNA, as a national bank subsidiary, are limited to the lesser of the amounts calculated under a “recent earnings” test and an “undivided profits” test. Under the recent earnings test, a dividend may not be paid if the total of all dividends declared by a bank in any calendar year is in excess of the current year’s net income combined with the retained net income of the two preceding years, less any required transfers to surplus, unless the national bank obtains the approval of the OCC. Under the undivided profits test, a dividend may be paid only to the extent that retained net profits (as defined and interpreted by regulation), including the portion transferred to surplus, exceed bad debts (as defined by regulation). As a result of the goodwill impairment recognized by CBNA in the second quarter of 2013, CBNA does not meet the recent earnings test and must obtain specific prior approval from the OCC before making a capital distribution. We expect the recent earnings test to remain negative through 2015. As a result, we expect that CBNA will be required to obtain specific prior approval from the OCC before making a capital distribution through 2015. Since the goodwill impairment in 2013, the OCC has approved each request by CBNA to distribute to us up to 30% of its prior quarter after-tax net income. However, CBNA may not rely on past or current approvals as a guarantee of future approvals.
58
Table of Contents
With respect to CBPA, the PA Code states, in part, that dividends may be declared and paid only out of accumulated net earnings and may not be declared unless surplus is at least equal to contributed capital. As of June 30, 2014, accumulated net earnings of CBPA were $227 million. We book capital contributed to our wholly-owned subsidiary, CBPA, almost entirely as surplus, which stands at $3.8 billion as of June 30, 2014.
In addition, with respect to both CBNA and CBPA, if, in the opinion of the applicable federal regulatory agency, a depository institution under its jurisdiction is engaged in or is about to engage in an unsafe or unsound practice (which, depending on the financial condition of the bank, could include the payment of dividends), the regulator may require, after notice and hearing, that the bank cease and desist from such practice. The OCC and the FDIC have indicated that the payment of dividends would constitute an unsafe and unsound practice if the payment would reduce a depository institution’s capital to an inadequate level.
Moreover, under the Federal Deposit Insurance Act (“FDIA”), an insured depository institution may not pay any dividends if the institution is undercapitalized or if the payment of the dividend would cause the institution to become undercapitalized. In addition, the federal bank regulatory agencies have issued policy statements which provide that FDIC-insured depository institutions and their holding companies should generally pay dividends only out of their current operating earnings.
During the six months ended June 30, 2014, we declared and paid the following cash dividends, by quarter:
| Six Months Ended June 30, 2014 |
Aggregate Cash Dividend |
|||
| (in millions) | ||||
| 1st Quarter |
$ | 25 | ||
| 2nd Quarter(1) |
343 | |||
|
|
|
|||
| Total |
$ | 368 | ||
|
|
|
|||
| (1) | Includes special common dividends to RBS. See “Management’s Discussion and Analysis of Financial Condition and Results of Operation—Capital.” |
Additionally, on August 1, 2014 and August 28, 2014 we declared and paid a special common dividend of $333 million and a common dividend of $50 million, respectively, to RBS.
During the year ended December 31, 2013, we declared and paid the following cash dividends, by quarter:
| Year Ended December 31, 2013 |
Aggregate Cash Dividend |
|||
| (in millions) | ||||
| 1st Quarter |
$ | 40 | ||
| 2nd Quarter(1) |
388 | |||
| 3rd Quarter(1) |
383 | |||
| 4th Quarter(1) |
374 | |||
|
|
|
|||
| Total |
$ | 1,185 | ||
|
|
|
|||
| (1) | Includes special common dividends to RBS. See “Management’s Discussion and Analysis of Financial Condition and Results of Operation—Capital.” |
59
Table of Contents
During the year ended December 31, 2012, we declared and paid the following cash dividends, by quarter:
| Year Ended December 31, 2012 |
Aggregate Cash Dividend |
|||
| (in millions) | ||||
| 1st Quarter |
$ | — | ||
| 2nd Quarter |
40 | |||
| 3rd Quarter |
55 | |||
| 4th Quarter |
55 | |||
|
|
|
|||
| Total |
$ | 150 | ||
|
|
|
|||
During the year ended December 31, 2011, we did not declare or pay any dividends.
60
Table of Contents
The following table sets forth our capitalization as of June 30, 2014. The selling stockholders are selling all of the shares of common stock in this offering and we will not receive any proceeds from the sale of the shares. This table should be read in conjunction with “Management’s Discussion and Analysis of Financial Condition and Results of Operations” and our unaudited interim and audited consolidated financial statements and notes included elsewhere in this prospectus.
| As of June 30, 2014 |
||||
| Actual | ||||
| (in millions) | ||||
| Debt: |
||||
| Short-term borrowed funds: |
||||
| Federal funds purchased |
$ | — | ||
| Securities sold under agreements to repurchase |
6,807 | |||
| Other short-term borrowed funds |
7,702 | |||
|
|
|
|||
| Total short-term borrowed funds |
$ | 14,509 | ||
|
|
|
|||
| Long-term borrowed funds: |
||||
| Citizens Financial Group, Inc. |
||||
| 4.150% fixed rate subordinated debt, due 2022 |
$ | 350 | ||
| 5.158% fixed-to-floating rate subordinated debt, (LIBOR + 3.56%) callable, due 2023(1) |
333 | |||
| 4.771% fixed rate subordinated debt, due 2023(1) |
333 | |||
| 4.691% fixed rate subordinated debt, due 2024(1) |
334 | |||
| 4.153% fixed rate subordinated debt, due 2024(1) |
333 | |||
|
|
|
|||
| 1,683 | ||||
| Banking Subsidiaries |
||||
| Federal Home Loan Advances due through 2033 |
24 | |||
| Other |
25 | |||
|
|
|
|||
| 49 | ||||
|
|
|
|||
| Total long-term borrowed funds |
$ | 1,732 | ||
|
|
|
|||
| Total debt |
$ | 16,241 | ||
|
|
|
|||
| Stockholders’ equity: |
||||
| Preferred Stock |
$ | — | ||
| Common Stock |
6 | |||
| Additional paid-in capital |
18,603 | |||
| Retained earnings(2) |
1,346 | |||
| Accumulated other comprehensive loss |
(358 | ) | ||
|
|
|
|||
| Total stockholders’ equity |
$ | 19,597 | ||
|
|
|
|||
| Total capitalization |
$ | 35,838 | ||
|
|
|
|||
| (1) | Intercompany borrowed funds with the RBS Group. See “Our Relationship with the RBS Group and Certain Other Related Party Transactions—Relationship with the RBS Group—Other” and Note 18 “Related Party Transactions” to our audited consolidated financial statements included elsewhere in this prospectus. |
| (2) | A $50 million dividend was paid to RBS Group on August 28, 2014. |
On August 1, 2014, we executed an additional $333 million exchange of common equity for 10-year subordinated debt (4.023% fixed rate subordinated debt, due 2024) to the RBS Group and, subject to regulatory approval, we plan to continue our strategy of capital optimization by, assuming
61
Table of Contents
completion of this offering, issuing $334 million of our shares of preferred stock to RBS and then using the proceeds from this issuance to purchase $334 million of our shares of common stock from RBS in the fourth quarter of 2014. In addition, we intend to repurchase approximately $500 million of shares of our common stock and $250 million of shares of our common stock in 2015 and 2016, respectively, with proceeds from the issuance of subordinated debt or another lesser form of capital. See “Our Relationship with the RBS Group and Certain Other Related Party Transactions—Relationship with the RBS Group—Other” for further details of the planned fourth quarter exchange transaction.
62
Table of Contents
Our consolidated net tangible book value as of June 30, 2014 was $13.1 billion or $23.39 per share of common stock. Consolidated net tangible book value per share represents consolidated tangible assets, less consolidated liabilities, divided by the aggregate number of shares of common stock outstanding. Our consolidated net tangible book value per share will not be affected by the sale of shares of common stock in this offering. On August 1, 2014, we exchanged $333 million of Tier 1 common equity for Tier 2 subordinated debt. Pro forma for this exchange, as of June 30, 2014, our consolidated net tangible book value would have been $12.8 billion or $22.79 per share of common stock, without giving effect to any additional net income earned or additional dividends paid between June 30, 2014 and August 1, 2014. Dilution per share represents the difference between the price per share to be paid by new investors for the shares of common stock sold in this offering and the consolidated net tangible book value per share. The price per share to the public of the shares of common stock in this offering exceeds the pro forma consolidated net tangible book value per share prior to the offering. Therefore, purchasers of shares of common stock in the offering will realize immediate and substantial dilution in the consolidated net tangible book value of $1.21 per share. The following table illustrates this per share dilution:
| Assumed initial public offering price |
$ | 24.00 | ||
| Pro forma consolidated net tangible book value per share as of June 30, 2014 |
$ | 22.79 | ||
|
|
|
|||
| Dilution per share to new investors |
$ | 1.21 | ||
|
|
|
We have not issued any shares of common stock or rights to acquire shares of common stock in the last five years.
Sales by the selling stockholders in this offering will reduce the number of shares held by existing stockholders to 419,998,324 or approximately 75.0% of the total shares of common stock outstanding after the offering, or to 398,998,324 shares or approximately 71.2% of the total shares of common stock outstanding after the offering if the option to purchase additional shares is exercised in full, and will increase the number of shares to be purchased by new investors to 140,000,000 or approximately 25.0% of the total shares of common stock outstanding after the offering, or to 161,000,000 shares or approximately 28.7% of the total shares of common stock outstanding after the offering if the option to purchase additional shares is exercised in full, of the total shares of common stock outstanding after the offering.
The foregoing table assumes no exercise of the underwriters’ over-allotment option and excludes (i) 5,087,770 shares (based principally on the midpoint of the range set forth on the cover page of this prospectus) of common stock underlying CFG equity awards following the conversion of outstanding RBS deferred share awards, outstanding RBS long-term incentive awards (assuming maximum achievement of the performance conditions applicable to the long-term incentive awards) and special IPO awards into awards on shares of our common stock upon completion of this offering and (ii) 62,112,029 shares of common stock that may be granted under our new equity compensation plans (including our employee stock purchase plan) following this offering. See “Compensation Discussion and Analysis” and our audited consolidated financial statements included elsewhere in this prospectus.
63
Table of Contents
SELECTED CONSOLIDATED FINANCIAL DATA
We derived the selected consolidated operating data for the years ended December 31, 2013, 2012 and 2011 and the selected consolidated balance sheet data as of December 31, 2013 and 2012 from our audited consolidated financial statements included elsewhere in this prospectus. We derived the selected consolidated statement of operations data for the years ended December 31, 2010 and 2009 and the selected consolidated balance sheet data as of December 31, 2011, 2010 and 2009 from our consolidated financial statements, which are not included in this prospectus. We derived the selected consolidated operating data for the six months ended June 30, 2014 and 2013 and the selected balance sheet data as of June 30, 2014 from our unaudited interim consolidated financial statements included elsewhere in this prospectus. Our historical results are not necessarily indicative of the results expected for any future period.
In our opinion, the unaudited interim consolidated financial statements have been prepared on the same basis as the audited consolidated financial statements and include all adjustments, consisting of normal recurring adjustments, necessary for a fair presentation of the information set forth herein. Our operating results for the six months ended June 30, 2014 are not necessarily indicative of those to be expected for the year ending December 31, 2014 or for any future period. You should read the following selected consolidated financial data in conjunction with the sections of this prospectus entitled “Summary Consolidated Financial and Other Data,” “Management’s Discussion and Analysis of Financial Condition and Results of Operations,” and “Selected Statistical Information” and our consolidated financial statements and notes thereto included elsewhere in this prospectus.
| For the Six Months Ended June 30, |
For the Year Ended December 31, | |||||||||||||||||||||||||||
| 2014 | 2013 | 2013 | 2012 | 2011 | 2010 | 2009 | ||||||||||||||||||||||
| (dollars in millions, except per share amounts) | ||||||||||||||||||||||||||||
| Operating Data: |
||||||||||||||||||||||||||||
| Net interest income |
$ | 1,641 | $ | 1,509 | $ | 3,058 | $ | 3,227 | $ | 3,320 | $ | 3,345 | $ | 3,419 | ||||||||||||||
| Noninterest income |
998 | 870 | 1,632 | 1,667 | 1,711 | 1,733 | 1,666 | |||||||||||||||||||||
|
|
|
|
|
|
|
|
|
|
|
|
|
|
|
|||||||||||||||
| Total revenue |
2,639 | 2,379 | 4,690 | 4,894 | 5,031 | 5,078 | 5,085 | |||||||||||||||||||||
| Provision for credit |
170 | 202 | 479 | 413 | 882 | 1,644 | 2,783 | |||||||||||||||||||||
| Noninterest expense |
1,758 | 6,073 | 7,679 | 3,457 | 3,371 | 3,483 | 3,495 | |||||||||||||||||||||
| Noninterest expense, |
1,758 | 1,638 | 3,244 | 3,457 | 3,371 | 3,483 | 3,495 | |||||||||||||||||||||
| Income (loss) before |
711 | (3,896 | ) | (3,468 | ) | 1,024 | 778 | (49 | ) | (1,193 | ) | |||||||||||||||||
| Income tax expense |
232 | (174 | ) | (42 | ) | 381 | 272 | (61 | ) | (420 | ) | |||||||||||||||||
| Net income (loss) |
479 | (3,722 | ) | (3,426 | ) | 643 | 506 | 11 | (740 | ) | ||||||||||||||||||
| Net income (loss), |
479 | 358 | 654 | 643 | 506 | 11 | (740 | ) | ||||||||||||||||||||
| Net income (loss) per |
0.86 | (6.65 | ) | (6.12 | ) | 1.15 | 0.90 | 0.02 | (1.32 | ) | ||||||||||||||||||
| Net income (loss) per |
0.86 | 0.64 | 1.17 | 1.15 | 0.90 | 0.02 | (1.32 | ) | ||||||||||||||||||||
64
Table of Contents
| For the Six Months Ended June 30, |
For the Year Ended December 31, | |||||||||||||||||||||||||||
| 2014 | 2013 | 2013 | 2012 | 2011 | 2010 | 2009 | ||||||||||||||||||||||
| (dollars in millions, except per share amounts) | ||||||||||||||||||||||||||||
| Other Operating Data: |
||||||||||||||||||||||||||||
| Return on average |
4.96 | % | (13.87 | )% | (15.69 | )% | 2.69 | % | 2.19 | % | 0.05 | % | (3.77 | )% | ||||||||||||||
| Return on average |
4.96 | % | 2.98 | % | 3.00 | % | 2.69 | % | 2.19 | % | 0.05 | % | (3.77 | )% | ||||||||||||||
| Return on average tangible |
7.45 | % | (24.96 | )% | (25.91 | )% | 4.86 | % | 4.18 | % | 0.11 | % | (9.56 | )% | ||||||||||||||
| Return on average tangible |
7.45 | % | 5.37 | % | 4.95 | % | 4.86 | % | 4.18 | % | 0.11 | % | (9.56 | )% | ||||||||||||||
| Return on average total |
0.77 | % | (2.73 | )% | (2.83 | )% | 0.50 | % | 0.39 | % | 0.01 | % | (0.47 | )% | ||||||||||||||
| Return on average total |
0.77 | % | 0.59 | % | 0.54 | % | 0.50 | % | 0.39 | % | 0.01 | % | (0.47 | )% | ||||||||||||||
| Return on average total |
0.81 | % | (2.99 | )% | (3.05 | )% | 0.55 | % | 0.43 | % | 0.01 | % | (0.51 | )% | ||||||||||||||
| Return on average total |
0.81 | % | 0.64 | % | 0.58 | % | 0.55 | % | 0.43 | % | 0.01 | % | (0.51 | )% | ||||||||||||||
| Efficiency ratio(1) |
66.58 | % | 255.24 | % | 163.73 | % | 70.64 | % | 67.00 | % | 68.59 | % | 68.73 | % | ||||||||||||||
| Efficiency ratio, excluding |
66.58 | % | 68.80 | % | 69.17 | % | 70.64 | % | 67.00 | % | 68.59 | % | 68.73 | % | ||||||||||||||
| Net interest margin(5)(12) |
2.88 | % | 2.83 | % | 2.85 | % | 2.89 | % | 2.97 | % | 2.78 | % | 2.49 | % | ||||||||||||||
| As of June 30, |
As of December 31, | |||||||||||||||||||||||
| 2014 | 2013 | 2012 | 2011 | 2010 | 2009 | |||||||||||||||||||
| (dollars in millions) | ||||||||||||||||||||||||
| Balance Sheet Data: |
||||||||||||||||||||||||
| Total assets |
$ | 130,279 | $ | 122,154 | $ | 127,053 | $ | 129,654 | $ | 129,689 | $ | 147,681 | ||||||||||||
| Loans and leases(6) |
88,829 | 85,859 | 87,248 | 86,795 | 87,022 | 95,080 | ||||||||||||||||||
| Allowance for loan and lease losses |
1,210 | 1,221 | 1,255 | 1,698 | 2,005 | 2,209 | ||||||||||||||||||
| Total securities |
24,823 | 21,245 | 19,417 | 23,352 | 21,802 | 28,161 | ||||||||||||||||||
| Goodwill |
6,876 | 6,876 | 11,311 | 11,311 | 11,311 | 11,709 | ||||||||||||||||||
| Total liabilities |
110,682 | 102,958 | 102,924 | 106,261 | 106,995 | 125,405 | ||||||||||||||||||
| Deposits(7) |
91,656 | 86,903 | 95,148 | 92,888 | 92,155 | 98,053 | ||||||||||||||||||
| Federal funds purchased and securities sold under agreements to repurchase |
6,807 | 4,791 | 3,601 | 4,152 | 5,112 | 5,222 | ||||||||||||||||||
| Other short-term borrowed funds |
7,702 | 2,251 | 501 | 3,100 | 1,930 | 11,373 | ||||||||||||||||||
| Long-term borrowed funds |
1,732 | 1,405 | 694 | 3,242 | 5,854 | 7,135 | ||||||||||||||||||
| Total stockholders’ equity |
19,597 | 19,196 | 24,129 | 23,393 | 22,694 | 22,276 | ||||||||||||||||||
65
Table of Contents
| As of June 30, |
As of December 31, | |||||||||||||||||||||||
| 2014 | 2013 | 2012 | 2011 | 2010 | 2009 | |||||||||||||||||||
| (dollars in millions) | ||||||||||||||||||||||||
| Other Balance Sheet Data: |
||||||||||||||||||||||||
| Asset Quality Ratios: |
||||||||||||||||||||||||
| Allowance for loan and lease losses as a |
1.36 | % | 1.42 | % | 1.44 | % | 1.96 | % | 2.30 | % | 2.32 | % | ||||||||||||
| Allowance for loan and lease losses as a |
101 | % | 86 | % | 67 | % | 95 | % | 85 | % | 101 | % | ||||||||||||
| Nonperforming loans and leases as a percentage |
1.35 | % | 1.65 | % | 2.14 | % | 2.06 | % | 2.71 | % | 2.31 | % | ||||||||||||
| Capital ratios: |
||||||||||||||||||||||||
| Tier 1 capital ratio(8) |
13.3 | % | 13.5 | % | 14.2 | % | 13.9 | % | 13.0 | % | 11.6 | % | ||||||||||||
| Total capital ratio(9) |
16.2 | % | 16.1 | % | 15.8 | % | 15.1 | % | 14.4 | % | 13.0 | % | ||||||||||||
| Tier 1 common equity ratio(10) |
13.3 | % | 13.5 | % | 13.9 | % | 13.3 | % | 12.5 | % | 11.1 | % | ||||||||||||
| Leverage ratio(11) |
11.1 | % | 11.6 | % | 12.1 | % | 11.6 | % | 10.4 | % | 8.7 | % | ||||||||||||
| (1) | These measures are non-GAAP financial measures. For more information on the computation of these non-GAAP financial measures, see “Management’s Discussion and Analysis of Financial Condition and Results of Operations—Principal Components of Operations and Key Performance Metrics Used By Management—Key Performance Metrics and Non-GAAP Financial Measures.” |
| (2) | Earnings per share information reflects a 165,582-for-1 forward stock split effective on August 22, 2014. |
| (3) | We define “Return on average common equity” as net income (loss) divided by average common equity. |
| (4) | We define “Return on average total assets” as net income (loss) divided by average total assets. |
| (5) | We define “Net interest margin” as net interest income divided by average total interest-earning assets. |
| (6) | Excludes loans held for sale of $262 million, $1.3 billion, $646 million, $564 million, $716 million, and $456 million as of June 30, 2014 and December 31, 2013, 2012, 2011, 2010, and 2009, respectively. |
| (7) | Excludes deposits held for sale of $5.3 billion as of December 31, 2013. |
| (8) | We define “Tier 1 capital ratio” as Tier 1 capital balance divided by total risk-weighted assets as defined under Basel I. |
| (9) | We define “Total capital ratio” as total capital balance divided by total risk-weighted assets as defined under Basel I. |
| (10) | We define “Tier 1 common equity ratio” as Tier 1 capital balance, minus preferred stock, divided by total risk-weighted assets as defined under Basel I. |
| (11) | We define “Leverage ratio” as Tier 1 capital balance divided by quarterly average total assets as defined under Basel I. |
| (12) | Operating ratios for the periods ended June 30, 2014 and 2013 are presented on an annualized basis. |
66
Table of Contents
MANAGEMENT’S DISCUSSION AND ANALYSIS OF FINANCIAL CONDITION AND RESULTS OF OPERATIONS
This section contains forward-looking statements that involve risks and uncertainties. Our actual results may differ materially from those discussed in the forward-looking statements as a result of various factors, including, without limitation, those set forth in “Special Note Regarding Forward-Looking Statements” and “Risk Factors” and the matters set forth in this prospectus generally. The following discussion is based on, and should be read in conjunction with, our unaudited interim and audited consolidated financial statements and related notes included elsewhere in this prospectus, as well as “Summary Consolidated Financial and Other Data,” “Selected Consolidated Financial Data” and the other financial information included elsewhere in this prospectus.
Overview
We are the 13th largest retail bank holding company in the United States according to SNL Financial with $130.3 billion of total assets as of June 30, 2014. Headquartered in Providence, Rhode Island, we deliver a broad range of retail and commercial banking products and services to more than five million individuals, institutions and companies. Our approximately 18,050 employees strive to meet the financial needs of customers and prospects through approximately 1,230 branches and approximately 3,215 ATMs operated in an 11-state footprint across the New England, Mid-Atlantic and Midwest regions and through our online, telephone and mobile banking platforms. We have 90 retail and commercial non-branch offices located both in our geographic footprint and in nine states and the District of Columbia outside our branch footprint. Our 11-state branch banking footprint contains approximately 29.9 million households and 3.1 million businesses according to SNL Financial. We conduct our banking operations through our two wholly owned banking subsidiaries, CBNA and CBPA.
We operate our business through two operating segments: Consumer Banking and Commercial Banking. Consumer Banking accounted for $46.9 billion and $45.4 billion, or approximately 53% and 53% of our year-to-date average loan and lease balances (including loans held for sale) for the six months ended June 30, 2014 and 2013, respectively, and $45.1 billion and $46.5 billion, or approximately 53% and 53%, as of December 31, 2013 and 2012, respectively. Consumer Banking serves retail customers and small businesses with annual revenues of up to $25 million through a network that as of June 30, 2014 included approximately 1,230 branches operated in an 11-state footprint across the New England, Mid-Atlantic and Midwest regions, as well as through our online, telephone and mobile banking platforms. Our Consumer Banking products and services include deposit products, mortgage and home equity lending, student loans, auto financing, credit cards, business loans and wealth management and investment services.
Commercial Banking accounted for $37.0 billion and $34.2 billion, or approximately 42% and 40% of our year-to-date average loan and lease balances (including loans held for sale) for the six months ended June 30, 2014 and 2013, respectively, and $34.6 billion and $32.5 billion, or approximately 40% and 37%, as of December 31, 2013 and 2012, respectively. Commercial Banking offers a broad complement of financial products and solutions, including lending and leasing, trade financing, deposit and treasury management, foreign exchange and interest rate risk management, corporate finance and debt and equity capital markets capabilities.
As of June 30, 2014 and December 31, 2013, we had $3.5 billion and $3.8 billion, respectively, of non-core asset balances, which are included in Other along with our treasury function, securities portfolio, wholesale funding activities, goodwill, community development assets and other unallocated assets, liabilities, revenues, provision for credit losses and expenses not attributed to Consumer Banking or Commercial Banking. Non-core assets are primarily loans inconsistent with our strategic
67
Table of Contents
goals, generally as a result of geographic location, industry, product type or risk level. We have actively managed these loans down since they were designated as non-core on June 30, 2009, and the portfolio decreased a further 10% as of June 30, 2014 compared to December 31, 2013. The largest component of our non-core portfolio is our home equity products serviced by others (a portion of which we now service internally).
Recent Events
On June 20, 2014, we closed the sale of certain assets and liabilities associated with our Chicago-area retail branches, small business relationships and select middle market relationships to U.S. Bancorp. The agreement to sell these assets and liabilities to U.S. Bancorp had previously been announced in January 2014. This sale, which we refer to as the “Chicago Divestiture,” included 103 branches, including 94 full-service branches, with $4.8 billion of deposits and $1.0 billion in loans as of June 30, 2014. We recorded a gain on sale of $288 million and also incurred related expenses of $17 million. Management estimates that the Chicago Divestiture has the effect of reducing quarterly net interest income by approximately $12 million to $15 million, noninterest income by approximately $13 million to $17 million and noninterest expense by approximately $20 million to $25 million. We intend to invest the majority of the sale proceeds over time into higher returning activities.
On May 29, 2014, we entered into an agreement with a third party to purchase predominantly prime auto loans, including an initial purchase of $150 million in principal balances of loans. On the same date, we entered into an agreement with the same party to purchase auto loans for future rolling 90-day periods that automatically renew until termination by either party. For the first year ended May 29, 2015, we are required to purchase a minimum of $250 million in principal balances of loans up to a maximum of $600 million in principal balances of loans per rolling 90-day period. After May 29, 2015, the minimum per each rolling 90-day period increases to $400 million in principal balances of loans, with a maximum of $600 million in principal balances of loans. We may cancel the agreement at any time at will; however, if we elect to cancel at any time during the first three years of the agreement, we will be charged a variable termination fee.
Key Factors Affecting Our Business
Macro-economic conditions
Our business is affected by national, regional and local economic conditions, as well as the perception of those conditions and future economic prospects. The significant macro-economic factors that impact our business are: the U.S. and global economic landscapes, unemployment rates, the housing markets and interest rates.
The U.S. economy expanded 1.0% in the six months ended June 30, 2014, as gains in consumer spending and business investment in the second quarter of 2014 helped the economy rebound from a slump in the first quarter of 2014 caused by harsh winter weather. This expansion followed considerable improvement in the economic landscape in 2013, with nominal GDP growth averaging 3.1% for the year. The Eurozone economy expanded 0.7% in the three months ended March 31, 2014, after having emerged from recession in the second half of 2013. In addition to the improving picture in the Eurozone and periphery countries, reaccelerating growth in China provided further support. The U.S. unemployment rate dropped from 6.7% at year-end 2013 to 6.1% at June 30, 2014. The overall improvement was partially driven by a decrease in the labor force participation rate, which declined to its lowest level in over 35 years. After a pause in late 2013 and the first quarter of 2014, the housing market continued to strengthen in the second quarter of 2014, as demonstrated by continued price increases, and an increase in existing home sales. The Federal Reserve Board maintained very accommodative monetary policy conditions through a zero to 25 basis point federal funds target at the short end of the curve, and quantitative easing programs designed to reduce longer tenor rates.
68
Table of Contents
Interest rates remain relatively low, and financial conditions are supportive of continued growth. See “—Interest rates” below for further discussion of the impact of interest rates on our results.
Credit trends
Credit trends improved during the six months ended June 30, 2014 compared to the same period in 2013, largely driven by improving macro-economic factors as discussed above. Net charge-offs for the six months ended June 30, 2014 of $155 million decreased $100 million, or 39%, from $255 million for the six months ended June 30, 2013. The annualized net charge-offs as a percentage of total average loans improved to 0.36% for the six months ended June 30, 2014, compared to 0.60% for the six months ended June 30, 2013.
Credit trends improved during 2013 compared to 2012 largely driven by the improvement in the macro-economic factors discussed above. The improvement in credit trends led to an improvement in our net charge-offs for the year ended December 31, 2013, which decreased $374 million, or 43%, to $501 million, compared to $875 million for the year ended December 31, 2012. The net charge-offs as a percentage of total average loans improved to 0.59% for the year ended December 31, 2013, compared to 1.01% for the year ended December 31, 2012. The overall charge-off rates are expected to increase marginally in 2015 and 2016 but are expected to remain below 2013 levels as commercial recovery opportunities dissipate, home prices stabilize and non-core portfolios continue to runoff.
Interest rates
Net interest income is our largest source of revenue and is the difference between the interest earned on interest-earning assets (usually loans and investment securities) and the interest expense incurred in connection with interest-bearing liabilities (usually deposits and borrowings). The level of net interest income is primarily a function of the average balance of interest-earning assets, the average balance of interest-bearing liabilities and the spread between the contractual yield on such assets and the contractual cost of such liabilities. These factors are influenced by both the pricing and mix of interest-earning assets and interest-bearing liabilities which, in turn, are impacted by external factors such as local economic conditions, competition for loans and deposits, the monetary policy of the Federal Reserve Board and market interest rates. For further discussion, refer to “—Risk Governance and Quantitative and Qualitative Disclosures About Risk—Market Risk—Non-Trading Risk.”
The cost of our deposits and short-term wholesale borrowings is largely based on short-term interest rates, which are primarily driven by the Federal Reserve Board’s actions. However, the yields generated by our loans and securities are typically driven by short-term and long-term interest rates, which are set by the market or, at times, by the Federal Reserve Board’s actions. The level of net interest income is therefore influenced by movements in such interest rates and the pace at which such movements occur. In 2013 and through the six months ended June 30, 2014, short-term and long-term interest rates remained at very low levels by historical standards, with many benchmark rates, such as the federal funds rate and one- and three-month LIBOR, near zero. Further declines in the yield curve or a decline in longer-term yields relative to short-term yields (a flatter yield curve) would have an adverse impact on our net interest margin and net interest income. The low interest rate environment has compressed our net interest margin in recent periods.
In 2013 and through the six months ended June 30, 2014, the Federal Reserve Board maintained a highly accommodative monetary policy, and indicated that this policy would remain in effect for a considerable time after its asset purchase program ends and the economic recovery strengthens. As of June 2014, the Federal Reserve was purchasing $35 billion per month, composed of $20 billion in Treasury securities and $15 billion in agency mortgage-backed securities. The Federal Reserve Board announced an end to purchases in October 2014.
69
Table of Contents
Regulatory trends
We are subject to extensive regulation and supervision, which continue to evolve as the legal and regulatory framework governing our operations continues to change. The current operating environment also has heightened regulatory expectations around many regulations including consumer compliance, the Bank Secrecy Act, and anti-money laundering compliance and increased internal audit activities. As a result of these heightened expectations, we expect to incur additional costs for additional compliance personnel or professional fees associated with advisors and consultants.
Dodd-Frank regulation
As described further under “Regulation and Supervision,” we are subject to a variety of laws and regulations, including the Dodd-Frank Act. The Dodd-Frank Act is complex, and many aspects of it are subject to final rulemaking that will take effect over several years. The Dodd-Frank Act will continue to impact our earnings through fee reductions, higher costs and imposition of new restrictions on us. The Dodd-Frank Act may also continue to have a material adverse impact on the value of certain assets and liabilities held on our balance sheet. The ultimate impact of the Dodd-Frank Act on our business will depend on regulatory interpretation and rulemaking as well as the success of any of our actions to mitigate the negative impacts of certain provisions. Key parts of the Dodd-Frank Act that will specifically impact our business are the repeal of a previous prohibition against payment of interest on demand deposits, which became effective in July 2011, and the introduction of a stress-testing and capital planning framework developed by the Federal Reserve Board, known as CCAR. As part of our obligations under the Dodd-Frank Act, we, and certain other bank holding companies, will be required to publish results of the Dodd-Frank stress test (“DFAST”) during the third quarter of 2014. The DFAST process is used to project net income, loan losses and capital ratios over a nine-quarter horizon under hypothetical, stressful macroeconomic and financial market scenarios developed by the Federal Reserve Board as well as under certain mandated assumptions about capital distributions prescribed in the DFAST rule. Given the purpose of the DFAST process and the assumptions used in order to assess our likely performance during hypothetical economic conditions, we expect that projected results under the DFAST severely adverse scenarios will show severe negative impacts on earnings, inconsistent with management expectations in light of the current economic and operating environment.
Repeal of the prohibition on depository institutions paying interest on demand deposits
We began offering interest-bearing corporate checking accounts after the 2011 repeal of the prohibition on depository institutions paying interest on demand deposits. Currently, industrywide interest rates for this product are very low and thus far the impact of the repeal has not had a significant effect on our results. However, market rates could increase more significantly in the future. If we need to pay higher interest rates on checking accounts to maintain current clients or attract new clients, our interest expense would increase, perhaps materially. Furthermore, if we fail to offer interest rates at a sufficient level to retain demand deposits, our core deposits may be reduced, which would require us to obtain funding in other ways or limit potential future asset growth.
Comprehensive Capital Analysis and Review
CCAR is an annual exercise by the Federal Reserve Board to ensure that the largest bank holding companies have sufficient capital to continue operations throughout times of economic and financial stress and robust, forward-looking capital planning processes that account for their unique risks.
As part of CCAR, the Federal Reserve Board evaluates institutions’ capital adequacy, internal capital adequacy assessment processes and their plans to make capital distributions, such as dividend payments or stock repurchases. In March 2014, the Federal Reserve Board objected on qualitative grounds to our capital plan submitted as part of the CCAR process. In addition to modifications we may be required to make in connection with our proposed capital distributions through the CCAR process,
70
Table of Contents
we may incur additional expenses in connection with the CCAR process that would affect our profitability and results of operations. For further information regarding the CCAR process, see “Dividend Policy” and “Regulation and Supervision.”
Basel III final rules applicable to us and our banking subsidiaries
In July 2013, the Federal Reserve Board, OCC, and FDIC issued the U.S. Basel III final rules. The final rule implements the Basel III capital framework and certain provisions of the Dodd-Frank Act, including the Collins Amendment. See “Regulation and Supervision—Capital” for further information. Certain aspects of the final rules, such as the new minimum capital ratios, will become effective on January 1, 2015. In order to comply with the new capital requirements, we established capital ratio targets that meet or exceed U.S. regulatory expectations under fully phased-in Basel III rules, and as a result our capital requirements were increased.
HELOC Payment Shock
Recent attention has been given by regulators, rating agencies, and the general press regarding the potential for increased exposure to credit losses associated with HELOCs that were originated during the period of rapid home price appreciation between 2003 and 2007. Industrywide, many of the HELOCs originated during this timeframe were structured with an extended interest-only payment period followed by a requirement to convert to a higher payment amount that would begin fully amortizing both principal and interest beginning at a certain date in the future. As of June 30, 2014, approximately 33% of our $16.2 billion HELOC portfolio, or $5.3 billion in drawn balances, and $4.5 billion in undrawn balances, were subject to a payment reset or balloon payment between July 1, 2014 and December 31, 2017, including $350 million in balloon balances where full payment is due at the end of a ten-year interest only draw period.
To help manage this exposure, in September 2013, we launched a comprehensive program designed to provide heightened customer outreach to inform, educate and assist customers through the reset process as well as to offer alternative financing and forbearance options. Preliminary results indicate that our efforts to assist customers at risk of default have successfully reduced delinquency and charge-off rates compared to our original expectations.
As of June 30, 2014, for the $668 million of our HELOC portfolio that was originally structured with a reset period in 2013, 93.7% of the balances were refinanced, paid off or were current on payments, 3.4% were past due and 2.9% had been charged off. As of June 30, 2014, for the $898 million of our HELOC portfolio that was originally structured with a reset period in 2014, 96.4% of the balances were refinanced, paid off or were current on payments, 3.1% were past due and 0.5% had been charged off. HELOC portfolio balances of $352 million are scheduled to reset in the remainder of 2014. Factors that affect our future expectations for charge-off risk for the portion of our HELOC portfolio subject to reset periods in the future include improved loan-to-value ratios resulting from continued home price appreciation, stable portfolio credit score profiles and more robust loss mitigation efforts.
Factors Affecting Comparability of Our Results
Goodwill
During the 19-year period from 1988 to 2007, we completed a series of more than 25 acquisitions of other financial institutions and financial assets and liabilities. We accounted for these types of business combinations using the acquisition method of accounting. Under this accounting method, the acquired company’s net assets are recorded at fair value at the date of acquisition, and the difference between the purchase price and the fair value of the net assets acquired is recorded as goodwill.
71
Table of Contents
Under relevant accounting guidance, we are required to review goodwill for impairment annually, or more frequently if events or circumstances indicate that the fair value of any of our business units might be less than its carrying value. The valuation of goodwill is dependent on forward-looking expectations related to the performance of the U.S. economy and our associated financial performance.
The prolonged delay in the full recovery of the U.S. economy, and the impact of that delay on our earnings expectations, prompted us to record a $4.4 billion pretax ($4.1 billion after tax) goodwill impairment as of June 30, 2013 related to our Consumer Banking reporting unit. For segment reporting purposes, the impairment charge is reflected in Other.
Although the U.S. economy has demonstrated signs of recovery, notably improvements in unemployment and housing, the pace and extent of recovery in these indicators, as well as in overall gross domestic product, have lagged behind previous expectations. The impact of the slow recovery is most evident in Consumer Banking. The forecasted lower economic growth for the United States, coupled with increasing costs of complying with the new regulatory framework in the financial industry, resulted in a deceleration of expected growth for Consumer Banking’s future income, which resulted in our recording of a goodwill impairment charge during the second quarter of 2013. We have recorded goodwill impairment charges in the past and any further impairment to our goodwill could materially affect our results in any given period. As of both June 30, 2014 and December 31, 2013, we had a carrying value of goodwill of $6.9 billion. For additional information regarding our goodwill impairment testing, see Note 5 “Goodwill” to our unaudited interim consolidated financial statements, as well as Note 1 “Significant Accounting Policies” and Note 8 “Goodwill” to our audited consolidated financial statements included elsewhere in this prospectus.
Investment in the business
We regularly incur expenses associated with investments in our infrastructure, and, from 2009 to year end 2013, we have invested more than $1.0 billion in infrastructure and technology, with an additional $250 million planned for each of 2014 and 2015. These investments, which are designed to lower our costs and improve our customer experience, include significant programs to enhance our resiliency, upgrade customer-facing technology and streamline operations. Recent significant investments included the 2013 launch of our new teller system, new commercial loan platform and new auto loan platform and the 2013 upgrade of the majority of our ATM network, including equipping more than 1,450 ATMs with advanced deposit-taking functionality. These investments also involved spending to prepare for the planned rollout of our new mortgage platform. We expect that these investments will increase our long-term overall efficiency and add to our capacity to increase revenue.
Operating expenses to operate as a fully independent public company
Following the completion of this offering and as part of our transition to a stand-alone company, we expect to incur one-time expenditures of approximately $55 million, including capitalized costs of $18 million, as well as ongoing incremental expenses of approximately $34 million per year. We expect these ongoing costs will include higher local charges associated with exiting worldwide vendor relationships and incremental expenses to support information technology, compliance, corporate governance, regulatory, financial and risk infrastructure that are necessary to enable us to operate as a fully stand-alone public company. For additional information on the planned separation from the RBS Group, see “Our Relationship with the RBS Group and Certain Other Related Party Transactions.”
Principal Components of Operations and Key Performance Metrics Used By Management
As a banking institution, we manage and evaluate various aspects of both our results of operations and our financial condition. We evaluate the levels and trends of the line items included in our balance
72
Table of Contents
sheet and statement of operations, as well as various financial ratios that are commonly used in our industry. We analyze these ratios and financial trends against our own historical performance, our budgeted performance and the financial condition and performance of comparable banking institutions in our region and nationally.
The primary line items we use in our key performance metrics to manage and evaluate our statement of operations include net interest income, noninterest income, total revenue, provision for credit losses, noninterest expense and net income (loss). The primary line items we use in our key performance metrics to manage and evaluate our balance sheet data include loans and leases, securities, allowance for credit losses, deposits, borrowed funds and derivatives.
Net interest income
Net interest income is the difference between the interest earned on interest-earning assets (usually loans and investment securities) and the interest expense incurred in connection with interest-bearing liabilities (usually deposits and borrowings). The level of net interest income is primarily a function of the average balance of interest-earning assets, the average balance of interest-bearing liabilities and the spread between the contractual yield on such assets and the cost of such liabilities. Net interest income is impacted by the relative mix of interest-earning assets and interest-bearing liabilities, movements in market interest rates, levels of nonperforming assets and pricing pressure from competitors. The mix of interest-earning assets is influenced by loan demand and by management’s continual assessment of the rate of return and relative risk associated with various classes of interest-earning assets.
The mix of interest-bearing liabilities is influenced by management’s assessment of the need for lower cost funding sources weighed against relationships with customers and growth requirements and is impacted by competition for deposits in our market and the availability and pricing of other sources of funds.
Noninterest income
The primary components of our noninterest income are service charges and fees, card fees, trust and investment services fees and securities gains, net.
Total revenue
Total revenue is the sum of our net interest income and our noninterest income.
Provision for credit losses
The provision for credit losses is the amount of expense that, based on our judgment, is required to maintain the allowance for credit losses at an adequate level to absorb probable losses inherent in the loan portfolio at the balance sheet date and that, in management’s judgment, is appropriate under relevant accounting guidance. The provision for credit losses includes the provision for loan and lease losses as well as the provision for unfunded commitments. The determination of the amount of the allowance is complex and involves a high degree of judgment and subjectivity. For additional information regarding the provision for credit losses, see “—Critical Accounting Estimates—Allowance for Credit Losses,” Note 4 “Allowance for Credit Losses, Nonperforming Assets, and Concentrations of Credit Risk” to our unaudited interim consolidated financial statements, as well as Note 1 “Significant Accounting Policies” and Note 5 “Allowance for Credit Losses, Nonperforming Assets, and Concentrations of Credit Risk” to our audited consolidated financial statements included elsewhere in this prospectus.
73
Table of Contents
Noninterest expense
Noninterest expense primarily includes salaries and employee benefits, outside services, occupancy, equipment expense, goodwill impairment, and other operating expenses.
Net income (loss)
We evaluate our net income based on measures including return on average total tangible assets, return on average tangible common equity and efficiency ratio.
Loans and leases
We classify our loans and leases pursuant to the following classes: commercial, commercial real estate, leases, residential (including residential mortgages and home equity loans and lines of credit), home equity products serviced by others (including certain purchased home equity loans and lines of credit), other secured retail (including automobile loans and other installment loans) and unsecured retail (including student loans and credit card).
Loans are reported at the amount of their outstanding principal, net of charge-offs, unearned income, deferred loan origination fees and costs and unamortized premiums or discounts (on purchased loans). Deferred loan origination fees and costs and purchase discounts and premiums are amortized as an adjustment of yield over the life of the loan, using the level yield interest method. Unamortized amounts remaining upon prepayment or sale are recorded as interest income or gain (loss) on sale, respectively. Credit card receivables include billed and uncollected interest and fees.
Leases are classified at the inception of the lease by type. Lease receivables, including leveraged leases, are reported at the aggregate of lease payments receivable and estimated residual values, net of unearned and deferred income, including unamortized investment credits. Lease residual values are reviewed at least annually for other-than-temporary impairment, with valuation adjustments recognized currently against noninterest income. Leveraged leases are reported net of non-recourse debt. Unearned income is recognized to yield a level rate of return on the net investment in the leases.
Mortgage loans held for sale are carried at fair value. Other loans held for sale primarily include loans relating to our Chicago branch network and are carried at the lower of cost or fair value.
Securities
Our securities portfolio is managed to seek return while maintaining prudent levels of quality, market risk and liquidity. Investments in debt and equity securities are carried in four portfolios: available for sale, held to maturity, trading account assets and other investment securities. We determine the appropriate classification at the time of purchase. Securities in our available for sale portfolio will be held for indefinite periods of time and may be sold in response to changes in interest rates, changes in prepayment risk or other factors relevant to our asset and liability strategy. Securities in our available for sale portfolio are carried at fair value, with unrealized gains and losses reported in other comprehensive income (“OCI”), as a separate component of stockholders’ equity, net of taxes. Securities are classified as held to maturity because we have the ability and intent to hold the securities to maturity, and are carried at amortized cost. Debt and equity securities that are bought and held principally for the purpose of being sold in the near term are classified as trading account assets and are carried at fair value. Realized and unrealized gains and losses on such assets are reported in noninterest income. Other investment securities are comprised mainly of FHLB stock and Federal Reserve Bank stock, which are carried at cost.
74
Table of Contents
Allowance for credit losses
Our estimate of probable losses in the loan and lease portfolios is recorded in the allowance for loan and lease losses and the reserve for unfunded lending commitments. Together these are referred to as the allowance for credit losses. We evaluate the adequacy of the allowance for credit losses using the following ratios: allowance for loan and lease losses as a percentage of total loans and leases; allowance for loan and lease losses as a percentage of nonperforming loans and leases; and nonperforming loans and leases as a percentage of total loans and leases. For additional information, see “—Critical Accounting Estimates—Allowance for Credit Losses” and Note 1 “Significant Accounting Policies” and Note 5 “Allowance for Credit Losses, Nonperforming Assets and Concentrations of Credit Risk” to our audited consolidated financial statements included elsewhere in this prospectus.
Deposits
Our deposits include on demand, checking with interest, regular savings, money market accounts and term deposits. As of June 30, 2014 and December 31, 2013, total deposits were $91.7 billion and $86.9 billion, respectively.
Borrowed funds
Our total short-term borrowed funds include federal funds purchased and securities sold under agreement to repurchase and other short-term borrowed funds. As of June 30, 2014 and December 31, 2013, total short-term borrowed funds were $14.5 billion and $7.0 billion, respectively. Our total short-term borrowed funds are offset by $4.3 billion and $1.4 billion in excess reserves held at Federal Reserve Banks as of June 30, 2014 and December 31, 2013, respectively.
As of June 30, 2014, our long-term borrowed funds include $350 million of fixed rate subordinated debt held by external parties and $1.3 billion of subordinated debt held by the RBS Group. On August 1, 2014, we issued an additional $333 million of subordinated debt to the RBS Group. Subject to regulatory approval and assuming completion of this offering, we plan to continue our strategy of capital optimization by issuing to RBS $334 million of preferred stock and concurrently repurchasing $334 million of shares of our common stock from RBS. In addition we intend to repurchase approximately $500 million of shares of our common stock and $250 million of shares of our common stock in 2015 and 2016, respectively, with proceeds from the issuance of subordinated debt or another lesser form of capital. For additional information, see “Our Relationship with the RBS Group and Certain Other Related Party Transactions.”
Derivatives
Historically, we have used pay-fixed interest rate swaps to synthetically lengthen liabilities, offsetting duration in fixed-rate assets. With our material prepayment of fixed-rate mortgages and home equity loans since 2008, these swaps were no longer needed and have been terminated or allowed to run off, resulting in a reduction in the notional balance of these swaps to $1.0 billion as of June 30, 2014 from $1.5 billion as of December 31, 2013.
We also use receive-fixed swaps to minimize the exposure to variability in the interest cash flows on our floating rate assets. As of June 30, 2014, a notional amount of $4.0 billion receive-fixed swaps had been executed. The assets and liabilities recorded for derivatives designated as hedges reflect the fair value of these hedge instruments.
We also sell interest rate swaps and foreign exchange forwards to commercial customers. Offsetting swap and forward agreements are simultaneously transacted to minimize our market risk associated with the customer derivative products. The assets and liabilities recorded for derivatives not designated as hedges reflect the fair value of these transactions.
75
Table of Contents
Key Performance Metrics and Non-GAAP Financial Measures
We consider various measures when evaluating our performance and making day-to-day operating decisions, as well as evaluating capital utilization and adequacy, including:
| • | Return on average common equity, which we define as net income (loss) divided by average common equity; |
| • | Return on average tangible common equity, which we define as net income (loss) divided by average common equity excluding average goodwill, net of the deferred tax liability, and average other intangibles; |
| • | Return on average total assets, which we define as net income (loss) divided by average total assets; |
| • | Return on average total tangible assets, which we define as net income (loss) divided by average total assets excluding average goodwill, net of the deferred tax liability, and average other intangibles; |
| • | Efficiency ratio, which we define as the ratio of our total noninterest expense to the sum of net interest income and total noninterest income. We measure our efficiency ratio to evaluate the efficiency of our operations as it helps us monitor how costs are changing compared to our income. A decrease in our efficiency ratio represents improvement; and |
| • | Net interest margin, which we calculate by dividing annualized net interest income for the period by average total interest-earning assets, is a key measure that we use to evaluate our net interest income. |
Certain of the above financial measures, including return on average tangible common equity, return on average total tangible assets and the efficiency ratio are not recognized under GAAP. We also present noninterest expense, net income (loss), return on average total tangible assets, return on average tangible common equity, return on average common equity, return on average total assets, and efficiency ratio, net of the $4.4 billion pretax ($4.1 billion after tax) goodwill impairment we incurred for the six months ended June 30, 2013. In addition, in the net income (loss) table, we present net income (loss) and return on average tangible common equity, net of goodwill impairment, restructuring charges and special items for the six months ended June 30, 2014, and 2013. We believe these measures provide useful information to investors because these are among the measures used by our management team to evaluate our operating performance and make day-to-day operating decisions. In addition, we believe goodwill impairment in any period does not reflect the operational performance of the business in that period and, accordingly, it is useful to consider these line items with and without goodwill impairment. This presentation also increases comparability of period-to-period results.
We also consider pro forma capital ratios defined by banking regulators but not effective at each period end to be non-GAAP financial measures. Since analysts and banking regulators may assess our capital adequacy using these pro forma ratios, we believe they are useful to provide investors the ability to assess its capital adequacy on the same basis. Other companies may use similarly titled non-GAAP financial measures that are calculated differently from the way we calculate such measures. Accordingly, our non-GAAP financial measures may not be comparable to similar measures used by other companies.
76
Table of Contents
The following table reconciles non-GAAP financial measures to GAAP:
| As of and for the Six Months Ended June 30, |
As of and for the Year Ended December 31, | |||||||||||||||||||||||||||||
| Ref. |
2014 | 2013 | 2013 | 2012 | 2011 | 2010 | 2009 | |||||||||||||||||||||||
| (dollars in millions, except per share amounts) | ||||||||||||||||||||||||||||||
| Noninterest expense, excluding goodwill impairment: |
||||||||||||||||||||||||||||||
| Noninterest expense (GAAP) |
A | $ | 1,758 | $ | 6,073 | $ | 7,679 | $ | 3,457 | $ | 3,371 | $ | 3,483 | $ | 3,495 | |||||||||||||||
| Less: Goodwill impairment (GAAP) |
— | 4,435 | 4,435 | — | — | — | — | |||||||||||||||||||||||
|
|
|
|
|
|
|
|
|
|
|
|
|
|
|
|||||||||||||||||
| Noninterest expense, excluding goodwill impairment (non-GAAP) |
B | $ | 1,758 | $ | 1,638 | $ | 3,244 | $ | 3,457 | $ | 3,371 | $ | 3,483 | $ | 3,495 | |||||||||||||||
|
|
|
|
|
|
|
|
|
|
|
|
|
|
|
|||||||||||||||||
| Net income (loss), excluding goodwill impairment: |
||||||||||||||||||||||||||||||
| Net income (loss) (GAAP) |
C | $ | 479 | $ | (3,722 | ) | $ | (3,426 | ) | $ | 643 | $ | 506 | $ | 11 | $ | (740 | ) | ||||||||||||
| Add: Goodwill impairment, net of income tax benefit (GAAP) |
— | 4,080 | 4,080 | — | — | — | — | |||||||||||||||||||||||
|
|
|
|
|
|
|
|
|
|
|
|
|
|
|
|||||||||||||||||
| Net income (loss), excluding goodwill impairment (non-GAAP) |
D | $ | 479 | $ | 358 | $ | 654 | $ | 643 | $ | 506 | $ | 11 | $ | (740 | ) | ||||||||||||||
|
|
|
|
|
|
|
|
|
|
|
|
|
|
|
|||||||||||||||||
| Return on average common equity, excluding goodwill impairment: |
||||||||||||||||||||||||||||||
| Average common equity (GAAP) |
E | $ | 19,489 | $ | 24,212 | $ | 21,834 | $ | 23,938 | $ | 23,137 | $ | 22,425 | $ | 19,604 | |||||||||||||||
| Return on average common equity, excluding goodwill impairment (non-GAAP)(1) |
D/E | 4.96 | % | 2.98 | % | 3.00 | % | 2.69 | % | 2.19 | % | 0.05 | % | (3.77 | )% | |||||||||||||||
| Return on average tangible common equity, excluding goodwill impairment: |
||||||||||||||||||||||||||||||
| Average common equity (GAAP) |
E | $ | 19,489 | $ | 24,212 | $ | 21,834 | $ | 23,938 | $ | 23,137 | $ | 22,425 | $ | 19,604 | |||||||||||||||
| Less: Average goodwill (GAAP) |
6,876 | 11,287 | 9,063 | 11,311 | 11,311 | 11,674 | 11,709 | |||||||||||||||||||||||
| Less: Average other intangibles (GAAP) |
7 | 10 | 9 | 12 | 15 | 19 | 205 | |||||||||||||||||||||||
| Add: Average deferred tax liabilities related to goodwill (GAAP) |
360 | 538 | 459 | 617 | 295 | 27 | 52 | |||||||||||||||||||||||
|
|
|
|
|
|
|
|
|
|
|
|
|
|
|
|||||||||||||||||
| Average tangible common equity (non-GAAP) |
F | $ | 12,966 | $ | 13,453 | $ | 13,221 | $ | 13,232 | $ | 12,106 | $ | 10,759 | $ | 7,742 | |||||||||||||||
|
|
|
|
|
|
|
|
|
|
|
|
|
|
|
|||||||||||||||||
| Return on average tangible common equity (non-GAAP)(1) |
C/F | 7.45 | % | (24.96 | )% | (25.91 | )% | 4.86 | % | 4.18 | % | 0.11 | % | (9.56 | )% | |||||||||||||||
| Return on average tangible common equity, excluding goodwill impairment (non-GAAP)(1) |
D/F | 7.45 | % | 5.37 | % | 4.95 | % | 4.86 | % | 4.18 | % | 0.11 | % | (9.56 | )% | |||||||||||||||
77
Table of Contents
| As of and for the Six Months Ended June 30, |
As of and for the Year Ended December 31, | |||||||||||||||||||||||||||||
| Ref. |
2014 | 2013 | 2013 | 2012 | 2011 | 2010 | 2009 | |||||||||||||||||||||||
| (dollars in millions, except per share amounts) | ||||||||||||||||||||||||||||||
| Return on average total assets, excluding goodwill impairment: |
||||||||||||||||||||||||||||||
| Average total assets (GAAP) |
G | $ | 125,535 | $ | 122,875 | $ | 120,866 | $ | 127,666 | $ | 128,344 | $ | 138,253 | $ | 156,272 | |||||||||||||||
| Return on average total assets, excluding goodwill impairment (non-GAAP)(1) |
D/G | 0.77 | % | 0.59 | % | 0.54 | % | 0.50 | % | 0.39 | % | 0.01 | % | (0.47 | )% | |||||||||||||||
| Return on average total tangible assets, excluding goodwill impairment: |
||||||||||||||||||||||||||||||
| Average total assets (GAAP) |
G | $ | 125,535 | $ | 122,875 | $ | 120,866 | $ | 127,666 | $ | 128,344 | $ | 138,253 | $ | 156,272 | |||||||||||||||
| Less: Average goodwill (GAAP) |
6,876 | 11,287 | 9,063 | 11,311 | 11,311 | 11,674 | 11,709 | |||||||||||||||||||||||
| Less: Average other intangibles (GAAP) |
7 | 10 | 9 | 12 | 15 | 19 | 205 | |||||||||||||||||||||||
| Add: Average deferred tax liabilities related to goodwill (GAAP) |
360 | 538 | 459 | 617 | 295 | 27 | 52 | |||||||||||||||||||||||
|
|
|
|
|
|
|
|
|
|
|
|
|
|
|
|||||||||||||||||
| Average tangible assets (non-GAAP) |
H | $ | 119,012 | $ | 112,116 | $ | 112,253 | $ | 116,960 | $ | 117,313 | $ | 126,587 | $ | 144,410 | |||||||||||||||
|
|
|
|
|
|
|
|
|
|
|
|
|
|
|
|||||||||||||||||
| Return on average total tangible assets (non-GAAP)(1) |
C/H | 0.81 | % | (2.99 | )% | (3.05 | )% | 0.55 | % | 0.43 | % | 0.01 | % | (0.51 | )% | |||||||||||||||
| Return on average total tangible assets, excluding goodwill impairment (non-GAAP)(1) |
D/H | 0.81 | % | 0.64 | % | 0.58 | % | 0.55 | % | 0.43 | % | 0.01 | % | (0.51 | )% | |||||||||||||||
| Efficiency ratio, excluding goodwill impairment: |
||||||||||||||||||||||||||||||
| Net interest income (GAAP) |
$ | 1,641 | $ | 1,509 | $ | 3,058 | $ | 3,227 | $ | 3,320 | $ | 3,345 | $ | 3,419 | ||||||||||||||||
| Noninterest income (GAAP) |
998 | 870 | 1,632 | 1,667 | 1,711 | 1,733 | 1,666 | |||||||||||||||||||||||
|
|
|
|
|
|
|
|
|
|
|
|
|
|
|
|||||||||||||||||
| Total revenue (GAAP) |
I | $ | 2,639 | $ | 2,379 | $ | 4,690 | $ | 4,894 | $ | 5,031 | $ | 5,078 | $ | 5,085 | |||||||||||||||
|
|
|
|
|
|
|
|
|
|
|
|
|
|
|
|||||||||||||||||
| Efficiency ratio (non-GAAP) |
A/I | 66.58 | % | 255.24 | % | 163.73 | % | 70.64 | % | 67.00 | % | 68.59 | % | 68.73 | % | |||||||||||||||
| Efficiency ratio, excluding goodwill impairment (non-GAAP) |
B/I | 66.58 | % | 68.80 | % | 69.17 | % | 70.64 | % | 67.00 | % | 68.59 | % | 68.73 | % | |||||||||||||||
| Net income (loss) per average common share—basic and diluted, excluding goodwill impairment: |
||||||||||||||||||||||||||||||
| Average common shares outstanding—basic and diluted |
L | 559,998,324 | 559,998,324 | 559,998,324 | 559,998,324 | 559,998,324 | 559,998,324 | 559,998,324 | ||||||||||||||||||||||
| Net income (loss) per average common share—basic and diluted, excluding goodwill impairment (unaudited) |
D/L | $ | 0.86 | $ | 0.64 | $ | 1.17 | $ | 1.15 | $ | 0.90 | $ | 0.02 | $ | (1.32 | ) | ||||||||||||||
78
Table of Contents
| As of and for the Six Months Ended June 30, |
As of and for the Year Ended December 31, | |||||||||||||||||||
| Ref. |
2014 | 2013 | 2013 | 2012 | 2011 | 2010 | 2009 | |||||||||||||
| (dollars in millions, except per share amounts) | ||||||||||||||||||||
| Pro forma Basel III common equity Tier 1 capital ratio: |
||||||||||||||||||||
| Tier 1 common capital (regulatory) |
$ | 13,448 | $ | 13,301 | ||||||||||||||||
| Less: Change in DTA and other threshold deductions (GAAP) |
(7 | ) | 6 | |||||||||||||||||
|
|
|
|
|
|||||||||||||||||
| Basel III common equity Tier 1 (non-GAAP) |
J | $ | 13,455 | $ | 13,295 | |||||||||||||||
|
|
|
|
|
|||||||||||||||||
| Risk-weighted assets (regulatory) |
$ | 101,397 | $ | 98,634 | ||||||||||||||||
| Add: Net change in credit and other risk-weighted assets (regulatory) |
2,383 | 2,687 | ||||||||||||||||||
|
|
|
|
|
|||||||||||||||||
| Basel III risk-weighted assets (non-GAAP) |
K | $ | 103,780 | $ | 101,321 | |||||||||||||||
|
|
|
|
|
|||||||||||||||||
| Pro forma Basel III common equity Tier 1 capital ratio (non-GAAP) |
J/K | 13.0 | % | 13.1 | % | |||||||||||||||
| Pro forma Basel III Tier 1 capital ratio: |
||||||||||||||||||||
| Basel III common equity Tier 1 (non-GAAP) |
J | $ | 13,455 | $ | 13,295 | |||||||||||||||
| Add: Trust preferred and minority interest (GAAP) |
— | — | ||||||||||||||||||
|
|
|
|
|
|||||||||||||||||
| Basel III Tier 1 capital (non-GAAP) |
N | $ | 13,455 | $ | 13,295 | |||||||||||||||
|
|
|
|
|
|||||||||||||||||
| Pro forma Basel III Tier 1 capital ratio (non-GAAP) |
N/K | 13.0 | % | 13.1 | % | |||||||||||||||
| Pro forma Basel III total capital ratio: |
||||||||||||||||||||
| Total Tier 2 common capital (regulatory) |
$ | 2,952 | $ | 2,584 | ||||||||||||||||
| Add: Excess allowance for loan and lease losses (regulatory) |
7 | 27 | ||||||||||||||||||
| Less: Reserves exceeding 1.25% of risk-weighted assets (regulatory) |
— | — | ||||||||||||||||||
|
|
|
|
|
|||||||||||||||||
| Basel III common equity Tier 2 (non-GAAP) |
O | $ | 2,959 | $ | 2,611 | |||||||||||||||
|
|
|
|
|
|||||||||||||||||
| Pro forma Basel III total capital (non-GAAP) |
O+J | $ | 16,414 | $ | 15,906 | |||||||||||||||
|
|
|
|
|
|||||||||||||||||
| Pro forma Basel III total capital ratio (non-GAAP) |
(O+J)/K | 15.8 | % | 15.7 | % | |||||||||||||||
| Pro forma Basel III leverage ratio: |
||||||||||||||||||||
| Quarterly average assets (GAAP) |
$ | 127,526 | $ | 120,705 | ||||||||||||||||
| Less: Goodwill (GAAP) |
6,876 | 6,876 | ||||||||||||||||||
79
Table of Contents
| As of and for the Six Months Ended June 30, |
As of and for the Year Ended December 31, | |||||||||||||||||||
| Ref. |
2014 | 2013 | 2013 | 2012 | 2011 | 2010 | 2009 | |||||||||||||
| (dollars in millions, except per share amounts) | ||||||||||||||||||||
| Restricted core capital elements (regulatory)(2) |
13 | 17 | ||||||||||||||||||
| Add: Deferred tax liability related to goodwill (GAAP) |
382 | 351 | ||||||||||||||||||
| Other comprehensive income pension adjustments (GAAP) |
257 | 259 | ||||||||||||||||||
|
|
|
|
|
|||||||||||||||||
| Basel III adjusted average assets (non-GAAP) |
P | $ | 121,276 | $ | 114,422 | |||||||||||||||
|
|
|
|
|
|||||||||||||||||
| Pro forma leverage ratio (non-GAAP) |
P/J | 11.1 | % | 11.6 | % | |||||||||||||||
| (1) | Ratios for the periods ended June 30, 2014 and 2013 are presented on an annualized basis. |
| (2) | Restricted core capital elements include other intangibles, intangible mortgage servicing assets, and disallowed mortgage servicing assets. |
| As of and for the Six Months Ended June 30, |
||||||||||||
| Ref. | 2014 | 2013 | ||||||||||
| (dollars in millions) | ||||||||||||
| Net income (loss), excluding goodwill impairment, restructuring charges and special items: |
||||||||||||
| Net income (loss) (GAAP) |
A | $ | 479 | $ | (3,722 | ) | ||||||
| Add: Goodwill impairment (GAAP) |
— | 4,080 | ||||||||||
| Add: Restructuring charges (GAAP) |
64 | — | ||||||||||
| Special items: |
||||||||||||
| Less: Net gain on the Chicago Divestiture (GAAP) |
180 | — | ||||||||||
| Add: Regulatory charges (GAAP) |
3 | — | ||||||||||
| Separation expenses (GAAP) |
5 | — | ||||||||||
|
|
|
|
|
|||||||||
| Net income (loss), excluding goodwill impairment, restructuring charges and special items (non-GAAP) |
B | $ | 371 | $ | 358 | |||||||
|
|
|
|
|
|||||||||
| Return on average tangible common equity, excluding goodwill impairment, restructuring charges and special items: |
||||||||||||
| Average common equity (GAAP) |
C | $ | 19,489 | $ | 24,212 | |||||||
| Less: Average goodwill (GAAP) |
6,876 | 11,287 | ||||||||||
| Less: Average other intangibles (GAAP) |
7 | 10 | ||||||||||
| Add: Average deferred tax liabilities related to goodwill (GAAP) |
360 | 538 | ||||||||||
|
|
|
|
|
|||||||||
| Average tangible common equity (non-GAAP) |
D | $ | 12,966 | $ | 13,453 | |||||||
|
|
|
|
|
|||||||||
| Return on average tangible common equity, excluding goodwill impairment, restructuring charges and special items (non-GAAP)(1) |
B/D | 5.77 | % | 5.37 | % | |||||||
| (1) | Ratios for the periods ended June 30, 2014 and 2013 are presented on an annualized basis. |
80
Table of Contents
| As of and for the Six Months Ended June 30, | ||||||||||||||||||||||||||||||||||
| 2014 | 2013 | |||||||||||||||||||||||||||||||||
| Ref. | Consumer Banking |
Commercial Banking |
Other | Consolidated | Consumer Banking |
Commercial Banking |
Other | Consolidated | ||||||||||||||||||||||||||
| (dollars in millions) | ||||||||||||||||||||||||||||||||||
| Net income (loss), excluding goodwill impairment: |
||||||||||||||||||||||||||||||||||
| Net income (loss) (GAAP) |
A | $ | 76 | $ | 282 | $ | 121 | $ | 479 | $ | 140 | $ | 264 | $ | (4,126 | ) | $ | (3,722 | ) | |||||||||||||||
| Add: Goodwill impairment, net of income tax benefit (GAAP) |
— | — | — | — | — | — | 4,080 | 4,080 | ||||||||||||||||||||||||||
|
|
|
|
|
|
|
|
|
|
|
|
|
|
|
|
|
|||||||||||||||||||
| Net income (loss), excluding goodwill impairment (non-GAAP) |
B | $ | 76 | $ | 282 | $ | 121 | $ | 479 | $ | 140 | $ | 264 | $ | (46 | ) | $ | 358 | ||||||||||||||||
|
|
|
|
|
|
|
|
|
|
|
|
|
|
|
|
|
|||||||||||||||||||
| Efficiency ratio: |
||||||||||||||||||||||||||||||||||
| Total revenue (GAAP) |
C | $ | 1,538 | $ | 734 | $ | 367 | $ | 2,639 | $ | 1,634 | $ | 699 | $ | 46 | $ | 2,379 | |||||||||||||||||
| Noninterest expense (GAAP) |
D | 1,293 | 310 | 155 | 1,758 | 1,262 | 315 | 4,496 | 6,073 | |||||||||||||||||||||||||
| Less: Goodwill impairment (GAAP) |
— | — | — | — | — | — | 4,435 | 4,435 | ||||||||||||||||||||||||||
|
|
|
|
|
|
|
|
|
|
|
|
|
|
|
|
|
|||||||||||||||||||
| Noninterest expense, excluding goodwill impairment (non- GAAP) |
E | $ | 1,293 | $ | 310 | $ | 155 | $ | 1,758 | $ | 1,262 | $ | 315 | $ | 61 | $ | 1,638 | |||||||||||||||||
|
|
|
|
|
|
|
|
|
|
|
|
|
|
|
|
|
|||||||||||||||||||
| Efficiency ratio (non-GAAP) |
D/C | 84.00 | % | 42.25 | % | NM | 66.58 | % | 77.27 | % | 45.12 | % | NM | 255.24 | % | |||||||||||||||||||
| Efficiency ratio, excluding goodwill impairment (non-GAAP) |
E/C | 84.00 | % | 42.25 | % | NM | 66.58 | % | 77.27 | % | 45.12 | % | NM | 68.80 | % | |||||||||||||||||||
| Return on average total tangible assets: |
||||||||||||||||||||||||||||||||||
| Average total assets (GAAP) |
$ | 48,085 | $ | 37,491 | $ | 39,959 | $ | 125,535 | $ | 46,737 | $ | 34,897 | $ | 41,241 | $ | 122,875 | ||||||||||||||||||
| Less: Average goodwill (GAAP) |
— | — | 6,876 | 6,876 | — | — | 11,287 | 11,287 | ||||||||||||||||||||||||||
| Less: Average other intangibles (GAAP) |
— | — | 7 | 7 | — | — | 10 | 10 | ||||||||||||||||||||||||||
| Add: Average deferred tax liabilities related to goodwill (GAAP) |
— | — | 360 | 360 | — | — | 538 | 538 | ||||||||||||||||||||||||||
|
|
|
|
|
|
|
|
|
|
|
|
|
|
|
|
|
|||||||||||||||||||
| Average total tangible assets (non-GAAP) |
F | $ | 48,085 | $ | 37,491 | $ | 33,436 | $ | 119,012 | $ | 46,737 | $ | 34,897 | $ | 30,482 | $ | 112,116 | |||||||||||||||||
|
|
|
|
|
|
|
|
|
|
|
|
|
|
|
|
|
|||||||||||||||||||
| Return on average total tangible assets (non-GAAP)(2) |
A/F | 0.32 | % | 1.52 | % | NM | 0.81 | % | 0.60 | % | 1.53 | % | NM | (2.99 | )% | |||||||||||||||||||
| Return on average total tangible assets, excluding goodwill impairment (non-GAAP)(2) |
B/F | 0.32 | % | 1.52 | % | NM | 0.81 | % | 0.60 | % | 1.53 | % | NM | 0.64 | % | |||||||||||||||||||
| Return on average tangible common equity: |
||||||||||||||||||||||||||||||||||
| Average common equity (GAAP)(1) |
$ | 4,609 | $ | 4,076 | $ | 10,804 | $ | 19,489 | $ | 4,364 | $ | 3,878 | $ | 15,970 | $ | 24,212 | ||||||||||||||||||
| Less: Average goodwill (GAAP) |
— | — | 6,876 | 6,876 | — | — | 11,287 | 11,287 | ||||||||||||||||||||||||||
| Less: Average other intangibles (GAAP) |
— | — | 7 | 7 | — | — | 10 | 10 | ||||||||||||||||||||||||||
| Add: Average deferred tax liabilities related to goodwill (GAAP) |
— | — | 360 | 360 | — | — | 538 | 538 | ||||||||||||||||||||||||||
|
|
|
|
|
|
|
|
|
|
|
|
|
|
|
|
|
|||||||||||||||||||
| Average tangible common equity (non-GAAP)(1) |
G | $ | 4,609 | $ | 4,076 | $ | 4,281 | $ | 12,966 | $ | 4,364 | $ | 3,878 | $ | 5,211 | $ | 13,453 | |||||||||||||||||
|
|
|
|
|
|
|
|
|
|
|
|
|
|
|
|
|
|||||||||||||||||||
| Return on average tangible common equity (non-GAAP)(1)(2) |
A/G | 3.35 | % | 13.97 | % | NM | 7.45 | % | 6.46 | % | 13.76 | % | NM | (24.96 | )% | |||||||||||||||||||
| Return on average tangible common equity, excluding goodwill impairment (non-GAAP)(1)(2) |
B/G | 3.35 | % | 13.97 | % | NM | 7.45 | % | 6.46 | % | 13.76 | % | NM | 5.37 | % | |||||||||||||||||||
| (1) | Operating segments are allocated capital on a risk-adjusted basis considering economic and regulatory capital requirements. We approximate that regulatory capital is equivalent to a sustainable target level for common equity Tier 1 and then allocate that approximation to the segments based on economic capital. |
| (2) | Ratios are presented on an annualized basis. |
81
Table of Contents
| As of and for the Year Ended December 31, | ||||||||||||||||||||||||||||||||||||||||||||||||||
| 2013 | 2012 | 2011 | ||||||||||||||||||||||||||||||||||||||||||||||||
| Ref. | Consumer Banking |
Commercial Banking |
Other | Consolidated | Consumer Banking |
Commercial Banking |
Other | Consolidated | Consumer Banking |
Commercial Banking |
Other | Consolidated | ||||||||||||||||||||||||||||||||||||||
| (dollars in millions) | ||||||||||||||||||||||||||||||||||||||||||||||||||
| Net income (loss), excluding goodwill impairment: |
||||||||||||||||||||||||||||||||||||||||||||||||||
| Net income (loss) (GAAP) |
A | $ | 242 | $ | 514 | $ | (4,182 | ) | $ | (3,426 | ) | $ | 185 | $ | 453 | $ | 5 | $ | 643 | $ | 265 | $ | 373 | $ | (132 | ) | $ | 506 | ||||||||||||||||||||||
| Add: Goodwill impairment, net of income tax benefit (GAAP) |
— | — | 4,080 | 4,080 | — | — | — | — | — | — | — | — | ||||||||||||||||||||||||||||||||||||||
|
|
|
|
|
|
|
|
|
|
|
|
|
|
|
|
|
|
|
|
|
|
|
|
|
|||||||||||||||||||||||||||
| Net income (loss), excluding goodwill impairment (non-GAAP) |
B | $ | 242 | $ | 514 | $ | (102 | ) | $ | 654 | $ | 185 | $ | 453 | $ | 5 | $ | 643 | $ | 265 | $ | 373 | $ | (132 | ) | $ | 506 | |||||||||||||||||||||||
|
|
|
|
|
|
|
|
|
|
|
|
|
|
|
|
|
|
|
|
|
|
|
|
|
|||||||||||||||||||||||||||
| Efficiency ratio: |
||||||||||||||||||||||||||||||||||||||||||||||||||
| Total revenue (GAAP) |
C | $ | 3,201 | $ | 1,420 | $ | 69 | $ | 4,690 | $ | 3,384 | $ | 1,385 | $ | 125 | $ | 4,894 | $ | 3,332 | $ | 1,272 | $ | 427 | $ | 5,031 | |||||||||||||||||||||||||
| Noninterest expense (GAAP) |
D | 2,522 | 635 | 4,522 | 7,679 | 2,691 | 625 | 141 | 3,457 | 2,524 | 605 | 242 | 3,371 | |||||||||||||||||||||||||||||||||||||
| Less: Goodwill impairment (GAAP) |
— | — | 4,435 | 4,435 | — | — | — | — | — | — | — | — | ||||||||||||||||||||||||||||||||||||||
|
|
|
|
|
|
|
|
|
|
|
|
|
|
|
|
|
|
|
|
|
|
|
|
|
|||||||||||||||||||||||||||
| Noninterest expense, excluding goodwill impairment (non-GAAP) |
E | $ | 2,522 | $ | 635 | $ | 87 | $ | 3,244 | $ | 2,691 | $ | 625 | $ | 141 | $ | 3,457 | $ | 2,524 | $ | 605 | $ | 242 | $ | 3,371 | |||||||||||||||||||||||||
|
|
|
|
|
|
|
|
|
|
|
|
|
|
|
|
|
|
|
|
|
|
|
|
|
|||||||||||||||||||||||||||
| Efficiency ratio (non-GAAP) |
D/C | 78.76 | % | 44.66 | % | NM | 163.73 | % | 79.45 | % | 45.22 | % | NM | 70.64 | % | 75.78 | % | 47.55 | % | NM | 67.00 | % | ||||||||||||||||||||||||||||
| Efficiency ratio, excluding goodwill impairment (non-GAAP) |
E/C | 78.76 | % | 44.66 | % | NM | 69.17 | % | 79.45 | % | 45.22 | % | NM | 70.64 | % | 75.78 | % | 47.55 | % | NM | 67.00 | % | ||||||||||||||||||||||||||||
| Return on average total tangible assets: |
||||||||||||||||||||||||||||||||||||||||||||||||||
| Average total assets (GAAP) |
$ | 46,465 | $ | 35,229 | $ | 39,172 | $ | 120,866 | $ | 47,824 | $ | 33,474 | $ | 46,368 | $ | 127,666 | $ | 46,071 | $ | 29,800 | $ | 52,473 | $ | 128,344 | ||||||||||||||||||||||||||
| Less: Average goodwill (GAAP) |
— | — | 9,063 | 9,063 | — | — | 11,311 | 11,311 | — | — | 11,311 | 11,311 | ||||||||||||||||||||||||||||||||||||||
| Less: Average other intangibles (GAAP) |
— | — | 9 | 9 | — | — | 12 | 12 | — | — | 15 | 15 | ||||||||||||||||||||||||||||||||||||||
| Add: Average deferred tax liabilities related to goodwill (GAAP) |
— | — | 459 | 459 | — | — | 617 | 617 | — | — | 295 | 295 | ||||||||||||||||||||||||||||||||||||||
|
|
|
|
|
|
|
|
|
|
|
|
|
|
|
|
|
|
|
|
|
|
|
|
|
|||||||||||||||||||||||||||
| Average total tangible assets (non-GAAP) |
F | $ | 46,465 | $ | 35,229 | $ | 30,559 | $ | 112,253 | $ | 47,824 | $ | 33,474 | $ | 35,662 | $ | 116,960 | $ | 46,071 | $ | 29,800 | $ | 41,442 | $ | 117,313 | |||||||||||||||||||||||||
|
|
|
|
|
|
|
|
|
|
|
|
|
|
|
|
|
|
|
|
|
|
|
|
|
|||||||||||||||||||||||||||
| Return on average total tangible assets (non-GAAP) |
A/F | 0.52 | % | 1.46 | % | NM | (3.05 | )% | 0.39 | % | 1.35 | % | NM | 0.55 | % | 0.57 | % | 1.25 | % | NM | 0.43 | % | ||||||||||||||||||||||||||||
| Return on average total tangible assets, excluding goodwill impairment (non-GAAP) |
B/F | 0.52 | % | 1.46 | % | NM | 0.58 | % | 0.39 | % | 1.35 | % | NM | 0.55 | % | 0.57 | % | 1.25 | % | NM | 0.43 | % | ||||||||||||||||||||||||||||
| Return on average tangible common equity: |
||||||||||||||||||||||||||||||||||||||||||||||||||
| Average common equity (GAAP)(1) |
$ | 4,395 | $ | 3,897 | $ | 13,542 | $ | 21,834 | $ | 3,813 | $ | 3,626 | $ | 16,499 | $ | 23,938 | $ | 3,423 | $ | 3,452 | $ | 16,262 | $ | 23,137 | ||||||||||||||||||||||||||
| Less: Average goodwill (GAAP) |
— | — | 9,063 | 9,063 | — | — | 11,311 | 11,311 | — | — | 11,311 | 11,311 | ||||||||||||||||||||||||||||||||||||||
| Less: Average other intangibles (GAAP) |
— | — | 9 | 9 | — | — | 12 | 12 | — | — | 15 | 15 | ||||||||||||||||||||||||||||||||||||||
| Add: Average deferred tax liabilities related to goodwill (GAAP) |
— | — | 459 | 459 | — | — | 617 | 617 | — | — | 295 | 295 | ||||||||||||||||||||||||||||||||||||||
|
|
|
|
|
|
|
|
|
|
|
|
|
|
|
|
|
|
|
|
|
|
|
|
|
|||||||||||||||||||||||||||
| Average tangible common equity (non-GAAP)(1) |
G | $ | 4,395 | $ | 3,897 | $ | 4,929 | $ | 13,221 | $ | 3,813 | $ | 3,626 | $ | 5,793 | $ | 13,232 | $ | 3,423 | $ | 3,452 | $ | 5,231 | $ | 12,106 | |||||||||||||||||||||||||
|
|
|
|
|
|
|
|
|
|
|
|
|
|
|
|
|
|
|
|
|
|
|
|
|
|||||||||||||||||||||||||||
| Return on average tangible common equity (non-GAAP)(1) |
A/G | 5.48 | % | 13.20 | % | NM | (25.91 | )% | 4.89 | % | 12.45 | % | NM | 4.86 | % | 7.71 | % | 10.81 | % | NM | 4.18 | % | ||||||||||||||||||||||||||||
| Return on average tangible common equity, excluding goodwill impairment (non-GAAP)(1) |
B/G | 5.48 | % | 13.20 | % | NM | 4.95 | % | 4.89 | % | 12.45 | % | NM | 4.86 | % | 7.71 | % | 10.81 | % | NM | 4.18 | % | ||||||||||||||||||||||||||||
| (1) | Operating segments are allocated capital on a risk-adjusted basis considering economic and regulatory capital requirements. We approximate that regulatory capital is equivalent to a sustainable target level for common equity Tier 1 and then allocate that approximation to the segments based on economic capital. |
82
Table of Contents
Results of Operations—Six Months Ended June 30, 2014 Compared with Six Months Ended June 30, 2013
Highlights
For the six months ended June 30, 2014:
| • | net income increased $4.2 billion to $479 million compared to a $3.7 billion loss for the six months ended June 30, 2013; |
| • | net income for the six months ended June 30, 2014 was $479 million, and included a $180 million after tax gain related to the Chicago Divestiture and $72 million after tax in restructuring charges and special noninterest expense items largely related to our separation from the RBS Group and ongoing efforts to improve processes and enhance efficiencies across the organization. 2013 included a goodwill impairment charge of $4.1 billion after tax. Excluding the Chicago gain, restructuring charges and special noninterest expense items and the goodwill impairment charge, net income increased $13 million or 4% to $371 million compared to $358 million for the same period in 2013; |
| • | net interest income of $1.6 billion increased $132 million, or 9%, compared to $1.5 billion for the six months ended June 30, 2013, largely reflecting the benefit of lower hedging costs, growth in loans and the investment securities portfolio and a reduction in deposit costs as we continued to reduce our reliance on higher cost certificates of deposit and money market funds. These results were partially offset by the impact of declining loan yields given the relatively persistent low-rate environment; |
| • | net interest margin was 2.88% compared to 2.83% for the six months ended June 30, 2013, driven by the benefit of lower hedging costs and lower deposit costs, partially offset by decreased yields on commercial and retail loans and increased long-term borrowing costs largely associated with increased subordinated debt; |
| • | noninterest income for the six months ended June 30, 2014 included a $288 million pretax gain related to the Chicago Divestiture and increased $128 million, or 15%, to $998 million, compared to $870 million for the six months ended June 30, 2013. Excluding the gain, noninterest income decreased by $160 million, or 18%, as decreases in mortgage banking fees, securities gains, net, and service charges and fees were partially offset by growth in trust and investment services fees and capital markets fees. No securities gains are expected for the remainder of 2014; |
| • | noninterest expense of $1.8 billion decreased $4.3 billion, or 71%, compared to $6.1 billion for the six months ended June 30, 2013 driven by a $4.4 billion goodwill impairment charge incurred in the six months ended June 30, 2013, offset by $115 million of restructuring charges and special items incurred in the six months ended June 30, 2014, which are largely related to our separation from the RBS Group, ongoing efforts to improve processes and enhance efficiencies across the organization, including certain regulatory and compliance programs, and special expense items related to the Chicago Divestiture; |
| • | provision for credit losses totaled $170 million for the six months ended June 30, 2014, down $32 million, or 16%, from $202 million compared to the same period in 2013. Results for the six months ended June 30, 2014 included a net provision build of $15 million compared with a $53 million release in the six months ended June 30, 2013; |
| • | our return on average tangible common equity improved to 7.45% from (24.96%) for the six months ended June 30, 2013. Excluding the impact of the goodwill impairment, restructuring charges and special items mentioned above, our return on average tangible common equity improved to 5.77% from 5.37% for the six months ended June 30, 2013; |
| • | average loans and leases of $87.2 billion increased $1.5 billion, or 2%, from $85.7 billion as of June 30, 2013, as commercial loan growth, the purchase of residential mortgages and auto loans more than offset the decrease in home equity loans and lines of credit; |
83
Table of Contents
| • | average interest-bearing deposits of $61.6 billion decreased $7.0 billion, or 10%, from $68.6 billion as of June 30, 2013, driven by the effect of the sale of $4.0 billion of interest-bearing deposits in the Chicago Divestiture, as well as attrition of higher cost money market and term deposits; |
| • | capital ratios continued to be well above regulatory requirements: our total capital ratio increased slightly to 16.2% from 16.1% as of December 31, 2013, and our Tier 1 capital ratio decreased slightly to 13.3% from 13.5% as of December 31, 2013 as a result of our plan to rebalance our capital structure; |
| • | net charge-offs of $155 million declined $100 million, or 39%, from $255 million for the six months ended June 30, 2013 and the allowance for credit losses totaled $1.3 billion as of June 30, 2014, up $15 million, or 1%, from December 31, 2013; and |
| • | net income (loss) per average common share, basic and diluted, was $0.86 compared to ($6.65) for the six months ended June 30, 2013, reflecting a 165,582-for-1 forward stock split effective on August 22, 2014. Net income per average common share, basic and diluted, excluding goodwill impairment, was $0.86 for the six months ended June 30, 2014 compared to $0.64 for the six months ended June 30, 2013, reflecting a 165,582-for-1 forward stock split effective on August 22, 2014. |
84
Table of Contents
Net Income (Loss)
We reported net income of $479 million for the six months ended June 30, 2014, after recording a $180 million after tax gain related to the Chicago Divestiture and $72 million after tax of restructuring charges and special items related to our separation from the RBS Group and efforts to improve processes and enhance efficiencies across the organization. These results increased $4.2 billion from the six months ended June 30, 2013, which included a $4.1 billion after tax goodwill impairment charge. Excluding the gain, restructuring charges and special items, and impairment charges noted above, net income increased $13 million, or 4%, from the six months ended June 30, 2013, as the benefit of higher net interest income and lower provision for credit losses was partially offset by the effect of lower noninterest income and increased noninterest expenses.
| Six Months Ended June 30, | ||||||||||||||||
| 2014 | 2013 | Change | Percent | |||||||||||||
| (dollars in millions) | (%) | |||||||||||||||
| Operating Data: |
||||||||||||||||
| Net interest income |
$ | 1,641 | $ | 1,509 | $ | 132 | 9 | % | ||||||||
| Noninterest income |
998 | 870 | 128 | 15 | ||||||||||||
|
|
|
|
|
|
|
|||||||||||
| Total revenue |
2,639 | 2,379 | 260 | 11 | ||||||||||||
| Provision for credit losses |
170 | 202 | (32 | ) | (16 | ) | ||||||||||
| Noninterest expense |
1,758 | 6,073 | (4,315 | ) | (71 | ) | ||||||||||
|
|
|
|
|
|
|
|||||||||||
| Income (loss) before income tax expense (benefit) |
711 | (3,896 | ) | 4,607 | 118 | |||||||||||
| Income tax expense (benefit) |
232 | (174 | ) | 406 | 233 | |||||||||||
|
|
|
|
|
|
|
|||||||||||
| Net income (loss) |
$ | 479 | $ | (3,722 | ) | $ | 4,201 | 113 | % | |||||||
|
|
|
|
|
|
|
|||||||||||
| Net income, excluding goodwill impairment, restructuring charges and special items(1) |
$ | 371 | $ | 358 | $ | 13 | 4 | % | ||||||||
| Return on average tangible common equity(1)(2) |
7.45 | % | (24.96 | )% | NM | — | ||||||||||
| Return on average tangible common equity, excluding goodwill impairment, restructuring charges and special items(1)(2) |
5.77 | % | 5.37 | % | 40 | bps | — | |||||||||
| (1) | This is a non-GAAP financial measure. For more information on the computation of this non-GAAP financial measure, see “—Principal Components of Operations and Key Performance Metrics Used By Management—Key Performance Metrics and Non-GAAP Financial Measures.” |
| (2) | Ratios for the periods ended June 30, 2014 and 2013 are presented on an annualized basis. |
85
Table of Contents
Net Interest Income
The following table shows the major components of net interest income and net interest margin:
| Six Months Ended June 30, | Change | |||||||||||||||||||||||||||||||
| 2014 | 2013 | |||||||||||||||||||||||||||||||
| Average Balances |
Income/ Expense |
Yields/ Rates |
Average Balances |
Income/ Expense |
Yields/ Rates |
Average Balances |
Yields/ Rates |
|||||||||||||||||||||||||
| (dollars in millions) | ||||||||||||||||||||||||||||||||
| Assets |
||||||||||||||||||||||||||||||||
| Interest-bearing cash and due from banks and deposits in banks |
$ | 1,991 | $ | 2 | 0.23 | % | $ | 2,725 | $ | 7 | 0.54 | % | $ | (734 | ) | (31 | ) bps | |||||||||||||||
| Taxable investment securities |
23,980 | 303 | 2.53 | 18,004 | 228 | 2.53 | 5,976 | — | ||||||||||||||||||||||||
| Non-taxable investment securities |
11 | — | 2.60 | 12 | — | 2.71 | (1 | ) | (11 | ) | ||||||||||||||||||||||
|
|
|
|
|
|
|
|
|
|
|
|||||||||||||||||||||||
| Total investment securities |
23,991 | 303 | 2.53 | 18,016 | 228 | 2.53 | 5,975 | — | ||||||||||||||||||||||||
| Commercial |
29,402 | 447 | 3.03 | 28,517 | 442 | 3.08 | 885 | (5 | ) | |||||||||||||||||||||||
| Commercial real estate |
6,991 | 89 | 2.53 | 6,487 | 89 | 2.73 | 504 | (20 | ) | |||||||||||||||||||||||
| Leases |
3,720 | 52 | 2.79 | 3,361 | 53 | 3.18 | 359 | (39 | ) | |||||||||||||||||||||||
|
|
|
|
|
|
|
|
|
|
|
|||||||||||||||||||||||
| Total commercial |
40,113 | 588 | 2.92 | 38,365 | 584 | 3.03 | 1,748 | (11 | ) | |||||||||||||||||||||||
|
|
|
|
|
|
|
|
|
|
|
|||||||||||||||||||||||
| Home equity lines of credit |
16,216 | 229 | 2.85 | 17,332 | 243 | 2.83 | (1,116 | ) | 2 | |||||||||||||||||||||||
| Residential mortgages |
10,125 | 204 | 4.03 | 9,091 | 183 | 4.03 | 1,034 | — | ||||||||||||||||||||||||
| Home equity loans |
5,543 | 156 | 5.69 | 6,674 | 191 | 5.77 | (1,131 | ) | (8 | ) | ||||||||||||||||||||||
| Automobile |
10,087 | 126 | 2.51 | 8,801 | 120 | 2.75 | 1,286 | (24 | ) | |||||||||||||||||||||||
| Student and other retail |
3,482 | 96 | 5.52 | 3,747 | 102 | 5.50 | (265 | ) | 2 | |||||||||||||||||||||||
| Credit cards |
1,639 | 82 | 10.13 | 1,651 | 87 | 10.57 | (12 | ) | (44 | ) | ||||||||||||||||||||||
|
|
|
|
|
|
|
|
|
|
|
|||||||||||||||||||||||
| Total retail |
47,092 | 893 | 3.82 | 47,296 | 926 | 3.95 | (204 | ) | (13 | ) | ||||||||||||||||||||||
|
|
|
|
|
|
|
|
|
|
|
|||||||||||||||||||||||
| Total loans and leases |
87,205 | 1,481 | 3.40 | 85,661 | 1,510 | 3.53 | 1,544 | (13 | ) | |||||||||||||||||||||||
| Loans held for sale |
133 | 2 | 3.35 | 478 | 7 | 2.95 | (345 | ) | 40 | |||||||||||||||||||||||
| Other loans held for sale |
1,062 | 22 | 4.06 | — | — | — | 1,062 | 406 | ||||||||||||||||||||||||
|
|
|
|
|
|
|
|
|
|
|
|||||||||||||||||||||||
| Interest-earning assets |
114,382 | 1,810 | 3.17 | 106,880 | 1,752 | 3.28 | 7,502 | (11 | ) | |||||||||||||||||||||||
| Allowance for loan and lease losses |
(1,262 | ) | (1,223 | ) | (39 | ) | ||||||||||||||||||||||||||
| Goodwill |
6,876 | 11,287 | (4,411 | ) | ||||||||||||||||||||||||||||
| Other noninterest-earning assets |
5,539 | 5,931 | 392 | |||||||||||||||||||||||||||||
|
|
|
|
|
|
|
|||||||||||||||||||||||||||
| Total noninterest-earning assets |
11,153 | 15,995 | (4,842 | ) | ||||||||||||||||||||||||||||
|
|
|
|
|
|
|
|||||||||||||||||||||||||||
| Total assets |
$ | 125,535 | $ | 122,875 | $ | 2,660 | ||||||||||||||||||||||||||
|
|
|
|
|
|
|
|||||||||||||||||||||||||||
| Liabilities and Stockholders’ Equity |
||||||||||||||||||||||||||||||||
| Checking with interest |
$ | 13,562 | $ | 4 | 0.06 | % | $ | 14,234 | $ | 4 | 0.06 | % | $ | (672 | ) | — | bps | |||||||||||||||
| Money market & savings |
38,667 | 33 | 0.17 | 43,121 | 61 | 0.28 | (4,454 | ) | (11 | ) | ||||||||||||||||||||||
| Term deposits |
9,376 | 30 | 0.64 | 11,249 | 52 | 0.93 | (1,873 | ) | (29 | ) | ||||||||||||||||||||||
|
|
|
|
|
|
|
|
|
|
|
|||||||||||||||||||||||
| Total interest-bearing deposits |
61,605 | 67 | 0.22 | 68,604 | 117 | 0.34 | (6,999 | ) | (12 | ) | ||||||||||||||||||||||
| Interest-bearing deposits held for sale |
3,953 | 4 | 0.22 | — | — | — | 3,953 | 22 | ||||||||||||||||||||||||
| Federal funds purchased and securities sold under agreements to repurchase(1) |
5,708 | 16 | 0.55 | 1,925 | 115 | 11.88 | 3,783 | (1,133 | ) | |||||||||||||||||||||||
| Other short-term borrowed funds |
4,838 | 49 | 2.03 | 279 | 1 | 0.62 | 4,559 | 141 | ||||||||||||||||||||||||
| Long-term borrowed funds |
1,412 | 33 | 4.60 | 624 | 10 | 3.03 | 788 | 157 | ||||||||||||||||||||||||
|
|
|
|
|
|
|
|
|
|
|
|||||||||||||||||||||||
| Total borrowed funds |
11,958 | 98 | 1.63 | 2,828 | 126 | 8.83 | 9,130 | (720 | ) | |||||||||||||||||||||||
|
|
|
|
|
|
|
|
|
|
|
|||||||||||||||||||||||
| Total interest-bearing liabilities |
77,516 | 169 | 0.43 | 71,432 | 243 | 0.68 | 6,084 | (25 | ) | |||||||||||||||||||||||
| Demand deposits |
25,393 | 24,907 | 486 | |||||||||||||||||||||||||||||
| Demand deposits held for sale |
932 | — | 932 | |||||||||||||||||||||||||||||
| Other liabilities |
2,205 | 2,324 | (119 | ) | ||||||||||||||||||||||||||||
| Stockholders’ equity |
19,489 | 24,212 | (4,723 | ) | ||||||||||||||||||||||||||||
|
|
|
|
|
|
|
|||||||||||||||||||||||||||
| Total liabilities and stockholders’ equity |
$ | 125,535 | $ | 122,875 | $ | 2,660 | ||||||||||||||||||||||||||
|
|
|
|
|
|
|
|||||||||||||||||||||||||||
| Interest rate spread |
2.74 | 2.60 | ||||||||||||||||||||||||||||||
|
|
|
|
|
|||||||||||||||||||||||||||||
| Net interest income |
$ | 1,641 | $ | 1,509 | $ | 132 | ||||||||||||||||||||||||||
|
|
|
|
|
|
|
|||||||||||||||||||||||||||
| Net interest margin |
2.88 | % | 2.83 | % | 5 | bps | ||||||||||||||||||||||||||
86
Table of Contents
| (1) | Balances are net of certain short-term receivables associated with reverse repurchase agreements. Interest expense includes the full cost of the repurchase agreements and certain hedging costs. The rate on federal funds purchased is elevated due to the impact from pay-fixed interest rate swaps that are scheduled to run off by the end of 2016. See “—Analysis of Financial Condition—June 30, 2014 Compared with December 31, 2013—Derivatives” for further information. |
For the six months ended June 30, 2014, net interest income of $1.6 billion increased $132 million, or 9%, from $1.5 billion for the six months ended June 30, 2013 and reflected a five basis point increase in net interest margin to 2.88%. The increase in net interest income was driven by growth in average interest-earning assets, the benefit of a reduction in interest rate hedging costs, as well as lower funding costs on deposits partially offset by declining loan yields and increased long-term borrowing costs related to our issuance of subordinated debt. Average interest-earning assets increased $7.5 billion for the six months ended June 30, 2014 compared to the same period in 2013, driven by a $6.0 billion increase in the investment securities portfolio, a $1.7 billion increase in total commercial loans, a $1.0 billion increase in residential mortgages, and a $1.3 billion increase in auto loans, partially offset by a $2.2 billion decrease in home equity balances and a $265 million decrease in student and other retail loans.
The five basis point increase in net interest margin was driven by a 13 basis point benefit from interest rate hedging activity tied to maturing pay-fixed swaps originated prior to the financial crisis as well as lower deposit costs as we reduced our reliance on higher cost certificates of deposit. We do not expect this trend to continue in future periods. This benefit was partially offset by continued pressure on interest-earning asset yields given the effect of the relatively persistent low-rate environment and largely reflected the effect of continued prepayment of higher yielding consumer real estate secured loans and industrywide competition for loans.
Average interest-earning asset yields of 3.17% for the six months ended June 30, 2014 declined 11 basis points compared to 3.28% for the six months ended June 30, 2013, driven by a 13 basis point decline in the loan and lease portfolio yield, largely reflecting prepayments of higher yielding fixed-rate assets, which were replaced by new purchases and originations with lower yields given the relatively persistent low-rate environment. Investment portfolio income of $303 million for the six months ended June 30, 2014 increased $75 million, or 33%, compared to the six months ended June 30, 2013, and the yield on the portfolio of 2.53% for the six months ended June 30, 2014 was flat compared to the six months ended June 30, 2013.
Total interest-bearing deposit costs for the six months ended June 30, 2014, decreased $50 million, or 43%, to $67 million, from $117 million for the six months ended June 30, 2013 and reflected a 12 basis point decrease in the rate paid on deposits to 0.22% from 0.34%. Rates on term deposits were 0.64% and 0.93% for the six months ended June 30, 2014 and 2013, respectively, while rates on money market and savings declined from 0.28% for the six months ended June 30, 2013 to 0.17% for the six months ended June 30, 2014. As a result of the historically low interest rate environment, many deposit products have hit pricing floors at or near zero, limiting further rate reduction and thus compressing margins. The total cost of borrowed funds declined $28 million, or 22%, as higher rate pay-fixed rate swaps matured; the decrease was partially offset by the increased cost of long-term borrowed funds from our issuance of subordinated debt.
Total borrowed funds rates declined to 1.63% for the six months ended June 30, 2014 from 8.83% for the six months ended June 30, 2013. Within the federal funds purchased and securities sold under agreement category and other short-term borrowed funds category, pay-fixed swap expense declined to $56 million for the six months ended June 30, 2014 compared to $112 million for the same period in 2013. Over the same period, $1.7 billion in notional swap balances matured with a remaining balance of $1.0 billion as of June 30, 2014. Excluding the impact of hedging costs, the total borrowed funds rates were 0.69% and 1.08% for the six months ended June 30, 2014 and 2013, respectively.
87
Table of Contents
Noninterest Income
The following table details the significant components of our noninterest income for the periods indicated:
| Six Months Ended June 30, |
Change | Percent | ||||||||||||||
| 2014 | 2013 | |||||||||||||||
| (dollars in millions) | (%) | |||||||||||||||
| Service charges and fees |
$ | 286 | $ | 325 | $ | (39 | ) | (12 | )% | |||||||
| Card fees |
117 | 114 | 3 | 3 | ||||||||||||
| Trust and investment services fees |
81 | 72 | 9 | 13 | ||||||||||||
| Foreign exchange and trade finance fees |
44 | 48 | (4 | ) | (8 | ) | ||||||||||
| Mortgage banking fees |
34 | 112 | (78 | ) | (70 | ) | ||||||||||
| Capital markets fees |
44 | 23 | 21 | 91 | ||||||||||||
| Bank-owned life insurance income |
23 | 25 | (2 | ) | (8 | ) | ||||||||||
| Securities gains, net |
25 | 94 | (69 | ) | (73 | ) | ||||||||||
| Other income(1) |
344 | 57 | 287 | 504 | ||||||||||||
|
|
|
|
|
|
|
|||||||||||
| Noninterest income |
$ | 998 | $ | 870 | $ | 128 | 15 | % | ||||||||
|
|
|
|
|
|
|
|||||||||||
| (1) | Includes net impairment losses on securities available for sale recognized in earnings and other income. |
Noninterest income of $998 million increased $128 million, or 15%, for the six months ended June 30, 2014, compared to $870 million for the six months ended June 30, 2013. The 2014 results reflected a $288 million gain on the Chicago Divestiture, partially offset by a $69 million decrease in securities gains and a $78 million reduction in mortgage banking fees, largely reflecting lower origination volumes, lower levels of mortgage servicing rights valuation recovery and our decision to retain a larger percentage of originations on balance sheet. Results also reflected a $39 million decrease in service charges and fees driven by a reduction in consumer service charges due to lower personal overdraft fees.
Provision for Credit Losses
For the six months ended June 30, 2014, the provision for credit losses was $170 million, down from $202 million for the six months ended June 30, 2013, driven by lower net charge-offs. The provision for loan and lease losses is the result of a detailed analysis performed to estimate an appropriate and adequate allowance for loan and lease losses (“ALLL”). Current credit trends continued to improve with net charge-offs for the six months ended June 30, 2014 of $155 million compared with $255 million for the six months ended June 30, 2013. The total provision for credit losses includes the provision for loan and lease losses as well as the provision for unfunded commitments. Refer to “—Analysis of Financial Condition—Allowance for Credit Losses and Nonperforming Assets” for more information.
88
Table of Contents
Noninterest Expense
The following table displays the significant components of our noninterest expense for the periods indicated:
| Six Months Ended June 30, |
Change | Percent | ||||||||||||||
| 2014 | 2013 | |||||||||||||||
| (dollars in millions) | (%) | |||||||||||||||
| Salaries and employee benefits |
$ | 872 | $ | 858 | $ | 14 | 2 | % | ||||||||
| Outside services |
208 | 171 | 37 | 22 | ||||||||||||
| Occupancy |
168 | 164 | 4 | 2 | ||||||||||||
| Equipment expense |
129 | 138 | (9 | ) | (7 | ) | ||||||||||
| Amortization of software |
64 | 45 | 19 | 42 | ||||||||||||
| Goodwill impairment |
— | 4,435 | (4,435 | ) | (100 | ) | ||||||||||
| Other operating expense |
317 | 262 | 55 | 21 | ||||||||||||
|
|
|
|
|
|
|
|||||||||||
| Noninterest expense |
$ | 1,758 | $ | 6,073 | $ | (4,315 | ) | (71 | )% | |||||||
|
|
|
|
|
|
|
|||||||||||
Noninterest expense was $1.8 billion for the six months ended June 30, 2014 and included $115 million of restructuring charges and special items largely related to our separation from the RBS Group as well as ongoing efforts to improve processes and enhance efficiencies across the organization. We expect to incur approximately $40 million to $80 million during the remainder of 2014 in additional restructuring and special items. During the six months ended June 30, 2013, a $4.4 billion pretax goodwill impairment charge was recorded. Refer to “—Results of Operations—Year Ended December 31, 2013 Compared with Year Ended December 31, 2012—Noninterest Expense” for more information. Excluding the restructuring charges and special items in 2014 and the goodwill impairment incurred in 2013, noninterest expense was flat year over year. See Note 23 “Exit Costs and Restructuring Reserves” to our unaudited interim consolidated financial statements included elsewhere in this prospectus.
Provision (Benefit) for Income Taxes
The provision (benefit) for income taxes totaled $232 million for the six months ended June 30, 2014, compared to an income tax benefit of $174 million for the six months ended June 30, 2013. The provision represents a 33% and 4% effective tax rate for the six months ending June 30, 2014 and 2013, respectively. The increase in the effective rate largely reflected the tax rate impact of the goodwill impairment charge taken in the second quarter of 2013. Goodwill not deductible for tax purposes accounted for 78.4% of the total goodwill impairment charge and generated a reduction of 31% in our effective tax rate for the six months ended June 30, 2013.
At June 30, 2014, we reported a net deferred tax liability of $403 million, compared to a $199 million liability at December 31, 2013. The increase in the net deferred tax liability was largely attributable to the utilization of net operating loss and tax credit carryforwards (which decreased the deferred tax asset), as well as a decrease in the unrealized loss reported on securities available for sale, derivative instruments and hedging activities. For further discussion, see Note 10 “Income Taxes” to our unaudited interim consolidated financial statements included elsewhere in this prospectus.
89
Table of Contents
Business Segments
The following table presents certain financial data of our business segments as of and for the six months ended June 30, 2014:
| As of and for the Six Months Ended June 30, 2014 |
||||||||||||||||
| Consumer Banking |
Commercial Banking |
Other(5) | Consolidated | |||||||||||||
| (dollars in millions) | ||||||||||||||||
| Net interest income |
$ | 1,083 | $ | 520 | $ | 38 | $ | 1,641 | ||||||||
| Noninterest income |
455 | 214 | 329 | 998 | ||||||||||||
|
|
|
|
|
|
|
|
|
|||||||||
| Total revenue |
1,538 | 734 | 367 | 2,639 | ||||||||||||
| Noninterest expense |
1,293 | 310 | 155 | 1,758 | ||||||||||||
|
|
|
|
|
|
|
|
|
|||||||||
| Profit before provision for credit losses |
245 | 424 | 212 | 881 | ||||||||||||
| Provision for credit losses |
129 | (7 | ) | 48 | 170 | |||||||||||
|
|
|
|
|
|
|
|
|
|||||||||
| Income before income tax expense |
116 | 431 | 164 | 711 | ||||||||||||
| Income tax expense |
40 | 149 | 43 | 232 | ||||||||||||
|
|
|
|
|
|
|
|
|
|||||||||
| Net income |
$ | 76 | $ | 282 | $ | 121 | $ | 479 | ||||||||
|
|
|
|
|
|
|
|
|
|||||||||
| Loans and leases and loans held for sale (period-end)(1) |
$ | 47,167 | $ | 37,541 | $ | 4,383 | $ | 89,091 | ||||||||
| Average Balances: |
||||||||||||||||
| Total assets |
$ | 48,085 | $ | 37,491 | $ | 39,959 | $ | 125,535 | ||||||||
| Loans and leases and loans held for sale(1) |
46,876 | 36,997 | 4,527 | 88,400 | ||||||||||||
| Deposits and deposits held for sale |
70,473 | 17,901 | 3,509 | 91,883 | ||||||||||||
| Interest-earning assets |
46,906 | 37,124 | 30,352 | 114,382 | ||||||||||||
| Key Metrics: |
||||||||||||||||
| Net interest margin(2) |
4.66 | % | 2.83 | % | NM | 2.88 | % | |||||||||
| Efficiency ratio(3) |
84.00 | % | 42.25 | % | NM | 66.58 | % | |||||||||
| Average loans to average deposits ratio |
66.52 | % | 206.67 | % | NM | 96.21 | % | |||||||||
| Return on average total tangible assets(2)(3) |
0.32 | % | 1.52 | % | NM | 0.81 | % | |||||||||
| Return on average tangible common equity(2)(3)(4) |
3.35 | % | 13.97 | % | NM | 7.45 | % | |||||||||
| (1) | Loans held for sale refer to mortgage loans held for sale recorded in the Consumer Banking segment, as well as the loans relating to the Chicago Divestiture, which are recorded in both the Consumer Banking and Commercial Banking segments. |
| (2) | Ratios for the period ended June 30, 2014 are presented on an annualized basis. |
| (3) | These are non-GAAP financial measures. For more information on the computation of these non-GAAP financial measures, see “—Principal Components of Operations and Key Performance Metrics Used By Management—Key Performance Metrics and Non-GAAP Financial Measures.” |
| (4) | Operating segments are allocated capital on a risk-adjusted basis considering economic and regulatory capital requirements. We approximate that regulatory capital is equivalent to a sustainable target level for common equity Tier 1 and then allocate that approximation to the segments based on economic capital. |
| (5) | Includes the financial impact of non-core, liquidating loan portfolios and other non-core assets, our treasury activities, wholesale funding activities, securities portfolio, community development assets and other unallocated assets, liabilities, revenues, provision for credit losses and expenses not attributed to our Consumer Banking or Commercial Banking segments. For a description of non-core assets, see “—Analysis of Financial Condition—June 30, 2014 Compared with December 31, 2013—Loans and Leases—Non-Core Assets.” |
We operate our business through two operating segments: Consumer Banking and Commercial Banking. Segment results are derived from our business line profitability reporting systems by specifically attributing managed balance sheet assets, deposits, and other liabilities and their related income or expense. Residual assets and liabilities not attributed to Consumer Banking and Commercial Banking are attributed to Other.
90
Table of Contents
Other includes our treasury function, securities portfolio, wholesale funding activities, goodwill and goodwill impairment, community development assets and other unallocated assets, liabilities, revenues, provision for credit losses and expenses not attributed to Consumer Banking or Commercial Banking. Other also includes our non-core assets. Non-core assets are primarily loans inconsistent with our strategic goals, generally as a result of geographic location, industry, product type or risk level. The non-core portfolio totaled $3.5 billion as of June 30, 2014, down 10% from December 31, 2013. The largest component of our non-core portfolio is our home equity products currently or formerly serviced by others.
Our capital levels are evaluated and managed centrally; however, capital is allocated to the operating segments to support evaluation of business performance. Operating segments are allocated capital on a risk-adjusted basis considering economic and regulatory capital requirements. We approximate that regulatory capital is equivalent to a sustainable target level for common equity Tier 1 and then allocate that approximation to the segments based on economic capital. Interest income and expense is determined based on the assets and liabilities managed by the business segment. Because funding and asset liability management is a central function, funds transfer-pricing methodologies are utilized to allocate a cost of funds used, or credit for the funds provided, to all business segment assets, liabilities and capital, respectively, using a matched funding concept. The residual effect on net interest income of asset/liability management, including the residual net interest income related to the funds transfer pricing process, is included in Other.
Provision for credit losses is allocated to each business segment based on actual net charge-offs that have been recognized by the business segment. The difference between the consolidated provision for credit losses and the business segments’ net charge-offs is reflected in Other.
Noninterest income and expense directly managed by each business segment, including fees, service charges, salaries and benefits, and other direct revenues and costs are accounted for within each segment’s financial results in a manner similar to the consolidated financial statements. Occupancy costs are allocated based on utilization of facilities by the business segment. Generally, operating losses are charged to the business segment when the loss event is realized in a manner similar to a loan charge-off. Noninterest expenses incurred by centrally managed operations or business segments that directly support another business segment’s operations are charged to the applicable business segment based on its utilization of those services.
Income taxes are assessed to each business segment at a standard tax rate with the residual tax expense or benefit to arrive at the consolidated effective tax rate included in Other.
Developing and applying methodologies used to allocate items among the business segments is a dynamic process. Accordingly, financial results may be revised periodically as management systems are enhanced, methods of evaluating performance or product lines change, or our organizational structure changes.
91
Table of Contents
Consumer Banking
| As of and for the Six Months Ended June 30, |
Change | Percent | ||||||||||||||
| 2014 | 2013 | |||||||||||||||
| (dollars in millions) | (%) | |||||||||||||||
| Net interest income |
$ | 1,083 | $ | 1,090 | $ | (7 | ) | (1 | )% | |||||||
| Noninterest income |
455 | 544 | (89 | ) | (16 | ) | ||||||||||
|
|
|
|
|
|
|
|||||||||||
| Total revenue |
1,538 | 1,634 | (96 | ) | (6 | ) | ||||||||||
| Noninterest expense |
1,293 | 1,262 | 31 | 2 | ||||||||||||
|
|
|
|
|
|
|
|||||||||||
| Profit before provision for credit losses |
245 | 372 | (127 | ) | (34 | ) | ||||||||||
| Provision for credit losses |
129 | 156 | (27 | ) | (17 | ) | ||||||||||
|
|
|
|
|
|
|
|||||||||||
| Income before income tax expense |
116 | 216 | (100 | ) | (46 | ) | ||||||||||
| Income tax expense |
40 | 76 | (36 | ) | (47 | ) | ||||||||||
|
|
|
|
|
|
|
|||||||||||
| Net income |
$ | 76 | $ | 140 | $ | (64 | ) | (46 | ) | |||||||
|
|
|
|
|
|
|
|||||||||||
| Loans and leases and loans held for sale (period-end)(1) |
$ | 47,167 | $ | 44,803 | $ | 2,364 | 5 | |||||||||
| Average Balances: |
||||||||||||||||
| Total assets |
$ | 48,085 | $ | 46,737 | $ | 1,348 | 3 | |||||||||
| Loans and leases and loans held for sale(1) |
46,876 | 45,440 | 1,436 | 3 | ||||||||||||
| Deposits and deposits held for sale |
70,473 | 72,499 | (2,026 | ) | (3 | ) | ||||||||||
| Interest-earning assets |
46,906 | 45,467 | 1,439 | 3 | ||||||||||||
| Key Metrics: |
||||||||||||||||
| Net interest margin(2) |
4.66 | % | 4.83 | % | (17 | ) bps | — | |||||||||
| Efficiency ratio(3) |
84.00 | % | 77.27 | % | 673 | bps | — | |||||||||
| Average loans to average deposits ratio |
66.52 | % | 62.68 | % | 384 | bps | — | |||||||||
| Return on average total tangible assets(2)(3) |
0.32 | % | 0.60 | % | (28 | ) bps | — | |||||||||
| Return on average tangible common equity(2)(3)(4) |
3.35 | % | 6.46 | % | (311 | ) bps | — | |||||||||
| (1) | Loans held for sale include mortgage loans held for sale and loans relating to the Chicago Divestiture. |
| (2) | Ratios for the periods ended June 30, 2014 and 2013 are presented on an annualized basis. |
| (3) | These are non-GAAP financial measures. For more information on the computation of these non-GAAP financial measures, see “—Principal Components of Operations and Key Performance Metrics Used By Management—Key Performance Metrics and Non-GAAP Financial Measures.” |
| (4) | Operating segments are allocated capital on a risk-adjusted basis considering economic and regulatory capital requirements. We approximate that regulatory capital is equivalent to a sustainable target level for common equity Tier 1 and then allocate that approximation to the segments based on economic capital. |
Consumer Banking segment net income of $76 million for the six months ended June 30, 2014 decreased $64 million, or 46%, from $140 million for the six months ended June 30, 2013, as the benefit of lower provision for credit losses was more than offset by lower fee income and higher noninterest expense.
Net interest income of $1.1 billion for the six months ended June 30, 2014 remained relatively stable with the six months ended June 30, 2013, as the benefit of lower deposit costs and loan growth was largely offset by the effect of continued downward pressure on loan yields and deposit spreads given the relatively persistent low-rate environment. Loan growth reflected higher residential mortgage and auto loan outstandings, partially offset by lower home equity outstandings.
Noninterest income of $455 million decreased $89 million, or 16%, from $544 million for the six months ended June 30, 2013, driven by a decrease in mortgage banking fees. Mortgage banking fees for the six months ended June 30, 2014 decreased $78 million due to reduction in overall origination volume and our decision to strategically hold more loans on balance sheet. Mortgage banking fees were also negatively impacted by lower mortgage servicing rights valuation recovery compared to the same period in 2013 as long term rates began to increase in the middle of
92
Table of Contents
2013. Service charges and fees were down $33 million for the six months ended June 30, 2014 compared to the same period in 2013, largely driven by the continued impact of prior regulatory changes, including changes in check posting order. This was partially offset by growth in trust and investment services fees of $10 million, as well as a $9 million gain on sale of portions of our Federal Family Education Loan Program portfolio.
Noninterest expense of $1.3 billion for the six months ended June 30, 2014 increased $31 million, or 2%, from the six months ended June 30, 2013 driven by increased regulatory and litigation costs, which more than offset the benefit of across the board expense reduction despite continued investment in key growth businesses.
Provision for credit losses of $129 million for the six months ended June 30, 2014 decreased $27 million, or 17%, from $156 million for the six months ended June 30, 2013, driven by improved credit quality within the loan portfolios.
Commercial Banking
| As of and for the Six Months Ended June 30, |
Change | Percent | ||||||||||||||
| 2014 | 2013 | |||||||||||||||
| (dollars in millions) | (%) | |||||||||||||||
| Net interest income |
$ | 520 | $ | 508 | $ | 12 | 2 | % | ||||||||
| Noninterest income |
214 | 191 | 23 | 12 | ||||||||||||
|
|
|
|
|
|
|
|||||||||||
| Total revenue |
734 | 699 | 35 | 5 | ||||||||||||
| Noninterest expense |
310 | 315 | (5 | ) | (2 | ) | ||||||||||
|
|
|
|
|
|
|
|||||||||||
| Profit before provision for credit losses |
424 | 384 | 40 | 10 | ||||||||||||
| Provision for credit losses |
(7 | ) | (24 | ) | 17 | 71 | ||||||||||
|
|
|
|
|
|
|
|||||||||||
| Income before income tax expense |
431 | 408 | 23 | 6 | ||||||||||||
| Income tax expense |
149 | 144 | 5 | 3 | ||||||||||||
|
|
|
|
|
|
|
|||||||||||
| Net income |
$ | 282 | $ | 264 | $ | 18 | 7 | |||||||||
|
|
|
|
|
|
|
|||||||||||
| Loans and leases and loans held for sale (period-end)(1) |
$ | 37,541 | $ | 34,312 | $ | 3,229 | 9 | |||||||||
| Average Balances: |
||||||||||||||||
| Total assets |
$ | 37,491 | $ | 34,897 | $ | 2,594 | 7 | |||||||||
| Loans and leases and loans held for sale(1) |
36,997 | 34,189 | 2,808 | 8 | ||||||||||||
| Deposits and deposits held for sale |
17,901 | 17,332 | 569 | 3 | ||||||||||||
| Interest-earning assets |
37,124 | 34,302 | 2,822 | 8 | ||||||||||||
| Key Metrics: |
||||||||||||||||
| Net interest margin(2) |
2.83 | % | 2.99 | % | (16 | ) bps | — | |||||||||
| Efficiency ratio(3) |
42.25 | % | 45.12 | % | (287 | ) bps | — | |||||||||
| Average loans to average deposits ratio |
206.67 | % | 197.26 | % | 941 | bps | — | |||||||||
| Return on average total tangible assets(2)(3) |
1.52 | % | 1.53 | % | (1 | ) bps | — | |||||||||
| Return on average tangible common equity(2)(3)(4) |
13.97 | % | 13.76 | % | 21 | bps | — | |||||||||
| (1) | Loans held for sale include loans relating to the Chicago Divestiture. |
| (2) | Ratios for the periods ended June 30, 2014 and 2013 are presented on an annualized basis. |
| (3) | These are non-GAAP financial measures. For more information on the computation of these non-GAAP financial measures, see “—Principal Components of Operations and Key Performance Metrics Used By Management—Key Performance Metrics and Non-GAAP Financial Measures.” |
| (4) | Operating segments are allocated capital on a risk-adjusted basis considering economic and regulatory capital requirements. We approximate that regulatory capital is equivalent to a sustainable target level for common equity Tier 1 and then allocate that approximation to the segments based on economic capital. |
93
Table of Contents
Commercial Banking net income of $282 million for the six months ended June 30, 2014 increased $18 million, or 7%, from $264 million for the six months ended June 30, 2013, driven by a $35 million increase in total revenue, partially offset by a $17 million decrease in the net recovery reflected in the provision for credit losses related to a reduction in recoveries of prior period charge-offs.
Net interest income of $520 million for the six months ended June 30, 2014 increased $12 million, or 2%, from $508 million for the six months ended June 30, 2013, as the benefit of a $2.8 billion increase in interest-earning assets was partially offset by continued downward pressure on loan yields given the relatively persistent low-rate environment and increased industrywide competition.
Noninterest income of $214 million for the six months ended June 30, 2014 increased $23 million, or 12%, from $191 million for the six months ended June 30, 2013, as a $37 million increase in leasing income and capital markets fees was partially offset by lower interest-rate product, foreign exchange and trade finance fee income.
Noninterest expense of $310 million for the six months ended June 30, 2014 decreased $5 million, or 2%, from $315 million for the six months ended June 30, 2013 as the benefit of lower employee incentive costs was partially offset by continued investment in the business to drive revenue growth.
Provision for credit losses for the six months ended June 30, 2014 reflected a net recovery of $7 million compared with a net recovery of $24 million for the six months ended June 30, 2013, reflecting decreasing monetization of loans or assets that had been charged off in prior periods.
Other
| As of and for the Six Months Ended June 30, |
Change | Percent | ||||||||||||||
| 2014 | 2013 | |||||||||||||||
| (dollars in millions) | (%) | |||||||||||||||
| Net interest income (expense) |
$ | 38 | $ | (89 | ) | $ | 127 | 143 | % | |||||||
| Noninterest income |
329 | 135 | 194 | 144 | ||||||||||||
|
|
|
|
|
|
|
|||||||||||
| Total revenue |
367 | 46 | 321 | 698 | ||||||||||||
| Noninterest expense |
155 | 4,496 | (4,341 | ) | (97 | ) | ||||||||||
|
|
|
|
|
|
|
|||||||||||
| Income (loss) before provision for credit losses |
212 | (4,450 | ) | 4,662 | 105 | |||||||||||
| Provision for credit losses |
48 | 70 | (22 | ) | (31 | ) | ||||||||||
|
|
|
|
|
|
|
|||||||||||
| Income (loss) before income tax expense (benefit) |
164 | (4,520 | ) | 4,684 | 104 | |||||||||||
| Income tax expense (benefit) |
43 | (394 | ) | 437 | 111 | |||||||||||
|
|
|
|
|
|
|
|||||||||||
| Net income (loss) |
$ | 121 | $ | (4,126 | ) | $ | 4,247 | 103 | ||||||||
|
|
|
|
|
|
|
|||||||||||
| Loans and leases and loans held for sale (period-end) |
$ | 4,383 | $ | 6,320 | $ | (1,937 | ) | (31 | ) | |||||||
| Average Balances: |
||||||||||||||||
| Total assets |
$ | 39,959 | $ | 41,241 | $ | (1,282 | ) | (3 | ) | |||||||
| Loans and leases and loans held for sale |
4,527 | 6,510 | (1,983 | ) | (30 | ) | ||||||||||
| Deposits and deposits held for sale |
3,509 | 3,680 | (171 | ) | (5 | ) | ||||||||||
| Interest-earning assets |
30,352 | 27,111 | 3,241 | 12 | ||||||||||||
Other recorded net income of $121 million for the six months ended June 30, 2014 compared with a net loss of $4.1 billion for the six months ended June 30, 2013, which included an after tax goodwill impairment charge of $4.1 billion. Excluding the goodwill impairment, the net loss for the six months ended June 30, 2013 was $46 million. Net income for the six months ended June 30, 2014 included a $180 million after tax gain related to the Chicago Divestiture partially offset by $72 million of after tax
94
Table of Contents
restructuring charges and special items. Excluding these items, net income increased $59 million driven by higher net interest income largely reflecting a reduction in pay-fixed swap costs as well as lower noninterest expense and provision for credit losses.
Net interest income for the six months ended June 30, 2014 increased $127 million to $38 million compared to an expense of $89 million for the six months ended June 30, 2013. The increase was driven primarily by the benefit of a $5.2 billion increase in average investment securities, a reduction in interest rate swap costs, partially offset by a $1.7 billion decrease in average non-core loan balances.
Noninterest income for the six months ended June 30, 2014 increased $194 million driven by the $288 million gain on the Chicago Divestiture. Excluding the gain, noninterest income decreased $94 million driven by a $69 million reduction in securities gains and higher net losses on low-income housing investments, which are more than offset by increased tax credits.
Noninterest expense for the six months ended June 30, 2014 of $155 million included $115 million of pretax restructuring charges and special items and decreased $4.3 billion from the six months ended June 30, 2013, which included the $4.4 billion pretax goodwill impairment charge. Excluding the goodwill impairment, restructuring charges and special items, noninterest expense decreased $21 million largely reflecting lower employee incentive costs and lower costs related to the non-core loan portfolio. For further information about these special items, including expected additional future costs, see Note 23 “Exit Costs and Restructuring Reserves” to our unaudited interim consolidated financial statements included elsewhere in this prospectus. Noninterest expense excluding goodwill impairment, restructuring charges and special items may increase in the third quarter due to expense expected to be incurred in connection with certain supervisory matters. For further information, please refer to “Risk Factors—Risks Related to Regulations Governing Our Industry—We are and may be subject to regulatory actions that may have a material impact on our business.” We are not able to predict the magnitude of these expenses but they could be significant.
The provision for credit losses within Other mainly represents the residual change in the consolidated allowance for credit losses after attributing the respective net charge-offs to the Consumer Banking and Commercial Banking segments. It also includes net charge-offs related to the non-core portfolio. The provision for credit losses for the six months ended June 30, 2014 decreased $22 million to $48 million compared to $70 million for the six months ended June 30, 2013 reflecting continued improvement in credit quality and decreased non-core net charge-offs. On a quarterly basis, we review and refine our estimate of the allowance for credit losses, taking into consideration changes in portfolio size and composition, historical loss experience, internal risk ratings, current economic conditions, industry performance trends and other pertinent information. As of June 30, 2014, changes in these factors led to an increase of $15 million in the allowance for credit losses compared with a release of $53 million for the six months ended June 30, 2013. The provision also reflected an increase in overall credit exposure associated with growth in our loan portfolio.
Total assets as of June 30, 2014 included $2.1 billion and $4.8 billion of goodwill related to the Consumer Banking and Commercial Banking reporting units, respectively. For further information regarding the reconciliation of segment results to GAAP results, see Note 19 “Business Segments” to our unaudited interim consolidated financial statements included elsewhere in this prospectus.
95
Table of Contents
Results of Operations—Year Ended December 31, 2013 Compared with Year Ended December 31, 2012
Highlights
For the year ended December 31, 2013:
| • | we recorded a $4.4 billion pretax ($4.1 billion after tax) goodwill impairment charge that resulted in a $3.4 billion net loss; |
| • | excluding the impact of the goodwill impairment charge and $26 million ($17 million after tax) in restructuring charges in 2013 and a net $158 million of pretax ($125 million after tax) unusual items in 2012, net income decreased $97 million, or 13%, from 2012. 2013 restructuring charges related to our implementation of a new branch image capture system on the teller line, which automated several key processes within the branch network, and our decision to close certain branches, which resulted in lease termination costs and other fixed asset write-offs. Unusual expenses in 2012 included a $138 million ($87 million after tax) litigation settlement related to overdraft protection, a $77 million ($49 million after tax) settlement of defined benefit pension plan obligations to vested former employees, a $25 million charge associated with a state tax settlement, and a $23 million ($15 million after tax) loss on sale of a commercial real estate portfolio, offset by a $75 million ($48 million after tax) gain on sale of VISA, Inc. Class B shares and a net $5 million ($3 million after tax) reversal of prior restructuring charges; |
| • | net interest margin was 2.85% compared to 2.89% in 2012, driven by declining yields on investment securities, auto loans, and commercial and consumer real estate-secured loans; |
| • | net interest income decreased $169 million, or 5%, to $3.1 billion compared to $3.2 billion in 2012, largely reflecting the effect of the continued low-rate environment which reduced loan yields and deposit spreads. Income from loans and leases decreased $204 million driven by the effect of lower interest rates and lower portfolio balances, principally in consumer real estate secured loans. Interest expense on deposits declined reflecting a decrease in total deposits and an improvement in the mix as we reduced our reliance on higher cost certificates of deposit and money market balances. Average earning assets decreased 4% as an increase in commercial loans was more than offset by declines in the investment portfolio and the consumer real estate secured portfolio, including a $947 million decrease in our non-core consumer real estate secured portfolio; |
| • | noninterest income decreased $35 million, or 2%, to $1.6 billion compared to $1.7 billion in 2012, which included a net benefit of $52 million in unusual items. Excluding the unusual items, noninterest income increased $17 million largely as higher securities gains, net, other services income, other income and trust and investment services revenue was partially offset by lower mortgage banking and card fee income. 2012 unusual items included the $75 million gain on sale of our VISA, Inc. Class B shares and a $23 million loss on the sale of a commercial real estate portfolio; |
| • | noninterest expense of $7.7 billion included a $4.4 billion goodwill impairment charge recorded in the second quarter of 2013 and a $26 million net restructuring charge. Noninterest expense in 2012 included a $138 million litigation settlement related to overdraft protection and a $77 million defined benefit pension plan obligation charge paid to vested former employees as a single lump sum payment, partially offset by a net $5 million reversal of prior restructuring charges. Excluding these unusual items, noninterest expense in 2013 decreased $29 million, or 1%, compared to 2012, largely due to lower other operating expense and salaries and employee benefits partially offset by higher amortization of software; |
96
Table of Contents
| • | excluding the impact of the $4.4 billion pretax ($4.1 billion after tax) goodwill impairment charge, our return on average tangible common equity improved to 4.95% from 4.86% in 2012; |
| • | average loans and leases of $85.4 billion decreased $1.6 billion, or 2%, from $87.0 billion in 2012, as commercial loan growth was more than offset by a decrease in our retail loan portfolio, which included a $1.2 billion decrease in the non-core retail loan portfolio; |
| • | average interest-bearing deposits of $67.9 billion were flat compared to 2012 as growth in low cost deposits such as interest checking and money market and savings deposits, was offset by lower term deposits; |
| • | our capital ratios continued to be well above regulatory requirements: our total capital ratio increased to 16.1% from 15.8% in 2012, and our Tier 1 capital ratio was 13.5% compared to 14.2% in 2012 as a result of our plan to rebalance our capital structure; |
| • | net charge-offs declined $374 million from 2012 to $501 million and provision for credit losses totaled $479 million, up 16% from $413 million in 2012. The allowance for credit losses totaled $1.3 billion as of December 31, 2013, down $35 million, or 3%, reflecting continued improvement in overall credit quality from 2012; and |
| • | net (loss) income per average common share, basic and diluted, was ($6.12) in 2013 compared to $1.15 in 2012, reflecting a 165,582-for-1 forward stock split effective on August 22, 2014. In 2013, net income per average common share, basic and diluted, excluding goodwill impairment, was $1.17, reflecting a 165,582-for-1 forward stock split effective on August 22, 2014. |
Net Income (Loss)
We reported a net loss of $3.4 billion for the year ended December 31, 2013, after recording a goodwill impairment charge of $4.1 billion after tax in the second quarter of 2013 and $26 million ($17 million after tax) in restructuring charges. Excluding the goodwill impairment and restructuring charges above and a net $158 million of pretax unusual items in 2012, net income decreased $97 million, or 13%, from 2012, largely driven by the effect of the relatively persistent low interest rate environment on net interest income and a reduction in fee income, driven by continued pressure from regulatory changes and lower mortgage banking fees. Results also reflected increased provision for credit losses and lower noninterest expense, excluding goodwill impairment.
The restructuring charges in 2013 related to our implementation of a new branch image capture system on the teller line which automated several key processes within the branch network, and our decision to close certain branches, which resulted in lease termination costs and other fixed asset write-offs. Unusual expenses in 2012 included a $138 million ($87 million after tax) overdraft litigation settlement, a $77 million ($49 million after tax) settlement of defined benefit pension plan obligation to vested former employees, a $25 million charge related to a state tax settlement and a $23 million ($15 million after tax) loss on sale of a commercial real estate portfolio, offset by a $75 million ($48 million after tax) gain on sale of our VISA, Inc. Class B shares and a net $5 million ($3 million after tax) reversal of prior restructuring charges.
97
Table of Contents
| Year Ended December 31, | ||||||||||||||||
| 2013 | 2012 | Change | Percent | |||||||||||||
| (dollars in millions) | (%) | |||||||||||||||
| Operating Data: |
||||||||||||||||
| Net interest income |
$ | 3,058 | $ | 3,227 | $ | (169 | ) | (5 | )% | |||||||
| Noninterest income |
1,632 | 1,667 | (35 | ) | (2 | ) | ||||||||||
|
|
|
|
|
|
|
|||||||||||
| Total revenue |
4,690 | 4,894 | (204 | ) | (4 | ) | ||||||||||
| Provision for credit losses |
479 | 413 | 66 | 16 | ||||||||||||
| Noninterest expense |
7,679 | 3,457 | 4,222 | 122 | ||||||||||||
| Noninterest expense, excluding goodwill impairment(1) |
3,244 | 3,457 | (213 | ) | (6 | ) | ||||||||||
| (Loss) income before income tax (benefit) expense |
(3,468 | ) | 1,024 | (4,492 | ) | (439 | ) | |||||||||
| Income tax (benefit) expense |
(42 | ) | 381 | (423 | ) | (111 | ) | |||||||||
| Net (loss) income |
(3,426 | ) | 643 | (4,069 | ) | (633 | ) | |||||||||
| Net income, excluding goodwill impairment(1) |
654 | 643 | 11 | 2 | ||||||||||||
| Return on average tangible common equity(1) |
(25.91 | )% | 4.86 | % | NM | — | ||||||||||
| Return on average tangible common equity, excluding goodwill impairment(1) |
4.95 | % | 4.86 | % | 9 bps | — | ||||||||||
| (1) | These are non-GAAP financial measures. For more information on the computation of these non-GAAP financial measures, see “—Principal Components of Operations and Key Performance Metrics Used By Management—Key Performance Metrics and Non-GAAP Financial Measures.” |
98
Table of Contents
Net Interest Income
The following table shows the major components of net interest income and net interest margin:
| Year Ended December 31, | Change | |||||||||||||||||||||||||||||||
| 2013 | 2012 | |||||||||||||||||||||||||||||||
| Average Balances |
Income/ Expense |
Yields/ Rates |
Average Balances |
Income/ Expense |
Yields/ Rates |
Average Balances |
Yields/ Rates |
|||||||||||||||||||||||||
| (dollars in millions) | ||||||||||||||||||||||||||||||||
| Assets |
||||||||||||||||||||||||||||||||
| Interest-bearing cash and due from banks and deposits in banks |
$ | 2,278 | $ | 11 | 0.46 | % | $ | 1,562 | $ | 7 | 0.46 | % | $ | 716 | — | bps | ||||||||||||||||
| Taxable investment securities |
19,062 | 477 | 2.50 | 22,030 | 615 | 2.79 | (2,968 | ) | (29 | ) | ||||||||||||||||||||||
| Non-taxable investment securities |
12 | — | 2.66 | 40 | 2 | 4.32 | (28 | ) | (166 | ) | ||||||||||||||||||||||
|
|
|
|
|
|
|
|
|
|
|
|||||||||||||||||||||||
| Total investment securities |
19,074 | 477 | 2.50 | 22,070 | 617 | 2.79 | (2,996 | ) | (29 | ) | ||||||||||||||||||||||
| Commercial |
28,654 | 900 | 3.10 | 27,273 | 849 | 3.07 | 1,381 | 3 | ||||||||||||||||||||||||
| Commercial real estate |
6,568 | 178 | 2.67 | 7,063 | 196 | 2.72 | (495 | ) | (5 | ) | ||||||||||||||||||||||
| Leases |
3,463 | 105 | 3.05 | 3,216 | 112 | 3.48 | 247 | (43 | ) | |||||||||||||||||||||||
|
|
|
|
|
|
|
|
|
|
|
|||||||||||||||||||||||
| Total commercial |
38,685 | 1,183 | 3.02 | 37,552 | 1,157 | 3.04 | 1,133 | (2 | ) | |||||||||||||||||||||||
|
|
|
|
|
|
|
|
|
|
|
|||||||||||||||||||||||
| Home equity lines of credit |
17,105 | 485 | 2.83 | 17,745 | 497 | 2.80 | (640 | ) | 3 | |||||||||||||||||||||||
| Residential mortgage |
9,104 | 360 | 3.96 | 9,551 | 413 | 4.32 | (447 | ) | (36 | ) | ||||||||||||||||||||||
| Home equity loans |
6,330 | 361 | 5.71 | 8,176 | 481 | 5.88 | (1,846 | ) | (17 | ) | ||||||||||||||||||||||
| Automobile |
8,857 | 235 | 2.65 | 8,276 | 273 | 3.30 | 581 | (65 | ) | |||||||||||||||||||||||
| Student and other installment loans |
3,655 | 202 | 5.52 | 4,040 | 218 | 5.38 | (385 | ) | 14 | |||||||||||||||||||||||
| Credit cards |
1,669 | 175 | 10.46 | 1,634 | 166 | 10.15 | 35 | 31 | ||||||||||||||||||||||||
|
|
|
|
|
|
|
|
|
|
|
|||||||||||||||||||||||
| Total retail |
46,720 | 1,818 | 3.89 | 49,422 | 2,048 | 4.14 | (2,702 | ) | (25 | ) | ||||||||||||||||||||||
|
|
|
|
|
|
|
|
|
|
|
|||||||||||||||||||||||
| Total loans and leases |
85,405 | 3,001 | 3.50 | 86,974 | 3,205 | 3.67 | (1,569 | ) | (17 | ) | ||||||||||||||||||||||
| Loans held for sale |
392 | 12 | 3.07 | 538 | 17 | 3.10 | (146 | ) | (3 | ) | ||||||||||||||||||||||
|
|
|
|
|
|
|
|
|
|
|
|||||||||||||||||||||||
| Interest-earning assets |
107,149 | 3,501 | 3.25 | 111,144 | 3,846 | 3.45 | (3,995 | ) | (20 | ) | ||||||||||||||||||||||
| Allowance for loan and lease losses |
(1,219 | ) | (1,506 | ) | 287 | |||||||||||||||||||||||||||
| Goodwill |
9,437 | 11,323 | (1,886 | ) | ||||||||||||||||||||||||||||
| Other noninterest-earning assets |
5,499 | 6,705 | (1,206 | ) | ||||||||||||||||||||||||||||
|
|
|
|
|
|
|
|||||||||||||||||||||||||||
| Total noninterest-earning assets |
13,717 | 16,522 | (2,805 | ) | ||||||||||||||||||||||||||||
|
|
|
|
|
|
|
|||||||||||||||||||||||||||
| Total assets |
$ | 120,866 | $ | 127,666 | $ | (6,800 | ) | |||||||||||||||||||||||||
|
|
|
|
|
|
|
|||||||||||||||||||||||||||
| Liabilities and Stockholders’ Equity |
||||||||||||||||||||||||||||||||
| Checking with interest |
$ | 14,096 | $ | 8 | 0.06 | % | $ | 13,522 | $ | 10 | 0.08 | % | $ | 574 | (2 | ) bps | ||||||||||||||||
| Money market & savings |
42,575 | 105 | 0.25 | 41,249 | 121 | 0.29 | 1,326 | (4 | ) | |||||||||||||||||||||||
| Term deposits |
11,266 | 103 | 0.91 | 13,534 | 244 | 1.80 | (2,268 | ) | (89 | ) | ||||||||||||||||||||||
|
|
|
|
|
|
|
|
|
|
|
|||||||||||||||||||||||
| Total interest-bearing deposits |
67,937 | 216 | 0.32 | 68,305 | 375 | 0.55 | (368 | ) | (23 | ) | ||||||||||||||||||||||
| Federal funds purchased and securities sold under agreements to repurchase(1) |
2,400 | 192 | 7.89 | 2,716 | 119 | 4.31 | (316 | ) | 358 | |||||||||||||||||||||||
| Other short-term borrowed funds |
251 | 4 | 1.64 | 3,026 | 101 | 3.27 | (2,775 | ) | (163 | ) | ||||||||||||||||||||||
| Long-term borrowed funds |
778 | 31 | 3.93 | 1,976 | 24 | 1.20 | (1,198 | ) | 273 | |||||||||||||||||||||||
|
|
|
|
|
|
|
|
|
|
|
|||||||||||||||||||||||
| Total borrowed funds |
3,429 | 227 | 6.53 | 7,718 | 244 | 3.11 | (4,289 | ) | 342 | |||||||||||||||||||||||
|
|
|
|
|
|
|
|
|
|
|
|||||||||||||||||||||||
| Total interest-bearing liabilities |
71,366 | 443 | 0.61 | 76,023 | 619 | 0.80 | (4,657 | ) | (19 | ) | ||||||||||||||||||||||
| Demand deposits |
25,399 | 25,053 | 346 | |||||||||||||||||||||||||||||
| Other liabilities |
2,267 | 2,652 | (385 | ) | ||||||||||||||||||||||||||||
| Stockholders’ equity |
21,834 | 23,938 | (2,104 | ) | ||||||||||||||||||||||||||||
|
|
|
|
|
|
|
|||||||||||||||||||||||||||
| Total liabilities and stockholders’ equity |
$ | 120,866 | $ | 127,666 | $ | (6,800 | ) | |||||||||||||||||||||||||
|
|
|
|
|
|
|
|||||||||||||||||||||||||||
| Interest rate spread |
2.64 | 2.65 | ||||||||||||||||||||||||||||||
|
|
|
|
|
|||||||||||||||||||||||||||||
| Net interest income |
$ | 3,058 | $ | 3,227 | $ | (169 | ) | |||||||||||||||||||||||||
|
|
|
|
|
|
|
|||||||||||||||||||||||||||
| Net interest margin |
2.85 | % | 2.89 | % | (4 | ) bps | ||||||||||||||||||||||||||
| (1) | Balances are net of certain short-term receivables associated with reverse repurchase agreements. Interest expense includes the full cost of the repurchase agreements and certain hedging costs. The rate on federal funds purchased is elevated due to the impact from pay-fixed interest rate swaps that are scheduled to run off by the end of 2016. See “—Analysis of Financial Condition—December 31, 2013 Compared with December 31, 2012—Derivatives” for further information. |
99
Table of Contents
Net interest income of $3.1 billion in 2013 decreased $169 million, or 5%, from $3.2 billion in 2012, and reflected a four basis point decline in net interest margin to 2.85%. The decrease in net interest income was driven by a reduction in earning asset yields given the relatively persistent low-rate environment, as well as a decrease in loan and securities portfolio balances, which were partially offset by a reduction in pay fixed swap costs and improved deposit spreads. Average interest-earning assets decreased $4.0 billion driven by a $2.9 billion decrease in consumer real estate secured portfolios, a $2.3 billion decrease in the investment securities portfolio and a $385 million decrease in student and other installment loans, which were partially offset by a $1.1 billion increase in total commercial loans and a $581 million increase in auto loans.
The four basis point decrease in net interest margin reflected the effect of the relatively persistent low-rate environment, which led to a decline in earning asset yields that outpaced our ability to reduce the cost of interest-bearing liabilities. The decline in earning asset yields reflected continued prepayment of higher yielding consumer real estate secured loans as well as the contractual amortization of higher yield portfolios, which were entered into in higher interest rate environments. In addition, intense industrywide competition for loans compressed spreads on new originations and resulted in downward pressure on loan yields. To a lesser extent, rates on interest-bearing deposits also declined compared to 2012. Industrywide, net interest margins experienced downward pressure as higher rate loan and securities balances ran off and deposit rates approached floors beneath which they cannot be reduced further.
The net yield on average interest-earning assets decreased 20 basis points to 3.25% in 2013 from 3.45% in 2012, reflecting a 17 basis point decline in the loan and lease portfolio yield and a 35 basis point decline in the investment portfolio yield from 2012. The decline in average yields largely reflected the effect of the continued low-rate environment as new loans and securities were issued at lower rates and prepayment speeds on higher rate fixed assets in the portfolio increased. Investment portfolio income of $488 million decreased $136 million, or 22%, from 2012, and the yield on the portfolio declined 35 basis points to 2.29%. These results were impacted by our strategic decision to slow down reinvestment activity in the first half of 2013, given extremely low levels of market rates.
Our total interest-bearing deposit costs in 2013 decreased $159 million, or 42%, from $375 million in 2012 and reflected a 23 basis point decrease in the rate paid on deposits to 0.32% from 0.55% in 2012. The rates paid on term deposits declined to 0.91% from 1.80% in 2012. As a result of the historically low interest rate environment, many deposit products have hit pricing floors at or near zero, limiting further rate reductions and thus compressing margin. The total cost of borrowed funds increased to 6.53% from 3.11% in 2012 due to additional subordinated debt issued in 2013 and the full expense impact of the subordinated debt issued in 2012.
100
Table of Contents
Noninterest Income
The following table details the significant components of our noninterest income for the periods indicated:
| Year Ended December 31, |
Change | Percent | ||||||||||||||
| 2013 | 2012 | |||||||||||||||
| (dollars in millions) | (%) | |||||||||||||||
| Service charges and fees |
$ | 640 | $ | 704 | $ | (64 | ) | (9 | )% | |||||||
| Card fees |
234 | 249 | (15 | ) | (6 | ) | ||||||||||
| Mortgage banking fees |
153 | 189 | (36 | ) | (19 | ) | ||||||||||
| Trust and investment services fees |
149 | 131 | 18 | 14 | ||||||||||||
| Foreign exchange and trade finance fees |
97 | 105 | (8 | ) | (8 | ) | ||||||||||
| Capital markets fees |
53 | 52 | 1 | 2 | ||||||||||||
| Bank-owned life insurance income |
50 | 51 | (1 | ) | (2 | ) | ||||||||||
| Securities gains, net |
144 | 95 | 49 | 52 | ||||||||||||
| Other income(1) |
112 | 91 | 21 | 23 | ||||||||||||
|
|
|
|
|
|
|
|||||||||||
| Total noninterest income |
$ | 1,632 | $ | 1,667 | $ | (35 | ) | (2 | )% | |||||||
|
|
|
|
|
|
|
|||||||||||
| (1) | Includes net impairment losses on securities available for sale recognized in earnings and other income. |
Total noninterest income of $1.6 billion in 2013 decreased 2%, or $35 million, from 2012 largely as higher securities gains, net, other income and trust and investment services fees were more than offset by lower service charges and fees, mortgage banking fees and card fees. Service charges and fees of $640 million decreased 9% largely on lower account volume. Mortgage banking fees of $153 million decreased $36 million, or 19%, from $189 million in 2012. The decrease was primarily driven by lower loan sale gains reflecting the decision to retain more loans on our balance sheet, which was partially offset by higher mortgage servicing rights valuations. Card fees of $234 million declined $15 million, or 6%, compared to $249 million in 2012 driven by lower transaction volumes. Net gains on the sale of securities of $144 million increased $49 million, or 52%, from $95 million in 2012 primarily reflecting the sale of higher yielding investment securities. We do not expect to record comparable securities gains, net, in the coming years. Other income of $112 million increased $21 million, or 23%, from 2012 primarily due to a $75 million gain on the sale of Visa Class B shares offset by a $23 million loss on the sale of a commercial real estate portfolio recorded in 2012. Excluding the gain on the sale of Visa Class B shares and the loss on commercial real estate, other income increased $73 million driven by higher derivatives income, leasing income, and a gain on sale of warrants.
Provision for Credit Losses
Provision for credit losses of $479 million in 2013 increased $66 million, or 16%, from $413 million in 2012, despite a $374 million decline in net charge-offs. The increase in the provision for credit losses reflected growth in the commercial loan portfolio and recognition of incremental loss exposure related to expected HELOC payment shock. Additionally, while overall credit quality continued to improve in 2013, the rate of improvement slowed relative to 2012. As a result, 2013 provision for credit losses included a release of $22 million from the allowance for credit losses (the amount by which net charge-offs exceeded the provision), compared with a release of $462 million in 2012. For further information regarding the expected HELOC payment shock, see “—Key Factors Affecting Our Business—HELOC Payment Shock.”
101
Table of Contents
Noninterest Expense
The following table displays the significant components of our noninterest expense for the periods indicated:
| Year Ended December 31, |
Change | Percent | ||||||||||||||
| 2013 | 2012 | |||||||||||||||
| (dollars in millions) | (%) | |||||||||||||||
| Salaries and employee benefits |
$ | 1,652 | $ | 1,743 | $ | (91 | ) | (5 | )% | |||||||
| Outside services |
360 | 339 | 21 | 6 | ||||||||||||
| Occupancy |
327 | 310 | 17 | 5 | ||||||||||||
| Equipment expense |
275 | 279 | (4 | ) | (1 | ) | ||||||||||
| Amortization of software |
102 | 77 | 25 | 32 | ||||||||||||
| Goodwill impairment |
4,435 | — | 4,435 | NM | ||||||||||||
| Other operating expense |
528 | 709 | (181 | ) | (26 | ) | ||||||||||
|
|
|
|
|
|
|
|||||||||||
| Total noninterest expense |
$ | 7,679 | $ | 3,457 | $ | 4,222 | 122 | % | ||||||||
|
|
|
|
|
|
|
|||||||||||
Noninterest expense of $7.7 billion in 2013 increased $4.2 billion from $3.5 billion in 2012 and included a second quarter $4.4 billion goodwill impairment charge as described below. Excluding the goodwill impairment, noninterest expense of $3.2 billion declined $213 million, or 6%, from $3.5 billion in 2012. Results in 2012 included a $138 million litigation settlement related to overdraft protection and a $77 million settlement of defined benefit pension plan obligations to vested former employees, partially offset by a net $5 million reversal of prior restructuring charges. Excluding these unusual items and a $26 million restructuring charge in 2013, noninterest expense decreased $29 million, or 1%, driven by lower other operating expense and salaries and employee benefits.
In the second quarter of 2013, we recorded a $4.4 billion goodwill impairment charge driven by a deceleration of the expected future earnings associated with our Consumer Banking reporting unit as compared to our prior expectations. Although the U.S. economy has demonstrated signs of recovery, including notable improvements in unemployment and housing, the pace and extent of recovery in these indicators, as well as in overall gross domestic product, have lagged behind previous expectations and interest rates have remained at or near historically low levels for a protracted period of time. Lower economic growth rates for the United States, coupled with increased costs to comply with the new regulatory framework in the financial services industry, resulted in a deceleration of the expected growth rate for future earnings associated with the Consumer Banking reporting unit, which caused us to record a goodwill impairment charge during the second quarter of 2013. For segment reporting purposes, the impairment charge is reflected in Other, and the remaining carrying value of goodwill totaled $6.9 billion as of December 31, 2013. See Note 8 “Goodwill” to our audited consolidated financial statements included elsewhere in this prospectus for further information.
Provision (Benefit) for Income Taxes
In 2013, we recorded an income tax benefit of $42 million compared to $381 million of income tax expense in 2012. The effective tax rates for the years ended December 31, 2013 and 2012 were 1% and 37%, respectively. The decrease in the effective rate was mainly due to the tax rate impact of the goodwill impairment in calculating our income tax benefit as well as the effect of a $25 million charge related to a state tax settlement in 2012. Goodwill not deductible for tax purposes accounted for 78.4% of the total goodwill impairment charge and generated a reduction of 35% in our effective tax rate for the year ended December 31, 2013. During 2012, we recorded a state tax settlement charge for the years 2003 through 2008 related to our real estate investment trust and various passive investment companies. For further discussion of our tax settlement in 2012, see Note 14 “Income Taxes” to our audited consolidated financial statements included elsewhere in this prospectus.
102
Table of Contents
Business Segments
The following table presents certain financial data of our business segments for the year ended December 31, 2013:
| As of and for the Year Ended December 31, 2013 |
||||||||||||||||
| Consumer Banking |
Commercial Banking |
Other(4) | Consolidated | |||||||||||||
| (dollars in millions) | ||||||||||||||||
| Net interest income (expense) |
$ | 2,176 | $ | 1,031 | $ | (149 | ) | $ | 3,058 | |||||||
| Noninterest income |
1,025 | 389 | 218 | 1,632 | ||||||||||||
|
|
|
|
|
|
|
|
|
|||||||||
| Total revenue |
3,201 | 1,420 | 69 | 4,690 | ||||||||||||
| Noninterest expense |
2,522 | 635 | 4,522 | 7,679 | ||||||||||||
|
|
|
|
|
|
|
|
|
|||||||||
| Profit (loss) before provision for credit losses |
679 | 785 | (4,453 | ) | (2,989 | ) | ||||||||||
| Provision for credit losses |
308 | (7 | ) | 178 | 479 | |||||||||||
|
|
|
|
|
|
|
|
|
|||||||||
| Income (loss) before income tax expense |
371 | 792 | (4,631 | ) | (3,468 | ) | ||||||||||
| Income tax expense (benefit) |
129 | 278 | (449 | ) | (42 | ) | ||||||||||
|
|
|
|
|
|
|
|
|
|||||||||
| Net income (loss) |
$ | 242 | $ | 514 | $ | (4,182 | ) | $ | (3,426 | ) | ||||||
|
|
|
|
|
|
|
|
|
|||||||||
| Loans and leases and loans held for sale (period- end)(1) |
$ | 45,019 | $ | 36,155 | $ | 5,939 | $ | 87,113 | ||||||||
| Average Balances: |
||||||||||||||||
| Total assets |
$ | 46,465 | $ | 35,229 | $ | 39,172 | $ | 120,866 | ||||||||
| Loans and leases and loans held for sale(1) |
45,106 | 34,647 | 6,044 | 85,797 | ||||||||||||
| Deposits and deposits held for sale |
72,158 | 17,516 | 3,662 | 93,336 | ||||||||||||
| Interest-earning assets |
45,135 | 34,771 | 27,243 | 107,149 | ||||||||||||
| Key Metrics: |
||||||||||||||||
| Net interest margin |
4.82 | % | 2.97 | % | NM | 2.85 | % | |||||||||
| Efficiency ratio(2) |
78.76 | % | 44.66 | % | NM | 163.73 | % | |||||||||
| Efficiency ratio, excluding goodwill impairment(2) |
78.76 | % | 44.66 | % | NM | 69.17 | % | |||||||||
| Average loans to average deposits ratio |
62.51 | % | 197.80 | % | NM | 91.92 | % | |||||||||
| Return on average total tangible assets(2) |
0.52 | % | 1.46 | % | NM | (3.05 | )% | |||||||||
| Return on average total tangible assets, excluding goodwill impairment(2) |
0.52 | % | 1.46 | % | NM | 0.58 | % | |||||||||
| Return on average tangible common equity(2)(3) |
5.48 | % | 13.20 | % | NM | (25.91 | )% | |||||||||
| Return on average tangible common equity, excluding goodwill impairment(2)(3) |
5.48 | % | 13.20 | % | NM | 4.95 | % | |||||||||
| (1) | Loans held for sale refer to mortgage loans held for sale recorded in the Consumer Banking segment, as well as the loans relating to the Chicago Divestiture, which are recorded in both the Consumer Banking and Commercial Banking segments. |
| (2) | These are non-GAAP financial measures. For more information on the computation of these non-GAAP financial measures, see “—Principal Components of Operations and Key Performance Metrics Used By Management—Key Performance Metrics and Non-GAAP Financial Measures.” |
| (3) | Operating segments are allocated capital on a risk-adjusted basis considering economic and regulatory capital requirements. We approximate that regulatory capital is equivalent to a sustainable target level for common equity Tier 1 and then allocate that approximation to the segments based on economic capital. |
| (4) | Includes the financial impact of non-core, liquidating loan portfolios and other non-core assets, our treasury activities, wholesale funding activities, securities portfolio, community development assets and other unallocated assets, liabilities, revenues, provision for credit losses, and expenses not attributed to our Consumer Banking or Commercial Banking segments. For a description of non-core assets, see “—Analysis of Financial Condition—December 31, 2013 Compared with December 31, 2012—Loans and Leases—Non-Core Assets.” |
We operate our business through two operating segments: Consumer Banking and Commercial Banking. Segment results are derived from our business line profitability reporting systems by
103
Table of Contents
specifically attributing managed balance sheet assets, deposits, and other liabilities and their related income or expense. Residual assets and liabilities not attributed to Consumer Banking and Commercial Banking are attributed to Other.
Other includes our treasury function, securities portfolio, wholesale funding activities, goodwill and goodwill impairment, community development assets and other unallocated assets, liabilities, revenues, provision for credit losses and expenses not attributed to Consumer Banking or Commercial Banking. Other also includes our non-core assets. Non-core assets are primarily loans inconsistent with our strategic goals, generally as a result of geographic location, industry, product type or risk level. The non-core portfolio totaled $3.8 billion as of December 31, 2013, down 33% from December 31, 2012. The largest component of our non-core portfolio is our home equity products currently or formerly serviced by others.
Our capital levels are evaluated and managed centrally; however, capital is allocated to the operating segments to support evaluation of business performance. Operating segments are allocated capital on a risk-adjusted basis considering economic and regulatory capital requirements. We approximate that regulatory capital is equivalent to a sustainable target level for common equity Tier 1 and then allocate that approximation to the segments based on economic capital. Interest income and expense is determined based on the assets and liabilities managed by the business segment. Because funding and asset liability management is a central function, funds transfer-pricing methodologies are utilized to allocate a cost of funds used, or credit for the funds provided, to all business segment assets, liabilities and capital, respectively, using a matched funding concept. The residual effect on net interest income of asset/liability management, including the residual net interest income related to the funds transfer pricing process, is included in Other.
Provision for credit losses is allocated to each business segment based on actual net charge-offs that have been recognized by the business segment. The difference between the consolidated provision for credit losses and the business segments’ net charge-offs is reflected in Other.
Noninterest income and expense directly managed by each business segment, including fees, service charges, salaries and benefits, and other direct revenues and costs are accounted for within each segment’s financial results in a manner similar to the consolidated financial statements. Occupancy costs are allocated based on utilization of facilities by the business segment. Generally, operating losses are charged to the business segment when the loss event is realized in a manner similar to a loan charge-off. Noninterest expenses incurred by centrally managed operations or business segments that directly support another business segment’s operations are charged to the applicable business segment based on its utilization of those services.
Income taxes are assessed to each business segment at a standard tax rate with the residual tax expense or benefit to arrive at the consolidated effective tax rate included in Other.
Developing and applying methodologies used to allocate items among the business segments is a dynamic process. Accordingly, financial results may be revised periodically as management systems are enhanced, methods of evaluating performance or product lines change, or our organizational structure changes.
104
Table of Contents
Consumer Banking
| As of and for the Year Ended December 31, |
||||||||||||||||
| 2013 | 2012 | Change | Percent | |||||||||||||
| (dollars in millions) | (%) | |||||||||||||||
| Net interest income |
$ | 2,176 | $ | 2,197 | $ | (21 | ) | (1 | )% | |||||||
| Noninterest income |
1,025 | 1,187 | (162 | ) | (14 | ) | ||||||||||
|
|
|
|
|
|
|
|||||||||||
| Total revenue |
3,201 | 3,384 | (183 | ) | (5 | ) | ||||||||||
| Noninterest expense |
2,522 | 2,691 | (169 | ) | (6 | ) | ||||||||||
|
|
|
|
|
|
|
|||||||||||
| Profit before provision for credit losses |
679 | 693 | (14 | ) | (2 | ) | ||||||||||
| Provision for credit losses |
308 | 408 | (100 | ) | (24 | ) | ||||||||||
|
|
|
|
|
|
|
|||||||||||
| Income before income tax expense |
371 | 285 | 86 | 30 | ||||||||||||
| Income tax expense |
129 | 100 | 29 | 29 | ||||||||||||
|
|
|
|
|
|
|
|||||||||||
| Net income |
$ | 242 | $ | 185 | $ | 57 | 31 | |||||||||
|
|
|
|
|
|
|
|||||||||||
| Loans and leases and loans held for sale (period-end)(1) |
$ | 45,019 | $ | 46,289 | $ | (1,270 | ) | (3 | ) | |||||||
| Average Balances: |
||||||||||||||||
| Total assets |
$ | 46,465 | $ | 47,824 | $ | (1,359 | ) | (3 | ) | |||||||
| Loans and leases and loans held for sale(1) |
45,106 | 46,455 | (1,349 | ) | (3 | ) | ||||||||||
| Deposits and deposits held for sale |
72,158 | 70,812 | 1,346 | 2 | ||||||||||||
| Interest-earning assets |
45,135 | 46,479 | (1,344 | ) | (3 | ) | ||||||||||
| Key Metrics: |
||||||||||||||||
| Net interest margin |
4.82 | % | 4.73 | % | 9 | bps | — | |||||||||
| Efficiency ratio(2) |
78.76 | % | 79.45 | % | (69 | ) bps | — | |||||||||
| Average loans to average deposits ratio |
62.51 | % | 65.60 | % | (309 | ) bps | — | |||||||||
| Return on average total tangible assets(2) |
0.52 | % | 0.39 | % | 13 | bps | — | |||||||||
| Return on average tangible common equity(2)(3) |
5.48 | % | 4.89 | % | 59 | bps | — | |||||||||
| (1) | Loans held for sale include mortgage loans held for sale and loans relating to the Chicago Divestiture. |
| (2) | These are non-GAAP financial measures. For more information on the computation of these non-GAAP financial measures, see “—Principal Components of Operations and Key Performance Metrics Used By Management—Key Performance Metrics and Non-GAAP Financial Measures.” |
| (3) | Operating segments are allocated capital on a risk-adjusted basis considering economic and regulatory capital requirements. We approximate that regulatory capital is equivalent to a sustainable target level for common equity Tier 1 and then allocate that approximation to the segments based on economic capital. |
Consumer Banking net income of $242 million in 2013 increased $57 million, or 31%, from 2012 as a 5% decrease in revenue was more than offset by a 6% decrease in noninterest expense and a $100 million decrease in provision for credit losses. 2012 unusual items included a $75 million ($48 million after tax) benefit in revenue relating to a gain on the sale of Visa class B shares and a $138 million ($87 million after tax) settlement charge in noninterest expense associated with overdraft litigation. Excluding these items, net income increased $18 million as the benefit of lower provision for credit losses and continued expense discipline more than offset the lower revenue reflecting continued pressure from the relatively persistent low-rate environment as well as the impact of regulatory changes on service charges and card fees.
Net interest income of $2.2 billion in 2013 declined $21 million, or 1%, largely driven by a 3% decrease in earning assets and a reduction in deposit spreads. The average loan portfolio declined $1.3 billion to $45.1 billion, driven by a $1.8 billion decrease in home equity balances given industrywide higher levels of mortgage refinance activity. In 2013, we originated $5.7 billion in mortgages compared with $7.9 billion in 2012. We sold 67% of 2013 originations compared to 70% in
105
Table of Contents
2012. Average deposits grew 2% to $72.2 billion reflecting a $3.0 billion increase in money market deposits, partially offset by a $2.4 billion decrease in certificates of deposit.
Noninterest income of $1.0 billion decreased $162 million, or 14%, from 2012, which included the benefit of the $75 million gain on the sale of Visa class B shares. Excluding this gain, noninterest income decreased $87 million driven by a $53 million decrease in service charges and a $36 million decrease in mortgage banking fees. The decrease in mortgage banking fees reflected a $2.2 billion decrease in origination volumes as well as lower gains on the sale of mortgages as secondary market spreads narrowed. Gains on sale of mortgages decreased $77 million and volume related fees declined $28 million, partially offset by the recovery of mortgage servicing rights valuations and lower amortization expense.
Noninterest expense of $2.5 billion decreased $169 million, or 6%, from 2012, which included the $138 million overdraft settlement. Excluding this settlement charge, noninterest expense decreased $31 million driven by lower salaries and benefits and branch related costs partially offset by higher commissions expense.
Provision for credit losses of $308 million decreased $100 million, or 24%, from 2012, largely reflecting the benefit of decreased charge-offs in the residential real estate secured portfolio as well as general improvement in the credit environment.
Commercial Banking
| As of and for the Year Ended December 31, |
||||||||||||||||
| 2013 | 2012 | Change | Percent | |||||||||||||
| (dollars in millions) | (%) | |||||||||||||||
| Net interest income |
$ | 1,031 | $ | 1,036 | $ | (5 | ) | — | ||||||||
| Noninterest income |
389 | 349 | 40 | 11 | % | |||||||||||
|
|
|
|
|
|
|
|||||||||||
| Total revenue |
1,420 | 1,385 | 35 | 3 | ||||||||||||
| Noninterest expense |
635 | 625 | 10 | 2 | ||||||||||||
|
|
|
|
|
|
|
|||||||||||
| Profit before provision for credit losses |
785 | 760 | 25 | 3 | ||||||||||||
| Provision for credit losses |
(7 | ) | 63 | (70 | ) | (111 | ) | |||||||||
|
|
|
|
|
|
|
|||||||||||
| Income before income tax expense |
792 | 697 | 95 | 14 | ||||||||||||
| Income tax expense |
278 | 244 | 34 | 14 | ||||||||||||
|
|
|
|
|
|
|
|||||||||||
| Net income |
$ | 514 | $ | 453 | $ | 61 | 13 | |||||||||
|
|
|
|
|
|
|
|||||||||||
| Loans and leases and loans held for sale (period-end)(1) |
$ | 36,155 | $ | 34,384 | $ | 1,771 | 5 | |||||||||
| Average Balances: |
||||||||||||||||
| Total assets |
$ | 35,229 | $ | 33,474 | $ | 1,755 | 5 | |||||||||
| Loans and leases and loans held for sale(1) |
34,647 | 32,499 | 2,148 | 7 | ||||||||||||
| Deposits and deposits held for sale |
17,516 | 17,650 | (134 | ) | (1 | ) | ||||||||||
| Interest-earning assets |
34,771 | 32,600 | 2,171 | 7 | ||||||||||||
| Key Metrics: |
||||||||||||||||
| Net interest margin |
2.97 | % | 3.18 | % | (21 | ) bps | — | |||||||||
| Efficiency ratio(1) |
44.66 | % | 45.22 | % | (56 | ) bps | — | |||||||||
| Average loans to average deposits ratio |
197.80 | % | 184.13 | % | 1,367 | bps | — | |||||||||
| Return on average total tangible assets(2) |
1.46 | % | 1.35 | % | 11 | bps | — | |||||||||
| Return on average tangible common equity(2)(3) |
13.20 | % | 12.45 | % | 75 | bps | — | |||||||||
| (1) | Loans held for sale include loans relating to the Chicago Divestiture. |
106
Table of Contents
| (2) | These are non-GAAP financial measures. For more information on the computation of these non-GAAP financial measures, see “—Principal Components of Operations and Key Performance Metrics Used By Management—Key Performance Metrics and Non-GAAP Financial Measures.” |
| (3) | Operating segments are allocated capital on a risk-adjusted basis considering economic and regulatory capital requirements. We approximate that regulatory capital is equivalent to a sustainable target level for common equity Tier 1 and then allocate that approximation to the segments based on economic capital. |
Commercial Banking net income of $514 million in 2013 increased $61 million, or 13%, from $453 million in 2012 driven by growth in noninterest income and continued improvement in credit quality. Total revenue rose 3% reflecting an 11% increase in noninterest income and relatively flat net interest income.
Net interest income of $1.0 billion in 2013 remained relatively flat with the prior year as the benefit of loan growth of 7%, largely in middle market, mid-corporate, and franchise lending, was offset by a 21 basis point decline in net interest margin given the relatively persistent low-rate environment.
Noninterest income of $389 million in 2013 increased $40 million, or 11%, from 2012, largely due to higher interest rate products and leasing income, which was partially offset by lower foreign exchange and trade finance fees.
Noninterest expense of $635 million in 2013 increased $10 million, driven by higher salary and benefits cost as well as continued investment in technology and risk management.
Average loans and leases increased $2.1 billion, or 7%, in 2013 due to strong new loan origination activity particularly in the second half of 2013 in commercial finance. Average deposit balances were relatively flat at $17.5 billion despite a $256 million increase in noninterest-bearing demand deposits.
Provision for credit losses in 2013 reflected a net recovery of $7 million on prior charge-offs, compared with an expense of $63 million in 2012, as overall credit quality continued to improve.
Other
| As of and for the Year Ended December 31, |
||||||||||||||||
| 2013 | 2012 | Change | Percent | |||||||||||||
| (dollars in millions) | (%) | |||||||||||||||
| Net interest (expense) |
$ | (149 | ) | $ | (6 | ) | $ | (143 | ) | NM | ||||||
| Noninterest income |
218 | 131 | 87 | 66 | % | |||||||||||
|
|
|
|
|
|
|
|||||||||||
| Total revenue |
69 | 125 | (56 | ) | (45 | ) | ||||||||||
| Noninterest expense |
4,522 | 141 | 4,381 | NM | ||||||||||||
|
|
|
|
|
|
|
|||||||||||
| (Loss) before provision for credit losses |
(4,453 | ) | (16 | ) | (4,437 | ) | NM | |||||||||
| Provision for credit losses |
178 | (58 | ) | 236 | 406 | |||||||||||
|
|
|
|
|
|
|
|||||||||||
| (Loss) income before income tax (benefit) expense |
(4,631 | ) | 42 | (4,673 | ) | NM | ||||||||||
| Income tax (benefit) expense |
(449 | ) | 37 | (486 | ) | NM | ||||||||||
|
|
|
|
|
|
|
|||||||||||
| Net (loss) income |
$ | (4,182 | ) | $ | 5 | $ | (4,187 | ) | NM | |||||||
|
|
|
|
|
|
|
|||||||||||
| Loans and leases and loans held for sale (period-end) |
$ | 5,939 | $ | 7,221 | $ | (1,282 | ) | (18 | ) | |||||||
| Average Balances: |
||||||||||||||||
| Total assets |
$ | 39,172 | $ | 46,368 | $ | (7,196 | ) | (16 | ) | |||||||
| Loans and leases and loans held for sale |
6,044 | 8,558 | (2,514 | ) | (29 | ) | ||||||||||
| Deposits and deposits held for sale |
3,662 | 4,896 | (1,234 | ) | (25 | ) | ||||||||||
| Interest-earning assets |
27,243 | 32,065 | (4,822 | ) | (15 | ) | ||||||||||
107
Table of Contents
A net loss of $4.2 billion was recorded for the year ended December 31, 2013, which included a pretax goodwill impairment charge of $4.4 billion. Excluding the goodwill impairment, the net loss was $102 million compared with net income of $5 million in 2012. 2013 results reflected the benefit of higher noninterest income and lower noninterest expense, which was more than offset by higher provision for credit losses and a reduction in net interest income. Total revenue of $69 million in 2013 decreased by $56 million, or 45%, from $125 million in 2012.
Net interest income in 2013 decreased $143 million to a loss of $149 million compared to a loss of $6 million in 2012. The decrease was driven by lower average investment portfolio balances of $2.3 billion, a $2.2 billion decrease in average non-core loan balances and a decrease in residual net interest income related to funds transfer pricing, which was partially offset by the benefit of interest rate swaps used for hedging assets and liabilities.
Noninterest income of $218 million in 2013 increased $87 million, or 66%, from $131 million in 2012, which included a $23 million loss on sale of non-core loans. Noninterest income in 2013 also included higher net gains on sale of securities available for sale of $65 million.
The provision for credit losses within Other mainly represents the residual change in the consolidated allowance for credit losses after attributing the respective net charge-offs to the Consumer Banking and Commercial Banking segments. It also includes net charge-offs related to the non-core portfolio. The provision totaled $178 million in 2013, and was an increase of $236 million from a negative provision of $58 million in 2012. Non-core net charge-offs were $195 million and $393 million in 2013 and 2012, respectively, resulting from improved credit quality and continued runoff in the portfolio. 2013 provision for credit losses included a release of $22 million from the allowance for credit losses (the amount by which net charge-offs exceeded the provision), compared with a release of $462 million in 2012.
Noninterest expense of $4.5 billion increased $4.4 billion from $141 million in 2012 and included a $4.4 billion goodwill impairment charge. Noninterest expense, excluding goodwill impairment, of $87 million in 2013 decreased $54 million, or 38%, from $141 million in 2012. 2013 results included $26 million of restructuring charges, and 2012 results included a $77 million settlement of defined benefit pension plan obligations to vested former employees, partially offset by a net $5 million reversal of prior restructuring charges.
Total assets include $2.1 billion and $4.8 billion of goodwill related to the Consumer Banking and Commercial Banking reporting units, respectively. For further information regarding the reconciliation of segment results to GAAP results, see Note 24 “Business Segments” to our audited consolidated financial statements included elsewhere in this prospectus.
108
Table of Contents
Results of Operations—Year Ended December 31, 2012 Compared with Year Ended December 31, 2011
Net Income
2012 net income of $643 million increased $137 million, or 27%, from $506 million in 2011, reflecting a $469 million decrease in provision for credit losses and the benefit of a $75 million ($48 million after tax) gain on the sale of VISA, Inc. Class B shares and a net $5 million ($3 million after tax) reversal of prior restructuring processes, partially offset by a $138 million ($87 million after tax) litigation settlement related to overdraft protection, a $77 million ($49 million after tax) settlement of defined benefit pension plan obligations to vested former employees, a $25 million charge related to a state tax settlement and a $23 million ($15 million after tax) loss on sale of a commercial real estate portfolio.
| Year Ended December 31, |
||||||||||||||||
| 2012 | 2011 | Change | Percent | |||||||||||||
| (dollars in millions) | (%) | |||||||||||||||
| Operating Data: |
||||||||||||||||
| Net interest income |
$ | 3,227 | $ | 3,320 | $ | (93 | ) | (3 | )% | |||||||
| Noninterest income |
1,667 | 1,711 | (44 | ) | (3 | ) | ||||||||||
|
|
|
|
|
|
|
|||||||||||
| Total revenue |
4,894 | 5,031 | (137 | ) | (3 | ) | ||||||||||
| Provision for credit losses |
413 | 882 | (469 | ) | (53 | ) | ||||||||||
| Noninterest expense |
3,457 | 3,371 | 86 | 3 | ||||||||||||
|
|
|
|
|
|
|
|||||||||||
| Income before income tax expense |
1,024 | 778 | 246 | 32 | ||||||||||||
| Income tax expense |
381 | 272 | 109 | 40 | ||||||||||||
|
|
|
|
|
|
|
|||||||||||
| Net income |
$ | 643 | $ | 506 | $ | 137 | 27 | % | ||||||||
|
|
|
|
|
|
|
|||||||||||
| Return on average tangible common equity(1) |
4.86 | % | 4.18 | % | 68 | bps | — | |||||||||
| (1) | This is a non-GAAP financial measure. For more information on the computation of this non-GAAP financial measures, see “—Principal Components of Operations and Key Performance Metrics Used By Management—Key Performance Metrics and Non-GAAP Financial Measures.” |
109
Table of Contents
Net Interest Income
The following table shows the major components of net interest income and interest margin:
| Year Ended December 31, | Change | |||||||||||||||||||||||||||||||
| 2012 | 2011 | |||||||||||||||||||||||||||||||
| Average Balances |
Income/ Expense |
Yields/ Rates |
Average Balances |
Income/ Expense |
Yields/ Rates |
Average Balances |
Yields/ Rates |
|||||||||||||||||||||||||
| (dollars in millions) | ||||||||||||||||||||||||||||||||
| Assets |
||||||||||||||||||||||||||||||||
| Interest-bearing cash and due from banks and deposits in banks |
$ | 1,562 | $ | 7 | 0.46 | % | $ | 2,016 | $ | 7 | 0.36 | % | $ | (454 | ) | 10 | bps | |||||||||||||||
| Taxable investment securities |
22,030 | 615 | 2.79 | 22,698 | 748 | 3.30 | (668 | ) | (51 | ) | ||||||||||||||||||||||
| Non-taxable investment securities |
40 | 2 | 4.32 | 49 | 2 | 4.37 | (9 | ) | (5 | ) | ||||||||||||||||||||||
|
|
|
|
|
|
|
|
|
|
|
|||||||||||||||||||||||
| Total investment securities |
22,070 | 617 | 2.79 | 22,747 | 750 | 3.30 | (677 | ) | (51 | ) | ||||||||||||||||||||||
| Commercial |
27,273 | 849 | 3.07 | 23,886 | 779 | 3.22 | 3,387 | (15 | ) | |||||||||||||||||||||||
| Commercial real estate |
7,063 | 196 | 2.72 | 8,310 | 237 | 2.82 | (1,247 | ) | (10 | ) | ||||||||||||||||||||||
| Leases |
3,216 | 112 | 3.48 | 2,952 | 113 | 3.83 | 264 | (35 | ) | |||||||||||||||||||||||
|
|
|
|
|
|
|
|
|
|
|
|||||||||||||||||||||||
| Total commercial |
37,552 | 1,157 | 3.04 | 35,148 | 1,129 | 3.18 | 2,404 | (14 | ) | |||||||||||||||||||||||
|
|
|
|
|
|
|
|
|
|
|
|||||||||||||||||||||||
| Home equity lines of credit |
17,745 | 497 | 2.80 | 17,172 | 472 | 2.75 | 573 | 5 | ||||||||||||||||||||||||
| Residential mortgage |
9,551 | 413 | 4.32 | 9,721 | 453 | 4.66 | (170 | ) | (34 | ) | ||||||||||||||||||||||
| Home equity loans |
8,176 | 481 | 5.88 | 10,575 | 627 | 5.93 | (2,399 | ) | (5 | ) | ||||||||||||||||||||||
| Automobile |
8,276 | 273 | 3.30 | 7,541 | 339 | 4.50 | 735 | (120 | ) | |||||||||||||||||||||||
| Student and other installment loans |
4,040 | 218 | 5.38 | 4,863 | 259 | 5.32 | (823 | ) | 6 | |||||||||||||||||||||||
| Credit cards |
1,634 | 166 | 10.15 | 1,580 | 155 | 9.79 | 54 | 36 | ||||||||||||||||||||||||
|
|
|
|
|
|
|
|
|
|
|
|||||||||||||||||||||||
| Total retail |
49,422 | 2,048 | 4.14 | 51,452 | 2,305 | 4.48 | (2,030 | ) | (34 | ) | ||||||||||||||||||||||
|
|
|
|
|
|
|
|
|
|
|
|||||||||||||||||||||||
| Total loans and leases |
86,974 | 3,205 | 3.67 | 86,600 | 3,434 | 3.95 | 374 | (28 | ) | |||||||||||||||||||||||
| Loans held for sale |
538 | 17 | 3.10 | 359 | 13 | 3.70 | 179 | (60 | ) | |||||||||||||||||||||||
|
|
|
|
|
|
|
|
|
|
|
|||||||||||||||||||||||
| Interest-earning assets |
111,144 | 3,846 | 3.45 | 111,722 | 4,204 | 3.75 | (578 | ) | (30 | ) | ||||||||||||||||||||||
| Allowance for loan and lease losses |
(1,506 | ) | (1,888 | ) | 382 | |||||||||||||||||||||||||||
| Goodwill |
11,323 | 11,344 | (21 | ) | ||||||||||||||||||||||||||||
| Other noninterest-earning assets |
6,705 | 7,166 | (461 | ) | ||||||||||||||||||||||||||||
|
|
|
|
|
|
|
|||||||||||||||||||||||||||
| Total noninterest-earning assets |
16,522 | 16,622 | (100 | ) | ||||||||||||||||||||||||||||
|
|
|
|
|
|
|
|||||||||||||||||||||||||||
| Total assets |
$ | 127,666 | $ | 128,344 | $ | (678 | ) | |||||||||||||||||||||||||
|
|
|
|
|
|
|
|||||||||||||||||||||||||||
| Liabilities and Stockholders’ Equity |
||||||||||||||||||||||||||||||||
| Checking with interest |
$ | 13,522 | $ | 10 | 0.08 | % | $ | 16,116 | $ | 15 | 0.10 | % | $ | (2,594 | ) | (2 | ) bps | |||||||||||||||
| Money market & savings |
41,249 | 121 | 0.29 | 37,638 | 94 | 0.25 | 3,611 | 4 | ||||||||||||||||||||||||
| Term deposits |
13,534 | 244 | 1.80 | 16,501 | 381 | 2.31 | (2,967 | ) | (51 | ) | ||||||||||||||||||||||
|
|
|
|
|
|
|
|
|
|
|
|||||||||||||||||||||||
| Total interest-bearing deposits |
68,305 | 375 | 0.55 | 70,255 | 490 | 0.70 | (1,950 | ) | (15 | ) | ||||||||||||||||||||||
| Federal funds purchased and securities sold under agreements to repurchase(1) |
2,716 | 119 | 4.31 | 3,808 | 191 | 4.96 | (1,092 | ) | (65 | ) | ||||||||||||||||||||||
| Short-term borrowed funds |
3,026 | 101 | 3.27 | 2,459 | 150 | 6.04 | 567 | (277 | ) | |||||||||||||||||||||||
| Long-term borrowed funds |
1,976 | 24 | 1.20 | 5,085 | 53 | 1.02 | (3,109 | ) | 18 | |||||||||||||||||||||||
|
|
|
|
|
|
|
|
|
|
|
|||||||||||||||||||||||
| Total borrowed funds |
7,718 | 244 | 3.11 | 11,352 | 394 | 3.42 | (3,634 | ) | (31 | ) | ||||||||||||||||||||||
|
|
|
|
|
|
|
|
|
|
|
|||||||||||||||||||||||
| Total interest-bearing liabilities |
76,023 | 619 | 0.80 | 81,607 | 884 | 1.07 | (5,584 | ) | (27 | ) | ||||||||||||||||||||||
| Demand deposits |
25,053 | 21,191 | 3,862 | |||||||||||||||||||||||||||||
| Other liabilities |
2,652 | 2,409 | 243 | |||||||||||||||||||||||||||||
| Stockholders’ equity |
23,938 | 23,137 | 801 | |||||||||||||||||||||||||||||
|
|
|
|
|
|
|
|||||||||||||||||||||||||||
| Total liabilities and stockholders’ equity |
$ | 127,666 | $ | 128,344 | $ | (678 | ) | |||||||||||||||||||||||||
|
|
|
|
|
|
|
|||||||||||||||||||||||||||
| Interest rate spread |
2.65 | 2.68 | ||||||||||||||||||||||||||||||
|
|
|
|
|
|
|
|||||||||||||||||||||||||||
| Net interest income |
$ | 3,227 | $ | 3,320 | $ | (93 | ) | |||||||||||||||||||||||||
|
|
|
|
|
|
|
|||||||||||||||||||||||||||
| Net interest margin |
2.89 | % | 2.97 | % | (8 | ) bps | ||||||||||||||||||||||||||
| (1) | Balances are net of certain short-term receivables associated with reverse repurchase agreements; interest expense includes the full cost of the repurchase agreements and certain hedging costs. The rate on federal funds purchased is elevated due to the impact from pay-fixed interest rate swaps that are scheduled to run off by the end of 2016. See “—Analysis of Financial Condition—December 31, 2013 Compared with December 31, 2012—Derivatives” for further information. |
110
Table of Contents
Net interest income in 2012 of $3.2 billion declined $93 million compared to 2011, largely reflecting the impact of the continued low interest rate environment. The net interest margin in 2012 decreased 8 basis points to 2.89% compared to 2.97% in 2011.
Interest income of $3.8 billion in 2012 decreased $358 million, or 9%, from $4.2 billion in 2011, despite a small increase in average loans and leases balances, which totaled $87.0 billion compared to $86.6 billion in 2011. The lower interest income on loans was driven by the runoff and prepayment of higher yielding, fixed rate assets and new originations of loans with lower yields, as well as sales of higher yielding investment securities. In addition, an increase in prepayments speeds increased net premium amortization expense on investment securities.
The decrease in our interest income on interest-earning assets was partially offset by a $115 million, or 23%, decrease in our interest-bearing deposit costs of $375 million in 2012 compared to $490 million in 2011 and largely reflected the relatively persistent low interest rate environment. The 2012 cost of other borrowed funds decreased $150 million, or 38%, to $244 million compared to $394 million in 2011, primarily reflecting the effect of maturing fixed-rate swaps that carried high pay-fixed interest rates.
Noninterest Income
The following table details the significant components of our noninterest income for the periods indicated:
| Year Ended December 31, |
||||||||||||||||
| 2012 | 2011 | Change | Percent | |||||||||||||
| (dollars in millions) | (%) | |||||||||||||||
| Service charges and fees |
$ | 704 | $ | 742 | $ | (38 | ) | (5 | )% | |||||||
| Card fees |
249 | 344 | (95 | ) | (28 | ) | ||||||||||
| Mortgage banking fees |
189 | 62 | 127 | 205 | ||||||||||||
| Trust and investment services fees |
131 | 131 | — | — | ||||||||||||
| Foreign exchange and trade finance fees |
105 | 114 | (9 | ) | (8 | ) | ||||||||||
| Capital markets fees |
52 | 40 | 12 | 30 | ||||||||||||
| Bank-owned life insurance income |
51 | 49 | 2 | 4 | ||||||||||||
| Securities gains, net |
95 | 162 | (67 | ) | (41 | ) | ||||||||||
| Other income(1) |
91 | 67 | 24 | 36 | ||||||||||||
|
|
|
|
|
|
|
|||||||||||
| Total noninterest income |
$ | 1,667 | $ | 1,711 | $ | 44 | (3 | )% | ||||||||
|
|
|
|
|
|
|
|||||||||||
| (1) | Includes net impairment losses on securities available for sale recognized in earnings and other income. |
Noninterest income of $1.7 billion in 2012 decreased $44 million, or 3%, from 2011, on lower card fees and securities gains, net, partially offset by higher mortgage banking fees. Card fees of $249 million in 2012 decreased $95 million, or 28%, from $344 million in 2011, driven by the effect of regulatory changes, including rules adopted by the Federal Reserve Board pursuant to the Dodd-Frank Act that limit the interchange fees that may be charged with respect to electronic debit transactions. For further information regarding the Federal Reserve Board’s interchange fee rule see “Risk Factors—Risks Related to Regulations Governing Our Industry—The Dodd-Frank Act’s provisions and related rules that restrict bank interchange fees may negatively impact our revenues and earnings” and “Regulation and Supervision—Rules Affecting Debit Card Interchange Fees.” Securities gains, net, of $95 million decreased $67 million, or 41%, from $162 million in 2011, primarily as a result of decreased sales volume. Mortgage banking fees of $189 million in 2012 increased $127 million, from $62 million in 2011, reflecting higher gains on the sale of mortgages. Other income of $91 million increased
111
Table of Contents
$24 million in 2012, from $67 million in 2011, driven by a $75 million gain on the sale of VISA, Inc. Class B shares during the second quarter of 2012, offset by a $23 million loss on sale of a commercial real estate portfolio and a net $20 million loss on sales of venture capital investments.
Provision for Credit Losses
In 2012, provision for credit losses of $413 million decreased $469 million, or 53%, from $882 million in 2011. The decrease in the provision for credit losses reflected continued improvement in credit quality, including a $290 million reduction in net charge-offs from $1.2 billion in 2011 to $875 million in 2012. The 2012 provision for credit losses included a release of $462 million from the allowance for credit losses (the amount by which net charge-offs exceeded the provision), compared with a release of $283 million in 2011. The 2012 provision for credit losses benefited from a $102 million reduction in the unallocated reserve during the year reflecting improvement in the economic environment and overall credit quality.
Noninterest Expense
The following table displays the significant components of total noninterest expense:
| Year Ended December 31, |
||||||||||||||||
| 2012 | 2011 | Change | Percent | |||||||||||||
| (dollars in millions) | (%) | |||||||||||||||
| Salaries and employee benefits |
$ | 1,743 | $ | 1,623 | $ | 120 | 7 | % | ||||||||
| Outside services |
339 | 340 | (1 | ) | — | |||||||||||
| Occupancy |
310 | 372 | (62 | ) | (17 | ) | ||||||||||
| Equipment expense |
279 | 301 | (22 | ) | (7 | ) | ||||||||||
| Amortization of software |
77 | 53 | 24 | 45 | ||||||||||||
| Other operating expense |
709 | 682 | 27 | 4 | ||||||||||||
|
|
|
|
|
|
|
|||||||||||
| Total noninterest expense |
$ | 3,457 | $ | 3,371 | $ | 86 | 3 | % | ||||||||
|
|
|
|
|
|
|
|||||||||||
Noninterest expense of $3.5 billion in 2012 increased $86 million, or 3%, from $3.4 billion in 2011, driven by higher salaries and employee benefits, amortization of software and other operating expense, partially offset by lower occupancy and equipment expense. Salaries and employee benefits of $1.7 billion in 2012 increased $120 million driven by a $77 million pension charge following a lump sum payout to vested former employees of the defined benefit pension plan. 2012 results included a $138 million litigation settlement related to overdraft protection in the first quarter of 2012. Occupancy expense of $310 million in 2012 decreased $62 million, or 17%, from $372 million in 2011, driven by lower lease termination expenses. Other operating expense of $709 million in 2012 rose $27 million, or 4%, from 2011, largely reflecting the $138 million settlement offset by lower nonperforming asset costs.
Provision for Income Taxes
Provision for income taxes of $381 million in 2012 increased $109 million, or 40%, from $272 million in 2011. The provision represented a 37% and 35% effective tax rate for the years ended December 31, 2012 and 2011, respectively. The increase in the effective rate represents the impact of higher levels of 2012 pretax earnings relative to permanent tax differences, the effect of a state tax settlement in 2012, as well as a favorable provision-to-tax return adjustment in 2011.
112
Table of Contents
Business Segments
The following table presents certain financial data of our business segments for the year ended December 31, 2012:
| As of and for the Year Ended December 31, 2012 | ||||||||||||||||
| Consumer Banking |
Commercial Banking |
Other(4) | Consolidated | |||||||||||||
| (dollars in millions) | ||||||||||||||||
| Net interest income (expense) |
$ | 2,197 | $ | 1,036 | $ | (6 | ) | $ | 3,227 | |||||||
| Noninterest income |
1,187 | 349 | 131 | 1,667 | ||||||||||||
|
|
|
|
|
|
|
|
|
|||||||||
| Total revenue |
3,384 | 1,385 | 125 | 4,894 | ||||||||||||
| Noninterest expense |
2,691 | 625 | 141 | 3,457 | ||||||||||||
|
|
|
|
|
|
|
|
|
|||||||||
| Profit (loss) before provision for credit losses |
693 | 760 | (16 | ) | 1,437 | |||||||||||
| Provision for credit losses |
408 | 63 | (58 | ) | 413 | |||||||||||
|
|
|
|
|
|
|
|
|
|||||||||
| Income before income tax expense |
285 | 697 | 42 | 1,024 | ||||||||||||
| Income tax expense |
100 | 244 | 37 | 381 | ||||||||||||
|
|
|
|
|
|
|
|
|
|||||||||
| Net income |
$ | 185 | $ | 453 | $ | 5 | $ | 643 | ||||||||
|
|
|
|
|
|
|
|
|
|||||||||
| Loans and leases and loans held for sale (period-end)(1) |
$ | 46,289 | $ | 34,384 | $ | 7,221 | $ | 87,894 | ||||||||
| Average Balances: |
||||||||||||||||
| Total assets |
$ | 47,824 | $ | 33,474 | $ | 46,368 | $ | 127,666 | ||||||||
| Total loans and leases and loans held for sale(1) |
46,455 | 32,499 | 8,558 | 87,512 | ||||||||||||
| Deposits and deposits held for sale |
70,812 | 17,650 | 4,896 | 93,358 | ||||||||||||
| Interest-earning assets |
46,479 | 32,600 | 32,065 | 111,144 | ||||||||||||
| Key Metrics: |
||||||||||||||||
| Net interest margin |
4.73 | % | 3.18 | % | NM | 2.89 | % | |||||||||
| Efficiency ratio(2) |
79.45 | % | 45.22 | % | NM | 70.64 | % | |||||||||
| Average loans to average deposits ratio |
65.60 | % | 184.13 | % | NM | 93.74 | % | |||||||||
| Return on average total tangible assets(2) |
0.39 | % | 1.35 | % | NM | 0.55 | % | |||||||||
| Return on average tangible common equity(2)(3) |
4.89 | % | 12.45 | % | NM | 4.86 | % | |||||||||
| (1) | Loans held for sale refer to mortgage loans held for sale recorded in the Consumer Banking segment. |
| (2) | These are non-GAAP financial measures. For more information on the computation of these non-GAAP financial measures, see “—Principal Components of Operations and Key Performance Metrics Used By Management—Key Performance Metrics and Non-GAAP Financial Measures.” |
| (3) | Operating segments are allocated capital on a risk-adjusted basis considering economic and regulatory capital requirements. We approximate that regulatory capital is equivalent to a sustainable target level for common equity Tier 1 and then allocate that approximation to the segments based on economic capital. |
| (4) | Includes the financial impact of non-core, liquidating loan portfolios and other non-core assets, our treasury activities, wholesale funding activities, securities portfolio, community development assets and other unallocated assets, liabilities, revenues, provision for credit losses, and expenses not attributed to our Consumer Banking or Commercial Banking segments. For a description of non-core assets, see “—Analysis of Financial Condition—December 31, 2013 Compared with December 31, 2012—Loans and Leases—Non-Core Assets.” |
113
Table of Contents
Consumer Banking
| As of and for the Year Ended December 31, |
||||||||||||||||
| 2012 | 2011 | Change | Percent | |||||||||||||
| (dollars in millions) | (%) | |||||||||||||||
| Net interest income |
$ | 2,197 | $ | 2,204 | $ | (7 | ) | — | ||||||||
| Noninterest income |
1,187 | 1,128 | 59 | 5 | % | |||||||||||
|
|
|
|
|
|
|
|||||||||||
| Total revenue |
3,384 | 3,332 | 52 | 2 | ||||||||||||
| Noninterest expense |
2,691 | 2,524 | 167 | 7 | ||||||||||||
|
|
|
|
|
|
|
|||||||||||
| Profit before provision for credit losses |
693 | 808 | (115 | ) | (14 | ) | ||||||||||
| Provision for credit losses |
408 | 400 | 8 | 2 | ||||||||||||
|
|
|
|
|
|
|
|||||||||||
| Income before income tax expense |
285 | 408 | (123 | ) | (30 | ) | ||||||||||
| Income tax expense |
100 | 143 | (43 | ) | (30 | ) | ||||||||||
|
|
|
|
|
|
|
|||||||||||
| Net income |
$ | 185 | $ | 265 | $ | (80 | ) | (30 | ) | |||||||
|
|
|
|
|
|
|
|||||||||||
| Loans and leases and loans held for sale (period-end)(1) |
$ | 46,289 | $ | 46,116 | $ | 173 | — | |||||||||
| Average Balances: |
||||||||||||||||
| Total assets |
$ | 47,824 | $ | 46,071 | $ | 1,753 | 4 | |||||||||
| Loans and leases and loans held for sale(1) |
46,455 | 44,605 | 1,850 | 4 | ||||||||||||
| Deposits and deposits held for sale |
70,812 | 68,881 | 1,931 | 3 | ||||||||||||
| Interest-earning assets |
46,479 | 44,664 | 1,815 | 4 | ||||||||||||
| Key Metrics: |
||||||||||||||||
| Net interest margin |
4.73 | % | 4.93 | % | (20 | )bps | — | |||||||||
| Efficiency ratio(1) |
79.45 | % | 75.78 | % | 367 | bps | — | |||||||||
| Average loans to average deposits ratio |
65.60 | % | 64.76 | % | 84 | bps | — | |||||||||
| Return on average total tangible assets(2) |
0.39 | % | 0.57 | % | (18 | )bps | — | |||||||||
| Return on average tangible common equity(2)(3) |
4.89 | % | 7.71 | % | (282 | )bps | — | |||||||||
| (1) | Loans held for sale includes mortgage loans originated for sale. |
| (2) | These are non-GAAP financial measures. For more information on the computation of these non-GAAP financial measures, see “—Principal Components of Operations and Key Performance Metrics Used By Management—Key Performance Metrics and Non-GAAP Financial Measures.” |
| (3) | Operating segments are allocated capital on a risk-adjusted basis considering economic and regulatory capital requirements. We approximate that regulatory capital is equivalent to a sustainable target level for common equity Tier 1 and then allocate that approximation to the segments based on economic capital. |
Consumer Banking net income of $185 million in 2012 decreased $80 million, or 30%, compared to $265 million in 2011, as a 2% increase in total revenue was more than offset by a 7% increase in noninterest expense. 2012 results included a $75 million ($48 million after tax) gain on the sale of Visa class B shares in noninterest income and a $138 million ($87 million after tax) overdraft charge litigation settlement in noninterest expense. Excluding these unusual items, net income totaled $224 million and decreased $41 million, or 15% from 2011, largely reflecting the impact of regulatory changes on fee income and lower net interest income driven by the continued low-rate environment.
Net interest income was largely unchanged at $2.2 billion as the benefit of loan growth of 4% and a 3% increase in deposits was offset by the impact of declining loan yields and deposit spreads, which drove a 20 basis point decrease in net interest margin in the face of the continued low-rate environment.
Noninterest income of $1.2 billion in 2012 increased $59 million, or 5%, compared to 2011. 2012 results included the benefit of a $75 million gain on Visa class B shares. Excluding this gain,
114
Table of Contents
noninterest income decreased $16 million as a $128 million increase in mortgage banking fees was more than offset by the effect of regulatory changes that drove a $98 million decrease in debit card fees and a $44 million decrease in service charges. 2012 mortgage banking fees reflected a $1.4 billion increase in origination volumes, and higher secondary market sale gains.
Noninterest expense of $2.7 billion in 2012 increased $167 million, or 7%, from 2011, driven by the overdraft litigation settlement. Excluding this settlement, noninterest expense of $2.6 billion increased $29 million, reflecting higher salaries and employee benefits tied to investments in mortgage and wealth as well as investments in technology and risk management infrastructure, partially offset by lower costs related to our branch network.
Provision for credit losses of $408 million increased 2% largely reflecting increased losses in consumer real estate secured.
Commercial Banking
| As of and for the Year Ended December 31, |
||||||||||||||||
| 2012 | 2011 | Change | Percent | |||||||||||||
| (dollars in millions) | (%) | |||||||||||||||
| Net interest income |
$ | 1,036 | $ | 929 | $ | 107 | 12 | % | ||||||||
| Noninterest income |
349 | 343 | 6 | 2 | ||||||||||||
|
|
|
|
|
|
|
|||||||||||
| Total revenue |
1,385 | 1,272 | 113 | 9 | ||||||||||||
| Noninterest expense |
625 | 605 | 20 | 3 | ||||||||||||
|
|
|
|
|
|
|
|||||||||||
| Profit before provision for credit losses |
760 | 667 | 93 | 14 | ||||||||||||
| Provision for credit losses |
63 | 92 | (29 | ) | (32 | ) | ||||||||||
|
|
|
|
|
|
|
|||||||||||
| Income before income tax expense |
697 | 575 | 122 | 21 | ||||||||||||
| Income tax expense |
244 | 202 | 42 | 21 | ||||||||||||
|
|
|
|
|
|
|
|||||||||||
| Net income |
$ | 453 | $ | 373 | $ | 80 | 21 | |||||||||
|
|
|
|
|
|
|
|||||||||||
| Loans and leases and loans held for sale (period-end) |
$ | 34,384 | $ | 30,776 | $ | 3,608 | 12 | |||||||||
| Average Balances: |
||||||||||||||||
| Total assets |
$ | 33,474 | $ | 29,800 | $ | 3,674 | 12 | |||||||||
| Loans and leases and loans held for sale |
32,499 | 28,763 | 3,736 | 13 | ||||||||||||
| Deposits and deposits held for sale |
17,650 | 17,725 | (75 | ) | — | |||||||||||
| Interest-earning assets |
32,600 | 28,914 | 3,686 | 13 | ||||||||||||
| Key Metrics: |
||||||||||||||||
| Net interest margin |
3.18 | % | 3.21 | % | (3 | )bps | — | |||||||||
| Efficiency ratio(1) |
45.22 | % | 47.55 | % | (233 | )bps | — | |||||||||
| Average loans to average deposits ratio |
184.13 | % | 162.28 | % | 2,185 | bps | — | |||||||||
| Return on average total tangible assets(1) |
1.35 | % | 1.25 | % | 10 | bps | — | |||||||||
| Return on average tangible common equity(1)(2) |
12.45 | % | 10.81 | % | 164 | bps | — | |||||||||
| (1) | These are non-GAAP financial measures. For more information on the computation of these non-GAAP financial measures, see “—Principal Components of Operations and Key Performance Metrics Used By Management—Key Performance Metrics and Non-GAAP Financial Measures.” |
| (2) | Operating segments are allocated capital on a risk-adjusted basis considering economic and regulatory capital requirements. We approximate that regulatory capital is equivalent to a sustainable target level for common equity Tier 1 and then allocate that approximation to the segments based on economic capital. |
115
Table of Contents
Commercial Banking net income of $453 million in 2012 increased $80 million, or 21%, from $373 million in 2011, driven by growth in net interest income and improvement in credit quality. Total revenue rose 9% reflecting a 12% increase in net interest income and relatively flat noninterest income.
Net interest income of $1.0 billion in 2012 increased $107 million as the benefit of average loan growth of 13%, largely in middle market, mid-corporate, and asset finance, was partially offset by a 3 basis point decline in net interest margin, given the continued low interest rate environment. Deposits remained relatively stable at $17.7 billion but deposit costs improved as $3.2 billion migrated from interest-bearing to noninterest-bearing accounts.
Noninterest income of $349 million in 2012 increased $6 million, or 2%, from 2011, largely due to growth in capital markets fee income.
Noninterest expense of $625 million in 2012 increased $20 million driven by higher salary and benefits cost due to staffing investments.
Average loans and leases increased $3.7 billion, or 13%, in 2012 on increased loan origination activity across the majority of the commercial lines of business. Average deposit balances were relatively flat at $17.7 billion; however, the mix of deposits improved, driven by a $3.2 billion increase in noninterest-bearing demand deposits, which offset reductions in interest-bearing balances.
Provision for credit losses of $63 million in 2012 decreased from $92 million in 2011 as overall credit quality improved.
Other
| As of and for the Year Ended December 31, |
||||||||||||||||
| 2012 | 2011 | Change | Percent | |||||||||||||
| (dollars in millions) | (%) | |||||||||||||||
| Net interest (expense) income |
$ | (6 | ) | $ | 187 | $ | (193 | ) | (103 | )% | ||||||
| Noninterest income |
131 | 240 | (109 | ) | (45 | ) | ||||||||||
|
|
|
|
|
|
|
|||||||||||
| Total revenue |
125 | 427 | (302 | ) | (71 | ) | ||||||||||
| Noninterest expense |
141 | 242 | (101 | ) | (42 | ) | ||||||||||
|
|
|
|
|
|
|
|||||||||||
| (Loss) profit before provision for credit losses |
(16 | ) | 185 | (201 | ) | (109 | ) | |||||||||
| Provision for credit losses |
(58 | ) | 390 | (448 | ) | (115 | ) | |||||||||
|
|
|
|
|
|
|
|||||||||||
| Income (loss) before income tax expense (benefit) |
42 | (205 | ) | 247 | 120 | |||||||||||
| Income tax expense (benefit) |
37 | (73 | ) | 110 | 151 | |||||||||||
|
|
|
|
|
|
|
|||||||||||
| Net income (loss) |
$ | 5 | $ | (132 | ) | $ | 137 | 104 | ||||||||
|
|
|
|
|
|
|
|||||||||||
| Total loans and leases and loans held for sale (period-end) |
$ | 7,221 | $ | 10,467 | $ | (3,246 | ) | (31 | ) | |||||||
| Average Balances: |
||||||||||||||||
| Total assets |
$ | 46,368 | $ | 52,473 | $ | (6,105 | ) | (12 | ) | |||||||
| Loans and leases and loans held for sale |
8,558 | 13,591 | (5,033 | ) | (37 | ) | ||||||||||
| Deposits and deposits held for sale |
4,896 | 4,839 | 57 | 1 | ||||||||||||
| Interest-earning assets |
32,065 | 38,144 | (6,079 | ) | (16 | ) | ||||||||||
Other recorded net income of $5 million for the year ended December 31, 2012 compared with a net loss of $132 million for the year ended December 31, 2011, as the benefit of a $448 million decrease in provision for credit losses and a $101 million decrease in noninterest expense was partially offset by a $193 million decrease in net interest income and a $109 million decrease in noninterest income.
116
Table of Contents
Net interest income in 2012 decreased $193 million to a loss of $6 million compared to $187 million in 2011. The decrease was driven by a $4.3 billion reduction in average non-core loan balances and a decrease in residual net interest income related to funds transfer pricing, partially offset by the benefit of a $201 million decrease in our pay fixed swaps expense.
Noninterest income of $131 million in 2012 decreased $109 million, or 45%, from $240 million in 2011. The decrease primarily resulted from lower net gains on sale of securities available for sale of $67 million, a $23 million loss on sale of non-core loans in 2012 and higher net loss on venture capital investments of $20 million.
The provision for credit losses within Other mainly represents the residual change in the consolidated allowance for credit losses after attributing the respective net charge-offs to the Consumer Banking and Commercial Banking segments. It also includes net charge-offs related to the non-core portfolio. The provision was a negative $58 million in 2012, and was a decrease of $448 million from $390 million in 2011. Non-core net charge-offs were $393 million and $653 million in 2012 and 2011, respectively, resulting from improved credit quality and continued runoff in the portfolio. The 2012 provision for credit losses included a release of $462 million from the allowance for credit losses (the amount by which net charge-offs exceeded the provision), compared with a release of $283 million in 2011.
Noninterest expense of $141 million in 2012 decreased $101 million from $242 million in 2011. The decrease reflected lower loan collection costs for non-core loans, and lower restructuring charges primarily related to lease termination expenses and lower amortization of intangible assets, partially offset by a $77 million settlement of defined benefit pension plan obligations to vested former employees.
Analysis of Financial Condition—June 30, 2014 Compared with December 31, 2013
Loans and Leases
The following table shows the composition of loans and leases, including non-core loans:
| June 30, 2014 |
December 31, 2013 |
Change | Percent | |||||||||||||
| (dollars in millions) | (%) | |||||||||||||||
| Commercial |
$ | 30,076 | $ | 28,667 | $ | 1,409 | 5 | % | ||||||||
| Commercial real estate |
7,158 | 6,948 | 210 | 3 | ||||||||||||
| Leases |
3,740 | 3,780 | (40 | ) | (1 | ) | ||||||||||
|
|
|
|
|
|
|
|||||||||||
| Total commercial |
40,974 | 39,395 | 1,579 | 4 | ||||||||||||
|
|
|
|
|
|
|
|||||||||||
| Residential, including originated home equity products |
30,116 | 29,694 | 422 | 1 | ||||||||||||
| Home equity products serviced by others |
1,972 | 2,171 | (199 | ) | (9 | ) | ||||||||||
| Other secured retail |
12,180 | 10,700 | 1,480 | 14 | ||||||||||||
| Unsecured retail |
3,587 | 3,899 | (312 | ) | (8 | ) | ||||||||||
|
|
|
|
|
|
|
|||||||||||
| Total retail |
47,855 | 46,464 | 1,391 | 3 | ||||||||||||
|
|
|
|
|
|
|
|||||||||||
| Total loans and leases(1)(2) |
$ | 88,829 | $ | 85,859 | $ | 2,970 | 3 | % | ||||||||
|
|
|
|
|
|
|
|||||||||||
| (1) | Excluded from the table above are loans held for sale totaling $262 million and $1.3 billion as of June 30, 2014 and December 31, 2013, respectively. Loans held for sale as of December 31, 2013 primarily related to the Chicago Divestiture. For further discussion, see Note 13 “Divestitures and Branch Assets and Liabilities Held for Sale” to our unaudited interim consolidated financial statements included elsewhere in this prospectus. |
| (2) | Mortgage loans serviced for others by the Company’s subsidiaries are not included above, and amounted to $18.3 billion and $18.7 billion at June 30, 2014 and December 31, 2013, respectively. |
117
Table of Contents
Our loans and leases are disclosed in portfolio segments and classes. Our loan and lease portfolio segments are commercial and retail. The classes of loans and leases are: commercial, commercial real estate, leases, residential (includes residential mortgages and home equity loans and lines of credit), home equity products serviced by others (includes certain purchased home equity loans and lines of credit), other secured retail (includes automobile loans and other installment loans) and unsecured retail (includes student loans and credit card).
As of June 30, 2014, our loans and leases portfolio increased $3.0 billion, or 3%, to $88.8 billion compared to $85.9 billion as of December 31, 2013, primarily reflecting increases in total retail loans and total commercial loans and leases. As of June 30, 2014, our total commercial loans and leases grew $1.6 billion, or 4%, to $41.0 billion compared to $39.4 billion as of December 31, 2013 in large part due to growth in commercial loans, primarily in mid-corporate. As of June 30, 2014, our total retail loans increased $1.4 billion, or 3%, to $47.9 billion compared to $46.5 billion as of December 31, 2013, primarily due to increases in our other secured retail portfolio of 14% driven mainly by the purchase of auto loans and stronger originations, and our residential, including originated home equity products of 1%, but offset by decreases in our home equity products serviced by others and unsecured retail of 9% and 8%, respectively, as of June 30, 2014 compared to December 31, 2013. The decrease in our home equity products serviced by others is due to runoff and the decrease in our unsecured loans is due to the sale of student loans.
Non-Core Assets
The table below shows the composition of our non-core assets as of the dates indicated:
| June 30, 2014 |
December 31, 2013 |
(Date of Designation) June 30, 2009 |
Change from 2014-2013 |
Change from 2014-2009 |
||||||||||||||||
| (dollars in millions) | (%) | (%) | ||||||||||||||||||
| Commercial |
$ | 87 | $ | 108 | $ | 1,900 | (19 | )% | (95 | )% | ||||||||||
| Commercial real estate |
297 | 381 | 3,412 | (22 | ) | (91 | ) | |||||||||||||
|
|
|
|
|
|
|
|||||||||||||||
| Total commercial |
384 | 489 | 5,312 | (21 | ) | (93 | ) | |||||||||||||
| Residential, including originated home equity products |
651 | 705 | 2,082 | (8 | ) | (69 | ) | |||||||||||||
| Home equity products serviced by others |
1,976 | 2,160 | 6,180 | (9 | ) | (68 | ) | |||||||||||||
| Other secured retail(1) |
— | — | 4,037 | — | (100 | ) | ||||||||||||||
| Unsecured retail |
382 | 406 | 2,490 | (6 | ) | (85 | ) | |||||||||||||
|
|
|
|
|
|
|
|||||||||||||||
| Total retail |
3,009 | 3,271 | 14,789 | (8 | ) | (80 | ) | |||||||||||||
|
|
|
|
|
|
|
|||||||||||||||
| Total non-core loans |
3,393 | 3,760 | 20,101 | (10 | ) | (83 | ) | |||||||||||||
|
|
|
|
|
|
|
|||||||||||||||
| Other assets |
65 | 81 | 378 | (20 | ) | (83 | ) | |||||||||||||
|
|
|
|
|
|
|
|||||||||||||||
| Total non-core assets |
$ | 3,458 | $ | 3,841 | $ | 20,479 | (10 | )% | (83 | )% | ||||||||||
|
|
|
|
|
|
|
|||||||||||||||
| (1) | Other secured retail loans were either paid down, charged off, sold or transferred to the core loan portfolio by December 31, 2011. |
Non-core assets are primarily loans inconsistent with our strategic goals, generally as a result of geographic location, industry, product type or risk level. We have actively managed these loans down since they were designated as non-core on June 30, 2009. Between that time and June 30, 2014, the portfolio has decreased $17.0 billion, including principal repayments of $9.1 billion; charge-offs of $3.8 billion; transfers back to the core portfolio of $2.8 billion; and sales of $1.3 billion.
118
Table of Contents
Transfers from non-core back to core are handled on an individual request basis and managed through the chief credit officer for our non-core portfolio. The rationale can vary and in the past some loan portfolio transfers have been approved after determination that the original decision to place them in non-core was not deemed appropriate. Individual loans can be reconsidered when the customer prospects change—typically related to situations where a non-strategic customer becomes a strategic customer due to growth or a new credit request that was previously considered to be unlikely.
At June 30, 2014, the non-core portfolio totaled $3.5 billion and has declined 10% since December 31, 2013 and over 83% since the designation of the non-core portfolios in 2009. Commercial non-core loan balances declined 21% compared to December 31, 2013, ending at $384 million compared to $489 million at December 31, 2013. Retail non-core loan balances of $3.0 billion decreased 8% or $262 million compared to December 31, 2013.
The largest component of our non-core portfolio is our home equity products currently or formerly serviced by other firms, or SBO, portfolio. The SBO portfolio is a liquidating portfolio consisting of pools of home equity loans and lines of credit purchased between 2003 and 2007. Although our SBO portfolio consists of loans that were initially serviced by others, we now service a portion of this portfolio internally. SBO balances serviced externally totaled $1.2 billion and $1.3 billion as of June 30, 2014 and December 31, 2013, respectively. The SBO portfolio has been closed to new purchases since the third quarter of 2007, with exposure down to $2.0 billion as of June 30, 2014 compared to $2.2 billion as of December 31, 2013. The SBO portfolio represented 6% of the entire real estate portfolio and 4% of the overall retail loan portfolio as of June 30, 2014.
The credit profile of the SBO portfolio is significantly weaker than the core real estate portfolio, with a weighted-average refreshed FICO score of 714 and combined loan to value (CLTV) of 98.6% as of June 30, 2014. The proportion of the portfolio in a second lien (subordinated) position is 95%. The amount of the portfolio in out of footprint geographies is 72.5%, with 28.8% concentrated in California, Nevada, Arizona and Florida.
Credit performance continues to improve due to portfolio liquidation (the lowest performing loans have already been charged off), more effective account servicing and collection strategies, and improvements in the real estate market. The delinquency rate of more than 90 days past due was 1.6% as of June 30, 2014, and decreased by 14 basis points from December 31, 2013. The SBO portfolio had a charge-off rate of 2.4% for the six months ended June 30, 2014 and a cumulative (inception to date) charge-off rate of 26.7% as of June 30, 2014.
Allowance for Credit Losses and Nonperforming Assets
We and our banking subsidiaries, CBNA and CBPA, maintain an allowance for credit losses, consisting of an allowance for loan and lease losses and a reserve for unfunded lending commitments. This allowance is created through charges to income, or provision for credit losses, and is maintained at an appropriate level adequate to absorb anticipated losses and is determined in accordance with GAAP. For further information on our processes to determine our allowance for credit losses, see “—Critical Accounting Estimates—Allowance for Credit Losses,” Note 4 “Allowance for Credit Losses, Nonperforming Assets, and Concentrations of Credit Risk,” to our unaudited interim consolidated financial statements and Note 1 “Significant Accounting Policies,” to our audited consolidated financial statements included elsewhere in this prospectus.
The allowance for credit losses totaled $1.3 billion at June 30, 2014 and December 31, 2013. Our allowance for loan and lease losses was 1.36% of total loans and leases and 101% of nonperforming loans and leases as of June 30, 2014 compared with 1.42% and 86% as of December 31, 2013. The total loan portfolio credit performance continued to improve across all credit measures in the
119
Table of Contents
six months ended June 30, 2014. Net charge-offs for the six months ended June 30, 2014 of $155 million decreased 39% compared to $255 million for the six months ended June 30, 2013, primarily driven by decreases in the non-core, real estate secured and unsecured retail portfolios. The portfolio annualized net charge-off rate declined to 0.36% for the six months ended June 30, 2014 from 0.60% for the six months ended June 30, 2013. The delinquency rate improved to 1.6% as of June 30, 2014 from 1.9% at December 31, 2013. Nonperforming loans and leases totaled $1.2 billion, or 1.35%, of the total portfolio as of June 30, 2014 as compared to $1.4 billion, or 1.65%, of the total loan portfolio as of December 31, 2013. At June 30, 2014, $621 million of nonperforming loans and leases had been designated as impaired and had no specific allowance because they had been written down to the fair value of their collateral. These loans included $547 million of retail loans and $74 million of commercial loans. Excluding impaired loans that have been written down to their net realizable value, the allowance to nonperforming loans ratio totaled 209% at June 30, 2014 as compared to 151% at December 31, 2013.
Commercial Loan Asset Quality
Our commercial loan portfolio consists of traditional commercial and commercial real estate loans. The portfolio is focused primarily on in-footprint customers where our local delivery model provides for strong client connectivity.
For commercial loans and leases, we use regulatory classification ratings to monitor credit quality. Loans with a “pass” rating are those that we believe will be fully repaid in accordance with the contractual loan terms. Commercial loans and leases that are “criticized” are those that have some weakness that indicates an increased probability of future loss. See Note 4 “Allowance for Credit Losses, Nonperforming Assets and Concentrations of Credit Risk,” to our unaudited interim consolidated financial statements included elsewhere in this prospectus.
During the six months ended June 30, 2014, the quality of the commercial loan portfolio remained steady. As of June 30, 2014, total criticized loans decreased to 4.3%, or $1.8 billion, of the commercial loan portfolio compared to 4.9%, or $1.9 billion, at December 31, 2013. Commercial real estate criticized balances decreased 23% to 6.3%, or $451 million, of the commercial real estate portfolio compared to 8.4%, or $582 million, as of December 31, 2013. Commercial real estate accounted for 25.4% of the criticized loans as of June 30, 2014, compared to 30.4% as of December 31, 2013.
Nonperforming balances and charge-offs have displayed a positive trend in the first half of 2014. As of June 30, 2014, nonperforming commercial balances decreased $70 million, or 26%, to $195 million, compared to $265 million as of December 31, 2013, with a 23% decline in commercial real estate nonperforming loans over the same period. As of June 30, 2014, nonperforming commercial loans stood at 0.5% of the commercial loan portfolio compared to 0.7% as of December 31, 2013. Net charge-offs in our commercial loan portfolio for the six months ended June 30, 2014 reflected a net recovery of $21 million compared to a net recovery of $2 million for the six months ended June 30, 2013. Charge-off performance continues to be positively influenced by recoveries and lower gross losses driven by improved economic conditions and a strategic focus on high quality new business; however, this favorable trend is expected to reduce as recovery opportunities dissipate. See “—Key Factors Affecting Our Business—Credit Trends” for further details.
Retail Loan Asset Quality
For retail loans, we primarily use the loan’s payment and delinquency status to monitor credit quality. The further a loan is past due, the greater the likelihood of future credit loss. These credit quality indicators are continually updated and monitored. Our retail loan portfolio remains predominantly focused on lending across the New England, Mid-Atlantic and Midwest regions, with
120
Table of Contents
continued geographic expansion outside the footprint with the auto finance and student lending portfolios. Originations within the footprint are primarily initiated through the branch network, whereas out-of-footprint lending is driven by indirect auto loans in dealer networks and student loans via our online platform.
The credit composition of our retail loan portfolio at June 30, 2014 remained favorable and well positioned across all product lines with an average refreshed FICO score of 753, down one point from December 31, 2013. Our real estate combined loan to value ratio, or CLTV, is calculated as the mortgage amount divided by the appraised value of the property and was 68.1% as of June 30, 2014 compared to 67.8% as of December 31, 2013. Excluding the SBO portfolio, the real estate CLTV was 65.9% as of June 30, 2014 compared to 65.1% as of December 31, 2013. The net charge-off rate (core and non-core) of 0.76% for the six months ended June 30, 2014 decreased 34 basis points from the same period in 2013. The overall rate of delinquency more than 30 days past due improved 30 basis points to 2.3% as of June 30, 2014, from 2.6% as of December 31, 2013. The improvement was driven by residential mortgage, home equity and student loans.
Nonperforming retail loans as a percentage of total retail loans were 2.1% as of June 30, 2014, an improvement of 38 basis points from December 31, 2013. The improvement in nonperforming retail loans was primarily driven by transfers of troubled debt restructurings (“TDRs”) from nonaccrual to accrual status.
Special Topics—HELOC Payment Shock
For further information regarding the possible HELOC payment shock, see “—Key Factors Affecting Our Business—HELOC Payment Shock.”
Troubled Debt Restructuring
TDR is the classification given to a loan that has been restructured in a manner that grants a concession to a borrower that is experiencing financial hardship that we would not otherwise make. TDRs typically result from our loss mitigation efforts and are undertaken in order to improve the likelihood of recovery and continuity of the relationship. Our loan modifications are handled on a case by case basis and are negotiated to achieve mutually agreeable terms that maximize loan collectability and meet our borrower’s financial needs. The types of concessions include interest rate reductions, term extensions, principal forgiveness and other modifications to the structure of the loan that fall outside lending policy. Depending on the specific facts and circumstances of the customer, restructuring can involve loans moving to nonaccrual, remaining on nonaccrual or continuing on accrual status. As of June 30, 2014, we had $1.2 billion classified as retail TDRs, of which 31% were in nonaccrual status. Within this nonaccrual population, 53.6% were current in payment. TDRs generally return to accrual status once repayment capacity and appropriate payment history can be established. TDRs are evaluated for impairment individually. Loans are classified as TDRs until paid off, sold or refinanced at market terms.
For additional information regarding the troubled debt restructurings, see Note 4 “Allowance for Credit Losses, Nonperforming Assets and Concentrations of Credit Risk” to our unaudited interim consolidated financial statements and Note 1 “Significant Accounting Policies” to our audited consolidated financial statements included elsewhere in this prospectus.
121
Table of Contents
The table below presents our retail TDRs in delinquent status as of June 30, 2014:
| June 30, 2014 | ||||||||||||||||
| Current | 30-89 Days Past Due |
90+ Days Past Due |
Total | |||||||||||||
| (in millions) | ||||||||||||||||
| Recorded Investment: |
||||||||||||||||
| Residential, including originated home equity products |
$ | 700 | $ | 39 | $ | 139 | $ | 878 | ||||||||
| Home equity products serviced by others |
96 | 8 | 5 | 109 | ||||||||||||
| Other secured retail |
27 | 3 | 1 | 31 | ||||||||||||
| Unsecured retail |
187 | 10 | 3 | 200 | ||||||||||||
|
|
|
|
|
|
|
|
|
|||||||||
| Total |
$ | 1,010 | $ | 60 | $ | 148 | $ | 1,218 | ||||||||
|
|
|
|
|
|
|
|
|
|||||||||
The table below presents the accrual status of our retail TDRs as of June 30, 2014:
| June 30, 2014 | ||||||||||||
| Accruing | Nonaccruing | Total | ||||||||||
| (in millions) | ||||||||||||
| Recorded Investment: |
||||||||||||
| Residential, including originated home equity products |
$ | 540 | $ | 338 | $ | 878 | ||||||
| Home equity products serviced by others |
75 | 34 | 109 | |||||||||
| Other secured retail |
23 | 8 | 31 | |||||||||
| Unsecured retail |
198 | 2 | 200 | |||||||||
|
|
|
|
|
|
|
|||||||
| Total |
$ | 836 | $ | 382 | $ | 1,218 | ||||||
|
|
|
|
|
|
|
|||||||
122
Table of Contents
Securities
Our securities portfolio is managed to seek return while maintaining prudent levels of quality, market risk and liquidity. The following table presents our securities available for sale and held to maturity portfolios:
| June 30, 2014 | December 31, 2013 | Change in Fair Value |
||||||||||||||||||
| Amortized Cost |
Fair Value | Amortized Cost |
Fair Value | |||||||||||||||||
| (dollars in millions) | (%) | |||||||||||||||||||
| Securities Available for Sale: |
||||||||||||||||||||
| U.S. Treasury |
$ | 15 | $ | 15 | $ | 15 | $ | 15 | — | |||||||||||
| State and political subdivisions |
10 | 10 | 11 | 10 | — | |||||||||||||||
| Mortgage-backed securities: |
||||||||||||||||||||
| Federal agencies and U.S. government sponsored entities |
17,343 | 17,585 | 14,970 | 14,993 | 17 | % | ||||||||||||||
| Other/non-agency |
887 | 858 | 992 | 952 | (10 | ) | ||||||||||||||
|
|
|
|
|
|
|
|
|
|||||||||||||
| Total mortgage-backed securities |
18,230 | 18,443 | 15,962 | 15,945 | 16 | |||||||||||||||
|
|
|
|
|
|
|
|
|
|||||||||||||
| Total debt securities |
18,255 | 18,468 | 15,988 | 15,970 | 16 | |||||||||||||||
|
|
|
|
|
|
|
|
|
|||||||||||||
| Marketable equity securities |
10 | 13 | 10 | 13 | — | |||||||||||||||
| Other equity securities |
12 | 12 | 12 | 12 | — | |||||||||||||||
|
|
|
|
|
|
|
|
|
|||||||||||||
| Total equity securities |
22 | 25 | 22 | 25 | — | |||||||||||||||
|
|
|
|
|
|
|
|
|
|||||||||||||
| Total securities available for sale |
$ | 18,277 | $ | 18,493 | $ | 16,010 | $ | 15,995 | 16 | % | ||||||||||
|
|
|
|
|
|
|
|
|
|||||||||||||
| Securities Held to Maturity: |
||||||||||||||||||||
| Mortgage-backed securities: |
||||||||||||||||||||
| Federal agencies and U.S. government sponsored entities |
$ | 3,897 | $ | 3,898 | $ | 2,940 | $ | 2,907 | 34 | % | ||||||||||
| Other/non-agency |
1,485 | 1,500 | 1,375 | 1,350 | 11 | |||||||||||||||
|
|
|
|
|
|
|
|
|
|||||||||||||
| Total securities held to maturity |
5,382 | 5,398 | 4,315 | 4,257 | 27 | |||||||||||||||
|
|
|
|
|
|
|
|
|
|||||||||||||
| Total securities available for sale and held to maturity |
$ | 23,659 | $ | 23,891 | $ | 20,325 | $ | 20,252 | 18 | % | ||||||||||
|
|
|
|
|
|
|
|
|
|||||||||||||
As of June 30, 2014, the fair value of the securities available for sale and held to maturity portfolios increased by $3.6 billion, or 18%, to $23.9 billion, compared to $20.3 billion as of December 31, 2013. U.S. Government-guaranteed notes and GSE-issued mortgage-backed securities comprise the majority of the securities portfolio holdings. Reinvestments have been directed predominantly into fixed-rate mortgage-backed securities, and as of June 30, 2014, the portfolio had an average expected life of 4.5 years.
The investment portfolio includes higher quality, highly liquid investments reflecting our ongoing commitment to maintaining appropriate contingent liquidity and pledging capacity. The portfolio composition has also been dominated by holdings backed by mortgages so that they can be pledged to the Federal Home Loan Banks (“FHLBs”). This has become increasingly important due to the enhanced liquidity requirements of the Liquidity Coverage Ratio (“LCR”). For further discussion of the LCR, see “Regulation and Supervision—Liquidity Standards.”
For the six months ended June 30, 2014, the securities portfolio income of the securities available for sale and held to maturity portfolios increased $74 million, or 35%, to $286 million compared to $212 million for the six months ended June 30, 2013, and the yield on the portfolio was 2.48%. The portfolio yield decreased by one basis point, driven by faster prepayments in the mortgage-backed
123
Table of Contents
securities portfolio. For the six months ended June 30, 2014, mortgage-backed securities maturities, principal paydowns, and sales totaled $1.5 billion and mortgage-backed securities purchases totaled $5.5 billion.
Deposits
The table below presents the major components of our deposits:
| June 30, 2014 |
December 31, 2013 |
Change | Percent | |||||||||||||
| (dollars in millions) | (%) | |||||||||||||||
| Demand |
$ | 26,670 | $ | 24,931 | $ | 1,739 | 7 | % | ||||||||
| Checking with interest |
15,171 | 13,630 | 1,541 | 11 | ||||||||||||
| Regular savings |
7,829 | 7,509 | 320 | 4 | ||||||||||||
| Money market accounts |
31,687 | 31,245 | 442 | 1 | ||||||||||||
| Term deposits |
10,299 | 9,588 | 711 | 7 | ||||||||||||
|
|
|
|
|
|
|
|||||||||||
| Total deposits |
91,656 | 86,903 | 4,753 | 5 | ||||||||||||
|
|
|
|
|
|
|
|||||||||||
| Deposits held for sale |
— | 5,277 | (5,277 | ) | (100 | ) | ||||||||||
|
|
|
|
|
|
|
|||||||||||
| Total deposits and deposits held for sale |
$ | 91,656 | $ | 92,180 | $ | (524 | ) | (1 | )% | |||||||
|
|
|
|
|
|
|
|||||||||||
Including the impact of the sale of the deposits in connection with the Chicago Divestiture, total deposits and deposits held for sale as of June 30, 2014 declined $524 million, or 1%, compared to December 31, 2013. Excluding the impact of deposits held for sale, total deposits as of June 30, 2014, increased $4.8 billion, or 5%, to $91.7 billion compared to $86.9 billion as of December 31, 2013. All categories of deposits increased, led by demand deposits, which increased $1.7 billion, or 7%.
Borrowed Funds
The tables below present our borrowed funds.
The following is a summary of our short-term borrowed funds:
| June 30, 2014 |
December 31, 2013 |
|||||||
| (in millions) | ||||||||
| Federal funds purchased |
$ | — | $ | 689 | ||||
| Securities sold under agreements to repurchase |
6,807 | 4,102 | ||||||
| Other short-term borrowed funds |
7,702 | 2,251 | ||||||
|
|
|
|
|
|||||
| Total short-term borrowed funds |
$ | 14,509 | $ | 7,042 | ||||
|
|
|
|
|
|||||
124
Table of Contents
Key data related to short-term borrowed funds is presented in the following table:
| For the Six Months Ended June 30, 2014 |
For the Year Ended December 31, 2013 |
For the Six Months Ended June 30, 2013 |
||||||||||
| (dollars in millions) | ||||||||||||
| Weighted-average interest rate at period end: |
||||||||||||
| Federal funds purchased and securities sold under agreements to repurchase |
0.12 | % | 0.09 | % | 0.04 | % | ||||||
| Other short-term borrowed funds |
0.27 | % | 0.20 | % | 2.25 | % | ||||||
| Maximum amount outstanding at month-end during the period: |
||||||||||||
| Federal funds purchased and securities sold under agreements to repurchase |
$ | 7,022 | $ | 5,114 | $ | 3,371 | ||||||
| Other short-term borrowed funds |
7,702 | 2,251 | 750 | |||||||||
| Average amount outstanding during the period: |
||||||||||||
| Federal funds purchased and securities sold under agreements to repurchase |
$ | 5,708 | $ | 2,400 | $ | 1,925 | ||||||
| Other short-term borrowed funds |
4,838 | 259 | 279 | |||||||||
| Weighted-average interest rate during the period: |
||||||||||||
| Federal funds purchased and securities sold under agreements to repurchase |
0.11 | % | 0.31 | % | 0.04 | % | ||||||
| Other short-term borrowed funds |
0.26 | % | 0.44 | % | 0.26 | % | ||||||
The following is a summary of our long-term borrowed funds:
| June 30, 2014 |
December 31, 2013 |
|||||||
| (in millions) | ||||||||
| Citizens Financial Group, Inc.: |
||||||||
| 4.150% fixed rate subordinated debt, due 2022 |
$ | 350 | $ | 350 | ||||
| 5.158% fixed-to-floating rate subordinated debt, (LIBOR + 3.56%) callable, due 2023(1) |
333 | 333 | ||||||
| 4.771% fixed rate subordinated debt, due 2023(1) |
333 | 333 | ||||||
| 4.691% fixed rate subordinated debt, due 2024(1) |
334 | 334 | ||||||
| 4.153% fixed rate subordinated debt, due 2024(1) |
333 | — | ||||||
| Banking Subsidiaries: |
||||||||
| Federal Home Loan advances due through 2033 |
24 | 25 | ||||||
| Other |
25 | 30 | ||||||
|
|
|
|
|
|||||
| Total long-term borrowed funds |
$ | 1,732 | $ | 1,405 | ||||
|
|
|
|
|
|||||
| (1) | Intercompany borrowed funds with the RBS Group. See “Our Relationship with the RBS Group and Certain Other Related Party Transactions—Relationship with the RBS Group—Other” and Note 14 “Related Party Transactions” to our unaudited interim consolidated financial statements included elsewhere in this prospectus. |
Short-term unsecured borrowed funds were minimal as of June 30, 2014. Other short-term borrowed funds include capital instruments and secured FHLB advances. The increase in total short-term borrowed funds relative to the December 31, 2013 balance reflected balance sheet growth, primarily securities. Additionally, asset liquidity is considered strong. As of June 30, 2014, unencumbered high-quality securities totaled $10.7 billion, unused FHLB capacity was approximately $1.6 billion and unencumbered loans pledged at the Federal Reserve Banks of $10.1 billion created additional contingent borrowing capacity of approximately $22.4 billion.
125
Table of Contents
Access to additional funding through repurchase agreements, collateralized borrowed funds or asset sales is available. Additionally, there is capacity to grow deposits. While access to short-term wholesale markets is limited, we have been able to meet our funding needs for the medium term with deposits and collateralized borrowed funds.
Derivatives
Historically, we have used pay-fixed swaps to synthetically lengthen liabilities and offset duration in fixed-rate assets. Given the material prepayment of fixed-rate mortgages and home equity loans since 2008, these swaps were no longer needed and have been terminated or allowed to run off, resulting in a reduction in the notional balance of these swaps to $1.0 billion as of June 30, 2014.
We use receive-fixed swaps to minimize the exposure to variability in the interest cash flows on our floating rate assets. This is reflected in the interest rate swaps line in the table below. As of June 30, 2014, a notional amount of $4.0 billion of receive-fixed swaps had been executed. The assets and liabilities recorded for derivatives designated as hedges reflect the fair value of these hedge instruments.
We also sell interest rate swaps and foreign exchange forwards to commercial customers. Offsetting swap and forward agreements are simultaneously transacted to minimize our market risk associated with the customer derivative products. The assets and liabilities recorded for derivatives not designated as hedges reflect the fair value of these transactions.
The table below presents our derivative assets and liabilities. For additional information regarding our derivative instruments, see Note 11 “Derivatives” to our unaudited interim consolidated financial statements included elsewhere in this prospectus.
| June 30, 2014 | December 31, 2013 | Changes in Net Liabilities |
||||||||||||||||||||||||||
| Notional Amount(1) |
Derivative Assets |
Derivative Liabilities |
Notional Amount(1) |
Derivative Assets |
Derivative Liabilities |
|||||||||||||||||||||||
| (dollars in millions) | (%) | |||||||||||||||||||||||||||
| Derivatives designated as hedging instruments: |
||||||||||||||||||||||||||||
| Interest rate swaps |
$ | 5,000 | $ | 23 | $ | 223 | $ | 5,500 | $ | 23 | $ | 412 | (49 | )% | ||||||||||||||
| Derivatives not designated as hedging instruments: |
||||||||||||||||||||||||||||
| Interest rate swaps |
28,381 | 611 | 522 | 29,355 | 654 | 558 | (7 | ) | ||||||||||||||||||||
| Foreign exchange contracts |
8,395 | 74 | 69 | 7,771 | 94 | 87 | (29 | ) | ||||||||||||||||||||
| Other contracts |
731 | 8 | 14 | 569 | 7 | 10 | 100 | |||||||||||||||||||||
|
|
|
|
|
|
|
|
|
|||||||||||||||||||||
| Total derivatives not designated as hedging instruments |
693 | 605 | 755 | 655 | (12 | ) | ||||||||||||||||||||||
|
|
|
|
|
|
|
|
|
|||||||||||||||||||||
| Gross derivative fair values |
716 | 828 | 778 | 1,067 | (61 | )% | ||||||||||||||||||||||
| Less: Gross amounts offset in the consolidated balance sheets(2) |
(81 | ) | (81 | ) | (128 | ) | (128 | ) | ||||||||||||||||||||
|
|
|
|
|
|
|
|
|
|||||||||||||||||||||
| Total net derivative fair values presented in the consolidated balance sheets(3) |
$ | 635 | $ | 747 | $ | 650 | $ | 939 | ||||||||||||||||||||
|
|
|
|
|
|
|
|
|
|||||||||||||||||||||
126
Table of Contents
| (1) | The notional or contractual amount of interest rate derivatives and foreign exchange contracts is the amount upon which interest and other payments under the contract are based. For interest rate derivatives, the notional amount is typically not exchanged. Therefore, notional amounts should not be taken as the measure of credit or market risk as they tend to greatly overstate the true economic risk of these contracts. |
| (2) | Amounts represent the impact of legally enforceable master netting agreements that allow us to settle positive and negative positions. |
| (3) | We also offset assets and liabilities associated with repurchase agreements on our consolidated balance sheets. See Note 2 “Securities” to our unaudited interim consolidated financial statements included elsewhere in this prospectus for further discussion. |
Analysis of Financial Condition—December 31, 2013 Compared with December 31, 2012
Loans and Leases
The following table shows the composition of loans and leases, including non-core loans:
| December 31, | Change | Percent | ||||||||||||||
| 2013 | 2012 | |||||||||||||||
| (dollars in millions) | (%) | |||||||||||||||
| Commercial |
$ | 28,667 | $ | 28,856 | $ | (189 | ) | (1 | )% | |||||||
| Commercial real estate |
6,948 | 6,459 | 489 | 8 | ||||||||||||
| Leases |
3,780 | 3,415 | 365 | 11 | ||||||||||||
|
|
|
|
|
|
|
|||||||||||
| Total commercial |
39,395 | 38,730 | 665 | 2 | ||||||||||||
|
|
|
|
|
|
|
|||||||||||
| Residential, including originated home equity products |
29,694 | 31,101 | (1,407 | ) | (5 | ) | ||||||||||
| Home equity products serviced by others |
2,171 | 2,960 | (789 | ) | (27 | ) | ||||||||||
| Other secured retail |
10,700 | 10,568 | 132 | 1 | ||||||||||||
| Unsecured retail |
3,899 | 3,889 | 10 | — | ||||||||||||
|
|
|
|
|
|
|
|||||||||||
| Total retail |
46,464 | 48,518 | (2,054 | ) | (4 | ) | ||||||||||
|
|
|
|
|
|
|
|||||||||||
| Total loans and leases(1) |
$ | 85,859 | $ | 87,248 | $ | (1,389 | ) | (2 | )% | |||||||
|
|
|
|
|
|
|
|||||||||||
| (1) | Excluded from the table above are loans totaling $1.1 billion, which were reclassified to loans held for sale at December 31, 2013. For further discussion, see Note 17 “Divestitures and Branch Assets and Liabilities Held for Sale” to our audited consolidated financial statements included elsewhere in this prospectus. |
Loan balances as of December 31, 2013, compared to December 31, 2012, reflect growth in total commercial offset by decreases in total retail, primarily in home equity products serviced by others and residential mortgages.
127
Table of Contents
Non-Core Assets
The table below shows the composition of our non-core assets as of the dates indicated:
| December 31, | (Date of Designation) June 30, 2009 |
Change from 2013-2012 |
Change from 2013-2009 |
|||||||||||||||||
| 2013 | 2012 | |||||||||||||||||||
| (dollars in millions) | (%) | (%) | ||||||||||||||||||
| Commercial |
$ | 108 | $ | 187 | $ | 1,900 | (42 | )% | (94 | )% | ||||||||||
| Commercial real estate |
381 | 643 | 3,412 | (41 | ) | (89 | ) | |||||||||||||
|
|
|
|
|
|
|
|||||||||||||||
| Total commercial |
489 | 830 | 5,312 | (41 | ) | (91 | ) | |||||||||||||
| Residential, including originated home equity products |
705 | 1,012 | 2,082 | (30 | ) | (66 | ) | |||||||||||||
| Home equity products serviced by others |
2,160 | 2,897 | 6,180 | (25 | ) | (65 | ) | |||||||||||||
| Other secured retail(1) |
— | — | 4,037 | — | (100 | ) | ||||||||||||||
| Unsecured retail |
406 | 869 | 2,490 | (53 | ) | (84 | ) | |||||||||||||
|
|
|
|
|
|
|
|||||||||||||||
| Total retail |
3,271 | 4,778 | 14,789 | (32 | ) | (78 | ) | |||||||||||||
|
|
|
|
|
|
|
|||||||||||||||
| Total non-core loans |
3,760 | 5,608 | 20,101 | (33 | ) | (81 | ) | |||||||||||||
| Other assets |
81 | 106 | 378 | (24 | ) | (79 | ) | |||||||||||||
|
|
|
|
|
|
|
|||||||||||||||
| Total non-core assets |
$ | 3,841 | $ | 5,714 | $ | 20,479 | (33 | )% | (81 | )% | ||||||||||
|
|
|
|
|
|
|
|||||||||||||||
| (1) | Other secured retail loans were either paid down, charged off, sold or transferred to the core loan portfolio by December 31, 2011. |
Non-core assets are primarily loans inconsistent with our strategic goals, generally as a result of geographic location, industry, product type or risk level. We have actively managed these loans down since they were designated as non-core on June 30, 2009. Since that time, the portfolio has decreased $16.6 billion, including principal repayments of $8.8 billion; charge-offs of $3.8 billion; transfers back to the core portfolio of $2.8 billion; and sales of $1.2 billion.
Transfers from non-core back to core are handled on an individual request basis and managed through the chief credit officer for our non-core portfolio. The rationale can vary and in the past some loan portfolio transfers have been approved after determination that the original decision to place them in non-core was not deemed appropriate. Individual loans can be reconsidered when the customer prospects change—typically related to situations where a non-strategic customer becomes a strategic customer due to growth or a new credit request that was previously considered to be unlikely.
During 2013, total non-core assets continued to decline to a balance of $3.8 billion as of December 31, 2013, a decrease of $1.9 billion, or 33%, compared to $5.7 billion as of December 31, 2012. The larger than normal decrease was primarily driven by a non-core to core transfer of $677 million of conforming student, certain home equity products serviced by others and residential mortgage loans in 2013. Commercial non-core balances of $489 million declined 41% compared to the prior year end balance of $830 million, while non-core retail loans of $3.3 billion decreased $1.5 billion, or 32%, compared to $4.8 billion as of December 31, 2012. The accounts transferred were good quality loans that met our credit policy standards. Non-core assets are expected to continue to decline through a combination of the factors described above.
The largest component of our non-core portfolio is our home equity products currently or formerly serviced by other firms, or SBO, portfolio. The SBO portfolio is a liquidating portfolio consisting of pools of home equity loans and lines of credit purchased between 2003 and 2007. Although our SBO portfolio consists of loans that were initially serviced by others, we now service a portion of this portfolio internally. SBO balances serviced externally totaled $1.3 billion and $1.6 billion as of
128
Table of Contents
December 31, 2013 and 2012, respectively. The SBO portfolio has been closed to new purchases since the third quarter of 2007, with exposure down to $2.2 billion as of December 31, 2013 from $5.5 billion as of December 31, 2009, representing an average annual liquidation rate of 20.7%. The SBO portfolio represented 7% of the entire real estate portfolio and 5% of the overall Consumer portfolio as of December 31, 2013.
The credit profile of the SBO portfolio is significantly weaker than the core real estate portfolio, with a weighted-average refreshed FICO score of 690 and combined loan to value (CLTV) of 96.2% as of December 31, 2013. The proportion of the portfolio in second lien (subordinated) position is 97%. The amount of the portfolio in out of footprint geographies is 71.2%, with 21.4% concentrated in California, Nevada, Arizona and Florida.
Credit performance continues to improve due to portfolio liquidation (the lowest performing loans have already been charged off), more effective account servicing and collection strategies, and improvements in the real estate market. The delinquency rate of more than 90 days past due was 1.8% as of December 31, 2013, and decreased by 14 basis points from December 31, 2012. The SBO portfolio had a full year charge-off rate of 5.4% through December 31, 2013 and a cumulative (inception to date) charge-off rate of 26% as of December 31, 2013.
Allowance for Credit Losses and Nonperforming Assets
The allowance for credit losses totaled $1.3 billion at both December 31, 2013 and 2012. Our allowance for loan and lease losses was 1.4% of total loans and leases and 86% of nonperforming loans as of December 31, 2013 compared with 1.4% and 67.1% as of December 2012. The total loan portfolio credit performance continued to improve across all credit measures in 2013. Net charge-offs for the year ended December 31, 2013 of $501 million decreased 42.7% compared to $875 million for the year ended December 31, 2012, primarily driven by decreases in the non-core, real estate secured, and unsecured retail portfolios. The portfolio net charge-off rate fell to 0.59% for the year ended December 31, 2013 from 1.01% for the year ended December 31, 2012. The delinquency rate improved to 1.9% as of December 31, 2013 compared to 2.5% as of December 31, 2012. Nonperforming loans and leases totaled $1.4 billion, or 1.7%, of the total portfolio as of December 31, 2013, as compared to $1.9 billion, or 2.1%, of the total loan portfolio as of December 31, 2012. At December 31, 2013, $607 million of nonperforming loans and leases had been designated as impaired and had no specific allowance because they had been written down to the fair value of their collateral. These loans included $530 million of retail loans and $77 million of commercial loans. Excluding impaired loans that have been written down to net realizable value, the allowance to nonperforming loans ratio totaled 151% at December 31, 2013 as compared to 106% at December 31, 2012.
Commercial Loan Asset Quality
During 2013, the quality of the commercial loan portfolio improved. As of December 31, 2013, total criticized loans decreased 37.0% to 4.9%, or $1.9 billion, of the commercial loan portfolio compared to 7.9%, or $3.0 billion, as of December 31, 2012. Commercial real estate criticized balances decreased 50.4% to 8.4%, or $582 million, of the commercial real estate portfolio compared to 18.2%, or $1.2 billion, as of December 31, 2012. Commercial real estate accounted for 30.4% of the criticized loans as of December 31, 2013 compared to 38.6% as of December 31, 2012. See Note 5 “Allowance for Credit Losses, Nonperforming Assets and Concentrations of Credit Risk” to our audited consolidated financial statements included elsewhere in this prospectus for further discussion.
Similarly, nonperforming balances and charge-offs have displayed a positive trend in 2013. As of December 31, 2013, nonperforming commercial balances decreased $345 million, to $265 million, compared to $610 million as of December 31, 2012, with a 60% decline in commercial real estate
129
Table of Contents
nonperforming loans over the same period. As of December 31, 2013, nonperforming loans stood at 0.7% of the commercial loan portfolio compared to 1.6% as of December 31, 2012. Likewise, net charge-offs in our commercial loan portfolio for the year ended December 31, 2013 decreased $123 million, to $21 million compared to $144 million for the year ended December 31, 2012, primarily due to lower gross charge-offs. This improvement was driven by improved economic conditions and a strategic focus on high quality new business.
Retail Loan Asset Quality
The credit composition of our retail loan portfolio remained favorable and well positioned across all product lines with an average refreshed FICO score of 754 (Prime) as of December 31, 2013, unchanged from December 31, 2012. Our real estate combined loan to value ratio, or CLTV, is calculated as the mortgage amount divided by the appraised value of the property and improved to 67.8% as of December 31, 2013 compared to 74.8% as of December 31, 2012. Excluding the SBO portfolio, the real estate CLTV was 65.1% as of December 31, 2013 compared to 71.4% as of December 31, 2012. The favorable reduction in CLTV was driven by recent improvements in home values and higher quality originations.
The annual net charge-off rate (core and non-core) of 1.0% in 2013 decreased 45 basis points from the prior year, driven by SBO, HELOCs, and residential mortgage loans. The overall rate of delinquency more than 30 days past due improved 36 basis points to 2.6% as of December 31, 2013, from 3.0% as of December 31, 2012. The improvement was driven by improvement across all products except HELOC, which is experiencing mild deterioration as regulatory changes have increased the foreclosure backlog and the effects of payment shock start to materialize. For further information regarding the possible HELOC payment shock, see “—Key Factors Affecting Our Business—HELOC Payment Shock.”
Nonperforming retail loans as a percentage of total retail loans were 2.5% as of December 31, 2013, an improvement of 11 basis points from December 31, 2012. The improvement in nonperforming retail loans was primarily driven by the return of $178 million of current nonaccruing residential mortgage Troubled Debt Restructurings, or TDRs, to accruing status in December 2013. In general, nonaccruing TDRs can be returned to accruing status after a sustained period of performance if the loan is supported by a well-documented evaluation of the borrower’s financial condition. Refer to the discussion of Nonperforming Loans and Leases in Note 1 “Significant Accounting Policies” to our audited consolidated financial statements included elsewhere in this prospectus for further information.
Special Topics—HELOC Payment Shock
For further information regarding the possible HELOC payment shock, see “—Key Factors Affecting Our Business—HELOC Payment Shock.”
Troubled Debt Restructuring
As of December 31, 2013, we had $1.2 billion classified as retail TDRs, of which 40.8% were in nonaccrual status. Within this nonaccrual population, 61.4% were current in payment. TDRs generally return to accrual status once repayment capacity and appropriate payment history can be established. TDRs are evaluated for impairment individually. Loans are classified as TDRs until paid off, sold or refinanced at market terms.
For additional information regarding the troubled debt restructurings, see Note 1 “Significant Accounting Policies” and Note 5 “Allowance for Credit Losses, Nonperforming Assets and Concentrations of Credit Risk” to our audited consolidated financial statements included elsewhere in this prospectus.
130
Table of Contents
The table below presents our retail TDRs in delinquent status as of December 31, 2013:
| December 31, 2013 | ||||||||||||||||
| Current | 30-89 Days Past Due |
90+Days Past Due |
Total | |||||||||||||
| (in millions) | ||||||||||||||||
| Recorded Investment: |
||||||||||||||||
| Residential, including originated home equity products |
$ | 649 | $ | 78 | $ | 125 | $ | 852 | ||||||||
| Home equity products serviced by others |
104 | 4 | 4 | 112 | ||||||||||||
| Other secured retail |
31 | 3 | 1 | 35 | ||||||||||||
| Unsecured retail |
185 | 12 | 4 | 201 | ||||||||||||
|
|
|
|
|
|
|
|
|
|||||||||
| Total |
$ | 969 | $ | 97 | $ | 134 | $ | 1,200 | ||||||||
|
|
|
|
|
|
|
|
|
|||||||||
The table below presents the accrual status of our retail TDRs as of December 31, 2013:
| December 31, 2013 | ||||||||||||
| Accruing | Nonaccruing | Total | ||||||||||
| (in millions) | ||||||||||||
| Recorded Investment: |
||||||||||||
| Residential, including originated home equity products |
$ | 410 | $ | 442 | $ | 852 | ||||||
| Home equity products serviced by others |
79 | 33 | 112 | |||||||||
| Other secured retail |
23 | 12 | 35 | |||||||||
| Unsecured retail |
199 | 2 | 201 | |||||||||
|
|
|
|
|
|
|
|||||||
| Total |
$ | 711 | $ | 489 | $ | 1,200 | ||||||
|
|
|
|
|
|
|
|||||||
131
Table of Contents
Securities
Our securities portfolio is managed to seek return while maintaining prudent levels of quality, market risk and liquidity. The following table presents our securities available for sale and held to maturity portfolios:
| December 31, 2013 |
December 31, 2012 |
Change in Fair Value |
||||||||||||||||||
| Amortized Cost |
Fair Value | Amortized Cost |
Fair Value | |||||||||||||||||
| (dollars in millions) | (%) | |||||||||||||||||||
| Securities Available for Sale: |
||||||||||||||||||||
| U.S. Treasury |
$ | 15 | $ | 15 | $ | 15 | $ | 15 | — | |||||||||||
| State and political subdivisions |
11 | 10 | 20 | 21 | (52 | )% | ||||||||||||||
| Mortgage-backed securities: |
||||||||||||||||||||
| Federal agencies and U.S. government sponsored entities |
14,970 | 14,993 | 16,368 | 16,904 | (11 | ) | ||||||||||||||
| Other/non-agency |
992 | 952 | 1,452 | 1,397 | (32 | ) | ||||||||||||||
|
|
|
|
|
|
|
|
|
|||||||||||||
| Total mortgage-backed securities |
15,962 | 15,945 | 17,820 | 18,301 | (13 | ) | ||||||||||||||
|
|
|
|
|
|
|
|
|
|||||||||||||
| Total debt securities |
15,988 | 15,970 | 17,855 | 18,337 | (13 | ) | ||||||||||||||
|
|
|
|
|
|
|
|
|
|||||||||||||
| Marketable equity securities |
10 | 13 | 5 | 7 | 86 | |||||||||||||||
| Other equity securities |
12 | 12 | 12 | 12 | — | |||||||||||||||
|
|
|
|
|
|
|
|
|
|||||||||||||
| Total equity securities |
22 | 25 | 17 | 19 | 32 | |||||||||||||||
|
|
|
|
|
|
|
|
|
|||||||||||||
| Total securities available for sale |
$ | 16,010 | $ | 15,995 | $ | 17,872 | $ | 18,356 | (13 | )% | ||||||||||
|
|
|
|
|
|
|
|
|
|||||||||||||
| Securities Held to Maturity: |
||||||||||||||||||||
| Mortgage-backed securities: |
||||||||||||||||||||
| Federal agencies and U.S. government sponsored entities |
$ | 2,940 | $ | 2,907 | $ | — | $ | — | NM | |||||||||||
| Other/non-agency |
1,375 | 1,350 | — | — | NM | |||||||||||||||
|
|
|
|
|
|
|
|
|
|||||||||||||
| Total securities held to maturity |
4,315 | 4,257 | — | — | NM | |||||||||||||||
|
|
|
|
|
|
|
|
|
|||||||||||||
| Total securities available for sale and held to maturity |
$ | 20,325 | $ | 20,252 | $ | 17,872 | $ | 18,356 | 10 | % | ||||||||||
|
|
|
|
|
|
|
|
|
|||||||||||||
In 2013, we transferred $4.2 billion of federal agency and non-agency debt securities from the securities available for sale portfolio to the securities held to maturity portfolio. At the time of transfer, $134 million of unrealized net losses were recognized in OCI. The amounts in OCI will be recognized in interest income over the remaining life of the securities as an offset to the adjustment of yield in a manner consistent with the amortization of premium and the accretion of discount. The resulting net realized yield on the securities held to maturity will remain unchanged from the original book yield.
As of December 31, 2013, the fair value of the securities available for sale and held to maturity portfolios increased by $1.9 billion, or 10%, to $20.3 billion compared to $18.4 billion as of December 31, 2012. U.S. Government-guaranteed notes and GSE-issued mortgage-backed securities comprise the majority of the securities portfolio holdings. Reinvestments have been directed predominantly into fixed rate mortgage-backed securities, and, as of December 31, 2013, the portfolio had an average expected life of 4.6 years. As long-term interest rates rose during the latter half of 2013, investment in agency mortgage-backed securities increased.
The investment portfolio includes higher quality, highly liquid investments reflecting our ongoing commitment to maintain appropriate contingent liquidity and pledging capacity. The portfolio
132
Table of Contents
composition has also been dominated by holdings backed by mortgages so that they can be pledged to the Federal Home Loan Banks. This has become increasingly important due to the enhanced liquidity requirements of the liquidity coverage ratio, or LCR. For further discussion of the LCR, see “Regulation and Supervision—Liquidity Standards.”
In 2013, the securities portfolio income of the securities available for sale and held to maturity portfolios decreased $140 million, or 24%, to $446 million compared to $586 million in 2012, and the yield on the portfolio was 2.50%. The portfolio yield decreased by 38 basis points, driven by faster prepayments in the mortgage-backed securities portfolio coupled with securities sales programs during the year. In 2013, mortgage-backed securities maturities, principal paydowns, and sales totaled $8.2 billion, and mortgage-backed securities purchases totaled $10.7 billion.
Deposits
The table below presents the major components of our deposits:
| December 31, | Change | Percent | ||||||||||||||
| 2013 | 2012 | |||||||||||||||
| (dollars in millions) | (%) | |||||||||||||||
| Demand |
$ | 24,931 | $ | 25,931 | $ | (1,000 | ) | (4 | )% | |||||||
| Checking with interest |
13,630 | 14,577 | (947 | ) | (6 | ) | ||||||||||
| Regular savings |
7,509 | 7,874 | (365 | ) | (5 | ) | ||||||||||
| Money market accounts |
31,245 | 35,102 | (3,857 | ) | (11 | ) | ||||||||||
| Term deposits |
9,588 | 11,664 | (2,076 | ) | (18 | ) | ||||||||||
|
|
|
|
|
|
|
|||||||||||
| Total deposits |
86,903 | 95,148 | (8,245 | ) | (9 | ) | ||||||||||
|
|
|
|
|
|
|
|||||||||||
| Deposits held for sale |
5,277 | — | 5,277 | NM | ||||||||||||
|
|
|
|
|
|
|
|||||||||||
| Total deposits and deposits held for sale |
$ | 92,180 | $ | 95,148 | $ | (2,968 | ) | (3 | )% | |||||||
|
|
|
|
|
|
|
|||||||||||
As of December 31, 2013, total deposits decreased $8.2 billion, or 9%, to $86.9 billion compared to $95.1 billion as of December 31, 2012. The decrease was primarily due to $5.3 billion in deposits that were reclassified to deposits held for sale at December 31, 2013. See Note 17 “Divestitures and Branch Assets and Liabilities Held for Sale” to our audited consolidated financial statements included elsewhere in this prospectus for further discussion.
Excluding the impact of the deposits held for sale reclassification, total deposits as of December 31, 2013 declined $3.0 billion, or 3%, compared to December 31, 2012. Term deposits decreased $2.1 billion, or 18%, reflecting continued runoff of higher cost term deposits. Money market accounts decreased 11% from December 31, 2012. All other deposit balances were flat year-over-year.
Borrowed Funds
The tables below present our borrowed funds.
The following is a summary of our short-term borrowed funds:
| December 31, | ||||||||
| 2013 | 2012 | |||||||
| (in millions) | ||||||||
| Federal funds purchased |
$ | 689 | $ | 1,905 | ||||
| Securities sold under agreements to repurchase |
4,102 | 1,696 | ||||||
| Other short-term borrowed funds |
2,251 | 501 | ||||||
|
|
|
|
|
|||||
| Total short-term borrowed funds |
$ | 7,042 | $ | 4,102 | ||||
|
|
|
|
|
|||||
133
Table of Contents
Key data related to short-term borrowed funds is presented in the following table:
| As of and for the Year Ended December 31, |
||||||||||||
| 2013 | 2012 | 2011 | ||||||||||
| (dollars in millions) | ||||||||||||
| Weighted-average interest rate at year end: |
||||||||||||
| Federal funds purchased and securities sold under agreements to repurchase |
0.09 | % | 0.10 | % | 0.06 | % | ||||||
| Other short-term borrowed funds |
0.20 | % | 0.29 | % | 0.20 | % | ||||||
| Maximum amount outstanding at month-end during the year: |
||||||||||||
| Federal funds purchased and securities sold under agreements to repurchase |
$ | 5,114 | $ | 4,393 | $ | 6,406 | ||||||
| Other short-term borrowed funds |
2,251 | 5,050 | 4,000 | |||||||||
| Average amount outstanding during the year: |
||||||||||||
| Federal funds purchased and securities sold under agreements to repurchase |
$ | 2,400 | $ | 2,716 | $ | 3,808 | ||||||
| Other short-term borrowed funds |
259 | 3,045 | 2,645 | |||||||||
| Weighted-average interest rate during the year: |
||||||||||||
| Federal funds purchased and securities sold under agreements to repurchase |
0.31 | % | 0.22 | % | 0.12 | % | ||||||
| Other short-term borrowed funds |
0.44 | % | 0.33 | % | 2.51 | % | ||||||
The following is a summary of our long-term borrowed funds:
| December 31, | ||||||||
| 2013 | 2012 | |||||||
| (in millions) | ||||||||
| Citizens Financial Group, Inc.: |
||||||||
| 4.150% fixed rate subordinated debt, due 2022 |
$ | 350 | $ | 350 | ||||
| 5.158% fixed-to-floating rate subordinated debt, (LIBOR + 3.56%) callable, due 2023(1) |
333 | — | ||||||
| 4.771% fixed rate subordinated debt, due 2023(1) |
333 | — | ||||||
| 4.691% fixed rate subordinated debt, due 2024(1) |
334 | — | ||||||
| 1.860% floating-rate (LIBOR + 1.50%) subordinated debt, due 2035 |
— | 289 | ||||||
| Banking Subsidiaries: |
||||||||
| Federal Home Loan advances due through 2033 |
25 | 27 | ||||||
| Other |
30 | 28 | ||||||
|
|
|
|
|
|||||
| Total long-term borrowed funds |
$ | 1,405 | $ | 694 | ||||
|
|
|
|
|
|||||
| (1) | Intercompany borrowed funds with the RBS Group. See “Our Relationship with the RBS Group and Certain Other Related Party Transactions—Relationship with the RBS Group—Other” and Note 18 “Related Party Transactions” to our audited consolidated financial statements included elsewhere in this prospectus. |
Short-term unsecured borrowed funds of $689 million were more than offset by $1.4 billion in average excess reserves held at the Federal Reserve Banks as of December 31, 2013. Other borrowed funds include repurchase agreements and secured FHLB advances. The increase in total short-term borrowed funds relative to the year-earlier period reflected balance sheet growth, primarily securities. Further, excluding the $689 million in federal funds purchased, the remainder of the short-term funding position, or $6.4 billion, represented secured and stable sources. Additionally, asset liquidity was considered strong. As of December 31, 2013, unencumbered high-quality securities totaled $10.5 billion, unused FHLB capacity was approximately $8.2 billion and unencumbered loans pledged to the Federal Reserve Banks created additional contingent borrowing capacity of approximately $10.4 billion.
134
Table of Contents
Derivatives
Historically, we have used pay-fixed interest rate swaps to synthetically lengthen liabilities and offset duration in fixed-rate assets. Given the material prepayment of fixed-rate mortgages and home equity loans since 2008, these swaps were no longer needed and have been terminated or allowed to run off, resulting in a reduction in the notional balance of these swaps from $4.2 billion as of December 31, 2012 to $1.5 billion as of December 31, 2013.
We use receive-fixed swaps to minimize the exposure to variability in the interest cash flows on our floating rate assets. This is reflected in the interest rate swaps line in the table below. As of December 31, 2013, a notional amount of $4.0 billion of receive-fixed swaps had been executed. The assets and liabilities recorded for derivatives designated as hedges reflect the market value of these hedge instruments.
We also sell interest rate swaps and foreign exchange forwards to commercial customers. Offsetting swap and forward agreements are simultaneously transacted to minimize our market risk associated with the customer derivative products. The assets and liabilities recorded for derivatives not designated as hedges reflect the market value of these transactions.
The table below presents our derivative assets and liabilities. For additional information regarding our derivative instruments, see Note 15 “Derivatives” to our audited consolidated financial statements included elsewhere in this prospectus.
| December 31, 2013 | December 31, 2012 | Changes in net Liabilities |
||||||||||||||||||||||||||
| Notional Amount(1) |
Derivative Assets |
Derivative Liabilities |
Notional Amount(1) |
Derivative Assets |
Derivative Liabilities |
|||||||||||||||||||||||
| (dollars in millions) | (%) | |||||||||||||||||||||||||||
| Derivatives designated as hedging instruments: |
||||||||||||||||||||||||||||
| Interest rate swaps |
$ | 5,500 | $ | 23 | $ | 412 | $ | 4,200 | $ | 1 | $ | 257 | 52 | % | ||||||||||||||
| Derivatives not designated as hedging instruments: |
||||||||||||||||||||||||||||
| Interest rate swaps |
29,355 | 654 | 558 | 31,227 | 1,102 | 1,033 | 39 | |||||||||||||||||||||
| Foreign exchange contracts |
7,771 | 94 | 87 | 5,978 | 71 | 67 | 75 | |||||||||||||||||||||
| Other contracts |
569 | 7 | 10 | 2,815 | 35 | 15 | (115 | ) | ||||||||||||||||||||
|
|
|
|
|
|
|
|
|
|||||||||||||||||||||
| Total derivatives not designated as hedging instruments |
755 | 655 | 1,208 | 1,115 | 8 | |||||||||||||||||||||||
|
|
|
|
|
|
|
|
|
|||||||||||||||||||||
| Gross derivative fair values |
778 | 1,067 | 1,209 | 1,372 | 7 | % | ||||||||||||||||||||||
| Less: Gross amounts offset in the consolidated balance sheets(2) |
(128 | ) | (128 | ) | (54 | ) | (54 | ) | ||||||||||||||||||||
|
|
|
|
|
|
|
|
|
|||||||||||||||||||||
| Total net derivative fair values presented in the consolidated balance sheets(3) |
$ | 650 | $ | 939 | $ | 1,155 | $ | 1,318 | ||||||||||||||||||||
|
|
|
|
|
|
|
|
|
|||||||||||||||||||||
| (1) | The notional or contractual amount of interest rate derivatives and foreign exchange contracts is the amount upon which interest and other payments under the contract are based. For interest rate derivatives, the notional amount is typically not exchanged. Therefore, notional amounts should not be taken as the measure of credit or market risk as they tend to greatly overstate the true economic risk of these contracts. |
| (2) | Amounts represent the impact of legally enforceable master netting agreements that allow us to settle positive and negative positions. |
| (3) | We also offset assets and liabilities associated with repurchase agreements on our consolidated balance sheets. See Note 3 “Securities” to our audited consolidated financial statements included elsewhere in this prospectus for further discussion. |
135
Table of Contents
Quarterly Results of Operations
The following table sets forth unaudited quarterly consolidated statements of operations data and consolidated balance sheet data as of and for the quarters ended June 30, 2014, March 31, 2014, the four quarters of 2013 and the last two quarters of 2012. We have prepared the statement of operations data and balance sheet data on the same basis as the audited consolidated financial statements and the unaudited interim consolidated financial statements included elsewhere in this prospectus and, in the opinion of management, each statement of operations and balance sheet includes all adjustments, consisting solely of normal recurring adjustments, necessary for the fair statement of the results of operations and balance sheet data as of and for these periods. This information should be read in conjunction with the audited consolidated financial statements and the unaudited interim consolidated financial statements and, in each case, the related notes included elsewhere in this prospectus.
136
Table of Contents
Summary Consolidated Financial and Other Data (unaudited)
| As of and for the Three Months Ended | ||||||||||||||||||||||||||||||||
| June 30, 2014 |
March 31, 2014 |
December 31, 2013 |
September 30, 2013 |
June 30, 2013 |
March 31, 2013 |
December 31, 2012 |
September 30, 2012 |
|||||||||||||||||||||||||
| (dollars in millions, except per share amounts) | ||||||||||||||||||||||||||||||||
| Operating Data: |
||||||||||||||||||||||||||||||||
| Net interest income |
$ | 833 | $ | 808 | $ | 779 | $ | 770 | $ | 749 | $ | 760 | $ | 772 | $ | 810 | ||||||||||||||||
| Noninterest income |
640 | (12) | 358 | 379 | 383 | 437 | 433 | 390 | (19) | 422 | ||||||||||||||||||||||
|
|
|
|
|
|
|
|
|
|
|
|
|
|
|
|
|
|||||||||||||||||
| Total revenue |
1,473 | 1,166 | 1,158 | 1,153 | 1,186 | 1,193 | 1,162 | 1,232 | ||||||||||||||||||||||||
| Provision for credit losses |
49 | 121 | 132 | 145 | 112 | 90 | 103 | 109 | ||||||||||||||||||||||||
| Noninterest expense |
948 | (13) | 810 | 818 | (15) | 788 | 5,252 | (17) | 821 | 895 | (20) | 791 | ||||||||||||||||||||
|
|
|
|
|
|
|
|
|
|
|
|
|
|
|
|
|
|||||||||||||||||
| Income (loss) before income tax expense (benefit) |
476 | 235 | 208 | 220 | (4,178 | ) | 282 | 164 | 332 | |||||||||||||||||||||||
| Income tax expense (benefit) |
163 | (14) | 69 | 56 | (16) | 76 | (273 | )(18) | 99 | 63 | (21) | 123 | ||||||||||||||||||||
|
|
|
|
|
|
|
|
|
|
|
|
|
|
|
|
|
|||||||||||||||||
| Net income (loss) |
$ | 313 | $ | 166 | $ | 152 | $ | 144 | $ | (3,905 | ) | $ | 183 | $ | 101 | $ | 209 | |||||||||||||||
|
|
|
|
|
|
|
|
|
|
|
|
|
|
|
|
|
|||||||||||||||||
| Net income (loss) per average common share—basic and diluted(1) |
$ | 0.56 | $ | 0.30 | $ | 0.27 | $ | 0.26 | $ | (6.97 | ) | $ | 0.33 | $ | 0.18 | $ | 0.37 | |||||||||||||||
| Other Operating Data: |
||||||||||||||||||||||||||||||||
| Return on average common equity(2)(3) |
6.41 | % | 3.48 | % | 3.12 | % | 2.91 | % | (13.94 | )% | 3.07 | % | 1.65 | % | 3.45 | % | ||||||||||||||||
| Return on average total assets(3)(4) |
0.99 | % | 0.54 | % | 0.50 | % | 0.49 | % | (2.77 | )% | 0.60 | % | 0.32 | % | 0.65 | % | ||||||||||||||||
| Net interest margin(3)(5) |
2.87 | % | 2.89 | % | 2.83 | % | 2.88 | % | 2.82 | % | 2.84 | % | 2.80 | % | 2.88 | % | ||||||||||||||||
| Balance Sheet Data: |
||||||||||||||||||||||||||||||||
| Total assets |
$ | 130,279 | $ | 126,892 | $ | 122,154 | $ | 120,074 | $ | 117,833 | $ | 126,044 | $ | 127,053 | $ | 131,580 | ||||||||||||||||
| Loans and leases(6) |
88,829 | 87,083 | 85,859 | 85,493 | 85,006 | 85,782 | 87,248 | 86,941 | ||||||||||||||||||||||||
| Allowance for loan and lease losses |
1,210 | 1,259 | 1,221 | 1,219 | 1,200 | 1,219 | 1,255 | 1,347 | ||||||||||||||||||||||||
| Total securities |
24,823 | 24,804 | 21,245 | 20,852 | 17,408 | 18,066 | 19,417 | 21,341 | ||||||||||||||||||||||||
| Goodwill |
6,876 | 6,876 | 6,876 | 6,876 | 6,876 | 11,311 | 11,311 | 11,311 | ||||||||||||||||||||||||
| Total liabilities |
110,682 | 107,450 | 102,958 | 100,661 | 98,223 | 101,837 | 102,924 | 107,471 | ||||||||||||||||||||||||
| Deposits(7) |
91,656 | 87,462 | 86,903 | 93,930 | 91,361 | 94,628 | 95,148 | 96,481 | ||||||||||||||||||||||||
| Federal funds purchased and securities sold under agreements to repurchase |
6,807 | 6,080 | 4,791 | 3,424 | 3,371 | 3,709 | 3,601 | 3,241 | ||||||||||||||||||||||||
| Other short-term borrowed funds |
7,702 | 4,950 | 2,251 | 2 | 2 | 11 | 501 | 4,002 | ||||||||||||||||||||||||
| Long-term borrowed funds |
1,732 | 1,403 | 1,405 | 1,064 | 732 | 692 | 694 | 697 | ||||||||||||||||||||||||
| Total stockholders’ equity |
19,597 | 19,442 | 19,196 | 19,413 | 19,610 | 24,207 | 24,129 | 24,109 | ||||||||||||||||||||||||
| Other Balance Sheet Data: |
||||||||||||||||||||||||||||||||
| Asset Quality Ratios: |
||||||||||||||||||||||||||||||||
| Allowance for loan and lease losses as a percentage of total loans and leases |
1.36 | % | 1.45 | % | 1.42 | % | 1.43 | % | 1.41 | % | 1.42 | % | 1.44 | % | 1.55 | % | ||||||||||||||||
| Allowance for loan and lease losses as a percentage of nonperforming loans and leases |
101 | % | 92 | % | 86 | % | 72 | % | 69 | % | 67 | % | 67 | % | 75 | % | ||||||||||||||||
| Nonperforming loans and leases as a percentage of total loans and leases |
1.35 | % | 1.57 | % | 1.65 | % | 1.98 | % | 2.06 | % | 2.14 | % | 2.14 | % | 2.08 | % | ||||||||||||||||
137
Table of Contents
| As of and for the Three Months Ended | ||||||||||||||||||||||||||||||||
| June 30, 2014 |
March 31, 2014 |
December 31, 2013 |
September 30, 2013 |
June 30, 2013 |
March 31, 2013 |
December 31, 2012 |
September 30, 2012 |
|||||||||||||||||||||||||
| (dollars in millions, except per share amounts) | ||||||||||||||||||||||||||||||||
| Capital ratios: |
||||||||||||||||||||||||||||||||
| Tier 1 capital ratio(8) |
13.3 | % | 13.4 | % | 13.5 | % | 14.0 | % | 14.3 | % | 14.5 | % | 14.2 | % | 14.1 | % | ||||||||||||||||
| Total capital ratio(9) |
16.2 | % | 16.0 | % | 16.1 | % | 16.3 | % | 16.3 | % | 16.2 | % | 15.8 | % | 15.7 | % | ||||||||||||||||
| Tier 1 common equity ratio(10) |
13.3 | % | 13.4 | % | 13.5 | % | 13.9 | % | 14.3 | % | 14.2 | % | 13.9 | % | 13.8 | % | ||||||||||||||||
| Leverage ratio(11) |
11.1 | % | 11.4 | % | 11.6 | % | 12.1 | % | 11.8 | % | 12.5 | % | 12.1 | % | 11.9 | % | ||||||||||||||||
| (1) | Earnings per share information reflects a 165,582-for-1 forward stock split effective on August 22, 2014. |
| (2) | We define “Return on average common equity” as net income (loss) divided by average common equity. |
| (3) | Ratios for the periods above are presented on an annualized basis. |
| (4) | We define “Return on average total assets” as net income (loss) divided by average total assets. |
| (5) | We define “Net interest margin” as net interest income divided by average total interest-earning assets. |
| (6) | Excludes loans held for sale of $262 million, $1.4 billion, $1.3 billion, $307 million, $429 million, $550 million, $646 million and $594 million as of June 30, 2014, March 31, 2014, December 31, 2013, September 30, 2013, June 30, 2013, March 31, 2013, December 31, 2012 and September 30, 2012, respectively. |
| (7) | Excludes deposits held for sale of $5.2 billion and $5.3 billion as of March 31, 2014 and December 31, 2013, respectively. |
| (8) | We define “Tier 1 capital ratio” as Tier 1 capital balance divided by total risk-weighted assets as defined under Basel I. |
| (9) | We define “Total capital ratio” as total capital balance divided by total risk-weighted assets as defined under Basel I. |
| (10) | We define “Tier 1 common equity ratio” as Tier 1 capital balance, minus preferred stock, divided by total risk-weighted assets as defined under Basel I. |
| (11) | We define “Leverage ratio” as Tier 1 capital balance divided by quarterly average total assets as defined under Basel I. |
| (12) | Includes $288 million of gain on the Chicago Divestiture. |
| (13) | Includes $115 million of restructuring charges and special expense items related largely to efficiency initiatives and the Chicago Divestiture. |
| (14) | Includes $65 million of tax expenses related to the gain on the Chicago Divestiture and restructuring charges and special items. |
| (15) | Includes $26 million of restructuring charges. |
| (16) | Includes $9 million of tax benefit related to restructuring charges. |
| (17) | Includes $4.4 billion of goodwill impairment charge. |
| (18) | Includes $355 million of tax benefit related to the goodwill impairment charge. |
| (19) | Includes $23 million loss on the sale of a commercial real estate portfolio. |
| (20) | Includes $77 million settlement of defined benefit pension plan obligations to vested former employees and $5 million reversal of prior restructuring charges. |
| (21) | Includes $33 million of net tax benefit related to the loss on sale of commercial real estate portfolio, settlement of the defined benefit pension plan obligations, and reversal of restructuring charges. |
Capital
As a bank holding company and a financial holding company, we are subject to regulation and supervision by the Federal Reserve Board. Our primary subsidiaries are our two insured depository institutions, CBNA, a national banking association whose primary federal regulator is the OCC, and CBPA, a Pennsylvania-charted savings bank regulated by the Department of Banking of the Commonwealth of Pennsylvania and supervised by the FDIC as its primary federal regulator.
Under current Basel I regulation, the Federal Reserve Board requires us to maintain minimum levels with respect to our total capital, Tier 1 capital and leverage ratios. The minimum standards for the total capital ratio (the ratio of our total risk-based capital, which is the sum of our Tier 1 and Tier 2 capital, as defined by Federal Reserve Board regulation, to total risk-weighted assets) and the Tier 1 capital ratio (the ratio of our Tier 1 capital to total risk-weighted assets) are 8.0% and 4.0%, respectively. The minimum Tier 1 leverage ratio (the ratio of a banking organization’s Tier 1 capital to total adjusted quarterly average total assets, as defined for regulatory purposes) is 3.0% for bank holding companies that either have the highest supervisory rating or have implemented the Federal
138
Table of Contents
Reserve Board’s risk-adjusted measure for market risk. The minimum Tier 1 leverage ratio for all other bank holding companies is 4.0%, unless a different minimum is specified by the Federal Reserve Board.
In July 2013, the U.S. bank regulatory agencies approved final regulatory capital rules that implement the Basel III capital framework and certain provisions of the Dodd-Frank Act. We will be required to comply with these rules beginning on January 1, 2015, with certain aspects of the rules phasing in through 2018. For further discussion of the capital rules to which we will be subject, see “Regulation and Supervision—Capital.”
The table below demonstrates the strength of our regulatory capital ratios as of June 30, 2014. Actual Basel I ratios and pro forma Basel III ratios, which include estimated impacts of fully phased-in Basel III and U.S. standardized approach risk-weighted assets requirements, remain well above current Basel I and future Basel III minima:
| Regulatory Ratios as of June 30, 2014 Basel I vs. Basel III Rules | ||||||||||||||||||||||||
| Regulatory Ratio |
Basel I Ratios and Requirements | Pro Forma Basel III Ratios and Requirements (including adoption of U.S. Standardized Approach Risk-Weighted Assets) |
||||||||||||||||||||||
| Actual Basel I Ratio |
Required Minimum |
Well Capitalized Minimum for Purposes of Prompt Corrective Action |
Pro Forma Basel III Ratio(1) |
Required Minimum + Required Capital Conservation Buffer for Non-Leverage Ratios |
Well Capitalized Minimum for Purposes of Prompt Corrective Action(2) |
|||||||||||||||||||
| Tier 1 Capital to Risk-Weighted Assets (Tier 1 Capital Ratio) |
13.3 | % | 4.0 | % | 6.0 | % | 13.0 | % | 8.5 | % | 8.0 | % | ||||||||||||
| Total Capital to Risk-Weighted Assets (Total Capital Ratio) |
16.2 | 8.0 | 10.0 | 15.8 | 10.5 | 10.0 | ||||||||||||||||||
| Tier 1 Capital to Average Total Assets (Leverage Ratio) . |
11.1 | 3.0 | 5.0 | 11.1 | 4.0 | 5.0 | ||||||||||||||||||
| Common Equity Tier 1 Capital to Risk-Weighted Assets (Common Equity Tier 1 Capital Ratio) |
|
Not Applicable |
|
|
Not Applicable |
|
|
Not Applicable |
|
13.0 | 7.0 | 6.5 | ||||||||||||
| (1) | These are non-GAAP financial measures. For more information on the computation of these non-GAAP financial measures, see “—Principal Components of Operations and Key Performance Metrics Used By Management—Key Performance Metrics and Non-GAAP Financial Measures.” |
| (2) | The Basel III well capitalized minima for purposes of prompt corrective action for bank holding companies have not yet been finalized. The percentages shown are the expected well capitalized minima based upon the current well capitalized minima for insured depository institutions. |
Our assessment of capital adequacy begins with our risk appetite and risk management framework, which provides for the identification, measurement and management of material risks. Required capital is determined for actual/forecasted risk portfolios using applicable regulatory capital methodologies, including estimated impacts of approved and proposed regulatory changes that will or may apply to future periods. Key analytical frameworks, which enable the comprehensive assessment of capital adequacy versus unexpected loss, supplement our base case forecast. These supplemental frameworks include Integrated Stress Testing, as well as an Internal Capital Adequacy Requirement that builds on internally assessed Economic Capital requirements. Our capital planning process is supported by a robust governance framework. This process includes: capital management policies and procedures that document capital
139
Table of Contents
adequacy metrics and limits, as well as our comprehensive capital contingency plan, and the active engagement of both the legal-entity boards and senior management in oversight and decision-making.
Forward-looking assessments of capital adequacy for us and for our banking subsidiaries feed development of capital plans that are submitted to the Federal Reserve Board and other bank regulators. We prepare these plans in full compliance with the Federal Reserve Board’s Capital Plan Rule and participate in the Federal Reserve Board’s annual CCAR stress-testing process. Both we and our banking subsidiaries also participate in semiannual stress tests required by the Dodd-Frank Act. Within this regulatory framework, we may only execute capital actions in accordance with a capital plan that the Federal Reserve Board has reviewed and to which the Federal Reserve Board has not objected. In March 2014, the Federal Reserve Board objected on qualitative grounds to our capital plan submitted as part of the CCAR process. As a result, we are not permitted to increase our capital distributions above 2013 levels until a new capital plan is approved by the Federal Reserve Board. The deadline for our next capital plan submission is January 5, 2015, and we cannot assure you that the Federal Reserve Board will not object to our next capital plan or that, even if it does not object to it, our planned capital distributions will not be significantly modified from 2013 levels. For further discussion of our 2014 capital plan, see “Regulation and Supervision—Dividends.”
During the first two quarters of 2014, we completed the following capital actions:
| • | paid common dividends of $25 million and $10 million in the first and second quarter of 2014, respectively; and |
| • | paid a special common dividend of $333 million to RBS and issued $333 million of 10-year subordinated debt (4.153% fixed rate subordinated debt due July 1, 2024) to the RBS Group in the second quarter of 2014. |
Additionally, on August 1, 2014 we declared and paid a special common dividend of $333 million to RBS and issued $333 million of 10-year subordinated debt (4.023% fixed rate subordinated debt, due 2024) to the RBS Group, and on August 28, 2014 we declared and paid a common dividend of $50 million to RBS. Refer to “Capitalization” for further details of future planned capital actions.
During 2013, we completed the following capital actions:
| • | paid common dividends of $40 million, $55 million, $50 million and $40 million in the first, second, third and fourth quarters of 2013, respectively; |
| • | redeemed $289 million of floating rate junior subordinated deferrable interest debentures due March 4, 2034 from a special purpose subsidiary, which caused the redemption of $280 million of our trust preferred securities from the RBS Group in the second quarter of 2013; |
| • | through CBPA, we redeemed $10 million of floating rate junior subordinated deferrable interest debentures due April 22, 2032, which caused redemption of $10 million of our trust preferred securities from third parties in the fourth quarter of 2013; |
| • | paid a special common dividend of $333 million and issued $333 million of 10-year subordinated debt (5.158% fixed-to-floating rate callable subordinated debt due June 29, 2023) to RBS in the second quarter of 2013; |
| • | paid a special common dividend of $333 million to RBS and issued $333 million of 10-year subordinated debt (4.771% fixed rate subordinated debt due October 1, 2023) to the RBS Group in the third quarter of 2013; and |
| • | paid a special common dividend of $334 million to RBS and issued $334 million of 10-year subordinated debt (4.691% fixed rate subordinated debt due January 2, 2024) to the RBS Group in the fourth quarter of 2013. |
140
Table of Contents
Special common dividends paired with issuance of a like amount of subordinated debt, as executed in the second through fourth quarters of 2013, the second quarter of 2014 and August 1, 2014 are undertaken to produce a more-balanced capital structure without impacting our overall level of qualifying regulatory capital. Exchanging common equity for the same amount of Tier 2 subordinated debt has no impact on either the level of total capital or the total risk-based capital ratio. From the beginning of 2013 to June 30, 2014, these “exchange transactions” have aggregated to $1.3 billion. Even after execution of these actions, both Common Equity Tier 1 and Tier 1 Capital, calculated using fully phased-in Basel III definitions, were 13.0% as of June 30, 2014, well above their respective Basel III minima, including the capital conservation buffer, of 7.0% and 8.5%, respectively. Our pro forma Basel III total risk-based capital ratio after giving effect to all Basel III impacts also remained strong at 15.8% versus the Basel III minimum, including the capital conservation buffer, of 10.5%. These pro forma Basel III ratios are non-GAAP financial measures. For more information on computation of these non-GAAP financial measures, see “—Principal Components of Operations and Key Performance Metrics Used By Management—Key Performance Metrics and Non-GAAP Financial Measures.”
As a result of the goodwill impairment recognized by CBNA in the second quarter of 2013, CBNA must request specific approval from the OCC before executing capital distributions. This requirement is expected to remain in place through the fourth quarter of 2015. See “Dividend Policy” for further details. However, as of June 30, 2014, irrespective of the ability of our subsidiary banks to pay dividends we on a non-consolidated basis had liquid assets in excess of $399 million compared to an annual interest burden on existing subordinated debt of approximately $77 million.
Liquidity
We define liquidity as an institution’s ability to meet its cash-flow and collateral obligations in a timely manner, at a reasonable cost. An institution must maintain current liquidity to fund its daily operations and forecasted cash-flow needs as well as contingent liquidity to deliver funding in a stress scenario. We consider the effective and prudent management of liquidity to be fundamental to our health and strength.
We manage liquidity at the consolidated enterprise level and at each material legal entity, including ourselves, CBNA and CBPA.
CFG Liquidity
Our primary sources of cash are (i) dividends from equity investments in our banking subsidiaries and (ii) externally issued subordinated debt ($350 million). Our uses of liquidity include the following: (i) routine cash flow requirements as a bank holding company, including payments of dividends, interest and expenses; (ii) needs of subsidiaries, including our banking subsidiaries, for additional equity and, as required, their needs for debt financing; and (iii) extraordinary requirements for cash, such as acquisitions.
On August 1, 2014, we exchanged $333 million of Tier 1 common equity for Tier 2 subordinated debt, and we plan to continue our strategy of capital optimization by issuing to RBS $334 million of preferred stock and concurrently repurchasing $334 million shares of common stock from RBS, assuming completion of this offering. In addition, we intend to repurchase approximately $500 million of shares of our common stock and $250 million of shares of our common stock in 2015 and 2016, respectively, with proceeds from the issuance of subordinated debt or another lesser form of capital, subject to regulatory approval. See “Our Relationship with the RBS Group and Certain Other Related Party Transactions—Relationship with the RBS Group—Other” for further details of the planned fourth quarter exchange transaction. As we increase subordinated debt in exchange for common equity, our funding costs will increase to reflect the incremental debt service.
141
Table of Contents
Our cash and cash equivalents represent a source of liquidity that can be used to meet various needs. As of June 30, 2014, we held cash and cash equivalents of $399 million. This should be viewed as a liquidity reserve.
Our liquidity risk is low, for four reasons. First, we have no material non-banking subsidiaries and our banking subsidiaries are self-funding. Second, we have no outstanding senior debt. Third, the capital structures of our banking subsidiaries are similar to our capital structure. As of June 30, 2014, our double leverage ratio (the combined equity of our subsidiaries divided by our equity) was 101.9%. Fourth, our other cash flow requirements, such as operating expenses, are relatively small.
Banking Subsidiaries’ Liquidity
In the ordinary course of business, the liquidity of CBNA and CBPA is managed by matching sources and uses of cash. The primary sources of bank liquidity include (i) deposits from our consumer and commercial franchise customers; (ii) payments of principal and interest on loans and debt securities; and (iii) as needed and as described below under “Liquidity Risk Management and Governance,” wholesale borrowings. The primary uses of bank liquidity include (i) withdrawals and maturities of deposits; (ii) payment of interest on deposits; (iii) funding of loan commitments; and (iv) funding of securities purchases. To the extent that the banks have relied on wholesale borrowings, uses also include payments of related principal and interest.
Our banking subsidiaries’ major businesses involve taking deposits and making loans. Hence, a key role of liquidity management is to ensure that customers have timely access to funds from deposits and loans. Liquidity management also involves maintaining sufficient liquidity to repay wholesale borrowings, pay operating expenses and support extraordinary funding requirements when necessary.
In the second quarter of 2014, CBNA issued $250 million in new subordinated debt to us. Additionally, CBNA issued $220 million in subordinated debt to us in exchange for common equity held by us and is expected to issue an additional $440 million in subordinated debt in exchange for common equity in the second half of 2014. Also during 2014, CBPA is expected to issue $300 million in subordinated debt to us in exchange for common equity held by us. Additionally during 2014, CBPA could issue $85 million in new subordinated debt to us to support asset growth if required. Because of the increased proportion of subordinated debt versus common equity in the capital structure of both CBNA and CBPA, funding costs will increase to reflect the incremental debt service costs.
Liquidity Risk
We define liquidity risk as the risk that we or either of our banking subsidiaries will be unable to meet our payment obligations in a timely manner. We manage liquidity risk at the consolidated enterprise level, and for each material legal entity including us, CBNA and CBPA. Liquidity risk can arise due to asset liquidity risk and/or funding liquidity risk.
Asset liquidity risk is the risk that market conditions may reduce an entity’s ability to liquidate, pledge and/or finance certain assets and thereby substantially reduce the liquidity value of such assets. Drivers of asset liquidity risk include general market disruptions as well as specific issues regarding the credit quality and/or valuation of a security or loan, issuer or borrower and/or asset class.
Funding liquidity risk is the risk that market conditions and/or entity-specific events may reduce an entity’s ability to raise funds from depositors and/or wholesale market counterparties. Drivers of funding liquidity may be idiosyncratic or systemic, reflecting impediments to operations and/or undermining of market confidence.
142
Table of Contents
Factors Affecting Liquidity
Given the composition of their assets and borrowing sources, asset liquidity at both CBNA and CBPA would be materially affected by such events as deterioration of financing markets for high-quality securities (e.g., mortgage-backed securities and other instruments issued by the Government National Mortgage Association, or GNMA, Federal National Mortgage Association, or FNMA, and the Federal Home Loan Mortgage Corporation, or FHLMC), by any incapacitation of the Federal Home Loan Banks, or FHLBs, to provide collateralized advances and/or by a refusal of the Federal Reserve Board to act as lender of last resort in systemic stress. Given the quality of our free securities, which represent unencumbered and liquid obligations, guaranteed explicitly (GNMA) or indirectly (FNMA and FHLMC) by the U.S. government, the positive track record of the FHLBs in stress and the commitment of the Federal Reserve Board to continue as lender of last resort in systemic stress scenarios, we view asset liquidity risk at our banking subsidiaries, both CBNA and CBPA, to be relatively modest.
Given the structure of their balance sheets, funding liquidity of CBNA and CBPA would be materially affected by an adverse idiosyncratic event (e.g., a major loss, causing a perceived or actual deterioration in its financial condition), an adverse systemic event (e.g., default or bankruptcy of a significant capital markets participant), or a combination of both (e.g., the financial crisis of 2008-2010). However, during the financial crisis, our banking subsidiaries reduced their dependence on unsecured wholesale funding to virtually zero. Consequently, and despite ongoing exposure to a variety of idiosyncratic and systemic events, we view our funding liquidity risk to be relatively modest.
An additional variable affecting our access, and the access of our banking subsidiaries, to unsecured wholesale market funds and to large denomination (i.e., uninsured) customer deposits is the credit ratings assigned by such agencies as Moody’s, Standard & Poor’s and Fitch. The following table presents our credit ratings:
| June 30, 2014 | ||||||
| Moody’s | Standard and Poor’s(1) |
Fitch(2) | ||||
| Citizens Financial Group, Inc.: |
||||||
| Long-term issuer |
NR | BBB+ | BBB+ | |||
| Short-term issuer |
NR | A-2 | F2 | |||
| Subordinated debt |
NR | BBB | BBB | |||
| Citizens Bank, N.A.: |
||||||
| Long-term issuer |
A3 | A- | BBB+ | |||
| Short-term issuer |
P-2 | A-2 | F2 | |||
| Citizens Bank of Pennsylvania: |
||||||
| Long-term issuer |
A3 | A- | BBB+ | |||
| Short-term issuer |
P-2 | A-2 | F2 | |||
NR = Not rated
| (1) | On May 7, 2014, Standard & Poor’s lowered Citizens Financial Group, Inc.’s stand-alone credit profile to “A-” from “A.” |
| (2) | On August 21, 2014, Fitch affirmed Citizens Financial Group, Inc.’s, Citizens Bank, N.A.’s and Citizens Bank of Pennsylvania’s long-term and short-term issuer ratings. |
Changes in our public credit ratings could affect both the cost and availability of our wholesale funding. Because of current credit ratings, CBNA and CBPA have limited access to unsecured wholesale funding. As a result and in order to maintain a conservative funding profile, our banking subsidiaries continue to minimize reliance on unsecured wholesale funding. At June 30, 2014, the majority of wholesale funding consisted of secured borrowings using high-quality liquid securities sold under agreements to repurchase (repurchase agreements) and secured FHLB advances using high-quality residential loan collateral. Our dependence on unsecured and credit-sensitive funding continues to be relatively low.
143
Table of Contents
Existing and evolving regulatory liquidity requirements represent another key driver of systemic liquidity conditions and liquidity management practices. The Federal Reserve Board evaluates our liquidity as part of the supervisory process, and the Federal Reserve Board recently issued regulations that will require us to conduct regular liquidity stress testing over various time horizons and to maintain a buffer of highly liquid assets sufficient to cover expected net cash outflows and projected loss or impairment of funding sources for a short-term liquidity stress scenario. See “Regulation and Supervision—Enhanced Prudential Standards.” In addition, the Basel Committee has developed a set of internationally-agreed upon quantitative liquidity metrics: the LCR and the Net Stable Funding Ratio (“NSFR”).
The LCR was developed to ensure banks have sufficient high-quality liquid assets to cover expected net cash outflows over a 30-day liquidity stress period. In September 2014, the U.S. federal banking regulators issued a final rule to implement a modified version of the LCR in the United States, which applies to bank holding companies with more than $50 billion but less than $250 billion in total assets, and less than $10 billion in on-balance sheet foreign exposure, such as us. The modified version of the LCR differs in certain respects from the Basel Committee’s version of the LCR, including a narrower definition of high-quality liquid assets, different prescribed cash inflow and outflow assumptions for certain types of instruments and transactions and a shorter phase-in schedule that begins on January 1, 2016 and ends on January 1, 2017. Achieving LCR compliance may require changes in the size and/or composition of our investment portfolio, the configuration of our discretionary wholesale funding portfolio, and our average cash position. While the specific LCR requirements were recently finalized, and hence the full extent of and impact from related implementation strategies cannot yet be quantified, at present, we expect to be fully compliant with the LCR by the required implementation date.
The NSFR was developed to provide a sustainable maturity structure of assets and liabilities and has a time horizon of one year. The Basel Committee contemplates that the NSFR, including any revisions, will be implemented as a minimum standard by January 1, 2018; however, the federal banking regulators have not yet proposed rules to implement the NSFR in the United States.
We continue to review these liquidity requirements, and to develop implementation plans and liquidity strategies. We expect to be fully compliant with the final rules on or prior to the applicable effective date.
Liquidity Risk Management and Governance
Liquidity risk is measured and managed by the Wholesale Funding and Liquidity unit within our treasury unit in accordance with policy guidelines promulgated by our Board and the Asset and Liability Management Committee. In managing liquidity risk, the Wholesale Funding and Liquidity unit delivers regular and comprehensive reporting, including current levels vs. threshold limits, for a broad set of liquidity metrics, explanatory commentary relating to emerging risk trends and, as appropriate, recommended remedial strategies.
The mission of our Wholesale Funding and Liquidity unit is to deliver prudent levels of current, projected and contingent liquidity from stable sources, in a timely manner and at a reasonable cost, without significant adverse consequences.
We seek to accomplish this mission by funding loans with stable deposits; by prudently controlling dependence on wholesale funding, particularly unsecured funding; and by maintaining ample available liquidity, including a liquidity buffer of unencumbered high-quality loans and securities. As of June 30, 2014:
| • | Core deposits continued to be our primary source of funding and our consolidated period-end loan-to-deposit ratio was 97.20% and includes loans and deposits held for sale; |
144
Table of Contents
| • | Unsecured wholesale funding was relatively low, at $1.1 billion, substantially offset by excess cash balances held at the Federal Reserve Banks, defined as total reserves held less required reserves of $4.3 billion; |
| • | Asset liquidity remained robust at $16.6 billion: net overnight position, defined as federal funds sold plus excess balances held at the Federal Reserve Banks minus federal funds purchased, totaled $4.3 billion; unencumbered liquid securities totaled $10.7 billion; and available FHLB capacity secured by mortgage loans totaled $1.6 billion; and |
| • | Available discount window capacity, defined as available total borrowing capacity from the Federal Reserve based on identified collateral, is secured by non-mortgage commercial and consumer loans, and totaled $10.1 billion. Use of this borrowing capacity would likely be considered only during exigent circumstances. |
The Wholesale Funding and Liquidity unit monitors a variety of liquidity and funding metrics, including specific risk threshold limits. The metrics are broadly classified as follows:
| • | Current liquidity sources and capacities, including excess cash at the Federal Reserve Banks, free and liquid securities and available and secured FHLB borrowing capacity; |
| • | Contingent stressed liquidity, including idiosyncratic, systemic and combined stress scenarios, in addition to evolving regulatory requirements such as the Liquidity Coverage Ratio and the Net Stable Funding Ratio; and |
| • | Current and prospective exposures, including secured and unsecured wholesale funding and spot and cumulative cash-flow gaps across a variety of horizons. |
Further, certain of these metrics are monitored for each of us, our banking subsidiaries, and for our consolidated enterprise on a daily basis, including net overnight position, free securities, internal liquidity, available FHLB borrowing capacity and total asset liquidity. In order to identify emerging trends and risks and inform funding decisions, specific metrics are also forecasted over a one-year horizon.
For the six months ended June 30, 2014, our operating activities contributed $1.0 billion in net cash, including an increase in other liabilities, which added $354 million, and an increase in depreciation, amortization and accretion, which added $196 million. For the six months ended June 30, 2014, net cash used by investing activities was $5.6 billion, primarily reflecting net securities available for sale portfolio purchases of $4.3 billion, a net increase in loans and leases of $2.2 billion and securities held to maturity portfolio purchases of $1.2 billion, partially offset by proceeds from maturities, paydowns and sales of securities available for sale of $2.1 billion. Finally, for the six months ended June 30, 2014, cash provided by financing activities was $7.2 billion, including a net increase in other short-term borrowed funds of $5.5 billion and a net increase in federal funds purchased and securities sold under agreement to repurchase of $2.0 billion. These activities represented a cumulative increase in cash and cash equivalents of $2.6 billion, which, when added to the cash and cash equivalents balance of $2.8 billion at the beginning of the period, resulted in an ending balance of cash and cash equivalents of $5.4 billion as of June 30, 2014.
For the six months ended June 30, 2013, aggregate operating activities contributed $1.4 billion in net cash. Significant items within this category included net loss of $3.7 billion and goodwill impairment of $4.4 billion. For the six months ended June 30, 2013, investing activities contributed net cash of $4.9 billion, primarily reflecting proceeds from maturities, paydowns and sales of securities available for sale of $5.3 billion, a decrease in loans and leases of $2.0 billion and a decrease in interest-bearing deposits in banks of $1.1 billion offset by purchases of securities available for sale of $3.3 billion. Finally, financing activities utilized net cash of $4.9 billion, primarily reflecting a decrease in deposits of $3.8 billion, a net decrease in other short-term borrowed funds of $500 million and dividends declared and paid to parent
145
Table of Contents
of $428 million. Together, these activities resulted in a cumulative increase in cash and cash equivalents of $1.4 billion. When added to the cash and cash equivalents balance of $3.1 billion at the beginning of the period, the result was an ending cash and cash equivalents balance of $4.5 billion at June 30, 2013.
For the year ended December 31, 2013, our operating activities contributed $2.6 billion in net cash, including sales of mortgage loans net of originations which, added $448 million, and a decrease in other assets, which added $827 million. For the year ended December 31, 2013, net cash contributed by investing activities decreased by $2.5 billion, primarily reflecting net securities available for sale portfolio purchases of $11.0 billion, partially offset by proceeds from maturities, paydowns and sales of securities available for sale of $8.4 billion. Finally, for the year ended December 31, 2013, cash used in financing activities was $502 million, including a net decrease in deposits of $3.0 billion, and $1.2 billion in dividends paid to RBS. These activities represented a cumulative decrease in cash and cash equivalents of $306 million, which, when added to cash and cash equivalents of $3.1 billion at the beginning of the year, resulted in an ending balance of cash and cash equivalents of $2.8 billion as of December 31, 2013.
For the year ended December 31, 2012, aggregate operating activities contributed $1.7 billion in net cash. Significant items within this category included net income of $643 million and deferred income taxes of $306 million. For the year ended December 31, 2012, investing activities contributed net cash of $919 million, primarily reflecting purchases of securities available for sale of $5.5 billion and an increase in loans and leases of $1.4 billion, more than offset by proceeds from maturities, paydowns and sales of securities available for sale of $9.4 billion. Finally, financing activities utilized net cash of $3.3 billion, primarily reflecting an increase in deposits of $2.6 billion, a net decrease in short-term borrowed funds of $2.6 billion, repayments of long-term borrowed funds of $2.9 billion, and a net decrease in federal funds purchased and securities sold under agreements to repurchase of $551 million. Together, these activities resulted in a cumulative decrease in cash and cash equivalents of $631 million. When added to the cash and cash equivalents balance of $3.7 billion at the beginning of the year, the result was an ending cash and cash equivalents balance of $3.1 billion at December 31, 2012.
Contractual Obligations
The following table presents our outstanding contractual obligations as of December 31, 2013:
| Total | Less than 1 year |
1 to 3 years | 3 to 5 years | After 5 years | ||||||||||||||||
| (in millions) | ||||||||||||||||||||
| Long-term borrowed funds |
$ | 1,405 | $ | — | $ | 9 | $ | 30 | $ | 1,366 | ||||||||||
| Operating lease obligations |
896 | 173 | 307 | 203 | 213 | |||||||||||||||
| Time deposits |
9,588 | 7,444 | 1,450 | 687 | 7 | |||||||||||||||
| Purchase obligations(1) |
581 | 456 | 87 | 38 | — | |||||||||||||||
|
|
|
|
|
|
|
|
|
|
|
|||||||||||
| $ | 12,470 | $ | 8,073 | $ | 1,853 | $ | 958 | $ | 1,586 | |||||||||||
|
|
|
|
|
|
|
|
|
|
|
|||||||||||
| (1) | Includes purchase obligations for goods and services covered by non-cancellable contracts and contracts including cancellation fees. |
146
Table of Contents
Off Balance Sheet Commitments
The following table presents our outstanding off balance sheet commitments. See Note 16 “Commitments, Guarantees and Contingencies,” to our audited consolidated financial statements included elsewhere in this prospectus for further discussion:
| June 30, 2014 |
December 31, 2013 |
Change | Percent | |||||||||||||
| (dollars in millions) | (%) | |||||||||||||||
| Commitment amount: |
||||||||||||||||
| Undrawn commitments to extend credit |
$ | 54,353 | $ | 53,987 | $ | 366 | 1 | % | ||||||||
| Financial standby letters of credit |
2,622 | 2,556 | 66 | 3 | ||||||||||||
| Performance letters of credit |
118 | 149 | (31 | ) | 21 | |||||||||||
| Commercial letters of credit |
56 | 64 | (8 | ) | (13 | ) | ||||||||||
| Marketing rights |
54 | 54 | — | — | ||||||||||||
| Risk participation agreements |
20 | 17 | 3 | 18 | ||||||||||||
| Residential mortgage loans sold with recourse |
12 | 13 | (1 | ) | (8 | ) | ||||||||||
|
|
|
|
|
|
|
|||||||||||
| Total |
$ | 57,235 | $ | 56,840 | $ | 395 | 1 | % | ||||||||
|
|
|
|
|
|
|
|||||||||||
| As of December 31, | Change | Percent | ||||||||||||||
| 2013 | 2012 | |||||||||||||||
| (dollars in millions) | (%) | |||||||||||||||
| Commitment amount: |
||||||||||||||||
| Undrawn commitments to extend credit |
$ | 53,987 | $ | 50,507 | $ | 3,480 | 7 | % | ||||||||
| Financial standby letters of credit |
2,556 | 3,082 | (526 | ) | (17 | ) | ||||||||||
| Performance letters of credit |
149 | 152 | (3 | ) | (2 | ) | ||||||||||
| Commercial letters of credit |
64 | 103 | (39 | ) | (38 | ) | ||||||||||
| Marketing rights |
54 | 57 | (3 | ) | (5 | ) | ||||||||||
| Risk participation agreements |
17 | 30 | (13 | ) | (43 | ) | ||||||||||
| Residential mortgage loans sold with recourse |
13 | 17 | (4 | ) | (24 | ) | ||||||||||
|
|
|
|
|
|
|
|||||||||||
| Total |
$ | 56,840 | $ | 53,948 | $ | 2,892 | 5 | % | ||||||||
|
|
|
|
|
|
|
|||||||||||
On May 29, 2014, we entered into an agreement to purchase auto loans on a quarterly basis in future periods. For the first year, the agreement requires the purchase of a minimum of $250 million of outstanding balances to a maximum of $600 million per quarterly period. For quarterly periods after the first year, the minimum and maximum purchases are $400 million and $600 million, respectively. The agreement automatically renews until terminated by either party. We may cancel the agreement at will with payment of a variable termination fee. After three years, there is no termination fee. For more information regarding this agreement, see “Management’s Discussion and Analysis of Financial Condition and Results of Operations—Recent Events.”
Critical Accounting Estimates
Our consolidated financial statements, which are included elsewhere in this prospectus, are prepared in accordance with GAAP. The preparation of financial statements in conformity with GAAP requires us to establish accounting policies and make estimates that affect amounts reported in our consolidated financial statements.
An accounting estimate requires assumptions and judgments about uncertain matters that could have a material effect on our consolidated financial statements. Estimates are made using facts and circumstances known at a point in time. Changes in those facts and circumstances could produce results substantially different from those estimates. The most significant accounting policies and estimates and their related application are discussed below.
147
Table of Contents
See Note 1 “Significant Accounting Policies” in our audited consolidated financial statements included elsewhere in this prospectus for further discussion of our significant accounting policies.
Allowance for Credit Losses
Management’s estimate of probable losses in our loan and lease portfolios including unfunded lending commitments is recorded in the allowance for loan and lease losses and the reserve for unfunded lending commitments, at levels that we believe to be appropriate as of the balance sheet date. Our determination of such estimates is based on a periodic evaluation of the loan and lease portfolios and unfunded credit facilities, as well as other relevant factors. This evaluation is inherently subjective and requires significant estimates and judgments of underlying factors, all of which are susceptible to change.
The allowance for loan and lease losses and reserve for unfunded lending commitments could be affected by a variety of internal and external factors. Internal factors include portfolio performance such as delinquency levels, assigned risk ratings, the mix and level of loan balances, differing economic risks associated with each loan category and the financial condition of specific borrowers. External factors include fluctuations in the general economy, unemployment rates, bankruptcy filings, developments within a particular industry, changes in collateral values and factors particular to a specific commercial credit such as competition, business and management performance. The allowance for loan and lease losses may be adjusted to reflect our current assessment of various qualitative risks, factors and events that may not be measured in our statistical procedures. There is no certainty that the allowance for loan and lease losses and reserve for unfunded lending commitments will be appropriate over time to cover losses because of unanticipated adverse changes in any of these internal, external or qualitative factors.
The evaluation of the adequacy of the commercial and commercial real estate allowance for loan and lease losses and reserve for unfunded lending commitments is primarily based on risk rating models that assess probability of default, loss given default and exposure at default on an individual loan basis. The models are primarily driven by individual customer financial characteristics and are validated against historical experience. Additionally, qualitative factors may be included in the risk rating models. After the aggregation of individual borrower incurred loss, additional overlays can be made based on back-testing against historical losses and forward loss curve ratios.
For nonaccruing commercial and commercial real estate loans with an outstanding balance of $3 million or greater and for all commercial and commercial real estate TDRs (regardless of size), we conduct specific analysis on a loan level basis to determine the probable amount of credit loss. If appropriate, a specific allowance is established for the loan through a charge to the provision for credit losses. For all classes of impaired loans, individual loan measures of impairment may result in a charge-off to the allowance for loan and lease losses, if deemed appropriate. In such cases, the provision for credit losses is not affected when a specific reserve for at least that amount already exists. Techniques utilized include comparing the loan’s carrying amount to the estimated present value of its future cash flows, the fair value of its underlying collateral, or the loan’s observable market price. The technique applied to each impaired loan is based on the workout officer’s opinion of the most probable workout scenario. Historically this has generally led to the use of the estimated present value of future cash flows approach. The fair value of underlying collateral will be used if the loan is deemed collateral-dependent. For loans that use the fair value of underlying collateral approach, a charge-off assessment is performed quarterly to write the loans down to fair value.
For most non-impaired retail loan portfolio types, the allowance for loan and lease losses is based upon the incurred loss model utilizing the probability of default (“PD”), loss given default (“LGD”) and exposure at default on an individual loan basis. When developing these factors, we may consider the
148
Table of Contents
loan product and collateral type, LTV ratio, lien position, borrower’s credit, time outstanding, geographic location, delinquency status and incurred loss period. Incurred loss periods are reviewed and updated at least annually, and potentially more frequently when economic situations change rapidly, as they tend to fluctuate with economic cycles. Incurred loss periods are generally longer in good economic times and shorter in bad times.
For home equity lines and loans, a number of factors impact the PD. Specifically, the borrower’s current FICO score, the utilization rate, delinquency statistics, borrower income, current combined loan to value ratio and months on books are all used to assess the borrower’s creditworthiness. Similarly, the loss severity is also impacted by various factors, including the utilization rate, the combined loan to value ratio, the lien position, the Housing Price Index change for the location (as measured by the Case-Shiller index), months on books and current loan balance.
When we are not in a first lien position, we use delinquency information on the first lien exposures obtained from third-party credit information providers in the credit assessment. For all first liens, whether owned by a third party or by us, an additional assessment is performed on a quarterly basis. In this assessment, the most recent three months’ performance of the senior liens is reviewed for delinquency (90 days or more past due), modification, foreclosure and/or bankruptcy statuses. If any derogatory status is present, the junior lien will be placed on nonaccrual status regardless of its delinquency status on our books. This subsequent change to nonaccrual status will alter the treatment in the PD model, thus affecting the reserve calculation.
In addition, the first lien exposure is combined with the second lien exposure to generate a combined LTV. The combined LTV is a more accurate reflection of the leverage of the borrower against the property value, as compared to the LTV from just the junior lien(s). The combined LTV is used for modeling both the junior lien PD and LGD. This also impacts the Allowance for Loan Loss rates for the junior lien HELOCs.
The above measures are all used to assess the PD and LGD for HELOC borrowers for whom we originated the loans. There is also a portfolio of home equity products that were originated and serviced by others (“SBO”); however, we currently service some of the loans in this portfolio. The SBO portfolio is modeled as a separate class and the reserves for this class are generated by using the delinquency roll rate models as described below.
For student loan and SBO portfolios, we estimate the allowance for loan loss by utilizing a delinquency roll rate model. For such a model, the portfolio is segmented by delinquency category (e.g. 30 days past due, 60 days past due, etc.). The purpose of this segmentation is to evaluate the probability of a loan flowing into the next delinquency stage category, within one month. The projected rate for each delinquency category is the moving average of the previous 12 months’ rates, although the number of months used could vary by loan type, with the current month from the previous two years included to adjust for seasonality. For the portfolios utilizing the incurred loss model, roll rate models are also run as challenger models and can be used to support management overlays if deemed necessary. At a macro level, retail losses for all portfolio types may be affected by factors such as collateral values, unemployment rates and local economic conditions.
For retail TDRs that are not collateral-dependent, allowances are developed using the present value of expected future cash flows, compared to the recorded investment in the loans. Expected re-default factors are considered in this analysis. Retail TDRs that are deemed collateral-dependent are written down to the fair market value of the collateral less costs to sell. The fair value of collateral is periodically monitored subsequent to the modification.
Changes in the levels of estimated losses, even if minor, can significantly affect management’s determination of an appropriate allowance for loan and lease losses. For consumer loans, losses are
149
Table of Contents
affected by such factors as loss severity, collateral values, economic conditions, and other factors. A 1% and 5% increase in the estimated loss rate for consumer loans at December 31, 2013 would have increased the allowance by $5 million and $25 million, respectively. The allowance for loan and lease losses for our Commercial Banking segment is sensitive to assigned credit risk ratings and inherent loss rates. If 10% and 20% of the December 31, 2013 period ending loan balances (including unfunded commitments) within each risk rating category of our Commercial Banking segment had experienced downgrades of two risk categories, the allowance for loan and lease losses would have increased by $32 million and $64 million, respectively, as of December 31, 2013.
Commercial loans and leases are charged off to the allowance when there is little prospect of collecting either principal or interest. Charge-offs of commercial loans and leases usually involve receipt of borrower-specific adverse information. For commercial collateral-dependent loans, an appraisal or other valuation is used to quantify a shortfall between the fair value of the collateral less costs to sell and the recorded investment in the commercial loan. Retail loan charge-offs are generally based on established delinquency thresholds rather than borrower-specific adverse information. When a loan is collateral-dependent, any shortfalls between the fair value of the collateral less costs to sell and the recorded investment is promptly charged off. Placing any loan or lease on nonaccrual status does not by itself require a partial or total charge-off; however, any identified losses are charged off at that time.
For additional information regarding the allowance for loan and lease losses and reserve for unfunded lending commitments, see Note 4 “Allowance for Credit Losses, Nonperforming Assets and Concentrations of Credit Risk” to our unaudited interim consolidated financial statements, as well as Note 5 “Allowance for Credit Losses, Nonperforming Assets and Concentrations of Credit Risk,” and Note 1 “Significant Accounting Policies,” to our audited consolidated financial statements included elsewhere in this prospectus.
Nonperforming Loans and Leases
Commercial loans, commercial real estate loans and leases are generally placed on nonaccrual status when contractually past due 90 days or more, or earlier if management believes that the probability of collection is insufficient to warrant further accrual. Some of these loans and leases may remain on accrual status when contractually past due 90 days or more if management considers the loan collectible. A loan may be returned to accrual status if (i) principal and interest payments have been brought current and we expect repayment of the remaining contractual principal and interest, (ii) the loan or lease has otherwise become well-secured and in the process of collection, or (iii) the borrower has been making regularly scheduled payments in full for the prior 6 months and it is reasonably assured that the loan or lease will be brought fully current within a reasonable period. Cash receipts on nonaccruing loans and leases are generally applied to reduce the unpaid principal balance.
Residential mortgages are generally placed on nonaccrual status when past due 120 days, or sooner if determined to be collateral-dependent. Residential mortgages are returned to accrual status when principal and interest payments become less than 120 days past due and when future payments are reasonably assured. Credit card balances (included in the “unsecured” retail class of loans) are placed on nonaccrual status when past due 90 days or more. Credit card balances are restored to accruing status if they subsequently become less than 90 days past due. Government guaranteed student loans (included in the “unsecured” class of loans) are not placed on nonaccrual status.
All other retail loans are generally placed on nonaccrual status when past due 90 days or more, or earlier if management believes the probability of collection is insufficient to warrant further accrual. Loans less than 90 days past due may be placed on nonaccrual status upon the death of the borrower, surrender or repossession of collateral, fraud or bankruptcy. Loans are generally returned to accrual
150
Table of Contents
status if the loan becomes less than 15 days past due. Cash receipts on nonaccruing loans and leases are generally applied to reduce the unpaid principal balance. Certain TDRs that are current in payment status are classified as nonaccrual in accordance with regulatory guidance. Income on these loans is generally recognized on a cash basis if management believes the remaining book value of the loan is realizable. Nonaccruing TDRs that meet the guidelines above for accrual status can be returned to accruing if supported by a well-documented evaluation of the borrower’s financial condition, and if they have been current for at least 6 months.
Additional information regarding our nonperforming loans and leases can be found in Note 4 “Allowance for Credit Losses, Nonperforming Assets and Concentrations of Credit Risk” to our unaudited interim consolidated financial statements, as well as Note 5 “Allowance for Credit Losses, Nonperforming Assets and Concentrations of Credit Risk,” and Note 1 “Significant Accounting Policies,” to our audited consolidated financial statements included elsewhere in this prospectus.
Impaired Loans
A loan is considered to be impaired when it is probable that we will be unable to collect all of the contractual interest and principal payments as scheduled in the loan agreement. Impaired loans include nonaccruing larger balance (greater than $3 million carrying value) non-homogenous commercial and commercial real estate loans, and restructured loans that are deemed TDRs. A loan modification is identified as a TDR when we, or a bankruptcy court, grants the borrower a concession that we would not otherwise make in response to the borrower’s financial difficulties. Concessions granted in TDRs for all classes of loans may include lowering the interest rate, forgiving a portion of principal, extending the loan term, lowering scheduled payments for a specified period of time, principal forbearance, or capitalizing past due amounts. A rate increase can be a concession if the increased rate is lower than a market rate for debt with risk similar to that of the restructured loan. Additionally, TDRs for commercial loans may also involve creating a multiple note structure, accepting non-cash assets, accepting an equity interest, or receiving a performance-based fee. In some cases a TDR may involve multiple concessions. The financial effects of TDRs for all loan classes may include lower income (either due to a lower interest rate or a delay in the timing of cash flows), larger loan loss provisions and accelerated charge-offs if the modification renders the loan collateral-dependent. In some cases, interest income throughout the term of the loan may increase if, for example, the loan is extended or the interest rate is increased as a result of the restructuring.
Impairment evaluations are performed at the individual loan level, and consider expected future cash flows from the loan, including, if appropriate, the realizable value of collateral. Impaired loans that are not TDRs are nonaccruing, and loans involved in TDRs may be accruing or nonaccruing. Retail loans that were discharged in bankruptcy and not reaffirmed by the customer are generally deemed to be collateral-dependent TDRs and are charged off to the fair value of the collateral, less cost to sell, and less amounts recoverable under a government guarantee (if any). Recently issued regulatory guidance on bankruptcy-discharged TDRs permits banks to apply judgment in the evaluation of the probability of loan repayment. As a result of the new guidance (which was issued in February 2014), loans for which we have documented that repayment is likely to occur need not be charged down to collateral value. Cash receipts on nonaccruing impaired loans, including nonaccruing loans involved in TDRs, are generally applied to reduce the unpaid principal balance.
Loans are generally restored to accrual status when principal and interest payments are brought current and when future payments are reasonably assured, following a sustained period of repayment performance by the borrower in accordance with the loan’s contractual terms.
For additional information regarding our impaired loans, see Note 4 “Allowance for Credit Losses, Nonperforming Assets and Concentrations of Credit Risk” to our unaudited interim consolidated
151
Table of Contents
financial statements, as well as Note 5 “Allowance for Credit Losses, Nonperforming Assets and Concentrations of Credit Risk,” and Note 1 “Significant Accounting Policies,” to our audited consolidated financial statements included elsewhere in this prospectus.
Fair Value
We measure fair value using the price that would be received to sell an asset or paid to transfer a liability in an orderly transaction between market participants at the measurement date. Fair value is based upon quoted market prices in an active market, where available. If quoted prices are not available, observable market-based inputs or independently sourced parameters are used to develop fair value, whenever possible. Such inputs may include prices of similar assets or liabilities, yield curves, interest rates, prepayment speeds and foreign exchange rates.
We classify our assets and liabilities that are carried at fair value in accordance with the three-level valuation hierarchy:
| • | Level 1. Quoted prices (unadjusted) in active markets for identical assets or liabilities; |
| • | Level 2. Observable inputs other than Level 1 prices, such as quoted prices for similar instruments; quoted prices in markets that are not active; or other inputs that are observable or can be corroborated by market data for substantially the full term of the asset or liability; and |
| • | Level 3. Unobservable inputs that are supported by little or no market information and that are significant to the fair value measurement. |
Classification in the hierarchy is based upon the lowest level input that is significant to the fair value measurement of the asset or liability. For instruments classified in Level 1 and 2 where inputs are primarily based upon observable market data, there is less judgment applied in arriving at the fair value. For instruments classified in Level 3, management judgment is more significant due to the lack of observable market data.
Significant assets measured at fair value on a recurring basis include our mortgage-backed securities available for sale. These instruments are priced using an external pricing service and are classified as Level 2 within the fair value hierarchy. The service’s pricing models use predominantly observable valuation inputs to measure the fair value of these securities under both the market and income approaches. The pricing service utilizes a matrix pricing methodology to price our U.S. agency pass-through securities, which involves making adjustments to to-be-announced security prices based on a matrix of various mortgage-backed securities characteristics such as weighted-average maturities, indices and other pool-level information. Other agency and non-agency mortgage-backed securities are priced using a discounted cash flow methodology. This methodology includes estimating the cash flows expected to be received for each security using projected prepayment speeds and default rates based on historical statistics of the underlying collateral and current market conventions. These estimated cash flows are then discounted using market-based discount rates that incorporate characteristics such as average life, volatility, ratings, performance of the underlying collateral, and prevailing market conditions.
We review and update the fair value hierarchy classifications on a quarterly basis. Changes from one quarter to the next related to the observability of inputs in fair value measurements may result in a reclassification between the fair value hierarchy levels and are recognized based on period-end balances. We also verify the accuracy of the pricing provided by our primary external pricing service on a quarterly basis. This process involves using a secondary external vendor to provide valuations for our securities portfolio for comparison purposes. Any securities with discrepancies beyond a certain threshold are researched and, if necessary, valued by an independent outside broker.
152
Table of Contents
Fair value is also used on a nonrecurring basis to evaluate certain assets for impairment or for disclosure purposes. Examples of nonrecurring uses of fair value include mortgage servicing rights accounted for by the amortization method, loan impairments for certain loans and goodwill.
For additional information regarding our fair value measurements, see Note 2 “Securities,” Note 6 “Mortgage Banking,” and Note 11 “Derivatives” to our unaudited interim consolidated financial statements, as well as Note 1 “Significant Accounting Policies,” Note 3 “Securities,” Note 9 “Mortgage Banking” and Note 15 “Derivatives” to our audited consolidated financial statements included elsewhere in this prospectus.
Goodwill
Goodwill is an asset that represents the future economic benefits arising from other assets acquired in a business combination that are not individually identified and separately recognized. Goodwill is not amortized, but is subject to annual impairment tests. Goodwill is assigned to reporting units at the date the goodwill is initially recorded. A reporting unit is a business operating segment or a component of a business operating segment. Once goodwill has been assigned to reporting units, it no longer retains its association with a particular acquisition, and all of the activities within a reporting unit, whether acquired or organically grown, are available to support the value of the goodwill.
The goodwill impairment analysis is a two-step test. The first step, used to identify potential impairment, involves comparing each reporting unit’s fair value to its carrying value including goodwill. If the fair value of a reporting unit exceeds its carrying value, applicable goodwill is deemed to be not impaired. If the carrying value exceeds fair value, there is an indication of impairment and the second step is performed to measure the amount of impairment.
The second step involves calculating an implied fair value of goodwill for each reporting unit for which the first step indicated impairment. The implied fair value of goodwill is determined in the same manner as the amount of goodwill recognized in a business combination, which is the excess of the fair value of the reporting unit, as determined in the first step, over the aggregate fair values of the individual assets, liabilities and identifiable intangible assets as if the reporting unit were being acquired in a business combination. If the implied fair value of goodwill exceeds the carrying value of goodwill assigned to the reporting unit, there is no impairment. If the carrying value of goodwill assigned to a reporting unit exceeds the implied fair value of the goodwill, an impairment charge is recorded for the excess. An impairment loss recognized cannot exceed the amount of goodwill assigned to a reporting unit, and the loss establishes a new basis in the goodwill. Subsequent reversal of goodwill impairment losses is not permitted.
We review goodwill for impairment annually as of October 31 (previously as of September 30) or more often if events or circumstances indicate that it is more likely than not that the fair value of one or more reporting units is below its carrying value. We rely on the income approach (discounted cash flow method) as the primary method for determining fair value. Market-based methods are used as benchmarks to corroborate the value determined by the discounted cash flow method.
We rely on several assumptions when estimating the fair value of our reporting units using the discounted cash flow method. These assumptions include the current discount rate, as well as projected loan losses, income taxes and capital retention rates. Discount rates are estimated based on the Capital Asset Pricing Model, which considers the risk-free interest rate, market risk premium, beta and unsystematic risk and size premium adjustments specific to a particular reporting unit. The discount rates are also calibrated on the assessment of the risks related to the projected cash flows of each reporting unit. Multi-year financial forecasts are developed for each reporting unit by considering several key business drivers such as new business initiatives, customer retention standards, market
153
Table of Contents
share changes, anticipated loan and deposit growth, forward interest rates, historical performance and industry and economic trends, among other considerations. The long-term growth rate used in determining the terminal value of each reporting unit was estimated based on management’s assessment of the minimum expected terminal growth rate of each reporting unit, as well as broader economic considerations such as gross domestic product and inflation.
We corroborate the fair value of our reporting units determined by the discounted cash flow method using market-based methods: a comparable company method and a comparable transaction method. The comparable company method measures fair value of a business by comparing it to publicly traded companies in similar lines of business. This involves identifying and selecting the comparable companies based on a number of factors (i.e., size, growth, profitability, risk and return on investment), calculating the market multiples (i.e., price-to-tangible book value, price-to-cash earnings and price-to-net income) of these comparable companies and then applying these multiples to our operating results to estimate the value of the reporting unit’s equity on a marketable, minority basis. A control premium is then applied to this value to estimate the fair value of the reporting unit on a marketable, controlling basis. The comparable transaction method measures fair value of a business based on exchange prices in actual transactions and on asking prices for controlling interests in public or private companies currently offered for sale. The process involves comparison and correlation of ourselves with other similar companies. Adjustments for differences in factors described earlier (i.e., size, growth, profitability, risk and return on investment) are also considered.
The valuation of goodwill is dependent on forward-looking expectations related to the performance of the U.S. economy and our associated financial performance. The prolonged delay in the full recovery of the U.S. economy, and the impact of that delay on earnings expectations, prompted a goodwill impairment test as of June 30, 2013. Although the U.S. economy has demonstrated signs of recovery, notably improvements in unemployment and housing, the pace and extent of recovery in these indicators, as well as in overall gross domestic product, have lagged previous expectations. The impact of the slow recovery is most evident in our Consumer Banking reporting unit. Accordingly, the percentage by which the estimated fair value of our Consumer Banking reporting unit exceeded its carrying value declined from 7% at December 31, 2011 to 5% at December 31, 2012.
During the first half of 2013, we observed further deceleration of expected growth for our Consumer Banking reporting unit’s future profits based on forecasted economic growth for the U.S. economy and the continuing impact of the new regulatory framework in the financial industry. This deceleration was incorporated into our revised earnings forecast in the second quarter of 2013, and we subsequently concluded that there was a likelihood of greater than 50% that goodwill impairment had occurred as of June 30, 2013.
An interim goodwill impairment test was subsequently performed for our Consumer Banking and Commercial Banking reporting units. Step One of these tests indicated that (1) the fair value of our Consumer Banking reporting unit was less than its carrying value by 19% and (2) the fair value of our Commercial Banking reporting unit exceeded its carrying value by 27%. Step Two of the goodwill impairment test was subsequently performed for our Consumer Banking reporting unit, which resulted in the recognition of a pretax $4.4 billion impairment charge in our Consolidated Statement of Operations for the period ending June 30, 2013. The impairment charge, which was a non-cash item, had minimal impact on our Tier 1 and total capital ratios. The impairment charge had no impact on our liquidity position or tangible common equity.
We performed an annual test for impairment of goodwill for both reporting units as of October 31, 2013. As of this testing date, the percentage by which the fair value of our Consumer Banking reporting unit exceeded its carrying value was 21%, and the percentage by which the fair value of our Commercial Banking reporting unit exceeded its carrying value was 31%.
154
Table of Contents
We based the fair value estimates used in our annual goodwill impairment testing on assumptions we believe to be representative of assumptions that a market participant would use in valuing the reporting units but that are unpredictable and inherently uncertain, including estimates of future growth rates and operating margins and assumptions about the overall economic climate and the competitive environment for our reporting units. There can be no assurances that future estimates and assumptions made for purposes of goodwill testing will prove accurate predictions of the future. If the assumptions regarding business plans, competitive environments or anticipated growth rates are not achieved, we may be required to record goodwill impairment charges in future periods.
For additional information regarding our goodwill impairment testing, see Note 5 “Goodwill” to our unaudited interim consolidated financial statements, as well as Note 1 “Significant Accounting Policies” and Note 8 “Goodwill” to our audited consolidated financial statements included elsewhere in this prospectus.
Income Taxes
Accrued income taxes are reported as a component of either other assets or other liabilities, as appropriate, in the audited consolidated balance sheets and reflect our estimate of income taxes to be paid or that effectively have been prepaid. Deferred income tax assets and liabilities represent the amount of future income taxes to be paid or that effectively have been prepaid, and the net balance is reported as an asset or liability in the audited consolidated balance sheets. We determine the realization of the deferred tax asset based upon an evaluation of the four possible sources of taxable income: (1) the future reversals of taxable temporary differences; (2) future taxable income exclusive of reversing temporary differences and carryforwards; (3) taxable income in prior carryback years; and (4) tax planning strategies. In projecting future taxable income, we utilize forecasted pretax earnings, adjust for the estimated book-tax differences and incorporate assumptions, including the amount of income allocable to taxing jurisdictions. These assumptions require significant judgment and are consistent with the plans and estimates that we use to manage the underlying businesses. The realization of the deferred tax assets could be reduced in the future if these estimates are significantly different than forecasted.
We are subject to income tax in the United States and multiple state and local jurisdictions. The tax laws and regulations in each jurisdiction may be interpreted differently in certain situations, which could result in a range of outcomes. Thus, we are required to exercise judgment regarding the application of these tax laws and regulations. We evaluate and recognize tax liabilities related to any tax uncertainties. Due to the complexity of some of these uncertainties, the ultimate resolution may differ from the current estimate of tax liabilities or refunds.
Our estimate of accrued income taxes, deferred income taxes and income tax expense can also change in any period as a result of new legislative or judicial guidance impacting tax positions, as well as changes in income tax rates. Any changes, if they occur, can be significant to our audited consolidated financial position, results of operations or cash flows.
For additional information regarding income taxes, see Note 10 “Income Taxes” to our unaudited interim consolidated financial statements, as well as Note 14 “Income Taxes” and Note 1 “Significant Accounting Policies” to our audited consolidated financial statements included elsewhere in this prospectus.
155
Table of Contents
Risk Governance and Quantitative and Qualitative Disclosures About Risk
We are committed to maintaining a strong, integrated and proactive approach to the management of all risks to which we are exposed in pursuit of our business objectives. A key aspect of our Board’s responsibility as the main decision making body is setting our risk appetite to ensure that the levels of risk that we are willing to accept in the attainment of our strategic business and financial objectives are clearly understood.
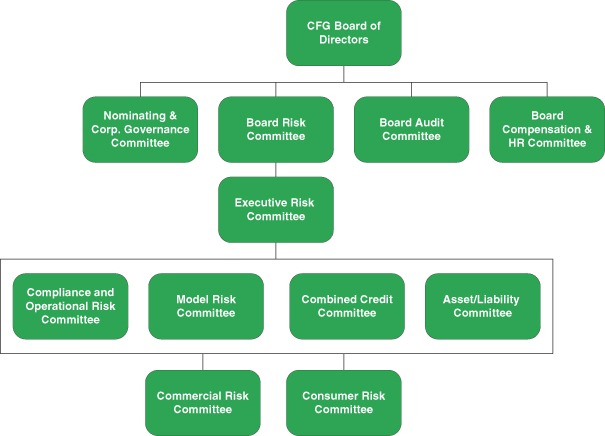
To enable the Board to carry out its objectives, it has delegated authority for risk management activities, as well as governance and oversight of those activities, to a number of Board and executive management level risk committees. The key committees that specifically consider risk across the enterprise are set out in the diagram below.
Chief Risk Officer
The Chief Risk Officer, or CRO, directs our overall risk management function overseeing the compliance, regulatory, operational and credit risk management. In addition, the CRO has oversight of the management of market, liquidity and strategic risks. The CRO reports to our CEO and Board Risk Committee.
Risk Framework
Our risk management framework is embedded in our business through a “Three Lines of Defense” model which defines responsibilities and accountabilities.
156
Table of Contents
First Line of Defense
The business lines (including their associated support functions) are the First Line of Defense and are accountable for owning and managing, within our defined risk appetite, the risks which exist in their respective business areas. The business lines are responsible for performing regular risk assessments to identify and assess the material risks that arise in their area of responsibility, complying with relevant risk policies, testing and certifying the adequacy and effectiveness of their controls on a regular basis, establishing and documenting operating procedures and establishing and owning a governance structure for identifying and managing risk.
Second Line of Defense
The Second Line of Defense includes independent monitoring and control functions accountable for developing and ensuring implementation of risk and control frameworks, oversight of risk, financial management and valuation, and regulatory compliance. This centralized risk function is appropriately independent from the business and is accountable for overseeing and challenging our business lines on the effective management of their risks. This risk function utilizes training, communications and awareness to provide expert support and advice to the business lines. This includes interpreting the risk policy standards and risk management framework, overseeing compliance by the businesses with policies and responsibilities, including providing relevant management information and escalating concerns where appropriate.
The Executive Risk Committee, chaired by the CRO, actively considers our inherent material risks, analyzes our overall risk profile and seeks confirmation that the risks are being appropriately identified, assessed and mitigated.
Third Line of Defense
Our internal audit function is the Third Line of Defense acting as an independent appraisal and assurance function. As an independent assurance function, internal audit ensures the key business risks are being managed to an acceptable level and that the risk management and internal control framework is operating effectively. Independent assessments are provided to our Audit Committee on a monthly basis and to the Board and executive management in the form of quarterly opinions.
Risk Appetite
Risk Appetite is a strategic business and risk management tool. We define our risk appetite as the maximum limit of acceptable risk beyond which we would either be unable to achieve our strategic objectives and capital adequacy obligations or would assume an unacceptable amount of risk to do so. The Board Risk Committee advises our Board of Directors in relation to current and potential future risk strategy, including determination of risk appetite and tolerance.
The principal non-market risks to which we are subject are: credit risk, operational risk, liquidity risk, strategic risk and reputational risk. We are also subject to market risks. Market risk refers to potential losses arising from changes in interest rates, foreign exchange rates, equity prices, commodity prices and/or other relevant market rates or prices. Market risk does not result from proprietary trading, which we prohibit. Rather, modest market risk arises from trading activities that serve customer needs, including hedging of interest rate and foreign exchange risk. As described below, more material market risk arises from our non-trading banking activities, such as loan origination and deposit-gathering. We have established enterprise-wide policies and methodologies to identify, measure, monitor and report market risk. We actively manage both trading and non-trading market risks. We are also subject to liquidity risk, discussed above under “—Liquidity.”
157
Table of Contents
Our risk appetite framework and risk limit structure establishes guidelines to determine the balance between existing and desired levels of risk and supports the implementation, measurement and management of our risk appetite policy.
Credit Risk
Overview
Credit risk represents the potential for loss arising from a customer, counterparty, or issuer failing to perform in accordance with the contractual terms of the obligation. While the majority of our credit risk is associated with lending activities, we do engage with other financial counterparties for a variety of purposes including investing, asset and liability management, and trading activities. Given the financial impact of credit risk on our profit and loss and balance sheet, the assessment, approval, and management of credit risk represents a major part of our overall risk-management responsibility.
Objective
The credit risk management organization is responsible for approving credit transactions, monitoring portfolio performance, identifying problem loans, and ensuring remedial management.
Organizational Structure
Management and oversight of credit risk is the responsibility of the Chief Credit Officers (“CCO”). Although there is substantial overlap between our consumer and commercial risk management functions and our business segments, Consumer Banking and Commercial Banking, as well as Other, the allocation of a line of business to either Consumer Banking or Commercial Banking for accounting purposes does not necessarily align with our risk management categories. The relevant CCO and their teams oversee the management of credit risk activities, under the guidance of the CRO. There are additional matrix reporting lines for the CCOs and CRO that tie into the segment executive management, as well as the RBS Group Credit Risk Management. From a commercial perspective, it is likely that some matrix reporting lines will continue into the RBS Group Risk functions for as long as we are majority owned by the RBS Group.
The credit risk teams operate independently from the business lines to ensure decisions are not influenced by unbalanced objectives. Each team is comprised of senior credit officers who possess extensive experience structuring and approving loans.
Governance
The primary mechanisms used to govern our credit risk function are our consumer and commercial credit policies. These policies outline the minimum acceptable lending standards that align with our desired risk appetite. Material issues or changes are identified by the individual committees and presented to the Combined Credit Risk Committee, Executive Risk Committee and the Board for approval as required.
Key Management Processes
To ensure credit risks are managed within our risk appetite and business and risk strategies are achieved, we employ a comprehensive and integrated control program. The program’s objective is to proactively (1) identify, (2) measure, (3) monitor, and (4) mitigate existing and emerging credit risks across the lifecycle (origination, account management/portfolio management, and loss mitigation and recovery).
158
Table of Contents
On the consumer banking side of credit risk, our teams use models to evaluate consumer loans across the lifecycle of the loan. Starting at origination, credit scoring models are used to forecast the probability of default of an applicant. These models are embedded in the loan origination system, which allows for real-time scoring and automated decisions for many of our products. Periodic validations are performed on our purchased and proprietary scores to ensure fit for purpose. When approving customers for a new loan or extension of an existing credit line, credit scores are used in conjunction with other credit risk variables such as affordability, length of term, collateral value, collateral type, and lien subordination.
The origination process is supported by dedicated underwriting teams that reside in the business line. The size of each team depends on the intensity of the approval process as the number of handoffs, documentation, and verification requirements differ substantially depending on the loan product.
To ensure proper oversight of the underwriting teams, lending authority is granted by credit risk to each underwriter. The amount of delegated authority depends on the experience of the individual. We periodically evaluate the performance of each underwriter and annually reauthorize their delegated authority. Only senior members of the credit risk team are authorized to grant significant exceptions to credit policies. It is not uncommon to make exceptions to established policies when compensating factors are present. These exceptions are capped at 5% of origination volume and tracked separately to ensure performance expectations are achieved.
Once an account is established, credit scores and collateral values are refreshed at regular intervals to allow for proactive identification of increasing or decreasing levels of credit risk. For accounts with contingent liability (revolving feature), credit policies have been developed that leverage the refreshed customer data to determine if a credit line should be increased, decreased, frozen, or closed. Lastly, behavioral modeling, segmentation, and loan modifications are used to cure delinquency, reduce the severity of loss, and maximize recoveries. Our approach to managing credit risk is highly analytical and, where appropriate, is automated, to ensure consistency and efficiency.
One of the central tools used to manage credit risk is the Consumer and Small Business Credit Risk Dashboard. This dashboard is refreshed monthly and evaluates key dimensions of credit risk against predefined parameters, commonly referred to as triggers and limits. Triggers are designed to alert senior management of unfavorable performance deviations from current risk profile and provide sufficient lead time to address and implement corrective actions before the risk increases in materiality. Where appropriate, triggers are aligned to budget expectations and operational targets. Limits, conversely, are designed to represent the maximum risk tolerance or appetite we are willing to accept in any given year.
The credit risk team is constantly evaluating current and projected economic conditions, internal credit performance in relation to budget and predefined risk tolerances, and current and expected regulatory guidance to determine the optimal balance of expansion and contraction policies. All policy change proposals receive intense scrutiny and syndication prior to approval and implementation. This process ensures decisions are made based on profit based analytics with full consideration to operational and regulatory risks.
On the commercial banking side of credit risk, the structure is broken into Commercial and Industrial (“C&I”) loans and leases and Commercial Real Estate (“CRE”). Within C&I there are separate verticals established for certain specialty products (e.g., asset based lending, leasing, franchise finance, health care, technology, mid-corporate). A “specialty vertical” is a stand-alone team of industry or product specialists. Substantially all activity that falls under the ambit of the defined industry or product is managed through a specialty vertical when one exists. CRE also operates as a specialty vertical.
159
Table of Contents
Commercial credit risk management begins with defined credit products and policies. New credit products and material changes to existing credit products require multiple levels of review and approval. The initial level of review involves the engagement of risk disciplines from across the enterprise for a New Product Risk Assessment. This assessment process reviews the product description, strategic rationale and financial impact and considers the risk impact from multiple perspectives (Reputation, Operational, Regulatory, Market, Legal as well as Credit). Credit risk approval then involves the determination and development of credit policy which includes the approval of the appropriate credit risk acceptance criteria beyond the general credit underwritings standards that already exist.
Commercial transactions are subject to individual analysis and approval at origination and thereafter are subject to formal annual reviews. The underwriting process includes the establishment and approval of Credit Grades that confirm the Probability of Default (“PD”) and Loss Given Default (“LGD”). Approval then requires both a business line approver and an independent Credit Approver. The approval level is determined by the size of the credit relationship as well as the PD with larger relationships and weaker PD’s requiring more senior individuals. The checks and balances in the credit process and the independence of the credit approver function are designed to appropriately assess and sanction the level of credit risk being accepted, facilitate the early recognition of credit problems when they occur, and to provide for effective problem asset management and resolution. All authority to grant credit is delegated through the independent credit administration function and is closely monitored and regularly updated.
The primary factors considered in commercial credit approvals are the financial strength of the borrower, assessment of the borrower’s management capabilities, cash flows from operations, industry sector trends, type and sufficiency of collateral, type of exposure, transaction structure, and the general economic outlook. While these are the primary factors considered, there are a number of other factors that may be considered in the decision process. In addition to the credit analysis conducted during the approval process at origination and annual review, our Credit Quality Assurance group performs testing to provide an independent review and assessment of the quality and/or risk of new loan originations. This group is part of our Risk Management area, and conducts portfolio reviews on a risk-based cycle to evaluate individual loans, validate risk ratings, as well as test the consistency of the credit processes.
The maximum level of credit exposure to individual credit borrowers is limited by policy guidelines based on the perceived risk of each borrower or related group of borrowers. Concentration risk is managed through limits on industry (sector), loan type (asset class), and loan quality factors. We focus predominantly on extending credit to commercial customers with existing or expandable relationships within our primary banking markets, although we will consider lending opportunities outside our primary markets if we believe that the associated risks are acceptable and aligned with strategic initiatives. Geographic considerations occur at both the transactional level as well as the product level, as certain specialties operate on a national basis.
Our management of risk concentrations includes the establishment of Sector and Asset Class limits which track and report correlated risk exposures. We established limits for 29 separate Sectors. These Sector Limits are approved annually by the Concentration Risk Management Committee. Exposure against these limits is tracked on a monthly basis. The two largest sector concentrations are Industrials and CRE.
Apart from Industrials and CRE (which together make up 29% of the commercial utilization as of June 30, 2014), we do not have any major sector concentrations. The Industrial sector includes basic C&I lending focused on general manufacturing. The sector is diversified and not managed as a specialized vertical. Our customers are local to our market and present no significant concentration.
160
Table of Contents
We have a smaller concentration in CRE than our peer banks based on industry data obtained from SNL Financial. As of March 31, 2014, our CRE outstandings amounted to 12% of total outstanding loans. According to SNL Financial, the corresponding ratio for peer banks was 18%.
We have also established, through the Concentration Risk Management Committee, Asset Class Limits to further measure and manage concentration risks. Asset classes include Leveraged Lending, Franchise Finance and Loan Underwriting Risk. These asset class limits are expressed as either a percentage of capital or by specific dollar thresholds. Exposure against these limits is tracked quarterly.
Our standardized credit grading system considers many components that directly correlate to loan quality and likelihood of repayment. Our assessment of a borrower’s credit strength, or lack thereof, is reflected in our risk ratings for such loans, which are directly tied to, and an integral component of, our allowance for loan and lease losses methodology. When deterioration in credit strength is noted, a loan becomes subject to Watch Review. The Watch Review process evaluates the weaknesses and recommends corrective strategy. The Watch Review process involves senior representatives from the business line portfolio management team, credit and our Global Recovery Group (“GRG”). If a viable corrective action strategy is not achieved, the credit is subject to classification as either Criticized or Classified which triggers a risk rating downgrade. As such, the loan would attract a higher allowance for loan and lease losses requirement, be subject to more frequent review (including continued inclusion in the Watch Review process), and be reported as a “non-pass” credit to our regulators. In addition, all classified assets are transferred to GRG.
Substantially all loans categorized as Classified are managed by GRG. GRG is a specialized group of credit professionals that handles the day-to-day management of workouts, commercial recoveries, and problem loan sales. Its responsibilities include developing and implementing action plans, assessing risk ratings, and determining the appropriateness of the allowance, the accrual status, and the ultimate collectability of the Classified loan portfolio.
Market Risk
Market risk refers to potential losses arising from changes in interest rates, foreign exchange rates, equity prices, commodity prices and/or other relevant market rates or prices. Market risk does not result from proprietary trading, which we prohibit. Rather, modest market risk arises from trading activities that serve customer needs, including hedging of interest rate and foreign exchange risk. As described below, more material market risk arises from our non-trading banking activities, such as loan origination and deposit-gathering. We have established enterprise-wide policies and methodologies to identify, measure, monitor and report market risk. We actively manage both trading and non-trading market risks.
Non-Trading Risk
We are exposed to market risk as a result of non-trading banking activities. This market risk is comprised entirely of interest rate risk, as we have no direct currency, equity or commodity risk. This interest rate risk emerges from the balance sheet after the aggregation of our assets, liabilities and equity. We refer to this non-trading risk embedded in the balance sheet as “structural interest rate risk” or “interest rate risk in the banking book.” Our mortgage servicing rights assets also contain interest rate risk as the value of the fee stream is impacted by the level of long-term interest rates.
A major source of structural interest rate risk is a difference in the repricing of assets, on the one hand, and liabilities and equity, on the other. First, there are differences in the timing of rate changes reflecting the maturity and/or repricing of assets and liabilities. For example, the rate earned on a residential mortgage may be fixed for 30 years; the rate paid on a certificate of deposit may be fixed
161
Table of Contents
only for a few months. Due to these timing differences, net interest income is sensitive to changes in the level and shape of the yield curve. Second, there are differences in the drivers of rate changes of various assets and liabilities. For example, commercial loans may reprice based on one-month LIBOR or prime; the rate paid on retail money market demand accounts may be only loosely correlated with LIBOR and depend on competitive demand for funds. Due to these basis differences, net interest income is sensitive to changes in spreads between certain indices or repricing rates.
Another important source of structural interest rate risk relates to the potential exercise of explicit or embedded options. For example, most consumer loans can be prepaid without penalty; and most consumer deposits can be withdrawn without penalty. The exercise of such options by customers can exacerbate the timing differences discussed above.
A primary source of our structural interest rate risk relates to faster repricing of floating rate loans relative to the retail deposit funding. This source of asset sensitivity is concentrated at the short end of the yield curve. Given the very low level of short-term interest rates, this risk is asymmetrical with significantly more upside benefit than potential exposure. The secondary source of our interest rate risk is driven by longer term rates comprising the rollover or reinvestment risk on fixed rate loans as well as the prepayment risk on mortgage related loans and securities funded by non-rate sensitive deposits and equity.
The primary goal of interest rate risk management is to control exposure to interest rate risk within policy limits approved by the Board. These limits and guidelines reflect our tolerance for interest rate risk over both short-term and long-term horizons. To ensure that exposure to interest rate risk is managed within this risk appetite, we must both measure the exposure and, as necessary, hedge it. The Treasury Asset and Liability Management team is responsible for measuring, monitoring and reporting on the structural interest rate risk position. These exposures are reported on a monthly basis to the Asset and Liability Committee and at Board meetings.
We measure structural interest rate risk through a variety of metrics intended to quantify both short-term and long-term exposures. The primary method that we use to quantify interest rate risk is simulation analysis in which we model net interest income from assets, liabilities and hedge derivative positions under various interest rate scenarios over a three-year horizon. Exposure to interest rate risk is reflected in the variation of forecasted net interest income across scenarios.
Key assumptions in this simulation analysis relate to the behavior of interest rates and spreads, the changes in product balances and the behavior of loan and deposit clients in different rate environments. The most material of these behavioral assumptions relate to the repricing characteristics and balance fluctuations of deposits with indeterminate (i.e., non-contractual) maturities as well as the pace of mortgage prepayments.
As the future path of interest rates cannot be known in advance, we use simulation analysis to project net interest income under various interest rate scenarios including a “most likely” (implied forward) scenario as well as a variety of deliberately extreme and perhaps unlikely scenarios. These scenarios may assume gradual ramping of the overall level of interest rates, immediate shocks to the level of rates and various yield curve twists in which movements in short- or long-term rates predominate. Generally, projected net interest income in any interest rate scenarios is compared to net interest income in a base case where market forward rates are realized.
The table below reports net interest income exposures against a variety of interest rate scenarios. Exposures are measured as a percentage change in net interest income over the next year due to either instantaneous, or gradual parallel +/- 200 basis point moves in benchmark interest rates. The net interest income simulation analyses do not include possible future actions that management might
162
Table of Contents
undertake to mitigate this risk. The current limit is an adverse change of 10% related to an instantaneous +/- 200 basis point move. As the table illustrates, our balance sheet is asset-sensitive: net interest income would benefit from an increase in interest rates. Exposure to a decline in interest rates is well within limit. It should be noted that the magnitude of any possible decline in interest rates is constrained by the low absolute starting levels of rates. While an instantaneous and severe shift in interest rates was used in this analysis, we believe that any actual shift in interest rates would likely be more gradual and would therefore have a more modest impact.
The table below summarizes our positioning in various parallel yield curve shifts:
Basis points
| Estimated % Change in Net Interest Income over 12 Months |
||||||||||||
| Tolerance Level |
June 30, 2014 |
December 31, 2013 |
||||||||||
| Instantaneous Change in Interest Rates |
||||||||||||
| +200 |
(10 | )% | 13.4 | % | 16.1 | % | ||||||
| +100 |
6.8 | % | 8.0 | % | ||||||||
| -100 |
(2.7 | )% | (3.7 | )% | ||||||||
| -200 |
(10 | )% | (3.4 | )% | (5.7 | )% | ||||||
| Gradual Change in Interest Rates |
||||||||||||
| +200 |
6.6 | % | 6.8 | % | ||||||||
| +100 |
3.2 | % | 3.2 | % | ||||||||
| -100 |
(1.4 | )% | (2.0 | )% | ||||||||
| -200 |
(2.1 | )% | (3.0 | )% | ||||||||
As part of the routine risk management process, a wide variety of similar analyses are reported for each of the next three rolling years.
As recommended by bank regulators, CBPA also uses a valuation measure of exposure to structural interest rate risk, Economic Value of Equity, as a supplement to net interest income simulations. Nevertheless, multi-year net interest income simulation is the main tool for managing structural interest rate risk.
As noted, the balance sheet is asset-sensitive, positioned to benefit from an increase in interest rates. The magnitude of this asset-sensitivity has been reduced from more elevated levels at the end of 2012. At that time, the extremely low levels of medium- to long-term interest rates presented a poor risk-to-reward trade-off for transaction that would add asset duration. As a result, the investment portfolio was reduced in size, increasing asset-sensitivity. Subsequently, intermediate- and long-term interest rates have risen and we resumed portfolio investment, moderating the aggregate asset-sensitivity of the balance sheet.
We also had market risk associated with the value of the mortgage servicing right assets, which are impacted by the level of interest rates. As of June 30, 2014 and December 31, 2013, our mortgage servicing rights had a book value of $175 million and $185 million, respectively, and were carried at the lower of cost or fair value. As of June 30, 2014, and December 31, 2013, the fair value of the mortgage servicing rights was $186 million and $195 million, respectively. Given low interest rates over recent years, there is a valuation allowance of $20 million and $23 million on the asset as of June 30, 2014 and December 31, 2013, respectively. Depending on the interest rate environment, hedges may be used to stabilize the fair value of the mortgage servicing right asset.
163
Table of Contents
Trading Risk
We are exposed to market risk primarily through client facilitation activities including derivatives and foreign exchange products. Exposure is created as a result of the implied volatility and spreads of a select range of interest rates and foreign exchange rates. These trading activities are conducted through our two banking subsidiaries, CBNA and CBPA.
Client facilitation activities consist primarily of interest rate derivatives and foreign exchange contracts where we enter into offsetting trades with a separate counterparty or exchange to manage our exposure to the customer. Historically, the majority of these offsetting trades have been with the RBS Group. We will occasionally execute hedges against the spread that exists across the client facing trade and its offset in the market to maintain a low risk profile. We do not engage in any proprietary trading to benefit from price differences between financial instruments and markets.
We record interest rate derivatives and foreign exchange contracts as derivative assets and liabilities on our consolidated balance sheets. Trading assets and liabilities are carried at fair value with income earned related to these activities included in net interest income. Changes in fair value of trading assets and liabilities are reflected in other net gains (losses), a component of noninterest income on the consolidated statements of operations.
Market Risk Governance. Our market risk function currently leverages the subject matter expertise within the RBS Group to ensure appropriate controls are in place to manage market risk. As part of our separation from the RBS Group, we intend to enter into a Transitional Services Agreement pursuant to which RBS Securities Inc. will continue to provide us with all necessary Value-at-Risk (VaR) and other risk measurements required for regulatory reporting related to derivative and foreign exchange contract trading activities, as well as internal market risk reporting and general consultative services related to our market risk framework until the dates specified in the Transitional Services Agreement. During the terms of the relevant services under the Transitional Services Agreement, we intend to build out our own market risk organization and framework in order to gradually migrate away from reliance on services provided by the RBS Group. As part of this process, we hired a new head of market risk management to begin building out our stand-alone capabilities with respect to market risk management.
Given the low level of market risk and substantial market risk expertise at our parent, we have received the support of our U.S. banking regulators for relying on the RBS Group’s market risk expertise. In managing our market risk, dealing authorities represent a key control in the management of market risk by setting the scope within which the business is permitted to operate. Dealing authorities are established jointly by designated senior business line and senior risk manager, and are reviewed at least annually. Dealing authorities are structured to accommodate the client facing trades, market offset trades and sets of hedges needed to maintain a low risk profile. Primary responsibility for keeping within established tolerances resides with the business. Key risk indicators, including a combined VaR for interest rate and foreign exchange rate risk, are monitored on a daily basis and reported against tolerances consistent with our risk appetite and business strategy to relevant business line management and risk counterparts.
Market Risk Measurement. We use VaR metrics, complemented with sensitivity analysis and stress testing in measuring market risk. During the term of the Transitional Services Agreement, we will continue to leverage the RBS Group market risk measurement models, which are described further below, that capture correlation effects and allow for aggregation of market risk across risk types, business lines and legal entities. We measure and monitor market risk for both management and regulatory capital purposes.
Value-at-Risk Overview. The RBS Group’s market risk measurement model is based on historical simulation. The VaR measure estimates the extent of any fair value losses on trading positions that
164
Table of Contents
may occur due to broad market movements (General VaR) such as changes in the level of interest rates, foreign exchange rates, equity prices and commodity prices. It is calculated on the basis that current positions remain broadly unaltered over the course of a given holding period. It is assumed that markets are sufficiently liquid to allow the business to close its positions, if required, within this holding period. VaR’s benefit is that it captures the historic correlations of a portfolio. Based on the composition of our “covered positions,” we do not calculate a Specific Risk VaR measure which estimates the extent of any losses that may occur from factors other than broad market movements. The RBS Group’s General VaR approach is expressed in terms of a confidence level over the past 500 trading days. The internal VaR measure (used as the basis of the main VaR trading limits) is a 99% confidence level with a one day holding period, meaning that a loss greater than the VaR is expected to occur, on average, on only one day in 100 trading days (i.e., 1% of the time). Theoretically, there should be a loss event greater than VaR two to three times per year. The regulatory measure of VaR is done at a 99% confidence level with a 10-day holding period. The historical market data applied to calculate the VaR is updated on a 10 business day lag. Refer to “—Market Risk Regulatory Capital” below for details of our 10-day VAR metrics for the quarters ended June 30, 2014, March 31, 2014 and December 31, 2013, including high, low, average and period end VaR for interest rate and foreign exchange rate risks, as well as total VaR. We began measuring the high, low, and average VaR for interest rate and foreign exchange currency rate risk during the fourth quarter of 2013, in conjunction with incorporating trade-level detail for foreign exchange risk in our market risk measurement models. Prior to that time, VaR for foreign exchange exposure was calculated using a manual process that did not capture potential interest rate risk from any forward transactions.
Market Risk Regulatory Capital. Effective January 1, 2013, the U.S. banking regulators adopted “Risk-Based Capital Guidelines: Market Risk” as the regulations covering the calculation of market risk capital (the Market Risk Rule). The Market Risk Rule, commonly known as Basel 2.5, substantially modified the determination of market risk-weighted assets and implemented a more risk sensitive methodology for the risk inherent in certain trading positions categorized as “covered positions.” For the purposes of the market risk rule, all of our client facing trades, market offset trades and sets of hedges needed to maintain a low risk profile qualify as “covered positions.” The internal VaR measure is calculated based on the same population of trades that is utilized for regulatory VaR. The following table shows the results of our modeled measures for regulatory capital calculations:
| For the Quarter Ended June 30, 2014 | ||||||||||||||||
| Market Risk Category |
Period End | Average | High | Low | ||||||||||||
| (in millions) | ||||||||||||||||
| Interest Rate |
$ | — | $ | — | $ | 1 | $ | — | ||||||||
| Foreign Exchange Currency Rate |
— | — | 1 | — | ||||||||||||
| Diversification Benefit |
— | — | NM | (1) | NM | (1) | ||||||||||
|
|
|
|
|
|||||||||||||
| General VaR |
— | — | 1 | — | ||||||||||||
| Specific Risk VaR |
— | — | — | — | ||||||||||||
|
|
|
|
|
|||||||||||||
| Total VaR |
$ | — | $ | — | $ | 1 | $ | — | ||||||||
|
|
|
|
|
|||||||||||||
| Stressed General VaR |
$ | — | $ | — | $ | 4 | $ | 2 | ||||||||
| Stressed Specific Risk VaR |
— | — | — | — | ||||||||||||
|
|
|
|
|
|||||||||||||
| Total Stressed VaR |
$ | 2 | $ | 2 | $ | 4 | $ | 2 | ||||||||
|
|
|
|
|
|||||||||||||
| CFG Market Risk Regulatory Capital |
$ | 9 | ||||||||||||||
| CFG Market Risk-Weighted Assets |
$ | 113 | ||||||||||||||
| (1) | The high and low for the portfolio may have occurred on different trading days than the high and low for the components. Therefore, there is no diversification benefit shown for the high and low columns. |
165
Table of Contents
| For the Quarter Ended March 31, 2014 | ||||||||||||||||
| Market Risk Category |
Period End | Average | High | Low | ||||||||||||
| (in millions) | ||||||||||||||||
| Interest Rate |
$ | — | $ | — | $ | 1 | $ | — | ||||||||
| Foreign Exchange Currency Rate |
— | — | 1 | — | ||||||||||||
| Diversification Benefit |
— | — | NM | (1) | NM | (1) | ||||||||||
|
|
|
|
|
|||||||||||||
| General VaR |
— | — | 2 | — | ||||||||||||
| Specific Risk VaR |
— | — | — | — | ||||||||||||
|
|
|
|
|
|||||||||||||
| Total VaR |
$ | — | $ | — | $ | 2 | $ | — | ||||||||
|
|
|
|
|
|||||||||||||
| Stressed General VaR |
$ | 2 | $ | 2 | $ | 7 | $ | — | ||||||||
| Stressed Specific Risk VaR |
— | — | — | — | ||||||||||||
|
|
|
|
|
|||||||||||||
| Total Stressed VaR |
$ | 2 | $ | 2 | $ | 7 | $ | — | ||||||||
|
|
|
|
|
|||||||||||||
| CFG Market Risk Regulatory Capital |
$ | 9 | ||||||||||||||
| CFG Market Risk-Weighted Assets |
$ | 111 | ||||||||||||||
| (1) | The high and low for the portfolio may have occurred on different trading days than the high and low for the components. Therefore, there is no diversification benefit shown for the high and low columns. |
| For the Quarter Ended December 31, 2013 | ||||||||||||||||
| Market Risk Category |
Period End | Average | High | Low | ||||||||||||
| (in millions) | ||||||||||||||||
| Interest Rate |
$ | 1 | $ | — | $ | 1 | $ | — | ||||||||
| Foreign Exchange Currency Rate |
— | 1 | 3 | — | ||||||||||||
| Diversification Benefit |
— | — | NM | (1) | NM | (1) | ||||||||||
|
|
|
|
|
|||||||||||||
| General VaR |
1 | 1 | 3 | — | ||||||||||||
| Specific Risk VaR |
— | — | — | — | ||||||||||||
|
|
|
|
|
|||||||||||||
| Total VaR |
$ | 1 | $ | 1 | $ | 3 | $ | — | ||||||||
|
|
|
|
|
|||||||||||||
| Stressed General VaR |
$ | 2 | $ | 3 | $ | 7 | $ | — | ||||||||
| Stressed Specific Risk VaR |
— | — | — | — | ||||||||||||
|
|
|
|
|
|||||||||||||
| Total Stressed VaR |
$ | 2 | $ | 3 | $ | 7 | $ | — | ||||||||
|
|
|
|
|
|||||||||||||
| CFG Market Risk Regulatory Capital |
$ | 12 | ||||||||||||||
| CFG Market Risk-Weighted Assets |
$ | 146 | ||||||||||||||
| (1) | The high and low for the portfolio may have occurred on different trading days than the high and low for the components. Therefore, there is no diversification benefit shown for the high and low columns. |
Stress VaR (“SVaR”). Stress VaR is an extension of VaR, but uses a longer historical look back horizon that is fixed from January 1, 2005. This is done not only to identify headline risks from more volatile periods, but also to provide a counter balance to VaR which may be low during periods of low volatility. The holding period for profit and loss determination is 10 days. SVaR is also a component of market risk regulatory capital. SVaR for us is calculated under its own dynamic window regime as compared to the RBS Group’s static SVaR window. In a dynamic window regime, values of the 10-day, 99% VaR are calculated over all possible 260-day periods that can be obtained from the complete historical data set. Refer to “—Market Risk Regulatory Capital” above for details of SVaR metrics, including high, low, average and period end SVaR for the combined portfolio. We began measuring the high, low, and average SVaR for our combined portfolio during the fourth quarter of 2013 in conjunction with the incorporation of trade-level detail for foreign exchange risk, in our market risk measurement models. Prior to that time, our SVaR measure did not include foreign exchange risk given low levels of materiality.
Sensitivity Analysis. Sensitivity analysis is the measure of exposure to a single risk factor, such as a one basis point change in rates or credit spread. We conduct and monitor sensitivity on interest
166
Table of Contents
rates, basis spreads, foreign exchange exposures and option prices. Whereas VaR is based on previous moves in market risk factors over recent periods, it may not be an accurate predictor of future market moves. Sensitivity analysis complements VaR as it provides an indication of risk relative to each factor irrespective of historical market moves and is an effective tool in evaluating the appropriateness of hedging strategies.
Stress Testing. Conducting a stress test of a portfolio consists of running risk models with the inclusion of key variables that simulate various historical or hypothetical scenarios. For historical stress tests, profit and loss results are simulated for selected time periods corresponding to the most volatile underlying returns while hypothetical stress tests aim to consider concentration risk, illiquidity under stressed market conditions and risk arising from the bank’s trading activities that may not be fully captured by its other models. Hypothetical scenarios also assume that the market moves happen simultaneously and that no repositioning or hedging activity takes place to mitigate losses as events unfold. We generate stress tests of our trading positions on a regular basis. For example, we currently include a stress test that simulates a Lehman Crisis scenario by taking the worst, 10-day peak to trough moves for the various risk factors that go into VaR from that period, and assuming they occurred simultaneously.
VaR Model Review and Validation. Market risk measurement models used within the RBS Group, including VaR models, are subject to ongoing and independent review and validation that focuses on the model methodology. Independent review of market risk measurement models is the responsibility of RBS Group Risk Analytics (GRA). Aspects covered include challenging the assumptions used, the quantitative techniques employed and the theoretical justification underpinning them, and an assessment of the soundness of the required data over time. Where possible, the quantitative impact of the major underlying modeling assumptions will be estimated (e.g., through developing alternative models). Results of such reviews are shared with U.S. regulators. For the terms of the relevant services under the Transitional Services Agreement, we and the RBS Group expect to utilize the same independently validated VaR model for both management and regulatory reporting purposes. The RBS Group market risk teams, including those providing consultative services to us under the Transitional Services Agreement, will conduct internal validation before a new or changed model element is implemented and before a change is made to a market data mapping. For example, the RBS Group market risk teams also perform regular reviews of key risk factors that are used in the market risk measurement models to produce profit and loss vectors used in the VaR calculations. These internal validations are subject to independent re-validation by GRA and, depending on the results of the impact assessment, notification to the appropriate regulatory authorities for the RBS Group and us may be required.
VaR Backtesting. Backtesting is one form of validation of the VaR model. The Market Risk Rule requires a comparison of our internal VaR measure to the actual net trading revenue (excluding fees, commissions, reserves, intra-day trading and net interest income) for each day over the preceding year (the most recent 250 business days). Any observed loss in excess of the VaR number is taken as an exception. The level of exceptions determines the multiplication factor used to derive the VaR and SVaR-based capital requirement for regulatory reporting purposes. We perform sub-portfolio backtesting as required under the Market Risk Rule, and as approved by its U.S. banking regulators, for interest rate and foreign exchange positions. The following table shows our daily net trading revenue and total internal VaR for the quarters ending June 30, 2014 and March 31, 2014. Prior to this time, we did not perform our own portfolio specific backtesting, relying instead on the RBS Group’s backtesting results. Until such time as we can accumulate a full 250 business days of backtesting results, we continue to utilize a multiplication factor derived from the RBS Group’s backtesting results, as agreed with our banking regulators.
167
Table of Contents
Daily VaR Backtesting: Sub-portfolio Level Backtesting.
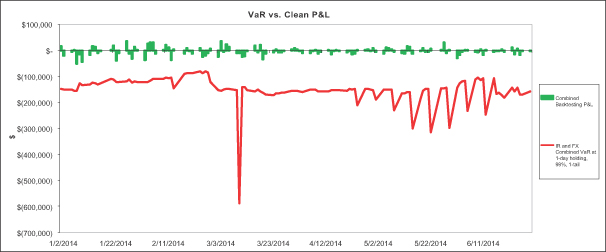
168
Table of Contents
SELECTED STATISTICAL INFORMATION
The accompanying supplemental information should be read in conjunction with the sections of this prospectus entitled “Summary Consolidated Financial and Other Data,” “Selected Consolidated Financial Data” and “Management’s Discussion and Analysis of Financial Condition and Results of Operations” and our unaudited interim and audited consolidated financial statements and related notes included elsewhere in this prospectus.
Distribution of Assets, Liabilities and Stockholders’ Equity; Interest Rates and Interest Differential
The following table provides a summary of our consolidated average balances including major categories of interest-earning assets and interest-bearing liabilities:
| Six Months Ended June 30, | Year Ended December 31, | |||||||||||||||||||||||||||||||||||||||||||||||
| 2014 | 2013 | 2012 | 2011 | |||||||||||||||||||||||||||||||||||||||||||||
| Average Balances |
Income/ Expense |
Yields/ Rates |
Average Balances |
Income/ Expense |
Yields/ Rates |
Average Balances |
Income/ Expense |
Yields/ Rates |
Average Balances |
Income/ Expense |
Yields/ Rates |
|||||||||||||||||||||||||||||||||||||
| (dollars in millions) | ||||||||||||||||||||||||||||||||||||||||||||||||
| Assets |
||||||||||||||||||||||||||||||||||||||||||||||||
| Interest-bearing cash and due from banks and deposits in banks |
$ | 1,991 | $ | 2 | 0.23 | % | $ | 2,278 | $ | 11 | 0.46 | % | $ | 1,562 | $ | 7 | 0.46 | % | $ | 2,016 | $ | 7 | 0.36 | % | ||||||||||||||||||||||||
| Taxable investment securities |
23,980 | 303 | 2.53 | 19,062 | 477 | 2.50 | 22,030 | 615 | 2.79 | 22,698 | 748 | 3.30 | ||||||||||||||||||||||||||||||||||||
| Non-taxable investment securities |
11 | — | 2.60 | 12 | — | 2.66 | 40 | 2 | 4.32 | 49 | 2 | 4.37 | ||||||||||||||||||||||||||||||||||||
|
|
|
|
|
|
|
|
|
|
|
|
|
|
|
|
|
|||||||||||||||||||||||||||||||||
| Total investment securities |
23,991 | 303 | 2.53 | 19,074 | 477 | 2.50 | 22,070 | 617 | 2.79 | 22,747 | 750 | 3.30 | ||||||||||||||||||||||||||||||||||||
| Commercial |
29,402 | 447 | 3.03 | 28,654 | 900 | 3.10 | 27,273 | 849 | 3.07 | 23,886 | 779 | 3.22 | ||||||||||||||||||||||||||||||||||||
| Commercial real estate |
6,991 | 89 | 2.53 | 6,568 | 178 | 2.67 | 7,063 | 196 | 2.72 | 8,310 | 237 | 2.82 | ||||||||||||||||||||||||||||||||||||
| Leases |
3,720 | 52 | 2.79 | 3,463 | 105 | 3.05 | 3,216 | 112 | 3.48 | 2,952 | 113 | 3.83 | ||||||||||||||||||||||||||||||||||||
|
|
|
|
|
|
|
|
|
|
|
|
|
|
|
|
|
|||||||||||||||||||||||||||||||||
| Total commercial |
40,113 | 588 | 2.92 | 38,685 | 1,183 | 3.02 | 37,552 | 1,157 | 3.04 | 35,148 | 1,129 | 3.18 | ||||||||||||||||||||||||||||||||||||
|
|
|
|
|
|
|
|
|
|
|
|
|
|
|
|
|
|||||||||||||||||||||||||||||||||
| Home equity lines of credit |
16,216 | 229 | 2.85 | 17,105 | 485 | 2.83 | 17,745 | 497 | 2.80 | 17,172 | 472 | 2.75 | ||||||||||||||||||||||||||||||||||||
| Residential mortgage |
10,125 | 204 | 4.03 | 9,104 | 360 | 3.96 | 9,551 | 413 | 4.32 | 9,721 | 453 | 4.66 | ||||||||||||||||||||||||||||||||||||
| Home equity loans |
5,543 | 156 | 5.69 | 6,330 | 361 | 5.71 | 8,176 | 481 | 5.88 | 10,575 | 627 | 5.93 | ||||||||||||||||||||||||||||||||||||
| Automobile |
10,087 | 126 | 2.51 | 8,857 | 235 | 2.65 | 8,276 | 273 | 3.30 | 7,541 | 339 | 4.50 | ||||||||||||||||||||||||||||||||||||
| Student and other installment loans |
3,482 | 96 | 5.52 | 3,655 | 202 | 5.52 | 4,040 | 218 | 5.38 | 4,863 | 259 | 5.32 | ||||||||||||||||||||||||||||||||||||
| Credit cards |
1,639 | 82 | 10.13 | 1,669 | 175 | 10.46 | 1,634 | 166 | 10.15 | 1,580 | 155 | 9.79 | ||||||||||||||||||||||||||||||||||||
|
|
|
|
|
|
|
|
|
|
|
|
|
|
|
|
|
|||||||||||||||||||||||||||||||||
| Total retail |
47,092 | 893 | 3.82 | 46,720 | 1,818 | 3.89 | 49,422 | 2,048 | 4.14 | 51,452 | 2,305 | 4.48 | ||||||||||||||||||||||||||||||||||||
|
|
|
|
|
|
|
|
|
|
|
|
|
|
|
|
|
|||||||||||||||||||||||||||||||||
| Total loans and leases(1) |
87,205 | 1,481 | 3.40 | 85,405 | 3,001 | 3.50 | 86,974 | 3,205 | 3.67 | 86,600 | 3,434 | 3.95 | ||||||||||||||||||||||||||||||||||||
| Loans held for sale |
133 | 2 | 3.35 | 392 | 12 | 3.07 | 538 | 17 | 3.10 | 359 | 13 | 3.70 | ||||||||||||||||||||||||||||||||||||
| Other Loans held for sale |
1,062 | 22 | 4.06 | — | — | — | — | — | — | — | — | — | ||||||||||||||||||||||||||||||||||||
|
|
|
|
|
|
|
|
|
|
|
|
|
|
|
|
|
|||||||||||||||||||||||||||||||||
| Interest-earning assets |
114,382 | 1,810 | 3.17 | 107,149 | 3,501 | 3.25 | 111,144 | 3,846 | 3.45 | 111,722 | 4,204 | 3.75 | ||||||||||||||||||||||||||||||||||||
| Allowance for loan and lease losses |
(1,262 | ) | (1,219 | ) | (1,506 | ) | (1,888 | ) | ||||||||||||||||||||||||||||||||||||||||
| Goodwill |
6,876 | 9,063 | 11,311 | 11,311 | ||||||||||||||||||||||||||||||||||||||||||||
| Other noninterest-earning assets |
5,539 | 5,873 | 6,717 | 7,199 | ||||||||||||||||||||||||||||||||||||||||||||
|
|
|
|
|
|
|
|
|
|||||||||||||||||||||||||||||||||||||||||
| Total noninterest-earning assets |
11,153 | 13,717 | 16,522 | 16,622 | ||||||||||||||||||||||||||||||||||||||||||||
|
|
|
|
|
|
|
|
|
|||||||||||||||||||||||||||||||||||||||||
| Total assets |
$ | 125,535 | $ | 120,866 | $ | 127,666 | $ | 128,344 | ||||||||||||||||||||||||||||||||||||||||
|
|
|
|
|
|
|
|
|
|||||||||||||||||||||||||||||||||||||||||
169
Table of Contents
| Six Months Ended June 30, | Year Ended December 31, | |||||||||||||||||||||||||||||||||||||||||||||||
| 2014 | 2013 | 2012 | 2011 | |||||||||||||||||||||||||||||||||||||||||||||
| Average Balances |
Income/ Expense |
Yields/ Rates |
Average Balances |
Income/ Expense |
Yields/ Rates |
Average Balances |
Income/ Expense |
Yields/ Rates |
Average Balances |
Income/ Expense |
Yields/ Rates |
|||||||||||||||||||||||||||||||||||||
| (dollars in millions) | ||||||||||||||||||||||||||||||||||||||||||||||||
| Liabilities and Stockholders’ Equity |
||||||||||||||||||||||||||||||||||||||||||||||||
| Checking with interest |
$ | 13,562 | $ | 4 | 0.06 | % | $ | 14,096 | $ | 8 | 0.06 | % | $ | 13,522 | $ | 10 | 0.08 | % | $ | 16,116 | $ | 15 | 0.10 | % | ||||||||||||||||||||||||
| Money market & savings |
38,667 | 33 | 0.17 | 42,575 | 105 | 0.25 | 41,249 | 121 | 0.29 | 37,638 | 94 | 0.25 | ||||||||||||||||||||||||||||||||||||
| Term deposits |
9,376 | 30 | 0.64 | 11,266 | 103 | 0.91 | 13,534 | 244 | 1.80 | 16,501 | 381 | 2.31 | ||||||||||||||||||||||||||||||||||||
|
|
|
|
|
|
|
|
|
|
|
|
|
|
|
|
|
|||||||||||||||||||||||||||||||||
| Total interest-bearing deposits |
61,605 | 67 | 0.22 | 67,937 | 216 | 0.32 | 68,305 | 375 | 0.55 | 70,255 | 490 | 0.70 | ||||||||||||||||||||||||||||||||||||
| Interest-bearing deposits held for sale |
3,953 | 4 | 0.22 | — | — | — | — | — | — | — | — | — | ||||||||||||||||||||||||||||||||||||
| Federal funds purchased and securities sold under agreements to repurchase(2) |
5,708 | 16 | 0.55 | 2,400 | 192 | 7.89 | 2,716 | 119 | 4.31 | 3,808 | 191 | 4.96 | ||||||||||||||||||||||||||||||||||||
| Short-term borrowed funds |
4,838 | 49 | 2.03 | 251 | 4 | 1.64 | 3,026 | 101 | 3.27 | 2,459 | 150 | 6.04 | ||||||||||||||||||||||||||||||||||||
| Long-term borrowed funds |
1,412 | 33 | 4.60 | 778 | 31 | 3.93 | 1,976 | 24 | 1.20 | 5,085 | 53 | 1.02 | ||||||||||||||||||||||||||||||||||||
|
|
|
|
|
|
|
|
|
|
|
|
|
|
|
|
|
|||||||||||||||||||||||||||||||||
| Total borrowed funds |
11,958 | 98 | 1.63 | 3,429 | 227 | 6.53 | 7,718 | 244 | 3.11 | 11,352 | 394 | 3.42 | ||||||||||||||||||||||||||||||||||||
|
|
|
|
|
|
|
|
|
|
|
|
|
|
|
|
|
|||||||||||||||||||||||||||||||||
| Total interest-bearing liabilities |
77,516 | 169 | 0.43 | 71,366 | 443 | 0.61 | 76,023 | 619 | 0.80 | 81,607 | 884 | 1.07 | ||||||||||||||||||||||||||||||||||||
| Demand deposits |
25,393 | 25,399 | 25,053 | 21,191 | ||||||||||||||||||||||||||||||||||||||||||||
| Demand deposits held for sale |
932 | — | — | — | ||||||||||||||||||||||||||||||||||||||||||||
| Other liabilities |
2,205 | 2,267 | 2,652 | 2,409 | ||||||||||||||||||||||||||||||||||||||||||||
| Stockholders’ equity |
19,489 | 21,834 | 23,938 | 23,137 | ||||||||||||||||||||||||||||||||||||||||||||
|
|
|
|
|
|
|
|
|
|||||||||||||||||||||||||||||||||||||||||
| Total liabilities and stockholders’ equity |
$ | 125,535 | $ | 120,866 | $ | 127,666 | $ | 128,344 | ||||||||||||||||||||||||||||||||||||||||
|
|
|
|
|
|
|
|
|
|||||||||||||||||||||||||||||||||||||||||
| Interest rate spread |
2.74 | 2.64 | 2.65 | 2.68 | ||||||||||||||||||||||||||||||||||||||||||||
|
|
|
|
|
|
|
|
|
|||||||||||||||||||||||||||||||||||||||||
| Net interest income |
$ | 1,641 | $ | 3,058 | $ | 3,227 | $ | 3,320 | ||||||||||||||||||||||||||||||||||||||||
|
|
|
|
|
|
|
|
|
|||||||||||||||||||||||||||||||||||||||||
| Net interest margin |
2.88 | % | 2.85 | % | 2.89 | % | 2.97 | % | ||||||||||||||||||||||||||||||||||||||||
| (1) | Interest income and rates on loans include loan fees. Additionally, average nonaccrual loans were included in the average loan balances used to determine the average yield on loans in amounts of $1.3 billion, $1.6 billion, $1.7 billion and $1.9 billion at June 30, 2014, December 31, 2013, 2012 and 2011, respectively. |
| (2) | Balances are net of certain short-term receivables associated with reverse repurchase agreements. Interest expense includes the full cost of the repurchase agreements and certain hedging costs. The yield on Federal funds purchased is elevated due to the impact from pay-fixed interest rate swaps that are scheduled to runoff by the end of 2016. See “Management’s Discussion and Analysis of Financial Condition and Results of Operations—Analysis of Financial Condition—June 30, 2014 Compared with December 31, 2013—Derivatives” and “Management’s Discussion and Analysis of Financial Condition and Results of Operations—Analysis of Financial Condition—December 31, 2013 Compared with December 31, 2012—Derivatives” for further information. |
170
Table of Contents
Change in Net Interest Income—Volume and Rate Analysis
The following table presents the amount of changes in interest income and interest expense due to changes in both average volume and average rate. Average volume and rate changes have been allocated between the average rate and average volume variances on a consistent basis based upon the respective percentage changes in average balances and average rates.
| June 30, 2014 versus June 30, 2013 | 2013 Versus 2012 | 2012 Versus 2011 | ||||||||||||||||||||||||||||||||||
| Average Volume |
Average Rate |
Net Change |
Average Volume |
Average Rate |
Net Change |
Average Volume |
Average Rate |
Net Change |
||||||||||||||||||||||||||||
| (in millions) | ||||||||||||||||||||||||||||||||||||
| Interest Income |
||||||||||||||||||||||||||||||||||||
| Interest-bearing cash and due from banks and deposits in banks |
$ | (2 | ) | $ | (3 | ) | $ | (5 | ) | $ | (4 | ) | $ | — | $ | 4 | $ | (2 | ) | $ | 2 | $ | — | |||||||||||||
| Taxable investment securities |
75 | — | 75 | (83 | ) | (55 | ) | (138 | ) | (22 | ) | (111 | ) | (133 | ) | |||||||||||||||||||||
| Non-taxable investment securities |
— | — | — | (2 | ) | — | (2 | ) | — | — | — | |||||||||||||||||||||||||
|
|
|
|
|
|
|
|
|
|
|
|
|
|
|
|
|
|
|
|||||||||||||||||||
| Total investment securities |
75 | 1 | 75 | (85 | ) | (55 | ) | (140 | ) | (22 | ) | (111 | ) | (133 | ) | |||||||||||||||||||||
| Commercial |
14 | (9 | ) | 5 | 43 | 8 | 51 | 111 | (41 | ) | 70 | |||||||||||||||||||||||||
| Commercial real estate |
7 | (7 | ) | — | (14 | ) | (4 | ) | (18 | ) | (36 | ) | (5 | ) | (41 | ) | ||||||||||||||||||||
| Leases |
6 | (7 | ) | (1 | ) | 9 | (16 | ) | (7 | ) | 10 | (11 | ) | (1 | ) | |||||||||||||||||||||
|
|
|
|
|
|
|
|
|
|
|
|
|
|
|
|
|
|
|
|||||||||||||||||||
| Total commercial |
27 | (23 | ) | 4 | 38 | (12 | ) | 26 | 85 | (57 | ) | 28 | ||||||||||||||||||||||||
|
|
|
|
|
|
|
|
|
|
|
|
|
|
|
|
|
|
|
|||||||||||||||||||
| Home equity lines of credit |
(16 | ) | 2 | (14 | ) | (18 | ) | 6 | (12 | ) | 16 | 9 | 25 | |||||||||||||||||||||||
| Residential mortgage |
21 | — | 21 | (19 | ) | (34 | ) | (53 | ) | (8 | ) | (32 | ) | (40 | ) | |||||||||||||||||||||
| Home equity loans |
(33 | ) | (2 | ) | (35 | ) | (108 | ) | (12 | ) | (120 | ) | (142 | ) | (4 | ) | (146 | ) | ||||||||||||||||||
| Automobile |
14 | (8 | ) | 6 | 19 | (57 | ) | (38 | ) | 33 | (99 | ) | (66 | ) | ||||||||||||||||||||||
| Student and other installment loans |
(10 | ) | 4 | (6 | ) | (26 | ) | 10 | (16 | ) | (52 | ) | 11 | (41 | ) | |||||||||||||||||||||
| Credit cards |
(1 | ) | (4 | ) | (5 | ) | 3 | 6 | 9 | 5 | 6 | 11 | ||||||||||||||||||||||||
|
|
|
|
|
|
|
|
|
|
|
|
|
|
|
|
|
|
|
|||||||||||||||||||
| Total retail |
(25 | ) | (8 | ) | (33 | ) | (149 | ) | (81 | ) | (230 | ) | (148 | ) | (109 | ) | (257 | ) | ||||||||||||||||||
|
|
|
|
|
|
|
|
|
|
|
|
|
|
|
|
|
|
|
|||||||||||||||||||
| Total loans and leases |
2 | (31 | ) | (29 | ) | (111 | ) | (93 | ) | (204 | ) | (63 | ) | (166 | ) | (229 | ) | |||||||||||||||||||
| Loans held for sale |
(5 | ) | 22 | 17 | (5 | ) | — | (5 | ) | 7 | (3 | ) | 4 | |||||||||||||||||||||||
|
|
|
|
|
|
|
|
|
|
|
|
|
|
|
|
|
|
|
|||||||||||||||||||
| Total interest income |
$ | 70 | $ | (12 | ) | $ | 58 | $ | (197 | ) | $ | (148 | ) | $ | (345 | ) | $ | (80 | ) | $ | (278 | ) | $ | (358 | ) | |||||||||||
|
|
|
|
|
|
|
|
|
|
|
|
|
|
|
|
|
|
|
|||||||||||||||||||
| Interest Expense |
||||||||||||||||||||||||||||||||||||
| Checking with interest |
$ | — | $ | — | $ | — | $ | — | $ | (2 | ) | $ | (2 | ) | $ | (2 | ) | $ | (3 | ) | $ | (5 | ) | |||||||||||||
| Money market & savings |
(6 | ) | (22 | ) | (28 | ) | 4 | (20 | ) | (16 | ) | 9 | 18 | 27 | ||||||||||||||||||||||
| Term deposits |
(11 | ) | (11 | ) | (22 | ) | (41 | ) | (100 | ) | (141 | ) | (68 | ) | (69 | ) | (137 | ) | ||||||||||||||||||
|
|
|
|
|
|
|
|
|
|
|
|
|
|
|
|
|
|
|
|||||||||||||||||||
| Total interest-bearing deposits |
(17 | ) | (33 | ) | (50 | ) | (37 | ) | (122 | ) | (159 | ) | (61 | ) | (54 | ) | (115 | ) | ||||||||||||||||||
| Interest-bearing deposits held for sale |
— | 4 | 4 | — | — | — | — | — | — | |||||||||||||||||||||||||||
| Federal funds purchased and securities sold under agreements to repurchase |
226 | (325 | ) | (99 | ) | (14 | ) | 87 | 73 | (55 | ) | (17 | ) | (72 | ) | |||||||||||||||||||||
| Other short-term borrowed funds |
14 | 34 | 48 | (92 | ) | (5 | ) | (97 | ) | 35 | (84 | ) | (49 | ) | ||||||||||||||||||||||
| Long-term borrowed funds |
13 | 10 | 23 | (15 | ) | 22 | 7 | (32 | ) | 3 | (29 | ) | ||||||||||||||||||||||||
|
|
|
|
|
|
|
|
|
|
|
|
|
|
|
|
|
|
|
|||||||||||||||||||
| Total borrowed funds |
253 | (281 | ) | (28 | ) | (121 | ) | 104 | (17 | ) | (52 | ) | (98 | ) | (150 | ) | ||||||||||||||||||||
|
|
|
|
|
|
|
|
|
|
|
|
|
|
|
|
|
|
|
|||||||||||||||||||
| Total interest expense |
236 | (310 | ) | (74 | ) | (158 | ) | (18 | ) | (176 | ) | (113 | ) | (152 | ) | (265 | ) | |||||||||||||||||||
|
|
|
|
|
|
|
|
|
|
|
|
|
|
|
|
|
|
|
|||||||||||||||||||
| Net interest income |
$ | (166 | ) | $ | 298 | $ | 132 | $ | (39 | ) | $ | (130 | ) | $ | (169 | ) | $ | 33 | $ | (126 | ) | $ | (93 | ) | ||||||||||||
|
|
|
|
|
|
|
|
|
|
|
|
|
|
|
|
|
|
|
|||||||||||||||||||
171
Table of Contents
Investment Portfolio
The following table presents the book value of the major components of our investments portfolio. See Note 2 “Securities” to our unaudited interim consolidated financial statements and Note 3 “Securities” to our audited consolidated financial statements included elsewhere in this prospectus for further discussion.
| June 30, | December 31, | |||||||||||||||
| 2014 | 2013 | 2012 | 2011 | |||||||||||||
| (in millions) | ||||||||||||||||
| Securities Available for Sale: |
||||||||||||||||
| U.S. Treasury |
$ | 15 | $ | 15 | $ | 15 | $ | 15 | ||||||||
| State and political subdivisions |
10 | 10 | 21 | 90 | ||||||||||||
| Other bonds, notes and debentures |
— | — | — | 1 | ||||||||||||
| Mortgage-backed securities: |
||||||||||||||||
| Federal agencies and U.S. government sponsored entities |
17,585 | 14,993 | 16,904 | 20,129 | ||||||||||||
| Other/non-agency |
858 | 952 | 1,397 | 1,893 | ||||||||||||
|
|
|
|
|
|
|
|
|
|||||||||
| Total mortgage-backed securities |
18,443 | 15,945 | 18,301 | 22,022 | ||||||||||||
|
|
|
|
|
|
|
|
|
|||||||||
| Total debt securities available for sale |
18,468 | 15,970 | 18,337 | 22,128 | ||||||||||||
|
|
|
|
|
|
|
|
|
|||||||||
| Marketable equity securities |
13 | 13 | 7 | 10 | ||||||||||||
| Other equity securities |
12 | 12 | 12 | 12 | ||||||||||||
|
|
|
|
|
|
|
|
|
|||||||||
| Total equity securities available for sale |
25 | 25 | 19 | 22 | ||||||||||||
|
|
|
|
|
|
|
|
|
|||||||||
| Total securities available for sale |
$ | 18,493 | $ | 15,995 | $ | 18,356 | $ | 22,150 | ||||||||
|
|
|
|
|
|
|
|
|
|||||||||
| Securities Held to Maturity: |
||||||||||||||||
| Mortgage-backed securities: |
||||||||||||||||
| Federal Agencies and U.S. government sponsored entities |
$ | 3,897 | $ | 2,940 | $ | — | $ | — | ||||||||
| Other/non-agency |
1,485 | 1,375 | — | — | ||||||||||||
|
|
|
|
|
|
|
|
|
|||||||||
| Total securities held to maturity |
$ | 5,382 | $ | 4,315 | $ | — | $ | — | ||||||||
|
|
|
|
|
|
|
|
|
|||||||||
| Other Investment Securities: |
||||||||||||||||
| Federal Reserve Bank stock |
$ | 470 | $ | 462 | $ | 490 | $ | 490 | ||||||||
| Federal Home Loan Bank stock |
472 | 468 | 565 | 655 | ||||||||||||
| Venture capital and other investments |
6 | 5 | 6 | 57 | ||||||||||||
|
|
|
|
|
|
|
|
|
|||||||||
| Total other investment securities |
$ | 948 | $ | 935 | $ | 1,061 | $ | 1,202 | ||||||||
|
|
|
|
|
|
|
|
|
|||||||||
172
Table of Contents
The following table presents an analysis of the amortized cost, remaining contractual maturities, and weighted-average yields by contractual maturity. Expected maturities may differ from contractual maturities because borrowers may have the right to call or prepay obligations with or without call or prepayment penalties.
| Distribution of Maturities | ||||||||||||||||||||||||||||||||||||||||
| As of June 30, 2014 | As of December 31, 2013 | |||||||||||||||||||||||||||||||||||||||
| Due in 1 Year or Less |
Due After 1 Through 5 Years |
Due After 5 Through 10 Years |
Due After 10 Years |
Total | Due in 1 Year or Less |
Due After 1 Through 5 Years |
Due After 5 Through 10 Years |
Due After 10 Years |
Total | |||||||||||||||||||||||||||||||
| (dollars in millions) | ||||||||||||||||||||||||||||||||||||||||
| Amortized Cost: |
||||||||||||||||||||||||||||||||||||||||
| Debt securities Available for Sale: |
||||||||||||||||||||||||||||||||||||||||
| U.S. Treasury |
$ | 15 | $ | — | $ | — | $ | — | $ | 15 | $ | 15 | $ | — | $ | — | $ | — | $ | 15 | ||||||||||||||||||||
| State and political subdivisions |
— | — | — | 10 | 10 | — | — | — | 11 | 11 | ||||||||||||||||||||||||||||||
| Mortgage-backed securities: |
||||||||||||||||||||||||||||||||||||||||
| Federal agencies and U.S. government sponsored entities |
3 | 35 | 2,603 | 14,702 | 17,343 | — | 39 | 2,865 | 12,066 | 14,970 | ||||||||||||||||||||||||||||||
| Other/non-agency |
— | 61 | 76 | 750 | 887 | — | 43 | 120 | 829 | 992 | ||||||||||||||||||||||||||||||
|
|
|
|
|
|
|
|
|
|
|
|
|
|
|
|
|
|
|
|
|
|||||||||||||||||||||
| Total debt securities available for sale |
18 | 96 | 2,679 | 15,462 | 18,255 | 15 | 82 | 2,985 | 12,906 | 15,988 | ||||||||||||||||||||||||||||||
|
|
|
|
|
|
|
|
|
|
|
|
|
|
|
|
|
|
|
|
|
|||||||||||||||||||||
| Debt Securities Held to Maturity: |
||||||||||||||||||||||||||||||||||||||||
| Mortgage-backed securities: |
||||||||||||||||||||||||||||||||||||||||
| Federal agencies and U.S. government sponsored entities |
— | — | — | 3,897 | 3,897 | — | — | — | 2,940 | 2,940 | ||||||||||||||||||||||||||||||
| Other/non-agency |
— | — | — | 1,485 | 1,485 | — | — | — | 1,375 | 1,375 | ||||||||||||||||||||||||||||||
|
|
|
|
|
|
|
|
|
|
|
|
|
|
|
|
|
|
|
|
|
|||||||||||||||||||||
| Total debt securities held to maturity |
— | — | — | 5,382 | 5,382 | — | — | — | 4,315 | 4,315 | ||||||||||||||||||||||||||||||
|
|
|
|
|
|
|
|
|
|
|
|
|
|
|
|
|
|
|
|
|
|||||||||||||||||||||
| Total amortized cost of debt securities(1) |
$ | 18 | $ | 96 | $ | 2,679 | $ | 20,844 | $ | 23,637 | $ | 15 | $ | 82 | $ | 2,985 | $ | 17,221 | $ | 20,303 | ||||||||||||||||||||
|
|
|
|
|
|
|
|
|
|
|
|
|
|
|
|
|
|
|
|
|
|||||||||||||||||||||
| Weighted-average yield(2) |
1.05 | % | 4.80 | % | 1.79 | % | 2.74 | % | 2.64 | % | 0.17 | % | 4.79 | % | 1.82 | % | 2.81 | % | 2.67 | % | ||||||||||||||||||||
| (1) | As of June 30, 2014 and December 31, 2013, no investments exceeded 10% of stockholders’ equity. |
| (2) | Yields on tax-exempt securities are not computed on a tax-equivalent basis. |
173
Table of Contents
Loan and Lease Portfolio
The following table shows the composition of total loans and leases. See Note 3 “Loans and Leases” to our unaudited interim consolidated financial statements and Note 4 “Loans and Leases” to our audited consolidated financial statements included elsewhere in this prospectus for further discussion of our loan and lease portfolio.
| June 30, | December 31, | |||||||||||||||||||||||
| 2014 | 2013 | 2012 | 2011 | 2010 | 2009 | |||||||||||||||||||
| (in millions) | ||||||||||||||||||||||||
| Loans and Leases: |
||||||||||||||||||||||||
| Commercial |
$ | 30,076 | $ | 28,667 | $ | 28,856 | $ | 25,770 | $ | 21,877 | $ | 21,253 | ||||||||||||
| Commercial real estate |
7,158 | 6,948 | 6,459 | 7,602 | 8,920 | 10,463 | ||||||||||||||||||
| Leases |
3,740 | 3,780 | 3,415 | 3,164 | 3,016 | 3,290 | ||||||||||||||||||
|
|
|
|
|
|
|
|
|
|
|
|
|
|||||||||||||
| Total commercial |
40,974 | 39,395 | 38,730 | 36,536 | 33,813 | 35,006 | ||||||||||||||||||
|
|
|
|
|
|
|
|
|
|
|
|
|
|||||||||||||
| Residential, including originated home equity products |
30,116 | 29,694 | 31,101 | 33,151 | 33,738 | 36,947 | ||||||||||||||||||
| Home equity products serviced by others |
1,972 | 2,171 | 2,960 | 3,624 | 4,412 | 5,510 | ||||||||||||||||||
| Other secured retail |
12,180 | 10,700 | 10,568 | 9,576 | 10,981 | 12,502 | ||||||||||||||||||
| Unsecured retail |
3,587 | 3,899 | 3,889 | 3,908 | 4,078 | 5,115 | ||||||||||||||||||
|
|
|
|
|
|
|
|
|
|
|
|
|
|||||||||||||
| Total retail |
47,855 | 46,464 | 48,518 | 50,259 | 53,209 | 60,074 | ||||||||||||||||||
|
|
|
|
|
|
|
|
|
|
|
|
|
|||||||||||||
| Total loans and leases |
$ | 88,829 | $ | 85,859 | $ | 87,248 | $ | 86,795 | $ | 87,022 | $ | 95,080 | ||||||||||||
|
|
|
|
|
|
|
|
|
|
|
|
|
|||||||||||||
Maturities and Sensitivities of Loans and Leases to Changes in Interest Rates
The following table is a summary of loans and leases by remaining maturity or repricing date:
| June 30, 2014 | ||||||||||||||||
| Due in 1 Year or Less |
Due After 1 Through 5 Years |
Due After 5 Years |
Total Loans and Leases |
|||||||||||||
| (in millions) | ||||||||||||||||
| Commercial |
$ | 25,500 | $ | 2,595 | $ | 1,981 | $ | 30,076 | ||||||||
| Commercial real estate |
6,762 | 233 | 163 | 7,158 | ||||||||||||
| Leases |
732 | 1,786 | 1,222 | 3,740 | ||||||||||||
|
|
|
|
|
|
|
|
|
|||||||||
| Total commercial |
32,994 | 4,614 | 3,366 | 40,974 | ||||||||||||
| Residential, including originated home equity products |
12,464 | 5,546 | 12,106 | 30,116 | ||||||||||||
| Home equity products serviced by others |
673 | 4 | 1,295 | 1,972 | ||||||||||||
| Other secured retail |
645 | 5,958 | 5,577 | 12,180 | ||||||||||||
| Unsecured retail |
1,508 | 175 | 1,904 | 3,587 | ||||||||||||
|
|
|
|
|
|
|
|
|
|||||||||
| Total retail |
15,290 | 11,683 | 20,882 | 47,855 | ||||||||||||
|
|
|
|
|
|
|
|
|
|||||||||
| Total loans and leases |
$ | 48,284 | $ | 16,297 | $ | 24,248 | $ | 88,829 | ||||||||
|
|
|
|
|
|
|
|
|
|||||||||
| Loans and leases due after one year at fixed interest rates |
$ | 10,241 | $ | 18,199 | $ | 28,440 | ||||||||||
| Loans and leases due after one year at variable interest rates |
6,056 | 6,049 | 12,105 | |||||||||||||
174
Table of Contents
| December 31, 2013 | ||||||||||||||||
| Due in 1 Year or Less |
Due After 1 Through 5 Years |
Due After 5 Years |
Total Loans and Leases |
|||||||||||||
| (in millions) | ||||||||||||||||
| Commercial |
$ | 24,299 | $ | 2,525 | $ | 1,843 | $ | 28,667 | ||||||||
| Commercial real estate |
6,505 | 286 | 157 | 6,948 | ||||||||||||
| Leases |
610 | 1,872 | 1,298 | 3,780 | ||||||||||||
|
|
|
|
|
|
|
|
|
|||||||||
| Total commercial |
31,414 | 4,683 | 3,298 | 39,395 | ||||||||||||
| Residential, including originated home equity products |
12,482 | 5,786 | 11,426 | 29,694 | ||||||||||||
| Home equity products serviced by others |
734 | 5 | 1,432 | 2,171 | ||||||||||||
| Other secured retail |
485 | 6,032 | 4,183 | 10,700 | ||||||||||||
| Unsecured retail |
1,659 | 226 | 2,014 | 3,899 | ||||||||||||
|
|
|
|
|
|
|
|
|
|||||||||
| Total retail |
15,360 | 12,049 | 19,055 | 46,464 | ||||||||||||
|
|
|
|
|
|
|
|
|
|||||||||
| Total loans and leases |
$ | 46,774 | $ | 16,732 | $ | 22,353 | $ | 85,859 | ||||||||
|
|
|
|
|
|
|
|
|
|||||||||
| Loans and leases due after one year at fixed interest rates |
$ | 10,232 | $ | 16,186 | $ | 26,418 | ||||||||||
| Loans and leases due after one year at variable interest rates |
6,500 | 6,167 | 12,667 | |||||||||||||
Loan and Lease Concentrations
This disclosure presents our exposure to any concentration of loans and leases that exceed 10% of total loans and leases. At June 30, 2014 and December 31, 2013, we did not identify any concentration of loans and leases that exceeded the 10% threshold. See Note 4 “Allowance for Credit Losses, Nonperforming Assets, and Concentrations of Credit Risk” to our unaudited interim consolidated financial statements and Note 5 “Allowance for Credit Losses, Nonperforming Assets, and Concentrations of Credit Risk” to our audited consolidated financial statements included elsewhere in this prospectus for further discussion of how we manage concentration exposures.
175
Table of Contents
Risk Elements
The following table presents a summary of nonperforming loans and leases by class:
| June 30, | December 31, | |||||||||||||||||||||||
| 2014 | 2013 | 2012 | 2011 | 2010 | 2009 | |||||||||||||||||||
| (in millions) | ||||||||||||||||||||||||
| Nonaccrual loans and leases |
||||||||||||||||||||||||
| Commercial |
$ | 63 | $ | 96 | $ | 119 | $ | 176 | $ | 283 | $ | 225 | ||||||||||||
| Commercial real estate |
129 | 169 | 386 | 710 | 927 | 886 | ||||||||||||||||||
| Leases |
— | — | 1 | 1 | 13 | 33 | ||||||||||||||||||
|
|
|
|
|
|
|
|
|
|
|
|
|
|||||||||||||
| Total commercial |
192 | 265 | 506 | 887 | 1,223 | 1,144 | ||||||||||||||||||
|
|
|
|
|
|
|
|
|
|
|
|
|
|||||||||||||
| Residential, including originated home equity products |
876 | 981 | 1,043 | 690 | 764 | 555 | ||||||||||||||||||
| Home equity products serviced by others |
80 | 89 | 133 | 93 | 169 | 273 | ||||||||||||||||||
| Other secured retail |
18 | 26 | 25 | 19 | 27 | 43 | ||||||||||||||||||
| Unsecured retail |
22 | 22 | 23 | 23 | 37 | 63 | ||||||||||||||||||
|
|
|
|
|
|
|
|
|
|
|
|
|
|||||||||||||
| Total retail |
996 | 1,118 | 1,224 | 825 | 997 | 934 | ||||||||||||||||||
|
|
|
|
|
|
|
|
|
|
|
|
|
|||||||||||||
| Total nonaccrual loans and leases |
$ | 1,188 | $ | 1,383 | $ | 1,730 | $ | 1,712 | $ | 2,220 | $ | 2,078 | ||||||||||||
|
|
|
|
|
|
|
|
|
|
|
|
|
|||||||||||||
| Loans and leases that are accruing and 90 days or more delinquent |
||||||||||||||||||||||||
| Commercial |
$ | — | $ | — | $ | 71 | $ | 1 | $ | 87 | $ | 1 | ||||||||||||
| Commercial real estate |
1 | — | 33 | 4 | 2 | 65 | ||||||||||||||||||
| Lease |
2 | — | — | — | — | — | ||||||||||||||||||
|
|
|
|
|
|
|
|
|
|
|
|
|
|||||||||||||
| Total commercial |
3 | — | 104 | 5 | 89 | 66 | ||||||||||||||||||
|
|
|
|
|
|
|
|
|
|
|
|
|
|||||||||||||
| Residential, including originated home equity products |
— | — | — | 29 | 15 | 22 | ||||||||||||||||||
| Other secured retail |
— | — | — | 36 | 29 | 27 | ||||||||||||||||||
| Unsecured retail |
9 | 33 | 35 | 2 | 2 | 2 | ||||||||||||||||||
|
|
|
|
|
|
|
|
|
|
|
|
|
|||||||||||||
| Total retail |
9 | 33 | 35 | 67 | 46 | 51 | ||||||||||||||||||
|
|
|
|
|
|
|
|
|
|
|
|
|
|||||||||||||
| Total accruing and 90 days or more delinquent |
12 | 33 | 139 | 72 | 135 | 117 | ||||||||||||||||||
|
|
|
|
|
|
|
|
|
|
|
|
|
|||||||||||||
| Total nonperforming loans and leases |
$ | 1,200 | $ | 1,416 | $ | 1,869 | $ | 1,784 | $ | 2,355 | $ | 2,195 | ||||||||||||
|
|
|
|
|
|
|
|
|
|
|
|
|
|||||||||||||
| Troubled debt restructurings(1) |
$ | 960 | $ | 777 | $ | 704 | $ | 493 | $ | 346 | $ | 209 | ||||||||||||
| (1) | TDR balances reported in this line item consist of only those TDRs not reported in the nonaccrual loan or accruing and 90 days or more delinquent loan categories. Thus, only those TDRs that are in compliance with their modified terms and not past due, or those TDRs that are past due 30-89 days and still accruing are included in the TDR balances listed above. |
176
Table of Contents
Impact of Nonperforming Loans and Leases on Interest Income
The following table presents the gross interest income for both nonaccrual and restructured loans that would have been recognized if such loans had been current in accordance with their original contractual terms, and had been outstanding throughout the period or since origination if held for only part of the period. The table also presents the interest income related to these loans that was actually recognized for the periods.
| Six Months Ended June 30, 2014 |
Year Ended December 31, 2013 |
|||||||
| (in millions) |
||||||||
| Gross amount of interest income that would have been recorded in accordance with original contractual terms, and had been outstanding throughout the period or since origination, if held for only part of the period(1) |
$ | 79 | $ | 176 | ||||
| Interest income actually recognized |
3 | 27 | ||||||
|
|
|
|
|
|||||
| Total interest income foregone |
$ | 76 | $ | 149 | ||||
|
|
|
|
|
|||||
| (1) | Based on the contractual rate that was being charged at the time the loan was restructured or placed on nonaccrual status. |
Potential Problem Loans
This disclosure presents outstanding amounts as well as specific reserves for certain loans and leases where information about possible credit problems of borrowers causes management to have serious doubts as to the ability of such borrowers to comply with the present repayment terms. At June 30, 2014 and December 31, 2013, we did not identify any potential problem loans or leases within the portfolio that were not already included in “—Risk Elements” above.
Cross-Border Outstandings
Cross-border outstandings can include loans, receivables, interest-bearing deposits with other banks, other interest-bearing investments and other monetary assets that are denominated in either dollars or other non-local currency.
As of June 30, 2014, December 31, 2013, 2012 and 2011, there were no aggregate cross-border outstandings from borrowers or counterparties in any country that exceeded 1%, or were between 0.75% and 1% of consolidated total assets.
177
Table of Contents
Summary of Loan and Lease Loss Experience
The following table summarizes the changes to our allowance for loan and lease losses:
| As of and for the Six Months Ended June 30, |
As of and for the Year Ended December 31, | |||||||||||||||||||||||
| 2014 | 2013 | 2012 | 2011 | 2010 | 2009 | |||||||||||||||||||
| (in millions) | ||||||||||||||||||||||||
| Allowance for Loan and Lease Losses—Beginning: |
||||||||||||||||||||||||
| Commercial |
$ | 361 | $ | 379 | $ | 394 | $ | 399 | $ | 451 | $ | 387 | ||||||||||||
| Commercial real estate |
78 | 111 | 279 | 401 | 317 | 161 | ||||||||||||||||||
| Leases |
24 | 19 | 18 | 28 | 79 | 49 | ||||||||||||||||||
| Qualitative(1) |
35 | — | — | — | — | — | ||||||||||||||||||
|
|
|
|
|
|
|
|
|
|
|
|
|
|||||||||||||
| Total commercial |
498 | 509 | 691 | 828 | 847 | 597 | ||||||||||||||||||
| Residential, including originated home equity products |
348 | 263 | 283 | 301 | 366 | 157 | ||||||||||||||||||
| Home equity products serviced by others |
103 | 178 | 293 | 385 | 495 | 474 | ||||||||||||||||||
| Other secured retail |
57 | 76 | 95 | 118 | 219 | 228 | ||||||||||||||||||
| Unsecured retail |
155 | 140 | 145 | 217 | 251 | 258 | ||||||||||||||||||
| Qualitative(1) |
60 | — | — | — | — | — | ||||||||||||||||||
|
|
|
|
|
|
|
|
|
|
|
|
|
|||||||||||||
| Total retail |
723 | 657 | 816 | 1,021 | 1,331 | 1,117 | ||||||||||||||||||
| Unallocated |
— | 89 | 191 | 156 | 31 | 17 | ||||||||||||||||||
|
|
|
|
|
|
|
|
|
|
|
|
|
|||||||||||||
| Total allowance for loan and lease losses—beginning |
$ | 1,221 | $ | 1,255 | $ | 1,698 | $ | 2,005 | $ | 2,209 | $ | 1,731 | ||||||||||||
|
|
|
|
|
|
|
|
|
|
|
|
|
|||||||||||||
| Gross Charge-Offs: |
||||||||||||||||||||||||
| Commercial |
$ | (11 | ) | $ | (72 | ) | $ | (127 | ) | $ | (170 | ) | $ | (267 | ) | $ | (406 | ) | ||||||
| Commercial real estate |
(3 | ) | (36 | ) | (129 | ) | (208 | ) | (420 | ) | (321 | ) | ||||||||||||
| Leases |
— | — | (1 | ) | — | (1 | ) | (38 | ) | |||||||||||||||
|
|
|
|
|
|
|
|
|
|
|
|
|
|||||||||||||
| Total commercial |
(14 | ) | (108 | ) | (257 | ) | (378 | ) | (688 | ) | (765 | ) | ||||||||||||
| Residential, including originated home equity products |
(93 | ) | (233 | ) | (324 | ) | (328 | ) | (364 | ) | (323 | ) | ||||||||||||
| Home equity products serviced by others |
(37 | ) | (146 | ) | (268 | ) | (366 | ) | (540 | ) | (709 | ) | ||||||||||||
| Other secured retail |
(41 | ) | (74 | ) | (105 | ) | (132 | ) | (205 | ) | (308 | ) | ||||||||||||
| Unsecured retail |
(60 | ) | (142 | ) | (156 | ) | (182 | ) | (294 | ) | (375 | ) | ||||||||||||
|
|
|
|
|
|
|
|
|
|
|
|
|
|||||||||||||
| Total retail |
(231 | ) | (595 | ) | (853 | ) | (1,008 | ) | (1,403 | ) | (1,715 | ) | ||||||||||||
|
|
|
|
|
|
|
|
|
|
|
|
|
|||||||||||||
| Total gross charge-offs |
$ | (245 | ) | $ | (703 | ) | $ | (1,110 | ) | $ | (1,386 | ) | $ | (2,091 | ) | $ | (2,480 | ) | ||||||
|
|
|
|
|
|
|
|
|
|
|
|
|
|||||||||||||
| Gross Recoveries: |
||||||||||||||||||||||||
| Commercial |
$ | 24 | $ | 46 | $ | 64 | $ | 42 | $ | 33 | $ | 31 | ||||||||||||
| Commercial real estate |
11 | 40 | 47 | 47 | 23 | 3 | ||||||||||||||||||
| Leases |
— | 1 | 2 | 3 | 1 | — | ||||||||||||||||||
|
|
|
|
|
|
|
|
|
|
|
|
|
|||||||||||||
| Total commercial |
35 | 87 | 113 | 92 | 57 | 34 | ||||||||||||||||||
| Residential, including originated home equity products |
24 | 55 | 52 | 51 | 48 | 48 | ||||||||||||||||||
| Home equity products serviced by others |
11 | 28 | 27 | 22 | 20 | 58 | ||||||||||||||||||
| Other secured retail |
10 | 12 | 21 | 35 | 46 | 41 | ||||||||||||||||||
| Unsecured retail |
10 | 20 | 22 | 21 | 71 | 13 | ||||||||||||||||||
|
|
|
|
|
|
|
|
|
|
|
|
|
|||||||||||||
| Total retail |
55 | 115 | 122 | 129 | 185 | 160 | ||||||||||||||||||
|
|
|
|
|
|
|
|
|
|
|
|
|
|||||||||||||
| Total gross recoveries |
$ | 90 | $ | 202 | $ | 235 | $ | 221 | $ | 242 | $ | 194 | ||||||||||||
|
|
|
|
|
|
|
|
|
|
|
|
|
|||||||||||||
178
Table of Contents
| As of and for the Six Months Ended June 30, |
As of and for the Year Ended December 31, | |||||||||||||||||||||||
| 2014 | 2013 | 2012 | 2011 | 2010 | 2009 | |||||||||||||||||||
| (dollars in millions) | ||||||||||||||||||||||||
| Net (Charge-offs)/Recoveries: |
||||||||||||||||||||||||
| Commercial |
$ | 13 | $ | (26 | ) | $ | (63 | ) | $ | (128 | ) | $ | (234 | ) | $ | (375 | ) | |||||||
| Commercial real estate |
8 | 4 | (82 | ) | (161 | ) | (397 | ) | (318 | ) | ||||||||||||||
| Leases |
— | 1 | 1 | 3 | — | (38 | ) | |||||||||||||||||
|
|
|
|
|
|
|
|
|
|
|
|
|
|||||||||||||
| Total commercial |
21 | (21 | ) | (144 | ) | (286 | ) | (631 | ) | (731 | ) | |||||||||||||
| Residential, including originated home equity products |
(69 | ) | (178 | ) | (272 | ) | (277 | ) | (316 | ) | (275 | ) | ||||||||||||
| Home equity products serviced by others |
(26 | ) | (118 | ) | (241 | ) | (344 | ) | (520 | ) | (651 | ) | ||||||||||||
| Other secured retail |
(31 | ) | (62 | ) | (84 | ) | (97 | ) | (159 | ) | (267 | ) | ||||||||||||
| Unsecured retail |
(50 | ) | (122 | ) | (134 | ) | (161 | ) | (223 | ) | (362 | ) | ||||||||||||
|
|
|
|
|
|
|
|
|
|
|
|
|
|||||||||||||
| Total retail |
(176 | ) | (480 | ) | (731 | ) | (879 | ) | (1,218 | ) | (1,555 | ) | ||||||||||||
|
|
|
|
|
|
|
|
|
|
|
|
|
|||||||||||||
| Total net (charge-offs)/recoveries |
$ | (155 | ) | $ | (501 | ) | $ | (875 | ) | $ | (1,165 | ) | $ | (1,849 | ) | $ | (2,286 | ) | ||||||
|
|
|
|
|
|
|
|
|
|
|
|
|
|||||||||||||
| Ratio of net charge-offs to average loans and leases |
(0.36 | )% | (0.59 | )% | (1.01 | )% | (1.35 | )% | (2.04 | )% | (2.21 | )% | ||||||||||||
| Provision for loan and lease losses: |
||||||||||||||||||||||||
| Commercial |
$ | (23 | ) | $ | 13 | $ | 48 | $ | 123 | $ | 182 | $ | 439 | |||||||||||
| Commercial real estate |
(13 | ) | (36 | ) | (84 | ) | 39 | 481 | 474 | |||||||||||||||
| Leases |
(1 | ) | 4 | — | (13 | ) | (51 | ) | 68 | |||||||||||||||
| Qualitative(1) |
26 | — | — | — | — | — | ||||||||||||||||||
|
|
|
|
|
|
|
|
|
|
|
|
|
|||||||||||||
| Total commercial |
(11 | ) | (19 | ) | (36 | ) | 149 | 612 | 981 | |||||||||||||||
| Residential, including originated home equity products |
42 | 170 | 252 | 259 | 251 | 484 | ||||||||||||||||||
| Home equity products serviced by others |
1 | 43 | 126 | 252 | 410 | 672 | ||||||||||||||||||
| Other secured retail |
38 | 43 | 65 | 74 | 58 | 258 | ||||||||||||||||||
| Unsecured retail |
44 | 140 | 129 | 89 | 189 | 355 | ||||||||||||||||||
| Qualitative(1) |
30 | — | — | — | — | — | ||||||||||||||||||
|
|
|
|
|
|
|
|
|
|
|
|
|
|||||||||||||
| Total retail |
155 | 396 | 572 | 674 | 908 | 1,769 | ||||||||||||||||||
|
|
|
|
|
|
|
|
|
|
|
|
|
|||||||||||||
| Unallocated |
— | 103 | (102 | ) | 68 | 125 | 14 | |||||||||||||||||
|
|
|
|
|
|
|
|
|
|
|
|
|
|||||||||||||
| Total provision for loan and lease losses |
$ | 144 | $ | 480 | $ | 434 | $ | 891 | $ | 1,645 | $ | 2,764 | ||||||||||||
|
|
|
|
|
|
|
|
|
|
|
|
|
|||||||||||||
| Transfers—General Allowance to Qualitative Allowance(1): |
||||||||||||||||||||||||
| Commercial |
$ | — | $ | 35 | ||||||||||||||||||||
| Retail |
— | 60 | ||||||||||||||||||||||
|
|
|
|
|
|||||||||||||||||||||
| Unallocated |
$ | — | $ | (95 | ) | |||||||||||||||||||
|
|
|
|
|
|||||||||||||||||||||
| Retail Emergence Period Change(2): |
||||||||||||||||||||||||
| Residential, including originated home equity products |
$ | — | $ | 96 | ||||||||||||||||||||
|
|
|
|
|
|||||||||||||||||||||
| Total retail |
— | 96 | ||||||||||||||||||||||
|
|
|
|
|
|||||||||||||||||||||
| Unallocated |
— | (96 | ) | |||||||||||||||||||||
|
|
|
|
|
|||||||||||||||||||||
| Emergence period change |
$ | — | $ | — | ||||||||||||||||||||
|
|
|
|
|
|||||||||||||||||||||
179
Table of Contents
| As of and for the Six Months Ended June 30, |
As of and for the Year Ended December 31, | |||||||||||||||||||||||
| 2014 | 2013 | 2012 | 2011 | 2010 | 2009 | |||||||||||||||||||
| (in millions) | ||||||||||||||||||||||||
| Sale/Other: |
||||||||||||||||||||||||
| Commercial |
$ | — | $ | (5 | ) | $ | — | $ | — | $ | — | $ | — | |||||||||||
| Commercial real estate |
— | (1 | ) | (2 | ) | — | — | — | ||||||||||||||||
|
|
|
|
|
|
|
|
|
|
|
|
|
|||||||||||||
| Total commercial |
— | (6 | ) | (2 | ) | — | — | — | ||||||||||||||||
| Residential, including originated home equity products |
— | (3 | ) | — | — | — | — | |||||||||||||||||
| Unsecured retail |
— | (3 | ) | — | — | — | — | |||||||||||||||||
|
|
|
|
|
|
|
|
|
|
|
|
|
|||||||||||||
| Total retail |
— | (6 | ) | — | — | — | — | |||||||||||||||||
| Unallocated |
— | (1 | ) | — | (33 | ) | — | — | ||||||||||||||||
|
|
|
|
|
|
|
|
|
|
|
|
|
|||||||||||||
| Sale/other |
$ | — | $ | (13 | ) | $ | (2 | ) | $ | (33 | ) | $ | — | $ | — | |||||||||
|
|
|
|
|
|
|
|
|
|
|
|
|
|||||||||||||
| Allowance for Loan and Lease Losses—Ending: |
||||||||||||||||||||||||
| Commercial |
$ | 351 | $ | 361 | $ | 379 | $ | 394 | $ | 399 | $ | 451 | ||||||||||||
| Commercial real estate |
73 | 78 | 111 | 279 | 401 | 317 | ||||||||||||||||||
| Leases |
23 | 24 | 19 | 18 | 28 | 79 | ||||||||||||||||||
| Qualitative(1) |
61 | 35 | — | — | — | — | ||||||||||||||||||
|
|
|
|
|
|
|
|
|
|
|
|
|
|||||||||||||
| Total commercial |
508 | 498 | 509 | 691 | 828 | 847 | ||||||||||||||||||
|
|
|
|
|
|
|
|
|
|
|
|
|
|||||||||||||
| Residential, including originated home equity products |
321 | 348 | 263 | 283 | 301 | 366 | ||||||||||||||||||
| Home equity products serviced by others |
78 | 103 | 178 | 293 | 385 | 495 | ||||||||||||||||||
| Other secured retail |
64 | 57 | 76 | 95 | 118 | 219 | ||||||||||||||||||
| Unsecured retail |
149 | 155 | 140 | 145 | 217 | 251 | ||||||||||||||||||
| Qualitative(1) |
90 | 60 | — | — | — | — | ||||||||||||||||||
|
|
|
|
|
|
|
|
|
|
|
|
|
|||||||||||||
| Total retail |
702 | 723 | 657 | 816 | 1,021 | 1,331 | ||||||||||||||||||
|
|
|
|
|
|
|
|
|
|
|
|
|
|||||||||||||
| Unallocated |
— | — | 89 | 191 | 156 | 31 | ||||||||||||||||||
|
|
|
|
|
|
|
|
|
|
|
|
|
|||||||||||||
| Total allowance for loan and lease losses—ending |
$ | 1,210 | $ | 1,221 | $ | 1,255 | $ | 1,698 | $ | 2,005 | $ | 2,209 | ||||||||||||
|
|
|
|
|
|
|
|
|
|
|
|
|
|||||||||||||
| Reserve for unfunded lending commitments—beginning |
$ | 39 | $ | 40 | $ | 61 | $ | 70 | $ | 71 | $ | 52 | ||||||||||||
| Provision (Credit) for unfunded lending commitments |
26 | (1 | ) | (21 | ) | (9 | ) | (1 | ) | 19 | ||||||||||||||
|
|
|
|
|
|
|
|
|
|
|
|
|
|||||||||||||
| Reserve for unfunded lending commitments—ending |
$ | 65 | $ | 39 | $ | 40 | $ | 61 | $ | 70 | $ | 71 | ||||||||||||
|
|
|
|
|
|
|
|
|
|
|
|
|
|||||||||||||
| Total allowance for credit losses—ending |
$ | 1,275 | $ | 1,260 | $ | 1,295 | $ | 1,759 | $ | 2,075 | $ | 2,280 | ||||||||||||
|
|
|
|
|
|
|
|
|
|
|
|
|
|||||||||||||
| (1) | As discussed in Note 1 “Significant Accounting Policies” to our audited consolidated financial statements included elsewhere in this prospectus, the allowance for loan and lease losses is reviewed separately for commercial and retail loans, and the allowance for loan and lease losses for each includes an adjustment for qualitative allowance that includes certain risks, factors and events that might not be measured in the statistical analysis. As a result of this adjustment, the unallocated allowance was absorbed into the separately measured commercial and retail qualitative allowance. |
| (2) | During December 2013, we updated our estimate of the incurred loss period for certain residential mortgages. This change reflected an analysis of defaulted borrowers and aligned to management’s view that incurred but unrealized losses emerge differently during various points of an economic/business cycle. See Note 5 “Allowance for Credit Losses, Nonperforming Assets, and Concentrations of Credit Risk,” to our audited consolidated financial statements included elsewhere in this prospectus for further detail. |
180
Table of Contents
Allocation of the Allowance for Loan and Lease Losses
The following table presents an allocation of the allowance for loan and lease losses by class and the percent of each class of loans and leases to total loans and leases:
| June 30, | December 31, | |||||||||||||||||||||||||||||||||||||||||||||||
| 2014 | 2013 | 2012 | 2011 | 2010 | 2009 | |||||||||||||||||||||||||||||||||||||||||||
| (dollars in millions) | ||||||||||||||||||||||||||||||||||||||||||||||||
| Commercial |
$ | 351 | 34 | % | $ | 361 | 33 | % | $ | 379 | 33 | % | $ | 394 | 30 | % | $ | 399 | 25 | % | $ | 451 | 22 | % | ||||||||||||||||||||||||
| Commercial real estate |
73 | 8 | 79 | 8 | 111 | 7 | 279 | 9 | 401 | 10 | 317 | 11 | ||||||||||||||||||||||||||||||||||||
| Leases |
23 | 4 | 23 | 5 | 19 | 4 | 18 | 3 | 28 | 4 | 79 | 4 | ||||||||||||||||||||||||||||||||||||
| Commercial qualitative allowance |
61 | N/A | 35 | N/A | — | N/A | — | N/A | — | N/A | — | N/A | ||||||||||||||||||||||||||||||||||||
|
|
|
|
|
|
|
|
|
|
|
|
|
|
|
|
|
|
|
|
|
|
|
|
|
|||||||||||||||||||||||||
| Total commercial |
508 | 46 | 498 | 46 | 509 | 44 | 691 | 42 | 828 | 39 | 847 | 37 | ||||||||||||||||||||||||||||||||||||
|
|
|
|
|
|
|
|
|
|
|
|
|
|
|
|
|
|
|
|
|
|
|
|
|
|||||||||||||||||||||||||
| Residential, including originated home equity products |
321 | 34 | 348 | 35 | 263 | 36 | 283 | 38 | 301 | 39 | 366 | 39 | ||||||||||||||||||||||||||||||||||||
| Home equity products serviced by others |
78 | 2 | 102 | 2 | 178 | 3 | 293 | 4 | 385 | 5 | 495 | 6 | ||||||||||||||||||||||||||||||||||||
| Other secured retail |
64 | 14 | 58 | 12 | 76 | 12 | 95 | 11 | 118 | 12 | 219 | 13 | ||||||||||||||||||||||||||||||||||||
| Unsecured retail |
149 | 4 | 155 | 5 | 140 | 5 | 145 | 5 | 217 | 5 | 251 | 5 | ||||||||||||||||||||||||||||||||||||
| Retail qualitative allowance |
90 | N/A | 60 | N/A | — | N/A | — | N/A | — | N/A | — | N/A | ||||||||||||||||||||||||||||||||||||
|
|
|
|
|
|
|
|
|
|
|
|
|
|
|
|
|
|
|
|
|
|
|
|
|
|||||||||||||||||||||||||
| Total retail |
702 | 54 | 723 | 54 | 657 | 56 | 816 | 58 | 1,021 | 61 | 1,331 | 63 | ||||||||||||||||||||||||||||||||||||
|
|
|
|
|
|
|
|
|
|
|
|
|
|
|
|
|
|
|
|
|
|
|
|
|
|||||||||||||||||||||||||
| Unallocated |
— | N/A | — | N/A | 89 | N/A | 191 | N/A | 156 | N/A | 31 | N/A | ||||||||||||||||||||||||||||||||||||
|
|
|
|
|
|
|
|
|
|
|
|
|
|
|
|
|
|
|
|
|
|
|
|
|
|||||||||||||||||||||||||
| Total |
$ | 1,210 | 100 | % | $ | 1,221 | 100 | % | $ | 1,255 | 100 | % | $ | 1,698 | 100 | % | $ | 2,005 | 100 | % | $ | 2,209 | 100 | % | ||||||||||||||||||||||||
|
|
|
|
|
|
|
|
|
|
|
|
|
|
|
|
|
|
|
|
|
|
|
|
|
|||||||||||||||||||||||||
181
Table of Contents
Deposits
The following table presents the average balances and average interest rates paid for deposits. See Note 10 “Deposits” to our audited consolidated financial statements included elsewhere in this prospectus for further discussion.
| For the Six Months Ended June 30, |
For the Year Ended December 31, | |||||||||||||||
| 2014 | 2013 | 2012 | 2011 | |||||||||||||
| Average Balances |
Average Balances |
Average Balances |
Average Balances |
|||||||||||||
| (in millions) | ||||||||||||||||
| Noninterest-bearing demand deposits(1) |
$ | 25,393 | $ | 25,399 | $ | 25,053 | $ | 21,191 | ||||||||
|
|
|
|
|
|
|
|
|
|||||||||
| For the Six Months Ended June 30, |
For the Year Ended December 31, | |||||||||||||||||||||||||||||||
| 2014 | 2013 | 2012 | 2011 | |||||||||||||||||||||||||||||
| Average Balances |
Yields/ Rates |
Average Balances |
Yields/ Rates |
Average Balances |
Yields/ Rates |
Average Balances |
Yields/ Rates |
|||||||||||||||||||||||||
| (dollars in millions) | ||||||||||||||||||||||||||||||||
| Checking with interest |
$ | 13,562 | 0.06 | % | $ | 14,096 | 0.06 | % | $ | 13,522 | 0.08 | % | $ | 16,116 | 0.10 | % | ||||||||||||||||
| Money market & savings |
38,667 | 0.17 | 42,575 | 0.25 | 41,249 | 0.29 | 37,638 | 0.25 | ||||||||||||||||||||||||
| Term deposits |
9,376 | 0.64 | 11,266 | 0.80 | 13,534 | 1.20 | 16,501 | 1.54 | ||||||||||||||||||||||||
|
|
|
|
|
|
|
|
|
|||||||||||||||||||||||||
| Total interest-bearing deposits(1)(2) |
$ | 61,605 | 0.22 | % | $ | 67,937 | 0.30 | % | $ | 68,305 | 0.43 | % | $ | 70,255 | 0.52 | % | ||||||||||||||||
|
|
|
|
|
|
|
|
|
|||||||||||||||||||||||||
| (1) | The aggregate amount of deposits by foreign depositors in domestic offices was approximately $1 million as of June 30, 2014, December 31, 2013, 2012, and 2011. |
| (2) | None of these customer deposit categories exceeded 10% of average total customer deposits for any of the periods presented. |
Time Certificates of Deposit of $100,000 or More
The following table presents the amount of time certificates of deposit of $100,000 or more, segregated by time remaining until maturity:
| June 30, 2014 |
December 31, 2013 |
|||||||
| (in millions) | ||||||||
| Three months or less |
$ | 2,715 | $ | 2,221 | ||||
| After three months through six months |
739 | 427 | ||||||
| After six months through twelve months |
845 | 718 | ||||||
| After twelve months |
685 | 570 | ||||||
|
|
|
|
|
|||||
| Total term deposits |
$ | 4,984 | $ | 3,936 | ||||
|
|
|
|
|
|||||
Return on Equity and Assets
The following table presents our return on average total assets, return on average common equity, dividend payout ratio and average equity to average assets ratio:
| June 30, | December 31, | |||||||||||||||
| 2014 | 2013 | 2012 | 2011 | |||||||||||||
| Return on average total assets |
0.77 | % | (2.83 | )% | 0.50 | % | 0.39 | % | ||||||||
| Return on average common equity |
4.96 | (15.69 | ) | 2.69 | 2.19 | |||||||||||
| Dividend payout ratio |
76.80 | (34.58 | ) | 23.31 | — | |||||||||||
| Average equity to average assets ratio |
15.53 | 18.06 | 18.75 | 18.03 | ||||||||||||
182
Table of Contents
Short-Term Borrowed Funds
The following table presents amounts and weighted-average rates for categories of short-term borrowed funds. See Note 7 “Borrowed Funds” to our unaudited interim consolidated financial statements, as well as Note 11 “Borrowed Funds” to our audited consolidated financial statements included elsewhere in this prospectus for further discussion.
| June 30, | December 31, | |||||||||||
| 2014 | 2013 | 2012 | ||||||||||
| (in millions) | ||||||||||||
| Federal funds purchased |
$ | — | $ | 689 | $ | 1,905 | ||||||
| Securities sold under agreements to repurchase |
6,807 | 4,102 | 1,696 | |||||||||
| Other short-term borrowed funds |
7,702 | 2,251 | 501 | |||||||||
|
|
|
|
|
|
|
|||||||
| Total short-term borrowed funds |
$ | 14,509 | $ | 7,042 | $ | 4,102 | ||||||
|
|
|
|
|
|
|
|||||||
| June 30, | December 31, | |||||||||||||||
| 2014 | 2013 | 2012 | 2011 | |||||||||||||
| (dollars in millions) | ||||||||||||||||
| Weighted-average interest rate at period end: |
||||||||||||||||
| Federal funds purchased and securities sold under agreements to repurchase |
0.12 | % | 0.09 | % | 0.10 | % | 0.06 | % | ||||||||
| Other short-term borrowed funds |
0.27 | 0.20 | 0.29 | 0.20 | ||||||||||||
| Maximum amount outstanding at month-end during the period: |
||||||||||||||||
| Federal funds purchased and securities sold under agreements to repurchase |
$ | 7,022 | $ | 5,114 | $ | 4,393 | $ | 6,406 | ||||||||
| Other short-term borrowed funds |
7,702 | 2,251 | 5,050 | 4,000 | ||||||||||||
| Average amount outstanding during the period: |
||||||||||||||||
| Federal funds purchased and securities sold under agreements to repurchase |
$ | 5,708 | $ | 2,400 | $ | 2,716 | $ | 3,808 | ||||||||
| Other short-term borrowed funds |
4,838 | 259 | 3,045 | 2,645 | ||||||||||||
| Weighted-average interest rate during the period: |
||||||||||||||||
| Federal funds purchased and securities sold under agreements to repurchase |
0.11 | % | 0.31 | % | 0.22 | % | 0.12 | % | ||||||||
| Other short-term borrowed funds |
0.26 | 0.44 | 0.33 | 2.51 | ||||||||||||
183
Table of Contents
We are the 13th largest retail bank holding company in the United States according to SNL Financial, with $130.3 billion of total assets as of June 30, 2014. Headquartered in Providence, Rhode Island, we deliver a comprehensive range of retail and commercial banking products and services to approximately five million individuals, institutions and companies. Our approximately 18,050 employees strive to meet the financial needs of customers and prospects through approximately 1,230 branches operated in an 11-state footprint across the New England, Mid-Atlantic and Midwest regions and through our online, telephone and mobile banking platforms. We have 90 retail and commercial non-branch offices located both in our geographic footprint and in nine states and the District of Columbia outside our branch footprint. Our 11-state branch banking footprint contains approximately 29.9 million households and 3.1 million businesses according to SNL Financial and our target is to maintain an overall business mix with approximately three-quarters concentrated within our footprint.
Business Segments
Through our two operating segments—Consumer Banking and Commercial Banking—we offer a broad set of banking products and services while providing local delivery and a differentiated customer focus. Because we operate in a highly competitive industry and believe that banking should have a personal touch, we have programs in place to train and prepare our employees to deliver a consistent, high-quality experience through every customer interaction. Furthermore, we seek to ensure that customers select us as their primary banking partner by taking the time to understand their banking needs, and we tailor our full range of products and services accordingly. To that end, our Consumer Banking value proposition is based on providing simple, easy to understand product offerings and a convenient banking experience with a more personalized approach. Commercial Banking focuses on offering a client-centric experience by leveraging an in-depth understanding of our clients’ and prospects’ businesses in order to proactively provide quality solutions through a broad range of products and services.
The following tables present certain financial information for our segments as of and for the six months ended June 30, 2014 and as of and for the year ended December 31, 2013:
| As of and for the Six Months Ended June 30, 2014 |
As of and for the Year Ended December 31, 2013 |
|||||||||||||||||||||||||||||||
| Consumer Banking |
Commercial Banking |
Other(1) | Consolidated | Consumer Banking |
Commercial Banking |
Other(1) | Consolidated | |||||||||||||||||||||||||
| (in millions) | ||||||||||||||||||||||||||||||||
| Total loans and leases and loans held for sale (average) |
$ | 46,876 | $ | 36,997 | $ | 4,527 | $ | 88,400 | $ | 45,106 | $ | 34,647 | $ | 6,044 | $ | 85,797 | ||||||||||||||||
| Total deposits and deposits held for sale (average) |
70,473 | 17,901 | 3,509 | 91,883 | 72,158 | 17,516 | 3,662 | 93,336 | ||||||||||||||||||||||||
| Net interest income |
1,083 | 520 | 38 | 1,641 | 2,176 | 1,031 | (149 | ) | 3,058 | |||||||||||||||||||||||
| Noninterest income |
455 | 214 | 329 | 998 | 1,025 | 389 | 218 | 1,632 | ||||||||||||||||||||||||
|
|
|
|
|
|
|
|
|
|
|
|
|
|
|
|
|
|||||||||||||||||
| Total revenue |
$ | 1,538 | $ | 734 | $ | 367 | $ | 2,639 | $ | 3,201 | $ | 1,420 | $ | 69 | $ | 4,690 | ||||||||||||||||
| Net Income (loss)(2) |
76 | 282 | 121 | 479 | 242 | 514 | (4,182 | ) | (3,426 | ) | ||||||||||||||||||||||
| (1) | Includes the financial impact of non-core, liquidating loan portfolios and other non-core assets and liabilities, our treasury activities, wholesale funding activities, securities portfolio, community development assets and other unallocated assets, liabilities, revenues, provision for credit losses and expenses not attributed to the Consumer Banking or Commercial Banking segments. For a description of non-core assets, see “Management’s Discussion and Analysis of Financial Condition and Results of Operation—Analysis of Financial Condition.” |
184
Table of Contents
| (2) | Includes a goodwill impairment charge of $4.4 billion ($4.1 billion after tax) in the second quarter of 2013. For more information, see “Management’s Discussion and Analysis of Financial Condition and Results of Operations—Results of Operations—Year Ended December 31, 2013 Compared with Year Ended December 31, 2012—Net Income (Loss),” Note 8 “Goodwill” to our audited consolidated financial statements and Note 5 “Goodwill” to our unaudited interim consolidated financial statements included elsewhere in this prospectus. |
Our History and Recent Strategic Initiatives
Our history dates back to High Street Bank, founded in 1828, which established Citizens Savings Bank in 1871. Citizens Savings Bank acquired a controlling interest in its founder by the 1940s, renaming the entity Citizens Trust Company. By 1981, we had grown to 29 branches in Rhode Island with approximately $1.0 billion of assets, and in 1988 we became a wholly owned subsidiary of the RBS Group. Over the following two decades, we grew substantially through a series of over 25 strategic bank acquisitions, including:
| • | In 1988, we acquired Fairhaven Savings Bank in Massachusetts, our first retail banking expansion beyond Rhode Island; |
| • | In 1996, we moved beyond southern New England when RBS and Bank of Ireland combined their New England banking operations through the merger of Citizens and First NH Bank in New Hampshire; |
| • | In 1999 and 2000, we acquired the commercial banking group of State Street Corporation and Boston-based UST Corporation, including its U.S. Trust branches in the Boston area; these acquisitions doubled the size of our Massachusetts operations and made us New England’s second-largest bank, with more than $30.0 billion in assets; |
| • | In 2001, we acquired the regional banking business of Mellon Financial Corporation, which included $14.4 billion in deposits, expanding our retail network outside of New England to Pennsylvania, Delaware and New Jersey; and |
| • | In 2004, we completed the largest transaction in our history by acquiring Charter One, which operated approximately 680 branches in nine states, and had $41.3 billion in assets, and expanded our branch footprint into New York, Vermont, Michigan, Ohio, Illinois and Indiana. |
These acquisitions greatly expanded our footprint throughout New England and into the Mid-Atlantic and the Midwest, transforming us from a local retail bank into one of the largest retail U.S. bank holding companies with nearly $170.0 billion in assets at the start of the global financial crisis. Following this period of expansion and the subsequent global financial crisis, we took a number of decisive steps to begin repositioning and strengthening our business profile, including:
| • | Transformed business mix: Refocused our efforts to transform our business model toward a more balanced and diversified platform with a greater emphasis on higher-growth, higher-return businesses. As of June 30, 2014, we had expanded the contribution of Commercial Banking relative to Consumer Banking to approximately 44% and 56% of the loans in our operating segments, respectively, as compared to 36% and 64%, respectively, as of December 31, 2009; |
| • | Improved deposit mix: Increased lower cost and more stable demand, checking, money market and savings accounts to 89% from 74% of total deposits at June 30, 2014 compared to December 31, 2009. This improvement in our core deposit funding mix, as well as our efforts to aggressively lower the rates paid on our time deposits, resulted in a more beneficial cost of total deposits, which decreased to 0.16% for the first half of 2014 from 0.23% for the year ended December 31, 2013 and 1.32% for the year ended December 31, 2009; |
| • | Reduced reliance on wholesale funding: Since the start of the financial crisis in 2009, we have aggressively worked to reduce the higher cost wholesale funding component of our balance |
185
Table of Contents
| sheet. We reduced wholesale borrowings from $23.7 billion as of December 31, 2009 to $16.2 billion as of June 30, 2014, and as of that date the balances were principally lower cost, more stable secured Federal Home Loan Bank and repurchase agreement borrowings; |
| • | Improved strategic focus: Identified and began running down certain non-core assets deemed to be inconsistent with our strategic goals, generally as a result of geographic location, industry, product type or risk level. The non-core portfolio decreased to $3.5 billion at June 30, 2014 from $20.5 billion when it was designated on June 30, 2009; |
| • | Optimized our geographic footprint: Exited certain geographies where we had underperforming market share positions and redeployed the capital into businesses with more attractive growth and return characteristics. In 2008, we sold 18 branches in the New York Adirondacks region, and in 2009, we sold our Indiana branch franchise, which consisted of 65 branches. In 2012, we sold 57 mostly in-store branches in Long Island and Westchester County, New York, and on June 20, 2014, we closed the sale of our 103 Chicago retail branches along with certain assets and deposits. Additionally, we have routinely sought to optimize the branch footprint through a process of consolidation and rationalization, which has resulted in the closure of another 232 branches since the beginning of 2009; |
| • | Refined our branch service delivery model: Proactively addressed evolving consumer preferences for banking interactions through expansion of alternative distribution channels. We have reduced our branch footprint while building out self-service channels through online and mobile banking, including remote deposit capture and person-to-person payments. Our mobile banking channel has experienced rapid growth with a 40% increase in active mobile customers since year-end 2012. We have continued to optimize the distribution network by migrating staffing in our branches toward a universal banker model, which involves training bankers to handle both teller and traditional banker functions, with a goal of further improving the efficiency of our network and allowing frontline employees to become more sales and solutions oriented; and |
| • | Increased infrastructure investment: Invested more than $1.0 billion in infrastructure and technology from 2009 to year end 2013, with an additional $250 million planned for each of 2014 and 2015. These investments, which are designed to lower our costs and improve our customer experience, include significant programs to enhance our information technology resiliency, upgrade customer-facing technology and streamline operations. Significant investments included the 2013 launch of our new teller system, new commercial loan platform and new auto loan platform and the 2013 upgrade of the majority of our ATM network, including by equipping more than 1,450 ATMs with advanced deposit-taking functionality. These investments also involved spending to prepare for the planned rollout of our new mortgage platform. |
These steps have helped provide a strong foundation for our ongoing transformation from a wholly owned subsidiary of a global financial group into a stand-alone U.S. regional bank. We have brought together a seasoned management team with an average of over 20 years of banking experience at large international financial institutions. The team was bolstered by the May 2013 announcement of Bruce Van Saun’s appointment as our Chairman and CEO. The team is focused on delivering improved returns, through implementation of growth and efficiency initiatives, along with a more disciplined allocation of capital and resources. This performance-driven culture is designed to enhance our competitiveness by rigorously analyzing the risk-return profiles of our diversified businesses and selectively investing in those that are well positioned to gain market share, improve efficiency and generate long-term growth and sustainable profitability. In prior years many of our strategies around risk management, capital and investments were heavily influenced by our status as a subsidiary of a larger global financial institution.
186
Table of Contents
Customer Focus
The focus on performance is complementary to our historic “credo,” which centers on delivering for customers, colleagues and communities. Ensuring that we are serving customers well, in a superior and differentiated fashion relative to peers, remains key to delivering long-term franchise value. As a result of our commitment to serving customers, Money magazine named our banking subsidiaries in its 2013 list of “The Best Banks in America,” and our Commercial Banking middle market business also received a number one rank from Greenwich Associates in key client survey scores compared to the top four competitors in our footprint across a number of categories, including Overall Lead Client Satisfaction. We strive to develop stronger and higher value customer relationships through an intense focus on delivering a differentiated experience across all of our distribution platforms, including our online, telephone and mobile banking platforms. We expect this focus to continue to drive improved customer loyalty across our businesses and distinguish us from our competitors. We believe this approach will enable us to win, retain and expand customer relationships, as well as increase cross-sell and share of wallet penetration across our business segments.
Our Competitive Strengths
Our long history of operations, through a range of challenging economic cycles, forms the basis for our competitive strengths. From our community bank roots, we bring a commitment to strong customer relationships, local service and an active involvement in the communities we serve. Our acquisitions enabled us to develop material scale in highly desirable markets and broad product capabilities. The actions taken since the global financial crisis have resulted in a business model with solid asset quality, a stable core deposit mix and a superior capital position. In particular, we believe that the following strengths differentiate us from our competitors and provide a strong foundation from which to execute our strategy to deliver enhanced growth, profitability and returns.
| • | Significant Scale with Strong Market Penetration in Attractive Geographic Markets: We believe our market share and scale in our footprint is central to our success and growth. With approximately 1,230 branch and 90 non-branch offices, approximately 3,215 ATMs and 18,050 employees, as well as our online, telephone and mobile banking platforms, we serve more than five million individuals, institutions and companies. As of June 30, 2013, we ranked second by deposit market share in the New England region and in the top five in nine of our key metropolitan statistical areas, or MSAs, including Boston, Providence, Philadelphia, Pittsburgh and Cleveland, according to SNL Financial. We believe this strong market share in our core regions, which have relatively diverse economies and affluent demographics, will help us achieve our long-term growth objectives. The following table sets forth information regarding our competitive position in our principal MSAs. |
| MSA |
Total Branches |
Deposits ($ in Millions) |
Market Rank(1) |
Market Share (%)(1) |
||||||||||||
| Boston, MA |
212 | $ | 28,343 | 2 | 16.4 | % | ||||||||||
| Philadelphia, PA |
188 | 17,012 | 4 | 8.1 | ||||||||||||
| Providence, RI |
100 | 12,854 | 1 | 34.6 | ||||||||||||
| Pittsburgh, PA |
131 | 7,130 | 2 | 8.8 | ||||||||||||
| Detroit, MI |
95 | 4,563 | 6 | 4.6 | ||||||||||||
| Cleveland, OH |
64 | 4,105 | 5 | 7.9 | ||||||||||||
| Manchester, NH |
28 | 4,014 | 1 | 38.7 | ||||||||||||
| Albany, NY |
29 | 1,590 | 4 | 7.1 | ||||||||||||
| Buffalo, NY |
43 | 1,573 | 4 | 4.8 | ||||||||||||
| Rochester, NY |
34 | 1,540 | 4 | 10.3 | ||||||||||||
| (1) | Source: FDIC, June 2013. Excludes “non-retail banks” as defined by SNL Financial. See “Certain Important Information.” |
187
Table of Contents
| • | Strong Customer Relationships: We focus on building strong customer relationships by delivering a consistent, high quality level of service supported by a wide range of products and services. We believe we provide a distinctive customer experience characterized by the personal touch of a local bank with the product selection of a larger financial institution. Our Consumer Banking cross-sell efforts have improved to 4.9 products and services per retail household as of June 30, 2014 compared to 4.2 products and services as of December 31, 2009. Additionally, Consumer Banking improved overall customer satisfaction as measured by J.D. Power and Associates by 5% from 2012 to 2013, while the industry average score improved by 3% during the same period. Our ability to provide a unique customer experience is also evidenced by our Commercial Banking middle market team ranking among the top five in customer and lead bank penetration, with a 10% market penetration in our footprint based on Greenwich Associates’ rolling four-quarter data as of June 30, 2014. |
| • | Stable Base of Core Deposits: We have a strong funding profile, with $91.7 billion of total deposits as of June 30, 2014, consisting of 29% in noninterest-bearing deposits and 71% in interest-bearing deposits. Noninterest-bearing deposits provide a lower-cost funding base, and we grew this base to $26.7 billion at June 30, 2014, up 40% from $19.0 billion at December 31, 2009. For the six months ended June 30, 2014, our total average cost of deposits was 0.16%, down from 0.23% in 2013, 0.40% in 2012 and 1.32% in 2009. |
| • | Superior Capital Position: We are among the most well capitalized large regional banks in the United States, with a Tier 1 common equity ratio of 13.3% as of June 30, 2014, ranking highest among peer regional banks, which had an average Tier 1 common equity ratio of 10.3% at that date, according to SNL Financial. Our Common Equity Tier 1 ratio at June 30, 2014 under Basel III rules was 13.0% (on a fully phased-in basis). Our strong capital position provides us the financial flexibility to continue to invest in our businesses and execute our strategic growth initiatives. Through recent capital optimization efforts we have sought to better align our Tier 1 common equity capital base with peer regional banking organizations, while maintaining a solid total capital position, by reducing Tier 1 common equity capital and increasing other Tier 1 and Tier 2 capital. On August 1, 2014, we exchanged $333 million of Tier 1 common equity for Tier 2 subordinated debt, and we plan to continue our strategy of capital optimization by issuing to RBS $334 million of preferred stock and concurrently repurchasing $334 million of shares of our common stock from RBS in the fourth quarter of 2014, subject to regulatory approval and assuming completion of this offering. Pro forma for these exchanges, our Tier 1 common equity ratio would have been 12.6% as of June 30, 2014. See “Our Relationship with the RBS Group and Certain Other Related Party Transactions—Relationship with the RBS Group—Other” for further details of the planned fourth quarter exchange transaction. We plan to repurchase approximately $500 million of shares of our common stock and $250 million of shares of our common stock in 2015 and 2016, respectively, with proceeds from the issuance of subordinated debt or another lesser form of capital, subject to regulatory approval. |
| • | Solid Asset Quality Throughout a Range of Credit Cycles: Our experienced credit risk professionals and conservative credit culture, combined with centralized processes and consistent underwriting standards across all business lines, have allowed us to maintain strong asset quality through a variety of business cycles. As a result, we weathered the global financial crisis better than our peers: for the two-year period ending December 31, 2009, net charge-offs averaged 1.63% of average loans compared to a peer average of 1.76% according to SNL Financial. More recently, the credit quality of our loan portfolio has continued to improve; nonperforming assets as a percentage of total assets were 0.95% at June 30, 2014, compared to 1.20% and 1.55% as of December 31, 2013 and 2012, respectively. Net charge-offs declined substantially to an annualized 0.36% of average loans in the six months ended June 30, 2014 versus 0.60% for the six months ended June 30, 2013. Our allowance for loan and lease losses was 1.36% of total loans at June 30, 2014. We |
188
Table of Contents
| believe the high quality of our loan portfolio provides us with significant capacity to prudently seek to add more attractive, higher yielding risk-adjusted returns while still maintaining appropriate risk discipline and solid asset quality. |
| • | Experienced Management Team Supported by a High-Performing, Talented Workforce: Our leadership team of seasoned industry professionals is supported by a highly motivated, diverse set of managers and employees committed to delivering a strong customer value proposition. Our highly experienced and talented executive management team, whose members have more than 20 years of banking experience on average, provide strong leadership to deliver on our overall business objectives. We have recently made selective additions to our management team and added key business line leaders, including the Head of Distribution and Head of Everyday Banking in Consumer Banking, as well as the Head of Technology Banking and Head of Loan Trading for Commercial Banking. Bruce Van Saun, who was announced as our Chairman and CEO in May 2013, has more than 30 years of financial services experience including four years as the RBS Group Finance Director. Earlier in his career, Mr. Van Saun held a number of senior positions at The Bank of New York Mellon, Deutsche Bank, Wasserstein Perella Group and Kidder Peabody & Co. |
| • | Commitment to Communities: Community involvement is one of our principal values and we strive to contribute to a better quality of life by serving the communities across our footprint through employee volunteer efforts, a foundation that funds a range of non-profit organizations and executives that provide board leadership to community organizations. These efforts contribute to a culture that seeks to promote positive employee morale and provide differentiated brand awareness in the community relative to peer banks, while also making a positive difference within the communities we serve. Employee engagement increased during 2013 as highlighted by a 27% increase in employee volunteerism to more than 76,000 hours companywide. In addition, employees serve on approximately 480 community boards across our footprint. We believe our strong commitment to our communities provides a competitive advantage by strengthening customer relationships and increasing loyalty. |
Business Strategy
Building on our core strengths, we intend to become a top-performing regional bank as viewed through the lenses of our five major stakeholders: customers, investors, regulators, colleagues and communities. We have identified a series of fundamental strategic initiatives designed to maximize the full potential of our business and drive sustainable growth and enhanced profitability. The core measure of our success in executing our strategic initiatives will be our ability to deliver higher ROTCE. We aim for our strategic initiatives to increase our ROTCE from 5% in 2013, excluding our $4.1 billion after-tax goodwill impairment charge, to a run-rate target of greater than 10% over a two- to three-year period.3 We plan to accomplish this goal through: (a) driving revenue growth in both the Consumer Banking and Commercial Banking segments; (b) enhancing cost reduction efforts across the company; (c) leveraging capital actions aimed at better aligning our capital structure with those of regional bank peers; and (d) the beneficial impact of a rising interest rate environment on our asset-sensitive balance sheet. We also expect these efforts to result in a targeted run-rate efficiency ratio (noninterest expense divided by the sum of net interest income and noninterest income) in the 60% range over a two- to three-year period.
| • | Revenue Growth: We are committed to generating profitable revenue growth in a disciplined manner by placing greater emphasis on reallocating resources toward businesses that we believe will further increase and diversify our revenue base in order to deliver more attractive |
| 3 | For information regarding the calculation of ROTCE and efficiency ratio, see “Management’s Discussion and Analysis of Financial Condition and Results of Operation—Principal Components of Operations and Key Performance Metrics Used By Management—Key Performance Metrics and Non-GAAP Financial Measures.” |
189
Table of Contents
| risk-adjusted returns to stockholders. As such, a key component of our strategy to further improve our operating results is focused around prudently growing higher-return earning assets and identifying and capitalizing on more fee income opportunities. We plan to invest more than $70 million in business initiatives in 2014, the financial benefits of which we expect to begin realizing in a two- to three-year period. |
Increasing Loan Origination—We will seek to prudently expand our balance sheet and drive increased loan origination volume by hiring more than 550 sales professionals in mortgage, small business and auto, as well as by building out our commercial industry focused teams and through increased loan origination volume in mid-corporate and franchise finance over a two- to three-year period.
| • | In mortgage, we are repositioning our origination platform through increased hiring of additional mortgage loan officers over the next two to three years and increasing capacity through the launch of a new origination and processing platform in the second half of 2014. In addition, we will continue to purchase high-quality mortgage assets in the secondary market through a targeted program. |
| • | We expect to accelerate growth in our auto loan portfolio both organically and through loan purchases. Over the past three years we have increased our auto finance representatives by approximately 65%, which has underpinned the expansion of our dealer network from approximately 3,500 to more than 6,500 over the same time period. |
| • | In Commercial Banking, we will continue to build out our industry focused teams where, for example, our Healthcare and Technology efforts have resulted in business line net operating income growth of over 50% since 2011. We are successfully recruiting respected industry leaders to bolster our expertise, adding more dedicated resources, and evaluating other specialties such as aerospace, chemicals and energy. |
| • | We are extending our origination efforts nationally in the mid-corporate space, which is focused on serving larger, mostly public clients with annual revenue of more than $500 million. We are selectively expanding geographically where our established expertise and product capabilities can be relevant. The national expansion, launched in the third quarter of 2013, has already added over $330 million of new loans outstanding as of June 30, 2014, and we are in the process of adding approximately 20 new, dedicated employees to accelerate our progress. |
| • | Finally, our franchise finance business is expanding its target market to include additional strong national and regional brands, large and up-and-coming restaurant operating companies and expansion of gas station and convenience dealer penetration. |
Focus on Higher Return Assets—Given our scale, expertise and current geographic reach, we believe we are well positioned to further diversify our asset base by prudently seeking higher yielding risk-adjusted assets with a more balanced mix of commercial and consumer loans and appropriate risk discipline.
| • | We continue to invest in attractive markets with higher return profiles, including expansion of our healthcare and technology verticals, where we can utilize our in-depth industry knowledge. |
| • | We have increased our commitment to selectively serve the leveraged loan market, which rests on our strengthened capital markets capabilities. |
| • | In October 2013, we deployed a fully automated auto loan origination platform with more sophisticated pricing and credit underwriting capabilities that will enable us to prudently originate more attractive risk-adjusted return assets. |
190
Table of Contents
| • | We continue to improve our private student lending platform, which we believe is well positioned for growth and includes an education refinance product that is unique in our footprint and serves a critical borrower need. |
Driving Additional Fee Income—We also intend to transition to a more balanced revenue profile by taking steps to further grow our noninterest income base and reduce our overall reliance on net interest income.
| • | We expect to drive increased growth in Wealth Management by expanding our advisor sales force where we expect to hire approximately an additional 100 financial consultants and premier bankers, while also training and licensing a number of existing bankers to sell investment products. |
| • | We expect to continue to expand our capital markets product and service offerings in order to generate higher fee income. |
| • | With respect to our cash management services, we are in the final stages of a multi-year investment of over $80 million in domestic cash products and services that will improve the breadth and depth of our product offering. Overall, our improvements support a holistic approach to working capital management via cash management, card and trade products. We have built out a targeted sales model for commercial cards where we have recently added six employees to the team dedicated to card sales and program utilization. |
Our target is to increase our run-rate ROTCE over a two- to three-year period by approximately 160 to 200 basis points through these revenue growth initiatives.
| • | Cost Initiatives: We are focused on streamlining our processes and improving our cost structures. As a result of the initiative launched in late 2013 to improve efficiency and effectiveness, we expect to generate aggregate annualized expense savings of approximately $200 million over a two- to three-year period. These savings include reductions in salaries and employee benefits ($120 million), lower occupancy expenses ($20 million), and streamlining operations in other areas ($60 million). We expect that this initiative will reduce our employee base by approximately 470 net employees, including the effect of our adding approximately 1,330 loan officers, relationship managers and others to support growth initiatives. Noninterest expense savings from this initiative are targeted to benefit our run-rate ROTCE in a two- to three-year period by approximately 90 to 100 basis points and to achieve a targeted efficiency ratio in the 60% range.4 |
| • | Reduction of Tier 1 Common Equity Ratio: Given the elevated level of common equity in our capital structure compared to peers, we intend to continue to pursue various capital actions, subject to regulatory approval, that are expected to reduce our Tier 1 common equity ratio to a level that is more consistent with that of other peer regional banks. We expect lower levels of tangible common equity to facilitate a 70 to 80 basis point improvement to our run-rate ROTCE over a two- to three-year period. |
| • | Rising Interest Rate Environment: Net interest income growth has been challenged by the relatively persistent low interest rate environment. We remain well positioned for a rising rate environment, which would be beneficial to our net interest margin because our asset sensitive balance sheet would react favorably to an increase in both short-term and long-term rates. As of June 30, 2014, the estimated impact on our net interest income over the next twelve months based on a 200 basis point gradual increase in rates would be 6.6%. See “Management’s |
| 4 | For information regarding the calculation of ROTCE and efficiency ratio, see “Management’s Discussion and Analysis of Financial Condition and Results of Operation—Principal Components of Operations and Key Performance Metrics Used By Management—Key Performance Metrics and Non-GAAP Financial Measures.” |
191
Table of Contents
| Discussion and Analysis of Financial Condition and Results of Operations—Risk Governance and Quantitative and Qualitative Disclosures About Risk—Market Risk—Non-Trading Risk” for further details. Based on management’s expectations, which utilized the market implied forward rates based on the yield curve as of February 28, 2014, the benefit to our net interest income from a gradually rising rate environment would be expected to increase our run-rate ROTCE over a two- to three-year period by 130 to 160 basis points. |
The bullets above are not intended as an exhaustive presentation of factors that will affect our medium term ROTCE. We also anticipate a benefit to our ROTCE over the next two to three years from runoff of our non-core portfolio and existing pay-fixed interest rate swaps, which we expect to be offset by the negative impact on our medium term ROTCE of some deterioration in the credit environment to historical levels and a decline in gains on investments in securities.
While our ROTCE target and its components are presented with numerical specificity, and we believe such targets to be reasonable as of the date of this prospectus, given the uncertainties surrounding our assumptions, including possible regulatory restrictions on activities we intend to pursue, there are significant risks that these assumptions may not be realized and thus our goals may not be achieved. Accordingly, our actual results may differ from these targets and the differences may be material and adverse, particularly if actual events adversely differ from one or more of our key assumptions. Our ROTCE targets and the related underlying assumptions are forward-looking statements. We strongly caution investors not to place undue reliance on any of these assumptions or targets. Except as may be required by applicable securities laws, we are not under any obligation (and expressly disclaim any obligation) to update or alter any assumptions, goals, targets, projections or other related statements that we may make. See “Special Note Regarding Forward-Looking Statements” and “Risk Factors,” including “Risk Factors—Our ability to implement our strategic plan and achieve our indicative performance targets requires us to increase our revenue from existing sources, find additional sources of revenue and reduce and control our costs. Because our strategic plans and indicative performance targets are based on assumptions regarding the future, including regarding matters that are beyond our control, there are significant risks that these assumptions may not be realized and thus our goals may not be achieved” for additional information regarding these forward-looking statements. For information regarding the calculation of ROTCE, see “Management’s Discussion and Analysis of Financial Condition and Results of Operation—Principal Components of Operations and Key Performance Metrics Used By Management—Key Performance Metrics and Non-GAAP Financial Measures.”
Consumer Banking Segment
Consumer Banking serves retail customers and small businesses with annual revenues of up to $25 million through a network that as of June 30, 2014 included approximately 1,230 branches operated in an 11-state footprint across the New England, Mid-Atlantic and Midwest regions, as well as through online, telephone and mobile banking platforms. We have an intense focus on winning, expanding and retaining customers through our Consumer Banking value proposition: “Simple. Clear. Personal.” We believe that offering a wide range of straightforward and understandable banking products and services to customers and prospects, coupled with personal customer service, will enable us to drive enhanced customer loyalty. This commitment to our customers led us to introduce a major operational initiative in 2013: Bank Better, a companywide approach to enhancing the banking experience for our customers. Comprising dozens of individual initiatives ranging from improved customer communications to upgrades of both customer-facing and customer-supporting technology, we announced Bank Better in December 2013.
Consumer Banking is committed to delivering a differentiated experience with a focus on customer convenience and service. We continue to strive to optimize the effectiveness of our distribution
192
Table of Contents
channels in order to adapt to increasing customer preferences for self service banking capabilities and decreasing demand for branch-based services similar to the universal banker model we introduced in January 2013. As a result of our commitment to serving our customers and making improvements in our infrastructure, Money magazine named our banking subsidiaries in its 2013 list of “The Best Banks in America.” The magazine noted our robust branch and ATM presence, our extended branch hours, and supermarket branch presence with seven-day-a-week service. In addition, we were recently named as the best bank in the U.S. for consumers in the baby boomer generation, according to a study by financial advice website GoBankingRates.com. We have increased our share of wallet penetration to 33% of deposit households also having a consumer loan with us, 68% of checking households utilizing direct deposit and 17% utilizing online bill pay as of June 30, 2014 compared to 23%, 59% and 13%, respectively, as of December 31, 2009. Consumer Banking accounted for $47.2 billion, or 56%, of the loans in our operating segments as of June 30, 2014.
Consumer Banking is organized as follows:
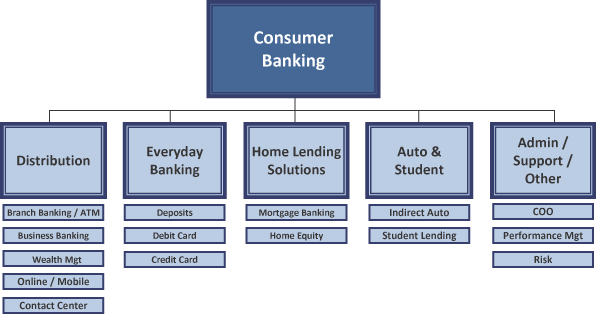
Distribution: As of June 30, 2014, our multi-channel distribution system included a network of approximately 1,230 branches, of which 356 were in-store locations, as well as approximately 3,215 ATMs and a workforce of banking specialists ranging from financial consultants and business banking officers to private bankers. Our ATM network includes both owned and branded sites, some of which are located in gas stations, convenience stores and other retail outlets. Our digital platform provides online and mobile capabilities which continue to improve the deployment of banking applications for both Android and Apple smartphones and iPads. This platform provides our customers the convenience of paying bills, transferring money between accounts and from person to person, in addition to a host of other everyday transactions. As of June 30, 2014, we had 1.7 million online banking customers and 549,000 active mobile customers. Lastly, our customer contact center handles approximately 10 million calls annually, providing our customers with extended access to our services.
We continue to focus on improving customer convenience while also optimizing our distribution model. In an effort to better align our distribution channels with evolving customer banking preferences, we closed more than 30 low-performing branches in 2013 and expect to continue to consolidate and reformat a number of branches over the next several years based on market opportunities and
193
Table of Contents
evolving customer preferences. We rolled out a new teller platform system across the network in 2013 which both expands customer convenience by providing secure, paperless transaction options at the branch, including debit card identification and simple, easy-to-read receipts, while also creating back office efficiencies. With our rollout of more than 1,450 enhanced ATMs we offer our customers the ability to receive expanded funds availability. Finally, we plan to test new low-cost and highly automated or sales-focused formats in our network to further address the changing preferences of consumers.
Everyday Banking: Provides customers with deposit and payment products and services, including checking, savings, money market, certificates of deposit, debit cards, credit cards and overdraft protection. We have over 1.4 million active debit cards issued and over 630,000 credit cards; 24% of our deposit customers now have a credit card relationship with us, more than double the percentage at the beginning of 2009. This was achieved by instituting more focused cross selling efforts in our branch network, which generates substantially all of our credit card origination volume. The division also actively manages the overall deposit portfolio, and since 2009 we have considerably improved our deposit costs from 1.32% to 0.23% in 2013 and 0.16% for the six months ended June 30, 2014. This was done by instituting more disciplined pricing practices and the winding down of “non-core,” higher cost deposits in the portfolio. In addition, recent product innovation efforts have focused on responding to customer preferences for banking products that are straightforward and easy to understand. As a result, in January 2014 we launched our new One Deposit Checking product which offers a simple and transparent fee structure—no monthly maintenance fee with one deposit of any amount each statement cycle—and our new $5 Overdraft Pass, which allows our customers to overdraw their checking and money market accounts without incurring an overdraft fee if the overdraft item is $5 or less.
Business Banking: Serves small and medium enterprise businesses with annual gross revenue of up to $25 million through a combination of branch-based employees, Business Banking officers and relationship managers. As of June 30, 2014, the team served approximately 330,000 customers with loans outstanding of $3.0 billion and deposit balances of $12.7 billion. We plan to continue to grow our sales force of approximately 330 bankers to over 400 over the next few years, as well as improve our lending infrastructure, expand our credit policy and redesign our Small Business Administration, or SBA program.
Wealth Management: Provides a full range of advisory services to clients with an array of banking, investment and insurance products and services through a sales force of more than 400 financial consultants and private/premier bankers. Through the Premier Banking program, we provide clients that have estimated investable assets of $500,000 to $2 million with a complete range of wealth management solutions, including financial planning, private banking, investment management and trust services. Our Premier Banking program is currently available in Massachusetts, Rhode Island, Connecticut, New Hampshire, Michigan, Ohio, Philadelphia and Pittsburgh with expansion plans in 2014 and 2015 into other areas of the franchise. Since 2011, Premier Banking households have grown from 12,000 to 46,000. In addition to Premier Banking, we also have a Private Bank focused on individuals with over $2 million in investable assets. We offer tailored solutions to meet the lending, trust, investment and banking needs of our Private Banking clients. As of June 30, 2014, wealth management had approximately $4.2 billion in assets under management and more than $18.0 billion in investment brokerage assets.
Home Lending Solutions (HLS): Offers home equity loans, HELOCs and residential mortgages. We serve customers primarily in our 11-state footprint and select out-of-footprint states through both the branch network, a direct to consumer call center and a mortgage loan officer base of 366 as of June 30, 2014. Home equity originations are sourced almost exclusively through our branch network and, based on first quarter 2014 originations, we ranked in the top five in all of our 10 largest markets
194
Table of Contents
for HELOCs based on data provided by Equifax. In addition, we ranked sixth nationally in HELOCs by outstanding balances as of June 30, 2014, according to SNL Financial. The home equity portfolio is conservatively underwritten with a refreshed average loan to value of 66% and a refreshed average FICO score of 765. Our mortgage business has grown from an unranked position to a position of relevance over the last four years, ranking 27th nationally among retail originators as reported by Inside Mortgage Finance for the first quarter of 2014. This new mortgage business is also conservatively underwritten with an average FICO of 765 and average loan to value of 70%. The business continues to focus on growing its sales force and improving back office efficiencies and is currently implementing a new origination platform designed to streamline our fulfillment process, enhance productivity and decrease the time from application to close, which is a key driver of customer satisfaction.
Indirect Auto Finance: Provides financing for the purchase of both new and used vehicles through a network of over 6,500 automotive dealerships in 43 states as of June 30, 2014, compared to just over 3,400 dealers in 23 states at December 31, 2010. As of June 30, 2014, we ranked 12th nationally among regulated depository institutions, and, in terms of first quarter 2014 originations, we ranked in the top five in seven of our top 10 markets according to Autocount. The average FICO score for first half 2014 originations was 759, compared to an average FICO score of 769 for 2013 originations, and the mix between new and used cars financed was 63% and 37%, respectively. In addition to expanding the geographic footprint of our business, we implemented a new origination platform in October 2013 that has facilitated more granular credit and pricing strategies which will enable us to optimize risk-adjusted returns. Our underwriting strategy, which has historically focused on super-prime, continues to focus on high quality borrowers through a prudent expansion of originations across a broader credit spectrum to include predominantly prime auto loans. As a result, we have been able to increase organic originations and have entered into a flow purchase agreement with a third party to accelerate our move into the prime space. The minimum weighted average FICO score for loans purchased under the flow purchase agreement is 705. For more information regarding this flow purchase agreement, see “Management’s Discussion and Analysis of Financial Condition and Results of Operations—Recent Events.”
Student Lending: Offers a variety of student loan products including the TruFit Student Loan program, which features no origination, application or disbursement fees, competitive rates and a choice of repayment options. We launched education finance in 2009 and have expanded to partner with over 1,200 higher education schools in all 50 states, which resulted in loan origination volume more than doubling to $253 million in 2013 from $112 million in 2010. Loan origination volume was $147 million during the first six months of 2014. In 2013, 96% of our private student loan originations had co-signors and approximately 75% of our borrowers had a FICO score above 750. In January 2014, we launched an Education Refinance Loan product, which is a loan solution for students that have graduated from college or graduate school and are looking to refinance or consolidate private student loan debt.
Commercial Banking Segment
Commercial Banking primarily targets companies and institutions with annual revenues of $25 million to $2.5 billion and strives to serve as the lead bank for its clients with multi-product, long-term, profitable relationships, driven by proactively delivering compelling financial solutions with quality execution and an emphasis on building long-term relationships. While activity is concentrated within the 11-state footprint, Commercial Banking pursues business opportunities nationally on a targeted basis.
We believe our Commercial Banking segment provides a compelling value proposition for our clients as evidenced by our Greenwich Associates’ top five ranking in both client penetration and number of lead relationships in middle market banking within our footprint based on rolling four-quarter
195
Table of Contents
data as of June 30, 2014. In addition, we strengthened our market share in loan syndications from 25th by volume of syndicated loans and 18th by number of syndicated loans in 2010 to 10th by volume and 9th by number in the first half of 2014, according to the Thomson Reuters overall national middle market bookrunner league table. Commercial Banking accounted for $37.5 billion, or approximately 44%, of the loans in our operating segments as of June 30, 2014, up significantly from 36% as of December 31, 2009.
Commercial Banking is composed of lines of business, as well as product groups. The Corporate Finance & Capital Markets and the Treasury Solutions product groups support all lines of business in Commercial Banking. These business lines and product groups work in teams to understand and determine client needs and provide comprehensive solutions to meet those needs. New clients are acquired through a coordinated approach to the market ranging from leveraging deep industry knowledge in specialized banking groups to deploying a regional coverage approach for middle market businesses with targeted profiles that are headquartered in our branch geographic footprint. Complementing these direct, field-based origination activities are telephone and e-marketing-based lead generation programs.
Commercial Banking is organized as follows:
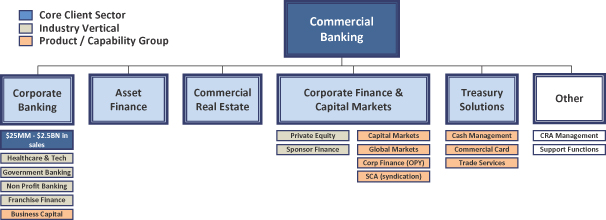
Corporate Banking: Targets domestic commercial and industrial clients, serving middle-market companies with annual gross revenues of $25 million to $500 million and mid-corporate companies with annual revenues of $500 million to $2.5 billion. It offers a broad range of products, including lines of credit, term loans, commercial mortgages, domestic and global treasury management solutions, trade services, interest rate products and foreign exchange, providing an average revenue mix of approximately 70% interest income and 30% fee income. Loans are extended on both a secured and unsecured basis, according to the credit profile of the client, and substantially all loans are floating rate loans at varying spreads over LIBOR. The average tenor of our commercial loans varies according to market conditions but currently stands at 3.4 years. Corporate Banking is a general lending practice, but is augmented by an expanding number of specialty lending groups targeting U.S. subsidiaries of foreign corporations, technology companies, government entities, including state governments, counties, municipalities, public schools, trustees, commissions, authorities and districts throughout New England; healthcare companies; not-for-profit and educational institutions throughout the footprint; security alarm companies; and professional firms, including legal, accounting and consulting firms, private trustees, family offices, title insurance companies and real estate investment trusts; Franchise Finance, providing financing to restaurant companies, convenience stores and gas stations on a national basis and Business Capital (asset based lending). The portfolio is well diversified with over 4,000 commercial relationships and approximately $40.0 billion in commitments. The
196
Table of Contents
weighted-average credit profile of Corporate Banking’s mid-corporate clients is a low investment grade equivalent, while the middle market is a near investment grade equivalent.
Asset Finance: Offers loan and tax- and non-tax-oriented leases, with an average term of approximately six-and-a-half years and a maximum term of 20 years for long-lived assets such as rail cars. The team also offers equipment financing term loans for middle market and mid-corporate companies located in our branch footprint, as well as Fortune 500 companies throughout the United States. All transactions are secured by the assets financed, commitments tend to be fully drawn and most leases and loans are fixed rate. Areas of industry specialization include energy, utilities and chemicals. We also deploy dedicated teams to financing corporate aircraft. Fee income is related to operating lease income, syndications fees and equipment/residual gains.
Commercial Real Estate: Provides customized debt capital solutions for middle market and institutional developers and investors as well as real estate investment trusts (REITs). We provide financing for projects in the office, multi-family, industrial, core retail, healthcare and hospitality sectors. Loan types include construction financing, term debt and lines of credit. Most loans are secured by commercial real estate properties and all are non-owner occupied. Any owner-occupied commercial real estate would be originated through our Corporate Banking business. REIT credit facilities are typically unsecured but based upon an advance formula on unlevered real estate holdings. Portfolio concentrations consist of 25% office, 27% multi-family, 18% retail, 6% industrial, 5% hospitality and 7% healthcare as of June 30, 2014. Our prudent credit underwriting standards and sound risk management practices, along with the benefit of improved economic conditions, resulted in a net recovery (i.e., recoveries exceeding charge-offs) of 4 basis points for the six months ended June 30, 2014. In addition, nonaccrual loans have declined by over 80% from year-end 2010 and net income has increased by more than 300%.
Corporate Finance & Capital Markets: The product groups include debt capital markets, corporate finance, strategic client acquisitions, foreign exchange and interest rate risk management services and financial advisory and equity capital markets services under a referral agreement with Oppenheimer & Co., Inc. (Oppenheimer). The lines of business include the centralized leveraged finance team, which provides leveraged financing solutions; the private equity team, which serves the unique and time-sensitive needs of private equity firms, management companies and funds; and the sponsor finance team, which provides acquisition and follow-on financing for new and recapitalized portfolio companies. Since 2010, we have dedicated a substantial amount of time and resources to building our capital markets capabilities. We have added key hires with capital markets, leveraged finance and loan syndication expertise to enhance our ability to provide thoughtful and timely advice to clients.
| • | Capital Markets originates, structures and underwrites multibank credit facilities. We target middle market, mid-corporate and private equity sponsors with a focus on offering value-added ideas to optimize their capital structure. We are able to originate and distribute senior and second lien debt through our sales desk and work with RBS to originate investment grade and high yield bonds along with convertible debt. Additionally, Capital Markets has expanded its loan sales capabilities allowing a focus on institutional relationships beyond RBS’ core investors. The group is in the final stages of building a secondary loan trading desk which is the next critical step following the expansion of the distribution business. From 2010 through the first half of 2014, Capital Markets has been involved in closing 409 transactions and has served in the lead-left role on 186 transactions and as joint lead arranger on 223 transactions. Our experience and execution capabilities have catapulted our league table standings from 25th by volume of syndicated loans and 18th by number of syndicated loans in 2010 to 10th by volume and 9th by number in the first half of 2014, according to the Thomson Reuters overall national middle market bookrunner league table. |
197
Table of Contents
| • | Corporate Finance provides advisory services to middle market and mid-corporate companies. Services include M&A, equity private placements and capital structure advisory. The team works closely with industry sector specialists within debt capital markets on proprietary transaction development which serves to originate deal flow in multiple bank products. The team is also responsible for coordinating the financial advisory and equity capital markets referral agreement with Oppenheimer. |
| • | Global Markets is a customer-facing business providing foreign exchange and interest rate risk management services: |
| • | Interest Rate Products is a customer-facing business providing interest rate risk management services to help companies mitigate risks associated with interest rate volatility. |
| • | Foreign Exchange is a customer-facing business that provides foreign exchange payment and risk management services to help companies mitigate risk associated with currency fluctuations. Global Markets FX provides payment and risk management products to assist its corporate and consumer customers. We offer clients cross-border payable and receivable solutions in over 125 local currencies by utilizing a global network of correspondent partner banks. These services allow our customers to maximize returns on assets and minimize exchange rate costs. |
| • | Leveraged Finance offers debt financing solutions for middle market and mid-corporate companies supporting acquisition, recapitalization, refinancing, and growth capital transactions across a wide range of industries. Transactions are typically secured by a first security interest in the company’s assets and include public, private, and private equity owned entities. Leveraged Finance is responsible for the underwriting, execution, and portfolio management of our leveraged cash flow transactions. |
| • | The Private Equity Banking Group specializes in banking services to private equity funds, venture capital funds, infrastructure funds, credit funds and secondary funds. These services include capital call revolving lines of credit, management company lines of credit, and associated banking products and services such as cash management, foreign exchange and wealth management. |
| • | Strategic Client Acquisition (SCA) was created to accelerate new client relationships through active participation in primary and secondary loan markets. The team efficiently sources transactions through long-established relationships in traditional pro rata markets as well as institutional, or term loan B, markets across all sectors. The combination of pro rata and term loan B tranches allows our traditional banking team to forge new relationships and accelerate existing relationship development while generating highly accretive returns. |
Treasury Solutions: Supports all lines of business in Commercial Banking and Business Banking with treasury management solutions, including domestic and international cash management, commercial cards and trade finance. Treasury Solutions provides services to the smallest business banking clients ($500,000 annual revenue) to our largest mid-corporate clients (over $2.5 billion annual revenue). Treasury Solutions manages the client experience end to end, from product development to sales to implementation to client services. Treasury Solutions offers a range of innovative products and services to meet clients’ treasury management needs, which typically include enhancing cash flow, maintaining liquidity, automating reconciliation and posting, and mitigating fraud. Traditional domestic cash management products solve client needs related to receivables, payables, information reporting and liquidity management. Receivables products include wholesale and retail lockbox, remote deposit capture, image cash letter, integrated receivables including automated clearinghouse house, or ACH, and wire data and coin and currency. Receivables products help our customers reduce days sales outstanding by collecting their receivables faster and posting information to their accounts receivable or
198
Table of Contents
enterprise resource planning, or ERP, systems more efficiently. Payables products include ACH, wire transfer, account reconciliation, integrated payables, electronic invoice payment and presentment, commercial cards and ePayables. Payables products help our clients pay efficiently, maximize working capital by extending days payables outstanding, and reconcile their payments to their accounts payable or ERP systems. Treasury Solutions offers robust information reporting services led by our commercial online banking system and augmented by alternate reporting channels including email, transmission, phone and fax. Our liquidity management solutions, including zero balance accounts, sweep-to-investment, and sweep-to-line help our clients maximize working capital by eliminating idle balances. Treasury Solutions offers international solutions to our clients including cash management solutions in Canada and trade finance solutions such as import and export letters of credit, bankers acceptance and supply chain finance.
Competition
The financial services industry in general and in our branch footprint is highly competitive. Our branch footprint is in the New England, Mid-Atlantic and Midwest regions, though certain lines of business serve broader, national markets. Within those markets we face competition from community banks, super-regional and national financial institutions, credit unions, savings and loan associations, mortgage banking firms, consumer finance companies, securities brokerage firms, insurance companies and money market funds. Competition among providers of financial products and services continues to increase, with consumers having the opportunity to select from a growing variety of traditional and nontraditional alternatives. The ability of non-banking financial institutions to provide services previously limited to commercial banks has intensified competition.
In Consumer Banking, the industry has become increasingly dependent on and oriented towards technology-driven delivery systems, permitting transactions to be conducted by telephone and computer, as well as through online and mobile channels. In addition, technology has lowered the barriers to entry and made it possible for non-bank institutions to attract funds and provide lending and other financial services in our footprint despite not having a physical presence within our footprint. Given their lower cost structure, these institutions are often able to offer rates on deposit products that are higher than what may be average for the market for retail banking institutions with a traditional branch footprint, such as us. The primary factors driving competition for loans and deposits are interest rates, fees charged, customer service levels, convenience, including branch location and hours of operation, and the range of products and services offered. In particular, the competition for home equity lines and auto loans has intensified, resulting in pressure on pricing.
In Commercial Banking, there is intense competition for quality loan originations from traditional banking institutions, particularly large regional banks, as well as commercial finance companies, leasing companies and other non-bank lenders, and institutional investors including collateralized loan obligation (CLO) managers, hedge funds and private equity firms. Some larger competitors, including certain national banks that have a significant presence in our market area, may offer a broader array of products and, due to their asset size, may sometimes be in a position to hold more exposure on their own balance sheet. We compete on a number of factors including, among others, customer service, quality of execution, range of products offered, price and reputation.
Intellectual Property
In the highly competitive banking industry in which we operate, trademarks, service marks, trade names and logos are important to the success of our business. We own and license a variety of trademarks, service marks, trade names, logos and pending registrations and are spending significant resources to develop our stand-alone brands. In connection with this offering, we expect to enter into a trademark license agreement, pursuant to which we will be granted a limited license to use certain
199
Table of Contents
trademarks (including the daisywheel logo) from RBS for an initial term of 5 years and, at our option, up to 10 years, following the completion of the offering. See “Our Relationship with the RBS Group and Certain Other Related Party Transactions—Relationship with the RBS Group—Trademark License Agreement.” After the consummation of this offering, we intend to change the legal names of any of our subsidiaries that continue to include “RBS” and to continue operational and legal work to rebrand CFG and our banking subsidiaries. The process of changing all marketing materials, operational materials, signage, systems, and legal entities containing “RBS” to our new brand name will take approximately 14 months and cost approximately $14 million, excluding any incremental advertising and customer communication expenses. We expect to then shift the majority of our advertising and marketing budget to our new brand progressively as the different legal entities complete their individual brand name changes; we expect the shift in advertising and marketing investment to be completed no later than July 31, 2015.
Information Technology Systems
We have recently made and continue to make significant investments in our information technology systems for our banking and lending and cash management activities. We believe this is necessary investment in order to offer new products and improve our overall customer experiences, as well as to provide scale for future growth and acquisitions. The technology investments include replacing systems that support our branch tellers, commercial loans, automobile loans and treasury solutions. Additional investments that are in process include creating an enterprise data warehouse to capture and manage data to better understand our customers, identify our capital requirements and support regulatory reporting and a new mortgage system for our home lending solutions business.
Employees
As of June 30, 2014, we had approximately 18,050 employees, which included approximately 17,400 full-time employees, 760 part-time employees, including employees on leave, and approximately 575 positions filled by temporary employees. None of our employees are parties to a collective bargaining agreement. We consider our relationship with our employees to be good and have not experienced interruptions of operations due to labor disagreements.
Properties
Our headquarters is in Providence, Rhode Island. As of June 30, 2014, we leased approximately 5.8 million square feet of office and retail branch space. Our portfolio of leased space consists of 3.8 million square feet of retail branch space which spans 11 states and 2.0 million square feet of non-branch office space. As of June 30, 2014, we owned an additional 1.1 million square feet of office and branch space. We operate 82 branches in Rhode Island, 46 in Connecticut, 250 in Massachusetts, 20 in Vermont, 74 in New Hampshire, 147 in New York, 11 in New Jersey, 360 in Pennsylvania, 23 in Delaware, 119 in Ohio and 97 in Michigan. Of these branches, 1,185 are leased and the rest are owned. Management believes the terms of the various leases are consistent with market standards and were arrived at through arm’s-length bargaining. We also believe that our properties are in good operating condition and adequately serve our current business operations. We anticipate that suitable additional or alternative space, including those under lease options, will be available at commercially reasonable terms for future expansion.
Legal and Regulatory Proceedings
We operate in a legal and regulatory environment that exposes us to potentially significant risks. In addition to the matters described below, in the normal course of business, we are named, from time to time, as a defendant in various legal actions, including arbitrations, class actions and other litigation, arising in connection with our activities as a banking institution, including with respect to allegations of
200
Table of Contents
unfair or deceptive business practices and mis-selling of certain products. Actual or threatened legal actions against us include claims for substantial amounts of compensatory damages, claims for intermediate amounts of compensatory damages and claims for punitive damages. For additional information, see Note 12 “Commitments, Guarantees and Contingencies” to our unaudited interim consolidated financial statements and Note 16 “Commitments, Guarantees and Contingencies” to our audited consolidated financial statements included elsewhere in this prospectus.
In part as a result of the extensive regulation, supervision and examination of our business described elsewhere in this prospectus, we are also involved, from time to time, in other reviews, investigations and proceedings (both formal and informal) by governmental and self-regulatory agencies regarding our business, certain of which may result in adverse judgments, settlements, fines, penalties, public or private censure, increased costs, required remediation, restriction on business activities or other impacts on us.
We contest liability and the amount of damages as appropriate in each pending matter. Where available information indicates that it is probable a liability has been incurred at the date of the consolidated financial statements and we can reasonably estimate the amount of that loss, we accrue the estimated loss as a charge to income.
In many proceedings, however, it is inherently difficult to determine whether any loss is probable or even possible or to estimate the amount of any loss. We cannot predict with certainty if, how or when such proceedings will be resolved or what the eventual settlement, fine, penalty or other relief, if any, may be, particularly for proceedings that are in their early stages of development or where plaintiffs seek substantial or indeterminate damages. Numerous issues may need to be resolved before liability can be reasonably estimated, including through potentially lengthy discovery and determination of important factual matters, determination of issues related to class certification and the calculation of damages and by addressing novel or unsettled legal questions relevant to the proceedings in question.
Set out below are descriptions of significant legal matters in which we are involved. Subject to the foregoing, and based on current knowledge, consultation with counsel and established reserves, we believe that the outcome of such proceedings will not have a material adverse effect on our consolidated financial condition, results of operations or cash flows.
Consumer Products
The activities of our banking subsidiaries are subject to extensive laws and regulations concerning unfair or deceptive acts or practices in connection with customer products. Certain of our banking subsidiaries’ practices with respect to overdraft protection and other consumer products have not met applicable standards. Our banking subsidiaries have implemented and are continuing to implement changes to bring their practices in conformity with applicable laws and regulations. In April 2013, our banking subsidiaries consented to the issuance of orders by the OCC and the FDIC (the “Consent Orders”). In the Consent Orders (which are publicly available and will remain in effect until terminated by the regulators), our banking subsidiaries neither admitted nor denied the regulators’ findings that they had engaged in deceptive marketing and implementation of the bank’s overdraft protection program, checking rewards programs, and stop-payment process for pre-authorized recurring electronic fund transfers. Under the Consent Orders, our banking subsidiaries paid a total of $10 million in civil monetary penalties and are required to develop plans to provide restitution to affected customers. The amount of restitution is currently anticipated to be approximately $8 million, and that amount is fully covered by an existing reserve. The Consent Orders also require our banking subsidiaries to cease and desist any operations in violation of Section 5 of the Federal Trade Commission Act, and to submit to the regulators periodic written progress reports regarding compliance with the Consent Orders. In addition, CBNA agreed to take certain remedial actions to
201
Table of Contents
improve its compliance risk management systems and to create a comprehensive action plan designed to achieve compliance with the Consent Order. Restitution plans have been prepared and submitted for approval, and CBNA has submitted for approval and is in the process of implementing its action plan for compliance with the Consent Order, as well as updated policies, procedures, and programs related to its compliance risk management systems.
Our banking subsidiaries are also addressing issues regarding, among other things, certain identity theft and debt cancellation products, certain overdraft fees, signature debit card fees, our banking subsidiaries’ policies and practices with respect to consumer complaints process, fair lending, identifying and correcting errors in customer deposits, and the charging of cost-based credit card late payment fees. Our banking subsidiaries have paid restitution, and expect to pay additional restitution, to certain affected customers in connection with certain of these practices. In addition, our banking subsidiaries may face formal administrative enforcement actions from their federal and other governmental supervisory agencies, including the assessment of civil monetary penalties and restitution, relating to the past practices and policies identified above and other consumer products, and they could also face potential civil litigation. For further information regarding risks related to regulatory actions and litigation, please refer to “Risk Factors—Risks Related to Our Business—Supervisory requirements and expectations on us as a financial holding company and a bank holding company, our need to make improvements and devote resources to various aspects of our controls, processes, policies and procedures, and any regulator-imposed limits on our activities, could limit our ability to implement our strategic plan, expand our business, improve our financial performance and make capital distributions to our stockholders,” “Risk Factors—Risks Related to Regulations Governing Our Industry—We are and may be subject to regulatory actions that may have a material impact on our business” and “Risk Factors—Risks Related to Regulations Governing Our Industry—We are and may be subject to litigation that may have a material impact on our business.”
Fair Labor Standards Act Litigation
We were named in several purported class actions brought under the Fair Labor Standards Act (“FLSA”) and equivalent state statutes alleging that certain categories of branch employees were denied overtime for hours worked. These suits were brought by current and former branch employees alleging that either: (1) they are/were in Assistant Branch Manager positions and were improperly classified as exempt under the FLSA thereby denying them pay for all hours worked, including overtime pay; or (2) they are/were properly classified as non-exempt tellers, bankers or the like but were told not to record all of their hours, had hours they entered deleted by their managers and/or were otherwise denied pay for hours worked, including overtime pay. These cases covered our entire geographic footprint, and have been settled, with final court approval of the settlements granted May 5, 2014. The settlement amount ($12 million), which had been fully covered by a then existing reserve, has been paid by us and is in the process of being distributed pursuant to the terms of the settlement. Separately, we were named in two lawsuits brought by current and former mortgage loan officers and home loan advisors alleging that they were improperly classified as exempt under the FLSA and corresponding state laws and therefore denied pay for all hours worked, including overtime pay. These cases have also been settled, and final court approval of the settlements was granted on January 29, 2014. The combined settlement amount of these two cases ($3 million), which had been fully covered by then existing reserves, has been paid by us and distributed pursuant to the terms of the settlements.
Telephone Consumer Protection Act Litigation
We are a defendant in a purported class action complaint filed in December 2013 in the United States District Court for the Southern District of California pursuant to the Telephone Consumer Protection Act (“TCPA”). The named plaintiff purports to represent a “national class” of customers who allegedly received automated calls to their cell phones from the bank or its agents, without customer consent, in violation of the TCPA. We are vigorously defending this matter.
202
Table of Contents
LIBOR Litigation
We are a defendant in lawsuits in which allegations have been made that our parent company, the RBS Group, manipulated U.S. dollar LIBOR to the detriment of our customers. The lawsuits include a purported class action on behalf of our borrowers whose interest rate was tied to U.S. dollar LIBOR. The plaintiffs in these cases assert various theories of liability, including fraud, negligent misrepresentation, breach of contract, and unjust enrichment. We are vigorously defending these matters.
Foreclosure-Related Expenses
In May 2013, the civil division of the U.S. Attorney’s Office for the Southern District of New York served a subpoena pursuant to the Financial Institutions Reform, Recovery and Enforcement Act of 1989 seeking information regarding home mortgage foreclosure expenses submitted for reimbursement to the United States Department of Housing and Urban Development, the Federal National Mortgage Association, or the Federal Home Loan Mortgage Corporation. We are cooperating with the investigation.
Mortgage Repurchase Demands
We are an originator and servicer of residential mortgages and routinely sell such mortgage loans in the secondary market and to government-sponsored entities. In the context of such sales, we make certain representations and warranties regarding the characteristics of the underlying loans and, as a result, may be contractually required to repurchase such loans or indemnify certain parties against losses for certain breaches of those representations and warranties. Between January 1, 2009 and June 30, 2014, we received approximately $146 million in repurchase demands and $97 million in indemnification payment requests in respect of loans originated, for the most part, since 2003. Of those claims presented, $81 million was paid to repurchase residential mortgage loans, and $32 million was incurred for indemnification costs to make investors whole. We repurchased mortgage loans totaling $35 million and $13 million for the years ended December 31, 2013 and 2012, respectively, and $17 million and $26 million for the six months ended June 30, 2014 and 2013, respectively. We incurred indemnification costs of $12 million and $5 million for the years ended December 31, 2013 and 2012, respectively, and $7 million and $6 million for the six months ended June 30, 2014 and 2013, respectively. We cannot estimate what the future level of repurchase demands or our ultimate exposure will be, and cannot give any assurance that the historical experience will continue in the future. It is possible that the volume of repurchase demands will increase. In addition to the above, we have since December 2013 been responding to subpoenas issued by the Office of the Inspector General for the Federal Housing Finance Agency seeking information about loans sold to the Federal National Mortgage Association and the Federal Home Loan Mortgage Corporation from 2003 through 2011.
203
Table of Contents
Our operations are subject to extensive regulation, supervision and examination under federal and state law. These laws and regulations cover all aspects of our business, including lending practices, safeguarding deposits, customer privacy and information security, capital structure, transactions with affiliates and conduct and qualifications of personnel. These laws and regulations are intended primarily for the protection of depositors, the Deposit Insurance Fund and the banking system as a whole and not for the protection of shareholders and creditors.
In 2010, President Obama signed into law the Dodd-Frank Act, which restructured the financial regulatory regime in the United States. The Dodd-Frank Act represents a significant overhaul of many aspects of the regulation of the financial services industry, addressing, among other things, systemic risk, capital adequacy, deposit insurance assessments, consumer financial protection, derivatives, restrictions on an insured bank’s transactions with its affiliates, lending limits and mortgage-lending practices. Various provisions of the Dodd-Frank Act, discussed in greater detail below, require the issuance of many implementing regulations which will take effect over several years, making it difficult to anticipate the overall impact to us, our subsidiaries or the financial industry more generally. While the overall impact cannot be predicted with any degree of certainty, the Dodd-Frank Act will affect us across a wide range of areas.
As a result of and in addition to new legislation aimed at regulatory reform, such as the Dodd-Frank Act, and the increased capital and liquidity requirements introduced by the U.S. implementation of the Basel III framework, the federal banking agencies, the Federal Reserve Board, the OCC and the FDIC, as well as the new CFPB, have taken a generally stricter approach to supervising and regulating financial institutions and financial products and services over which they exercise their respective supervisory authorities. We, our two banking subsidiaries and our products and services are all subject to greater supervisory scrutiny and enhanced supervisory requirements and expectations and face significant challenges in meeting them. We expect to continue to face greater supervisory scrutiny and enhanced supervisory requirements for the foreseeable future.
General
As a bank holding company and financial holding company (as defined in the Bank Holding Company Act), we are subject to regulation, supervision and examination by the Federal Reserve Board, through the Federal Reserve Bank of Boston.
CBNA is a national banking association. As such, it is subject to regulation, examination and supervision by the OCC as its primary federal regulator and by the FDIC as the insurer of its deposits.
CBPA is a Pennsylvania-chartered savings bank. Accordingly, it is subject to supervision by the Department of Banking of the Commonwealth of Pennsylvania (the “PA Banking Department”), as its chartering agency, and regulation, supervision and examination by the FDIC as the primary federal regulator of state-chartered savings banks and as the insurer of its deposits.
A principal objective of the U.S. bank regulatory system is to protect depositors by ensuring the financial safety and soundness of banks. To that end, the banking regulators have broad regulatory, examination and enforcement authority. The regulators regularly examine our operations, and CFG and our banking subsidiaries are subject to periodic reporting requirements.
The regulators have various remedies available if they determine that the financial condition, capital resources, asset quality, earnings prospects, management, liquidity or other aspects of a banking organization’s operations are unsatisfactory. The regulators may also take action if they
204
Table of Contents
determine that the banking organization or its management is violating or has violated any law or regulation. The regulators have the power to, among other things:
| • | enjoin “unsafe or unsound” practices; |
| • | require affirmative actions to correct any violation or practice; |
| • | issue administrative orders that can be judicially enforced; |
| • | direct increases in capital; |
| • | direct the sale of subsidiaries or other assets; |
| • | limit dividends and distributions; |
| • | restrict growth; |
| • | assess civil monetary penalties; |
| • | remove officers and directors; and |
| • | terminate deposit insurance. |
CBNA and CBPA are subject to various requirements and restrictions under federal and state law, including requirements to maintain reserves against deposits, restrictions on the types and amounts of loans that may be granted and the interest that may be charged and limitations on the types of investments that may be made, activities that may be engaged in, the opening and closing of branches and types of services that may be offered. The consumer lending and finance activities of CBNA and CBPA are also subject to extensive regulation under various federal and state laws. These statutes impose requirements on the making, enforcement and collection of consumer loans and on the types of disclosures that must be made in connection with such loans. CBNA and CBPA and certain of their subsidiaries are also prohibited from engaging in certain tie-in arrangements in connection with extensions of credit, leases or sales of property, or furnishing products or services.
In addition, CBNA and CBPA are subject to regulation, supervision and examination by the CFPB. The CFPB has broad authority to regulate the offering and provision of consumer financial products by depository institutions with more than $10 billion in total assets. The CFPB may promulgate rules under a variety of consumer financial protection statutes, including the Truth in Lending Act, the Electronic Funds Transfer Act and the Real Estate Settlement Procedures Act.
The Dodd-Frank Act established the Financial Stability Oversight Council, which has oversight authority for monitoring and regulating systemic risk, and can recommend prudential standards, reporting and disclosure requirements to the Federal Reserve Board for systemically important financial institutions.
Financial Holding Company Regulation
The Gramm-Leach-Bliley Act of 1999 (“GLBA”) permits a qualifying bank holding company to become a financial holding company. Financial holding companies may engage in a broader range of activities than those permitted for a bank holding company, which are limited to (i) banking, managing or controlling banks, (ii) furnishing services to or performing services for subsidiaries and (iii) activities that the Federal Reserve Board has determined to be so closely related to banking as to be a proper incident thereto. GLBA broadens the scope of permissible activities for financial holding companies to include, among other things, securities underwriting and dealing, insurance underwriting and brokerage, merchant banking and other activities that are declared by the Federal Reserve Board, in cooperation with the Treasury Department, to be “financial in nature or incidental thereto” or that the Federal Reserve Board declares unilaterally to be “complementary” to financial activities. In addition, a
205
Table of Contents
financial holding company may conduct permissible new financial activities or acquire permissible non-bank financial companies with after-the-fact notice to the Federal Reserve Board.
We have elected and qualified for financial holding company status under the GLBA. To maintain financial holding company status, a financial holding company and its banking subsidiaries must remain well capitalized and well managed, and maintain a Community Reinvestment Act (“CRA”) rating of at least “Satisfactory.” If a financial holding company ceases to meet these requirements, the Federal Reserve Board’s regulations provide that we must enter into an agreement with the Federal Reserve Board to comply with all applicable capital and management requirements. Until the financial holding company returns to compliance, the Federal Reserve Board may impose limitations or conditions on the conduct of its activities, and the company may not commence any of the broader financial activities permissible for financial holding companies or acquire a company engaged in such financial activities without prior approval of the Federal Reserve Board. Any restrictions imposed on our activities by the Federal Reserve Board may not necessarily be made known to the public. If the company does not return to compliance within 180 days, the Federal Reserve Board may require divestiture of the company’s depository institutions. Failure to satisfy the financial holding company requirements could also result in loss of financial holding company status. Bank holding companies and banks must also be both well capitalized and well managed in order to acquire banks located outside their home state.
The OCC recently determined that CBNA is not currently both well capitalized and well managed, as those terms are defined in applicable regulations, based on certain minimum capital ratios and supervisory ratings, respectively, and consequently no longer meets the conditions to own a financial subsidiary. A financial subsidiary is permitted to engage in a broader range of activities—similar to those of a financial holding company—than those permissible for a national bank. CBNA has two financial subsidiaries, Citizens Securities, Inc., a registered broker-dealer, and RBS Citizens Insurance Agency, Inc., a dormant entity, although it continues to collect commissions on certain outstanding policies. CBNA has entered into the OCC Agreement pursuant to which it must develop a remediation plan, which must be approved by the OCC, setting forth the specific actions it will take to bring itself back into compliance with the conditions to own a financial subsidiary and the schedule for achieving that objective. Until CBNA satisfactorily addresses the deficiencies, it will be subject to restrictions on its ability to acquire control or build an interest in any new financial subsidiary and to commence new activities in any existing financial subsidiary, without the prior approval of the OCC. If CBNA fails to remediate the condition within 180 days after receipt of the OCC Agreement, or such longer period as the OCC may permit, it may have to divest itself of its financial subsidiaries and comply with any additional limitations or conditions on its conduct as the OCC may impose. CBNA has implemented a comprehensive enterprise-wide program that seeks to address these deficiencies.
Separately, CBNA is also making improvements to its compliance management systems, risk management, deposit reconciliation practices and overdraft fees in order to address deficiencies in those areas. CBPA is making improvements to address deficiencies in its deposit reconciliation practices, overdraft fees, identity theft add-on products, third-party payment processor activities, oversight of third-party service providers, compliance program, policies and, procedures and training, consumer complaints process and anti-money laundering controls. These efforts require us to make investments in additional resources and systems and also require a significant commitment of managerial time and attention.
We are also required to make improvements to our overall compliance and operational risk management programs and practices in order to comply with enhanced supervisory requirements and expectations and to address weaknesses in retail credit risk management, liquidity risk management, model risk management, outsourcing and vendor risk management and related oversight and monitoring practices and tools. Our and our banking subsidiaries’ consumer compliance program and controls also require improvement, particularly with respect to deposit reconciliation processes, fair lending and mortgage servicing.
206
Table of Contents
Under the Bank Holding Company Act, currently we may not be able to engage in certain categories of new activities or acquire shares or control of other companies other than in connection with internal reorganizations.
Standards for Safety and Soundness
The FDIA requires the Federal Reserve Board, OCC and FDIC to prescribe operational and managerial standards for all insured depository institutions, including CBNA and CBPA. The agencies have adopted regulations and interagency guidelines which set forth the safety and soundness standards used to identify and address problems at insured depository institutions before capital becomes impaired. If an agency determines that a bank fails to satisfy any standard, it may require the bank to submit an acceptable plan to achieve compliance, consistent with deadlines for the submission and review of such safety and soundness compliance plans.
Under Section 619 of the Dodd-Frank Act, which codifies the Federal Reserve Board’s long-standing “source of strength” doctrine, any bank holding company that controls an insured depository institution must serve as a source of financial and managerial strength for its depository institution subsidiary. The statute defines “source of financial strength” as the ability to provide financial assistance in the event of the financial distress at the insured depository institution. The Federal Reserve Board may require a bank holding company to provide such support at times when it may not have the financial resource to do so or when doing so is not otherwise in the interests of CFG or its shareholders or creditors.
CBPA is also subject to supervision by the PA Banking Department. The PA Banking Department may order any Pennsylvania-chartered savings bank to discontinue any violation of law or unsafe or unsound business practice. It may also order the termination of any trustee, officer, attorney or employee of a savings bank engaged in objectionable activity.
Dividends
Various federal and state statutory provisions and regulations, as well as regulatory expectations, limit the amount of dividends that we and our subsidiaries may pay. Dividends payable by CBNA, as a national bank subsidiary, are limited to the lesser of the amount calculated under a “recent earnings” test and an “undivided profits” test. Under the recent earnings test, a dividend may not be paid if the total of all dividends declared by a bank in any calendar year is in excess of the current year’s net income combined with the retained net income of the two preceding years, less any required transfers to surplus, unless the national bank obtains the approval of the OCC. Under the undivided profits test, a dividend may be paid only to the extent that retained net profits (as defined and interpreted by regulation), including the portion transferred to surplus, exceed bad debts (as defined by regulation). CBNA is currently required to seek the OCC’s approval prior to paying any dividends to us. Federal bank regulatory agencies have issued policy statements which provide that FDIC-insured depository institutions and their holding companies should generally pay dividends only out of their current operating earnings. Under Pennsylvania law, CBPA may declare and pay dividends only out of accumulated net earnings. It may not declare dividends unless its retained earnings equal or exceed contributed capital.
Furthermore, with respect to both CBNA and CBPA, if, in the opinion of the applicable federal regulatory agency, either is engaged in or is about to engage in an unsafe or unsound practice (which, depending on the financial condition of the bank, could include the payment of dividends), the regulator may require, after notice and hearing, that such bank cease and desist from such practice. The OCC and the FDIC have indicated that the payment of dividends would constitute an unsafe and unsound practice if the payment would reduce a depository institution’s capital to an inadequate level.
207
Table of Contents
Supervisory stress tests conducted by the Federal Reserve Board in connection with its annual CCAR process affect our ability to make capital distributions. As part of the CCAR process, the Federal Reserve Board evaluates institutions’ capital adequacy and internal capital adequacy assessment processes to ensure that they have sufficient capital to continue operations during periods of economic and financial stress. The Federal Reserve Board must approve any planned distribution of capital in connection with the CCAR process. In March 2014, the Federal Reserve Board objected on qualitative grounds to our capital plan for the one-year period ending March 31, 2015 submitted as part of the CCAR process. In its public report entitled “Comprehensive Capital Analysis and Review 2014: Assessment Framework and Results,” the Federal Reserve Board cited significant deficiencies in our capital planning processes, including inadequate governance, weak internal controls and deficiencies in our practices for estimating revenues and losses under a stress scenario and for ensuring the appropriateness of loss estimates across our business lines in a specific stress scenario. Although the Federal Reserve Board acknowledged that bank holding companies such as ours that are new to the CCAR process are subject to different expectations, our weaknesses were considered serious enough to warrant the Federal Reserve Board’s objection based on its qualitative assessment of our capital planning process. As a result, we are not permitted to increase our capital distributions above 2013 levels (for capital plan purposes, the one-year period ended March 31, 2014) until a new capital plan is approved by the Federal Reserve Board. The deadline for our next capital plan submission is January 5, 2015, and we cannot assure you that the Federal Reserve Board will not object to our next capital plan or that, even if it does not object to it, our planned capital distributions will not be significantly modified from 2013 levels.
In addition, the ability of banks and bank holding companies to pay dividends and make other forms of capital distribution will also depend on their ability to maintain a sufficient capital conservation buffer under the U.S. Basel III capital framework (described further below). The capital conservation buffer requirements will be phased in beginning on January 1, 2016. The ability of banks and bank holding companies to pay dividends, and the contents of their respective dividend policies, could be impacted by a range of regulatory changes made pursuant to the Dodd-Frank Act, many of which still require final implementing rules to become effective.
Federal Deposit Insurance Act
The FDIA imposes various requirements on insured depository institutions. For example, the FDIA requires, among other things, that the federal banking agencies take “prompt corrective action” in respect of depository institutions that do not meet minimum capital requirements, which are described below in “Capital.” The FDIA sets forth the following five capital tiers: “well capitalized,” “adequately capitalized,” “undercapitalized,” “significantly undercapitalized” and “critically undercapitalized.” A depository institution’s capital tier will depend upon how its capital levels compare with various relevant capital measures and certain other factors that are established by regulation.
The FDIA prohibits any depository institution from making any capital distributions (including payment of a dividend) or paying any management fee to its parent holding company if the depository institution would thereafter be “undercapitalized.” “Undercapitalized” institutions are subject to growth limitations and are required to submit a capital restoration plan. For a capital restoration plan to be acceptable, among other things, the depository institution’s parent holding company must guarantee that the institution will comply with the capital restoration plan. If a depository institution fails to submit an acceptable capital restoration plan, it is treated as if it is “significantly undercapitalized.” “Significantly undercapitalized” depository institutions may be subject to a number of requirements and restrictions, including orders to sell sufficient voting stock to become “adequately capitalized,” orders to elect a new board of directors, requirements to reduce total assets and cessation of receipt of deposits from correspondent banks. “Critically undercapitalized” institutions are subject to the appointment of a receiver or conservator.
208
Table of Contents
The FDIA prohibits insured banks from accepting brokered deposits or offering interest rates on any deposits significantly higher than the prevailing rate in the bank’s normal market area or nationally (depending upon where the deposits are solicited), unless it is “well capitalized,” or it is “adequately capitalized” and receives a waiver from the FDIC. A bank that is “adequately capitalized” and that accepts brokered deposits under a waiver from the FDIC may not pay an interest rate on any deposit in excess of 75 basis points over certain prevailing market rates. The FDIA imposes no such restrictions on a bank that is “well capitalized.”
The FDIA requires CBNA and CBPA to pay deposit insurance assessments. Deposit insurance assessments are based on average consolidated total assets, less average tangible equity and various other regulatory factors included in a FDIC assessment scorecard. Deposit insurance assessments are also affected by the minimum reserve ratio with respect to the Deposit Insurance Fund (“DIF”). The minimum reserve ratio is currently 2%, and the FDIC is free to increase this ratio in the future.
Under the FDIA, banks may also be held liable by the FDIC for certain losses incurred, or reasonably expected to be incurred, by the DIF. Either CBNA and CBPA may be liable for losses caused by the other’s default and also may be liable for any assistance provided by the FDIC to the other if it is in danger of default.
Capital
We must comply with capital adequacy standards established by the Federal Reserve Board. CBNA and CBPA must comply with similar capital adequacy standards established by the OCC and FDIC, respectively. We currently have capital in excess of the “well capitalized” standards described below. For more detail on our regulatory capital, see “Management’s Discussion and Analysis of Financial Condition and Results of Operation—Capital.”
Capital Requirements Applicable to Us, As Currently in Effect
The Federal Reserve Board has adopted guidelines pursuant to which it assesses the adequacy of capital as part of its examination and supervision of a bank holding company. These guidelines include quantitative measures that assign risk weights to a bank holding company’s assets, exposures and off-balance sheet items to determine its risk-weighted assets and that define and set minimum regulatory capital requirements.
Under existing regulatory capital rules applicable to us and our banking subsidiaries, capital is divided into two tiers. Tier 1 capital consists principally of stockholders’ equity less any amounts of goodwill, other intangible assets, non-financial equity investments and other items that are required to be deducted. Tier 2 capital consists principally of perpetual and trust preferred stock that is not eligible to be included as Tier 1 capital, term subordinated debt, intermediate-term preferred stock and, subject to limitations, general allowances for loan losses. Assets are adjusted under the risk-based guidelines to take into account different risk characteristics. Quarterly average on-balance sheet assets for purpose of the leverage ratio do not include goodwill, other intangible assets or items that the Federal Reserve Board has determined should be deducted from Tier 1 capital.
Under the capital adequacy guidelines currently in effect, bank holding companies must maintain a Tier 1 risk-based capital ratio of at least 4%, a total risk-based capital ratio of at least 8% and a leverage ratio of at least 4%. To qualify as “well capitalized,” a bank holding company must maintain a Tier 1 risk-based capital ratio of at least 6%, a total risk-based capital ratio of at least 10% and a leverage ratio of at least 5%.
209
Table of Contents
Basel III Final Rules Applicable to Us and Our Banking Subsidiaries
In July 2013, the Federal Reserve Board, OCC and FDIC issued the U.S. Basel III final rule. The final rule implements the Basel III capital framework and certain provisions of the Dodd-Frank Act, including the Collins Amendment, which establishes minimum risk-based capital and leverage requirements on a consolidated basis for insured depository institutions and their bank holding companies. Certain aspects of the final rule, such as the new minimum capital ratios, changes to the prompt corrective action ratios to reflect the higher minimum capital ratios for the various capital tiers and the revised methodology for calculating risk-weighted assets, will become effective on January 1, 2015. Other aspects of the final rule, such as the capital conservation buffer and the new regulatory deductions from and adjustments to capital, will be phased in over several years beginning on January 1, 2015.
The U.S. Basel III final rule includes a new minimum ratio of Common Equity Tier 1 capital to risk-weighted assets of 4.5% and a Common Equity Tier 1 capital conservation buffer of greater than 2.5% of risk-weighted assets that will apply to all U.S. banking organizations. Failure to maintain the capital conservation buffer will result in increasingly stringent restrictions on a banking organization’s ability to make dividend payments and other capital distributions and pay discretionary bonuses to executive officers. The final rule also increases the minimum ratio of Tier 1 capital to risk-weighted assets from 4% to 6%, while maintaining the current minimum total risk-based capital ratio of 8%. In addition, for the largest and most internationally active U.S. banking organizations, the final rule includes a new minimum supplementary leverage ratio that takes into account certain off-balance sheet exposures.
The U.S. Basel III final rule focuses regulatory capital on Common Equity Tier 1 capital, and introduces new regulatory adjustments and deductions from capital as well as narrower eligibility criteria for regulatory capital instruments. Consistent with the requirements of the Collins Amendment, the new eligibility criteria for regulatory capital instruments results in, among other things, trust preferred securities no longer qualifying as Tier 1 capital for bank holding companies, such as us. The final rule also revises the methodology for calculating risk-weighted assets for certain types of assets and exposures.
Liquidity Standards
The Federal Reserve Board evaluates our liquidity as part of the supervisory process. In September 2014, the Federal Reserve Board, OCC and FDIC issued a final rule to implement the Basel III LCR. The LCR is a quantitative liquidity metric designed by the Basel Committee to ensure that banks have sufficient high-quality liquid assets to cover expected net cash outflows over a 30-day liquidity stress period. The final rule applies a modified version of the LCR to bank holding companies with more than $50 billion but less than $250 billion in total assets, and less than $10 billion in on-balance sheet foreign exposure, such as us. The modified version of the LCR differs in certain respects from the Basel Committee’s version of the LCR, including a narrower definition of high-quality liquid assets, different prescribed cash inflow and outflow assumptions for certain types of instruments and transactions, and a shorter phase-in schedule that begins on January 1, 2016 and ends on January 1, 2017.
Basel III also will impose a NSFR, a quantitative liquidity metric designed to promote the resilience of a bank’s liquidity risk profile over a longer period than the LCR. The NSFR establishes a minimum acceptable amount of stable funding based on the liquidity characteristics of an institution’s assets and activities over a one-year horizon. The NSFR has been developed to provide a sustainable maturity structure of assets and liabilities. The Basel Committee contemplates that the NSFR, including any revisions, will be implemented as a minimum standard by January 1, 2018. Federal banking regulators have not yet proposed rules to implement the NSFR in the United States.
In addition, under the Dodd-Frank Act the Federal Reserve Board has implemented enhanced prudential standards for bank holding companies with $50 billion or more in total consolidated assets.
210
Table of Contents
See “—Enhanced Prudential Standards.” These regulations will require us to conduct regular liquidity stress testing over various time horizons and to maintain a buffer of higher liquid assets sufficient to cover expected net cash outflows and projected loss or impairment of funding sources for a short-term liquidity stress scenario. This liquidity buffer requirement is designed to complement the Basel III LCR, but how the two requirements will interact as they are implemented is not yet clear.
Stress Testing Requirements
The Federal Reserve Board, OCC and FDIC have promulgated final rules under the Dodd-Frank Act requiring us, CBNA and CBPA to conduct annual stress tests and publish a summary of the results. As part of our obligations under the Dodd-Frank Act, we, and certain other bank holding companies, will be required to publish results of the Dodd-Frank stress test (“DFAST”) during the third quarter of 2014. The DFAST process is used to project net income, loan losses and capital ratios over a nine-quarter horizon under hypothetical, stressful macroeconomic and financial market scenarios developed by the Federal Reserve Board as well as certain mandated assumptions about capital distributions prescribed in the DFAST rule. Given the purpose of the DFAST process and the assumptions used in order to assess our likely performance during hypothetical economic conditions, we expect that projected results under the DFAST severely adverse scenarios will show severe negative impacts on earnings, inconsistent with management expectations in light of the current economic and operating environment.
Separately, the Federal Reserve Board has issued an interim final rule specifying how large bank holding companies should incorporate the U.S. Basel III capital standards into their 2014 capital plan and stress test capital projections. Among other things, the interim final rule requires large bank holding companies to project both their Common Equity Tier 1 risk-based capital ratio using the methodology under existing capital guidelines and their Common Equity Tier 1 risk-based capital ratio under the U.S. Basel III capital standards, as such standards phase in over the nine-quarter planning horizon.
Final Regulations Under the Volcker Rule
In December 2013, the Federal Reserve Board, OCC and FDIC issued final rules to implement the Volcker Rule. The Volcker Rule prohibits an insured depository institution, such as CBNA and CBPA, and its affiliates from (1) engaging in proprietary trading or (2) investing in or sponsoring certain types of funds, both subject to certain limited exceptions. These prohibitions are expected to impact the ability of U.S. banking organizations to provide investment management products and services that are competitive with non-banking firms generally and with non-U.S. banking organizations in overseas markets. The final rules would also effectively prohibit short-term trading strategies by any U.S. banking organization if those strategies involve instruments other than those specifically permitted for trading.
Resolution Plans
Federal Reserve Board and FDIC regulations require bank holding companies with more than $50 billion in assets to submit resolution plans that, in the event of material financial distress or failure, establish the rapid, orderly and systemically safe liquidation of the company under the bankruptcy code. Insured depository institutions with more than $50 billion in assets must submit to the FDIC a resolution plan whereby they can be resolved in a manner that is orderly and that ensures that depositors will receive access to insured funds within certain required timeframes. If the Federal Reserve Board and the FDIC determine that a company’s resolution plan is not credible, and the company fails to cure the deficiencies in a timely manner, then the Federal Reserve Board and the FDIC may jointly impose on the company, or on any of its subsidiaries, more stringent capital, leverage or liquidity requirements or restrictions on growth, activities or operations, or require the divestment of
211
Table of Contents
certain assets or operations. We timely submitted our resolution plan, jointly with RBS, on July 1, 2013. When RBS no longer controls us for bank regulatory purposes, we will separately file our own resolution plan with the Federal Reserve Board and FDIC.
Enhanced Prudential Standards
The Dodd-Frank Act requires the Federal Reserve Board to impose liquidity, single counterparty credit limits, risk management and other enhanced prudential standards for bank holding companies with $50 billion or more in total consolidated assets, including us. The Federal Reserve Board on February 18, 2014 approved a final rule implementing certain of the enhanced prudential standards. Under the final rule, we will have to comply with various liquidity risk management standards and maintain a liquidity buffer of unencumbered highly liquid assets based on the results of internal liquidity stress testing. The final rule also establishes certain requirements and responsibilities for our risk committee and mandates certain risk management standards. The final rule establishes a compliance date of January 1, 2015, for these new standards. Final rules on single counterparty credit limits and an early remediation framework have not yet been promulgated.
The enhanced prudential standards rules also will subject a foreign banking organization with at least $50 billion in non-branch U.S. assets as of June 30, 2015 to various requirements, including a requirement to establish by July 1, 2016 an IHC to hold all of the foreign banking organization’s interests in U.S. companies which it controls for U.S. bank regulatory purposes. An IHC will have to comply with U.S. risk-based capital, leverage, liquidity and risk-management requirements, as well as other regulations. Although the timing of our separation from the RBS Group is uncertain, the RBS Group will likely be subject to the enhanced prudential standards for foreign banking organizations, including the requirement to create an IHC, owing in part to the fact that we are a subsidiary of the RBS Group. If we become a subsidiary of an RBS Group IHC, even if we receive dividends from our banking subsidiaries, our ability to pay dividends or make capital distributions could be constrained by the IHC’s capital requirements, which will be affected by any interests that it holds in other RBS Group U.S. companies.
Heightened Standards
In September 2014, the OCC adopted guidelines that establish heightened standards for large national banks with average total consolidated assets of $50 billion or more, including CBNA. The guidelines will be effective 60 days after they are published in the Federal Register. If CBNA’s average total consolidated assets, as defined in the guidelines, are below $100 billion as of the relevant measurement date, CBNA will be required to comply with the guidelines within 18 months after the effective date. The guidelines set forth minimum standards for the design and implementation of a bank’s risk governance framework, and minimum standards for oversight of that framework by a bank’s board of directors. The guidelines supersede the OCC’s “heightened expectations” program for large banks that the OCC began informally communicating to certain banks in 2010. The guidelines are intended to focus management and boards of directors of covered banks on strengthening risk management practices and governance and improve bank examiners’ ability to assess compliance with the OCC’s expectations. Under the guidelines, a bank may use certain components or the entirety of its parent company’s risk governance framework if the risk profiles of the parent company and the covered bank are substantially the same as demonstrated through a documented assessment, but the framework must ensure the bank’s risk profile is easily distinguished and separate from the parent for risk management and supervisory reporting purposes. A bank’s board of directors is required to have two members who are independent of the bank and parent company management. The guidelines provide that a bank’s board of directors should require management to establish and implement an effective risk governance framework that meets the standards in the guidelines, and the board of directors or the board’s risk committee should approve any significant changes to the risk governance framework and monitor compliance with the framework. The board of directors should also provide active oversight and a credible challenge to management’s recommendations and decisions and exercise independent judgment.
212
Table of Contents
Protection of Customer Personal Information
The privacy provisions of the GLBA generally prohibit financial institutions, including us, from disclosing nonpublic personal financial information of consumer customers to third parties for certain purposes (primarily marketing) unless customers have the opportunity to opt out of the disclosure. The Fair Credit Reporting Act restricts information sharing among affiliates for marketing purposes. Both the Fair Credit Reporting Act and Regulation V, issued by the Federal Reserve Board, govern the use and provision of information to consumer reporting agencies.
Federal and state banking agencies have prescribed standards for maintaining the security and confidentiality of consumer information, and we are subject to such standards, as well as certain federal and state laws or standards for notifying consumers in the event of a security breach.
Anti-Tying Restrictions
Generally, a bank may not extend credit, lease, sell property or furnish any services or fix or vary the consideration for them on the condition that (1) the customer obtain or provide some additional credit, property or services from or to that bank or its bank holding company or their subsidiaries or (2) the customer not obtain some other credit, property or services from a competitor, except to the extent reasonable conditions are imposed to assure the soundness of the credit extended. A bank may, however, offer combined-balance products and may otherwise offer more favorable terms if a customer obtains two or more traditional bank products. Certain foreign transactions are exempt from the general rule.
Community Reinvestment Act Requirements
The CRA requires the banking agencies to evaluate the record of us and our banking subsidiaries in meeting the credit needs of our local communities, including low and moderate income neighborhoods. These evaluations are considered in evaluating mergers, acquisitions and applications to open a branch or facility and, in the case of a bank holding company that has elected financial holding company status, a CRA rating of “satisfactory” is required to commence certain new financial activities or to acquire a company engaged in such activities. We received a rating of “satisfactory” in our most-recent CRA evaluation.
Rules Affecting Debit Card Interchange Fees
The Federal Reserve Board issued final rules, effective October 1, 2011, establishing standards, including a cap, for debit card interchange fees and prohibiting network exclusivity arrangements and routing restrictions. In July 2013, a U.S. federal district court invalidated the Federal Reserve Board’s interchange fee rule in favor of a group of retailers who argued that the Federal Reserve Board had inappropriately set the new limits on interchange fees too high. The Federal Reserve Board successfully appealed the district court decision and the caps imposed by the final rules remain in effect.
Consumer Financial Protection Regulations
The consumer protection provisions of the Dodd-Frank Act and the examination, supervision and enforcement of those laws and implementing regulations by the CFPB have created a more intense and complex environment for consumer finance regulation. The CFPB is authorized to engage in consumer financial education, track consumer complaints, request data and promote the availability of financial services to underserved consumers and communities. We expect increased oversight of financial services products by the CFPB, which are likely to affect our operations. The CFPB has significant authority to implement and enforce federal consumer finance laws, including the Truth in Lending Act, the Equal Credit Opportunity Act, the Fair Credit Billing Act and new requirements for financial services products provided for in the Dodd-Frank Act, as well as the authority to identify and
213
Table of Contents
prohibit unfair, deceptive or abusive acts and practices. The review of products and practices to prevent such acts and practices is a continuing focus of the CFPB, and of banking regulators more broadly. The ultimate impact of this heightened scrutiny is uncertain but could result in changes to pricing, practices, products and procedures. It could also result in increased costs related to regulatory oversight, supervision and examination, additional remediation efforts and possible penalties.
In addition, the Dodd-Frank Act provides the CFPB with broad supervisory, examination and enforcement authority over various consumer financial products and services, including the ability to require reimbursements and other payments to customers for alleged legal violations and to impose significant penalties, as well as injunctive relief that prohibits lenders from engaging in allegedly unlawful practices. The CFPB also has the authority to obtain cease and desist orders providing for affirmative relief and/or monetary penalties. The Dodd-Frank Act and accompanying regulations, including regulations to be promulgated by the CFPB, are being phased in over time. While some regulations have been promulgated, many others have not yet been proposed or finalized. We cannot predict the terms of all of the final regulations, their intended consequences or how such regulations will affect us or our industry. The Dodd-Frank Act does not prevent states from adopting stricter consumer protection standards. State regulation of financial products and potential enforcement actions could also adversely affect our business, financial condition or results of operations.
Moreover, retail activities of banks are subject to a variety of statutes and regulations designed to protect consumers. Interest and other charges collected or contracted for by banks are subject to state usury laws and federal laws concerning interest rates. Loan operations are also subject to federal laws applicable to credit transactions, such as:
| • | the federal Truth-In-Lending Act and Regulation Z issued by the Federal Reserve Board, governing disclosures of credit terms to consumer borrowers; |
| • | the Home Mortgage Disclosure Act and Regulation C issued by the Federal Reserve Board, requiring financial institutions to provide information to enable the public and public officials to determine whether a financial institution is fulfilling its obligation to help meet the housing needs of the community it serves; |
| • | the Equal Credit Opportunity Act and Regulation B issued by the Federal Reserve Board, prohibiting discrimination on the basis of various prohibited factors in extending credit; |
| • | the Fair Debt Collection Act, governing the manner in which consumer debts may be collected by collection agencies; |
| • | the Service Members Civil Relief Act, applying to all debts incurred prior to commencement of active military service (including credit card and other open-ended debt) and limiting the amount of interest, including service and renewal charges and any other fees or charges (other than bona fide insurance) that is related to the obligation or liability; and |
| • | the guidance of the various federal agencies charged with the responsibility of implementing such federal laws. |
Deposit operations also are subject to, among others:
| • | the Truth in Savings Act and Regulation DD issued by the Federal Reserve Board, which require disclosure of deposit terms to consumers; |
| • | Regulation CC issued by the Federal Reserve Board, which relates to the availability of deposit funds to consumers; |
| • | the Right to Financial Privacy Act, which imposes a duty to maintain the confidentiality of consumer financial records and prescribes procedures for complying with administrative subpoenas of financial records; and |
214
Table of Contents
| • | the Electronic Funds Transfer Act and Regulation E issued by the Federal Reserve Board, which governs automatic deposits to and withdrawals from deposit accounts and customers’ rights and liabilities arising from the use of automated teller machines and other electronic banking services. |
The CFPB has finalized a number of significant rules which will impact nearly every aspect of the lifecycle of a residential mortgage. The final rules require banks to, among other things: (i) develop and implement procedures to ensure compliance with a new “reasonable ability to repay” test and identify whether a loan meets a new definition for a “qualified mortgage,” (ii) implement new or revised disclosures, policies and procedures for servicing mortgages including, but not limited to, early intervention with delinquent borrowers and specific loss mitigation procedures for loans secured by a borrower’s principal residence, (iii) comply with additional restrictions on mortgage loan originator compensation and (iv) comply with new disclosure requirements and standards for appraisals and escrow accounts maintained for “higher priced mortgage loans.” These new rules create operational and strategic challenges for us, as we are both a mortgage originator and a servicer. Forthcoming additional rulemaking affecting the residential mortgage business is also expected. These rules and any other new regulatory requirements promulgated by the CFPB and other federal or state regulators could require changes to our business, result in increased compliance costs and affect the streams of revenue of such business.
In addition, our two banking subsidiaries are currently subject to consent orders issued by the OCC and the FDIC in connection with their findings of deceptive marketing and implementation of some of our checking account and funds transfer products and services. Among other things, the consent orders require us to remedy deficiencies and develop stronger compliance controls, policies and procedures. We have made progress and continue to make progress in addressing these requirements, but the consent orders remain in place and we are unable to predict when they may be terminated.
Commercial Real Estate Lending
Lending operations that involve concentrations of commercial real estate loans are subject to enhanced scrutiny by federal banking regulators. Regulators have advised financial institutions of the risks posed by commercial real estate lending concentrations. Such loans generally include land development, construction loans and loans secured by multifamily property and nonfarm, nonresidential real property where the primary source of repayment is derived from rental income associated with the property. The guidance prescribes the following guidelines for examiners to help identify institutions that are potentially exposed to concentration risk and may warrant greater supervisory scrutiny:
| • | total reported loans for construction, land development and other land represent 100% or more of the institution’s total capital, or |
| • | total commercial real estate loans represent 300% or more of the institution’s total capital, and the outstanding balance of the institution’s commercial real estate loan portfolio has increased by 50% or more during the prior 36 months. |
In 2009, the federal banking regulators issued additional guidance on commercial real estate lending that emphasizes these considerations.
In addition, the Dodd-Frank Act contains provisions that may cause us to reduce the amount of our commercial real estate lending and increasing the cost of borrowing, including rules relating to risk retention of securitized assets. Section 941 of the Dodd-Frank Act requires, among other things, a loan originator or a securitizer of asset-backed securities to retain a percentage of the credit risk of securitized assets. The banking agencies have jointly issued a proposed rule to implement these requirements but have yet to issue final rules.
215
Table of Contents
Transactions with Affiliates and Insiders
A variety of legal limitations restrict us from lending money to, borrowing money from, or in some cases transacting business with CBNA and CBPA. Among such restrictions to which we are subject are Sections 23A and 23B of the Federal Reserve Act and Federal Reserve Board Regulation W. Section 23A places limits on the amount of “covered transactions,” which include loans or extensions of credit to, investments in or certain other transactions with, affiliates, as well as the amount of advances to third parties collateralized by the securities or obligations of affiliates. The aggregate of all covered transactions is limited to 10% of a bank’s capital and surplus for any one affiliate and 20% for all affiliates. Furthermore, within the foregoing limitations as to amount, certain covered transactions must meet specified collateral requirements ranging from 100% to 130%. Also, a bank is prohibited from purchasing low-quality assets from any of its affiliates. Section 608 of the Dodd-Frank Act broadens the definition of “covered transactions” to include derivative transactions and the borrowing or lending of securities if the transaction will cause a bank to have credit exposure to an affiliate. The revised definition also includes the acceptance of debt obligations of an affiliate as collateral for a loan or extension of credit to a third party. Furthermore, reverse repurchase transactions are viewed as extensions of credit (instead of asset purchases) and thus become subject to collateral requirements.
Section 23B prohibits an institution from engaging in certain transactions with affiliates unless the transactions are on terms substantially the same, or at least as favorable to the bank, as those prevailing at the time for comparable transactions with non-affiliated companies. Except for limitations on low-quality asset purchases and transactions that are deemed to be unsafe or unsound, Regulation W generally excludes affiliated depository institutions from treatment as affiliates. Transactions between a bank and any of its subsidiaries that are engaged in certain financial activities may be subject to the affiliated transaction limits. The Federal Reserve Board also may designate banking subsidiaries as affiliates.
Pursuant to Federal Reserve Board Regulation O, we are also subject to quantitative restrictions on extensions of credit to executive officers, directors, principal stockholders and their related interests. In general, such extensions of credit (1) may not exceed certain dollar limitations, (2) must be made on substantially the same terms, including interest rates and collateral, as those prevailing at the time for comparable transactions with third parties and (3) must not involve more than the normal risk of repayment or present other unfavorable features. Certain extensions of credit also require the approval of our Board.
Anti-Money Laundering; USA PATRIOT Act; Office of Foreign Assets Control
Institutions must maintain anti-money laundering programs that include established internal policies, procedures and controls; a designated compliance officer; an ongoing employee training program; and testing of the program by an independent audit function. We are prohibited from entering into specified financial transactions and account relationships and must meet enhanced standards for due diligence in dealings with foreign financial institutions and foreign customers. We also must take reasonable steps to conduct enhanced scrutiny of account relationships to guard against money laundering and to report any suspicious transactions. Recent laws provide law enforcement authorities with increased access to financial information maintained by banks. Anti-money laundering obligations have been substantially strengthened as a result of the USA PATRIOT Act, enacted in 2001 and renewed in 2006. Bank regulators routinely examine institutions for compliance with these obligations and are required to consider compliance in connection with the regulatory review of applications.
The USA PATRIOT Act provides for the facilitation of information sharing among governmental entities and financial institutions for the purpose of combating terrorism and money laundering. The statute also creates enhanced information collection tools and enforcement mechanics for the U.S.
216
Table of Contents
government, including: (1) requiring standards for verifying customer identification at account opening; (2) promulgating rules to promote cooperation among financial institutions, regulators and law enforcement entities in identifying parties that may be involved in terrorism or money laundering; (3) requiring reports by non-financial trades and businesses filed with the Treasury’s Financial Crimes Enforcement Network for transactions exceeding $10,000; and (4) mandating the filing of suspicious activities reports if a bank believes a customer may be violating U.S. laws and regulations. The statute also requires enhanced due diligence requirements for financial institutions that administer, maintain or manage private bank accounts or correspondent accounts for non-U.S. persons.
The Federal Bureau of Investigation may send bank regulatory agencies lists of the names of persons suspected of involvement in terrorist activities. We can be requested to search our records for any relationships or transactions with persons on those lists and may be required to report any identified relationships or transactions. Furthermore, OFAC is responsible for helping to ensure that U.S. entities do not engage in transactions with certain prohibited parties, as defined by various Executive Orders and Acts of Congress. OFAC publishes, and routinely updates, lists of names of persons and organizations suspected of aiding, harboring or engaging in terrorist acts, including the Specially Designated Nationals and Blocked Persons. If we find a name on any transaction, account or wire transfer that is on an OFAC list, we must freeze such account, file a suspicious activity report and notify the appropriate authorities.
Other Regulatory Matters
We and our subsidiaries and affiliates are subject to numerous examinations by federal and state banking regulators, as well as the SEC, FINRA and various state insurance and securities regulators. In some cases, regulatory agencies may take supervisory actions that may not be publicly disclosed, which restrict or limit a financial institution. As part of our regular examination process, our and our banking subsidiaries’ respective regulators may advise us or our banking subsidiaries to operate under various restrictions as a prudential matter. We and our subsidiaries have from time to time received requests for information from regulatory authorities at the federal level or in various states, including state insurance commissions, state attorneys general, federal agencies or law enforcement authorities, securities regulators and other regulatory authorities, concerning their business practices. Such requests are considered incidental to the normal conduct of business.
In order to remedy various weaknesses and meet various regulatory and supervisory challenges, we need to make substantial improvements to our compliance, risk management and other processes, systems and controls. We expect to continue to dedicate significant resources and managerial time and attention and to make significant investments in enhanced compliance, risk management and other processes, systems and controls. We also expect to make restitution payments to our banking subsidiaries’ customers, which could be significant, arising from certain consumer compliance deficiencies and may be required to pay civil money penalties in connection with certain of these deficiencies. We have established reserves in respect of these future payments, but the amounts that we are ultimately obligated to pay could be in excess of our reserves.
The remediation efforts and other matters described above will increase our operational costs and may limit our ability to implement aspects of our strategic plan or otherwise pursue certain business opportunities. Moreover, if we are unsuccessful in remedying these weaknesses and meeting the enhanced supervisory requirements and expectations that apply to us and our banking subsidiaries, we could remain subject to existing restrictions or become subject to additional restrictions on our activities, informal (non-public) or formal (public) supervisory actions or public enforcement actions, including the payment of civil money penalties.
217
Table of Contents
Executive Officers and Directors
The following table sets forth information regarding our executive officers and directors, as of the date of this prospectus:
| Name |
Age |
Position | ||||
| Bruce Van Saun |
57 | Chairman and Chief Executive Officer | ||||
| Mark Casady |
53 | Director | ||||
| Anthony Di Iorio |
70 | Director | ||||
| Robert Gillespie |
59 | Director | ||||
| William P. Hankowsky |
63 | Director | ||||
| Howard W. Hanna III |
67 | Director | ||||
| Leo (“Lee”) I. Higdon |
68 | Director | ||||
| Charles J. (“Bud”) Koch |
68 | Director | ||||
| Robert D. Matthews, Jr. |
51 | Director and Vice Chairman, Commercial Banking | ||||
| Arthur F. Ryan |
71 | Lead Director | ||||
| Shivan S. Subramaniam |
65 | Director | ||||
| Wendy A. Watson |
66 | Director | ||||
| Marita Zuraitis |
54 | Director | ||||
| David Bowerman |
49 | Vice Chairman, Business Services | ||||
| Brad L. Conner |
53 | Vice Chairman, Consumer Banking | ||||
| John J. Fawcett |
55 | Chief Financial Officer | ||||
| Stephen T. Gannon |
61 | Executive Vice President, General Counsel and Chief Legal Officer | ||||
| Ronald S. Ohsberg |
50 | Executive Vice President, Controller | ||||
| Nancy L. Shanik |
60 | Group Executive Vice President, Chief Risk Officer | ||||
Directors
Bruce Van Saun joined our Board as Chairman and Chief Executive Officer in October 2013. From October 2009 through October 2013, Mr. Van Saun served as the RBS Group Finance Director and was a member of its board of directors. From 1997 to 2008, Mr. Van Saun held a number of senior positions with Bank of New York and later Bank of New York Mellon, including vice chairman and chief financial officer. Earlier in his career, he held senior positions with Deutsche Bank, Wasserstein Perella Group and Kidder Peabody & Co. In all, Mr. Van Saun has more than 30 years of financial services experience. Mr. Van Saun has served on the board of directors of our subsidiaries CBNA and CBPA since October 2013, and also served as a director on the boards of our affiliates, The Royal Bank of Scotland plc (from October 2009 to September 2013) and National Westminster Bank plc (from October 2009 to September 2013). In addition, Mr. Van Saun has served as a director on the franchise board of Lloyd’s of London since September 2012. He has previously served on a number of boards in both the United Kingdom and the United States, including the boards of Direct Line Insurance Group plc (from April 2012 to October 2013), WorldPay (Ship Midco Limited) (from July 2011 to September 2013), ConvergEx Inc. (from May 2007 to October 2013), AbitibiBowater (Resolute Forest Products Inc.) Corporation (from June 2005 to April 2008), and Stride Rite Corporation (from June 1999 to December 2005). Mr. Van Saun is a member of the Financial Services Roundtable and The Clearing House supervisory board. Mr. Van Saun holds a B.S. in Business Administration from Bucknell University in 1979 and an M.B.A. in Finance and General Management from the University of North Carolina in 1983.
Mark Casady joined our Board in June 2014. Mr. Casady is chief executive officer and chairman of the board of directors of LPL Financial Holdings Inc. He joined LPL Financial in May 2002 as chief
218
Table of Contents
operating officer, became president in April 2003, and became chief executive officer and chairman in December 2005. Before joining LPL Financial, Mr. Casady was managing director, mutual fund group for Deutsche Asset Management, Americas—formerly Scudder Investments. He joined Scudder in 1994 and held roles as managing director—Americas; head of global mutual fund group and head of defined contribution services. He was also a member of the Scudder, Stevens and Clark board of directors and management committee. Mr. Casady serves on the board of governors of FINRA and the board of directors of the Financial Services Roundtable. He has also served on the boards of our subsidiaries, CBNA and CBPA, since June 2014. Mr. Casady is former chairman of the Insured Retirement Institute and Eze Software Group; Mr. Casady received his B.S. from Indiana University and his M.B.A. from DePaul University.
Anthony Di Iorio has served on our Board since January 2014. Mr. Di Iorio began his career at Peat Marwick (now KPMG) where he worked in the firm’s Financial Institutions Practice in New York and Chicago. After leaving Peat Marwick he worked for several leading financial institutions, including as Co-controller of Goldman Sachs, Chief Financial Officer of the Capital Markets business of NationsBank (now Bank of America), Executive Vice President of Paine Webber and CEO of Paine Webber International. He joined Deutsche Bank in Frankfurt in 2001 and later became the Bank’s Chief Financial Officer and a member of its Board and Group Executive Committee. After retiring in 2008 he served as senior adviser to Ernst & Young working with the firm’s financial services partners in the United Kingdom, Europe, the Middle East and Africa. Mr. Di Iorio served on the board of directors of The Royal Bank of Scotland Group plc and those of its subsidiaries, The Royal Bank of Scotland plc and National Westminster Bank Plc from September 2011 to March 2014, and has served on the board of directors of our subsidiaries CBNA and CBPA since January 2014. Mr. Di Iorio holds a Bachelor of Business Administration from Iona College and an M.B.A. from Columbia University.
Robert Gillespie joined our board in August 2014. Mr. Gillespie began his career with PricewaterhouseCoopers where he qualified as a chartered accountant. He then moved into banking by joining SG Warburg where he specialized in corporate finance and was appointed as a Director of the firm in 1987 and as a Managing Director of its U.S. investment banking business in 1989. Following the acquisition of Warburg by Swiss Bank Corporation in 1995 and that firm’s subsequent merger with Union Bank of Switzerland to form UBS in 1998, Mr. Gillespie held the roles of Head of UK Corporate Finance, Head of European Corporate Finance and Co-Head of UBS’s global business and CEO of the EMEA region. He relinquished his management roles at the end of 2005 and was appointed Vice Chairman of UBS Investment Bank. Mr. Gillespie left UBS to join Evercore Partners, from where he was seconded to the UK Panel on Takeovers and Mergers, as Director General, from 2010 to 2013. Mr. Gillespie resigned from Evercore Partners in March 2013. In December 2013, Mr. Gillespie joined the Board of The Royal Bank of Scotland Group plc and those of its subsidiaries, The Royal Bank of Scotland plc and National Westminster Bank Plc. Mr. Gillespie has also served on the boards of our subsidiaries, Citizens Bank, N.A. and Citizens Bank of Pennsylvania, since August 2014. In addition, Mr. Gillespie serves on the board of directors of Ashurst LLP (since 2013), The Boat Race Company Limited (since 2009), Somerset House Trust and Somerset House Enterprises Limited (since 2003) and serves on the board of directors of Social Finance, Ltd (since 2013) and as a trustee and director of Topolski Memoir Limited (since 2009). Mr. Gillespie has also served on the Council of the University of Durham since 2007, and has been the Chairman of the Council since 2012. Mr. Gillespie received his B.A. in Economics from the University of Durham in 1977, and his A.C.A. from the Institute of Chartered Accountants in England and Wales in 1980.
William P. Hankowsky has served on our Board since November 2006. Mr. Hankowsky is the chairman, president and chief executive officer of Liberty Property Trust. Mr. Hankowsky joined Liberty in January of 2001 as chief investment officer, and was responsible for refining the company’s corporate strategy and investment process. In 2002, he was named president, and in 2003 was appointed chief executive officer and elected chairman of Liberty’s board of trustees. Prior to joining Liberty, Mr. Hankowsky served for 11 years as president of the Philadelphia Industrial Development
219
Table of Contents
Corporation (PIDC), where he oversaw the city’s economic development agency, managing 11 industrial parks, operating 20 loan programs, and coordinating major projects including a new arena, convention center, hotels and stadium. Prior to PIDC, Mr. Hankowsky was the city of Philadelphia’s commerce director. Mr. Hankowsky currently serves on the boards of Aqua America Inc. (NYSE: WTR) since 2004, Interstate General Media (Philadelphia Inquirer, Daily News), Delaware River Waterfront Corporation, Greater Philadelphia Chamber of Commerce, the Kimmel Center for the Performing Arts, the Board of Governors of the National Association of Real Estate Investment Trusts, Philadelphia Convention and Visitors Bureau, Pennsylvania Academy of the Fine Arts, and Philadelphia Shipyard Development Corporation. Mr. Hankowsky has also served on the board of directors of our subsidiaries CBNA and CBPA since November 2006. Mr. Hankowsky received a Bachelor of Arts degree in economics from Brown University.
Howard W. (“Hoddy”) Hanna III has served on our Board since June 2009. Mr. Hanna is the chairman and chief executive officer of Howard Hanna Real Estate Services, Inc. Mr. Hanna became a sales associate in 1970 and the General Manager of Howard Hanna Real Estate Services in 1974. Mr. Hanna became Chief Operating Officer of Howard Hanna Real Estate Services and its parent company, Hanna Holdings, Inc. when the company incorporated in 1979 and then became President in 1983 and Chief Executive Officer in 1990. Howard Hanna Real Estate Services, Inc. offers a full range of mortgage origination products and services in certain geographies and, in this capacity, competes with us in Pennsylvania, Ohio and Michigan. Mr. Hanna currently serves as the Chair of the Children’s Hospital of Pittsburgh Foundation Board of Trustees. He is a member of the Children’s Hospital of Pittsburgh of UPMC Board of Trustees and he serves on the Hospital Board’s Finance and Investment Committee. Mr. Hanna also serves on the boards of John Carroll University, LaRoche College, the Katz Graduate School of Business Board of Visitors, University of Pittsburgh, the Diocese of Pittsburgh Finance Council and the YMCA of Greater Pittsburgh. From 2007 to 2012, Mr. Hanna served on the board of directors of the Federal Reserve Bank of Cleveland’s Pittsburgh office. Mr. Hanna has also served on the board of directors of our subsidiaries CBNA and CBPA since June 2009. Mr. Hanna received a Bachelor of Science degree from John Carroll University in 1969.
Leo (“Lee”) I. Higdon joined our Board in August 2014. From 2006 to 2013, Mr. Higdon was the President of Connecticut College. Mr. Higdon currently serves on the board of directors of Eaton Vance Corporation, where he is non-executive chairman (since 2000), and HealthSouth Corporation, where he is lead director (since 2004). From 2001 to 2006, he was the President of the College of Charleston. Prior to becoming President of the College of Charleston, Mr. Higdon was the President of Babson College and the Dean of the Darden Graduate School of Business Administration at the University of Virginia. Mr. Higdon spent over 20 years at Salomon Brothers Inc, holding various positions, including Vice President and Managing Director, and Vice Chairman from 1988 to 1993. In addition, Mr. Higdon previously served on the board of directors of Bestfoods, Inc., Chemtura Corporation and Newmont Mining Corporation. Mr. Higdon earned a B.A. in history from Georgetown University and a M.B.A. in Finance from the University of Chicago.
Charles (“Bud”) Koch has served on our Board since September 2004. He also serves on the board of directors of our subsidiaries CBNA and CBPA. Mr. Koch is the retired Chairman of the Board and Chief Executive Officer of Charter One Financial and its subsidiary Charter One Bank. He served as Charter One’s Chief Executive Officer from 1987 to 2004 and as its Chairman from 1995 to 2004, when the bank was sold to RBS. Mr. Koch was a director of RBS and its subsidiaries Royal Bank of Scotland plc and National Westminster Bank from 2004 until February 2009. Mr. Koch has been a director of Assurant Inc. (AIZ) since August 2005, and he currently serves as Chair of the Assurant Finance and Investment Committee, and a member of its Compensation Committee. Mr. Koch has been a director of the Federal Home Loan Bank of Cincinnati since 1990. He was Chairman of the Board of the FHLB of Cincinnati from 2005 to 2006, and he currently serves on its Risk Committee, its Compensation Committee and its Nomination and Governance Committee. His long tenure on the
220
Table of Contents
FHLB of Cincinnati Board has been interrupted twice, for a total of 3 years, due to term limitations. Mr. Koch serves as a trustee of Case Western Reserve University, and he served as its Chairman of the Board from 2008 to 2012. He is also a past Chairman of the Board of John Carroll University. Mr. Koch graduated from Lehigh University with a B.S. in Industrial Engineering and earned a MBA from Loyola College in Baltimore, Maryland.
Robert D. Matthews, Jr. has served on our Board since July 2009. Mr. Matthews is Vice Chairman of CFG, with specific responsibility for the Commercial Banking business lines including Corporate Banking, Commercial Finance, Corporate Finance and Capital Markets and Treasury Solutions. Mr. Matthews also oversees the State Presidents who represent our overall franchise in our 12 markets under the Citizens Bank and Charter One brands and oversees both our Community Reinvestment Act and Public and Government Affairs functions. Prior to assuming his current position in 2009, Mr. Matthews was a member of the Executive Leadership Group at Citizens Bank and was responsible for Commercial Markets. Mr. Matthews joined our leadership team in 2007 from Citigroup Inc., where he was Executive Vice President and Head of U.S. Commercial and Middle Market Banking. Mr. Matthews has served on the board of directors of the Private Export Funding Corporation since 2011 and is a member of that board’s Audit and Risk Committees. Mr. Matthews has also served on the board of directors of our subsidiaries CBNA and CBPA since July 2009. Mr. Matthews received a Bachelor’s degree in Economics from Harvard College in 1985 with an emphasis on labor relations and bargaining behavior.
Arthur F. Ryan has served on our Board since April 2009. Mr. Ryan is the former Chairman, Chief Executive Officer and President of Prudential Financial, Inc., one of the largest diversified financial institutions in the world. After 13 years at Prudential, he retired as CEO and President in 2007 and he retired as Chairman in May 2008. Prior to joining Prudential in 1994, Mr. Ryan worked at Chase Manhattan Bank for 22 years. He ran Chase Manhattan’s worldwide retail bank between 1984 and 1990, and he became President and Chief Operating Officer in 1990. Mr. Ryan served on the board of directors of The Royal Bank of Scotland Group plc and those of its subsidiaries, The Royal Bank of Scotland plc and National Westminster Bank Plc from October 2008 to September 2013, and has served as a non-executive director of Regeneron Pharmaceuticals, Inc. since January 2003. Mr. Ryan has also served on the board of directors of our subsidiaries CBNA and CBPA since April 2009.
Shivan S. Subramaniam has served on our Board since January 2005. Mr. Subramaniam has been the Chairman and Chief Executive Officer of Factory Mutual Insurance Company since 2002 and President and Chief Executive Officer since 1999. Mr. Subramaniam is responsible for strategic and operational direction at FM Global, which is one of the world’s leading commercial and industrial property insurers. Previously, Mr. Subramaniam served as Chairman and Chief Executive Officer at Allendale Insurance, a predecessor company of FM Global. Elected president of Allendale in 1992, he held a number of senior-level positions in finance and management after joining the company in 1974. Mr. Subramaniam’s career spans nearly 40 years in the insurance industry. Mr. Subramaniam has served on the board of directors of Lifespan Corporation since December 2006, and is a trustee of Bryant University and a director of the Rhode Island Public Expenditure Council (RIPEC). Mr. Subramaniam has also served on the board of directors of our subsidiaries CBNA and CBPA since January 2005. Mr. Subramaniam received his bachelor’s degree in mechanical engineering from the Birla Institute of Technology, Pilani, India, and has since earned two master’s degrees—one in operations research from the Polytechnic at New York University, and another in management from the Sloan School of Management at the Massachusetts Institute of Technology.
Wendy A. Watson has served on our Board since October 2010. Until her retirement in 2009, Ms. Watson was the Executive Vice President, Global Services for State Street Bank & Trust Company. Ms. Watson joined State Street Bank & Trust Company in 2000. Previously, Ms. Watson was with the Canadian Imperial Bank of Commerce where she served as head of the Global Private
221
Table of Contents
Banking and Trust business and President & CEO CIBC Finance. She has also served as Chief Information Officer and as head of Internal Audit for Confederation Life Insurance Company in Toronto. Ms. Watson began her career in the audit department of Sun Life Assurance Company in Canada where she rose to become the No. 2 person in the company’s 70-person global audit function. Ms. Watson has served as a director of CMA Holdings Canada since 2010, of DAS Canada Insurance Company (a subsidiary of Munich Re) since 2010, and of the Independent Order of the Foresters Live Insurance Company since 2013. Ms. Watson’s years of board service also include Chair of the Board of two of State Street Bank’s multi-national entities—State Street Syntel Private Ltd (India) and State Street Syntel Services Ltd (Mauritius). Ms. Watson currently serves on the Community Service Committee of Boston Children’s Hospital and the Advisory Board of Crittenten Women’s Union. Ms. Watson has also served on the board of directors of our subsidiaries CBNA and CBPA since October 2010. In addition to her corporate directorship roles, Ms. Watson is also currently a member of the Editorial Board of the “Intelligent Outsourcer” Journal and has served as a member of the board of directors of the Women’s College Hospital and the Women’s College Hospital Foundation in Toronto. Ms. Watson is a magna cum laude graduate of McGill University in Montreal with a Bachelor of Commerce degree with majors in Accounting and Law. Ms. Watson holds an advanced Professional Director Certification from the American College of Corporate Directors, a public company director education and credentialing organization. She is a fellow of the National Association of Corporate Directors. She is also a CPA and Certified Fraud Examiner.
Marita Zuraitis has served on our Board since May 2011. Ms. Zuraitis is Director, President and Chief Executive Officer of the Horace Mann Educators Corporation. Prior to joining Horace Mann in May 2013, Ms. Zuraitis served as Executive Vice President and a member of the Executive Leadership Team for The Hanover Insurance Group, Inc. While at The Hanover Insurance Group, Ms. Zuraitis served as President, Property and Casualty Companies, responsible for the personal and commercial lines of operation at Citizens Insurance Company of America, The Hanover Insurance Company and their affiliates, a position she held since 2004. Prior to 2004, Ms. Zuraitis was with The St. Paul Travelers Companies for six years, where she achieved the position of President and Chief Executive Officer, Commercial Lines. She also held a number of increasingly responsible underwriting and field management positions with United States Fidelity and Guaranty Company and Aetna Life and Casualty. Ms. Zuraitis has 30 years of experience in the insurance industry. Ms. Zuraitis has served as a member of the board of trustees for the American Institute for Chartered Property and Casualty Underwriters (“The Institutes”) since June 2009. Ms. Zuraitis is a member of the executive committee and the compensation committee of The Institutes. Ms. Zuraitis has also served on the board of directors of our subsidiaries CBNA and CBPA since May 2011. She is also a past Chairperson of the board of trustees for NCCI Holdings, Inc., a provider of workers’ compensation data analytics based in Boca Raton, Florida, and a past member of the board of Worcester Academy in Worcester, Massachusetts. A graduate of Fairfield University in Fairfield, Connecticut, Ms. Zuraitis completed the Advanced Executive Education Program at the Wharton School of Business and the Program on Negotiations at Harvard University.
Executive Officers
David Bowerman is Vice Chairman, Head of Citizens Business Services with responsibility for Operations, Technology, Property, Procurement and Security across Citizens entities in the Americas. Prior to assuming his current position in 2008, Mr. Bowerman was Managing Director, UK and European Operations, with RBS plc, with responsibility for eight Business Services operations and a staff of 21,000 supporting RBS’s income-generating divisions. Mr. Bowerman joined NatWest Bank in 1982. During his years with RBS, he has undertaken a range of retail and corporate roles. He gained extensive experience and built a wide portfolio of successes in leading and implementing significant cultural change and organizational strategies. Mr. Bowerman is a fellow of the Chartered Institute of
222
Table of Contents
Bankers in Scotland. He was educated in England and attended Harvard Business School’s Advanced Management Program. Mr. Bowerman has served on the board of the Institute for the Study and Practice of Nonviolence, in Providence, R.I., since 2011.
Brad L. Conner is Vice Chairman of our Consumer Banking Division. He is responsible for Retail Banking, Business Banking, Wealth Management, Home Lending Solutions, Auto Finance and Education Finance, as well as the Consumer Phone Bank and online channels. Before joining CFG in 2008, Mr. Conner was President of JP Morgan Chase & Co.’s Home Equity and Mortgage Home Loan Direct business. He previously oversaw the combined home equity business of Chase and Bank One after the companies merged in 2004, and served as CEO of Chase’s Education Finance businesses. In his 12 years at Bank One/Chase, Mr. Conner played a key leadership role in the growth and evolution of the company’s mortgage and home equity businesses. Mr. Conner served as a director for the Rhode Island Public Expenditure Council from 2010 through 2012. Since 2009, he has served on the board of trustees of the Dave Thomas Foundation for Adoption, where he has served as treasurer since 2011, and he currently serves on its audit committee and its Committee for Institutional Advancement. He has also been a member of the Consumer Bankers Association board of directors since 2011. Mr. Conner has a B.A. and M.B.A. from the University of Arkansas.
John J. Fawcett is our Chief Financial Officer. Mr. Fawcett’s functional responsibilities include financial management functions including controllers, financial reporting, planning and analysis, tax management, treasury, corporate strategy and investor relations. In January 2008, Mr. Fawcett joined CFG from Citigroup Inc., where he held various roles over the course of a 20-year career including Chief Financial Officer for Trading and Capital Markets; Head of Planning and Analysis for the Global Corporate and Investment Bank; and most recently Chief Financial Officer for the Global Transactions Services Business. Mr. Fawcett earned a B.S. in accounting and an M.B.A. in finance from St. John’s University.
Stephen T. Gannon is our General Counsel and Chief Legal Officer. Mr. Gannon is responsible for overseeing our legal department, providing strategic leadership to the management of legal risk and overseeing an integrated legal function. Prior to joining CFG in August 2014, Mr. Gannon was the Executive Vice-President and Deputy General Counsel of Capital One Financial Corporation. In his seven years at Capital One Financial Corporation, Mr. Gannon was responsible for advising on litigation and regulatory matters, transactional and product line matters as well as policy affairs and governance and, in January 2014, was appointed to serve as Market President for Central Virginia. Mr. Gannon was previously the General Counsel – Retail Brokerage Group at Wachovia Securities LLC, a partner and head of the securities litigation practice at LeClair Ryan, P.C., a partner at McSweeney, Burtch, and Crump, P.C., as well as a Staff Attorney and Branch Chief at the Securities and Exchange Commission. Mr. Gannon earned an A.B. in History and a J.D. from Georgetown University.
Ronald S. Ohsberg is our Corporate Controller. He is responsible for financial reporting, accounting policy, accounting operations, treasury operations and Finance Division risk and control. In 2004, Mr. Ohsberg joined CFG after working at FleetBoston Financial, where over a 12-year period he held various managerial roles, most recently as Director of Accounting. Prior to that he was an audit manager with KPMG. Mr. Ohsberg earned B.S. degrees in accounting and finance and an M.B.A. from the University of Rhode Island. He also is a CPA.
Nancy L. Shanik is our Chief Risk Officer. She is responsible for overseeing our risk management organization, including its vision, strategy development and execution and day-to-day operations. She is a member of the RBS Americas Risk Committee and the RBS Group Risk Board. Ms. Shanik serves on the board of the Kleinfelder Group and she also chairs its audit committee. Ms. Shanik joined CFG in 2010 from Alvarez & Marsal in New York, where she had been a managing director since 2009. Prior
223
Table of Contents
to this, Ms. Shanik spent 31 years with Citigroup Inc. in positions of increasing responsibility. She was both a Managing Director and Senior Credit Officer and served as the Chief Credit Officer of Citigroup Inc.’s Global Commercial Markets business. She has developed broad-based and hands-on leadership, management and restructuring experience throughout her diverse career. Ms. Shanik earned an M.B.A. from Tulane University Graduate School of Business with concentrations in corporate finance and accounting, and a bachelor’s degree cum laude in marketing and communication theory from the University of Vermont. She also attended the Stanford University Executive Program.
Board Composition
Following completion of this offering, our Board will consist of 13 directors, Bruce Van Saun, Mark Casady, Anthony Di Iorio, Robert Gillespie, William P. Hankowsky, Howard W. Hanna III, Leo (“Lee”) I. Higdon, Charles J. (“Bud”) Koch, Robert D. Matthews, Jr., Arthur F. Ryan, Shivan S. Subramaniam, Wendy A. Watson and Marita Zuraitis. As part of our separation from the RBS Group, we intend to enter into the Separation Agreement, which will provide the RBS Group with certain rights relating to the composition of our Board. See “Our Relationship with the RBS Group and Certain Other Related Party Transactions—Relationship with the RBS Group—Separation and Shareholder Agreement.”
Mr. Van Saun serves as our Chairman of the Board and Chief Executive Officer. When the Chairman of the Board is also the Chief Executive Officer, our Corporate Governance Guidelines provide for the election of one of our independent directors to serve as Lead Director. Mr. Ryan currently serves as our Lead Director, and is responsible for serving as liaison between the Chairman and the independent directors, approving meeting agendas and schedules for our Board and presiding at executive sessions of the independent directors and any other board meetings at which the Chairman is not present, among other responsibilities.
We have determined that each of Mr. Casady, Mr. Di Iorio, Mr. Gillespie, Mr. Hankowsky, Mr. Hanna, Mr. Higdon, Mr. Koch, Mr. Ryan, Mr. Subramaniam, Ms. Watson and Ms. Zuraitis is an independent director within the meaning of the applicable rules of the SEC and NYSE. In addition, each of Mr. Di Iorio, Mr. Hankowsky, Mr. Hanna, Mr. Koch and Ms. Watson is also an independent director under Rule 10A-3 of the Securities Exchange Act of 1934, as amended (the “Exchange Act”) for the purpose of audit committee membership, and each of Mr. Ryan, Mr. Hankowsky and Ms. Watson is also an independent director under Rule 10C-1 of the Exchange Act for the purpose of compensation committee membership. Our Board has determined that each of Mr. Di Iorio, Mr. Hankowsky, Mr. Hanna, Mr. Koch and Ms. Watson is a financial expert within the meaning of the applicable rules of the SEC and NYSE.
Background and Experience of Directors
When considering whether directors and nominees have the experience, qualifications, attributes or skills, taken as a whole, to enable our Board to satisfy its oversight responsibilities effectively in light of our business and structure, the Board focuses primarily on each person’s background and experience as reflected in the information discussed in each of the directors’ individual biographies set forth above. We believe that our directors provide an appropriate mix of experience and skills relevant to the size and nature of our business. In particular, the members of our Board considered the following important characteristics, among others:
| • | Mr. Van Saun—we considered his experience as an executive in the financial services industry, his extensive financial background and his experience serving on the boards of other public companies, including RBS. Furthermore, we also considered how his additional role as our Chief Executive Officer would bring management’s perspective to Board deliberations and provide valuable information about the status of our day-to-day operations. |
224
Table of Contents
| • | Mr. Casady—we considered his experience as an executive in the financial services industry, including his experience as chief executive officer of LPL Financial Holdings Inc., and his experience serving on the boards of directors of the Insured Retirement Institute, Eze Software Group and the Financial Services Roundtable and the board of governors of FINRA. |
| • | Mr. Di Iorio—we considered his experience as an executive in the financial services industry, including his experience as chief financial officer of Deutsche Bank, his extensive financial background and his experience serving on the boards of other public companies, including RBS. |
| • | Mr. Gillespie—we considered his experience as an executive in the financial services industry, including his experience as Co-Head of UBS’s global business, CEO of UBS’s EMEA region and Vice Chairman of UBS Investment Bank, his extensive financial background and his experience serving on the boards of other public companies, including RBS. |
| • | Mr. Hankowsky—we considered his extensive business and management expertise, including his experience as chief executive officer of Liberty Property Trust, his service as president of PIDC, his experience serving on the boards of numerous public companies and non-profit entities and his experience in the real estate sector. |
| • | Mr. Hanna—we considered his extensive business and management expertise, his experience serving on the boards of numerous non-profit entities and the board of directors of the Federal Reserve Bank of Cleveland’s Pittsburgh office and his experience in the real estate and mortgage origination sectors. |
| • | Mr. Higdon—we considered his experience as an executive in the financial services industry, including his experience as Vice President and Managing Director and Vice Chairman of Salomon Brothers Inc and his experience serving on the boards of other public companies, including Eaton Vance Corporation and HealthSouth Corporation. |
| • | Mr. Koch—we considered his experience as an executive in the financial services industry, including his experience as chief executive officer of Charter One Financial, his experience serving on the boards of other public companies and the FHLB of Cincinnati and his experience in the retail banking sector. |
| • | Mr. Matthews—we considered his experience as an executive in the financial services industry and his experience serving on the board of the Private Export Funding Corporation. Furthermore, we also considered how his additional role as Vice Chairman of CFG overseeing the Commercial Banking business lines, among other areas, as well as his experience as Head of U.S. Commercial and Middle Market Banking at Citigroup Inc. would bring management’s perspective and industry insight to Board deliberations and provide valuable information about the status of our day-to-day operations. |
| • | Mr. Ryan—we considered his experience as an executive in the financial services industry, including his experience as chief executive officer of Prudential Financial, Inc., his experience serving on the boards of other public companies and his experience in the retail banking sector. |
| • | Mr. Subramaniam—we considered his extensive business and management expertise, including his experience as chief executive officer of FM Global, and his experience serving on the boards of directors of FM Global and Lifespan Corporation and the board of trustees of Bryant University. |
| • | Ms. Watson—we considered her experience as an executive in the financial services industry, her extensive financial background and her experience serving on the boards of other financial services companies. |
225
Table of Contents
| • | Ms. Zuraitis—we considered her experience as an executive in the financial services industry, her experience serving on the boards of Horace Mann Educators Corporation and NCCI Holdings, Inc. and her experience in the insurance sector. |
Board Committees
Upon completion of this offering, the standing committees of our Board will consist of the following committees:
The Audit Committee will consist of Ms. Watson, Mr. Di Iorio, Mr. Hankowsky, Mr. Hanna and Mr. Koch, with Ms. Watson serving as chair, and be comprised entirely of independent directors. The Audit Committee operates pursuant to a charter approved by the Board. The Audit Committee reviews and, as it deems appropriate, recommends to our Board our internal accounting and financial controls and the accounting principles and auditing practices and procedures to be employed in preparation and review of our financial statements. The Audit Committee is also directly responsible for the engagement and oversight of independent public auditors.
The Compensation and Human Resources Committee (formerly named the Compensation Advisory Committee), or Compensation Committee, will consist of Mr. Ryan, Mr. Hankowsky and Ms. Watson, with Mr. Ryan serving as chair, and be comprised entirely of independent directors. The Compensation Committee operates pursuant to a charter approved by the Board. The Compensation Committee is responsible for, among other things, reviewing and approving our overall compensation philosophy, determining the compensation of our executive officers and directors, administering our incentive and equity-based compensation plans, and succession planning.
The Nominating and Corporate Governance Committee will consist of Mr. Subramaniam, Mr. Di Iorio and Mr. Ryan, with Mr. Subramaniam serving as chair, and be comprised entirely of independent directors. The Nominating and Corporate Governance Committee operates pursuant to a charter approved by the Board. The Nominating and Corporate Governance Committee reviews and, as it deems appropriate, recommends to the Board policies and procedures relating to director and board committee nominations and corporate governance policies.
The Risk Committee will consist of Mr. Koch, Mr. Casady, Mr. Subramaniam, Ms. Watson and Ms. Zuraitis, with Mr. Koch serving as chair. The Risk Committee operates pursuant to a charter approved by the Board. The Risk Committee reviews and, as it deems appropriate, recommends to the Board the design and implementation of our risk strategy and policy, risk appetite framework and specific risk appetites and limits. The Risk Committee also oversees our risk management function and reviews the due diligence of any proposed strategic transaction.
Compensation Committee Interlocks and Insider Participation
During 2014, no member of our Compensation Committee has been one of our officers or employees, and none has had any relationships with our company of the type that is required to be disclosed under Item 404 of Regulation S-K. None of our executive officers serves or has served as a member of our Board, Compensation Committee or other board committee performing equivalent functions of any entity that has one or more executive officers serving as one of our directors or on our Compensation Committee.
Corporate Governance Guidelines and Code of Business Conduct and Ethics
Our Board has adopted Corporate Governance Guidelines, which set forth a flexible framework within which our Board, assisted by Board committees, directs our affairs. The Guidelines address,
226
Table of Contents
among other things, the composition and functions of the Board, director independence, compensation of directors, management succession and review, Board committees and selection of new directors.
Our Board has also adopted a Code of Business Conduct and Ethics, which sets forth key guiding principles concerning ethical conduct and is applicable to all of our directors, officers and employees. The Code addresses, among other things, conflicts of interest, protection of confidential information and compliance with laws, rules and regulations, and describes the process by which any concerns about violations should be reported.
The Corporate Governance Guidelines and the Code of Business Conduct Ethics will be available on our corporate website. We expect that any amendments to these codes, or any waivers of their requirements, will be disclosed on our website.
227
Table of Contents
COMPENSATION DISCUSSION AND ANALYSIS
Introduction
This Compensation Discussion & Analysis, or CD&A, focuses on our executive compensation philosophy and program. In particular, the CD&A and the compensation tables that follow focus on the compensation paid to our named executive officers, or NEOs, with respect to fiscal year 2013. Our NEOs are executive officers who served in the roles of our Chief Executive Officer, or CEO, and Chief Financial Officer, or CFO, during 2013 as well as our three next most highly compensated executive officers during 2013, all of whom are named below:
| Name |
Position | |
| Bruce Van Saun |
Chairman and Chief Executive Officer | |
| John J. Fawcett |
Chief Financial Officer | |
| Robert D. Matthews, Jr. |
Head of Commercial Banking | |
| Brad L. Conner |
Head of Consumer Banking | |
| Nancy L. Shanik |
Chief Risk Officer | |
| Name of Former Executive |
Position | |
| Ellen Alemany |
Former Chairman and Chief Executive Officer | |
Background
Our Compensation Committee has been involved with the evaluation of the performance of our executive team, has provided oversight with respect to our executive compensation decisions, and has been actively engaged with senior management in talent management and management succession planning.
As a wholly owned subsidiary of RBS prior to this offering, the compensation packages of our NEOs, which are guided by U.S. market data, have been governed by the compensation philosophy and objectives of RBS, and have been subject to approval by the RBS Performance and Remuneration Committee of the board of directors of RBS, or RemCo, and compliance with all applicable laws and regulations. See “—Applicability of UK and European Remuneration Rules” below for further details. This CD&A describes compensation programs and decisions as they relate to our NEOs.
Compensation Philosophy & Objectives
The fundamental principles that RBS follows in designing and implementing compensation programs for our NEOs are to:
| • | attract, retain, motivate and reward high-caliber executives to deliver long-term business performance within acceptable risk parameters; |
| • | provide clear alignment between annual and long-term compensation for executives and RBS/divisional strategic plans; |
| • | support a culture where employees recognize the importance of serving customers well and are rewarded for superior individual performance; and |
| • | encourage the creation of value over the long-term and align the rewards of the participants with the returns to shareholders. |
228
Table of Contents
Executive Compensation Procedures
Role of RemCo
Prior to this offering RemCo has been responsible for the approval, evaluation and oversight of our executive officer compensation and has approved base salaries, equity grants and annual bonus awards for our NEOs, in each case, following consideration by our Compensation Committee. Our CEO works with our Compensation Committee to formulate compensation recommendations to be submitted to RemCo for all NEOs other than himself. None of our NEOs attend the RemCo meeting at which it is determined whether such recommendations should be approved. Following this offering, while we remain subject to UK and European remuneration regulations, RemCo’s role with respect to our executive compensation will be more limited and will be to work with our Compensation Committee to ensure compliance with those regulations. For further details, see “—Applicability of UK and European Remuneration Rules” below.
Role of Compensation Committee
Our Compensation Committee is composed of independent directors for purposes of the NYSE listing rules, Section 16 of the Exchange Act and Section 162(m) of the Internal Revenue Code of 1986, as amended (together with applicable regulations, “Section 162(m)”). Our Compensation Committee’s role with respect to the compensation of our NEOs has been largely advisory as executive compensation decisions are formally approved by RemCo, as described above. Historically, including during 2013, our CEO and Head of Human Resources presented executive compensation proposals to our Compensation Committee for its review and feedback prior to submission to RemCo for approval, but our Compensation Committee did not formally approve compensation decisions relating to our NEOs.
Following this offering, our Compensation Committee will continue to be composed of independent directors and will be responsible for establishing, implementing and monitoring the administration of our executive compensation plans and programs and for approving our executive officer compensation. RemCo will work with our Compensation Committee to ensure compliance with UK and European remuneration regulations while those regulations apply to us. For further details, see “—Applicability of UK and European Remuneration Rules” below. For more on our Compensation Committee’s responsibilities, see “Management—Board Committees” above. Our Compensation Committee is expected to have the ability to delegate its authority to subcommittees when it deems it appropriate and in our shareholders’ best interests. Under its charter, our Compensation Committee will have the ability to delegate to one or more of our officers the authority to make equity grants to employees other than our executive officers in accordance with, and under our, proposed omnibus incentive plan. See “—Our Anticipated NEO Compensation Program Following the Offering—Omnibus Incentive Plan” for details.
Role of Compensation Consultants
PricewaterhouseCoopers LLP
The advisers to RemCo are appointed independently by RemCo, which reviews its selection of advisers annually. The advisers are instructed by, and report directly to, RemCo. The Chair of RemCo approves the fees for the advisers. PricewaterhouseCoopers LLP, or PwC, was appointed as RemCo’s remuneration adviser on September 14, 2010, and PwC’s appointment is reconfirmed by RemCo annually, including most recently in July 2013, as part of an annual review of the quality of advice received and fees charged. PwC is a signatory to the voluntary code of conduct in relation to remuneration consulting in the UK. PwC also provides professional services in the ordinary course of business, including assurance, advisory, tax and legal advice to subsidiaries of RBS. During 2013,
229
Table of Contents
PwC attended each of the nine scheduled RemCo meetings and, with respect to our executive compensation, was involved in reviewing recommendations on our executive compensation issues.
McLagan
Historically, including for 2013, our management has retained McLagan to provide peer survey data that is referred to in making executive compensation recommendations for the upcoming year. In October 2012, McLagan provided survey data regarding the compensation of our executives relative to executives in similar roles at the following companies, as applicable: Bank of America Corp.; BMO Financial Group; Citigroup Inc.; Fifth Third Bancorp; First Niagara Financial Group, Inc.; HSBC Holdings plc; Huntington Bancshares, Inc.; JP Morgan Chase & Co.; KeyCorp; M&T Bank Corp.; PNC Financial Services Group, Inc.; SunTrust Banks, Inc.; The Toronto-Dominion Bank; Webster Financial Corp.; and Wells Fargo & Company. This information was referred to by management in making compensation recommendations for our NEOs for 2013, other than for Mr. Van Saun, who was not our employee at the time. The relevant companies were selected because they are among the companies with which we compete for talent.
In preparing executive compensation recommendations that are ultimately submitted to RemCo, our management refers to the survey data provided by McLagan as a reference point for pay levels and practices and considers such data relevant to, but not determinative of, their consideration of overall executive compensation matters. Going forward, we anticipate that McLagan will continue to provide us with survey data and that Compensation Advisory Partners (discussed below) will also be involved in selecting the companies that should be included in that survey data. Survey data gathered by McLagan is not provided directly to RemCo or our Compensation Committee but is referred to by management when formulating executive compensation recommendations that are presented to our Compensation Committee for feedback and ultimately to RemCo for approval.
Frederic W. Cook & Co., Inc.
In anticipation of our transition to public company status, in December 2013, our management engaged Frederic W. Cook & Co., Inc., or Cook, to advise on public company director and executive compensation design. While our Compensation Committee was conducting a search for its own independent compensation consultant, Cook was engaged to provide us information regarding the executive compensation programs of our public company peers and to provide advice regarding compensation considerations relevant to public companies, such as Section 162(m). We did not engage Cook for any additional services outside of executive and director compensation consulting.
Compensation Advisory Partners
In March 2014, our Compensation Committee retained Compensation Advisory Partners, LLC, or CAP, to provide guidance and advice going forward on compensation-related matters, including changes to our executive and director compensation structure following this offering. CAP was directly selected and retained by our Compensation Committee to provide a broad set of services pertaining to the compensation of our executives and our directors. We do not engage CAP for any additional services outside of executive and director compensation consulting. In connection with CAP’s retention, our Compensation Committee conducted an assessment of potential conflicts of interest of CAP, and no conflicts of interest relating to its services were identified.
Role of Management
Our CEO annually reviews the performance of each of the other NEOs. Following this review, the CEO, together with our Head of Human Resources, makes compensation recommendations for the
230
Table of Contents
NEOs other than himself, including recommendations for salary adjustments, annual incentives and long-term equity-based incentive awards, to our Compensation Committee for review and feedback. Our CEO then submits these proposals to RemCo for approval. During 2013, RemCo also considered at its meetings the views of the RBS Chairman, Group Chief Executive, RBS Finance Director, RBS Human Resources Director, RBS Head of Reward, RBS Secretary and RBS Chief Risk Officer with respect to executive compensation.
Going forward, we expect that our CEO will similarly be engaged in compensation decisions relating to the other NEOs. Our CEO does not and will not have any role in determining his own compensation.
Components of Our Executive Compensation Program and Analysis
The following table presents the principal elements of the compensation program that applied to our NEOs for the 2013 performance year and the objective of each element:
| Element of Pay |
Objective |
Operation | ||
| Base Salary | To attract and retain employees by being competitive in the specific market in which each individual employee works. | Base salaries are reviewed annually and should reflect the talents, skills and competencies of the individual. Salaries should be sufficient so that inappropriate risk-taking is not encouraged. | ||
| Annual Incentives | To support a culture where employees recognize the importance of serving customers well and are rewarded for superior individual performance. | The annual incentive pool is based on RemCo’s review and holistic assessment of our performance against a number of financial and operational performance-related guideposts, including customer, financial, risk and people (such as employee engagement and leadership) measures. Allocation from the pool depends on divisional, functional and individual performance. Individual performance assessment is supported by a structured performance management framework.
Under the RBS-wide deferral arrangements, a significant proportion of annual incentive awards for our more senior and higher-paid employees are deferred (part in RBS bonds (with interest in certain prior years) and part as a right to receive RBS shares) over a three-year period. Deferred awards are subject to clawback, which for 2014 awards includes post-vesting clawback, as discussed in “—Clawback Policy” below. For individuals who are considered “Code Staff” under UK rules, which for 2013 included Mr. Van Saun and Mss. Shanik and Alemany, at least 50% of any annual incentive must be delivered in the form of shares or share-linked instruments and be subject to an additional six-month retention period post-vesting. See “—Applicability of UK and European Remuneration Rules” below for details.
| ||
231
Table of Contents
| Element of Pay |
Objective |
Operation | ||
| Deferred awards in the form of the right to receive RBS shares held by our employees will be converted into equity awards of our stock upon completion of this offering. For details, see “—Our Compensation in Connection with this Offering—Conversion of Outstanding RBS Deferred Share Awards and RBS LTIP Awards Following This Offering” below. | ||||
| Long-Term Incentive Plan | To encourage the creation of value over the long term and to align the rewards of the participants with the returns to shareholders. | RBS provides certain employees in senior roles (including our NEOs) with long-term incentive awards.
Awards for our NEOs have historically been structured as performance-vesting share units. Vesting after a three-year period is based partly on RBS, divisional and/or functional performance (except for our CEO, for whom vesting is based solely on RBS performance). Vesting levels may vary between 0 and 100%.
Awards are subject to clawback, which for 2014 awards includes post-vesting clawback, as discussed in “—Clawback Policy” below. For individuals who are considered “Code Staff,” which for 2013 included Mr. Van Saun and Mss. Shanik and Alemany, these awards (including Special IPO Awards described below) are subject to a six-month retention period post-vesting. See “—Applicability of UK and European Remuneration Rules” below for details.
In anticipation of this offering, our employees, including our NEOs, received special equity awards in lieu of traditional performance-vesting share units, the terms of which are described in “—Our Compensation in Connection with This Offering—Special IPO Awards Granted in 2014” below.
Long-term incentive awards, including special equity awards relating to this offering, held by our employees will be converted into equity awards of our stock upon completion of this offering. For details, see “—Our Compensation in Connection with this Offering—Conversion of Outstanding RBS Deferred Share Awards and RBS LTIP Awards Following This Offering” below. | ||
232
Table of Contents
| Element of Pay |
Objective |
Operation | ||
| Perquisites and Other Benefits | To give employees an opportunity to provide for their retirement and address certain other specific needs. | Our NEOs are generally eligible to participate in our company-sponsored benefit programs, including our broad-based 401(k) plan, offered on the same terms and conditions as those made generally available to our employees.
In addition, we provide certain personal benefits to certain of the NEOs for competitive reasons. For additional details, see the “All Other Compensation” column of the “2013 Summary Compensation Table” below, along with accompanying footnotes. |
Base Salary
Although we have no written policies or guidelines for setting or adjusting the base salaries of our NEOs, our NEOs’ salaries are intended to be competitive with those of our peers and are subject to change if, among other reasons, the executive’s experience or responsibilities change materially or there are changes in the competitive market environment. Mr. Van Saun’s base salary was increased, effective April 1, 2014, to $1,487,000 to remain competitive. For the amounts of our NEOs’ base salaries, see the “Salary” column of the “2013 Summary Compensation Table” below, along with accompanying footnotes.
Annual Incentive Awards
Determination of Our CEO’s Annual Incentive Award
Although our CEO had a strong year in terms of delivering on his objectives, he did not receive an annual incentive award for the 2013 performance year in light of the overall challenges faced by RBS during that period.
Determination of Annual Bonus Pool Under AIP
For the 2013 performance year, as in past years, our NEOs (other than our CEO) participated in our discretionary Annual Incentive Plan, or AIP. The aggregate discretionary AIP annual bonus pool was approved by RemCo after a collaborative holistic review by RBS and us of our performance during 2013. As part of that assessment, RemCo reviewed our performance against a number of financial and operational performance-related guideposts, including, among other things, our operating income, cost-to-income ratio, return on equity and people and customer metrics, and such other objective and subjective criteria as deemed appropriate by RemCo. No specific weight was assigned to any particular performance factor or guidepost and the aggregate amount of the bonus pool was not determined formulaically.
Determining Other NEOs’ Annual Incentive Awards (Other than the CEO)
There are no target award amounts established under the AIP for our NEOs or other participants. Rather, proposed incentive award amounts, or AIP awards, submitted to RemCo for review and approval for our NEOs are determined at year-end by the CEO, after taking into account the funding of the relative bonus pool and qualitative assessment of individual performance.
All employees, including our NEOs, participate in a robust performance management process whereby managers and employees develop a set of mutually agreed upon performance objectives during the first quarter of each performance year. All employees are reviewed annually as part of the
233
Table of Contents
performance management process and are rated between 1 (low) and 5 (high), which is a consideration in determining annual incentive awards.
There is no particular weight assigned to performance-related factors; rather, our CEO may evaluate performance as deemed appropriate in his discretion. For the 2013 performance year, our CEO made the following determinations regarding each NEO’s individual performance, which were taken into account by RemCo in ultimately approving our NEOs’ individual annual incentive awards:
| • | Mr. Fawcett. Mr. Fawcett was principally responsible for the successful execution of three planned capital conversion transactions that were integral in efforts to realign our capital position with that of our regional bank peers. He was a key contributor to strategic initiatives (including public offering readiness planning, Project Top (a revenue generation and expense review project) and the Chicago Divestiture). |
| • | Mr. Matthews. Under Mr. Matthews’s leadership, strong strategic progress was made in the commercial business, which delivered good current financial performance and is positioned for further growth. Key initiatives include the expansion of the capital markets business and industry coverage groups. Mr. Matthews was instrumental in increasing customer satisfaction and loyalty and effectively controlling risk, as evidenced by strong audit and risk ratings. With Mr. Matthews’s oversight and guidance, the commercial business increased its market share during 2013 despite increasing competitive pressures. |
| • | Mr. Conner. Mr. Conner continued to build a strong foundation for the consumer business. To that end, Mr. Conner has made good progress in building a customer-centric organization with a focus on implementing measures to ensure progress, and aligning the organization with such measures. He has assembled a talented team who are focused on growth. |
| • | Ms. Shanik. Ms. Shanik was instrumental in designing and implementing a framework for effective risk management, including development of a new risk governance committee structure, creation of divisional policy ownership and adoption of key changes relating to our risk operating model. |
Mandatory Deferral of 2013 Annual Incentive Awards
The time and the form of payment for AIP awards are determined by RemCo. For the 2013 performance year, AIP awards were granted partially in the form of a deferred bond with no interest and partially as a right to receive RBS shares, or deferred share awards, with such awards being granted under, and subject to the rules of, the RBS 2010 Deferral Plan, or the RBS Deferral Plan.
For the 2013 performance year, all employees were subject to the same form and timing of payment for AIP awards, including our NEOs. Up to $3,129 was paid in March 2014, the next $35,986 was awarded in the form of a deferred bond with no interest to be paid in June 2014, and amounts above $39,115 were awarded as deferred share awards with a grant date fair market value equal to the remaining value of the award. The portion of the award granted as deferred share awards under the RBS Deferral Plan is scheduled to “vest” (i.e., they remain subject to forfeiture in the event of a termination for “cause” or grantee engaging in “detrimental activity” or “competitive activity” (in each case, as defined in the RBS Deferral Plan)) ratably in four installments on each of June 6, 2014, March 9, 2015, March 7, 2016 and March 7, 2017. “Code Staff” (which, for 2013, included Mr. Van Saun and Mss. Shanik and Alemany) are required to hold their RBS shares for at least six months following the applicable vesting date. For details, see “—Applicability of UK and European Remuneration Rules” below.
Each of our NEOs (other than our CEO) received the following number of deferred share awards in respect of their annual incentive awards for the 2013 performance year: Mr. Fawcett (101,428);
234
Table of Contents
Mr. Matthews (125,148); Mr. Conner (79,533); and Ms. Shanik (102,340). Under the SEC reporting rules, these numbers will appear in the “Stock Awards” column of our 2014 Summary Compensation Table, which will be included in our annual proxy statement for the 2014 fiscal year. For the amount of the deferred bond portion of our NEOs’ annual incentive awards for the 2013 performance year, see the “Bonus” column of the “2013 Summary Compensation Table” below, along with accompanying footnotes.
Outstanding deferred share awards held by our employees will be converted into equity awards of our stock upon completion of this offering. For details, see “—Our Compensation in Connection with this Offering—Conversion of Outstanding RBS Deferred Share Awards and RBS LTIP Awards Following This Offering” below.
For 2014 annual incentive awards, assuming the UK Remuneration Code, or the UK Code, continues to apply to us at grant, all of our NEOs will be required to meet the variable pay requirements applicable to “Code Staff.” For further details, see “—Applicability of UK and European Remuneration Rules” below.
Special One-Time Allowances
In addition, in February 2014, RBS approved funding for special one-time cash allowances for certain of our employees. These allowances, which will be paid in June 2014, relate to the 2013 performance year and are designed to provide additional cash compensation during 2014 to selected employees significantly impacted by the bonus deferral schedule for the 2013 performance year, with a focus on employees in our customer-facing businesses. Two of our NEOs—Messrs. Matthews and Conner—will be receiving such allowances. For the amounts of these one-time allowances to be paid to Messrs. Matthews and Conner, see the “Bonus” column of the “2013 Summary Compensation Table” below, along with accompanying footnotes.
Annual Incentive Awards Going Forward
We have adopted an annual incentive plan in which our NEOs will participate starting with the 2014 performance year. For details and a summary of material terms, see “—Our Anticipated NEO Compensation Program Following the Offering—Annual Incentive Plan” below.
Long-Term Incentive Awards
The compensation philosophy of rewarding the achievement of long-term company objectives has also been, prior to this offering, accomplished by providing our NEOs with the opportunity to receive RBS equity awards that vested over time, subject to the satisfaction of certain performance conditions. Prior to this offering, long-term equity-based awards granted to our NEOs and certain other employees have been granted pursuant to the RBS 2010 Long-Term Incentive Plan, or the LTIP. These awards, or LTIP awards, have historically been granted on an annual basis, at the same time AIP awards are made, and have been structured in the form of a right to receive a number of RBS shares after a three-year performance period in a maximum amount of 100% of the RBS shares underlying the award originally granted, subject to the satisfaction of certain performance conditions and exercise of RemCo’s negative discretion. All LTIP awards are subject to clawback provisions during the vesting period under the accountability review process and, for 2014 awards, are also subject to post-vesting clawback. For details, see “—Clawback Policy” below. Awards granted under the LTIP are at risk of cancellation or forfeiture if a grantee leaves RBS generally other than in limited “good leaver” circumstances (as described in the LTIP) or if applicable performance conditions are not satisfied.
235
Table of Contents
LTIP awards granted to our NEOs have been subject to a range of financial and non-financial RBS, divisional and functional performance measures. With respect to LTIP awards granted in 2013, the vesting of:
| • | Mr. Van Saun’s award is 100% based on RBS performance; |
| • | Messrs. Matthews’s and Conner’s awards and Ms. Alemany’s award are 25% based on RBS performance and 75% based on our performance; and |
| • | Mr. Fawcett’s and Ms. Shanik’s awards are 50% based on our performance, 25% based on RBS-wide functional performance and 25% based on RBS performance. |
The percentage of LTIP awards that vests is determined by RemCo at the end of the performance period based on RemCo’s assessment of financial and non-financial performance of RBS, CFG and functions (such as finance, risk, legal and human resources), as applicable, and is subject to RemCo’s negative discretion. Our performance measures focus on our financial and operational performance, effective risk management and customer and people measures but are not formulaic, and are assessed by RemCo holistically. The ultimate vesting of an LTIP award could vary between 0% and 100% of the RBS shares underlying the awards originally granted. It is intended that the vesting level will be the same for all employees in the same division or function, unless a clawback event occurs. For the amounts of LTIP awards granted to our NEOs in 2013 and applicable vesting provisions, see the “Stock Awards” column of the “2013 Summary Compensation Table” below and the “2013 Grants of RBS Plan-Based Awards” table below, along with accompanying footnotes.
In anticipation of this offering, our employees, including our NEOs, did not receive traditional LTIP awards in 2014. Instead, our NEOs and certain other key employees received RBS special equity awards. For additional details regarding the terms and amounts of these special awards, see “—Our Compensation in Connection with This Offering—Special IPO Awards Granted in 2014” below.
Outstanding LTIP awards held by our employees will be converted into equity awards of our stock upon completion of this offering, as described in the “—Our Compensation in Connection with This Offering—Conversion of Outstanding RBS Deferred Share Awards and RBS LTIP Awards Following This Offering” below.
Other Benefits
Employment Agreements/Offer Letters and Severance Benefits
We have entered into an employment agreement with our CEO and offer letters with each of our other NEOs that contain covenants, such as those prohibiting post-employment competition or solicitation by the NEOs. For details, see “Compensation Tables—Potential Payments Upon Termination or Change in Control—Employment Agreements/Offer Letters with our NEOs” below.
In addition, our full-time employees, including our NEOs (other than our CEO who is eligible for severance under the terms of his employment agreement) are eligible for severance benefits in accordance with our severance practice, which provides for the payment of severance benefits to such employees in the event their employment with us is terminated without cause and for reasons unrelated to poor performance. For details, see “Compensation Tables—Potential Payments Upon Termination or Change in Control—Severance Practice” below.
Nonqualified Deferred Compensation Plans
Our employees may participate in two nonqualified deferred compensation plans—the CFG Deferred Compensation Plan and the RBS Americas Deferred Compensation Plan. Following closure
236
Table of Contents
of the CFG Deferred Compensation Plan to new participants on December 31, 2008, the RBS Americas Deferred Compensation Plan was adopted, effective as of January 1, 2009. The deferred compensation plans currently do not offer any matching contributions or provide for above-market earnings, and none of our NEOs participated in these plans during 2013. Only Ms. Alemany had a balance under each of these plans as of December 31, 2013. For a description of the material terms of these deferred compensation plans, see “Compensation Tables—Nonqualified Deferred Compensation” below.
Pension Plan
We sponsor the RBS Americas Pension Plan, a tax-qualified, non-contributory defined benefit pension plan that was closed to new participants effective January 1, 2009 and frozen to all participants and benefit accruals effective December 31, 2012. None of our NEOs is eligible to participate in this plan other than Messrs. Matthews and Conner (who were hired prior to 2009), each of whom had a benefit under this plan as of December 31, 2013. For a description of the material terms of the RBS Americas Pension Plan, see “Compensation Tables—2013 Pension Benefits” below.
401(k) Plan
We maintain a qualified defined contribution 401(k) plan for all of our employees. Employees may defer up to 50% of their eligible pay to the plan (up to Internal Revenue Code limits). After employees have completed one full year of service, employee contributions are matched at 100% up to an overall limit of 5% on a pay period basis and employees receive an additional company contribution equal to 2% of earnings, subject to limits set by the Internal Revenue Service. Our NEOs are entitled to participate in our 401(k) plan on the same basis as our employees generally, except that Mr. Van Saun is not eligible to receive any company contributions under our 401(k) plan.
Health and Welfare Benefit Plans
Our NEOs are currently eligible to participate in CFG-sponsored benefit programs, offered on the same terms and conditions as those made generally available to our employees, including medical, dental, vision, short-term and long-term disability plans.
Perquisites and Other Benefits
We provide our NEOs with company-selected independent advisors to assist them with financial planning, if desired by the executives. Our NEOs are also covered by a relocation policy (which includes a reimbursement for taxes related to relocation expenses) and a charitable contribution policy that generally covers all our employees. Additionally, Mr. Matthews received temporary housing benefits in excess of benefits provided for under the relocation policy, as described in footnote 7 to the “2013 Summary Compensation Table” below. In 2013, we also provided certain of our NEOs with reimbursements for taxes relating to financial planning. Mr. Van Saun was also eligible for a housing allowance during his employment as RBS’s Chief Financial Officer.
Lastly, Mr. Van Saun receives and Ms. Alemany received an annual pension and benefits allowance. For Mr. Van Saun, this benefit is intended to make him whole for certain pension and benefits funding available to him during his service to RBS in the UK and has been increased, effective as of April 1, 2014, to an annual payment of $561,929 (from $519,659) in connection with the increase of his base salary; for Ms. Alemany, this payment was intended to make her whole for certain pension benefits she received from her former employer.
For additional details regarding these and other perquisites that we provide to our executives, see footnote 7 to the “2013 Summary Compensation Table” below.
237
Table of Contents
Clawback Policy
RBS has implemented a group-wide accountability review process to ensure that there is a standardized process for RBS to take appropriate action in instances where new and restated financial information would change the bonus and/or long-term incentive decisions which were made in previous years or which will be made in the current year. The CFG Accountability Review Panel, or ARP, meets on a quarterly basis to consider the events referred for its review and the proposed recommendations for action. To the extent further action is deemed appropriate by the ARP, our CEO is responsible for making final decisions based on the recommendations and advice of the ARP. The potential accountability review actions can include compensation adjustments (e.g., current-year bonus reduction or clawback), disciplinary action (e.g., dismissal) and performance adjustments (e.g., a change to performance rating).
In addition, all deferred share awards and LTIP awards are (and, consequently, any awards that are converted into awards on our shares in connection with and upon the closing of this offering, will be) subject to clawback provisions contained in the relevant plan rules. Specifically, under these plans (and plans that will govern the converted awards, see “—Our Compensation in Connection with This Offering—Conversion of Outstanding RBS Deferred Share Awards and RBS LTIP Awards Following This Offering” below), an award may be reduced before it is paid out if, following the grant date, RBS (or CFG) becomes aware of information that would have affected the decision about the executive’s performance or learns that the performance factors on which reward decisions were based do not turn out to be accurate. RBS (or CFG) may also reclaim any unpaid portion of an award if RBS (or CFG) or an executive’s business unit suffers a material downturn in its financial performance or suffers a material failure of risk management. Awards granted under the RBS Deferral Plan and the LTIP in 2014 are subject to clawback provisions which may apply post-vesting, normally for up to six months following the vesting date. This means RBS (or CFG) may require individuals to repay some or all of their awards in exceptional circumstances relating to the performance of RBS (or CFG) or an individual participant or the application (or non-compliance with) any legal or regulatory requirement applicable to RBS (or CFG) or such participant. For further details regarding the clawback provisions applicable to awards granted under the RBS Deferral Plan and LTIP in 2014, see “Our Compensation in Connection with This Offering—Conversion of Outstanding RBS Deferred Share Awards and RBS LTIP Awards Following This Offering” below.
In addition, our CEO and CFO are subject to clawback as mandated by the Sarbanes-Oxley Act. Further, our Compensation Committee will monitor the regulatory developments related to clawback, including under the Dodd-Frank Act, and will modify its practices and policy, to the extent necessary, to comply with applicable law and regulations.
Balancing Risk and Incentive Compensation
We have implemented a multi-layered approach in order to ensure that we balance risk and incentive compensation. All employees, including our NEOs, participate in a robust performance management process whereby managers and employees develop a set of mutually agreed performance objectives during the first quarter of each performance year. All employees are reviewed annually as part of the performance management process and are rated 1 (low)—5 (high), which is a consideration in determining annual incentive awards. Included within an employee’s performance management document are objectives and measures specifically relating to risk management.
As part of the effort to evaluate roles within the business to assess the inherent risk associated with each role, we operate a “covered role” identification process. Covered roles are roles that either individually or as part of a group can expose the firm to material amounts of risk. Individuals in covered roles, including each of the NEOs, have additional risk-based objectives that are included in their
238
Table of Contents
performance objectives as part of the performance management process referred to in the preceding paragraph.
In addition, we identify employees serving in covered roles who are members of executive management, serve in key control positions, are material risk-takers and/or have credit approval authority above a specified threshold as “Tier 1” employees. Tier 1 employees are reviewed by our regional risk leadership as part of their year-end performance evaluation. The result of this evaluation is considered by senior management before year-end compensation is finalized. Each of our NEOs is a Tier 1 employee.
As a supplement to the performance management process, some individuals, including all NEOs, are subject to a “360 review.” This process is completed through the use of an evaluation tool which allows for peer, subordinate and manager feedback. One of the areas that participants are evaluated on within the “360 review” is risk. All participants receive an overall risk and control feedback score which reflects input from all feedback providers. Additionally, input from the assigned risk officer is separately highlighted in the results of the “360 review” to ensure pointed risk feedback is obtained where applicable.
Lastly, as part of the management of the region, individual regional key leaders are reviewed together by our CEO and the RBS Americas management team to assess their performance from a regional management and risk perspective. The regional co-heads along with the regional head of human resources and chief risk officer complete this review and provide their input to the line management to assure that the regional point of view is taken into account when making final pay decisions. As we become an independent company and are no longer part of the RBS U.S. region, we expect this regional layer of review will no longer continue.
Compensation Risk Assessment
Our Compensation Committee has performed a review of compensation policies and practices for all of our employees and has concluded that our compensation policies and practices are not reasonably likely to have a material adverse effect on us.
Applicability of UK and European Remuneration Rules
Due to RBS’s ownership of us, certain employees are identified as “Code Staff” and are subject to specific requirements regarding the oversight, structure and delivery of variable pay under the UK Code. During 2013, Mr. Van Saun and Mss. Shanik and Alemany were our only employees determined to be Code Staff. Specifically, under the UK Code, a minimum of 40% (for Code Staff with variable compensation up to £500,000) or 60% (for Code Staff with variable compensation over £500,000) of variable pay must be deferred over a minimum three-year period, vesting no faster than on an annual pro rata basis. A minimum of 50% of any variable pay, both immediate and deferred, must be delivered in equity or equivalents. Shares delivered to Code Staff upon vesting of variable pay awards must be held for a period of six months post-vesting before they may be sold or transferred. Awards granted and shares delivered under the RBS Deferral Plan and LTIP (which, as described below, will be converted into awards on our shares upon the closing of this offering and, upon conversion, administered under the CFG Deferral Plan and CFG LTIP, respectively) must comply with these requirements. In addition, awards granted under the Citizens Financial Group, Inc. 2014 Omnibus Incentive Plan, the Citizens Financial Group, Inc. 2014 Employee Stock Purchase Plan and the Citizens Financial Group, Inc. 2014 Non-Employee Directors Plan (in each case as described below), must also comply with the above requirements while UK and European remuneration regulations continue to apply to us.
239
Table of Contents
The Code Staff definition was recently revised by the new European Banking Authority with expanded criteria to identify “Material Risk Takers,” or MRTs. RBS and CFG have completed a review of CFG’s employees in order to determine which employees are deemed to be MRTs. Approximately 40 employees have been identified as MRTs, including each of our NEOs. As a result, all such employees will be subject to the remuneration requirements described above in respect of variable pay granted for performance year 2014 and beyond, to the extent that UK and European remuneration regulations apply to us at the time of grant.
One of the requirements of CRD IV is that MRTs may not receive variable compensation in excess of 100% of fixed compensation starting with performance year 2014. In order to deliver competitive levels of compensation to our employees impacted by CRD IV, role based allowances have been approved by RemCo for certain MRTs, subject to these limitations. The annual role based allowance for each of Messrs. Van Saun, Fawcett, Matthews and Conner and Ms. Shanik is $2,676,600, $525,000, $975,000, $805,000, and $661,000, respectively. These allowances will be delivered in a combination of cash and CFG shares or solely in CFG shares. Any shares delivered as part of the allowance will be fully vested upon grant, but subject to transfer restrictions lapsing ratably over three years for Messrs. Fawcett, Matthews and Conner and Ms. Shanik, and lapsing in installments for up to five years for Mr. Van Saun.
We intend to maintain competitive total compensation levels for affected employees, although the structure of our compensation packages may not be considered in line with our peers. Our Compensation Committee will administer our equity plans with reference to, and will work with RemCo to ensure compliance with, applicable UK and European remuneration regulations for so long as they continue to apply to us. Once we cease to be subject to UK and European remuneration regulations, we will evaluate and modify our compensation structure as appropriate so that it is more aligned with our peers and continues to attract and retain the high-caliber talent necessary to maximize long-term shareholder value.
Our Compensation in Connection with This Offering
Special IPO Awards Granted in 2014
As mentioned above, in anticipation of this offering, our employees, including our NEOs, did not receive any LTIP awards in 2014 for the 2013 performance year. In lieu of such typical annual LTIP awards granted historically, RemCo granted to certain of our employees, including the NEOs, “special IPO awards.” The special IPO awards have been granted subject to the LTIP rules (except as indicated otherwise in the award certificates) and have been initially denominated 50% in a convertible bond and 50% as a right to receive RBS shares. Upon the closing of this offering, the entire award will convert into a right to receive our shares based on our stock price at the effective time of this offering and the RBS share price over the 30 London Stock Exchange dealing days immediately prior to such date (converted into U.S. Dollars using the average U.S. Dollar to British Pound currency exchange rate over such period). Following this offering, the special IPO awards will be subject to the terms and conditions of the CFG Converted Equity 2010 Long Term Incentive Plan (as described below) and applicable award certificates.
For each of Messrs. Van Saun, Fawcett, Matthews and Conner and Ms. Shanik, the amount of the special IPO awards denominated in a convertible bond was $2,346,888, $475,000, $550,000, $500,000 and $440,000, respectively, and the number of RBS shares subject to the award was 428,216, 86,670, 100,354, 91,231 and 80,283, respectively.
The special IPO awards are scheduled to vest 50% in March 2016 and 50% in March 2017, subject to satisfaction of the following conditions: (i) completion of the initial public offering on or by
240
Table of Contents
December 31, 2014; (ii) the grantee receiving a 3 performance rating (fully satisfactory) for each performance year ending on December 31 of 2014, 2015 and 2016; and (iii) the grantee being in continuous employment with us through the applicable vesting date, unless the grantee leaves under certain “good leaver” circumstances described in the award certificate. If the initial offering is not completed on or by December 31, 2014, RemCo will have discretion to provide for the vesting of some or a portion of these awards in its discretion.
Similarly to other 2014 LTIP awards, these special IPO awards are subject to clawback provisions which may apply prior to and following vesting. See “—Clawback Policy” above.
Conversion of Outstanding RBS Deferred Share Awards and RBS LTIP Awards Following This Offering
Upon completion of this offering, outstanding deferred share awards and LTIP awards held by our employees will be converted into awards to receive our shares. These converted awards will be governed by the terms of the CFG Converted Equity 2010 Long Term Incentive Plan, or the CFG LTIP, and the CFG Converted Equity 2010 Deferral Plan Rules, or the CFG Deferral Plan, as applicable.
The terms of the CFG LTIP, the CFG Deferral Plan and the converted awards are intended to mirror those of the LTIP, the RBS Deferral Plan and the outstanding LTIP awards and deferred share awards, as applicable, in all material respects, except that outstanding awards will be delivered in CFG shares rather than RBS shares. Additionally, the LTIP awards are currently subject to the performance conditions described above under “—Components of Our Executive Compensation Program and Analysis—Long-Term Incentive Awards.” We are currently considering how the existing performance conditions applicable to such awards will be treated as a result of the conversion. Alternatives under consideration include truncating the three-year performance period or assessing performance at the end of the original performance period applicable to such awards.
Each of the CFG LTIP and the CFG Deferral Plan were adopted by our Board of Directors. No new awards can be granted under these plans following the completion of this offering.
Other outstanding equity awards held by our employees (i.e., stock options outstanding under the RBS Group 2007 Executive Share Option Plan) will continue as currently in effect with respect to RBS stock following this offering. For the amounts of such outstanding stock options, see “—Outstanding RBS Equity Awards at 2013 Fiscal Year-End” table below.
The number of shares subject to converted LTIP awards and deferred share awards will be determined based on our stock price at the effective time of this offering. As of the date of this prospectus, for each of Messrs. Van Saun, Fawcett, Matthews and Conner and Ms. Shanik, the number of RBS shares underlying LTIP awards and deferred share awards to be converted into awards to receive our shares was 1,690,018, 497,820, 547,076, 457,040 and 452,732, respectively, assuming maximum achievement of the performance conditions applicable to the LTIP awards.
The following is a summary of the material terms of the CFG LTIP and the CFG Deferral Plan. This summary is qualified in its entirety by reference to the CFG LTIP and the CFG Deferral Plan, attached as Exhibit 10.28 and Exhibit 10.27, respectively, to this registration statement.
CFG Converted Equity 2010 Long Term Incentive Plan
Shares Subject to the Plan
The number of shares authorized for issuance under the CFG LTIP is the maximum number of CFG shares that can be delivered in respect of converted LTIP awards. Any shares that are subject to
241
Table of Contents
a CFG LTIP award that are released or lapse or are satisfied in cash or bonds in lieu of shares, in whole or in part, will become available for issuance under the Citizens Financial Group, Inc. 2014 Omnibus Incentive Plan (described below).
Termination of Employment
If a participant ceases to be an employee of any “member of the CFG group” (as defined in the CFG LTIP) for any reason other than due to the participant’s death or due to “exceptional circumstances” (as described in the CFG LTIP), an outstanding award will be forfeited on the date of such participant’s termination of employment (or, on the date which the participant gives or receives notice of termination, as determined in the discretion of our Compensation Committee). Unless otherwise provided in an award certificate, any unvested portion of an award will vest in full on the date of such participant’s death. In the event a participant ceases to be employed by any member of the CFG group due to “exceptional circumstances,” unless otherwise provided in an award certificate, an award will continue to vest and settle on their original vesting schedule, subject to the satisfaction of performance condition(s), if applicable, and will be prorated to reflect the period the participant was employed. However, if after a participant ceases to be an employee of the CFG group due to “exceptional circumstances,” such participant engages in “detrimental activity” (as defined in the CFG LTIP), the award will be forfeited.
Corporate Events
In the event of a “change of control” (as defined in the CFG LTIP), unless our Compensation Committee determines otherwise, any unvested portion of an award will vest on the date of such change of control, subject to the satisfaction of performance condition(s), if applicable, and prorated to reflect the portion of the vesting period that has passed.
In the event our Compensation Committee becomes aware that we are or are expected to be affected by any variation in share capital, demerger, distribution (other than an ordinary dividend), delisting or other transaction which, in the opinion of our Compensation Committee could affect the current or future value of our shares, our Compensation Committee will have authority to:
| • | allow awards to vest, subject to any conditions our Compensation Committee may impose, as determined in its discretion; |
| • | cause awards to become forfeited in whole or in part; |
| • | require substitution by the acquiring company of awards; |
| • | adjust the number of shares comprised in an award and such other terms as appear appropriate to our Compensation Committee; and/or |
| • | take any other appropriate action (including, for the avoidance of doubt, allowing awards to be exchanged for new awards on equivalent terms, as far as practicable). |
Clawback of Awards
For CFG LTIP awards granted prior to 2014, our Compensation Committee may at any time review any CFG LTIP award in light of the performance of any member of the CFG group or RBS, any business area or team, and the conduct, capability or performance of the individual participant, and may take any action in accordance with applicable law. Following this review, our Compensation Committee may make any determination with respect to any unvested portion of an award including (i) reducing the number of our shares in respect of such award, (ii) determining that no shares, cash or bonds will vest in respect of such award or (iii) determining that no amount (or a reduced amount) will be paid in respect of any dividend equivalent.
242
Table of Contents
For CFG LTIP awards granted in 2014, our Compensation Committee may decide before an award vests (or for such period after an awards vests as our Compensation Committee deems appropriate) that any participant be subject to clawback in light of: (i) the performance of, or the application of (or non-compliance with) any legal or regulatory requirement applicable to, any member of the CFG group, RBS, any business area or team or the individual participant or (ii) any other matter which our Compensation Committee considers relevant. To give effect to the clawback provision, our Compensation Committee may take any action, including, but not limited to: (i) reducing the number of shares in respect of such award and/or determining the extent to which such award (or any award granted to the participant under any other employee share plan or incentive plan operated by any member of the CFG group) vests or becomes exercisable, (ii) reducing any bonus award that would otherwise be payable to the participant, (iii) reducing the amount that will be paid in respect of any dividend equivalent and/or (iv) requiring the participant to pay or repay any amounts as may be required for the application of clawback to be satisfied in full.
Plan Term
The CFG LTIP will be effective on the effective date of this offering and will terminate on the date on which all CFG LTIP awards have been vested, settled, delivered, forfeited, reduced, canceled or otherwise lapsed or expired. The plan will expire sooner if our Compensation Committee terminates the CFG LTIP.
Amendment or Termination
Our Compensation Committee may amend or terminate the CFG LTIP at any time, subject to (i) RemCo approval and (ii) applicable law and the rules and regulations of the primary stock market or exchange on which our shares are quoted or traded. However, any amendment or change to the CFG LTIP to the advantage of present or future participants which relates to (i) participant eligibility, (ii) authorized shares, (iii) individual award limits, (iv) the basis for determining a participant’s entitlement to benefits (or an adjustment to entitlements) or (v) the terms of the amendment provision contained in the CFG LTIP must be approved by our shareholders. Shareholder approval is not required where our Compensation Committee makes minor changes to the CFG LTIP (i) to benefit the administration of the plan, (ii) to comply with or take account of applicable law or rules of the stock market or exchange on which our shares are principally quoted or traded or (iii) to obtain or maintain favorable tax or regulatory treatment.
CFG Converted Equity 2010 Deferral Plan
Shares Subject to the Plan
The number of shares authorized for issuance under the CFG Deferral Plan is the maximum number of CFG shares that can be delivered in respect of converted deferred share awards. Any shares that are subject to a CFG deferred share award that are released or lapse or are satisfied in cash or bonds in lieu of shares, in whole or in part, will become available for issuance under the Citizens Financial Group, Inc. 2014 Omnibus Incentive Plan (described below).
Termination of Employment
If a participant ceases to be an employee of any “member of the CFG group” (as defined in the CFG Deferral Plan) for any reason other than for “cause” (as defined in the CFG Deferral Plan) or due to the participant’s death, an outstanding award will continue to “vest” (i.e., settle) on its original “vesting” schedule, except that if a participant engages in any “detrimental activity” or “competitive activity” (in each case, as defined in the CFG Deferral Plan), any “unvested” portion of an award will be
243
Table of Contents
forfeited (except to the extent our Compensation Committee determines otherwise). If a participant ceases to be an employee of any member of the CFG group due to a termination for cause, any outstanding award will be forfeited on the date of such participant’s termination of employment (or, on the date which the participant receives notice of such termination, as determined in the discretion of our Compensation Committee). Any “unvested” portion of an award will “vest” on the date of the participant’s death and the participant will receive an amount in cash equal to the value of the shares underlying such award on such date.
Corporate Events
In the event our Compensation Committee becomes aware that we are or expected to be affected by any variation in share capital, demerger, distribution (other than an ordinary dividend), “change of control” (defined under the CFG Deferral Plan similarly as under the Citizens Financial Group, Inc. 2014 Omnibus Incentive Plan, described below), delisting or other transaction, which, in the opinion of our Compensation Committee could affect the current or future value of our shares or bonds, our Compensation Committee will have authority to:
| • | cause awards to become forfeited; |
| • | require substitution by the acquiring company of awards; |
| • | adjust the number of shares comprised in an award and such other terms as appear appropriate to our Compensation Committee; and/or |
| • | take any other appropriate action (including, for the avoidance of doubt, allowing awards to be exchanged for new awards on equivalent terms, as far as practicable). |
Clawback of Awards
For CFG deferred share awards granted prior to 2014, our Compensation Committee may at any time review any CFG deferred share award in light of the performance of any member of the CFG group or RBS, any business area or team, and the conduct, capability or performance of the individual participant, and may take any action in accordance with applicable law. Following this review, our Compensation Committee may make any determination in respect of any “unvested” portion of a CFG deferred share award including (i) reducing the number of our shares, securities or cash in respect of such award, (ii) determining that an award will not “vest” (in whole or in part) or (iii) determining that no amount (or a reduced amount) will be paid in respect of any dividend equivalent or notional interest.
For CFG deferred share awards granted in 2014, our Compensation Committee may decide before an award vests (or for such period after an awards vests as our Compensation Committee deems appropriate) that any participant be subject to clawback in light of: (i) the performance of, or the application of (or non-compliance with) any legal or regulatory requirement applicable to, any member of the CFG group, RBS, any business area or team or the individual participant or (ii) any other matter which our Compensation Committee considers relevant. To give effect to the clawback provision, our Compensation Committee may take any action, including, but not limited to: (i) reducing the number of shares in respect of such award and/or determining the extent to which such award (or any award granted to the participant under any other employee share plan or incentive plan operated by any member of the CFG group) vests or becomes exercisable, (ii) reducing any bonus award that would otherwise be payable to the participant, (iii) reducing the amount that will be paid in respect of any dividend equivalent and/or (iv) requiring the participant to pay or repay any amounts as may be required for the application of clawback to be satisfied in full.
244
Table of Contents
Plan Term
The CFG Deferral Plan will be effective on the effective date of this offering and will terminate on the date on which all CFG deferred share awards have been vested, settled, delivered, forfeited, reduced, canceled or otherwise lapsed or expired. The plan will expire sooner if our Compensation Committee terminates the CFG Deferral Plan.
Amendment or Termination
Our Compensation Committee may amend or terminate the CFG Deferral Plan at any time, subject to (i) RemCo approval and (ii) applicable law and the rules and regulations of the primary stock market or exchange on which our shares are quoted or traded. However, any amendment or change to the CFG Deferral Plan to the advantage of present or future participants which relates to (i) participant eligibility, (ii) authorized shares, (iii) individual award limits, (iv) the basis for determining a participant’s entitlement to benefits (or an adjustment to entitlements) or (v) the terms of the amendment provision contained in the CFG Deferral Plan, must be approved by our shareholders. Shareholder approval is not required where our Compensation Committee makes minor changes to the CFG Deferral Plan (i) to benefit the administration of the plan, (ii) to comply with or take account of applicable law or rules of the stock market or exchange on which our shares are principally quoted or traded or (iii) to obtain or maintain favorable tax or regulatory treatment.
Our Anticipated NEO Compensation Program Following the Offering
In anticipation of becoming a public company, we have been working to develop our own compensation philosophy, objectives and procedures for the period following the completion of this offering. We anticipate that our compensation philosophy and objectives will be similar to the principles currently followed by RBS with respect to our NEOs as described above. Our Compensation Committee will review the impact of the offering on all aspects of compensation and may make adjustments to the compensation program as it deems appropriate and in the best interests of our shareholders. Together with our Board of Directors, our Compensation Committee will be responsible for determining our compensation philosophy, consistent with all applicable laws and regulations. In this regard, our Compensation Committee will work with RemCo to ensure compliance with UK and European remuneration regulations while those regulations continue to apply to us. For further details, see “—Applicability of UK and European Remuneration Rules” above.
Annual Incentive Plan
Bonuses payable to our NEOs will be subject to the maximums set forth in the RBS Citizens Financial Group, Inc. Performance Formula and Incentive Plan, or the Section 162(m) Plan, which was adopted in connection with this offering. The Section 162(m) Plan has been designed to grant annual incentive awards that are intended to qualify as performance-based compensation under Section 162(m) of the Internal Revenue Code. We anticipate granting awards under the Section 162(m) Plan starting in respect of the 2014 performance year. At the beginning of each performance year, our Compensation Committee will designate participants in the Section 162(m) Plan for the relevant year. The Section 162(m) Plan sets forth the maximum annual incentive award that can be granted to any participant for any year at 2% of adjusted pretax operating income for our CEO and 0.7% of pretax operating income for other participants. Our Compensation Committee may use negative discretion to reduce the amount of each participating executive’s annual incentive award based on our Compensation Committee’s assessment of company and individual performance during the relevant year.
The Section 162(m) plan defines “pretax operating income” as, for the applicable fiscal year, our consolidated pretax income, adjusted to exclude the impact of any extraordinary items, goodwill
245
Table of Contents
impairment, integration and restructuring costs, discontinued operations, acquisition costs, gains or losses on strategic disposals, pension curtailments or settlements, cumulative effect of accounting changes, valuation adjustments related to debt accounted for at fair value, and other unusual or non-recurring items of loss or expense. In each case, all of the preceding terms included in the definition of “pretax operating income” will have the meanings as defined by generally accepted accounting principles accepted in the United States of America and identified in the audited financial statements, notes to the audited financial statements, management’s discussion and analysis or our other filings with the SEC.
Omnibus Incentive Plan
We have adopted the Citizens Financial Group, Inc. 2014 Omnibus Incentive Plan, or the Omnibus Plan, which permits us to grant of equity-based and cash incentive awards to our NEOs and other employees and service providers. The following is a summary of the material terms of the Omnibus Plan and these awards. This summary is qualified in its entirety by reference to the Omnibus Plan attached as Exhibit 10.29 to this registration statement.
Purpose
The purpose of the Omnibus Plan is to motivate and reward those employees and other individuals who are expected to perform at the highest level and contribute significantly to our success, thereby furthering our best interests and those of our shareholders.
Plan Term
The Omnibus Plan is scheduled to expire after ten years following the effective date of this offering. The plan will expire sooner if, prior to the end of the ten-year term, the maximum number of shares available for issuance under the Omnibus Plan has been issued or our Board of Directors terminates the Omnibus Plan.
Authorized Shares and Award Limits
Subject to adjustment (as described below), 52,592,057 shares of our common stock (representing 10.3% of our issued and outstanding shares as of the effective time of this offering, less the amount of shares subject to converted awards) are available for awards to be granted under the Omnibus Plan (other than substitute awards, which are awards granted in assumption of, or in substitution for, an outstanding award previously granted by a company or other business acquired by us or with which we combine). Shares granted under the Omnibus Plan that are subject to an outstanding award that is forfeited, expires, terminates, otherwise lapses or is settled for cash, in whole or in part, without the delivery of the shares will again be available for issuance under the Omnibus Plan. In addition, any shares that are subject to converted equity awards under the CFG Converted Equity 2010 Long Term Incentive Plan and the CFG Converted Equity 2010 Deferral Plan that are released, lapse or are satisfied in cash or our bonds, in whole or in part, will be available for awards to be granted under the Omnibus Plan. Shares tendered or withheld in payment of an exercise price or in respect of taxes will not again become available for issuance under the Omnibus Plan.
Subject to adjustment (as described below), the maximum number of shares of our common stock that may be granted to any single individual during any calendar year is as follows: (i) stock options and SARs that relate to no more than 1,000,000 shares; (ii) restricted stock and RSUs that relate to no more than 1,000,000 shares; (iii) performance awards denominated in shares and other share-based awards that relate to no more than 1,000,000 shares; (iv) deferred awards denominated in shares that relate to no more than 1,000,000 shares; (v) deferred awards denominated in cash that relate to no more than $15,000,000; and (vi) performance awards denominated in cash and other cash-based awards that relate to no more than $15,000,000.
246
Table of Contents
Administration
Our Compensation Committee will administer the Omnibus Plan and will have authority to:
| • | designate participants; |
| • | determine the types of awards (including substitute awards) to be granted to each participant; |
| • | determine the number of shares to be covered by awards (or with respect to which payments, rights or other matters are to be calculated in connection with awards); |
| • | determine the terms and conditions of awards; |
| • | determine whether, to what extent and under what circumstances awards may be settled or exercised in cash, shares, other awards, other property or net settlement; |
| • | determine the circumstances under which awards may be canceled, repurchased, forfeited or suspended; |
| • | determine whether, and to what extent and under what circumstances cash, shares of our common stock and other awards may be deferred automatically or at the election of the holder or the Compensation Committee; |
| • | interpret and administer the Omnibus Plan and any instrument or agreement relating to, or award made under, the Omnibus Plan; |
| • | amend the terms or conditions of outstanding awards, including to accelerate the time or times at which an award becomes vested, unrestricted or may be exercised; |
| • | correct any defect, supply any omission and reconcile any inconsistency in the Omnibus Plan or any award to carry the Omnibus Plan into effect; |
| • | establish, amend, suspend or waive rules and regulations and appoint agents and other individuals for the proper administration of the Omnibus Plan; and |
| • | make any other determination and take any other action that it deems necessary or desirable to administer the Omnibus Plan. |
To the extent not inconsistent with applicable law and our Compensation Committee’s charter, our Compensation Committee may delegate to a committee of one or more directors or to one or more of our officers the authority to grant awards under the Omnibus Plan.
Types of Awards
The Omnibus Plan provides for grants of incentive and non-qualified stock options, SARs, restricted stock, RSUs, performance awards, deferred awards, other share-based awards and other cash-based awards:
| • | Stock Options. A stock option is a contractual right to purchase shares at a future date at a specified exercise price. The per share exercise price of a stock option will be determined by our Compensation Committee at the time of grant but may not (except in the case of substitute awards) be less than the “fair market value” of a share of our common stock (defined under the Omnibus Plan as the closing price of a share of our common stock on the day prior to the grant date). Our Compensation Committee will determine the date on which each stock option becomes vested and exercisable and the expiration date of each option. No stock option will be exercisable more than ten years from the grant date, except that our Compensation Committee may provide in an award agreement for an extension of such ten-year term in the event the exercise of the option would be prohibited by law on the expiration date. A grant of a stock option may not be accompanied by a tandem award of dividend equivalents or provide for dividends, dividend equivalents or other distributions to be paid on |
247
Table of Contents
| such options. Stock options that are intended to qualify as incentive stock options must meet the requirements of Section 422 of the Internal Revenue Code. |
| • | SARs. A SAR represents a contractual right to receive, in cash or shares, an amount equal to the appreciation of one share of our common stock from the grant date over the exercise or hurdle price of such SAR. The per share exercise price of a SAR (except in the case of substitute awards) will be determined by our Compensation Committee but may not be less than the “fair market value” of a share of our common stock (as defined under the Omnibus Plan and summarized above). Our Compensation Committee will determine the date on which each SAR may be exercised or settled, in whole or in part, and the expiration date of each SAR. However, no SAR will be exercisable more than ten years from the grant date. A grant of a SAR may not be accompanied by a tandem award of dividend equivalents or provide for dividends, dividend equivalents or other distributions to be paid on such SAR. |
| • | Restricted Stock. Restricted stock is an award of shares of our common stock that are subject to restrictions on transfer and a substantial risk of forfeiture. |
| • | RSUs. An RSU represents a contractual right to receive the value of a share of our common stock at a future date, subject to specified vesting and other restrictions. |
| • | Performance Awards. Performance awards, which may be denominated in cash or shares, will be earned upon the satisfaction of performance conditions specified by our Compensation Committee. The performance conditions for awards that are intended to qualify as “performance-based compensation” for purposes of Section 162(m) of the Internal Revenue Code may include, but not be limited to, the following: |
| • | return measures (including, but not limited to, total shareholder return; return on equity; return on tangible common equity; return on tier 1 common equity; return on assets or net assets; return on risk-weighted assets; and return on capital (including return on total capital or return on invested capital)); |
| • | revenues (including, but not limited to, total revenue; gross revenue; net revenue; revenue growth; and net sales); |
| • | income/earnings measures (including, but not limited to, earnings per share; earnings or loss (including earnings before or after interest, taxes, depreciation and amortization); gross income; net income after cost of capital; net interest income; non-interest income; fee income; net interest margin; operating income (before or after taxes); pre- or after-tax income or loss (before or after allocation of corporate overhead and bonus); pre- or after-tax operating income; net earnings; net income or loss (before or after taxes); operating margin; gross margin; and adjusted net income); |
| • | expense measures (including, but not limited to, expenses; operating efficiencies; non-interest expense and operating/efficiency ratios; and improvement in or attainment of expense levels or working capital levels (including cash and accounts receivable)); |
| • | balance sheet/risk management measures (including, but not limited to, loans; deposits; assets; tangible equity; charge-offs; net charge-offs; non-performing assets or loans; risk-weighted assets; classified assets; criticized assets; allowance for loans and lease losses; loan loss reserves; asset quality levels; year-end cash; investments; interest-sensitivity gap levels; regulatory compliance; satisfactory internal or external audits; financial ratings; shareholders’ equity; tier 1 capital; and liquidity); |
| • | cash flow measures (including, but not limited to, cash flow or cash flow per share (before or after dividends); and cash flow return on investment); |
| • | share price measures (including, but not limited to, share price; appreciation in and/or maintenance of share price; and market capitalization); |
248
Table of Contents
| • | strategic objectives (including, but not limited to, market share; debt reduction; operating efficiencies; customer satisfaction; customer growth; employee satisfaction; research and development achievements; branding; mergers and acquisitions; succession management; people development; management retention; dynamic market response; expense reduction initiatives; reductions in costs; risk management; regulatory compliance and achievements; implementation, completion or attainment of measurable objectives with respect to research, development, commercialization, products or projects, production volume levels, acquisitions and divestitures; factoring transactions; and recruiting and maintaining personnel); and |
| • | other measures (including, but not limited to, economic value-added models or equivalent metrics; economic profit added; gross profits; economic profit; comparisons with various stock market indices; financial ratios (including those measuring liquidity, activity, profitability or leverage); cost of capital or assets under management; and financing and other capital raising transactions (including sales of the Company’s equity or debt securities; factoring transactions; sales or licenses of the Company’s assets, including its intellectual property, whether in a particular jurisdiction or territory or globally; or through partnering transactions)). |
These performance criteria may be measured on an absolute (e.g., plan or budget) or relative basis, may be established on a corporate-wide basis or with respect to one or more business units, divisions, subsidiaries or business segments, may be based on a ratio or separate calculation of any performance criteria and may be made relative to an index or one or more of the performance goals themselves.
| • | Deferred Awards. Our Compensation Committee is authorized to grant deferred awards which may be denominated in a right to receive shares of our common stock or cash, including in lieu of any annual bonus payable under any of our bonus plans or arrangements. Our Compensation Committee will determine the method of converting the amount of annual bonus into a deferred award and, if applicable, the form, vesting, settlement, forfeiture and cancellation provisions or any other criteria applicable to such deferred awards. Deferred awards can be granted independently or as an element of, or supplement to, any other award. Our Compensation Committee may determine the form or forms (including cash, shares, other awards, other property or any combination thereof) in which payment of the amount owing upon settlement of any deferred award may be made. |
| • | Other Share-Based Awards. Our Compensation Committee is authorized to grant other share-based awards, which may be denominated, payable or valued in or based on, in whole or in part, shares of our common stock or factors that may influence the value of our shares, including convertible or exchangeable debt securities, other rights convertible or exchangeable into shares, purchase rights for shares, awards with value and payment contingent upon our performance or that of our business units or any other factors designated by our Compensation Committee. |
| • | Other Cash-Based Awards. Our Compensation Committee is authorized to grant other cash-based awards either independently or as an element of or supplement to any other award under the Omnibus Plan. |
Our Compensation Committee will determine the terms and conditions of all awards granted under the Omnibus Plan, including the date(s) on which awards become vested.
Adjustments
In the event that our Compensation Committee determines that, as result of any dividend or other distribution, recapitalization, stock split, reverse stock split, reorganization, merger, consolidation,
249
Table of Contents
separation, rights offering, split-up, spin-off, combination, repurchase or exchange of our shares or other securities, issuance of warrants or other rights to purchase our shares or other securities, issuance of our shares pursuant to the anti-dilution provisions of our securities, or other similar corporate transaction or event affecting our shares, or of changes in applicable laws, regulations or accounting principles, an adjustment is appropriate to prevent dilution or enlargement of the benefits or potential benefits intended to be made available under the Omnibus Plan, our Compensation Committee will, subject to compliance with Section 409A of the Internal Revenue Code, adjust equitably any or all of:
| • | the number and type of shares or other securities that thereafter may be made the subject of awards, including the aggregate and individual limits under the Omnibus Plan; |
| • | the number and type of shares or other securities subject to outstanding awards; and |
| • | the grant, purchase, exercise or hurdle price for any award or, if deemed appropriate, make provision for a cash payment to the holder of an outstanding award. |
In addition, our Compensation Committee is authorized to adjust the terms and conditions of, and the criteria included in, outstanding awards in recognition of events (including those events described above) affecting the Company or the financial statements of the Company, or changes in applicable laws, regulations or accounting principles, whenever our Compensation Committee determines that such adjustments are appropriate in order to prevent dilution or enlargement of the benefits or potential benefits intended to be made available under the Omnibus Plan, subject, in all such instances, to compliance with Section 162(m) of the Internal Revenue Code.
Termination of Service and Change of Control
Our Compensation Committee will determine the effect of a termination of employment or service on outstanding awards, including whether the awards will vest, become exercisable, settle or be forfeited. In the event of a “change of control” (as defined in the Omnibus Plan and summarized below), except as otherwise provided in the applicable award agreement, our Compensation Committee may provide for:
| • | continuation or assumption of outstanding awards under the Omnibus Plan by us (if we are the surviving corporation) or by the surviving corporation or its parent; |
| • | substitution by the surviving corporation or its parent of awards with substantially the same terms and value as such outstanding awards under the Omnibus Plan; |
| • | acceleration of the vesting (including the lapse of any restrictions, with any performance criteria or conditions deemed met at target) or the right to exercise outstanding awards immediately prior to the date of the change of control and the expiration of awards not timely exercised by the date determined by our Compensation Committee; or |
| • | in the case of outstanding stock options and SARs, cancelation in consideration of a payment in cash or other consideration equal to the intrinsic value of the award. Our Compensation Committee may, in its sole discretion, terminate without the payment of any consideration, any stock options or SARs for which the exercise or hurdle price is equal to or exceeds the per share value of the consideration to be paid in the change of control transaction. |
Under the Omnibus Plan, except as otherwise provided in a participant’s award agreement, “change of control” generally means the occurrence of one or more of the following events:
| • | the acquisition of more than 50% of the combined voting power of our outstanding securities (other than by an employee benefit plan or trust maintained by us); |
250
Table of Contents
| • | the replacement of the majority of our directors during any 12-month period; |
| • | the consummation of our merger or consolidation with another entity (unless our voting securities outstanding immediately before such transaction continue to represent at least 50% of the combined voting power and total fair market value of the securities of the surviving entity, or if applicable, the ultimate parent thereof, outstanding immediately after such transaction); or |
| • | the transfer of our assets having an aggregate fair market value of more than 50% of the fair market value of us and our subsidiaries immediately before such transfer, but only to the extent that in connection with such transfer or within a reasonable period thereafter, our shareholders receive distributions of cash and/or assets having a fair market value that is greater than 50% of the fair market value of us and our subsidiaries immediately before such transfer. |
Amendment and Termination
Our Board of Directors may amend, alter, suspend, discontinue or terminate the Omnibus Plan, subject to approval of our shareholders if required by applicable law or the rules of the stock exchange on which our shares are principally traded. Our Compensation Committee may also amend, alter, suspend, discontinue or terminate, or waive any conditions or rights under, any outstanding award. However, subject to the adjustment provision and change of control provision (each summarized above), any such action by our Compensation Committee that would materially adversely affect the rights of a holder of an outstanding award may not be taken without the holder’s consent, except (i) to the extent that such action is taken to cause the Omnibus Plan to comply with applicable law, stock market or exchange rules and regulations, or accounting or tax rules and regulations, or (ii) to impose any “clawback” or recoupment provisions on any awards in accordance with the Omnibus Plan.
In addition, our Compensation Committee may amend the Omnibus Plan or create sub-plans in such manner as may be necessary to enable the plan to achieve its stated purposes in any jurisdiction in a tax-efficient manner and in compliance with local rules and regulations. In the event of our dissolution or liquidation, each award will terminate immediately prior to the consummation of such action, unless otherwise determined by our Compensation Committee.
Cancellation or “Clawback” of Awards
Our Compensation Committee may, to the extent permitted by applicable law and stock exchange rules or by any of our policies, cancel or require reimbursement of any awards granted, shares issued or cash received upon the vesting, exercise or settlement of any awards granted under the Omnibus Plan or the sale of shares underlying such awards.
Prohibition on Repricing
Subject to the adjustment provision summarized above, our Compensation Committee may not directly or indirectly, through cancellation or regrant or any other method, reduce, or have the effect of reducing, the exercise or hurdle price of any award established at the time of grant without approval of our shareholders.
U.S. Federal Income Tax Consequences
Non-Qualified Stock Options
A non-qualified stock option is an option that does not meet the requirements of Section 422 of the Internal Revenue Code. A participant will not recognize taxable income when granted a non-qualified
251
Table of Contents
stock option. When the participant exercises the stock option, he or she will recognize taxable ordinary income equal to the excess of the fair market value of the shares received on the exercise date over the aggregate exercise price of the shares. The participant’s tax basis in the shares acquired on exercise of the option will be increased by the amount of such taxable income. We generally will be entitled to a federal income tax deduction in an amount equal to the ordinary income that the participant recognizes. When the participant sells the shares acquired on exercise, the participant will realize long-term or short-term capital gain or loss, depending on whether the participant holds the shares for more than one year before selling them. Special rules apply if all or a portion of the exercise price is paid in the form of shares.
Incentive Stock Options
An incentive stock option is an option that meets the requirements of Section 422 of the Internal Revenue Code. A participant will not have taxable income when granted an incentive stock option or when exercising the option. If the participant exercises the option and does not dispose of the shares until the later of two years after the grant date and one year after the exercise date, the entire gain, if any, realized when the participant sells the shares will be taxable as long-term capital gain. We will not be entitled to any corresponding tax deduction.
If a participant disposes of the shares received upon exercise of an incentive stock option within the one-year or two-year periods described above, it will be considered a “disqualifying disposition,” and the option will be treated as a non-qualified stock option for federal income tax purposes. If a participant exercises an incentive stock option more than three months after the participant’s employment or service with us terminates, the option will be treated as a non-qualified stock option for federal income tax purposes. If the participant is disabled and terminates employment or service because of his or her disability, the three-month period is extended to one year. The three-month period does not apply in the case of the participant’s death.
Restricted Stock
Unless a participant makes an election to accelerate recognition of the income to the date of grant as described below, the participant will not recognize income, and the Company will not be allowed a tax deduction, at the time a restricted stock award is granted. When the restrictions lapse, the participant will recognize ordinary income equal to the fair market value of the common stock as of that date, less any amount paid for the stock, and the Company will be allowed a corresponding tax deduction at that time. If the participant files an election under Section 83(b) of the Internal Revenue Code within 30 days after the date of grant of the restricted stock, the participant will recognize ordinary income as of the date of grant equal to the fair market value of the common stock as of that date, less any amount the participant paid for the common stock, and we will be allowed a corresponding tax deduction at that time. Any future appreciation in the common stock will be taxable to the participant at capital gains rates. However, if the restricted stock award is later forfeited, the participant will not be able to recover the tax previously paid pursuant to his Section 83(b) election.
RSUs
A participant does not recognize income, and the Company will not be allowed a tax deduction, at the time an RSU is granted. When the RSUs vest and are settled for cash or stock, the participant generally will be required to recognize as income an amount equal to the fair market value of the shares on the date of vesting, and the Company will be allowed a corresponding tax deduction at that time . Any gain or loss recognized upon a subsequent sale or exchange of the stock (if settled in stock) is treated as capital gain or loss for which we are not entitled to a deduction.
252
Table of Contents
Employee Stock Purchase Plan
We have adopted the Citizens Financial Group, Inc. 2014 Employee Stock Purchase Plan, or the ESPP, which permits our employees to contribute up to a specified percentage of base salary and commissions to purchase our shares at a discount. The following is a summary of the material terms of the ESPP and is qualified in its entirety by reference to the ESPP attached as Exhibit 10.32 to this registration statement.
Purpose
The purpose of the ESPP is to facilitate our employees’ participation in the ownership and economic progress of CFG by providing our employees with an opportunity to purchase shares of our common stock.
Plan Term
The ESPP is scheduled to expire ten years following the effective date of this offering. The term will expire sooner if, prior to the end of the ten-year term, the maximum number of shares available for issuance under the ESPP has been issued, our shareholders do not approve the ESPP within 12 months after the date the ESPP is adopted by our Board of Directors or our Board of Directors terminates the ESPP.
Authorized Shares and Share Limits
Subject to adjustment (as described below), 7,839,977 shares of our common stock (representing 1.4% of our issued and outstanding shares as of the effective time of this offering) are available for sale under the ESPP. A participant may not purchase more than a maximum of 5,000 shares of our common stock during any single offering period.
Authorized and unissued shares of our common stock or shares reacquired by us may be made subject to purchase under the ESPP, as determined in the discretion of our Compensation Committee or our Board of Directors. If any purchase of shares of our common stock pursuant to an option under the ESPP is not consummated for any reason, the shares subject to such option may be again made available for sale under the ESPP.
Administration
Our Compensation Committee will administer the ESPP and will have authority to:
| • | designate participants (subject to Section 423 of the Internal Revenue Code); |
| • | determine all questions with regards to rights of employees, including but not limited to, eligibility to participate in the ESPP and the range of permissible percentages of payroll deductions and the maximum amount; |
| • | adopt rules of procedure and regulations necessary for the administration of the ESPP (provided that such rules are not inconsistent with the terms of the plan) and enforce the terms of the ESPP and regulations adopted; |
| • | prescribe procedures to be followed by eligible employees to participate in the ESPP; |
| • | direct the administration of the ESPP; |
| • | direct or cause the distribution of shares of our common stock purchased under the ESPP; |
| • | furnish or cause to be furnished to us information required for tax or other purposes; |
253
Table of Contents
| • | maintain separate accounts in the name of each participant; |
| • | receive from us, our subsidiaries and each eligible employee information necessary for the proper administration of the ESPP; |
| • | engage the service of counsel and agents whom it may deem advisable to assist it with the performance of its duties; |
| • | interpret and construe the ESPP in its sole discretion, correct any defect, supply any omission or reconcile any inconsistency in the ESPP to carry the ESPP into effect; and |
| • | make any changes or modifications necessary to administer and implement the provisions of the ESPP in any foreign country to the fullest extent possible. |
Eligibility
Our employees (including employees of our designated subsidiaries) whose customary employment is for more than five months per year and at least 20 hours per week, and who have completed 30 days of service with us on the first day of any offering period (as summarized below), may participate in the ESPP, except that no employee will be eligible to participate in the ESPP if, immediately after the grant of an option to purchase shares under the ESPP, that employee would own 5% of the total combined voting power or value of all classes of our common stock. In addition, employees who are citizens or residents of a foreign jurisdiction will be prohibited from participating in the ESPP if the grant of an option to such employees would be prohibited under the laws of such foreign jurisdiction or if compliance with the laws of such foreign jurisdiction would cause the ESPP to violate the requirements of Section 423 of the Internal Revenue Code.
Participation
In order to participate in the ESPP, an employee who is eligible at the beginning of an offering period will authorize payroll deductions of up to 10% of base salary and commissions on an after-tax basis for each pay date during the offering period, except that for the initial offering period (as summarized below), eligible employees may authorize deductions of up to 50% of base salary and commissions. A participant may not make any separate cash payment into his or her account or alter the amount of his or her payroll deductions during an offering period, but may withdraw from participation (as summarized below).
No participant may accrue options to purchase shares of our common stock at a rate that exceeds $25,000 in fair market value of our stock (determined as of the first day of the offering period during which such rights are granted) for each calendar year in which such rights are outstanding at any time.
Offering Periods
The ESPP provides for offering periods every calendar quarter, with purchases being made on the last day of each offering period. The initial offering period under the ESPP will commence on the first subscription date following the effective date of this offering and will terminate on the earlier of the last day of the calendar quarter or the calendar year in which the effective date of this offering occurs.
Purchases
On the last day of an offering period, also referred to as the exercise date, a participant’s accumulated payroll deductions are used to purchase shares of our common stock. The number of shares a participant purchases on each exercise date is determined by dividing the total amount of payroll deductions withheld from the participant’s base salary and/or commissions, as applicable,
254
Table of Contents
during that offering period by 90% of the closing price of a share of our common stock on such exercise date (or if the shares did not trade on such date, for the most recent trading day preceding the exercise date, as the case may be), as reported on the principal stock market or exchange on which our shares of common stock are quoted or traded.
Participants are not entitled to any dividends or voting rights with respect to options to purchase shares of our common stock under the ESPP. Shares received upon exercise of an option shall be entitled to receive dividends on the same basis as other outstanding shares of our common stock.
Withdrawal and Termination of Employment
A participant can withdraw all, but not less than all, of the payroll deductions credited to his or her account for the applicable offering period by delivery of notice prior to the exercise date for such offering period. If a participant’s employment is terminated on or before the exercise date (including due to retirement or death), the participant will be deemed to have elected to withdraw from the ESPP, and the accumulated payroll deductions held in the participant’s account will be returned to the participant or his or her beneficiary (in the event of the participant’s death).
Adjustments upon Changes in Capitalization and Certain Transactions
In the event of a merger, reorganization, consolidation, recapitalization, dividend or distribution, stock split, reverse stock split, spin-off or other similar transaction or other change in corporate structure affecting shares of our common stock or their value, or any unusual or reoccurring transactions or events affecting us or any changes in applicable laws, regulations or accounting principles, our Compensation Committee, in its sole discretion, is authorized to take action to:
| • | terminate outstanding options in exchange for an amount of cash equal to the amount that would have been obtained if such options were currently exercisable; |
| • | replace outstanding options with other rights or property; |
| • | provide for the assumption of outstanding options by a successor or survivor corporation (or a parent or subsidiary) or the substitution of similar rights covering such successor or survivor (or a parent or subsidiary); |
| • | make adjustments to the number and type of common stock subject to outstanding options under the ESPP or to the terms and conditions of outstanding options and options which may be granted in the future; |
| • | shorten the offering period then in progress and set as the new exercise date the date immediately prior to the date of any transaction or event described above and provide for necessary procedures to effectuate such actions; and/or |
| • | provide that all outstanding options will terminate without being exercised. |
Amendment and Termination
Our Board of Directors may amend, alter, suspend, discontinue or terminate the ESPP at any time and for any reason, except that our Board of Directors may not, without shareholder approval, increase the maximum number of shares of common stock that may be issued under the ESPP (except pursuant to or in connection with a change in capitalization or other transaction summarized above). Except as required to comply with Section 423 of the Internal Revenue Code, as required to obtain a favorable tax ruling from the Internal Revenue Service, or as specifically provided in the ESPP, no such amendment, alteration, suspension, discontinuation or termination of the ESPP may be made to an outstanding option which adversely affects the rights of any participant without the consent of such participant.
255
Table of Contents
U.S. Federal Income Tax Consequences
The ESPP and the options to purchase shares of our common stock granted to participants under the ESPP are intended to qualify under the provisions of Sections 421 and 423 of the Internal Revenue Code. Under these provisions, no income will be taxable to a participant until the shares purchased under the ESPP are sold or otherwise disposed of. Upon a sale or other disposition of the shares, the participant’s tax consequences will generally depend upon his or her holding period with respect to the shares. If the shares are sold or disposed of more than two years after the first day of the relevant offering period and one year after the date of acquisition of the shares, the participant will recognize ordinary income equal to the lesser of (1) an amount equal to 10% of the fair market value of the shares as of the date of option grant or (2) the excess of the fair market value of the shares at the time of such sale or disposition over the exercise price of the option. Any additional gain on such sale or disposition will be treated as long-term capital gain. We are generally not allowed a tax deduction for such ordinary income or capital gain.
If shares are disposed of before the expiration of these holding periods, the difference between the fair market value of such shares at the time of purchase and the exercise price will be treated as income taxable to the participant at ordinary income rates in the year in which the sale or disposition occurs, and we will generally be entitled to a tax deduction in the same amount in such year.
Stock Ownership Guidelines
We have established stock ownership guidelines in order to further align the long-term interests of our executive officers and non-employee directors with those of our shareholders. Our stock ownership guidelines require that our executive officers and non-employee directors own shares of our common stock having an aggregate value equal to a multiple of the executive officer’s annual base salary or the non-employee director’s annual cash retainer, as follows:
| Position |
Multiple |
|||
| Chief Executive Officer |
5x Annual Base Salary | |||
| All Other Executive Officers |
3x Annual Base Salary | |||
| Non-Employee Directors |
3x Annual Cash Board Retainer |
Shares that count for purposes of ownership under the share ownership guidelines include (i) shares or units for which receipt has been deferred (including shares held through our 401(k) plan, shares purchased under the ESPP, unvested RSUs or shares or units held through a deferred compensation plan maintained by us) and (ii) restricted stock and unvested RSUs (that may only be settled in shares) that are subject to time-based vesting conditions only. Unexercised options (whether vested or unvested), performance awards (including performance-based restricted stock and performance-based units) and unvested RSUs that may only be settled in cash do not count towards the satisfaction of these stock ownership guidelines.
Generally, each executive officer or non-employee director will have five years from the date he or she becomes subject to these guidelines to achieve compliance. Non-employee directors are also subject to a holding requirement until they achieve compliance with these stock ownership guidelines.
In addition, Mr. Van Saun is currently subject to stock ownership guidelines of RBS as a member of the RBS executive committee, which require him to hold RBS shares worth 125% of salary (excluding unvested RBS shares granted under RBS share plans, including the RBS Deferral Plan and LTIP). The requirement will cease to apply when Mr. Van Saun is no longer a member of RBS’s executive committee, which will occur on or before the closing of this offering.
256
Table of Contents
Prohibition on Hedging and Pledging
We have adopted a policy prohibiting any of our insiders, including our NEOs, from hedging or pledging their ownership in our securities (including equity-based awards), which would undermine the risk alignment effects embedded in our equity-based compensation arrangements. A similar prohibition already exists in respect of awards granted under the RBS Deferral Plan and LTIP.
Tax Deductibility of Compensation
Under Section 162(m), a public company generally may not deduct compensation in excess of $1 million paid to its chief executive officer and the three other most highly compensated executive officers (other than the chief financial officer), unless the compensation qualifies as “performance-based.” We intend to seek to maximize deductibility under Section 162(m) of all elements of compensation of such employees, from and after the time that our compensation programs become subject to Section 162(m). Following this offering, we generally intend to structure our equity-based and cash-based incentive awards to meet the exception under Section 162(m) for “performance-based” compensation and to minimize the impact of Section 162(m). However, to maintain flexibility in compensating our executives, we do not have a policy requiring compensation to be fully deductible under Section 162(m).
257
Table of Contents
2013 Summary Compensation Table
| Name and Principal Position |
Year | Salary ($) | Bonus ($)(3) |
Stock Awards ($)(4)(5) |
Change in Pension Value and Nonqualified Deferred Compensation Earnings ($)(6) |
All Other Compensation ($)(7) |
Total ($) | |||||||||||||||||||||
| Bruce Van Saun, Chairman & Chief Executive Officer(1)(2) |
2013 | 1,203,538 | — | 3,733,933 | — | 733,352 | 5,670,823 | |||||||||||||||||||||
| John J. Fawcett, Chief Financial Officer |
2013 | 700,000 | 39,115 | 805,939 | 520 | 32,059 | 1,577,633 | |||||||||||||||||||||
| Robert D. Matthews, Jr., Head of Commercial Banking |
2013 | 750,000 | 189,115 | 960,943 | 505 | 355,739 | 2,256,302 | |||||||||||||||||||||
| Brad L. Conner, Head of Consumer Banking |
2013 | 700,000 | 189,115 | 860,942 | 505 | 36,063 | 1,786,625 | |||||||||||||||||||||
| Nancy L. Shanik, Chief Risk Officer |
2013 | 575,000 | 39,115 | 1,058,336 | 670 | 20,250 | 1,693,371 | |||||||||||||||||||||
| Ellen Alemany, Former Chairman & Chief Executive Officer(1) |
2013 | 2,115,385 | — | 3,958,329 | 2,214 | 1,439,847 | 7,515,775 | |||||||||||||||||||||
| (1) | Ms. Alemany served as our Chairman and Chief Executive Officer until her retirement on September 30, 2013, with Mr. Van Saun succeeding her in such roles as of October 1, 2013. Prior to that date, Mr. Van Saun served as RBS’s Chief Financial Officer. Compensation amounts for Mr. Van Saun in the above “2013 Summary Compensation Table” include compensation received during 2013 from RBS for his services as RBS’s Chief Financial Officer as well as compensation received from us for his services as our Chief Executive Officer. |
| (2) | Other than for stock awards, Mr. Van Saun’s compensation that was earned during 2013 for his services as RBS’s Chief Financial Officer has been converted from British Pounds Sterling to U.S. dollars using the year-to-date average exchange rate as of December 31, 2013 of 1.5645922 used by RBS for internal purposes. |
| (3) | The amounts in this column include, for Messrs. Fawcett, Matthews and Conner and Ms. Shanik, the RBS deferred bond component of the annual AIP awards paid to each of them in 2014 with respect to the 2013 performance year: $3,129 of this AIP award was paid in March 2014 and $35,986 will be deferred until June 6, 2014. In addition, for each of Messrs. Matthews and Conner, the amounts in this column include $150,000 as a special one-time cash allowance that will be paid to each of them in June 2014 as compensation relating to the 2013 performance year. |
| (4) | Although deferred share awards and LTIP awards are initially expressed in British Pounds Sterling, those amounts were converted by RBS into U.S. dollars at the time of grant for U.S. employees, including our NEOs, other than Mr. Van Saun who at the time of grant in 2013 was employed as RBS’s Chief Financial Officer. In converting these awards into U.S. dollars, RBS used the average exchange rate for the five trading days on the London Stock Exchange preceding the grant date, which was 1.50562. We have used the same exchange rate to convert the value of Mr. Van Saun’s equity awards. |
| (5) | The amounts in this column reflect the aggregate grant date fair value of the deferred share awards granted under the RBS Deferral Plan and awards granted under the LTIP in 2013 in respect of the 2012 performance year, in each case, calculated in accordance with FASB ASC Topic 718, excluding the effect of estimated forfeitures. The amounts for the LTIP awards were calculated based on the probable outcome of the performance conditions as of the grant date, consistent with the estimate of aggregate compensation cost to be recognized over the service period determined as of the grant date under FASB ASC Topic 718, excluding the effect of estimated forfeitures. For a breakdown of these amounts, see the “Grant Date Fair Value of Stock and Option Awards” column of the “2013 Grants of RBS Plan-Based Awards” table below. The actual value, if any, realized by the NEOs for these awards is a function of the value of the underlying shares if and when these awards vest and, for LTIP awards, holistic assessment by RemCo of the applicable performance guideposts (and subject to RemCo’s negative discretion). For purposes of this table and the tables that follow, deferred share awards are considered “unvested” to the extent they remain subject to forfeiture in the event of a termination for “cause” or grantee’s engaging in a “detrimental activity” or “competitive activity” (in each case, as defined in the RBS Deferral Plan). |
| The following are the values of the LTIP awards as of the grant date, assuming attainment of the maximum level of performance: Mr. Van Saun, ($3,387,645); Mr. Fawcett, ($840,002); Mr. Matthews, ($1,050,002); Mr. Conner, ($900,001); Ms. Shanik, ($725,000); and Ms. Alemany ($3,500,000). |
258
Table of Contents
| (6) | The amounts in this column reflect the portion of interest earned during 2013 on outstanding deferred bonds granted under the RBS Deferral Plan in excess of 120% of the applicable U.S. federal long-term rate. Because of changes in assumptions underlying the present value calculations from the end of 2012 to the end of 2013 with respect to the eligible NEOs’ (Messrs. Matthews and Conner) accumulated benefits under the RBS Americas Pension Plan, there was no increase in pension values for these NEOs and $0 has been included in this column with respect to changes in pension values for 2013. See the footnotes to and the commentary following the “2013 Pension Benefits” table below for more details on the assumptions used to determine the present values. |
| (7) | The amounts in this column reflect the aggregate incremental cost of certain perquisites and other benefits (to the extent the total value of such perquisites and personal benefits for a named executive officer was $10,000 or more) provided to the named executive officers in 2013 as follows: |
| (a) | For Mr. Van Saun, (i) with respect to his services to RBS, includes a housing allowance in the amount of $252,269; his benefits funding in the amount of $30,829; and his pension funding in the amount of $312,429; and (ii) with respect to his services to us, includes his pension and benefits allowance in the amount of $119,921 (as described under “—Potential Payments Upon Termination or Change in Control—Employment Agreements/Offer Letters with our NEOs” below); charitable matching contributions made by us on behalf of Mr. Van Saun in the amount of $11,000; and the cost associated with personal car and driver use in the amount of $6,904, which is based on allocation of fixed costs (e.g., driver’s compensation and benefits and car lease payments) and variable costs (e.g., fuel, maintenance and insurance costs, driver overtime and tolls) attributable to travel between his home and our Stamford office in 2013. |
| (b) | For Mr. Fawcett, represents company contributions to the 401(k) plan in the amount of $20,250; and the cost of an authorized car service used periodically by Mr. Fawcett in the amount of $11,809 for travel between his home and our offices in 2013. |
| (c) | For Mr. Matthews, includes company contributions to the 401(k) plan in the amount of $12,750; cost of financial planning services in the amount of $13,220; housing and related expenses for a corporate apartment in Boston, Massachusetts in the amount of $131,031 (which benefit has been discontinued as of February 28, 2014); reimbursement for taxes relating to the housing and related expenses in the amount of $117,135; reimbursement for taxes relating to financial planning in the amount of $9,000; charitable matching contributions made by us on behalf of Mr. Matthews in the amount of $25,000; and the cost associated with personal car and driver use in the amount of $47,603, which is based on allocation of fixed costs (e.g., driver’s compensation and benefits and car lease payments) and variable costs (e.g., fuel, maintenance and insurance costs, driver overtime and tolls) attributable to travel between his home and our Boston office in 2013. |
| (d) | For Mr. Conner, includes company contributions to the 401(k) plan in the amount of $13,110; cost of financial planning services in the amount of $13,220; and reimbursement for taxes relating to financial planning in the amount of $9,733. |
| (e) | For Ms. Shanik, represents company contributions to the 401(k) plan in the amount of $20,250. |
| (f) | For Ms. Alemany, includes company contributions to the 401(k) plan in the amount of $12,865; financial planning services in the amount of $13,220; a pension allowance in the amount of $740,385; a payment in the amount of $500,000 made to Ms. Alemany as compensation for providing consulting services to us upon request through the end of 2013; company-paid long-term disability premiums in the amount of $52,244 under the executive long-term disability plan in effect at the time Ms. Alemany joined CFG; reimbursement for taxes in the amount of $66,579 relating to financial planning and the long-term disability coverage; charitable matching contributions made by us on behalf of Ms. Alemany in the amount of $27,500; and the cost associated with personal car and driver use in the amount of $27,054, which is based on allocation of fixed costs (e.g., driver’s compensation and benefits and car lease payments) and variable costs (e.g., fuel, maintenance and insurance costs, driver overtime and tolls) attributable to travel between her home and our Stamford office in 2013. |
| (g) | During 2013, certain family members of Ms. Alemany and Messrs. Van Saun, Conner and Matthews occasionally accompanied them on business trips on the company plane, but there was no incremental cost associated with such use. Our NEOs are not currently permitted to use the company plane for personal travel. |
259
Table of Contents
2013 Grants of RBS Plan-Based Awards
| Name |
Grant Date |
Estimated Future Payouts |
All Other Stock Awards: Number of Shares of Stock or Units (#)(2) |
Grant Date Fair Value of Stock and Option Awards ($)(3) |
||||||||||||||||||||
| Threshold (#) |
Target (#) |
Maximum (#) |
||||||||||||||||||||||
| Bruce Van Saun |
3/8/13 | — | — | 727,685 | — | 2,258,425 | ||||||||||||||||||
| 3/8/13 | — | — | — | 316,947 | 1,475,508 | |||||||||||||||||||
| John J. Fawcett |
3/8/13 | — | — | 180,437 | — | 560,000 | ||||||||||||||||||
| 3/8/13 | — | — | — | 52,829 | 245,939 | |||||||||||||||||||
| Robert D. Matthews, Jr. |
3/8/13 | — | — | 225,546 | — | 700,000 | ||||||||||||||||||
| 3/8/13 | — | — | — | 56,052 | 260,943 | |||||||||||||||||||
| Brad L. Conner |
3/8/13 | — | — | 193,325 | — | 599,999 | ||||||||||||||||||
| 3/8/13 | — | — | — | 56,052 | 260,943 | |||||||||||||||||||
| Nancy L. Shanik |
3/8/13 | — | — | 155,734 | — | 483,332 | ||||||||||||||||||
| 3/8/13 | — | — | — | 123,514 | 575,004 | |||||||||||||||||||
| Ellen Alemany |
3/8/13 | — | — | 751,819 | — | 2,333,328 | ||||||||||||||||||
| 3/8/13 | — | — | — | 349,059 | 1,625,001 | |||||||||||||||||||
| (1) | The amounts in this column represent RBS LTIP awards granted in 2013. There is no threshold or target level of performance for these LTIP awards, and the number of RBS shares reflected above is the maximum number of shares that may be earned under the terms of these awards, assuming attainment of the maximum level of performance. For additional information, see “—Compensation Discussion and Analysis—Components of our Executive Compensation Program and Analysis—Long-Term Incentive Awards” above. |
| (2) | The amounts in this column represent RBS deferred share awards granted under the RBS Deferral Plan in 2013 for the 2012 performance year. For additional details, see “—Compensation Discussion and Analysis—Components of our Executive Compensation Program and Analysis—Annual Incentive Awards—Mandatory Deferral of 2013 Annual Incentive Awards” above. |
| (3) | This column reflects the grant date value of deferred share awards and LTIP awards, calculated in accordance with FASB ASC Topic 718, excluding the effect of estimated forfeitures. The amounts for LTIP awards granted in 2013 were calculated based on the probable outcome of the performance conditions as of the grant date, consistent with the estimate of aggregate compensation cost to be recognized over the service period determined as of the grant date under FASB ASC Topic 718, excluding the effect of estimated forfeitures. The actual value, if any, realized by the NEOs for these awards is a function of the value of the underlying shares if and when these awards vest and, for LTIP awards, holistic assessment by RemCo of the applicable performance guideposts. Grant date fair values of these awards were initially expressed in British Pounds Sterling. For details regarding how these values were converted into U.S. dollars, see footnote 4 to the “2013 Summary Compensation Table” above. |
260
Table of Contents
Outstanding RBS Equity Awards at 2013 Fiscal Year-End
| Option Awards | Stock Awards | |||||||||||||||||||||||||||||||||||
| Name |
Number of Securities Underlying Unexercised Options (#) Exercisable(1) |
Number of Securities Underlying Unexercised Options (#) Unexercisable |
Equity Incentive Plan Awards: Number of Securities Underlying Unexercised Unearned Options (#) |
Option Exercise Price ($)(2) |
Option Expiration Date(3) |
Number of Shares or Units of Stock That Have Not Vested (#)(4) |
Market Value of Shares or Units of Stock That Have Not Vested ($)(5) |
Equity Incentive Plan Awards: Number of Unearned Shares, Units or Other Rights That Have Not Vested (#) |
Equity Incentive Plan Awards: Market or Payout Value of Unearned Shares, Units or Other Rights That Have Not Vested ($)(5) |
|||||||||||||||||||||||||||
| Bruce Van Saun |
— | — | — | — | — | — | — | 170,677 | (6) | 954,571 | ||||||||||||||||||||||||||
| — | — | — | — | — | — | — | 803,859 | (7) | 4,495,861 | |||||||||||||||||||||||||||
| — | — | — | — | — | — | — | 727,685 | (8) | 4,069,833 | |||||||||||||||||||||||||||
| — | — | — | — | — | 150,000 | (9) | 838,928 | — | — | |||||||||||||||||||||||||||
| — | — | — | — | — | 316,947 | (10) | 1,772,637 | — | — | |||||||||||||||||||||||||||
| John J. Fawcett |
212,451 | — | — | 4.66 | 4/2/19 | — | — | — | — | |||||||||||||||||||||||||||
| — | — | — | — | — | — | — | 56,259 | (6) | 314,648 | |||||||||||||||||||||||||||
| — | — | — | — | — | — | — | 188,820 | (7) | 1,056,044 | |||||||||||||||||||||||||||
| — | — | — | — | — | — | — | 180,437 | (8) | 1,009,157 | |||||||||||||||||||||||||||
| — | — | — | — | — | 12,315 | (11) | 68,876 | — | — | |||||||||||||||||||||||||||
| — | — | — | — | — | 34,544 | (9) | 193,199 | — | — | |||||||||||||||||||||||||||
| — | — | — | — | — | 52,829 | (10) | 295,465 | — | — | |||||||||||||||||||||||||||
| Robert D. Matthews, Jr. |
109,260 | — | — | 4.66 | 4/2/19 | — | — | — | — | |||||||||||||||||||||||||||
| — | — | — | — | — | — | — | 51,785 | (6) | 289,626 | |||||||||||||||||||||||||||
| — | — | — | — | — | — | — | 168,590 | (7) | 942,896 | |||||||||||||||||||||||||||
| — | — | — | — | — | — | — | 225,546 | (8) | 1,261,445 | |||||||||||||||||||||||||||
| — | — | — | — | — | 11,970 | (11) | 66,946 | — | — | |||||||||||||||||||||||||||
| — | — | — | — | — | 43,422 | (9) | 242,853 | — | — | |||||||||||||||||||||||||||
| — | — | — | — | — | 56,052 | (10) | 313,490 | — | — | |||||||||||||||||||||||||||
| Brad L. Conner |
145,680 | — | — | 4.66 | 4/2/19 | — | — | — | — | |||||||||||||||||||||||||||
| — | — | — | — | — | — | — | 44,880 | (6) | 251,007 | |||||||||||||||||||||||||||
| — | — | — | — | — | — | — | 144,987 | (7) | 810,891 | |||||||||||||||||||||||||||
| — | — | — | — | — | — | — | 193,325 | (8) | 1,081,238 | |||||||||||||||||||||||||||
| — | — | — | — | — | 11,970 | (11) | 66,946 | — | — | |||||||||||||||||||||||||||
| — | — | — | — | — | 43,422 | (9) | 242,853 | — | — | |||||||||||||||||||||||||||
| — | — | — | — | — | 56,052 | (10) | 313,490 | — | — | |||||||||||||||||||||||||||
| Nancy L. Shanik |
— | — | — | — | — | — | — | 41,290 | (6) | 230,929 | ||||||||||||||||||||||||||
| — | — | — | — | — | — | — | 144,987 | (7) | 810,891 | |||||||||||||||||||||||||||
| — | — | — | — | — | — | — | 155,734 | (8) | 870,997 | |||||||||||||||||||||||||||
| — | — | — | — | — | 15,881 | (11) | 88,820 | — | — | |||||||||||||||||||||||||||
| — | — | — | — | — | 51,701 | (9) | 289,156 | — | — | |||||||||||||||||||||||||||
| — | — | — | — | — | 74,108 | (10) | 414,475 | — | — | |||||||||||||||||||||||||||
| Ellen Alemany |
805,251 | — | — | 4.66 | 9/29/14 | — | — | — | — | |||||||||||||||||||||||||||
| — | — | — | — | — | — | — | 269,281 | (6) | 1,506,048 | |||||||||||||||||||||||||||
| — | — | — | — | — | — | — | 786,751 | (7) | 4,400,182 | |||||||||||||||||||||||||||
| — | — | — | — | — | — | — | 501,213 | (8) | 2,803,209 | |||||||||||||||||||||||||||
| — | — | — | — | — | 52,475 | (11) | 293,485 | — | — | |||||||||||||||||||||||||||
| — | — | — | — | — | 139,368 | (9) | 779,464 | — | — | |||||||||||||||||||||||||||
| — | — | — | — | — | 209,435 | (10) | 1,171,339 | — | — | |||||||||||||||||||||||||||
| (1) | The amounts in this column reflect stock options that were granted under the RBS Group 2007 Executive Share Option Plan, or Option Plan, on April 3, 2009 to certain of our NEOs. These options cliff-vested and became exercisable on April 3, 2012. No other options have been granted to our NEOs since April 3, 2009. |
| (2) | Stock options were granted with an exercise price equal to the fair market value of RBS shares on the date of grant of 2.82 British Pounds Sterling, which has been converted into U.S. Dollars using the 1.6542 exchange rate, which was the rate used by RBS for internal purposes as of December 31, 2013. |
261
Table of Contents
| (3) | This column reflects the expiration date of stock options outstanding as of December 31, 2013. Ms. Alemany’s stock options expire on September 29, 2014 due to the termination of her employment by reason of her retirement. When we cease to be a member of the RBS (as defined in the Option Plan), our employees (including the NEOs) will be treated as having terminated employment under the terms of their option awards and will have 12 months to exercise outstanding options. |
| (4) | The amounts in this column reflect deferred share awards granted under the RBS Deferral Plan that remained unvested as of December 31, 2013. |
| (5) | Values in these columns have been calculated by multiplying the number of shares outstanding as of December 31, 2013 by £3.381, the closing price on the London Stock Exchange for RBS shares as of December 31, 2013, and converted into U.S. Dollars using the 1.6542 exchange rate, which was the rate used by RBS for internal purposes as of December 31, 2013. For LTIP awards, the amounts in this column assume assessment by RemCo of the maximum level of performance for LTIP awards granted in 2012 and 2013 (assuming no exercise of negative discretion by RemCo) and actual performance as assessed by RemCo for the 2011—2013 performance cycle for LTIP awards granted in 2011 (along with applicable exercise of negative discretion). For additional information, see “Compensation Discussion and Analysis—Components of our Executive Compensation Program and Analysis—Long-Term Incentive Awards” above. |
| (6) | These amounts reflect the number of shares underlying LTIP awards granted on March 7, 2011 that were unvested but expected to vest (Mr. Van Saun at 27%; Mr. Fawcett at 48.50%; Messrs. Matthews and Conner at 50%; Ms. Shanik at 46%; and Ms. Alemany at 48.75%) on March 7, 2014, based on RemCo’s holistic assessment of actual performance with respect to certain RBS, CFG and functional performance guideposts for the January 1, 2011 to December 31, 2013 performance period and exercise of negative discretion by RemCo. |
| (7) | These amounts reflect the maximum number of shares underlying LTIP awards granted on March 7, 2012 which are scheduled to vest on March 9, 2015 between 0% and 100% based on RemCo’s holistic assessment of certain RBS, CFG and functional performance guideposts for the January 1, 2012 to December 31, 2014 performance period and exercise of negative discretion by RemCo, if any. |
| (8) | These amounts reflect the maximum number of shares underlying LTIP awards granted on March 8, 2013 which are scheduled to vest on March 7, 2016 between 0% and 100% based on RemCo’s holistic assessment of certain RBS, CFG and functional performance guideposts for the January 1, 2013 to December 31, 2015 performance period and exercise of negative discretion by RemCo, if any. For Ms. Alemany, this reflects two-thirds of her 2013 LTIP award, to which she was entitled pursuant to her separation agreement. For details, see “—Potential Payments Upon Termination or Change in Control—Separation Agreement with Ellen Alemany.” |
| (9) | These amounts reflect unvested deferred share awards granted under the RBS Deferral Plan in March 2012 relating to the 2011 performance year. Three installments of deferred share awards granted to Mss. Alemany and Shanik have already vested on March 7, 2012, March 8, 2013 (March 7, 2013 for Ms. Shanik) and March 7, 2014, with the remaining installment scheduled to vest on March 9, 2015. One-half of the deferred share awards granted to Mr. Van Saun vested on March 8, 2013 and the other half vested on March 7, 2014. Deferred share awards granted to Messrs. Fawcett, Matthews and Conner vested as to one-third on March 7, 2013, one-third on March 7, 2014 and the remaining one-third is scheduled to vest on March 9, 2015. RBS shares delivered upon vesting to Mr. Van Saun and Mss. Shanik and Alemany are subject to an additional six-month holding period following each vesting date since they were “Code Staff” for 2012. For additional details, see “—Compensation Discussion and Analysis—Components of our Executive Compensation Program and Analysis—Annual Incentive Awards—Mandatory Deferral of 2013 Annual Incentive Awards” and “Compensation Discussion and Analysis—Applicability of UK and European Remuneration Rules” above. |
| (10) | These amounts reflect unvested deferred share awards granted under the RBS Deferral Plan in March 2013 relating to the 2012 performance year. Two installments of the deferred share awards granted to Mss. Alemany and Shanik have already vested on March 8, 2013 (March 7, 2013 for Ms. Shanik) and March 7, 2014, with the remaining installments scheduled to vest on March 9, 2015 and March 7, 2016. One-half of the deferred share awards granted to Mr. Van Saun vested on March 7, 2014 and the other half is scheduled to vest on March 9, 2015. Deferred share awards granted to Messrs. Fawcett, Matthews and Conner vested as to one-third on March 7, 2014, and the remaining two-thirds is scheduled to vest in two equal installments on March 9, 2015 and March 7, 2016. RBS shares delivered upon vesting to Mr. Van Saun and Mss. Shanik and Alemany are subject to an additional six-month holding period following each vesting date since they were “Code Staff” for 2013. For additional details, see “Compensation Discussion and Analysis—Components of our Executive Compensation Program and Analysis—Annual Incentive Awards—Mandatory Deferral of 2013 Annual Incentive Awards” and “Compensation Discussion and Analysis—Applicability of UK and European Remuneration Rules” above. |
| (11) | These amounts reflect unvested deferred share awards granted under the RBS Deferral Plan in March 2011 relating to the 2010 performance year. Deferred share awards granted to Mss. Shanik and Alemany vested in four installments on each of March 7, 2011, March 9, 2012 (March 7, 2012 for Ms. Shanik), March 8, 2013 (March 7, 2013 for Ms. Shanik) and March 7, 2014. Deferred share awards granted to Messrs. Fawcett, Matthews and Conner vested in three equal installments on March 7 of each of 2012, 2013 and 2014. RBS shares delivered upon vesting to Mr. Van Saun and Mss. Shanik and Alemany are subject to an additional six-month holding period following each vesting date since they were “Code Staff” for 2011. For additional details, see “Compensation Discussion and Analysis—Components of our Executive Compensation Program and Analysis—Annual Incentive Awards—Mandatory Deferral of 2013 Annual Incentive Awards” and “Compensation Discussion and Analysis—Applicability of UK and European Remuneration Rules” above. |
262
Table of Contents
RBS Options Exercised and Stock Vested in 2013
| Stock Awards | ||||||||
| Name |
Number of Shares Acquired on Vesting (#) |
Value Realized on Vesting ($)(1) |
||||||
| Bruce Van Saun |
301,544 | 1,378,344 | ||||||
| John J. Fawcett |
174,507 | 803,627 | ||||||
| Robert D. Matthews, Jr. |
193,156 | 889,452 | ||||||
| Brad L. Conner |
194,705 | 896,601 | ||||||
| Nancy L. Shanik |
91,136 | 415,177 | ||||||
| Ellen Alemany |
547,702 | 2,516,184 | ||||||
| (1) | The values reflected in this column have been calculated by multiplying the number of shares underlying outstanding equity awards that vested on each relevant date by the closing price on the London Stock Exchange of RBS shares on such date, and then converted into U.S. Dollars based on the exchange rate used by RBS for internal purposes as of each such date, which were as follows: March 7, 2013 (1.5025); March 8, 2013 (1.4928); and May 14, 2013 (1.5257). |
2013 Pension Benefits
We sponsor the RBS Americas Pension Plan, or the Pension Plan, which is a non-contributory defined benefit pension plan that is qualified under Section 401(a) of the Internal Revenue Code. The Pension Plan was closed to new hires and re-hires effective January 1, 2009, and frozen to all participants and benefit accruals effective December 31, 2012. During 2013 regular full-time and part-time employees of the Company who were hired before January 1, 2009 and completed one year of service were eligible for benefits under the Pension Plan.
The benefit under the Pension Plan for employees is currently calculated using a formula based on the employee’s “average gross compensation” (defined under the Pension Plan as a participant’s average eligible compensation during five years of employment (whether or not consecutive) prior to December 31, 2012 yielding the highest average), subject to limitations imposed by the Internal Revenue Service. Eligible compensation generally includes all taxable compensation, other than certain equity-based and non-recurring amounts. The formula generally provides for a benefit of 1% of average gross compensation multiplied by each year of the participant’s credited service, with such benefit percentage varying depending on the employee’s hire date and retirement date, as specified under the Pension Plan. Pension benefits under the Pension Plan are generally payable in the form of a monthly annuity, though benefits under the Pension Plan may be received as a lump sum payment.
A participant’s pension benefit under the Pension Plan vests in full on the “normal retirement date”—generally, when the participant reaches age 65 (or, for certain individuals (depending on the date such participant commenced participation in the Pension Plan), the fifth anniversary of the date such participant commenced participation in the Pension Plan, if later). A participant’s pension benefit under the Pension Plan also vests in full upon completion of five years of vesting service. Participants may begin receiving full retirement benefits on the first day of the month coincident with or immediately following the normal retirement date and may be eligible for reduced benefits if retiring after attainment of age 55 with a minimum of five years of vesting service. Participants who retire after attainment of age 62 with a minimum of twenty years of vesting service are eligible to receive unreduced retirement benefits. Messrs. Matthews and Conner became participants in the Pension Plan on April 1, 2009 and July 1, 2009, respectively. As of December 31, 2013, Messrs. Matthews and Conner were not eligible for early retirement under the Pension Plan. Based on their age at date of hire, Messrs. Matthews and Conner will never be eligible for unreduced retirement benefits at age 62.
263
Table of Contents
| Name |
Plan Name |
Number of Years Credited Service (#)(2) |
Present Value of Accumulated Benefit ($)(3) |
Payments During Last Fiscal Year ($) |
||||||||||
| Bruce Van Saun(1) |
— | — | — | — | ||||||||||
| John D. Fawcett(1) |
— | — | — | — | ||||||||||
| Robert D. Matthews, Jr. |
RBS Americas Pension Plan | 4.75 | 72,982 | 0 | ||||||||||
| Brad L. Conner |
RBS Americas Pension Plan | 4.54 | 73,106 | 0 | ||||||||||
| Nancy L. Shanik(1) |
— | — | — | — | ||||||||||
| Ellen Alemany(1) |
— | — | — | — | ||||||||||
| (1) | Messrs. Van Saun and Fawcett and Mss. Shanik and Alemany are not eligible for benefits under any Company-sponsored defined benefit plans. |
| (2) | After December 31, 2012, no further benefit accruals occur under the RBS Americas Pension Plan. Therefore, an eligible employee’s actual years of service to us may be more than such employee’s years of credited service under the RBS Americas Pension Plan. |
| (3) | The present value of accumulated benefits at December 31, 2013 was calculated using the same actuarial assumptions used by us for GAAP financial reporting purposes, except as noted below. The key assumptions are: (i) a discount rate of 5.0%, (ii) a retirement age of 65, as required (the earliest unreduced retirement age under the RBS Americas Pension Plan), (iii) the RP-2000 Scale AA Combined Healthy Mortality Table for males using generational projection Scale AA and (iv) no pre-retirement decrements, as required. |
Nonqualified Deferred Compensation
| Name |
Executive Contributions in Last FY ($) |
Registrant Contributions in Last FY ($)(2) |
Aggregate Earnings in Last FY ($)(3) |
Aggregate Withdrawals ($)(4) |
Aggregate Balance at Last FYE(5) ($) |
|||||||||||||||
| Bruce Van Saun(1) |
||||||||||||||||||||
| AIP awards—deferred bonds |
— | — | — | — | — | |||||||||||||||
| Nonqualified deferred compensation plans(6) |
— | — | — | — | — | |||||||||||||||
| John J. Fawcett |
||||||||||||||||||||
| AIP awards—deferred bonds |
— | 35,986 | 12,460 | 836,599 | 522,996 | |||||||||||||||
| Nonqualified deferred compensation plans(6) |
— | — | — | — | — | |||||||||||||||
| Robert D. Matthews, Jr. |
||||||||||||||||||||
| AIP awards—deferred bonds |
— | 35,986 | 12,741 | 874,130 | 578,810 | |||||||||||||||
| Nonqualified deferred compensation plans(6) |
— | — | — | — | — | |||||||||||||||
| Brad L. Conner |
||||||||||||||||||||
| AIP awards—deferred bonds |
— | 35,986 | 12,741 | 874,130 | 578,810 | |||||||||||||||
| Nonqualified deferred compensation plans(6) |
— | — | — | — | — | |||||||||||||||
| Nancy L. Shanik |
||||||||||||||||||||
| AIP awards—deferred bonds |
— | 35,986 | 13,297 | 473,297 | 737,838 | |||||||||||||||
| Nonqualified deferred compensation plans(6) |
— | — | — | — | — | |||||||||||||||
| Ellen Alemany |
||||||||||||||||||||
| AIP awards—deferred bonds |
— | — | 42,024 | 1,382,024 | 2,115,740 | |||||||||||||||
| Nonqualified deferred compensation plans(6) |
— | — | 916,156 | 706,193 | 8,716,007 | |||||||||||||||
| (1) | Mr. Van Saun does not have any deferred bonds outstanding as of December 31, 2013 as all of his AIP awards have been granted in the form of deferred share awards (as is the case with other executive directors of RBS), as determined by RBS following consultation with its shareholders. |
264
Table of Contents
| (2) | Amounts in this column reflect the RBS deferred bond portion (with no interest) of the AIP award granted in 2014 for the 2013 performance year, the payment of which has been deferred until June 6, 2014. These amounts are also reflected in the “Bonus” column of the “2013 Summary Compensation Table” for applicable NEOs. |
| (3) | Amounts in this column reflect aggregate earnings on the RBS deferred bond portion of AIP awards during 2013 with respect to awards for the 2012 and 2011 performance years. These amounts include any nonqualified deferred compensation earnings that are disclosed in the “Change in Pension Value and Nonqualified Deferred Compensation Earnings” column of the “2013 Summary Compensation Table” and described in footnote 6 thereto. |
| (4) | Amounts in this column reflect the aggregate value of deferred bonds and accrued interest that were paid out during 2013 with respect to deferred bond portion of AIP awards for the 2012 and 2011 performance years. |
| (5) | All amounts deferred and earnings on such deferred amounts in 2013 have been reported in the “Bonus” and “Change in Pension Value and Nonqualified Deferred Compensation Earnings” columns of the “2013 Summary Compensation Table” above. |
| (6) | Amounts in this row reflect amounts with respect to the CFG Deferred Compensation Plan and the RBS Americas Deferred Compensation Plan, the material terms of which are described below. |
AIP Awards—Deferred Bond Awards
As described in the Compensation Discussion & Analysis above, the time and the form of payment for AIP awards are determined by RemCo. Awards have been historically granted partially in deferred bonds (with interest in certain prior years) and partially in deferred share awards, and are subject to the terms and conditions of the RBS Deferral Plan. Deferred share awards that were granted to our NEOs in 2013 for the 2012 performance year are reflected in the “2013 Grants of RBS Plan-Based Awards” table above, and all deferred share awards that remained outstanding as of December 31, 2013 are reflected in the Outstanding Equity Awards At 2013 Fiscal Year-End above.
Amounts in the above table relate to the RBS deferred bond portion of AIP awards, including applicable earnings, to the extent they have been paid during 2013 or remained outstanding as of December 31, 2013. Prior to awards for performance year 2013, deferred bond awards earned interest. Deferred bonds remain subject to the cancellation and forfeiture provisions included in the RBS Deferral Plan.
Nonqualified Deferred Compensation Plans
We maintain two nonqualified deferred compensation plans—the CFG Deferred Compensation Plan and the RBS Americas Deferred Compensation Plan. Following closure of the CFG Deferred Compensation Plan to new participants on December 31, 2008, the RBS Americas Deferred Compensation Plan was adopted, effective as of January 1, 2009. The deferred compensation plans currently do not offer any matching contributions or provide for above-market earnings, and none of our NEOs participated in these plans during 2013. Only Ms. Alemany had a balance under each of these plans as of December 31, 2013.
Under the CFG Deferred Compensation Plan, eligibility was limited to our “key officers” as designated from time to time by our executive committee. Participants are permitted to defer between 1% and 90% of their base salary, annual bonus and payments under any long-term incentive plan, subject to a minimum deferral of $5,000. Participants select the allocation of their accounts among investment indices available under the plan. Our Board of Directors may amend the plan at any time, as long as the amount accrued to the date of amendment in any account under the plan is not decreased or otherwise restricted, and may terminate the plan at any time. Pursuant to elections made by Ms. Alemany under the plan, certain amounts outstanding under this plan as of December 31, 2013 were paid to her in a lump sum following her retirement date and other amounts continue to be paid to her as part of a series of 10 annual installments that commenced during her service.
Under the RBS Americas Deferred Compensation Plan, eligibility is limited to employees who have total compensation in the immediately preceding year equal to or exceeding the Internal Revenue Code Section 401(a)(17) limit for the relevant plan year. Participants are permitted to defer between
265
Table of Contents
1% and 80% of their base salary and annual bonus. Participants select the allocation of their accounts among investment indices available under the plan. Our Board of Directors may amend the plan at any time, as long as the amount accrued to the date of amendment in any account under the plan is not decreased or otherwise restricted. Pursuant to elections made by Ms. Alemany under the plan, the amount outstanding under this plan as of December 31, 2013 will be paid to Ms. Alemany in 10 annual installments, with the first payment occurring six months following her retirement date.
Potential Payments Upon Termination or Change in Control
We have entered into an employment agreement with our CEO and offer letters with each of our other NEOs. In addition, our full-time employees, including our NEOs (other than our CEO who is eligible for severance under the terms of his employment agreement) are eligible for severance benefits pursuant to our severance practice. Material terms of our severance practice, our CEO’s employment agreement and each of our other NEO’s offer letters are summarized below. Please see the “Potential Payments Table” section below for quantification of estimated payments, as provided for under these arrangements and the terms of outstanding equity awards (as applicable), that would be made to our NEOs under various termination scenarios or a change in control, assuming such event occurred on December 31, 2013.
In addition, following a termination of employment, our NEOs are entitled to the nonqualified deferred compensation amounts, to the extent vested, reported in the “2013 Nonqualified Deferred Compensation” table above, subject to the terms of the arrangements, as described in the accompanying narrative.
Severance Practice
Our severance practice provides for the payment of severance benefits to eligible employees in the event their employment with us is terminated without cause and for reasons unrelated to poor performance. Under the severance practice, eligible employees who execute a severance and release agreement may receive a lump sum payment equal to two weeks of severance pay for each year of his or her employment, with a minimum payment of 26 weeks of base salary for individuals whose base salary equals or exceeds $300,000 and a maximum of 52 weeks of base salary payments (regardless of the employee’s base salary).
In addition to severance pay, eligible employees are entitled to receive benefits under our then-existing health and welfare plans for a period of one month following the month in which termination of employment occurs at active employee rates, which is in addition to the COBRA continuation coverage periods. Outplacement services are also offered to eligible employees with the duration of such service varying by level of employee. We may amend or terminate this practice at any time.
Employment Agreements/Offer Letters with Our NEOs
We have entered into an employment agreement with Mr. Van Saun and offer letters with each of our other NEOs. Material terms of Mr. Van Saun’s agreement and the other NEOs’ offer letters are summarized below.
Employment Agreement with Mr. Van Saun
General Terms
In connection with his appointment, we entered into an offer letter and an employment agreement with our CEO, Mr. Van Saun, which were effective as of October 1, 2013 (referred to collectively as the “employment agreement”). Mr. Van Saun’s compensation, as set forth in his employment agreement, was informed by negotiations between RBS, us and Mr. Van Saun, as well as the terms of his compensation arrangement during his tenure with RBS.
266
Table of Contents
Under the terms of Mr. Van Saun’s employment agreement, Mr. Van Saun is:
| • | entitled to: |
| • | an initial annual base salary of $1,370,000; |
| • | an additional initial annual amount of $519,659, or the Pension and Benefit Funding, which is intended to make Mr. Van Saun whole for pension and benefits funding received during his service to RBS in the UK; |
| • | participate in our employee benefit and welfare plans on a basis that is at least as favorable as that provided to our other executives who are based in the United States, except that he does not receive company contributions to the 401(k) plan; |
| • | relocation benefits under the RBS’s relocation policy in connection with his relocation to the U.S.; and |
| • | the right to receive tax and advisory support through the U.S. tax year ending December 2015 and UK tax year ending March 2016 (unless he is terminated sooner for “cause” (as defined in his employment agreement and summarized below) or voluntarily resigns); and |
| • | is eligible for: |
| • | discretionary annual incentive awards under the applicable bonus program with a target bonus opportunity equal to 175% of Mr. Van Saun’s base salary and maximum bonus opportunity equal to 250% of Mr. Van Saun’s base salary; and |
| • | long-term equity-based awards under the LTIP with a target long-term incentive opportunity equal to 200% of Mr. Van Saun’s base salary and maximum long-term incentive opportunity equal to 300% of Mr. Van Saun’s base salary. |
However, notwithstanding his eligibility under the bonus program and LTIP, as described above, starting with the 2014 performance year, Mr. Van Saun’s variable compensation is subject to the limitations imposed by CRD IV for so long as such limitations continue to apply to us. For further details, see “Compensation Discussion and Analysis—Applicability of UK and European Remuneration Rules” above.
Under the terms of his employment agreement, Mr. Van Saun is also entitled to certain severance benefits as described below.
Termination Without “Cause” or for “Good Reason” Absent Change in Control
Upon six-months’ notice to Mr. Van Saun (or in the alternative, (i) payment in lieu of such notice equal to six months of his base salary and Pension and Benefit Funding, to be paid in installments on regularly scheduled payroll dates and reduced to offset other income he received during this period, or (ii) a six-month “garden leave” during which Mr. Van Saun will not be reporting to work but will continue to receive payments of his base salary and Pension and Benefit Funding), we can terminate Mr. Van Saun’s employment without “cause” or, upon written notice to us, Mr. Van Saun can terminate his employment for “good reason” (as defined in his employment agreement and summarized below) if we fail to cure “good reason” circumstances within 30 days of receiving notice. Upon such terminations, in lieu of any other payments that may be due to him under any other severance plan or practice we maintain, Mr. Van Saun:
| • | will be entitled to a lump sum cash payment equal to 12 months of his then base salary within 30 days of his termination; |
| • | will be treated as a “good leaver” by reason of redundancy under the RBS Deferral Plan and LTIP (which would result in him receiving his deferred share awards and LTIP awards on the |
267
Table of Contents
| original payment dates, subject to satisfaction of the applicable performance conditions, if any, and pro rata reductions); and |
| • | subject to his execution of a release and not being terminated by us for underperformance, will be entitled to receive a pro rata target incentive award under the applicable annual incentive plan in respect of the year in which such termination occurs, provided that there is an orderly handover of responsibilities. |
In addition, upon his termination for “good reason,” Mr. Van Saun will receive a payment equal to six months of his base salary and Pension and Benefit Funding in lieu of the six-months’ notice requirement (to be paid in installments on regularly scheduled payroll dates and reduced to offset other income received during this period).
Termination in Connection with Change in Control
If, within six months of a “disposal” of CFG (which under his employment agreement is defined as a sale to a third party of all or substantially all of CFG), Mr. Van Saun is terminated by the applicable acquirer or resigns in direct response to being assigned to a position in which the nature or scope of his responsibilities or authority is not reasonably regarded as equivalent to or more senior to his position at us immediately prior to such sale, subject to his execution of a release, Mr. Van Saun will generally be:
| • | entitled to receive a payment equal to two times the sum of his then base salary and Pension and Benefit Funding; |
| • | treated as a “good leaver” by reason of redundancy under the RBS Deferral Plan and the LTIP (vesting for LTIP awards will be set at two-thirds of face value) and, will not be subject to proration if he has completed five years of service to RBS (provided he has given at least six-months’ notice in the event of a voluntary termination of employment, the RBS board of directors does not determine that he committed any act warranting termination for “cause” and he does not commence employment with certain enumerated companies during the vesting period (which may be waived); and |
| • | subject to not being terminated by us for underperformance, entitled to a pro rata target incentive award under the applicable annual incentive plan in respect of the year in which such termination occurs. |
The above payments are subject to the following conditions: (i) Mr. Van Saun has not been offered or accepted a position with the acquirer that is at least as equivalent to his position immediately prior to the sale; (ii) in our opinion, Mr. Van Saun has not materially underperformed against agreed-upon performance objectives and plans; (iii) circumstances do not exist that would warrant a termination of Mr. Van Saun by us or the acquirer for “cause”; and (iv) there has been no clawback triggered under RBS equity plans resulting in the reduction of Mr. Van Saun’s awards.
Voluntary Termination Other Than for “Good Reason”
Mr. Van Saun can terminate his employment voluntarily (other than for “good reason”) at any time upon giving a six-months’ notice. We may, in our sole discretion, either place Mr. Van Saun on “garden leave” during such notice period (during which Mr. Van Saun will continue to receive his base salary and Pension and Benefit Funding) or pay him an amount equal to six months of his base salary in lieu of the notice period (to be paid in installments on regularly scheduled payroll dates and reduced to offset other income received during this period).
Following the date on which Mr. Van Saun completes five years of service with RBS, Mr. Van Saun will be treated as a “good leaver” by reason of redundancy under the RBS Deferral Plan and
268
Table of Contents
LTIP (but without any pro rata reduction), provided he has given at least six-months’ notice in the event of a voluntary termination of employment, the RBS board of directors does not determine that he committed any act warranting termination for “cause” and he does not commence employment with certain enumerated companies during the vesting period (which may be waived).
Termination due to Retirement, Death or Disability
Upon his termination of employment due to death or retirement, Mr. Van Saun or his estate will be entitled to, in each case, through the end of the month in which termination occurs:
| • | his base salary; and |
| • | Pension and Benefit Funding. |
Upon his termination due to disability, he will be entitled to receive the same payments except through the date on which he will first become eligible to receive payment of long-term disability benefits under our employee benefit plans as then in effect.
Termination for “Cause”
If Mr. Van Saun’s employment is terminated for “cause,” Mr. Van Saun will receive his unpaid salary and Pension and Benefit Funding through his termination date and will not be entitled to any additional payments or benefits.
Restrictive Covenants
Mr. Van Saun is subject to a perpetual confidentiality covenant. During his employment and for a period of six months following termination from us other than for “good reason” (less any time spent on “garden leave”), Mr. Van Saun cannot hold a position as employee, director, officer, consultant, partner, agent or principal in certain enumerated companies deemed to be a competitor of RBS or us, without the prior consent of RBS and CFG. During his employment and for a period of 12 months following his termination of employment from us (less any time spent on “garden leave”), Mr. Van Saun also cannot solicit or hire employees of RBS or us or solicit any of our customers or prospective clients or persuade or attempt to persuade any such customers or clients to divert business from us.
Definitions
“Cause” generally means Mr. Van Saun’s (i) willful material breach of any of his obligations under his employment agreement; (ii) in the opinion of RBS’s board of directors, being guilty of gross misconduct which brings him or us or any other member of RBS into disrepute; (iii) dishonesty in the conduct of his duties; (iv) gross incompetence, willful neglect of duty or mismanagement of his financial affairs through failure to observe our rules and procedures for the operation of bank accounts and/or borrowing; (v) being found guilty of, or entering a plea of nolo contendere to, any felony or misdemeanor involving dishonesty; (vi) committing any act of bankruptcy or taking advantage of any statute for the time being in force offering relief to insolvent debtors; or (vii) being prohibited from acting as our officer or any other member of the RBS due to any default on his part.
“Good reason” generally means (i) material breach of Mr. Van Saun’s employment agreement or (ii) a substantial diminution or other substantial adverse change not consented to by Mr. Van Saun, in the nature or scope of his base salary or responsibilities, authorities, powers, functions or duties.
269
Table of Contents
Offer Letters of Messrs. Fawcett, Matthews and Conner and Ms. Shanik
Each of Messrs. Fawcett, Matthews and Conner and Ms. Shanik have offer letters with us or one of our subsidiaries. These offer letters generally provide for the terms of each executive’s compensation arrangement, including salary, eligibility to receive annual cash and equity incentive awards and vacation and eligibility for other health and welfare benefits.
Under the offer letters, each of the executives is subject to a notice period with regard to his or her intent to leave our or one of our subsidiaries’ employ for any reason (for Messrs. Fawcett and Matthews, 90 days; for Mr. Conner, 60 days; and for Ms. Shanik, 30 days). In addition, each of the offer letters contains non-solicitation of customers and employees covenants (for Mr. Fawcett, for 90 days following his termination of employment for wrongful conduct (as defined in his offer letter); for Mr. Matthews and Ms. Shanik, for 12 months following a termination of employment for any reason; and for Mr. Conner, for 12 months with respect to the non-solicitation of employees covenant and for six months with respect to the non-solicitation of customers covenant following his termination of employment for any reason). Mr. Fawcett’s offer letter also includes a non-competition covenant that survives for 90 days following his termination of employment for wrongful conduct (as defined in his offer letter).
In addition, for Mr. Matthews, if, within one year of a change in control (defined as the time when any person other than us or RBS or any of their affiliates becomes the owner of more than 50% of the voting power of our stock), Mr. Matthews’s compensation is decreased or his title, level or responsibility are materially decreased, Mr. Matthews is entitled, upon giving notice of his resignation, to receive, within 90 days of his termination, (i) the cash equivalent of two years’ base salary and (ii) the cost of any benefits he was receiving immediately prior to the time of such change in control (including any living expense allowances, if applicable). Ms. Shanik’s offer letter originally provided for certain severance benefits if her employment was terminated by us other than for “wrongful conduct” (as defined in her offer letter) or serious underperformance within three years of the commencement of her employment with us. As of September 2013, the obligation to pay such severance benefits to Ms. Shanik has lapsed.
Potential Payments Table
The following table summarizes estimated payments, as provided for under our severance practice, our CEO’s employment agreement and each of our other NEO’s offer letters and the terms of their outstanding equity awards (as applicable), that would be made to our NEOs at, following or in connection with a termination of employment under various termination scenarios or a change in control, assuming such event occurred on December 31, 2013. For the summary of the material terms of the severance practice, our CEO’s employment agreement and each of our other NEO’s offer letters, see “—Severance Practice” and “—Employment Agreements/Offer Letters with our NEOs” above.
270
Table of Contents
Amounts for Ellen Alemany are not included in the table below because she retired prior to December 31, 2013. Amounts which were paid or payable to her in connection with her retirement, along with the terms of her separation agreement, are described below under “—Separation Agreement with Ellen Alemany” and are also included in the “All Other Compensation” column of the “2013 Summary Compensation Table” above.
| Name |
Voluntary Termination ($) |
Voluntary Termination with Good Reason ($) |
Not for Cause Termination ($) |
For Cause Termination ($) |
Change in Control Not for Cause Termination ($) |
Change in Control Only (No Related Termination) ($) |
Death ($) | Disability ($) |
Retirement ($) |
|||||||||||||||||||||||||||
| Bruce Van Saun |
||||||||||||||||||||||||||||||||||||
| Cash Payment |
— | (6) | 4,712,330 | (7) | 3,767,500 | (8) | — | 6,176,818 | (9) | — | — | 944,830 | (10) | — | ||||||||||||||||||||||
| Deferred Share Awards/LTIP Awards(1)(2) |
7,391,083 | 7,391,083 | 7,391,083 | — | 6,098,424 | 7,391,083 | 12,131,829 | 7,391,083 | 7,391,083 | |||||||||||||||||||||||||||
| Health Benefits(3) |
— | 1,153 | 1,153 | — | 1,153 | — | — | — | — | |||||||||||||||||||||||||||
| Outplacement Services(4) |
— | 4,378 | 4,378 | — | 4,378 | — | — | — | — | |||||||||||||||||||||||||||
| Total |
7,391,083 | 12,108,944 | 11,164,114 | — | 12,280,773 | 7,391,083 | 12,131,829 | 8,335,913 | 7,391,083 | |||||||||||||||||||||||||||
| John J. Fawcett |
||||||||||||||||||||||||||||||||||||
| Cash Payment |
— | — | 350,000 | (11) | — | — | — | — | — | — | ||||||||||||||||||||||||||
| Deferred Share Awards/LTIP Awards(1)(5) |
557,540 | 557,540 | 1,780,389 | — | 1,780,389 | 1,780,389 | 2,937,389 | 1,780,389 | 1,780,389 | |||||||||||||||||||||||||||
| Health Benefits(3) |
— | — | 1,190 | — | — | — | — | — | — | |||||||||||||||||||||||||||
| Outplacement Services(4) |
— | — | 4,378 | — | — | — | — | — | — | |||||||||||||||||||||||||||
| Total |
557,540 | 557,540 | 2,135,957 | — | 1,780,389 | 1,780,389 | 2,937,389 | 1,780,389 | 1,780,389 | |||||||||||||||||||||||||||
| Robert D. Matthews, Jr. |
— | |||||||||||||||||||||||||||||||||||
| Cash Payment |
— | — | 375,000 | (11) | — | 1,770,386 | (12) | — | — | — | — | |||||||||||||||||||||||||
| Deferred Share Awards/LTIP Awards(1)(5) |
623,290 | 623,290 | 1,823,442 | — | 1,823,442 | 1,823,442 | 3,117,259 | 1,823,442 | 1,823,442 | |||||||||||||||||||||||||||
| Health Benefits(3) |
— | — | 1,153 | — | — | — | — | — | — | |||||||||||||||||||||||||||
| Outplacement Services(4) |
— | — | 4,378 | — | — | — | — | — | — | |||||||||||||||||||||||||||
| Total |
623,290 | 623,290 | 2,203,973 | — | 3,593,828 | 1,823,442 | 3,117,259 | 1,823,442 | 1,823,442 | |||||||||||||||||||||||||||
| Brad L. Conner |
||||||||||||||||||||||||||||||||||||
| Cash Payment |
— | — | 350,000 | (11) | — | — | — | — | — | — | ||||||||||||||||||||||||||
| Deferred Share Awards/LTIP Awards(1)(5) |
623,290 | 623,290 | 1,656,240 | — | 1,656,240 | 1,656,240 | 2,766,425 | 1,656,240 | 1,656,240 | |||||||||||||||||||||||||||
| Health Benefits(3) |
— | — | 1,066 | — | — | — | — | — | — | |||||||||||||||||||||||||||
| Outplacement Services(4) |
— | — | 4,378 | — | — | — | — | — | — | |||||||||||||||||||||||||||
| Total |
623,290 | 623,290 | 2,011,684 | — | 1,656,240 | 1,656,240 | 2,766,425 | 1,656,240 | 1,656,240 | |||||||||||||||||||||||||||
| Nancy L. Shanik |
||||||||||||||||||||||||||||||||||||
| Cash Payment |
— | — | 287,500 | (11) | — | — | — | — | — | — | ||||||||||||||||||||||||||
| Deferred Share Awards/LTIP Awards(1)(5) |
792,451 | 792,451 | 1,748,038 | — | 1,748,038 | 1,748,038 | 2,705,267 | 1,748,038 | 1,748,038 | |||||||||||||||||||||||||||
| Health Benefits(3) |
— | — | — | — | — | — | — | — | — | |||||||||||||||||||||||||||
| Outplacement Services(4) |
— | — | 4,378 | — | — | — | — | — | — | |||||||||||||||||||||||||||
| Total |
792,451 | 792,451 | 2,039,916 | — | 1,748,038 | 1,748,038 | 2,705,267 | 1,748,038 | 1,748,038 | |||||||||||||||||||||||||||
| (1) | These amounts reflect the number of deferred share awards and LTIP awards (as described below and as applicable) outstanding as of December 31, 2013 and multiplied by £3.381 (the closing price on the London Stock Exchange for RBS shares as of December 31, 2013), and converted into U.S. dollars using an exchange rate of 1.6542 (which represented the exchange rate used for internal purposes by RBS as of December 31, 2013). The amounts in this row assume assessment by RemCo of the maximum level of performance for LTIP awards granted in 2012 and 2013 as of December 31, 2013 and reflect RemCo’s actual holistic assessment for LTIP awards granted in 2011. For additional information, see “—Compensation Discussion and Analysis—Components of Our Executive Compensation Program and Analysis—Long-Term Incentive Awards” above. |
| (2) | Under the terms of his employment agreement, except in the event of a termination for “cause” (as defined in Mr. Van Saun’s employment agreement), Mr. Van Saun will continue (i) to “vest” in his outstanding deferred share awards granted under the RBS Deferral Plan in accordance with the original vesting schedule, subject to not engaging in any “competitive activity” or “detrimental activity” (in each case, as defined in the RBS Deferral Plan) and (ii) to vest in his outstanding LTIP awards, subject to RemCo’s holistic assessment of applicable performance guideposts and subject to proration based on the portion of the applicable vesting period during which he was employed, except in the event of his death (in which case there would be no proration). |
| In the event of our “disposal” (as defined in Mr. Van Saun’s employment agreement) and Mr. Van Saun’s termination by the applicable acquirer or his resignation in direct response to being assigned to a position in which the nature or scope of his |
271
Table of Contents
| responsibilities or authority is not reasonably regarded as equivalent to or more senior to his position at CFG immediately prior to such disposal, subject to his execution of a release (as defined in his employment agreement), his LTIP awards would be deemed vested at two-thirds of their face value. |
| Following September 8, 2014, the date Mr. Van Saun will have completed five years of service to RBS, Mr. Van Saun’s LTIP awards will not be subject to proration (provided he has given at least six months’ notice in the event of a voluntary termination of employment, the RBS board of directors does not determine that he committed any act warranting a termination for “cause” and he does not commence employment with certain enumerated companies during the vesting period (which may be waived)). Since as of December 31, 2013, Mr. Van Saun would not have been eligible for this treatment, LTIP awards reflected in the table above are prorated. |
| (3) | The amounts reflected above for this benefit reflect the cost of COBRA continuation coverage for one month under the plan in which the particular executive is enrolled, less the applicable active employee rate. For Mr. Van Saun, this benefit is provided under his employment agreement. |
| (4) | Reflects the cost to us of providing outplacement services for 12 months under our outplacement policy. |
| (5) | Under the terms of the RBS Deferral Plan, following an NEO’s termination of employment for any reason (other than for “cause” (as defined in the RBS Deferral Plan), in which cases deferred share awards would be forfeited), each of these NEOs will continue to “vest” in his or her outstanding deferred share awards in accordance with the original vesting schedule as long as the NEO does not engage in any “detrimental activity” (as defined in the RBS Deferral Plan) in the case of termination of employment due to redundancy or both any “competitive activity” (as defined in the RBS Deferral Plan) and any “detrimental activity” in the case of any other termination of employment. |
| Under the terms of the LTIP, following an NEO’s termination of employment due to (i) ill-health, injury or disability, (ii) retirement with our agreement, (iii) redundancy, (iv) NEO’s employing entity ceasing to be a “member” of RBS (such as due to a “change in control” event), (v) the business in which the NEO works being transferred to a person which is not a “member” of RBS or (vi) any other reason, if and to the extent RemCo so decides in any particular case, each of these NEOs would continue to vest in his or her outstanding LTIP awards in accordance with the original vesting schedule, subject to RemCo’s holistic assessment of applicable performance guideposts and, unless otherwise determined by RemCo or except in the event of the NEO’s death, subject to proration based on the portion of the vesting period during which the NEO was employed by us. |
| (6) | This assumes that we do not elect, in our discretion, to pay Mr. Van Saun six months of base salary and Pension and Benefits Funding in lieu of complying with the notice period under the terms of his employment agreement. |
| (7) | This amount reflects the sum of (i) 18 months of base salary, (ii) six months of Pension and Benefits funding and (iii) a pro rata annual discretionary award based on target (175% of base salary under Mr. Van Saun’s offer letter). Because the assumed termination date is December 31, 2013, the full target award is reflected. |
| (8) | This amount reflects the sum of (i) 12 months of base salary and (ii) a pro rata annual discretionary award based on target (175% of base salary under Mr. Van Saun’s offer letter). Because the assumed termination date is December 31, 2013, the full target award is reflected. This amount also assumes that we do not elect, in our discretion, to pay Mr. Van Saun six months of base salary and Pension and Benefits Funding in lieu of complying with the notice period under the terms of his employment agreement. |
| (9) | This amount reflects the sum of (i) two times the sum of Mr. Van Saun’s base salary and Pension and Benefits Funding and (ii) a pro rata annual discretionary award based on target (175% of base salary under Mr. Van Saun’s offer letter). Because the assumed termination date is December 31, 2013, the full target award is reflected. |
| (10) | This amount reflects six months of base salary and Pension and Benefits Funding, which will be paid to Mr. Van Saun prior to his receipt of long-term disability benefits under the terms of his employment agreement. |
| (11) | This amount reflects 26 weeks of base salary, as provided for under our severance practice. |
| (12) | This amount reflects two times Mr. Matthews’s base salary ($1.5 million) plus the cost of relocation and financial planning benefits received by Mr. Matthews during 2013 ($270,386), as provided for under the terms of his offer letter. |
Separation Agreement with Ellen Alemany
In connection with her retirement, effective as of September 30, 2013, we entered into a separation and release agreement with Ms. Alemany. Under the terms of her separation agreement: (i) Ms. Alemany received a lump sum payment equal to $500,000, as compensation for providing consulting services to us upon request through the end of 2013; (ii) Ms. Alemany and her dependents are entitled to participate in a company self-funded retiree medical plan until Ms. Alemany reaches age 65, subject to Ms. Alemany’s paying the full cost of premiums for that coverage; (iii) Ms. Alemany was eligible to be considered for a discretionary annual incentive award for the 2013 performance period, prorated 75% to reflect the portion of the performance year for which she was employed with us, paid
272
Table of Contents
in accordance with the RBS Deferral Plan, and subject to the same terms and conditions of the RBS Deferral Plan as applied to other senior executives who are Code Staff of CFG, RBS or their respective affiliates; (iv) LTIP awards granted to Ms. Alemany in 2011 and 2012 continue to fully vest in accordance with their terms (without proration) (for a total of $6,154,787); (v) LTIP awards granted to Ms. Alemany in 2013 continue to vest in accordance with their terms, subject to two-thirds proration based on the portion of the performance period deemed to have elapsed by September 30, 2013 (for a total of $1,947,453); (vi) Ms. Alemany has been treated as a “voluntary leaver” under the RBS Deferral Plan so that all earned but unpaid deferred awards will be paid according to their original schedules (for a total of $2,338,737). Ms. Alemany did not receive an annual incentive award for the 2013 performance year in light of overall challenges faced by RBS during 2013. Calculations for Ms. Alemany are based on the closing price on the London Stock Exchange for RBS shares on her date of retirement (£3.599) and an exchange rate of 1.6194, which was used for internal RBS purposes as of such date.
All of the above payments and benefits were subject to Ms. Alemany executing and not revoking a release of claims in our favor. In addition, any unvested RBS Deferral Plan awards remained subject to forfeiture if Ms. Alemany were to engage in any “competitive activity” (defined to include engaging in any activity with a competitor, accepting an offer of employment or engagement with a competitor or providing consulting services (with some exceptions) to any other financial institutions where such services relate to business activities that compete with us) or “detrimental activity” (as defined in the RBS Deferral Plan).
Ms. Alemany is also subject to a perpetual confidentiality covenant. In addition, for six months following her retirement, Ms. Alemany was restricted from competing with us or our affiliates and for 12 months following her retirement, she is restricted from soliciting, diverting or contacting any customers or vendors of ours or our affiliates, or soliciting or hiring any person who was employed by us or our affiliates.
273
Table of Contents
2013 Director Compensation Table
The following table lists the individuals who served as our non-employee directors during 2013 and summarizes their 2013 compensation. Directors who are also our employees are not compensated for their service on our Board of Directors.
| Name |
Fees Earned or Paid in Cash ($) |
All Other Compensation ($)(2) |
Total ($)(3) |
|||||||||
| William P. Hankowsky |
126,000 | — | 126,000 | |||||||||
| Howard W. Hanna III |
129,750 | (4) | — | 129,750 | ||||||||
| Charles J. (“Bud”) Koch |
149,500 | — | 149,500 | |||||||||
| Arthur F. Ryan |
138,500 | 2,500 | 141,000 | |||||||||
| Judith M. von Seldenek(1) |
60,000 | — | 60,000 | |||||||||
| Shivan S. Subramaniam |
114,000 | (5) | 4,000 | 118,000 | ||||||||
| Wendy A. Watson |
157,500 | (5) | 5,149 | 162,649 | ||||||||
| Marita Zuraitis |
126,000 | — | 126,000 | |||||||||
| (1) | Ms. Seldenek resigned effective April 25, 2013. |
| (2) | Amounts in this column reflect matching charitable contributions made by us on behalf of directors during 2013. |
| (3) | As of December 31, 2013, none of our directors held any stock awards or options in respect of CFG or RBS stock. |
| (4) | Mr. Hanna elected to defer $64,500 of his board membership fees earned for 2013 pursuant to our Directors’ Deferred Compensation Plan. For a summary of material terms of the plan, see “—2013 Director Compensation Program” below. |
| (5) | Each of Mr. Subramaniam and Ms. Watson elected to defer all of their board membership fees earned for 2013 pursuant to our Directors’ Deferred Compensation Plan. For a summary of material terms of the plan, see “—2013 Director Compensation Program” below. |
2013 Director Compensation Program
During 2013, we paid each non-employee director an annual retainer of $90,000. In addition, our lead director and the chair of each committee received an additional retainer of $10,000. Each non-employee director was also paid $1,500 for each board and committee meeting attended during 2013. Directors also receive reimbursement of business expenses incurred in connection with their attendance at meetings.
Directors may defer up to 100% of their meeting and retainer fees under our Directors Deferred Compensation Plan. No company contributions are made to this plan. Contributions to this plan are credited with interest on a monthly basis, based on the applicable interest crediting rate applicable for the month interest is to be posted. The interest crediting rate is the annualized average yield on the United States Treasury bond 10-year constant maturity for the immediately preceding calendar quarter plus two percent (2%), which is then divided by 12 to determine the monthly interest crediting rate. There are no above-market or preferential earnings on compensation deferred pursuant to this plan. In addition, our directors are eligible to receive matching charitable contributions up to $5,000 per year, as part of our general charitable contribution program. Under our charitable contribution policy, we match charitable contributions dollar-for-dollar up to the maximum matching contribution. Our non-employee directors do not participate in our employee benefit programs.
Post-IPO Director Compensation Program
Citizens Financial Group, Inc. Non-Employee Directors Compensation Policy
We have adopted the Citizens Financial Group, Inc. Non-Employee Director Compensation Policy, or the Director Compensation Policy, which establishes compensation to be paid to each of our
274
Table of Contents
non-employee directors commencing on the effective date of this offering. Our Compensation Committee may amend, revise, suspend, discontinue or terminate the Director Compensation Policy at any time.
Under the Director Compensation Policy, all non-employee directors will receive the following annual cash retainers, payable in semi-annual, equal installments:
| Board Service |
Retainer (Annualized) ($) |
|||
| Board Retainer |
75,000 | |||
| Lead Director Retainer |
20,000 | |||
| Audit Committee Chair Retainer |
15,000 | |||
| Other Committee Chair Retainer (per committee) |
10,000 | |||
In addition, each non-employee director who attends more than six meetings of any committee of our Board of Directors in any calendar year will also receive an additional cash fee of $1,500 for each such additional meeting attended (regardless of whether attended in person or by telephone).
Each non-employee director will also receive, on the date of each annual meeting of our shareholders, an annual grant of RSUs under the Citizens Financial Group, Inc. 2014 Non-Employee Directors Compensation Plan, or the Directors Plan, having a “fair market value” (defined under the Directors Plan as the closing price of a share of our common stock on the day prior to the grant date) of $75,000. Each annual award will vest 100% on the first anniversary of the grant date, subject to the terms and conditions of the Directors Plan and the applicable award agreement thereunder.
In addition, each non-employee director serving on our Board of Directors on the closing date of this offering will receive an initial award of RSUs under the Directors Plan with the number of shares underlying such RSU award equal to $75,000 divided by the price of a share of our common stock on the effective date of this offering, prorated to reflect the number of days between the effective date of this offering and May 5, 2015 (the expected date of our 2015 annual meeting of shareholders). The initial RSU award will vest on the date of our 2015 annual shareholder meeting (or, if earlier, the first anniversary of the grant date), subject to the terms and conditions of the Directors Plan and the applicable award agreement thereunder.
The initial and annual grants of RSUs will fully vest upon a “change of control” (as defined in the above description of the Omnibus Plan) or a non-employee director’s separation from service from our Board of Directors for any reason (other than under circumstances which would constitute “cause” under the terms of our bylaws or applicable law).
Non-employee directors may defer up to 100% of their cash retainers and meeting fees under our Directors Deferred Compensation Plan. Non-employee directors are also eligible to receive matching charitable contributions up to an aggregate limit of $5,000 per year. For details, see “—2013 Director Compensation Program” above.
Citizens Financial Group, Inc. 2014 Non-Employee Directors Compensation Plan
We have adopted the Directors Plan which allows us to grant cash retainers, stock options, restricted stock, RSUs and other equity-based awards to our non-employee directors. The following is a summary of the material terms of the Directors Plan, which is qualified in its entirety by reference to the Directors Plan attached as Exhibit 10.30 to this registration statement.
Purpose
The purpose of the Directors Plan is to attract and retain the services of experienced non-employee directors.
275
Table of Contents
Plan Term
The Directors Plan will expire after ten years following the effective date of this offering. However, the plan will expire sooner if, prior to that date, the maximum number of shares of our common stock available for issuance under the Directors Plan has been issued or our Board of Directors terminates the plan.
Authorized Shares
Subject to adjustment (as described below), 1,679,995 shares of our common stock (representing 0.3% of our issued and outstanding shares as of the effective time of this offering) are available for awards to be granted under the Directors Plan (other than substitutes awards).
If an award is forfeited, expires, terminates or otherwise lapses or is settled for cash, in whole or in part, the shares covered by such award will again be available for issuance under the Directors Plan. Shares tendered or withheld in payment of an exercise price or in respect of taxes will not again become available for issuance under the Directors Plan.
Administration
Our Board of Directors will administer the Directors Plan and will have authority to:
| • | designate participants; |
| • | determine the types of awards (including substitute awards) to be granted to each participant; |
| • | determine the number of shares to be covered by awards (or with respect to which payments, rights or other matters are to be calculated in connection with awards); |
| • | determine the terms and conditions of awards; |
| • | determine whether, to what extent and under what circumstances awards may be settled or exercised in cash, shares, other awards, other property or net settlement; |
| • | determine the circumstances under which awards may be canceled, repurchased, forfeited or suspended; |
| • | determine whether, and to what extent and under what circumstances cash, shares of our common stock and other awards may be deferred automatically or at the election of the holder or our Board of Directors; |
| • | interpret and administer the Directors Plan and any instrument or agreement relating to, or award made under, the Directors Plan; |
| • | amend the terms or conditions of outstanding awards, including to accelerate the time or times at which an award becomes vested, unrestricted or may be exercised; |
| • | correct any defect, supply any omission and reconcile any inconsistency in the Directors Plan or any award to carry the Directors Plan into effect; |
| • | establish, amend, suspend or waive rules and regulations and appoint agents and other individuals for the proper administration of the Directors Plan; and |
| • | make any other determination and take any other action that it deems necessary or desirable to administer the Directors Plan. |
276
Table of Contents
Eligibility
Each regular, active member or prospective member of our Board of Directors who is not our employee or an employee of any of our affiliates (that is, entities that we directly or indirectly control or in which we have a significant equity interest, in each case determined by our Board of Directors, or any other entity which our Board of Directors determines should be treated as our affiliate).
Adjustments
In the event that our Board of Directors determines that, as result of any dividend or other distribution, recapitalization, stock split, reverse stock split, reorganization, merger, consolidation, separation, rights offering, split-up, spin-off, combination, repurchase or exchange of our shares or other securities, issuance of warrants or other rights to purchase our shares or other securities, issuance of our shares pursuant to the anti-dilution provisions of our securities, or other similar corporate transaction or event affecting our shares, or of changes in applicable laws, regulations or accounting principles, an adjustment is appropriate to prevent dilution or enlargement of the benefits or potential benefits intended to be made available under the Directors Plan, our Board of Directors will, subject to compliance with Section 409A of the Code, adjust equitably any or all of:
| • | the number and type of shares or other securities that thereafter may be made the subject of awards, including the aggregate limit under the Directors Plan; |
| • | the number and type of shares or other securities subject to outstanding awards; and |
| • | the grant, purchase, exercise or hurdle price for any award or, if deemed appropriate, make provision for a cash payment to the holder of an outstanding award. |
In addition, our Board of Directors is authorized to adjust the terms and conditions of, and the criteria included in, outstanding awards in recognition of events (including those events described above) affecting the Company or the financial statements of the Company, or changes in applicable laws, regulations or accounting principles, whenever our Board of Directors determines that such adjustments are appropriate in order to prevent dilution or enlargement of the benefits or potential benefits intended to be made available under the Directors Plan.
Types of Awards
Our Board of Directors is authorized to grant stock options, restricted stock, RSUs, other share-based awards (see “Our Anticipated NEO Compensation Program Following the Offering—Omnibus Incentive Plan—Types of Awards” for more details) and retainers (as described below) to our non-employee directors.
Retainers
Our Board of Directors is authorized, subject to limitations under applicable law, to grant annual cash retainers to non-employee directors for service as a member of the Board of Directors or a committee of the Board or as chair or lead director of the Board or any such committee. These retainers may be received in shares of our common stock at the election of the directors.
Automatic Grants
Our Board of Directors may institute, by resolution, automatic award grants to new and to continuing members of our Board of Directors, and determine the number and type of such awards, the terms and conditions of such awards and the criteria for the grant of such awards.
277
Table of Contents
Separation from Service and Change of Control
Our Board of Directors will determine the effect of a separation from service from the Board of Directors on outstanding awards, including whether the awards will vest, become exercisable, settle or be forfeited. In the event of a “change of control” (as defined under the Omnibus Plan and summarized above), except as otherwise provided in the applicable award agreement, our Board of Directors may provide for:
| • | continuation or assumption of outstanding awards under the Directors Plan by us (if we are the surviving corporation) or by the surviving corporation or its parent; |
| • | substitution by the surviving corporation or its parent of awards with substantially the same terms and value as such outstanding awards under the Directors Plan; |
| • | acceleration of the vesting (including the lapse of any restrictions) or the right to exercise outstanding awards immediately prior to the date of the change of control and the expiration of awards not timely exercised by the date determined by our Board of Directors; or |
| • | in the case of outstanding stock options, cancelation in consideration of a payment in cash or other consideration equal to the intrinsic value of the award. Our Board of Directors may, in its sole discretion, terminate without the payment of any consideration, any stock options for which the exercise or hurdle price is equal to or exceeds the per share value of the consideration to be paid in the change of control transaction. |
Amendment and Termination
Our Board of Directors may amend, alter, suspend, discontinue or terminate the Directors Plan, subject to approval of our shareholders if required by applicable law or the rules of the stock exchange on which our shares are principally traded. Our Board of Directors may also amend, alter, suspend, discontinue or terminate, or waive any conditions or rights under, any outstanding award. However, subject to the adjustment provision and change of control provision (each summarized above), any such action by our Board of Directors that would materially adversely affect the rights of a holder of an outstanding award may not be taken without the holder’s consent, except (i) to the extent that such action is taken to cause the Directors Plan to comply with applicable law, stock market or exchange rules and regulations or accounting or tax rules and regulations or (ii) to impose any “clawback” or recoupment provisions on any awards in accordance with the Directors Plan.
In addition, our Board of Directors may amend the Directors Plan or create sub-plans in such manner as may be necessary to enable the plan to achieve its stated purposes in any jurisdiction in a tax-efficient manner and in compliance with local rules and regulations. In the event of our dissolution or liquidation, each award will terminate immediately prior to the consummation of such action, unless otherwise determined by our Board of Directors.
Cancellation or “Clawback” of Awards
Our Board of Directors may, to the extent permitted by applicable law and stock exchange rules or by any of our policies, cancel or require reimbursement of any awards granted, shares issued or cash received upon the vesting, exercise or settlement of any awards granted under the Directors Plan or the sale of shares underlying such awards.
Prohibition on Repricing
Subject to the adjustment provision summarized above, our Board of Directors may not directly or indirectly, through cancellation or regrant or any other method, reduce, or have the effect of reducing, the exercise or hurdle price of any award established at the time of grant without approval of our shareholders.
278
Table of Contents
U.S. Federal Income Tax Consequences
For more details on the U.S. federal income tax consequences of certain awards that may be granted under the Directors Plan, see “Our Anticipated NEO Compensation Program Following the Offering—Omnibus Incentive Plan—U.S. Federal Income Tax Consequences.”
279
Table of Contents
OUR RELATIONSHIP WITH THE RBS GROUP AND CERTAIN OTHER RELATED PARTY TRANSACTIONS
Relationship with the RBS Group
Prior to the completion of this offering, we are an indirect wholly owned subsidiary of RBS, and have been a part of the RBS Group’s consolidated business operations. Following the offering, we expect that RBS will continue to beneficially own a majority of our outstanding common stock, and as a result RBS will continue to have significant control of our business, including pursuant to the agreements described below. See “Risk Factors—Risks Related to Our Separation from the RBS Group.” In addition, we expect that, following this offering, the RBS Group will continue to consolidate our financial results in its financial statements.
In connection with this offering, we and RBS intend to enter into, or have entered into, certain agreements that will provide a framework for our ongoing relationship with the RBS Group. Of the agreements summarized below, the material agreements are filed as exhibits to the registration statement of which this prospectus is a part, and the summaries of these agreements set forth the terms of the agreements that we believe are material. These summaries are qualified in their entirety by reference to the full text of such agreements.
Separation and Shareholder Agreement
We intend to enter into the Separation Agreement with RBS immediately prior to the completion of this offering that will govern the relationship between the RBS Group and us following this offering.
Governance
The terms of the Separation Agreement will provide RBS with certain governance rights over us. In particular, until RBS ceases to beneficially own at least 20% of our issued and outstanding common stock, RBS will have the right to nominate one director to our Board, subject to election by our stockholders, and non-voting Board observer rights in certain circumstances. Until the time RBS is no longer required to consolidate our financial results under international financial reporting standards, RBS will also be entitled to designate a member of our Assets and Liabilities Committee. In addition, until the earlier of the date on which RBS ceases to directly or indirectly own at least 4.99% of our issued and outstanding common stock and the date on which RBS receives written notice from the Federal Reserve Board that RBS is not deemed to control us for purposes of the Bank Holding Company Act, amendments to certain of our key policies, including certain of our risk management, accounting, financial reporting, capital management, information security, corporate governance and human resources policies, will require the consent of RBS.
The Separation Agreement will also provide that, until RBS ceases to beneficially own at least 20% of our issued and outstanding common stock, the following corporate actions will require the consent of RBS:
| • | material changes to the scope or nature of our business; |
| • | any merger, consolidation, business combination or similar transaction involving us, CBNA or CBPA as a party; |
| • | acquisitions or dispositions of assets or liabilities, whether in a single transaction or series of related transaction, with a purchase price (in excess of book value) of above $500 million or where the book value of assets or liabilities acquired or disposed exceeds $4.0 billion; |
| • | for so long as RBS is deemed to control us for European Union regulatory purposes, any acquisition of any package of assets or liabilities that constitutes a financial institution or any |
280
Table of Contents
| acquisition the purpose of which is to expand our or any of our subsidiaries’’ activities outside of our or any of their respective business model, if the aggregate purchase price of such acquisitions exceeds $125 million; |
| • | entry into joint ventures or similar transactions where the joint venture or other entity formed by such transaction has assets or liabilities with a book value in excess of $4.0 billion; |
| • | certain related party transactions; |
| • | the issuance of any capital stock, subject to certain exceptions including issuances pursuant to our approved equity incentive plans; |
| • | any increase or changes in certain funding and liquidity metrics agreed to by us and RBS prior to the date of this offering; and |
| • | liquidation, dissolution or voluntary bankruptcy or similar extraordinary transactions. |
In addition, until RBS ceases to beneficially own at least 50% of our issued and outstanding common stock, we will be required to obtain the consent of RBS to adopt an annual budget, amend an annual budget, to the extent such amendment is presented to our Board, and terminate or appoint a replacement for our Chief Executive Officer, Chief Financial Officer or Chief Risk Officer.
Covenants
We will agree, subject in certain cases until the time RBS is no longer required to consolidate our financial results under international financial reporting standards or certain other threshold dates, to certain covenants, including covenants relating to:
| • | compliance with a policy framework agreed by RBS prior to the date of this offering; |
| • | disclosure of information to RBS; |
| • | cooperation with respect to preparation of public filings; |
| • | the obligation to take, or refrain from taking, at RBS’s reasonable written request, actions necessary to enable RBS to comply with its legal and regulatory obligations; |
| • | access by RBS to our personnel, auditors, advisers, data and facilities, to the extent required by RBS to meet its legal, regulatory, risk management, accounting and other requirements; and |
| • | consummation on or around October 1, 2014 of the $334 million capital exchange transaction described under “—Other.” |
We have also agreed with RBS to share with RBS certain refunds, tax credits or other tax benefits attributable to tax proceedings that relate to periods prior to the separation and are expected to conclude after this offering.
Indemnification
Generally, each party will indemnify, defend and hold harmless the other party and its affiliates and their respective directors, officers, employees and agents from and against any and all losses relating to, arising out of or resulting from any breach by the indemnifying party or its subsidiaries of the Separation Agreement and the other agreements described in this section (unless such agreement provides for separate indemnification). Each party will also indemnify the other party against losses arising from the indemnifying party’s business, whether arising prior to or after this offering. We have also agreed to indemnify RBS against certain liabilities arising from material inaccuracies in our filings
281
Table of Contents
with governmental authorities and securities exchanges, except with respect to any liabilities arising out of information provided by RBS for inclusion therein, with respect to which RBS has agreed to indemnify us. The Separation Agreement also specifies procedures with respect to claims subject to indemnification.
Term
The Separation Agreement will terminate on the earlier of the date on which RBS ceases to directly or indirectly own at least 4.99% of our issued and outstanding common stock and the date on which RBS receives written notice from the Federal Reserve Board that RBS is not deemed to control us for purposes of the Bank Holding Company Act, although certain provisions of the agreement will survive indefinitely. In addition, certain rights, including RBS’s consent and governance rights, and obligations, including the covenants to which we are subject, will terminate upon a reduction in RBS’s beneficial ownership of our outstanding common stock below specified thresholds.
Transitional Services Agreement
We intend to enter into a Transitional Services Agreement with RBS immediately prior to the completion of this offering for the continued provision of certain services, including certain information technology, operations, compliance, business continuity, legal, human resources, back office and web services. We refer to these services and resources, collectively, as the “RBS services.” The Transitional Services Agreement will also allow the RBS Group to continue to use certain of our services and resources. We refer to these services and resources, collectively, as the “CFG services.”
We will pay the RBS Group and the RBS Group will pay us mutually agreed upon fixed fees for the RBS services and the CFG Services, respectively. The services that are to be provided under the Transitional Services Agreement generally will continue to be provided until December 31, 2016, although certain services may have an earlier termination date or be terminated prior to that time. We and RBS Group will agree to migration plans for some of the services being provided under the Transitional Services Agreement and have agreed to discuss in good faith the mitigation of any risks or issues relating to the migration of any of the services and to agree to mitigation plans.
Trademark License Agreement
We intend to enter into a trademark license agreement with RBS immediately prior to the completion of this offering that will grant us a sole, limited license to use certain RBS trademarks, including the daisywheel logo. The term of the license is for an initial term of 5 years, and, at our option, up to 10 years, subject to partial earlier termination upon the occurrence of certain events, including the removal of the “RBS” brand name from all of our products and services by the time RBS ceases to hold at least 50% of our capital stock (but in no event earlier than October 1, 2015). Under the agreement, we will lose the right to use RBS trademarks in connection with the marketing of any product or service once we rebrand and cease using RBS trademarks in connection with such product or service. From and after the initial term of the trademark license agreement, we will be required to pay RBS an annual license fee of $500,000 for year six, increasing up to $5,000,000 for year ten for the right to continue to use the licensed trademarks.
Registration Rights Agreement
We intend to enter into a Registration Rights Agreement with RBS immediately prior to the completion of this offering, pursuant to which we will agree that, upon the request of RBS, we will use our reasonable best efforts to effect the registration under applicable federal and state securities laws of any shares of our common stock beneficially owned by RBS following this offering.
282
Table of Contents
Demand registration. RBS will be able to request registration under the Securities Act of all or any portion of our shares covered by the agreement and we will be obligated, subject to limited exceptions, to register such shares as requested by RBS. RBS will be able to request that we complete 6 demand registrations and underwritten offerings in any twelve-month period subject to limitations on minimum offering size. RBS will be able to designate the terms of each offering effected pursuant to a demand registration, which may take any form, including a shelf registration.
Piggy-back registration. If we at any time intend to file on our behalf or on behalf of any of our other security holders a registration statement in connection with a public offering of any of our securities on a form and in a manner that would permit the registration for offer and sale of our common stock held by RBS, RBS will have the right to include its shares of our common stock in that offering.
Registration expenses. We will be generally responsible for all registration expenses in connection with the performance of our obligations under the registration rights provisions in the Registration Rights Agreement. RBS is responsible for its own internal fees and expenses, any applicable underwriting discounts or commissions and any stock transfer taxes.
Indemnification. Generally, the agreement will contain indemnification and contribution provisions by us for the benefit of RBS and, in limited situations, by RBS for the benefit of us with respect to the information provided by RBS included in any registration statement, prospectus or related document.
Transfer. If RBS transfers shares covered by the agreement, it will be able to transfer the benefits of the Registration Rights Agreement to transferees of 5% of the shares of our common stock outstanding immediately following the completion of this offering, provided that each transferee agrees to be bound by the terms of the Registration Rights Agreement.
Term. The registration rights will remain in effect with respect to any shares covered by the agreement until:
| • | such shares have been sold pursuant to an effective registration statement under the Securities Act; |
| • | such shares have been sold to the public pursuant to Rule 144 under the Securities Act; or |
| • | such shares have been sold in a transaction in which the transferee is not entitled to the benefits of the Registration Rights Agreement. |
Commercial Matters
In addition to the agreements that we intend to enter into as part of our separation from the RBS Group, we expect to continue certain of our commercial relationships with the RBS Group for which we intend to continue or enter into one or more commercial matters agreements. The principal commercial activities to be covered by such agreements include the following.
Interest rate swaps and foreign currency products
We enter into interest rate swap agreements with the RBS Group for the purpose of reducing our exposure to interest rate fluctuations. As of June 30, 2014, the total notional amount of swaps outstanding was $5.0 billion which pay fixed rates ranging from 1.78% to 4.3% and receive overnight Federal funds rate and one month LIBOR with maturities from 2016 through 2023. As of December 31, 2013, the total notional amount of swaps outstanding was $5.5 billion, all of which pay fixed rates ranging from 1.78% to 5.47% and receive overnight Federal funds rate with maturities from 2014 to
283
Table of Contents
2023. Included in these balances were $4.0 billion of receive-fixed swaps that had been executed as of June 30, 2013 as part of a new hedging program initiated during the quarter ended March 31, 2013. We recorded net interest expense of $21 million and $92 million for the six months ended June 30, 2014 and 2013, respectively.
In order to meet the financing needs of our customers, we enter into interest rate swap and cap agreements with our customers and simultaneously enter into offsetting swap and cap agreements with the RBS Group. We earn a spread equal to the difference between rates charged to the customer and rates charged by the RBS Group. The notional amount of these interest rate swap and cap agreements outstanding with the RBS Group was $11.7 billion and $13.4 billion at June 30, 2014 and December 31, 2013, respectively. We recorded expense of $135 million for the six months ended June 30, 2014 and income of $176 million for the six months ended June 30, 2013.
Also, to meet the financing needs of our customers, we enter into a variety of foreign currency denominated products, such as loans, deposits and foreign exchange contracts. To manage the foreign exchange risk associated with these products, we enter into offsetting foreign exchange contracts with the RBS Group. We earn a spread equal to the difference between rates charged to the customer and rates charged by the RBS Group. The notional amount of foreign exchange contracts outstanding with the RBS Group was $4.9 billion and $4.6 billion at June 30, 2014 and December 31, 2013, respectively. We recorded expense within foreign exchange and trade finance fees of $7 million for the six months ended June 30, 2014 and income of $13 million for the six months ended June 30, 2013.
Other Commercial Matters
We have service and referral arrangements with the RBS Group in respect of certain commercial matters for which we intend to enter into a master commercial services agreement prior to the completion of this offering. We anticipate that the commercial matters to be included and the terms of such services and referrals will be largely consistent with historic periods. Our commercial services arrangements include those related to mortgage servicing, market research, data information services and automated cash management and liquidity financing. Our commercial referral arrangements include those related to transactional services, debt capital markets transactions, underwriting of loan syndications, asset finance and loan syndications and corporate credit card services.
Other
On May 24, 2013, we redeemed $289 million of floating rate junior subordinated deferrable interest debentures due March 4, 2034 from a special purpose subsidiary, which caused the redemption of $280 million of our trust preferred securities from RBS.
On June 28, 2013, we entered into a purchase agreement with RBS pursuant to which we issued to RBS $333,000,000 aggregate principal amount of 5.158% Fixed-to-Floating Rate Callable Subordinated Notes due 2023 pursuant to Rule 144A under the Securities Act. The principal amount of this subordinated debt was equal to a special dividend paid to RBS on the same day. Together, these actions reduced our common equity without reducing total regulatory capital.
On September 30, 2013, we entered into a purchase agreement with RBS pursuant to which we issued to RBS $333,000,000 aggregate principal amount of 4.771% Fixed Rate Subordinated Notes due 2023 pursuant to Rule 144A under the Securities Act. The principal amount of this subordinated debt was equal to a special dividend paid to RBS on the same day. Together, these actions reduced our common equity without reducing total regulatory capital.
284
Table of Contents
On December 2, 2013, we entered into a purchase agreement with RBS pursuant to which we issued to RBS $334,000,000 aggregate principal amount of 4.691% Fixed Rate Subordinated Notes due 2024 pursuant to Rule 144A under the Securities Act. The principal amount of this subordinated debt was equal to a special dividend paid to RBS on the same day. Together, these actions reduced our common equity without reducing total regulatory capital.
On June 26, 2014, we entered into a purchase agreement with RBS pursuant to which we issued to RBS $333,000,000 aggregate principal amount of 4.153% Fixed Rate Subordinated Notes due 2024 pursuant to Rule 144A under the Securities Act. The principal amount of this subordinated debt was equal to a special dividend paid to RBS on the same day. Together, these actions reduced our common equity without reducing total regulatory capital.
On August 1, 2014, we entered into a purchase agreement with RBS pursuant to which we issued to RBS $333,000,000 aggregate principal amount of 4.023% Fixed Rate Subordinated Notes due 2024 pursuant to Rule 144A under the Securities Act. The principal amount of this subordinated debt was equal to a special dividend paid to RBS on the same day. Together, these actions reduced our common equity without reducing total regulatory capital.
For further information regarding these and other capital actions taken during 2013 and 2014, please refer to “Management’s Discussion and Analysis of Financial Condition and Results of Operations—Capital.”
We have agreed to an additional capital exchange transaction with RBS, to occur on or around October 1, 2014, subject to us obtaining any required regulatory approvals. On the same day, assuming completion of this offering, we will issue $334,000,000 of our shares of preferred stock to RBS and then use the proceeds from this issuance to purchase $334,000,000 of our shares of common stock from RBSG International Holdings Limited. Together, these actions will reduce our common equity without reducing either total Tier 1 regulatory capital or total regulatory capital. If the proposed exchange transaction occurs after the completion of this offering, the purchase price of a share of our common stock will be the average of the daily volume-weighted average price of a share of our common stock as reported by the NYSE over the five trading days preceding the purchase date (or such lesser number of trading days preceding such purchase date as occur between the date of this prospectus and such purchase date).
We also maintained a $50 million revolving line of credit as of December 31, 2013 and 2012 with the RBS Group. This line of credit was not drawn upon as of December 31, 2013 or 2012, expired on January 31, 2014, and was not renewed.
We have issued a guarantee to the RBS Group for a fee, pursuant to which we will absorb credit losses related to the sale of option contracts by the RBS Group to our customers. There were outstanding option contracts with a notional value of $1 million and $2 million at June 30, 2014 and December 31, 2013, respectively.
We have made loans to directors and executive officers and their immediate families, as well as their affiliated companies. Such loans amounted to $126 million and $78 million at June 30, 2014 and December 31, 2013, respectively. The loans to such persons (i) complied with our Regulation O policies and procedures, (ii) were made in the ordinary course of business, (iii) were made on substantially the same terms, including interest rates and collateral, as those prevailing at the time for comparable loans with persons not related to the lender, and (iv) did not involve more than a normal risk of collectability or did not present other features unfavorable to us.
285
Table of Contents
Under supplemental retirement arrangements relating to their service to Charter One, which we purchased in 2004, Mr. Koch as well as his brother, John Koch, are entitled to receive monthly payments. Mr. Bud Koch and Mr. John Koch received approximately $877,500 and $744,900, respectively, per year under this arrangement during each of 2013, 2012 and 2011.
Indemnification Agreements
We intend to enter into indemnification agreements with our directors and executive officers. These agreements will require us to indemnify these individuals to the fullest extent permitted by Delaware law against liabilities that may arise by reason of their service to us, and to advance expenses incurred as a result of any proceeding against them as to which they could be indemnified. Insofar as indemnification for liabilities arising under the Securities Act may be permitted to directors or executive officers, we have been informed that in the opinion of the SEC such indemnification is against public policy and is therefore unenforceable.
There is currently no pending material litigation or proceeding involving any of our directors, officers or employees for which indemnification is sought.
286
Table of Contents
PRINCIPAL AND SELLING STOCKHOLDERS
Immediately following the offering, RBSG International Holdings Limited will own approximately 75.0% of our outstanding common stock, assuming no exercise by the underwriters of their option to purchase additional shares, and approximately 71.2% of our common stock if the underwriters exercise their option to purchase additional shares in full.
RBSG International Holdings Limited is selling 135,363,704 shares of our common stock in this offering, assuming no exercise by the underwriters of their option to purchase additional shares. RBS CBFM North America Corporation is selling 4,636,296 shares of our common stock in this offering.
The following table sets forth information regarding beneficial ownership of our common stock as of September 5, 2014, by:
| • | each person whom we know to own beneficially more than 5% of our common stock; |
| • | each of the directors and named executive officers individually; and |
| • | all directors and executive officers as a group. |
287
Table of Contents
Upon completion of this offering, no shares of common stock underlying CFG equity awards will be beneficially owned by directors or officers in accordance with the rules of the SEC. The percentage of beneficial ownership for the following table is based on 559,998,324 shares of common stock outstanding as of September 5, 2014. Unless otherwise indicated, the address for each listed stockholder is: c/o Citizens Financial Group, Inc., One Citizens Plaza, Providence, RI, 02903. The address of the selling stockholders is c/o the Company Secretary, The Royal Bank of Scotland Group plc, PO Box 1000, RBS Gogarburn, Edinburgh EH12 1HQ. To our knowledge, except as indicated in the footnotes to this table and pursuant to applicable community property laws, the persons named in the table have sole voting and investment power with respect to all shares of common stock owned by them.
| Shares Beneficially Owned Before the Offering |
Number of Shares Being Offered |
Shares Beneficially Owned After the Offering(1) |
||||||||||||||||||
| Name of Beneficial Owner |
Number | Percent | Number | Common Stock Beneficially Owned |
Percent | |||||||||||||||
| Selling Stockholders |
||||||||||||||||||||
| RBSG International Holdings Limited(2) |
555,362,028 | 99.2 | % | 135,363,704 | 419,998,324 | 75.0 | ||||||||||||||
| RBS CBFM North America Corporation(3) |
4,636,296 | 0.8 | % | 4,636,296 | — | — | ||||||||||||||
| Directors and Officers |
||||||||||||||||||||
| Bruce Van Saun |
— | — | — | — | — | |||||||||||||||
| David Bowerman |
— | — | — | — | — | |||||||||||||||
| Brad L. Conner |
— | — | — | — | — | |||||||||||||||
| John Fawcett |
— | — | — | — | — | |||||||||||||||
| Robert D. Matthews, Jr. |
— | — | — | — | — | |||||||||||||||
| Nancy L. Shanik |
— | — | — | — | — | |||||||||||||||
| Mark Casady |
— | — | — | — | — | |||||||||||||||
| Anthony Di Iorio |
— | — | — | — | — | |||||||||||||||
| Robert Gillespie |
— | — | — | — | — | |||||||||||||||
| William P. Hankowsky |
— | — | — | — | — | |||||||||||||||
| Howard W. Hanna III |
— | — | — | — | — | |||||||||||||||
| Leo (“Lee”) I. Higdon |
||||||||||||||||||||
| Charles J. (“Bud”) Koch |
— | — | — | — | — | |||||||||||||||
| Arthur F. Ryan |
— | — | — | — | — | |||||||||||||||
| Shivan S. Subramaniam |
— | — | — | — | — | |||||||||||||||
| Wendy A. Watson |
— | — | — | — | — | |||||||||||||||
| Marita Zuraitis |
— | — | — | — | — | |||||||||||||||
| Directors and Officers as a group (17 persons) |
— | — | — | — | — | |||||||||||||||
| (1) | Assumes no exercise of the underwriters’ option to purchase additional shares. See “Underwriting.” |
| (2) | The shares are directly held by RBSG International Holdings Limited, a private limited company organized under the laws of the Scotland. RBSG International Holdings Limited is a wholly owned indirect subsidiary of RBS. RBS is a publicly owned company whose ordinary shares are traded on the London Stock Exchange and American Depositary Shares are traded on the NYSE. The UK Government, through Her Majesty’s Treasury (“HM Treasury”), is the ultimate controlling party of RBS and, as of June 30, 2014, held 62.9% of the voting rights in RBS and had an economic interest of 79.5%. The UK Government’s shareholding is managed by UK Financial Investments Limited, a company wholly owned by the UK Government. |
| (3) | The shares are directly held by RBS CBFM North America Corporation, a Delaware corporation. RBS CBFM North America Corporation is a wholly owned indirect subsidiary of RBS. See note (2) above for additional information regarding the beneficial ownership of RBS. |
288
Table of Contents
The following descriptions are summaries of the material terms of our amended and restated certificate of incorporation and amended and restated bylaws. Reference is made to the more detailed provisions of, and the descriptions are qualified in their entirety by reference to, the amended and restated certificate of incorporation and amended and restated bylaws, copies of which are filed with the SEC as exhibits to the registration statement of which this prospectus is a part, and applicable law.
General
Our authorized capital stock consists of 1,000,000,000 shares of common stock, par value $0.01 per share, and 100,000,000 shares of preferred stock, par value $25.00 per share. Unless our board of directors determines otherwise, we will issue all shares of capital stock in uncertificated form.
Common Stock
Common stock outstanding. As of June 30, 2014, there were 559,998,324 shares of common stock outstanding which were held of record by two stockholders. All outstanding shares of common stock are fully paid and non-assessable, and the shares of common stock to be issued upon completion of this offering will be fully paid and non-assessable.
Voting rights. The holders of common stock are entitled to one vote per share on all matters to be voted upon by the stockholders, except on matters relating solely to terms of preferred stock.
Dividend rights. Subject to preferences that may be applicable to any outstanding preferred stock, the holders of common stock are entitled to receive ratably such dividends, if any, as may be declared from time to time by our Board out of funds legally available therefor. See “Dividend Policy.”
Rights upon liquidation. In the event of liquidation, dissolution or winding up, the holders of common stock are entitled to share ratably in all assets remaining after payment of liabilities, subject to prior distribution rights of preferred stock, if any, then outstanding.
Other rights. The holders of our common stock have no preemptive or conversion rights or other subscription rights. There are no redemption or sinking fund provisions applicable to the common stock.
Preferred Stock
Our Board has the authority to issue preferred stock in one or more series and to fix the rights, preferences, privileges and restrictions thereof, including dividend rights, dividend rates, conversion rights, voting rights, terms of redemption, redemption prices, liquidation preferences and the number of shares constituting any series or the designation of such series, without further vote or action by the stockholders. The issuance of preferred stock may have the effect of delaying, deferring or preventing a change in control of our company without further action by the stockholders and may adversely affect the voting and other rights of the holders of common stock.
Anti-Takeover Effects of Some Provisions
Some provisions of our amended and restated certificate of incorporation and amended and restated bylaws could make the following more difficult:
| • | acquisition of control of us by means of a proxy contest or otherwise, or |
| • | removal of our incumbent officers and directors. |
289
Table of Contents
These provisions, as well as our ability to issue preferred stock, are designed to discourage coercive takeover practices and inadequate takeover bids. These provisions are also designed to encourage persons seeking to acquire control of us to first negotiate with our Board. We believe that the benefits of increased protection give us the potential ability to negotiate with the proponent of an unfriendly or unsolicited proposal to acquire or restructure us, and that the benefits of this increased protection outweigh the disadvantages of discouraging those proposals, because negotiation of those proposals could result in an improvement of their terms.
Election and Removal of Directors. Our Board will consist of not less than five nor more than 25 directors, excluding any directors elected by holders of preferred stock pursuant to provisions applicable in the case of defaults. The exact number of directors will be fixed from time to time by resolution of our Board. Our Board will initially have 12 members.
Our amended and restated certificate of incorporation and amended and restated bylaws will provide that directors may be removed, with or without cause, by an affirmative vote of shares representing a majority of the shares then entitled to vote at an election of directors. Any vacancy occurring on our Board and any newly created directorship may be filled only by a vote of a majority of the remaining directors in office.
Limits on Written Consents. Our amended and restated certificate of incorporation and amended and restated bylaws will provide that, upon RBS ceasing to beneficially own shares representing 50% of our issued and outstanding capital stock (the “Triggering Event”), stockholder action can be taken only at an annual or special meeting of stockholders and cannot be taken by written consent in lieu of a meeting.
Stockholder Meetings. Our amended and restated certificate of incorporation and amended and restated bylaws will also provide that, except as otherwise required by law, special meetings of the stockholders can only be called by the chairman of our Board or our chief executive officer, or pursuant to a resolution adopted by a majority of our Board or, until the Triggering Event, at the request of holders of a majority of the total voting power of our outstanding shares of common stock, voting together as a single class. Except as described above, stockholders are not permitted to call a special meeting or to require our Board to call a special meeting.
Super-Majority Approval Requirements. The Delaware General Corporation Law generally provides that the affirmative vote of the holders of a majority of the total voting power of the shares entitled to vote on any matter is required to amend a corporation’s certificate of incorporation or bylaws, unless either a corporation’s certificate of incorporation or bylaws require a greater percentage. Our amended and restated certificate of incorporation and amended and restated bylaws will provide that, following the Triggering Event, the affirmative vote of holders of 75% of the total voting power of our outstanding common stock eligible to vote in the election of directors, voting together as a single class, will be required to amend, alter, change or repeal specified provisions, including those relating to actions by written consent of stockholders, calling of special meetings of stockholders, business combinations and amendment of our amended and restated certificate of incorporation and amended and restated bylaws. This requirement of a super-majority vote to approve amendments to our amended and restated certificate of incorporation and amended and restated bylaws could enable a minority of our stockholders to effectively exercise veto power over any such amendments.
Other Limitations on Stockholder Actions. Our amended and restated bylaws will also impose some procedural requirements on stockholders who wish to:
| • | make nominations in the election of directors; |
| • | propose that a director be removed; |
| • | propose any repeal or change in our amended and restated bylaws; or |
290
Table of Contents
| • | propose any other business to be brought before an annual or special meeting of stockholders. |
Under these procedural requirements, in order to bring a proposal before a meeting of stockholders, a stockholder must deliver timely notice of a proposal pertaining to a proper subject for presentation at the meeting to our corporate secretary along with the following:
| • | a description of the business or nomination to be brought before the meeting and the reasons for conducting such business at the meeting; |
| • | the stockholder’s name and address; |
| • | any material interest of the stockholder in the proposal; |
| • | the number of shares beneficially owned by the stockholder and evidence of such ownership; and |
| • | the names and addresses of all persons with whom the stockholder is acting in concert and a description of all arrangements and understandings with those persons, and the number of shares such persons beneficially own. |
To be timely, a stockholder must generally deliver notice:
| • | in connection with an annual meeting of stockholders, not less than 120 days nor more than 180 days prior to the date on which the annual meeting of stockholders was held in the immediately preceding year, but in the event that the date of the annual meeting is more than 30 days before or more than 70 days after the anniversary date of the preceding annual meeting of stockholders, a stockholder notice will be timely if received by us not later than the close of business on the later of (1) the 120th day prior to the annual meeting and (2) the 10th day following the day on which we first publicly announce the date of the annual meeting; or |
| • | in connection with the election of a director at a special meeting of stockholders, not less than 120 days nor more than 150 days prior to the date of the special meeting, but in the event that less than 55 days’ notice or prior public disclosure of the date of the special meeting of the stockholders is given or made to the stockholders, a stockholder notice will be timely if received by us not later than the close of business on the 10th day following the day on which a notice of the date of the special meeting was mailed to the stockholders or the public disclosure of that date was made. |
In order to submit a nomination for our Board, a stockholder must also submit any information with respect to the nominee that we would be required to include in a proxy statement, as well as some other information. If a stockholder fails to follow the required procedures, the stockholder’s proposal or nomination will be ineligible and will not be voted on by our stockholders.
Dissenters’ Rights of Appraisal and Payment
Under the Delaware General Corporation Law, with certain exceptions, our stockholders will have appraisal rights in connection with a merger or consolidation of our company. Pursuant to the Delaware General Corporation Law, stockholders who properly request and perfect appraisal rights in connection with such merger or consolidation will have the right to receive payment of the fair value of their shares as determined by the Delaware Court of Chancery.
Stockholders’ Derivative Actions
Under the Delaware General Corporation Law, any of our stockholders may bring an action in our name to procure a judgment in our favor, also known as a derivative action, provided that the stockholder bringing the action is a holder of our shares at the time of the transaction to which the action relates or such stockholder’s stock thereafter devolved by operation of law.
291
Table of Contents
Forum Selection
The Court of Chancery of the State of Delaware will be the sole and exclusive forum for (i) any derivative action or proceeding brought on our behalf, (ii) any action asserting a claim of breach of fiduciary duty owed by any director, officer or other employee of ours to us or our stockholders, (iii) any action asserting a claim arising pursuant to any provision of the Delaware General Corporation Law or (iv) any action asserting a claim governed by the internal affairs doctrine. Any person or entity purchasing or otherwise acquiring any interest in shares of our capital stock shall be deemed to have notice of and consented to the foregoing forum selection provisions.
Conflicts of Interest
Delaware law permits corporations to adopt provisions renouncing any interest or expectancy in certain opportunities that are presented to the corporation or its officers, directors or stockholders. Our amended and restated certificate of incorporation will, to the maximum extent permitted from time to time by Delaware law, renounce any interest or expectancy that we have in, or right to be offered an opportunity to participate in, specified business opportunities that are from time to time presented to our officers, directors or stockholders or their respective affiliates, other than those officers, directors, stockholders or affiliates who are our or our subsidiaries’ employees. Our amended and restated certificate of incorporation will provide that, to the fullest extent permitted by law, none of RBS or any of its affiliates or any director who is not employed by us or his or her affiliates will have any duty to refrain from (i) engaging in a corporate opportunity in the same or similar lines of business in which we or our affiliates now engage or propose to engage or (ii) otherwise competing with us or our affiliates. In addition, to the fullest extent permitted by law, in the event that RBS or any non-employee director acquires knowledge of a potential transaction or other business opportunity which may be a corporate opportunity for itself or himself or its or his affiliates or for us or our affiliates, such person will have no duty to communicate or offer such transaction or business opportunity to us or any of our affiliates and they may take any such opportunity for themselves or offer it to another person or entity. Our amended and restated certificate of incorporation will not renounce our interest in any business opportunity that is expressly offered to a non-employee director solely in his or her capacity as a director of CFG. To the fullest extent permitted by law, no business opportunity will be deemed to be a potential corporate opportunity for us unless we would be permitted to undertake the opportunity under our amended and restated certificate of incorporation, we have sufficient financial resources to undertake the opportunity and the opportunity would be in line with our business.
Limitation of Liability of Directors and Officers
Our amended and restated certificate of incorporation will provide that no director will be personally liable to us or our stockholders for monetary damages for breach of fiduciary duty as a director, except as required by applicable law, as in effect from time to time. Currently, Delaware law requires that liability be imposed for the following:
| • | any breach of the director’s duty of loyalty to our company or our stockholders; |
| • | any act or omission not in good faith or which involved intentional misconduct or a knowing violation of law; |
| • | unlawful payments of dividends or unlawful stock repurchases or redemptions as provided in Section 174 of the Delaware General Corporation Law; and |
| • | any transaction from which the director derived an improper personal benefit. |
As a result, neither we nor our stockholders have the right, through stockholders’ derivative suits on our behalf, to recover monetary damages against a director for breach of fiduciary duty as a director, including breaches resulting from grossly negligent behavior, except in the situations described above.
292
Table of Contents
Our amended and restated bylaws will provide that, to the fullest extent permitted by law, we will indemnify any officer or director of our company against all damages, claims and liabilities arising out of the fact that the person is or was our director or officer, or served any other enterprise at our request as a director, officer, employee, agent or fiduciary. We will reimburse the expenses, including attorneys’ fees, incurred by a person indemnified by this provision when we receive an undertaking to repay such amounts if it is ultimately determined that the person is not entitled to be indemnified by us. Amending this provision will not reduce our indemnification obligations relating to actions taken before an amendment.
Indemnification Agreements
We intend to enter into an indemnification agreement with each of our directors and executive officers as described in “Our Relationship with the RBS Group and Certain Other Related Party Transactions—Relationship with the RBS Group—Indemnification Agreements.” Insofar as indemnification for liabilities arising under the Securities Act may be permitted to directors or executive officers, we have been informed that in the opinion of the SEC such indemnification is against public policy and is therefore unenforceable.
Listing
We have applied to list the common stock on the NYSE under the symbol “CFG.”
Transfer Agent and Registrar
The Transfer Agent and Registrar for the Common Stock is Computershare Trust Company, N.A.
293
Table of Contents
MATERIAL U.S. FEDERAL TAX CONSIDERATIONS
The following is a general discussion of the material U.S. federal income and estate tax consequences of the ownership and disposition of our common stock by a beneficial owner that is a “non-U.S. holder” purchasing our common stock in this offering, other than a non-U.S. holder that owns or has owned, actually or constructively, more than 5% of our common stock. For purposes of this discussion, a “non-U.S. holder” is a person or entity that, for U.S. federal income tax purposes, is a:
| • | nonresident alien individual, other than certain former citizens and residents of the United States subject to tax as expatriates; |
| • | a corporation (or other entity taxable as a corporation) not created or organized in the United States or under the laws of the United States or of any state therein (or the District of Columbia); or |
| • | an estate or trust, other than an estate or trust the income of which is subject to U.S. federal income tax regardless of its source. |
If an entity or arrangement that is classified as a partnership for U.S. federal income tax purposes owns our common stock, the U.S. federal income tax treatment of a partner will generally depend on the status of the partner and the activities of the partnership. Partnerships owning our common stock and partners in such partnerships are urged to consult their tax advisors as to the particular U.S. federal income tax consequences of owning and disposing of our common stock.
This discussion is based on the Internal Revenue Code of 1986, as amended (the “Code”), and administrative pronouncements, judicial decisions and final, temporary and proposed Treasury Regulations as of the date hereof, changes to any of which subsequent to the date of this prospectus may affect the tax consequences described herein. This discussion does not address all aspects of U.S. federal income and estate taxation that may be relevant to a non-U.S. holder in light of its particular circumstances and does not address any tax consequences arising under the laws of any state, local or foreign jurisdiction, nor does it address the tax consequences to special classes of investors including, but not limited to, tax-exempt organizations, “controlled foreign corporations,” “passive foreign investment companies,” corporations that accumulate earnings to avoid U.S. federal income tax, insurance companies, banks or other financial institutions, dealers in securities, persons liable for the alternative minimum tax, traders in securities that elect to use a mark-to-market method of accounting for their securities holdings, persons who have acquired our common stock as compensation or otherwise in connection with the performance of services, or persons that will own our common stock as a position in a “straddle,” “conversion transaction” or other risk reduction transaction. Prospective holders are urged to consult their tax advisors with respect to the particular tax consequences to them of owning and disposing of our common stock, including the consequences under the laws of any state, local or foreign jurisdiction.
Dividends
Any dividends we pay with respect to our common stock (see “Dividend Policy”) will constitute dividends for U.S. federal income tax purposes to the extent paid from our current or accumulated earnings and profits, as determined under U.S. federal income tax principles. Any dividend paid to a non-U.S. holder of our common stock generally will be subject to withholding tax at a 30% rate or a reduced rate specified by an applicable income tax treaty. In order to obtain a reduced rate of withholding, a non-U.S. holder will be required to provide proper certification of its eligibility for such reduced rate.
If dividends paid to a non-U.S. holder are effectively connected with the non-U.S. holder’s conduct of a trade or business in the United States (and, if required by an applicable income tax treaty, are attributable to a permanent establishment or fixed base maintained by the non-U.S. holder in the
294
Table of Contents
United States), the non-U.S. holder will not be subject to U.S. withholding tax if the non-U.S. holder complies with applicable certification and disclosure requirements. Instead, the non-U.S. holder will generally be taxed with respect to the receipt of dividends paid on our common stock in the same manner as if the non-U.S. holder were a resident of the United States. A non-U.S. corporation receiving effectively connected dividends may also be subject to an additional “branch profits tax” imposed at a rate of 30% (or a lower rate specified in an applicable tax treaty).
Gain on Disposition of Our Common Stock
A non-U.S. holder generally will not be subject to U.S. federal income tax on gain realized upon the sale or other disposition of our common stock unless:
| • | the gain is effectively connected with a trade or business of the non-U.S. holder within the United States (and, if required by an applicable income tax treaty, is attributable to a U.S. permanent establishment or fixed base of such non-U.S. holder); |
| • | the non-U.S. holder is a nonresident alien individual and is present in the United States for 183 days or more in the taxable year of disposition and certain other conditions are met; or |
| • | we are or have been a United States real property holding corporation for U.S. federal income tax purposes at any time within the five-year period preceding the disposition or the non-U.S. holder’s holding period, whichever period is shorter, and our common stock has ceased to be traded on an established securities market prior to the beginning of the calendar year in which the sale or disposition occurs. We believe we are not, and do not anticipate becoming, a United States real property holding corporation. |
If a non-U.S. holder is engaged in a trade or business in the United States and gain recognized by the non-U.S. holder on a sale or other disposition of our common stock is effectively connected with a conduct of such trade or business and, if required by an applicable income tax treaty, is attributable to a permanent establishment or fixed base, the non-U.S. holder will generally be taxed with respect to such gain in the same manner as a U.S. person. Such non-U.S. holders are urged to consult their own tax advisors with respect to the U.S. tax consequences of the ownership and disposition of our common stock, including the possible imposition of a branch profits tax at a rate of 30% (or lower rate specified in an applicable tax treaty).
Information Reporting Requirements and Backup Withholding
Information returns will be filed with the Internal Revenue Service in connection with payments of dividends on our common stock. Unless the non-U.S. holder complies with certification procedures to establish that it is not a U.S. person, information returns may be filed with the Internal Revenue Service in connection with the proceeds from a sale or other disposition of our common stock and the non-U.S. holder may be subject to U.S. backup withholding on dividend payments on our common stock or on the proceeds from a sale or other disposition of our common stock. The amount of any backup withholding from a payment to a non-U.S. holder will be allowed as a credit against such holder’s U.S. federal income tax liability and may entitle such holder to a refund, provided that the required information is timely furnished to the Internal Revenue Service.
FATCA Withholding Tax
Legislation enacted in 2010 (commonly known as “FATCA”) generally imposes withholding at a rate of 30% on certain payments to certain foreign entities (including financial intermediaries), after December 31, 2012 (subject to certain transition rules), of dividends on and the gross proceeds of dispositions of U.S. common stock, unless various U.S. information reporting and due diligence requirements (generally relating to ownership by U.S. persons of interests in or accounts with those
295
Table of Contents
entities) have been satisfied. Current Treasury regulations implementing this withholding tax will defer the withholding obligation until January 1, 2017 for gross proceeds from dispositions of common stock of a U.S. issuer. Non-U.S. holders should consult their tax advisors regarding the possible implications of this legislation on their investment in our common stock.
Federal Estate Tax
The estates of nonresident alien individuals generally are subject to U.S. federal estate tax on property with a U.S. situs. Because we are a U.S. corporation, our common stock will be U.S. situs property and therefore will be includible in the U.S. taxable estate of a nonresident alien decedent who owns or possesses certain powers or interests in our common stock (including through certain trusts), unless an applicable estate tax treaty provides otherwise.
296
Table of Contents
SHARES ELIGIBLE FOR FUTURE SALE
Prior to this offering, there has been no market for our common stock. Future sales of substantial amounts of our common stock in the public market could adversely affect market prices prevailing from time to time. Furthermore, because only a limited number of shares will be available for sale shortly after this offering due to existing contractual and legal restrictions on resale as described below, there may be sales of substantial amounts of our common stock in the public market after the restrictions lapse. This may adversely affect the prevailing market price and our ability to raise equity capital in the future.
Upon completion of this offering, we will have 559,998,324 shares of common stock outstanding, excluding shares underlying any CFG equity awards outstanding at that time. Of these 559,998,324 shares, the 140,000,000 shares, or 161,000,000 shares if the underwriters exercise their over-allotment option in full, sold in this offering will be freely transferable without restriction or registration under the Securities Act of 1933, as amended (the “Securities Act”), except for any shares purchased by one of our existing “affiliates,” as that term is defined in Rule 144 under the Securities Act. The remaining 419,998,324 shares, or 398,998,324 shares if the underwriters exercise their overallotment option in full, of common stock outstanding are “restricted shares” as defined in Rule 144. Restricted shares may be sold in the public market only if registered or if they qualify for an exemption from registration under Rule 144. As a result of the contractual 180-day lock-up period described below and the provisions of Rule 144, these shares will be available for sale in the public market as follows:
| Number of Shares |
Date | |
| 0 (or 0 shares if the underwriters exercise their overallotment option in full) |
On the date of this prospectus. | |
| 0 (or 0 shares if the underwriters exercise their overallotment option in full) |
After 90 days from the date of this prospectus. | |
| 419,998,324 (or 398,998,324 shares if the underwriters exercise their overallotment option in full) |
After 180 days from the date of this prospectus (subject to volume limitations). |
As part of its obligations under the European Commission’s State Aid Amendment Decision of April 9, 2014, RBS has committed to dispose of its remaining ownership of our common stock by December 31, 2016, with an automatic 12-month extension depending on market conditions. See “Risk Factors—Risks Related to our Common Stock—Our stock price could decline due to the large number of outstanding shares of our common stock eligible for future sale, and RBS has committed to sell its remaining beneficial ownership of our common stock, although the timing of such sale or sales remains uncertain.”
Rule 144
In general, a person who has beneficially owned restricted shares of our common stock for at least six months would be entitled to sell such securities, provided that (i) such person is not deemed to have been one of our affiliates at the time of, or at any time during the 90 days preceding, a sale and (ii) we are subject to the Exchange Act periodic reporting requirements for at least 90 days before the sale. Persons who have beneficially owned restricted shares of our common stock for at least six months but who are our affiliates at the time of, or any time during the 90 days preceding, a sale, would be subject to additional restrictions, by which such person would be entitled to sell within any three-month period only a number of securities that does not exceed the greater of the following:
| • | 1% of the number of shares of our common stock then outstanding, which will equal approximately 5.6 million shares immediately after this offering; or |
297
Table of Contents
| • | the average weekly trading volume of our common stock on the NYSE during the four calendar weeks preceding the filing of a notice on Form 144 with respect to the sale; |
provided, in each case, that we are subject to the Exchange Act periodic reporting requirements for at least 90 days before the sale. Such sales both by affiliates and by non-affiliates must also comply with the manner of sale, current public information and notice provisions of Rule 144 to the extent applicable.
Registration Rights
Upon completion of this offering, subject to the lock-up agreements described below, the holders of 419,998,324 shares of common stock (or 398,998,324 shares of common stock if the underwriters’ over-allotment option is exercised in full) or their transferees will be entitled to various rights with respect to the registration of these shares under the Securities Act. Registration of these shares under the Securities Act would result in these shares becoming freely tradable without restriction under the Securities Act immediately upon the effectiveness of the registration, except for shares purchased by affiliates.
Equity Awards
Upon the completion of this offering, outstanding RBS deferred share awards, RBS LTIP awards (assuming maximum achievement of the performance conditions applicable to the LTIP awards) and special IPO awards granted to certain of our executive officers will convert into awards on shares of our common stock for a total of 1,378,226 shares (based principally on the midpoint of the range set forth on the cover page of this prospectus). For further details, see “Compensation Discussion and Analysis.” All of the shares subject to such converted equity awards held by our executive officers are subject to lock-up agreements. An additional 62,112,029 shares of common stock are available for future equity grants under our new stock plans (including our ESPP).
Upon completion of this offering, we intend to file a registration statement on Form S-8 under the Securities Act covering shares of common stock subject to outstanding CFG converted equity awards or issuable pursuant to our stock plans. Subject to Rule 144 volume limitations applicable to affiliates, shares registered under this registration statement will be available for sale in the open market, beginning 90 days after the date of the prospectus, except to the extent that the shares are subject to vesting restrictions with us or the contractual restrictions described below.
Lock-up Agreements
All of our directors, officers and the holders of substantially all of our common stock have agreed, subject to certain customary exceptions, not to offer, pledge, sell, contract to sell, sell any option or contract to purchase, purchase any option or contract to sell, grant any option, right or warrant to purchase or otherwise transfer or dispose of, directly or indirectly, or enter into any swap or other arrangement that transfers to another, in whole or in part, any of the economic consequences of ownership of any shares of common stock or any securities convertible into or exercisable or exchangeable for shares of common stock for a period of 180 days after the date of this prospectus, without the prior written consent of Morgan Stanley & Co. LLC, Goldman, Sachs & Co. and J.P. Morgan Securities LLC. See “Underwriting.”
298
Table of Contents
Under the terms and subject to the conditions in an underwriting agreement dated the date of this prospectus, the underwriters named below, for whom Morgan Stanley & Co. LLC, Goldman, Sachs & Co. and J.P. Morgan Securities LLC are acting as representatives, have severally agreed to purchase, and the selling stockholders have agreed to sell to them, severally, the number of shares indicated below:
| Name |
Number of Shares |
|||
| Morgan Stanley & Co. LLC |
||||
| Goldman, Sachs & Co. |
||||
| J.P. Morgan Securities LLC |
||||
| Barclays Capital Inc. |
||||
| Citigroup Global Markets Inc. |
||||
| Deutsche Bank Securities Inc. |
||||
| RBS Securities Inc. |
||||
| Wells Fargo Securities, LLC |
||||
| Credit Suisse Securities (USA) LLC |
||||
| UBS Securities LLC |
||||
| Jefferies LLC |
||||
| Keefe, Bruyette & Woods, Inc. |
||||
| Oppenheimer & Co. Inc. |
||||
| RBC Capital Markets, LLC |
||||
| Sandler O’Neill & Partners, L.P. |
||||
| Evercore Group L.L.C. |
||||
| ING Financial Markets LLC |
||||
| Sanford C. Bernstein & Co., LLC |
||||
| Guggenheim Securities, LLC |
||||
| Lebenthal & Co., LLC |
||||
| The Williams Capital Group, L.P. |
||||
| Total: |
140,000,000 | |||
The underwriters and the representatives are collectively referred to as the “underwriters” and the “representatives,” respectively. The underwriters are offering the shares of common stock subject to their acceptance of the shares from the selling stockholders and subject to prior sale. The underwriting agreement provides that the obligations of the several underwriters to pay for and accept delivery of the shares of common stock offered by this prospectus are subject to the approval of certain legal matters by their counsel and to certain other conditions. The underwriters are obligated to take and pay for all of the shares of common stock offered by this prospectus if any such shares are taken. However, the underwriters are not required to take or pay for the shares covered by the underwriters’ over-allotment option to purchase additional shares described below. The underwriting agreement also provides that if an underwriter defaults, the purchase commitments of non-defaulting underwriters may be increased or the offering may be postponed or terminated.
The underwriters initially propose to offer part of the shares of common stock directly to the public at the offering price listed on the cover page of this prospectus and part to certain dealers. After the initial offering of the shares of common stock, the offering price and other selling terms may from time to time be varied by the representatives. The offering of the shares by the underwriters is subject to receipt and acceptance and subject to the underwriters’ right to reject any order in whole or in part. Sales of shares of common stock made outside the United States may be made by affiliates of the underwriters.
299
Table of Contents
The selling stockholders have granted to the underwriters an option, exercisable for 30 days from the date of this prospectus, to purchase up to 21,000,000 additional shares of common stock at the public offering price listed on the cover page of this prospectus, less underwriting discounts and commissions. The underwriters may exercise this option solely for the purpose of covering over-allotments, if any, made in connection with the offering of the shares of common stock offered by this prospectus. To the extent the option is exercised, each underwriter will become obligated, subject to certain conditions, to purchase about the same percentage of the additional shares of common stock as the number listed next to the underwriter’s name in the preceding table bears to the total number of shares of common stock listed next to the names of all underwriters in the preceding table.
The following table shows the per share and total public offering price, underwriting discounts and commissions, and proceeds before expenses to the selling stockholders. These amounts are shown assuming both no exercise and full exercise of the underwriters’ option to purchase up to an additional shares of common stock.
| Total | ||||||||||||
| Per Share |
No Exercise |
Full Exercise |
||||||||||
| Public offering price |
$ | $ | $ | |||||||||
| Underwriting discounts and commissions to be paid by the selling stockholders |
||||||||||||
| Proceeds, before expenses, to selling stockholders |
$ | $ | $ | |||||||||
The estimated offering expenses payable by us and the selling stockholders are approximately $12.3 million. We have agreed to reimburse the underwriters for certain expenses relating to clearance of this offering with the Financial Industry Regulatory Authority up to $50,000.
The underwriters have informed us that they do not intend sales to discretionary accounts to exceed 5% of the total number of shares of common stock offered by them.
We have applied to list our shares of common stock on the NYSE under the trading symbol “CFG.”
We and all directors and officers and the holders of substantially all of our outstanding stock and stock options have agreed that, subject to certain exceptions, without the prior written consent of Morgan Stanley & Co. LLC, Goldman, Sachs & Co. and J.P. Morgan Securities LLC on behalf of the underwriters, we and they will not, during the period ending 180 days after the date of this prospectus (the “restricted period”):
| • | offer, pledge, sell, contract to sell, sell any option or contract to purchase, purchase any option or contract to sell, grant any option, right or warrant to purchase, lend or otherwise transfer or dispose of, directly or indirectly, any shares of common stock or any securities convertible into or exercisable or exchangeable for shares of common stock; |
| • | file any registration statement with the Securities and Exchange Commission relating to the offering of any shares of common stock or any securities convertible into or exercisable or exchangeable for common stock; or |
| • | enter into any swap or other arrangement that transfers to another, in whole or in part, any of the economic consequences of ownership of the common stock, |
whether any such transaction described above is to be settled by delivery of common stock or such other securities, in cash or otherwise. In addition, we and each such other person agrees that, without the prior written consent of Morgan Stanley & Co. LLC, Goldman, Sachs & Co. and J.P. Morgan Securities LLC on behalf of the underwriters, we or such other person will not, during the restricted period, make any demand for, or exercise any right with respect to, the registration of any shares of common stock or any security convertible into or exercisable or exchangeable for common stock.
300
Table of Contents
The restrictions described in the paragraph above do not apply to:
| • | transactions by a selling stockholder, director or officer relating to shares of our common stock or other securities acquired in open market transactions after the completion of this offering; |
| • | the conversion of equity-based awards held by directors or officers or our or any of our subsidiaries’ current or former service providers, as applicable, in the form of securities of RBS (or American Depositary Shares representing such securities) into securities or equity-based awards of CFG; |
| • | transfers, sales, tenders or other dispositions by a selling stockholder, director or officer of shares of our common stock or any securities convertible into shares of our common stock to a bona-fide third party pursuant to (i) a tender or exchange offer for our securities or (ii) another transaction, including, a merger, consolidation or other business combination, in each case that results in a change in control of us, provided that all of a selling stockholder’s, director’s or officer’s securities subject to the restrictions described above that are not so transferred, sold, tendered or otherwise disposed of remain subject to these restrictions and that in the event that the tender offer or other transaction is not completed, such securities will continue to be subject to these restrictions; |
| • | any issuance or transfer of shares of our common stock or securities convertible into or exercisable or exchangeable for shares of our common stock by us as consideration for a merger, acquisition, asset transfer or similar transaction, provided that the securities issued or transferred do not represent more than 5% of the total number of shares of our common stock issued and outstanding immediately following the completion of this offering including any exercise of the underwriters’ overallotment option and that we cause the recipient of such securities to execute and deliver a lock-up agreement; |
| • | transfers by a selling stockholder to any third-party pledgee in a bona fide transaction as collateral to secure obligations pursuant to lending or other arrangements between such third parties (or their affiliates or designees) and such selling stockholder or its affiliates or any similar arrangement relating to a financing arrangement for the benefit of such selling stockholder or its affiliates, provided that the selling stockholder shall cause any such third-party pledgee to execute and deliver to the representatives, on or prior to the pledging of such collateral, a lock-up agreement; |
| • | transfers by a selling stockholder if required to occur during the restricted period under the European Commission’s State Aid Amendment Decision dated April 9, 2014 or as otherwise directed by such selling stockholder’s regulators; or |
| • | certain other customary exceptions, including sales pursuant to the underwriting agreement, issuance of shares pursuant to our incentive compensation plans described herein, establishment of any trading plan pursuant to Rule 10b5-1, the filing of one or more registration statements on Form S-8 and certain donations, charitable gifts or transfers to related parties. |
The restricted period described above will be extended if:
| • | during the last 17 days of the restricted period we issue an earnings release or material news or a material news event relating to us occurs, or |
| • | prior to the expiration of the restricted period, we announce that we will release earnings results during the 16-day period beginning on the last day of the restricted period, |
in which case the restrictions described in the preceding paragraph will continue to apply until the expiration of the 18-day period beginning on the issuance of the earnings release or the occurrence of the material news or material event.
301
Table of Contents
Morgan Stanley & Co. LLC, Goldman, Sachs & Co. and J.P. Morgan Securities LLC, in their sole discretion, may release the common stock and other securities subject to the lock-up agreements described above in whole or in part at any time, with or without notice.
At our request, the underwriters have reserved approximately 2% of the shares of common stock to be offered by this prospectus for sale, at the initial public offering price, to directors, officers, employees and business associates of the Company. The number of shares of common stock available for sale to the general public will be reduced to the extent these individuals purchase such reserved shares. Any reserved shares that are not so purchased will be offered by the underwriters to the general public on the same basis as the other shares offered by this prospectus.
In order to facilitate the offering of the common stock, the underwriters may engage in transactions that stabilize, maintain or otherwise affect the price of the common stock. Specifically, the underwriters may sell more shares than they are obligated to purchase under the underwriting agreement, creating a short position. A short sale is covered if the short position is no greater than the number of shares available for purchase by the underwriters under the over-allotment option. The underwriters can close out a covered short sale by exercising the over-allotment option or purchasing shares in the open market. In determining the source of shares to close out a covered short sale, the underwriters will consider, among other things, the open market price of shares compared to the price available under the over-allotment option. The underwriters may also sell shares in excess of the over-allotment option, creating a naked short position. The underwriters must close out any naked short position by purchasing shares in the open market. A naked short position is more likely to be created if the underwriters are concerned that there may be downward pressure on the price of the common stock in the open market after pricing that could adversely affect investors who purchase in this offering. As an additional means of facilitating this offering, the underwriters may bid for, and purchase, shares of common stock in the open market to stabilize the price of the common stock. These activities may raise or maintain the market price of the common stock above independent market levels or prevent or retard a decline in the market price of the common stock. The underwriters are not required to engage in these activities and may end any of these activities at any time.
We, the selling stockholders, RBS and the several underwriters have agreed to indemnify each other against certain liabilities, including liabilities under the Securities Act.
A prospectus in electronic format may be made available on websites maintained by one or more underwriters, or selling group members, if any, participating in this offering. The representatives may agree to allocate a number of shares of common stock to underwriters for sale to their online brokerage account holders. Internet distributions will be allocated by the representatives to underwriters that may make Internet distributions on the same basis as other allocations.
The underwriters and their respective affiliates are full service financial institutions engaged in various activities, which may include securities trading, commercial and investment banking, financial advisory, investment management, investment research, principal investment, hedging, financing and brokerage activities. Certain of the underwriters and their respective affiliates have, from time to time, performed, and may in the future perform, various financial advisory and investment banking services for us, for which they received or will receive customary fees and expenses. Also, we and Oppenheimer & Co., Inc. have established a referral program, including a fee sharing arrangement for referrals by the parties, pursuant to a written agreement dated May 31, 2012.
In addition, in the ordinary course of their various business activities, the underwriters and their respective affiliates may make or hold a broad array of investments and actively trade debt and equity securities (or related derivative securities) and financial instruments (including bank loans) for their own account and for the accounts of their customers and may at any time hold long and short positions in such securities and instruments. Such investment and securities activities may involve our securities
302
Table of Contents
and instruments. The underwriters and their respective affiliates may also make investment recommendations or publish or express independent research views in respect of such securities or instruments and may at any time hold, or recommend to clients that they acquire, long or short positions in such securities and instruments.
Because RBS Securities Inc., an underwriter for this offering, is under common control with us and the selling stockholders and because affiliates of this underwriter will receive at least 5% of the proceeds of this offering, a conflict of interest under Financial Industry Regulatory Authority, Inc. (“FINRA”) Rule 5121 is deemed to exist. Accordingly, this offering will be conducted in accordance with this rule. Pursuant to FINRA Rule 5121, RBS Securities Inc. will not confirm sales to any account over which it exercises discretionary authority without the specific prior written approval of the account holder.
Pricing of the Offering
Prior to this offering, there has been no public market for our common stock. The initial public offering price was determined by negotiations between the selling stockholders and the representatives. Among the factors considered in determining the initial public offering price were our future prospects and those of our industry in general, our revenues, earnings and certain other financial and operating information in recent periods, and the price-earnings ratios, market prices of securities, and certain financial and operating information of companies engaged in activities similar to ours.
Selling Restrictions
Other than in the United States, no action has been taken by us or the underwriters that would permit a public offering of the securities offered by this prospectus in any jurisdiction where action for that purpose is required. The securities offered by this prospectus may not be offered or sold, directly or indirectly, nor may this prospectus or any other offering material or advertisements in connection with the offer and sale of any such securities be distributed or published, in any jurisdiction, except under circumstances that will result in compliance with the applicable rules and regulations of that jurisdiction. Persons into whose possession this prospectus comes are advised to inform themselves about and to observe any restrictions relating to the offering and the distribution of this prospectus. This prospectus does not constitute an offer to sell or a solicitation of an offer to buy any securities offered by this prospectus in any jurisdiction in which such an offer or a solicitation is unlawful.
European Economic Area
In relation to each Member State of the European Economic Area which has implemented the Prospectus Directive (each, a “Relevant Member State”) an offer to the public of any shares of our common stock may not be made in that Relevant Member State, except that an offer to the public in that Relevant Member State of any shares of our common stock may be made at any time under the following exemptions under the Prospectus Directive, if they have been implemented in that Relevant Member State:
| (a) | to any legal entity which is a qualified investor as defined in the Prospectus Directive; |
| (b) | to fewer than 100 or, if the Relevant Member State has implemented the relevant provision of the 2010 PD Amending Directive, 150, natural or legal persons (other than qualified investors as defined in the Prospectus Directive), as permitted under the Prospectus Directive, subject to obtaining the prior consent of the representatives for any such offer; or |
303
Table of Contents
| (c) | in any other circumstances falling within Article 3(2) of the Prospectus Directive, provided that no such offer of shares of our common stock shall result in a requirement for the publication by us or any underwriter of a prospectus pursuant to Article 3 of the Prospectus Directive. |
For the purposes of this provision, the expression an “offer to the public” in relation to any shares of our common stock in any Relevant Member State means the communication in any form and by any means of sufficient information on the terms of the offer and any shares of our common stock to be offered so as to enable an investor to decide to purchase any shares of our common stock, as the same may be varied in that Member State by any measure implementing the Prospectus Directive in that Member State, the expression “Prospectus Directive” means Directive 2003/71/EC (and amendments thereto, including the 2010 PD Amending Directive, to the extent implemented in the Relevant Member State), and includes any relevant implementing measure in the Relevant Member State, and the expression “2010 PD Amending Directive” means Directive 2010/73/EU.
United Kingdom
Each underwriter has represented and agreed that:
| (a) | it has only communicated or caused to be communicated and will only communicate or cause to be communicated an invitation or inducement to engage in investment activity (within the meaning of Section 21 of the Financial Services and Markets Act 2000 (“FSMA”) received by it in connection with the issue or sale of the shares of our common stock in circumstances in which Section 21(1) of the FSMA does not apply to us; and |
| (b) | it has complied and will comply with all applicable provisions of the FSMA with respect to anything done by it in relation to the shares of our common stock in, from or otherwise involving the United Kingdom. |
Hong Kong
The shares may not be offered or sold by means of any document other than (i) in circumstances which do not constitute an offer to the public within the meaning of the Companies Ordinance (Cap.32, Laws of Hong Kong), or (ii) to “professional investors” within the meaning of the Securities and Futures Ordinance (Cap.571, Laws of Hong Kong) and any rules made thereunder, or (iii) in other circumstances which do not result in the document being a “prospectus” within the meaning of the Companies Ordinance (Cap.32, Laws of Hong Kong), and no advertisement, invitation or document relating to the shares may be issued or may be in the possession of any person for the purpose of issue (in each case whether in Hong Kong or elsewhere), which is directed at, or the contents of which are likely to be accessed or read by, the public in Hong Kong (except if permitted to do so under the laws of Hong Kong) other than with respect to shares which are or are intended to be disposed of only to persons outside Hong Kong or only to “professional investors” within the meaning of the Securities and Futures Ordinance (Cap. 571, Laws of Hong Kong) and any rules made thereunder.
Singapore
This prospectus has not been registered as a prospectus with the Monetary Authority of Singapore. Accordingly, this prospectus and any other document or material in connection with the offer or sale, or invitation for subscription or purchase, of the shares may not be circulated or distributed, nor may the shares be offered or sold, or be made the subject of an invitation for subscription or purchase, whether directly or indirectly, to persons in Singapore other than (i) to an institutional investor under Section 274 of the Securities and Futures Act, Chapter 289 of Singapore
(the “SFA”), (ii) to a relevant person, or any person pursuant to Section 275(1A), and in accordance
304
Table of Contents
with the conditions, specified in Section 275 of the SFA or (iii) otherwise pursuant to, and in accordance with the conditions of, any other applicable provision of the SFA.
Where the shares are subscribed or purchased under Section 275 by a relevant person which is: (a) a corporation (which is not an accredited investor) the sole business of which is to hold investments and the entire share capital of which is owned by one or more individuals, each of whom is an accredited investor; or (b) a trust (where the trustee is not an accredited investor) whose sole purpose is to hold investments and each beneficiary is an accredited investor, shares, debentures and units of shares and debentures of that corporation or the beneficiaries’ rights and interest in that trust shall not be transferable for 6 months after that corporation or that trust has acquired the shares under Section 275 except: (1) to an institutional investor under Section 274 of the SFA or to a relevant person, or any person pursuant to Section 275(1A), and in accordance with the conditions, specified in Section 275 of the SFA; (2) where no consideration is given for the transfer; or (3) by operation of law.
Japan
The securities have not been and will not be registered under the Financial Instruments and Exchange Law of Japan (the Financial Instruments and Exchange Law) and each underwriter has agreed that it will not offer or sell any securities, directly or indirectly, in Japan or to, or for the benefit of, any resident of Japan (which term, as used in this prospectus means any person resident in Japan, including any corporation or other entity organized under the laws of Japan), or to others for re-offering or resale, directly or indirectly, in Japan or to a resident of Japan, except pursuant to an exemption from the registration requirements of, and otherwise in compliance with, the Financial Instruments and Exchange Law and any other applicable laws, regulations and ministerial guidelines of Japan.
305
Table of Contents
The validity of the shares of common stock offered hereby will be passed upon for us by Davis Polk & Wardwell LLP, New York, New York, and by Cleary Gottlieb Steen & Hamilton LLP, for the underwriters.
The financial statements included in this prospectus have been audited by Deloitte & Touche LLP, an independent registered public accounting firm, as stated in their report appearing in this prospectus. Such financial statements are included in reliance upon the report of such firm given upon their authority as experts in accounting and auditing.
WHERE YOU CAN FIND MORE INFORMATION
We have filed with the SEC a registration statement on Form S-1 under the Securities Act with respect to the common stock offered hereby. This prospectus, which is part of the registration statement, does not contain all of the information set forth in the registration statement and the exhibits and schedules to the registration statement. For further information, we refer you to the registration statement and the exhibits and schedules filed as part of the registration statement. If a document has been filed as an exhibit to the registration statement, we refer you to the copy of the document that has been filed. A copy of the registration statement, including the exhibits and schedules thereto, may be read and copied at the SEC’s Public Reference Room at 100 F Street, N.E., Washington, D.C. 20549. Information on the operation of the Public Reference Room may be obtained by calling the SEC at 1-800-SEC-0330. In addition, the SEC maintains an Internet website that contains reports, proxy statements and other information about issuers, like us, that file electronically with the SEC. The address of that site is www.sec.gov.
As a result of the offering, we will become subject to the full informational requirements of the Exchange Act. We will fulfill our obligations with respect to such requirements by filing periodic reports and other information with the SEC. We intend to furnish our stockholders with annual reports containing audited consolidated financial statements certified by an independent public accounting firm. We also maintain an Internet site at www.citizensbank.com. Our website and the information contained therein or connected thereto shall not be deemed to be incorporated into this prospectus or the registration statement of which it forms a part.
306
Table of Contents
INDEX TO CONSOLIDATED FINANCIAL STATEMENTS
| F-2 | ||||
| F-4 | ||||
| Consolidated Financial Statements: |
||||
| Consolidated Balance Sheets as of December 31, 2012 and 2013 |
F-5 | |||
| Consolidated Statements of Operations for the years ended December 31, 2011, 2012 and 2013 |
F-6 | |||
| F-7 | ||||
| F-8 | ||||
| Consolidated Statements of Cash Flows for the years ended December 31, 2011, 2012 and 2013 |
F-9 | |||
| F-10 | ||||
| Unaudited Interim Consolidated Financial Statements: |
||||
| Consolidated Balance Sheets as of December 31, 2013 and June 30, 2014 |
F-93 | |||
| Consolidated Statements of Operations for the six months ended June 30, 2013 and 2014 |
F-94 | |||
| F-95 | ||||
| F-96 | ||||
| Consolidated Statements of Cash Flows for the six months ended June 30, 2013 and 2014 |
F-97 | |||
| F-98 |
F-1
Table of Contents
CITIZENS FINANCIAL GROUP, INC.
GLOSSARY OF ACRONYMS AND TERMS
GLOSSARY OF ACRONYMS AND TERMS
The following listing provides a comprehensive reference of common acronyms and terms used throughout the document:
| AFS |
Available For Sale | |
| ALLL |
Allowance for Loan and Lease Losses | |
| AOCI |
Accumulated Other Comprehensive Income | |
| ATM |
Automatic Teller Machine | |
| BHC |
Bank Holding Company | |
| bps |
Basis Points | |
| Capital Plan Rule |
Federal Reserve’s Regulation Y Capital Plan Rule | |
| CCAR |
Comprehensive Capital Analysis and Review | |
| CCB |
Capital Conservation Buffer | |
| CEB |
Commercial Enterprise Banking | |
| CEO |
Chief Executive Officer | |
| CET1 |
Common Equity Tier 1 | |
| Citizens or CFG or the Company |
Citizens Financial Group, Inc. and its Subsidiaries | |
| CLTV |
Combined Loan-to-Value | |
| CMO |
Collateralized Mortgage Obligation | |
| CRA |
Community Reinvestment Act of 1977 | |
| CSA |
Credit Support Annex | |
| Dodd-Frank Act (DFA) |
The Dodd-Frank Wall Street Reform and Consumer Protection Act of 2010 | |
| EC |
Economic Capital | |
| EPS |
Earnings Per Share | |
| ERISA |
Employee Retirement Income Security Act of 1974 | |
| ESOP |
Executive Share Option Plan | |
| Fannie Mae (FNMA) |
The Federal National Mortgage Association | |
| FASB |
The Financial Accounting Standards Board | |
| FDIC |
Federal Deposit Insurance Corporation | |
| FDICIA |
Federal Deposit Insurance Corporation Improvement Act of 1991 | |
| FFIEC |
Federal Financial Institutions Examination Council | |
| FHC |
Financial Holding Company | |
| FHLB |
Federal Home Loan Bank | |
| FICO |
Fair Isaac Corporation (credit rating) | |
| FLSA |
Fair Labor Standards Act of 1938, as amended | |
| FRB |
Federal Reserve Bank | |
| FRBG |
Federal Reserve Board of Governors | |
| Freddie Mac (FHLMC) |
The Federal Home Loan Mortgage Corporation | |
| FTP |
Funds Transfer Pricing |
F-2
Table of Contents
| GAAP |
Accounting Principles Generally Accepted in the United States of America | |
| GDP |
Gross Domestic Product | |
| Ginnie Mae (GNMA) |
The Government National Mortgage Association | |
| GLBA |
Gramm-Leach-Bliley Act of 1999 | |
| HELOC |
Home Equity Line of Credit | |
| HTM |
Held To Maturity | |
| ICAR |
Internal Capital Adequacy Requirement | |
| IFRS |
International Financial Reporting Standards | |
| ILP |
Incurred Loss Period | |
| IST |
Integrated Stress Testing | |
| IT |
Information Technology | |
| LIBOR |
London Interbank Offered Rate | |
| LOB |
Line of Business | |
| LTV |
Loan-to-Value | |
| MBS |
Mortgage-Backed Security | |
| MD&A |
Management’s Discussion and Analysis of Financial Condition and Results of Operation | |
| MERS |
Mortgage Electronic Registration Systems, Inc. | |
| MSR |
Mortgage Servicing Right | |
| NPR |
Notice of Proposed Rulemaking | |
| OCC |
Office of the Comptroller of the Currency | |
| OCI |
Other Comprehensive Income | |
| OIS |
Overnight Index Swap | |
| OTC |
Over the Counter | |
| PIMCO |
Pacific Investment Management Company, LLC | |
| RBS |
The Royal Bank of Scotland plc. | |
| RBS CBFM |
The Royal Bank of Scotland plc. Corporate Banking and Financial Markets | |
| RBSG or RBS Group |
The Royal Bank of Scotland Group plc. | |
| REIT |
Real Estate Investment Trust | |
| ROTCE |
Return on Average Tangible Common Equity | |
| RPA |
Risk Participation Agreement | |
| RV |
Recreational Vehicle | |
| SBO |
Serviced by Others | |
| SIFI |
Systemically Important Financial Institutions | |
| TDR |
Troubled Debt Restructuring | |
| UK |
United Kingdom |
F-3
Table of Contents

|

| |
| REPORT OF INDEPENDENT REGISTERED PUBLIC ACCOUNTING FIRM | ||
To the Board of Directors and Stockholders of
Citizens Financial Group, Inc.
Providence, Rhode Island
We have audited the accompanying consolidated balance sheets of Citizens Financial Group, Inc. and its subsidiaries (the “Company”) as of December 31, 2013 and 2012, and the related consolidated statements of operations, other comprehensive income (loss), changes in stockholders’ equity, and cash flows for each of the three years in the period ended December 31, 2013. These financial statements are the responsibility of the Company’s management. Our responsibility is to express an opinion on these financial statements based on our audits.
We conducted our audits in accordance with the standards of the Public Company Accounting Oversight Board (United States). Those standards require that we plan and perform the audit to obtain reasonable assurance about whether the financial statements are free of material misstatement. The Company is not required to have, nor were we engaged to perform, an audit of its internal control over financial reporting. Our audits included consideration of internal control over financial reporting as a basis for designing audit procedures that are appropriate in the circumstances, but not for the purpose of expressing an opinion on the effectiveness of the Company’s internal control over financial reporting. Accordingly, we express no such opinion. An audit also includes examining, on a test basis, evidence supporting the amounts and disclosures in the financial statements, assessing the accounting principles used and significant estimates made by management, as well as evaluating the overall financial statement presentation. We believe that our audits provide a reasonable basis for our opinion.
In our opinion, such consolidated financial statements present fairly, in all material respects, the financial position of Citizens Financial Group, Inc. and its subsidiaries as of December 31, 2013 and 2012, and the results of its operations and its cash flows for each of the three years in the period ended December 31, 2013, in conformity with accounting principles generally accepted in the United States of America.
/s/ Deloitte & Touche LLP
Boston, Massachusetts
March 12, 2014 (except for notes 24, 26, and 27, as to which the date is May 12, 2014, and except for notes 25 and 29, as to which the date is September 8, 2014)

F-4
Table of Contents
CITIZENS FINANCIAL GROUP, INC.
| December 31, 2013 |
December 31, 2012 |
|||||||
| (in millions, except share data) | ||||||||
| ASSETS: |
||||||||
| Cash and due from banks (related party balances of $0 and $193, respectively) |
$ | 1,406 | $ | 1,623 | ||||
| Interest-bearing cash and due from banks |
1,351 | 1,440 | ||||||
| Interest-bearing deposits in banks |
233 | 126 | ||||||
| Federal funds sold and securities purchased under resale agreements |
— | 1,100 | ||||||
| Securities available for sale, at fair value |
15,995 | 18,356 | ||||||
| Securities held to maturity (estimated fair value of $4,257 and $0, respectively) |
4,315 | — | ||||||
| Other investment securities |
935 | 1,061 | ||||||
| Loans held for sale, at fair value |
176 | 624 | ||||||
| Other loans held for sale |
1,078 | 22 | ||||||
| Loans and leases |
85,859 | 87,248 | ||||||
| Less: Allowance for loan and lease losses |
1,221 | 1,255 | ||||||
|
|
|
|
|
|||||
| Net loans and leases |
84,638 | 85,993 | ||||||
| Derivative assets (related party balances of $0 and $8, respectively) |
650 | 1,155 | ||||||
| Premises and equipment, net |
592 | 643 | ||||||
| Bank-owned life insurance |
1,339 | 1,299 | ||||||
| Goodwill |
6,876 | 11,311 | ||||||
| Due from broker |
446 | 4 | ||||||
| Other branch assets held for sale |
46 | — | ||||||
| Other assets (related party balances of $63 and $20, respectively) |
2,078 | 2,296 | ||||||
|
|
|
|
|
|||||
| TOTAL ASSETS |
$ | 122,154 | $ | 127,053 | ||||
|
|
|
|
|
|||||
| LIABILITIES AND STOCKHOLDERS’ EQUITY: |
||||||||
| LIABILITIES: |
||||||||
| Deposits: |
||||||||
| Noninterest-bearing |
$ | 24,931 | $ | 25,931 | ||||
| Interest-bearing (related party balances of $5 and $7, respectively) |
61,972 | 69,217 | ||||||
|
|
|
|
|
|||||
| Total deposits |
86,903 | 95,148 | ||||||
| Deposits held for sale |
5,277 | — | ||||||
| Federal funds purchased and securities sold under agreements to repurchase |
4,791 | 3,601 | ||||||
| Other short-term borrowed funds |
2,251 | 501 | ||||||
| Derivative liabilities (related party balances of $835 and $1,224, respectively) |
939 | 1,318 | ||||||
| Deferred taxes, net |
199 | 446 | ||||||
| Long-term borrowed funds (related party balances of $1,000 and $289, respectively) |
1,405 | 694 | ||||||
| Other liabilities (related party balances of $27 and $90, respectively) |
1,193 | 1,216 | ||||||
|
|
|
|
|
|||||
| TOTAL LIABILITIES |
102,958 | 102,924 | ||||||
|
|
|
|
|
|||||
| Commitments and contingent liabilities (refer to Note 16) |
||||||||
| STOCKHOLDERS’ EQUITY: |
||||||||
| Preferred stock: |
||||||||
| $1.00 par value, 30,000 shares authorized, no shares outstanding at December 31, 2013 and 2012, and liquidation value per share of $100,000 |
— | — | ||||||
| Common stock: |
||||||||
| $.01 par value, 1,000,000,000 shares authorized, 559,998,324 shares issued and outstanding at December 31, 2013 and 2012 |
6 | 6 | ||||||
| Additional paid-in capital |
18,603 | 18,589 | ||||||
| Retained earnings |
1,235 | 5,846 | ||||||
| Accumulated other comprehensive loss |
(648 | ) | (312 | ) | ||||
|
|
|
|
|
|||||
| TOTAL STOCKHOLDERS’ EQUITY |
19,196 | 24,129 | ||||||
|
|
|
|
|
|||||
| TOTAL LIABILITIES AND STOCKHOLDERS’ EQUITY |
$ | 122,154 | $ | 127,053 | ||||
|
|
|
|
|
|||||
The accompanying Notes to Consolidated Financial Statements are an integral part of these statements.
F-5
Table of Contents
CITIZENS FINANCIAL GROUP, INC.
CONSOLIDATED STATEMENTS OF OPERATIONS
| Year Ended December 31, | ||||||||||||
| 2013 | 2012 | 2011 | ||||||||||
| (in millions, except share data) | ||||||||||||
| INTEREST INCOME: |
||||||||||||
| Interest and fees on loans and leases (related party balance of $56 in 2013) |
$ | 3,001 | $ | 3,205 | $ | 3,434 | ||||||
| Interest and fees on loans held for sale |
12 | 17 | 13 | |||||||||
| Investment securities (related party balance of $(1) in 2011) |
477 | 620 | 750 | |||||||||
| Interest-bearing deposits in banks (related party balance of $1 in 2011) |
11 | 4 | 7 | |||||||||
|
|
|
|
|
|
|
|||||||
| Total interest income |
3,501 | 3,846 | 4,204 | |||||||||
|
|
|
|
|
|
|
|||||||
| INTEREST EXPENSE: |
||||||||||||
| Deposits (related party balances of $15, $104 and $182, respectively) |
216 | 375 | 490 | |||||||||
| Federal funds purchased and securities sold under agreement to repurchase (related party balances of $184, $117 and $187, respectively) |
192 | 119 | 191 | |||||||||
| Other short-term borrowed funds (related party balances of $3, $90 and $88, respectively) |
4 | 101 | 150 | |||||||||
| Long-term borrowed funds (related party balances of $16, $9 and $67, respectively) |
31 | 24 | 53 | |||||||||
|
|
|
|
|
|
|
|||||||
| Total interest expense |
443 | 619 | 884 | |||||||||
|
|
|
|
|
|
|
|||||||
| Net interest income |
3,058 | 3,227 | 3,320 | |||||||||
| Provision for credit losses |
479 | 413 | 882 | |||||||||
|
|
|
|
|
|
|
|||||||
| Net interest income after provision for credit losses |
2,579 | 2,814 | 2,438 | |||||||||
|
|
|
|
|
|
|
|||||||
| NONINTEREST INCOME: |
||||||||||||
| Service charges and fees (related party balances of $15, $23 and $22, respectively) |
640 | 704 | 742 | |||||||||
| Card fees |
234 | 249 | 344 | |||||||||
| Mortgage banking fees |
153 | 189 | 62 | |||||||||
| Trust and investment services fees |
149 | 131 | 131 | |||||||||
| Securities gains, net |
144 | 95 | 162 | |||||||||
| Foreign exchange and trade finance fees (related party balances of $(15), $(9) and $1, respectively) |
97 | 105 | 114 | |||||||||
| Capital markets fees (related party balances of $14, $7 and $6, respectively) |
53 | 52 | 40 | |||||||||
| Bank-owned life insurance income |
50 | 51 | 49 | |||||||||
| Other-than-temporary impairment: |
||||||||||||
| Total other-than-temporary impairment losses |
(49 | ) | (84 | ) | (189 | ) | ||||||
| Portions of loss recognized in other comprehensive income (before taxes) |
41 | 60 | 170 | |||||||||
|
|
|
|
|
|
|
|||||||
| Net impairment losses recognized in earnings |
(8 | ) | (24 | ) | (19 | ) | ||||||
| Other income (related party balances of $(32), $(285) and $(690), respectively) |
120 | 115 | 86 | |||||||||
|
|
|
|
|
|
|
|||||||
| Total noninterest income |
1,632 | 1,667 | 1,711 | |||||||||
|
|
|
|
|
|
|
|||||||
| NONINTEREST EXPENSE: |
||||||||||||
| Salaries and employee benefits |
1,652 | 1,743 | 1,623 | |||||||||
| Outside services |
360 | 339 | 340 | |||||||||
| Occupancy (related party balances of $3, $2 and $3, respectively) |
327 | 310 | 372 | |||||||||
| Equipment expense |
275 | 279 | 301 | |||||||||
| Amortization of software |
102 | 77 | 53 | |||||||||
| Goodwill impairment |
4,435 | — | — | |||||||||
| Other operating expense |
528 | 709 | 682 | |||||||||
|
|
|
|
|
|
|
|||||||
| Total noninterest expense |
7,679 | 3,457 | 3,371 | |||||||||
|
|
|
|
|
|
|
|||||||
| (Loss) income before income tax (benefit) expense |
(3,468 | ) | 1,024 | 778 | ||||||||
| Income tax (benefit) expense |
(42 | ) | 381 | 272 | ||||||||
|
|
|
|
|
|
|
|||||||
| NET (LOSS) INCOME |
$ | (3,426 | ) | $ | 643 | $ | 506 | |||||
|
|
|
|
|
|
|
|||||||
| Weighted-average number of shares outstanding: |
||||||||||||
| Basic |
559,998,324 | 559,998,324 | 559,998,324 | |||||||||
| Diluted |
559,998,324 | 559,998,324 | 559,998,324 | |||||||||
|
|
|
|
|
|
|
|||||||
| Per common share information: |
||||||||||||
| Basic earnings |
$ | (6.12 | ) | $ | 1.15 | $ | 0.90 | |||||
| Diluted earnings |
(6.12 | ) | 1.15 | 0.90 | ||||||||
| Dividends declared and paid to parent |
2.12 | 0.27 | — | |||||||||
|
|
|
|
|
|
|
|||||||
The accompanying Notes to Consolidated Financial Statements are an integral part of these statements.
F-6
Table of Contents
CITIZENS FINANCIAL GROUP, INC.
CONSOLIDATED STATEMENTS OF OTHER COMPREHENSIVE INCOME (LOSS)
| Year Ended December 31, | ||||||||||||
| 2013 | 2012 | 2011 | ||||||||||
| (in millions) | ||||||||||||
| Net (loss) income |
$ | (3,426 | ) | $ | 643 | $ | 506 | |||||
| Other comprehensive income (loss): |
||||||||||||
| Net unrealized derivative instrument gains (losses) arising during the period, net of income taxes of $(100), $(15), and $(64), respectively |
(172 | ) | (26 | ) | (112 | ) | ||||||
| Reclassification adjustment for net derivative (gains) losses included in net income, net of income taxes of $66, $123, and $188, respectively |
114 | 212 | 328 | |||||||||
| Net unrealized securities (losses) gains arising during the period, net of income taxes of $(165), $80, and $163, respectively |
(285 | ) | 138 | 286 | ||||||||
| Other than temporary impairment not recognized in earnings on securities, net of income taxes of $(15), $(22), and $(62), respectively |
(26 | ) | (38 | ) | (108 | ) | ||||||
| Reclassification of net securities gains to net income, net of income taxes of $(50), $(26), and $(52), respectively |
(86 | ) | (45 | ) | (90 | ) | ||||||
| Defined benefit pension plans: |
||||||||||||
| Actuarial gain (loss), net of taxes of $66, $(63), and $(92), respectively |
110 | (107 | ) | (150 | ) | |||||||
| Amortization of actuarial loss, net of taxes of $5, $14, and $8, respectively |
9 | 24 | 12 | |||||||||
| Settlement/curtailment, net of taxes of $0, $34, and $0, respectively |
— | 58 | (3 | ) | ||||||||
|
|
|
|
|
|
|
|||||||
| Total other comprehensive (loss) income, net of income taxes |
(336 | ) | 216 | 163 | ||||||||
|
|
|
|
|
|
|
|||||||
| Total comprehensive (loss) income |
$ | (3,762 | ) | $ | 859 | $ | 669 | |||||
|
|
|
|
|
|
|
|||||||
The accompanying Notes to Consolidated Financial Statements are an integral part of these statements.
F-7
Table of Contents
CITIZENS FINANCIAL GROUP, INC.
CONSOLIDATED STATEMENTS OF CHANGES IN STOCKHOLDERS’ EQUITY
| Preferred Stock |
Common Stock |
Additional Paid-in Capital |
Retained Earnings |
Accumulated Other Comprehensive Income (Loss) |
Total | |||||||||||||||||||
| (in millions) | ||||||||||||||||||||||||
| Balance at January 1, 2011 |
$ | — | $ | 6 | $ | 18,532 | $ | 4,847 | $ | (691 | ) | $ | 22,694 | |||||||||||
| Capital contribution |
— | — | 30 | — | — | 30 | ||||||||||||||||||
| Total comprehensive income: |
||||||||||||||||||||||||
| Net income |
— | — | — | 506 | — | 506 | ||||||||||||||||||
| Other comprehensive income |
— | — | — | — | 163 | 163 | ||||||||||||||||||
|
|
|
|
|
|
|
|
|
|
|
|
|
|||||||||||||
| Total comprehensive income |
669 | |||||||||||||||||||||||
|
|
|
|
|
|
|
|
|
|
|
|
|
|||||||||||||
| Balance at December 31, 2011 |
— | 6 | 18,562 | 5,353 | (528 | ) | 23,393 | |||||||||||||||||
| Dividend to parent |
— | — | — | (150 | ) | — | (150 | ) | ||||||||||||||||
| Capital contribution |
— | — | 27 | — | — | 27 | ||||||||||||||||||
| Total comprehensive income: |
||||||||||||||||||||||||
| Net income |
— | — | — | 643 | — | 643 | ||||||||||||||||||
| Other comprehensive income |
— | — | — | — | 216 | 216 | ||||||||||||||||||
|
|
|
|
|
|
|
|
|
|
|
|
|
|||||||||||||
| Total comprehensive income |
859 | |||||||||||||||||||||||
|
|
|
|
|
|
|
|
|
|
|
|
|
|||||||||||||
| Balance at December 31, 2012 |
— | 6 | 18,589 | 5,846 | (312 | ) | 24,129 | |||||||||||||||||
| Dividends to parent |
— | — | — | (185 | ) | — | (185 | ) | ||||||||||||||||
| Dividends to parent—exchange transactions |
— | — | — | (1,000 | ) | — | (1,000 | ) | ||||||||||||||||
| Capital contribution |
— | — | 14 | — | — | 14 | ||||||||||||||||||
| Total comprehensive loss: |
||||||||||||||||||||||||
| Net loss |
— | — | — | (3,426 | ) | — | (3,426 | ) | ||||||||||||||||
| Other comprehensive loss |
— | — | — | — | (336 | ) | (336 | ) | ||||||||||||||||
|
|
|
|
|
|
|
|
|
|
|
|
|
|||||||||||||
| Total comprehensive loss |
(3,762 | ) | ||||||||||||||||||||||
|
|
|
|
|
|
|
|
|
|
|
|
|
|||||||||||||
| Balance at December 31, 2013 |
$ | — | $ | 6 | $ | 18,603 | $ | 1,235 | $ | (648 | ) | $ | 19,196 | |||||||||||
|
|
|
|
|
|
|
|
|
|
|
|
|
|||||||||||||
The accompanying Notes to Consolidated Financial Statements are an integral part of these statements.
F-8
Table of Contents
CITIZENS FINANCIAL GROUP, INC.
CONSOLIDATED STATEMENTS OF CASH FLOWS
| Year Ended December 31, | ||||||||||||
| 2013 | 2012 | 2011 | ||||||||||
| (in millions) | ||||||||||||
| OPERATING ACTIVITIES |
||||||||||||
| Net (loss) income |
$ | (3,426 | ) | $ | 643 | $ | 506 | |||||
| Adjustments to reconcile net income to net cash provided by operating activities: |
||||||||||||
| Provision for credit losses |
479 | 413 | 882 | |||||||||
| Originations of mortgage loans held for sale |
(3,781 | ) | (5,496 | ) | (3,823 | ) | ||||||
| Proceeds from sales of mortgage loans held for sale |
4,229 | 5,436 | 3,975 | |||||||||
| Amortization of terminated cash flow hedges (related party balances of $69, $74 and $84, respectively) |
73 | 97 | 139 | |||||||||
| Depreciation, amortization and accretion |
404 | 467 | 434 | |||||||||
| (Recovery) impairment of mortgage servicing rights |
(47 | ) | 12 | 42 | ||||||||
| Securities impairment |
8 | 24 | 19 | |||||||||
| Goodwill impairment |
4,435 | — | — | |||||||||
| Gain on other investment securities |
— | (3 | ) | (9 | ) | |||||||
| Deferred income taxes |
(53 | ) | 306 | 252 | ||||||||
| Loss on disposal / impairment of premises and equipment |
16 | 11 | 8 | |||||||||
| (Gain) loss on sales of: |
||||||||||||
| Securities available for sale |
(144 | ) | (93 | ) | (162 | ) | ||||||
| Other investment securities |
— | (63 | ) | — | ||||||||
| Subsidiary |
— | — | (7 | ) | ||||||||
| Premises and equipment |
— | — | (2 | ) | ||||||||
| Other assets |
— | 24 | — | |||||||||
| Decrease (increase) in other assets (related party balances of $(35), $(24) and $1, respectively) |
827 | 76 | (164 | ) | ||||||||
| (Decrease) increase in other liabilities (related party balances of $(452), $(323) and $70, respectively) |
(371 | ) | (140 | ) | 389 | |||||||
|
|
|
|
|
|
|
|||||||
| Net cash provided by operating activities |
2,649 | 1,714 | 2,479 | |||||||||
|
|
|
|
|
|
|
|||||||
| INVESTING ACTIVITIES |
||||||||||||
| Investment securities: |
||||||||||||
| Purchases of securities available for sale |
(10,999 | ) | (5,532 | ) | (13,749 | ) | ||||||
| Proceeds from maturities and paydowns of securities available for sale |
4,708 | 6,667 | 6,639 | |||||||||
| Proceeds from sales of securities available for sale |
3,645 | 2,724 | 5,077 | |||||||||
| Purchases of other investment securities |
(1 | ) | (1 | ) | (33 | ) | ||||||
| Proceeds from sales of other investment securities |
127 | 204 | 93 | |||||||||
| Purchases of securities held to maturity |
(224 | ) | — | — | ||||||||
| Proceeds from maturities and paydowns of securities held to maturity |
22 | — | — | |||||||||
| Net decrease (increase) in interest-bearing deposits in banks |
993 | (995 | ) | (68 | ) | |||||||
| Net decrease in cash collateral |
— | — | 1,485 | |||||||||
| Net increase in loans and leases |
(341 | ) | (1,432 | ) | (1,072 | ) | ||||||
| Net increase in bank-owned life insurance |
(40 | ) | (42 | ) | (43 | ) | ||||||
| Net cash payments for divestiture activities |
— | (309 | ) | — | ||||||||
| Premises and equipment: |
||||||||||||
| Purchases |
(160 | ) | (178 | ) | (106 | ) | ||||||
| Proceeds from sales |
25 | 6 | 5 | |||||||||
| Purchases of software |
(208 | ) | (193 | ) | (262 | ) | ||||||
|
|
|
|
|
|
|
|||||||
| Net cash (used in) provided by investing activities |
(2,453 | ) | 919 | (2,034 | ) | |||||||
|
|
|
|
|
|
|
|||||||
| FINANCING ACTIVITIES |
||||||||||||
| Net (decrease) increase in deposits |
(2,968 | ) | 2,584 | 733 | ||||||||
| Net increase (decrease) in federal funds purchased and securities sold under agreements to repurchase |
1,190 | (551 | ) | (960 | ) | |||||||
| Net increase (decrease) in other short-term borrowed funds |
1,750 | (2,599 | ) | 1,662 | ||||||||
| Proceeds from long-term borrowed funds (related party balance of $1,000 in 2013) |
1,002 | 337 | 9 | |||||||||
| Repayments of long-term borrowed funds (related party balances of $280, $216 and $0, respectively) |
(291 | ) | (2,885 | ) | (3,113 | ) | ||||||
| Dividends declared and paid to parent |
(1,185 | ) | (150 | ) | — | |||||||
|
|
|
|
|
|
|
|||||||
| Net cash used in financing activities |
(502 | ) | (3,264 | ) | (1,669 | ) | ||||||
|
|
|
|
|
|
|
|||||||
| Decrease in cash and cash equivalents |
(306 | ) | (631 | ) | (1,224 | ) | ||||||
| Cash and cash equivalents at beginning of year |
3,063 | 3,694 | 4,918 | |||||||||
|
|
|
|
|
|
|
|||||||
| Cash and cash equivalents at end of year |
$ | 2,757 | $ | 3,063 | $ | 3,694 | ||||||
|
|
|
|
|
|
|
|||||||
The accompanying Notes to Consolidated Financial Statements are an integral part of these statements.
F-9
Table of Contents
CITIZENS FINANCIAL GROUP, INC.
NOTES TO CONSOLIDATED FINANCIAL STATEMENTS
NOTE 1—SIGNIFICANT ACCOUNTING POLICIES
The accounting and reporting policies of Citizens Financial Group, Inc. (formerly RBS Citizens Financial Group, Inc., effective April 16, 2014) conform to GAAP. The Company is a wholly-owned subsidiary of The Royal Bank of Scotland plc, a banking subsidiary of the ultimate parent, The Royal Bank of Scotland Group plc. On December 1, 2008, the UK Government became the ultimate controlling party of RBSG. The UK Government’s shareholding is managed by UK Financial Investments Limited, a company wholly owned by the UK Government. The Company’s principal business activity is banking, conducted through its subsidiaries Citizens Bank, N.A. (formerly RBS Citizens, N.A., effective April 16, 2014) and Citizens Bank of Pennsylvania.
Following is a summary of the significant accounting policies of the Company:
Basis of Presentation
The Consolidated Financial Statements include the accounts of the Company. All intercompany transactions and balances have been eliminated. The Company has evaluated its unconsolidated entities and does not believe that any entity in which it has an interest, but does not currently consolidate, meets the requirements for a variable interest entity to be consolidated.
The preparation of financial statements in conformity with GAAP requires management to make estimates and assumptions that affect the reported amounts of assets and liabilities at the date of the financial statements and the reported amounts of revenues and expenses during the reporting period. Actual results could differ from those estimates. Material estimates that are particularly susceptible to significant change in the near term relate to the determination of the provision for credit losses, evaluation and measurement of impairment of goodwill, evaluation of unrealized losses on securities for other-than-temporary impairment, accounting for income taxes, the valuation of AFS and HTM securities, and derivatives.
Cash and Cash Equivalents
For the purposes of reporting cash flows, cash and cash equivalents have original maturities of three months or less and include cash and due from banks and interest-bearing cash and due from banks, primarily at the FRB.
Interest-Bearing Deposits in Banks
Interest-bearing deposits in banks are carried at cost and include deposits that mature within one year.
Securities
Investments in debt and equity securities are carried in four portfolios: AFS, HTM, trading account assets and other investment securities. Management determines the appropriate classification at the time of purchase.
Securities in the AFS portfolio will be held for indefinite periods of time and may be sold in response to changes in interest rates, changes in prepayment risk, or other factors in managing the Company’s asset / liability strategy. Gains and losses on the sales of securities are recognized in earnings and are computed using the specific identification method. Security impairments (i.e., declines in the fair value of securities below cost) that are considered by management to be other-
F-10
Table of Contents
CITIZENS FINANCIAL GROUP, INC.
NOTES TO CONSOLIDATED FINANCIAL STATEMENTS
than-temporary are recognized in earnings as realized losses. However, the determination of the impairment amount is dependent on the Company’s intent to sell (or not sell) the security. If the Company intends to sell the impaired security, the impairment loss recognized in current period earnings equals the difference between the instrument’s fair value and amortized cost. If the Company does not intend to sell the impaired security, and it is not likely that the Company will be required to sell the impaired security, the credit-related impairment loss is recognized in current period earnings and equals the difference between the amortized cost of the security and the present value of the expected cash flows that have currently been projected.
Securities AFS are carried at fair value, with unrealized gains and losses reported in OCI as a separate component of stockholders’ equity, net of taxes. Premiums and discounts on debt securities are amortized or accreted using a level-yield method over the estimated lives of the individual securities. The Company uses actual prepayment experience and estimates of future prepayments to determine the constant effective yield necessary to apply the interest method of income recognition. Estimates of future prepayments are based on the underlying collateral characteristics of each security and are derived from market sources. Judgment is involved in making determinations about prepayment expectations and in changing those expectations in response to changes in interest rates and macroeconomic conditions. The amortization of premiums and discounts associated with mortgage-backed securities may be significantly impacted by changes in prepayment assumptions.
Securities are classified as HTM because the Company has the ability and intent to hold the securities to maturity. Transfers of debt securities into the HTM category from the AFS category are made at fair value at the date of transfer. The unrealized holding gain or loss at the date of transfer is retained in OCI and in the carrying value of the HTM securities. Such amounts are amortized over the remaining life of the security. The securities are reported at cost and adjusted for amortization of premium and accretion of discount. Interest income is recorded on the accrual basis adjusted for the amortization of premium and the accretion of discount.
Trading account assets are comprised of debt and equity securities that are bought and held principally for the purpose of selling them in the near term are classified as trading account assets, and are carried at fair value. Realized and unrealized gains and losses on such assets are reported in noninterest income in the Consolidated Statements of Operations. Trading account assets are reported in other assets in the Consolidated Balance Sheets.
Other investment securities are comprised mainly of FHLB stock and FRB stock, which are carried at cost; and venture capital investments, which are carried at fair value, with changes in fair value recognized in noninterest income. For securities that are not publicly traded, estimates of fair value are made based upon review of the investee’s financial results, condition and prospects. Other investment securities, which are carried at cost, are reviewed at least annually for impairment, with valuation adjustments recognized in noninterest income.
Loans and Leases
Loans are reported at the amount of their outstanding principal, net of charge-offs, unearned income, deferred loan origination fees and costs, and unamortized premiums or discounts (on purchased loans). Deferred loan origination fees and costs and purchase discounts and premiums are amortized as an adjustment of yield over the life of the loan, using the level-yield interest method. Unamortized amounts remaining upon prepayment or sale are recorded as interest income or gain (loss) on sale, respectively. Credit card receivables include billed and uncollected interest and fees.
F-11
Table of Contents
CITIZENS FINANCIAL GROUP, INC.
NOTES TO CONSOLIDATED FINANCIAL STATEMENTS
Leases are classified at the inception of the lease. Lease receivables, including leveraged leases, are reported at the aggregate of lease payments receivable and estimated residual values, net of unearned and deferred income, including unamortized investment credits. Lease residual values are reviewed at least annually for other-than-temporary impairment, with valuation adjustments recognized currently against noninterest income. Leveraged leases are reported net of non-recourse debt. Unearned income is recognized to yield a level rate of return on the net investment in the leases.
Loans and leases are disclosed in portfolio segments and classes. The Company’s loan and lease portfolio segments are commercial and retail. The classes of loans and leases are: commercial, commercial real estate, leases, residential (includes residential mortgages and home equity loans and lines of credit), home equity products serviced by others (includes certain purchased home equity loans and lines of credit), other secured retail (includes automobile loans and other installment loans), and unsecured retail (includes student loans and credit card).
Loans held for sale are carried at the lower of cost or fair value. Loans accounted for under the fair value option are carried at fair value.
Allowance for Credit Losses
Management’s estimate of probable losses in the Company’s loan and lease portfolios is recorded in the ALLL and the reserve for unfunded lending commitments. The Company evaluates the adequacy of the ALLL by performing reviews of certain individual loans and leases, analyzing changes in the composition, size and delinquency of the portfolio, reviewing previous loss experience, and considering current and anticipated economic factors. The ALLL is established in accordance with the Company’s credit reserve policies, as approved by the Audit Committee of the Board of Directors. The Chief Financial Officer and Chief Risk Officer review the adequacy of the ALLL each quarter, together with risk management. The ALLL is maintained at a level that management considers to be adequate based on the results of this evaluation, and is established through charges to earnings in the form of a provision for credit losses. Amounts determined to be uncollectible are deducted from the allowance and subsequent recoveries, if any, are added to the allowance. While management uses available information to estimate loan and lease losses, future additions to the allowance may be necessary based on changes in economic conditions. In addition, various regulatory agencies, as an integral part of their examination process, periodically review the Company’s allowance for credit losses.
For non-impaired commercial and commercial real estate loans, the Company estimates the appropriate level of the ALLL by applying expected loss rates to existing loans with similar risk characteristics. Probable losses for commercial and commercial real estate loans are determined using a model that utilizes the probability of default, loss given default, and exposure at default on an individual loan basis. These factors consider the internal risk rating, loan tenor, and weighted-average life.
For non-impaired retail loans, the ALLL is based upon the appropriate selection of either (a) losses estimated using delinquency roll rate models or (b) an expected loss model utilizing the probability of default, loss given default, and exposure at default on an individual loan basis. When developing these factors, the Company may consider the loan product and collateral type, LTV ratio, lien position, borrower’s credit, time outstanding, geographic location, delinquency status, and loss emergence period. Certain retail portfolios, including SBO home equity loans, student loans, and commercial credit card receivables utilize roll rate models exclusively to estimate the ALLL. Selection of the appropriate use of delinquency roll rate or expected loss models by product is determined quarterly.
F-12
Table of Contents
CITIZENS FINANCIAL GROUP, INC.
NOTES TO CONSOLIDATED FINANCIAL STATEMENTS
For nonaccruing commercial and commercial real estate loans with an outstanding balance of $3 million or greater and for all commercial and commercial real estate TDRs (regardless of size), the Company conducts further analysis to determine the probable amount of loss and establishes a specific allowance for the loan, if appropriate. The Company estimates the impairment amount by comparing the loan’s carrying amount to the estimated present value of its future cash flows, the fair value of its underlying collateral, or the loan’s observable market price. For collateral-dependent impaired commercial and commercial real estate loans, the excess of the Company’s recorded investment in the loan over the fair value of the collateral, less cost to sell, is charged off to the ALLL.
For retail TDRs that are not collateral-dependent, allowances are developed using the present value of expected future cash flows, compared to the recorded investment in the loans. Expected re-default factors are considered in this analysis. Retail TDRs that are deemed collateral-dependent are written down to fair market value less cost to sell. The fair value of collateral is periodically monitored subsequent to the modification.
The ALLL may be adjusted to reflect the Company’s current assessment of various qualitative risks, factors and events that may not be measured in the statistical analysis. Such factors include trends in economic conditions, loan growth, back testing results, base versus stress losses, credit underwriting policy exceptions, regulatory and audit findings, and peer comparisons.
In addition to the ALLL, the Company also estimates probable credit losses associated with off balance sheet financial instruments such as standby letters of credit, financial guarantees and binding unfunded loan commitments. Off balance sheet financial instruments are subject to individual reviews and are analyzed and segregated by risk according to the Company’s internal risk rating scale. These risk classifications, in conjunction with historical loss experience, economic conditions and performance trends within specific portfolio segments, result in the estimate of the reserve for unfunded lending commitments.
The ALLL and the reserve for unfunded lending commitments are reported on the Consolidated Balance Sheets in the ALLL and in other liabilities, respectively. Provision for credit losses related to the loans and leases portfolio and the unfunded lending commitments are reported in the Consolidated Statements of Operations as provision for credit losses.
Commercial loans and leases are charged off to the allowance when there is little prospect of collecting either principal or interest. Charge-offs of commercial loans and leases usually involve receipt of borrower-specific adverse information. For commercial collateral-dependent loans, an appraisal or other valuation is used to quantify a shortfall between the fair value of the collateral less costs to sell and the recorded investment in the commercial loan. Retail loan charge-offs are generally based on established delinquency thresholds rather than borrower-specific adverse information. When a loan is collateral-dependent, any shortfalls between the fair value of the collateral less costs to sell and the recorded investment is promptly charged off. Placing any loan or lease on nonaccrual status does not by itself require a partial or total charge-off; however, any identified losses are charged off at that time.
Nonperforming Loans and Leases
Commercial loans, commercial real estate loans, and leases are generally placed on nonaccrual status when contractually past due 90 days or more, or earlier if management believes that the probability of collection is insufficient to warrant further accrual. Some of these loans and leases may
F-13
Table of Contents
CITIZENS FINANCIAL GROUP, INC.
NOTES TO CONSOLIDATED FINANCIAL STATEMENTS
remain on accrual status when contractually past due 90 days or more if management considers the loan collectible. A loan may be returned to accrual status if (1) principal and interest payments have been brought current, and the Company expects repayment of the remaining contractual principal and interest, (2) the loan or lease has otherwise become well-secured and in the process of collection, or (3) the borrower has been making regularly scheduled payments in full for the prior six months and it’s reasonably assured that the loan or lease will be brought fully current within a reasonable period. Cash receipts on nonaccruing loans and leases are generally applied to reduce the unpaid principal balance.
Residential mortgages are generally placed on nonaccrual status when past due 120 days, or sooner if determined to be collateral-dependent. Residential mortgages are returned to accrual status when principal and interest payments become less than 120 days past due and when future payments are reasonably assured. Credit card balances (included in the “unsecured” retail class of loans) are placed on nonaccrual status when past due 90 days or more. Credit card balances are restored to accruing status if they subsequently become less than 90 days past due. Guaranteed student loans (included in the “unsecured” class of loans) are not placed on nonaccrual status.
All other retail loans are generally placed on nonaccrual status when past due 90 days or more, or earlier if management believes that the probability of collection is insufficient to warrant further accrual. Loans less than 90 days past due may be placed on nonaccrual status upon the death of the borrower, surrender or repossession of collateral, fraud or bankruptcy. Loans are generally returned to accrual status if the loan becomes less than 15 days past due. Cash receipts on nonaccruing loans and leases are generally applied to reduce the unpaid principal balance. Certain TDRs that are current in payment status are classified as nonaccrual in accordance with regulatory guidance. Income on these loans is generally recognized on a cash basis if management believes that the remaining book value of the loan is realizable. Nonaccruing TDRs that meet the guidelines above for accrual status can be returned to accruing if supported by a well documented evaluation of the borrowers’ financial condition, and if they have been current for at least 6 months.
Impaired Loans
A loan is considered to be impaired when it is probable that the Company will be unable to collect all of the contractual interest and principal payments as scheduled in the loan agreement. Impaired loans include nonaccruing larger balance (greater than $3 million carrying value), non-homogenous commercial and commercial real estate loans, and restructured loans that are deemed TDRs. A loan modification is identified as a TDR when the Company, or bankruptcy court, grants the borrower a concession the Company would not otherwise make in response to the borrower’s financial difficulties. Concessions granted in TDRs for all classes of loans may include lowering the interest rate, forgiving a portion of principal, extending the loan term, lowering scheduled payments for a specified period of time, principal forbearance, or capitalizing past due amounts. A rate increase can be a concession if the increased rate is lower than a market rate for debt with risk similar to that of the restructured loan. Additionally, TDRs for commercial loans may also involve creating a multiple note structure, accepting non-cash assets, accepting an equity interest, or receiving a performance-based fee. In some cases a TDR may involve multiple concessions. The financial effects of TDRs for all loan classes may include lower income (either due to a lower interest rate or a delay in the timing of cash flows), larger loan loss provisions, and accelerated charge-offs if the modification renders the loan collateral-dependent. In some cases interest income throughout the term of the loan may increase if, for example, the loan is extended or the interest rate is increased as a result of the restructuring. Loans are classified as TDRs until paid off, sold, or refinanced at market terms.
F-14
Table of Contents
CITIZENS FINANCIAL GROUP, INC.
NOTES TO CONSOLIDATED FINANCIAL STATEMENTS
Impairment evaluations are performed at the individual loan level, and consider expected future cash flows from the loan, including, if appropriate, the realizable value of collateral. Impaired loans which are not TDRs are nonaccruing, and loans involved in TDRs may be accruing or nonaccruing. Retail loans that were discharged in bankruptcy and not reaffirmed by the customer are deemed to be collateral-dependent TDRs and are charged off to the fair value of the collateral, less cost to sell, and less amounts recoverable under a government guarantee (if any). Cash receipts on nonaccruing impaired loans, including nonaccruing loans involved in TDRs, are generally applied to reduce the unpaid principal balance. Certain TDRs that are current in payment status are classified as nonaccrual in accordance with regulatory guidance. Income on the loans is generally recognized on a cash basis if management believes that the remaining book value of the loan is realizable.
Loans are generally restored to accrual status when principal and interest payments are brought current and when future payments are reasonably assured, following a sustained period of repayment performance by the borrower in accordance with the loan’s contractual terms.
Premises and Equipment
Premises and equipment are stated at cost, less accumulated depreciation and amortization. Depreciation and amortization have been computed using the straight-line method over the estimated useful lives of the assets. Leasehold improvements are amortized over the life of the lease (including renewal options if exercise of those options is reasonably assured) or their estimated useful life, whichever is shorter.
Additions to property, plant and equipment are recorded at cost. The cost of major additions, improvements and betterments is capitalized. Normal repairs and maintenance and other costs that do not improve the property, extend the useful life or otherwise do not meet capitalization criteria are charged to expense as incurred. The Company evaluates premises and equipment for impairment when events or changes in circumstances indicate that the carrying value of such assets may not be recoverable.
Software
Costs related to computer software, developed or obtained for internal use, are capitalized if the projects improve functionality and provide long-term future operational benefits. Capitalized costs are amortized using the straight-line method over the asset’s expected useful life and is based upon the basic pattern of consumption and economic benefits provided by the asset. The Company begins to amortize the software when the asset (or identifiable component of the asset) is substantially complete and ready for its intended use. All other costs incurred in connection with an internal-use software project are expensed as incurred. Capitalized software is included in other assets on the Consolidated Balance Sheets.
Fair Value
The Company measures fair value using the price that would be received to sell an asset or paid to transfer a liability in an orderly transaction between market participants at the measurement date. Fair value is based upon quoted market prices in an active market, where available. If quoted prices are not available, observable market-based inputs or independently sourced parameters are used to develop fair value, whenever possible. Such inputs may include prices of similar assets or liabilities, yield curves, interest rates, prepayment speeds, and foreign exchange rates.
F-15
Table of Contents
CITIZENS FINANCIAL GROUP, INC.
NOTES TO CONSOLIDATED FINANCIAL STATEMENTS
A portion of the Company’s assets and liabilities is carried at fair value, including AFS securities, private equity investments, and derivative instruments. In addition, the Company elects to account for its residential mortgages held for sale at fair value. The Company classifies its assets and liabilities that are carried at fair value in accordance with the three-level valuation hierarchy:
| • | Level 1. Quoted prices (unadjusted) in active markets for identical assets or liabilities. |
| • | Level 2. Observable inputs other than Level 1 prices, such as quoted prices for similar instruments; quoted prices in markets that are not active; or other inputs that are observable or can be corroborated by market data for substantially the full term of the asset or liability. |
| • | Level 3. Unobservable inputs that are supported by little or no market information and that are significant to the fair value measurement. |
Classification in the hierarchy is based upon the lowest level input that is significant to the fair value measurement of the asset or liability. For instruments classified in Level 1 and 2 where inputs are primarily based upon observable market data, there is less judgment applied in arriving at the fair value. For instruments classified in Level 3, management judgment is more significant due to the lack of observable market data.
The Company reviews and updates the fair value hierarchy classifications on a quarterly basis. Changes from one quarter to the next related to the observability of inputs in fair value measurements may result in a reclassification between the fair value hierarchy levels and are recognized based on period-end balances.
Fair value is also used on a nonrecurring basis to evaluate certain assets for impairment or for disclosure purposes. Examples of nonrecurring uses of fair value include MSRs accounted for by the amortization method, loan impairments for certain loans, and goodwill.
Goodwill
Goodwill is the purchase premium associated with the acquisition of a business. It is assigned to reporting units at the date the goodwill is initially recorded. A reporting unit is a business operating segment or a component of a business operating segment. Once goodwill has been assigned to reporting units, it no longer retains its association with a particular acquisition, and all of the activities within a reporting unit, whether acquired or organically grown, are available to support the value of the goodwill.
Goodwill is not amortized, but is subject to annual impairment tests. The goodwill impairment analysis is a two-step test. The first step, used to identify potential impairment, involves comparing each reporting unit’s fair value to its carrying value, including goodwill. If the fair value of a reporting unit exceeds its carrying value, applicable goodwill is deemed to be not impaired. If the carrying value exceeds fair value, there is an indication of impairment and the second step is performed to measure the amount of impairment.
The second step involves calculating an implied fair value of goodwill for each reporting unit for which the first step indicated impairment. The implied fair value of goodwill is determined in the same manner as the amount of goodwill recognized in a business combination, which is the excess of the fair value of the reporting unit, as determined in the first step, over the aggregate fair values of the individual assets, liabilities and identifiable intangible assets as if the reporting unit were being acquired in a business combination. If the implied fair value of goodwill exceeds the carrying value of goodwill
F-16
Table of Contents
CITIZENS FINANCIAL GROUP, INC.
NOTES TO CONSOLIDATED FINANCIAL STATEMENTS
assigned to the reporting unit, there is no impairment. If the carrying value of goodwill assigned to a reporting unit exceeds the implied fair value of the goodwill, an impairment charge is recorded for the excess. An impairment loss that is recognized cannot exceed the amount of goodwill assigned to a reporting unit, and the loss establishes a new basis in the goodwill. Subsequent reversal of goodwill impairment losses is not permitted.
In September 2013, the Company changed its annual goodwill impairment test date from September 30 to October 31. The Company reviews goodwill for impairment annually as of October 31, or more often if events or circumstances indicate that it is more likely than not that the fair value of one or more reporting units is below its carrying value. The fair values of the Company’s reporting units are determined using a combination of income and market-based approaches. The Company relies on the income approach (discounted cash flow method) for determining fair value. Market and transaction approaches are used as benchmarks only to corroborate the value determined by the discounted cash flow method. The Company relies on several assumptions when estimating the fair value of its reporting units using the discounted cash flow method. These assumptions include the current discount rate, as well as projected loan loss, income tax and capital retention rates.
Discount rates are estimated based on the Capital Asset Pricing Model, which considers the risk-free interest rate, market risk premium, beta, and unsystematic risk and size premium adjustments specific to a particular reporting unit. The discount rates are also calibrated on the assessment of the risks related to the projected cash flows of each reporting unit. Cash flow projections include estimates for projected loan loss, income tax and capital retention rates. Multi-year financial forecasts are developed for each reporting unit by considering several key business drivers such as new business initiatives, customer retention standards, market share changes, anticipated loan and deposit growth, forward interest rates, historical performance, and industry and economic trends, among other considerations. The long-term growth rate used in determining the terminal value of each reporting unit was estimated based on management’s assessment of the minimum expected terminal growth rate of each reporting unit, as well as broader economic considerations such as GDP and inflation.
The Company based its fair value estimates on assumptions it believes to be representative of assumptions that a market participant would use in valuing the reporting unit but that are unpredictable and inherently uncertain, including estimates of future growth rates and operating margins and assumptions about the overall economic climate and the competitive environment for its reporting units. There can be no assurances that future estimates and assumptions made for purposes of goodwill testing will prove accurate predictions of the future. If the assumptions regarding business plans, competitive environments or anticipated growth rates are not achieved, the Company may be required to record goodwill impairment charges in future periods.
Bank-Owned Life Insurance
Bank-owned life insurance is stated at its cash surrender value. The Company is the beneficiary of life insurance policies on current and former officers and selected employees of the Company.
Employee Benefits
Pension costs under defined benefit plans are actuarially computed and include current service costs and amortization of prior service costs over the participants’ average future working lifetime. The actuarial cost method used in determining the net periodic pension cost is the projected unit credit
F-17
Table of Contents
CITIZENS FINANCIAL GROUP, INC.
NOTES TO CONSOLIDATED FINANCIAL STATEMENTS
method. The cost of postretirement and postemployment benefits other than pensions is recognized on an accrual basis during the periods employees provide services to earn those benefits.
Derivatives
The Company is party to a variety of derivative transactions, including interest rate swap contracts, interest rate options, foreign exchange contracts, residential loan commitment rate locks, forward sale contracts, warrants and purchase options. The Company enters into contracts in order to meet the financing needs of its customers. The Company also enters into contracts as a means of reducing its interest rate and foreign currency risks, and these contracts are designated as hedges when acquired, based on management’s intent. The Company monitors the results of each transaction to ensure that management’s intent is satisfied.
All derivatives, whether designated for hedging relationships or not, are recognized in the Consolidated Balance Sheets at fair value. If a derivative is designated as a cash flow hedge, the effective portions of changes in the fair value of the derivative are recorded in AOCI, a component of stockholders’ equity. The ineffective portions of cash flow hedges are immediately recognized as an adjustment to income or expense. For cash flow hedging relationships that have been discontinued, balances in OCI are reclassified to interest expense in the periods during which the hedged item affects income. If it is probable that the hedged forecasted transaction will not occur, balances in OCI are reclassified immediately to income. Changes in the fair value of derivatives that do not qualify as hedges are recognized immediately in earnings.
Derivative assets and derivative liabilities governed by master netting agreements are netted by the counterparty on the balance sheet, and this netted derivative asset or liability position is also netted against the fair value of any cash collateral that has been pledged or received in accordance with a CSA.
Transfers and Servicing of Financial Assets
A transfer of financial assets is accounted for as a sale when control over the assets transferred is surrendered. Assets transferred that satisfy the conditions of a sale are derecognized, and all assets obtained and liabilities incurred in a purchase are recognized and measured at fair value. Servicing rights retained in the transfer of financial assets are initially recognized at fair value. Subsequent to the initial recognition date, the Company recognizes periodic amortization expense of servicing rights and assesses servicing rights for impairment.
Mortgage Banking
Mortgage loans held for sale are accounted for at fair value on an individual loan basis. Changes in the fair value, and realized gains and losses on the sales of mortgage loans, are reported in mortgage banking income.
The fair value of MSRs is determined based on expected future cash flows discounted at an interest rate commensurate with the servicing risks involved. MSRs are presented in the Consolidated Balance Sheets net of accumulated amortization, which is recorded in proportion to, and over the period of, net servicing income. The Company’s identification of MSRs in a single class was determined based on the availability of market inputs and the Company’s method of managing MSR risks. For the purpose of evaluating impairment, MSRs are stratified based on predominant risk
F-18
Table of Contents
CITIZENS FINANCIAL GROUP, INC.
NOTES TO CONSOLIDATED FINANCIAL STATEMENTS
characteristics (such as interest rate, loan size, origination date, term, or geographic location) of the underlying loans. An allowance is then established in the event the recorded value of an individual stratum exceeds fair value.
The Company determines the fair value of MSRs using a model that calculates the present value of estimated net future servicing income. The model utilizes assumptions that market participants use in estimating future net servicing income, including estimates of prepayment speeds, default rates, cost to service, discount rate, escrow earnings, contractual servicing fee income, and ancillary income. The discount rate is the required rate of return investors in the market would expect for an asset of similar risk.
The Company accounts for derivatives in its mortgage banking operations at fair value on the balance sheet as derivative assets or derivative liabilities, depending on whether the derivative had a positive (asset) or negative (liability) fair value as of the balance sheet date. The Company’s mortgage banking derivatives include commitments to originate mortgages held for sale, certain loan sale agreements, and other financial instruments that meet the definition of a derivative.
Income Taxes
The Company uses an asset and liability (balance sheet) approach for financial accounting and reporting of income taxes. This results in two components of income tax expense: current and deferred. Current income tax expense approximates taxes to be paid or refunded for the current period. Deferred income tax expense results from changes in deferred tax assets and liabilities between periods. These gross deferred tax assets and liabilities represent decreases or increases in taxes expected to be paid in the future because of future reversals of temporary differences in the bases of assets and liabilities, as measured by tax laws, and their bases, as reported in the Consolidated Financial Statements.
Deferred tax assets are recognized for net operating loss carryforwards and tax credit carryforwards. Valuation allowances are recorded as necessary to reduce deferred tax assets to the amounts that management concludes are more likely than not to be realized.
The Company also assesses the probability that the positions taken, or expected to be taken, in its income tax returns will be sustained by taxing authorities. A “more likely than not” (more than 50 percent) recognition threshold must be met before a tax benefit can be recognized. Tax positions that are more likely than not to be sustained are reflected in the Company’s Consolidated Financial Statements.
Tax positions are measured as the largest amount of tax benefit that is greater than 50 percent likely of being realized upon settlement with a taxing authority that has full knowledge of all relevant information. The difference between the benefit recognized for a position and the tax benefit claimed on a tax return is referred to as an unrecognized tax benefit.
Revenue Recognition
Revenue is recognized to the extent that it is probable that the economic benefits will flow to the Company and the revenue can be reliably measured.
F-19
Table of Contents
CITIZENS FINANCIAL GROUP, INC.
NOTES TO CONSOLIDATED FINANCIAL STATEMENTS
Interest income on loans and securities classified as AFS or HTM is determined using the effective interest method. This method calculates periodic interest income at a constant effective yield on the net investment in the loan or security, to provide a constant rate of return over the terms of the financial assets. Securities classified as trading account assets, and other financial assets accounted for using the fair value option, are measured at fair value with corresponding changes recognized in noninterest income.
Loan commitment fees for loans that are likely to be drawn down, and other credit related fees, are deferred (together with any incremental costs) and recognized as an adjustment to the effective interest rate on the loan. When it is unlikely that a loan will be drawn down, the loan commitment fees are recognized over the commitment period on a straight-line basis.
Other types of noninterest revenues, such as service charges on deposits, interchange income on credit cards and trust revenues, are accrued and recognized into income as services are provided and the amount of fees earned are reasonably determinable.
Earnings Per Share
Basic EPS is computed by dividing net income / (loss) available to common shareholders by the weighted-average number of common shares outstanding during each period. Net income / (loss) available to common shareholders represents net income after preferred stock dividends, accretion of the discount on preferred stock issuances, gains or losses from any repurchases of preferred stock, and dividends. Diluted EPS is computed by dividing net income / (loss) available to common shareholders by the weighted-average number of common shares outstanding during each period, plus potential dilutive shares such as call options, share-based payment awards, and warrants using the treasury method.
New Accounting Pronouncements
In January 2014, the FASB issued Accounting Standards Update No. 2014-04, “Reclassification of Residential Real Estate Collateralized Consumer Mortgage Loans upon Foreclosure.” This amendment clarifies that an in-substance repossession or foreclosure occurs, and a creditor is considered to have received physical possession of residential real estate property collateralizing a consumer mortgage loan, upon either (1) the creditor obtaining legal title to the residential real estate property upon completion of a foreclosure or (2) the borrower conveying all interest in the residential real estate property to the creditor to satisfy that loan through completion of a deed in lieu of foreclosure or through a similar legal agreement. The amendment require disclosure of both (1) the amount of foreclosed residential real estate property held by the creditor and (2) the recorded investment in consumer mortgage loans collateralized by residential real estate property that are in the process of foreclosure according to local requirements of the applicable jurisdiction. This amendment is effective for annual periods, and interim periods within those annual periods, beginning after December 15, 2014, and is expected to have an immaterial impact on the Company’s Consolidated Financial Statements.
Also in January 2014, the FASB issued Accounting Standards Update No. 2014-01, “Accounting for Investments in Qualified Affordable Housing Projects.” This amendment permits reporting entities to make an accounting policy election to account for their investments in qualified affordable housing projects using the proportional amortization method if certain conditions are met. Under the proportional amortization method, an entity amortizes the initial cost of the investment in proportion to
F-20
Table of Contents
CITIZENS FINANCIAL GROUP, INC.
NOTES TO CONSOLIDATED FINANCIAL STATEMENTS
the tax credits and other tax benefits received and recognizes the net investment performance in the income statement as a component of income tax expense (benefit). Qualified affordable housing project investments that are not accounted for using the proportional amortization method must be accounted for as an equity method or cost method investment. This amendment is effective for annual periods and interim reporting periods within those annual periods, beginning after December 15, 2014, and is expected to have an immaterial impact on the Company’s Consolidated Financial Statements.
Reclassifications of Prior Year Amounts
Certain reclassifications were made to the prior year Financial Statements to conform to the 2013 presentation. Significant reclassifications are as follows:
| • | The Company reclassified student loans from the secured retail loan class to the other unsecured retail loan class. |
| • | The Company reclassified the 2012 $75 million gain related to the sale of its Visa Inc. Class B shares from Net Gains on Securities Available for Sale to Other Net Gains on the Consolidated Statements of Operations. |
| • | The Company reclassified software amortization from equipment expense to amortization of software on the Consolidated Statements of Operations. The software balance from 2012 was reclassified from Premises and Equipment to Other Assets in the Consolidated Balance Sheets. |
NOTE 2—CASH AND DUE FROM BANKS
The Company’s subsidiary banks maintain certain average reserve balances and compensating balances for check clearing and other services with the FRB. At December 31, 2013 and 2012, the balance of deposits at the FRB amounted to $1.4 billion. Average balances maintained with the FRB during the years ended December 31, 2013, 2012, and 2011 exceeded amounts required by law for the FRB’s requirements. All amounts, both required and excess reserves, held at the FRB currently earn interest at a fixed rate of 25 basis points. As a result, the Company recorded, in interest-bearing deposits in banks, interest income on FRB deposits of $5 million, $3 million, and $5 million in 2013, 2012, and 2011, respectively.
F-21
Table of Contents
CITIZENS FINANCIAL GROUP, INC.
NOTES TO CONSOLIDATED FINANCIAL STATEMENTS
NOTE 3—SECURITIES
The following table provides the major components of securities at amortized cost and fair value:
| December 31, 2013 | December 31, 2012 | |||||||||||||||||||||||||||||||
| Amortized Cost |
Gross Unrealized Gains |
Gross Unrealized Losses |
Fair Value |
Amortized Cost |
Gross Unrealized Gains |
Gross Unrealized Losses |
Fair Value |
|||||||||||||||||||||||||
| (in millions) | ||||||||||||||||||||||||||||||||
| Securities Available for Sale |
||||||||||||||||||||||||||||||||
| U.S. Treasury |
$ | 15 | $ | — | $ | — | $ | 15 | $ | 15 | $ | — | $ | — | $ | 15 | ||||||||||||||||
| State and political subdivisions |
11 | — | (1 | ) | 10 | 20 | 1 | — | 21 | |||||||||||||||||||||||
| Mortgage-backed securities: |
||||||||||||||||||||||||||||||||
| Federal agencies and U.S. government sponsored entities |
14,970 | 151 | (128 | ) | 14,993 | 16,368 | 537 | (1 | ) | 16,904 | ||||||||||||||||||||||
| Other / non-agency |
992 | 5 | (45 | ) | 952 | 1,452 | 13 | (68 | ) | 1,397 | ||||||||||||||||||||||
|
|
|
|
|
|
|
|
|
|
|
|
|
|
|
|
|
|||||||||||||||||
| Total mortgage-backed securities |
15,962 | 156 | (173 | ) | 15,945 | 17,820 | 550 | (69 | ) | 18,301 | ||||||||||||||||||||||
|
|
|
|
|
|
|
|
|
|
|
|
|
|
|
|
|
|||||||||||||||||
| Total debt securities |
15,988 | 156 | (174 | ) | 15,970 | 17,855 | 551 | (69 | ) | 18,337 | ||||||||||||||||||||||
|
|
|
|
|
|
|
|
|
|
|
|
|
|
|
|
|
|||||||||||||||||
| Marketable equity securities |
10 | 3 | — | 13 | 5 | 2 | — | 7 | ||||||||||||||||||||||||
| Other equity securities |
12 | — | — | 12 | 12 | — | — | 12 | ||||||||||||||||||||||||
|
|
|
|
|
|
|
|
|
|
|
|
|
|
|
|
|
|||||||||||||||||
| Total equity securities |
22 | 3 | — | 25 | 17 | 2 | — | 19 | ||||||||||||||||||||||||
|
|
|
|
|
|
|
|
|
|
|
|
|
|
|
|
|
|||||||||||||||||
| Total securities available for sale |
$ | 16,010 | $ | 159 | $ | (174 | ) | $ | 15,995 | $ | 17,872 | $ | 553 | $ | (69 | ) | $ | 18,356 | ||||||||||||||
|
|
|
|
|
|
|
|
|
|
|
|
|
|
|
|
|
|||||||||||||||||
| Securities Held to Maturity |
||||||||||||||||||||||||||||||||
| Mortgage-backed securities: |
||||||||||||||||||||||||||||||||
| Federal agencies and U.S. government sponsored entities |
$ | 2,940 | $ | — | $ | (33 | ) | $ | 2,907 | $ | — | $ | — | $ | — | $ | — | |||||||||||||||
| Other / non-agency |
1,375 | — | (25 | ) | 1,350 | — | — | — | — | |||||||||||||||||||||||
|
|
|
|
|
|
|
|
|
|
|
|
|
|
|
|
|
|||||||||||||||||
| Total securities held to maturity |
$ | 4,315 | $ | — | $ | (58 | ) | $ | 4,257 | $ | — | $ | — | $ | — | $ | — | |||||||||||||||
|
|
|
|
|
|
|
|
|
|
|
|
|
|
|
|
|
|||||||||||||||||
| Other Investment Securities |
||||||||||||||||||||||||||||||||
| Federal Reserve Bank stock |
$ | 462 | $ | — | $ | — | $ | 462 | $ | 490 | $ | — | $ | — | $ | 490 | ||||||||||||||||
| Federal Home Loan Bank stock |
468 | — | — | 468 | 565 | — | — | 565 | ||||||||||||||||||||||||
| Venture capital and other investments |
5 | — | — | 5 | 6 | — | — | 6 | ||||||||||||||||||||||||
|
|
|
|
|
|
|
|
|
|
|
|
|
|
|
|
|
|||||||||||||||||
| Total other investment securities |
$ | 935 | $ | — | $ | — | $ | 935 | $ | 1,061 | $ | — | $ | — | $ | 1,061 | ||||||||||||||||
|
|
|
|
|
|
|
|
|
|
|
|
|
|
|
|
|
|||||||||||||||||
During 2013, to reduce the growing potential negative impact of AFS securities market volatility on tangible common equity, the Company transferred a total of $4.2 billion, consisting of federal agency and other non-agency MBS from the AFS securities portfolio to establish the HTM securities portfolio. At the time of transfer, $134 million of unrealized net losses were recognized in OCI. The amounts in OCI will be recognized in interest income over the remaining life of the securities as an offset to the adjustment of yield in a manner consistent with the amortization of premium and the accretion of discount, resulting in no impact on net income.
F-22
Table of Contents
CITIZENS FINANCIAL GROUP, INC.
NOTES TO CONSOLIDATED FINANCIAL STATEMENTS
The Company has reviewed its securities portfolio for other-than-temporary impairments. The following tables summarize those securities whose fair values are below carrying values, segregated by those that have been in a continuous unrealized loss position for less than twelve months, and those that have been in a continuous unrealized loss position for twelve months or longer:
| December 31, 2013 | ||||||||||||||||||||||||||||||||||||
| Less than 12 Months | 12 Months or Longer | Total | ||||||||||||||||||||||||||||||||||
| Number of Issues |
Fair Value |
Gross Unrealized Losses |
Number of Issues |
Fair Value |
Gross Unrealized Losses |
Number of Issues |
Fair Value |
Gross Unrealized Losses |
||||||||||||||||||||||||||||
| (dollars in millions) | ||||||||||||||||||||||||||||||||||||
| State and political subdivisions |
1 | $ | 10 | $ | (1 | ) | — | $ | — | $ | — | 1 | $ | 10 | $ | (1 | ) | |||||||||||||||||||
| Mortgage-backed securities: |
||||||||||||||||||||||||||||||||||||
| Federal agencies and U.S. government sponsored entities |
263 | 12,067 | (158 | ) | 7 | 20 | (2 | ) | 270 | 12,087 | (160 | ) | ||||||||||||||||||||||||
| Other / non-agency |
22 | 1,452 | (34 | ) | 19 | 490 | (37 | ) | 41 | 1,942 | (71 | ) | ||||||||||||||||||||||||
|
|
|
|
|
|
|
|
|
|
|
|
|
|
|
|
|
|
|
|||||||||||||||||||
| Total mortgage-backed securities |
285 | 13,519 | (192 | ) | 26 | 510 | (39 | ) | 311 | 14,029 | (231 | ) | ||||||||||||||||||||||||
|
|
|
|
|
|
|
|
|
|
|
|
|
|
|
|
|
|
|
|||||||||||||||||||
| Total |
286 | $ | 13,529 | $ | (193 | ) | 26 | $ | 510 | $ | (39 | ) | 312 | $ | 14,039 | $ | (232 | ) | ||||||||||||||||||
|
|
|
|
|
|
|
|
|
|
|
|
|
|
|
|
|
|
|
|||||||||||||||||||
| December 31, 2012 | ||||||||||||||||||||||||||||||||||||
| Less than 12 Months | 12 Months or Longer | Total | ||||||||||||||||||||||||||||||||||
| Number of Issues |
Fair Value |
Gross Unrealized Losses |
Number of Issues |
Fair Value |
Gross Unrealized Losses |
Number of Issues |
Fair Value |
Gross Unrealized Losses |
||||||||||||||||||||||||||||
| (dollars in millions) | ||||||||||||||||||||||||||||||||||||
| Mortgage-backed securities: |
||||||||||||||||||||||||||||||||||||
| Federal agencies and U.S. government sponsored entities |
29 | $ | 139 | $ | (1 | ) | 1 | $ | 3 | $ | — | 30 | $ | 142 | $ | (1 | ) | |||||||||||||||||||
| Other / non-agency |
2 | 53 | (1 | ) | 29 | 854 | (67 | ) | 31 | 907 | (68 | ) | ||||||||||||||||||||||||
|
|
|
|
|
|
|
|
|
|
|
|
|
|
|
|
|
|
|
|||||||||||||||||||
| Total |
31 | $ | 192 | $ | (2 | ) | 30 | $ | 857 | $ | (67 | ) | 61 | $ | 1,049 | $ | (69 | ) | ||||||||||||||||||
|
|
|
|
|
|
|
|
|
|
|
|
|
|
|
|
|
|
|
|||||||||||||||||||
For each debt security identified with an unrealized loss, the Company reviews the expected cash flows to determine if the impairment in value is temporary or other-than-temporary. If the Company has determined that the present value of the debt security’s expected cash flows is less than its amortized cost basis, an other-than-temporary impairment is deemed to have occurred. The amount of impairment loss that is recognized in current period earnings is dependent on the Company’s intent to sell (or not sell) the security.
If the Company intends to sell the impaired security, the impairment loss recognized in current period earnings equals the difference between the instrument’s fair value and its amortized cost. If the Company does not intend to sell the impaired security, and it is not likely that the Company will be required to sell the impaired security, the credit-related impairment loss is recognized in current period earnings and equals the difference between the amortized cost of the security and the present value of the expected cash flows that have currently been projected.
In addition to these cash flow projections, several other characteristics of each security are reviewed when determining whether a credit loss exists and the period over which the debt security is
F-23
Table of Contents
CITIZENS FINANCIAL GROUP, INC.
NOTES TO CONSOLIDATED FINANCIAL STATEMENTS
expected to recover. These characteristics include: (1) the type of investment, (2) various market factors affecting the fair value of the security (e.g., interest rates, spread levels, liquidity in the sector, etc.), (3) the length and severity of impairment, and (4) the public credit rating of the instrument.
The Company estimates the portion of loss attributable to credit using a cash flow model. The inputs to this model include prepayment, default and loss severity assumptions that are based on industry research and observed data. The loss projections generated by the model are reviewed on a quarterly basis by a cross-functional governance committee. This governance committee determines whether security impairments are other-than-temporary based on this review.
The following table presents the cumulative credit related losses recognized in earnings on debt securities held by the Company as of:
| December 31, 2013 |
December 31, 2012 |
December 31, 2011 |
||||||||||
| (in millions) | ||||||||||||
| Cumulative balance through January 1 |
$ | 55 | $ | 38 | $ | 24 | ||||||
| Credit impairments recognized in earnings on securities not previously impaired |
— | 1 | 1 | |||||||||
| Credit impairments recognized in earnings on securities that have been previously impaired |
8 | 23 | 18 | |||||||||
| Reductions due to increases in cash flow expectations on impaired securities |
(7 | ) | (7 | ) | (5 | ) | ||||||
|
|
|
|
|
|
|
|||||||
| Cumulative balance through December 31 |
$ | 56 | $ | 55 | $ | 38 | ||||||
|
|
|
|
|
|
|
|||||||
Cumulative credit losses recognized in earnings for impaired AFS debt securities held as of December 31, 2013, 2012, and 2011 were $56 million, $55 million, and $38 million, respectively. There were no credit losses recognized in earnings for the Company’s HTM portfolio as of December 31, 2013 and 2012. The Company recognized $8 million, $24 million, and $19 million of credit related other-than-temporary impairment losses in earnings for the years ended December 31, 2013, 2012, and 2011, respectively, related to non-agency MBS in the AFS portfolio. No impaired debt securities were sold during 2013, 2012, or 2011. Reductions in credit losses due to increases in cash flow expectations were $7 million for the years ended December 31, 2013 and 2012, and $5 million for the year ended December 31, 2011, and are presented in investment securities interest income on the Consolidated Statements of Operations. The Company does not currently have the intent to sell these securities, and it is not likely that the Company will be required to sell these securities prior to the recovery of their amortized cost bases. As of December 31, 2013, 2012, and 2011, $41 million, $60 million, and $170 million, respectively, of pretax non-credit related losses were deferred in OCI.
The Company has determined that credit losses are not expected to be incurred on the remaining agency and non-agency MBS identified with unrealized losses as of the current reporting date. The unrealized losses on these investment securities reflect the reduced liquidity in the MBS market and the increased risk spreads due to the uncertainty of the U.S. macroeconomic environment. Therefore, the Company has determined that these securities are not other-than-temporarily impaired because the Company does not currently have the intent to sell these securities, and it is not likely that the Company will be required to sell these securities prior to the recovery of their amortized cost bases. Additionally, any subsequent increases in the valuation of impaired securities do not impact their recorded cost bases.
F-24
Table of Contents
CITIZENS FINANCIAL GROUP, INC.
NOTES TO CONSOLIDATED FINANCIAL STATEMENTS
The amortized cost and fair value of debt securities at December 31, 2013 by contractual maturity are shown below. Expected maturities may differ from contractual maturities because borrowers may have the right to call or prepay obligations with or without call or prepayment penalties.
| Distribution of Maturities | ||||||||||||||||||||
| 1 Year or Less |
1-5 Years |
5-10 Years |
After 10 Years |
Total | ||||||||||||||||
| (in millions) | ||||||||||||||||||||
| Amortized Cost: |
||||||||||||||||||||
| Debt securities available for sale |
||||||||||||||||||||
| U.S. Treasury |
$ | 15 | $ | — | $ | — | $ | — | $ | 15 | ||||||||||
| State and political subdivisions |
— | — | — | 11 | 11 | |||||||||||||||
| Mortgage-backed securities: |
||||||||||||||||||||
| Federal agencies and U.S. government sponsored entities |
— | 39 | 2,865 | 12,066 | 14,970 | |||||||||||||||
| Other / non-agency |
— | 43 | 120 | 829 | 992 | |||||||||||||||
|
|
|
|
|
|
|
|
|
|
|
|||||||||||
| Total debt securities available for sale |
15 | 82 | 2,985 | 12,906 | 15,988 | |||||||||||||||
|
|
|
|
|
|
|
|
|
|
|
|||||||||||
| Debt securities held to maturity |
||||||||||||||||||||
| Mortgage-backed securities: |
||||||||||||||||||||
| Federal agencies and U.S. government sponsored entities |
— | — | — | 2,940 | 2,940 | |||||||||||||||
| Other / non-agency |
— | — | — | 1,375 | 1,375 | |||||||||||||||
|
|
|
|
|
|
|
|
|
|
|
|||||||||||
| Total debt securities held to maturity |
— | — | — | 4,315 | 4,315 | |||||||||||||||
|
|
|
|
|
|
|
|
|
|
|
|||||||||||
| Total debt securities |
$ | 15 | $ | 82 | $ | 2,985 | $ | 17,221 | $ | 20,303 | ||||||||||
|
|
|
|
|
|
|
|
|
|
|
|||||||||||
| Fair Value: |
||||||||||||||||||||
| Debt securities available for sale |
||||||||||||||||||||
| U.S. Treasury |
$ | 15 | $ | — | $ | — | $ | — | $ | 15 | ||||||||||
| State and political subdivisions |
— | — | — | 10 | 10 | |||||||||||||||
| Mortgage-backed securities: |
||||||||||||||||||||
| Federal agencies and U.S. government sponsored entities |
— | 41 | 2,853 | 12,099 | 14,993 | |||||||||||||||
| Other / non-agency |
— | 43 | 123 | 786 | 952 | |||||||||||||||
|
|
|
|
|
|
|
|
|
|
|
|||||||||||
| Total debt securities available for sale |
15 | 84 | 2,976 | 12,895 | 15,970 | |||||||||||||||
|
|
|
|
|
|
|
|
|
|
|
|||||||||||
| Debt securities held to maturity |
||||||||||||||||||||
| Mortgage-backed securities: |
||||||||||||||||||||
| Federal agencies and U.S. government sponsored entities |
— | — | — | 2,907 | 2,907 | |||||||||||||||
| Other / non-agency |
— | — | — | 1,350 | 1,350 | |||||||||||||||
|
|
|
|
|
|
|
|
|
|
|
|||||||||||
| Total debt securities held to maturity |
— | — | — | 4,257 | 4,257 | |||||||||||||||
|
|
|
|
|
|
|
|
|
|
|
|||||||||||
| Total debt securities |
$ | 15 | $ | 84 | $ | 2,976 | $ | 17,152 | $ | 20,227 | ||||||||||
|
|
|
|
|
|
|
|
|
|
|
|||||||||||
F-25
Table of Contents
CITIZENS FINANCIAL GROUP, INC.
NOTES TO CONSOLIDATED FINANCIAL STATEMENTS
Amount of interest income from taxable and non-taxable investment securities are shown below:
| Year Ended December 31, | ||||||||||||
| 2013 | 2012 | 2011 | ||||||||||
| (in millions) | ||||||||||||
| Taxable |
$ | 488 | $ | 622 | $ | 755 | ||||||
| Non-taxable |
— | 2 | 2 | |||||||||
|
|
|
|
|
|
|
|||||||
| Total interest income from investment securities |
$ | 488 | $ | 624 | $ | 757 | ||||||
|
|
|
|
|
|
|
|||||||
Realized gains and losses on AFS securities are shown below:
| Year Ended December 31, | ||||||||||||
| 2013 | 2012 | 2011 | ||||||||||
| (in millions) | ||||||||||||
| Gains on sale of debt securities |
$ | 144 | $ | 93 | $ | 170 | ||||||
| Losses on sale of debt securities |
— | — | (9 | ) | ||||||||
| Gains on sale of marketable equity securities |
— | 2 | 1 | |||||||||
|
|
|
|
|
|
|
|||||||
| Total |
$ | 144 | $ | 95 | $ | 162 | ||||||
|
|
|
|
|
|
|
|||||||
The amortized cost and fair value of securities pledged are shown below:
| December 31, 2013 | December 31, 2012 | |||||||||||||||
| Amortized Cost | Fair Value | Amortized Cost | Fair Value | |||||||||||||
| (in millions) | ||||||||||||||||
| Pledged against repurchase agreements |
$ | 5,016 | $ | 4,998 | $ | 2,882 | $ | 2,988 | ||||||||
| Pledged against Federal Home Loan Bank borrowed funds |
1 | 1 | 6 | 6 | ||||||||||||
| Pledged against derivatives, to qualify for fiduciary powers, and to secure public and other deposits as required by law |
2,818 | 2,853 | 4,995 | 5,184 | ||||||||||||
|
|
|
|
|
|
|
|
|
|||||||||
Securitizations of mortgage loans retained in the investment portfolio for the years ended December 31, 2013, 2012, and 2011 were $106 million, $21 million, and $62 million, respectively. These securitizations included a substantive guarantee by a third party. In 2013, the guarantors were Fannie Mae, Ginnie Mae, and Freddie Mac, which purchased the underlying loans. In 2012, the guarantors were Fannie Mae and Freddie Mac. Fannie Mae guaranteed the 2011 securitizations. These securitizations were accounted for as a sale of the transferred loans and as a purchase of securities. The securities received from the guarantors are classified as AFS.
The Company regularly enters into security repurchase agreements with unrelated counterparties. Repurchase agreements are financial transactions that involve the transfer of a security from one party to another and a subsequent transfer of the same (or “substantially the same”) security back to the original party. The Company’s repurchase agreements are typically short term (e.g., overnight) transactions, but they may be extended to longer terms to maturity. Such transactions are accounted for as secured borrowed funds on the Company’s financial statements. When permitted by GAAP, the Company offsets the short-term receivables associated with its reverse repurchase agreements with the short-term payables associated with its repurchase agreements.
F-26
Table of Contents
CITIZENS FINANCIAL GROUP, INC.
NOTES TO CONSOLIDATED FINANCIAL STATEMENTS
The effects of this offsetting on the Consolidated Balance Sheets are presented in the following table:
| December 31, 2013 | December 31, 2012 | |||||||||||||||||||||||
| Gross Assets (Liabilities) |
Gross Assets (Liabilities) Offset |
Net Amounts of Assets (Liabilities) |
Gross Assets (Liabilities) |
Gross Assets (Liabilities) Offset |
Net Amounts of Assets (Liabilities) |
|||||||||||||||||||
| (in millions) | ||||||||||||||||||||||||
| Reverse repurchase and similar arrangements |
$ | — | $ | — | $ | — | $ | 5,100 | $ | (4,000 | ) | $ | 1,100 | |||||||||||
| Repurchase and similar arrangements |
(3,000 | ) | — | (3,000 | ) | (4,000 | ) | 4,000 | — | |||||||||||||||
|
|
|
|
|
|
|
|
|
|
|
|
|
|||||||||||||
| Note: | The Company also offsets certain derivative assets and derivative liabilities on the Consolidated Balance Sheets. See Note 15 “Derivatives” for further information. |
NOTE 4—LOANS AND LEASES
A summary of the loans and leases portfolio follows:
| December 31, 2013 |
December 31, 2012 |
|||||||
| (in millions) | ||||||||
| Commercial |
$ | 28,667 | $ | 28,856 | ||||
| Commercial real estate |
6,948 | 6,459 | ||||||
| Leases |
3,780 | 3,415 | ||||||
|
|
|
|
|
|||||
| Total commercial |
39,395 | 38,730 | ||||||
|
|
|
|
|
|||||
| Residential, including originated home equity products |
29,694 | 31,101 | ||||||
| Home equity products serviced by others |
2,171 | 2,960 | ||||||
| Other secured retail |
10,700 | 10,568 | ||||||
| Unsecured retail |
3,899 | 3,889 | ||||||
|
|
|
|
|
|||||
| Total retail |
46,464 | 48,518 | ||||||
|
|
|
|
|
|||||
| Total loans and leases |
$ | 85,859 | $ | 87,248 | ||||
|
|
|
|
|
|||||
Excluded from the table above are loans totaling $1.1 billion, which were reclassified to loans held for sale at December 31, 2013. See Note 17 “Divestitures and Branch Assets and Liabilities Held for Sale” for further discussion.
Mortgage loans serviced for others by the Company’s subsidiaries are not included above, and amounted to $18.7 billion and $18.6 billion at December 31, 2013 and 2012, respectively.
Loans pledged as collateral for FHLB borrowed funds totaled $19.0 billion and $22.9 billion at December 31, 2013 and 2012, respectively. This collateral consists primarily of residential mortgages and home equity loans. Loans pledged as collateral to support the contingent ability to borrow at the FRB discount window, if necessary, totaled $13.9 billion and $17.7 billion at December 31, 2013 and 2012, respectively.
In 2012, the Company purchased a portfolio of auto loans with outstanding principal balances of $922 million. It also sold a portfolio of commercial real estate loans totaling $227 million incurring a loss on sale of $23 million that is presented in other net gains in the accompanying Consolidated Statements of Operations.
F-27
Table of Contents
CITIZENS FINANCIAL GROUP, INC.
NOTES TO CONSOLIDATED FINANCIAL STATEMENTS
The Company is engaged in the leasing of equipment for commercial use, with primary lease concentrations to Fortune 1000 companies for large capital equipment acquisitions. A lessee is evaluated from a credit perspective using the same underwriting standards and procedures as for a loan borrower. A lessee is expected to make rental payments based on its cash flows and the viability of its balance sheet. Leases are usually not evaluated as collateral-based transactions, and therefore the lessee’s overall financial strength is the most important credit evaluation factor.
A summary of the investment in leases, before the allowance for lease losses, is as follows:
| December 31, 2013 |
December 31, 2012 |
|||||||
| (in millions) | ||||||||
| Direct financing leases |
$ | 3,668 | $ | 3,260 | ||||
| Leveraged leases |
112 | 155 | ||||||
|
|
|
|
|
|||||
| Total leases |
$ | 3,780 | $ | 3,415 | ||||
|
|
|
|
|
|||||
The components of the investment in leases, before the allowance for lease losses, are as follows:
| December 31, 2013 |
December 31, 2012 |
|||||||
| (in millions) | ||||||||
| Total future minimum lease rentals |
$ | 3,252 | $ | 3,186 | ||||
| Estimated residual value of leased equipment (unguaranteed) |
968 | 678 | ||||||
| Initial direct costs |
20 | 13 | ||||||
| Unearned income on minimum lease rentals and estimated residual value of leased equipment |
(460 | ) | (462 | ) | ||||
|
|
|
|
|
|||||
| Total leases |
$ | 3,780 | $ | 3,415 | ||||
|
|
|
|
|
|||||
At December 31, 2013, the future minimum lease rentals on direct financing and leveraged leases are as follows:
| Year Ended December 31, |
(in millions) | |||
| 2014 |
$ | 675 | ||
| 2015 |
614 | |||
| 2016 |
501 | |||
| 2017 |
388 | |||
| 2018 |
363 | |||
| Thereafter |
711 | |||
|
|
|
|||
| Total |
$ | 3,252 | ||
|
|
|
|||
Pretax income on leveraged leases was $3 million for the years ended December 31, 2013 and 2012 and $6 million for the year ended December 31, 2011. The income tax expense on this income was $1 million for the years ended December 31, 2013 and 2012 and $2 million for the year ended December 31, 2011. There was no investment credit recognized in income during these years.
F-28
Table of Contents
CITIZENS FINANCIAL GROUP, INC.
NOTES TO CONSOLIDATED FINANCIAL STATEMENTS
NOTE 5—ALLOWANCE FOR CREDIT LOSSES, NONPERFORMING ASSETS, AND CONCENTRATIONS OF CREDIT RISK
The ALLL is increased through a provision for credit losses that is charged to earnings, based on the Company’s quarterly evaluation, and is reduced by net charge-offs and the ALLL associated with sold loans. See Note 1 “Significant Accounting Policies,” for a detailed discussion of ALLL methodologies and estimation techniques.
During 2013, the Company modified the way that it establishes the ALLL. As discussed in Note 1, “Significant Accounting Policies,” the ALLL is reviewed separately for commercial and retail segments, and the ALLL for each includes an adjustment for qualitative reserves that includes certain risks, factors and events that might not be measured in the statistical analysis. As a result of this change, the unallocated reserve was absorbed into the separately measured commercial and retail qualitative reserves.
Additionally, during December 2013, the Company revised and extended its incurred loss period for certain residential mortgages. This change reflects management’s recognition that incurred but unrealized losses emerge differently during various points of an economic / business cycle. Incurred Loss Periods (“ILPs”) are not static and move over time based on several factors. As economies expand and contract, access to credit, jobs, and liquidity moves directionally with the economy. ILPs will be longer in stronger economic times, when borrowers have the financial ability to withstand adversity and the ILPs will be shorter in an adverse economic environment, when the borrower has less financial flexibility. Since the current economy has not been as strong as the economy during the 2002—2006 time period, we believe that ILPs will not be as long, but rather directional to our history. Since overall Company reserves are deemed adequate, there was no need to increase the reserve but rather reallocate some of the general reserves to cover the $96 million incurred loss period increase.
There were no other material changes in assumptions or estimation techniques compared with prior periods that impacted the determination of the current period’s ALLL and the reserve for unfunded lending commitments.
The following is a summary of changes in the allowance for credit losses:
| Year Ended December 31, 2013 | ||||||||||||||||
| Commercial | Retail | Unallocated | Total | |||||||||||||
| (in millions) | ||||||||||||||||
| Allowance for loan and lease losses as of January 1, 2013 |
$ | 509 | $ | 657 | $ | 89 | $ | 1,255 | ||||||||
| Charge-offs |
(108 | ) | (595 | ) | — | (703 | ) | |||||||||
| Recoveries |
87 | 115 | — | 202 | ||||||||||||
|
|
|
|
|
|
|
|
|
|||||||||
| Net charge-offs |
(21 | ) | (480 | ) | — | (501 | ) | |||||||||
| Sales / Other |
(6 | ) | (6 | ) | (1 | ) | (13 | ) | ||||||||
| Provision charged to income |
(19 | ) | 396 | 103 | 480 | |||||||||||
| Transfer of unallocated reserve to qualitative reserve |
35 | 60 | (95 | ) | — | |||||||||||
| Loss emergence period change |
— | 96 | (96 | ) | — | |||||||||||
|
|
|
|
|
|
|
|
|
|||||||||
| Allowance for loan and lease losses as of December 31, 2013 |
498 | 723 | — | 1,221 | ||||||||||||
|
|
|
|
|
|
|
|
|
|||||||||
| Reserve for unfunded lending commitments as of January 1, 2013 |
40 | — | — | 40 | ||||||||||||
| Credit for unfunded lending commitments |
(1 | ) | — | — | (1 | ) | ||||||||||
|
|
|
|
|
|
|
|
|
|||||||||
| Reserve for unfunded lending commitments as of December 31, 2013 |
39 | — | — | 39 | ||||||||||||
|
|
|
|
|
|
|
|
|
|||||||||
| Total allowance for credit losses as of December 31, 2013 |
$ | 537 | $ | 723 | $ | — | $ | 1,260 | ||||||||
|
|
|
|
|
|
|
|
|
|||||||||
F-29
Table of Contents
CITIZENS FINANCIAL GROUP, INC.
NOTES TO CONSOLIDATED FINANCIAL STATEMENTS
| Year Ended December 31, 2012 | ||||||||||||||||
| Commercial | Retail | Unallocated | Total | |||||||||||||
| (in millions) | ||||||||||||||||
| Allowance for loan and lease losses as of January 1, 2012 |
$ | 691 | $ | 816 | $ | 191 | $ | 1,698 | ||||||||
| Charge-offs |
(257 | ) | (853 | ) | — | (1,110 | ) | |||||||||
| Recoveries |
113 | 122 | — | 235 | ||||||||||||
|
|
|
|
|
|
|
|
|
|||||||||
| Net charge-offs |
(144 | ) | (731 | ) | — | (875 | ) | |||||||||
| Sales / Other |
(2 | ) | — | — | (2 | ) | ||||||||||
| Provision charged to income |
(36 | ) | 572 | (102 | ) | 434 | ||||||||||
|
|
|
|
|
|
|
|
|
|||||||||
| Allowance for loan and lease losses as of December 31, 2012 |
509 | 657 | 89 | 1,255 | ||||||||||||
|
|
|
|
|
|
|
|
|
|||||||||
| Reserve for unfunded lending commitments as of January 1, 2012 |
61 | — | — | 61 | ||||||||||||
| Credit for unfunded lending commitments |
(21 | ) | — | — | (21 | ) | ||||||||||
|
|
|
|
|
|
|
|
|
|||||||||
| Reserve for unfunded lending commitments as of December 31, 2012 |
40 | — | — | 40 | ||||||||||||
|
|
|
|
|
|
|
|
|
|||||||||
| Total allowance for credit losses as of December 31, 2012 |
$ | 549 | $ | 657 | $ | 89 | $ | 1,295 | ||||||||
|
|
|
|
|
|
|
|
|
|||||||||
| Year Ended December 31, 2011 | ||||||||||||||||
| Commercial | Retail | Unallocated | Total | |||||||||||||
| (in millions) | ||||||||||||||||
| Allowance for loan and lease losses as of January 1, 2011 |
$ | 828 | $ | 1,021 | $ | 156 | $ | 2,005 | ||||||||
| Charge-offs |
(378 | ) | (1,008 | ) | — | (1,386 | ) | |||||||||
| Recoveries |
92 | 129 | — | 221 | ||||||||||||
|
|
|
|
|
|
|
|
|
|||||||||
| Net charge-offs |
(286 | ) | (879 | ) | — | (1,165 | ) | |||||||||
| Sales/other |
— | — | (33 | ) | (33 | ) | ||||||||||
| Provision charged to income |
149 | 674 | 68 | 891 | ||||||||||||
|
|
|
|
|
|
|
|
|
|||||||||
| Allowance for loan and lease losses as of December 31, 2011 |
691 | 816 | 191 | 1,698 | ||||||||||||
|
|
|
|
|
|
|
|
|
|||||||||
| Reserve for unfunded lending commitments as of January 1, 2011 |
70 | — | — | 70 | ||||||||||||
| Credit for unfunded lending commitments |
(9 | ) | — | — | (9 | ) | ||||||||||
|
|
|
|
|
|
|
|
|
|||||||||
| Reserve for unfunded lending commitments as of December 31, 2011 |
61 | — | — | 61 | ||||||||||||
|
|
|
|
|
|
|
|
|
|||||||||
| Total allowance for credit losses as of December 31, 2011 |
$ | 752 | $ | 816 | $ | 191 | $ | 1,759 | ||||||||
|
|
|
|
|
|
|
|
|
|||||||||
The recorded investment in loans and leases based on the Company’s evaluation methodology is as follows:
| December 31, 2013 | December 31, 2012 | |||||||||||||||||||||||
| Commercial | Retail | Total | Commercial | Retail | Total | |||||||||||||||||||
| (in millions) | ||||||||||||||||||||||||
| Individually evaluated |
$ | 239 | $ | 1,200 | $ | 1,439 | $ | 474 | $ | 1,140 | $ | 1,614 | ||||||||||||
| Formula-based evaluation |
39,156 | 45,264 | 84,420 | 38,256 | 47,378 | 85,634 | ||||||||||||||||||
|
|
|
|
|
|
|
|
|
|
|
|
|
|||||||||||||
| Total |
$ | 39,395 | $ | 46,464 | $ | 85,859 | $ | 38,730 | $ | 48,518 | $ | 87,248 | ||||||||||||
|
|
|
|
|
|
|
|
|
|
|
|
|
|||||||||||||
F-30
Table of Contents
CITIZENS FINANCIAL GROUP, INC.
NOTES TO CONSOLIDATED FINANCIAL STATEMENTS
The following is a summary of the allowance for credit losses by evaluation method:
| December 31, 2013 | December 31, 2012 | |||||||||||||||||||||||||||
| Commercial | Retail | Total | Commercial | Retail | Unallocated | Total | ||||||||||||||||||||||
| (in millions) | ||||||||||||||||||||||||||||
| Individually evaluated |
$ | 23 | $ | 108 | $ | 131 | $ | 41 | $ | 73 | $ | — | $ | 114 | ||||||||||||||
| Formula-based evaluation |
514 | 615 | 1,129 | 508 | 584 | — | 1,092 | |||||||||||||||||||||
| Unallocated |
— | — | — | — | — | 89 | 89 | |||||||||||||||||||||
|
|
|
|
|
|
|
|
|
|
|
|
|
|
|
|||||||||||||||
| Allowance for credit losses |
$ | 537 | $ | 723 | $ | 1,260 | $ | 549 | $ | 657 | $ | 89 | $ | 1,295 | ||||||||||||||
|
|
|
|
|
|
|
|
|
|
|
|
|
|
|
|||||||||||||||
For commercial loans and leases, the Company utilizes regulatory classification ratings to monitor credit quality. Loans with a “pass” rating are those that the Company believes will be fully repaid in accordance with the contractual loan terms. Commercial loans and leases that are “criticized” are those that have some weakness that indicates an increased probability of future loss. For retail loans, the Company primarily uses the loan’s payment and delinquency status to monitor credit quality. The further a loan is past due, the greater the likelihood of future credit loss. These credit quality indicators for both commercial and retail loans are continually updated and monitored.
The recorded investment in classes of commercial loans and leases based on regulatory classification ratings is as follows:
| December 31, 2013 | ||||||||||||||||||||
| Criticized | ||||||||||||||||||||
| Pass | Special Mention | Substandard | Doubtful | Total | ||||||||||||||||
| (in millions) | ||||||||||||||||||||
| Commercial |
$ | 27,433 | $ | 588 | $ | 541 | $ | 105 | $ | 28,667 | ||||||||||
| Commercial real estate |
6,366 | 339 | 116 | 127 | 6,948 | |||||||||||||||
| Leases |
3,679 | 40 | 61 | — | 3,780 | |||||||||||||||
|
|
|
|
|
|
|
|
|
|
|
|||||||||||
| Total |
$ | 37,478 | $ | 967 | $ | 718 | $ | 232 | $ | 39,395 | ||||||||||
|
|
|
|
|
|
|
|
|
|
|
|||||||||||
| December 31, 2012 | ||||||||||||||||||||
| Criticized | ||||||||||||||||||||
| Pass | Special Mention | Substandard | Doubtful | Total | ||||||||||||||||
| (in millions) | ||||||||||||||||||||
| Commercial |
$ | 27,100 | $ | 744 | $ | 809 | $ | 203 | $ | 28,856 | ||||||||||
| Commercial real estate |
5,285 | 569 | 315 | 290 | 6,459 | |||||||||||||||
| Leases |
3,304 | 88 | 23 | — | 3,415 | |||||||||||||||
|
|
|
|
|
|
|
|
|
|
|
|||||||||||
| Total |
$ | 35,689 | $ | 1,401 | $ | 1,147 | $ | 493 | $ | 38,730 | ||||||||||
|
|
|
|
|
|
|
|
|
|
|
|||||||||||
F-31
Table of Contents
CITIZENS FINANCIAL GROUP, INC.
NOTES TO CONSOLIDATED FINANCIAL STATEMENTS
The recorded investment in classes of retail loans, categorized by delinquency status, is as follows:
| December 31, 2013 | ||||||||||||||||||||
| Current | 1-29 Days Past Due |
30-89 Days Past Due |
90 Days or More Past Due |
Total | ||||||||||||||||
| (in millions) | ||||||||||||||||||||
| Residential, including originated home equity products |
$ | 27,912 | $ | 861 | $ | 259 | $ | 662 | $ | 29,694 | ||||||||||
| Home equity products serviced by others |
1,901 | 167 | 43 | 60 | 2,171 | |||||||||||||||
| Other secured retail |
10,068 | 550 | 66 | 16 | 10,700 | |||||||||||||||
| Unsecured retail |
3,593 | 185 | 67 | 54 | 3,899 | |||||||||||||||
|
|
|
|
|
|
|
|
|
|
|
|||||||||||
| Total |
$ | 43,474 | $ | 1,763 | $ | 435 | $ | 792 | $ | 46,464 | ||||||||||
|
|
|
|
|
|
|
|
|
|
|
|||||||||||
| December 31, 2012 | ||||||||||||||||||||
| Current | 1-29 Days Past Due |
30-89 Days Past Due |
90 Days or More Past Due |
Total | ||||||||||||||||
| (in millions) | ||||||||||||||||||||
| Residential, including originated home equity products |
$ | 29,075 | $ | 967 | $ | 230 | $ | 829 | $ | 31,101 | ||||||||||
| Home equity products serviced by others |
2,595 | 188 | 62 | 115 | 2,960 | |||||||||||||||
| Other secured retail |
9,938 | 545 | 74 | 11 | 10,568 | |||||||||||||||
| Unsecured retail |
3,633 | 123 | 78 | 55 | 3,889 | |||||||||||||||
|
|
|
|
|
|
|
|
|
|
|
|||||||||||
| Total |
$ | 45,241 | $ | 1,823 | $ | 444 | $ | 1,010 | $ | 48,518 | ||||||||||
|
|
|
|
|
|
|
|
|
|
|
|||||||||||
The presentation of student loans at December 31, 2012 in the table above, and in the tables that follow, were reclassified from the other secured retail loan class to the unsecured retail loan class to conform to the Company’s current loan class presentation.
F-32
Table of Contents
CITIZENS FINANCIAL GROUP, INC.
NOTES TO CONSOLIDATED FINANCIAL STATEMENTS
Nonperforming Assets
A summary of nonperforming loans and leases by class is as follows:
| December 31, 2013 | December 31, 2012 | |||||||||||||||||||||||
| Nonaccruing | Accruing and 90 Days or More Delinquent |
Total Nonperforming Loans and Leases |
Nonaccruing | Accruing and 90 Days or More Delinquent |
Total Nonperforming Loans and Leases |
|||||||||||||||||||
| (in millions) | ||||||||||||||||||||||||
| Commercial |
$ | 96 | $ | — | $ | 96 | $ | 119 | $ | 71 | $ | 190 | ||||||||||||
| Commercial real estate |
169 | — | 169 | 386 | 33 | 419 | ||||||||||||||||||
| Leases |
— | — | — | 1 | — | 1 | ||||||||||||||||||
|
|
|
|
|
|
|
|
|
|
|
|
|
|||||||||||||
| Total commercial |
265 | — | 265 | 506 | 104 | 610 | ||||||||||||||||||
|
|
|
|
|
|
|
|
|
|
|
|
|
|||||||||||||
| Residential, including originated home equity products |
981 | — | 981 | 1,043 | — | 1,043 | ||||||||||||||||||
| Home equity products serviced by others |
89 | — | 89 | 133 | — | 133 | ||||||||||||||||||
| Other secured retail |
26 | — | 26 | 25 | — | 25 | ||||||||||||||||||
| Unsecured retail |
22 | 33 | 55 | 23 | 35 | 58 | ||||||||||||||||||
|
|
|
|
|
|
|
|
|
|
|
|
|
|||||||||||||
| Total retail |
1,118 | 33 | 1,151 | 1,224 | 35 | 1,259 | ||||||||||||||||||
|
|
|
|
|
|
|
|
|
|
|
|
|
|||||||||||||
| Total |
$ | 1,383 | $ | 33 | $ | 1,416 | $ | 1,730 | $ | 139 | $ | 1,869 | ||||||||||||
|
|
|
|
|
|
|
|
|
|
|
|
|
|||||||||||||
A summary of other nonperforming assets is as follows:
| December 31, 2013 |
December 31, 2012 |
|||||||
| (in millions) | ||||||||
| Nonperforming assets, net of allowance: |
||||||||
| Commercial |
$ | 10 | $ | 36 | ||||
| Retail |
40 | 58 | ||||||
|
|
|
|
|
|||||
| Nonperforming assets, net of allowance |
$ | 50 | $ | 94 | ||||
|
|
|
|
|
|||||
Nonperforming assets consists primarily of other real estate owned and is presented in other assets on the Consolidated Balance Sheets.
A summary of key performance indicators is as follows:
| December 31, 2013 |
December 31, 2012 |
|||||||
| Nonperforming commercial loans and leases as a percentage of total loans and leases |
0.31 | % | 0.70 | % | ||||
| Nonperforming retail loans as a percentage of total loans and leases |
1.34 | 1.44 | ||||||
|
|
|
|
|
|||||
| Total nonperforming loans and leases as a percentage of total loans and leases |
1.65 | 2.14 | ||||||
|
|
|
|
|
|||||
| Nonperforming commercial assets as a percentage of total assets |
0.23 | 0.51 | ||||||
| Nonperforming retail assets as a percentage of total assets |
0.97 | 1.04 | ||||||
|
|
|
|
|
|||||
| Total nonperforming assets as a percentage of total assets |
1.20 | % | 1.55 | % | ||||
|
|
|
|
|
|||||
F-33
Table of Contents
CITIZENS FINANCIAL GROUP, INC.
NOTES TO CONSOLIDATED FINANCIAL STATEMENTS
The following is an analysis of the age of the past due amounts (accruing and nonaccruing):
| December 31, 2013 | December 31, 2012 | |||||||||||||||||||||||
| 30-89 Days Past Due |
90 Days or More Past Due |
Total Past Due |
30-89 Days Past Due |
90 Days or More Past Due |
Total Past Due |
|||||||||||||||||||
| (in millions) | ||||||||||||||||||||||||
| Commercial |
$ | 61 | $ | 96 | $ | 157 | $ | 48 | $ | 190 | $ | 238 | ||||||||||||
| Commercial real estate |
34 | 169 | 203 | 47 | 419 | 466 | ||||||||||||||||||
| Leases |
24 | — | 24 | 7 | 1 | 8 | ||||||||||||||||||
|
|
|
|
|
|
|
|
|
|
|
|
|
|||||||||||||
| Total commercial |
119 | 265 | 384 | 102 | 610 | 712 | ||||||||||||||||||
|
|
|
|
|
|
|
|
|
|
|
|
|
|||||||||||||
| Residential, including originated home equity products |
259 | 662 | 921 | 230 | 829 | 1,059 | ||||||||||||||||||
| Home equity products serviced by others |
43 | 60 | 103 | 62 | 115 | 177 | ||||||||||||||||||
| Other secured retail |
66 | 16 | 82 | 74 | 11 | 85 | ||||||||||||||||||
| Unsecured retail |
67 | 54 | 121 | 78 | 55 | 133 | ||||||||||||||||||
|
|
|
|
|
|
|
|
|
|
|
|
|
|||||||||||||
| Total retail |
435 | 792 | 1,227 | 444 | 1,010 | 1,454 | ||||||||||||||||||
|
|
|
|
|
|
|
|
|
|
|
|
|
|||||||||||||
| Total |
$ | 554 | $ | 1,057 | $ | 1,611 | $ | 546 | $ | 1,620 | $ | 2,166 | ||||||||||||
|
|
|
|
|
|
|
|
|
|
|
|
|
|||||||||||||
Impaired loans include (1) nonaccruing larger balance commercial loans (greater than $3 million carrying value) and (2) commercial and retail TDRs. The following is a summary of impaired loan information by class:
| December 31, 2013 | ||||||||||||||||||||||||||||
| Impaired Loans With a Related Allowance |
Allowance on Impaired Loans |
Impaired Loans Without a Related Allowance |
Unpaid Contractual Balance |
Total Recorded Investment in Impaired Loans |
Interest Income Recognized |
Average Recorded Investment |
||||||||||||||||||||||
| (in millions) | ||||||||||||||||||||||||||||
| Commercial |
$ | 86 | $ | 15 | $ | 33 | $ | 214 | $ | 119 | $ | 1 | $ | 157 | ||||||||||||||
| Commercial real estate |
76 | 8 | 44 | 221 | 120 | 1 | 149 | |||||||||||||||||||||
|
|
|
|
|
|
|
|
|
|
|
|
|
|
|
|||||||||||||||
| Total commercial |
162 | 23 | 77 | 435 | 239 | 2 | 306 | |||||||||||||||||||||
|
|
|
|
|
|
|
|
|
|
|
|
|
|
|
|||||||||||||||
| Residential, including originated home equity products |
355 | 59 | 497 | 1,081 | 852 | 14 | 737 | |||||||||||||||||||||
| Home equity products serviced by others |
91 | 11 | 21 | 125 | 112 | 5 | 114 | |||||||||||||||||||||
| Other secured retail |
23 | 3 | 12 | 43 | 35 | 1 | 33 | |||||||||||||||||||||
| Unsecured retail |
201 | 35 | — | 201 | 201 | 10 | 181 | |||||||||||||||||||||
|
|
|
|
|
|
|
|
|
|
|
|
|
|
|
|||||||||||||||
| Total retail |
670 | 108 | 530 | 1,450 | 1,200 | 30 | 1,065 | |||||||||||||||||||||
|
|
|
|
|
|
|
|
|
|
|
|
|
|
|
|||||||||||||||
| Total |
$ | 832 | $ | 131 | $ | 607 | $ | 1,885 | $ | 1,439 | $ | 32 | $ | 1,371 | ||||||||||||||
|
|
|
|
|
|
|
|
|
|
|
|
|
|
|
|||||||||||||||
F-34
Table of Contents
CITIZENS FINANCIAL GROUP, INC.
NOTES TO CONSOLIDATED FINANCIAL STATEMENTS
| December 31, 2012 | ||||||||||||||||||||||||||||
| Impaired Loans With a Related Allowance |
Allowance on Impaired Loans |
Impaired Loans Without a Related Allowance |
Unpaid Contractual Balance |
Total Recorded Investment in Impaired Loans |
Interest Income Recognized |
Average Recorded Investment |
||||||||||||||||||||||
| (in millions) | ||||||||||||||||||||||||||||
| Commercial |
$ | 138 | $ | 25 | $ | 50 | $ | 321 | $ | 188 | $ | 1 | $ | 276 | ||||||||||||||
| Commercial real estate |
133 | 16 | 153 | 448 | 286 | 1 | 310 | |||||||||||||||||||||
|
|
|
|
|
|
|
|
|
|
|
|
|
|
|
|||||||||||||||
| Total commercial |
271 | 41 | 203 | 769 | 474 | 2 | 586 | |||||||||||||||||||||
|
|
|
|
|
|
|
|
|
|
|
|
|
|
|
|||||||||||||||
| Residential, including originated home equity products |
268 | 41 | 536 | 1,003 | 804 | 6 | 474 | |||||||||||||||||||||
| Home equity products serviced by others |
122 | 16 | 33 | 194 | 155 | 6 | 127 | |||||||||||||||||||||
| Other secured retail |
28 | 5 | 15 | 49 | 43 | 1 | 33 | |||||||||||||||||||||
| Unsecured retail |
138 | 11 | — | 138 | 138 | — | 11 | |||||||||||||||||||||
|
|
|
|
|
|
|
|
|
|
|
|
|
|
|
|||||||||||||||
| Total retail |
556 | 73 | 584 | 1,384 | 1,140 | 13 | 645 | |||||||||||||||||||||
|
|
|
|
|
|
|
|
|
|
|
|
|
|
|
|||||||||||||||
| Total |
$ | 827 | $ | 114 | $ | 787 | $ | 2,153 | $ | 1,614 | $ | 15 | $ | 1,231 | ||||||||||||||
|
|
|
|
|
|
|
|
|
|
|
|
|
|
|
|||||||||||||||
Troubled Debt Restructurings
A loan modification is identified as a TDR when the Company or a bankruptcy court grants the borrower a concession the Company would not otherwise make in response to the borrower’s financial difficulties. TDRs typically result from the Company’s loss mitigation efforts and are undertaken in order to improve the likelihood of recovery and continuity of the relationship. Citizen’s loan modifications are handled on a case-by-case basis and are negotiated to achieve mutually agreeable terms that maximize loan collectability and meet the borrower’s financial needs. Concessions granted in TDRs for all classes of loans may include lowering the interest rate, forgiving a portion of principal, extending the loan term, lowering scheduled payments for a specified period of time, principal forbearance, or capitalizing past due amounts. A rate increase can be a concession if the increased rate is lower than a market rate for debt with risk similar to that of the restructured loan. TDRs for commercial loans and leases may also involve creating a multiple note structure, accepting non-cash assets, accepting an equity interest, or receiving a performance-based fee. In some cases a TDR may involve multiple concessions. The financial effects of TDRs for all loan classes may include lower income (either due to a lower interest rate or a delay in the timing of cash flows), larger loan loss provisions, and accelerated charge-offs if the modification renders the loan collateral-dependent. In some cases interest income throughout the term of the loan may increase if, for example, the loan is extended or the interest rate is increased as a result of the restructuring.
Because TDRs are impaired loans, the Company measures impairment by comparing the present value of expected future cash flows, or, when appropriate, collateral value, to the loan’s recorded investment. Any excess of recorded investment over the present value of expected future cash flows or collateral value is recognized by creating a valuation allowance or increasing an existing valuation allowance. Any portion of the loan’s recorded investment the Company does not expect to collect as a result of the modification is charged off at the time of modification.
F-35
Table of Contents
CITIZENS FINANCIAL GROUP, INC.
NOTES TO CONSOLIDATED FINANCIAL STATEMENTS
Commercial TDRs were $167 million and $244 million on December 31, 2013 and 2012, respectively. Retail TDRs totaled $1.2 billion and $1.1 billion on December 31, 2013 and 2012, respectively. Commitments to lend additional funds to debtors owing receivables which were TDRs were $52 million and $86 million on December 31, 2013 and 2012, respectively.
The following table summarizes how loans were modified during the year ending December 31, 2013, the charge-offs related to the modifications, and the impact on the ALLL. The reported balances include loans that became TDRs during 2013, and were paid off in full, charged off, or sold prior to December 31, 2013.
| Primary Modification Types | ||||||||||||||||||||||||
| Interest Rate Reduction(1) | Maturity Extension(2) | |||||||||||||||||||||||
| Number of Contracts |
Pre- Modification Outstanding Recorded Investment |
Post- Modification Outstanding Recorded Investment |
Number of Contracts |
Pre- Modification Outstanding Recorded Investment |
Post- Modification Outstanding Recorded Investment |
|||||||||||||||||||
| (dollars in millions) | ||||||||||||||||||||||||
| Commercial |
126 | $ | 13 | $ | 13 | 134 | $ | 18 | $ | 18 | ||||||||||||||
| Commercial real estate |
11 | 7 | 7 | 3 | 1 | 1 | ||||||||||||||||||
|
|
|
|
|
|
|
|
|
|
|
|
|
|||||||||||||
| Total commercial |
137 | 20 | 20 | 137 | 19 | 19 | ||||||||||||||||||
|
|
|
|
|
|
|
|
|
|
|
|
|
|||||||||||||
| Residential, including originated home equity products |
414 | 48 | 50 | 2,221 | 91 | 82 | ||||||||||||||||||
| Home equity products serviced by others |
34 | 2 | 2 | 6 | — | — | ||||||||||||||||||
| Other secured retail |
259 | 2 | 2 | 2 | — | — | ||||||||||||||||||
| Unsecured retail |
2,729 | 15 | 15 | — | — | — | ||||||||||||||||||
|
|
|
|
|
|
|
|
|
|
|
|
|
|||||||||||||
| Total retail |
3,436 | 67 | 69 | 2,229 | 91 | 82 | ||||||||||||||||||
|
|
|
|
|
|
|
|
|
|
|
|
|
|||||||||||||
| Total |
3,573 | $ | 87 | $ | 89 | 2,366 | $ | 110 | $ | 101 | ||||||||||||||
|
|
|
|
|
|
|
|
|
|
|
|
|
|||||||||||||
| Primary Modification Types | ||||||||||||||||||||
| Other(3) | ||||||||||||||||||||
| Number of Contracts |
Pre- Modification Outstanding Recorded Investment |
Post- Modification Outstanding Recorded Investment |
Net Change to ALLL Resulting from Modification |
Charge-offs Resulting from Modification |
||||||||||||||||
| (dollars in millions) | ||||||||||||||||||||
| Commercial |
6 | $ | 1 | $ | 1 | $ | — | $ | 1 | |||||||||||
| Commercial real estate |
1 | — | — | (2 | ) | — | ||||||||||||||
|
|
|
|
|
|
|
|
|
|
|
|||||||||||
| Total commercial |
7 | 1 | 1 | (2 | ) | 1 | ||||||||||||||
|
|
|
|
|
|
|
|
|
|
|
|||||||||||
| Residential, including originated home equity products |
2,196 | 174 | 160 | 4 | 23 | |||||||||||||||
| Home equity products serviced by others |
312 | 14 | 11 | (1 | ) | 4 | ||||||||||||||
| Other secured retail |
1,471 | 16 | 13 | — | 4 | |||||||||||||||
| Unsecured retail |
2,620 | 48 | 47 | 5 | — | |||||||||||||||
|
|
|
|
|
|
|
|
|
|
|
|||||||||||
| Total retail |
6,599 | 252 | 231 | 8 | 31 | |||||||||||||||
|
|
|
|
|
|
|
|
|
|
|
|||||||||||
| Total |
6,606 | $ | 253 | $ | 232 | $ | 6 | $ | 32 | |||||||||||
|
|
|
|
|
|
|
|
|
|
|
|||||||||||
F-36
Table of Contents
CITIZENS FINANCIAL GROUP, INC.
NOTES TO CONSOLIDATED FINANCIAL STATEMENTS
| (1) | Includes modifications that consist of multiple concessions, one of which is an interest rate reduction. |
| (2) | Includes modifications that consist of multiple concessions, one of which is a maturity extension (unless one of the other concessions was an interest rate reduction). |
| (3) | Includes modifications other than interest rate reductions or maturity extensions, such as lowering scheduled payments for a specified period of time, principal forbearance, capitalizing arrearages, and principal forgiveness. Also included are the following: deferrals, trial modifications, certain bankruptcies, loans in forbearance and prepayment plans. Modifications can include the deferral of accrued interest resulting in post modification balances being higher than pre-modification. |
The following table summarizes how loans were modified during the year ending December 31, 2012, the charge-offs related to the modifications, and the impact on the ALLL. The reported balances include loans that became TDRs during 2012, and were paid off in full, charged off, or sold prior to December 31, 2012.
| Primary Modification Types | ||||||||||||||||||||||||
| Interest Rate Reduction(1) | Maturity Extension(2) | |||||||||||||||||||||||
| Number of Contracts |
Pre- Modification Outstanding Recorded Investment |
Post- Modification Outstanding Recorded Investment |
Number of Contracts |
Pre- Modification Outstanding Recorded Investment |
Post- Modification Outstanding Recorded Investment |
|||||||||||||||||||
| (dollars in millions) | ||||||||||||||||||||||||
| Commercial |
18 | $ | 13 | $ | 13 | 108 | $ | 25 | $ | 24 | ||||||||||||||
| Commercial real estate |
4 | 9 | 9 | 6 | 14 | 13 | ||||||||||||||||||
|
|
|
|
|
|
|
|
|
|
|
|
|
|||||||||||||
| Total commercial |
22 | 22 | 22 | 114 | 39 | 37 | ||||||||||||||||||
|
|
|
|
|
|
|
|
|
|
|
|
|
|||||||||||||
| Residential, including originated home equity products |
565 | 95 | 99 | 193 | 14 | 16 | ||||||||||||||||||
| Home equity products serviced by others |
44 | 2 | 2 | 7 | 1 | — | ||||||||||||||||||
| Unsecured retail |
2,965 | 17 | 16 | — | — | — | ||||||||||||||||||
|
|
|
|
|
|
|
|
|
|
|
|
|
|||||||||||||
| Total retail |
3,574 | 114 | 117 | 200 | 15 | 16 | ||||||||||||||||||
|
|
|
|
|
|
|
|
|
|
|
|
|
|||||||||||||
| Total |
3,596 | $ | 136 | $ | 139 | 314 | $ | 54 | $ | 53 | ||||||||||||||
|
|
|
|
|
|
|
|
|
|
|
|
|
|||||||||||||
F-37
Table of Contents
CITIZENS FINANCIAL GROUP, INC.
NOTES TO CONSOLIDATED FINANCIAL STATEMENTS
| Primary Modification Types | ||||||||||||||||||||
| Other(3) | ||||||||||||||||||||
| Number of Contracts |
Pre-Modification Outstanding Recorded Investment |
Post-Modification Outstanding Recorded Investment |
Net Change to ALLL Resulting from Modification |
Charge-offs Resulting from Modification |
||||||||||||||||
| (dollars in millions) | ||||||||||||||||||||
| Commercial |
180 | $ | 43 | $ | 46 | $ | (29 | ) | $ | 14 | ||||||||||
| Commercial real estate |
16 | 72 | 74 | (26 | ) | 2 | ||||||||||||||
|
|
|
|
|
|
|
|
|
|
|
|||||||||||
| Total commercial |
196 | 115 | 120 | (55 | ) | 16 | ||||||||||||||
|
|
|
|
|
|
|
|
|
|
|
|||||||||||
| Residential, including originated home equity products |
6,221 | 425 | 384 | (6 | ) | 43 | ||||||||||||||
| Home equity products serviced by others |
1,514 | 67 | 50 | (8 | ) | 17 | ||||||||||||||
| Other secured retail |
3,201 | 25 | 17 | (4 | ) | 8 | ||||||||||||||
| Unsecured retail |
7,557 | 139 | 138 | 5 | — | |||||||||||||||
|
|
|
|
|
|
|
|
|
|
|
|||||||||||
| Total retail |
18,493 | 656 | 589 | (13 | ) | 68 | ||||||||||||||
|
|
|
|
|
|
|
|
|
|
|
|||||||||||
| Total |
18,689 | $ | 771 | $ | 709 | $ | (68 | ) | $ | 84 | ||||||||||
|
|
|
|
|
|
|
|
|
|
|
|||||||||||
| (1) | Includes modifications that consist of multiple concessions, one of which is an interest rate reduction. |
| (2) | Includes modifications that consist of multiple concessions, one of which is a maturity extension (unless one of the other concessions was an interest rate reduction). |
| (3) | Includes modifications other than interest rate reductions or maturity extensions, such as lowering scheduled payments for a specified period of time, principal forbearance, capitalizing arrearages, and principal forgiveness. Also included are the following: deferrals, trial modifications, certain bankruptcies, loans in forbearance and prepayment plans. Modifications can include the deferral of accrued interest resulting in post modification balances being higher than pre-modification. |
The table below summarizes TDRs that defaulted during 2013 and 2012 within 12 months of their modification date. For purposes of this table, a payment default is defined as being past due 90 days or more under the modified terms. Amounts represent the loan’s recorded investment at the time of payment default. Loan data in this table includes loans meeting the criteria that were paid off in full, charged off, or sold prior to December 31, 2013 and 2012. If a TDR of any loan type becomes 90 days past due after being modified, the loan is written down to fair value less cost to sell. The amount written off is charged to the ALLL.
| 2013 | 2012 | |||||||||||||||
| Number of Contracts |
Balance Defaulted |
Number of Contracts |
Balance Defaulted |
|||||||||||||
| (dollars in millions) | ||||||||||||||||
| Commercial |
18 | $ | 1 | 4 | $ | 3 | ||||||||||
| Commercial real estate |
3 | 1 | 1 | 5 | ||||||||||||
|
|
|
|
|
|
|
|
|
|||||||||
| Total commercial |
21 | 2 | 5 | 8 | ||||||||||||
|
|
|
|
|
|
|
|
|
|||||||||
| Residential, including originated home equity products |
1,660 | 124 | 713 | 81 | ||||||||||||
| Home equity products serviced by others |
229 | 5 | 208 | 15 | ||||||||||||
| Other secured retail |
241 | 2 | 151 | 1 | ||||||||||||
| Unsecured retail |
1,433 | 20 | 628 | 4 | ||||||||||||
|
|
|
|
|
|
|
|
|
|||||||||
| Total retail |
3,563 | 151 | 1,700 | 101 | ||||||||||||
|
|
|
|
|
|
|
|
|
|||||||||
| Total |
3,584 | $ | 153 | 1,705 | $ | 109 | ||||||||||
|
|
|
|
|
|
|
|
|
|||||||||
F-38
Table of Contents
CITIZENS FINANCIAL GROUP, INC.
NOTES TO CONSOLIDATED FINANCIAL STATEMENTS
Concentrations of Credit Risk
Most of the Company’s business activity is with customers located in the New England, Mid-Atlantic and Mid-West regions. Generally, loans are collateralized by assets including real estate, inventory, accounts receivable, other personal property and investment securities. As of December 31, 2013 and 2012, the Company had a significant amount of loans collateralized by residential and commercial real estate. There are no significant concentrations to particular industries within the commercial loan portfolio. Exposure to credit losses arising from lending transactions, which fail to perform according to contractual agreements, may fluctuate with the fair values of the collateral supporting loans. The Company’s policy is to collateralize loans to the extent necessary; however, unsecured loans are also granted on the basis of the financial strength of the applicant and the facts surrounding the transaction.
Certain loan products, including residential mortgages, home equity loans and lines of credit, and credit cards, have contractual features that may increase credit exposure to the Company in the event of an increase in interest rates or a decline in housing values. These products include loans that exceed 90% of the value of the underlying collateral (high LTV loans), interest-only and negative amortization residential mortgages, and loans with low introductory rates. Certain loans have more than one of these characteristics.
The following table presents balances of loans with these characteristics:
| December 31, 2013 | December 31, 2012 | |||||||||||||||||||||||||||||||||||||||
| Residential Mortgages |
Home Equity Loans and Lines of Credit |
Home Equity Products Serviced by Others |
Credit Cards |
Total | Residential Mortgages |
Home Equity Loans and Lines of Credit |
Home Equity Products Serviced by Others |
Credit Cards |
Total | |||||||||||||||||||||||||||||||
| (in millions) | ||||||||||||||||||||||||||||||||||||||||
| High loan-to-value |
$ | 1,054 | $ | 2,798 | $ | 1,581 | $ | — | $ | 5,433 | $ | 1,892 | $ | 4,685 | $ | 2,266 | $ | — | $ | 8,843 | ||||||||||||||||||||
| Interest only / negative amortization |
882 | — | — | — | 882 | 868 | — | — | — | 868 | ||||||||||||||||||||||||||||||
| Low introductory rate |
— | — | — | 119 | 119 | — | — | — | 118 | 118 | ||||||||||||||||||||||||||||||
| Multiple characteristics and other |
96 | — | — | — | 96 | 233 | — | — | — | 233 | ||||||||||||||||||||||||||||||
|
|
|
|
|
|
|
|
|
|
|
|
|
|
|
|
|
|
|
|
|
|||||||||||||||||||||
| Total |
$ | 2,032 | $ | 2,798 | $ | 1,581 | $ | 119 | $ | 6,530 | $ | 2,993 | $ | 4,685 | $ | 2,266 | $ | 118 | $ | 10,062 | ||||||||||||||||||||
|
|
|
|
|
|
|
|
|
|
|
|
|
|
|
|
|
|
|
|
|
|||||||||||||||||||||
NOTE 6—PREMISES, EQUIPMENT, AND SOFTWARE
A summary of the carrying value of premises and equipment follows:
| Useful Lives | December 31, 2013 |
December 31, 2012 |
||||||||
| (dollars in millions) | ||||||||||
| Land and land improvements |
15 years | $ | 33 | $ | 48 | |||||
| Buildings and leasehold improvements |
5-40 years | 636 | 669 | |||||||
| Furniture, fixtures and equipment |
5-10 years | 1,598 | 1,671 | |||||||
|
|
|
|
|
|||||||
| Total premises and equipment, gross |
2,267 | 2,388 | ||||||||
| Less: accumulated depreciation |
1,675 | 1,745 | ||||||||
|
|
|
|
|
|||||||
| Total premises and equipment, net |
$ | 592 | $ | 643 | ||||||
|
|
|
|
|
|||||||
F-39
Table of Contents
CITIZENS FINANCIAL GROUP, INC.
NOTES TO CONSOLIDATED FINANCIAL STATEMENTS
The above table includes capital leases with book values of $45 million and $53 million and related accumulated depreciation of $17 million and $37 million as of December 31, 2013 and 2012, respectively. Depreciation charged to noninterest expense was $138 million, $163 million, and $179 million for the years ended December 31, 2013, 2012, and 2011, respectively, and is presented in the Consolidated Statements of Operations in occupancy and equipment expense.
The Company entered into a sale-leaseback transaction during 2013, which includes an operating lease for a period of 10 years. There was a $15 million gain recorded in 2013 of which $14 million was deferred. There were no sale-leaseback transactions during 2012. During 2011, the Company entered into a sale-leaseback transaction, which included an operating lease for a period of 10 years. There was a $1 million gain recorded in 2011 and the entire amount was deferred. The deferred gains on the Company’s sale-leaseback transactions are amortized over the lease terms and reported in occupancy expense.
The Company had capitalized software assets, net of amortization, of $729 million and $623 million as of December 31, 2013 and 2012 respectively. Amortization expense was $102 million, $77 million, and $53 million for the years ended December 31, 2013, 2012, and 2011, respectively. Capitalized software assets are reported as a component of other assets in the Consolidated Balance Sheets.
The estimated future amortization expense for capitalized software assets is as follows:
| Year |
(in millions) | |||
| 2014 |
$ | 108 | ||
| 2015 |
92 | |||
| 2016 |
73 | |||
| 2017 |
56 | |||
| 2018 |
33 | |||
| Thereafter |
133 | |||
|
|
|
|||
| Total |
$ | 495 | ||
|
|
|
|||
NOTE 7—LEASE COMMITMENTS
The Company is committed under long-term leases for the rental of premises and equipment. These leases have varying renewal options and require, in certain instances, the payment of insurance, real estate taxes and other operating expenses.
At December 31, 2013, the aggregate minimum rental commitments under these non-cancelable operating leases and capital leases, exclusive of renewals, are as follows for the years ended December 31:
| Operating Leases |
Capital Leases |
|||||||
| (in millions) | ||||||||
| 2014 |
$ | 173 | $ | 10 | ||||
| 2015 |
161 | 7 | ||||||
| 2016 |
146 | 7 | ||||||
| 2017 |
119 | 6 | ||||||
| 2018 |
84 | 2 | ||||||
| Thereafter |
213 | 8 | ||||||
|
|
|
|
|
|||||
| Total minimum lease payments |
$ | 896 | $ | 40 | ||||
| Amounts representing interest |
n/a | (9 | ) | |||||
|
|
|
|
|
|||||
| Present value of net minimum lease payments |
n/a | $ | 31 | |||||
|
|
|
|
|
|||||
F-40
Table of Contents
CITIZENS FINANCIAL GROUP, INC.
NOTES TO CONSOLIDATED FINANCIAL STATEMENTS
Rental expense for such leases for the years ended December 31, 2013, 2012, and 2011 totaled $224 million, $203 million, and $228 million, respectively, and is presented in the Consolidated Statements of Operations in occupancy and equipment expense.
NOTE 8—GOODWILL
Goodwill represents the excess of fair value of assets purchased over the purchase price. Since 1988, the Company has closed 26 acquisitions of banks or assets of banks. The changes in the carrying value of goodwill for the years ended December 31, 2013, 2012, and 2011 were:
| Consumer | Commercial | Total | ||||||||||
| (in millions) | ||||||||||||
| Balance at December 31, 2011 |
$ | 6,393 | $ | 4,918 | $ | 11,311 | ||||||
| Impairment losses based on results of interim impairment testing |
— | — | — | |||||||||
|
|
|
|
|
|
|
|||||||
| Balance at December 31, 2012 |
$ | 6,393 | $ | 4,918 | $ | 11,311 | ||||||
| Impairment losses based on results of interim impairment testing |
(4,435 | ) | — | (4,435 | ) | |||||||
| Transfers |
178 | (178 | ) | — | ||||||||
|
|
|
|
|
|
|
|||||||
| Balance at December 31, 2013 |
$ | 2,136 | $ | 4,740 | $ | 6,876 | ||||||
|
|
|
|
|
|
|
|||||||
Accumulated impairment losses related to the Consumer Banking reporting unit totaled $5.9 billion at December 31, 2013, and $1.5 billion at December 31, 2012 and 2011. The accumulated impairment losses related to the Commercial Banking unit at December 31, 2013, 2012 and 2011 totaled $50 million.
The Company performs an annual test for impairment of goodwill at a level of reporting referred to as a reporting unit. The Company has identified and allocated goodwill to the following reporting units based upon reviews of the structure of the Company’s executive team and supporting functions, resource allocations and financial reporting processes:
| • | Consumer Banking |
| • | Commercial Banking |
During 2012, the Global Transaction Services reporting unit was combined with Commercial Banking following a reorganization of operations at RBSG.
The Company tested the value of goodwill as of June 30, 2013, and recorded an impairment charge of $4.4 billion relating to the Consumer Banking reporting unit. The impairment charge, which was a non-cash item, had minimal impact on the Company’s regulatory capital ratios and liquidity, and for segment reporting purposes was included in Other. Refer to Note 24 “Business Segments,” for information regarding segment reporting. No impairment was recorded in 2012 and 2011.
The valuation of goodwill is dependent on forward-looking expectations related to the performance of the U.S. economy and the associated financial performance of the Company. The prolonged delay in the full recovery of the U.S. economy, and the impact of that delay on earnings expectations, prompted a goodwill impairment test as of June 30, 2013. Although the U.S. economy has demonstrated signs of recovery, notably improvements in unemployment and housing, the pace and extent of recovery in these indicators, as well as in overall Gross Domestic Product, have lagged previous expectations. The impact of the slow recovery is most evident in the Company’s Consumer Banking reporting unit. Forecasted economic growth for the U.S., coupled with the continuing impact of
F-41
Table of Contents
CITIZENS FINANCIAL GROUP, INC.
NOTES TO CONSOLIDATED FINANCIAL STATEMENTS
the new regulatory framework in the financial industry, have resulted in a deceleration of expected growth for the Consumer Banking reporting unit’s future profits, and an associated goodwill impairment. Refer to Note 1 “Significant Accounting Policies,” for information regarding the impairment test.
NOTE 9—MORTGAGE BANKING
In its mortgage banking business, the Company sells residential mortgage loans to government-sponsored entities and other parties, who may issue securities backed by pools of such loans. The Company retains no beneficial interests in these sales, but may retain the servicing rights of the loans sold. The Company is obligated to subsequently repurchase a loan if the purchaser discovers a standard representation or warranty violation such as noncompliance with eligibility requirements, customer fraud, or servicing violations. This primarily occurs during a loan file review.
The Company received $4.2 billion, $5.4 billion, and $4.0 billion of proceeds from the sale of residential mortgages in 2013, 2012, and 2011, respectively, and recognized gains on such sales of $66 million, $123 million, and $41 million in 2013, 2012, and 2011, respectively. Pursuant to the standard representations and warranties obligations discussed in the preceding paragraph, the Company repurchased mortgage loans totaling $35 million, $13 million, and $9 million in 2013, 2012, and 2011, respectively.
Mortgage servicing fees, a component of mortgage banking income, were $61 million for the year ended December 31, 2013, and $60 million for the years ended December 31, 2012 and 2011. The Company recorded a recovery of $47 million compared to impairments of $12 million and $42 million for its MSRs for the years ended December 31, 2013, 2012, and 2011, respectively.
Changes related to MSRs were as follows:
| Year Ended December 31, | ||||||||||||
| 2013 | 2012 | 2011 | ||||||||||
| (in millions) | ||||||||||||
| MSRs: |
||||||||||||
| Balance as of January 1 |
$ | 215 | $ | 215 | $ | 209 | ||||||
| Amount capitalized |
45 | 67 | 59 | |||||||||
| Amortization |
(52 | ) | (67 | ) | (53 | ) | ||||||
|
|
|
|
|
|
|
|||||||
| Carrying amount before valuation allowance |
208 | 215 | 215 | |||||||||
|
|
|
|
|
|
|
|||||||
| Valuation allowance for servicing assets: |
||||||||||||
| Balance as of January 1 |
70 | 58 | 16 | |||||||||
| Valuation (recovery) impairment |
(47 | ) | 12 | 42 | ||||||||
|
|
|
|
|
|
|
|||||||
| Balance at end of period |
23 | 70 | 58 | |||||||||
|
|
|
|
|
|
|
|||||||
| Net carrying value of MSRs |
$ | 185 | $ | 145 | $ | 157 | ||||||
|
|
|
|
|
|
|
|||||||
MSRs are presented in other assets on the Consolidated Balance Sheets.
The fair value of MSRs is estimated using a valuation model that calculates the present value of estimated future net servicing cash flows, taking into consideration actual and expected mortgage loan prepayment rates, discount rates, servicing costs, and other economic factors, which are determined based on current market conditions. The valuation model uses a static discounted cash flow methodology incorporating current market interest rates. A static model does not attempt to forecast or
F-42
Table of Contents
CITIZENS FINANCIAL GROUP, INC.
NOTES TO CONSOLIDATED FINANCIAL STATEMENTS
predict the future direction of interest rates; rather it estimates the amount and timing of future servicing cash flows using current market interest rates. The current mortgage interest rate influences the expected prepayment rate and therefore, the length of the cash flows associated with the servicing asset, while the discount rate determines the present value of those cash flows. Expected mortgage loan prepayment assumptions are obtained using the QRM Multi Component prepayment model. The Company periodically obtains third party valuations of its MSRs to assess the reasonableness of the fair value calculated by the valuation model.
The key economic assumptions used to estimate the value of mortgage MSRs are presented in the following tables:
| Year Ended December 31, | ||||||||
| 2013 | 2012 | |||||||
| (dollars in millions) | ||||||||
| Fair value |
$ | 195 | $ | 147 | ||||
| Weighted-average life (in years) |
5.4 | 3.6 | ||||||
| Weighted-average constant prepayment rate |
13.0 | % | 21.4 | % | ||||
| Weighted-average discount rate |
10.8 | % | 10.5 | % | ||||
|
|
|
|
|
|||||
| Year Ended December 31, | ||||||||||||
| 2013 | 2012 | 2011 | ||||||||||
| (in millions) | ||||||||||||
| Prepayment rate: |
||||||||||||
| Decline in fair value from 50 bps adverse change in interest rates |
$ | 9 | $ | 11 | $ | 18 | ||||||
| Decline in fair value from 100 bps adverse change in interest rates |
$ | 18 | $ | 18 | $ | 25 | ||||||
| Weighted-average discount rate: |
||||||||||||
| Decline in fair value from 50 bps adverse change |
$ | 3 | $ | 2 | $ | 2 | ||||||
| Decline in fair value from 100 bps adverse change |
$ | 6 | $ | 4 | $ | 4 | ||||||
|
|
|
|
|
|
|
|||||||
The key economic assumptions used in estimating the fair value of MSRs capitalized during the year were as follows:
| Year Ended December 31, | ||||||||||||
| 2013 | 2012 | 2011 | ||||||||||
| Weighted-average life (in years) |
6.0 | 4.0 | 5.0 | |||||||||
| Weighted-average constant prepayment rate |
12.4 | % | 20.7 | % | 16.2 | % | ||||||
| Weighted-average discount rate |
10.5 | % | 10.5 | % | 10.6 | % | ||||||
|
|
|
|
|
|
|
|||||||
A sensitivity analysis as of December 31, 2013 of current fair value to an immediate 50 bps and 100 bps adverse change in the key economic assumptions presents the decline in fair value that would occur if the adverse change were realized. These sensitivities are hypothetical. The effect of a variation in a particular assumption on the fair value of the mortgage servicing rights is calculated independently without changing any other assumption. In reality, changes in one factor may result in changes in another (for example, changes in interest rates, which drive changes in prepayment speeds, could result in changes in the discount rates), which might amplify or counteract the sensitivities. The primary risk inherent in the Company’s MSRs is an increase in prepayments of the underlying mortgage loans serviced, which is dependent upon market movements of interest rates.
F-43
Table of Contents
CITIZENS FINANCIAL GROUP, INC.
NOTES TO CONSOLIDATED FINANCIAL STATEMENTS
NOTE 10—DEPOSITS
The major components of deposits are as follows:
| December 31, 2013 |
December 31, 2012 |
|||||||
| (in millions) | ||||||||
| Demand |
$ | 24,931 | $ | 25,931 | ||||
| Checking with interest |
13,630 | 14,577 | ||||||
| Regular savings |
7,509 | 7,874 | ||||||
| Money market accounts |
31,245 | 35,102 | ||||||
| Term deposits |
9,588 | 11,664 | ||||||
|
|
|
|
|
|||||
| Total deposits |
$ | 86,903 | $ | 95,148 | ||||
|
|
|
|
|
|||||
The maturity distribution of term deposits as of December 31, 2013 is as follows:
| Year |
(in millions) | |||
| 2014 |
$ | 7,444 | ||
| 2015 |
985 | |||
| 2016 |
465 | |||
| 2017 |
431 | |||
| 2018 and thereafter |
263 | |||
|
|
|
|||
| Total |
$ | 9,588 | ||
|
|
|
|||
Of these deposits, the amount of term deposits with a denomination of $100,000 or more was $3.9 billion at December 31, 2013. The remaining maturities of these deposits are as follows:
| (in millions) | ||||
| Three months or less |
$ | 2,221 | ||
| After three months through six months |
427 | |||
| After six months through twelve months |
718 | |||
| After twelve months |
570 | |||
|
|
|
|||
| Total term deposits |
$ | 3,936 | ||
|
|
|
|||
Excluded from the tables above are deposits totaling $5.3 billion, which includes term deposits of $891 million, that were reclassified to deposits held for sale at December 31, 2013. See Note 17 “Divestitures and Branch Assets and Liabilities Held for Sale” for further discussion. Of these term deposits held for sale, term deposits with a denomination of $100,000 or more were $268 million as of December 31, 2013.
F-44
Table of Contents
CITIZENS FINANCIAL GROUP, INC.
NOTES TO CONSOLIDATED FINANCIAL STATEMENTS
NOTE 11—BORROWED FUNDS
The following is a summary of the Company’s short-term borrowed funds:
| December 31, | ||||||||
| 2013 | 2012 | |||||||
| (in millions) | ||||||||
| Federal funds purchased |
$ | 689 | $ | 1,905 | ||||
| Securities sold under agreements to repurchase |
4,102 | 1,696 | ||||||
| Other short-term borrowed funds |
2,251 | 501 | ||||||
|
|
|
|
|
|||||
| Total short-term borrowed funds |
$ | 7,042 | $ | 4,102 | ||||
|
|
|
|
|
|||||
Key data related to short-term borrowed funds is presented in the following table:
| Year Ended December 31, | ||||||||||||
| 2013 | 2012 | 2011 | ||||||||||
| (dollars in millions) | ||||||||||||
| Weighted-average interest rate at year-end |
||||||||||||
| Federal funds purchased and securities sold under agreements to repurchase |
0.09 | % | 0.10 | % | 0.06 | % | ||||||
| Other short-term borrowed funds |
0.20 | 0.29 | 0.20 | |||||||||
| Maximum amount outstanding at month-end during the year |
||||||||||||
| Federal funds purchased and securities sold under agreements to repurchase |
$ | 5,114 | $ | 4,393 | $ | 6,406 | ||||||
| Other short-term borrowed funds |
2,251 | 5,050 | 4,000 | |||||||||
| Average amount outstanding during the year |
||||||||||||
| Federal funds purchased and securities sold under agreements to repurchase |
$ | 2,400 | $ | 2,716 | $ | 3,808 | ||||||
| Other short-term borrowed funds |
259 | 3,045 | 2,645 | |||||||||
| Weighted-average interest rate during the year |
||||||||||||
| Federal funds purchased and securities sold under agreements to repurchase |
0.31 | % | 0.22 | % | 0.12 | % | ||||||
| Other short-term borrowed funds |
0.44 | 0.33 | 2.51 | |||||||||
|
|
|
|
|
|
|
|||||||
The following is a summary of the Company’s long-term borrowed funds:
| December 31, 2013 |
December 31, 2012 |
|||||||
| (dollars in millions) | ||||||||
| Parent company: |
||||||||
| 4.150% fixed rate subordinated debt, due 2022, UST + 2.50% |
$ | 350 | $ | 350 | ||||
| 5.158% fixed-to-floating rate subordinated debt, (LIBOR + 3.56%) callable, due 2023 |
333 | — | ||||||
| 4.771% fixed rate subordinated debt, due 2023 |
333 | — | ||||||
| 4.691% fixed rate subordinated debt, due 2024 |
334 | — | ||||||
| 1.860% floating-rate (LIBOR + 1.50%) subordinated debt, due 2035 |
— | 289 | ||||||
| Banking Subsidiaries |
||||||||
| Federal Home Loan advances due through 2033 |
25 | 27 | ||||||
| Other |
30 | 28 | ||||||
|
|
|
|
|
|||||
| Total long-term borrowed funds |
$ | 1,405 | $ | 694 | ||||
|
|
|
|
|
|||||
F-45
Table of Contents
CITIZENS FINANCIAL GROUP, INC.
NOTES TO CONSOLIDATED FINANCIAL STATEMENTS
Advances, lines of credit and letters of credit from the FHLB are collateralized by pledged mortgages and pledged securities at least sufficient to satisfy the collateral maintenance level established by the FHLB. The utilized borrowing capacity for FHLB advances and letters of credit was $4.2 billion and $1.1 billion at December 31, 2013 and 2012, respectively. The Company’s available FHLB borrowing capacity was $8.2 billion and $12.8 billion at December 31, 2013 and 2012, respectively. The Company can also borrow from the FRB discount window to meet short-term liquidity requirements. These potential borrowed funds are secured by investment securities and loans. At December 31, 2013, the Company’s unused secured borrowing capacity was approximately $28.9 billion, which includes free securities, FHLB borrowing capacity, and FRB discount window capacity. Additionally, at December 31, 2013, the Company had available a $50 million line of credit with RBS. This line of credit was not drawn upon at December 31, 2013, expired on January 31, 2014, and was not renewed.
The following is a summary of maturities for the Company’s long-term borrowed funds at December 31, 2013:
| Year |
(in millions) | |||
| 2014 or on demand |
$ | — | ||
| 2015 |
3 | |||
| 2016 |
6 | |||
| 2017 |
17 | |||
| 2018 |
13 | |||
| 2019 and thereafter |
1,366 | |||
|
|
|
|||
| Total |
$ | 1,405 | ||
|
|
|
|||
NOTE 12—PREFERRED STOCK
The Company has authorized 30,000 shares of $1 par value non-cumulative, non-voting perpetual preferred stock as of December 31, 2013. The preferred stock ranks senior to the common stock of the Company with respect to dividend rights upon liquidation or dissolution of the Company. The stock is not convertible into any other property of the Company, nor is it redeemable by either the Company or the holder thereof. Dividends are non-cumulative and are payable quarterly at LIBOR plus 180 bps, if and when declared by the Company’s board of directors. In the event of any liquidation, dissolution or winding up of the Company, holders of each share of the preferred stock outstanding are entitled to be paid, out of the assets of the Company available for distribution to stockholders, before any payment is made to the holders of common stock, an amount equal to $100,000 per share of preferred stock then issued and outstanding. There were no shares issued and outstanding during 2013 or 2012.
NOTE 13—EMPLOYEE BENEFITS
Pension Plans
The Company maintains a non-contributory pension plan (the “Plan” or “qualified plan”) that was closed to new hires and re-hires effective January 1, 2009 and frozen to all participants effective December 31, 2012. Benefits under the Plan are based on employees’ years of service and highest 5-year average eligible compensation. The Plan is funded on a current basis, in compliance with the requirements of the ERISA. The Company also provides an unfunded, non-qualified supplemental retirement plan (the “non-qualified plan”), which was closed and frozen consistent with the qualified plan.
F-46
Table of Contents
CITIZENS FINANCIAL GROUP, INC.
NOTES TO CONSOLIDATED FINANCIAL STATEMENTS
RBSG restructured the administration of employee benefit plans during 2008. As a result, the qualified and non-qualified pension plans of certain RBSG subsidiaries (referred to as the Company’s “Affiliates”) merged with the Company’s pension plans. As plan sponsor of the surviving plans, the Company recorded the pension obligation or asset (for the entire qualified plan) and obligation (for the entire non-qualified plan) in the accompanying Consolidated Balance Sheets as of December 31, 2013, 2012 and 2011.
During 2012, the Company offered to vested former employees who had not yet retired a one-time opportunity to receive the value of future defined benefit pension payments as a single lump sum payment. In December 2012, the Company made lump sum payments of $196 million to former employees who accepted the offer, which resulted in a $240 million reduction of the defined benefit obligation and a $92 million settlement charge.
The qualified plan’s allocation by asset category is as follows:
| Target Asset Allocation | Actual Asset Allocation | |||||||||||
| 2014 | 2013 | 2012 | ||||||||||
| Asset Category |
||||||||||||
| Equity securities |
45-55 | % | 52.6 | % | 54.2 | % | ||||||
| Debt securities |
40-50 | 42.9 | 40.2 | |||||||||
| Other |
0-10 | 4.5 | 5.6 | |||||||||
|
|
|
|
|
|||||||||
| Total |
100.0 | % | 100.0 | % | ||||||||
|
|
|
|
|
|||||||||
The written Pension Plan Investment Policy, set forth by the RBS Americas Retirement Committee, formulates those investment principles and guidelines that are appropriate to the needs and objectives of the Plan, and defines the management, structure, and monitoring procedures adopted for the ongoing operation of the aggregate funds of the Plan. Stated goals and objectives are:
| • | Total return, consistent with prudent investment management, is the primary goal of the Plan. The nominal rate of return objective should meet or exceed the actuarial rate return target. In addition, assets of the Plan shall be invested to ensure that principal is preserved and enhanced over time; |
| • | The total return for the overall Plan shall meet or exceed the Plan’s Policy Index; |
| • | Total portfolio risk exposure should generally rank in the mid-range of comparable funds. Risk-adjusted returns are expected to consistently rank in the top-half of comparable funds; and |
| • | Investment managers shall exceed the return of the designated benchmark index and rank in the top-half of the appropriate asset class and style universe. |
The RBS Americas Retirement Committee reviews, at least annually, the assets and net cash flow of the Plan, discusses the current economic outlook and the Plan’s investment strategy with the investment managers, reviews the current asset mix and its compliance with the Policy, and receives and considers statistics on the investment performance of the Plan.
The Plan’s investment advisors may vary equity commitments from 90% to 100% of assets under management. American Depository Receipts may be held by each domestic stock manager, in proportions that each manager shall deem appropriate. The maximum weight of the stock of any one company at the total portfolio level is 5% at market.
F-47
Table of Contents
CITIZENS FINANCIAL GROUP, INC.
NOTES TO CONSOLIDATED FINANCIAL STATEMENTS
The minimum quality rating of any fixed income issue held in an investment grade portfolio should be B, and the overall weighted-average quality should be A or higher. The overall quality of the high yield fixed income portfolio should be B or better. The average duration (interest rate sensitivity) of an actively managed fixed income portfolio should not exceed seven years.
Securities of an individual issuer, except the U.S. government and agencies and sovereign nations and their agencies, should not constitute more than 8% of an investment manager’s portfolio at any time, at fair value.
The assets of the qualified plan may be invested in any or all of the following asset categories:
| a) | Equity-oriented investments: |
| • | domestic and foreign common and preferred stocks, and related rights, warrants, convertible debentures, and other common share equivalents |
| • | equity index futures, and options on equity index futures |
| • | exchange traded options on equities |
| • | venture capital funds / partnerships |
| b) | Fixed income-oriented investments: |
| • | domestic and foreign bonds, debentures and notes |
| • | mortgages |
| • | mortgage-backed securities |
| • | asset-backed securities |
| • | guaranteed investment contracts or certificates |
| • | term deposits |
| • | money market securities or cash |
| • | financial futures and options on financial futures |
| • | forward contracts |
| • | options on financial instruments |
Unless specifically approved by the RBS Americas Retirement Committee, certain securities, strategies and investments are ineligible for inclusion within this Plan’s asset base. Among these are:
| • | privately-placed or other non-marketable debt, except securities issued under Rule 144A; |
| • | lettered, legend or other so-called restricted stock; |
| • | commodities (only the PIMCO All Asset Fund has been approved, which invests in a variety of PIMCO funds, including the PIMCO Commodity Real Return Fund); |
| • | straight preferred stocks and non-taxable municipal securities should not normally be held unless pricing anomalies in the marketplace suggest the likelihood of near-term capital gains when normal spread relationships resume; |
| • | unhedged short sales (market neutral hedge fund has been approved); |
| • | direct investments in private placements, real estate, oil and gas and venture capital; and |
| • | any transaction prohibited by ERISA. |
F-48
Table of Contents
CITIZENS FINANCIAL GROUP, INC.
NOTES TO CONSOLIDATED FINANCIAL STATEMENTS
In addition, derivative instruments are permitted for the following reasons: hedging, creation of market exposures and management of country and asset allocation exposure. Derivative instruments are prohibited for the following reasons: leverage and unrelated speculation.
In selecting the expected long-term rate of return on assets, the Company considers the average rate of earnings expected on the funds invested or to be invested to provide for the benefits of this Plan. This includes considering the trust’s asset allocation and the expected returns likely to be earned over the life of the Plan. This basis is consistent with the prior year.
Changes in the fair value of defined benefit pension plan assets, projected benefit obligation, funded status, and accumulated benefit obligation are summarized as follows:
| Year Ended December 31, | ||||||||||||||||||||||||
| Qualified Plan | Non-Qualified Plan | |||||||||||||||||||||||
| 2013 | 2012 | 2011 | 2013 | 2012 | 2011 | |||||||||||||||||||
| (in millions) | ||||||||||||||||||||||||
| Fair value of plan assets as of January 1 |
$ | 998 | $ | 1,106 | $ | 975 | $ | — | $ | — | $ | — | ||||||||||||
| Actual return (loss) on plan assets |
111 | 142 | (23 | ) | — | — | — | |||||||||||||||||
| Employer contributions |
— | — | 200 | 8 | 8 | 7 | ||||||||||||||||||
| Settlements |
— | (196 | ) | — | — | — | — | |||||||||||||||||
| Benefits and administrative expenses paid |
(78 | ) | (54 | ) | (46 | ) | (8 | ) | (8 | ) | (7 | ) | ||||||||||||
|
|
|
|
|
|
|
|
|
|
|
|
|
|||||||||||||
| Fair value of plan assets as of December 31 |
1,031 | 998 | 1,106 | — | — | — | ||||||||||||||||||
| Projected benefit obligation |
1,026 | 1,185 | 1,118 | 107 | 116 | 109 | ||||||||||||||||||
|
|
|
|
|
|
|
|
|
|
|
|
|
|||||||||||||
| Pension asset (obligation) |
$ | 5 | $ | (187 | ) | $ | (12 | ) | $ | (107 | ) | $ | (116 | ) | $ | (109 | ) | |||||||
|
|
|
|
|
|
|
|
|
|
|
|
|
|||||||||||||
| Accumulated benefit obligation |
$ | 1,026 | $ | 1,185 | $ | 1,100 | $ | 107 | $ | 116 | $ | 109 | ||||||||||||
|
|
|
|
|
|
|
|
|
|
|
|
|
|||||||||||||
The table below summarizes the beneficial interest in the pension asset (obligation) for the qualified and non-qualified plans between the Company and Affiliates:
| Year Ended December 31, | ||||||||||||||||||||||||
| Qualified Plan | Non-Qualified Plan | |||||||||||||||||||||||
| 2013 | 2012 | 2011 | 2013 | 2012 | 2011 | |||||||||||||||||||
| (in millions) | ||||||||||||||||||||||||
| Citizens |
$ | 56 | $ | (116 | ) | $ | 33 | $ | (101 | ) | $ | (113 | ) | $ | (107 | ) | ||||||||
| Affiliates |
(51 | ) | (71 | ) | (45 | ) | (6 | ) | (3 | ) | (2 | ) | ||||||||||||
|
|
|
|
|
|
|
|
|
|
|
|
|
|||||||||||||
| Pension asset (obligation) |
$ | 5 | $ | (187 | ) | $ | (12 | ) | $ | (107 | ) | $ | (116 | ) | $ | (109 | ) | |||||||
|
|
|
|
|
|
|
|
|
|
|
|
|
|||||||||||||
The Company’s share of the 2012 single lump sum payments to vested former employees described earlier in this Note for the qualified plan was $146 million, while $15 million of the lump sum payments were due from Affiliates as of December 31, 2012. There were no balances due to or due from Affiliates as of December 31, 2013 or December 31, 2011.
F-49
Table of Contents
CITIZENS FINANCIAL GROUP, INC.
NOTES TO CONSOLIDATED FINANCIAL STATEMENTS
The pretax amounts recognized (for the qualified and non-qualified plans) in AOCI are as follows:
| December 31, | ||||||||
| 2013 | 2012 | |||||||
| (in millions) | ||||||||
| Net prior service credit |
$ | — | $ | — | ||||
| Net actuarial loss |
414 | 602 | ||||||
|
|
|
|
|
|||||
| Total loss recognized in accumulated other comprehensive income |
$ | 414 | $ | 602 | ||||
|
|
|
|
|
|||||
Approximately $10 million of net actuarial loss recorded in AOCI as of December 31, 2013 is expected to be recognized as a component of net periodic benefit costs during 2014.
Other changes in plan assets and benefit obligations (for the qualified and non-qualified plans) recognized in OCI include the following:
| Year Ended December 31, | ||||||||||||
| 2013 | 2012 | 2011 | ||||||||||
| (in millions) | ||||||||||||
| Net periodic pension (income) / cost |
$ | (3 | ) | $ | 150 | $ | 39 | |||||
| Net actuarial (gain) loss |
(174 | ) | 169 | 242 | ||||||||
| Amortization of prior service credit |
— | 1 | 1 | |||||||||
| Amortization of net actuarial loss |
(14 | ) | (38 | ) | (20 | ) | ||||||
| Settlement |
— | (92 | ) | — | ||||||||
|
|
|
|
|
|
|
|||||||
| Total recognized in other comprehensive income |
(188 | ) | 40 | 223 | ||||||||
|
|
|
|
|
|
|
|||||||
| Total recognized in net periodic pension cost and other comprehensive income |
$ | (191 | ) | $ | 190 | $ | 262 | |||||
|
|
|
|
|
|
|
|||||||
There were no settlements for the years ended December 31, 2013 and 2011. The Company’s share of the $92 million settlement was $77 million for the year ended December 31, 2012.
Weighted-average rates assumed in determining the actuarial present value of benefit obligations and net periodic benefit cost are as follows:
| Year Ended December 31, | ||||||||||||
| 2013 | 2012 | 2011 | ||||||||||
| Assumptions for benefit obligations: |
||||||||||||
| Discount rate—qualified plan |
5.00 | % | 4.125 | % | 5.25 | % | ||||||
| Discount rate—non-qualified plan |
4.75 | 4.00 | 5.00 | |||||||||
| Compensation increase rate |
N/A | N/A | 4.75 | |||||||||
| Expected long-term rate of return on plan assets |
7.50 | 7.75 | 8.25 | |||||||||
|
|
|
|
|
|
|
|||||||
| Assumptions for net periodic pension cost: |
||||||||||||
| Discount rate—qualified plan |
4.125 | 5.25 | 5.75 | |||||||||
| Discount rate—non-qualified plan |
4.00 | 5.00 | 5.63 | |||||||||
| Compensation increases—qualified and non-qualified plans |
N/A | 4.75 | 4.75 | |||||||||
| Expected long-term rate of return on plan assets |
7.50 | 7.75 | 8.25 | |||||||||
|
|
|
|
|
|
|
|||||||
The Company expects to contribute $8 million to its non-qualified plan in 2014.
F-50
Table of Contents
CITIZENS FINANCIAL GROUP, INC.
NOTES TO CONSOLIDATED FINANCIAL STATEMENTS
The following benefit payments for the qualified and non-qualified plans reflect expected future service, as appropriate, that are expected to be paid, are as follows:
| (in millions) | ||||
| Expected benefit payments by fiscal year ended: |
||||
| December 31, 2014 |
$ | 65 | ||
| December 31, 2015 |
65 | |||
| December 31, 2016 |
66 | |||
| December 31, 2017 |
67 | |||
| December 31, 2018 |
68 | |||
| December 31, 2019 – 2023 |
361 | |||
Fair Value Measurements
The following valuation techniques are used to measure the qualified pension plan assets at fair value:
Cash and money market funds:
Cash and money market funds represent instruments that generally mature in one year or less and are valued at cost, which approximates fair value. Cash and money market funds are classified as Level 2.
Mutual funds:
Where observable quoted prices are available in an active market, mutual funds are classified as Level 1 in the fair value hierarchy. If quoted market prices are not available, mutual funds are classified as Level 2 because they currently trade in active markets and the Company expects all future purchases and sales to be valued at current net asset value.
Corporate bonds, municipal obligations, U.S. government obligations and Non-U.S. government obligations:
Corporate bonds, municipal obligations, U.S. government obligations and Non-U.S. government obligations are valued at the quoted market prices determined in the active markets in which the bonds are traded. If quoted market prices are not available, the fair value of the security is estimated using pricing models, quoted prices of securities with similar characteristics or discounted cash flows. These investments are classified as Level 2, because they currently trade in active markets for similar securities and the inputs to the valuations are observable.
Limited partnerships:
Limited partnerships are valued at estimated fair value based on their proportionate share of the limited partnerships’ fair value as recorded in the limited partnerships’ audited financial statements. The limited partnerships invest primarily in readily marketable securities. The limited partnerships allocate gains, losses and expenses to the partners based on ownership percentage as described in the partnership agreements. The instruments that can be transacted at the investment net asset value are classified as Level 2 because the Company expects all future purchases and sales to be valued at current net asset value. The instruments that cannot be transacted at the investment net asset value are classified as Level 3 investments.
F-51
Table of Contents
CITIZENS FINANCIAL GROUP, INC.
NOTES TO CONSOLIDATED FINANCIAL STATEMENTS
Common collective funds:
The fair value is estimated using the net asset value received from the investment companies. The instruments that can be transacted at the investment net asset value are classified as Level 2 because the Company expects all future purchases to be valued at current net asset value. Instruments that cannot be transacted at the investment net asset value are classified as Level 3 investments.
Derivatives-Managed portfolio:
The managed portfolio invests in certain derivatives that are valued at the settlement price determined by the relevant exchange and are classified as Level 2 in the fair value hierarchy.
The following tables present the qualified pension plan assets measured at fair value within the fair value hierarchy:
| Fair Value Measurements as of December 31, 2013 | ||||||||||||||||
| Total | Level 1 | Level 2 | Level 3 | |||||||||||||
| (in millions) | ||||||||||||||||
| Cash and money market funds |
$ | 8 | $ | — | $ | 8 | $ | — | ||||||||
| Mutual funds |
||||||||||||||||
| International equity funds |
28 | 28 | — | — | ||||||||||||
| Income funds |
43 | — | 43 | — | ||||||||||||
| Common and collective funds |
||||||||||||||||
| International equity common and collective funds |
115 | — | 115 | — | ||||||||||||
| Balanced common and collective funds |
474 | — | 474 | — | ||||||||||||
| Fixed income common and collective funds |
117 | — | 117 | — | ||||||||||||
| Managed Fund |
||||||||||||||||
| Cash and money market funds |
1 | — | 1 | — | ||||||||||||
| Corporate bonds |
105 | — | 105 | — | ||||||||||||
| Municipal obligations |
2 | — | 2 | — | ||||||||||||
| U.S. government obligations |
9 | — | 9 | — | ||||||||||||
| Non-U.S. government obligations |
3 | — | 3 | — | ||||||||||||
| Limited partnerships |
126 | — | 126 | — | ||||||||||||
|
|
|
|
|
|
|
|
|
|||||||||
| Total assets measured at fair value |
$ | 1,031 | $ | 28 | $ | 1,003 | $ | — | ||||||||
|
|
|
|
|
|
|
|
|
|||||||||
F-52
Table of Contents
CITIZENS FINANCIAL GROUP, INC.
NOTES TO CONSOLIDATED FINANCIAL STATEMENTS
| Fair Value Measurements as of December 31, 2012 | ||||||||||||||||
| Total | Level 1 | Level 2 | Level 3 | |||||||||||||
| (in millions) | ||||||||||||||||
| Cash and money market funds |
$ | 20 | $ | — | $ | 20 | $ | — | ||||||||
| Mutual funds |
||||||||||||||||
| International equity funds |
31 | 31 | — | — | ||||||||||||
| Income funds |
49 | — | 49 | — | ||||||||||||
| Common and collective funds |
||||||||||||||||
| International equity common and collective funds |
115 | — | 115 | — | ||||||||||||
| Balanced common and collective funds |
395 | — | 395 | — | ||||||||||||
| Fixed income common and collective funds |
123 | — | 123 | — | ||||||||||||
| Managed Fund |
||||||||||||||||
| Cash and money market funds |
5 | — | 5 | — | ||||||||||||
| U.S. government obligations |
15 | — | 15 | — | ||||||||||||
| Municipal obligations |
2 | — | 2 | — | ||||||||||||
| Corporate bonds |
97 | — | 97 | — | ||||||||||||
| Non-U.S. government obligations |
4 | — | 4 | — | ||||||||||||
| Derivative assets- swaps |
1 | — | 1 | — | ||||||||||||
| Derivative liabilities- swaps |
(1 | ) | — | (1 | ) | — | ||||||||||
| Limited partnerships |
142 | — | 142 | — | ||||||||||||
|
|
|
|
|
|
|
|
|
|||||||||
| Total assets measured at fair value |
$ | 998 | $ | 31 | $ | 967 | $ | — | ||||||||
|
|
|
|
|
|
|
|
|
|||||||||
In keeping with the Plan’s fixed income strategic objectives, the December 31, 2013 holdings of the managed fund included exchange traded Eurodollar futures contracts with a notional value of $324 million and an unrealized gain (fair value) of under $1 million. There were no transfers among Levels 1, 2 or 3 during the years ended December 31, 2013, 2012, and 2011.
The fair values of participation units in the common and collective trusts are based on net asset value after adjustments to reflect all fund investments at fair value. The unfunded commitments, redemption frequency, and redemption notice period for those Plan investments that utilize net asset value to determine the fair value as of December 31, 2013 and 2012, are as follows:
| Investments |
Fair Value Estimated Using Net Asset Value per Share as of December 31 | |||||||||||||||||
| 2013 | 2012 | Unfunded Commitment |
Redemption Frequency |
Redemption Restrictions |
Notice Period | |||||||||||||
| (dollars in millions) | ||||||||||||||||||
| Equity Mutual Fund(1) |
$ | 43 | $ | 49 | $ | — | Daily | None | 1-7 days | |||||||||
| Common and Collective Funds: |
||||||||||||||||||
| Domestic equity funds(2) |
— | — | — | Daily | None | 5-15 days | ||||||||||||
| International equity funds(3) |
115 | 115 | — | Monthly | None | 3 days | ||||||||||||
| Balanced funds(4) |
474 | 395 | — | Daily | None | 2-3 days | ||||||||||||
| Fixed income fund(5) |
117 | 123 | — | Daily | None | 3 days | ||||||||||||
| Limited Partnerships: |
||||||||||||||||||
| International Equity(6) |
116 | 130 | — | Daily | None | 10 days | ||||||||||||
| Offshore Feeder Fund(7) |
10 | 12 | — | Monthly | None | 14 days | ||||||||||||
|
|
|
|
|
|
|
|||||||||||||
| Total |
$ | 875 | $ | 824 | $ | — | ||||||||||||
|
|
|
|
|
|
|
|||||||||||||
| (1) | The equity mutual fund seeks to offer participants capital appreciation by primarily investing in common stocks via investments in several underlying funds of the same fund family. The principle investment objective is to generate positive total return. |
F-53
Table of Contents
CITIZENS FINANCIAL GROUP, INC.
NOTES TO CONSOLIDATED FINANCIAL STATEMENTS
| (2) | The domestic equity funds seek to offer participants capital appreciation by primarily investing in common stocks of companies domiciled in the U.S. Strategies may also include total return while limiting the exposure to the equity market risk. |
| (3) | The international equity funds seek medium to long-term capital appreciation principally through global investments in readily marketable high-quality equity securities of companies with improving fundamentals and attractive valuations. |
| (4) | The balanced funds seek to maximize total return by investing in global equities and fixed income transferable securities that may include some high yield fixed income transferable securities. The fund may invest in securities denominated in currencies other than U.S. dollars. |
| (5) | The fixed income fund seeks to outperform the Barclays Capital U.S. Corporate Investment Grade Bond Index or similar benchmark. |
| (6) | The international equity limited partnership focuses on global and agribusiness strategies, blending a thematic framework with security-level analysis and customized valuation techniques. The fund conducts primary research to identify investable themes that provide clients with diversification benefits and help create opportunities for outperformance over a market cycle. |
| (7) | The offshore feeder fund operates under a “master / feeder” structure whereby it invests substantially all assets in the GMO Multi-Strategy Fund (Onshore) (the “master fund”). The investment objective of the master fund is capital appreciation with a target performance of the Citigroup Three-Month Treasury Bill plus 8% with a standard deviation of 5%. The investment advisor plans to pursue the master fund’s objective through a combination of investments in other pooled vehicles. |
Postretirement Benefits
The Company and Affiliates merged their postretirement plans into a single postretirement plan in 2008 and continue to provide health care insurance benefits for certain retired employees and their spouses. Employees enrolled in medical coverage immediately prior to retirement and meeting eligibility requirements can elect retiree medical coverage. Employees and covered spouses can continue coverage at the full cost, except for a small group described below. However, coverage must be elected at the time of retirement and cannot be elected at a future date. Spouses may be covered only if the spouse is covered at the time of the employee’s retirement.
The Company reviews coverage on an annual basis and reserves the right to modify or cancel coverage at any renewal date. The Company’s cost sharing for certain full-time employees, who were hired prior to August 1, 1993 with 25 years of service who reach retirement age (under age 65) while employed by the Company is 70%; for those with 15-24 years of service, the Company’s share is 50%. Also, the Company shares in the cost for retiree medical benefits for a closed group of grandfathered arrangements from acquisitions. A small, closed group of retirees receive life insurance coverage.
The accumulated postretirement benefit obligation was $27 million and $30 million at December 31, 2013 and 2012, respectively. The funded status was a liability of $27 million and $30 million at December 31, 2013 and 2012, respectively, and is reported in other liabilities in the accompanying Consolidated Balance Sheets. The total gain recognized in OCI was $367 thousand at December 31, 2013 and a total cost recognized in OCI was $1 million at December 31, 2012.
The Company contributed and paid benefits of $3 million, $2 million, and $3 million during 2013, 2012 and 2011, respectively. The benefits expected to be paid in each of the next five years is $2 million, and $9 million is expected to be paid during the five years from 2019 through 2023. The Company expects to contribute approximately $2 million to the plan during 2014.
The weighted-average discount rate assumed in determining the actuarial present value of benefit obligations was 4.625% and 3.88% as of December 31, 2013 and 2012, respectively.
For measurement purposes, a 7.5% and 8.0% assumed annual rate of increase in the per capita cost of covered health care benefits was used for the years ended December 31, 2013 and 2012, respectively, decreasing gradually down to a 5% ultimate rate over the next several years.
F-54
Table of Contents
CITIZENS FINANCIAL GROUP, INC.
NOTES TO CONSOLIDATED FINANCIAL STATEMENTS
Weighted-average rates assumed in determining the net periodic benefit cost of the postretirement benefits plan are as follows:
| Postretirement Benefits Plan | ||||||||
| 2013 | 2012 | |||||||
| (dollars in millions) | ||||||||
| Discount rate |
3.875 | % | 5.00 | % | ||||
| Rate of compensation increase |
— | — | ||||||
|
|
|
|
|
|||||
| Healthcare cost trend rate for the next year |
5.00 | 5.00 | ||||||
| Effect on accumulated postretirement benefit obligation |
||||||||
| One percent increase |
$ | 2 | $ | 2 | ||||
| One percent decrease |
(2 | ) | (2 | ) | ||||
|
|
|
|
|
|||||
Postemployment Benefits
The Company provides postemployment benefits to certain former and inactive employees, primarily the Company’s long-term disability plan. Effective January 1, 2013, the Company required claimants receiving long-term disability benefits for 24 months to apply for Medicare approval so that Medicare is the primary payer of medical benefits. (Benefit) Cost recorded for the years ended December 31, 2013, 2012 and 2011 were ($3) million, ($1) million, and $3 million, respectively.
401(k) Plan
The Company sponsors an employee tax-deferred 401(k) plan under which individual employee contributions to the plan are matched by the Company. For periods prior to 2012, contributions are matched at 100% up to an overall limitation of 6% on a pay period basis. Employees hired or rehired on or after January 1, 2009 receive an additional 3% of earnings, subject to limits set by the Internal Revenue Service. Effective January 1, 2013, contributions are matched at 100% up to an overall limitation of 5% on a pay period basis. Substantially all employees will receive an additional 2% of earnings, subject to limits set by the Internal Revenue Service. Amounts contributed by the Company for the years ended December 31, 2013, 2012, and 2011 were $70 million, $60 million, and $57 million, respectively.
NOTE 14—INCOME TAXES
Total income tax (benefit) expense was as follows:
| Year Ended December 31, |
||||||||||||
| 2013 | 2012 | 2011 | ||||||||||
| (in millions) | ||||||||||||
| Income tax (benefit) expense |
$ | (42 | ) | $ | 381 | $ | 272 | |||||
| Tax effect of changes in OCI |
(194 | ) | 125 | 89 | ||||||||
|
|
|
|
|
|
|
|||||||
| Total comprehensive income tax (benefit) expense |
$ | (236 | ) | $ | 506 | $ | 361 | |||||
|
|
|
|
|
|
|
|||||||
F-55
Table of Contents
CITIZENS FINANCIAL GROUP, INC.
NOTES TO CONSOLIDATED FINANCIAL STATEMENTS
Components of income tax expense (benefit) are as follows:
| Current | Deferred | Total | ||||||||||
| (in millions) | ||||||||||||
| Year Ended December 31, 2013 |
||||||||||||
| U.S. federal |
$ | 3 | $ | (47 | ) | $ | (44 | ) | ||||
| State and local |
8 | (6 | ) | 2 | ||||||||
|
|
|
|
|
|
|
|||||||
| Total |
$ | 11 | $ | (53 | ) | $ | (42 | ) | ||||
|
|
|
|
|
|
|
|||||||
| Year Ended December 31, 2012 |
||||||||||||
| U.S. federal |
$ | 19 | $ | 269 | $ | 288 | ||||||
| State and local |
56 | 37 | 93 | |||||||||
|
|
|
|
|
|
|
|||||||
| Total |
$ | 75 | $ | 306 | $ | 381 | ||||||
|
|
|
|
|
|
|
|||||||
| Year Ended December 31, 2011 |
||||||||||||
| U.S. federal |
$ | (22 | ) | $ | 220 | $ | 198 | |||||
| State and local |
42 | 32 | 74 | |||||||||
|
|
|
|
|
|
|
|||||||
| Total |
$ | 20 | $ | 252 | $ | 272 | ||||||
|
|
|
|
|
|
|
|||||||
The effective income tax rate differed from the U.S. federal income tax rate of 35% in 2013, 2012 and 2011 as follows:
| Year Ended December 31, | ||||||||||||||||||||||||
| 2013 | 2012 | 2011 | ||||||||||||||||||||||
| Amount | Rate | Amount | Rate | Amount | Rate | |||||||||||||||||||
| (dollars in millions) | ||||||||||||||||||||||||
| U.S. Federal income tax (benefit) expense and tax rate |
$ | (1,214 | ) | 35.00 | % | $ | 359 | 35.00 | % | $ | 270 | 35.00 | % | |||||||||||
| Increase (decrease) resulting from: |
||||||||||||||||||||||||
| Goodwill Impairment |
1,217 | (35.09 | ) | — | — | — | — | |||||||||||||||||
| State and local income taxes (net of federal benefit) |
1 | (0.03 | ) | 61 | 5.93 | 48 | 6.24 | |||||||||||||||||
| Changes in uncertain tax positions |
— | — | — | 0.01 | (1 | ) | (0.07 | ) | ||||||||||||||||
| Bank-owned life insurance |
(17 | ) | 0.50 | (18 | ) | (1.76 | ) | (17 | ) | (2.21 | ) | |||||||||||||
| Tax-exempt interest |
(13 | ) | 0.37 | (12 | ) | (1.14 | ) | (10 | ) | (1.23 | ) | |||||||||||||
| Low income housing partnerships |
(11 | ) | 0.32 | (8 | ) | (0.76 | ) | (7 | ) | (0.93 | ) | |||||||||||||
| Other |
(5 | ) | 0.14 | (1 | ) | (0.10 | ) | (11 | ) | (1.47 | ) | |||||||||||||
|
|
|
|
|
|
|
|
|
|
|
|
|
|||||||||||||
| Total income tax (benefit) expense and rate |
$ | (42 | ) | 1.21 | % | $ | 381 | 37.18 | % | $ | 272 | 35.33 | % | |||||||||||
|
|
|
|
|
|
|
|
|
|
|
|
|
|||||||||||||
The decrease in the effective rate from 2012 to 2013 represents the tax rate impact of the 2013 goodwill impairment in addition to the tax rate impact of a 2012 state tax settlement. The state tax settlement represents 2.45% of the total tax rate for 2012 and is included in the rate reconciliation as a component of state and local income taxes (net of federal benefit).
F-56
Table of Contents
CITIZENS FINANCIAL GROUP, INC.
NOTES TO CONSOLIDATED FINANCIAL STATEMENTS
The tax effects of temporary differences that give rise to significant portions of the deferred tax assets and liabilities are presented below:
| December 31, 2013 |
December 31, 2012 |
|||||||
| (in millions) | ||||||||
| Deferred tax assets: |
||||||||
| Unrealized net loss on securities and derivatives |
$ | 397 | $ | 203 | ||||
| Allowance for credit losses |
475 | 486 | ||||||
| Net operating loss carryforwards |
129 | 266 | ||||||
| Accrued expenses not currently deductible |
149 | 150 | ||||||
| Investment and other tax credit carryforwards |
62 | 47 | ||||||
| Deferred income |
35 | 23 | ||||||
| Fair value marks |
30 | 23 | ||||||
| Other |
— | 3 | ||||||
|
|
|
|
|
|||||
| Total deferred tax assets |
1,277 | 1,201 | ||||||
| Valuation allowance |
(137 | ) | (163 | ) | ||||
|
|
|
|
|
|||||
| Deferred tax assets, net of valuation allowance |
1,140 | 1,038 | ||||||
|
|
|
|
|
|||||
| Deferred tax liabilities: |
||||||||
| Leasing transactions |
811 | 739 | ||||||
| Amortization of intangibles |
296 | 572 | ||||||
| Depreciation |
124 | 95 | ||||||
| Pension |
56 | 47 | ||||||
| MSRs |
50 | 31 | ||||||
| Other |
2 | — | ||||||
|
|
|
|
|
|||||
| Total deferred tax liabilities |
1,339 | 1,484 | ||||||
|
|
|
|
|
|||||
| Net deferred tax liability |
$ | 199 | $ | 446 | ||||
|
|
|
|
|
|||||
Certain 2012 balances in the table above were restated to better conform to the current year presentation. This adjustment expanded the pension category to include other employee compensation plans that were included as accrued expenses not currently deductible in 2012.
At December 31, 2013, the Company had deferred tax assets of $191 million in connection with federal and state net operating loss and credit carryforwards. At December 31, 2013, the federal net operating loss carryforward was approximately $19 million, the state net operating loss carryforward was approximately $110 million, federal tax credit carryforwards were approximately $55 million and state tax credit carryforwards were approximately $7 million. These net operating losses and credits will expire, if not utilized, in the years 2014 through 2033, except for approximately $129 thousand of federal alternative minimum tax credits, which do not expire.
The Company had at December 31, 2013, a valuation allowance of $137 million against the deferred tax assets related to certain state temporary differences, net operating losses and credits, as it is management’s current assessment that it is more likely than not that the Company will not recognize a portion of the deferred tax asset related to these items. The valuation allowance decreased $26 million during the year ended December 31, 2013.
Effective with fiscal year ended September 30, 1997, the reserve method for bad debts was no longer permitted for tax purposes. The repeal of the reserve method required the recapture of the
F-57
Table of Contents
CITIZENS FINANCIAL GROUP, INC.
NOTES TO CONSOLIDATED FINANCIAL STATEMENTS
reserve balance in excess of certain base year reserve amounts attributable to years ended prior to 1988. At December 31, 2013 the Company’s base year loan loss reserves attributable to years ended prior to 1988, for which no deferred income taxes have been provided, was $557 million. This base year reserve may become taxable if certain distributions are made with respect to the stock of the Company or if the Company ceases to qualify as a bank for tax purposes. No actions are planned that would cause this reserve to become wholly or partially taxable.
The Company files income tax returns in the U.S. federal jurisdiction and various state and local jurisdictions. With few exceptions, the Company is no longer subject to U.S. federal or state and local income tax examinations by major tax authorities for years before 2008.
A reconciliation of the beginning and ending amount of unrecognized tax benefits is as follows:
| December 31, 2013 |
December 31, 2012 |
December 31, 2011 |
||||||||||
| (in millions) | ||||||||||||
| Balance at the beginning of the period, January 1 |
$ | 34 | $ | 136 | $ | 104 | ||||||
| Gross increases for tax positions related to prior years |
— | 29 | 48 | |||||||||
| Gross decreases for tax positions related to prior years |
— | — | (6 | ) | ||||||||
| Decreases for tax positions relating to settlements with taxing authorities |
(1 | ) | (134 | ) | (10 | ) | ||||||
| Gross increases for tax positions related to the current years |
— | 3 | — | |||||||||
|
|
|
|
|
|
|
|||||||
| Balance at end of period |
$ | 33 | $ | 34 | $ | 136 | ||||||
|
|
|
|
|
|
|
|||||||
Included in the total amount of unrecognized tax benefits at December 31, 2013, are potential benefits of $23 million that, if recognized, would affect the effective tax rate.
The Company classifies interest and penalties related to unrecognized tax benefits as a component of income taxes. The Company accrued $2 million, $14 million, and $18 million of interest expense through December 31, 2013, 2012, and 2011, respectively. The Company had approximately $14 million, $12 million, and $55 million accrued for the payment of interest at December 31, 2013, 2012, and 2011, respectively. There were no amounts accrued for penalties as of December 31, 2013, 2012, and 2011, and there were no penalties recognized during 2013, 2012, and 2011.
It is anticipated that during 2014 the Company will enter into settlement agreements with certain state taxing authorities regarding the issue of nexus. Settlement of these uncertainties would reduce the unrecognized tax benefit by $19 million. During 2012, the Company settled a state tax issue for the years 2003 through 2008 related to its real estate investment trust and various passive investment companies. Settlement of these uncertainties reduced the unrecognized tax benefit by $134 million.
NOTE 15—DERIVATIVES
In the normal course of business, the Company enters into a variety of derivative transactions in order to meet the financing needs of its customers and to reduce its own exposure to fluctuations in interest rates and foreign currency exchange rates. The Company does not use derivatives for speculative purposes.
F-58
Table of Contents
CITIZENS FINANCIAL GROUP, INC.
NOTES TO CONSOLIDATED FINANCIAL STATEMENTS
The Company’s derivative instruments are recognized on the Consolidated Balance Sheets at fair value. Information regarding the valuation methodology and inputs used to estimate the fair value of the Company’s derivative instruments is described in Note 19 “Fair Value Measurements.”
The following table identifies derivative instruments included on the Consolidated Balance Sheets in derivative assets and derivative liabilities:
| December 31, 2013 | December 31, 2012 | |||||||||||||||||||||||
| Notional Amount(1) |
Derivative Assets |
Derivative Liabilities |
Notional Amount(1) |
Derivative Assets |
Derivative Liabilities |
|||||||||||||||||||
| (in millions) | ||||||||||||||||||||||||
| Derivatives designated as hedging instruments: |
||||||||||||||||||||||||
| Interest rate swaps |
$ | 5,500 | $ | 23 | $ | 412 | $ | 4,200 | $ | 1 | $ | 257 | ||||||||||||
| Derivatives not designated as hedging instruments: |
||||||||||||||||||||||||
| Interest rate swaps |
29,355 | 654 | 558 | 31,227 | 1,102 | 1,033 | ||||||||||||||||||
| Foreign exchange contracts |
7,771 | 94 | 87 | 5,978 | 71 | 67 | ||||||||||||||||||
| Other contracts |
569 | 7 | 10 | 2,815 | 35 | 15 | ||||||||||||||||||
|
|
|
|
|
|
|
|
|
|||||||||||||||||
| Total derivatives not designated as hedging instruments |
755 | 655 | 1,208 | 1,115 | ||||||||||||||||||||
|
|
|
|
|
|
|
|
|
|||||||||||||||||
| Gross derivative fair values |
778 | 1,067 | 1,209 | 1,372 | ||||||||||||||||||||
| Less: Gross amounts offset in the Consolidated Balance Sheets(2) |
(128 | ) | (128 | ) | (54 | ) | (54 | ) | ||||||||||||||||
|
|
|
|
|
|
|
|
|
|||||||||||||||||
| Total net derivative fair values presented in the Consolidated Balance Sheets(3) |
$ | 650 | $ | 939 | $ | 1,155 | $ | 1,318 | ||||||||||||||||
|
|
|
|
|
|
|
|
|
|||||||||||||||||
| (1) | The notional or contractual amount of interest rate derivatives and foreign exchange contracts is the amount upon which interest and other payments under the contract are based. For interest rate derivatives, the notional amount is typically not exchanged. Therefore, notional amounts should not be taken as the measure of credit or market risk, as they tend to greatly overstate the true economic risk of these contracts. |
| (2) | Amounts represent the impact of legally enforceable master netting agreements that allow the Company to settle positive and negative positions. |
| (3) | The Company also offsets assets and liabilities associated with repurchase agreements on the Consolidated Balance Sheets. See Note 3 “Securities” for further information. |
The Company’s derivative transactions are internally divided into three sub-groups: institutional, customer and residential loan.
Institutional derivatives
The institutional derivatives portfolio primarily consists of interest rate swap agreements that are used to hedge the interest rate risk associated with the Company’s investment securities, loans and financing liabilities (i.e., borrowed funds, deposits, etc.). The goal of the Company’s interest rate hedging activities is to manage interest rate sensitivity so that movements in interest rates do not significantly adversely affect net interest income.
F-59
Table of Contents
CITIZENS FINANCIAL GROUP, INC.
NOTES TO CONSOLIDATED FINANCIAL STATEMENTS
The Company entered into certain interest rate swap agreements to hedge the market risk associated with fixed income securities. By entering into pay-fixed / receive-floating interest rate swaps, the Company was able to minimize the variability in the fair value of these securities due to changes in interest rates. The Company also has outstanding interest rate swap agreements to hedge the interest rate risk associated with floating rate loans. By entering into pay-floating / receive-fixed interest rate swaps, the Company is able to minimize the variability in the cash flows of these assets due to changes in interest rates.
Customer derivatives
The customer derivatives portfolio consists of interest rate swap agreements and option contracts that are transacted to meet the financing needs of the Company’s customers. Offsetting swap and cap agreements are simultaneously transacted to effectively eliminate the Company’s market risk associated with the customer derivative products. The customer derivatives portfolio also includes foreign exchange contracts that are entered into on behalf of customers for the purpose of hedging exposure related to cash orders and loans and deposits denominated in foreign currency. The primary risks associated with these transactions arise from exposure to changes in foreign currency exchange rates and the ability of the counterparties to meet the terms of the contract. To manage this market risk, the Company simultaneously enters into offsetting foreign exchange contracts.
Residential loan derivatives
The Company enters into residential loan commitments that allow residential mortgage customers to lock in the interest rate on a residential mortgage while the loan undergoes the underwriting process. The Company also uses forward sales contracts to protect the value of residential mortgage loans and loan commitments that are being underwritten for future sale to investors in the secondary market.
The Company has certain derivative transactions that are designated as hedging instruments described as follows:
Derivatives designated as hedging instruments
The majority of the Company’s institutional hedging portfolio qualifies for hedge accounting. This includes interest rate swaps that are designated in highly effective cash flow hedging relationships. The Company formally documents at inception all hedging relationships, as well as risk management objectives and strategies for undertaking various accounting hedges. Additionally, the Company uses dollar offset or regression analysis at the hedge’s inception, and at least quarterly thereafter to assess whether the derivatives are expected to be, or have been, highly effective in offsetting changes in the hedged item’s expected cash flows. The Company discontinues hedge accounting when it is determined that a derivative is not expected to be or has ceased to be effective as a hedge, and then reflects changes in fair value in earnings after termination of the hedge relationship.
Cash flow hedges
The Company enters into certain interest rate swap agreements designed to hedge a portion of the Company’s floating rate assets and financing liabilities (including its borrowed funds and deposits). All of these swaps have been deemed as highly effective cash flow hedges. The effective portion of the hedging gains and losses associated with these hedges are recorded in OCI; the ineffective portion of the hedging gains and losses is recorded in earnings (other income). Hedging gains and losses on derivative contracts reclassified from OCI to current period earnings are included in the line item in the
F-60
Table of Contents
CITIZENS FINANCIAL GROUP, INC.
NOTES TO CONSOLIDATED FINANCIAL STATEMENTS
accompanying consolidated statements of operations in which the hedged item is recorded, and in the same period that the hedged item affects earnings. During the next 12 months, approximately $46 million of net loss (pretax) on derivative instruments included in OCI is expected to be reclassified to net interest expense in the Consolidated Statements of Operations
Hedging gains and losses associated with the Company’s cash flow hedges are immediately reclassified from OCI to current period earnings (other net gains) if it becomes probable that the hedged forecasted transactions will not occur by the originally specified time period.
The following table summarizes certain information related to the Company’s cash flow hedges:
| The Effect of Cash Flow Hedges on Net Income and Stockholders’ Equity |
||||||||||||
| Amounts Recognized for the Years Ended | ||||||||||||
| December 31, 2013 |
December 31, 2012 |
December 31, 2011 |
||||||||||
| (in millions) | ||||||||||||
| Effective portion of loss recognized in OCI(1) |
$ | (59 | ) | $ | (42 | ) | $ | (177 | ) | |||
| Amounts reclassified from OCI to interest income(2) |
56 | — | — | |||||||||
| Amounts reclassified from OCI to interest expense(2) |
(235 | ) | (335 | ) | (517 | ) | ||||||
| Amounts reclassified from OCI to other income(3) |
(1 | ) | (1 | ) | — | |||||||
| Ineffective portion of gain recognized in other income(4) |
— | 1 | — | |||||||||
|
|
|
|
|
|
|
|||||||
| (1) | The cumulative effective gains and losses on the Company’s cash flow hedging activities are included on the AOCI line item on the Consolidated Balance Sheets. |
| (2) | This amount includes both (a) the amortization of effective gains and losses associated with the Company’s terminated cash flow hedges and (b) the current reporting period’s interest settlements realized on the Company’s active cash flow hedges. Both (a) and (b) were previously included on the accumulated other comprehensive loss line item on the Consolidated Balance Sheets and were subsequently recorded as adjustments to the interest expense of the underlying hedged item. |
| (3) | This amount represents hedging gains and losses that have been immediately reclassified from accumulated other comprehensive loss based on the probability that the hedged forecasted transactions would not occur by the originally specified time period. This amount is reflected in the other income line item on the Consolidated Statements of Operations. |
| (4) | This amount represents the net ineffectiveness recorded during the reporting periods presented plus any amounts excluded from effectiveness testing. These amounts are reflected in the other income line item on the Consolidated Statements of Operations. |
Economic Hedges
The Company’s customer derivatives are recorded on the Consolidated Balance Sheets at fair value. These include interest rate and foreign exchange derivative contracts that are transacted to meet the hedging and financing needs of the Company’s customers. Mark-to-market adjustments to the fair value of customer related interest rate contracts are included in other income in the accompanying Consolidated Statements of Operations. Mark-to-market adjustments to the fair value of foreign exchange contracts relating to foreign currency loans are included in interest and fees on loans and leases in the accompanying Consolidated Statements of Operations, while all other foreign currency contract fair value changes are included in international fees. In both cases, the mark-to-market gains and losses associated with the customer derivatives are mitigated by the mark-to-market gains and losses on the offsetting interest rate and foreign exchange derivative contracts transacted.
The Company’s residential loan derivatives (including residential loan commitments and forward sales contracts) are recorded on the Consolidated Balance Sheets at fair value. Mark-to-market
F-61
Table of Contents
CITIZENS FINANCIAL GROUP, INC.
NOTES TO CONSOLIDATED FINANCIAL STATEMENTS
adjustments to the fair value of residential loan commitments and forward sale contracts are included in noninterest income under mortgage banking.
The following table summarizes certain information related to the Company’s economic hedges:
| The Effect of Customer Derivatives and Economic Hedges on Net Income |
||||||||||||
| Amounts Recognized in Noninterest Income for the Year Ended December 31, |
||||||||||||
| 2013 | 2012 | 2011 | ||||||||||
| (in millions) | ||||||||||||
| Customer derivative contracts |
||||||||||||
| Customer interest rate contracts(1) |
$ | 79 | $ | 292 | $ | 706 | ||||||
| Customer foreign exchange contracts(1) |
18 | 10 | 2 | |||||||||
| Residential loan commitments(3) |
(7 | ) | 11 | (28 | ) | |||||||
| Economic hedges |
||||||||||||
| Offsetting derivatives transactions to hedge interest rate risk on customer interest rate contracts(1) |
(30 | ) | (285 | ) | (690 | ) | ||||||
| Offsetting derivatives transactions to hedge foreign exchange risk on customer foreign exchange contracts(2) |
(15 | ) | (10 | ) | (1 | ) | ||||||
| Forward sale contracts(3) |
25 | 8 | 22 | |||||||||
|
|
|
|
|
|
|
|||||||
| Total |
$ | 70 | $ | 26 | $ | 11 | ||||||
|
|
|
|
|
|
|
|||||||
| (1) | Reported in other income on the Consolidated Statements of Operations. |
| (2) | Reported in foreign exchange and trade finance fees on the Consolidated Statements of Operations. |
| (3) | Reported in mortgage banking fees on the Consolidated Statements of Operations. |
NOTE 16—COMMITMENTS, GUARANTEES AND CONTINGENCIES
Commitments
Commitments to extend credit are agreements to lend to customers in accordance with conditions contractually agreed upon in advance. Generally, the commitments have fixed expiration dates or termination clauses and may require payment of a fee. Since many of these commitments are expected to expire without being drawn upon, the contract amounts are not necessarily indicative of future cash requirements.
When-issued securities are agreements to purchase securities that have been authorized for issuance but not yet issued. The fair value of when-issued securities is reflected in the consolidated balance sheets at trade date.
During 2003, the Company entered into a 25-year agreement to acquire the naming and marketing rights of a baseball stadium in Pennsylvania. The Company paid $3 million in each of the years ended December 31, 2013, 2012, and 2011, and is obligated to pay $54 million over the remainder of the contract.
Letters of Credit
Standby letters of credit, both financial and performance, are issued by the Company for its customers. They are used as conditional guarantees of payment to a third party in the event the
F-62
Table of Contents
CITIZENS FINANCIAL GROUP, INC.
NOTES TO CONSOLIDATED FINANCIAL STATEMENTS
customer either fails to make specific payments (financial) or fails to complete a specific project (performance). Commercial letters of credit are used to facilitate the import of goods. The commercial letter of credit is used as the method of payment to the Company’s customers’ suppliers. The Company’s exposure to credit loss in the event of counterparty nonperformance in connection with the above instruments is represented by the contractual amount of those instruments, net of the value of collateral held. Standby letters of credit and commercial letters of credit are issued for terms of up to ten years and one year, respectively.
Generally, letters of credit are collateralized by cash, accounts receivable, inventory or investment securities. Credit risk associated with letters of credit is considered in determining the appropriate amounts of reserves for unfunded commitments.
The Company recognizes a liability on the Consolidated Balance Sheets representing its obligation to stand ready to perform over the term of the standby letters of credit in the event that the specified triggering events occur. The liability for these guarantees at December 31, 2013 and 2012 is $3 million and $4 million, respectively.
Risk Participation Agreements
RPAs are guarantees issued by the Company to other parties for a fee, whereby the Company agrees to participate in the credit risk of a derivative customer of the other party. Under the terms of these agreements, the “participating bank” receives a fee from the “lead bank” in exchange for the guarantee of reimbursement if the customer defaults on an interest rate swap. The interest rate swap is transacted such that any and all exchanges of interest payments (favorable and unfavorable) are made between the lead bank and the customer. In the event that an early termination of the swap occurs and the customer is unable to make a required close out payment, the participating bank assumes that obligation and is required to make this payment.
RPAs where the Company acts as the lead bank are referred to as “participations-out,” in reference to the credit risk associated with the customer derivatives being transferred out of the Company. Participations-out generally occur concurrently with the sale of new customer derivatives. RPAs where the Company acts as the participating bank are referred to as “participations-in,” in reference to the credit risk associated with the counterparty’s derivatives being assumed by the Company. The Company’s maximum credit exposure is based on its proportionate share of the settlement amount of the referenced interest rate swap. Settlement amounts are generally calculated based on the fair value of the swap plus outstanding accrued interest receivables from the customer. The Company’s estimate of the credit exposure associated with its risk participations-in as of December 31, 2013 and 2012 is $17 million and $30 million, respectively. The current amount of credit exposure is spread out over 71 counterparties. RPAs generally have terms ranging from 1-5 years; however, certain outstanding agreements have terms as long as 9 years.
Other Guarantees
The Company has issued a guarantee to RBS, for a fee, whereby the Company will absorb credit losses related to the sale of option contracts by RBS to customers of the Company. There were outstanding option contracts with a notional value of $2 million and $222 million at December 31, 2013 and 2012, respectively.
F-63
Table of Contents
CITIZENS FINANCIAL GROUP, INC.
NOTES TO CONSOLIDATED FINANCIAL STATEMENTS
The following is a summary of outstanding off balance sheet arrangements:
| December 31, 2013 |
December 31, 2012 |
|||||||
| (in millions) | ||||||||
| Commitment amount: |
||||||||
| Undrawn commitments to extend credit |
$ | 53,987 | $ | 50,507 | ||||
| Financial standby letters of credit |
2,556 | 3,082 | ||||||
| Performance letters of credit |
149 | 152 | ||||||
| Commercial letters of credit |
64 | 103 | ||||||
| Marketing rights |
54 | 57 | ||||||
| Risk participation agreements |
17 | 30 | ||||||
| Residential mortgage loans sold with recourse |
13 | 17 | ||||||
|
|
|
|
|
|||||
| Total |
$ | 56,840 | $ | 53,948 | ||||
|
|
|
|
|
|||||
Contingencies
The Company operates in a legal and regulatory environment that exposes it to potentially significant risks. A certain amount of litigation ordinarily results from the nature of the Company’s banking and other businesses. The Company is a party to legal proceedings, including class actions. It is also the subject of investigations, reviews, and regulatory matters arising out of its normal business operations, which, in some instances, relate to concerns about unfair and / or deceptive practices and mis-selling of certain products. In addition, the Company engages in discussions with relevant governmental and regulatory authorities on an ongoing and regular basis regarding various issues, and it is possible that any issues discussed or identified may result in investigatory or other action being taken. Litigation and regulatory matters may result in settlements, damages, fines, public or private censure, increased costs, required remediation, restriction on business activities, or other impact on the Company.
In these disputes and proceedings, the Company contests liability and the amount of damages as appropriate. Given their complex nature, it may be years before some of these matters are finally resolved. Moreover, before liability can be reasonably estimated for a claim, numerous legal and factual issues may need to be examined, including through potentially lengthy discovery and determination of important factual matters, and by addressing novel or unsettled legal issues relevant to the proceedings in question.
The Company cannot predict with certainty if, how, or when such claims will be resolved or what the eventual settlement, fine, penalty or other relief, if any, may be, particularly for claims that are at an early stage in their development or where claimants seek substantial or indeterminate damages. The Company recognizes a provision for a claim when, in the opinion of management after seeking legal advice, it is probable that a liability exists and the amount of loss can reasonably be estimated. In many proceedings, however, it is not possible to determine whether any loss is probable or to estimate the amount of any loss. In each of the matters described below, the Company is unable to estimate the liability in excess of any provision accrued, if any, that might arise or its effects on the Company’s Consolidated Statements of Operations or Consolidated Cash Flows in any particular period.
Set out below are descriptions of significant legal matters involving the Company. Based on information currently available, the advice of legal and other counsel, and established reserves, management believes that the aggregate liabilities, if any, arising from these proceedings will not have a materially adverse effect on the Company’s Consolidated Financial Statements.
F-64
Table of Contents
CITIZENS FINANCIAL GROUP, INC.
NOTES TO CONSOLIDATED FINANCIAL STATEMENTS
Consumer Products
The activities of the Company’s bank subsidiaries are subject to extensive laws and regulations concerning unfair or deceptive acts or practices in connection with customer products. Certain of the bank subsidiaries’ practices with respect to overdraft protection and other consumer products have not met applicable standards. The bank subsidiaries have implemented and are continuing to implement changes to bring their practices in conformity with applicable laws and regulations. In April 2013, the bank subsidiaries consented to the issuance of orders by the OCC and the FDIC (the Consent Orders). In the Consent Orders (which are publicly available and will remain in effect until terminated by the regulators), the bank subsidiaries neither admitted nor denied the regulators’ findings that they had engaged in deceptive marketing and implementation of the bank’s overdraft protection program, checking rewards programs, and stop-payment process for pre-authorized recurring electronic fund transfers. Under the Consent Orders, the Company’s banking subsidiaries paid a total of $10 million in civil monetary penalties, and are required to develop plans to provide restitution to affected customers (the amount of which is anticipated to be approximately $8 million), to cease and desist any operations in violation of Section 5 of the Federal Trade Commission Act, and to submit to the regulators periodic written progress reports regarding compliance with the Consent Orders. In addition, Citizens Bank, N.A. agreed to take certain remedial actions to improve its compliance risk management systems and to create a comprehensive action plan designed to achieve compliance with the Consent Order. Restitution plans have been prepared and submitted for approval and Citizens Bank, N.A. has submitted for approval, and is in the process of implementing, its action plan for compliance with the Consent Order, as well as updated policies, procedures, and programs related to its compliance risk management systems.
The Company’s bank subsidiaries have also identified issues regarding, among other things, certain identity theft and debt cancellation products, certain overdraft fees, the bank subsidiaries’ policies and practices with respect to identifying and correcting errors in customer deposits, and the charging of cost-based credit card late payment fees. The banking subsidiaries have paid restitution, or expect to pay restitution, to certain affected customers in connection with certain of these practices. In addition, the banking subsidiaries could face formal administrative enforcement actions from their federal supervisory agencies, including the assessment of civil monetary penalties and restitution, relating to the past practices and policies identified above and other consumer products, and they could face potential civil litigation. The Company does not expect that the aggregate of amounts paid in connection with these matters will have a material adverse effect on the Company’s business, financial condition and results of operations.
Fair Labor Standards Act Litigation
The Company has been named in several purported class actions brought under the FLSA and equivalent state statutes alleging that certain categories of branch employees were denied overtime for hours worked. These suits are brought by current and former branch employees alleging that either: (1) they are / were in Assistant Branch Manager positions and were improperly classified as exempt under the FLSA thereby denying them pay for all hours worked, including overtime pay; or (2) they are / were properly classified as non-exempt tellers, bankers or the like but were told not to record all of their hours, had hours they entered deleted by their managers and / or were otherwise denied pay for hours worked, including overtime pay. These cases cover the Company’s entire geographic footprint, and they have been settled, subject to court approval. The settlement amount of $12 million is fully covered by an existing reserve. Separately, the Company has been named in two lawsuits brought by current and former mortgage loan officers and home loan advisors alleging that they were improperly classified as exempt under the FLSA and corresponding state laws and therefore denied pay for all
F-65
Table of Contents
CITIZENS FINANCIAL GROUP, INC.
NOTES TO CONSOLIDATED FINANCIAL STATEMENTS
hours worked, including overtime pay. These cases have also been settled, and final court approval of the settlements was granted on January 29, 2014. The combined settlement amount of these two cases was $3 million and is fully covered by existing reserves.
Telephone Consumer Protection Act Litigation
The Company is a defendant in a purported class action complaint filed in December 2013 in the United States District Court for the Southern District of California pursuant to the Telephone Consumer Protection Act (“TCPA”). The named plaintiff purports to represent a “national class” of customers who allegedly received automated calls to their cell phones from the bank or its agents, without customer consent, in violation of the TCPA. The Company is vigorously defending this matter.
LIBOR Litigation
The Company is a defendant in lawsuits in which allegations have been made that its parent company, RBS Group, manipulated U.S. dollar LIBOR to the detriment of the Company customers. The lawsuits include a purported class action on behalf of borrowers of the Company whose interest rate was tied to U.S. dollar LIBOR. The plaintiffs in these cases assert various theories of liability, including fraud, negligent misrepresentation, breach of contract, and unjust enrichment. The Company is vigorously defending these matters.
Foreclosure-Related Expenses
In May 2013, the civil division of the U.S. Attorney’s Office for the Southern District of New York served a subpoena pursuant to the Financial Institutions Reform, Recovery and Enforcement Act of 1989 seeking information regarding home mortgage foreclosure expenses submitted for reimbursement to the United States Department of Housing and Urban Development, FNMA, or FHLMC. The Company is cooperating with the investigation.
Mortgage Repurchase Demands
The Company is an originator and servicer of residential mortgages and routinely sells such mortgage loans in the secondary market and to government-sponsored entities. In the context of such sales, the Company makes certain representations and warranties regarding the characteristics of the underlying loans and, as a result, may be contractually required to repurchase such loans or indemnify certain parties against losses for certain breaches of those representations and warranties. Between the start of January 2009 and the end of December 2013, the Company has received approximately $119 million in repurchase demands and $89 million in indemnification payment requests in respect of loans originated, for the most part, since 2003. Of those claims presented, $64 million was paid to repurchase residential mortgage loans, and $25 million was incurred for indemnification costs to make investors whole. The Company repurchased mortgage loans totaling $35 million and $13 million for the years ended December 31, 2013 and 2012, respectively. The Company incurred indemnification costs of $12 million and $5 million for the years ended December 31, 2013 and 2012, respectively. The Company cannot estimate what the future level of repurchase demands will be or the Company’s ultimate exposure, and cannot give any assurance that the historical experience will continue in the future. It is possible that the volume of repurchase demands will increase. In addition to the above, the Company has since December 2013 been responding to subpoenas issued by the Office of the Inspector General for the Federal Housing Finance Agency seeking information about loans sold to the Federal National Mortgage Association and the Federal Home Loan Mortgage Corporation from 2003 through 2011.
F-66
Table of Contents
CITIZENS FINANCIAL GROUP, INC.
NOTES TO CONSOLIDATED FINANCIAL STATEMENTS
NOTE 17—DIVESTITURES AND BRANCH ASSETS AND LIABILITIES HELD FOR SALE
In January 2014, the Company reached an agreement to sell its Chicago-area retail branches, small business relationships and select middle market relationships. The sale included 103 branches, approximately $5.3 billion in local deposits and $1.1 billion of locally originated loans as well as related branch premises. The transaction is subject to regulatory approval and is anticipated to close in the second quarter of 2014. As a result of this transaction, the assets and liabilities related to the branches being sold have been classified as held for sale.
The following table presents the assets and liabilities held for sale related to this transaction as of:
| December 31, 2013 |
||||
| (in millions) | ||||
| Loans held for sale: |
||||
| Commercial |
$ | 551 | ||
| Commercial real estate |
49 | |||
|
|
|
|||
| Total commercial |
600 | |||
|
|
|
|||
| Residential mortgages |
389 | |||
| Other secured retail |
7 | |||
| Unsecured retail |
82 | |||
|
|
|
|||
| Total retail |
478 | |||
|
|
|
|||
| Total loans held for sale |
1,078 | |||
|
|
|
|||
| Other branch assets held for sale: |
||||
| Properties and equipment, net |
46 | |||
|
|
|
|||
| Total other branch assets held for sale |
46 | |||
|
|
|
|||
| Total branch assets held for sale |
$ | 1,124 | ||
|
|
|
|||
| Deposits held for sale: |
||||
| Demand |
$ | 1,020 | ||
| Checking with interest |
849 | |||
| Regular savings |
504 | |||
| Money market accounts |
2,013 | |||
| Term deposits |
891 | |||
|
|
|
|||
| Total deposits held for sale |
$ | 5,277 | ||
|
|
|
|||
| Total branch liabilities held for sale |
$ | 5,277 | ||
|
|
|
|||
On June 22, 2012, the Company completed the sale of 57 branches in New York. Assets and deposits totaled $16 million and $325 million, respectively. A gain of $4 million was recognized in other net gains, offset by approximately $4 million in one-time costs recognized in noninterest expense.
In June 2012, the Company entered into a series of transactions to sell substantially all of its venture capital investments. As a result, the Company de-recognized $48 million of assets and recognized losses of $14 million on the transactions, which are presented in other net gains in the accompanying Consolidated Statements of Operations.
F-67
Table of Contents
CITIZENS FINANCIAL GROUP, INC.
NOTES TO CONSOLIDATED FINANCIAL STATEMENTS
NOTE 18—RELATED PARTY TRANSACTIONS
The following is a summary of inter-company borrowed funds:
| Related Party | Interest Rate | Maturity Date | December 31, 2013 |
December 31, 2012 |
||||||||||
| (dollars in millions) | ||||||||||||||
| Subordinated debt |
RBSG | 4.961% | January 2024 | $ | 334 | $ | — | |||||||
| RBSG | 4.771% | October 2023 | 333 | — | ||||||||||
| RBS | 5.158% | June 2023 | 333 | — | ||||||||||
| RBS | Three month LIBOR + 1.50% |
March 2035 | — | 289 | ||||||||||
Total interest expense recorded on inter-company subordinated debt was $16 million, $9 million, and $67 million for the years ended December 31, 2013, 2012, and 2011, respectively.
The Company maintained a $50 million revolving line of credit at December 31, 2013 and 2012 with RBS. This line of credit was not drawn upon at December 31, 2013 or 2012, expired on January 31, 2014, and was not renewed. No interest expense was incurred on this revolving line of credit for the years ended December 31, 2013, 2012, and 2011, respectively.
The Company enters into interest rate swap agreements with RBS for the purpose of reducing the Company’s exposure to interest rate fluctuations. As of December 31, 2013, the total notional amount of swaps outstanding was $5.5 billion. Included in this balance were $1.5 billion which pay fixed rates ranging from 1.78% to 5.47% and receive overnight fed funds rate and one month LIBOR with maturities from 2014 through 2023. Also included in this balance were $4 billion of receive-fixed swaps that had been executed as of June 30, 2013 as part of a new hedging program implemented during the quarter ended March 31, 2013. As of December 31, 2012, the total notional amount of swaps outstanding was $4.2 billion, all of which pay fixed rates ranging from 2.94% to 5.47% and receive overnight Federal funds rate with maturities from 2013 through 2016. The Company recorded net interest expense of $146 million, $311 million, and $457 million for the years ended December 31 2013, 2012, and 2011, respectively.
In order to meet the financing needs of its customers, the Company enters into interest rate swap and cap agreements with its customers and simultaneously enters into offsetting swap and cap agreements with RBS. The Company earns a spread equal to the difference between rates charged to the customer and rates charged by RBS. The notional amount of these interest rate swap and cap agreements outstanding with RBS was $13.4 billion and $16.0 billion at December 31, 2013 and 2012, respectively. The Company recorded expense of $32 million, $285 million, and $690 million within other income for the years ended December 31, 2013, 2012, and 2011, respectively.
Also to meet the financing needs of its customers, the Company enters into a variety of foreign currency denominated products, such as loans, deposits and foreign exchange contracts. To manage the foreign exchange risk associated with these products, the Company simultaneously enters into offsetting foreign exchange contracts with RBS. The Company earns a spread equal to the difference between rates charged to the customer and rates charged by RBS. The notional amount of foreign exchange contracts outstanding with RBS was $4.6 billion and $3.4 billion at December 31, 2013 and December 31, 2012, respectively. The Company recorded expense within foreign exchange and trade finance fees of $15 million, $9 million and $1 million for the years ended December 31, 2013, 2012 and 2011, respectively.
F-68
Table of Contents
CITIZENS FINANCIAL GROUP, INC.
NOTES TO CONSOLIDATED FINANCIAL STATEMENTS
The Company has issued a guarantee to RBS for a fee, whereby the Company will absorb credit losses related to the sale of foreign exchange option contracts by RBS to customers of the Company. There were outstanding foreign exchange option contracts with a notional value of $2 million and $222 million at December 31, 2013 and 2012, respectively. The Company recorded fee income of $0 million, $1 million and $2 million for the years ended December 31, 2013, 2012 and 2011, respectively.
The Company receives income for providing services and referring customers to RBS. The Company also shares office space with certain RBS entities for which rent expense and / or income is recorded in occupancy expense. The total fee income, net of occupancy expense, for the years ended December 31, 2013, 2012, and 2011 was $26 million, $28 million, and $24 million, respectively. In 2013 the Company paid $1.0 billion of common stock dividends to RBS as part of the exchange transactions described in “Management’s Discussion and Analysis of Financial Condition and Results of Operations—Capital” included elsewhere in this prospectus and $185 million of regular dividends to RBS. In 2012, the Company paid $150 million in regular common stock dividends to RBS. There were no dividends paid in 2011.
The Company, as a matter of policy and during the ordinary course of business with underwriting terms similar to those offered to the public, has made loans to directors and executive officers and their immediate families, as well as their affiliated companies. Such loans amounted to $78 million and $92 million at December 31, 2013 and 2012, respectively.
NOTE 19—FAIR VALUE MEASUREMENTS
As discussed in Significant Accounting Policies, the Company measures or monitors many of its assets and liabilities on a fair value basis. Fair value is used on a recurring basis for assets and liabilities for which fair value is the required or elected measurement basis of accounting. Additionally, fair value is used on a nonrecurring basis to evaluate assets for impairment or for disclosure purposes. Nonrecurring fair value adjustments typically involve the application of lower of cost or market accounting or write-downs of individual assets. The Company also applies the fair value measurement guidance to determine amounts reported for certain disclosures in this note for assets and liabilities not required to be reported at fair value in the financial statements.
Fair Value Option, Mortgage Loans Held for Sale
The Company elected to account for residential mortgage loans held for sale at fair value. Applying fair value accounting to the residential mortgage loans held for sale better aligns the reported results of the economic changes in the value of these loans and their related hedge instruments.
The fair value of residential loans held for sale is derived from observable mortgage security prices and includes adjustments for loan servicing value, agency guarantee fees, and other loan level attributes which are mostly observable in the marketplace. Credit risk does significantly impact the valuation since loans are sold shortly after origination. Therefore, the Company classifies the residential mortgage loans held for sale in Level 2 of the fair value hierarchy.
At December 31, 2013, the fair value carrying amount of residential loans held for sale and the aggregate unpaid principal amount that the Company is contractually entitled to receive at maturity are $176 million and $173 million, respectively. At December 31, 2012, the fair value carrying amount of residential loans held for sale and the aggregate unpaid principal amount that the Company is contractually entitled to receive at maturity were $624 million and $597 million, respectively. The amount of loans past due or nonaccruing is considered insignificant.
F-69
Table of Contents
CITIZENS FINANCIAL GROUP, INC.
NOTES TO CONSOLIDATED FINANCIAL STATEMENTS
The loans accounted for under the fair value option are initially measured at fair value when the financial asset is recognized. Subsequent changes in fair value are recognized in current earnings. The Company recognized $(33) million, $6 million, and $14 million in mortgage banking noninterest income for the years ended December 31, 2013, 2012, and 2011, respectively. Interest income on residential loans held for sale is calculated based on the contractual interest rate of the loan and is recorded in interest income.
Recurring Fair Value Measurements
The Company utilizes a variety of valuation techniques to measure its assets and liabilities at fair value. Following is a description of valuation methodologies used for significant assets and liabilities carried on the balance sheet at fair value on a recurring basis:
Securities AFS: The fair value of securities classified as AFS is based upon quoted prices, if available. Where observable quoted prices are available in an active market, securities are classified as Level 1 in the fair value hierarchy. Classes of instruments that are valued using this market approach include debt securities issued by the U.S. Treasury. If quoted market prices are not available, the fair value for the security is estimated by using pricing models, quoted prices of securities with similar characteristics or discounted cash flows. These instruments are classified as Level 2 because they currently trade in active markets and the inputs to the valuations are observable. The pricing models used to value securities generally begin with market prices (or rates) for similar instruments and make adjustments based on the unique characteristics of the instrument being valued. These adjustments reflect assumptions made regarding the sensitivity of each security’s value to changes in interest rates and prepayment speeds. Classes of instruments that are valued using this market approach include residential and commercial CMOs, specified pool mortgage “pass-through” securities and other debt securities issued by U.S. government-sponsored entities and state and political subdivisions.
A significant majority of the Company’s Level 1 and 2 securities are priced using an external pricing service. The Company verifies the accuracy of the pricing provided by its primary outside pricing service on a quarterly basis. This process involves using a secondary external vendor to provide valuations for the Company’s securities portfolio for comparison purposes. Any securities with discrepancies beyond a certain threshold are researched and, if necessary, valued by an independent outside broker.
In certain cases where there is limited activity or less transparency around inputs to the valuation model, securities are classified as Level 3.
Residential loans held for sale: See the Fair Value Option discussion above.
Derivatives: The majority of the Company’s derivatives portfolio is comprised of “plain vanilla” interest rate swaps, which are traded in over-the-counter markets where quoted market prices are not readily available. For these interest rate derivatives, fair value is determined utilizing models that use primarily market observable inputs, such as swap rates and yield curves. The pricing models used to value interest rate swaps calculate the sum of each instrument’s fixed and variable cash flows, which are then discounted using an appropriate yield curve (i.e., LIBOR or OIS curve) to arrive at the fair value of each swap. The pricing models do not contain a high level of subjectivity as the methodologies used do not require significant judgment. The Company also considers certain adjustments to the modeled price which market participants would make when pricing each instrument, including a credit valuation adjustment that reflects the credit quality of the swap counterparty. The Company incorporates the effect of exposure to a particular
F-70
Table of Contents
CITIZENS FINANCIAL GROUP, INC.
NOTES TO CONSOLIDATED FINANCIAL STATEMENTS
counterparty’s credit by netting its derivative contracts with the collateral available and calculating a credit valuation adjustment on the basis of the net position with the counterparty where permitted. The determination of this adjustment requires judgment on behalf of Company management; however, the total amount of this portfolio-level adjustment is not material to the total fair value of the interest rate swaps in their entirety. Therefore, interest rate swaps are classified as Level 2 in the valuation hierarchy.
The Company’s other derivatives include foreign exchange contracts. Fair value of foreign exchange derivatives uses the mid-point of daily quoted currency spot prices. A valuation model estimates fair value based on the quoted spot rates together with interest rate yield curves and forward currency rates. Since all of these inputs are observable in the market, foreign exchange derivatives are classified as Level 2 in the fair value hierarchy.
Venture capital investments: The Company values its venture capital private equity fund investments based on its capital invested in each fund, which is adjusted by management each quarter, if necessary, to arrive at its estimate of fair value. Adjustments for a fund’s underlying investments may be based upon comparisons to public companies, industry benchmarks, current financing round pricing, earnings multiples of comparable companies, current operating performance and future expectations, or third party valuations. Since the inputs to the valuation are difficult to independently corroborate in the marketplace, and involve a significant degree of management judgment, venture capital investments are classified as Level 3 in the fair value hierarchy.
The following table presents assets and liabilities measured at fair value, including gross derivative assets and liabilities on a recurring basis at December 31, 2013:
| Total | Level 1 | Level 2 | Level 3 | |||||||||||||
| (in millions) | ||||||||||||||||
| Securities available for sale: |
||||||||||||||||
| Mortgage-backed securities |
$ | 15,945 | $ | — | $ | 15,945 | $ | — | ||||||||
| State and political subdivisions |
10 | — | 10 | — | ||||||||||||
| Equity securities |
25 | 8 | 17 | — | ||||||||||||
| U.S. Treasury |
15 | 15 | — | — | ||||||||||||
| Residential loans held for sale |
176 | — | 176 | — | ||||||||||||
| Derivative assets: |
||||||||||||||||
| Interest rate swaps |
677 | — | 677 | — | ||||||||||||
| Foreign exchange contracts |
94 | — | 94 | — | ||||||||||||
| Other contracts |
7 | — | 7 | — | ||||||||||||
| Venture capital investments |
5 | — | — | 5 | ||||||||||||
|
|
|
|
|
|
|
|
|
|||||||||
| Total assets |
$ | 16,954 | $ | 23 | $ | 16,926 | $ | 5 | ||||||||
|
|
|
|
|
|
|
|
|
|||||||||
| Derivative liabilities: |
||||||||||||||||
| Interest rate swaps |
$ | 970 | $ | — | $ | 970 | $ | — | ||||||||
| Foreign exchange contracts |
87 | — | 87 | — | ||||||||||||
| Other contracts |
10 | — | 10 | — | ||||||||||||
|
|
|
|
|
|
|
|
|
|||||||||
| Total liabilities |
$ | 1,067 | $ | — | $ | 1,067 | $ | — | ||||||||
|
|
|
|
|
|
|
|
|
|||||||||
F-71
Table of Contents
CITIZENS FINANCIAL GROUP, INC.
NOTES TO CONSOLIDATED FINANCIAL STATEMENTS
The following table presents assets and liabilities measured at fair value including gross derivative assets and liabilities on a recurring basis at December 31, 2012:
| Total | Level 1 | Level 2 | Level 3 | |||||||||||||
| (in millions) | ||||||||||||||||
| Securities available for sale: |
||||||||||||||||
| Mortgage-backed securities |
$ | 18,301 | $ | — | $ | 18,301 | $ | — | ||||||||
| State and political subdivisions |
21 | — | 21 | — | ||||||||||||
| Equity securities |
19 | 7 | 12 | — | ||||||||||||
| U.S. Treasury |
15 | 15 | — | — | ||||||||||||
| Residential loans held for sale |
624 | — | 624 | — | ||||||||||||
| Derivative assets: |
||||||||||||||||
| Interest rate swaps |
1,103 | — | 1,103 | — | ||||||||||||
| Foreign exchange contracts |
71 | — | 71 | — | ||||||||||||
| Other contracts |
35 | — | 35 | — | ||||||||||||
| Venture capital investments |
6 | — | — | 6 | ||||||||||||
|
|
|
|
|
|
|
|
|
|||||||||
| Total assets |
$ | 20,195 | $ | 22 | $ | 20,167 | $ | 6 | ||||||||
|
|
|
|
|
|
|
|
|
|||||||||
| Derivative liabilities: |
||||||||||||||||
| Interest rate swaps |
$ | 1,290 | $ | — | $ | 1,290 | $ | — | ||||||||
| Foreign exchange contracts |
67 | — | 67 | — | ||||||||||||
| Other contracts |
15 | — | 15 | — | ||||||||||||
|
|
|
|
|
|
|
|
|
|||||||||
| Total liabilities |
$ | 1,372 | $ | — | $ | 1,372 | $ | — | ||||||||
|
|
|
|
|
|
|
|
|
|||||||||
The changes in Level 3 assets measured at fair value on a recurring basis are summarized as follows:
| Year Ended December 31, | ||||||||||||
| 2013 | 2012 | 2011 | ||||||||||
| (in millions) | ||||||||||||
| Balance as of January 1 |
$ | 6 | $ | 57 | $ | 64 | ||||||
| Purchases, issuances, sales and settlements: |
||||||||||||
| Purchases |
— | 1 | 2 | |||||||||
| Sales |
(4 | ) | (45 | ) | — | |||||||
| Settlements |
3 | 23 | — | |||||||||
| Other net losses |
— | (30 | ) | (9 | ) | |||||||
|
|
|
|
|
|
|
|||||||
| Balance as of December 31 |
$ | 5 | $ | 6 | $ | 57 | ||||||
|
|
|
|
|
|
|
|||||||
| Net unrealized gain (loss) included in net income for the year relating to assets held at December 31 |
$ | — | $ | (11 | ) | $ | 9 | |||||
|
|
|
|
|
|
|
|||||||
There were no transfers among Levels 1, 2 or 3 during the years ended December 31, 2013, 2012 and 2011.
F-72
Table of Contents
CITIZENS FINANCIAL GROUP, INC.
NOTES TO CONSOLIDATED FINANCIAL STATEMENTS
Nonrecurring Fair Value Measurements
The following valuation techniques are utilized to measure significant assets for which the Company utilizes fair value on a nonrecurring basis:
Impaired Loans: The carrying amount of collateral-dependent impaired loans is compared to the appraised value of the collateral less costs to dispose. Any excess of carrying amount over the appraised value is charged to the ALLL.
MSRs: MSRs do not trade in an active market with readily observable prices. MSRs are classified as Level 3 since the valuation methodology utilizes significant unobservable inputs. At December 31, 2013 the fair value is calculated using the discounted cash flow model, the model that uses assumptions, including weighted-average life of 5.4 years (range of 1.8—7.4 years), weighted-average constant prepayment rate of 13% (range of 9.4%—41.5%) and weighted-average discount rate of 10.8% (range of 10.2%—13.1%). Refer to Note 1 “Significant Accounting Policies,” and Note 9 “Mortgage Banking,” for more information.
Foreclosed assets: Foreclosed assets consist primarily of residential properties. Foreclosed assets are carried at the lower of carrying value or fair value less costs to dispose. Fair value is based upon independent market prices or appraised values of the collateral and is classified as Level 2.
Goodwill: Goodwill is valued using unobservable inputs and is classified as Level 3. Fair value is calculated using the present value of estimated future earnings (discounted cash flow method), the model which uses assumptions including discount rate (9.5%), historical projected loss rates (commercial banking, 0.44%; retail banking, 0.57%), income tax (35%), and capital retention (7%). Refer to Note 1 “Significant Accounting Policies,” for a description of the goodwill valuation methodology.
Commercial loans held for sale: Commercial loans held for sale consist primarily of syndicated loans not sold at the time of funding. The mark to market is recorded in noninterest income in the Consolidated Statements of Operations.
The following table presents assets and liabilities measured at fair value on a nonrecurring basis and any gains (losses) recorded in earnings:
| Carrying Value at December 31, 2013 | Year Ended December 31, 2013 |
|||||||||||||||||||
| Total | Level 1 | Level 2 | Level 3 | Total (Losses) Gains |
||||||||||||||||
| (in millions) | ||||||||||||||||||||
| Impaired collateral-dependent loans(1) |
$ | 74 | $ | — | $ | 74 | $ | — | $ | (83 | ) | |||||||||
| MSRs(2) |
185 | — | — | 185 | 47 | |||||||||||||||
| Foreclosed real estate(3) |
49 | — | 49 | — | (4 | ) | ||||||||||||||
| Goodwill(5) |
6,876 | — | — | 6,876 | (4,435 | ) | ||||||||||||||
|
|
|
|
|
|
|
|
|
|
|
|||||||||||
| Carrying Value at December 31, 2012 | Year Ended December 31, 2012 |
|||||||||||||||||||
| Total | Level 1 | Level 2 | Level 3 | Total Losses | ||||||||||||||||
| (in millions) | ||||||||||||||||||||
| Impaired collateral-dependent loans(1) |
$ | 292 | $ | — | $ | 292 | $ | — | $ | (101 | ) | |||||||||
| MSRs(2) |
145 | — | — | 145 | (12 | ) | ||||||||||||||
| Foreclosed real estate(3) |
92 | — | 92 | — | (6 | ) | ||||||||||||||
| Commercial loans held for sale(4) |
22 | — | 22 | — | — | |||||||||||||||
|
|
|
|
|
|
|
|
|
|
|
|||||||||||
F-73
Table of Contents
CITIZENS FINANCIAL GROUP, INC.
NOTES TO CONSOLIDATED FINANCIAL STATEMENTS
| Carrying Value at December 31, 2011 | Year Ended December 31, 2011 |
|||||||||||||||||||
| Total | Level 1 | Level 2 | Level 3 | Total Losses | ||||||||||||||||
| (in millions) | ||||||||||||||||||||
| Impaired collateral-dependent loans(1) |
$ | 488 | $ | — | $ | 488 | $ | — | $ | (118 | ) | |||||||||
| MSRs(2) |
157 | — | — | 157 | (42 | ) | ||||||||||||||
| Foreclosed real estate(3) |
116 | — | 116 | — | (7 | ) | ||||||||||||||
|
|
|
|
|
|
|
|
|
|
|
|||||||||||
| (1) | In 2013, impaired loans for which collection is dependent on the loan’s collateral in the amount of $161 million were written down to $74 million, resulting in an impairment charge of $83 million, which was charged to the allowance for loan and lease losses. In 2012, impaired loans for which collection is dependent on the loan’s collateral in the amount of $447 million were written down to their fair value of $292 million, resulting in an impairment charge of $101 million, which was charged to the allowance for loan and lease losses. In 2011, impaired loans for which collection is dependent on the loan’s collateral in the amount of $875 million were written down to their fair value of $488 million resulting in an impairment charge of $118 million, which was charged to the allowance for loan and lease losses. Fair value of the loans was primarily based on the appraised value of the collateral. |
| (2) | In 2013, MSRs totaling $215 million were evaluated for impairment and written down to $185 million. An impairment recapture of $47 million and a total cumulative valuation allowance of $23 million were recognized. In 2012, MSRs totaling $215 million were evaluated for impairment and written down to $145 million, resulting in a charge of $12 million and a total cumulative valuation allowance of $70 million. In 2011, MSRs totaling $209 million were evaluated for impairment and written down to $157 million, resulting in an impairment charge of $42 million. The fair value of MSRs was $195 million, $147 million and $155 million at December 31, 2013, 2012, and 2011, respectively. |
| (3) | In 2013, foreclosed real estate accounted for at the lower of cost or fair value less costs to sell was written down to fair value of $49 million, resulting in an impairment charge of $4 million. In 2012, foreclosed real estate accounted for at the lower of cost or fair value less costs to sell was written down to fair value of $92 million, resulting in an impairment charge of $6 million. In 2011, foreclosed real estate accounted for at the lower of cost or fair value less costs to sell was written down to fair value of $116 million, resulting in an impairment charge of $7 million. |
| (4) | In 2012, commercial loans held for sale totaled $22 million; cost approximated fair value. |
| (5) | In 2013, Goodwill totaling $11.3 billion was written down to its implied fair value of $6.9 billion, resulting in an impairment charge of $4.4 billion. Fair value of $6.9 billion was valued as of June 30, 2013. |
Disclosures about Fair Value of Financial Instruments
Following is a description of valuation methodologies used to estimate the fair value of financial instruments for disclosure purposes (these instruments are not recorded in the financial statements at fair value):
Loans and leases: For loans and leases not recorded at fair value on a recurring basis that are not accounted for as collateral-dependent loans impaired loans, fair value is estimated by using one of two methods: a discounted cash flow method or a securitization method. The discounted cash flow method involves discounting the expected future cash flows using current rates that a market participant would likely use to value similar pools of loans. Inputs used in this method include observable information such as contractual cash flows (net of servicing cost) and unobservable information such as estimated prepayment speeds, credit loss exposures, and discount rates. The securitization method involves utilizing market securitization data to value the assets as if a securitization transaction had been executed. Inputs used include observable market-based MBS data and pricing adjustments based on unobservable data reflecting the liquidity risk, credit loss exposure and other characteristics of the underlying loans. The internal risk-weighted balances of loans are grouped by product type for purposes of these estimated valuations. For nonaccruing loans, fair value is estimated by discounting management’s estimate of future cash flows with a discount rate commensurate with the risk associated with such assets. Fair value of collateral-dependent loans is primarily based on the appraised value of the collateral.
F-74
Table of Contents
CITIZENS FINANCIAL GROUP, INC.
NOTES TO CONSOLIDATED FINANCIAL STATEMENTS
Loans held for sale: Balances are loans that were transferred to loans held for sale that are reported at book value.
Securities held to maturity: The fair value of securities classified as HTM is estimated using pricing models, quoted prices of securities with similar characteristics or discounted cash flow. The pricing models used to value these securities generally begin with market prices (or rates) for similar instruments and make adjustments based on the unique characteristics of the instrument being valued. These adjustments reflect assumptions made regarding the sensitivity of each security’s value to changes in interest rates and prepayment speeds.
Other investment securities: The cost basis carrying value of other investment securities, such as FHLB stock and FRB stock, is assumed to approximate the fair value of the securities. As a member of the FHLB and FRB, the Company is required to hold FHLB and FRB stock. The stock can be sold only to the FHLB and FRB upon termination of membership, or redeemed at the FHLB’s or FRB’s sole discretion.
Deposits: The fair value of demand deposits, checking with interest accounts, regular savings and money market accounts is the amount payable on demand at the balance sheet date. The fair value of term deposits is estimated by discounting the expected future cash flows using rates currently offered for deposits of similar remaining maturities.
Deposits held for sale: Balances are deposits that were transferred to held for sale that are reported at book value.
Federal funds purchased and securities sold under agreements to repurchase and borrowed funds: Rates currently available to the Company for debt of similar terms and remaining maturities are used to discount the expected cash flows of existing debt.
The following table is a summary of fair value for financial instruments not recorded at fair value in the Consolidated Financial Statements. The carrying amounts in the following table are recorded in the consolidated balance sheets under the indicated captions:
| December 31, 2013 | ||||||||||||||||||||||||||||||||
| Total | Level 1 | Level 2 | Level 3 | |||||||||||||||||||||||||||||
| Carrying Value |
Fair Value |
Carrying Value |
Fair Value |
Carrying Value |
Fair Value |
Carrying Value |
Fair Value |
|||||||||||||||||||||||||
| (in millions) | ||||||||||||||||||||||||||||||||
| Financial Assets: |
||||||||||||||||||||||||||||||||
| Loans and leases |
$ | 85,859 | $ | 85,724 | $ | — | $ | — | $ | 74 | $ | 74 | $ | 85,785 | $ | 85,650 | ||||||||||||||||
| Other loans held for sale |
1,078 | 1,078 | — | — | — | — | 1,078 | 1,078 | ||||||||||||||||||||||||
| Securities held to maturity |
4,315 | 4,257 | — | — | 4,315 | 4,257 | — | — | ||||||||||||||||||||||||
| Other investment securities |
935 | 935 | — | — | 935 | 935 | — | — | ||||||||||||||||||||||||
| Financial Liabilities: |
||||||||||||||||||||||||||||||||
| Deposits |
86,903 | 86,907 | — | — | 86,903 | 86,907 | — | — | ||||||||||||||||||||||||
| Deposits held for sale |
5,277 | 5,277 | — | — | 5,277 | 5,277 | — | — | ||||||||||||||||||||||||
| Federal funds purchased and securities sold under agreements to repurchase |
4,791 | 4,791 | — | — | 4,791 | 4,791 | — | — | ||||||||||||||||||||||||
| Other short-term borrowed funds |
2,251 | 2,249 | — | — | 2,251 | 2,249 | — | — | ||||||||||||||||||||||||
| Long-term borrowed funds |
1,405 | 1,404 | — | — | 1,405 | 1,404 | — | — | ||||||||||||||||||||||||
|
|
|
|
|
|
|
|
|
|
|
|
|
|
|
|
|
|||||||||||||||||
F-75
Table of Contents
CITIZENS FINANCIAL GROUP, INC.
NOTES TO CONSOLIDATED FINANCIAL STATEMENTS
| December 31, 2012 | ||||||||||||||||||||||||||||||||
| Total | Level 1 | Level 2 | Level 3 | |||||||||||||||||||||||||||||
| Carrying Value |
Fair Value |
Carrying Value |
Fair Value |
Carrying Value |
Fair Value |
Carrying Value |
Fair Value |
|||||||||||||||||||||||||
| (in millions) | ||||||||||||||||||||||||||||||||
| Financial Assets: |
||||||||||||||||||||||||||||||||
| Loans and leases |
$ | 87,248 | $ | 86,856 | $ | — | $ | — | $ | 292 | $ | 292 | $ | 86,956 | $ | 86,564 | ||||||||||||||||
| Other investment securities |
1,061 | 1,061 | — | — | 1,061 | 1,061 | — | — | ||||||||||||||||||||||||
| Financial Liabilities: |
||||||||||||||||||||||||||||||||
| Deposits |
95,148 | 95,192 | — | — | 95,148 | 95,192 | — | — | ||||||||||||||||||||||||
| Federal funds purchased and securities sold under agreements to repurchase |
3,601 | 3,601 | — | — | 3,601 | 3,601 | — | — | ||||||||||||||||||||||||
| Other short-term borrowed funds |
501 | 501 | — | — | 501 | 501 | — | — | ||||||||||||||||||||||||
| Long-term borrowed funds |
694 | 693 | — | — | 694 | 693 | — | — | ||||||||||||||||||||||||
|
|
|
|
|
|
|
|
|
|
|
|
|
|
|
|
|
|||||||||||||||||
NOTE 20—REGULATORY MATTERS
As a BHC, the Company is subject to regulation and supervision by the FRBG. The primary subsidiaries of Citizens are its two insured depository institutions: Citizens Bank, N.A., a national banking association whose primary federal regulator is the OCC, and Citizens Bank of Pennsylvania, a Pennsylvania-chartered savings bank regulated by the Department of Banking of the Commonwealth of Pennsylvania and supervised by the FDIC as its primary federal regulator. Under the regulatory capital adequacy guidelines of the FDICIA, the Company and its banking subsidiaries must meet specific capital requirements. These requirements are expressed in terms of the following ratios: (1) Risk-based Total Capital (total capital/risk-weighted on- and off-balance sheet assets); (2) Risk-based Tier 1 Capital (tier 1 capital/risk-weighted on- and off-balance sheet assets); and (3) Tier 1 Leverage (tier 1 capital/adjusted average quarterly assets). To meet the regulatory capital requirements, the Company and its banking subsidiaries must maintain minimum Risk-based Total Capital, Risk-based Tier 1 Capital, and Tier 1 Leverage ratios. In addition, the Company must not be subject to a written agreement, order or capital directive with any of its regulators. Failure to meet minimum capital requirements can result in the initiation of certain actions that, if undertaken, could have a material effect on the Company’s Consolidated Financial Statements.
The following table presents capital and capital ratio information:
| FDIC Requirements | ||||||||||||||||||||||||
| Actual | Minimum Capital Adequacy |
Classification as Well Capitalized |
||||||||||||||||||||||
| Amount | Ratio | Amount | Ratio | Amount | Ratio | |||||||||||||||||||
| (dollars in millions) | ||||||||||||||||||||||||
| As of December 31, 2013 |
||||||||||||||||||||||||
| Total Capital to Risk-Weighted Assets |
$ | 15,885 | 16.1 | % | $ | 7,891 | 8.0 | % | $ | 9,863 | 10.0 | % | ||||||||||||
| Tier 1 Capital to Risk-Weighted Assets |
13,301 | 13.5 | % | 3,945 | 4.0 | % | 5,918 | 6.0 | % | |||||||||||||||
| Tier 1 Capital to Average Assets (Leverage) |
13,301 | 11.6 | % | 3,433 | 3.0 | % | 5,721 | 5.0 | % | |||||||||||||||
|
|
|
|
|
|
|
|
|
|
|
|
|
|||||||||||||
| As of December 31, 2012 |
||||||||||||||||||||||||
| Total Capital to Risk-Weighted Assets |
$ | 15,623 | 15.8 | % | $ | 7,901 | 8.0 | % | $ | 9,876 | 10.0 | % | ||||||||||||
| Tier 1 Capital to Risk-Weighted Assets |
14,036 | 14.2 | % | 3,951 | 4.0 | % | 5,926 | 6.0 | % | |||||||||||||||
| Tier 1 Capital to Average Assets (Leverage) |
14,036 | 12.1 | % | 3,475 | 3.0 | % | 5,791 | 5.0 | % | |||||||||||||||
|
|
|
|
|
|
|
|
|
|
|
|
|
|||||||||||||
F-76
Table of Contents
CITIZENS FINANCIAL GROUP, INC.
NOTES TO CONSOLIDATED FINANCIAL STATEMENTS
In accordance with federal and state banking regulations, dividends paid by the Company’s banking subsidiaries to the Company itself are generally limited to the retained earnings of the respective banking subsidiaries unless specifically approved by the appropriate bank regulator. The Company declared and paid RBS total common stock dividends of $1.2 billion in 2013. There were $150 million in common stock dividends in 2012 and no common stock dividends in 2011.
The earnings impact of goodwill impairment recognized by Citizens Bank, N.A. has put the bank subsidiary in the position of having to request specific approval from the OCC before executing capital distributions to its parent, Citizens. This requirement will be in place through the fourth quarter of 2015. Regardless of the OCC’s decision regarding capital distributions by Citizens Bank, N.A., the stand-alone BHC, as of December 31, 2013, had liquid assets in excess of $554 million compared to an annual interest burden on existing subordinated debt of approximately $63 million.
NOTE 21—SUPPLEMENTAL CASH FLOW INFORMATION
Supplemental cash flow information is as follows:
| Year Ended December 31, | ||||||||||||
| 2013 | 2012 | 2011 | ||||||||||
| (in millions) | ||||||||||||
| Supplemental cash flow information: |
||||||||||||
| Interest paid |
$ | 452 | $ | 644 | $ | 899 | ||||||
| Income taxes paid (refunded) |
20 | 201 | (109 | ) | ||||||||
|
|
|
|
|
|
|
|||||||
| Supplemental schedule of non-cash investing and financing activities: |
||||||||||||
| Transfer of securities available for sale to held to maturity |
$ | 4,240 | $ | — | $ | — | ||||||
| Transfer of other loans held for sale |
1,078 | 22 | — | |||||||||
| Loans securitized and transferred to securities available for sale |
106 | 21 | 62 | |||||||||
| Capital contribution |
14 | 27 | 30 | |||||||||
| Accrual and income tax true up related to the 2010 sale of RBS WorldPay, Inc. |
— | — | 12 | |||||||||
| Due from broker for securities sold but not settled |
(442 | ) | (4 | ) | — | |||||||
| Due to broker for securities purchased but not settled |
— | 2 | — | |||||||||
|
|
|
|
|
|
|
|||||||
F-77
Table of Contents
CITIZENS FINANCIAL GROUP, INC.
NOTES TO CONSOLIDATED FINANCIAL STATEMENTS
NOTE 22—RECLASSIFICATIONS OUT OF ACCUMULATED OTHER COMPREHENSIVE INCOME
The following table presents the changes in the balances, net of taxes, of each component of OCI:
| Net Unrealized Gains (Losses) on Derivatives |
Net Unrealized Gains (Losses) on Securities |
Defined Benefit Pension Plans |
Total AOCI | |||||||||||||
| (in millions) | ||||||||||||||||
| Balance at January 1, 2011 |
$ | (642 | ) | $ | 163 | $ | (212 | ) | $ | (691 | ) | |||||
| Other comprehensive loss before reclassifications |
(112 | ) | 286 | — | 174 | |||||||||||
| Other than temporary impairment not recognized in earnings on securities |
— | (108 | ) | — | (108 | ) | ||||||||||
| Amounts reclassified from other comprehensive income |
328 | (90 | ) | (141 | ) | 97 | ||||||||||
|
|
|
|
|
|
|
|
|
|||||||||
| Net other comprehensive income (loss) |
216 | 88 | (141 | ) | 163 | |||||||||||
|
|
|
|
|
|
|
|
|
|||||||||
| Balance at December 31, 2011 |
(426 | ) | 251 | (353 | ) | (528 | ) | |||||||||
| Other comprehensive loss before reclassifications |
(26 | ) | 138 | — | 112 | |||||||||||
| Other than temporary impairment not recognized in earnings on securities |
— | (38 | ) | — | (38 | ) | ||||||||||
| Amounts reclassified from other comprehensive income |
212 | (45 | ) | (25 | ) | 142 | ||||||||||
|
|
|
|
|
|
|
|
|
|||||||||
| Net other comprehensive income (loss) |
186 | 55 | (25 | ) | 216 | |||||||||||
|
|
|
|
|
|
|
|
|
|||||||||
| Balance at December 31, 2012 |
(240 | ) | 306 | (378 | ) | (312 | ) | |||||||||
| Other comprehensive loss before reclassifications |
(172 | ) | (285 | ) | — | (457 | ) | |||||||||
| Other than temporary impairment not recognized in earnings on securities |
— | (26 | ) | — | (26 | ) | ||||||||||
| Amounts reclassified from other comprehensive income |
114 | (86 | ) | 119 | 147 | |||||||||||
|
|
|
|
|
|
|
|
|
|||||||||
| Net other comprehensive (loss) income |
(58 | ) | (397 | ) | 119 | (336 | ) | |||||||||
|
|
|
|
|
|
|
|
|
|||||||||
| Balance at December 31, 2013 |
$ | (298 | ) | $ | (91 | ) | $ | (259 | ) | $ | (648 | ) | ||||
|
|
|
|
|
|
|
|
|
|||||||||
F-78
Table of Contents
CITIZENS FINANCIAL GROUP, INC.
NOTES TO CONSOLIDATED FINANCIAL STATEMENTS
The following table reports the amounts reclassified out of each component of OCI and into the Consolidated Statement of Operations:
| Year Ended December 31, 2013 | ||||||
| Details about AOCI Components |
Amount Reclassified from AOCI |
Affected Line Item in the Consolidated Statements | ||||
| (in millions) | ||||||
| Reclassification adjustment for net derivative gains (losses) included in net income (loss): |
$ | 56 | Interest income | |||
| (235 | ) | Interest expense | ||||
| (1 | ) | Other income | ||||
|
|
|
|||||
| (180 | ) | Income before income tax (benefit) expense | ||||
| (66 | ) | Income tax (benefit) expense | ||||
|
|
|
|||||
| $ | (114 | ) | Net (loss) income | |||
|
|
|
|||||
| Reclassification of net securities gains (losses) to net income (loss): |
$ | 144 | Securities gains, net | |||
| (8 | ) | Net impairment losses recognized in earnings | ||||
|
|
|
|||||
| 136 | Income before income tax (benefit) expense | |||||
| 50 | Income tax (benefit) expense | |||||
|
|
|
|||||
| $ | 86 | Net (loss) income | ||||
|
|
|
|||||
| Reclassification of changes related to the employee benefit plan: |
$ | (190 | ) | Salaries and employee benefits | ||
|
|
|
|||||
| (190 | ) | Income before income tax (benefit) expense | ||||
| (71 | ) | Income tax (benefit) expense | ||||
|
|
|
|||||
| $ | (119 | ) | Net (loss) income | |||
|
|
|
|||||
| Total reclassification loss: |
$ | (147 | ) | Net (loss) income | ||
|
|
|
|||||
The following table presents the effects to net income of the amounts reclassified out of OCI:
| Year Ended December 31, 2013 |
||||
| (in millions) | ||||
| Net interest income (includes $(179) of AOCI reclassifications) |
$ | 3,058 | ||
| Provision for credit losses |
479 | |||
| Noninterest income (includes $135 of AOCI reclassifications) |
1,632 | |||
| Noninterest expense (includes $190 of AOCI reclassifications) |
7,679 | |||
|
|
|
|||
| Loss before income tax benefit |
(3,468 | ) | ||
| Income tax benefit (includes $87 income tax net benefit from reclassification items) |
(42 | ) | ||
|
|
|
|||
| Net loss |
$ | (3,426 | ) | |
|
|
|
|||
F-79
Table of Contents
CITIZENS FINANCIAL GROUP, INC.
NOTES TO CONSOLIDATED FINANCIAL STATEMENTS
NOTE 23—EXIT COSTS AND RESTRUCTURING RESERVES
The Company continues to review its structural expense base in a companywide effort to create a more streamlined organization, reduce expense growth, and provide funds for future growth initiatives. During 2013, Citizens introduced branch image capture on the teller line, which automated several key processes within the branch network.
The following table includes the activity in the exit costs and restructuring reserves:
| Severance | Facilities Costs | Fixed Assets | Other | Total | ||||||||||||||||
| (in millions) | ||||||||||||||||||||
| Reserve balance as of January 1, 2011 |
$ | 9 | $ | 15 | $ | — | $ | 1 | $ | 25 | ||||||||||
| Additions |
9 | 43 | 9 | 4 | 65 | |||||||||||||||
| Utilization |
(9 | ) | (6 | ) | (2 | ) | (5 | ) | (22 | ) | ||||||||||
|
|
|
|
|
|
|
|
|
|
|
|||||||||||
| Reserve balance as of December 31, 2011 |
9 | 52 | 7 | — | 68 | |||||||||||||||
| Additions |
2 | 1 | — | 4 | 7 | |||||||||||||||
| Reversals |
(1 | ) | (11 | ) | — | — | (12 | ) | ||||||||||||
| Utilization |
(7 | ) | (22 | ) | — | (4 | ) | (33 | ) | |||||||||||
|
|
|
|
|
|
|
|
|
|
|
|||||||||||
| Reserve balance as of December 31, 2012 |
3 | 20 | 7 | — | 30 | |||||||||||||||
| Additions |
6 | 15 | 7 | 3 | 31 | |||||||||||||||
| Reversals |
(1 | ) | (4 | ) | — | — | (5 | ) | ||||||||||||
| Utilization |
(6 | ) | (13 | ) | (8 | ) | (3 | ) | (30 | ) | ||||||||||
|
|
|
|
|
|
|
|
|
|
|
|||||||||||
| Reserve balance as of December 31, 2013 |
$ | 2 | $ | 18 | $ | 6 | $ | 0 | $ | 26 | ||||||||||
|
|
|
|
|
|
|
|
|
|
|
|||||||||||
In the year ended December 31, 2013, the Company reversed $5 million and recorded $31 million in noninterest expense for restructuring charges. The reversed restructuring charges consisted primarily of lease termination costs of $4 million and employee termination costs of $1 million. The recorded restructuring charges consisted primarily of employee termination costs of $6 million, lease termination costs of $15 million, fixed asset writeoffs of $7 million, and $3 million of other costs.
In the year ended December 31, 2012, the Company recorded a $7 million charge to noninterest expense for other restructuring charges consisting primarily of lease termination costs of $1 million, employee termination costs of $2 million, and miscellaneous other expense of $4 million.
NOTE 24—BUSINESS SEGMENTS
The Company is managed by its CEO on a divisional basis. The Company’s two business segments are Consumer Banking and Commercial Banking. The business segments are determined based on the products and services provided or the type of customer served. Each division has a Vice Chairman who reports directly to the CEO. The CEO has final authority over resource allocation decisions and performance assessment. The business segments reflect this management structure and the manner in which financial information is currently evaluated by the CEO. Non-segment operations are classified as Other, which includes corporate functions, the Treasury function, the securities portfolio, wholesale funding activities, intangible assets, Community Development, non-core assets, and other unallocated assets, liabilities, revenues and expenses.
Segment results are determined based upon the Company’s management reporting system, which assigns balance sheet and income statement items to each of the business segments. The process is designed around the Company’s organizational and management structure and, accordingly, the
F-80
Table of Contents
CITIZENS FINANCIAL GROUP, INC.
NOTES TO CONSOLIDATED FINANCIAL STATEMENTS
results derived are not necessarily comparable with similar information published by other financial institutions. A description of each reportable segment and table of financial results is presented below.
| • | Consumer Banking—The Consumer Banking segment focuses on retail customers and small businesses with annual revenues of up to $25 million. It offers traditional banking products and services, including checking, savings, home loans, student loans, credit cards, business loans and financial management services. It also operates an indirect auto financing business, providing financing for both new and used vehicles through auto dealerships. The segment’s distribution channels include a branch network, ATMs and a work force of experienced specialists ranging from financial consultants, mortgage loan officers and business banking officers to private bankers. |
| • | Commercial Banking—The Commercial Banking segment targets companies with annual revenues from $25 million to $2 billion and provides a full complement of financial products and solutions, including loans, leases, trade financing, deposits, cash management, foreign exchange, interest rate risk management, corporate finance and capital markets advisory capabilities. It focuses on small and middle-market companies and has dedicated teams with industry expertise in government banking, not-for-profit, healthcare, technology, asset finance, franchise finance, asset-based lending, commercial real estate, private equity and sponsor finance. While the segment’s business development efforts are predominantly focused on our twelve-state core footprint, some of its specialized industry teams also operate selectively on a national basis (such as healthcare, asset finance and franchise finance). Commercial Banking is organized by teams that target different client segments. A key component of the segment’s growth strategy is to expand its loan portfolio by originating high-quality commercial loans, which produce revenues consistent with its financial objectives and complies with its conservative credit policies. Commercial underwriting is driven by cash flow analysis supported by collateral analysis and review. The commercial lending teams offer a wide range of commercial loan products, including commercial real estate loans; working capital loans and lines of credit; demand, term and time loans; and equipment, inventory and accounts receivable financing. |
| As of and for the Year Ended December 31, 2013 | ||||||||||||||||
| Consumer Banking | Commercial Banking | Other | Consolidated | |||||||||||||
| (in millions) | ||||||||||||||||
| Net interest income (expense) |
$ | 2,176 | $ | 1,031 | $ | (149 | ) | $ | 3,058 | |||||||
| Noninterest income |
1,025 | 389 | 218 | 1,632 | ||||||||||||
|
|
|
|
|
|
|
|
|
|||||||||
| Total revenue |
3,201 | 1,420 | 69 | 4,690 | ||||||||||||
| Noninterest expense |
2,522 | 635 | 4,522 | 7,679 | ||||||||||||
|
|
|
|
|
|
|
|
|
|||||||||
| Profit (loss) before provision for credit losses |
679 | 785 | (4,453 | ) | (2,989 | ) | ||||||||||
| Provision for credit losses |
308 | (7 | ) | 178 | 479 | |||||||||||
|
|
|
|
|
|
|
|
|
|||||||||
| Income (loss) before income tax expense |
371 | 792 | (4,631 | ) | (3,468 | ) | ||||||||||
| Income tax expense (benefit) |
129 | 278 | (449 | ) | (42 | ) | ||||||||||
|
|
|
|
|
|
|
|
|
|||||||||
| Net income (loss) |
$ | 242 | $ | 514 | $ | (4,182 | ) | $ | (3,426 | ) | ||||||
|
|
|
|
|
|
|
|
|
|||||||||
| Total Average Assets |
$ | 46,465 | $ | 35,229 | $ | 39,172 | $ | 120,866 | ||||||||
|
|
|
|
|
|
|
|
|
|||||||||
F-81
Table of Contents
CITIZENS FINANCIAL GROUP, INC.
NOTES TO CONSOLIDATED FINANCIAL STATEMENTS
| As of and for the Year Ended December 31, 2012 | ||||||||||||||||
| Consumer Banking | Commercial Banking | Other | Consolidated | |||||||||||||
| (in millions) | ||||||||||||||||
| Net interest income (expense) |
$ | 2,197 | $ | 1,036 | $ | (6 | ) | $ | 3,227 | |||||||
| Noninterest income |
1,187 | 349 | 131 | 1,667 | ||||||||||||
|
|
|
|
|
|
|
|
|
|||||||||
| Total revenue |
3,384 | 1,385 | 125 | 4,894 | ||||||||||||
| Noninterest expense |
2,691 | 625 | 141 | 3,457 | ||||||||||||
|
|
|
|
|
|
|
|
|
|||||||||
| Profit (loss) before provision for credit losses |
693 | 760 | (16 | ) | 1,437 | |||||||||||
| Provision for credit losses |
408 | 63 | (58 | ) | 413 | |||||||||||
|
|
|
|
|
|
|
|
|
|||||||||
| Income before income tax expense |
285 | 697 | 42 | 1,024 | ||||||||||||
| Income tax expense |
100 | 244 | 37 | 381 | ||||||||||||
|
|
|
|
|
|
|
|
|
|||||||||
| Net income |
$ | 185 | $ | 453 | $ | 5 | $ | 643 | ||||||||
|
|
|
|
|
|
|
|
|
|||||||||
| Total Average Assets |
$ | 47,824 | $ | 33,474 | $ | 46,368 | $ | 127,666 | ||||||||
|
|
|
|
|
|
|
|
|
|||||||||
| As of and for the Year Ended December 31, 2011 | ||||||||||||||||
| Consumer Banking | Commercial Banking | Other | Consolidated | |||||||||||||
| (in millions) | ||||||||||||||||
| Net interest income |
$ | 2,204 | $ | 929 | $ | 187 | $ | 3,320 | ||||||||
| Noninterest income |
1,128 | 343 | 240 | 1,711 | ||||||||||||
|
|
|
|
|
|
|
|
|
|||||||||
| Total revenue |
3,332 | 1,272 | 427 | 5,031 | ||||||||||||
| Noninterest expense |
2,524 | 605 | 242 | 3,371 | ||||||||||||
|
|
|
|
|
|
|
|
|
|||||||||
| Profit before provision for credit losses |
808 | 667 | 185 | 1,660 | ||||||||||||
| Provision for credit losses |
400 | 92 | 390 | 882 | ||||||||||||
|
|
|
|
|
|
|
|
|
|||||||||
| Income (loss) before income tax expense |
408 | 575 | (205 | ) | 778 | |||||||||||
| Income tax expense (benefit) |
143 | 202 | (73 | ) | 272 | |||||||||||
|
|
|
|
|
|
|
|
|
|||||||||
| Net income (loss) |
$ | 265 | $ | 373 | $ | (132 | ) | $ | 506 | |||||||
|
|
|
|
|
|
|
|
|
|||||||||
| Total Average Assets |
$ | 46,071 | $ | 29,800 | $ | 52,473 | $ | 128,344 | ||||||||
|
|
|
|
|
|
|
|
|
|||||||||
In addition to non-segment operations, Other includes certain reconciling items in order to translate the segment results that are based on management accounting practices into consolidated results. For example, Other includes goodwill and the associated $4.4 billion goodwill impairment charge recorded in 2013. Management accounting practices utilized by the Company as the basis for presentation for segment results include the following:
| • | FTP adjustments. The Company utilizes an FTP system to eliminate the effect of interest rate risk from the segments’ net interest income because such risk is centrally managed within the Treasury function. The FTP system credits (or charges) the segments with the economic value of the funds created (or used) by the segments. The FTP system provides a funds credit for sources of funds and a funds charge for the use of funds by each segment. The summation of the interest income / expense and FTP charges / credits for each segment is its designated net interest income. The variance between the Company’s cumulative FTP charges and cumulative FTP credits is allocated to the individual business segments. |
F-82
Table of Contents
CITIZENS FINANCIAL GROUP, INC.
NOTES TO CONSOLIDATED FINANCIAL STATEMENTS
| • | Provision for credit losses allocations. Provision for credit losses is allocated to each business segment based on actual net charge-offs that have been recognized by the business segment. The difference between the consolidated provision for credit losses and the business segments’ net charge-offs is reflected in Other. |
| • | Income tax allocations. Income taxes are assessed to each line of business at a standard tax rate with the residual tax expense or benefit to arrive at the consolidated effective tax rate included in Other. |
| • | Expense allocations. Noninterest expenses incurred by centrally managed operations or business lines that directly support another business line’s operations are charged to the applicable business line based on its utilization of those services. |
| • | Goodwill. For impairment testing purposes, the Company’s allocates goodwill to its Consumer Banking and Commercial Banking reporting units. For management reporting purposes, the Company presents the goodwill balance (and any related impairment charges) in Other. |
Substantially all revenues generated and long-lived assets held by the Company’s business segments are derived from clients that reside in the United States. Neither segment earns revenue from a single external customer that represents 10 percent or more of the Company’s total revenues.
NOTE 25—EARNINGS PER SHARE
| Year Ended December 31, | ||||||||||||
| 2013 | 2012 | 2011 | ||||||||||
| (dollars in millions, except share data) | ||||||||||||
| Numerator: |
||||||||||||
| Net (loss) income |
$ | (3,426 | ) | $ | 643 | $ | 506 | |||||
| Net (loss) income available to common shareholders |
(3,426 | ) | 643 | 506 | ||||||||
|
|
|
|
|
|
|
|||||||
| Denominator: |
||||||||||||
| Weighted-average common shares outstanding—basic |
559,998,324 | 559,998,324 | 559,998,324 | |||||||||
| Weighted-average common shares outstanding—diluted |
559,998,324 | 559,998,324 | 559,998,324 | |||||||||
|
|
|
|
|
|
|
|||||||
| Earnings (loss) per common share: |
||||||||||||
| Basic |
$ | (6.12 | ) | $ | 1.15 | $ | 0.90 | |||||
| Diluted |
(6.12 | ) | 1.15 | 0.90 | ||||||||
|
|
|
|
|
|
|
|||||||
The Company had 559,998,324 shares of common stock issued and outstanding as of December 31, 2013, 2012, and 2011 after reflecting the 165,582-for-1 forward stock split that was effective on August 22, 2014. The Company’s authorized shares were increased to 1,000,000,000 on April 9, 2014. The Company did not have dilutive shares during the periods presented.
NOTE 26—SHARE-BASED COMPENSATION
RBS Group grants stock-based compensation awards to employees of the Company pursuant to its various long-term incentive plans. These plans are administered by the Group Performance and Remuneration Committee of the RBSG Board of Directors. All stock-based compensation awards granted to employees have been settled in RBSG shares.
F-83
Table of Contents
CITIZENS FINANCIAL GROUP, INC.
NOTES TO CONSOLIDATED FINANCIAL STATEMENTS
Restricted Share Units
A restricted share unit is the right to receive shares of stock on a future date, which may be subject to time-based vesting conditions and/or performance-based vesting conditions. Time-based restricted share units granted historically have generally become vested ratably over a three-year period. Performance-based restricted share units granted historically have generally become vested at the end of a three-year performance period, depending on the level of performance achieved during such period as compared to specified RBS Group, divisional and/or functional performance guideposts and subject to the further adjustment at the discretion of the Group Remuneration and Performance Committee of the RBSG Board of Directors.
The fair value of each award is determined on the grant date. All awards (including those with cliff or ratable vesting) are expensed on a straight-line basis. With respect to performance-based awards, over the performance and requisite service period (i.e., vesting period) of the award, the number of shares of stock that will be issued is adjusted upward or downward based upon the probability of achievement of performance (in the case of performance-based awards) and the ultimate number of shares issued and the related compensation cost recognized as expense is based on actual performance levels.
The following table summarizes the activity related to our restricted share unit plans:
| Year Ended December 31, | ||||||||||||||||||||||||
| 2013 | 2012 | 2011 | ||||||||||||||||||||||
| Restricted Share Units |
Weighted- Average Grant Price |
Restricted Share Units |
Weighted- Average Grant Price |
Restricted Share Units |
Weighted- Average Grant Price |
|||||||||||||||||||
| Nonvested, January 1, |
22,865,810 | $ | 6.14 | 23,490,759 | $ | 6.49 | 20,333,225 | $ | 6.23 | |||||||||||||||
| Granted |
6,363,919 | 4.66 | 9,477,611 | 4.41 | 8,519,076 | 7.05 | ||||||||||||||||||
| Vested |
(4,208,789 | ) | 6.68 | (8,379,848 | ) | 5.22 | (3,726,990 | ) | 6.22 | |||||||||||||||
| Forfeited |
(5,241,973 | ) | 7.03 | (1,722,712 | ) | 5.93 | (1,634,552 | ) | 6.79 | |||||||||||||||
|
|
|
|
|
|
|
|
|
|
|
|
|
|||||||||||||
| Nonvested, December 31, |
19,778,967 | $ | 5.31 | 22,865,810 | $ | 6.14 | 23,490,759 | $ | 6.49 | |||||||||||||||
|
|
|
|
|
|
|
|
|
|
|
|
|
|||||||||||||
Share Options
RBS Group awarded share options to certain employees under the ESOP, which were subject to clawback provisions and, in some cases, performance conditions. The last ESOP award was granted in 2009 and vested three years later in 2012. There are no remaining unvested ESOP awards. All unexercised options expire by April 2019.
F-84
Table of Contents
CITIZENS FINANCIAL GROUP, INC.
NOTES TO CONSOLIDATED FINANCIAL STATEMENTS
The following table summarizes the activity related to share options for the periods presented:
| Year Ended December 31, | ||||||||||||||||||||||||
| 2013 | 2012 | 2011 | ||||||||||||||||||||||
| Number of Options |
Weighted- Average Exercise Price |
Number of Options |
Weighted- Average Exercise Price |
Number of Options |
Weighted- Average Exercise Price |
|||||||||||||||||||
| Outstanding at January 1, |
1,594,237 | $ | 4.37 | 2,109,150 | $ | 4.39 | 2,136,128 | $ | 4.40 | |||||||||||||||
| Exercised |
(127,469 | ) | 4.25 | — | — | — | — | |||||||||||||||||
| Forfeited/Canceled |
— | — | (514,913 | ) | 4.47 | (26,978 | ) | 4.61 | ||||||||||||||||
|
|
|
|
|
|
|
|
|
|
|
|
|
|||||||||||||
| Outstanding at December 31, |
1,466,768 | $ | 4.38 | 1,594,237 | $ | 4.37 | 2,109,150 | $ | 4.39 | |||||||||||||||
|
|
|
|
|
|
|
|
|
|
|
|
|
|||||||||||||
| Exercisable at December 31, |
1,466,768 | |||||||||||||||||||||||
|
|
|
|||||||||||||||||||||||
Compensation expense related to the above share based plans was $27 million, $29 million, and $29 million for the years ended December 31, 2013, 2012, and 2011, respectively. At December 31, 2013, the total unrecognized compensation expense for nonvested equity awards granted was $20 million. This expense is expected to be recognized over a weighted-average period of three years. No share-based compensation costs were capitalized or dividends paid by RBS Group, during the years ended December 31, 2013, 2012 and 2011.
F-85
Table of Contents
CITIZENS FINANCIAL GROUP, INC.
NOTES TO CONSOLIDATED FINANCIAL STATEMENTS
NOTE 27—PARENT COMPANY ONLY FINANCIALS
CFG Parent Company
Condensed Statements of Operations
| Year Ended December 31, | ||||||||||||
| 2013 | 2012 | 2011 | ||||||||||
| (in millions) | ||||||||||||
| OPERATING INCOME: |
||||||||||||
| Income from bank subsidiaries and associated banks, excluding equity in undistributed income: |
||||||||||||
| Dividends |
$ | 210 | $ | 175 | $ | — | ||||||
| Interest |
13 | 13 | 20 | |||||||||
| Management and service fees |
26 | 42 | 44 | |||||||||
| Income from nonbank subsidiaries and associated nonbank companies excluding equity in undistributed income: |
||||||||||||
| Interest |
— | — | 1 | |||||||||
| Securities gains |
— | 1 | — | |||||||||
| All other operating income |
2 | 4 | 19 | |||||||||
|
|
|
|
|
|
|
|||||||
| Total operating income |
251 | 235 | 84 | |||||||||
|
|
|
|
|
|
|
|||||||
| OPERATING EXPENSE: |
||||||||||||
| Salaries and employee benefits |
38 | 52 | 50 | |||||||||
| Interest expense |
24 | 4 | — | |||||||||
| All other expenses |
43 | 39 | 40 | |||||||||
|
|
|
|
|
|
|
|||||||
| Total operating expense |
105 | 95 | 90 | |||||||||
|
|
|
|
|
|
|
|||||||
| Income (loss) before taxes and undistributed income |
146 | 140 | (6 | ) | ||||||||
|
|
|
|
|
|
|
|||||||
| Applicable income taxes |
(22 | ) | (9 | ) | (14 | ) | ||||||
|
|
|
|
|
|
|
|||||||
| Income before undistributed income of subsidiaries and associated companies |
168 | 149 | 8 | |||||||||
|
|
|
|
|
|
|
|||||||
| Equity in undistributed (losses) income of subsidiaries and associated companies: |
||||||||||||
| Bank |
(3,595 | ) | 501 | 488 | ||||||||
| Nonbank |
1 | (7 | ) | 10 | ||||||||
|
|
|
|
|
|
|
|||||||
| Net (loss) income |
$ | (3,426 | ) | $ | 643 | $ | 506 | |||||
|
|
|
|
|
|
|
|||||||
| Other comprehensive (loss) income, net of income taxes: |
||||||||||||
| Net pension plan activity arising during the period |
$ | 17 | $ | (7 | ) | $ | (27 | ) | ||||
| Net unrealized derivative instrument gains arising during the period |
1 | — | — | |||||||||
|
|
|
|
|
|
|
|||||||
| Other comprehensive income (loss) activity of the Parent Company Only, net of income taxes |
18 | (7 | ) | (27 | ) | |||||||
|
|
|
|
|
|
|
|||||||
| Other comprehensive (loss) income activity of Bank subsidiaries, net of income taxes |
(354 | ) | 223 | 190 | ||||||||
|
|
|
|
|
|
|
|||||||
| Total other comprehensive (loss) income, net of income taxes |
(336 | ) | 216 | 163 | ||||||||
|
|
|
|
|
|
|
|||||||
| Total comprehensive (loss) income |
$ | (3,762 | ) | $ | 859 | $ | 669 | |||||
|
|
|
|
|
|
|
|||||||
F-86
Table of Contents
CITIZENS FINANCIAL GROUP, INC.
NOTES TO CONSOLIDATED FINANCIAL STATEMENTS
In accordance with federal and state banking regulations, dividends paid by the Company’s banking subsidiaries to the Company itself are generally limited to the retained earnings of the respective banking subsidiaries unless specifically approved by the appropriate bank regulator. The Company declared and paid RBS total common stock dividends of $1.2 billion in 2013. There were $150 million in common stock dividends in 2012 and no common stock dividends in 2011.
CFG Parent Company
Condensed Balance Sheets
| December 31, | ||||||||
| 2013 | 2012 | |||||||
| (in millions) | ||||||||
| ASSETS: |
||||||||
| Cash and due from banks |
$ | 494 | $ | 694 | ||||
| Loans and advances to: |
||||||||
| Bank subsidiaries |
459 | 460 | ||||||
| Related bank holding companies |
1 | 8 | ||||||
| Investments in subsidiaries: |
||||||||
| Bank subsidiaries |
19,522 | 23,545 | ||||||
| Nonbank subsidiaries |
73 | 92 | ||||||
| Other assets |
178 | 184 | ||||||
|
|
|
|
|
|||||
| TOTAL ASSETS |
$ | 20,727 | $ | 24,983 | ||||
|
|
|
|
|
|||||
| LIABILITIES: |
||||||||
| Long-term debt due to: |
||||||||
| Nonbank subsidiaries |
$ | — | $ | 295 | ||||
| Unaffiliated companies |
350 | 350 | ||||||
| Related bank holding companies |
1,000 | — | ||||||
| Other liabilities |
181 | 209 | ||||||
|
|
|
|
|
|||||
| TOTAL LIABILITIES |
1,531 | 854 | ||||||
|
|
|
|
|
|||||
| TOTAL STOCKHOLDERS’ EQUITY |
19,196 | 24,129 | ||||||
|
|
|
|
|
|||||
| TOTAL LIABILITIES AND STOCKHOLDERS’ EQUITY |
$ | 20,727 | $ | 24,983 | ||||
|
|
|
|
|
|||||
F-87
Table of Contents
CITIZENS FINANCIAL GROUP, INC.
NOTES TO CONSOLIDATED FINANCIAL STATEMENTS
CFG Parent Company
Condensed Cash Flow Statements
| Year Ended December 31, | ||||||||||||
| 2013 | 2012 | 2011 | ||||||||||
| (in millions) | ||||||||||||
| OPERATING ACTIVITIES |
||||||||||||
| Net (loss) income |
$ | (3,426 | ) | $ | 643 | $ | 506 | |||||
| Adjustments to reconcile net (loss) income to net cash provided by operating activities: |
||||||||||||
| Deferred income taxes |
(11 | ) | (12 | ) | (29 | ) | ||||||
| Gain on sales of assets |
— | (1 | ) | — | ||||||||
| Equity in undistributed losses (earnings) of subsidiaries |
3,594 | (494 | ) | (498 | ) | |||||||
| Net change in other liabilities |
7 | 47 | (9 | ) | ||||||||
| Net change in other assets |
15 | (20 | ) | 30 | ||||||||
| Other operating, net |
1 | (2 | ) | — | ||||||||
|
|
|
|
|
|
|
|||||||
| Total adjustments |
3,606 | (482 | ) | (506 | ) | |||||||
|
|
|
|
|
|
|
|||||||
| Net cash provided (used) by operating activities |
180 | 161 | — | |||||||||
|
|
|
|
|
|
|
|||||||
| INVESTING ACTIVITIES |
||||||||||||
| Proceeds from sales and maturities of securities available for sale |
— | 3 | 437 | |||||||||
| Payments for investments in and advances to subsidiaries |
(220 | ) | (800 | ) | (508 | ) | ||||||
| Sale or repayment of investments in and advances to subsidiaries |
315 | 1,164 | 22 | |||||||||
| Other investing, net |
(1 | ) | (1 | ) | — | |||||||
|
|
|
|
|
|
|
|||||||
| Net cash provided (used) by investing activities |
94 | 366 | (49 | ) | ||||||||
|
|
|
|
|
|
|
|||||||
| FINANCING ACTIVITIES |
||||||||||||
| Proceeds from advances from subsidiaries |
— | 5 | 22 | |||||||||
| Repayment of advances from subsidiaries |
(289 | ) | (239 | ) | (13 | ) | ||||||
| Proceeds from issuance of long-term debt |
1,000 | 350 | — | |||||||||
| Dividends paid |
(1,185 | ) | (150 | ) | — | |||||||
|
|
|
|
|
|
|
|||||||
| Net cash (used) provided by financing activities |
(474 | ) | (34 | ) | 9 | |||||||
|
|
|
|
|
|
|
|||||||
| Net (decrease) increase in cash and due from banks |
(200 | ) | 493 | (40 | ) | |||||||
| Cash and due from banks at beginning of year |
694 | 201 | 241 | |||||||||
|
|
|
|
|
|
|
|||||||
| Cash and due from banks at end of period |
$ | 494 | $ | 694 | $ | 201 | ||||||
|
|
|
|
|
|
|
|||||||
NOTE 28—OTHER OPERATING EXPENSE
The following table presents the details of other operating expense:
| Year Ended December 31, | ||||||||||||
| 2013 | 2012 | 2011 | ||||||||||
| (in millions) | ||||||||||||
| Deposit insurance |
$ | 85 | $ | 98 | $ | 117 | ||||||
| Promotional expense |
76 | 86 | 102 | |||||||||
| Settlements and operating losses |
51 | 58 | 61 | |||||||||
| Postage and delivery |
60 | 196 | 32 | |||||||||
| Other |
256 | 271 | 370 | |||||||||
|
|
|
|
|
|
|
|||||||
| Total other operating expense |
$ | 528 | $ | 709 | $ | 682 | ||||||
|
|
|
|
|
|
|
|||||||
F-88
Table of Contents
CITIZENS FINANCIAL GROUP, INC.
NOTES TO CONSOLIDATED FINANCIAL STATEMENTS
NOTE 29—SUBSEQUENT EVENTS
The Company has evaluated events that have occurred subsequent to December 31, 2013 through September 8, 2014, the date the Consolidated Financial Statements were originally issued. In January 2014, the Company reached an agreement to sell 103 retail branches, including loans, deposits, and related branch premises located in Illinois. The agreement includes the sale of approximately $1.1 billion in loans, $5.3 billion in deposits and related branch premises. The all-cash transaction is expected to close in the second quarter of 2014. As a result of this transaction, the assets and liabilities related to the branches being sold have been classified as held for sale in the Consolidated Balance Sheet at December 31, 2013. On April 9, 2014, the Company approved an increase in the number of authorized shares of common stock to 1,000,000,000. On August 22, 2014, the Company declared and made effective a 165,582-for-1 forward stock split of common stock. As a result, all share and per share data have been restated to reflect the effect of the split.
F-89
Table of Contents
UNAUDITED INTERIM CONSOLIDATED FINANCIAL STATEMENTS
F-90
Table of Contents
CITIZENS FINANCIAL GROUP, INC.
GLOSSARY OF ACRONYMS AND TERMS
GLOSSARY OF ACRONYMS AND TERMS
The following listing provides a comprehensive reference of common acronyms and terms used throughout the document:
| AFS |
Available For Sale | |
| ALLL |
Allowance for Loan and Lease Losses | |
| AOCI |
Accumulated Other Comprehensive Income | |
| ATM |
Automatic Teller Machine | |
| BHC |
Bank Holding Company | |
| bps |
Basis Points | |
| Capital Plan Rule |
Federal Reserve’s Regulation Y Capital Plan Rule | |
| CBNA |
Citizens Bank, National Association | |
| CBPA |
Citizens Bank of Pennsylvania | |
| CCAR |
Comprehensive Capital Analysis and Review | |
| CCB |
Capital Conservation Buffer | |
| CEB |
Commercial Enterprise Banking | |
| CEO | Chief Executive Officer | |
| CET1 |
Common Equity Tier 1 | |
| Citizens or CFG or the Company | Citizens Financial Group, Inc. and its Subsidiaries | |
| CLTV |
Combined Loan-to-Value | |
| CMO |
Collateralized Mortgage Obligation | |
| CRA |
Community Reinvestment Act of 1977 | |
| CSA |
Credit Support Annex | |
| Dodd-Frank Act (DFA) |
The Dodd-Frank Wall Street Reform and Consumer Protection Act of 2010 | |
| EC |
Economic Capital | |
| EPS |
Earnings Per Share | |
| ESOP |
Executive Share Option Plan | |
| ERISA |
Employee Retirement Income Security Act of 1974 | |
| Fannie Mae (FNMA) |
The Federal National Mortgage Association | |
| FASB |
The Financial Accounting Standards Board | |
| FDIC |
Federal Deposit Insurance Corporation | |
| FDICIA |
Federal Deposit Insurance Corporation Improvement Act of 1991 | |
| FFIEC |
Federal Financial Institutions Examination Council | |
| FHC |
Financial Holding Company | |
| FHLB |
Federal Home Loan Bank | |
| FICO |
Fair Isaac Corporation (credit rating) | |
| FLSA |
Fair Labor Standards Act of 1938, as amended | |
| FRB |
Federal Reserve Bank | |
| FRBG |
Federal Reserve Board of Governors |
F-91
Table of Contents
| Freddie Mac (FHLMC) |
The Federal Home Loan Mortgage Corporation | |
| FTP |
Funds Transfer Pricing | |
| GAAP |
Accounting Principles Generally Accepted in the United States of America | |
| GDP |
Gross Domestic Product | |
| Ginnie Mae (GNMA) |
The Government National Mortgage Association | |
| GLBA |
Gramm-Leach-Bliley Act of 1999 | |
| HELOC |
Home Equity Line of Credit | |
| HTM |
Held To Maturity | |
| ICAR |
Internal Capital Adequacy Requirement | |
| IFRS |
International Financial Reporting Standards | |
| ILP |
Incurred Loss Period | |
| IST |
Integrated Stress Testing | |
| IT |
Information Technology | |
| LIBOR |
London Interbank Offered Rate | |
| LOB |
Line of Business | |
| LTV |
Loan-to-Value | |
| MBS |
Mortgage-Backed Securities | |
| MD&A |
Management’s Discussion and Analysis of Financial Condition and Results of Operations | |
| MERS |
Mortgage Electronic Registration Systems | |
| MSR |
Mortgage Servicing Right | |
| NPR |
Notice of Proposed Rulemaking | |
| OCC |
Office of the Comptroller of the Currency | |
| OCI |
Other Comprehensive Income | |
| OIS |
Overnight Index Swap | |
| OTC |
Over the Counter | |
| PIMCO |
Pacific Investment Management Company, LLC | |
| RBS |
The Royal Bank of Scotland plc. | |
| RBS CBFM |
The Royal Bank of Scotland plc. Corporate Banking and Financial Markets | |
| RBSG or RBS Group |
The Royal Bank of Scotland Group plc. and its subsidiaries | |
| REIT |
Real Estate Investment Trust | |
| ROTCE |
Return on Tangible Common Equity | |
| RPA |
Risk Participation Agreement | |
| RV |
Recreational Vehicle | |
| SBO |
Serviced by Others loan portfolio | |
| SIFI |
Systemically Important Financial Institutions | |
| TDR |
Troubled Debt Restructuring | |
| UK |
United Kingdom |
F-92
Table of Contents
CITIZENS FINANCIAL GROUP, INC.
| June 30, 2014 (unaudited) |
December 31, 2013 (unaudited) |
|||||||
| (in millions, except share data) | ||||||||
| ASSETS: |
||||||||
| Cash and due from banks |
$ | 1,038 | $ | 1,406 | ||||
| Interest-bearing cash and due from banks |
4,318 | 1,351 | ||||||
| Interest-bearing deposits in banks |
309 | 233 | ||||||
| Securities available for sale, at fair value |
18,493 | 15,995 | ||||||
| Securities held to maturity (estimated fair value of $5,398 and $4,257, respectively) |
5,382 | 4,315 | ||||||
| Other investment securities |
948 | 935 | ||||||
| Loans held for sale, at fair value |
173 | 176 | ||||||
| Other loans held for sale |
89 | 1,078 | ||||||
| Loans and leases |
88,829 | 85,859 | ||||||
| Less: Allowance for loan and lease losses |
1,210 | 1,221 | ||||||
|
|
|
|
|
|||||
| Net loans and leases |
87,619 | 84,638 | ||||||
| Derivative assets |
635 | 650 | ||||||
| Premises and equipment, net |
560 | 592 | ||||||
| Bank-owned life insurance |
1,361 | 1,339 | ||||||
| Goodwill |
6,876 | 6,876 | ||||||
| Due from broker |
— | 446 | ||||||
| Other branch assets held for sale |
— | 46 | ||||||
| Other assets (related party balances of $(45) and $63, respectively) |
2,478 | 2,078 | ||||||
|
|
|
|
|
|||||
| TOTAL ASSETS |
$ | 130,279 | $ | 122,154 | ||||
|
|
|
|
|
|||||
| LIABILITIES AND STOCKHOLDERS’ EQUITY: |
||||||||
| LIABILITIES: |
||||||||
| Deposits: |
||||||||
| Noninterest-bearing |
$ | 26,670 | $ | 24,931 | ||||
| Interest-bearing (related party balances of $5 and $5, respectively) |
64,986 | 61,972 | ||||||
|
|
|
|
|
|||||
| Total deposits |
91,656 | 86,903 | ||||||
| Deposits held for sale |
— | 5,277 | ||||||
| Federal funds purchased and securities sold under agreements to repurchase |
6,807 | 4,791 | ||||||
| Other short-term borrowed funds |
7,702 | 2,251 | ||||||
| Derivative liabilities (related party balances of $643 and $835, respectively) |
747 | 939 | ||||||
| Deferred taxes, net |
403 | 199 | ||||||
| Long-term borrowed funds (related party balances of $1,333 and $1,000, respectively) |
1,732 | 1,405 | ||||||
| Other liabilities (related party balances of $34 and $27, respectively) |
1,635 | 1,193 | ||||||
|
|
|
|
|
|||||
| TOTAL LIABILITIES |
110,682 | 102,958 | ||||||
|
|
|
|
|
|||||
| Contingencies (refer to Note 12) |
||||||||
| STOCKHOLDERS’ EQUITY: |
||||||||
| Preferred stock: |
||||||||
| $25.00 par value, 100,000,000 shares authorized, no shares outstanding at June 30, 2014 and $1.00 par value, 30,000 shares authorized, no shares outstanding at December 31, 2013 |
— | — | ||||||
| Common stock: |
||||||||
| $.01 par value, 1,000,000,000 shares authorized, 559,998,324 shares issued and outstanding at June 30, 2014 and at December 31, 2013 |
6 | 6 | ||||||
| Additional paid-in capital |
18,603 | 18,603 | ||||||
| Retained earnings |
1,346 | 1,235 | ||||||
| Accumulated other comprehensive loss |
(358 | ) | (648 | ) | ||||
|
|
|
|
|
|||||
| TOTAL STOCKHOLDERS’ EQUITY |
19,597 | 19,196 | ||||||
|
|
|
|
|
|||||
| TOTAL LIABILITIES AND STOCKHOLDERS’ EQUITY |
$ | 130,279 | $ | 122,154 | ||||
|
|
|
|
|
|||||
The accompanying Notes to Unaudited Interim Consolidated Financial Statements are an integral part of these statements.
F-93
Table of Contents
CITIZENS FINANCIAL GROUP, INC.
CONSOLIDATED STATEMENTS OF OPERATIONS
| Six Months Ended June 30, | ||||||||
| 2014 (unaudited) |
2013 (unaudited) |
|||||||
| (in millions, except share data) | ||||||||
| INTEREST INCOME: |
||||||||
| Interest and fees on loans and leases (related party balance of $36 and $21, respectively) |
$ | 1,481 | $ | 1,510 | ||||
| Interest and fees on loans held for sale |
2 | 7 | ||||||
| Interest and fees on other loans held for sale |
22 | — | ||||||
| Investment securities |
303 | 228 | ||||||
| Interest-bearing deposits in banks |
2 | 7 | ||||||
|
|
|
|
|
|||||
| Total interest income |
1,810 | 1,752 | ||||||
|
|
|
|
|
|||||
| INTEREST EXPENSE: |
||||||||
| Deposits (related party balances of $0 and $3, respectively) |
67 | 117 | ||||||
| Deposits held for sale |
4 | — | ||||||
| Federal funds purchased and securities sold under agreement to repurchase (related party balances of $13 and $110, respectively) |
16 | 115 | ||||||
| Other short-term borrowed funds (related party balances of $44 and $0, respectively) |
49 | 1 | ||||||
| Long-term borrowed funds (related party balances of $25 and $2, respectively) |
33 | 10 | ||||||
|
|
|
|
|
|||||
| Total interest expense |
169 | 243 | ||||||
|
|
|
|
|
|||||
| Net interest income |
1,641 | 1,509 | ||||||
| Provision for credit losses |
170 | 202 | ||||||
|
|
|
|
|
|||||
| Net interest income after provision for credit losses |
1,471 | 1,307 | ||||||
|
|
|
|
|
|||||
| NONINTEREST INCOME: |
||||||||
| Service charges and fees (related party balances of $3 and $9, respectively) |
286 | 325 | ||||||
| Card fees |
117 | 114 | ||||||
| Trust and investment services fees |
81 | 72 | ||||||
| Foreign exchange and trade finance fees (related party balances of $(7) and $13, respectively) |
44 | 48 | ||||||
| Capital markets fees (related party balances of $5 and $4, respectively) |
44 | 23 | ||||||
| Mortgage banking fees |
34 | 112 | ||||||
| Bank-owned life insurance income |
23 | 25 | ||||||
| Securities gains, net |
25 | 94 | ||||||
| Other-than-temporary impairment: |
||||||||
| Total other-than-temporary impairment losses |
(39 | ) | (60 | ) | ||||
| Portions of loss recognized in other comprehensive income (before taxes) |
33 | 56 | ||||||
|
|
|
|
|
|||||
| Net impairment losses recognized in earnings |
(6 | ) | (4 | ) | ||||
| Other income (related party balances of $(135) and $176, respectively) |
350 | 61 | ||||||
|
|
|
|
|
|||||
| Total noninterest income |
998 | 870 | ||||||
|
|
|
|
|
|||||
| NONINTEREST EXPENSE: |
||||||||
| Salaries and employee benefits |
872 | 858 | ||||||
| Outside services |
208 | 171 | ||||||
| Occupancy (related party balances of $0 and $2, respectively) |
168 | 164 | ||||||
| Equipment expense |
129 | 138 | ||||||
| Amortization of software |
64 | 45 | ||||||
| Goodwill impairment |
— | 4,435 | ||||||
| Other operating expense |
317 | 262 | ||||||
|
|
|
|
|
|||||
| Total noninterest expense |
1,758 | 6,073 | ||||||
|
|
|
|
|
|||||
| Income before income tax expense (benefit) |
711 | (3,896 | ) | |||||
| Income tax expense (benefit) |
232 | (174 | ) | |||||
|
|
|
|
|
|||||
| NET INCOME (LOSS) |
$ | 479 | $ | (3,722 | ) | |||
|
|
|
|
|
|||||
| Weighted-average number of shares outstanding: |
||||||||
| Basic |
559,998,324 | 559,998,324 | ||||||
| Diluted |
559,998,324 | 559,998,324 | ||||||
|
|
|
|
|
|||||
| Per common share information: |
||||||||
| Basic earnings |
$ | 0.86 | $ | (6.65 | ) | |||
| Diluted earnings |
0.86 | (6.65 | ) | |||||
| Dividends declared and paid to parent |
0.66 | 0.76 | ||||||
|
|
|
|
|
|||||
The accompanying Notes to Unaudited Interim Consolidated Financial Statements are an integral part of these statements.
F-94
Table of Contents
CITIZENS FINANCIAL GROUP, INC.
CONSOLIDATED STATEMENTS OF OTHER COMPREHENSIVE INCOME
| Six Months Ended June 30, | ||||||||
| 2014 (unaudited) |
2013 (unaudited) |
|||||||
| (in millions) | ||||||||
| Net income (loss) |
$ | 479 | $ | (3,722 | ) | |||
| Other comprehensive income (loss): |
||||||||
| Net unrealized derivative instrument gains (losses) arising during the periods, net of income taxes of $70 and $(81), respectively |
120 | (139 | ) | |||||
| Reclassification adjustment for net derivative losses included in net income, net of income taxes of $7 and $45, respectively |
13 | 77 | ||||||
| Net unrealized securities gains (losses) arising during the periods, net of income taxes of $109 and $(126), respectively |
188 | (219 | ) | |||||
| Other than temporary impairment not recognized in earnings on securities, net of income taxes of $(12) and $(21), respectively |
(21 | ) | (35 | ) | ||||
| Reclassification of net securities gains to net income, net of income taxes of $(7) and $(34), respectively |
(12 | ) | (56 | ) | ||||
| Defined benefit pension plans: |
||||||||
| Amortization of actuarial loss, net of income taxes of $1 and $3, respectively |
2 | 3 | ||||||
|
|
|
|
|
|||||
| Total other comprehensive income (loss), net of income taxes |
290 | (369 | ) | |||||
|
|
|
|
|
|||||
| Total comprehensive income (loss) |
$ | 769 | $ | (4,091 | ) | |||
|
|
|
|
|
|||||
The accompanying Notes to Unaudited Interim Consolidated Financial Statements are an integral part of these statements.
F-95
Table of Contents
CITIZENS FINANCIAL GROUP, INC.
CONSOLIDATED STATEMENTS OF CHANGES IN STOCKHOLDERS’ EQUITY
| Preferred Stock |
Common Stock |
Additional Paid-in Capital |
Retained Earnings |
Accumulated Other Comprehensive Income (Loss) |
Total | |||||||||||||||||||
| (in millions) | ||||||||||||||||||||||||
| Balance at December 31, 2012 |
$ | — | $ | 6 | $ | 18,589 | $ | 5,846 | $ | (312 | ) | $ | 24,129 | |||||||||||
| Dividend to parent |
— | — | — | (95 | ) | — | (95 | ) | ||||||||||||||||
| Dividends to parent—exchange transactions |
— | — | — | (333 | ) | — | (333 | ) | ||||||||||||||||
| Total comprehensive loss: |
||||||||||||||||||||||||
| Net loss |
— | — | — | (3,722 | ) | — | (3,722 | ) | ||||||||||||||||
| Other comprehensive loss |
— | — | — | — | (369 | ) | (369 | ) | ||||||||||||||||
|
|
|
|
|
|
|
|
|
|
|
|
|
|||||||||||||
| Total comprehensive loss |
(4,091 | ) | ||||||||||||||||||||||
|
|
|
|
|
|
|
|
|
|
|
|
|
|||||||||||||
| Balance at June 30, 2013 (unaudited) |
$ | — | $ | 6 | $ | 18,589 | $ | 1,696 | $ | (681 | ) | $ | 19,610 | |||||||||||
|
|
|
|
|
|
|
|
|
|
|
|
|
|||||||||||||
| Balance at December 31, 2013 |
$ | — | $ | 6 | $ | 18,603 | $ | 1,235 | $ | (648 | ) | $ | 19,196 | |||||||||||
| Dividend to parent |
— | — | — | (35 | ) | — | (35 | ) | ||||||||||||||||
| Dividends to parent—exchange transactions |
— | — | — | (333 | ) | — | (333 | ) | ||||||||||||||||
| Total comprehensive income: |
||||||||||||||||||||||||
| Net income |
— | — | — | 479 | — | 479 | ||||||||||||||||||
| Other comprehensive income |
— | — | — | — | 290 | 290 | ||||||||||||||||||
|
|
|
|
|
|
|
|
|
|
|
|
|
|||||||||||||
| Total comprehensive income |
769 | |||||||||||||||||||||||
|
|
|
|
|
|
|
|
|
|
|
|
|
|||||||||||||
| Balance at June 30, 2014 (unaudited) |
$ | — | $ | 6 | $ | 18,603 | $ | 1,346 | $ | (358 | ) | $ | 19,597 | |||||||||||
|
|
|
|
|
|
|
|
|
|
|
|
|
|||||||||||||
The accompanying Notes to Unaudited Interim Consolidated Financial Statements are an integral part of these statements.
F-96
Table of Contents
CITIZENS FINANCIAL GROUP, INC.
CONSOLIDATED STATEMENTS OF CASH FLOWS
| Six Months Ended June 30, |
||||||||
| 2014 (unaudited) |
2013 (unaudited) |
|||||||
| (in millions) | ||||||||
| OPERATING ACTIVITIES |
||||||||
| Net income (loss) |
$ | 479 | $ | (3,722 | ) | |||
| Adjustments to reconcile net income (loss) to net cash provided by operating activities: |
||||||||
| Provision for credit losses |
170 | 202 | ||||||
| Originations of mortgage loans held for sale |
(684 | ) | (2,407 | ) | ||||
| Proceeds from sales of mortgage loans held for sale |
688 | 2,624 | ||||||
| Amortization of terminated cash flow hedges (related party balances of $12 and $35, respectively) |
24 | 39 | ||||||
| Depreciation, amortization and accretion |
196 | 205 | ||||||
| Recovery of mortgage servicing rights |
(3 | ) | (39 | ) | ||||
| Securities impairment |
6 | 4 | ||||||
| Goodwill impairment |
— | 4,435 | ||||||
| Deferred income taxes |
36 | (186 | ) | |||||
| Loss on disposal/impairment of premises and equipment |
11 | 7 | ||||||
| Loss on sale of other branch assets held for sale |
9 | — | ||||||
| Gain on sales of: |
||||||||
| Securities available for sale |
(25 | ) | (94 | ) | ||||
| Other loans held for sale |
(11 | ) | — | |||||
| Deposits held for sale |
(286 | ) | — | |||||
| Decrease in other assets (related party balances of $47 and $8, respectively) |
57 | 801 | ||||||
| Increase (decrease) in other liabilities (related party balances of $(147) and $(412), respectively) |
354 | (474 | ) | |||||
|
|
|
|
|
|||||
| Net cash provided by operating activities |
1,021 | 1,395 | ||||||
|
|
|
|
|
|||||
| INVESTING ACTIVITIES |
||||||||
| Investment securities: |
||||||||
| Purchases of securities available for sale |
(4,318 | ) | (3,251 | ) | ||||
| Proceeds from maturities and paydowns of securities available for sale |
1,421 | 2,822 | ||||||
| Proceeds from sales of securities available for sale |
711 | 2,441 | ||||||
| Purchases of other investment securities |
(68 | ) | — | |||||
| Proceeds from sales of other investment securities |
55 | 91 | ||||||
| Purchases of securities held to maturity |
(1,174 | ) | — | |||||
| Proceeds from maturities and paydowns of securities held to maturity |
120 | — | ||||||
| Net (increase) decrease in interest-bearing deposits in banks |
(76 | ) | 1,050 | |||||
| Net (increase) decrease in loans and leases |
(2,171 | ) | 1,956 | |||||
| Net increase in bank-owned life insurance |
(22 | ) | (18 | ) | ||||
| Premises and equipment: |
||||||||
| Purchases |
(37 | ) | (82 | ) | ||||
| Proceeds from sales |
29 | — | ||||||
| Capitalization of software |
(80 | ) | (75 | ) | ||||
|
|
|
|
|
|||||
| Net cash (used in) provided by investing activities |
(5,610 | ) | 4,934 | |||||
|
|
|
|
|
|||||
| FINANCING ACTIVITIES |
||||||||
| Net decrease in deposits |
(238 | ) | (3,787 | ) | ||||
| Net increase (decrease) in federal funds purchased and securities sold under agreements to repurchase |
2,016 | (230 | ) | |||||
| Net increase (decrease) in other short-term borrowed funds |
5,450 | (500 | ) | |||||
| Proceeds from issuance of long-term borrowed funds (related party balances of $333 and $333, respectively) |
333 | 333 | ||||||
| Repayments of long-term borrowed funds (related party balances of $0 and $280, respectively) |
(5 | ) | (294 | ) | ||||
| Dividends declared and paid to parent |
(368 | ) | (428 | ) | ||||
|
|
|
|
|
|||||
| Net cash provided by (used in) financing activities |
7,188 | (4,906 | ) | |||||
|
|
|
|
|
|||||
| Increase in cash and cash equivalents |
2,599 | 1,423 | ||||||
| Cash and cash equivalents at beginning of period |
2,757 | 3,063 | ||||||
|
|
|
|
|
|||||
| Cash and cash equivalents at end of period |
$ | 5,356 | $ | 4,486 | ||||
|
|
|
|
|
|||||
The accompanying Notes to Unaudited Interim Consolidated Financial Statements are an integral part of these statements.
F-97
Table of Contents
CITIZENS FINANCIAL GROUP, INC.
NOTES TO CONSOLIDATED FINANCIAL STATEMENTS (UNAUDITED)
NOTE 1—BASIS OF PRESENTATION
Basis of Presentation
The unaudited Consolidated Financial Statements, including the notes thereto of Citizens Financial Group, Inc. (formerly RBS Citizens Financial Group, Inc., prior to April 16, 2014), have been prepared in accordance with GAAP interim reporting requirements, and therefore do not include all information and notes included in the audited Consolidated Financial Statements in conformity with GAAP. These interim Consolidated Financial Statements and notes thereto should be read in conjunction with the Company’s audited Consolidated Financial Statements and accompanying notes included elsewhere in this prospectus. The Company’s principal business activity is banking, conducted through its subsidiaries, Citizens Bank, N.A. (formerly RBS Citizens, N.A., prior to April 16, 2014) and Citizens Bank of Pennsylvania.
The unaudited Consolidated Financial Statements include all adjustments, consisting of normal recurring adjustments, necessary for a fair presentation of the results for the interim periods. The results for interim periods are not necessarily indicative of results for a full year.
Certain prior period amounts have been reclassified to conform to current period presentation. These reclassifications are immaterial and have no effect on net income, total comprehensive income, total assets or total stockholders’ equity as previously reported.
Cash and Cash Equivalents
See Note 1 “Significant Accounting Policies” of the Company’s audited Consolidated Financial Statements included elsewhere in this prospectus for a detailed discussion of cash and cash equivalents.
New Accounting Pronouncements
In June 2014, the FASB issued Accounting Standards Update No. 2014-12, “Accounting for Share-Based Payments When the Terms of an Award Provide That a Performance Target Could Be Achieved after the Requisite Service Period.” This update amends the guidance on stock compensation and clarifies that entities should treat performance targets that can be met after the requisite service period of a share-based payment award as performance conditions that affect vesting. Accordingly, an entity should not record compensation expense (measured as of the grant date without taking into account the effect of the performance target) related to an award for which a transfer to the employee is contingent on the entity’s satisfaction of a performance target until it becomes probable that the performance target will be met. The amendment is effective for annual reporting periods, including interim reporting periods within those periods, beginning after December 15, 2015, and is expected to have an immaterial impact on the Company’s Consolidated Financial Statements.
In June 2014, the FASB issued Accounting Standards Update No. 2014-11, “Repurchase-to-Maturity Transactions, Repurchase Financings, and Disclosure” which makes limited amendments to the guidance on accounting for certain repurchase agreements. This update requires entities to account for repurchase-to-maturity transactions as secured borrowings (rather than as sales with forward repurchase agreements); eliminates accounting guidance on linked repurchase financing transactions; and expands disclosure requirements related to certain transfers of financial assets that are accounted for as sales and certain transfers accounted for as secured borrowings. This update also amends the existing guidance to clarify that repos and securities lending transactions that do not
F-98
Table of Contents
CITIZENS FINANCIAL GROUP, INC.
NOTES TO CONSOLIDATED FINANCIAL STATEMENTS (UNAUDITED)
meet all of the derecognition criteria in the existing guidance should be accounted for as secured borrowings. This amendment is effective for annual reporting periods, including interim reporting periods within those periods, beginning after December 15, 2014 and is expected to have an immaterial impact on the Company’s Consolidated Financial Statements.
In May 2014, the FASB issued Accounting Standards Update No. 2014-09, “Revenue From Contracts With Customers.” This amendment outlines a single comprehensive model for entities to use in accounting for revenue arising from contracts with customers and supersedes most current revenue recognition guidance, including industry-specific guidance. The core principle of the revenue model is that “an entity recognizes revenue to depict the transfer of promised goods or services to customers in an amount that reflects the consideration to which the entity expects to be entitled in exchange for those goods or services.” The new guidance applies to all contracts with customers except those that are within the scope of other topics in GAAP. This amendment is effective for annual reporting periods, including interim reporting periods within those periods, beginning after December 15, 2016 and is expected to have an immaterial impact on the Company’s Consolidated Financial Statements.
In April 2014, the FASB issued Accounting Standards Update No. 2014-08, “Reporting Discontinued Operations and Disclosures of Disposals of Components of an Entity.” This amendment modifies the requirements for reporting a discontinued operation. The amended definition of “discontinued operations” includes only disposals, held-for-sale classifications of components, or groups of components of an entity that represent “strategic shift” that either has or will have a major effect on the entity’s operations and financial results, such as geographic area, line of business, equity method investment or other parts of an entity. This amendment also provides disclosure guidance for situations where an entity has continuing involvement with a discontinued operation or retains an equity method investment in a component after disposal. This amendment is effective for all disposals or classifications as held for sale (including businesses or nonprofit activities that, on acquisition, are classified as held for sale) that occur in annual periods, and in interim periods within those annual periods, beginning after December 15, 2014, and is expected to have an immaterial impact on the Company’s Consolidated Financial Statements.
F-99
Table of Contents
CITIZENS FINANCIAL GROUP, INC.
NOTES TO CONSOLIDATED FINANCIAL STATEMENTS (UNAUDITED)
NOTE 2—SECURITIES
The following table provides the major components of securities at amortized cost and fair value:
| June 30, 2014 | December 31, 2013 | |||||||||||||||||||||||||||||||
| Amortized Cost |
Gross Unrealized Gains |
Gross Unrealized Losses |
Fair Value |
Amortized Cost |
Gross Unrealized Gains |
Gross Unrealized Losses |
Fair Value |
|||||||||||||||||||||||||
| (in millions) | ||||||||||||||||||||||||||||||||
| Securities Available for Sale |
||||||||||||||||||||||||||||||||
| U.S. Treasury |
$ | 15 | $ | — | $ | — | $ | 15 | $ | 15 | $ | — | $ | — | $ | 15 | ||||||||||||||||
| State and political subdivisions |
10 | — | — | 10 | 11 | — | (1 | ) | 10 | |||||||||||||||||||||||
| Mortgage-backed securities: |
||||||||||||||||||||||||||||||||
| Federal agencies and U.S. government sponsored entities |
17,343 | 289 | (47 | ) | 17,585 | 14,970 | 151 | (128 | ) | 14,993 | ||||||||||||||||||||||
| Other/non-agency |
887 | 7 | (36 | ) | 858 | 992 | 5 | (45 | ) | 952 | ||||||||||||||||||||||
|
|
|
|
|
|
|
|
|
|
|
|
|
|
|
|
|
|||||||||||||||||
| Total mortgage-backed securities |
18,230 | 296 | (83 | ) | 18,443 | 15,962 | 156 | (173 | ) | 15,945 | ||||||||||||||||||||||
|
|
|
|
|
|
|
|
|
|
|
|
|
|
|
|
|
|||||||||||||||||
| Total debt securities available for sale |
18,255 | 296 | (83 | ) | 18,468 | 15,988 | 156 | (174 | ) | 15,970 | ||||||||||||||||||||||
|
|
|
|
|
|
|
|
|
|
|
|
|
|
|
|
|
|||||||||||||||||
| Marketable equity securities |
10 | 3 | — | 13 | 10 | 3 | — | 13 | ||||||||||||||||||||||||
| Other equity securities |
12 | — | — | 12 | 12 | — | — | 12 | ||||||||||||||||||||||||
|
|
|
|
|
|
|
|
|
|
|
|
|
|
|
|
|
|||||||||||||||||
| Total equity securities available for sale |
22 | 3 | — | 25 | 22 | 3 | — | 25 | ||||||||||||||||||||||||
|
|
|
|
|
|
|
|
|
|
|
|
|
|
|
|
|
|||||||||||||||||
| Total securities available for sale |
$ | 18,277 | $ | 299 | $ | (83 | ) | $ | 18,493 | $ | 16,010 | $ | 159 | $ | (174 | ) | $ | 15,995 | ||||||||||||||
|
|
|
|
|
|
|
|
|
|
|
|
|
|
|
|
|
|||||||||||||||||
| Securities Held to Maturity |
||||||||||||||||||||||||||||||||
| Mortgage-backed securities: |
||||||||||||||||||||||||||||||||
| Federal agencies and U.S. government sponsored entities |
$ | 3,897 | $ | 16 | $ | (15 | ) | $ | 3,898 | $ | 2,940 | $ | — | $ | (33 | ) | $ | 2,907 | ||||||||||||||
| Other/non-agency |
1,485 | 18 | (3 | ) | 1,500 | 1,375 | — | (25 | ) | 1,350 | ||||||||||||||||||||||
|
|
|
|
|
|
|
|
|
|
|
|
|
|
|
|
|
|||||||||||||||||
| Total securities held to maturity |
$ | 5,382 | $ | 34 | $ | (18 | ) | $ | 5,398 | $ | 4,315 | $ | — | $ | (58 | ) | $ | 4,257 | ||||||||||||||
|
|
|
|
|
|
|
|
|
|
|
|
|
|
|
|
|
|||||||||||||||||
| Other Investment Securities |
||||||||||||||||||||||||||||||||
| Federal Reserve Bank stock |
$ | 470 | $ | — | $ | — | $ | 470 | $ | 462 | $ | — | $ | — | $ | 462 | ||||||||||||||||
| Federal Home Loan Bank stock |
472 | — | — | 472 | 468 | — | — | 468 | ||||||||||||||||||||||||
| Venture capital and other investments |
6 | — | — | 6 | 5 | — | — | 5 | ||||||||||||||||||||||||
|
|
|
|
|
|
|
|
|
|
|
|
|
|
|
|
|
|||||||||||||||||
| Total other investment securities |
$ | 948 | $ | — | $ | — | $ | 948 | $ | 935 | $ | — | $ | — | $ | 935 | ||||||||||||||||
|
|
|
|
|
|
|
|
|
|
|
|
|
|
|
|
|
|||||||||||||||||
F-100
Table of Contents
CITIZENS FINANCIAL GROUP, INC.
NOTES TO CONSOLIDATED FINANCIAL STATEMENTS (UNAUDITED)
The Company has reviewed its securities portfolio for other-than-temporary impairments. The following tables summarize those securities whose fair values are below carrying values, segregated by those that have been in a continuous unrealized loss position for less than twelve months, and those that have been in a continuous unrealized loss position for twelve months or longer:
| June 30, 2014 | ||||||||||||||||||||||||||||||||||||
| Less than 12 Months | 12 Months or Longer | Total | ||||||||||||||||||||||||||||||||||
| Number of Issues |
Fair Value |
Gross Unrealized Losses |
Number of Issues |
Fair Value |
Gross Unrealized Losses |
Number of Issues |
Fair Value |
Gross Unrealized Losses |
||||||||||||||||||||||||||||
| (dollars in millions) | ||||||||||||||||||||||||||||||||||||
| U.S. Treasury |
1 | $ | 15 | $ | — | — | $ | — | $ | — | 1 | $ | 15 | $ | — | |||||||||||||||||||||
| State and political subdivisions |
1 | 10 | — | — | — | — | 1 | 10 | — | |||||||||||||||||||||||||||
| Mortgage-backed securities: |
||||||||||||||||||||||||||||||||||||
| Federal agencies and U.S. government sponsored entities |
77 | 4,005 | (24 | ) | 30 | 916 | (38 | ) | 107 | 4,921 | (62 | ) | ||||||||||||||||||||||||
| Other/non-agency |
10 | 407 | (5 | ) | 18 | 464 | (34 | ) | 28 | 871 | (39 | ) | ||||||||||||||||||||||||
|
|
|
|
|
|
|
|
|
|
|
|
|
|
|
|
|
|
|
|||||||||||||||||||
| Total mortgage-backed securities |
87 | 4,412 | (29 | ) | 48 | 1,380 | (72 | ) | 135 | 5,792 | (101 | ) | ||||||||||||||||||||||||
|
|
|
|
|
|
|
|
|
|
|
|
|
|
|
|
|
|
|
|||||||||||||||||||
| Total |
89 | $ | 4,437 | $ | (29 | ) | 48 | $ | 1,380 | $ | (72 | ) | 137 | $ | 5,817 | $ | (101 | ) | ||||||||||||||||||
|
|
|
|
|
|
|
|
|
|
|
|
|
|
|
|
|
|
|
|||||||||||||||||||
| December 31, 2013 | ||||||||||||||||||||||||||||||||||||
| Less than 12 Months | 12 Months or Longer | Total | ||||||||||||||||||||||||||||||||||
| Number of Issues |
Fair Value |
Gross Unrealized Losses |
Number of Issues |
Fair Value |
Gross Unrealized Losses |
Number of Issues |
Fair Value |
Gross Unrealized Losses |
||||||||||||||||||||||||||||
| (dollars in millions) | ||||||||||||||||||||||||||||||||||||
| State and political subdivisions |
1 | $ | 10 | $ | (1 | ) | — | $ | — | $ | — | 1 | $ | 10 | $ | (1 | ) | |||||||||||||||||||
| Mortgage-backed securities: |
||||||||||||||||||||||||||||||||||||
| Federal agencies and U.S. government sponsored entities |
263 | 12,067 | (158 | ) | 7 | 20 | (2 | ) | 270 | 12,087 | (160 | ) | ||||||||||||||||||||||||
| Other/non-agency |
22 | 1,452 | (34 | ) | 19 | 490 | (37 | ) | 41 | 1,942 | (71 | ) | ||||||||||||||||||||||||
|
|
|
|
|
|
|
|
|
|
|
|
|
|
|
|
|
|
|
|||||||||||||||||||
| Total mortgage-backed securities |
285 | 13,519 | (192 | ) | 26 | 510 | (39 | ) | 311 | 14,029 | (231 | ) | ||||||||||||||||||||||||
|
|
|
|
|
|
|
|
|
|
|
|
|
|
|
|
|
|
|
|||||||||||||||||||
| Total |
286 | $ | 13,529 | $ | (193 | ) | 26 | $ | 510 | $ | (39 | ) | 312 | $ | 14,039 | $ | (232 | ) | ||||||||||||||||||
|
|
|
|
|
|
|
|
|
|
|
|
|
|
|
|
|
|
|
|||||||||||||||||||
For each debt security identified with an unrealized loss, the Company reviews the expected cash flows to determine if the impairment in value is temporary or other-than-temporary. If the Company has determined that the present value of the debt security’s expected cash flows is less than its amortized cost basis, an other-than-temporary impairment is deemed to have occurred. The amount of impairment loss that is recognized in current period earnings is dependent on the Company’s intent to sell (or not sell) the debt security.
If the Company intends to sell the impaired debt security, the impairment loss recognized in current period earnings equals the difference between the debt security’s fair value and its amortized cost. If the Company does not intend to sell the impaired debt security, and it is not likely that the Company will be required to sell the impaired security, the credit-related impairment loss is recognized in current period earnings and equals the difference between the amortized cost of the debt security and the present value of the expected cash flows that have currently been projected.
F-101
Table of Contents
CITIZENS FINANCIAL GROUP, INC.
NOTES TO CONSOLIDATED FINANCIAL STATEMENTS (UNAUDITED)
In addition to these cash flow projections, several other characteristics of each debt security are reviewed when determining whether a credit loss exists and the period over which the debt security is expected to recover. These characteristics include: (1) the type of investment, (2) various market factors affecting the fair value of the security (e.g., interest rates, spread levels, liquidity in the sector, etc.), (3) the length and severity of impairment, and (4) the public credit rating of the instrument.
The Company estimates the portion of loss attributable to credit using a cash flow model. The inputs to this model include prepayment, default and loss severity assumptions that are based on industry research and observed data. The loss projections generated by the model are reviewed on a quarterly basis by a cross-functional governance committee. This governance committee determines whether security impairments are other-than-temporary based on this review.
The following table presents the cumulative credit related losses recognized in earnings on debt securities held by the Company as of:
| Six Months Ended June 30, |
||||||||
| 2014 | 2013 | |||||||
| (in millions) | ||||||||
| Cumulative balance through January 1 |
$ | 56 | $ | 55 | ||||
| Credit impairments recognized in earnings on debt securities that have been previously impaired |
6 | 4 | ||||||
| Reductions due to increases in cash flow expectations on impaired securities |
(2 | ) | (3 | ) | ||||
|
|
|
|
|
|||||
| Cumulative balance at end of period |
$ | 60 | $ | 56 | ||||
|
|
|
|
|
|||||
Cumulative credit losses recognized in earnings for impaired AFS debt securities held as of June 30, 2014 and 2013 were $60 million and $56 million, respectively. There were no credit losses recognized in earnings for the Company’s HTM portfolio as of June 30, 2014 and 2013. The Company recognized $6 million and $4 million of credit related other-than-temporary impairment losses in earnings for the six months ended June 30, 2014 and 2013, respectively, related to non-agency MBS in the AFS portfolio. No impaired debt securities were sold during June 30, 2014 or 2013. Reductions in credit losses due to increases in cash flow expectations were $2 million and $3 million for the six months ended June 30, 2014 and 2013, respectively, and are presented in investment securities interest income on the Consolidated Statements of Operations. The Company does not currently have the intent to sell these debt securities, and it is not likely that the Company will be required to sell these debt securities prior to the recovery of their amortized cost bases. As of June 30, 2014 and 2013, $33 million and $56 million, respectively, of pretax non-credit related losses were deferred in OCI.
The Company has determined that credit losses are not expected to be incurred on the remaining agency and non-agency MBS identified with unrealized losses as of the current reporting date. The unrealized losses on these debt securities reflect the reduced liquidity in the MBS market and the increased risk spreads due to the uncertainty of the U.S. macroeconomic environment. Therefore, the Company has determined that these debt securities are not other-than-temporarily impaired because the Company does not currently have the intent to sell these debt securities, and it is not likely that the Company will be required to sell these debt securities prior to the recovery of their amortized cost bases. Additionally, any subsequent increases in the valuation of impaired debt securities do not impact their recorded cost bases.
F-102
Table of Contents
CITIZENS FINANCIAL GROUP, INC.
NOTES TO CONSOLIDATED FINANCIAL STATEMENTS (UNAUDITED)
The amortized cost and fair value of debt securities at June 30, 2014 by contractual maturity are shown below. Expected maturities may differ from contractual maturities because issuers may have the right to call or prepay obligations with or without call or prepayment penalties.
| Distribution of Maturities | ||||||||||||||||||||
| 1 Year or Less |
1-5 Years |
5-10 Years |
After 10 Years |
Total | ||||||||||||||||
| (in millions) | ||||||||||||||||||||
| Amortized Cost: |
||||||||||||||||||||
| Debt securities available for sale |
||||||||||||||||||||
| U.S. Treasury |
$ | 15 | $ | — | $ | — | $ | — | $ | 15 | ||||||||||
| State and political subdivisions |
— | — | — | 10 | 10 | |||||||||||||||
| Mortgage-backed securities: |
||||||||||||||||||||
| Federal agencies and U.S. government sponsored entities |
3 | 35 | 2,603 | 14,702 | 17,343 | |||||||||||||||
| Other/non-agency |
— | 61 | 76 | 750 | 887 | |||||||||||||||
|
|
|
|
|
|
|
|
|
|
|
|||||||||||
| Total debt securities available for sale |
18 | 96 | 2,679 | 15,462 | 18,255 | |||||||||||||||
|
|
|
|
|
|
|
|
|
|
|
|||||||||||
| Debt securities held to maturity |
||||||||||||||||||||
| Mortgage-backed securities: |
||||||||||||||||||||
| Federal agencies and U.S. government sponsored entities |
— | — | — | 3,897 | 3,897 | |||||||||||||||
| Other/non-agency |
— | — | — | 1,485 | 1,485 | |||||||||||||||
|
|
|
|
|
|
|
|
|
|
|
|||||||||||
| Total debt securities held to maturity |
— | — | — | 5,382 | 5,382 | |||||||||||||||
|
|
|
|
|
|
|
|
|
|
|
|||||||||||
| Total amortized cost of debt securities |
$ | 18 | $ | 96 | $ | 2,679 | $ | 20,844 | $ | 23,637 | ||||||||||
|
|
|
|
|
|
|
|
|
|
|
|||||||||||
| Fair Value: |
||||||||||||||||||||
| Debt securities available for sale |
||||||||||||||||||||
| U.S. Treasury |
$ | 15 | $ | — | $ | — | $ | — | $ | 15 | ||||||||||
| State and political subdivisions |
— | — | — | 10 | 10 | |||||||||||||||
| Mortgage-backed securities: |
||||||||||||||||||||
| Federal agencies and U.S. government sponsored entities |
4 | 37 | 2,626 | 14,918 | 17,585 | |||||||||||||||
| Other/non-agency |
— | 63 | 77 | 718 | 858 | |||||||||||||||
|
|
|
|
|
|
|
|
|
|
|
|||||||||||
| Total debt securities available for sale |
19 | 100 | 2,703 | 15,646 | 18,468 | |||||||||||||||
|
|
|
|
|
|
|
|
|
|
|
|||||||||||
| Debt securities held to maturity |
||||||||||||||||||||
| Mortgage-backed securities: |
||||||||||||||||||||
| Federal agencies and U.S. government sponsored entities |
— | — | — | 3,898 | 3,898 | |||||||||||||||
| Other/non-agency |
— | — | — | 1,500 | 1,500 | |||||||||||||||
|
|
|
|
|
|
|
|
|
|
|
|||||||||||
| Total debt securities held to maturity |
— | — | — | 5,398 | 5,398 | |||||||||||||||
|
|
|
|
|
|
|
|
|
|
|
|||||||||||
| Total fair value of debt securities |
$ | 19 | $ | 100 | $ | 2,703 | $ | 21,044 | $ | 23,866 | ||||||||||
|
|
|
|
|
|
|
|
|
|
|
|||||||||||
The Company recognized $303 million and $228 million of interest income from taxable investment securities in earnings for the six months ended June 30, 2014 and 2013, respectively. No interest income was recognized from non-taxable investment securities in earnings for the six months ended June 30, 2014 and 2013.
F-103
Table of Contents
CITIZENS FINANCIAL GROUP, INC.
NOTES TO CONSOLIDATED FINANCIAL STATEMENTS (UNAUDITED)
The Company recognized $25 million and $94 million of gains on sale of debt securities in earnings for the six months ended June 30, 2014 and 2013, respectively.
The amortized cost and fair value of securities pledged are shown below:
| June 30, 2014 | December 31, 2013 | |||||||||||||||
| Amortized Cost | Fair Value | Amortized Cost | Fair Value | |||||||||||||
| (in millions) | ||||||||||||||||
| Pledged against repurchase agreements |
$ | 7,396 | $ | 7,511 | $ | 5,016 | $ | 4,998 | ||||||||
| Pledged against Federal Home Loan Bank borrowed funds |
1 | 1 | 1 | 1 | ||||||||||||
| Pledged against derivatives to qualify for fiduciary powers, and to secure public and other deposits as required by law |
3,190 | 3,247 | 2,818 | 2,853 | ||||||||||||
The Company regularly enters into security repurchase agreements with unrelated counterparties. Repurchase agreements are financial transactions that involve the transfer of a security from one party to another and a subsequent transfer of the same (or ”substantially the same”) security back to the original party. The Company’s repurchase agreements are typically short-term transactions (e.g., overnight), but they may be extended to longer terms to maturity. Such transactions are accounted for as secured borrowed funds on the Company’s financial statements. When permitted by GAAP, the Company offsets the short-term receivables associated with its reverse repurchase agreements with the short-term payables associated with its repurchase agreements.
The effects of this offsetting on the Consolidated Balance Sheets are presented in the following table:
| June 30, 2014 | December 31, 2013 | |||||||||||||||||||||||
| Gross Assets (Liabilities) |
Gross Assets (Liabilities) Offset |
Net Amounts of Assets (Liabilities) |
Gross Assets (Liabilities) |
Gross Assets (Liabilities) Offset |
Net Amounts of Assets (Liabilities) |
|||||||||||||||||||
| (in millions) | ||||||||||||||||||||||||
| Reverse repurchase and similar arrangements |
$ | — | $ | — | $ | — | $ | — | $ | — | $ | — | ||||||||||||
| Repurchase and similar arrangements |
(5,850 | ) | — | (5,850 | ) | (3,000 | ) | — | (3,000 | ) | ||||||||||||||
| Note: | The Company also offsets certain derivative assets and derivative liabilities on the Consolidated Balance Sheets. See Note 11 “Derivatives,” for further information. |
F-104
Table of Contents
CITIZENS FINANCIAL GROUP, INC.
NOTES TO CONSOLIDATED FINANCIAL STATEMENTS (UNAUDITED)
NOTE 3—LOANS AND LEASES
A summary of the loans and leases portfolio follows:
| June 30, 2014 |
December 31, 2013 |
|||||||
| (in millions) | ||||||||
| Commercial |
$ | 30,076 | $ | 28,667 | ||||
| Commercial real estate |
7,158 | 6,948 | ||||||
| Leases |
3,740 | 3,780 | ||||||
|
|
|
|
|
|||||
| Total commercial |
40,974 | 39,395 | ||||||
|
|
|
|
|
|||||
| Residential, including originated home equity products |
30,116 | 29,694 | ||||||
| Home equity products serviced by others |
1,972 | 2,171 | ||||||
| Other secured retail |
12,180 | 10,700 | ||||||
| Unsecured retail |
3,587 | 3,899 | ||||||
|
|
|
|
|
|||||
| Total retail |
47,855 | 46,464 | ||||||
|
|
|
|
|
|||||
| Total loans and leases(1)(2) |
$ | 88,829 | $ | 85,859 | ||||
|
|
|
|
|
|||||
| (1) | Excluded from the table above are loans held for sale totaling $262 million as of June 30, 2014 and $1.3 billion as of December 31, 2013. The December 31, 2013 loans held for sale balance primarily related to the Company’s sale of certain assets and liabilities associated with its Chicago-area retail branches. For further discussion, see Note 13 “Divestitures and Branch Assets and Liabilities Held for Sale.” |
| (2) | Mortgage loans serviced for other by the Company’s subsidiaries are not included above, and amounted to $18.3 billion and $18.7 billion at June 30, 2014 and December 31, 2013, respectively. |
Loans held for sale, excluding the loans related to the sale of the Chicago-area retail branches, totaled $173 million and $176 million at June 30, 2014 and December 31, 2013, respectively. Other loans held for sale totaled $89 million and $1.1 billion at June 30, 2014 and December 31, 2013, respectively. The other loans held for sale balance at December 31, 2013 primarily related to the Company’s sale of certain assets and liabilities associated with its Chicago-area retail branches. See Note 13 “Divestitures and Branch Assets and Liabilities Held for Sale,” for further details.
Loans pledged as collateral for FHLB borrowed funds totaled $21.0 billion and $19.0 billion at June 30, 2014 and December 31, 2013, respectively. This collateral consists primarily of residential mortgages and home equity loans. Loans pledged as collateral to support the contingent ability to borrow at the FRB discount window, if necessary, totaled $13.3 billion and $13.9 billion at June 30, 2014 and December 31, 2013, respectively.
During the six months ended June 30, 2014 the Company purchased a portfolio of residential loans with an outstanding principal balance of $878 million, a portfolio of auto loans with an outstanding principal balance of $759 million and a portfolio of student loans with an outstanding principal balance of $59 million. In addition to the $1.1 billion loans sold as part of the Company’s sale of its Chicago-area retail branches, the Company sold portfolios of residential mortgage loans with outstanding principal balances of $126 million and student loans of $357 million as well as commercial loans with an outstanding principal balance of $132 million during the six months ended June 30, 2014. The Company had no loan portfolio purchase or sale transactions during the six months ended June 30, 2013.
F-105
Table of Contents
CITIZENS FINANCIAL GROUP, INC.
NOTES TO CONSOLIDATED FINANCIAL STATEMENTS (UNAUDITED)
NOTE 4—ALLOWANCE FOR CREDIT LOSSES, NONPERFORMING ASSETS, AND CONCENTRATIONS OF CREDIT RISK
The ALLL is increased through a provision for credit losses that is charged to earnings, based on the Company’s quarterly evaluation of the loan portfolio, and is reduced by net charge-offs and the ALLL associated with sold loans. See Note 1 “Significant Accounting Policies” of the Company’s audited Consolidated Financial Statements, included elsewhere in this prospectus for a detailed discussion of ALLL methodologies and estimation techniques.
On a quarterly basis, the Company reviews and refines its estimate of the allowance for credit losses, taking into consideration changes in portfolio size and composition, historical loss experience, internal risk ratings, current economic conditions, industry performance trends and other pertinent information. As of June 30, 2014, changes in these factors led to an increase in the allowance for credit losses which was offset by a decrease reflecting asset quality improvements and lower charge-offs.
During 2013, the Company modified the way that it establishes the ALLL. The ALLL is reviewed separately for commercial and retail loan portfolios, and the ALLL for each includes an adjustment for qualitative reserves that includes certain risks, factors and events that might not be measured in the statistical analysis. As a result of this change, the unallocated reserve was absorbed into the separately measured commercial and retail qualitative reserves.
There were no other material changes in assumptions or estimation techniques compared with prior periods that impacted the determination of the current period’s ALLL and the reserve for unfunded lending commitments.
The following is a summary of changes in the allowance for credit losses:
| Six Months Ended June 30, 2014 | ||||||||||||
| Commercial | Retail | Total | ||||||||||
| (in millions) | ||||||||||||
| Allowance for loan and lease losses as of January 1, 2014 |
$ | 498 | $ | 723 | $ | 1,221 | ||||||
| Charge-offs |
(14 | ) | (231 | ) | (245 | ) | ||||||
| Recoveries |
35 | 55 | 90 | |||||||||
|
|
|
|
|
|
|
|||||||
| Net recoveries (charge-offs) |
21 | (176 | ) | (155 | ) | |||||||
| Provision charged to income |
(11 | ) | 155 | 144 | ||||||||
|
|
|
|
|
|
|
|||||||
| Allowance for loan and lease losses as of June 30, 2014 |
508 | 702 | 1,210 | |||||||||
|
|
|
|
|
|
|
|||||||
| Reserve for unfunded lending commitments as of January 1, 2014 |
39 | — | 39 | |||||||||
| Provision for unfunded lending commitments |
26 | — | 26 | |||||||||
|
|
|
|
|
|
|
|||||||
| Reserve for unfunded lending commitments as of June 30, 2014 |
65 | — | 65 | |||||||||
|
|
|
|
|
|
|
|||||||
| Total allowance for credit losses as of June 30, 2014 |
$ | 573 | $ | 702 | $ | 1,275 | ||||||
|
|
|
|
|
|
|
|||||||
F-106
Table of Contents
CITIZENS FINANCIAL GROUP, INC.
NOTES TO CONSOLIDATED FINANCIAL STATEMENTS (UNAUDITED)
| Six Months Ended June 30, 2013 | ||||||||||||||||
| Commercial | Retail | Unallocated | Total | |||||||||||||
| (in millions) | ||||||||||||||||
| Allowance for loan and lease losses as of January 1, 2013 |
$ | 509 | $ | 657 | $ | 89 | $ | 1,255 | ||||||||
| Charge-offs |
(49 | ) | (313 | ) | — | (362 | ) | |||||||||
| Recoveries |
51 | 56 | — | 107 | ||||||||||||
|
|
|
|
|
|
|
|
|
|||||||||
| Net recoveries (charge-offs) |
2 | (257 | ) | — | (255 | ) | ||||||||||
| Provision charged to income |
(49 | ) | 235 | 14 | 200 | |||||||||||
|
|
|
|
|
|
|
|
|
|||||||||
| Allowance for loan and lease losses as of June 30, 2013 |
462 | 635 | 103 | 1,200 | ||||||||||||
|
|
|
|
|
|
|
|
|
|||||||||
| Reserve for unfunded lending commitments as of January 1, 2013 |
40 | — | — | 40 | ||||||||||||
| Provision for unfunded lending commitments |
2 | — | — | 2 | ||||||||||||
|
|
|
|
|
|
|
|
|
|||||||||
| Reserve for unfunded lending commitments as of June 30, 2013 |
42 | — | — | 42 | ||||||||||||
|
|
|
|
|
|
|
|
|
|||||||||
| Total allowance for credit losses as of June 30, 2013 |
$ | 504 | $ | 635 | $ | 103 | $ | 1,242 | ||||||||
|
|
|
|
|
|
|
|
|
|||||||||
The recorded investment in loans and leases based on the Company’s evaluation methodology is as follows:
| June 30, 2014 | December 31, 2013 | |||||||||||||||||||||||
| Commercial | Retail | Total | Commercial | Retail | Total | |||||||||||||||||||
| (in millions) | ||||||||||||||||||||||||
| Individually evaluated |
$ | 254 | $ | 1,218 | $ | 1,472 | $ | 239 | $ | 1,200 | $ | 1,439 | ||||||||||||
| Formula-based evaluation |
40,720 | 46,637 | 87,357 | 39,156 | 45,264 | 84,420 | ||||||||||||||||||
|
|
|
|
|
|
|
|
|
|
|
|
|
|||||||||||||
| Total |
$ | 40,974 | $ | 47,855 | $ | 88,829 | $ | 39,395 | $ | 46,464 | $ | 85,859 | ||||||||||||
|
|
|
|
|
|
|
|
|
|
|
|
|
|||||||||||||
The following is a summary of the allowance for credit losses by evaluation method:
| June 30, 2014 | December 31, 2013 | |||||||||||||||||||||||
| Commercial | Retail | Total | Commercial | Retail | Total | |||||||||||||||||||
| (in millions) | ||||||||||||||||||||||||
| Individually evaluated |
$ | 23 | $ | 116 | $ | 139 | $ | 23 | $ | 108 | $ | 131 | ||||||||||||
| Formula-based evaluation |
550 | 586 | 1,136 | 514 | 615 | 1,129 | ||||||||||||||||||
|
|
|
|
|
|
|
|
|
|
|
|
|
|||||||||||||
| Allowance for credit losses |
$ | 573 | $ | 702 | $ | 1,275 | $ | 537 | $ | 723 | $ | 1,260 | ||||||||||||
|
|
|
|
|
|
|
|
|
|
|
|
|
|||||||||||||
For commercial loans and leases, the Company utilizes regulatory classification ratings to monitor credit quality. Loans with a “pass” rating are those that the Company believes will be fully repaid in accordance with the contractual loan terms. Commercial loans and leases that are “criticized” are those that have some weakness that indicates an increased probability of future loss. For retail loans, the Company primarily uses the loan’s payment and delinquency status to monitor credit quality. The further a loan is past due, the greater the likelihood of future credit loss. These credit quality indicators for both commercial and retail loans are continually updated and monitored.
F-107
Table of Contents
CITIZENS FINANCIAL GROUP, INC.
NOTES TO CONSOLIDATED FINANCIAL STATEMENTS (UNAUDITED)
The recorded investment in classes of commercial loans and leases based on regulatory classification ratings is as follows:
| June 30, 2014 | ||||||||||||||||||||
| Criticized | ||||||||||||||||||||
| Pass | Special Mention |
Substandard | Doubtful | Total | ||||||||||||||||
| (in millions) | ||||||||||||||||||||
| Commercial |
$ | 28,816 | $ | 722 | $ | 406 | $ | 132 | $ | 30,076 | ||||||||||
| Commercial real estate |
6,707 | 229 | 110 | 112 | 7,158 | |||||||||||||||
| Leases |
3,676 | 13 | 51 | — | 3,740 | |||||||||||||||
|
|
|
|
|
|
|
|
|
|
|
|||||||||||
| Total |
$ | 39,199 | $ | 964 | $ | 567 | $ | 244 | $ | 40,974 | ||||||||||
|
|
|
|
|
|
|
|
|
|
|
|||||||||||
| December 31, 2013 | ||||||||||||||||||||
| Criticized | ||||||||||||||||||||
| Pass | Special Mention |
Substandard | Doubtful | Total | ||||||||||||||||
| (in millions) | ||||||||||||||||||||
| Commercial |
$ | 27,433 | $ | 588 | $ | 541 | $ | 105 | $ | 28,667 | ||||||||||
| Commercial real estate |
6,366 | 339 | 116 | 127 | 6,948 | |||||||||||||||
| Leases |
3,679 | 40 | 61 | — | 3,780 | |||||||||||||||
|
|
|
|
|
|
|
|
|
|
|
|||||||||||
| Total |
$ | 37,478 | $ | 967 | $ | 718 | $ | 232 | $ | 39,395 | ||||||||||
|
|
|
|
|
|
|
|
|
|
|
|||||||||||
The recorded investment in classes of retail loans, categorized by delinquency status is as follows:
| June 30, 2014 | ||||||||||||||||||||
| Current | 1-29 Days Past Due |
30-89 Days Past Due |
90 Days or More Past Due |
Total | ||||||||||||||||
| (in millions) | ||||||||||||||||||||
| Residential, including originated home equity products |
$ | 28,395 | $ | 849 | $ | 208 | $ | 664 | $ | 30,116 | ||||||||||
| Home equity products serviced by others |
1,735 | 143 | 39 | 55 | 1,972 | |||||||||||||||
| Other secured retail |
11,495 | 608 | 66 | 11 | 12,180 | |||||||||||||||
| Unsecured retail |
3,405 | 106 | 45 | 31 | 3,587 | |||||||||||||||
|
|
|
|
|
|
|
|
|
|
|
|||||||||||
| Total |
$ | 45,030 | $ | 1,706 | $ | 358 | $ | 761 | $ | 47,855 | ||||||||||
|
|
|
|
|
|
|
|
|
|
|
|||||||||||
| December 31, 2013 | ||||||||||||||||||||
| Current | 1-29 Days Past Due |
30-89 Days Past Due |
90 Days or More Past Due |
Total | ||||||||||||||||
| (in millions) | ||||||||||||||||||||
| Residential, including originated home equity products |
$ | 27,912 | $ | 861 | $ | 259 | $ | 662 | $ | 29,694 | ||||||||||
| Home equity products serviced by others |
1,901 | 167 | 43 | 60 | 2,171 | |||||||||||||||
| Other secured retail |
10,068 | 550 | 66 | 16 | 10,700 | |||||||||||||||
| Unsecured retail |
3,593 | 185 | 67 | 54 | 3,899 | |||||||||||||||
|
|
|
|
|
|
|
|
|
|
|
|||||||||||
| Total |
$ | 43,474 | $ | 1,763 | $ | 435 | $ | 792 | $ | 46,464 | ||||||||||
|
|
|
|
|
|
|
|
|
|
|
|||||||||||
F-108
Table of Contents
CITIZENS FINANCIAL GROUP, INC.
NOTES TO CONSOLIDATED FINANCIAL STATEMENTS (UNAUDITED)
Nonperforming Assets
A summary of nonperforming loans and leases by class is as follows:
| June 30, 2014 | December 31, 2013 | |||||||||||||||||||||||
| Nonaccruing | Accruing and 90 Days or More Delinquent |
Total Nonperforming Loans and Leases |
Nonaccruing | Accruing and 90 Days or More Delinquent |
Total Nonperforming Loans and Leases |
|||||||||||||||||||
| (in millions) | ||||||||||||||||||||||||
| Commercial |
$ | 63 | $ | — | $ | 63 | $ | 96 | $ | — | $ | 96 | ||||||||||||
| Commercial real estate |
129 | 1 | 130 | 169 | — | 169 | ||||||||||||||||||
| Leases |
— | 2 | 2 | — | — | — | ||||||||||||||||||
|
|
|
|
|
|
|
|
|
|
|
|
|
|||||||||||||
| Total commercial |
192 | 3 | 195 | 265 | — | 265 | ||||||||||||||||||
|
|
|
|
|
|
|
|
|
|
|
|
|
|||||||||||||
| Residential, including originated home equity products |
876 | — | 876 | 981 | — | 981 | ||||||||||||||||||
| Home equity products serviced by others |
80 | — | 80 | 89 | — | 89 | ||||||||||||||||||
| Other secured retail |
18 | — | 18 | 26 | — | 26 | ||||||||||||||||||
| Unsecured retail |
22 | 9 | 31 | 22 | 33 | 55 | ||||||||||||||||||
|
|
|
|
|
|
|
|
|
|
|
|
|
|||||||||||||
| Total retail |
996 | 9 | 1,005 | 1,118 | 33 | 1,151 | ||||||||||||||||||
|
|
|
|
|
|
|
|
|
|
|
|
|
|||||||||||||
| Total |
$ | 1,188 | $ | 12 | $ | 1,200 | $ | 1,383 | $ | 33 | $ | 1,416 | ||||||||||||
|
|
|
|
|
|
|
|
|
|
|
|
|
|||||||||||||
A summary of other nonperforming assets is as follows:
| June 30, 2014 |
December 31, 2013 |
|||||||
| (in millions) | ||||||||
| Nonperforming assets, net of valuation allowance: |
||||||||
| Commercial |
$ | 4 | $ | 10 | ||||
| Retail |
37 | 40 | ||||||
|
|
|
|
|
|||||
| Nonperforming assets, net of valuation allowance |
$ | 41 | $ | 50 | ||||
|
|
|
|
|
|||||
Nonperforming assets consists primarily of other real estate owned and is presented in other assets on the Consolidated Balance Sheets.
A summary of key performance indicators is as follows:
| June 30, 2014 |
December 31, 2013 |
|||||||
| Nonperforming commercial loans and leases as a percentage of total loans and leases |
0.22 | % | 0.31 | % | ||||
| Nonperforming retail loans as a percentage of total loans and leases |
1.13 | 1.34 | ||||||
|
|
|
|
|
|||||
| Total nonperforming loans and leases as a percentage of total loans and leases |
1.35 | 1.65 | ||||||
|
|
|
|
|
|||||
| Nonperforming commercial assets as a percentage of total assets |
0.15 | 0.23 | ||||||
| Nonperforming retail assets as a percentage of total assets |
0.80 | 0.97 | ||||||
|
|
|
|
|
|||||
| Total nonperforming assets as a percentage of total assets |
0.95 | % | 1.20 | % | ||||
|
|
|
|
|
|||||
F-109
Table of Contents
CITIZENS FINANCIAL GROUP, INC.
NOTES TO CONSOLIDATED FINANCIAL STATEMENTS (UNAUDITED)
The following is an analysis of the age of the past due amounts (accruing and nonaccruing):
| June 30, 2014 | December 31, 2013 | |||||||||||||||||||||||
| 30-89 Days Past Due |
90 Days or More Past Due |
Total Past Due |
30-89 Days Past Due |
90 Days or More Past Due |
Total Past Due |
|||||||||||||||||||
| (in millions) | ||||||||||||||||||||||||
| Commercial |
$ | 24 | $ | 63 | $ | 87 | $ | 61 | $ | 96 | $ | 157 | ||||||||||||
| Commercial real estate |
57 | 130 | 187 | 34 | 169 | 203 | ||||||||||||||||||
| Leases |
2 | 2 | 4 | 24 | — | 24 | ||||||||||||||||||
|
|
|
|
|
|
|
|
|
|
|
|
|
|||||||||||||
| Total commercial |
83 | 195 | 278 | 119 | 265 | 384 | ||||||||||||||||||
|
|
|
|
|
|
|
|
|
|
|
|
|
|||||||||||||
| Residential, including originated home equity products |
208 | 664 | 872 | 259 | 662 | 921 | ||||||||||||||||||
| Home equity products serviced by others |
39 | 55 | 94 | 43 | 60 | 103 | ||||||||||||||||||
| Other secured retail |
66 | 11 | 77 | 66 | 16 | 82 | ||||||||||||||||||
| Unsecured retail |
45 | 31 | 76 | 67 | 54 | 121 | ||||||||||||||||||
|
|
|
|
|
|
|
|
|
|
|
|
|
|||||||||||||
| Total retail |
358 | 761 | 1,119 | 435 | 792 | 1,227 | ||||||||||||||||||
|
|
|
|
|
|
|
|
|
|
|
|
|
|||||||||||||
| Total |
$ | 441 | $ | 956 | $ | 1,397 | $ | 554 | $ | 1,057 | $ | 1,611 | ||||||||||||
|
|
|
|
|
|
|
|
|
|
|
|
|
|||||||||||||
Impaired loans include (1) nonaccruing larger balance commercial loans (greater than $3 million carrying value) and (2) commercial and retail TDRs. The following is a summary of impaired loan information by class:
| June 30, 2014 | ||||||||||||||||||||
| Impaired Loans With a Related Allowance |
Allowance on Impaired Loans |
Impaired Loans Without a Related Allowance |
Unpaid Contractual Balance |
Total Recorded Investment in Impaired Loans |
||||||||||||||||
| (in millions) | ||||||||||||||||||||
| Commercial |
$ | 124 | $ | 15 | $ | 35 | $ | 163 | $ | 159 | ||||||||||
| Commercial real estate |
56 | 8 | 39 | 262 | 95 | |||||||||||||||
|
|
|
|
|
|
|
|
|
|
|
|||||||||||
| Total commercial |
180 | 23 | 74 | 425 | 254 | |||||||||||||||
|
|
|
|
|
|
|
|
|
|
|
|||||||||||
| Residential, including originated home equity products |
364 | 57 | 514 | 1,123 | 878 | |||||||||||||||
| Home equity products serviced by others |
86 | 14 | 23 | 122 | 109 | |||||||||||||||
| Other secured retail |
21 | 4 | 10 | 40 | 31 | |||||||||||||||
| Unsecured retail |
200 | 41 | — | 200 | 200 | |||||||||||||||
|
|
|
|
|
|
|
|
|
|
|
|||||||||||
| Total retail |
671 | 116 | 547 | 1,485 | 1,218 | |||||||||||||||
|
|
|
|
|
|
|
|
|
|
|
|||||||||||
| Total |
$ | 851 | $ | 139 | $ | 621 | $ | 1,910 | $ | 1,472 | ||||||||||
|
|
|
|
|
|
|
|
|
|
|
|||||||||||
F-110
Table of Contents
CITIZENS FINANCIAL GROUP, INC.
NOTES TO CONSOLIDATED FINANCIAL STATEMENTS (UNAUDITED)
| December 31, 2013 | ||||||||||||||||||||
| Impaired Loans With a Related Allowance |
Allowance on Impaired Loans |
Impaired Loans Without a Related Allowance |
Unpaid Contractual Balance |
Total Recorded Investment in Impaired Loans |
||||||||||||||||
| (in millions) | ||||||||||||||||||||
| Commercial |
$ | 86 | $ | 15 | $ | 33 | $ | 214 | $ | 119 | ||||||||||
| Commercial real estate |
76 | 8 | 44 | 221 | 120 | |||||||||||||||
|
|
|
|
|
|
|
|
|
|
|
|||||||||||
| Total commercial |
162 | 23 | 77 | 435 | 239 | |||||||||||||||
|
|
|
|
|
|
|
|
|
|
|
|||||||||||
| Residential, including originated home equity products |
355 | 59 | 497 | 1,081 | 852 | |||||||||||||||
| Home equity products serviced by others |
91 | 11 | 21 | 125 | 112 | |||||||||||||||
| Other secured retail |
23 | 3 | 12 | 43 | 35 | |||||||||||||||
| Unsecured retail |
201 | 35 | — | 201 | 201 | |||||||||||||||
|
|
|
|
|
|
|
|
|
|
|
|||||||||||
| Total retail |
670 | 108 | 530 | 1,450 | 1,200 | |||||||||||||||
|
|
|
|
|
|
|
|
|
|
|
|||||||||||
| Total |
$ | 832 | $ | 131 | $ | 607 | $ | 1,885 | $ | 1,439 | ||||||||||
|
|
|
|
|
|
|
|
|
|
|
|||||||||||
Additional information on impaired loans is as follows:
| For the Six Months Ended June 30, | ||||||||||||||||
| 2014 | 2013 | |||||||||||||||
| Interest Income Recognized |
Average Recorded Investment |
Interest Income Recognized |
Average Recorded Investment |
|||||||||||||
| (in millions) | ||||||||||||||||
| Commercial |
$ | 1 | $ | 102 | $ | 1 | $ | 201 | ||||||||
| Commercial real estate |
— | 96 | 1 | 176 | ||||||||||||
|
|
|
|
|
|
|
|
|
|||||||||
| Total commercial |
1 | 198 | 2 | 377 | ||||||||||||
|
|
|
|
|
|
|
|
|
|||||||||
| Residential, including originated home equity products |
13 | 843 | 3 | 733 | ||||||||||||
| Home equity products serviced by others |
3 | 108 | 3 | 126 | ||||||||||||
| Other secured retail |
— | 31 | 4 | 177 | ||||||||||||
| Unsecured retail |
5 | 192 | 2 | 48 | ||||||||||||
|
|
|
|
|
|
|
|
|
|||||||||
| Total retail |
21 | 1,174 | 12 | 1,084 | ||||||||||||
|
|
|
|
|
|
|
|
|
|||||||||
| Total |
$ | 22 | $ | 1,372 | $ | 14 | $ | 1,461 | ||||||||
|
|
|
|
|
|
|
|
|
|||||||||
Troubled Debt Restructurings
A loan modification is identified as a TDR when the Company or a bankruptcy court grants the borrower a concession the Company would not otherwise make in response to the borrower’s financial difficulties. TDRs typically result from the Company’s loss mitigation efforts and are undertaken in order to improve the likelihood of recovery and continuity of the relationship. Citizen’s loan modifications are handled on a case-by-case basis and are negotiated to achieve mutually agreeable terms that maximize loan collectability and meet the borrower’s financial needs. Concessions granted in TDRs for all classes of loans may include lowering the interest rate, forgiving a portion of principal, extending the loan term, lowering scheduled payments for a specified period of time, principal forbearance, or
F-111
Table of Contents
CITIZENS FINANCIAL GROUP, INC.
NOTES TO CONSOLIDATED FINANCIAL STATEMENTS (UNAUDITED)
capitalizing past due amounts. A rate increase can be a concession if the increased rate is lower than a market rate for debt with risk similar to that of the restructured loan. TDRs for commercial loans and leases may also involve creating a multiple note structure, accepting non-cash assets, accepting an equity interest, or receiving a performance-based fee. In some cases a TDR may involve multiple concessions. The financial effects of TDRs for all loan classes may include lower income (either due to a lower interest rate or a delay in the timing of cash flows), larger loan loss provisions, and accelerated charge-offs if the modification renders the loan collateral-dependent. In some cases interest income throughout the term of the loan may increase if, for example, the loan is extended or the interest rate is increased as a result of the restructuring.
Because TDRs are impaired loans, the Company measures impairment by comparing the present value of expected future cash flows, or, when appropriate, collateral value, to the loan’s recorded investment. Any excess of recorded investment over the present value of expected future cash flows or collateral value is recognized by creating a valuation allowance or increasing an existing valuation allowance. Any portion of the loan’s recorded investment the Company does not expect to collect as a result of the modification is charged off at the time of modification.
Commercial TDRs were $194 million and $167 million on June 30, 2014 and December 31, 2013, respectively. Retail TDRs totaled $1.2 billion on June 30, 2014 and December 31, 2013. Commitments to lend additional funds to debtors owing receivables which were TDRs were $46 million and $52 million on June 30, 2014 and December 31, 2013, respectively.
The following table summarizes how loans were modified during the six months ended June 30, 2014, the charge-offs related to the modifications, and the impact on the ALLL. The reported balances include loans that became TDRs during 2014, and were paid off in full, charged off, or sold prior to June 30, 2014.
| Primary Modification Types | ||||||||||||||||||||||||
| Interest Rate Reduction(1) | Maturity Extension(2) | |||||||||||||||||||||||
| Number of Contracts |
Pre- Modification Outstanding Recorded Investment |
Post- Modification Outstanding Recorded Investment |
Number of Contracts |
Pre- Modification Outstanding Recorded Investment |
Post- Modification Outstanding Recorded Investment |
|||||||||||||||||||
| (dollars in millions) | ||||||||||||||||||||||||
| Commercial |
15 | $ | 7 | $ | 7 | 28 | $ | 2 | $ | 2 | ||||||||||||||
| Commercial real estate |
2 | — | — | 2 | — | — | ||||||||||||||||||
|
|
|
|
|
|
|
|
|
|
|
|
|
|||||||||||||
| Total commercial |
17 | 7 | 7 | 30 | 2 | 2 | ||||||||||||||||||
|
|
|
|
|
|
|
|
|
|
|
|
|
|||||||||||||
| Residential, including originated home equity products |
136 | 14 | 14 | 266 | 18 | 16 | ||||||||||||||||||
| Home equity products serviced by others |
21 | 1 | 1 | 1 | — | — | ||||||||||||||||||
| Other secured retail |
58 | 1 | 1 | 7 | — | — | ||||||||||||||||||
| Unsecured retail |
1,185 | 6 | 6 | — | — | — | ||||||||||||||||||
|
|
|
|
|
|
|
|
|
|
|
|
|
|||||||||||||
| Total retail |
1,400 | 22 | 22 | 274 | 18 | 16 | ||||||||||||||||||
|
|
|
|
|
|
|
|
|
|
|
|
|
|||||||||||||
| Total |
1,417 | $ | 29 | $ | 29 | 304 | $ | 20 | $ | 18 | ||||||||||||||
|
|
|
|
|
|
|
|
|
|
|
|
|
|||||||||||||
F-112
Table of Contents
CITIZENS FINANCIAL GROUP, INC.
NOTES TO CONSOLIDATED FINANCIAL STATEMENTS (UNAUDITED)
| Primary Modification Types | ||||||||||||||||||||
| Other(3) | ||||||||||||||||||||
| Number of Contracts |
Pre- Modification Outstanding Recorded Investment |
Post- Modification Outstanding Recorded Investment |
Net Change to ALLL Resulting from Modification |
Charge-offs Resulting from Modification |
||||||||||||||||
| (dollars in millions) | ||||||||||||||||||||
| Commercial |
2 | $ | — | $ | — | $ | — | $ | — | |||||||||||
| Commercial real estate |
— | — | — | — | — | |||||||||||||||
|
|
|
|
|
|
|
|
|
|
|
|||||||||||
| Total commercial |
2 | — | — | — | — | |||||||||||||||
|
|
|
|
|
|
|
|
|
|
|
|||||||||||
| Residential, including originated home equity products |
921 | 73 | 69 | — | 5 | |||||||||||||||
| Home equity products serviced by others |
109 | 4 | 4 | — | — | |||||||||||||||
| Other secured retail |
446 | 7 | 5 | — | 2 | |||||||||||||||
| Unsecured retail |
853 | 16 | 16 | — | — | |||||||||||||||
|
|
|
|
|
|
|
|
|
|
|
|||||||||||
| Total retail |
2,329 | 100 | 94 | — | 7 | |||||||||||||||
|
|
|
|
|
|
|
|
|
|
|
|||||||||||
| Total |
2,331 | $ | 100 | $ | 94 | $ | — | $ | 7 | |||||||||||
|
|
|
|
|
|
|
|
|
|
|
|||||||||||
| (1) | Includes modifications that consist of multiple concessions, one of which is an interest rate reduction. |
| (2) | Includes modifications that consist of multiple concessions, one of which is a maturity extension (unless one of the other concessions was an interest rate reduction). |
| (3) | Includes modifications other than interest rate reductions or maturity extensions, such as lowering scheduled payments for a specified period of time, principal forbearance, capitalizing arrearages, and principal forgiveness. Also included are the following: deferrals, trial modifications, certain bankruptcies, loans in forbearance and prepayment plans. Modifications can include the deferral of accrued interest resulting in post modification balances being higher than pre-modification. |
The following table summarizes how loans were modified during the six months ended June 30, 2013, the charge-offs related to the modifications, and the impact on the ALLL. The reported balances include loans that became TDRs during 2013, and were paid off in full, charged off, or sold prior to June 30, 2013.
| Primary Modification Types | ||||||||||||||||||||||||
| Interest Rate Reduction(1) | Maturity Extension(2) | |||||||||||||||||||||||
| Number of Contracts |
Pre- Modification Outstanding Recorded Investment |
Post- Modification Outstanding Recorded Investment |
Number of Contracts |
Pre- Modification Outstanding Recorded Investment |
Post- Modification Outstanding Recorded Investment |
|||||||||||||||||||
| (dollars in millions) | ||||||||||||||||||||||||
| Commercial |
71 | $ | 4 | $ | 4 | 84 | $ | 4 | $ | 4 | ||||||||||||||
| Commercial real estate |
4 | 3 | 3 | 1 | — | — | ||||||||||||||||||
|
|
|
|
|
|
|
|
|
|
|
|
|
|||||||||||||
| Total commercial |
75 | 7 | 7 | 85 | 4 | 4 | ||||||||||||||||||
|
|
|
|
|
|
|
|
|
|
|
|
|
|||||||||||||
| Residential, including originated home equity products |
238 | 27 | 29 | 80 | 7 | 7 | ||||||||||||||||||
| Home equity products serviced by others |
19 | 1 | 1 | 1 | — | — | ||||||||||||||||||
| Other secured retail |
195 | 2 | 2 | 2 | — | — | ||||||||||||||||||
| Unsecured retail |
1,342 | 7 | 7 | — | — | — | ||||||||||||||||||
|
|
|
|
|
|
|
|
|
|
|
|
|
|||||||||||||
| Total retail |
1,794 | 37 | 39 | 83 | 7 | 7 | ||||||||||||||||||
|
|
|
|
|
|
|
|
|
|
|
|
|
|||||||||||||
| Total |
1,869 | $ | 44 | $ | 46 | 168 | $ | 11 | $ | 11 | ||||||||||||||
|
|
|
|
|
|
|
|
|
|
|
|
|
|||||||||||||
F-113
Table of Contents
CITIZENS FINANCIAL GROUP, INC.
NOTES TO CONSOLIDATED FINANCIAL STATEMENTS (UNAUDITED)
| Primary Modification Types | ||||||||||||||||||||
| Other(3) | ||||||||||||||||||||
| Number of Contracts |
Pre-Modification Outstanding Recorded Investment |
Post-Modification Outstanding Recorded Investment |
Net Change to ALLL Resulting from Modification |
Charge-offs Resulting from Modification |
||||||||||||||||
| (dollars in millions) | ||||||||||||||||||||
| Commercial |
3 | $ | — | $ | — | $ | — | $ | — | |||||||||||
| Commercial real estate |
— | — | — | (1 | ) | — | ||||||||||||||
|
|
|
|
|
|
|
|
|
|
|
|||||||||||
| Total commercial |
3 | — | — | (1 | ) | — | ||||||||||||||
|
|
|
|
|
|
|
|
|
|
|
|||||||||||
| Residential, including originated home equity products |
1,050 | 85 | 80 | 1 | 6 | |||||||||||||||
| Home equity products serviced by others |
145 | 7 | 5 | — | 2 | |||||||||||||||
| Other secured retail |
847 | 8 | 7 | — | 1 | |||||||||||||||
| Unsecured retail |
1,536 | 28 | 28 | — | — | |||||||||||||||
|
|
|
|
|
|
|
|
|
|
|
|||||||||||
| Total retail |
3,578 | 128 | 120 | 1 | 9 | |||||||||||||||
|
|
|
|
|
|
|
|
|
|
|
|||||||||||
| Total |
3,581 | $ | 128 | $ | 120 | $ | — | $ | 9 | |||||||||||
|
|
|
|
|
|
|
|
|
|
|
|||||||||||
| (1) | Includes modifications that consist of multiple concessions, one of which is an interest rate reduction. |
| (2) | Includes modifications that consist of multiple concessions, one of which is a maturity extension (unless one of the other concessions was an interest rate reduction). |
| (3) | Includes modifications other than interest rate reductions or maturity extensions, such as lowering scheduled payments for a specified period of time, principal forbearance, capitalizing arrearages, and principal forgiveness. Also included are the following: deferrals, trial modifications, certain bankruptcies, loans in forbearance and prepayment plans. Modifications can include the deferral of accrued interest resulting in post modification balances being higher than pre-modification. |
The table below summarizes TDRs that defaulted during the six months ended June 30, 2014 and 2013 within 12 months of their modification date. For purposes of this table, a payment default is defined as being past due 90 days or more under the modified terms. Amounts represent the loan’s recorded investment at the time of payment default. Loan data in this table includes loans meeting the criteria that were paid off in full, charged off, or sold prior to June 30, 2014 and 2013. If a TDR of any loan type becomes 90 days past due after being modified, the loan is written down to the fair value of collateral less cost to sell. The amount written off is charged to the ALLL.
| June 30, 2014 | June 30, 2013 | |||||||||||||||
| Number of Contracts |
Balance Defaulted |
Number of Contracts |
Balance Defaulted |
|||||||||||||
| (dollars in millions) | ||||||||||||||||
| Commercial |
17 | $ | 3 | 1 | $ | — | ||||||||||
| Commercial real estate |
1 | 1 | 1 | — | ||||||||||||
|
|
|
|
|
|
|
|
|
|||||||||
| Total commercial |
18 | 4 | 2 | — | ||||||||||||
|
|
|
|
|
|
|
|
|
|||||||||
| Residential, including originated home equity products |
429 | 33 | 1,124 | 85 | ||||||||||||
| Home equity products serviced by others |
46 | 1 | 150 | 4 | ||||||||||||
| Other secured retail |
67 | 1 | 130 | 1 | ||||||||||||
| Unsecured retail |
504 | 5 | 592 | 8 | ||||||||||||
|
|
|
|
|
|
|
|
|
|||||||||
| Total retail |
1,046 | 40 | 1,996 | 98 | ||||||||||||
|
|
|
|
|
|
|
|
|
|||||||||
| Total |
1,064 | $ | 44 | 1,998 | $ | 98 | ||||||||||
|
|
|
|
|
|
|
|
|
|||||||||
F-114
Table of Contents
CITIZENS FINANCIAL GROUP, INC.
NOTES TO CONSOLIDATED FINANCIAL STATEMENTS (UNAUDITED)
Concentrations of Credit Risk
Most of the Company’s business activity is with customers located in the New England, Mid-Atlantic and Mid-West regions. Generally, loans are collateralized by assets including real estate, inventory, accounts receivable, other personal property and investment securities. As of June 30, 2014 and December 31, 2013, the Company had a significant amount of loans collateralized by residential and commercial real estate. There are no significant concentrations to particular industries within the commercial loan portfolio. Exposure to credit losses arising from lending transactions may fluctuate with fair values of collateral supporting loans, which fail to perform according to contractual agreements. The Company’s policy is to collateralize loans to the extent necessary; however, unsecured loans are also granted on the basis of the financial strength of the applicant and the facts surrounding the transaction.
Certain loan products, including residential mortgages, home equity loans and lines of credit, and credit cards, have contractual features that may increase credit exposure to the Company in the event of an increase in interest rates or a decline in housing values. These products include loans that exceed 90% of the value of the underlying collateral (high LTV loans), interest-only and negative amortization residential mortgages, and loans with low introductory rates. Certain loans have more than one of these characteristics.
The following table presents balances of loans with these characteristics:
| June 30, 2014 | ||||||||||||||||||||
| Residential Mortgages |
Home Equity Loans and Lines of Credit |
Home Equity Products serviced by others |
Credit Cards |
Total | ||||||||||||||||
| (in millions) | ||||||||||||||||||||
| High loan-to-value |
$ | 1,003 | $ | 2,574 | $ | 1,413 | $ | — | $ | 4,990 | ||||||||||
| Interest only/negative amortization |
875 | — | — | — | 875 | |||||||||||||||
| Low introductory rate |
— | — | — | 106 | 106 | |||||||||||||||
| Multiple characteristics and other |
76 | — | — | — | 76 | |||||||||||||||
|
|
|
|
|
|
|
|
|
|
|
|||||||||||
| Total |
$ | 1,954 | $ | 2,574 | $ | 1,413 | $ | 106 | $ | 6,047 | ||||||||||
|
|
|
|
|
|
|
|
|
|
|
|||||||||||
| December 31, 2013 | ||||||||||||||||||||
| Residential Mortgages |
Home Equity Loans and Lines of Credit |
Home Equity Products serviced by others |
Credit Cards |
Total | ||||||||||||||||
| (in millions) | ||||||||||||||||||||
| High loan-to-value |
$ | 1,054 | $ | 2,798 | $ | 1,581 | $ | — | $ | 5,433 | ||||||||||
| Interest only/negative amortization |
882 | — | — | — | 882 | |||||||||||||||
| Low introductory rate |
— | — | — | 119 | 119 | |||||||||||||||
| Multiple characteristics and other |
96 | — | — | — | 96 | |||||||||||||||
|
|
|
|
|
|
|
|
|
|
|
|||||||||||
| Total |
$ | 2,032 | $ | 2,798 | $ | 1,581 | $ | 119 | $ | 6,530 | ||||||||||
|
|
|
|
|
|
|
|
|
|
|
|||||||||||
F-115
Table of Contents
CITIZENS FINANCIAL GROUP, INC.
NOTES TO CONSOLIDATED FINANCIAL STATEMENTS (UNAUDITED)
NOTE 5—GOODWILL
Goodwill represents the excess of fair value of assets purchased over the purchase price. Since 1988, the Company has closed 26 acquisitions of banks or assets of banks. The changes in the carrying value of goodwill for the six months ended June 30, 2014 and 2013 were:
| Consumer Banking |
Commercial Banking |
Total | ||||||||||
| (in millions) | ||||||||||||
| Balance at December 31, 2012 |
$ | 6,393 | $ | 4,918 | $ | 11,311 | ||||||
| Impairment losses based on results of interim impairment testing |
(4,435 | ) | — | (4,435 | ) | |||||||
| Transfers |
178 | (178 | ) | — | ||||||||
|
|
|
|
|
|
|
|||||||
| Balance at June 30, 2013 |
$ | 2,136 | $ | 4,740 | $ | 6,876 | ||||||
|
|
|
|
|
|
|
|||||||
| Balance at December 31, 2013 |
$ | 2,136 | $ | 4,740 | $ | 6,876 | ||||||
| Adjustments |
— | — | — | |||||||||
|
|
|
|
|
|
|
|||||||
| Balance at June 30, 2014 |
$ | 2,136 | $ | 4,740 | $ | 6,876 | ||||||
|
|
|
|
|
|
|
|||||||
Accumulated impairment losses related to the Consumer Banking reporting unit totaled $5.9 billion at June 30, 2014, and 2013. The accumulated impairment losses related to the Commercial Banking unit totaled $50 million at June 30, 2014 and 2013.
The Company performs an annual test for impairment of goodwill at a level of reporting referred to as a reporting unit. The Company has identified and allocated goodwill to the following reporting units based upon reviews of the structure of the Company’s executive team and supporting functions, resource allocations and financial reporting processes:
| • | Consumer Banking |
| • | Commercial Banking |
The Company tested the value of goodwill as of June 30, 2013, and recorded an impairment charge of $4.4 billion relating to the Consumer Banking reporting unit. The impairment charge, which was a non-cash item, had minimal impact on the Company’s regulatory capital ratios and liquidity, and for segment reporting purposes was included in Other. Refer to Note 19 “Business Segments,” for information regarding segment reporting.
The valuation of goodwill is dependent on forward-looking expectations related to the performance of the U.S. economy and the associated financial performance of the Company. The prolonged delay in the full recovery of the U.S. economy, and the impact of that delay on earnings expectations, prompted a goodwill impairment test as of June 30, 2013. Although the U.S. economy has demonstrated signs of recovery, notably improvements in unemployment and housing, the pace and extent of these indicators, as well as in overall Gross Domestic Product, have lagged previous expectations. The impact of the slow recovery is most evident in the Company’s Consumer Banking reporting unit. Forecasted economic growth for the U.S., coupled with the continuing impact of the new regulatory framework in the financial industry, have resulted in a deceleration of expected growth for the Consumer Banking reporting unit’s future profits, and an associated goodwill impairment. Refer to Note 1 “Significant Accounting Policies,” in the Company’s audited Consolidated Financial Statements included elsewhere in this prospectus for information regarding the impairment test.
F-116
Table of Contents
CITIZENS FINANCIAL GROUP, INC.
NOTES TO CONSOLIDATED FINANCIAL STATEMENTS (UNAUDITED)
NOTE 6—MORTGAGE BANKING
In its mortgage banking business, the Company sells residential mortgage loans to government-sponsored entities and other parties, who may issue securities backed by pools of such loans. The Company retains no beneficial interests in these sales, but may retain the servicing rights of the loans sold. The Company is obligated to subsequently repurchase a loan if the purchaser discovers a standard representation or warranty violation such as noncompliance with eligibility requirements, customer fraud, or servicing violations. This primarily occurs during a loan file review.
The Company received $688 million and $2.6 billion of proceeds from the sale of residential mortgages in the six months ended June 30, 2014 and 2013, respectively and recognized gains on such sales of $17 million and $47 million in the six months then ended, respectively. Pursuant to the standard representations and warranties obligations discussed in the preceding paragraph, the Company repurchased mortgage loans totaling $17 million and $26 million for the six months ended June 30, 2014 and 2013, respectively.
Mortgage servicing fees, a component of mortgage banking fees, were $30 million and $32 million for the six months ended June 30, 2014 and 2013, respectively. The Company recorded a valuation recovery of $3 million compared to a recovery of $39 million for its MSRs for the six months ended June 30, 2014 and 2013, respectively.
Changes related to MSRs were as follows:
| Six Months Ended June 30, | ||||||||
| 2014 | 2013 | |||||||
| (in millions) | ||||||||
| MSRs: |
||||||||
| Balance as of January 1 |
$ | 208 | $ | 215 | ||||
| Amount capitalized |
8 | 26 | ||||||
| Amortization |
(21 | ) | (29 | ) | ||||
|
|
|
|
|
|||||
| Carrying amount before valuation allowance |
195 | 212 | ||||||
|
|
|
|
|
|||||
| Valuation allowance for servicing assets: |
||||||||
| Balance as of January 1 |
23 | 70 | ||||||
| Valuation recovery |
(3 | ) | (39 | ) | ||||
|
|
|
|
|
|||||
| Balance at end of period |
20 | 31 | ||||||
|
|
|
|
|
|||||
| Net carrying value of MSRs |
$ | 175 | $ | 181 | ||||
|
|
|
|
|
|||||
MSRs are presented in other assets on the Consolidated Balance Sheets.
The fair value of MSRs is estimated using a valuation model that calculates the present value of estimated future net servicing cash flows, taking into consideration actual and expected mortgage loan prepayment rates, discount rates, servicing costs, and other economic factors, which are determined based on current market conditions. The valuation model uses a static discounted cash flow methodology incorporating current market interest rates. A static model does not attempt to forecast or predict the future direction of interest rates; rather it estimates the amount and timing of future servicing cash flows using current market interest rates. The current mortgage interest rate influences the expected prepayment rate and therefore, the length of the cash flows associated with the servicing asset, while the discount rate determines the present value of those cash flows. Expected mortgage
F-117
Table of Contents
CITIZENS FINANCIAL GROUP, INC.
NOTES TO CONSOLIDATED FINANCIAL STATEMENTS (UNAUDITED)
loan prepayment assumptions are obtained using the QRM Multi Component prepayment model. The Company periodically obtains third-party valuations of its MSRs to assess the reasonableness of the fair value calculated by the valuation model.
The key economic assumptions used to estimate the value of MSRs are presented in the following table:
| As of June 30, | ||||||||
| 2014 | 2013 | |||||||
| (dollars in millions) | ||||||||
| Fair value |
$ | 186 | $ | 188 | ||||
| Weighted average life (in years) |
5.2 | 5.2 | ||||||
| Weighted average constant prepayment rate |
13.0 | % | 14.1 | % | ||||
| Weighted average discount rate |
10.3 | % | 10.4 | % | ||||
The key economic assumptions used in estimating the fair value of MSRs capitalized during the period were as follows:
| Six Months Ended June 30, |
||||||||
| 2014 | 2013 | |||||||
| Weighted average life (in years) |
5.4 | 6.3 | ||||||
| Weighted average constant prepayment rate |
12.1 | % | 13.3 | % | ||||
| Weighted average discount rate |
10.3 | % | 10.5 | % | ||||
The sensitivity analysis below as of June 30, 2014 and 2013, presents the impact to current fair value of an immediate 50 basis points and 100 basis points adverse change in the key economic assumptions and presents the decline in fair value that would occur if the adverse change were realized. These sensitivities are hypothetical. The effect of a variation in a particular assumption on the fair value of the mortgage servicing rights is calculated independently without changing any other assumption. In reality, changes in one factor may result in changes in another (for example, changes in interest rates, which drive changes in prepayment speeds, could result in changes in the discount rates), which might amplify or counteract the sensitivities. The primary risk inherent in the Company’s MSRs is an increase in prepayments of the underlying mortgage loans serviced, which is dependent upon market movements of interest rates.
| Six Months Ended June 30, |
||||||||
| 2014 | 2013 | |||||||
| (in millions) | ||||||||
| Prepayment rate: |
||||||||
| Decline in fair value from 50 basis points adverse change in interest rates |
$ | 8 | $ | 11 | ||||
| Decline in fair value from 100 basis points adverse change in interest rates |
$ | 14 | $ | 22 | ||||
| Weighted average discount rate: |
||||||||
| Decline in fair value from 50 basis points adverse change |
$ | 3 | $ | 3 | ||||
| Decline in fair value from 100 basis points adverse change |
$ | 6 | $ | 6 | ||||
F-118
Table of Contents
CITIZENS FINANCIAL GROUP, INC.
NOTES TO CONSOLIDATED FINANCIAL STATEMENTS (UNAUDITED)
NOTE 7-BORROWED FUNDS
The following is a summary of the Company’s short-term borrowed funds:
| As of June 30, 2014 |
As of December 31, 2013 |
|||||||
| (in millions) | ||||||||
| Federal funds purchased |
$ | — | $ | 689 | ||||
| Securities sold under agreements to repurchase |
6,807 | 4,102 | ||||||
| Other short-term borrowed funds |
7,702 | 2,251 | ||||||
|
|
|
|
|
|||||
| Total short-term borrowed funds |
$ | 14,509 | $ | 7,042 | ||||
|
|
|
|
|
|||||
Key data related to short-term borrowed funds is presented in the following table:
| As of and For the Six Months Ended June 30, 2014 |
As of and For the Year Ended December 31, 2013 |
|||||||
| (dollars in millions) | ||||||||
| Weighted-average interest rate at period end: |
||||||||
| Federal funds purchased and securities sold under agreements to repurchase |
0.12 | % | 0.09 | % | ||||
| Other short-term borrowed funds |
0.27 | % | 0.20 | % | ||||
| Maximum amount outstanding at month-end during the period: |
||||||||
| Federal funds purchased and securities sold under agreements to repurchase |
$ | 7,022 | $ | 5,114 | ||||
| Other short-term borrowed funds |
7,702 | 2,251 | ||||||
| Average amount outstanding during the period: |
||||||||
| Federal funds purchased and securities sold under agreements to repurchase |
$ | 5,708 | $ | 2,400 | ||||
| Other short-term borrowed funds |
4,838 | 259 | ||||||
| Weighted-average interest rate during the period: |
||||||||
| Federal funds purchased and securities sold under agreements to repurchase |
0.11 | % | 0.31 | % | ||||
| Other short-term borrowed funds |
0.26 | % | 0.44 | % | ||||
The following is a summary of the Company’s long-term borrowed funds:
| June 30, 2014 |
December 31, 2013 |
|||||||
| (in millions) | ||||||||
| Citizens Financial Group, Inc.: |
||||||||
| 4.150% fixed rate subordinated debt, due 2022 |
$ | 350 | $ | 350 | ||||
| 5.158% fixed-to-floating rate subordinated debt, (LIBOR + 3.56%) callable, due 2023 |
333 | 333 | ||||||
| 4.771% fixed rate subordinated debt, due 2023 |
333 | 333 | ||||||
| 4.691% fixed rate subordinated debt, due 2024 |
334 | 334 | ||||||
| 4.153% fixed rate subordinated debt due 2024 |
333 | — | ||||||
| Banking Subsidiaries: |
||||||||
| Federal Home Loan advances due through 2033 |
24 | 25 | ||||||
| Other |
25 | 30 | ||||||
|
|
|
|
|
|||||
| Total long-term borrowed funds |
$ | 1,732 | $ | 1,405 | ||||
|
|
|
|
|
|||||
F-119
Table of Contents
CITIZENS FINANCIAL GROUP, INC.
NOTES TO CONSOLIDATED FINANCIAL STATEMENTS (UNAUDITED)
Advances, lines of credit, and letters of credit from the FHLB are collateralized by pledged mortgages and pledged securities at least sufficient to satisfy the collateral maintenance level established by the FHLB. The utilized borrowing capacity for FHLB advances and letters of credit was $11.1 billion and $4.2 billion at June 30, 2014 and December 31, 2013, respectively. The Company’s available FHLB borrowing capacity was $1.6 billion and $8.2 billion at June 30, 2014 and December 31, 2013, respectively. The Company can also borrow from the FRB discount window to meet short-term liquidity requirements. Collateral, such as investment securities and loans, is pledged to provide borrowing capacity at the FRB. At June 30, 2014, the Company’s unused secured borrowing capacity was approximately $22.4 billion, which includes free securities, FHLB borrowing capacity, and FRB discount window capacity.
The following is a summary of maturities for the Company’s long-term borrowed funds at June 30, 2014:
| Year |
(in millions) | |||
| 2015 or on demand |
$ | 2 | ||
| 2016 |
6 | |||
| 2017 |
14 | |||
| 2018 |
11 | |||
| 2019 |
1 | |||
| 2020 and thereafter |
1,698 | |||
|
|
|
|||
| Total |
$ | 1,732 | ||
|
|
|
|||
NOTE 8—PREFERRED STOCK
As of June 30, 2014, the Company had authorized 100,000,000 shares of $25 par value undesignated preferred stock. These undesignated shares were authorized on April 9, 2014, by resolution of the Board of Directors. The Board of Directors or any authorized committee thereof are authorized to provide for the issuance of these shares in one or more series, and by filing a certificate pursuant to applicable law of the State of Delaware, to establish or change from time to time the number of shares of each such series, and to fix the designations, powers, including voting powers, full or limited, or no voting powers, preferences and the relative, participating, optional or other special rights of the shares of each series and any qualifications, limitations and restrictions thereof.
Prior to April 9, 2014, the Company had authorized 30,000 of $1 par value non-cumulative, non-voting perpetual preferred stock. That preferred stock ranked senior to the common stock of the Company with respect to dividend rights upon liquidation or dissolution of the Company. The stock was not convertible into any other property of the Company, nor was it redeemable by either the Company or the holder thereof. Dividends were non-cumulative and were payable quarterly at LIBOR plus 180 bps, if and when declared by the Company’s Board of Directors. In the event of any liquidation, dissolution or winding up of the Company, holders of each share of the preferred stock outstanding were entitled to be paid, out of the assets of the Company available for distribution to stockholders, before any payment was made to the holders of common stock, an amount equal to $100,000 per share of preferred stock then issued and outstanding.
There were no shares issued and outstanding during 2014 or 2013.
F-120
Table of Contents
CITIZENS FINANCIAL GROUP, INC.
NOTES TO CONSOLIDATED FINANCIAL STATEMENTS (UNAUDITED)
NOTE 9—EMPLOYEE BENEFITS
The Company maintains a non-contributory pension plan (the “Plan” or “qualified plan”) that was closed to new hires and re-hires effective January 1, 2009 and frozen to all participants effective December 31, 2012. Benefits under the Plan are based on employees’ years of service and highest 5-year average eligible compensation. The Plan is funded on a current basis, in compliance with the requirements of the ERISA. The Company also provides an unfunded, non-qualified supplemental retirement plan (the “non-qualified plan”), which was closed and frozen consistent with the qualified plan.
The following table presents the components of net periodic (income) cost for the Company’s qualified and non-qualified plans:
| Six Months Ended June 30, | ||||||||||||||||||||||||
| Qualified Plan |
Non-Qualified Plan |
Total | ||||||||||||||||||||||
| 2014 | 2013 | 2014 | 2013 | 2014 | 2013 | |||||||||||||||||||
| (in millions) | ||||||||||||||||||||||||
| Service cost |
$ | 2 | $ | 2 | $ | — | $ | — | $ | 2 | $ | 2 | ||||||||||||
| Interest cost |
22 | 21 | 2 | 2 | 24 | 23 | ||||||||||||||||||
| Expected return on plan assets |
(35 | ) | (34 | ) | — | — | (35 | ) | (34 | ) | ||||||||||||||
| Amortization of actuarial loss |
4 | 6 | 1 | 1 | 5 | 7 | ||||||||||||||||||
|
|
|
|
|
|
|
|
|
|
|
|
|
|||||||||||||
| Net periodic pension (income) cost |
$ | (7 | ) | $ | (5 | ) | $ | 3 | $ | 3 | $ | (4 | ) | $ | (2 | ) | ||||||||
|
|
|
|
|
|
|
|
|
|
|
|
|
|||||||||||||
NOTE 10—INCOME TAXES
Income Tax Provision (Benefit)
The provision (benefit) for income taxes was $232 million and $(174) million for the six months ended June 30, 2014 and 2013, respectively. The provision represented an effective tax rate of 33% and 4% for the six months ended June 30, 2014 and 2013, respectively. For the six months ended June 30, 2014, the effective tax rate compared favorably to the statutory rate of 35% primarily as a result of tax credits and the permanent benefit of tax-exempt income. For the six months ended June 30, 2013, the effective tax rate compared favorably to the statutory rate of 35% primarily as a result of the tax rate impact of a goodwill impairment charge.
Deferred Tax Liability
At June 30, 2014, the Company reported a net deferred tax liability of $403 million, compared to a $199 million liability as of December 31, 2013. The increase in the net deferred tax liability is primarily attributable to the utilization of net operating loss and tax credit carryforwards, in addition to a decrease in the unrealized loss reported on securities available for sale, derivative instruments, and hedging activities.
NOTE 11—DERIVATIVES
In the normal course of business, the Company enters into a variety of derivative transactions in order to meet the financing needs of its customers and to reduce its own exposure to fluctuations in interest rates and foreign currency exchange rates. The Company does not use derivatives for speculative purposes.
F-121
Table of Contents
CITIZENS FINANCIAL GROUP, INC.
NOTES TO CONSOLIDATED FINANCIAL STATEMENTS (UNAUDITED)
The Company’s derivative instruments are recognized on the Consolidated Balance Sheets at fair value. Information regarding the valuation methodology and inputs used to estimate the fair value of the Company’s derivative instruments is described in Note 15 “Fair Value Measurements.”
The following table identifies derivative instruments included on the Consolidated Balance Sheets in derivative assets and derivative liabilities:
| June 30, 2014 | December 31, 2013 | |||||||||||||||||||||||
| Notional Amount1 |
Derivative Assets |
Derivative Liabilities |
Notional Amount1 |
Derivative Assets |
Derivative Liabilities |
|||||||||||||||||||
| (in millions) | ||||||||||||||||||||||||
| Derivatives designated as hedging instruments: |
||||||||||||||||||||||||
| Interest rate swaps |
$ | 5,000 | $ | 23 | $ | 223 | $ | 5,500 | $ | 23 | $ | 412 | ||||||||||||
| Derivatives not designated as hedging instruments: |
||||||||||||||||||||||||
| Interest rate swaps |
28,381 | 611 | 522 | 29,355 | 654 | 558 | ||||||||||||||||||
| Foreign exchange contracts |
8,395 | 74 | 69 | 7,771 | 94 | 87 | ||||||||||||||||||
| Other contracts |
731 | 8 | 14 | 569 | 7 | 10 | ||||||||||||||||||
|
|
|
|
|
|
|
|
|
|||||||||||||||||
| Total derivatives not designated as hedging instruments |
693 | 605 | 755 | 655 | ||||||||||||||||||||
|
|
|
|
|
|
|
|
|
|||||||||||||||||
| Gross derivative fair values |
716 | 828 | 778 | 1,067 | ||||||||||||||||||||
| Less: Gross amounts offset in the Consolidated Balance Sheets2 |
(81 | ) | (81 | ) | (128 | ) | (128 | ) | ||||||||||||||||
|
|
|
|
|
|
|
|
|
|||||||||||||||||
| Total net derivative fair values presented in the Consolidated Balance Sheets3 |
$ | 635 | $ | 747 | $ | 650 | $ | 939 | ||||||||||||||||
|
|
|
|
|
|
|
|
|
|||||||||||||||||
| 1 | The notional or contractual amount of interest rate derivatives and foreign exchange contracts is the amount upon which interest and other payments under the contract are based. For interest rate derivatives, the notional amount is typically not exchanged. Therefore, notional amounts should not be taken as the measure of credit or market risk, as they tend to greatly overstate the true economic risk of these contracts. |
| 2 | Amounts represent the impact of legally enforceable master netting agreements that allow the Company to settle positive and negative positions. |
| 3 | The Company also offsets assets and liabilities associated with repurchase agreements on the Consolidated Balance Sheets. See Note 2 “Securities,” for further information. |
The Company’s derivative transactions are internally divided into three sub-groups: institutional, customer and residential loan.
Institutional derivatives
The institutional derivatives portfolio primarily consists of interest rate swap agreements that are used to hedge the interest rate risk associated with the Company’s investment securities, loans and financing liabilities (i.e., borrowed funds, deposits, etc.). The goal of the Company’s interest rate hedging activities is to manage interest rate sensitivity so that movements in interest rates do not significantly adversely affect net interest income.
The Company enters into certain interest rate swap agreements to hedge the risk associated with floating rate loans. By entering into pay-floating/receive-fixed interest rate swaps, the Company was
F-122
Table of Contents
CITIZENS FINANCIAL GROUP, INC.
NOTES TO CONSOLIDATED FINANCIAL STATEMENTS (UNAUDITED)
able to minimize the variability in the cash flows of these assets due to changes in interest rates. The Company has outstanding interest rate swap agreements designed to hedge a portion of the Company’s borrowed funds and deposits. By entering into a pay-fixed/receive-floating interest rate swap, a portion of these liabilities has been effectively converted to a fixed rate liability for the term of the interest rate swap agreement.
Customer derivatives
The customer derivatives portfolio consists of interest rate swap agreements and option contracts that are transacted to meet the financing needs of the Company’s customers. Offsetting swap and cap agreements are simultaneously transacted to effectively eliminate the Company’s market risk associated with the customer derivative products. The customer derivatives portfolio also includes foreign exchange contracts that are entered into on behalf of customers for the purpose of hedging exposure related to cash orders and loans and deposits denominated in foreign currency. The primary risks associated with these transactions arise from exposure to changes in foreign currency exchange rates and the ability of the counterparties to meet the terms of the contract. To manage this market risk, the Company simultaneously enters into offsetting foreign exchange contracts.
Residential loan derivatives
The Company enters into residential loan commitments that allow residential mortgage customers to lock in the interest rate on a residential mortgage while the loan undergoes the underwriting process. The Company also uses forward sales contracts to protect the value of residential mortgage loans and loan commitments that are being underwritten for future sale to investors in the secondary market.
The Company has certain derivative transactions that are designated as hedging instruments described as follows:
Derivatives designated as hedging instruments
The majority of the Company’s institutional hedging portfolio qualifies for hedge accounting. This includes interest rate swaps that are designated in highly effective cash flow hedging relationships. The Company formally documents at inception all hedging relationships, as well as risk management objectives and strategies for undertaking various accounting hedges. Additionally, the Company uses dollar offset or regression analysis at the hedge’s inception, and at least quarterly thereafter to assess whether the derivatives are expected to be, or have been, highly effective in offsetting changes in the hedged item’s expected cash flows. The Company discontinues hedge accounting when it is determined that a derivative is not expected to be or has ceased to be effective as a hedge, and then reflects changes in fair value in earnings after termination of the hedge relationship.
Cash flow hedges
The Company has outstanding interest rate swap agreements designed to hedge a portion of the Company’s floating rate assets and financing liabilities (including its borrowed funds and deposits). All of these swaps have been deemed as highly effective cash flow hedges. The effective portion of the hedging gains and losses associated with these hedges are recorded in OCI; the ineffective portion of the hedging gains and losses is recorded in earnings (other income). Hedging gains and losses on derivative contracts reclassified from OCI to current period earnings are included in the line item in the accompanying consolidated statements of operations in which the hedged item is recorded, and in the same period that the hedged item affects earnings. During the next 12 months, approximately
F-123
Table of Contents
CITIZENS FINANCIAL GROUP, INC.
NOTES TO CONSOLIDATED FINANCIAL STATEMENTS (UNAUDITED)
$33 million of net loss (pretax) on derivative instruments included in OCI is expected to be reclassified to net interest expense in the Consolidated Statements of Operations.
Hedging gains and losses associated with the Company’s cash flow hedges are immediately reclassified from OCI to current period earnings (other income) if it becomes probable that the hedged forecasted transactions will not occur by the originally specified time period.
The following table summarizes certain information related to the Company’s cash flow hedges:
| The Effect of Cash Flow Hedges on Net Income and Stockholders’ Equity |
||||||||
| Amounts Recognized for the Six Months Ended June 30, |
||||||||
| 2014 | 2013 | |||||||
| (in millions) | ||||||||
| Effective portion of gain recognized in OCI1 |
$ | 191 | $ | 55 | ||||
| Amounts reclassified from OCI to interest income2 |
36 | (22 | ) | |||||
| Amounts reclassified from OCI to interest expense2 |
(56 | ) | (98 | ) | ||||
| Amounts reclassified from OCI to other income3 |
— | (2 | ) | |||||
| 1 | The cumulative effective gains and losses on the Company’s cash flow hedging activities are included on the accumulated other comprehensive loss line item on the Consolidated Balance Sheets. |
| 2 | This amount includes both (a) the amortization of effective gains and losses associated with the Company’s terminated cash flow hedges and (b) the current reporting period’s interest settlements realized on the Company’s active cash flow hedges. Both (a) and (b) were previously included on the accumulated other comprehensive loss line item on the Consolidated Balance Sheets and were subsequently recorded as adjustments to the interest expense of the underlying hedged item. |
| 3 | This amount represents hedging gains and losses that have been immediately reclassified from accumulated other comprehensive loss based on the probability that the hedged forecasted transactions would not occur by the originally specified time period. This amount is reflected in the other income line item on the Consolidated Statements of Operations. |
Economic Hedges
The Company’s customer derivatives are recorded on the Consolidated Balance Sheets at fair value. These include interest rate and foreign exchange derivative contracts that are transacted to meet the hedging and financing needs of the Company’s customers. Mark-to-market adjustments to the fair value of customer related interest rate contracts are included in other income in the accompanying Consolidated Statements of Operations. Mark-to-market adjustments to the fair value of foreign exchange contracts relating to foreign currency loans are included in interest and fees on loans and leases in the accompanying Consolidated Statements of Operations, while all other foreign currency contract fair value changes are included in foreign exchange and trade finance fees. In both cases, the mark-to-market gains and losses associated with the customer derivatives are mitigated by the mark-to-market gains and losses on the offsetting interest rate and foreign exchange derivative contracts transacted.
The Company’s residential loan derivatives (including residential loan commitments and forward sales contracts) are recorded on the Consolidated Balance Sheets at fair value. Mark-to-market adjustments to the fair value of residential loan commitments and forward sale contracts are included in noninterest income under mortgage banking fees.
F-124
Table of Contents
CITIZENS FINANCIAL GROUP, INC.
NOTES TO CONSOLIDATED FINANCIAL STATEMENTS (UNAUDITED)
The following table summarizes certain information related to the Company’s economic hedges:
| The Effect of Customer Derivatives and Economic Hedges on Net Income |
||||||||
| Amounts Recognized in Noninterest Income for the Six Months Ended June 30, |
||||||||
| 2014 | 2013 | |||||||
| (in millions) | ||||||||
| Customer derivative contracts |
||||||||
| Customer interest rate contracts1 |
$ | 149 | $ | (150 | ) | |||
| Customer foreign exchange contracts1 |
6 | (10 | ) | |||||
| Residential loan commitments3 |
8 | (40 | ) | |||||
| Economic hedges |
||||||||
| Offsetting derivatives transactions to hedge interest rate risk on customer interest rate contracts1 |
(135 | ) | 178 | |||||
| Offsetting derivatives transactions to hedge foreign exchange risk on customer foreign exchange contracts2 |
(7 | ) | 13 | |||||
| Forward sale contracts3 |
(4 | ) | 40 | |||||
|
|
|
|
|
|||||
| Total |
$ | 17 | $ | 31 | ||||
|
|
|
|
|
|||||
| 1 | Reported in other income on the Consolidated Statements of Operations. |
| 2 | Reported in foreign exchange and trade finance fees on the Consolidated Statements of Operations. |
| 3 | Reported in mortgage banking fees on the Consolidated Statements of Operations. |
NOTE 12—COMMITMENTS, GUARANTEES AND CONTINGENCIES
Commitments
Commitments to extend credit are agreements to lend to customers in accordance with conditions contractually agreed upon in advance. Generally, the commitments have fixed expiration dates or termination clauses and may require payment of a fee. Since many of these commitments are expected to expire without being drawn upon, the contract amounts are not necessarily indicative of future cash requirements.
When-issued securities are agreements to purchase securities that have been authorized for issuance but not yet issued. The fair value of when-issued securities is reflected in the consolidated balance sheets at trade date.
On May 29, 2014, the Company entered into an agreement to purchase auto loans on a quarterly basis in future periods. For the first year, the agreement requires the purchase of a minimum of $250 million of outstanding balances to a maximum of $600 million per quarterly period. For quarterly periods after the first year, the minimum and maximum purchases are $400 million and $600 million, respectively. The agreement automatically renews until terminated by either party. The Company may cancel the agreement at will with payment of a variable termination fee. After 3 years, there is no termination fee.
During 2003, the Company entered into a 25-year agreement to acquire the naming and marketing rights of a baseball stadium in Pennsylvania. The Company has not made any payments on this contract for the six months ended June 30, 2014. The Company paid $3 million for the year ended December 31, 2013, and is obligated to pay $54 million over the remainder of the contract.
F-125
Table of Contents
CITIZENS FINANCIAL GROUP, INC.
NOTES TO CONSOLIDATED FINANCIAL STATEMENTS (UNAUDITED)
Letters of Credit
Standby letters of credit, both financial and performance, are issued by the Company for its customers. They are used as conditional guarantees of payment to a third party in the event the customer either fails to make specific payments (financial) or fails to complete a specific project (performance). Commercial letters of credit are used to facilitate the import of goods. The commercial letter of credit is used as the method of payment to the Company’s customers’ suppliers. The Company’s exposure to credit loss in the event of counterparty nonperformance in connection with the above instruments is represented by the contractual amount of those instruments, net of the value of collateral held. Standby letters of credit and commercial letters of credit are issued for terms of up to ten years and one year, respectively.
Generally, letters of credit are collateralized by cash, accounts receivable, inventory or investment securities. Credit risk associated with letters of credit is considered in determining the appropriate amounts of reserves for unfunded commitments.
The Company recognizes a liability on the Consolidated Balance Sheets representing its obligation to stand ready to perform over the term of the standby letters of credit in the event that the specified triggering events occur. The liability for these guarantees at June 30, 2014 and December 31, 2013 is $3 million.
Risk Participation Agreements
RPAs are guarantees issued by the Company to other parties for a fee, whereby the Company agrees to participate in the credit risk of a derivative customer of the other party. Under the terms of these agreements, the “participating bank” receives a fee from the “lead bank” in exchange for the guarantee of reimbursement if the customer defaults on an interest rate swap. The interest rate swap is transacted such that any and all exchanges of interest payments (favorable and unfavorable) are made between the lead bank and the customer. In the event that an early termination of the swap occurs and the customer is unable to make a required close out payment, the participating bank assumes that obligation and is required to make this payment.
RPAs where the Company acts as the lead bank are referred to as “participations-out,” in reference to the credit risk associated with the customer derivatives being transferred out of the Company. Participations-out generally occur concurrently with the sale of new customer derivatives. RPAs where the Company acts as the participating bank are referred to as “participations-in,” in reference to the credit risk associated with the counterparty’s derivatives being assumed by the Company. The Company’s maximum credit exposure is based on its proportionate share of the settlement amount of the referenced interest rate swap. Settlement amounts are generally calculated based on the fair value of the swap plus outstanding accrued interest receivables from the customer. The Company’s estimate of the credit exposure associated with its risk participations-in as of June 30, 2014 and December 31, 2013 is $20 million and $17 million, respectively. The current amount of credit exposure is spread out over 74 counterparties. RPAs generally have terms ranging from 1-5 years; however, certain outstanding agreements have terms as long as 9 years.
Other Guarantees
The Company has issued a guarantee to RBS, for a fee, whereby the Company will absorb credit losses related to the sale of option contracts by RBS to customers of the Company. There were outstanding option contracts with a notional value of $1 million and $2 million at June 30, 2014 and December 31, 2013, respectively.
F-126
Table of Contents
CITIZENS FINANCIAL GROUP, INC.
NOTES TO CONSOLIDATED FINANCIAL STATEMENTS (UNAUDITED)
The following is a summary of outstanding off balance sheet arrangements:
| June 30, 2014 | December 31, 2013 | |||||||
| (in millions) | ||||||||
| Commitment amount: |
||||||||
| Undrawn commitments to extend credit |
$ | 54,353 | $ | 53,987 | ||||
| Financial standby letters of credit |
2,622 | 2,556 | ||||||
| Performance letters of credit |
118 | 149 | ||||||
| Commercial letters of credit |
56 | 64 | ||||||
| Marketing rights |
54 | 54 | ||||||
| Risk participation agreements |
20 | 17 | ||||||
| Residential mortgage loans sold with recourse |
12 | 13 | ||||||
|
|
|
|
|
|||||
| Total |
$ | 57,235 | $ | 56,840 | ||||
|
|
|
|
|
|||||
Contingencies
The Company operates in a legal and regulatory environment that exposes it to potentially significant risks. A certain amount of litigation ordinarily results from the nature of the Company’s banking and other businesses. The Company is a party to legal proceedings, including class actions. It is also the subject of investigations, reviews, and regulatory matters arising out of its normal business operations, which, in some instances, relate to concerns about unfair and/or deceptive practices and mis-selling of certain products. In addition, the Company engages in discussions with relevant governmental and regulatory authorities on an ongoing and regular basis regarding various issues, and it is possible that any issues discussed or identified may result in investigatory or other action being taken. Litigation and regulatory matters may result in settlements, damages, fines, public or private censure, increased costs, required remediation, restriction on business activities, or other impact on the Company.
In these disputes and proceedings, the Company contests liability and the amount of damages as appropriate. Given their complex nature, it may be years before some of these matters are finally resolved. Moreover, before liability can be reasonably estimated for a claim, numerous legal and factual issues may need to be examined, including through potentially lengthy discovery and determination of important factual matters, and by addressing novel or unsettled legal issues relevant to the proceedings in question.
The Company cannot predict with certainty if, how, or when such claims will be resolved or what the eventual settlement, fine, penalty or other relief, if any, may be, particularly for claims that are at an early stage in their development or where claimants seek substantial or indeterminate damages. The Company recognizes a provision for a claim when, in the opinion of management after seeking legal advice, it is probable that a liability exists and the amount of loss can reasonably be estimated. In many proceedings, however, it is not possible to determine whether any loss is probable or to estimate the amount of any loss. In each of the matters described below, the Company is unable to estimate the liability in excess of any provision accrued, if any, that might arise or its effects on the Company’s Consolidated Statements of Operations or Consolidated Cash Flows in any particular period.
Set out below are descriptions of significant legal matters involving the Company. Based on information currently available, the advice of legal and other counsel, and established reserves, management believes that the aggregate liabilities, if any, arising from these proceedings will not have a materially adverse effect on the Company’s Consolidated Financial Statements.
F-127
Table of Contents
CITIZENS FINANCIAL GROUP, INC.
NOTES TO CONSOLIDATED FINANCIAL STATEMENTS (UNAUDITED)
Consumer Products
The activities of the Company’s bank subsidiaries are subject to extensive laws and regulations concerning unfair or deceptive acts or practices in connection with customer products. Certain of the bank subsidiaries’ practices with respect to overdraft protection and other consumer products have not met applicable standards. The bank subsidiaries have implemented and are continuing to implement changes to bring their practices in conformity with applicable laws and regulations.
In April 2013, the bank subsidiaries consented to the issuance of orders by the OCC and the FDIC (the Consent Orders). In the Consent Orders (which are publicly available and will remain in effect until terminated by the regulators), the bank subsidiaries neither admitted nor denied the regulators’ findings that they had engaged in deceptive marketing and implementation of the bank’s overdraft protection program, checking rewards programs, and stop-payment process for pre-authorized recurring electronic fund transfers. Under the Consent Orders, the bank subsidiaries paid a total of $10 million in civil monetary penalties and are required to develop plans to provide restitution to affected customers (the amount of which is anticipated to be approximately $8 million) to cease and desist any operations in violation of Section 5 of the Federal Trade Commission Act, and to submit to the regulators periodic written progress reports regarding compliance with the Consent Orders. In addition, Citizens Bank, N.A. agreed to take certain remedial actions to improve its compliance risk management systems and to create a comprehensive action plan designed to achieve compliance with one of the Consent Orders. Restitution plans have been prepared and submitted for approval and Citizens Bank, N.A. has submitted for approval, and is in the process of implementing, its action plan for compliance with such Consent Order, as well as updated policies, procedures, and programs related to its compliance risk management systems.
The Company’s bank subsidiaries have also identified issues regarding, among other things, certain identity theft and debt cancellation products, certain overdraft fees, signature debit card fees, the bank subsidiaries’ policies and practices with respect to consumer complaints process, identifying and correcting errors in customer deposits, and the charging of cost-based credit card late payment fees. The banking subsidiaries have paid restitution and expect to pay additional restitution to certain affected customers in connection with certain of these practices. In addition, the banking subsidiaries could face formal administrative enforcement actions from their federal supervisory agencies, including the assessment of civil monetary penalties and restitution, relating to the past practices and policies identified above and other consumer products, and they could face potential civil litigation. The Company does not expect that the aggregate of amounts paid in connection with these matters will have a material adverse effect on the Company’s Consolidated Financial Statements.
Fair Labor Standards Act Litigation
The Company was named in several purported class actions brought under the FLSA and equivalent state statutes alleging that certain categories of branch employees were denied overtime for hours worked. These suits were brought by current and former branch employees alleging that either: (1) they were in Assistant Branch Manager positions and were improperly classified as exempt under the FLSA thereby denying them pay for all hours worked, including overtime pay; or (2) they were properly classified as non-exempt tellers, bankers or the like but were told not to record all of their hours, had hours they entered deleted by their managers and/or were otherwise denied pay for hours worked, including overtime pay. These cases cover the Company’s entire footprint, and they have been settled with final court approval of the settlements granted on May 5, 2014. The settlement amount ($12 million), which had been fully covered by an existing reserve, has been paid by the Company and is in the process of being distributed pursuant to the terms of the settlement. Separately,
F-128
Table of Contents
CITIZENS FINANCIAL GROUP, INC.
NOTES TO CONSOLIDATED FINANCIAL STATEMENTS (UNAUDITED)
the Company was named in two lawsuits brought by current and former mortgage loan officers and home loan advisors alleging that they were improperly classified as exempt under the FLSA and corresponding state laws and therefore denied pay for all hours worked, including overtime pay. These cases have been settled, and final court approval of the settlements was granted on January 29, 2014. The combined settlement amount of these two cases ($3 million) which had been fully covered by existing reserves, has been paid by the Company and distributed pursuant to the terms of the settlements.
Telephone Consumer Protection Act Litigation
The Company is a defendant in a purported class action complaint filed in December 2013 in the United States District Court for the Southern District of California pursuant to the Telephone Consumer Protection Act. The named plaintiff purports to represent a ”national class” of customers who allegedly received automated calls to their cell phones from the bank or its agents, without customer consent, in violation of the Telephone Consumer Protection Act. The Company is vigorously defending this matter.
LIBOR Litigation
The Company is a defendant in lawsuits in which allegations have been made that its parent company, RBS Group, manipulated U.S. dollar LIBOR to the detriment of the Company’s customers. The lawsuits include a purported class action on behalf of borrowers of the Company whose interest rates were tied to U.S. dollar LIBOR. The plaintiffs in these cases assert various theories of liability, including fraud, negligent misrepresentation, breach of contract, and unjust enrichment. The Company is vigorously defending these matters.
Foreclosure-Related Expenses
In May 2013, the civil division of the U.S. Attorney’s Office for the Southern District of New York served a subpoena pursuant to the Financial Institutions Reform, Recovery and Enforcement Act of 1989 seeking information regarding home mortgage foreclosure expenses submitted for reimbursement to the United States Department of Housing and Urban Development, FNMA, or FHLMC. The Company is cooperating with the investigation.
Mortgage Repurchase Demands
The Company is an originator and servicer of residential mortgages and routinely sells such mortgage loans in the secondary market and to government-sponsored entities. In the context of such sales, the Company makes certain representations and warranties regarding the characteristics of the underlying loans and, as a result, may be contractually required to repurchase such loans or indemnify certain parties against losses for certain breaches of those representations and warranties. Between the start of January 2009 and the end of June 30, 2014, the Company has received approximately $146 million in repurchase demands and $97 million in indemnification payment requests in respect of loans originated, for the most part, since 2003. Of those claims presented, $81 million was paid to repurchase residential mortgage loans, and $32 million was incurred for indemnification costs to make investors whole. The Company repurchased mortgage loans totaling $17 million and $26 million for the six months ended June 30, 2014 and 2013, respectively. The Company incurred indemnification costs of $7 million and $6 million for the six months ended June 30, 2014 and 2013, respectively. The Company cannot estimate what the future level of repurchase demands will be or the Company’s
F-129
Table of Contents
CITIZENS FINANCIAL GROUP, INC.
NOTES TO CONSOLIDATED FINANCIAL STATEMENTS (UNAUDITED)
ultimate exposure, and cannot give any assurance that the historical experience will continue in the future. It is possible that the volume of repurchase demands will increase. In addition to the above, the Company has since December 2013 been responding to subpoenas issued by the Office of the Inspector General for the Federal Housing Finance Agency seeking information about loans sold to Federal National Mortgage Association and the Federal Home Loan Mortgage Corporation from 2003 through 2011.
NOTE 13—DIVESTITURES AND BRANCH ASSETS AND LIABILITIES HELD FOR SALE
In June 2014, the Company sold 103 retail branches located in Illinois, including certain customer deposit liabilities of $4.8 billion and selected loans of $1.0 billion (primarily middle market, small business, home equity and credit card balances). As a result of this transaction, the Company recorded a gain on sale of $288 million consisting of $286 million related to the deposits, a gain on sale of $11 million related to the loans and $9 million loss on sale of other branch assets. For the six months ended June 30, 2014, the corresponding interest and fees on these loans was $20 million and interest expense on deposits was $4 million. The Company has agreed to service the credit card accounts sold to the purchaser until September 2014. At such time, the Company is expected to complete all exit activities associated with this transaction. As a result of this transaction, the related assets and liabilities were classified as held for sale as of December 31, 2013. See Note 17 “Divestitures and Branch Assets and Liabilities Held for Sale,” in the Company’s audited Consolidated Financial Statements included elsewhere in this prospectus for further details.
NOTE 14—RELATED PARTY TRANSACTIONS
The following is a summary of inter-company borrowed funds:
| Related Party | Interest Rate | Maturity Date | June 30, 2014 |
December 31, 2013 |
||||||||||||
| (dollars in millions) | ||||||||||||||||
| Subordinated debt |
RBSG | 4.153 | % | July 2024 | $ | 333 | $ | — | ||||||||
| RBSG | 4.961 | % | January 2024 | 334 | 334 | |||||||||||
| RBSG | 4.771 | % | October 2023 | 333 | 333 | |||||||||||
| RBS | 5.158 | % | June 2023 | 333 | 333 | |||||||||||
Total interest expense recorded on inter-company subordinated debt was $25 million and $2 million for the six months ended June 30, 2014 and 2013, respectively.
The Company maintained a $50 million revolving line of credit at December 31, 2013 with RBS. This line of credit was not drawn upon at December 31, 2013, expired on January 31, 2014, and was not renewed. No interest expense was incurred on this revolving line of credit for the six months ended June 30, 2013.
The Company enters into interest rate swap agreements with RBS for the purpose of reducing the Company’s exposure to interest rate fluctuations. As of June 30, 2014, the total notional amount of swaps outstanding was $5 billion which pay fixed rates ranging from 1.78% to 4.30% and receive overnight fed funds rate and one month LIBOR with maturities from 2016 through 2023. As of December 31, 2013, the total notional amount of swaps outstanding was $5.5 billion, all of which paid fixed rates ranging from 1.78% to 5.47% and received overnight Federal funds rate with maturities from 2014 through 2023. Included in these balances were $4 billion of receive-fixed swaps that had been executed as of June 30, 2014 and 2013 as part of a new hedging program implemented during the quarter ended March 31, 2013. The Company recorded net interest expense of $21 million and $92 million for the six months ended June 30, 2014 and 2013, respectively.
F-130
Table of Contents
CITIZENS FINANCIAL GROUP, INC.
NOTES TO CONSOLIDATED FINANCIAL STATEMENTS (UNAUDITED)
In order to meet the financing needs of its customers, the Company enters into interest rate swap and cap agreements with its customers and simultaneously enters into offsetting swap and cap agreements with RBS. The Company earns a spread equal to the difference between rates charged to the customer and rates charged by RBS. The notional amount of these interest rate swap and cap agreements outstanding with RBS was $11.7 billion and $13.4 billion at June 30, 2014 and December 31, 2013, respectively. The Company recorded expense of $135 million for the six months ended June 30, 2014 and income of $176 million for the six months ended June 30, 2013 within other income.
Also to meet the financing needs of its customers, the Company enters into a variety of foreign currency denominated products, such as loans, deposits and foreign exchange contracts. To manage the foreign exchange risk associated with these products, the Company simultaneously enters into offsetting foreign exchange contracts with RBS. The Company earns a spread equal to the difference between rates charged to the customer and rates charged by RBS. The notional amount of foreign exchange contracts outstanding with RBS was $4.9 billion and $4.6 billion at June 30, 2014 and December 31, 2013, respectively. The Company recorded expense within foreign exchange and trade finance fees of $7 million for the six months ended June 30, 2014 and income of $13 million for the six months ended June 30, 2013.
The Company has issued a guarantee to RBS for a fee, whereby the Company will absorb credit losses related to the sale of option contracts by RBS to customers of the Company. There were outstanding option contracts with a notional value of $1 million and $2 million at June 30, 2014 and December 31, 2013, respectively.
The Company receives income for providing services and referring customers to RBS. The Company also shares office space with certain RBS entities for which rent expense and/or income is recorded in occupancy expense. The total fee income, net of occupancy expense, for the six months ended June 30, 2014 and 2013 was $8 million and $12 million, respectively.
For the six months ended June 30, 2014 and 2013, the Company paid $333 million of common stock dividends to RBS as part of the exchange transactions described in the “Management’s Discussion and Analysis of Financial Condition and Results of Operations—Capital” included elsewhere in this prospectus. Additionally, the Company paid $35 million and $95 million of regular dividends to RBS for the six months ended June 30, 2014 and 2013, respectively.
The Company, as a matter of policy and during the ordinary course of business with underwriting terms similar to those offered to the public, has made loans to directors and executive officers and their immediate families, as well as their affiliated companies. Such loans amounted to $126 million and $78 million at June 30, 2014 and December 31, 2013, respectively.
NOTE 15—FAIR VALUE MEASUREMENTS
As discussed in Note 1 “Significant Accounting Policies” in the Company’s audited Consolidated Financial Statements included elsewhere in this prospectus, the Company measures or monitors many of its assets and liabilities on a fair value basis. Fair value is used on a recurring basis for assets and liabilities for which fair value is the required or elected measurement basis of accounting. Additionally, fair value is used on a nonrecurring basis to evaluate assets for impairment or for disclosure purposes. Nonrecurring fair value adjustments typically involve the application of lower of cost or market
F-131
Table of Contents
CITIZENS FINANCIAL GROUP, INC.
NOTES TO CONSOLIDATED FINANCIAL STATEMENTS (UNAUDITED)
accounting or write-downs of individual assets. The Company also applies the fair value measurement guidance to determine amounts reported for certain disclosures in this note for assets and liabilities not required to be reported at fair value in the financial statements.
Fair Value Option, Mortgage Loans Held for Sale
The Company elected to account for residential mortgage loans held for sale at fair value. Applying fair value accounting to the residential mortgage loans held for sale better aligns the reported results of the economic changes in the value of these loans and their related hedge instruments.
The fair value of residential loans held for sale is derived from observable mortgage security prices and includes adjustments for loan servicing value, agency guarantee fees, and other loan level attributes which are mostly observable in the marketplace. Credit risk does not significantly impact the valuation since loans are sold shortly after origination. Therefore, the Company classifies the residential mortgage loans held for sale in Level 2 of the fair value hierarchy.
The following table summarizes the difference between the aggregate fair value and the aggregate unpaid principal balance for residential mortgage loans held for sale measured at fair value:
| June 30, 2014 | December 31, 2013 | |||||||||||||||||||||||
| Aggregate Fair Value |
Aggregate Unpaid Principal |
Aggregate Fair Value Less Aggregate Unpaid Principal |
Aggregate Fair Value |
Aggregate Unpaid Principal |
Aggregate Fair Value Less Aggregate Unpaid Principal |
|||||||||||||||||||
| (in millions) | ||||||||||||||||||||||||
| Residential mortgage loans held for sale, at fair value |
$ | 173 | $ | 166 | $ | 7 | $ | 176 | $ | 173 | $ | 3 | ||||||||||||
The loans accounted for under the fair value option are initially measured at fair value when the financial asset is recognized. Subsequent changes in fair value are recognized in current earnings. The Company recognized $5 million, and $(36) million in mortgage banking noninterest income for the six months ended June 30, 2014, and 2013, respectively. Interest income on residential mortgage loans held for sale is calculated based on the contractual interest rate of the loan and is recorded in interest income.
Additional information regarding the company’s significant accounting policies for determining fair value is provided in Note 1 “Significant Accounting Policies” in the Company’s audited Consolidated Financial Statements included elsewhere in this prospectus.
Recurring Fair Value Measurements
The Company utilizes a variety of valuation techniques to measure its assets and liabilities at fair value. Following is a description of valuation methodologies used for significant assets and liabilities carried on the balance sheet at fair value on a recurring basis:
Securities AFS: The fair value of securities classified as AFS is based upon quoted prices, if available. Where observable quoted prices are available in an active market, securities are classified as Level 1 in the fair value hierarchy. Classes of instruments that are valued using this market approach include debt securities issued by the U.S. Treasury. If quoted market prices are not available, the fair value for the security is estimated by using pricing models, quoted prices of securities with similar characteristics or discounted cash flows. These instruments are classified as Level 2 because they currently trade in active markets and the inputs to the valuations are
F-132
Table of Contents
CITIZENS FINANCIAL GROUP, INC.
NOTES TO CONSOLIDATED FINANCIAL STATEMENTS (UNAUDITED)
observable. The pricing models used to value securities generally begin with market prices (or rates) for similar instruments and make adjustments based on the unique characteristics of the instrument being valued. These adjustments reflect assumptions made regarding the sensitivity of each security’s value to changes in interest rates and prepayment speeds. Classes of instruments that are valued using this market approach include residential and commercial CMOs, specified pool mortgage “pass-through” securities and other debt securities issued by U.S. government-sponsored entities and state and political subdivisions.
A significant majority of the Company’s Level 1 and 2 securities are priced using an external pricing service. The Company verifies the accuracy of the pricing provided by its primary outside pricing service on a quarterly basis. This process involves using a secondary external vendor to provide valuations for the Company’s securities portfolio for comparison purposes. Any securities with discrepancies beyond a certain threshold are researched and, if necessary, valued by an independent outside broker.
In certain cases where there is limited activity or less transparency around inputs to the valuation model, securities are classified as Level 3.
Residential loans held for sale: See the Fair Value Option discussion above.
Derivatives: The majority of the Company’s derivatives portfolio is comprised of “plain vanilla” interest rate swaps, which are traded in over-the-counter markets where quoted market prices are not readily available. For these interest rate derivatives, fair value is determined utilizing models that use primarily market observable inputs, such as swap rates and yield curves. The pricing models used to value interest rate swaps calculate the sum of each instrument’s fixed and variable cash flows, which are then discounted using an appropriate yield curve (i.e., LIBOR or OIS curve) to arrive at the fair value of each swap. The pricing models do not contain a high level of subjectivity as the methodologies used do not require significant judgment. The Company also considers certain adjustments to the modeled price which market participants would make when pricing each instrument, including a credit valuation adjustment that reflects the credit quality of the swap counterparty. The Company incorporates the effect of exposure to a particular counterparty’s credit by netting its derivative contracts with the collateral available and calculating a credit valuation adjustment on the basis of the net position with the counterparty where permitted. The determination of this adjustment requires judgment on behalf of Company management; however, the total amount of this portfolio-level adjustment is not material to the total fair value of the interest rate swaps in their entirety. Therefore, interest rate swaps are classified as Level 2 in the valuation hierarchy.
The Company’s other derivatives include foreign exchange contracts. Fair value of foreign exchange derivatives uses the mid-point of daily quoted currency spot prices. A valuation model estimates fair value based on the quoted spot rates together with interest rate yield curves and forward currency rates. Since all of these inputs are observable in the market, foreign exchange derivatives are classified as Level 2 in the fair value hierarchy.
Venture capital investments: The Company values its venture capital private equity fund investments based on its capital invested in each fund, which is adjusted by management each quarter, if necessary, to arrive at its estimate of fair value. Adjustments for a fund’s underlying investments may be based upon comparisons to public companies, industry benchmarks, current financing round pricing, earnings multiples of comparable companies, current operating performance and future expectations, or third-party valuations. Since the inputs to the valuation are difficult to independently corroborate in the marketplace, and involve a significant degree of management judgment, venture capital investments are classified as Level 3 in the fair value hierarchy.
F-133
Table of Contents
CITIZENS FINANCIAL GROUP, INC.
NOTES TO CONSOLIDATED FINANCIAL STATEMENTS (UNAUDITED)
The following table presents assets and liabilities measured at fair value, including gross derivative assets and liabilities on a recurring basis at June 30, 2014:
| Total | Level 1 | Level 2 | Level 3 | |||||||||||||
| (in millions) | ||||||||||||||||
| Securities available for sale: |
||||||||||||||||
| Mortgage-backed securities |
$ | 18,443 | $ | — | $ | 18,443 | $ | — | ||||||||
| State and political subdivisions |
10 | — | 10 | — | ||||||||||||
| Equity securities |
25 | 8 | 17 | — | ||||||||||||
| U.S. Treasury |
15 | 15 | — | — | ||||||||||||
| Residential loans held for sale |
173 | — | 173 | — | ||||||||||||
| Derivative assets: |
||||||||||||||||
| Interest rate swaps |
634 | — | 634 | — | ||||||||||||
| Foreign exchange contracts |
74 | — | 74 | — | ||||||||||||
| Other contracts |
8 | — | 8 | — | ||||||||||||
| Venture capital investments |
6 | — | — | 6 | ||||||||||||
|
|
|
|
|
|
|
|
|
|||||||||
| Total assets |
$ | 19,388 | $ | 23 | $ | 19,359 | $ | 6 | ||||||||
|
|
|
|
|
|
|
|
|
|||||||||
| Derivative liabilities: |
||||||||||||||||
| Interest rate swaps |
$ | 745 | $ | — | $ | 745 | $ | — | ||||||||
| Foreign exchange contracts |
69 | — | 69 | — | ||||||||||||
| Other contracts |
14 | — | 14 | — | ||||||||||||
|
|
|
|
|
|
|
|
|
|||||||||
| Total liabilities |
$ | 828 | $ | — | $ | 828 | $ | — | ||||||||
|
|
|
|
|
|
|
|
|
|||||||||
The following table presents assets and liabilities measured at fair value including gross derivative assets and liabilities on a recurring basis at December 31, 2013:
| Total | Level 1 | Level 2 | Level 3 | |||||||||||||
| (in millions) | ||||||||||||||||
| Securities available for sale: |
||||||||||||||||
| Mortgage-backed securities |
$ | 15,945 | $ | — | $ | 15,945 | $ | — | ||||||||
| State and political subdivisions |
10 | — | 10 | — | ||||||||||||
| Equity securities |
25 | 8 | 17 | — | ||||||||||||
| U.S. Treasury |
15 | 15 | — | — | ||||||||||||
| Residential loans held for sale |
176 | — | 176 | — | ||||||||||||
| Derivative assets: |
||||||||||||||||
| Interest rate swaps |
677 | — | 677 | — | ||||||||||||
| Foreign exchange contracts |
94 | — | 94 | — | ||||||||||||
| Other contracts |
7 | — | 7 | — | ||||||||||||
| Venture capital investments |
5 | — | — | 5 | ||||||||||||
|
|
|
|
|
|
|
|
|
|||||||||
| Total assets |
$ | 16,954 | $ | 23 | $ | 16,926 | $ | 5 | ||||||||
|
|
|
|
|
|
|
|
|
|||||||||
| Derivative liabilities: |
||||||||||||||||
| Interest rate swaps |
$ | 970 | $ | — | $ | 970 | $ | — | ||||||||
| Foreign exchange contracts |
87 | — | 87 | — | ||||||||||||
| Other contracts |
10 | — | 10 | — | ||||||||||||
|
|
|
|
|
|
|
|
|
|||||||||
| Total liabilities |
$ | 1,067 | $ | — | $ | 1,067 | $ | — | ||||||||
|
|
|
|
|
|
|
|
|
|||||||||
F-134
Table of Contents
CITIZENS FINANCIAL GROUP, INC.
NOTES TO CONSOLIDATED FINANCIAL STATEMENTS (UNAUDITED)
The changes in Level 3 assets measured at fair value on a recurring basis are summarized as follows:
| Six Months Ended June 30, | ||||||||
| 2014 | 2013 | |||||||
| (in millions) | ||||||||
| Balance as of January 1, |
$ | 5 | $ | 6 | ||||
| Purchases, issuances, sales and settlements: |
||||||||
| Sales |
— | (4 | ) | |||||
| Settlements |
— | 3 | ||||||
| Other net gains |
1 | — | ||||||
|
|
|
|
|
|||||
| Balance as of period end |
$ | 6 | $ | 5 | ||||
|
|
|
|
|
|||||
| Net unrealized gain (loss) included in net income for the period relating to assets held at period end |
$ | — | $ | — | ||||
There were no transfers among Levels 1, 2 or 3 during the six months ended June 30, 2014 and 2013.
Nonrecurring Fair Value Measurements
The following valuation techniques are utilized to measure significant assets for which the Company utilizes fair value on a nonrecurring basis:
Impaired Loans: The carrying amount of collateral-dependent impaired loans is compared to the appraised value of the collateral less costs to dispose and is classified as Level 2. Any excess of carrying amount over the appraised value is charged to the ALLL.
MSRs: MSRs do not trade in an active market with readily observable prices. MSRs are classified as Level 3 since the valuation methodology utilizes significant unobservable inputs. At June 30, 2014 the fair value is calculated using the discounted cash flow model, the model which uses assumptions, including weighted average life of 5.2 years (range of 1.7—7 years), weighted average constant prepayment rate of 13.0% (range of 9.8%—44.5%) and weighted average discount rate of 10.3% (range of 9.6%—12.6%). At December 31, 2013 the fair value is calculated using the discounted cash flow model, the model which uses assumptions, including weighted average life of 5.4 years (range of 1.8 - 7.4 years), weighted average constant prepayment rate of 13.0% (range of 9.4%—41.5%) and weighted average discount rate of 10.8% (range of 10.2%—13.1%). Refer to Note 1 “Significant Accounting Policies,” and Note 9 “Mortgage Banking,” in the Company’s audited Consolidated Financial Statements included elsewhere in this prospectus.
Foreclosed assets: Foreclosed assets consist primarily of residential properties. Foreclosed assets are carried at the lower of carrying value or fair value less costs to dispose. Fair value is based upon independent market prices or appraised values of the collateral and is classified as Level 2.
Goodwill: Goodwill is valued using unobservable inputs and is classified as Level 3. Fair value is calculated using the present value of estimated future earnings (discounted cash flow method). On a quarterly basis, the Company assesses whether or not impairment indicators are present.
The Company monitored events and circumstances during the first half of 2014 and did not observe any factors that would more likely than not reduce the fair value of one or more reporting units below its respective carrying value. Accordingly, goodwill was not tested for impairment during the first half of 2014. For additional information on the Company’s goodwill impairment
F-135
Table of Contents
CITIZENS FINANCIAL GROUP, INC.
NOTES TO CONSOLIDATED FINANCIAL STATEMENTS (UNAUDITED)
testing and the most recent goodwill impairment test, see Note 1 “Significant Accounting Policies,” Note 5 “Goodwill,” Note 19 “Fair Value Measurements” and Note 8 “Goodwill” included in the Company’s audited Consolidated Financial Statements included elsewhere in this prospectus.
The following table presents gains (losses) on assets and liabilities measured at fair value on a nonrecurring basis and recorded in earnings:
| Six Months Ended June 30, | ||||||||
| 2014 | 2013 | |||||||
| (in millions) | ||||||||
| Impaired collateral-dependent loans |
$ | (94 | ) | $ | (58 | ) | ||
| MSRs |
3 | 39 | ||||||
| Foreclosed assets |
1 | 2 | ||||||
| Goodwill impairment |
— | (4,435 | ) | |||||
The following tables present assets and liabilities measured at fair value on a nonrecurring basis:
| June 30, 2014 | ||||||||||||||||
| Total | Level 1 | Level 2 | Level 3 | |||||||||||||
| (in millions) | ||||||||||||||||
| Impaired collateral-dependent loans1 |
$ | 70 | $ | — | $ | 70 | $ | — | ||||||||
| MSRs2 |
175 | — | — | 175 | ||||||||||||
| Foreclosed assets3 |
40 | — | 40 | — | ||||||||||||
| Goodwill4 |
6,876 | — | — | 6,876 | ||||||||||||
| December 31, 2013 | ||||||||||||||||
| Total | Level 1 | Level 2 | Level 3 | |||||||||||||
| (in millions) | ||||||||||||||||
| Impaired collateral-dependent loans1 |
$ | 74 | $ | — | $ | 74 | $ | — | ||||||||
| MSRs2 |
185 | — | — | 185 | ||||||||||||
| Foreclosed assets3 |
49 | — | 49 | — | ||||||||||||
| Goodwill4 |
6,876 | — | — | 6,876 | ||||||||||||
| 1 | In the first six months of 2014, impaired loans for which collection is dependent on the loan’s collateral in the amount of $121 million were written down to $70 million, resulting in an impairment charge of $37 million, which was charged to the ALLL. In the year ended 2013, impaired loans for which collection is dependent on the loan’s collateral in the amount of $161 million were written down to their fair value of $74 million, resulting in an impairment charge of $83 million, which was charged to the ALLL. |
| 2 | In the first six months of 2014, MSRs totaling $208 million were evaluated for impairment and written down to $175 million, resulting in an impairment recapture of $3 million and a total cumulative valuation allowance of $19 million. In the year ended 2013, MSRs totaling $215 million were evaluated for impairment and written down to $185 million, resulting in an impairment (charge) of $47 million and a total cumulative valuation allowance of $23 million. |
| 3 | In the first six months of 2014, foreclosed real estate accounted for at the lower of cost or fair value less costs to sell was written down to fair value of $40 million, resulting in impairment charges of $1 million. In the year ended 2013, foreclosed real estate accounted for at the lower of cost or fair value less costs to sell was written down to fair value of $49 million, resulting in an impairment charge of $4 million. |
| 4 | In the year ended 2013, Goodwill totaling $11.3 billion was written down to its implied fair value of $6.9 billion, resulting in an impairment charge of $4.4 billion. |
F-136
Table of Contents
CITIZENS FINANCIAL GROUP, INC.
NOTES TO CONSOLIDATED FINANCIAL STATEMENTS (UNAUDITED)
Disclosures about Fair Value of Financial Instruments
Following is a description of valuation methodologies used to estimate the fair value of financial instruments for disclosure purposes (these instruments are not recorded in the financial statements at fair value):
Loans and leases: For loans and leases not recorded at fair value on a recurring basis that are not accounted for as collateral-dependent impaired loans, fair value is estimated by using one of two methods: a discounted cash flow method or a securitization method. The discounted cash flow method involves discounting the expected future cash flows using current rates which a market participant would likely use to value similar pools of loans. Inputs used in this method include observable information such as contractual cash flows (net of servicing cost) and unobservable information such as estimated prepayment speeds, credit loss exposures, and discount rates. The securitization method involves utilizing market securitization data to value the assets as if a securitization transaction had been executed. Inputs used include observable market-based MBS data and pricing adjustments based on unobservable data reflecting the liquidity risk, credit loss exposure and other characteristics of the underlying loans. The internal risk-weighted balances of loans are grouped by product type for purposes of these estimated valuations. For nonaccruing loans, fair value is estimated by discounting management’s estimate of future cash flows with a discount rate commensurate with the risk associated with such assets. Fair value of collateral-dependent loans is primarily based on the appraised value of the collateral.
Loans held for sale: Balances are loans that were transferred to loans held for sale that are reported at book value.
Securities held to maturity: The fair value of securities classified as HTM is estimated using pricing models, quoted prices of securities with similar characteristics or discounted cash flow. The pricing models used to value these securities generally begin with market prices (or rates) for similar instruments and make adjustments based on the unique characteristics of the instrument being valued. These adjustments reflect assumptions made regarding the sensitivity of each security’s value to changes in interest rates and prepayment speeds.
Other investment securities: The cost basis carrying value of other investment securities, such as FHLB stock and FRB stock, is assumed to approximate the fair value of the securities. As a member of the FHLB and FRB, the Company is required to hold FHLB and FRB stock. The stock can be sold only to the FHLB and FRB upon termination of membership, or redeemed at the FHLB’s or FRB’s sole discretion.
Deposits: The fair value of demand deposits, checking with interest accounts, regular savings and money market accounts is the amount payable on demand at the balance sheet date. The fair value of term deposits is estimated by discounting the expected future cash flows using rates currently offered for deposits of similar remaining maturities.
Deposits held for sale: Balances are deposits that were transferred to held for sale that are reported at book value.
Federal funds purchased and securities sold under agreements to repurchase, other short-term borrowed funds, and long-term borrowed funds: Rates currently available to the Company for debt of similar terms and remaining maturities are used to discount the expected cash flows of existing debt.
F-137
Table of Contents
CITIZENS FINANCIAL GROUP, INC.
NOTES TO CONSOLIDATED FINANCIAL STATEMENTS (UNAUDITED)
The following table is a summary of fair value for financial instruments not recorded at fair value in the Consolidated Financial Statements. The carrying amounts in the following table are recorded in the Consolidated Balance Sheets under the indicated captions:
| June 30, 2014 | ||||||||||||||||||||||||||||||||
| Total | Level 1 | Level 2 | Level 3 | |||||||||||||||||||||||||||||
| Carrying Value |
Fair Value |
Carrying Value |
Fair Value |
Carrying Value |
Fair Value |
Carrying Value |
Fair Value |
|||||||||||||||||||||||||
| (in millions) | ||||||||||||||||||||||||||||||||
| Financial Assets: |
||||||||||||||||||||||||||||||||
| Loans and leases |
$ | 88,829 | $ | 89,580 | $ | — | $ | — | $ | 70 | $ | 70 | $ | 88,759 | $ | 89,510 | ||||||||||||||||
| Other loans held for sale |
89 | 89 | — | — | — | — | 89 | 89 | ||||||||||||||||||||||||
| Securities held to maturity |
5,382 | 5,398 | — | — | 5,382 | 5,398 | — | — | ||||||||||||||||||||||||
| Other investment securities |
948 | 948 | — | — | 948 | 948 | — | — | ||||||||||||||||||||||||
| Financial Liabilities: |
||||||||||||||||||||||||||||||||
| Deposits |
91,656 | 91,936 | — | — | 91,656 | 91,936 | — | — | ||||||||||||||||||||||||
| Federal funds purchased and securities sold under agreements to repurchase |
6,807 | 6,830 | — | — | 6,807 | 6,830 | — | — | ||||||||||||||||||||||||
| Other short-term borrowed funds |
7,702 | 7,705 | — | — | 7,702 | 7,705 | — | — | ||||||||||||||||||||||||
| Long-term borrowed funds |
1,732 | 1,733 | — | — | 1,732 | 1,733 | — | — | ||||||||||||||||||||||||
| December 31, 2013 | ||||||||||||||||||||||||||||||||
| Total | Level 1 | Level 2 | Level 3 | |||||||||||||||||||||||||||||
| Carrying Value |
Fair Value |
Carrying Value |
Fair Value |
Carrying Value |
Fair Value |
Carrying Value |
Fair Value |
|||||||||||||||||||||||||
| (in millions) | ||||||||||||||||||||||||||||||||
| Financial Assets: |
||||||||||||||||||||||||||||||||
| Loans and leases |
$ | 85,859 | $ | 85,724 | $ | — | $ | — | $ | 74 | $ | 74 | $ | 85,785 | $ | 85,650 | ||||||||||||||||
| Other loans held for sale |
1,078 | 1,078 | — | — | — | — | 1,078 | 1,078 | ||||||||||||||||||||||||
| Securities held to maturity |
4,315 | 4,257 | — | — | 4,315 | 4,257 | — | — | ||||||||||||||||||||||||
| Other investment securities |
935 | 935 | — | — | 935 | 935 | — | — | ||||||||||||||||||||||||
| Financial Liabilities: |
||||||||||||||||||||||||||||||||
| Deposits |
86,903 | 86,907 | — | — | 86,903 | 86,907 | — | — | ||||||||||||||||||||||||
| Deposits held for sale |
5,277 | 5,277 | — | — | 5,277 | 5,277 | — | — | ||||||||||||||||||||||||
| Federal funds purchased and securities sold under agreements to repurchase |
4,791 | 4,791 | — | — | 4,791 | 4,791 | — | — | ||||||||||||||||||||||||
| Other short-term borrowed funds |
2,251 | 2,249 | — | — | 2,251 | 2,249 | — | — | ||||||||||||||||||||||||
| Long-term borrowed funds |
1,405 | 1,404 | — | — | 1,405 | 1,404 | — | — | ||||||||||||||||||||||||
NOTE 16—REGULATORY MATTERS
As a BHC, the Company is subject to regulation and supervision by the FRB. The primary subsidiaries of Citizens are its two insured depository institutions CBNA, a national banking association whose primary federal regulator is the OCC, and CBPA, a Pennsylvania-chartered savings bank regulated by the Department of Banking of the Commonwealth of Pennsylvania and supervised by the FDIC as its primary federal regulator. Under the regulatory capital adequacy guidelines of the FDICIA,
F-138
Table of Contents
CITIZENS FINANCIAL GROUP, INC.
NOTES TO CONSOLIDATED FINANCIAL STATEMENTS (UNAUDITED)
the Company and its banking subsidiaries must meet specific capital requirements. These requirements are expressed in terms of the following ratios: (1) Total Risk-Based Capital (total capital/risk-weighted on- and off-balance sheet assets); (2) Tier 1 Risk-Based Capital (tier 1 capital/risk-weighted on- and off-balance sheet assets); and (3) Tier 1 Leverage (tier 1 capital/adjusted average quarterly assets). To meet the regulatory capital requirements, the Company and its banking subsidiaries must maintain minimum Total Risk-Based Capital, Tier 1 Risk-Based Capital, and Tier 1 Leverage ratios. In addition, the Company must not be subject to a written agreement, order or capital directive with any of its regulators. Failure to meet minimum capital requirements can result in the initiation of certain actions that, if undertaken, could have a material effect on the Company’s Consolidated Financial Statements.
The following table presents capital and capital ratio information:
| FDIC Requirements | ||||||||||||||||||||||||
| Actual | Minimum Capital Adequacy |
Classification as Well Capitalized |
||||||||||||||||||||||
| Amount | Ratio | Amount | Ratio | Amount | Ratio | |||||||||||||||||||
| (dollars in millions) | ||||||||||||||||||||||||
| As of June 30, 2014 |
||||||||||||||||||||||||
| Total Capital to Risk-Weighted Assets |
$ | 16,400 | 16.2 | % | $ | 8,112 | 8.0 | % | $ | 10,140 | 10.0 | % | ||||||||||||
| Tier 1 Capital to Risk-Weighted Assets |
13,448 | 13.3 | 4,056 | 4.0 | 6,084 | 6.0 | ||||||||||||||||||
| Tier 1 Capital to Average Assets (Leverage) |
13,448 | 11.1 | 3,638 | 3.0 | 6,064 | 5.0 | ||||||||||||||||||
| As of December 31, 2013 |
||||||||||||||||||||||||
| Total Capital to Risk-Weighted Assets |
$ | 15,885 | 16.1 | % | $ | 7,891 | 8.0 | % | $ | 9,863 | 10.0 | % | ||||||||||||
| Tier 1 Capital to Risk-Weighted Assets |
13,301 | 13.5 | 3,945 | 4.0 | 5,918 | 6.0 | ||||||||||||||||||
| Tier 1 Capital to Average Assets (Leverage) |
13,301 | 11.6 | 3,433 | 3.0 | 5,721 | 5.0 | ||||||||||||||||||
In accordance with federal and state banking regulations, dividends paid by the Company’s banking subsidiaries to the Company itself are generally limited to the retained earnings of the respective banking subsidiaries unless specifically approved by the appropriate bank regulator. The Company declared and paid RBS total common stock dividends of $368 million in the six months ended June 30, 2014. There were $1.2 billion in common stock dividends declared and paid for the year ended December 31, 2013. For the six months ended June 30, 2013, the Company declared and paid RBS total common stock dividends of $428 million.
The earnings impact of goodwill impairment recognized by CBNA has put the bank subsidiary in the position of having to request specific approval from the OCC before executing capital distributions to its parent, Citizens. This requirement will be in place through the fourth quarter of 2015. As of June 30, 2014, the unconsolidated BHC had liquid assets in excess of $399 million compared to an annual interest burden on existing subordinated debt of approximately $77 million on a non-consolidated basis.
The OCC recently determined that CBNA no longer meets both conditions necessary to own a financial subsidiary. CBNA must be both well capitalized and well managed to own a financial subsidiary. A financial subsidiary is permitted to engage in a broader range of activities, similar to those of a financial holding company, than those permissible for a national bank. CBNA has two financial subsidiaries, Citizens Securities, Inc., a registered broker-dealer, and RBS Citizens Insurance Agency, Inc., a dormant entity although it continues to collect commissions on certain outstanding policies. CBNA has entered into an agreement with the OCC (the ”OCC Agreement”) pursuant to which it must
F-139
Table of Contents
CITIZENS FINANCIAL GROUP, INC.
NOTES TO CONSOLIDATED FINANCIAL STATEMENTS (UNAUDITED)
develop a remediation plan, which must be submitted to the OCC, setting forth the specific actions it will take to bring itself back into compliance with the conditions to own a financial subsidiary and the schedule for achieving that objective. Until CBNA satisfactorily addresses the deficiencies, CBNA may not consolidate its assets and liabilities with those of the financial subsidiaries for purposes of determining and reporting regulatory capital. In addition, CBNA will be subject to restrictions on its ability to acquire control or hold an interest in any new financial subsidiary and to commence new activities in any existing financial subsidiary, without the prior consent of the OCC. If CBNA fails to remediate the deficiencies within 180 days from March 13, 2014, or such longer period as the OCC may permit, it may have to divest itself of its financial subsidiaries and comply with any additional limitations or conditions on its conduct as the OCC may impose. CBNA has implemented a comprehensive enterprise-wide program that seeks to address these deficiencies.
NOTE 17—SUPPLEMENTAL CASH FLOW INFORMATION
Supplemental cash flow information is as follows:
| Six Months Ended June 30, | ||||||||
| 2014 | 2013 | |||||||
| (in millions) | ||||||||
| Supplemental cash flow information: |
||||||||
| Interest paid |
$ | 163 | $ | 250 | ||||
| Income taxes paid |
88 | 10 | ||||||
| Supplemental schedule of non-cash investing and financing activities: |
||||||||
| Due to broker for securities purchased but not settled |
$ | 87 | $ | 524 | ||||
NOTE 18—RECLASSIFICATIONS OUT OF ACCUMULATED OTHER COMPREHENSIVE INCOME
The following tables present the changes in the balances, net of taxes, of each component of OCI:
| Net Unrealized Gains (Losses) on Derivatives |
Net Unrealized Gains (Losses) on Securities |
Defined Benefit Pension Plans |
Total AOCI | |||||||||||||
| (in millions) | ||||||||||||||||
| Balance at December 31, 2012 |
$ | (240 | ) | $ | 306 | $ | (378 | ) | $ | (312 | ) | |||||
| Other comprehensive loss before reclassifications |
(139 | ) | (219 | ) | — | (358 | ) | |||||||||
| Other than temporary impairment not recognized in earnings on securities |
— | (35 | ) | — | (35 | ) | ||||||||||
| Amounts reclassified from other comprehensive income |
77 | (56 | ) | 3 | 24 | |||||||||||
|
|
|
|
|
|
|
|
|
|||||||||
| Net other comprehensive (loss) income |
(62 | ) | (310 | ) | 3 | (369 | ) | |||||||||
|
|
|
|
|
|
|
|
|
|||||||||
| Balance at June 30, 2013 |
$ | (302 | ) | $ | (4 | ) | $ | (375 | ) | $ | (681 | ) | ||||
|
|
|
|
|
|
|
|
|
|||||||||
F-140
Table of Contents
CITIZENS FINANCIAL GROUP, INC.
NOTES TO CONSOLIDATED FINANCIAL STATEMENTS (UNAUDITED)
| Net Unrealized Gains (Losses) on Derivatives |
Net Unrealized Gains (Losses) on Securities |
Defined Benefit Pension Plans |
Total AOCI | |||||||||||||
| (in millions) | ||||||||||||||||
| Balance at December 31, 2013 |
$ | (298 | ) | $ | (91 | ) | $ | (259 | ) | $ | (648 | ) | ||||
| Other comprehensive income before reclassifications |
120 | 188 | — | 308 | ||||||||||||
| Other than temporary impairment not recognized in earnings on securities |
— | (21 | ) | — | (21 | ) | ||||||||||
| Amounts reclassified from other comprehensive income |
13 | (12 | ) | 2 | 3 | |||||||||||
|
|
|
|
|
|
|
|
|
|||||||||
| Net other comprehensive income |
133 | 155 | 2 | 290 | ||||||||||||
|
|
|
|
|
|
|
|
|
|||||||||
| Balance at June 30, 2014 |
$ | (165 | ) | $ | 64 | $ | (257 | ) | $ | (358 | ) | |||||
|
|
|
|
|
|
|
|
|
|||||||||
The following table reports the amounts reclassified out of each component of OCI and into the Consolidated Statement of Operations:
| Six Months Ended June 30, | ||||||||||
| 2014 | 2013 | |||||||||
| Details about AOCI Components |
Amount Reclassified from AOCI |
Affected Line Item in the Consolidated Statements of Operations | ||||||||
| (in millions) | ||||||||||
| Reclassification adjustment for net derivative gains (losses) included in net income (loss): |
$ | 36 | $ | (22 | ) | Interest income | ||||
| (56 | ) | (98 | ) | Interest expense | ||||||
| — | (2 | ) | Other income | |||||||
|
|
|
|
|
|||||||
| (20 | ) | (122 | ) | Income before income tax expense (benefit) | ||||||
| (7 | ) | (45 | ) | Income tax expense (benefit) | ||||||
|
|
|
|
|
|||||||
| $ | (13 | ) | $ | (77 | ) | Net income (loss) | ||||
|
|
|
|
|
|||||||
| Reclassification of net securities gains (losses) to net income (loss): |
$ | 25 | $ | 94 | Securities gains, net | |||||
| (6 | ) | (4 | ) | Net impairment losses recognized in earnings | ||||||
|
|
|
|
|
|||||||
| 19 | 90 | Income before income tax expense (benefit) | ||||||||
| 7 | 34 | Income tax expense (benefit) | ||||||||
|
|
|
|
|
|||||||
| $ | 12 | $ | 56 | Net income (loss) | ||||||
|
|
|
|
|
|||||||
| Reclassification of changes related to the employee benefit plan: |
$ | (3 | ) | $ | (6 | ) | Salaries and employee benefits | |||
|
|
|
|
|
|||||||
| (3 | ) | (6 | ) | Income before income tax expense (benefit) | ||||||
| (1 | ) | (3 | ) | Income tax expense (benefit) | ||||||
|
|
|
|
|
|||||||
| $ | (2 | ) | $ | (3 | ) | Net income (loss) | ||||
|
|
|
|
|
|||||||
| Total reclassification losses |
$ | (3 | ) | $ | (24 | ) | Net income (loss) | |||
|
|
|
|
|
|||||||
F-141
Table of Contents
CITIZENS FINANCIAL GROUP, INC.
NOTES TO CONSOLIDATED FINANCIAL STATEMENTS (UNAUDITED)
The following table presents the effects to net income of the amounts reclassified out of OCI:
| Six Months Ended June 30, | ||||||||
| 2014 | 2013 | |||||||
| (in millions) | ||||||||
| Net interest income (includes $(20) and $(120) of AOCI reclassifications, respectively) |
$ | 1,641 | $ | 1,509 | ||||
| Provision for credit losses |
170 | 202 | ||||||
| Noninterest income (includes $19 and $88 of AOCI reclassifications, respectively) |
998 | 870 | ||||||
| Noninterest expense (includes $3 and $6 of AOCI reclassifications, respectively) |
1,758 | 6,073 | ||||||
|
|
|
|
|
|||||
| Income (loss) before income tax expense |
711 | (3,896 | ) | |||||
| Income tax expense (benefit) (includes $(1) and $(14) income tax net expense and (benefit) from reclassification items, respectively) |
232 | (174 | ) | |||||
|
|
|
|
|
|||||
| Net income (loss) |
$ | 479 | $ | (3,722 | ) | |||
|
|
|
|
|
|||||
NOTE 19—BUSINESS SEGMENTS
The Company is managed by its CEO on a divisional basis. The Company’s two business segments are Consumer Banking and Commercial Banking. The business segments are determined based on the products and services provided, or the type of customer served. Each division has a Vice Chairman who reports directly to the CEO. The CEO has final authority over resource allocation decisions and performance assessment. The business segments reflect this management structure and the manner in which financial information is currently evaluated by the CEO. Non-segment operations are classified as Other, which includes corporate functions, the Treasury function, the securities portfolio, wholesale funding activities, intangible assets, Community Development, Non-Core assets, and other unallocated assets, liabilities, revenues and expenses.
Segment results are determined based upon the Company’s management reporting system, which assigns balance sheet and income statement items to each of the business segments. The process is designed around the Company’s organizational and management structure and, accordingly, the results derived are not necessarily comparable with similar information published by other financial institutions. A description of each reportable segment and table of financial results is presented below.
| • | Consumer Banking—The Consumer Banking segment focuses on retail customers and small businesses with annual revenues of up to $25 million. It offers traditional banking products and services, including checking, savings, home loans, student loans, credit cards, business loans and financial management services. It also operates an indirect auto financing business, providing financing for both new and used vehicles through auto dealerships. The segment’s distribution channels include a branch network, ATMs and a work force of experienced specialists ranging from financial consultants, mortgage loan officers and business banking officers to private bankers. |
| • | Commercial Banking—The Commercial Banking segment primarily targets companies with annual revenues from $25 million to $2.5 billion and provides a full complement of financial products and solutions, including loans, leases, trade financing, deposits, cash management, foreign exchange, interest rate risk management, corporate finance and capital markets advisory capabilities. It focuses on small and middle-market companies and has dedicated |
F-142
Table of Contents
CITIZENS FINANCIAL GROUP, INC.
NOTES TO CONSOLIDATED FINANCIAL STATEMENTS (UNAUDITED)
| teams with industry expertise in government banking, not-for-profit, healthcare, technology, asset finance, franchise finance, asset-based lending, commercial real estate, private equity and sponsor finance. While the segment’s business development efforts are predominantly focused on the Company’s twelve-state core footprint, some of its specialized industry businesses also operate selectively on a national basis (such as healthcare, asset finance and franchise finance). Commercial Banking is organized by teams that target different client segments. A key component of the segment’s growth strategy is to expand its loan portfolio by originating high-quality commercial loans, which produce revenues consistent with its financial objectives and complies with its conservative credit policies. Commercial underwriting is driven by cash flow analysis supported by collateral analysis and review. The commercial lending teams offer a wide range of commercial loan products, including commercial real estate loans; working capital loans and lines of credit; demand, term and time loans; and equipment, inventory and accounts receivable financing. |
| As of and for the Six Months Ended June 30, 2014 | ||||||||||||||||
| Consumer Banking | Commercial Banking | Other | Consolidated | |||||||||||||
| (in millions) | ||||||||||||||||
| Net interest income |
$ | 1,083 | $ | 520 | $ | 38 | $ | 1,641 | ||||||||
| Noninterest income |
455 | 214 | 329 | 998 | ||||||||||||
|
|
|
|
|
|
|
|
|
|||||||||
| Total revenue |
1,538 | 734 | 367 | 2,639 | ||||||||||||
| Noninterest expense |
1,293 | 310 | 155 | 1,758 | ||||||||||||
|
|
|
|
|
|
|
|
|
|||||||||
| Profit before provision for credit losses |
245 | 424 | 212 | 881 | ||||||||||||
| Provision for credit losses |
129 | (7 | ) | 48 | 170 | |||||||||||
|
|
|
|
|
|
|
|
|
|||||||||
| Income before income tax expense |
116 | 431 | 164 | 711 | ||||||||||||
| Income tax expense |
40 | 149 | 43 | 232 | ||||||||||||
|
|
|
|
|
|
|
|
|
|||||||||
| Net income |
$ | 76 | $ | 282 | $ | 121 | $ | 479 | ||||||||
|
|
|
|
|
|
|
|
|
|||||||||
| Total Average Assets |
$ | 48,085 | $ | 37,491 | $ | 39,959 | $ | 125,535 | ||||||||
| As of and for the Six Months Ended June 30, 2013 | ||||||||||||||||
| Consumer Banking | Commercial Banking | Other | Consolidated | |||||||||||||
| (in millions) | ||||||||||||||||
| Net interest income (expense) |
$ | 1,090 | $ | 508 | $ | (89 | ) | $ | 1,509 | |||||||
| Noninterest income |
544 | 191 | 135 | 870 | ||||||||||||
|
|
|
|
|
|
|
|
|
|||||||||
| Total revenue |
1,634 | 699 | 46 | 2,379 | ||||||||||||
| Noninterest expense |
1,262 | 315 | 4,496 | 6,073 | ||||||||||||
|
|
|
|
|
|
|
|
|
|||||||||
| Profit (loss) before provision for credit losses |
372 | 384 | (4,450 | ) | (3,694 | ) | ||||||||||
| Provision for credit losses |
156 | (24 | ) | 70 | 202 | |||||||||||
|
|
|
|
|
|
|
|
|
|||||||||
| Income (loss) before income tax expense (benefit) |
216 | 408 | (4,520 | ) | (3,896 | ) | ||||||||||
| Income tax expense (benefit) |
76 | 144 | (394 | ) | (174 | ) | ||||||||||
|
|
|
|
|
|
|
|
|
|||||||||
| Net income (loss) |
$ | 140 | $ | 264 | $ | (4,126 | ) | $ | (3,722 | ) | ||||||
|
|
|
|
|
|
|
|
|
|||||||||
| Total Average Assets |
$ | 46,737 | $ | 34,897 | $ | 41,241 | $ | 122,875 | ||||||||
F-143
Table of Contents
CITIZENS FINANCIAL GROUP, INC.
NOTES TO CONSOLIDATED FINANCIAL STATEMENTS (UNAUDITED)
In addition to non-segment operations, Other includes certain reconciling items in order to translate the segment results that are based on management accounting practices into consolidated results. For example, Other includes goodwill and the associated $4.4 billion goodwill impairment charge recorded in 2013. Management accounting practices utilized by the Company as the basis for presentation for segment results include the following:
| • | FTP adjustments: The Company utilizes an FTP system to eliminate the effect of interest rate risk from the segments’ net interest income because such risk is centrally managed within the Treasury function. The FTP system credits (or charges) the segments with the economic value of the funds created (or used) by the segments. The FTP system provides a funds credit for sources of funds and a funds charge for the use of funds by each segment. The summation of the interest income/expense and FTP charges/credits for each segment is its designated net interest income. The variance between the Company’s cumulative FTP charges and cumulative FTP credits is allocated to the individual business segments. |
| • | Provision for credit losses allocations: Provision for credit losses is allocated to each business segment based on actual net charge-offs that have been recognized by the business segment. The difference between the consolidated provision for credit losses and the business segments’ net charge-offs is reflected in Other. |
| • | Income tax allocations: Income taxes are assessed to each line of business at a standard tax rate with the residual tax expense or benefit to arrive at the consolidated effective tax rate included in Other. |
| • | Expense allocations: Noninterest expenses incurred by centrally managed operations or business lines that directly support another business line’s operations are charged to the applicable business line based on its utilization of those services. |
| • | Goodwill: For impairment testing purposes, the Company allocates goodwill to its Consumer Banking and Commercial Banking reporting units. For management reporting purposes, the Company presents the goodwill balance (and any related impairment charges) in Other. |
Substantially all revenues generated and long-lived assets held by the Company’s business segments are derived from clients that reside in the United States. Neither segment earns revenue from a single external customer that represents 10 percent or more of the Company’s total revenues.
NOTE 20—SHARE-BASED COMPENSATION
RBS Group grants stock-based compensation awards to employees of the Company pursuant to its various long-term incentive plans. These plans are administered by the Group Performance and Remuneration Committee of the RBS Group Board of Directors. All stock-based compensation awards granted to employees have been settled in RBS Group shares. For more information, refer to Note 26 “Share Based Compensation,” in the Company’s audited Consolidated Financial Statements included elsewhere in this prospectus.
In March 2014, the Company granted special Initial Public Offering (“IPO”) awards. The awards were granted half in rights to receive RBS Group shares and half as a fixed convertible bond. These special IPO awards will convert into a right to receive the Company’s shares at the closing of the IPO. The special IPO awards are scheduled to vest 50% in March 2016 and 50% in March 2017, subject to certain conditions, including the occurrence of the IPO on or by December 31, 2014.
F-144
Table of Contents
CITIZENS FINANCIAL GROUP, INC.
NOTES TO CONSOLIDATED FINANCIAL STATEMENTS (UNAUDITED)
The Company awarded 9,246,927 and 6,788,959 shares to employees during the periods ended June 30, 2014 and 2013, respectively. The grant date fair value of the shares was $51 million and $32 million for the six months ended June 30, 2014 and 2013, respectively. Grant date fair value for all awards is estimated using the fair value of RBS Group shares on grant date. Compensation expense related to share based plans was $19 million and $15 million for the six months ended June 30, 2014 and 2013, respectively.
NOTE 21—EARNINGS PER SHARE
| Six Months Ended June 30, | ||||||||
| 2014 | 2013 | |||||||
| (dollars in millions, except share data) | ||||||||
| Numerator: |
||||||||
| Net income (loss) |
$ | 479 | $ | (3,722 | ) | |||
| Net income available to common shareholders |
479 | (3,722 | ) | |||||
| Denominator: |
||||||||
| Weighted-average common shares outstanding—basic |
559,998,324 | 559,998,324 | ||||||
| Weighted-average common shares outstanding—diluted |
559,998,324 | 559,998,324 | ||||||
| Earnings per common share: |
||||||||
| Basic |
$ | 0.86 | $ | (6.65 | ) | |||
| Diluted |
0.86 | (6.65 | ) | |||||
The Company had 559,998,324 shares of common stock issued and outstanding as of June 30, 2014 and 2013, after reflecting the 165,582-for-1 forward stock split that was effective on August 22, 2014. The Company’s authorized shares were increased to 1,000,000,000 on April 9, 2014.
NOTE 22—OTHER OPERATING EXPENSE
The following table presents the details of other operating expense:
| Six Months Ended June 30, | ||||||||
| 2014 | 2013 | |||||||
| (in millions) | ||||||||
| Deposit insurance |
$ | 46 | $ | 49 | ||||
| Promotional expense |
41 | 38 | ||||||
| Settlements and operating losses |
64 | 23 | ||||||
| Postage and delivery |
25 | 26 | ||||||
| Other |
141 | 126 | ||||||
|
|
|
|
|
|||||
| Total other operating expense |
$ | 317 | $ | 262 | ||||
|
|
|
|
|
|||||
NOTE 23—EXIT COSTS AND RESTRUCTURING RESERVES
In 2014, the Company began the implementation of a restructuring initiative designed to achieve operating efficiencies and reduce expense growth. As a result of this program, the Company expects to incur total restructuring costs of approximately $121 million through December 31, 2015, consisting of $41 million of employee compensation, $40 million of facilities costs and $40 million of other costs, primarily consulting and technology services. For the six months ended June 30, 2014, the Company incurred $87 million of restructuring costs, consisting of $41 million of employee compensation reported in salaries and employee benefits, $9 million of facilities costs (including $6 million of building impairment) reported in occupancy, $26 million reported in outside services, and $11 million in other operating expenses.
F-145
Table of Contents
CITIZENS FINANCIAL GROUP, INC.
NOTES TO CONSOLIDATED FINANCIAL STATEMENTS (UNAUDITED)
In 2014, as a result of the sale of retail branches located in Illinois (see Note 13 “Divestitures and Branch Assets and Liabilities Held for Sale” for further information), the Company incurred total costs of approximately $17 million for the six months ended June 30, 2014, consisting of $3 million of employee compensation reported in salaries and employee benefits, $3 million of fixed assets expenses reported in equipment, $4 million reported in outside services and $7 million reported in other operating expenses.
For segment reporting all of these restructuring costs are reported within Other. See Note 19 “Business Segments” for further information.
The following table includes the activity in the exit costs and restructuring reserves:
| Salaries & Employee Benefits |
Occupancy & Equipment |
Other | Total | |||||||||||||
| (in millions) | ||||||||||||||||
| Reserve balance as of December 31, 2012 |
$ | 3 | $ | 27 | $ | — | $ | 30 | ||||||||
| Additions |
6 | 22 | 3 | 31 | ||||||||||||
| Reversals |
(1 | ) | (4 | ) | — | (5 | ) | |||||||||
| Utilization |
(6 | ) | (21 | ) | (3 | ) | (30 | ) | ||||||||
|
|
|
|
|
|
|
|
|
|||||||||
| Reserve balance as of December 31, 2013 |
2 | 24 | — | 26 | ||||||||||||
| Additions |
44 | 12 | 48 | 104 | ||||||||||||
| Reversals |
(1 | ) | — | — | (1 | ) | ||||||||||
| Utilization |
(7 | ) | (15 | ) | (8 | ) | (30 | ) | ||||||||
|
|
|
|
|
|
|
|
|
|||||||||
| Reserve balance as of June 30, 2014 |
$ | 38 | $ | 21 | $ | 40 | $ | 99 | ||||||||
|
|
|
|
|
|
|
|
|
|||||||||
NOTE 24—SUBSEQUENT EVENTS
The Company has evaluated the impact of events that have occurred subsequent to June 30, 2014 through September 8, 2014, the date the Consolidated Financial Statements were filed with the United States Securities and Exchange Commission. Based on this evaluation, the Company has determined that none of these events were required to be recognized or disclosed in the Consolidated Financial Statements and related Notes, other than that on August 1, 2014, we declared and paid a special common dividend of $333 million to RBS and issued $333 million of 10-year subordinated debt (4.023% fixed rate subordinated debt, due 2024) to RBS Group. Refer to “Management’s Discussion and Analysis of Financial Condition and Results of Operations—Capital” included elsewhere in this prospectus for further details. On April 9, 2014, the Company approved an increase in the number of authorized shares of common stock to 1,000,000,000. On August 22, 2014, the Company declared and made effective a 165,582-for-1 forward stock split of common stock. As a result, all share and per share data have been restated to reflect the effect of the split.
F-146
Table of Contents

Table of Contents
PART II
INFORMATION NOT REQUIRED IN PROSPECTUS
| Item 13. | Other Expenses of Issuance and Distribution. |
| Amount to be paid |
||||
| Registration fee |
$518,420 | |||
| FINRA filing fee |
225,500 | |||
| Listing fee |
250,000 | |||
| Transfer agent’s fees |
3,500 | |||
| Printing and engraving expenses |
500,000 | |||
| Legal fees and expenses |
6,653,000 | |||
| Accounting fees and expenses |
1,500,000 | |||
| Blue Sky fees and expenses |
— | |||
| Miscellaneous |
2,695,000 | |||
|
|
|
|||
| Total |
$12,345,420 | |||
|
|
|
|||
Each of the amounts set forth above, other than the Registration fee and the FINRA filing fee, is an estimate.
| Item 14. | Indemnification of Directors and Officers. |
Section 145 of the Delaware General Corporation Law provides that a corporation may indemnify directors and officers as well as other employees and individuals against expenses (including attorneys’ fees), judgments, fines and amounts paid in settlement actually and reasonably incurred by such person in connection with any threatened, pending or completed actions, suits or proceedings in which such person is made a party by reason of such person being or having been a director, officer, employee or agent to the Registrant. The Delaware General Corporation Law provides that Section 145 is not exclusive of other rights to which those seeking indemnification may be entitled under any bylaw, agreement, vote of stockholders or disinterested directors or otherwise. The Registrant’s Certificate of Incorporation and Bylaws provides for indemnification by the Registrant of its directors, officers and employees to the fullest extent permitted by the Delaware General Corporation Law.
Section 102(b)(7) of the Delaware General Corporation Law permits a corporation to provide in its certificate of incorporation that a director of the corporation shall not be personally liable to the corporation or its stockholders for monetary damages for breach of fiduciary duty as a director, except for liability (i) for any breach of the director’s duty of loyalty to the corporation or its stockholders, (ii) for acts or omissions not in good faith or which involve intentional misconduct or a knowing violation of law, (iii) for unlawful payments of dividends or unlawful stock repurchases, redemptions or other distributions or (iv) for any transaction from which the director derived an improper personal benefit. The Registrant’s Certificate of Incorporation provides for such limitation of liability.
The Registrant maintains policies of insurance under which coverage is provided (a) to its directors and officers, in their respective capacities as such, against loss arising from a claim made for any actual or alleged wrongful act, and (b) to the Registrant with respect to payments which may be made by the Registrant to such officers and directors pursuant to the above indemnification provision or otherwise as a matter of law.
II-1
Table of Contents
The proposed form of Underwriting Agreement filed as Exhibit 1 to this Registration Statement provides for indemnification of directors and officers of the Registrant by the underwriters against certain liabilities. In addition, the Registrant intends to enter into indemnification agreements with its directors and officers that require the Registrant, among other things, to indemnify such persons against certain liabilities which may arise by reason of their status or service as a director or officer and to advance their expenses incurred as a result of any proceeding against them as to which they could be indemnified.
| Item 15. | Recent Sales of Unregistered Securities. |
Since three years before the date of the initial filing of this Registration Statement, the Registrant has sold the following securities without registration under the Securities Act of 1933, as amended:
| • | On September 28, 2012, the Registrant issued and sold $350,000,000 aggregate principal amount of 4.150% Fixed Rate Subordinated Notes due 2022 pursuant to Rule 144A under the Securities Act. Net proceeds to the Registrant from the sale of the notes, after deduction of the discount, was $346,391,500. Net proceeds were used for general corporate purposes. Merrill Lynch, Pierce, Fenner & Smith Incorporated and RBS Securities Inc. acted as representatives of the initial purchasers. |
| • | On June 28, 2013, the Registrant issued and sold $333,000,000 aggregate principal amount of 5.158% Fixed-to-Floating Rate Callable Subordinated Notes due 2023 pursuant to Rule 144A under the Securities Act. The principal amount of this subordinated debt was equal to a special dividend paid to RBS on the same day. Together, these actions reduced the Registrant’s common equity without reducing total regulatory capital. |
| • | On September 30, 2013, the Registrant issued and sold $333,000,000 aggregate principal amount of 4.771% Fixed Rate Subordinated Notes due 2023 pursuant to Rule 144A under the Securities Act. The principal amount of this subordinated debt was equal to a special dividend paid to RBS on the same day. Together, these actions reduced the Registrant’s common equity without reducing total regulatory capital. |
| • | On December 2, 2013, the Registrant issued and sold $334,000,000 aggregate principal amount of 4.691% Fixed Rate Subordinated Notes due 2024 pursuant to Rule 144A under the Securities Act. The principal amount of this subordinated debt was equal to a special dividend paid to RBS on the same day. Together, these actions reduced the Registrant’s common equity without reducing total regulatory capital. |
| • | On June 26, 2014, the Registrant issued and sold $333,000,000 aggregate principal amount of 4.153% Fixed Rate Subordinated Notes due 2024 pursuant to Rule 144A under the Securities Act. The principal amount of this subordinated debt was equal to a special dividend paid to RBS on the same day. Together, these actions reduced the Registrant’s common equity without reducing total regulatory capital. |
| • | On August 1, 2014, the Registrant issued and sold $333,000,000 aggregate principal amount of 4.023% Fixed Rate Subordinated Notes due 2024 pursuant to Rule 144A under the Securities Act. The principal amount of this subordinated debt was equal to a special dividend paid to RBS on the same day. Together, these actions reduced the Registrant’s common equity without reducing total regulatory capital. |
II-2
Table of Contents
| Item 16. | Exhibits and Financial Statement Schedules. |
| (a) | The following exhibits are filed as part of this Registration Statement: |
| Exhibit |
Description | |
| 1.1 | Form of Underwriting Agreement | |
| 3.1 | Form of Amended and Restated Certificate of Incorporation of the Registrant | |
| 3.2 | Form of Amended and Restated Bylaws of the Registrant | |
| 5.1 | Opinion of Davis Polk & Wardwell LLP | |
| 10.1 | Form of Separation and Shareholder Agreement between the Registrant and The Royal Bank of Scotland Group plc | |
| 10.2 | Form of Transitional Services Agreement between the Registrant and The Royal Bank of Scotland Group plc | |
| 10.3 | Form of Trademark License Agreement between the Registrant and The Royal Bank of Scotland Group plc | |
| 10.4 | Form of Registration Rights Agreement between the Registrant and The Royal Bank of Scotland Group plc | |
| 10.5 | Form of Indemnification Agreement | |
| 10.6 | Employment Agreement, dated October 1, 2013, between the Registrant and Bruce Van Saun† | |
| 10.7 | Offer Letter, dated November 6, 2013, between The Royal Bank of Scotland Group, plc and Bruce Van Saun† | |
| 10.8 | Employment Agreement, dated March 21, 2007, between RBS North America Services, Inc. and Ellen Alemany† | |
| 10.9 | Side Letter, dated March 21, 2007, between RBS North America Services, Inc. and Ellen Alemany† | |
| 10.10 | Separation and Release Agreement, dated May 13, 2013, between the Registrant, The Royal Bank of Scotland Group, plc and Ellen Alemany† | |
| 10.11 | Offer Letter, dated August 28, 2007, between RBS North America Services, Inc. and Robert D. Matthews, Jr.† | |
| 10.12 | Side Letter, dated May 17, 2010, between the Registrant and Robert D. Matthews, Jr.† | |
| 10.13 | Offer Letter, dated September 18, 2007, between RBS North America Services, Inc. and John Fawcett† | |
| 10.14 | Offer Letter, dated May 23, 2008, between the Registrant and Brad Conner† | |
| 10.15 | Offer Letter, dated September 13, 2010, between the Registrant and Nancy Shanik† | |
| 10.16 | The Royal Bank of Scotland Group, plc 2007 Executive Share Option Plan† | |
| 10.17 | Form of The Royal Bank of Scotland Group, plc 2007 Executive Share Option Plan Award Certificate† | |
| 10.18 | Amended and Restated RBS Americas Deferred Compensation Plan, effective January 1, 2009, as amended August 30, 2013† | |
| 10.19 | Amended and Restated Deferred Compensation Plan for Directors of Citizens Financial Group, Inc., effective January 1, 2009† | |
II-3
Table of Contents
| Exhibit |
Description | |
| 10.20 | Amended and Restated Citizens Financial Group, Inc. Deferred Compensation Plan, effective January 1, 2009† | |
| 10.21 | Citizens Financial Group, Inc. Executive Severance Practice† | |
| 10.22 | The Royal Bank of Scotland Group, plc 2010 Deferral Plan Rules† | |
| 10.23 | Form of The Royal Bank of Scotland Group, plc 2010 Deferral Plan Award Certificate† | |
| 10.24 | Rules of The Royal Bank of Scotland Group, plc 2010 Long Term Incentive Plan † | |
| 10.25 | Form of The Royal Bank of Scotland Group, plc 2010 Long Term Incentive Plan Award Certificate† | |
| 10.26 | Form of The Royal Bank of Scotland Group, plc 2010 Long Term Incentive Plan Award Certificate for Bruce Van Saun† | |
| 10.27 | Form of The Citizens Financial Group, Inc. Converted Equity 2010 Deferral Plan† | |
| 10.28 | Form of the Citizens Financial Group, Inc. Converted Equity 2010 Long Term Incentive Plan† | |
| 10.29 | Form of Citizens Financial Group, Inc. 2014 Omnibus Incentive Plan† | |
| 10.30 | Form of Citizens Financial Group, Inc. 2014 Non-Employee Directors Compensation Plan† | |
| 10.31 | Form of Citizens Financial Group, Inc. 2014 Non-Employee Directors Compensation Plan Award Agreement† | |
| 10.32 | Form of Citizens Financial Group, Inc. 2014 Employee Stock Purchase Plan† | |
| 10.33 | Form of Citizens Financial Group, Inc. Non-Employee Directors Compensation Policy† | |
| 10.34 | RBS Citizens Financial Group, Inc. Performance Formula and Incentive Plan† | |
| 10.35 | Form of The Royal Bank of Scotland Group, plc CFG Special (IPO) Award Certificate† | |
| 10.36 | Form of Role Based Allowance Letter† | |
| 10.37 | Supplemental Retirement Agreement, dated October 31, 1995, as amended, between Charter One Financial, Inc. and Charles J. Koch | |
| 10.38 | Form of Amended and Restated Master Service Agreement between Citizens Bank, N.A. and RBS Business Services Private LTD | |
| 10.39 | Form of Transitional Services Agreement between Citizens Bank, N.A. and RBS Global Trade Service Centre Private Limited | |
| 21.1 | Subsidiaries of the Registrant | |
| 23.1 | Consent of Deloitte & Touche LLP | |
| 23.2 | Consent of Davis Polk & Wardwell LLP (included in Exhibit 5.1) | |
| 24.1 | Power of Attorney (included on signature page to this Registration Statement) | |
| † | Previously filed. |
(b) No financial statement schedules are provided because the information called for is not required or is shown either in the financial statements or the notes thereto.
| Item 17. | Undertakings |
The undersigned hereby undertakes the following:
(a) The undersigned registrant hereby undertakes to provide to the underwriter at the closing specified in the underwriting agreement certificates in such denominations and registered in such names as required by the underwriter to permit prompt delivery to each purchaser.
II-4
Table of Contents
(b) Insofar as indemnification for liabilities arising under the Securities Act of 1933 may be permitted to directors, officers and controlling persons of the registrant pursuant to the provisions referenced in Item 14 of this Registration Statement, or otherwise, the registrant has been advised that in the opinion of the Securities and Exchange Commission such indemnification is against public policy as expressed in the Act and is, therefore, unenforceable. In the event that a claim for indemnification against such liabilities (other than the payment by the registrant of expenses incurred or paid by a director, officer or controlling person of the registrant in the successful defense of any action, suit or proceeding) is asserted by such director, officer or controlling person in connection with the securities being registered hereunder, the registrant will, unless in the opinion of its counsel the matter has been settled by controlling precedent, submit to a court of appropriate jurisdiction the question of whether such indemnification by it is against public policy as expressed in the Act and will be governed by the final adjudication of such issue.
(c) The undersigned registrant hereby undertakes that:
(1) For purposes of determining any liability under the Securities Act of 1933, the information omitted from the form of prospectus filed as part of this Registration Statement in reliance upon Rule 430A and contained in a form of prospectus filed by the Registrant pursuant to Rule 424(b)(1) or (4) or 497(h) under the Securities Act of 1933 shall be deemed to be part of this Registration Statement as of the time it was declared effective.
(2) For the purpose of determining any liability under the Securities Act of 1933, each post-effective amendment that contains a form of prospectus shall be deemed to be a new Registration Statement relating to the securities offered therein, and the offering of such securities at that time shall be deemed to be the initial bona fide offering thereof.
II-5
Table of Contents
SIGNATURES
Pursuant to the requirements of the Securities Act of 1933, the Registrant has duly caused this Registration Statement to be signed on its behalf by the undersigned, thereunto duly authorized, in the City of Stamford, State of Connecticut, on the 8 day of September, 2014.
| CITIZENS FINANCIAL GROUP, INC. | ||
| By: | /s/ Bruce Van Saun | |
| Name:Bruce Van Saun | ||
| Title: Chairman and Chief Executive Officer | ||
KNOW ALL MEN BY THESE PRESENTS, that each person whose signature appears below constitutes and appoints Bruce Van Saun and John Fawcett, and each of them, his or her true and lawful attorneys-in-fact and agents, with full power to act separately and full power of substitution and resubstitution, for him or her and in his or her name, place and stead, in any and all capacities, to sign any and all amendments (including post-effective amendments) to this registration statement and all additional registration statements pursuant to Rule 462(b) of the Securities Act of 1933, as amended, and to file the same, with all exhibits thereto, and all other documents in connection therewith, with the Securities and Exchange Commission, granting unto each said attorney-in-fact and agent full power and authority to do and perform each and every act in person, hereby ratifying and confirming all that said attorneys-in-fact and agents or either of them or his or her or their substitute or substitutes may lawfully do or cause to be done by virtue hereof.
Pursuant to the requirements of the Securities Act of 1933, as amended, this registration statement has been signed by the following persons in the capacities and on the dates indicated.
| Signature |
Title |
Date | ||
| /s/ Bruce Van Saun Bruce Van Saun |
Chairman and Chief Executive Officer (principal executive officer) |
September 8, 2014 | ||
| * Mark Casady |
Director |
September 8, 2014 | ||
| * Anthony Di Iorio |
Director |
September 8, 2014 | ||
| * Robert Gillespie |
Director |
September 8, 2014 | ||
| * William P. Hankowsky |
Director |
September 8, 2014 | ||
| * Howard W. Hanna III |
Director |
September 8, 2014 | ||
| /s/ Leo I. Higdon Leo I. Higdon |
Director |
September 8, 2014 | ||
| * Charles J. Koch |
Director |
September 8, 2014 | ||
II-6
Table of Contents
| Signature |
Title |
Date | ||
| * Robert D. Matthews, Jr. |
Director |
September 8, 2014 | ||
| * Arthur F. Ryan |
Director |
September 8, 2014 | ||
| * Shivan S. Subramaniam |
Director |
September 8, 2014 | ||
| * Wendy A. Watson |
Director |
September 8, 2014 | ||
| * Marita Zuraitis |
Director |
September 8, 2014 | ||
| * John Fawcett |
Executive Vice President and |
September 8, 2014 | ||
| * Ronald S. Ohsberg |
Executive Vice President and Controller |
September 8, 2014 | ||
| *By: | /s/ Bruce Van Saun | |
| Name:Bruce Van Saun | ||
| Title: Attorney in Fact |
II-7
Table of Contents
EXHIBIT INDEX
| Exhibit |
Description | |
| 1.1 | Form of Underwriting Agreement | |
| 3.1 | Form of Amended and Restated Certificate of Incorporation of the Registrant | |
| 3.2 | Form of Amended and Restated Bylaws of the Registrant | |
| 5.1 | Opinion of Davis Polk & Wardwell LLP | |
| 10.1 | Form of Separation and Shareholder Agreement between the Registrant and The Royal Bank of Scotland Group plc | |
| 10.2 | Form of Transitional Services Agreement between the Registrant and The Royal Bank of Scotland Group plc | |
| 10.3 | Form of Trademark License Agreement between the Registrant and The Royal Bank of Scotland Group plc | |
| 10.4 | Form of Registration Rights Agreement between the Registrant and The Royal Bank of Scotland Group plc | |
| 10.5 | Form of Indemnification Agreement | |
| 10.6 | Employment Agreement, dated October 1, 2013, between the Registrant and Bruce Van Saun† | |
| 10.7 | Offer Letter, dated November 6, 2013, between The Royal Bank of Scotland Group, plc and Bruce Van Saun† | |
| 10.8 | Employment Agreement, dated March 21, 2007, between RBS North America Services, Inc. and Ellen Alemany† | |
| 10.9 | Side Letter, dated March 21, 2007, between RBS North America Services, Inc. and Ellen Alemany† | |
| 10.10 | Separation and Release Agreement, dated May 13, 2013, between the Registrant, The Royal Bank of Scotland Group, plc and Ellen Alemany† | |
| 10.11 | Offer Letter, dated August 28, 2007, between RBS North America Services, Inc. and Robert D. Matthews, Jr.† | |
| 10.12 | Side Letter, dated May 17, 2010, between the Registrant and Robert D. Matthews, Jr.† | |
| 10.13 | Offer Letter, dated September 18, 2007, between RBS North America Services, Inc. and John Fawcett† | |
| 10.14 | Offer Letter, dated May 23, 2008, between the Registrant and Brad Conner† | |
| 10.15 | Offer Letter, dated September 13, 2010, between the Registrant and Nancy Shanik† | |
| 10.16 | The Royal Bank of Scotland Group, plc 2007 Executive Share Option Plan† | |
| 10.17 | Form of The Royal Bank of Scotland Group, plc 2007 Executive Share Option Plan Award Certificate† | |
| 10.18 | Amended and Restated RBS Americas Deferred Compensation Plan, effective January 1, 2009, as amended August 30, 2013† | |
| 10.19 | Amended and Restated Deferred Compensation Plan for Directors of Citizens Financial Group, Inc., effective January 1, 2009† | |
II-8
Table of Contents
| Exhibit |
Description | |
| 10.20 | Amended and Restated Citizens Financial Group, Inc. Deferred Compensation Plan, effective January 1, 2009† | |
| 10.21 | Citizens Financial Group, Inc. Executive Severance Practice† | |
| 10.22 | The Royal Bank of Scotland Group, plc 2010 Deferral Plan Rules† | |
| 10.23 | Form of The Royal Bank of Scotland Group, plc 2010 Deferral Plan Award Certificate† | |
| 10.24 | Rules of The Royal Bank of Scotland Group, plc 2010 Long Term Incentive Plan † | |
| 10.25 | Form of The Royal Bank of Scotland Group, plc 2010 Long Term Incentive Plan Award Certificate† | |
| 10.26 | Form of The Royal Bank of Scotland Group, plc 2010 Long Term Incentive Plan Award Certificate for Bruce Van Saun† | |
| 10.27 | Form of The Citizens Financial Group, Inc. Converted Equity 2010 Deferral Plan† | |
| 10.28 | Form of the Citizens Financial Group, Inc. Converted Equity 2010 Long Term Incentive Plan† | |
| 10.29 | Form of Citizens Financial Group, Inc. 2014 Omnibus Incentive Plan† | |
| 10.30 | Form of Citizens Financial Group, Inc. 2014 Non-Employee Directors Compensation Plan† | |
| 10.31 | Form of Citizens Financial Group, Inc. 2014 Non-Employee Directors Compensation Plan Award Agreement† | |
| 10.32 | Form of Citizens Financial Group, Inc. 2014 Employee Stock Purchase Plan† | |
| 10.33 | Form of Citizens Financial Group, Inc. Non-Employee Directors Compensation Policy† | |
| 10.34 | RBS Citizens Financial Group, Inc. Performance Formula and Incentive Plan† | |
| 10.35 | Form of The Royal Bank of Scotland Group, plc CFG Special (IPO) Award Certificate† | |
| 10.36 | Form of Role Based Allowance Letter† | |
| 10.37 | Supplemental Retirement Agreement, dated October 31, 1995, as amended, between Charter One Financial, Inc. and Charles J. Koch | |
| 10.38 | Form of Amended and Restated Master Service Agreement between Citizens Bank, N.A. and RBS Business Services Private LTD | |
| 10.39 | Form of Transitional Services Agreement between Citizens Bank, N.A. and RBS Global Trade Service Centre Private Limited | |
| 21.1 | Subsidiaries of the Registrant | |
| 23.1 | Consent of Deloitte & Touche LLP | |
| 23.2 | Consent of Davis Polk & Wardwell LLP (included in Exhibit 5.1) | |
| 24.1 | Power of Attorney (included on signature page to this Registration Statement) | |
| † | Previously filed. |
II-9