Attached files
| file | filename |
|---|---|
| 8-K - 8-K - KEYCORP /NEW/ | d783054d8k.htm |
| KeyCorp
Beth Mooney
Chairman and
Chief Executive Officer
Barclays 2014 Global Financial Services Conference
September 8, 2014
Don Kimble
Chief Financial Officer
Exhibit 99.1 |
| 2
FORWARD-LOOKING STATEMENTS AND ADDITIONAL
INFORMATION DISCLOSURE
This presentation contains forward-looking statements, including statements
about our financial condition, results of operations, asset quality trends,
capital
levels
and
profitability.
Forward-looking
statements
can
often
be
identified
by
words
such
as
“outlook,”
“goal,”
“objective,”
“plan,”
“expect,”
“anticipate,”
“intend,”
“project,”
“believe,”
or “estimate.”
Forward-looking statements represent management’s current expectations
and forecasts regarding future events. If underlying assumptions prove to be
inaccurate or unknown risks or uncertainties arise, actual results could vary
materially from these projections or expectations. Risks and uncertainties
include but are not limited to: (1) deterioration of commercial real estate market fundamentals; (2) declining asset prices; (3)
adverse changes in credit quality trends; (4) changes in local, regional and
international business, economic or political conditions; (5) the extensive
and increasing regulation of the U.S. financial services industry; (6) increasing
capital and liquidity standards under applicable regulatory rules; (7)
unanticipated changes in our liquidity position, including but not limited to,
changes in the cost of liquidity, our ability to enter the financial markets and
to secure alternative funding sources; (8) our ability to receive dividends from
our subsidiary, KeyBank; (9) downgrades in our credit ratings or those
of
KeyBank;
(10)
operational
or
risk
management
failures
by
us
or
critical
third-parties;
(11)
breaches
of
security
or
failures
of
our
technology
systems
due
to
technological
or
other
factors
and
cybersecurity
threats;
(12)
adverse
judicial
proceedings;
(13)
the
occurrence
of
natural
or
man-made
disasters or conflicts or terrorist attacks; (14) a reversal of the U.S. economic
recovery due to economic, political or other shocks; (15) our ability to
anticipate interest rate changes and manage interest rate risk; (16) deterioration
of economic conditions in the geographic regions where we operate; (17)
the soundness
of
other
financial
institutions;
(18)
our
ability
to
attract
and
retain
talented
executives
and
employees,
to
effectively
sell
additional
products
or
services
to
new
or
existing
customers,
and
to
manage
our
reputational
risks;
(19)
our
ability
to
timely
and
effectively
implement
our
strategic initiatives; (20) increased competitive pressure due to industry
consolidation; (21) unanticipated adverse effects of acquisitions and
dispositions of assets or businesses; and (22) our ability to develop and
effectively use the quantitative models we rely upon in our business planning.
We provide greater detail regarding these factors in our 2013 Form 10-K and
subsequent filings, which are available online at www.key.com/ir and
www.sec.gov. Forward-looking statements speak only as of the date they are made
and Key does not undertake any obligation to update the forward- looking
statements to reflect new information or future events. This
presentation
also
includes
certain
Non-GAAP
financial
measures
related
to
“tangible
common
equity,”
“Tier
1
common
equity,”
“pre-provision
net
revenue,”
and
“cash
efficiency
ratio.”
Management
believes
these
ratios
may
assist
investors,
analysts
and
regulators
in
analyzing
Key’s
financials.
Although Key has procedures in place to ensure that these measures are calculated
using the appropriate GAAP or regulatory components, they have
limitations
as
analytical
tools
and
should
not
be
considered
in
isolation,
or
as
a
substitute
for
analysis
of
results
under
GAAP.
For
more
information on these calculations and to view the reconciliations to the most
comparable GAAP measures, please refer to the Appendix to this presentation
or our most recent Form 10-Q filing. |
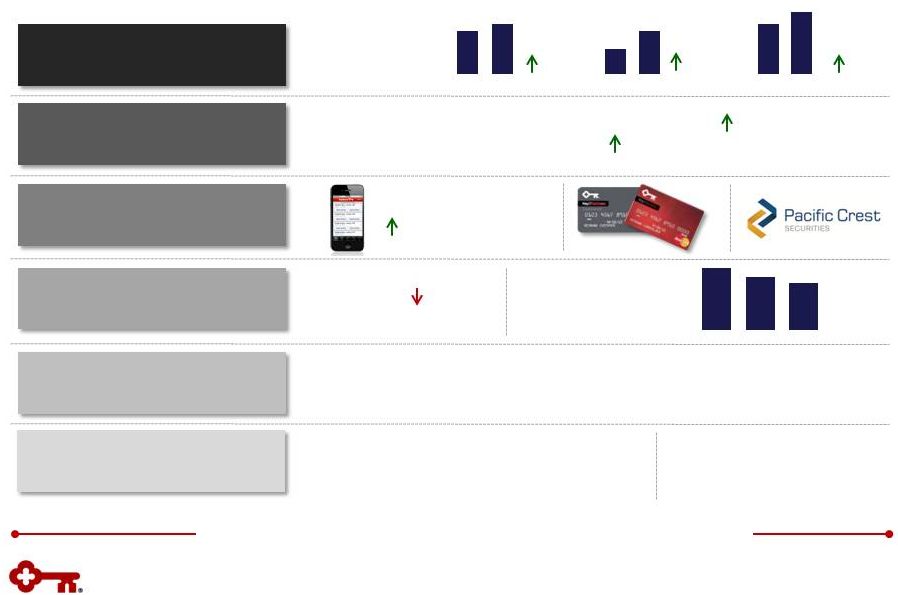 3
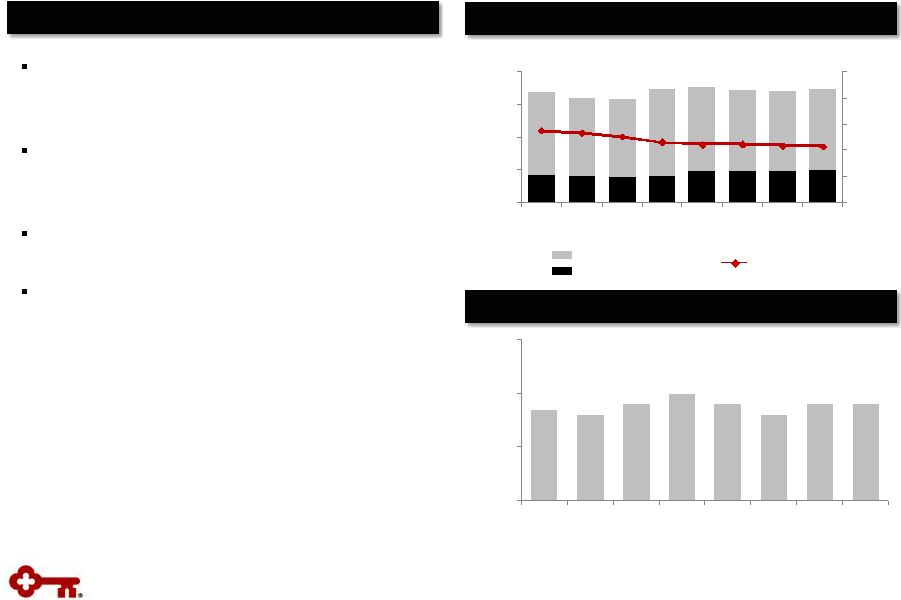
Solid Progress in 2014
Focused on continuing to execute and drive results
Grew organically: acquired and
expanded relationships
Improved productivity
Invested in businesses
Reduced expenses and improved
efficiency
Managed risk
Returned and managed capital
Average balance
growth:
Total loans
6%
CF&A loans
13%
Total deposits
(a)
2%
•
Community Bank:
2Q14
consumer sales per FTE per day
30% from prior year
•
Corporate Bank:
2Q14 revenue per FTE 11% from 2Q12
A stronger, more targeted and focused Key
2Q14 mobile usage
(b)
:
32% from prior year
•
Expenses 3%
2Q14 YTD vs. prior year
•
Cash efficiency
ratio,
ex. Charges
:
2Q12
2Q13
2Q14
69%
65%
63%
Note: Graphs not to scale
(a) Excludes deposits in foreign office
(b) Usage defined as active client log-in during the
preceding month (c) Excludes efficiency initiative
charges •
Strong
asset
quality
performance
vs.
peers
NPA
ratio
top
of
peer
group
•
Higher
quality
new
business
originations
compared
to
overall
portfolio
•
Maintained peer-leading capital levels
•
Executing on 2014 capital plan:
$542 MM in
share repurchases and an 18% increase in the
quarterly common share dividend
•
2014 payout:
estimated to
be among the highest in
peer
group
for
2
nd
consecutive year
2Q13
2Q14
2Q13
2Q14
2Q13
2Q14
(c)
:
: |
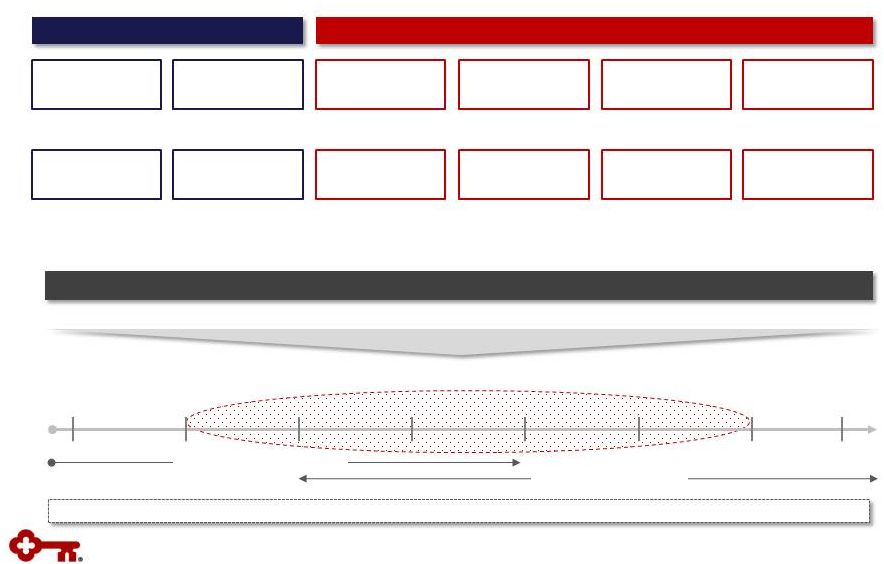 Cross-business collaboration provides additional opportunities across the
franchise Business Model: Aligned and Targeted
Traditional Bank Products
Capital Markets Capabilities
Deposits & payments
Loans
Wealth management &
private banking
Equipment
finance
Commercial mortgage
banking
Derivatives & foreign
exchange
Equity capital markets
Equity research
M&A /
financial sponsors /
leveraged finance
Investment grade &
high-yield debt
Loan syndications
Public finance
$3
$50
$1,500
$2,000
Commercial client revenue size ($MM)
$25
$100
$250
$500
Community Bank
Corporate Bank
Consumer
Energy Healthcare Industrial
Public Sector Real
Estate Technology Targeted
industries 4
Local delivery of broad product set and industry expertise
Differentiated platform with depth and maturity
Competitive advantage
6% Y-o-Y average loan
growth
$40 B in AUM
$66 B deposits at 18 bps
#7 largest bank-owned
equipment finance co.
Note: Data as of 2Q14 unless otherwise noted; YTD statistics through 2Q14
(a)
Source: Monitor 100; ranking based on net assets as of FY13
(b)
Source: Mortgage Bankers Association FY13 rankings
#3 commercial mortgage
servicer (master/primary)
Over 100 M&A deals
completed since 2011
85 transactions YTD,
raising $58 B
Rates, commodity &
currency solutions
111 transactions YTD,
raising $29 B
33 transactions YTD,
raising $14 B
550 companies under
coverage
55 transactions YTD,
raising $18 B
(b)
(a) |
 5
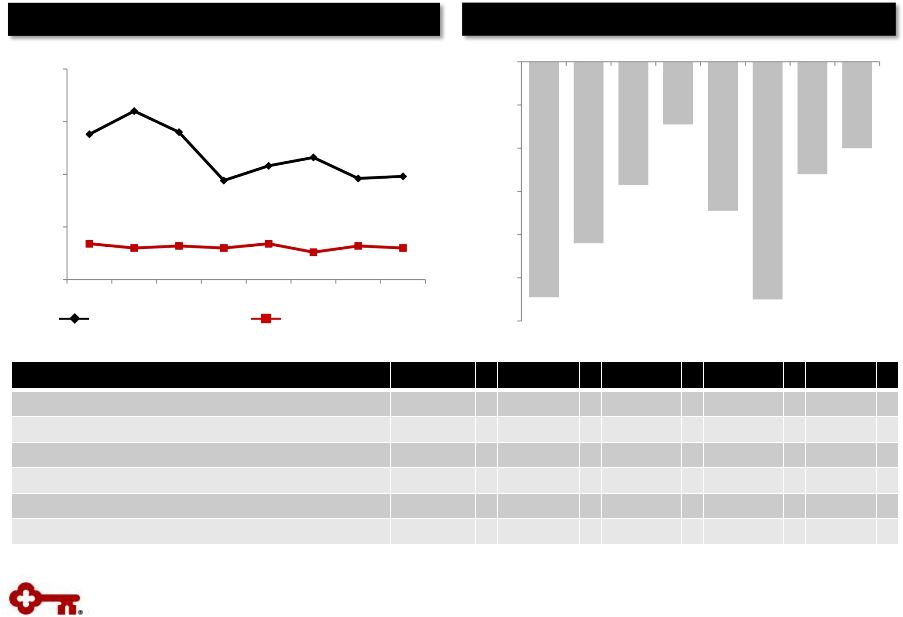
Business Model: Growing and Taking Share
Winning with Clients
Key’s business model creates a competitive advantage with targeted clients and
has enabled us to take market share
Key
Key:
Investment
Banking
and
Debt
Placement
Fees
(b)
U.S.
Commercial
Banks
(c)
Commercial
and
Industrial
Loans
(a)
%
change
vs.
2Q11:
(a)
Balances are period-end
(b)
Data represents LTM, the twelve preceding months; 3Q11 represents annualized YTD
fees (c)
Source: Federal Reserve H8 report dated August 15, 2014
Commercial and
Industrial
Loans
(a)
:
% change vs. 2Q11
Investment Banking and
Debt Placement Fees
(b)
:
LTM; $ in millions
2014
2014
2014
has been acquired by
Sell-Side Advisor
Sell-Side Advisor
2014
2014
2014
$300,000,000
Senior Notes
Joint Bookrunner
a portfolio company of
$249,850,000
Senior Secured
Credit Facilities
Joint Lead Arranger,
Joint Bookrunner &
Administrative Agent
2014
2014
2014
$42,550,000
Follow-On Offering
Joint Bookrunner
$217,260,000
Follow-On Offering
Joint Bookrunner
Joint Lead Arranger,
Joint Bookrunner &
Administrative Agent
$259,000,000
Senior Secured
Credit Facilities
has been acquired by
capitalized with significant
investments from
Sell-Side Advisor
has been acquired by
$241,000,000
First Lien
Credit Facilities
Broad Street
Energy Partners
Joint Lead Arranger,
Joint Bookrunner &
Administrative Agent
a portfolio company of
$100
$150
$200
$250
$300
$350
$400
0%
10%
20%
30%
40%
50%
60% |
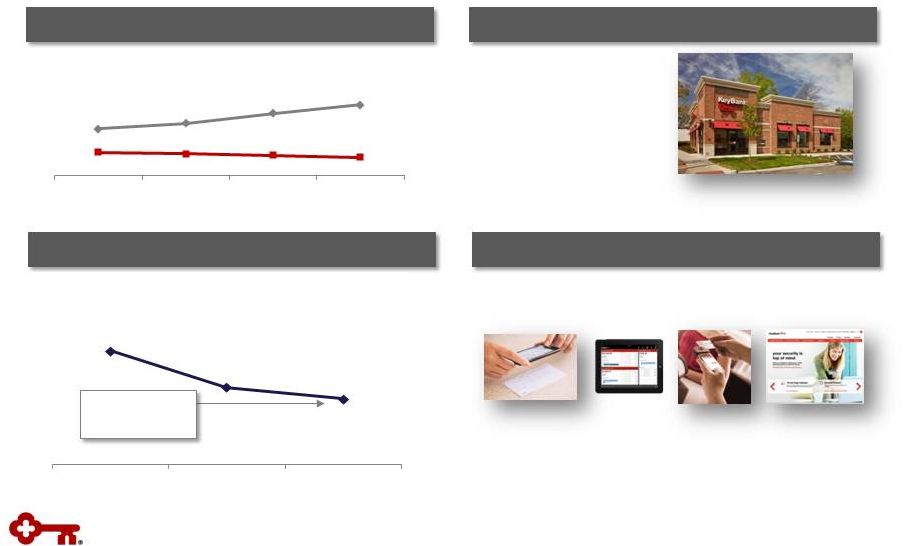 6
Channel Optimization: Redefining Convenience
Multi-channel delivery, with investment in digital channels and redefined support
of branches, aligns with changing client preferences
Branches Important to Clients
Direct, positive impact
•
Realigning Physical Network
Consolidating branches, aligned with changing
client behavior and market dynamics
Changing Client Behavior
Branch count
down 7% from
4Q12
Investing in Digital Channels
Branch transactions
Online/mobile transactions
3 yr. CAGR: +9%
3 yr. CAGR: (3)%
Investments tied to value proposition: providing
real time solutions with ease, value and
expertise •
Mobile payments
•
Online targeting and sales
•
Account opening tools
•
Rewards platform
•
Financial analytics
•
Alerts and notifications
•
Enhanced security and
interface
#1 sales generator
•
Strengthen personal and
commercial client relationships
across our franchise
Online and mobile transactions now exceed branch
transactions by 2x
4Q12
4Q13
2Q14
2010
2011
2012
2013
1,088
1,028
1,009 |
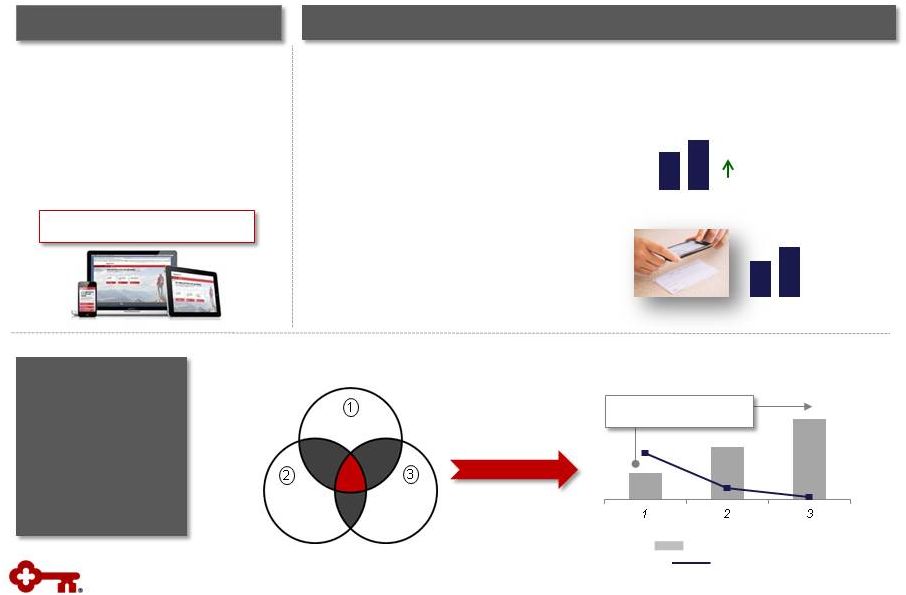 Hassle-Free Checking
•
•
Mobile Check Deposit
•
7
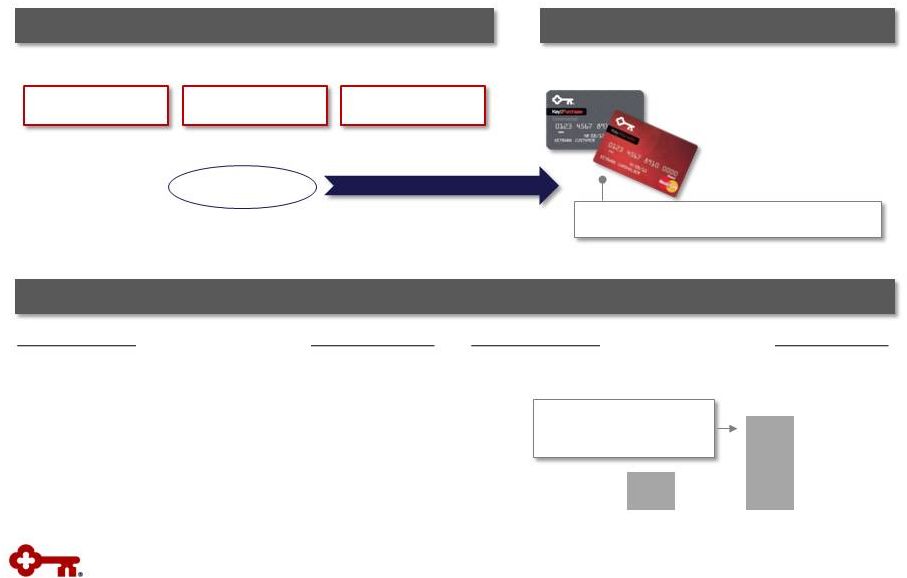
Consumer Products: Strengthening Our Offering
Well-designed and delivered products build engaged client relationships
What We Provide
Recent Investments and New Products
•
Deposit products
•
Debit card
•
Credit card
•
Loans and lines of credit
•
Investing
•
Online and mobile banking
•
Multi-channel delivery
Expanding
Relationships
Credit Card
•
•
Credit card sales:
22% 2Q14 vs. 2Q13
Note: Graphs not to scale
(a)
Mobile deposit
growth
rate
(a)
: 21%
Clients with a full relationship have higher
revenue and a lower attrition rate
Client revenue
3x higher
# of Needs Fulfilled (Checking, Savings, Borrowing)
Checking
Savings/
Investments
Borrowing
Targeting full relationship potential with three
primary client needs
Avg. annual revenue per client
Avg. attrition rate
Ease, value and expertise
Linked with a comprehensive
rewards platform
Provides competitive functionality, aligned with
trend of increased mobile usage
Strengthens core payments relationship offering
Strong sales growth
Promotes Key’s ease, value and expertise to acquire and expand new
relationships Early results: solid demand and sales volume
Compounded quarterly growth rate of mobile deposit transaction volume: 3Q13
through 2Q14 |
 8
Commercial Payments: Accelerating Growth
Client-focused model and investments provide opportunity for accelerated
growth What We Provide
Opportunity for Growth
Monetizing Investments
Working capital, efficiency, information and risk mitigation
Receivables
Payables
Foreign Exchange &
International
•
Check
•
ACH
•
Purchase card
•
Prepaid card
•
Consolidated payables
•
Foreign exchange
•
Letters of credit
•
Capitalizing on shift from paper to
electronic transactions
Purchase and Prepaid Cards: Launched in 1Q14
•
Opportunity to acquire and
expand relationships
Recent win: prepaid card issuer for the state of Ohio
Commercial clients with payment products are more
profitable
Average annual client
profitability 2.5x higher with a
payments relationship
No payments
relationship
With a payments
relationship
•
Align resources against high value activities
•
Improve targeting and productivity of sales force
•
Enhance overall productivity through improved process and
channel management
•
Continued
investment
in
the
business:
product
and
people
•
Lockbox
•
Remote deposit
•
Merchant acquiring
•
Integrated
receivables
Areas of Focus
Client Profitability |
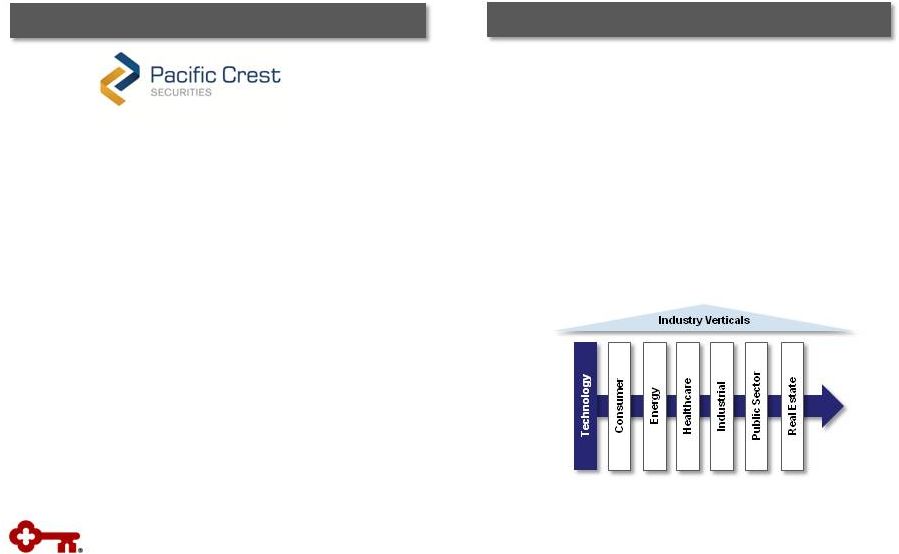 Strategic Acquisition: Leading Technology Platform
•
Industry-focused firm covering high growth
technology sub-verticals
•
Comprehensive platform aligned with Key’s
business model
-
Equity research
-
Sales and trading
-
Investment banking
•
Recognized as a leading research and capital
markets provider across technology sub-verticals
-
#1 ranked Technology Equity Sales Coverage for the
past 6 years
(a)
-
#2 ranked for Best Sales Professional Support
(b)
-
Top 10 Greatest Knowledge of Industries/
Companies
(b)
•
Accelerates growth and impact in the market,
consistent with Key’s strategy
•
Adds new expertise and clients while driving
synergies across the platform
•
Provides the opportunity to expand new and
existing client relationships
-
Delivers breadth of Key platform to acquired
relationships
-
Capitalizes on convergence of technology across
other industry verticals
Note: Acquisition subject to regulatory approval and customary closing conditions;
expected closing date: third quarter 2014 (a)
2014 Greenwich Small / Mid-cap Rankings
(b)
2014 Greenwich All U.S. institutions Rankings
Underscores Key’s commitment to be the leading corporate and investment bank
serving middle market companies
9
Expected Benefits
Highlights |
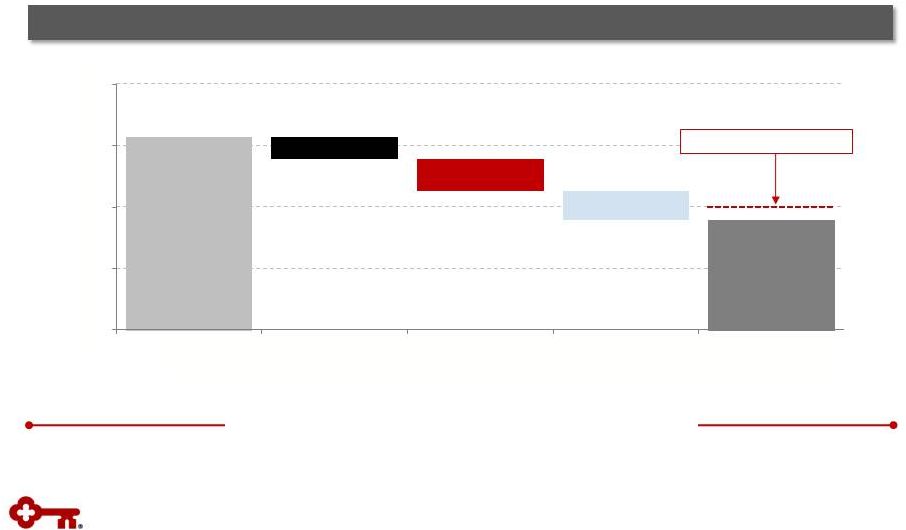
 Continued cost savings enable investments and offset
normal expense growth
Y-o-Y: low to mid-
single digit % decline
10
Expenses: Culture of Continuous Improvement
Reducing expenses while investing in our businesses for growth
$ in millions
FY13
FY14
Outlook
Noninterest Expense
Outlook
Continuous Improvement
Expenses down 7%,
ex. charges
(a)
Note: Noninterest expense outlook graph not to scale
(a) Excludes efficiency and pension settlement charges
$2.8 B
•
Reducing
occupancy
costs:
Corporate
square
footage
11%
over
the
last
four
years
•
Right-sizing:
Rationalized
fixed
income
trading
platform
to
align
with
opportunity:
headcount
20%
Community Bank FTE 13% from year-end 2012, while
client-facing FTE are 6%
•
Improving
operational
effectiveness:
Lean
Six
Sigma
practices
implemented
throughout
organization
Plans to remove an
additional 17% by 2016
Redefining end-to-end credit processes to
reduce duplication and identify cost savings
Efficiency and pension settlement charges
$550
$600
$650
$700
$750
4Q12
4Q13
2Q14 |
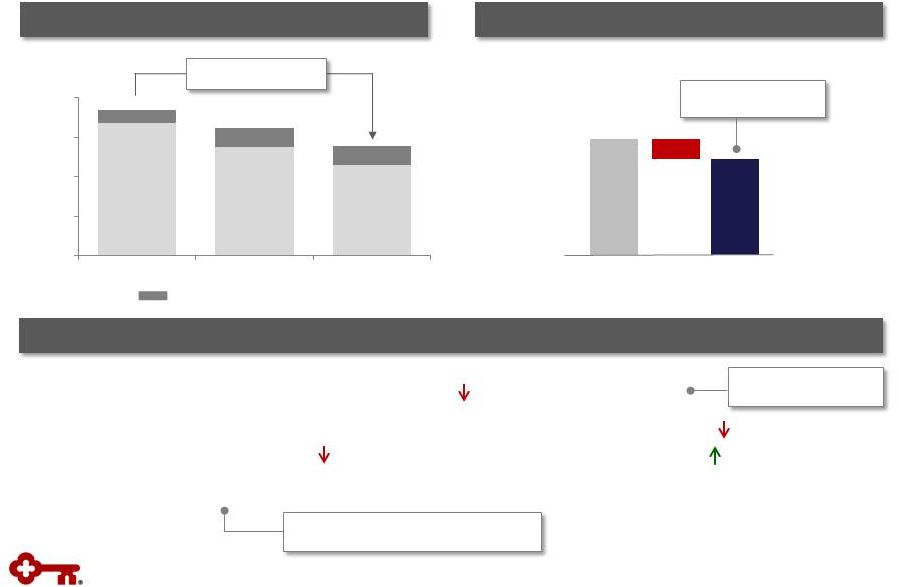
 11
Efficiency Ratio: Driving to 60% and Below
Business plans and macroeconomic environment provide path to an
efficiency ratio below 60%
Cash
Efficiency
Ratio
(a)
Outlook
(a)
Non-GAAP measure: see Appendix for reconciliation
(b)
Assumes implied forward curve
Long-term, committed to moving below 60%
(b)
50%
55%
60%
65%
70%
2Q14
Business
Growth, Expense Savings
Net of Investments
Rising Rate Benefit
Long-term Target: <60%
2-3 year outlook: 60% |
 12
Risk Discipline
Enterprise-wide risk management approach drives quality
Targeted, Relationship-based Approach
Strong Asset Quality
•
Target specific segments and sectors where we
have expertise
•
Execute rigorous and disciplined sales approach
•
Clearly defined and well understood risk appetite
and tolerances
•
Risk management principles applied actively
Net Charge-offs to Average Loans
Early resolution through the credit cycle
Key
Peer Median
(a)
(a)
Source:
SNL;
Peers
include
BBT,
CMA,
FITB,
FHN,
HBAN,
MTB,
PBCT,
PNC,
RF,
STI,
USB
and
ZION
Over the past 15 quarters, Key
has been approximately 25%
lower than peer median
Nonperforming Assets
Key NPAs
NPAs down
44% from 4Q12
Peer Median
(a)
NPAs, % of Assets
Key NPAs, % of Assets
0.0%
1.0%
2.0%
3.0%
4.0%
$735
$531
$410
0.00%
0.50%
1.00%
1.50%
$0
$200
$400
$600
$800
4Q12
4Q13
2Q14 |
 13
Disciplined Capital Management
Strong Capital Position
Peer-leading Return
Capital
Priorities
Organic
Growth
Dividends
Share
Repurchases
Opportunistic
Growth
Disciplined in how we manage, invest, deploy and return our strong capital
position Tier 1 Common Equity
(a)
(a)
Non-GAAP measure: see Appendix for reconciliations
(b)
Includes peer banks participating in the 2013 CCAR or CapPR process with the
Federal Reserve: BBT, CMA, FITB, HBAN, MTB, PNC, RF, STI, USB and ZION 10.7%
under Basel III Regulatory Capital Rules Book Value per Share
8%
from 4Q12
2014 Capital Actions
•
Increased quarterly common share dividend by 18% to
$.065
•
Repurchased ~$250 MM shares in 1H14
2014 payout estimated to be >80%, among the highest in
our peer group for the second consecutive year
2013 Total Shareholder Payout
(b)
Peers
11.36%
11.22%
11.25%
4Q12
4Q13
2Q14
76%
0%
20%
40%
60%
80%
$10.78
$11.25
$11.65
4Q12
4Q13
2Q14 |
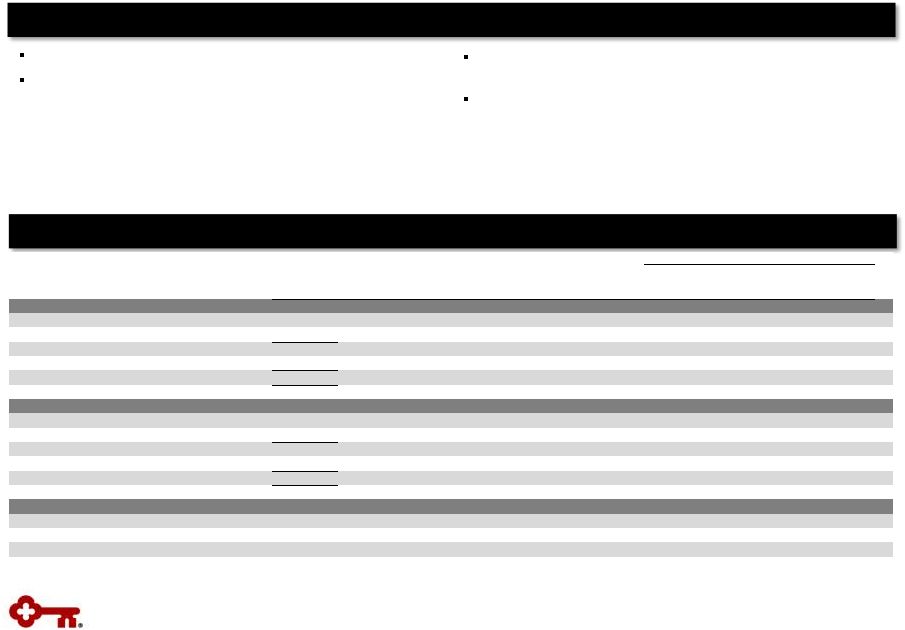
 Disciplined Capital Management
Risk Management
Positive Operating Leverage
Focused Forward
Key is well-positioned to grow and improve returns
Focused on executing our strategy and making progress on our commitments
14 |
 Appendix
15 |
 •
Supporting businesses with
technology development
•
Driving talent management to
improve productivity
Focused on Driving Positive Operating Leverage
Revenue Growth
Expense Savings
Community
Bank
Corporate
Bank
•
Improving sales productivity
•
Strengthening product offering:
Hassle-Free
•
Enhancing online and mobile
channels
•
Optimizing branch channel
•
Driving greater efficiencies through
back and middle-office processes
Enterprise
•
Adding senior bankers:
existing
industry expertise and relationships
•
Strengthening commercial payment
product capabilities
•
Investing in technology vertical:
Pacific Crest acquisition
•
Exiting international leasing
originations and reducing related cost
structure
•
Variablizing cost:
utilization of third-
party partners
•
Rationalization of fixed income trading
platform
•
Improving operational effectiveness:
Lean Six Sigma, variablizing costs
•
Reducing occupancy costs
•
Right-sizing support activities
16
Executing action plans across our organization
Driving consumer sales
per
FTE
per
day:
up
30%
from prior year
Aggressive campaign to
add bankers:
relationship managers
up
15%
from
prior
year
(a)
Data as of 2Q14 unless otherwise noted
(a)
Includes impact of announced acquisition of Pacific Crest Securities, which is
subject to regulatory approval and customary closing conditions; expected closing
date: third quarter 2014
Reducing occupancy:
plans to remove 17% of
corporate square footage
by 2016 |
 Actively Managing Businesses
Consumer and commercial
payments
Digital: online and mobile
channels
Victory Capital Management
Education and indirect
lending
Credit card
Western NY branch
acquisition
Commercial real estate
Key Merchant Services
Channel optimization
Key evaluates all of its businesses to maximize long-term value, aligning core
businesses with core competencies
CRE servicing
International leasing
Pacific
Crest
Securities
(a)
(a) Acquisition subject to regulatory approval and customary
closing conditions; expected closing date: third quarter 2014 Invest
Acquire
Exit
Reinvent
17 |
 Progress on Targets for Success
Focus areas
Metrics
(a)
2Q14
1Q14
Targets
Improving balance
sheet efficiency
Loan to deposit ratio
(b)
87%
88%
90-100%
Maintaining
moderate risk
profile
NCOs to average loans
.22%
.15%
40-60 bps
Provision to average loans
.07%
.04%
Growing high
quality, diverse
revenue streams
Net interest margin
2.98%
3.00%
LT: >3.50%
Noninterest income
to total revenue
44%
43%
>40%
Generating
positive operating
leverage
Cash efficiency ratio
(c)
66%
65%
LT: <60%
Strengthening
returns with
disciplined capital
management
Return on average assets
1.14%
1.13%
1.00-1.25%
18
(a)
Continuing operations, unless otherwise noted
(b)
Represents period-end consolidated total loans and loans held for sale (excluding education loans
in the securitization trusts) divided by period-end consolidated total deposits (excluding
deposits in foreign office) (c)
Excludes intangible asset amortization; non-GAAP measure: see Appendix for reconciliation
|
 2014
Outlook and Expectations Loans
Mid-single digit average balance growth
Net Interest
Income
Relatively stable from 2013, with slight downward pressure from
competitive environment
Noninterest
Income
Low single-digit growth compared to prior year
Expense
Low to mid-single digit percentage decline from 2013
Efficiency /
Productivity
Positive operating leverage
Asset Quality
Net charge-offs to average loans expected to continue below
targeted
range
of
40
–
60
bps
for
the
remainder
of
the
year
Capital
Disciplined execution of 2014 capital plan, including dividends and
share repurchases
Guidance
ranges:
relatively
stable:
+/-
2%;
low
single-digit:
<5%;
mid-single
digit:
4%
-
6%
19 |
 Positive operating leverage year-over-year
Total average loans up 6% from prior year, driven by CF&A up 13%
CF&A loan growth and investment banking and debt placement fees (up 18%
year-over-year) reaffirms strength of business model
Expenses remain well-controlled, down 3% from prior year
Asset quality remains strong, with NCOs below targeted range
NPAs down 41% from prior year
New business originations are higher quality than overall book
Remaining disciplined with structure and relationship focus
Strong Risk
Management
Repurchased $108 million in common shares in 2Q14
Increased quarterly common share dividend by 18%
Committed to capital priorities: organic growth, dividends, repurchases,
opportunistic growth
Positive
Operating
Leverage
Investor Highlights: 2Q14
Execution of strategy and differentiated business model driving results
Disciplined
Capital
Management
20 |
 Financial Highlights
TE = Taxable equivalent, EOP = End of Period
(a)
From continuing operations
(b)
Year-over-year average balance growth
(c)
From consolidated operations
(d)
Non-GAAP measure: see Appendix for reconciliation
Metrics
2Q14
1Q14
4Q13
3Q13
2Q13
EPS –
assuming dilution
$ .27
$ .26
$ .26
$ .25
$ .21
Cash efficiency ratio
(d)
65.8
%
64.9
%
67.4
%
67.5
%
69.1
%
Net interest margin (TE)
2.98
3.00
3.01
3.11
3.13
Return on average total assets
1.14
1.13
1.08
1.12
.95
Total loans and leases
6
%
4
%
3
%
5
%
7
%
CF&A loans
13
9
8
11
14
Deposits (excl. foreign deposits)
2
4
8
5
8
Tier 1 common equity
(d)
11.3
%
11.3
%
11.2
%
11.2
%
11.2
%
Tier 1 risk-based capital
12.0
12.0
12.0
11.9
11.9
Tangible common equity to tangible assets
10.2
10.1
9.8
9.9
10.0
NCOs to average loans
.22
%
.15
%
.27
%
.28
%
.34
%
NPLs to EOP portfolio loans
.71
.81
.93
1.01
1.23
Allowance for loan losses to EOP loans
1.46
1.50
1.56
1.62
1.65
Balance
Sheet
Growth
(a),(b)
Capital
(c)
Asset
Quality
(a)
Financial
Performance
(a)
21
(d) |
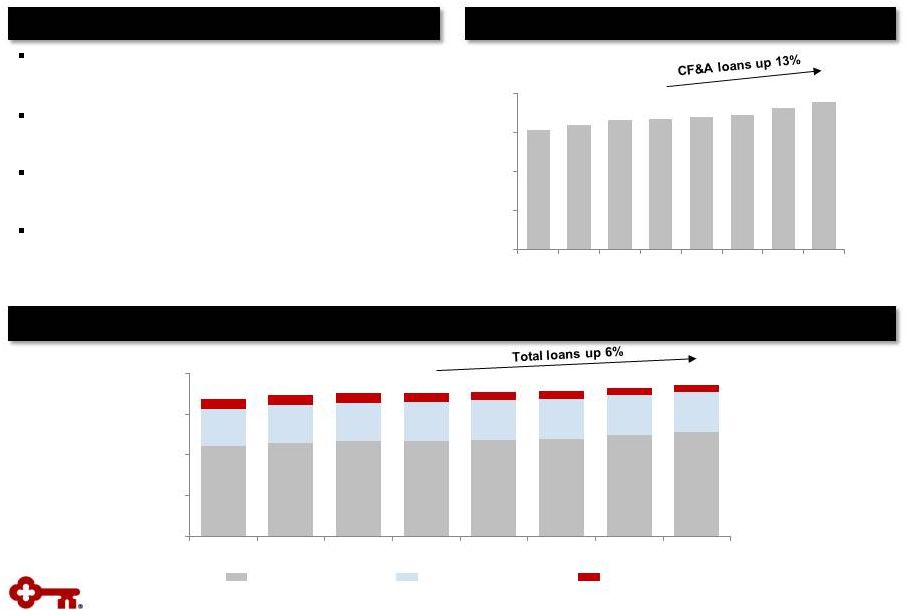 Average total loans up 6% from prior year
–
Driven by 13% increase in CF&A
Total commitments continue to grow with
utilization relatively stable
High quality new loan originations: consistent with
moderate risk profile
Remaining disciplined with structure and
relationship focus
Loan Growth
$ in billions
Highlights
Average Commercial, Financial & Agricultural Loans
Average Loans
Exit Portfolios
Home Equity & Other
Total Commercial
$ in billions
$55.6
$52.7
22
$0.0
$15.0
$30.0
$45.0
$60.0
3Q12
4Q12
1Q13
2Q13
3Q13
4Q13
1Q14
2Q14
$23.5
$26.4
$0.0
$7.0
$14.0
$21.0
$28.0
3Q12
4Q12
1Q13
2Q13
3Q13
4Q13
1Q14
2Q14 |
 Improving Deposit Mix
Highlights
Funding Cost
Overall funding cost continues to improve
Transaction deposit balances up 4% from 2Q13
Growth from prior year reflects inflows from
commercial clients as well as commercial
mortgage servicing
Total CD maturities and average cost
–
2014 Q3: $1.8 billion at .98%
–
2014 Q4: $.8 billion at .66%
–
2015 and beyond: $3.6 billion at 1.22%
Average
Deposits
(a)
$ in billions
Note: Transaction deposits include noninterest-bearing, and NOW and MMDA
Cost of total deposits
(a)
Interest-bearing liability cost
CDs and other time deposits
Savings
Noninterest-bearing
NOW and MMDA
$66.5
$64.9
23
.26%
.18%
.62%
.52%
.00%
.25%
.50%
.75%
1.00%
1.25%
3Q12
4Q12
1Q13
2Q13
3Q13
4Q13
1Q14
2Q14
$0.0
$10.0
$20.0
$30.0
$40.0
$50.0
$60.0
$70.0
3Q12
4Q12
1Q13
2Q13
3Q13
4Q13
1Q14
2Q14
(a)
Excludes deposits in foreign office |
 Net
Interest Income and Margin TE = Taxable equivalent
Continuing Operations
Highlights
Net Interest Income (TE) & Net Interest Margin (TE) Trend
Net interest income down 1% from prior year due to:
–
Competitive environment and asset repricing
offsetting loan growth
–
2Q14 leveraged lease
termination
(-$2 MM impact)
Growth from the prior quarter (up 2%) reflects
continued loan growth, day count and funding cost
improvement
Maintaining moderate asset sensitive position
–
Naturally asset sensitive balance sheet flows:
approximately 70% of loans variable rate
–
High quality investment portfolio with average
life of 3.6 years
–
Flexibility to quickly adjust interest rate risk
position
NIM Change (bps):
vs. 1Q14
Loan yield
(.05)
Leveraged lease termination
(.01)
Loan fees
.02
CD maturities / repricing
.01
Interest rate risk management / swaps
.01
Total Change
(.02)
Net interest income (TE)
NIM (TE)
$ in millions
24
$586
$579
3.13%
2.98%
2.00%
2.50%
3.00%
3.50%
4.00%
$500
$540
$580
$620
3Q12
4Q12
1Q13
2Q13
3Q13
4Q13
1Q14
2Q14 |
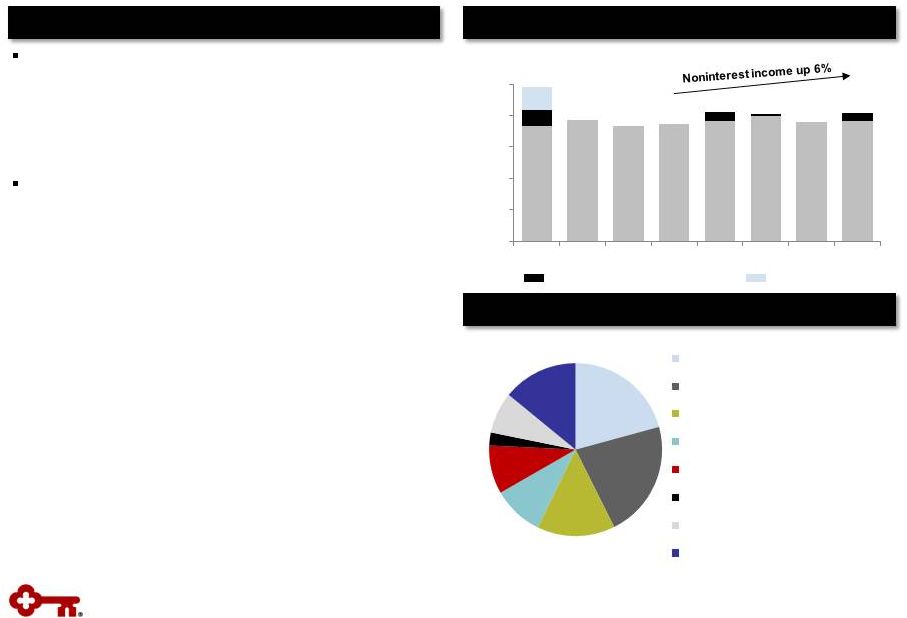 Noninterest Income
TE = Taxable equivalent
Continuing Operations
Highlights
Noninterest Income
Noninterest income up 6% from prior year, due to:
–
Investment banking and debt placement fees
up 18%
–
Gains from leveraged lease termination and
principal investing
Change from prior quarter (up 5%) reflects:
–
Investment banking and debt placement fees
up 18%
–
Leveraged lease early termination gain
–
Seasonal pickup in activity levels
•
Cards and payments: +13%
•
Deposit service charges: +5%
2Q14
Noninterest Income Diversity
$ in millions
(a)
Other includes corporate-owned life insurance, principal investing, etc.
Leveraged lease termination gains
TruPS gains
$455
$429
(a)
25
$150
$225
$300
$375
$450
$525
3Q12
4Q12
1Q13
2Q13
3Q13
4Q13
1Q14
2Q14
21%
22%
15%
9%
9%
2%
8%
14%
Trust & Investment Services
Investment Banking & Debt Placement
Deposit Service Charges
Cards & Payments
Corporate Services
Mortgage Fees
Operating Lease Income
Other |
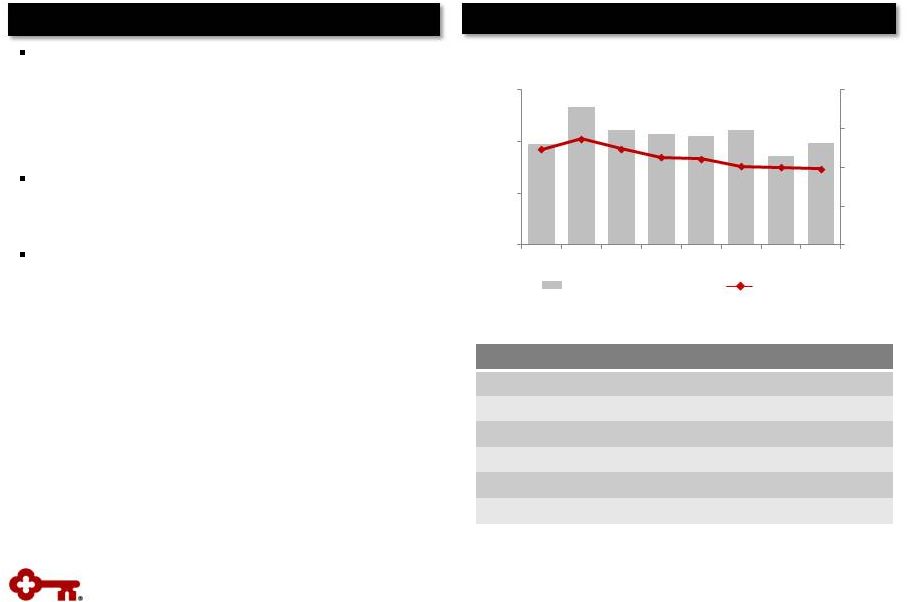
 Focused Expense Management
Noninterest Expense
$ in millions
Highlights
$689
Noninterest Expense Outlook
(a)
Non-GAAP measure: see Appendix for reconciliation
(b)
Excludes one-time gains of $54 million related to the redemption of trust
preferred securities $711
$2.8 B
Cash Efficiency Ratio
(a)
(b)
Expenses down 3% from prior year, benefitting
from continuous improvement efforts
Increase from prior quarter reflects:
–
Seasonal trends in marketing and personnel
–
Higher level of efficiency charges
Focused on improving efficiency and driving into
targeted range
Y-o-Y:
low to
mid-
single
digit %
decline
FY13 Reported
FY14 Outlook
Efficiency charges:
Pension settlement charges:
$15
$37
$16
$22
$10
$ 2
$25
Efficiency and pension settlement charges, as a % of revenue:
.8%
1.5%
1.5%
3.6%
3.9%
2.3%
1.0%
Cash efficiency ratio,
excluding efficiency and
pension settlement charges
$24
2.3%
26
$400
$500
$600
$700
$800
3Q12
4Q12
1Q13
2Q13
3Q13
4Q13
1Q14
2Q14
63.4%
65.8%
60%
65%
70%
3Q12
4Q12
1Q13
2Q13
3Q13
4Q13
1Q14
2Q14 |
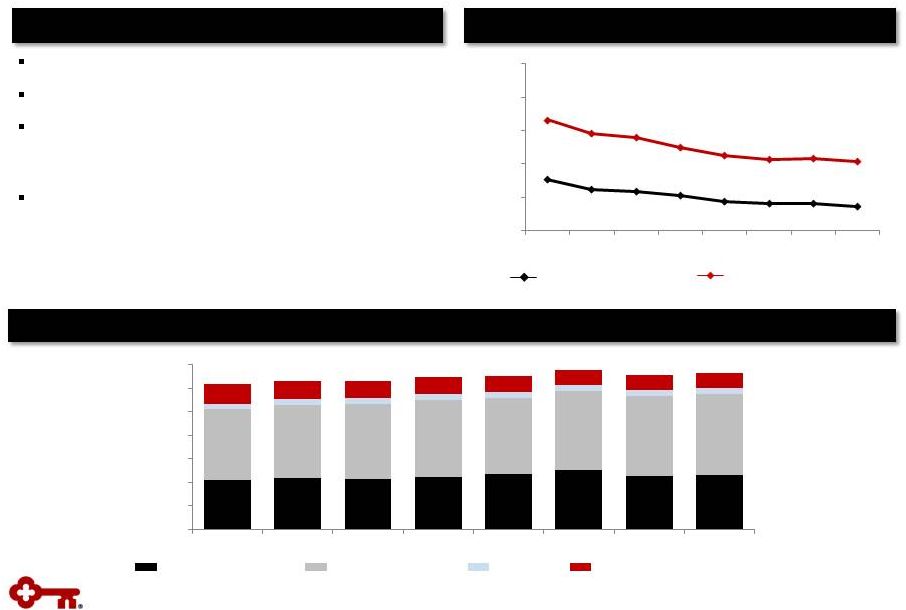
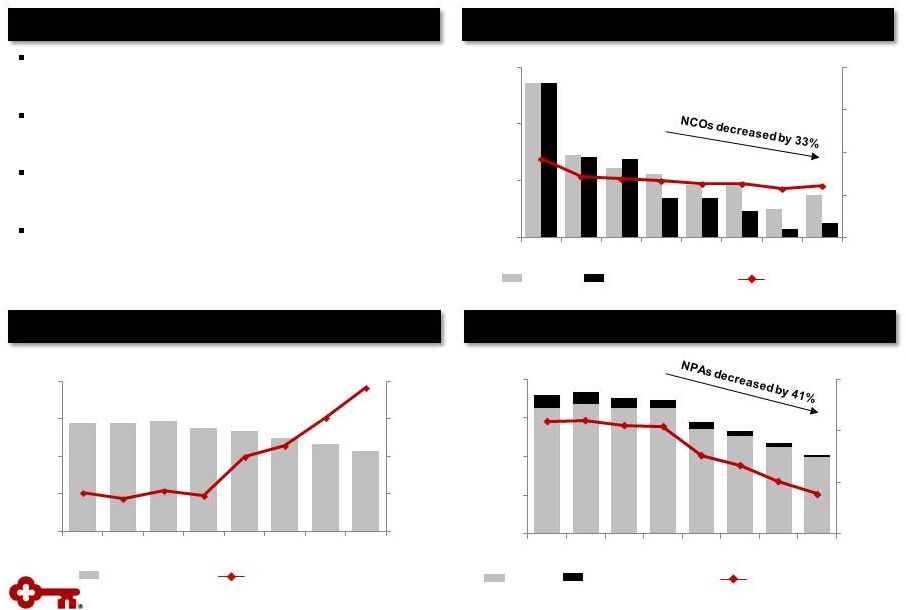 NPLs
NPLs to period-end loans
NCOs
Provision for loan and
lease losses
NCOs to average loans
$ in millions
$ in millions
NPLs held for sale,
OREO & other NPAs
Continued Improvement in Asset Quality
Net loan charge-offs decreased 33% from 2Q13 to
$30 MM, or 22 bps of average loans
Total gross charge-offs down 24% from 2Q13 and
down 2% from 1Q14
Commercial loan recoveries exceeded gross
charge-offs by $3 MM in 2Q14
Net charge-offs expected to continue below the
targeted range for the remainder of the year
Allowance for loan and
lease losses to NPLs
Allowance for loan
and lease losses
$ in millions
$693
$410
27
Highlights
Net Charge-offs & Provision for Loan and Lease Losses
Nonperforming Assets
Allowance for Loan and Lease Losses
$45
$30
$28
$10
.34%
.22%
(1.00)%
.00%
1.00%
2.00%
3.00%
$0
$40
$80
$120
3Q12
4Q12
1Q13
2Q13
3Q13
4Q13
1Q14
2Q14
1.23%
.71%
0.40%
0.80%
1.20%
1.60%
$0
$200
$400
$600
$800
3Q12
4Q12
1Q13
2Q13
3Q13
4Q13
1Q14
2Q14
$876
$814
134%
206%
110%
135%
160%
185%
210%
$600
$700
$800
$900
$1,000
3Q12
4Q12
1Q13
2Q13
3Q13
4Q13
1Q14
2Q14 |
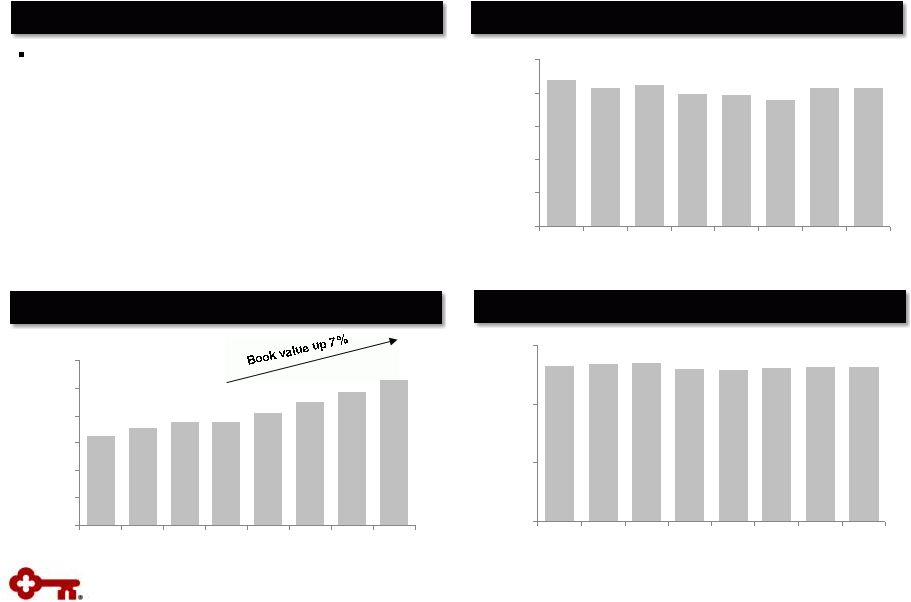 $10.89
$11.65
$9.00
$9.50
$10.00
$10.50
$11.00
$11.50
$12.00
3Q12
4Q12
1Q13
2Q13
3Q13
4Q13
1Q14
2Q14
Disciplined capital management
-
Continuing to invest in businesses
-
Increased quarterly common share dividend
by 18%
-
Repurchased $108 MM in common shares
Strong Capital
(a)
Non-GAAP measure: see Appendix for reconciliations
28
9.96%
10.15%
6.00%
7.00%
8.00%
9.00%
10.00%
11.00%
3Q12
4Q12
1Q13
2Q13
3Q13
4Q13
1Q14
2Q14
11.18%
11.25%
6.00%
8.00%
10.00%
12.00%
3Q12
4Q12
1Q13
2Q13
3Q13
4Q13
1Q14
2Q14
Highlights
Tangible Common Equity to Tangible Assets
(a)
Book Value per Share
Tier 1 Common Equity
(a) |
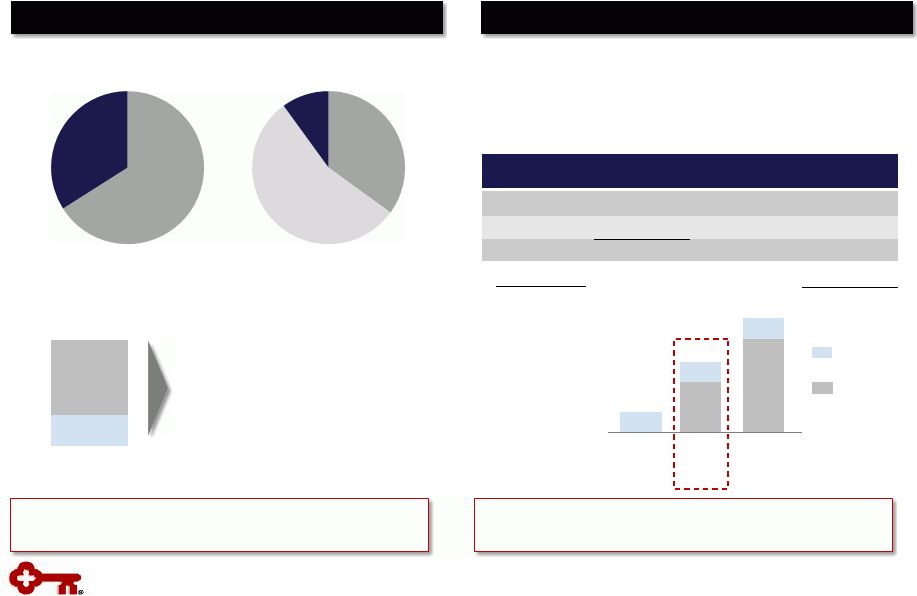 Interest Rate Risk Management
•
High quality
•
Fixed rate agency MBS and CMOs
•
Average maturity: 3.6 years
•
GNMAs total 31% of total portfolio
•
Reinvesting cash flows into GNMAs
$16
$5
$5
Modeled asset
sensitivity
3%
0%
8%
$5
Flexibility to Adjust Rate
Sensitivity with Swaps
Loan Portfolio
Variable:
66%
Fixed:
34%
Deposits
Debt
hedges
A/LM
hedges
Investment Portfolio
Noninterest-
bearing: 35%
Interest-
bearing, non-
time: 55%
CDs:
10%
•
Maintaining moderate asset sensitive position of ~3%
-
Assumes 200 basis point increase in short-term rates over a
12-month period
•
Utilize swaps for debt hedging and asset liability management
-
Fairly even pace of A/LM swap maturities
2Q14
Swaps
($ in B)
6/30/14
Notional Amt.
Wtd. Avg.
Maturity (Yrs.)
Receive
Rate
Pay
Rate
A/L Management
$ 9.3
2.0
.8%
.2%
Debt
5.1
3.6
2.8
.2
$ 14.4
1.5%
.2%
2Q14
$17 B
AFS: $12 B
HTM: $5 B
$14 B
29
Balance sheet has relatively short duration and is
more impacted by the short-end of the curve
Flexibility to adjust rate sensitivity for changes in balance
sheet growth/mix as well as interest rate outlook
Naturally Asset Sensitive Balance Sheet
Actively Managing Rate Risk
Size of swap
portfolio
$9 |
 2.17%
.00%
1.00%
2.00%
3.00%
4.00%
5.00%
$0.0
$5.0
$10.0
$15.0
$20.0
3Q12
4Q12
1Q13
2Q13
3Q13
4Q13
1Q14
2Q14
Average AFS securities
$ in billions
High Quality Investment Portfolio
Portfolio composed of Agency-backed CMOs:
Fannie, Freddie & GNMA
–
No private label MBS or financial paper
Currently reinvesting cash flows into GNMA
securities, for Basel III liquidity (LCR)
–
31% of total portfolio was GNMA at 6/30/14
Securities cash flows of $.9 billion in 2Q14
and $.8 billion in 1Q14
Average portfolio life at 6/30/14 of 3.6 years,
unchanged from 3/31/14
(a) Yield is calculated on the basis of amortized cost
(b) Includes end of period held-to-maturity and
available-for-sale securities Average yield
(a)
Average HTM securities
$17.4
2.33%
$17.4
30
Highlights
Average Total Investment Securities
Securities to Total Assets
(b)
20%
19%
10%
15%
20%
25%
3Q12
4Q12
1Q13
2Q13
3Q13
4Q13
1Q14
2Q14 |
 Asset
Quality Trends (a)
Loan and lease outstandings
(b)
From continuing operations
30 –
89 days delinquent
90+ days delinquent
Metric
(b)
2Q14
1Q14
4Q13
3Q13
2Q13
Delinquencies to EOP total loans: 30-89 days
.49
%
.48
%
.58
%
.54
%
.47
%
Delinquencies to EOP total loans: 90+ days
.15
.16
.13
.17
.15
NPLs to EOP portfolio loans
.71
.81
.93
1.01
1.23
NPAs to EOP portfolio loans + OREO + Other NPAs
.74
.85
.97
1.08
1.30
Allowance for loan losses to period-end loans
1.46
1.50
1.56
1.62
1.65
Allowance for loan losses to NPLs
205.6
185.7
166.9
160.4
134.4
Continuing Operations
Continuing Operations
31
Delinquencies to Period-end Total Loans
Quarterly Change in Criticized Outstandings
(a)
1.00%
.75%
.50%
.25%
.00%
.47%
.49%
.15%
.15%
0%
(2)%
(4)%
(6)%
(8)%
(10)%
(12)%
(3)%
(4)%
3Q12
4Q12
1Q13
2Q13
3Q13
4Q13
1Q14
2Q14
3Q12
4Q12
1Q13
2Q13
3Q13
4Q13
1Q14
2Q14 |
 Period-
end loans
Average
loans
Net loan
charge-
offs
Net loan
charge-offs
(b)
/
average loans
(%)
Nonperforming
loans
(c)
Ending
allowance
(d)
Allowance /
period-end
loans
(d)
(%)
Allowance /
NPLs
(%)
6/30/14
2Q14
2Q14
2Q14
6/30/14
6/30/14
6/30/14
6/30/14
Commercial,
financial
and
agricultural
(a)
26,327
26,444
-
-
37
373
1.42
N/M
Commercial real estate:
Commercial Mortgage
7,946
7,880
-
-
38
159
2.00
418.42
Construction
1,047
1,049
(1)
(.38)
9
34
3.25
377.78
Commercial lease financing
4,241
4,257
(2)
(.19)
15
60
1.41
400.00
Real
estate
–
residential
mortgage
2,189
2,189
1
.18
89
25
1.14
28.09
Home equity
10,679
10,627
10
.38
189
86
.81
45.50
Credit cards
718
702
11
6.29
1
30
4.18
N/M
Consumer
other
–
Key
Community
Bank
1,514
1,479
7
1.90
2
24
1.59
N/M
Consumer
other
–
Exit
Portfolio
939
984
4
1.63
16
23
2.45
143.75
Continuing
total
(e)
55,600
55,611
30
.22
396
814
1.46
205.56
Discontinued operations
4,162
4,273
7
1.16
19
32
1.31
168.42
Consolidated total
59,762
59,884
37
.26
415
846
1.46
203.86
Credit Quality
$ in millions
(a)
6-30-14
ending
loan
balances
include $94
million
of
commercial credit card
balances;
6-30-14
average
loan
balances
include
$95
million of
assets
from
commercial
credit cards
(b)
Net loan charge-off amounts are annualized in calculation. NCO ratios for
discontinued operations and consolidated Key exclude education loans in the securitization
trusts since valued at fair-market value
(c)
6-30-14 NPL amount excludes $15 million of purchased credit impaired
loans (d)
6-30-14 allowance by portfolio is estimated. Allowance/period loans ratios
for discontinued operations and consolidated Key exclude education loans in the
securitization trusts since valued at fair-market value
(e)
6-30-14
ending
loan
balances
include purchased loans
of
$151
million, of which
$15
million were
purchased credit impaired
N/M = Not meaningful
32
Credit Quality by Portfolio
$
$
$
$
$
$
$
$
$
$
$
$
$
$
$ |
 Vintage (% of Loans)
Loan
Balances
Average
Loan Size ($)
Average
FICO
Average
LTV
(a)
% of Loans
LTV>90%
2012
and
later
2011
2010
2009
2008
and
prior
Loans and lines
First lien
$
6,103
$
69,452
767
67
%
.6
%
47
%
5
%
3
%
4
%
41
%
Second lien
4,276
47,292
762
76
3.3
31
5
3
4
57
Community Bank
$
10,379
58,214
765
71
1.7
40
5
4
4
47
Exit portfolio
300
22,330
729
80
2.5
-
-
-
-
100
Total home equity portfolio
$
10,679
Nonaccrual loans and lines
First lien
$
91
$
62,046
713
72
%
.6
%
4
%
3
%
3
%
5
%
85
%
Second lien
87
48,713
711
78
2.2
1
2
2
3
92
Community Bank
$
178
54,748
712
75
1.4
3
3
2
4
88
Exit portfolio
11
24,570
701
77
2.8
-
-
-
-
100
Total home equity nonaccruals
$
189
Second quarter net charge-offs (NCOs)
Community Bank
$
9
2
%
1
%
2
%
2
%
93
%
% of average loans
.35
%
Exit Portfolio
$
1
-
-
-
-
100
% of average loans
1.31
%
Home Equity Portfolio –
6/30/14
Home Equity Portfolio –
6/30/14
$ in millions, except average loan size
Home Equity Portfolio
Highlights
Highlights
High quality portfolio
Community bank loans and lines: 97% of total portfolio; branch-
originated
–
59% first lien position
–
Average FICO score of 765
–
Average LTV at origination: 71%
$4.0 billion of the total portfolio are fixed rate loans that require
principal and interest payments; $6.7 billion are lines
$1.5 billion in lines outstanding (14% of the total portfolio)
come to end of draw period in the next four years
–
Proactive communication and client outreach initiated
near end of draw period
33
Average LTVs are at origination. Current average LTVs for Community Bank total home equity loans and
lines is approximately 71%, which compares to 71% at the end of the first quarter of 2014. (a) |
 Balance Outstanding
Change
Net Loan Charge-offs
Balance on
Nonperforming Status
6-30-14
3-31-14
6-30-14
vs.
3-31-14
2Q14
(c)
1Q14
(c)
6-30-14
3-31-14
Residential
properties
–
homebuilder
$ 19
$ 20
$ (1)
-
$ (1)
$
7 $
7
Marine and RV floor plan
23
23
-
-
-
6
6
Commercial
lease
financing
(a)
1,154
1,381
(227)
$ (5)
(2)
3
3
Total commercial loans
1,196
1,424
(228)
(5)
(3)
16
16
Home
equity
–
Other
300
315
(15)
1
2
11
11
Marine
888
965
(77)
5
4
15
15
RV and other consumer
61
66
(5)
(1)
1
1
1
Total consumer loans
1,249
1,346
(97)
$ 5
7
27
27
Total exit loans in loan portfolio
$ 2,445
$ 2,770
$ (325)
-
$ 4
$ 43
$
43 Discontinued
operations
–
education
lending
business
(not
included
in
exit
loans
above)
(b)
$ 4,162
$ 4,354
$ (192)
$ 7
$ 9
$ 19
$
20 Average balances, $
in millions (a)
Includes (1) the business aviation, commercial vehicle, office products,
construction and industrial leases; (2) Canadian lease financing portfolios; (3) European
lease financing portfolios; and (4) all remaining balances related to lease in,
lease out; sale in, lease out; service contract leases; and qualified technological
equipment leases.
(b)
Includes loans in Key’s consolidated education loan securitization
trusts (c)
Credit amounts indicate recoveries exceeded charge-offs
$ in millions
Exit Loan Portfolio
Exit Loan Portfolio
Exit Loan Portfolio
34
$3,286
$2,560
$0
$1,000
$2,000
$3,000
$4,000
3Q12
4Q12
1Q13
2Q13
3Q13
4Q13
1Q14
2Q14 |
 GAAP
to Non-GAAP Reconciliation $ in millions
35
Three months ended
6-30-14
3-31-14
12-31-13
9-30-13
6-30-13
Tangible common equity to tangible assets at period end
Key shareholders’
equity (GAAP)
10,504
$
10,403
$
10,303
$
10,206
$
10,229
Less:
Intangible assets
(a)
1,008
1,012
1,014
1,017
1,021
Preferred Stock, Series A
(b)
282
282
282
282
282
Tangible common equity (non-GAAP)
9,214
$
9,109
$
9,007
$
8,907
$
8,926
Total assets (GAAP)
91,798
$
90,802
$
92,934
$
90,708
$
90,639
Less:
Intangible assets
(a)
1,008
1,012
1,014
1,017
1,021
Tangible assets (non-GAAP)
90,790
$
89,790
$
91,920
$
89,691
$
89,618
Tangible common equity to tangible assets ratio (non-GAAP)
10.15
%
10.14
%
9.80
%
9.93
%
9.96
%
Tier 1 common equity at period end
Key shareholders’
equity (GAAP)
10,504
$
10,403
$
10,303
$
10,206
$
10,229
Qualifying capital securities
339
339
339
340
339
Less:
Goodwill
979
979
979
979
979
Accumulated other comprehensive income (loss)
(c)
(328)
(367)
(394)
(409)
(359)
Other assets
(d)
86
84
89
96
101
Total Tier 1 capital (regulatory)
10,106
10,046
9,968
9,880
9,847
Less:
Qualifying capital securities
339
339
339
340
339
Preferred Stock, Series A
(b)
282
282
282
282
282
Total Tier 1 common equity (non-GAAP)
9,485
$
9,425
$
9,347
$
9,258
$
9,226
Net risk-weighted assets (regulatory)
84,287
$
83,637
$
83,328
$
82,913
$
82,528
Tier 1 common equity ratio (non-GAAP)
11.25
%
11.27
%
11.22
%
11.17
%
11.18
%
Pre-provision net revenue
Net interest income (GAAP)
573
$
563
$
583
$
578
$
581
Plus:
Taxable-equivalent adjustment
6
6
6
6
5
Noninterest income (GAAP)
455
435
453
459
429
Less:
Noninterest expense (GAAP)
689
662
712
716
711
Pre-provision net revenue from continuing operations (non-GAAP)
345
$
342
$
330
$
327
$
304
$
$
$
$
$
$
$
$
$
(a)
Three months ended June 30, 2014, March 31, 2014, December 31, 2013, September 30, 2013, and June 30,
2013, exclude $79 million, $84 million, $92 million, $99 million, and $107 million of
period-end purchased credit card receivable intangible assets, respectively
(b)
Net of capital surplus for the three months ended June 30, 2014, March 31, 2014, December 31, 2013,
September 30, 2013, and June 30, 2013 (c)
Includes net unrealized gains or losses on securities available for sale (except for net unrealized
losses on marketable equity securities), net gains or losses on cash flow hedges, and amounts
resulting from the application of the applicable accounting guidance for defined benefit and other
postretirement plans
(d)
Other assets deducted from Tier 1 capital and net risk-weighted assets consist of disallowed
intangible assets (excluding goodwill) and deductible portions of nonfinancial equity
investments. There were no disallowed deferred tax assets at June 30, 2014, March 31, 2014, December 31, 2013,
September 30, 2013, and June 30, 2013
|
 Three months ended
6-30-14
3-31-14
12-31-13
9-30-13
6-30-13
Average tangible common equity
Average
Key
shareholders’
equity
(GAAP)
$
10,459
$
10,371
$
10,272
$
10,237
$
10,314
Less:
Intangible assets (average)
a)
1,010
1,013
1,016
1,019
1,023
Preferred Stock, Series A (average)
291
291
291
291
291
Average tangible common equity (non-GAAP)
$
9,158
$
9,067
$
8,965
$
8,927
$
9,000
Return on average tangible common equity from continuing operations
Net
income
(loss)
from
continuing
operations
attributable
to
Key
common
shareholders (GAAP)
$
242
$
232
$
229
$
229
$
193
Average tangible common equity (non-GAAP)
9,158
9,067
8,965
8,927
9,000
Return on average tangible common equity from continuing operations
(non-GAAP) 10.60
%
10.38
%
10.13
%
10.18
%
8.60
%
Return on average tangible common equity consolidated
Net income (loss) attributable to Key common shareholders (GAAP)
$
214
$
236
$
224
$
266
$
198
Average tangible common equity (non-GAAP)
9,158
9,067
8,965
8,927
9,000
Return on average tangible common equity consolidated (non-GAAP)
9.37
%
10.56
%
9.91
%
11.82
%
8.82
%
Cash efficiency ratio
Noninterest expense (GAAP)
$
689
$
662
$
712
$
716
$
711
Less:
Intangible asset amortization (GAAP)
9
10
10
12
10
Adjusted noninterest expense (non-GAAP)
$
680
$
652
$
702
$
704
$
701
Net interest income (GAAP)
$
573
$
563
$
583
$
578
$
581
Plus:
Taxable-equivalent adjustment
6
6
6
6
5
Noninterest income (GAAP)
455
435
453
459
429
Total taxable-equivalent revenue (non-GAAP)
$
1,034
$
1,004
$
1,042
$
1,043
$
1,015
Cash efficiency ratio (non-GAAP)
65.8
%
64.9
%
67.4
%
67.5
%
69.1
%
GAAP to Non-GAAP Reconciliation
(continued)
$ in millions
(a)
Three months ended June 30, 2014, March 31, 2014, December 31, 2013, September 30,
2013, and June 30, 2013 exclude $82 million, $89 million, $96 million, $103
million, and $110 million of average purchased credit card receivable intangible assets, respectively
36 |
 KeyCorp & Subsidiaries
$ in billions
Quarter ended
June 30, 2014
Tier 1 common equity under current regulatory rules
Adjustments from current regulatory rules to the Regulatory Capital Rules:
Deferred
tax
assets
and
PCCRs
(b)
Common
Equity
Tier
1
anticipated
under
the
Regulatory
Capital
Rules
(c)
Total risk-weighted assets under current regulatory rules
Adjustments from current regulatory rules to the Regulatory Capital Rules:
Loan commitments <1 year
Past Due Loans
Mortgage
servicing
assets
(d)
Deferred
tax
assets
(d)
Other
Total
risk-weighted
assets
anticipated
under
the
Regulatory
Capital
Rules
(c)
Common Equity Tier 1 ratio under the Regulatory Capital Rules
%
Table may not foot due to rounding
Common Equity Tier 1 Under the Regulatory Capital
Rules (estimated)
(a)
37
9.5
(.1)
9.4
84.3
1.0
.1
.5
.2
1.5
87.6
10.7
Common equity Tier 1 capital is a non-generally accepted accounting principle (GAAP) financial
measure that is used by investors, analysts and bank regulatory agencies to assess the capital
position of financial services companies. Management reviews Common Equity Tier 1 along with other measures of capital as part of
its financial analyses
Includes the deferred tax asset subject to future taxable income for realization, primarily tax
credit carryforwards, as well as the deductible portion of purchased credit card receivables The anticipated amount of
regulatory capital and risk-weighted assets is based upon the federal banking agencies’ Regulatory Capital Rules (as fully phased-in on
January 1, 2019); Key is subject to the Regulatory Capital Rules under the “standardized
approach” Item is
included in the 10%/15% exceptions bucket calculation and is risk-weighted at 250%
(a)
(b)
(c)
(d)
$
$
$
$ |