Attached files
| file | filename |
|---|---|
| 8-K - 8-K - EQUITY LIFESTYLE PROPERTIES INC | d783127d8k.htm |
Exhibit 99.1

Equity LifeStyle Properties
ELS
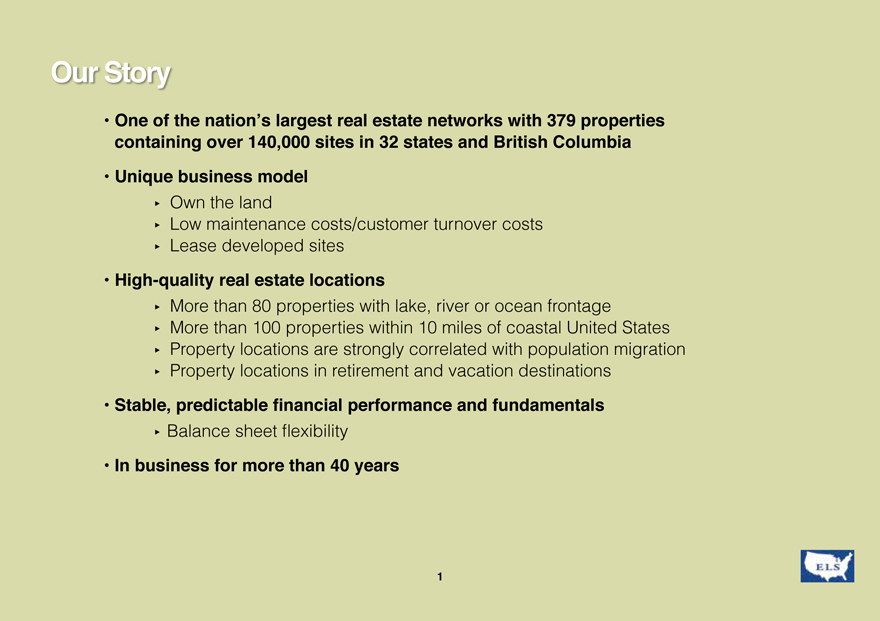
Our Story
• One of
the nation’s largest real estate networks with 379 properties containing over 140,000 sites in 32 states and British Columbia
• Unique business model
Own the land
Low maintenance costs/customer turnover costs
Lease developed sites
High-quality real estate locations
More than 80 properties with lake, river or ocean frontage
More than 100 properties within 10
miles of coastal United States
Property locations are strongly correlated with population migration
Property locations in retirement and vacation destinations
Stable, predictable financial
performance and fundamentals
Balance sheet flexibility
In business for more
than 40 years
ELS
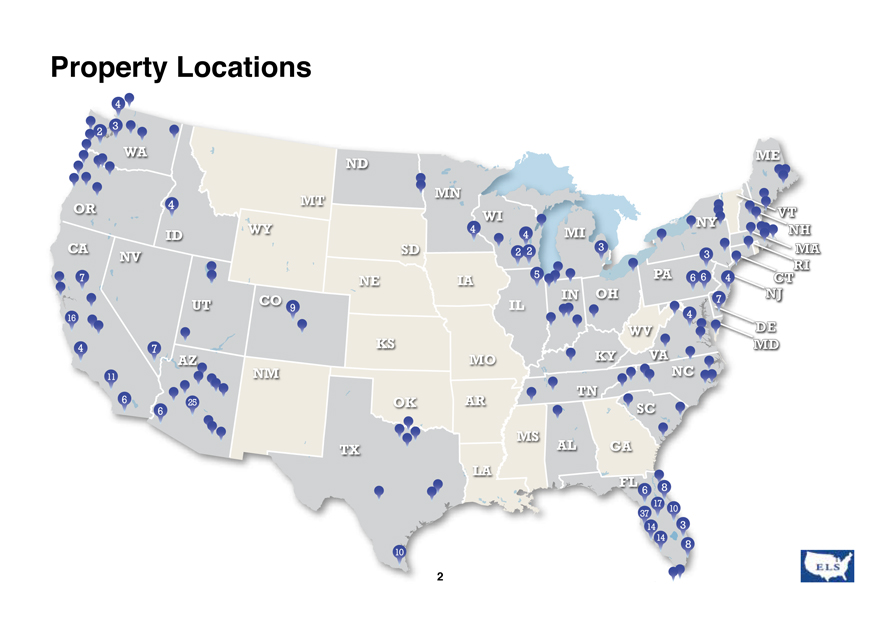
Property Locations
2
WA OR CA NV ID UT AZ NM TX OK LA AR MO IA MN WI IL OH MI PA WV KY TN MS AL GA FL SC NC MD DE NJ CT RI MA NH VT ME NY VA KS NE SD ND MT WY CO 4 4 7 6 6 3 3 8 4 4 4
4 2 2 3 2 8 17 37 10 9 7 7 25 6 6 11 4 16 14 14 3 6 5 10 IN ELS
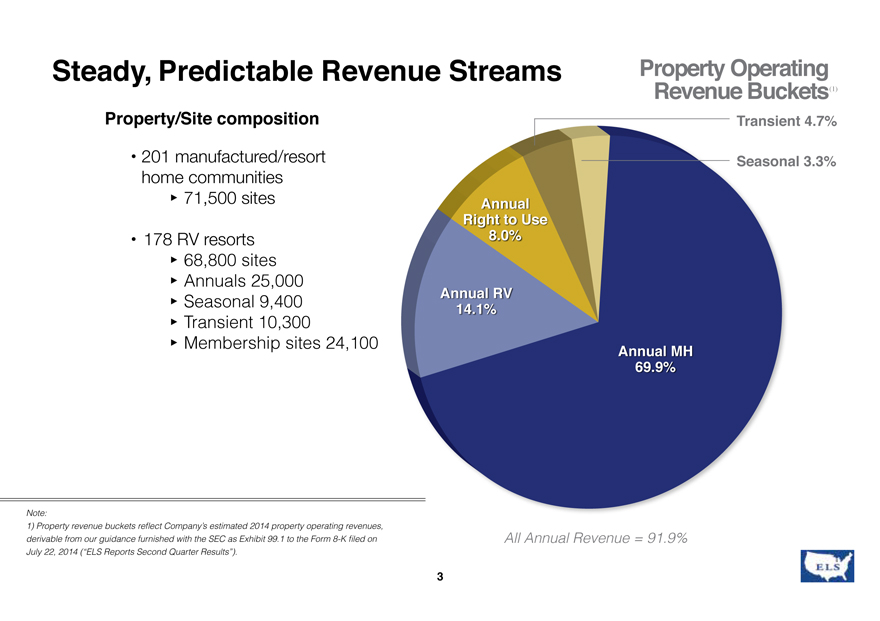
Steady,Predictable Revenue Streams
Property Operating
Revenue Buckets(1)
Property/Site composition
| • |
|
201 manufacturedfresort home communities |
71,500 sites
| • |
|
178 RV resorts |
68,800 sites
Annuals 25,000
Seasonal 9,400
Transient 10,300
Membership sites 24.100
Note:
1) Property revenue buckets reflect Company’s estimated 2014 property operating
revenues, derivable from our guidance furnished with the SEC as Exhibit 99.1 to the Form 8-K filed on July 22, 2014 (“ELS Reports Second Quarter Results”).
All Annual Revenue •91.9%

Our Lifestyle Options
·Customers own the units they place on our sites
| • |
|
Manufactured homes |
| • |
|
Resort cottages (park models) |
| • |
|
Recreational vehicles |
·We offer a lifestyle and a variety of product options to meet our customers’ needs
·We seek to create long erm relationships
with our customers
Manufactured Home
RV Resort Cottage
RV Site
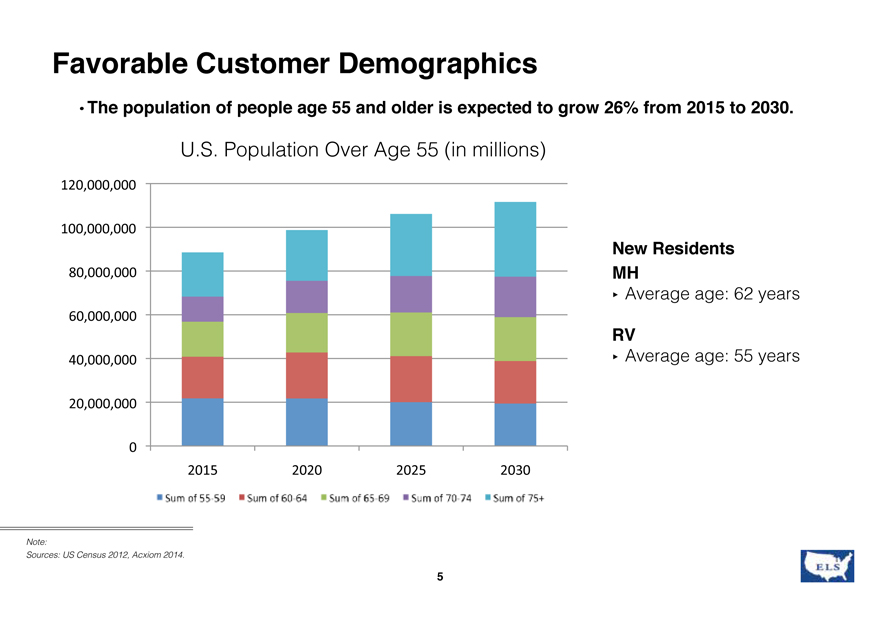
Favorable Customer Demographics
·The population of people age 55 and older is expected to grow 26% from 2015 to 2030.
US Population Over Age 55 (in millions)
80,000,000
60,000,000
40,000,000
20,000,000
New Residents
MH
| • |
|
Average age 62 years |
RV
| • |
|
Average age 55 years |
Sum of 55-59 Sum of 60-64 Sum of 65-69 Sum of 75+
Note:
Sources: US Census 2012, Acxiom 2014.

Customer Outreach
| • |
|
Online Marketing |
| • |
|
Partners |
| • |
|
Customer Engagement Channels |
| 6 |
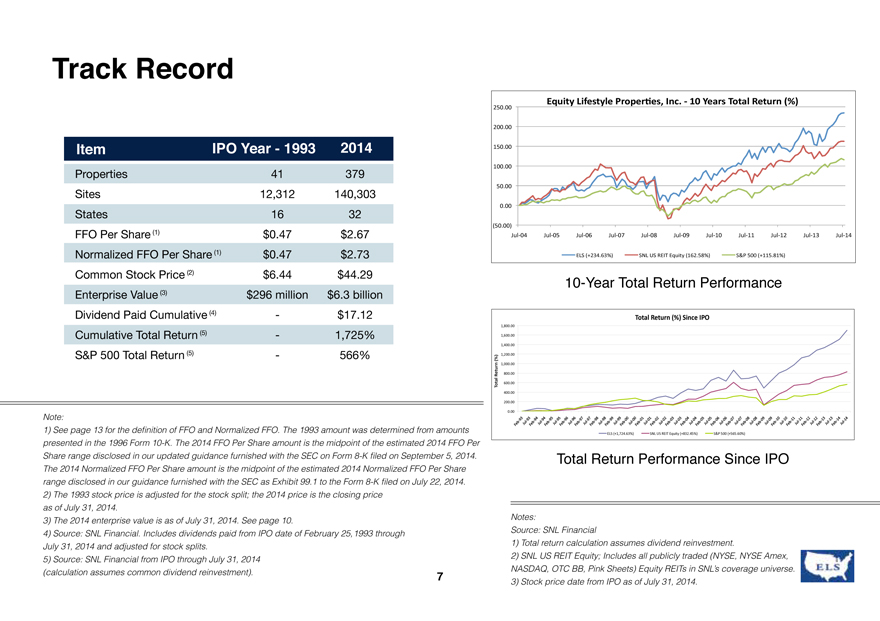
Track Record Properties Sites States FFO Per Share (1)Normalized FFO Per Share (1)Common Stock Price (2)Enterprise Value (3)Dividend Paid Cumulative (4)Cumulative Total Return (5)S&P 500 Total Return (5) 41 12,312 16 $0.47 $0.47 $6.44 $296 million 379 140,303 32 $2.67 $2.73 $44.29 $6.3 billion $17.12 1,725% 566% Note:1) See page 13 for the definition of FFO and Nomalized FFO. The 1993 amount was determined from amounts presented in the 1996 Form 10-K. The 2014 FFO Per Share amount is the midpoint of the estimated 2014 FFO Per Share range disclosed in our updated guidance furnished with the SEC on Form 8-K filed on September 5, 2014.The 2014 Normalized FFO Per Share amount is the midpoint of the estimated 2014 Normalized FFO Per Share range disclosed in our guidance furnished with the SEC as Exhibit 99.1 to the Form 8-K filed on July 22, 20142) The 1993 stock price is adjusted for the stock split; the 2014 price is the closing price as of July 31, 2014.3) The 2014 enterprise value is as of July 31, 2014. See page 10.4) Source: SNL Financial. Includes dividends paid from IPO date of February 25,1993 through July 31, 2014 and adjusted for stock splits.5) Source: SNL Financial from IPO through July 31, 2014 (calculation assumes common dividend reinvestment). Equity estyle operBes, Inc. ears otal eturn%). 250.00 200.00 50.00 100.00 150.00 0.00 (50.00) Jul-04 Jul-05 Jul-06 Jul-07 Jul-08 Jul-09 Jul-10 Jul-11 Jul-12 Jul-13 Jul-14 0.00 200.00 400.00 600.00 800.00 1,000.00 1,200.00 1,400.00 1,600.00 10-Year Total Return Performance Since IPO Total return(%). Total Return Performance Since IPO Feb-93 Feb-94 Feb-95 Feb-96 Feb-97 Feb-98 Feb-99 Feb-00 Feb-01 Feb-02 Feb-03 Feb-04 Feb-05 Feb-06 Feb-07 Feb-08 Feb-09 Feb-10 Feb-11 Feb-12 Feb-13 Feb-14 Jul-93 Jul-94 Jul-95 Jul-96 Jul-97 Jul-98 Jul-99 Jul-00 Jul-01 Jul-02 Jul-03 Jul-04 Jul-05 Jul-06 Jul-07 Jul-08 Jul-09 Jul-10 Jul-11 Jul-12 Jul-13 Jul-14 Notes: Source: SNL Financial1) Total return calculation assumes dividend reinvestment.2) SNL US REIT Equity; Includes all publicly traded (NYSE, NYSE Amex, NASDAQ, OTC BB, Pink Sheets) Equity REITs in SNL’s coverage universe.3) Stock price date from IPO as of July 31, 2014.
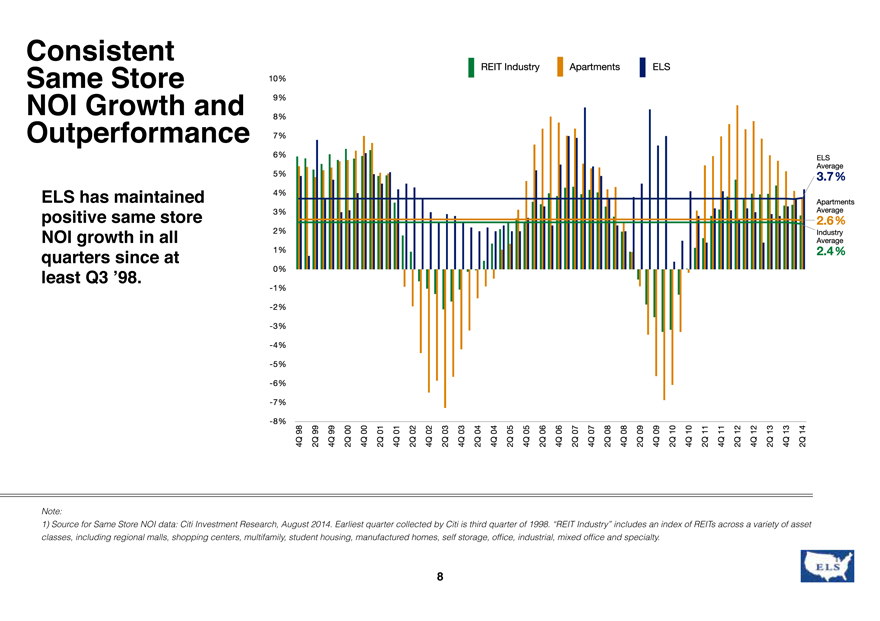
Consistent Same Store NOI Growth and Outperformance ELS has maintained positive same store NOI growth in all quarters since at least Q3 ’98. REIT Industry Apartment ELS -8% -7% -6% -5% -4% -3% -2% -1% 0% 1% 2% 3% 4% 5% 6% 7% 8% 9% 10% 4Q98 2Q99 4Q99 2Q00 4Q00 2Q01 4Q02 2Q02 4Q01 2Q03 2Q04 2Q05 2Q06 2Q07 2Q08 2Q09 2Q10 2Q11 2Q12 2Q13 2Q14 4Q01 4Q02 4Q03 4Q04 4Q05 4Q06 4Q07 4Q08 4Q09 4Q10 4Q11 4Q12 4Q13 4Q14 Note:1) Source for Same Store NOI data: Citi Investment Research, August 2014. Earliest quarter collected by Citi is third quarter of 1998. “REIT Industry” includes an index of REITs across a variety of asset classes, including regional malls, shopping centers, multifamily, student housing, manufactured homes, self storage, office, industrial, mixed office and specialist.
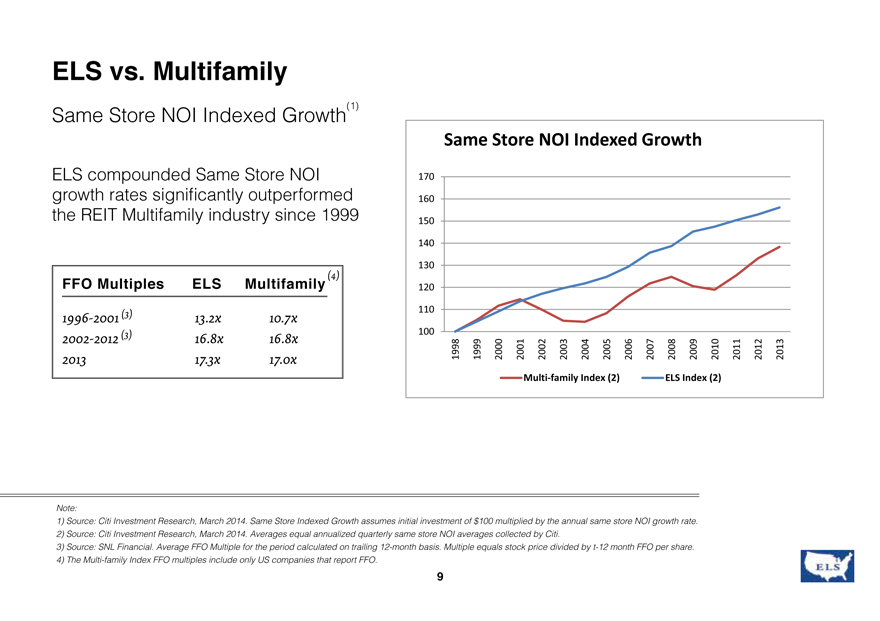
ELS vs. Multifamily ELS compounded Same Store NOI growth rates significantly outperformed the REIT Multifamily
industry since 1999
Same Store NOI Indexed Growth(1)
FFO Multiples ELS
Multifamily(4) 1996-2001 (3) 13.2x 10.7x 2002-2012 (3) 16.8x 16.8x2013 17.3x 17.0x
Same Store NOI Indexed Growth
Multi-family Index (2) ELS Index (2)
100 110 120 130 140 150 160 170
1998 1999 2000 2001 2002 2003 2004 2005 2006 2007 2008 2009 2010 2011 2012 2013
Note:1)
Source: Citi Investment Research, March 2014. Same Store Indexed Growth assumes initial investment of $100 multiplied by the annual same store NOI growth rate.2) Source: Citi Investment Research, March 2014. Averages equal annualized quarterly same
store NOI averages collected by Citi. 3) Source: SNL Financial. Average FFO Multiple for the period calculated on trailing 12-month basis. Multiple equals stock price divided by t-12 month FFO per share.4) The Multi-family Index FFO multiples
include only US companies that report FFO.
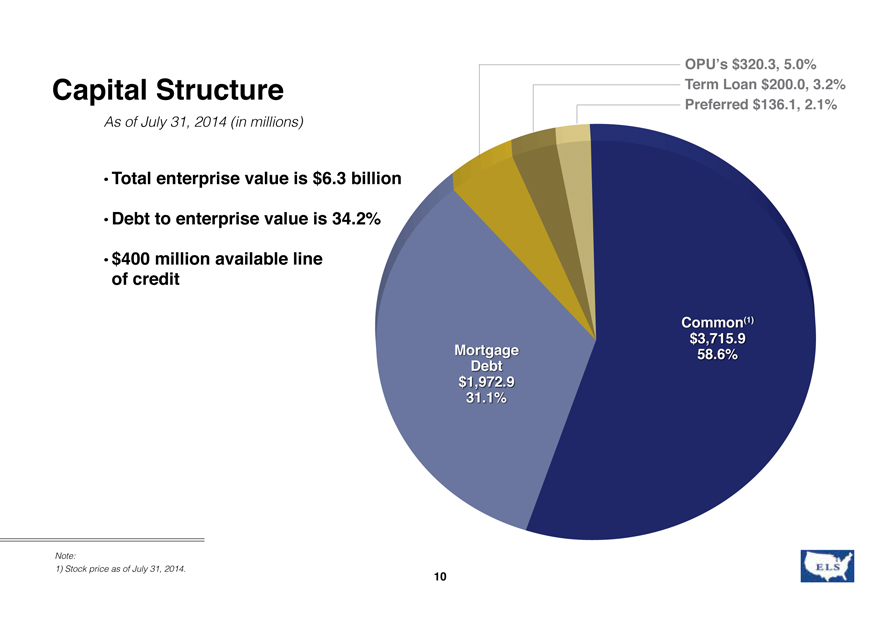
| • |
|
Total enterprise value is $6.3 billion Debt to enterprise value is 34.2% $400 million available line of creditNote:1) Stock price as of July 31, 2014.10As of July 31, 2014 (in millions) Mortgage Debt$ 1,972.9 31.1% |
Common(1)
$3,715.9
58.6%
Preferred $136.1, 2.1% Term Loan $200.0, 3.2% OPU’s $320.3, 5.0%
Note:1) Stock price as
of July 31, 2014.
Performance Update
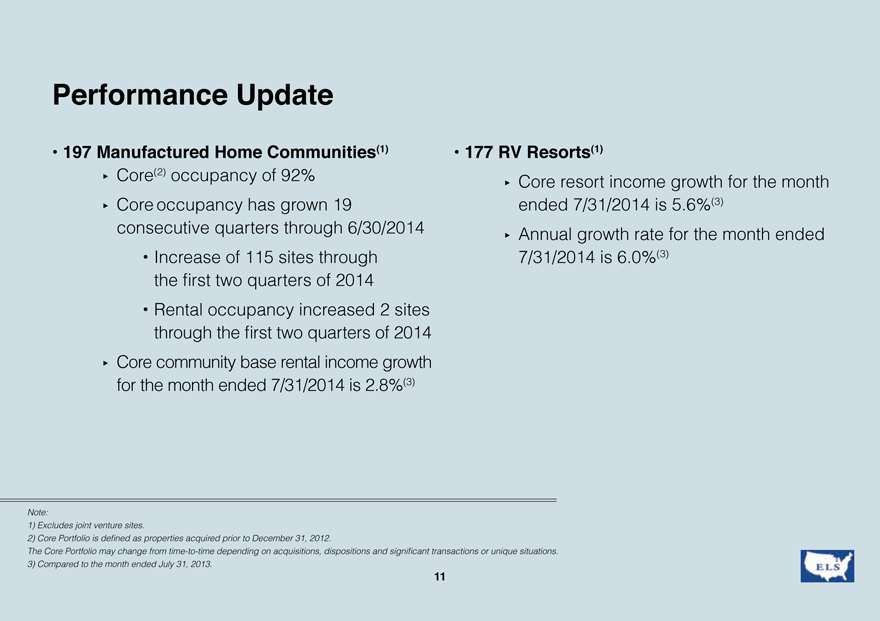
| • |
|
197 Manufactured Home Communities(1) Core(2) occupancy of 92% ? Core occupancy has grown 19 consecutive quarters through 6/30/2014 Increase of 115 sites through the first two quaters of 2014 Rental occupancy increased 2 sites through the first two quaters of 2014 ? Core community base rental income growth for the month ended 7/31/2014 is 2.8%(3) |
| • |
|
177 RV Resorts(1) ? Core resort income growth for the month ended 7/31/2014 is 5.6%(3) ? Annual growth rate for the month ended 7/31/2014 is 6.0%(3) |
Note:1) Excludes joint venture sites.2) Core Portfolio is defined as properties acquired prior to December 31, 2012. The Core Portfolio may change from time-to-time depending on acquisitions, dispositions and significant transactions or unique situations3) Compared to the month ended July 31, 2013.
Safe Harbor Statement Non GAAP Financial Measures Net Income to FFO and Normalized FFO Reconciliation (in
millions)
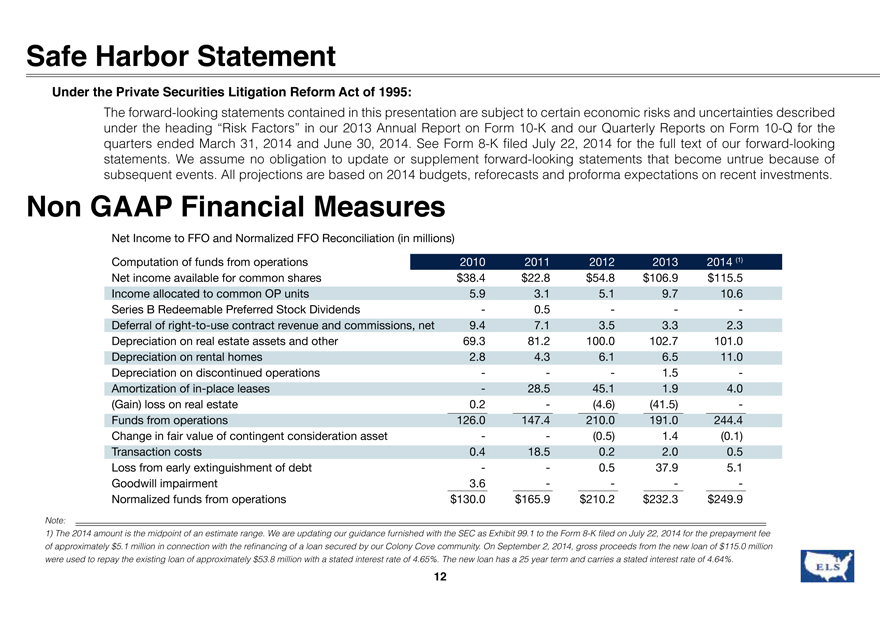
Under the Private Securities Litigation Reform Act of 1995:
The
forward-looking statements contained in this presentation are subject to certain economic risks and uncertainties described under the heading “Risk Factors” in our 2013 Annual Report on Form 10-K and our Quarterly Reports on Form 10-Q for
the quarters ended March 31, 2014 and June 30, 2014. See Form 8-K filed July 22, 2014 for the full text of our forward-looking statements. We assume no obligation to update or supplement forward-looking statements that become untrue
because of subsequent events. All projections are based on 2014 budgets, reforecasts and proforma expectations on recent investments.
Net Income to FFO and
Normalized FFO Reconciliation (in millions)
Computation of funds from operations 2010 2011 2012 2013 2014 (1)Net income available for common shares $38.4 $22.8
$54.8 $106.9 $115.5Income allocated to common OP units 5.9 3.1 5.1 9.7 10.6Series B Redeemable Preferred Stock Dividends— 0.5 —— -Deferral of right-to-use contract revenue and commissions, net 9.4 7.1 3.5 3.3 2.3Depreciation on real
estate assets and other 69.3 81.2 100.0 102.7 101.0Depreciation on rental homes 2.8 4.3 6.1 6.5 11.0Depreciation on discontinued operations——— 1.5 -Amortization of in-place leases— 28.5 45.1 1.9 4.0(Gain) loss on real estate 0.2
— (4.6) (41.5) -Funds from operations 126.0 147.4 210.0 191.0 244.4Change in fair value of contingent consideration asset —— (0.5) 1.4 (0.1) Transaction costs 0.4 18.5 0.2 2.0 0.5Loss from early extinguishment of debt
—— 0.5 37.9 5.1Goodwill impairment 3.6 ——— -Normalized funds from operations $130.0 $165.9 $210.2 $232.3 $249.9
Note:1) The 2014 amount is
the midpoint of an estimate range. We are updating our guidance furnished with the SEC as Exhibit 99.1 to the Form 8-K filed on July 22, 2014 for the prepayment fee of approximately $5.1 million in connection with the refinancing of a loan
secured by our Colony Cove community. On September 2, 2014, gross proceeds from the new loan of $115.0 million were used to repay the existing loan of approximately $53.8 million with a stated interest rate of 4.65%. The new loan has a 25 year
term and carries a stated interest rate of 4.64%.
Non GAAP Financial Measures
Funds from Operations (“FFO”) is a non-GAAP financial measure. We believe FFO, as defined by the Board of Governors of the National Association of Real
Estate Investment Trusts (“NAREIT”), is generally an appropriate measure of performance for an equity REIT. While FFO is a relevant and widely used measure of operating performance for equity REITs, it does not represent cash flow from
operations or net income as defined by GAAP, and it should not be considered as an alternative to these indicators in evaluating liquidity or operating performance.
We define FFO as net income, computed in accordance with GAAP, excluding gains and actual or estimated losses from sales of properties, plus real estate related
depreciation and amortization, impairments, if any, and after adjustments for unconsolidated partnerships and joint ventures. Adjustments for unconsolidated partnerships and joint ventures are calculated to reflect FFO on the same basis. We receive
up-front non-refundable payments from the entry of right-to-use contracts. In accordance with GAAP, the up-front non-refundable payments and related commissions are deferred and amortized over the estimated customer life. Although the NAREIT
definition of FFO does not address the treatment of non-refundable right-to-use payments, we believe that it is appropriate to adjust for the impact of the deferral activity in our calculation of FFO. Normalized Funds from Operations
(“Normalized FFO”) is a non-GAAP measure. We define Normalized FFO as FFO excluding the following non-operating income and expense items: a) the financial impact of contingent consideration; b) gains and losses from early debt
extinguishment, including prepayment penalties and defeasance costs; c) property acquisition and other transaction costs related to mergers and acquisitions; and d) other miscellaneous non-comparable items. We believe that FFO and Normalized FFO are
helpful to investors as supplemental measures of the performance of an equity REIT. We believe that by excluding the effect of depreciation, amortization and actual or estimated gains or losses from sales of real estate, all of which are based on
historical costs and which may be of limited relevance in evaluating current performance, FFO can facilitate comparisons of operating performance between periods and among other equity REITs. We further believe that Normalized FFO provides useful
information to investors, analysts and our management because it allows them to compare our operating performance to the operating performance of other real estate companies and between periods on a consistent basis without having to account for
differences not related to our operations. For example, we believe that excluding the early extinguishment of debt, property acquisition and other transaction costs related to mergers and acquisitions and the change in fair value of our contingent
consideration asset from Normalized FFO allows investors, analysts and our management to assess the sustainability of operating performance in future periods because these costs do not affect the future operations of the properties. In some cases,
we provide information about identified non-cash components of FFO and Normalized FFO because it allows investors, analysts and our management to assess the impact of those items. Investors should review FFO and Normalized FFO along with GAAP net
income and cash flow from operating activities, investing activities and financing activities, when evaluating an equity REIT’s operating performance. We compute FFO in accordance with our interpretation of standards established by NAREIT,
which may not be comparable to FFO reported by other REITs that do not define the term in accordance with the current NAREIT definition or that interpret the current NAREIT definition differently than we do. Normalized FFO presented herein is not
necessarily comparable to normalized FFO presented by other real estate companies due to the fact that not all real estate companies use the same methodology for computing this amount. FFO and Normalized FFO do not represent cash generated from
operating activities in accordance with GAAP, nor do they represent cash available to pay distributions and should not be considered as an alternative to net income, determined in accordance with GAAP, as an indication of our financial performance,
or to cash flow from operating activities, determined in accordance with GAAP, as a measure of our liquidity, nor is it indicative of funds available to fund our cash needs, including our ability to make cash distributions.

Equity LifeStyle Properties Two North Riverside Plaza, Chicago, Illinois 60606800-247-5279 |
www.EquityLifeStyle.com
08/14