Attached files
| file | filename |
|---|---|
| 8-K - 8-K - SCIENTIFIC GAMES CORP | a14-20376_18k.htm |
Exhibit 99.1
|
|
Scientific Games Corporation Lender Presentation September 3, 2014 |

|
|
2 Forward-Looking Statements; Additional Notes Forward-Looking Statements: Throughout this presentation, Scientific Games Corporation (“Scientific Games,” “SGMS” or the “Company”) makes forward-looking statements within the meaning of the U.S. Private Securities Litigation Reform Act of 1995. Forward-looking statements describe future expectations, plans, results or strategies and can often be identified by the use of terminology such as “may,” “will,” “would,” “estimate,” “project,” “assume,” “intend,” “continue,” “believe,” “expect,” “anticipate,” “should,” “could,” “illustrative,” “potential,” “opportunity,” or similar terminology. These statements are based upon management’s current expectations, beliefs, assumptions and estimates and are not guarantees of timing, future results or performance. Similarly, statements herein that describe the pending acquisition of Bally Technologies, Inc. (“Bally” or “BYI”) by Scientific Games (the “Transaction”), including its financial impact, and other statements of management’s expectations, beliefs, assumptions, estimates and goals regarding the Transaction, are forward-looking statements. It is uncertain whether any of the events or results anticipated by the forward-looking statements (including consummation of the Transaction) will transpire or occur, or if any of them do, what impact they will have on the results of operations and financial condition of the combined company or the price of Scientific Games’ or Bally’s stock. These forward-looking statements involve certain risks and uncertainties and other factors that could cause actual results to differ materially from those indicated in such forward-looking statements, including but not limited to: uncertainties as to the timing of the consummation of the Transaction and the ability of the parties to consummate the Transaction; the satisfaction of the conditions precedent to consummation of the Transaction, including the approval of Bally’s stockholders; the ability to obtain required regulatory and gaming approvals at all or in a timely manner; the ability to obtain the debt financing necessary to consummate the Transaction; litigation related to the Transaction; disruption of Bally’s or Scientific Games’ current plans and operations as a result of the Transaction; the ability of Bally or Scientific Games to retain and hire key personnel; competitive responses to the Transaction; unexpected costs, charges or expenses resulting from the Transaction; the ability of Scientific Games to successfully integrate Bally’s operations, product lines and technology; the ability of Scientific Games to implement its plans, forecasts and other expectations with respect to Bally’s business after the completion of the Transaction and to realize additional opportunities for growth and innovation; the ability of Scientific Games to realize the anticipated synergies from the Transaction in the anticipated amounts or within the anticipated timeframes or within costs expectations or at all; the ability of Scientific Games and Bally to maintain relationships with their respective employees, customers, other business partners and governmental authorities; and the other risks, uncertainties and important factors contained and identified (including under the heading “Risk Factors”) in Scientific Games’ and Bally’s filings with the Securities and Exchange Commission (the “SEC”), such as their respective Quarterly Reports on Form 10-Q, Annual Reports on Form 10-K and Current Reports on Form 8-K, any of which could cause actual results to differ materially from the forward-looking statements. The forward-looking statements included in this presentation are made only as of the date hereof and, except for Scientific Games’ and Bally’s ongoing obligations under U.S. federal securities laws, neither Scientific Games nor Bally undertakes any obligation to update any forward-looking statements whether as a result of new information, future events or otherwise. Readers are cautioned not to place undue reliance on any of these forward-looking statements. Additional Notes: Scientific Games sold its installed base of gaming terminals in its pub business on March 25, 2013. As presented herein, Scientific Games’ results exclude the results related to Scientific Games’ discontinued pub operations, unless otherwise noted. This presentation may contain industry market data, industry forecasts and other statistical information. Such information has been obtained from publicly available information, industry publications and other third party sources and Scientific Games makes no representations as to the accuracy of such information. Scientific Games has not independently verified any such information. Trademarks and copyrights are the property of Scientific Games Corporation, WMS Gaming Inc., Bally Technologies, Inc. and/or their respective affiliates and/or licensors. All rights reserved. |

|
|
3 Non-GAAP Financial Measures This presentation includes certain financial measures that were not prepared in accordance with generally accepted accounting principles in the United States (GAAP). Combined Revenue, Attributable EBITDA of SGMS, Attributable EBITDA of Bally, Combined Attributable EBITDA, Attributable EBITDA Margin, Combined Capex, Combined Free Cash Flow (“FCF”), Combined FCF Margin and Combined FCF Available For Debt Repayment are each non-GAAP financial measures presented herein as supplemental disclosures. . Combined Revenue, as used herein, reflects the arithmetic sum of Scientific Games’ revenue (giving effect to the acquisition of WMS Industries, Inc. (“WMS”) in October 2013 for the full applicable period) and Bally’s revenue (giving effect to the acquisitions of SHFL entertainment, Inc. (“SHFL”) in November 2013 and Dragonplay Ltd. in July 2014 for the full applicable period). Unless otherwise noted, SGMS’ social gaming revenue has been recast to reflect revenue reported on a gross basis before platform fees (as a result of a recent change in the Facebook® payment settlement process) for all periods presented. . Attributable EBITDA of SGMS, as used herein, includes Scientific Games’ consolidated EBITDA plus (without duplication) SGMS’ pro rata share of the EBITDA of its joint ventures and minority equity investments, subject to adjustments only to the extent contemplated by the definition of "consolidated EBITDA" in SGMS’ credit agreement. Attributable EBITDA of SGMS, as used herein, also includes the Attributable EBITDA of WMS for the portion of any applicable period presented prior to its acquisition by SGMS and otherwise reflects the same EBITDA-based metric as publicly reported by SGMS. For additional information regarding the definition of Attributable EBITDA of SGMS, see SGMS’ press release dated August 5, 2014. . Attributable EBITDA of Bally, as used herein, represents Bally’s EBITDA subject to the same adjustments that apply to the calculation of Attributable EBITDA of SGMS. Attributable EBITDA of Bally, as used herein, also includes the Attributable EBITDA of SHFL and Dragonplay for the portion of any applicable period presented prior to their acquisition by Bally. Attributable EBITDA of Bally, as used herein, is calculated consistently with the EBITDA-based metric as publicly reported by SGMS but is not the same EBITDA-based metric as publicly reported by Bally. . Combined Attributable EBITDA, as used herein, reflects the arithmetic sum of SGMS’ Attributable EBITDA and Bally’s Attributable EBITDA for the applicable period and, where indicated herein, includes (a) anticipated cost synergies from SGMS’ acquisition of WMS not yet realized as of the end of the applicable period ($58 million as of June 30, 2014), (b) anticipated cost synergies from Bally’s acquisition of SHFL not yet realized as of the end of the applicable period ($18 million as of June 30, 2014), (c) anticipated cost synergies from the Transaction ($220 million) and (d) certain anticipated accounting adjustments in connection with the Transaction to give effect to anticipated accounting reclassifications of brand license royalty guarantee expense from cost of revenue to D&A and certain game approval costs from SG&A to D&A, in each case, to conform to SGMS’ accounting policies ($33 million). Combined Attributable EBITDA does not reflect the costs to achieve any anticipated cost synergies. Attributable EBITDA margin refers to Attributable EBITDA (or Combined Attributable EBITDA, as the case may be) divided by revenue (or Combined Revenue, as the case may be). . Combined Capex, as used herein, reflects the arithmetic sum of SGMS’ capital expenditures and Bally’s capital expenditures for the applicable period (including capital expenditures of WMS and SHFL (but not Dragonplay) for the full applicable period) and, where indicated herein, includes (a) incremental capital expenditures of WMS resulting from certain accounting reclassifications related to SGMS’ acquisition of WMS ($3 million), (b) incremental capital expenditures of BYI resulting from the anticipated accounting adjustments described in the definition of Combined Attributable EBITDA ($33 million), (c) anticipated capital expenditure synergies from the Transaction and (d) the exclusion of capital expenditures incurred by WMS and BYI related to ERP implementations ($5 million) and certain real estate purchases ($13 million). Combined Capex does not reflect the costs to achieve any anticipated capital expenditure synergies. . Combined FCF refers to Combined Attributable EBITDA (including anticipated synergies and certain accounting adjustments, as described above) less Combined Capex. Combined FCF Margin refers to Combined FCF divided by Combined Revenue. . Combined FCF Available for Debt Repayment refers to Combined Attributable EBITDA (including anticipated synergies and certain accounting adjustments, as described above) minus EBITDA from equity investments (net of cash from equity investments) minus Combined Capex minus estimated working capital minus combined cash taxes (ie., SGMS’ LTM 6/30/14 cash tax expense plus BYI’s LTM 6/30/14 non-U.S. cash tax expense) minus estimated cash interest expense (assuming the post-Transaction capital structure). The foregoing non-GAAP financial measures are presented for informational purposes only, do not reflect any purchase accounting or other adjustments resulting from the Transaction (except where indicated) and do not represent “pro forma" amounts determined in accordance with the SEC's rules and regulations, including Article 11 of Regulation S-X. Such measures should not be taken to represent how the companies would have performed had their operations been combined during the periods presented, or how the companies will perform on a combined basis after giving effect to the Transaction. Additional information regarding the foregoing non-GAAP financial measures, including reconciliation information, can be found in the appendix to this presentation. |

|
|
4 Transaction Overview Gaming Business Overview Lottery Business Overview Synergies & Cash Flow Enhancements Financial Overview 1 3 4 6 7 Presenters & Agenda Gavin Isaacs President & CEO Scott Schweinfurth Executive Vice President & CFO Neil Davidson Sr. Vice President, CFO & Treasurer Credit Highlights 5 Transaction Rationale 2 Scientific Games Bally Indicative Terms and Timeline 8 |

|
|
Transaction Overview |

|
|
6 . On August 1, 2014, SGMS announced a definitive agreement to acquire all of the outstanding shares of BYI for $83.30 per share in cash . Transaction value of $5.1 billion (including $1.8 billion of BYI net debt) . 10.4x LTM 6/30/14 BYI Attributable EBITDA of $492 million, excluding anticipated cost synergies and certain accounting adjustments . 6.7x LTM 6/30/14 BYI Attributable EBITDA of $762 million, including anticipated cost synergies and certain accounting adjustments (1) . The transaction is expected to be financed through the following: . $350 million incremental revolver . Incremental to SGMS' existing $300 million revolver (total revolver size of $650 million) (2) . $1,735 million incremental term loan B due in 7 years (3) . $750 million new senior secured notes due in 7 years . $2,200 million new senior unsecured notes due in 8 years . $500 million new senior unsecured notes due in 10 years . $118 million cash on hand . Existing SGMS term loan B and senior subordinated notes expected to remain in place . Net secured leverage and net total leverage expected to be 3.7x and 6.4x, respectively, LTM 6/30/14 Combined Attributable EBITDA of $1,335 million (including anticipated cost synergies and certain other adjustments) . The transaction is expected to close by the end of 2014 . On August 19, 2014, SGMS and BYI received notice of early termination of the waiting period under the Hart-Scott-Rodino Antitrust Improvements Act of 1976 . Transaction remains subject to approval by Bally stockholders, receipt of certain gaming regulatory approvals and other customary closing conditions Executive Summary (1) Amount reflects (a) realization of $220 million of cost synergies anticipated from the pending BYI acquisition, (b) realization of $18 million of cost synergies anticipated by the end of 2014 from the SHFL acquisition and (c) certain accounting adjustments anticipated in connection with the pending BYI acquisition to give effect to accounting reclassifications of brand license royalty guarantee expense from cost of revenue to D&A and certain game approval costs from SG&A to D&A to conform to SGMS’ accounting policies (estimated effect of $33 million). (2) $200 million of total revolver anticipated to be drawn at closing. (3) In any event, the maturity of the incremental term loan B will not extend beyond that of the new senior secured notes. |

|
|
7 ($ in millions) Anticipated Sources of Funds Amount Cash From BYI / SGMS Balance Sheet $118 Expanded Revolver (to $650) 200 Rolled SGMS Term Loan B 2,289 Incremental Term Loan B 1,735 New Secured Notes 750 Rolled Other SGMS Debt 48 New Senior Unsecured Notes (8-year) 2,200 New Senior Unsecured Notes (10-year) 500 Rolled SGMS Senior Sub. Notes 900 Total Sources of Funds $8,739 Anticipated Uses of Funds Amount Purchase Price of BYI Equity ($83.30 per Share) $3,241 Refinancing Existing BYI Debt 1,932 Rolled SGMS Term Loan B 2,289 Rolled Other SGMS Debt 48 Rolled SGMS Senior Sub. Notes 900 Fees & Expenses 330 Total Uses of Funds $8,739 Sources & Uses and Combined Capitalization (1) Cash balances do not include the impact of cash flow anticipated to be generated from 6/30/14 to the expected closing of the pending BYI acquisition. Excludes restricted cash. (2) See page 3 for definitions of SGMS Attributable EBITDA, BYI Attributable EBITDA and Combined Attributable EBITDA. (3) Amount reflects (a) realization of $58 million of cost synergies anticipated by the end of 2015 from the WMS acquisition, (b) realization of $18 million of cost synergies anticipated by the end of 2014 from the SHFL acquisition, (c) realization of $220 million of cost synergies anticipated from the pending BYI acquisition and (d) certain anticipated accounting adjustments described in footnote (1) on page 6 (estimated effect of $33 million). ($ in millions) 6/30/14A Anticipated Combined Capitalization SGMS BYI Adj. Combined Cash (1) $89 $77 ($118) $49 SGMS Revolver ($300) -- -- -- -- BYI Revolver ($1,070) -- 770 (770) -- Expanded Revolver (to $650) -- -- 200 200 SGMS Term Loan B 2,289 -- -- 2,289 SGMS Incremental Term Loan B -- -- 1,735 1,735 BYI Term Loan A -- 340 (340) -- BYI Term Loan B -- 822 (822) -- New Secured Notes -- -- 750 750 Capital Leases and Other 48 -- -- 48 Total Secured Debt $2,336 $1,932 $753 $5,021 New Senior Unsecured Notes (8-year) -- -- 2,200 2,200 New Senior Unsecured Notes (10-year) -- -- 500 500 Total Senior Debt $2,336 $1,932 $3,453 $7,721 SGMS 8.125% Senior Subordinated Notes 250 -- -- 250 SGMS 6.250% Senior Subordinated Notes 300 -- -- 300 SGMS 6.625% Senior Subordinated Notes 350 -- -- 350 Total Debt $3,236 $1,932 $3,453 $8,621 Net Debt 3,147 1,855 3,571 8,573 Combined Attributable EBITDA - LTM 6/30/14 SGMS BYI Adj. Combined SGMS Attributable EBITDA (2) $515 -- -- $515 BYI Attributable EBITDA (2) -- 492 -- 492 Unrealized Synergies & Certain Acct. Adj. (3) -- -- 329 329 Comb. Attributable EBITDA (Incl. Synergies & Acct. Adj.) (2) $515 $492 $329 $1,335 Total Secured Debt / Combined Attributable EBITDA 4.5x 3.9x 3.8x Total Senior Debt / Combined Attributable EBITDA 4.5x 3.9x 5.8x Total Debt / Combined Attributable EBITDA 6.3x 3.9x 6.5x Total Secured Net Debt / Combined Attributable EBITDA 4.4x 3.8x 3.7x Total Net Debt / Combined Attributable EBITDA 6.1x 3.8x 6.4x |

|
|
Transaction Rationale |

|
|
9 . Diverse portfolio of products and services with broad global distribution and significant recurring revenue . One-stop-shopping for gaming and lottery customers . Best-in-class product development teams, player research, analytics, business processes and product pipeline . Enhanced international presence, particularly in the growing AustralAsia region . Influential player in fast-growing online social gaming and real money gaming with extensive content library . Strong cultural fit with common focus on innovation, customer-first approach and accountability . Management teams have successful historical working relationships . Both companies have recent success in integration planning and implementation Compelling Strategic Rationale Strategic Rationale |
|
|
10 Combining Complementary Products, Services and Operations SGMS BYI Instant Lottery Products Design and printing of secure scratch-off instant lottery tickets, marketing support and licensing/loyalty programs Lottery Systems Draw game-based lottery systems, online keno and sports betting systems, and ticket validation systems Gaming Machines Sale and support of gaming content, gaming machines and VLTs Gaming Operations Lease of gaming machines, including wide-area progressive and other leased and participation-based gaming machines Interactive Gaming Top-tier interactive social gaming apps, and proven slot and table game content for real-money online casino operators Proprietary Table Games Proprietary table products that enhance existing table game operations Electronic Table Systems Table games offered on a gaming machine without a live dealer Gaming Systems Slot accounting, player tracking, networked gaming, bonusing, marketing and business intelligence systems Utility Products Products to enhance productivity and security, including automatic card shufflers |

|
|
11 Nonrecurring Revenue . Expected to diversify revenue base, expand margins (~940 bps) and accelerate global growth opportunities . Bally brings leading gaming systems and table products businesses (17% of LTM 6/30/14 Combined Revenue) . Significantly enhanced scale enabling realization of supply chain efficiencies . LTM 6/30/14 Combined Revenue of ~$3.0 billion (1) . LTM 6/30/14 Combined Attributable EBITDA (including synergies and certain accounting adjustments) of ~$1.3 billion (1) . ~60% of LTM 6/30/14 Combined Revenue is recurring in nature (2) . Significantly improves free cash flow profile to enable meaningful deleveraging . Approximately $400 million of Combined FCF Available for Debt Repayment (3) . $220 million of anticipated cost synergies and $25 million of anticipated capex synergies with ~80% expected to be achieved in year 1 and 100% in year 2 Compelling Financial Rationale Financial Rationale Note: U.S. Dollars in millions. (1) See definitions on page 3. (2) For purposes hereof, Combined Revenue that is recurring in nature refers to a subset of Combined Revenue consisting of (a) services revenue from SGMS’ instant products and lottery systems segments (typically generated under long-term contracts), (b) SGMS’ and BYI’s gaming operations revenue from the placement of gaming machines, which remain on the casino floor as long as performance is acceptable but which have an estimated average life on the floor of approximately four years (with periodic game theme updates to refresh performance), (c) maintenance and software service revenue from BYI’s gaming systems business, (d) lease, license, service and warranty revenue from BYI’s table products and (e) SGMS’ and BYI’s B2B real money gaming revenue. (3) See page 38 for illustrative computation. Combined Recurring Revenue LTM 6/30/14 Combined Revenue: ~$3 billion ~60% Recurring 26% 17% 7% 5% 4% 1% 25% 6% 5% 2%2% <1% Gaming Operations Instant Products Lottery Systems Gaming Systems Table Products Interactive Gaming Machines Sales Gaming Systems Interactive Lottery Systems Table Products Instant Products 125 144 32 43 18 33 ~$175 ~$220 Year 1 Year 2 SG&A R&D COGS Anticipated Cost Synergies Recurring Revenue (2) 26% 17% 7% 5% 4% 1% 25% 6% 5% 2%2%0% Gaming Operations Instant Products Lottery Systems Gaming Systems Table Products Interactive Gaming Machines Sales Gaming Systems Interactive Lottery Systems Table Products Instant Products 26% 17% 7% 5% 4% 1% 25% 6% 5% 2%2%0% Gaming Operations Instant Products Lottery Systems Gaming Systems Table Products Interactive Gaming Machines Sales Gaming Systems Interactive Lottery Systems Table Products Instant Products |

|
|
Gaming Business Overview |

|
|
13 $308 $431 $739 LTM 6/30/14 SGMS BYI Gaming Product Sales Overview Note: U.S. $ in millions. (1) Pro forma for WMS and SHFL acquisitions. (2) Excludes depreciation and amortization for SGMS and excludes amortization related to intangible assets for BYI. (3) Source: Eilers Research, company filings and SGMS estimates. Highlights U.S. and Canada 2Q 2014 Estimated Ship Share (3) . A leading supplier of for-sale gaming machines to casinos and other gaming operators worldwide . Broad range of video and mechanical reel gaming machines . Sales of high-margin conversion kits and replacement parts . Serves Class III, Class II and video lottery sectors . Current SGMS ASP of ~$15,000 and BYI ASP of ~$17,000, both at ~50% cost of revenue / revenue 22% 14% 21% 16% 11% 3% 13% Bally SGMS IGT Aristocrat Konami MGAM Other BYI surpassed IGT in U.S. and Canada shipments in 2Q for the first time ever (3) SGMS + BYI combined total ship share of 35% Revenue (1) Revenue Less Cost of Revenue (2) $159 $215 $374 LTM 6/30/14 SGMS BYI |

|
|
14 Gaming Product Sales - Product Pipeline ¦ New 3-reel Mechanical Blade machine launched in late March should provide strong growth opportunities ¦ Opens up segment of casino floor for which WMS has not had product to sell for the last few years ¦ 2H 2014 planned ramp up of new themes for the cabinet: 8 themes in 1H vs. 19 themes anticipated in 2H ¦ 135 units were shipped in the last few weeks of 1Q 2014 shortly after the launch followed by 617 units in 2Q 2014 ¦ New ALPHA 2 Pro Series Wave machine launched in early 2014 ¦ The industry’s first cabinet with a 40-inch concave LCD touchscreen monitor ¦ Virtually all of BYI’s catalog of video-slot games for the Pro Series V32 and V22/22 can be played on the Pro Wave SGMS BYI ¦ The Equinox™ cabinet features ¦ Attractive dual 22-inch widescreen LCDs, illuminated button panels ergonomically designed to offer increased ease of play ¦ Ear-level speakers deliver a more crisp sound quality |

|
|
15 Gaming Operations Overview Highlights North America 2Q 2014 Installed Base (3) . SGMS and BYI-owned gaming machines leased to casinos and other gaming operators . Revenue based on a % of coin-in, a % of net win, a fixed daily fee or a combination . Many based on well-recognized gaming entertainment brands . Wide area progressive (WAP), local area progressive (LAP) and stand-alone gaming machines leased to customers . Generates revenue that is recurring in nature with high return . SGMS WAP and premium participation units installed base of 8,732 units and BYI WAP installed base of 2,486 units as of 6/30/14 . SGMS average daily revenue per WAP and premium participation unit of ~$70 and BYI average daily revenue per WAP unit of $80 - $100 37% 17% 11% 8% 4% 2% 21% IGT Bally SGMS Aristocrat Konami MGAM Other Sample Size – 43,830 Units SGMS + BYI combined total leased game share of 28% Revenue (1) $383 $411 $794 LTM 6/30/14 SGMS BYI $283 $271 $555 LTM 6/30/14 SGMS BYI Revenue Less Cost of Revenue (2) Note: U.S. $ in millions. (1) Pro forma for WMS and SHFL acquisitions. (2) Excludes depreciation and amortization for SGMS and excludes amortization related to intangible assets for BYI. (3) Source – Eilers Research, LLC Reports. Leased games include participation games, WAP, LAP, daily fee and VLT/Class II leased games in North America. |

|
|
16 Gaming Operations – Product Pipeline SGMS BYI ¦ Total installed base of 12,543 units worldwide at 6/30/14 ¦ Lottery expansion opportunities, including New York ¦ Growth opportunities ¦ BYI represents only ~15% of the WAP footprint in the U.S. ¦ 7 new WAP titles including Titanic and the Magic of David Copperfield shown at 2013 G2E ¦ 8 new premium titles including ZZTop Live from Texas and Quick Hit Cash Wheel shown at 2013 G2E ¦ Duo Fu Duo Cai recently launched in the U.S. WAPs VLT Premium Leased Games ¦ Scheduled to be launched in 2H 2014: ¦ The first Blade participation game – Monopoly Luxury Diamonds with Wheel Bonus (launched at beginning of July) ¦ The first Willy Wonka game on the new 2.0 Gamefield platform ¦ Launch of 6 new games using 5 new licensed brands: Star Trek, Mad Men, Jetsons, Elton John, Flintstones and in January, Elvis Monopoly Luxury Diamonds Performance (1) Casino Units Avg Coin-in vs. Other WAP (2) Casino 1 2 $6,076 1.05 Casino 2 2 $5,583 2.07 Casino 3 2 $11,931 1.83 Casino 4 2 $8,000 1.48 Casino 5 7 $23,921 3.47 Casino 6 4 $13,956 2.02 Casino 7 2 $8,916 2.10 Casino 8 4 $4,011 1.26 Casino 9 4 $6,282 1.99 Grand Total 29 $13,265 2.15 (1) Represents performance of Monopoly Wheel Blade 3RM (R). (2) Represents Monopoly Wheel Blade 3RM (R) average coin-in per day divided by the average of other WAP coin-in at each casino. 910 2,486 3Q11 4Q14 2Q14 Installed Base (num. of units) 3Q11 2,486 910 |

|
|
17 . Gamefield 2.0 . 32 inch horizontal screen . New brand . Expected launch in 4Q 2014 . The Flintstones was the most financially successful animated series for 3 decades until “The Simpsons” debuted in 1989 (1) Gaming Operations Overview - Product Pipeline . Utilizes all sound chairs . Expected launch in 4Q 2014 . This new brand features several great attributes . Elton John has tremendous mass appeal . Great music . Great iconography Elton John The Flintstones (1) Source: Excavating Bedrock: Reminiscences of “The Flintstones”, Hogan's Alley #9, 2000. |

|
|
18 ¦ BYI systems are the gold standard in the industry ¦ BYI system links various gaming machines on a floor and provides services such as slot monitoring, player tracking, marketing and intelligence technology ¦ Technology allows real-time monitoring of performance and interaction with player (e.g., offering free play or coupon to customer) ¦ Approximately 30% of revenues are annual maintenance revenues, which have a historical renewal rate of virtually all customers Revenue (1) $71 $65 $102 $124 $41 $34 $53 $51 $24 $36 $49 $50 $69 $83 $97 $97 $205 $218 $301 $322 $0 $50 $100 $150 $200 $250 $300 $350 CY11A CY12A CY13A LTM 6/30/14 Hardware Software/Other Services Maintenance ¦ New customers – casino openings or by displacing competitors ¦ New hardware and software to existing customers ¦ Drivers of recent growth ¦ New iView Display Manager is installed in only 8% of current systems ¦ Maintenance and service revenue is recurring in nature ¦ SDS for Windows targets casinos with less than 1,000 slots where BYI’s share is estimated to be only ~16% $ in millions Gaming Systems Overview Gross Margin (1)(2) $ in millions $154 $162 $224 $231 $0 $50 $100 $150 $200 $250 CY11A CY12A CY13A LTM 6/30/14 Gross Margin %: 74% 75% 74% 72% Business Line Overview Systems Revenue Sources Note: U.S. Dollars in millions. (1) Excludes interactive results. (2) Excludes amortization related to intangible assets. |
|
|
19 Note: U.S. Dollars in millions, except number of games and $ per game figures. (1) Source – Eilers Research, LLC Reports. IGT, Konami and Other units are estimated. Aristocrat units are for U.S. and Canada while IGT, BYI and Konami are worldwide. 0 50 100 150 200 250 300 350 CY04 CY05 CY06 CY07 CY08 CY09 CY10 CY11 CY12 CY13 BYI IGT + Aristocrat + Konami + Other ¦ LTM 6/30/14 maintenance revenue of $97mm; growing at a 15% CAGR since FY08 ¦ Typical new systems installation costs: ~$3,500 - $4,500 per gaming device $ Gaming Systems Overview (cont’d) Annual Systems Revenue (1) Revenue Growth Potential Future Revenue Opportunities # of Games $ Per Game $ Potential Over 5-7 Years Current Customers to Sell New Products ~450K ~$2,500 $1,100 Share Gains ~120K ~$3,500 420 New Opportunities (assuming 50% share) ~100K ~$3,500 350 Recurring Revenue Sources - Per Annum Increasing Maintenance $10 Increasing Services $7-10 |

|
|
20 ¦ Utility products for table games: ¦ Increase speed of play; higher player turnover ¦ Enhanced security ¦ Includes card shufflers, roulette chip sorters, shoes and deck checkers ¦ Fastest growth is in Asia (1) $85 $97 $109 $108 61% 62% 63% 61% 0% 20% 40% 60% 80% $0 $50 $100 $150 $200 CY11A CY12A CY13A LTM 6/30/14 Revenue Gross Margin Utilities Overview Revenue (1) Business Line Overview DeckM ate 2 Poker M D3 Blackjack, Baccarat iDeal Single Deck Specialty (PTG) o ne2six Continuous Blackjack, Face-Up Baccarat, Single-Deck Specialty SHF L-F lex New Shuffler Technology Enables Leasing Opportunities on Underutilized Tables Utilities KPIs 7,944 8,482 8,550 8,923 $444 $454 $470 $447 $0 $100 $200 $300 $400 $500 0 2,000 4,000 6,000 8,000 10,000 12,000 CY11A CY12A CY13A LTM 6/30/14 Lease Base Avg. Monthly Lease Rate $ in millions (1) Pro forma for SHFL acquisition. (2) Excludes amortization related to intangible assets. (2) |

|
|
21 ¦ Games for which BYI owns or licenses intellectual property ¦ 99% of revenue is recurring in nature ¦ Higher house advantage than public domain games ¦ High volatility creates player appeal for premium payouts on high hands ¦ More than 30 relevant brands ¦ Progressive/add-on upgrades ¦ Only ~25% of table game base has been upgraded ¦ New content and new features ¦ ~30% of all tables are proprietary ¦ Gaining popularity internationally ¦ Significant Macau expansion opportunity (1) $45 $51 $57 $59 80% 82% 83% 86% 0% 20% 40% 60% 80% 100% $0 $20 $40 $60 $80 $100 CY11A CY12A CY13A LTM 6/30/14 Revenue Gross Margin $ in millions Proprietary Table Games Overview Revenue (1) Business Line Overview 5,843 7,095 7,757 8,722 $618 $573 $584 $559 $0 $100 $200 $300 $400 $500 $600 $700 0 2,000 4,000 6,000 8,000 10,000 12,000 14,000 CY11A CY12A CY13A LTM 6/30/14 Lease Base Avg. Monthly Lease Rate Proprietary Table Games KPIs (1) (1) Pro forma for SHFL acquisition. (2) Excludes amortization related to intangible assets. (2) |

|
|
22 703 723 978 1,111 $19,451 $18,201 $17,182 $16,147 $0 $3,000 $6,000 $9,000 $12,000 $15,000 $18,000 $21,000 0 200 400 600 800 1,000 1,200 CY11A CY12A CY13A LTM 6/30/14 New Units Sold Avg. Sales Price ¦ Table games offered on a gaming machine with or without a live dealer ¦ Reported in both gaming sales and gaming operations ¦ Opportunity to upgrade legacy installed base of 8,000 sold seats ¦ Strong sales in Australia and Asia ¦ Allows increase in low-denomination table offering in Macau, which is subject to a table cap ¦ Multigame feature gives player more options than live tables ¦ Allows casino to offer table games in jurisdictions that only allow EGMs ¦ Less costly than having a dealer for low-denomination games, which usually are not profitable for casinos ¦ New SHFL Table Master Fusion electronic table creates replacement opportunities (1) Electronic Table Systems Overview Electronic Table Systems KPIs (1) Business Line Overview (1) Pro forma for SHFL acquisition. |
|
|
23 ¦ On July 1, 2014, BYI acquired Dragonplay, a leading online social casino company that develops and publishes social games for smartphones and Facebook ¦ Portfolio includes Live Hold'em Pro, Wild Bingo, Dragonplay Slots and Farm Slots ¦ Adds table games to the social games portfolio ¦ Unique table offering to be complemented with SHFL proprietary table games ¦ Social casino gaming sector is ~$3bn, with $2bn coming from US players, and is expected to be the healthiest and fastest growing sector of gaming in North America (1) ¦ Allows casino to augment land-based casino gaming with mobile and online play-for-free games ¦ Allows lotteries to mimic real world social interaction with their brands, games, players and prizes – but on a much larger scale (1) $24 $98 $110 69% 69% 66% 0% 20% 40% 60% 80% $0 $60 $120 $180 CY11A CY12A CY13A LTM 6/30/14 SGMS Revenue less Cost of Revenue % $ in millions SGMS ¦ Jackpot Party® Social Casino is among the top grossing casino sites across multiple platforms (2) ¦ Play4Fun Network™ is first-of-its-kind white-label B2B freeplay BYI ¦ Dragonplay ranks among the 10 top-grossing game developers in the social casino genre on GooglePlay (2) ¦ Strong presence on the Android platform – benefits from lower costs Combined Opportunities ¦ Cross-distribute content on all platforms ¦ Opportunity to expand Dragonplay distribution beyond Android platforms ¦ Anticipated cost synergies from elimination of duplicative functions and consolidation of management team under the same leadership Social Gaming Overview Social Gaming Revenue (3) Business Line Overview Product Highlights BYI Dragonplay Acquisition (1) Source – Wall Street Research. (2) Source – Eilers Research, LLC Reports. (3) Amounts pro forma for WMS acquisition but not Dragonplay acquisition. SGMS social gaming revenue has been recast to reflect revenue reported on a gross basis before platform fees (as a result of a recent change in the Facebook® payment settlement process) for all periods presented (effect of $6 million, $20 million and $8 million in the CY12A, CY13A and LTM 6/30/14 periods, respectively). (4) Excludes depreciation and amortization. Acquisition Date 7/1/2014 Purchase Price ~$100mm (based on maximum earnout payments of $49mm) LTM 6/30/14 Revenue $33mm LTM 6/30/14 EBITDA $10mm (4) |

|
|
24 $7 $15 $18 $2 $5 $7 $3 $9 $20 $25 89% 85% 82% 79% 0% 20% 40% 60% 80% 100% $0 $5 $10 $15 $20 $25 $30 $35 $40 CY11A CY12A CY13A LTM 6/30/14 SGMS BYI Revenue less Cost of Revenue % ¦ The content provider portion of real-money gaming is a ~$400mm industry and is growing at ~15% CAGR (1) ¦ Integration of extensive library of proven gaming content to realmoney online casino operator websites $ in millions Real-Money Interactive Gaming Overview SGMS ¦ Remote Game Server Integration – provide slots and other games to real-money online casino operators through compatible interface game server integration; currently have real-money gaming agreements with 18 online casino operators ¦ Customers include the Rank Group, British Columbia Lottery Corporation, Betfair, 888, Bonnier Gaming, Sky Betting & Gaming, Gamesys Group, bwin.party, Ladbrokes, William Hill and Gala Coral BYI ¦ The iGaming Platform utilizes cloud-based technology to deliver gaming contents across multiple channels such as the web, social networks, tablets and smart phones Combined Opportunity ¦ Standardize onto one platform to offer online casino customers the benefits of WMS, SGMS, SHFL, BYI and Dragonplay content through one-stop shopping Real-Money Gaming Revenue Business Line Overview Product Highlights (1) Source: H2 Gambling Capital. Assumes 65% of N.A. casino and bingo sectors are legalized. (2) Excludes depreciation and amortization for SGMS and excludes amortization related to intangible assets for BYI. (2) |

|
|
Lottery Business Overview |

|
|
26 $28 $30 $30 $30 $31 $32 $35 $37 FY06 FY07 FY08 FY09 FY10 FY11 FY12 FY13 Global Lottery Industry Overview €13 €17 €19 €21 €21 €23 €22 €22 FY06 FY07 FY08 FY09 FY10 FY11 FY12 FY13 $23 $22 $22 $22 $23 $23 $24 $25 FY06 FY07 FY08 FY09 FY10 FY11 FY12 FY13 1.4% 6.1% 3.2% 4.9% 4.4% 4.0% FY12 FY13 FY14E FY15E FY16E FY17E Note: Represents sum of lottery revenues as reported based on the fiscal year of each lottery. The U.S. lottery industry’s fiscal year generally ends on June 30th. (1) Source: LaFleur's World Lottery Almanac. (2) Source: Global Betting and Gaming Consultants report. U.S. Instant Products Retail Sales (1) U.S. Draw Games Retail Sales (1) Global Lottery Industry Revenue Growth (2) Italy Lottery Retail Sales (1) $ in billions $ in billions € in billions |
|
|
27 Instant Products Overview . Large global industry: ~$80 billion of instant games sold at retail worldwide annually (1) . A leading worldwide instant lottery game provider, serving 38 of the 44 U.S. jurisdictions that sell instant lottery games and ~50 countries . Five highly sophisticated, secure printing facilities on four continents; capacity to print in excess of 46 billion instant tickets annually . Largest portfolio of licensed brands for lottery products . A leader in lottery loyalty and rewards programs . Long-term contracts with high contract renewal rates Note: U.S. $ in millions. (1) Source: LaFleur's World Lottery Almanac. (2) Excludes depreciation and amortization. Revenue Revenue Less Cost of Revenue (2) $503 $505 $530 $541 CY11 CY12 CY13 LTM 6/30/14 $215 $215 $235 $244 CY11 CY12 CY13 LTM 6/30/14 |

|
|
28 Lottery Systems Overview . ~$180 billion global draw-based game annual sales (1) . A leading supplier of lottery systems, technology and terminals . 13 U.S. systems contracts (2) . ~200,000 lottery retailer terminals installed globally Revenue Revenue Less Cost of Revenue (3) $230 $253 $261 $276 CY11 CY12 CY13 LTM 6/30/14 $101 $108 $109 $108 CY11 CY12 CY13 LTM 6/30/14 Note: U.S. $ in millions. (1) Source: LaFleur's World Lottery Almanac. (2) Include IN where SGMS currently provides network & retailer terminals to GTECH and MN & NC internet gaming systems. (3) Excludes depreciation and amortization. |
|
|
29 Lottery Pipeline . In April, the Multi-State Lottery Association announced MONOPOLY™ Millionaire’s Club by SGMS was selected as a new national premium draw game with an associated national TV game show . Scheduled to launch in October 2014 followed by TV game show scheduled to start in spring 2015 . 22 state lotteries with 173 million population agreed to participate at launch . In May 2014, the first retail sales of instant games began in Greece . Performance to date has been in line with plan, despite slower ramp up of retail locations. May provide upside once full retail network is operational . In July, the Turkish Privatization Administration announced that Net-Sans-Hitay had been selected to operate the Turkish national lottery, Milli Pyango, under a 10-year license to be negotiated . SGMS would be the exclusive supplier to Net Sans-Hitay . There are 15 lottery systems contracts up for competitive bidding over the next 18 months . SGMS is the incumbent in only Maryland and Puerto Rico |

|
|
Credit Highlights |

|
|
31 Credit Highlights A Leading Global Gaming and Lottery Company Significantly Enhanced Scale and Diversification Lottery, Gaming Operations, Gaming Systems & Table Product Businesses Have Significant Recurring Revenue Clearly Identified Anticipated Synergies and Integration Plan Backed by Recent Successful Integration Experience Enhanced Organic Revenue Opportunities Strong FCF Generation and Commitment to Meaningful Deleveraging Strong Management Team 1 2 3 4 5 6 7 |

|
|
32 $2,089 $1,007 $515 $492 $230 $329 $58 $18 $2,319 $1,335 $573 $510 $462 $451 $330 $253 $110 $91 $79 $25 GTK-IT + IGT SGMS + BYI SGMS BYI Amaya Novo ALL--+V INLOT MGAM Konami Ainsworth Pollard 50.4% 44.4% 41.0% 40.0% 37.5% 37.2% 37.0% 35.0% 32.6% 29.0% 13.1% 10.8% MGAM SG + BYI Novomatic Amaya Ainsworth BYI GTK-IT + IGT SGMS ALL-AU + VGT Konami Pollard INLOT $6,274 $3,007 $2,345 $1,636 $1,371 $1,156 $1,102 $1,011 $314 $218 $210 $188 GTK+IGT SG+BYI INLOT SGMS BYI Amaya Novomatic ALL-AU + VGT Konami MGAM Ainsworth Pollard + + (1) SGMS, BYI, IGT, GTECH, Konami, Multimedia, Intralot and Pollard figures are based on LTM 6/30/2014. Amaya figures are based on LTM 5/31/2014. Aristocrat + VGT figures are based on LTM 3/31/2014. Ainsworth and Novomatic figures are based on LTM 12/31/2013. EBITDA represents Attributable EBITDA for SGMS and BYI and Combined Attributable EBITDA of SGMS + BYI. Included companies do not necessarily calculate EBITDA or EBITDA margin in the same manner, which limits comparability. (2) Includes B2C retail gaming operations business. Includes $230 million of anticipated cost synergies from GTECH’s pending acquisition of IGT. (3) Pro forma for BYI acquisition. Attributable EBITDA and Attributable EBITDA margin reflect anticipated cost synergies and certain anticipated accounting adjustments described in definition of Combined Attributable EBITDA on page 3. (4) Includes B2C retail gaming operations business. (5) Pro forma for WMS acquisition. Attributable EBITDA and Attributable EBITDA margin reflect realization of $58 million of remaining cost synergies anticipated from the WMS acquisition. (6) Pro forma for SHFL and Dragonplay acquisitions. Attributable EBITDA and Attributable EBITDA margin reflect the realization of $18 million of remaining cost synergies anticipated from the SHFL acquisition. (7) Pro forma for the acquisition of Oldford Group Limited, which includes PokerStars and Full Tilt Poker. (8) Revenue, EBITDA and EBITDA margin reflect gaming segment only. (4) (2) (3) (8) (8) (5) (6) Revenue ($ in Millions) (1) EBITDA ($ in Millions) (1) EBITDA Margin (1) A Leading Global Gaming and Lottery Company 1 + + + + (4) (2) (3) (8) (8) (5) (6) + (3) (8) (6) (5) (8) (4) + + (2) (7) (7) (7) (6) Anticipated Synergies and Certain Accounting Adjustments |

|
|
33 A Leading Global Gaming and Lottery Company Instant Tickets Lottery Systems Slots WAP Gaming Systems Utility Products Proprietary Table Games Electronic Table Systems Real Money Online Gaming Social Gaming Combined company would be the most diversified gaming and lottery company in the world 1 P P P P P P P P P P P P P P P P P P P P P P P P P P P + + + P P P P P P P P |
|
|
34 26% 25% 18% 11% 9% 6% 5% Gaming Operations Gaming Machines Sales Instant Products Gaming Systems Lottery Systems Table Products Interactive 30% 32% 24% 12% 2% SGMS BYI 23% 19% 17% 8% 33% Combined SGMS + BYI Significantly Enhanced Scale and Diversification 2 Revenue: ~$1.6 billion (1) Revenue: ~$1.4 billion (2) Revenue: ~$3.0 billion (1) Pro Forma for WMS acquisition. (2) Pro Forma for SHFL and Dragonplay acquisitions. Diversified business reduces reliance on any individual business line . Further enhances gaming business – increases economies of scale . Expanded library of intellectual property and innovative technologies allows the combined company to offer the best solution to each customer . More diversified combined gaming business . International will represent approximately one-third of combined revenue LTM 6/30/14 Revenue by Business Line |
|
|
35 Lottery, Gaming Operations, Gaming Systems & Table Product Businesses Have Significant Recurring Revenue . Lottery Systems: U.S. contracts generally are for a minimum of 5-year terms and typically contain multiple renewal options that generally have been exercised by lotteries in the past . Instant Products: U.S. contracts are generally for 3-5 year terms, frequently with multiple renewal options which lotteries have generally exercised in the past . Gaming Operations: . Class 3 participation gaming machines generally remain on casino floors as long as performance is acceptable – usually about 4 years – with periodic new game theme updates to refresh cabinet performance . VLT units generally subject to multi-year contracts (e.g., 7-year contract for NY VLTs expiring December 2017) . Table Products: Proprietary table games (99% leased) and utility products (e.g., shufflers) (50% leased), which generate recurring lease, license, service and warranty revenues (~72% of total business line revenue) . Generally proprietary table games and utility products have an average life of 15-20 and 10-15 years, respectively . Gaming Systems: Systems maintenance revenues are generated from perpetual software licenses on all software sold. Systems services backlog has been regularly refreshed with new customers . Certain large casino customers have generally used Bally systems for roughly 40 years . Interactive: Anticipate long life in B2B real money gaming and table content relationships as content is integral to casino operator’s offerings 26% 17% 7% 5% 4% 1% 25% 6% 5% 2%2% <1% Gaming Operations Instant Products Lottery Systems Gaming Systems Table Products Interactive Gaming Machines Sales Gaming Systems Interactive Lottery Systems Table Products Instant Products LTM 6/30/14 Combined Revenue: ~$3.0 billion ~60% Recurring 3 Combined SGMS + BYI (1) See footnote (2) on page 11 for a description of revenue characterized as recurring in nature for purposes hereof. Nonrecurring Revenue Recurring Revenue (1) 26% 17% 7% 5% 4% 1% 25% 6% 5% 2%2%0% Gaming Operations Instant Products Lottery Systems Gaming Systems Table Products Interactive Gaming Machines Sales Gaming Systems Interactive Lottery Systems Table Products Instant Products 26% 17% 7% 5% 4% 1% 25% 6% 5% 2%2%0% Gaming Operations Instant Products Lottery Systems Gaming Systems Table Products Interactive Gaming Machines Sales Gaming Systems Interactive Lottery Systems Table Products Instant Products |

|
|
36 ~$175 ~$220 Year 1 Year 2 20.2% 32.8% 35.0% 44.4% 66% 19% 15% SG&A R&D COGS (1) Amounts pro forma for WMS acquisition. Standalone SGMS Attributable EBITDA margin reflects realization of $58 million of remaining cost synergies anticipated from the WMS acquisition. Combined Attributable EBITDA Margin reflects anticipated cost synergies and certain anticipated accounting adjustments described in definition of Combined Attributable EBITDA on page 3 (estimated total effect of $329 million). (2) Standalone SGMS FCF reflects SGMS Attributable EBITDA of $573 million including $58 million of remaining cost synergies anticipated from the WMS acquisition minus SGMS adjusted capex of $243 million. Combined FCF reflects Combined Attributable EBITDA of $1,335 million minus Combined Capex of $349 million (see definition of Combined Capex on page 3) ~$220 million ~80% of synergies expected to be achieved in Year 1 consistent with WMS integration timing – SHFL integration expected to be completed in Year 1 Clearly Identified Anticipated Synergies and Integration Plan Backed by Recent Successful Integration Experience 4 Focused integration plan led by an experienced team Bally’s historical higher EBITDA conversion to cash plus anticipated cost synergies expected to result in over 30% Combined FCF margin + Combined + Combined LTM 6/30/2014 Combined FCF (2) Margin Anticipated Cost Synergies Detail LTM 6/30/14 Attributable EBITDA Margin (1) Expected Timeline Anticipated synergies and operational excellence result in top-tier margins |

|
|
37 Enhanced Organic Growth Opportunities 5 1 2 3 4 5 Cross-selling: Cross-distribution of WMS, SGMS, BYI and SHFL content across multiple sectors Game Content: BYI titles used in SGMS products and across platforms (online, lottery, mobile) and vice versa IP & Licensed Brands: Cross-utilization of each company’s IP and brand portfolio across products and platforms International Expansion: Immediate strong presence in growing AustralAsia region due to legacy SHFL business; combined teams in other regions provide global growth opportunities Interactive Businesses: Cross-distribute WMS, SGMS, BYI, SHFL and Dragonplay content across social and real-money gaming platforms |

|
|
38 515 894 397 492 329 25 (24) (349) (50) (18) (497) $1,007 (374) $894 $397 LTM 6/30/14 Combined Attributable EBITDA Anticipated Synergies and Other Adjustments EBITDA from Equity Investments Net of Cash From Equity Investments Combined CapEx Working Capital Estimate Combined Cash Taxes Cash Flow Available for Debt Service PF Cash Interest LTM 6/30/14 Combined FCF Available for Debt Repayment Synergies & Other Adjustments (2) (4) (5) (6) (3) Strong FCF Generation and Commitment to Meaningful Deleveraging . Free cash flow prioritized to pay debt . Focus on deleveraging with the goal to achieve ~4x leverage by the end of the next 4 years . Combined liquidity of $457 million as of 6/30/14 (1) 6 Note: U.S. Dollars in millions. (1) Computed as cash on hand plus anticipated undrawn revolver (including contemplated incremental revolver) less outstanding letters of credit. Combined liquidity does not include the impact of cash flow generation anticipated from 6/30/14 to the anticipated closing of the pending BYI acquisition. (2) Amount reflects realization of anticipated cost synergies and certain accounting adjustments described in definition of Combined Attributable EBITDA on page 3. (3) Amount reflects EBITDA from equity investments net of distributed earnings from equity investments and return of capital payments from equity investments. (4) See definition of Combined Capex on page 3. (5) Represents SGMS’ LTM 6/30/14 cash tax expense plus BYI’s LTM 6/30/14 non-U.S. cash tax expense. (6) Represents cash interest expense assuming anticipated post-closing combined company capital structure is in place for LTM period. Substantial amount of Attributable EBITDA expected to convert into free cash flow . As of December 31, 2013, SGMS reported net operating losses (NOLs) that could offset $144 million of future federal taxes due . Accounting for additional interest expense and other deductions and tax credits, SGMS is not expected to be a cash federal tax payer in the U.S. until 2020 . Section 199 domestic production activity deduction and foreign tax credits and R&D tax credits for BYI and SGMS, expected to take effect in 2020 after anticipated depletion of NOLs in 2019 Maintain disciplined approach to deploy capital under new policy Substantial cash flow savings expected from SGMS tax attributes |
|
|
39 Gavin Isaacs President and Chief Executive Officer . CEO of SHFL entertainment from April 2011 to November 2013 . EVP and COO of Bally from 2006 to 2011 . Previous executive leadership experience at Aristocrat Scott Schweinfurth Executive Vice President and CFO . Prior to joining SGMS in 2013, was EVP, CFO, and Treasurer of WMS from 2000 to 2013 . SVP, CFO and Treasurer of Bally from 1995 to 2000 Orrin J. Edidin Group Chief Executive of Interactive . Prior to joining SGMS, served as President of WMS Industries and CEO of Williams Interactive LLC Strong Management Team 7 Highly experienced management team with proven track record of integrating acquisitions and familiarity with both organizations James C. Kennedy Jr. EVP, Group Chief Executive of Lottery . Prior to current role, served as President, Printed Products, and Chief Marketing Officer and various other positions since 1985 Neil Davidson Bally Senior Vice President, CFO and Treasurer . Bally’s CFO since 2010 . Bally’s Chief Accounting Officer between 2008 to 2010 . Chairman of Bally’s board from 2012 to 2014 . CEO of Bally from 2004 to 2012 and in 2014 . Anticipated to be Vice Chairman of the Board of the combined company Management Relevant Experience Richard Haddrill Bally Chief Executive Officer |

|
|
Synergies & Cash Flow Enhancements |

|
|
41 Integration Team with Strong Track Record of Exceeding Synergy Targets . ~$100 million estimate of cost synergies by end of 2015 confirmed . $80 million of cost savings anticipated in 2014, well ahead of $50 million originally anticipated . 304 position eliminations yielding $27 million of savings with $1 million anticipated to be achieved from position eliminations in the second half of 2014 . $17 million from manufacturing cost savings, labor savings, shipping and logistics improvements and reduction of cost of WAP operations . $18 million from elimination of duplicate public company costs, indirect purchase savings and exiting loss-making businesses . $65 million of run-rate cost synergies for 2014 from actions already completed or initiated . $35 million of actual synergies achieved in the first half of 2014 . Integrated over 1,600 employees . ~$42 million estimate of cost synergies by June 30, 2014 confirmed . The full amount anticipated to come as a result of actions already taken . $24 million of actual cost synergies realized by 6/30/14 SGMS’ Acquisition of WMS BYI’s Acquisition of SHFL WMS Cost Synergies SHFL Cost Synergies $50 $80 Year 1 Year 1 $30 $42 Year 1 Year 1 May 2013 Lender Presentation Current Estimate July 2013 Announcement Presentation Current Estimate The confidence in SGMS / BYI synergy estimates is based on past experience; Gavin Isaacs and Scott Schweinfurth have extensive institutional knowledge of both companies |

|
|
42 Highly Achievable Cost Synergies Plan 125 144 32 43 18 33 ~$175 ~$220 Year 1 Year 2 SG&A R&D COGS COGS 2% SG&A 68% R&D 30% COGS 31% SG&A 63% R&D 6% ~$220 million of anticipated cost synergies (~11% of Combined Costs (1)) with ~80% expected to be achieved in year 1 $122 million $98 million Note: U.S. Dollars in millions. (1) Combined Costs reflect LTM 6/30/14 Combined Revenue less LTM 6/30/14 Combined Attributable EBITDA (excluding anticipated synergies and accounting adjustments) excluding EBITDA from equity investments. Components & Timing Headcount Related Non-Headcount Related |

|
|
43 Cost Synergies Analysis Anticipated Synergies as % of Combined Costs (1) Costs as % of Revenue Average of Comparable SGMS/BYI Transactions COGS 3% 10% - 20% SG&A 20% 20% - 35% R&D 13% 20% - 35% Relatively conservative synergy assumptions with upside potential BYI (2) IGT (3) SG&A 29% 22% R&D 11% 11% Capex 7% 5% BYI’s existing cost structure offers “low hanging fruit” synergy opportunities Source: Company filings and third party integration consultant. (1) Combined Costs reflect LTM 6/30/14 Combined Revenue less LTM 6/30/14 Combined Attributable EBITDA (excluding anticipated synergies and accounting adjustments) excluding EBITDA from equity investments. (2) LTM 6/30/14 BYI standalone publicly reported results before the pending acquisition by SGMS. (3) LTM 6/30/14 IGT standalone publicly reported results before the pending acquisition by GTECH. |

|
|
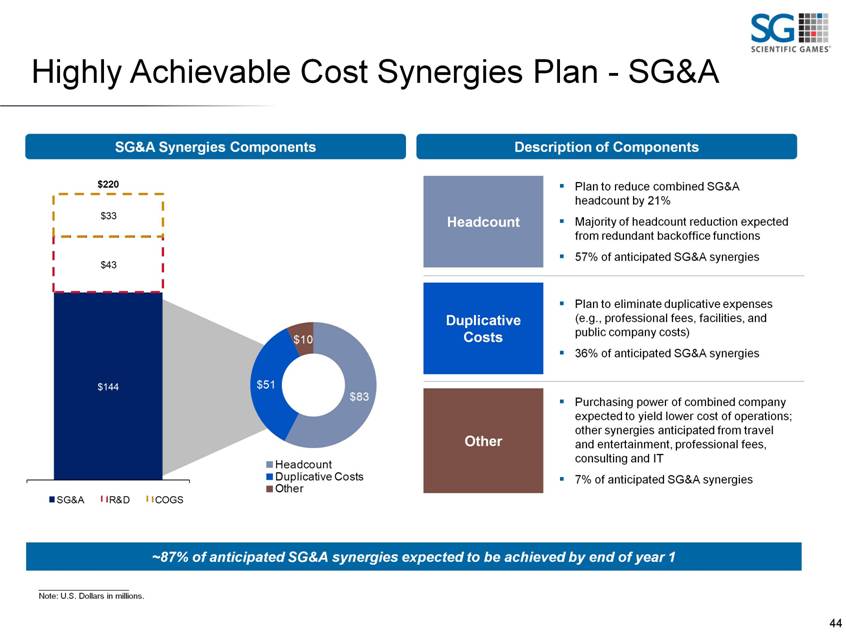
44 Highly Achievable Cost Synergies Plan - SG&A Headcount . Plan to reduce combined SG&A headcount by 21% . Majority of headcount reduction expected from redundant backoffice functions . 57% of anticipated SG&A synergies Duplicative Costs . Plan to eliminate duplicative expenses (e.g., professional fees, facilities, and public company costs) . 36% of anticipated SG&A synergies Other . Purchasing power of combined company expected to yield lower cost of operations; other synergies anticipated from travel and entertainment, professional fees, consulting and IT . 7% of anticipated SG&A synergies $144 $43 $33 $220 SG&A R&D COGS ~87% of anticipated SG&A synergies expected to be achieved by end of year 1 Note: U.S. Dollars in millions. $83 $51 $10 Headcount Duplicative Costs Other SG&A Synergies Components Description of Components |
|
|
45 $144 $43 $33 $220 SG&A R&D COGS R&D . Plan to select one operating system and standardize inside of gaming machines, unify control sub-system and cabinet design architecture, etc. . 89% expected to be headcount related India . Plan to continue to move more of the systems group offshore to low-cost centers of excellence . 89% expected to be headcount related All Other . Plan to reduce game development time and improve process through implementing Agile methodologies and integrating studios . 77% expected to be headcount related ~73% of anticipated R&D synergies expected to be achieved by end of year 1 Note: U.S. Dollars in millions. $30 $4 $4 $5 R&D (Payroll) R&D (Opex) India All Other Highly Achievable Cost Synergies Plan - R&D R&D Synergies Components Description of Components |

|
|
46 Manufacturing Consolidation . Plan to consolidate all new and remanufacturing production . Plan to apply WMS' successful high-level assembly sourcing strategy to Bally . 46% of anticipated COGS synergies Direct Material Spend Savings . Plan to leverage strategic sourcing and platform engineering to transition to a common supply base . 47% of anticipated COGS synergies Supply Chain & Organization Consolidation . Plan to integrate the supply chain organizations to maximize fixed overhead cost leverage and reduce combined headcount . 7% of anticipated COGS synergies ~50% of anticipated COGS synergies expected to be achieved by end of year 1 Note: U.S. Dollars in millions. $144 $43 $33 $220 SG&A R&D COGS $15 $16 $2 Manufacturing Consolidation Direct Material Spend Savings Supply Chain & Organization Consolidation Highly Achievable Cost Synergies Plan - COGS COGS Synergies Components Description of Components |

|
|
47 Anticipated Capex Savings . Gaming Operations Capex Savings: . Anticipated gaming operations capex savings is driven by enhanced manufacturing efficiencies and unit assumptions . Manufacturing efficiencies are expected to yield savings on Gamefield, Blade and Wave units . Property, Plant & Equipment Capex Savings: . Assumes no new significant real estate projects . Implementation of Oracle HR and Finance ERP modules within SGMS expected be completed by December 2015; implementation within BYI expected to be completed by December 2016 at a cost of $25 million in capex . Expected reduction in hardware, software, engineering, machinery/equipment and leasehold improvement spend $243 $349 $131 ($15) ($10) LTM 6/30/14 SGMS Capex LTM 6/30/14 BYI Capex Less: Anticipated Gaming Ops. Capex Synergies Less: Anticipated PP&E Capex Synergies Combined Capex (assuming realization of capex synergies) Represents only ~7% of Combined Capex Combined Capex Bridge Commentary $33 Note: Dollars in millions. (1) Reflects SGMS’ capex for the LTM period (including capex of WMS for the portion of the LTM period prior to its acquisition by SGMS), adjusted to (a) include incremental capex of WMS resulting from certain accounting reclassifications related to SGMS’ acquisition of WMS ($3 million) and (b) exclude capex of WMS related to ERP implementation ($3 million) and a real estate purchase ($8 million). (2) Reflects BYI’s capex for the LTM period (including capex of SHFL for the portion of the LTM period prior to its acquisition by BYI), adjusted to (a) include incremental capex of BYI resulting from the anticipated accounting adjustments described in the definition of Combined Attributable EBITDA ($33 million) and (b) exclude capex of BYI related to ERP implementation ($2 million) and a real estate purchase ($5 million). (2) (1) |

|
|
48 Anticipated One-Time Integration Costs Anticipated Costs to Achieve Anticipated Synergies: $76 million for EBITDA Synergies $40 million for Capex Synergies . Headcount: $40mm . Non-Headcount: $2mm . Facilities: $5mm . Capex: $20mm . Headcount: $15mm . Non-Headcount: $2mm . Facilities: $5mm . Capex: $20mm . Non-Headcount: $2mm . Facilities: $5mm Year 1 Year 2 Year 3 SGMS / BYI Headcount $55mm Non-Headcount $6mm SGMS / BYI Facilities $15mm Capex $40mm |

|
|
Financial Overview |

|
|
50 (1) SGMS Financial Performance Note: U.S. Dollars in millions. (1) Amounts reflect SGMS’ publicly reported revenue (excluding WMS contribution for the periods prior to October 18, 2013). (2) Amounts reflect SGMS’ revenue pro forma for WMS acquisition and BYI’s revenue pro forma for SHFL and Dragonplay acquisitions. SGMS revenue has been recast to reflect social gaming revenue reported on a gross basis before platform fees as a result of a recent change in the Facebook® payment settlement process (effect of $19 million and $8 million for the LTM 6/30/13 and LTM 6/30/14 periods, respectively). Reported Revenue (1) Combined Revenue (2) $866 $929 $1,091 $1,441 CY11 CY12 CY13 LTM 6/30/14 $1,642 $1,636 $1,277 $1,371 $2,919 $3,007 LTM 6/30/13 LTM 6/30/14 SGMS BYI |

|
|
51 (1) SGMS Financial Performance Note: U.S. Dollars in millions. (1) Amounts reflect SGMS’ publicly reported Attributable EBITDA (excluding WMS contribution for the periods prior to October 18, 2013). Note that SGMS’ definition of publicly reported Attributable EBITDA was modified to some extent in the Q4 2013. The Attributable EBITDA for CY12 and CY13 shown above was calculated under this modified definition (see SGMS’ press release dated March 12, 2014 for reconciliations to net loss for such periods). The Attributable EBITDA for CY11 shown above was calculated under the prior definition (see SGMS’ press release dated February 28, 2012 for reconciliation to net loss for such period; the Attributable EBITDA for CY11 calculated under the modified definition would be essentially flat to that shown above). Reported Attributable EBITDA (1) $327 $338 $383 $475 CY11 CY12 CY13 LTM 6/30/14 |

|
|
52 2Q 2014 Business Line Update Gaming Product Sales (1) Gaming Operations (1) $65 $43 $61 $62 $126 $105 2Q CY13 2Q CY14 SGMS BYI $126 $81 $119 $120 $245 $201 2Q CY13 2Q CY14 SGMS BYI . SGMS and BYI revenue on a combined basis declined 2% y-o-y in a challenging 2Q 2014 . 2H14 expected to benefit from the introduction of the first Blade participation game (Monopoly Luxury Diamonds), the launch of the first Willy Wonka game on the Gamefield platform and favorable seasonal trends in revenue per unit per day . Product sales have been impacted by a very challenging industry environment . BYI sales improved 1% compared to 2Q 2013 demonstrating the strength of its current product portfolio; for the first time ever BYI shipped more slots in the U.S. and Canada than IGT (3) . 2H14 results expected to reflect the ramp up of themes for the new Blade mechanical as well as by the recent leadership changes in gaming segment Revenue Revenue $100 $97 $107 $104 $207 $201 2Q CY13 2Q CY14 SGMS BYI $70 $73 $72 $61 $142 $134 2Q CY13 2Q CY14 SGMS BYI Note: U.S. Dollars in millions. (1) Pro forma for WMS and SHFL acquisitions. (2) Excludes depreciation and amortization for SGMS and excludes amortization related to intangible assets for BYI. (3) Source – Eilers Research, LLC Reports. Revenue Less Cost of Revenue (2) Revenue Less Cost of Revenue (2) |

|
|
53 $58 $53 2Q CY13 2Q CY14 $41 $42 2Q CY13 2Q CY14 2Q 2014 Business Line Update Systems $73 $74 2Q CY13 2Q CY14 $24 $32 $6 $8 $30 $40 2Q CY13 2Q CY14 $16 $21 $4 $5 $20 $26 2Q CY13 2Q CY14 $28 $31 2Q CY13 2Q CY14 . Systems revenue increased 2% y-o-y in 2Q 2014 . Revenue increased due to several large system installations and hardware upgrades, as well as increased installed base of customers, which resulted in higher maintenance revenue . Gross margin decreased due to a change in the mix of products sold Revenue Gross Margin (3) Table Products (1) Interactive (2) . Table products revenue increased 2% y-o-y in 2Q14 . Gross profit increased 8% y-o-y in 2Q14 Revenue Gross Margin (3) . Interactive revenue increased 32% y-o-y in 2Q14 . Driven by SGMS average DAU growth of ~1mm for social casinos . The BYI acquisition of Dragonplay expected to provide additional growth in social gaming sector going forward Revenue SGMS BYI Note: U.S. Dollars in millions. (1) Pro forma for SHFL acquisition. (2) Pro forma for WMS, SHFL and Dragonplay acquisitions. SGMS social gaming revenue has been recast to reflect revenue reported on a gross basis before platform fees (as a result of a recent change in the Facebook® payment settlement process) for all periods presented (effect of $6.2 million for 2Q CY13). (3) Excludes amortization related to intangible assets for BYI. (4) Excludes depreciation and amortization for SGMS and excludes amortization related to intangible assets for BYI. Revenue Less Cost of Revenue (4) |

|
|
54 $64 $69 2Q CY13 2Q CY14 SGMS 2Q 2014 Business Line Update Instant Products Lottery Systems $56 $64 2Q CY13 2Q CY14 SGMS $130 $139 2Q CY13 2Q CY14 SGMS . Lottery systems revenue increased 8% y-o-y in 2Q14 . Revenue increased due to higher sports betting service revenue from international customers, higher terminal sales to a U.S. customer and higher hardware and software sales to international customers . Decrease in revenue less cost of revenue reflected a less profitable revenue mix . Instant products revenue increased 7% y-o-y in 2Q14 . Revenue increased due to higher lottery retail sales by customers to which SGMS supplies instant games on a participation basis, as well as the benefit from sales of instant games to the Northstar New Jersey joint venture, the commencement of sales to the Hellenic Lotteries joint venture in early May 2014 and an increase in licensing and player loyalty revenue . Increase in revenue less cost of revenue reflected higher revenue and a more profitable revenue mix Revenue Revenue $27 $25 2Q CY13 2Q CY14 SGMS Note: U.S. Dollars in millions. (1) Excludes depreciation and amortization. Revenue Less Cost of Revenue (1) Revenue Less Cost of Revenue (1) |

|
|
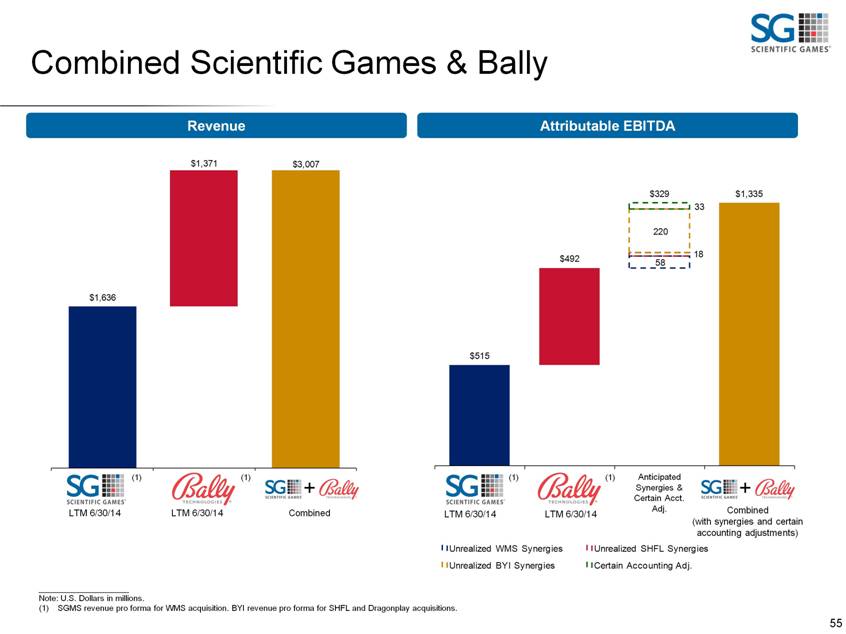
55 Note: U.S. Dollars in millions. (1) SGMS revenue pro forma for WMS acquisition. BYI revenue pro forma for SHFL and Dragonplay acquisitions. 58 18 220 33 $515 $492 $329 $1,335 Unrealized WMS Synergies Unrealized SHFL Synergies Unrealized BYI Synergies Certain Accounting Adj. $3,007 $1,371 $1,636 (1) (1) + + Combined Scientific Games & Bally Anticipated Synergies & Certain Acct. Adj. LTM 6/30/14 LTM 6/30/14 Combined LTM 6/30/14 LTM 6/30/14 Combined (with synergies and certain accounting adjustments) Revenue Attributable EBITDA (1) (1) |
|
|
56 $350 $2,162 $1,632 -- $250 $200 $450 $300 $750 $21 $48 $48 $48 $948 $46 $2,479 $2,732 $2,200 $500 2014 2015 2016 2017 2018 2019 2020 2021 2022 2023 2024 Liquidity Profile Pro Forma Revolver Combined Calculation 6/30/2014 $49 Revolver Commitment $650 Less: Expected Drawn Amount (200) Less: Letters of Credit (2) (42) Revolver Availability 408 Available Liquidity $457 Expected Cash & Cash Equivalents (1) (1) ¦ No major near-term debt maturities ¦ Substantial liquidity anticipated at closing; $650mm revolver with only $200mm anticipated to be drawn and combined cash on hand estimated at $49mm (1) ¦ Pre-payable bank debt structure allows the Company to take advantage of strong cash flow generation ¦ Cash flow prioritized to repay debt and focus on deleveraging with the goal to achieve ~4x leverage by the end of the next 4 years Pro Forma Debt Maturity Profile Long-dated capital structure provides ample flexibility Note: U.S. Dollars in millions. (1) Cash balances do not include the impact of cash flow anticipated to be generated from 6/30/14 to the closing of the pending BYI acquisition. Excludes restricted cash. (2) Amount represents combined letters of credit outstanding as of 6/30/14. Existing Term Loan B Incremental Term Loan B2 Existing 8.125% Senior Subordinated Notes Drawn Revolving Credit Facility Undrawn Revolving Credit Facility Existing 6.625% Senior Subordinated Notes Existing 6.250% Senior Subordinated Notes New Senior Secured Notes New 8-Yr Senior Unsecured Notes New 10-Yr Senior Unsecured Notes Other Debt |

|
|
Indicative Terms and Timeline |

|
|
58 Incremental Senior Secured Credit Facilities Anticipated Terms Borrower Scientific Games International, Inc. Facility Incremental Revolving Credit Facility Incremental Term Loan B2 Amount Up to $350 million $1,735 million Guarantors & Security Same as the existing credit agreement Maturity October 18, 2018 (1) 7 years from closing (2) Amortization None 1% per annum Incremental Sum of $350 million and first lien leverage ratio of 3.25x Voluntary Prepayments Pre-payable at par 101 soft call for 6 months (from the acquisition closing date) Excess Cash Flow Sweep N/A 50% ECF stepping down to 25% when net secured leverage is equal to or less than 3.0x, then 0% when net secured leverage is equal to or less than 2.0x Financial Covenants Maximum first lien leverage ratio tested quarterly, regardless of usage None (1) If the Incremental Revolving Credit Facility is less than the $350 million at closing, then the Company will have the ability to increase the revolver to such amount going forward. (2) In any event, the maturity date of the Incremental Term Loan B2 will not extend beyond that of the new senior secured notes. |

|
|
59 Amendment Anticipated Terms Borrower Scientific Games International, Inc. Facility Existing Senior Secured Credit Facilities Amount $300 million Revolving Credit Facility $2,289 million Term Loan B Maturity October 18, 2018 (unchanged) October 18, 2020 (unchanged) Amendment Request. Amend all items necessary to effect the Acquisition and certain other provisions. Details to be posted to Syndtrak shortly Vote Required 50.1% (class voting) LIBOR Spread 25 bps less than the final LIBOR spread on the Incremental Term Loan B2 LIBOR Floor 1.00% (unchanged) Amendment Fee TBD (a portion of which will be non-refundable and payable by year-end) Voluntary Prepayments Reset 101 soft call for 6 months (from the acquisition closing date) |
|
|
Transaction Timeline September 2014 Sun Mon Tue Wed Thu Fri Sat 1 2 3 4 5 6 7 8 9 10 11 12 13 14 15 16 17 18 19 20 21 22 23 24 25 26 27 28 29 30 Holiday Denotes Key Dates Date: Key Process Event Sep 3rd: Lender Meeting Sep 5th: Distribute Credit Agreement / Amendment Documentation Sep 10th: Amendment Consents Due (5 PM) Sep 15th: Comments due on Credit Agreement Commitments due on Incremental Revolver and Incremental Term Loan B2 Pricing and Allocations Shortly Thereafter By End of 2014: Expect to Receive Gaming Regulatory Approvals Expected Closing and Funding 60 |
|
|
Public Lender Q&A |

|
|
Appendix |

|
|
63 Post-Closing Organizational Structure Guarantors Borrower / Issuer Scientific Games Corporation (NASDAQ: SGMS) Foreign Subsidiaries Foreign Subsidiaries Domestic Subsidiaries Foreign Subsidiaries Domestic Subsidiaries $650mm Revolver $2,289mm Existing TLB1 $1,735mm Incr. TLB2 $750mm New Sr. Sec. Notes $2,700mm New Sr. Unsec. Notes $300mm 2020 Notes $350mm 2021 Notes Scientific Games International, Inc. ("SGI") Domestic Subsidiaries WMS Industries Inc. Bally Technologies, Inc. $250mm 2018 Notes Foreign Subsidiaries Domestic Subsidiaries Note: SGI is a guarantor for the 2018 notes issued by SGC. |

|
|
Non-GAAP Reconciliation ($ in millions) (unaudited) SGMS Reported LTM ended June 30, 2014 (unaudited) WMS Three months + 18 days ended October 18, 2013 Pro forma and other adjustments (unaudited) SGMS Pro forma LTM ended June 30, 2014 (unaudited) BYI Reported LTM ended June 30, 2014 (unaudited) SHFL Three months + 55 days ended November 24, 2013 (unaudited) Dragonplay LTM ended June 30, 2014 Pro forma and other adjustments (unaudited) BYI Pro forma LTM ended June 30, 2014 (unaudited) Combined LTM ended June 30, 2014 (1) Statement of operations data: Revenue: Instant games 528.2 $ - $ - $ 528.2 $ - $ - $ - $ - $ - $ 528.2 $ Services 604.2 113.7 - 717.9 471.5 48.7 32.6 - 552.9 1,270.7 Product sales 308.9 81.0 - 389.8 743.6 74.6 - - 818.2 1,208.0 Total Revenue 1,441.3 194.6 - 1,636.0 1,215.1 123.4 32.6 - 1,371.1 3,007.0 Operating expenses: - - Cost of instant games (2) 288.2 - - 288.2 - - - - 288.2 Cost of services (2) 241.8 26.3 (4.8) (3) 263.3 153.0 19.6 9.3 (0.2) (11) 181.7 445.0 Cost of product sales (2) 178.8 40.5 (13.0) (4) 206.3 298.3 28.4 - (10.4) (4) 316.3 522.6 Selling, general and administrative expenses 359.8 119.9 (57.0) (5) 422.7 343.2 65.2 13.5 (10) (67.5) (12) 354.4 777.1 Research and development 73.5 32.9 (2.1) (6) 104.2 135.9 21.1 - (2.0) (11) 154.9 259.2 Employee termination and restructuring costs 32.9 - - 32.9 - - - - - 32.9 Depreciation and amortization 316.6 41.1 15.5 (7) 373.3 57.6 - - 19.4 (13) 77.0 450.3 Operating income (50.3) (66.1) 61.4 (55.0) 227.2 (11.0) 9.8 60.7 286.8 231.7 Other income (expense): Interest expense (166.5) (1.1) (20.3) (8) (188.0) (56.8) (1.4) - (26.5) (14) (84.6) (272.6) Earnings from equity investments (1.9) - - (1.9) - - - - - (1.9) Loss on early extinguishment of debt (31.8) - - (31.8) (7.3) - - - (7.3) (39.1) Gain on sale of equity investment 14.5 - - 14.5 - - - - - 14.5 Other (expense) income, net 5.8 4.0 - 9.8 1.5 1.2 - - 2.7 12.5 Total other expense (180.0) 2.9 (20.3) (197.4) (62.6) (0.2) - (26.5) (89.2) (286.7) Net (loss) income from continuing operations before income taxes (230.3) (63.2) 41.1 (252.5) 164.7 (11.1) 9.8 34.2 197.6 (54.9) Income tax (expense) benefit 112.1 16.0 (16.0) (9) 112.1 (66.1) 3.5 - (12.1) (15) (74.7) 37.3 Net (loss) income from continuing operations (118.3) $ (47.2) $ 25.0 $ (140.4) $ 98.6 $ (7.6) $ 9.8 $ 22.1 $ 122.8 $ (17.6) $ Reconciliation of Net (Loss) Income to Attributable EBITDA Employee termination and restructuring 32.9 - - 32.9 1.9 - - - 1.9 34.8 M&A and financing costs and charges 35.9 11.8 (32.5) (5) 15.2 58.7 16.3 - (68.2) (16) 6.7 22.0 Earnouts - - - - 2.6 - - 2.6 2.6 Legal contingencies and settlements 24.9 - - 24.9 - - - - - 24.9 Loss (gain) on early extinguishment of debt 31.8 - - 31.8 7.3 - - - 7.3 39.1 Depreciation and amortization 316.6 41.1 15.5 (7) 373.3 133.7 12.6 - 19.4 (13) 165.7 539.0 Gain on sale of equity interest (14.5) - - (14.5) - - - - - (14.5) Other expense (income), net 1.4 1.7 - 3.1 18.0 - - - 18.0 21.1 Interest expense 166.6 1.1 20.3 (8) 188.0 47.8 1.0 - 26.5 (14) 75.2 263.3 Income tax expense (benefit) (112.1) (16.0) 16.0 (9) (112.1) 66.1 (3.5) - 12.1 (15) 74.7 (37.3) Stock-based compensation 24.2 2.6 - 26.9 14.0 14.6 - (11.9) (17) 16.7 43.5 EBITDA from equity investments 83.9 - - 83.9 - - - - - 83.9 (Earnings) loss from equity investments 1.9 - - 1.9 - - - - - 1.9 Attributable EBITDA 475.2 $ (4.8) $ 44.4 $ 514.9 $ 448.5 $ 33.3 $ 9.8 $ (0.0) $ 491.7 $ 1,006.6 $ Anticipated Synergies and Certain Accounting Adjustments Unrealized cost synergies from the WMS acquisition (anticipated by the end of 2015) 58.0 - 58.0 Unrealized cost synergies from the SHFL acquisition (anticipated by the end of 2014) - 18.0 18.0 Cost synergies anticipated from the pending BYI acquisition - - 220.0 Certain anticipated accounting adjustments related to pending BYI acquisition: Reclassification of BYI game regulatory approval costs to D&A - 22.6 (18) Reclassification of BYI guaranteed brand license royalty expense to D&A - 10.1 (19) Combined Attributable EBITDA (with synergies and acct. adjustments) 572.9 $ 509.7 $ 1,335.3 $ |

|
|
66 Non-GAAP Financial Measures Scientific Games’ management uses non-GAAP financial measures (such as Attributable EBITDA, FCF and EBITDA from Equity Investments) in conjunction with GAAP financial measures to, among other things: (i) monitor and evaluate the performance of Scientific Games’ business operations, as well as the performance of its equity investments; (ii) facilitate management's internal comparisons of Scientific Games’ historical operating performance; (iii) facilitate management's external comparisons of Scientific Games’ results to the historical operating performance of other companies that may have different capital structures and debt levels; and (iv) analyze and evaluate financial and strategic planning decisions regarding future operating investments and operating budgets. Scientific Games’ management believes that Attributable EBITDA is helpful because this non-GAAP financial measure eliminates the effects of unusual, infrequent or other items that management believes have less bearing on Scientific Games’ (or Bally’s, as the case may be) underlying operating performance. Moreover, Scientific Games’ management believes Attributable EBITDA and EBITDA from Equity Investments are useful to investors because a significant amount of Scientific Games’ business is conducted through its equity investments, and those measures eliminate financial items from the equity investees' earnings that management believes have less bearing on the equity investees' performance. Management believes that Attributable EBITDA and FCF provide useful information regarding Scientific Games’ liquidity and its ability to service debt and fund investments. Scientific Games’ management also believes that FCF is useful for investors because it provides them with an important perspective on the cash available for debt repayment and other strategic measures, after making necessary capital investments in property and equipment to support Scientific Games’ ongoing business operations. In addition, Attributable EBITDA and FCF are metrics used in determining performance-based bonuses (subject to certain additional adjustments in the discretion of Scientific Games’ compensation committee). Accordingly, Scientific Games’ management believes that these non-GAAP financial measures are useful as they provide investors with information regarding Scientific Games’ financial condition and operating performance that is an integral part of management's reporting and planning processes. The non-GAAP financial measures presented herein on a combined basis (i.e., Combined Revenue, Combined Attributable EBITDA, Combined Capex, Combined Costs, Combined FCF and Combined FCF Available for Debt Repayment) are being presently as supplemental disclosures for illustrative purposes only. In light of the pending Transaction, Scientific Games’ management believes it is useful to investors to present these non-GAAP financial measures on an illustrative basis that combine the results of Bally and Scientific Games. The foregoing non-GAAP combined financial measures do not reflect any purchase accounting or other adjustments resulting from the Transaction (except where indicated) and do not represent “pro forma" amounts determined in accordance with the SEC's rules and regulations, including Article 11 of Regulation S-X. Such measures should not be taken to represent how the companies would have performed had their operations been combined during the periods presented, or how the companies will perform on a combined basis after giving effect to the Transaction. The non-GAAP financial measures used herein should not be considered in isolation of, as a substitute for, or superior to, the financial information prepared in accordance with GAAP. The non-GAAP financial measures as defined in this presentation may differ from similarly titled measures presented by other companies. The non-GAAP financial measures, as well as other information in this presentation, should be read in conjunction with Scientific Games’ and Bally’s financial statements filed with the SEC. |
