Attached files
| file | filename |
|---|---|
| 8-K - 8-K - CARDINAL FINANCIAL CORP | a14-20252_28k.htm |
Exhibit 99.1
|
|
Cardinal Financial Corporation Annual Shareholder Meeting April 25, 2014 CARDINAL FINANCIAL CORPORATION RAYMOND JAMES 2014 U.S. BANK CONFERENCE SEPTEMBER 3, 2014 |
|
|
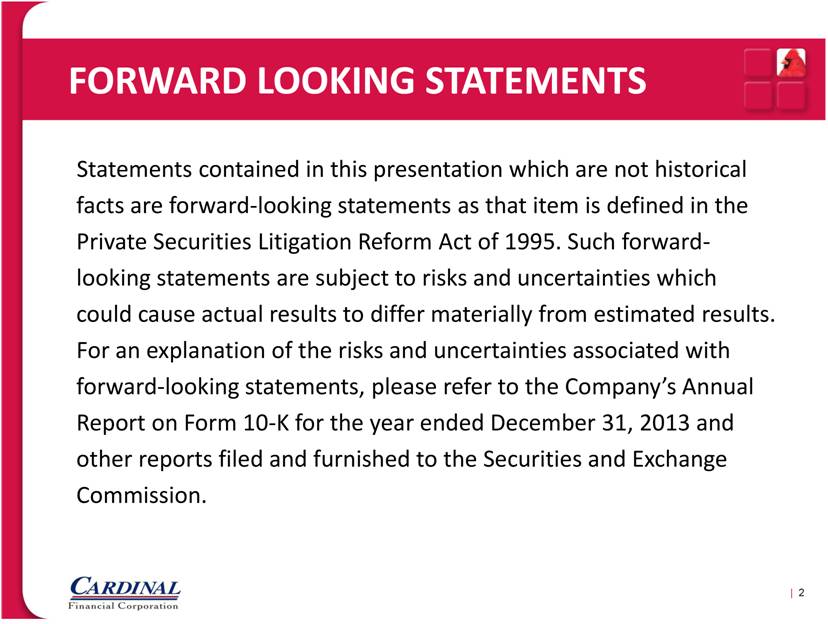
FORWARD LOOKING STATEMENTS Statements contained in this presentation which are not historical facts are forward-looking statements as that item is defined in the Private Securities Litigation Reform Act of 1995. Such forward-looking statements are subject to risks and uncertainties which could cause actual results to differ materially from estimated results. For an explanation of the risks and uncertainties associated with forward-looking statements, please refer to the Company’s Annual Report on Form 10-K for the year ended December 31, 2013 and other reports filed and furnished to the Securities and Exchange Commission. | 2 |
|
|
Aggressive on Sales, CONSERVATIVE ON RISK OUR OPERATING PHILOSOPHY | 3 |
|
|
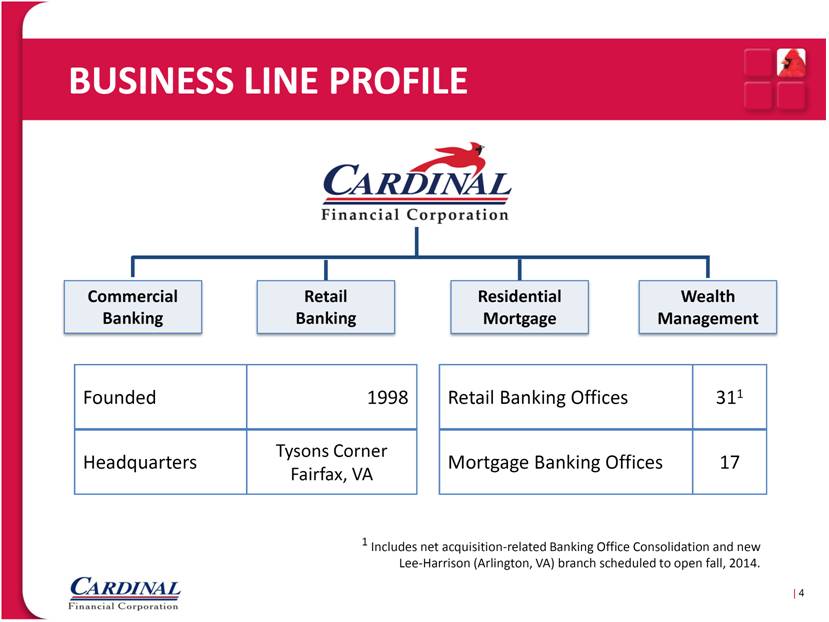
BUSINESS LINE PROFILE | 4 Founded 1998 Retail Banking Offices 311 Headquarters Tysons Corner Fairfax, VA Mortgage Banking Offices 17 Commercial Banking Retail Banking Residential Mortgage Wealth Management 1 Includes net acquisition-related Banking Office Consolidation and new Lee-Harrison (Arlington, VA) branch scheduled to open fall, 2014. |
|
|
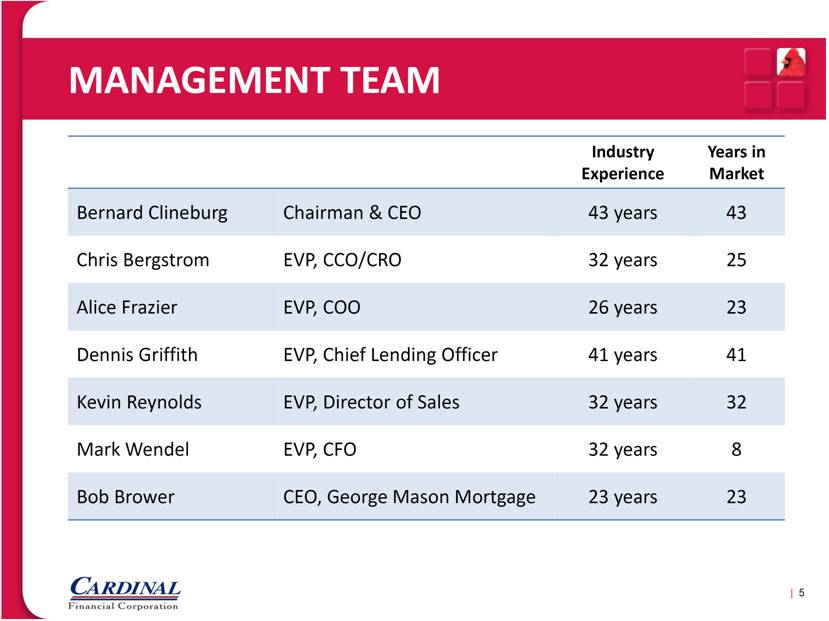
MANAGEMENT TEAM Industry Experience Years in Market Bernard Clineburg Chairman & CEO 43 years 43 Chris Bergstrom EVP, CCO/CRO 32 years 25 Alice Frazier EVP, COO 26 years 23 Dennis Griffith EVP, Chief Lending Officer 41 years 41 Kevin Reynolds EVP, Director of Sales 32 years 32 Mark Wendel EVP, CFO 32 years 8 Bob Brower CEO, George Mason Mortgage 23 years 23 | 5 |
|
|
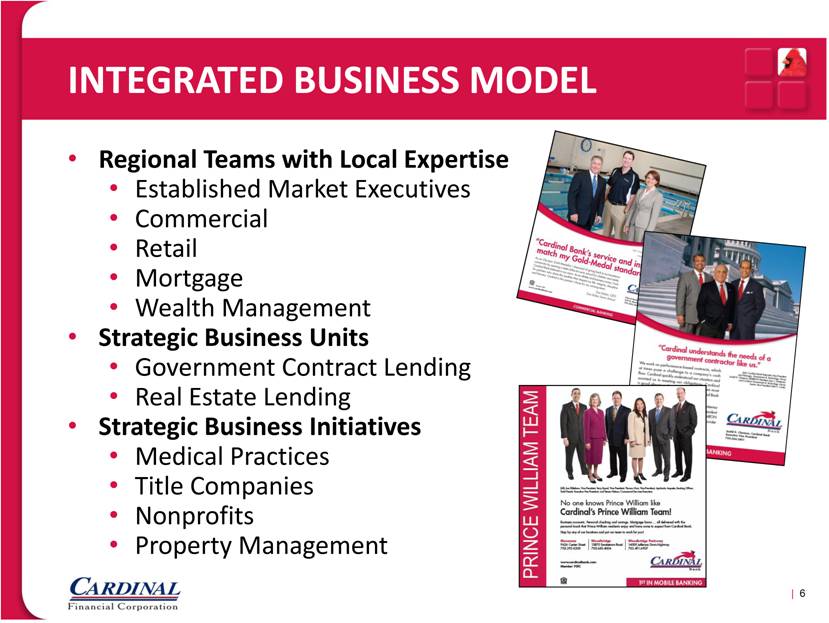
INTEGRATED BUSINESS MODEL Regional Teams with Local Expertise Established Market Executives Commercial Retail Mortgage Wealth Management Strategic Business Units Government Contract Lending Real Estate Lending Strategic Business Initiatives Medical Practices Title Companies Nonprofits Property Management | 6 |
|
|
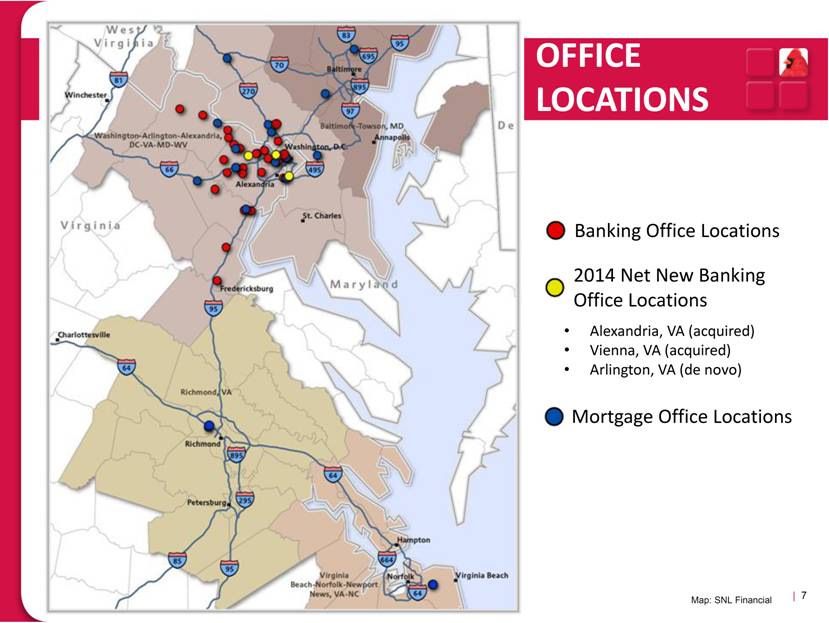
OFFICE LOCATIONS | 7 Map: SNL Financial Banking Office Locations Mortgage Office Locations Alexandria, VA (acquired) Vienna, VA (acquired) Arlington, VA (de novo) |
|
|
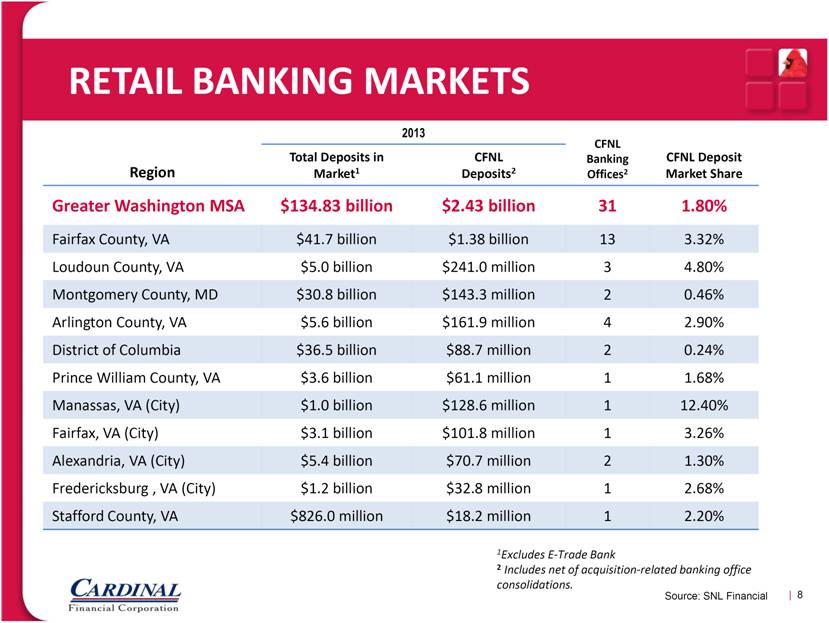
RETAIL BANKING MARKETS Region 2013 CFNL Banking Offices2 CFNL Deposit Market Share Total Deposits in Market1 CFNL Deposits2 Greater Washington MSA $134.83 billion $2.43 billion 31 1.80% Fairfax County, VA $41.7 billion $1.38 billion 13 3.32% Loudoun County, VA $5.0 billion $241.0 million 3 4.80% Montgomery County, MD $30.8 billion $143.3 million 2 0.46% Arlington County, VA $5.6 billion $161.9 million 4 2.90% District of Columbia $36.5 billion $88.7 million 2 0.24% Prince William County, VA $3.6 billion $61.1 million 1 1.68% Manassas, VA (City) $1.0 billion $128.6 million 1 12.40% Fairfax, VA (City) $3.1 billion $101.8 million 1 3.26% Alexandria, VA (City) $5.4 billion $70.7 million 2 1.30% Fredericksburg , VA (City) $1.2 billion $32.8 million 1 2.68% Stafford County, VA $826.0 million $18.2 million 1 2.20% | 8 Source: SNL Financial 1Excludes E-Trade Bank 2 Includes net of acquisition-related banking office consolidations. |
|
|
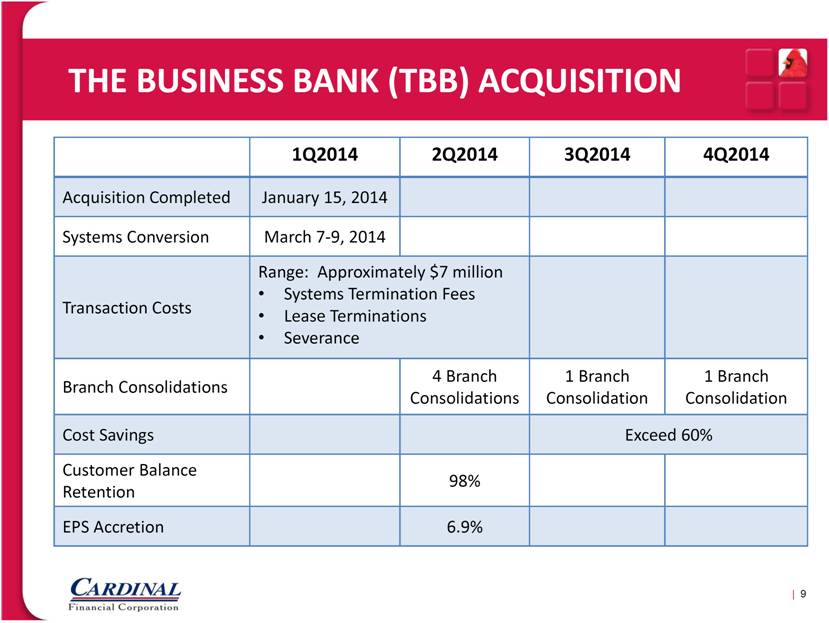
THE BUSINESS BANK (TBB) ACQUISITION | 9 1Q2014 2Q2014 3Q2014 4Q2014 Acquisition Completed January 15, 2014 Systems Conversion March 7-9, 2014 Transaction Costs Range: Approximately $7 million Systems Termination Fees Lease Terminations Severance Branch Consolidations 4 Branch Consolidations 1 Branch Consolidation 1 Branch Consolidation Cost Savings Exceed 60% Customer Balance Retention 98% EPS Accretion 6.9% |
|
|
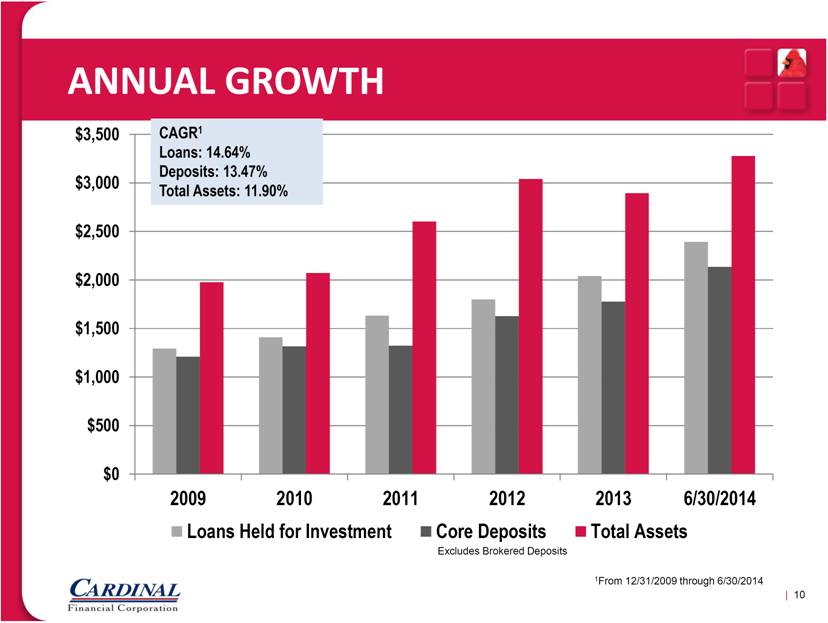
ANNUAL GROWTH | 10 1From 12/31/2009 through 6/30/2014 Excludes Brokered Deposits CAGR1 Loans: 14.64% Deposits: 13.47% Total Assets: 11.90% |
|
|
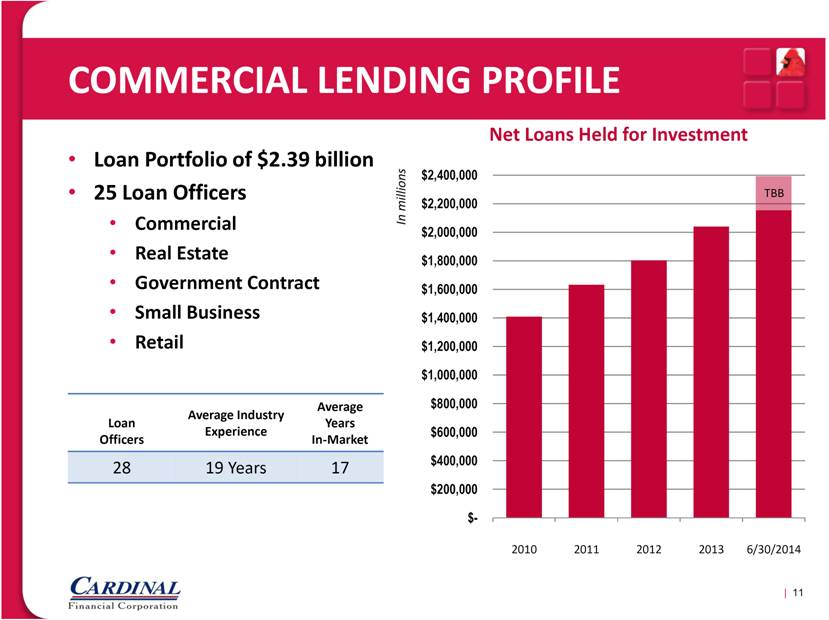
COMMERCIAL LENDING PROFILE Loan Portfolio of $2.39 billion 25 Loan Officers Commercial Real Estate Government Contract Small Business Retail | 11 Net Loans Held for Investment Loan Officers Average Industry Experience Average Years In-Market 28 19 Years 17 |
|
|
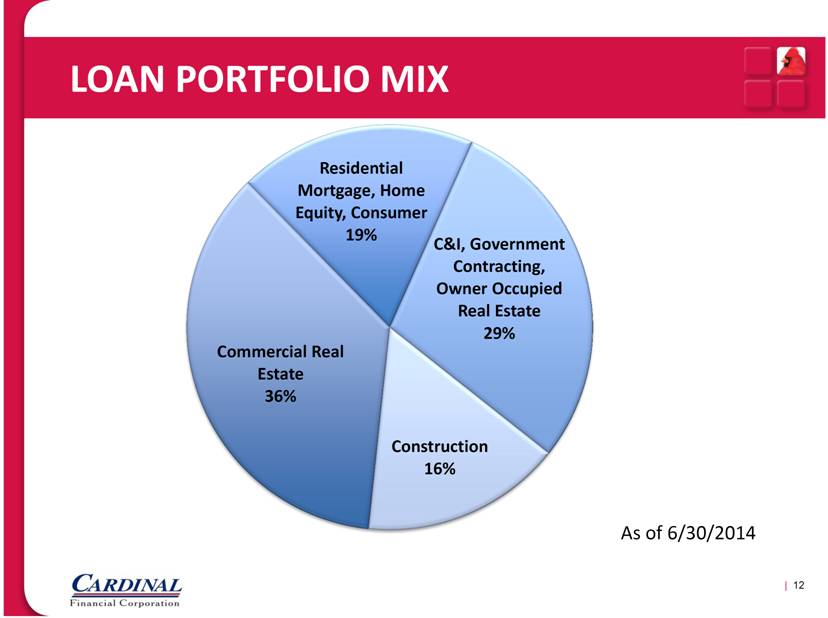
LOAN PORTFOLIO MIX | 12 As of 6/30/2014 |
|
|
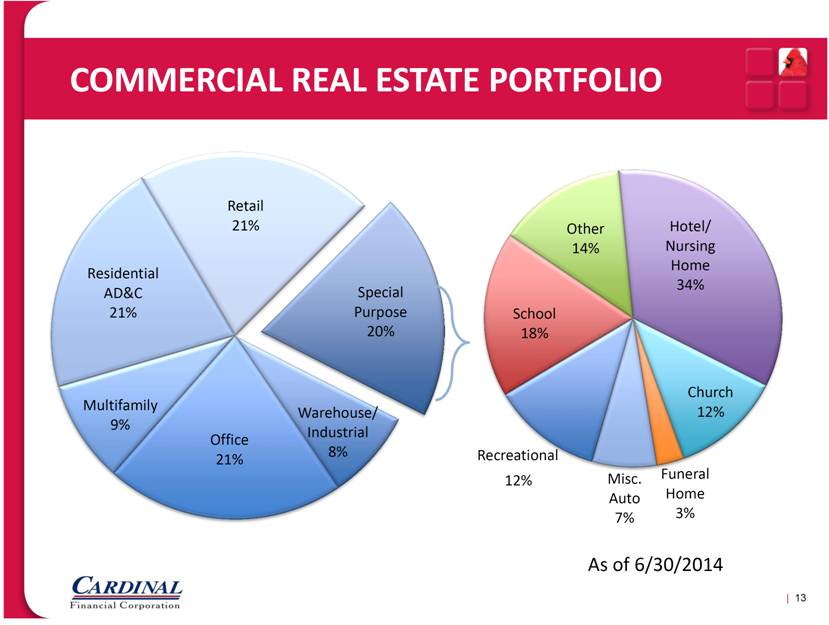
COMMERCIAL REAL ESTATE PORTFOLIO | 13 Recreational As of 6/30/2014 |
|
|
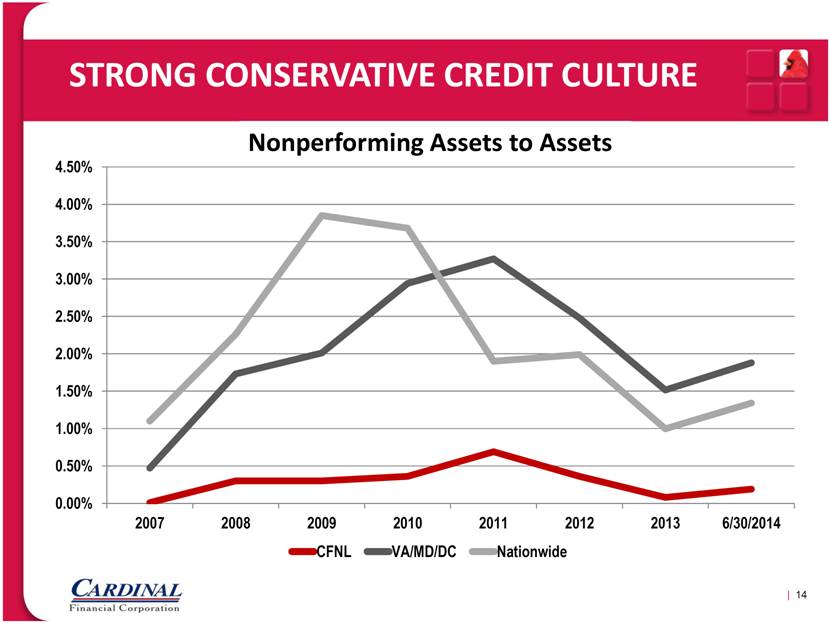
STRONG CONSERVATIVE CREDIT CULTURE | 14 Source: SNL Financial Complete Listing of Peer Group Used in Appendix Nonperforming Assets to Assets |
|
|
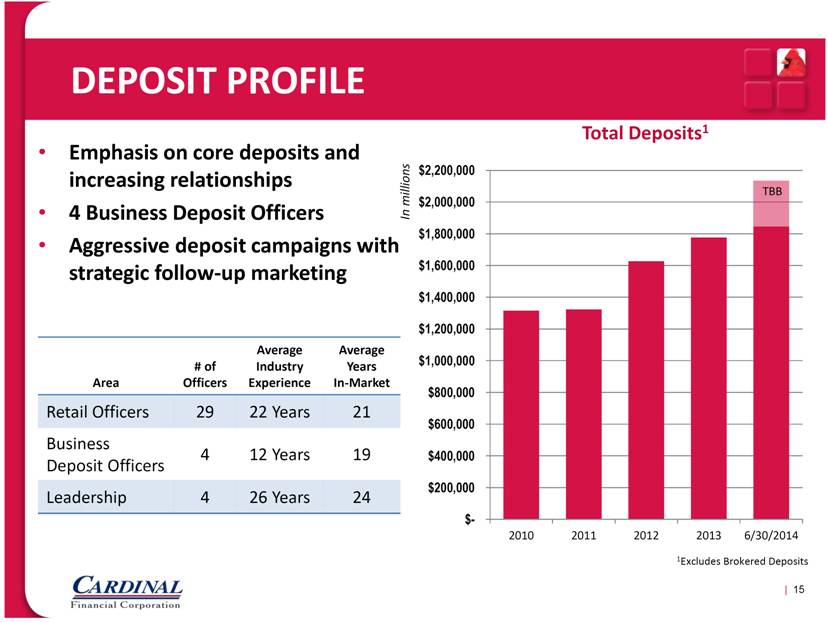
DEPOSIT PROFILE Emphasis on core deposits and increasing relationships 4 Business Deposit Officers Aggressive deposit campaigns with strategic follow-up marketing | 15 Total Deposits1 Area # of Officers Average Industry Experience Average Years In-Market Retail Officers 29 22 Years 21 Business Deposit Officers 4 12 Years 19 Leadership 4 26 Years 24 1Excludes Brokered Deposits |
|
|
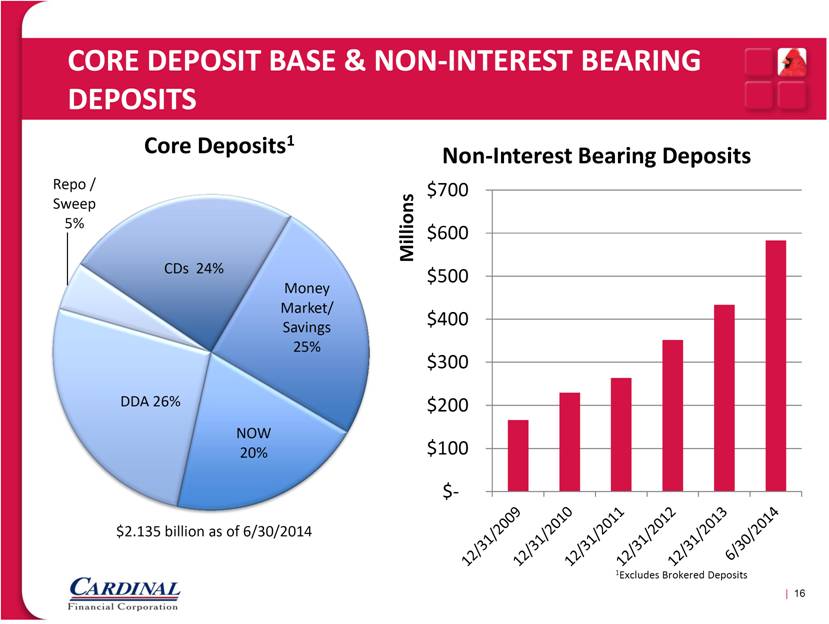
CORE DEPOSIT BASE & NON-INTEREST BEARING DEPOSITS | 16 1Excludes Brokered Deposits $2.135 billion as of 6/30/2014 |
|
|
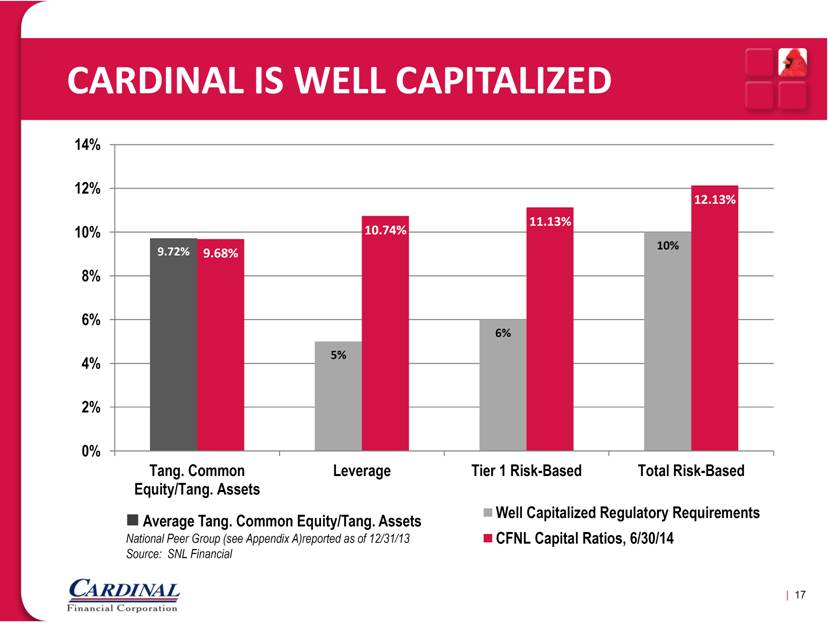
CARDINAL IS WELL CAPITALIZED | 17 Average Tang. Common Equity/Tang. Assets National Peer Group (see Appendix A)reported as of 12/31/13 Source: SNL Financial |
|
|
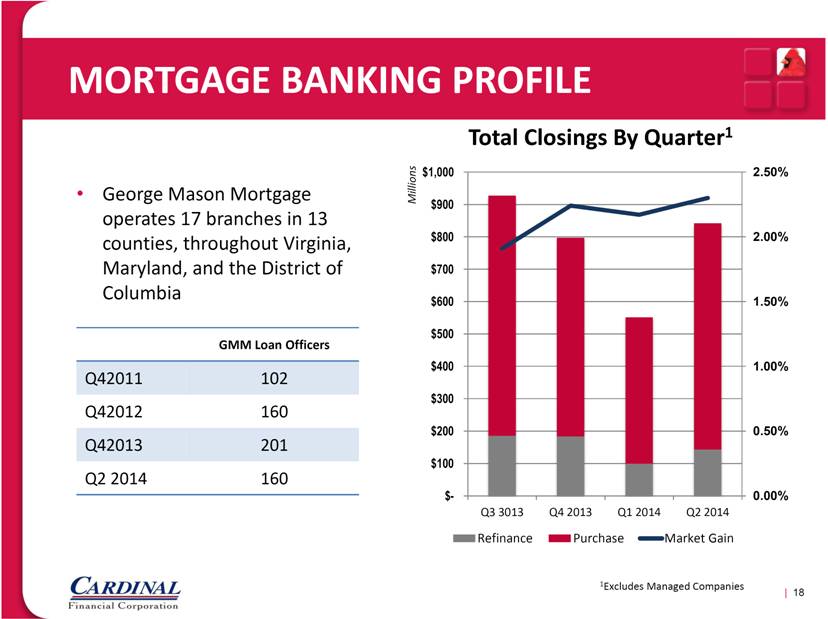
MORTGAGE BANKING PROFILE George Mason Mortgage operates 17 branches in 13 counties, throughout Virginia, Maryland, and the District of Columbia | 18 GMM Loan Officers Q42011 102 Q42012 160 Q42013 201 Q2 2014 160 1Excludes Managed Companies |
|
|
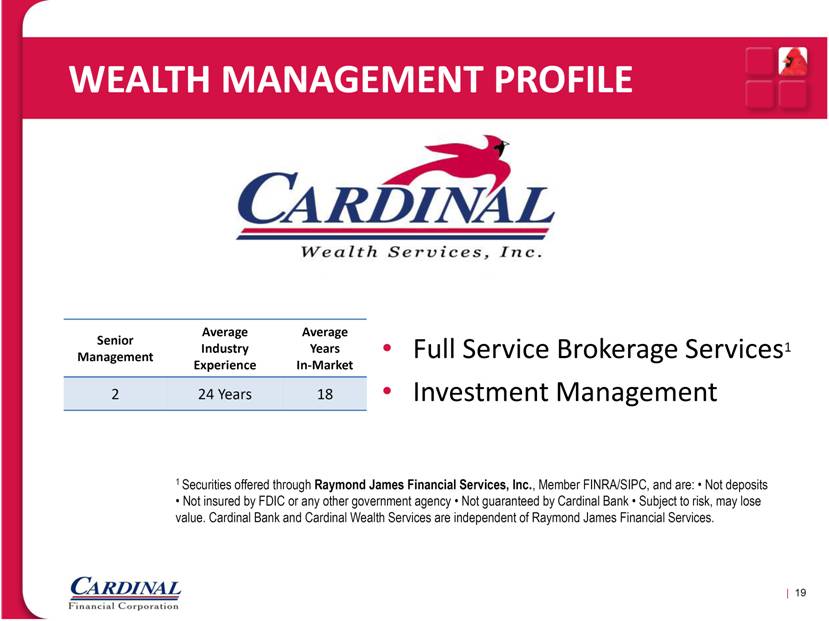
Full Service Brokerage Services1 Investment Management WEALTH MANAGEMENT PROFILE 1 Securities offered through Raymond James Financial Services, Inc., Member FINRA/SIPC, and are: • Not deposits • Not insured by FDIC or any other government agency • Not guaranteed by Cardinal Bank • Subject to risk, may lose value. Cardinal Bank and Cardinal Wealth Services are independent of Raymond James Financial Services. | 19 Senior Management Average Industry Experience Average Years In-Market 2 24 Years 18 |
|
|
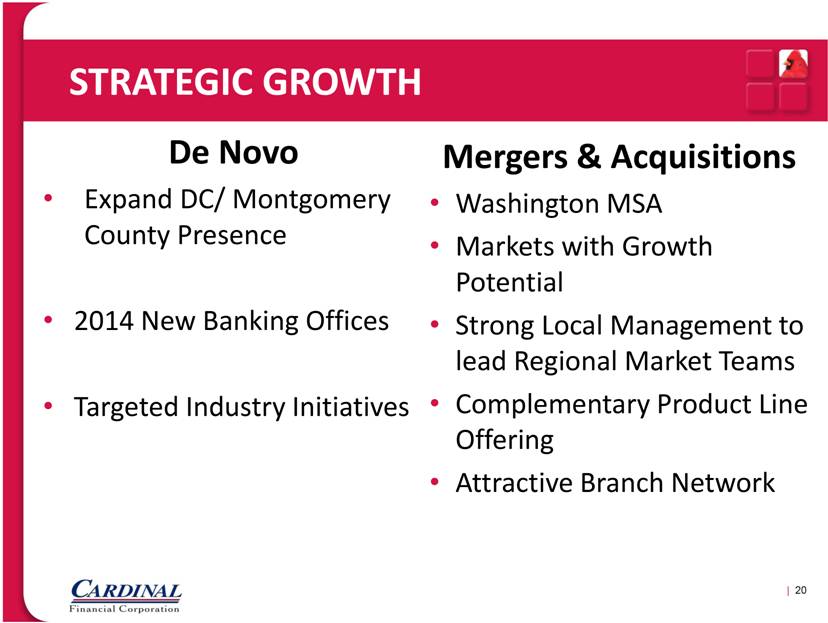
STRATEGIC GROWTH | 20 Mergers & Acquisitions Washington MSA Markets with Growth Potential Strong Local Management to lead Regional Market Teams Complementary Product Line Offering Attractive Branch Network De Novo Expand DC/ Montgomery County Presence 2014 New Banking Offices Targeted Industry Initiatives |
|
|
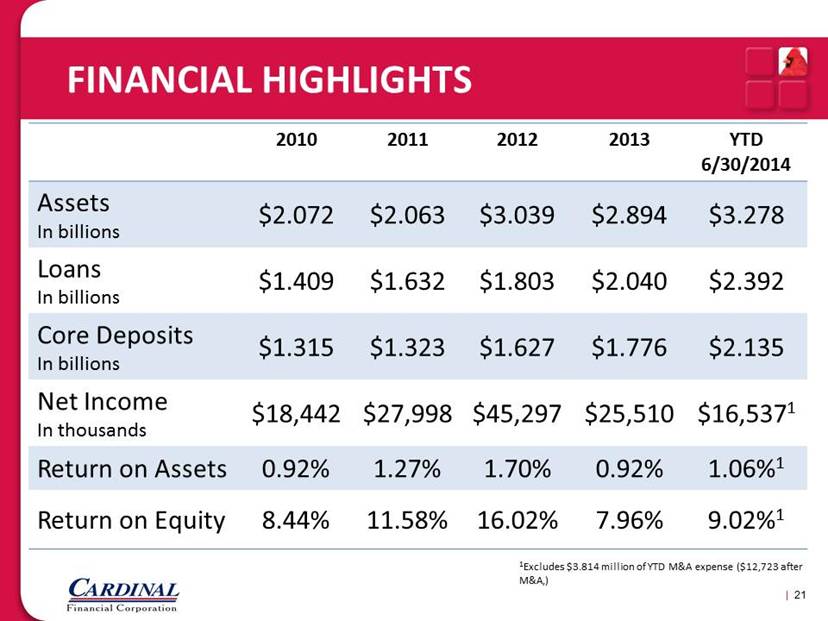
FINANCIAL HIGHLIGHTS 2010 2011 2012 2013 YTD 6/30/2014 Assets In billions $2.072 $2.063 $3.039 $2.894 $3.278 Loans In billions $1.409 $1.632 $1.803 $2.040 $2.392 Core Deposits In billions $1.315 $1.323 $1.627 $1.776 $2.135 Net Income In thousands $18,442 $27,998 $45,297 $25,510 $16,5371 Return on Assets 0.92% 1.27% 1.70% 0.92% 1.06% 1 Return on Equity 8.44% 11.58% 16.02% 7.96% 9.02% 1 | 21 1Excludes $3.814 million of YTD M&A expense ($12,723 after M&A) |
|
|
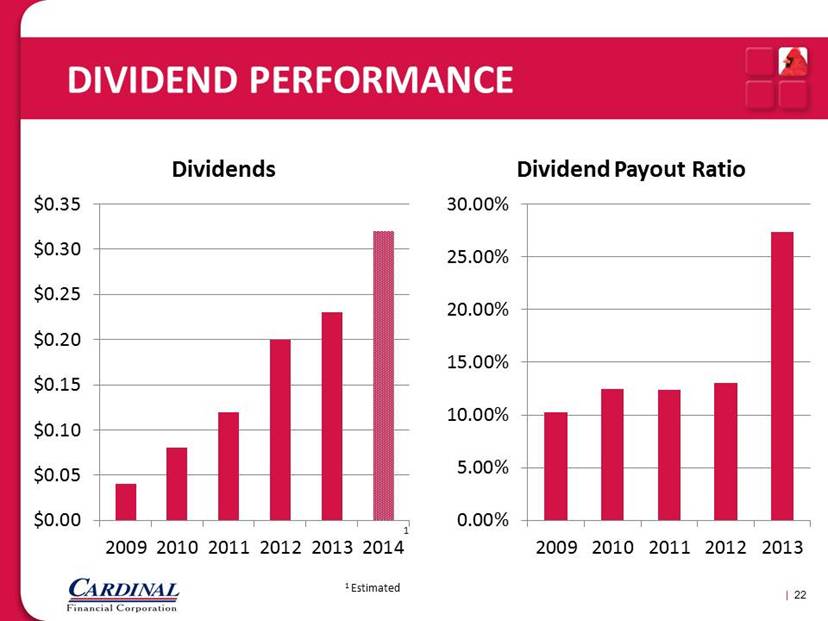
| 22 DIVIDEND PERFORMANCE 1 1 Estimated Dividends Dividend Payout Ratio |
|
|
INVESTMENT SUMMARY Well-positioned for growth Franchise value in premier market Resilient regional economy Opportunities for organic and M&A growth Strong, experienced management team Excellent asset quality and diversified loan portfolio Diversified revenue stream Shareholder-focused Attractive valuation Dividend has increased 800% since 2009 Dividend payout ratio target of 20% to 30% of earnings. 23 |
|
|
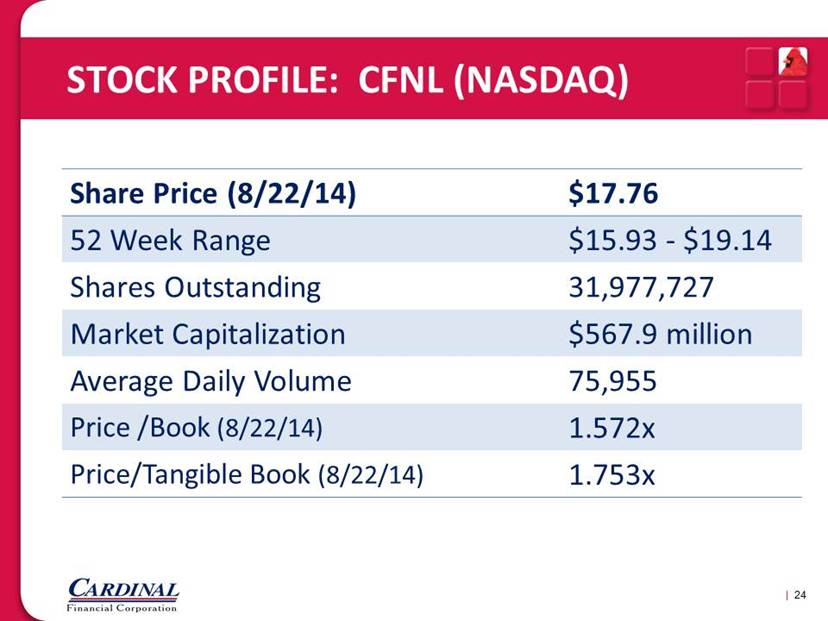
STOCK PROFILE: CFNL (NASDAQ) | 22 Share Price (8/22/14) $17.76 52 Week Range $15.93 - $19.14 Shares Outstanding 31,977,727 Market Capitalization $567.9 million Average Daily Volume 75,955 Price /Book (8/22/14) 1.572x Price/Tangible Book (8/22/14) 1.753x 24 |
|
|
Aggressive on Sales, CONSERVATIVE ON RISK OUR OPERATING PHILOSOPHY | 25 |
|
|
APPENDIX A Peer Comparisons |
|
|
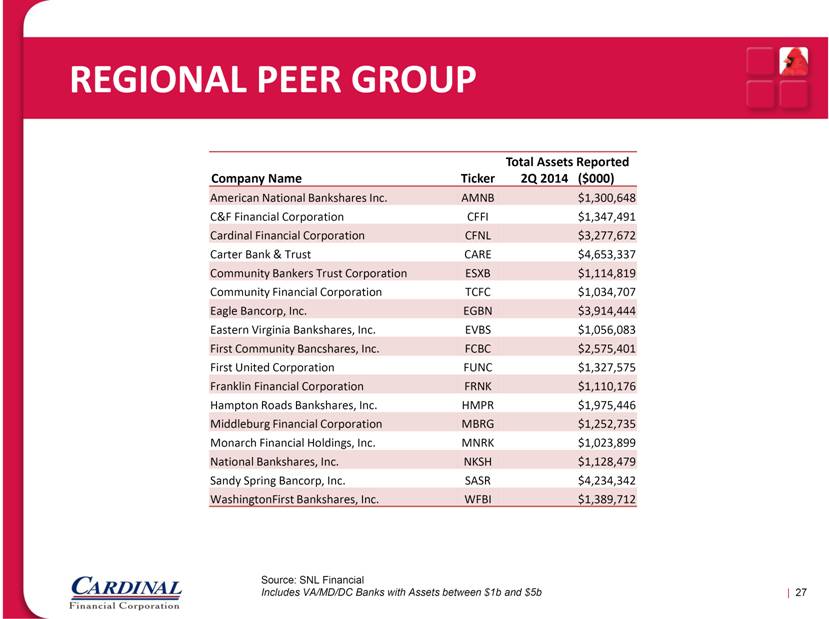
REGIONAL PEER GROUP | 27 Company Name Ticker Total Assets Reported 2Q 2014 ($000) American National Bankshares Inc. AMNB $1,300,648 C&F Financial Corporation CFFI $1,347,491 Cardinal Financial Corporation CFNL $3,277,672 Carter Bank & Trust CARE $4,653,337 Community Bankers Trust Corporation ESXB $1,114,819 Community Financial Corporation TCFC $1,034,707 Eagle Bancorp, Inc. EGBN $3,914,444 Eastern Virginia Bankshares, Inc. EVBS $1,056,083 First Community Bancshares, Inc. FCBC $2,575,401 First United Corporation FUNC $1,327,575 Franklin Financial Corporation FRNK $1,110,176 Hampton Roads Bankshares, Inc. HMPR $1,975,446 Middleburg Financial Corporation MBRG $1,252,735 Monarch Financial Holdings, Inc. MNRK $1,023,899 National Bankshares, Inc. NKSH $1,128,479 Sandy Spring Bancorp, Inc. SASR $4,234,342 WashingtonFirst Bankshares, Inc. WFBI $1,389,712 Source: SNL Financial Includes VA/MD/DC Banks with Assets between $1b and $5b |
|
|
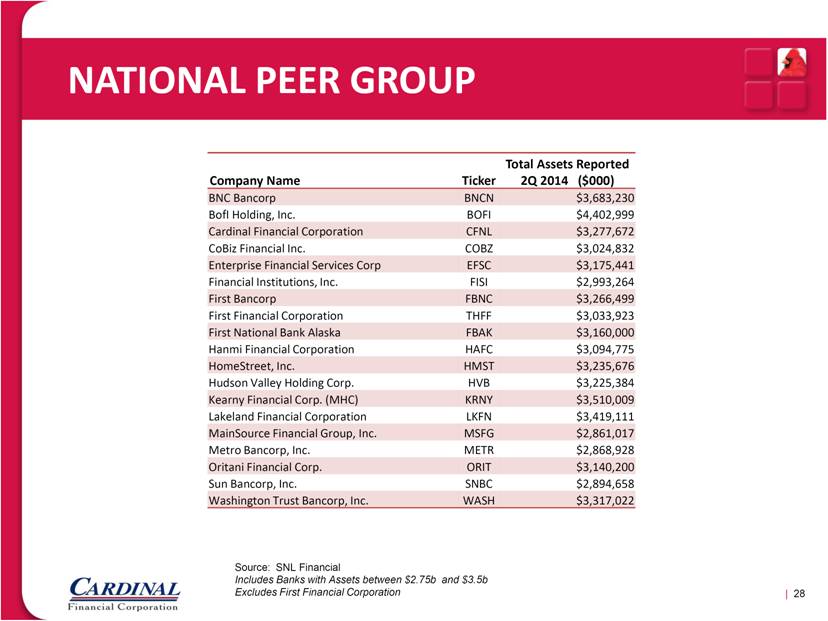
NATIONAL PEER GROUP Company Name Ticker Total Assets Reported 2Q 2014 ($000) BNC Bancorp BNCN $3,683,230 BofI Holding, Inc. BOFI $4,402,999 Cardinal Financial Corporation CFNL $3,277,672 CoBiz Financial Inc. COBZ $3,024,832 Enterprise Financial Services Corp EFSC $3,175,441 Financial Institutions, Inc. FISI $2,993,264 First Bancorp FBNC $3,266,499 First Financial Corporation THFF $3,033,923 First National Bank Alaska FBAK $3,160,000 Hanmi Financial Corporation HAFC $3,094,775 HomeStreet, Inc. HMST $3,235,676 Hudson Valley Holding Corp. HVB $3,225,384 Kearny Financial Corp. (MHC) KRNY $3,510,009 Lakeland Financial Corporation LKFN $3,419,111 MainSource Financial Group, Inc. MSFG $2,861,017 Metro Bancorp, Inc. METR $2,868,928 Oritani Financial Corp. ORIT $3,140,200 Sun Bancorp, Inc. SNBC $2,894,658 Washington Trust Bancorp, Inc. WASH $3,317,022 | 28 Source: SNL Financial Includes Banks with Assets between $2.75b and $3.5b Excludes First Financial Corporation |
|
|
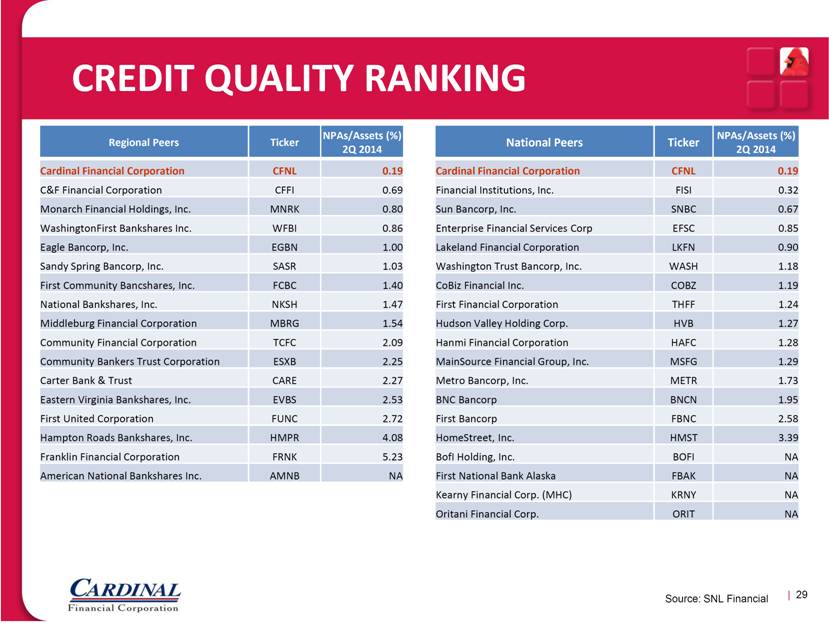
CREDIT QUALITY RANKING | 29 Source: SNL Financial National Peers Ticker NPAs/Assets (%) 2Q 2014 Cardinal Financial Corporation CFNL 0.19 Financial Institutions, Inc. FISI 0.32 Sun Bancorp, Inc. SNBC 0.67 Enterprise Financial Services Corp EFSC 0.85 Lakeland Financial Corporation LKFN 0.90 Washington Trust Bancorp, Inc. WASH 1.18 CoBiz Financial Inc. COBZ 1.19 First Financial Corporation THFF 1.24 Hudson Valley Holding Corp. HVB 1.27 Hanmi Financial Corporation HAFC 1.28 MainSource Financial Group, Inc. MSFG 1.29 Metro Bancorp, Inc. METR 1.73 BNC Bancorp BNCN 1.95 First Bancorp FBNC 2.58 HomeStreet, Inc. HMST 3.39 BofI Holding, Inc. BOFI NA First National Bank Alaska FBAK NA Kearny Financial Corp. (MHC) KRNY NA Oritani Financial Corp. ORIT NA Regional Peers Ticker NPAs/Assets (%) 2Q 2014 Cardinal Financial Corporation CFNL 0.19 C&F Financial Corporation CFFI 0.69 Monarch Financial Holdings, Inc. MNRK 0.80 WashingtonFirst Bankshares Inc. WFBI 0.86 Eagle Bancorp, Inc. EGBN 1.00 Sandy Spring Bancorp, Inc. SASR 1.03 First Community Bancshares, Inc. FCBC 1.40 National Bankshares, Inc. NKSH 1.47 Middleburg Financial Corporation MBRG 1.54 Community Financial Corporation TCFC 2.09 Community Bankers Trust Corporation ESXB 2.25 Carter Bank & Trust CARE 2.27 Eastern Virginia Bankshares, Inc. EVBS 2.53 First United Corporation FUNC 2.72 Hampton Roads Bankshares, Inc. HMPR 4.08 Franklin Financial Corporation FRNK 5.23 American National Bankshares Inc. AMNB NA |