Attached files
| file | filename |
|---|---|
| 8-K - FORM 8-K - ABM INDUSTRIES INC /DE/ | t1401682_8k.htm |
| EX-99.1 - EXHIBIT 99.1 - ABM INDUSTRIES INC /DE/ | t1401682_ex99-1.htm |
Exhibit 99.2

Cover Slide Title (20pt. Bold) Third Quarter 2014 Teleconference September 4 , 2014

1 2 3 4 5 Agenda 2 Introduction & Overview | Henrik Slipsager, CEO Third Quarter 2014 Review of Financial Results | Jim Lusk, CFO Third Quarter 2014 Operational Review | Jim McClure, EVP, Tracy Price, EVP & Henrik Slipsager, CEO Fiscal 2014 Outlook | Henrik Slipsager, CEO Questions & Answers Forward - Looking Statements and Non - GAAP Financial Information: Our discussions during this conference call will include forward - looking statements. Actual results could differ materially from th ose projected in the forward - looking statements. The factors that could cause actual results to differ are discussed in the Company’s 2013 Annual Report on Form 10 - K and in our 2014 reports on Form 10 - Q and Form 8 - K. These reports are available on our website at http://investor.abm.com/ under “SEC Filings”. A description of factors that could cause actual results to differ is also set forth at the end of this presentation. Also, the discussion during this conference call will include certain financial measures that were not prepared in accordance wi th U.S. generally accepted accounting principles (“U.S. GAAP”). Reconciliations of those non - GAAP financial measures to the most directly comparable U.S. GAAP financial measures can be found on the Investor Relations portion of our website at http://investor.abm.com and at the end of this presentation.

Third Quarter 2014 Review of Financial Results

Fiscal Q3 2014 Overview • Achieved record revenue for the third quarter of $1.28 billion, up 4.9% – Select organic growth rates: ▪ Janitorial 3.5%; ▪ Building & Energy Solutions 14.2% 1 ; and ▪ Other (Air Serv) 11.1% 2 • Net Income up 21.3%, Adjusted N et I ncome per share rises 14.6% to $0.47 – Items affecting adjusted net income: ▪ Organic growth ▪ Realignment savings in the Onsite businesses ▪ L ower insurance expense due to enhancements in the Company’s risk management and safety programs • Repurchased 377,364 shares at a cost of $10 million • Announced 194th consecutive quarterly dividend 4 1 Excludes revenue from acquisition of BEST Infrared Services, Inc. & Alpha Mechanical, Inc. 2 Excludes revenue from acquisition of Blackjack Promotions Limited

Third Quarter Results Synthesis – Key Financial Metrics 5 Note: Reconciliation of adjusted operating p rofit, adjusted net income, adjusted net income per diluted share, and adjusted EBITDA is in the appendix of this presentatio n. Adjusted Net Income • Adjusted net income of $ 26 . 9 million, or $ 0 . 47 per diluted share, up 16 . 5 % compared to $ 23 . 1 million, or $ 0 . 41 per diluted share in fiscal 2013 third quarter . The increase in adjusted net income is primarily from organic growth, savings from the realignment of Onsite businesses, and lower insurance expense for policy year 2014 due to enhancements in risk management & safety programs . Net Income • N et income of $ 19 . 4 million or $ 0 . 34 per diluted share was up 21 . 3 % compared to $ 16 . 0 million, or $ 0 . 29 per diluted share in fiscal 2013 . The increase is the result of new business, improved operating margins including savings from the realignment of Onsite businesses and lower insurance expense . Also in the Company’s results is an after - tax charge of $ 6 . 1 million ( $ 10 . 5 million pre - tax) to increase expected insurance reserves for policy years before 2014 . This compares to an after - tax charge of $ 6 . 0 million ( $ 9 . 9 million pre - tax) recorded in the third quarter of fiscal 2013 . Net Cash from Operating Activities • For the quarter, net cash from operating a ctivities decreased 58 . 5 % to $ 19 . 3 million, primarily related to the timing of collecting client receivables and higher cash taxes paid . ($ in millions, except per share amounts) Increase Increase (unaudited) 2014 2013 (Decrease) 2014 2013 (Decrease) Revenues 1,276.1$ 1,216.8$ 4.9% 3,733.9$ 3,572.5$ 4.5% 33.7$ 28.7$ 17.4% 85.5$ 81.6$ 4.8% 46.7$ 40.4$ 15.6% 106.5$ 96.9$ 9.9% Net income 19.4$ 16.0$ 21.3% 47.7$ 48.7$ (2.1)% 0.34$ 0.29$ 17.2% 0.84$ 0.87$ (3.4)% 26.9$ 23.1$ 16.5% 59.8$ 58.0$ 3.1% 0.47$ 0.41$ 14.6% 1.05$ 1.04$ 1.0% 19.3$ 46.5$ (58.5)% 57.0$ 84.3$ (32.4)% Adjusted EBITDA 62.4$ 57.2$ 9.1% 153.3$ 147.8$ 3.7% Net cash provided by operating activities Adjusted net income Adjusted net income per diluted share Net income per diluted share Adjusted operating profit Nine Months Ended July 31, Three Months Ended July 31, Operating profit

Select Cash Flow & Balance Sheet Items Cash Flow from Operating Activities (in millions) • Q3 2014 Insurance claim liabilities of $352.4 million down $7.4 million compared to Q3 2013 • Q3 2014 Self - insurance claims paid $25.4 million up $1.9 million compared to Q3 2013 • Q3 2014 c apital expenditures of $9.2 million, down $1.8 million Y - o - Y 6 • Days sales outstanding (DSO) for the third quarter were 54 days • DSO up 3 days on a Y - o - Y basis and up 1 day sequentially • Q3 2014 Depreciation and amortization of $14.1 million down $1.1 million Y - o - Y basis

Select Cash Flow & Balance Sheet Items – Continued 7 Line of Credit OneSource Linc Air Serv/HHA In Millions Dividends Paid (Fiscal Year Basis) Per Share $0.250 $0.300 $0.350 $0.400 $0.450 $0.500 $0.550 $0.600 2004 2005 2006 2007 2008 2009 2010 2011 2012 2013 $0.395 $0.415 $0.435 $0.470 $0.495 $0.515 $0.535 $0.555 $0.575 $0.595

Third Quarter 2014 Operational Review

Q3 2014 Results Synthesis - Revenues • Revenues of $648.3 million, up organically $22 million or 3.5% compared to 2013 Q3 • Janitorial tag business up 7.1% Consolidated revenues up 4.9% at $1.28 billion – A Q3 Record Janitorial Services 9 Facility Services Parking & Shuttle Services Security Services Building & Energy Solutions Other (Air Serv) • Revenues of $151.0 million, down $1.8 million or 1.2% compared to 2013 Q3 • Expecting flat to lower revenue growth in fourth quarter as new jobs ramp up • Revenues of $156.5 million, up $2.5 million or 1.6% compared to 2013 Q3 • Management reimbursement revenues were up $2.6 million to $78.0 million • Revenues of $95.4 million, down $0.8 million compared to 2013 Q3 • Anticipating new business in high - tech vertical to generate growth in upcoming quarters • Revenues of $127.5 million, up $22.6 million or 21.5% compared to 2013 Q3; organic revenue grew 14.2% • Y - o - Y organic growth of 14.4% in ABES, 11.0% in ABM Government, and 17.2% in ABM Healthcare Support Services • Revenues of $97.4 million, up $14.8 million or 17.9% compared to 2013 Q3; organic revenue grew 11.1% • Blackjack acquisition contributed revenue of $5.6 million

Q3 2014 Results Synthesis - Operating Profits 1 • Janitorial operating profit of $40.4 million, increased $6.0 million or 17.4%. This significant growth was primarily related to lower labor and labor related expenses as a result of safety initiatives and realignment savings, and new business added. • Operating profit for Facility Services was $7.5 million, up $0.5 or 7.1% on a number of items. • Parking operating profit increased $1.2 million, or 14.6%, as compared to the fiscal third quarter of 2013. The increase is attributable to reduced insurance expense, lower expense from the Onsite realignment and lower legal expense. • Operating profit for Security was flat at $3.9 million. • Building & Energy Solutions profit increased 15.3% to $6.8 million from new business and acquisitions. • Operating profit for the Other segment, which represents the results of Air Serv, increased $0.7 million to $4.5 million, primarily driven by new business in the United Kingdom and contribution from the Blackjack acquisition. ($ in millions) 2014 2013 Change Janitorial 40.4$ 34.4$ 17.4% Facility Services 7.5 7.0 7.1% Parking 9.4 8.2 14.6% Security 3.9 4.0 (2.5)% Building & Energy Solutions 6.8 5.9 15.3% Other 4.5 3.8 18.4% Total Profit 72.5 63.3 14.5% Third Quarter 10 1 Excludes Corporate

Q3 2014 Business & Sales Highlights • ABM Building Solutions business was selected by Colquitt County Schools to implement district - wide comprehensive infrastructure improvements. The customized solution developed by ABM will provide energy efficient upgrades and facility enhancements to all fourteen schools within the county. • ABM’s Facility Services selected to provide a full range of facilities engineering maintenance services for Commonwealth Partner’s properties across the Western and Midwestern United States. The deal builds upon Commonwealth Partner’s existing contract with ABM Parking Services. • Company completed acquisition of Airco Commercial Services Inc., a provider of HVAC services, energy solutions and building controls. The acquisition is part of ABM’s strategy to deliver an entire portfolio of services in every major metro area in Northern California. 11

O utlook

Fiscal 2014 Outlook 13 • Based on the Company’s year - to - date operational results and its current expectations, the Company is lifting guidance for: – Adjusted net income to $1.65 to $1.69 per diluted share • Guidance for net income of $1.42 to $1.46 per diluted share • Effective tax rate in the range of 36% to 38%. This is an increase over fiscal 2013’s effective tax rate of 35.2%. • This guidance continues to assume an $0.08 per diluted share benefit based on the Work Opportunity Tax Credit, which the Company assumes Congress will retroactively reenact by the end of the Company’s fiscal year - end of October 31, 2014. • Depreciation and amortization expense is expected to remain relatively consistent with fiscal 2013. The range is $58 million to $60 million. • Capital expenditures are expected to be in the range of $34 million to $36 million. • Cash taxes are expected to be in the range of $35 million to $37 million.

Forward - Looking Statement 14 This presentation contains forward - looking statements that set forth management’s anticipated results based on management’s current plans and assumptions . Any number of factors could cause actual results to differ materially from those anticipated . These factors include, but are not limited to the following : ( 1 ) risks relating to our acquisition strategy may adversely impact our results of operations ; ( 2 ) our strategy of moving to an integrated facility solutions services provider platform, which focuses on vertical market strategy, may not generate the organic growth in revenues or profitability that we expect ; ( 3 ) we are subject to intense competition that can constrain our ability to gain business as well as our profitability ; ( 4 ) increases in costs that we cannot pass on to clients, including certain costs relating to electronic workforce management and client management tools, could affect our profitability ; ( 5 ) federal health care reform legislation may adversely affect our business and results of operations ; ( 6 ) our business success depends on retaining senior management and attracting and retaining qualified personnel ; ( 7 ) we have high deductibles for certain insurable risks, and therefore we are subject to volatility associated with those risks ; ( 8 ) we are defendants in class and representative actions and other lawsuits alleging various claims that could cause us to incur substantial liabilities ; ( 9 ) we are at risk of losses stemming from any accident or other incident involving our airport operations ; ( 10 ) our business success depends on our ability to preserve our long - term relationships with clients ; ( 11 ) our restructuring initiatives may not achieve the expected cost reductions ; ( 12 ) we are at risk of losses stemming from damage to our reputation ; ( 13 ) negative or unexpected tax consequences could adversely affect our results of operations ; ( 14 ) changes in energy prices and government regulations could adversely impact the results of operations of our Building & Energy Solutions business ; ( 15 ) sequestration under the Budget Control Act of 2011 may negatively impact our business ; ( 16 ) significant delays or reductions in appropriations for our government contracts may negatively affect our business and could have an adverse effect on our financial position, results of operations, and cash flows ; ( 17 ) we conduct some of our operations through joint ventures, and our ability to do business may be affected by the failure of our joint venture partners to perform their obligations ; ( 18 ) our services in areas of military conflict expose us to additional risks ; ( 19 ) we are subject to business continuity risks associated with centralization of certain administrative functions ; ( 20 ) we could incur additional costs to cover energy savings guarantees ; ( 21 ) we are subject to cyber - security risks arising out of breaches of security relating to sensitive company, client, and employee information and to the technology that manages our operations and other business processes ; ( 22 ) a decline in commercial office building occupancy and rental rates could affect our revenues and profitability ; ( 23 ) deterioration in general economic conditions could reduce the demand for facility services and, as a result, reduce our earnings and adversely affect our financial condition ; ( 24 ) financial difficulties or bankruptcy of one or more of our clients could adversely affect our results ; ( 25 ) future declines in the fair value of our investments in auction rate securities could negatively impact our earnings ; ( 26 ) we incur accounting and other control costs that reduce profitability ; ( 27 ) any future increase in the level of our debt or in interest rates could affect our results of operations ; ( 28 ) our ability to operate and pay our debt obligations depends upon our access to cash ; ( 29 ) goodwill impairment charges could have a material adverse effect on our financial condition and results of operations ; ( 30 ) impairment of long - lived assets may adversely affect our operating results ; ( 31 ) changes in immigration laws or enforcement actions or investigations under such laws could significantly adversely affect our labor force, operations, and financial results ; ( 32 ) labor disputes could lead to loss of revenues or expense variations ; ( 33 ) we participate in multiemployer pension plans that under certain circumstances could result in material liabilities being incurred ; and ( 34 ) natural disasters or acts of terrorism could disrupt services .

Appendix - Unaudited Reconciliation of non - GAAP Financial Measures

Unaudited Reconciliation of non - GAAP Financial Measures 16 ABM Industries Incorporated and Subsidiaries Reconciliations of Non-GAAP Financial Measures (Unaudited) ($ in millions) 2014 2013 2014 2013 Reconciliation of Adjusted Net Income to Net Income Adjusted net income 26.9$ 23.1$ 59.8$ 58.0$ Items impacting comparability: Rebranding (a) (1.4) (1.4) (3.2) (2.1) U.S. Foreign Corrupt Practices Act investigation (b) (0.2) - (1.1) (0.4) Self-insurance adjustment (10.5) (9.9) (10.5) (9.9) Acquisition costs (0.3) (0.3) (0.6) (1.0) Litigation and other settlements - - (3.4) (0.1) Restructuring (c) (0.6) (0.1) (2.2) (1.8) Total items impacting comparability (13.0) (11.7) (21.0) (15.3) Benefit from income taxes 5.5 4.6 8.9 6.0 Items impacting comparability, net of taxes (7.5) (7.1) (12.1) (9.3) Net Income 19.4$ 16.0$ 47.7$ 48.7$ entity affiliated with a former joint venture partner. Nine Months Ended July 31, Three Months Ended July 31, (a) Represents costs related to the Company's branding initiative. (b) Includes legal and other costs incurred in connection with an internal investigation into a foreign (c) Restructuring costs associated with realignment of our operational structure.
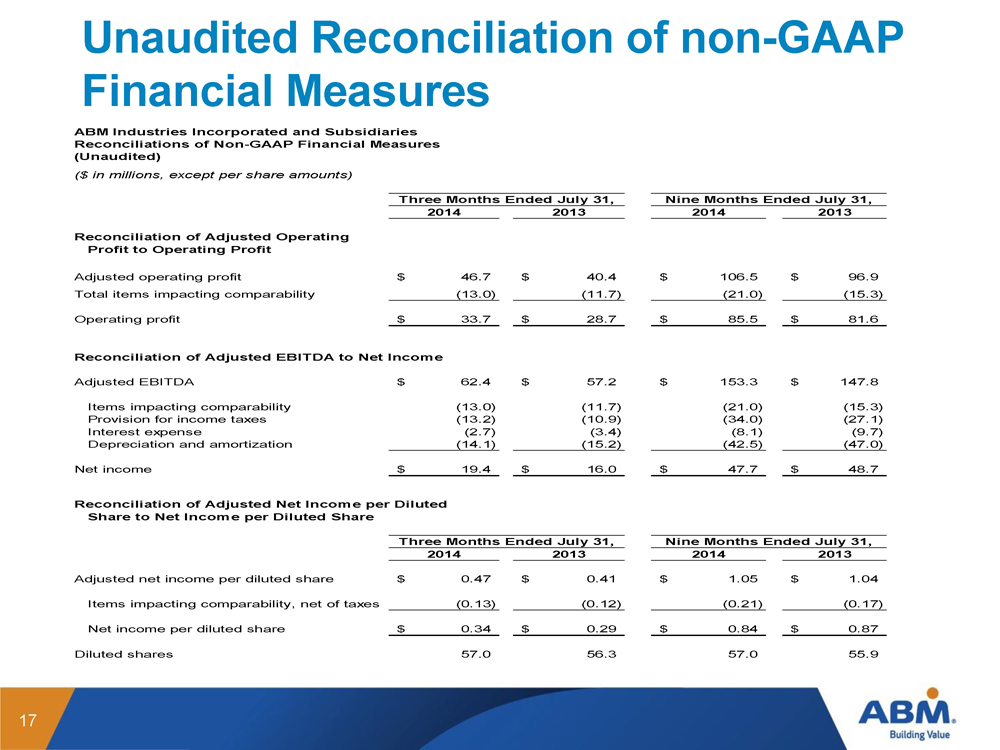
Unaudited Reconciliation of non - GAAP Financial Measures 17 ABM Industries Incorporated and Subsidiaries Reconciliations of Non-GAAP Financial Measures (Unaudited) ($ in millions, except per share amounts) 2014 2013 2014 2013 Reconciliation of Adjusted Operating Profit to Operating Profit Adjusted operating profit 46.7$ 40.4$ 106.5$ 96.9$ Total items impacting comparability (13.0) (11.7) (21.0) (15.3) Operating profit 33.7$ 28.7$ 85.5$ 81.6$ Reconciliation of Adjusted EBITDA to Net Income Adjusted EBITDA 62.4$ 57.2$ 153.3$ 147.8$ Items impacting comparability (13.0) (11.7) (21.0) (15.3) Provision for income taxes (13.2) (10.9) (34.0) (27.1) Interest expense (2.7) (3.4) (8.1) (9.7) Depreciation and amortization (14.1) (15.2) (42.5) (47.0) Net income 19.4$ 16.0$ 47.7$ 48.7$ Reconciliation of Adjusted Net Income per Diluted Share to Net Income per Diluted Share 2014 2013 2014 2013 Adjusted net income per diluted share 0.47$ 0.41$ 1.05$ 1.04$ Items impacting comparability, net of taxes (0.13) (0.12) (0.21) (0.17) Net income per diluted share 0.34$ 0.29$ 0.84$ 0.87$ Diluted shares 57.0 56.3 57.0 55.9 Three Months Ended July 31, Nine Months Ended July 31, Three Months Ended July 31, Nine Months Ended July 31,

Unaudited Reconciliation of non - GAAP Financial Measures 18 ABM Industries Incorporated and Subsidiaries Reconciliation of Estimated Adjusted Net Income per Diluted Share to Estimated Net Income per Diluted Share for the Year Ending October 31, 2014 Estimated net income per diluted share including expected Work Opportunity Tax Credit of $0.08 per diluted share (a) Low Estimate High Estimate Adjusted net income per diluted share 1.65$ 1.69$ Adjustments (b) (0.23)$ (0.23)$ Net income per diluted share 1.42$ 1.46$ (a) The Company continues to assume Congress will retroactively reenact the Work Opportunity Tax Credit within the Company's fiscal year, which ends October 31, 2014. This guidance includes the expected Work Opportunity Tax Credit of $ 0.08 per diluted share. Year Ending October 31, 2014 (per diluted share) (b)Adjustmentsincluderebrandingcosts,restructuringcostsassociatedwithrealignmentofouroperationalstructure,certainlegal settlements, adjustments to self-insurance reserves pertaining to prior year's claims and other unique items impacting comparability.