Attached files
| file | filename |
|---|---|
| 8-K - 8-K - PATTERSON UTI ENERGY INC | d781230d8k.htm |
 Barclays
2014 CEO Energy-Power Conference
September 2-3, 2014
Exhibit 99.1 |
 Forward Looking Statements
2
This material and any oral statements made in connection with this material
include "forward-looking statements" within the meaning of
the Securities Act of 1933 and the Securities Exchange Act of
1934. Statements made which provide the Company’s or
management’s intentions, beliefs, expectations or predictions for
the future are forward-looking statements and are inherently uncertain. The
opinions, forecasts, projections or other statements other than
statements of historical fact, including, without limitation, plans and
objectives of management of the Company are forward-looking
statements. It is important to note that actual results could
differ materially from those discussed in such forward-looking
statements. Important factors that could cause actual results to differ
materially include the risk factors and other cautionary statements
contained from time to time in the Company’s SEC filings, which may
be obtained by contacting the Company
or
the
SEC.
These
filings
are
also
available
through
the
Company’s
web
site at http://www.patenergy.com
or through the SEC’s Electronic Data Gathering
and Analysis Retrieval System (EDGAR) at
http://www.sec.gov. We undertake no
obligation to publicly update or revise any forward-looking
statement. Statements made in this presentation include
non-GAAP financial measures. The required reconciliation to
GAAP financial measures are included on our website and at the end of
this presentation. |
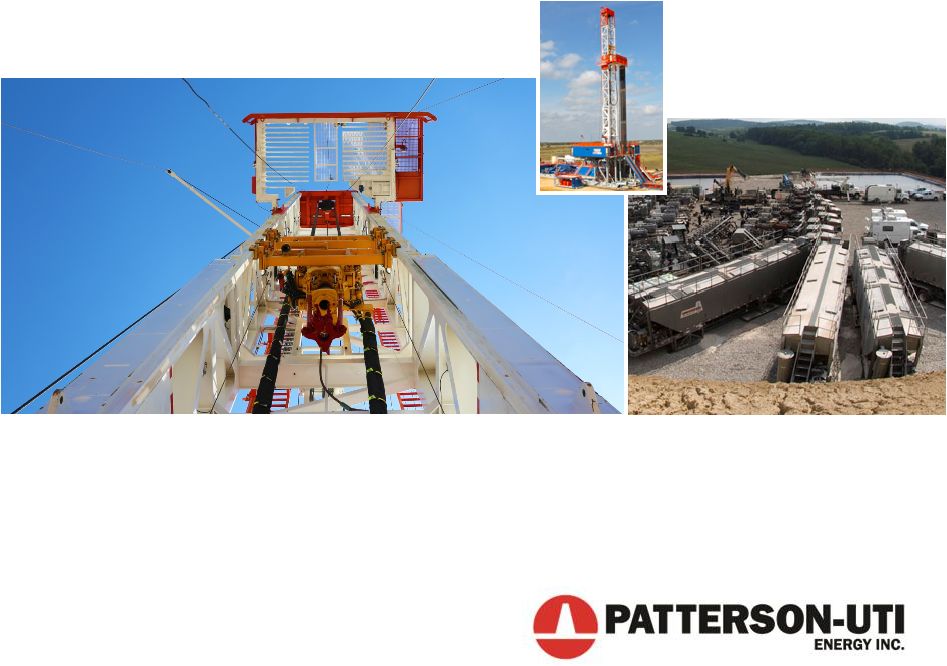
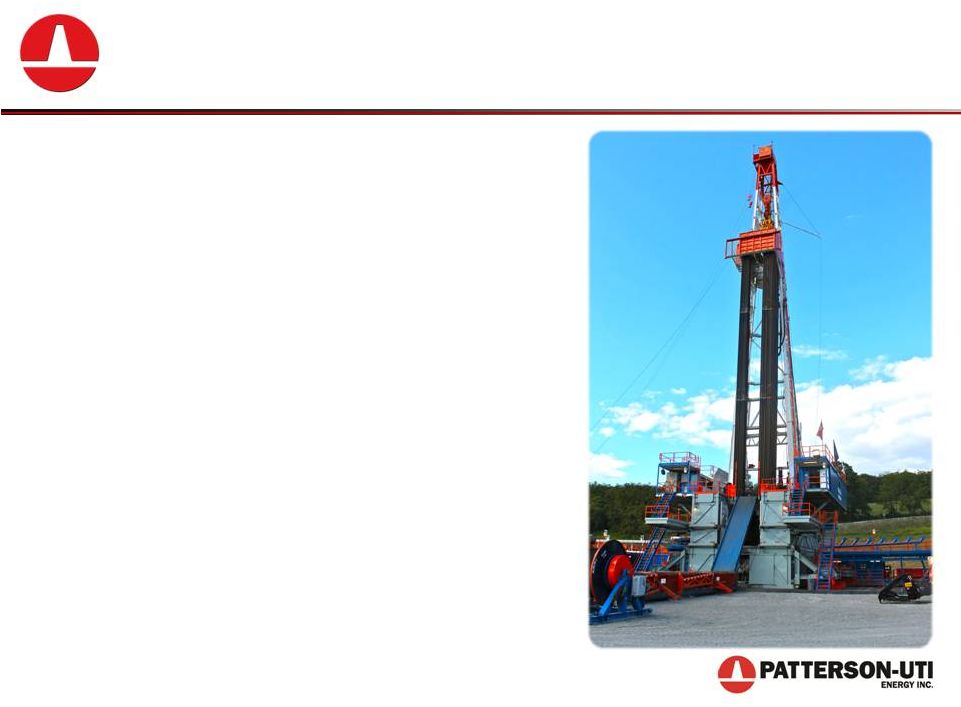
 Patterson-UTI Energy is a leading
provider of contract drilling and
pressure pumping services
3 |
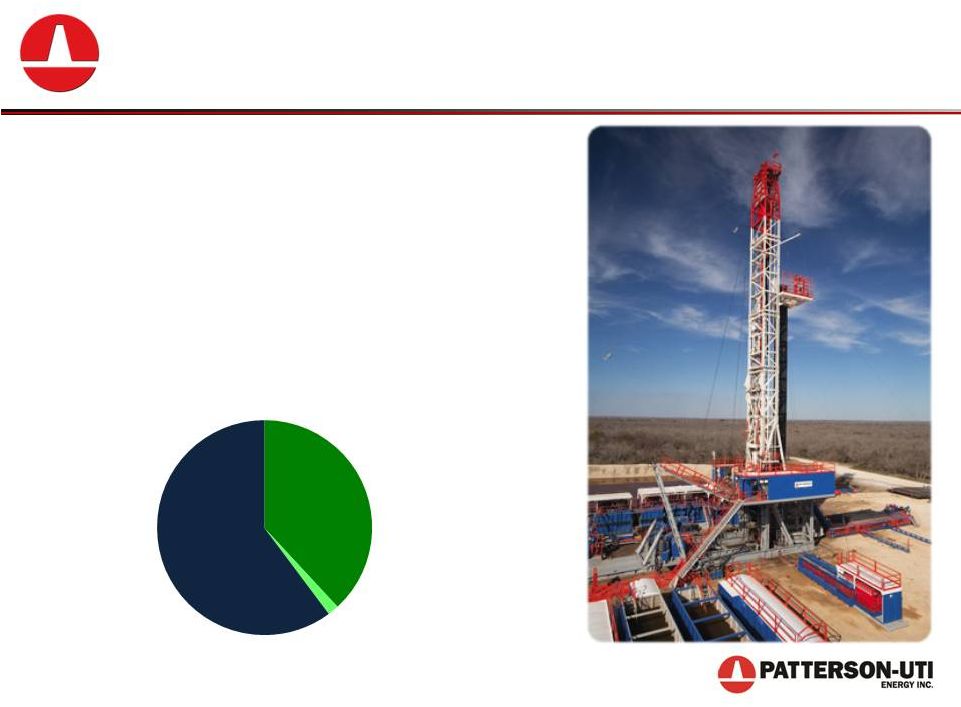 Contract Drilling
•
High quality fleet of land drilling rigs
including 137 APEX
®
rigs
•
Leader in walking rig technology for
pad drilling applications
•
Large footprint across North
American drilling markets
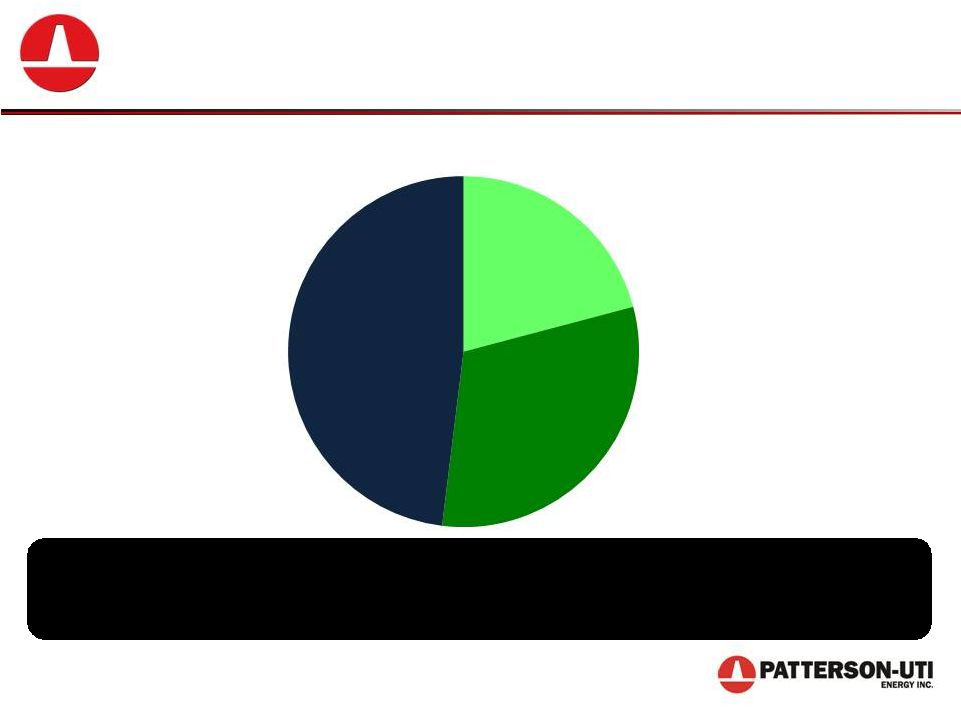
Patterson-UTI reported results for the six months ended June 30, 2014
4
Contract
Drilling
60%
Pressure
Pumping
36%
Oil &
Natural
Gas
2%
Components of Revenue |
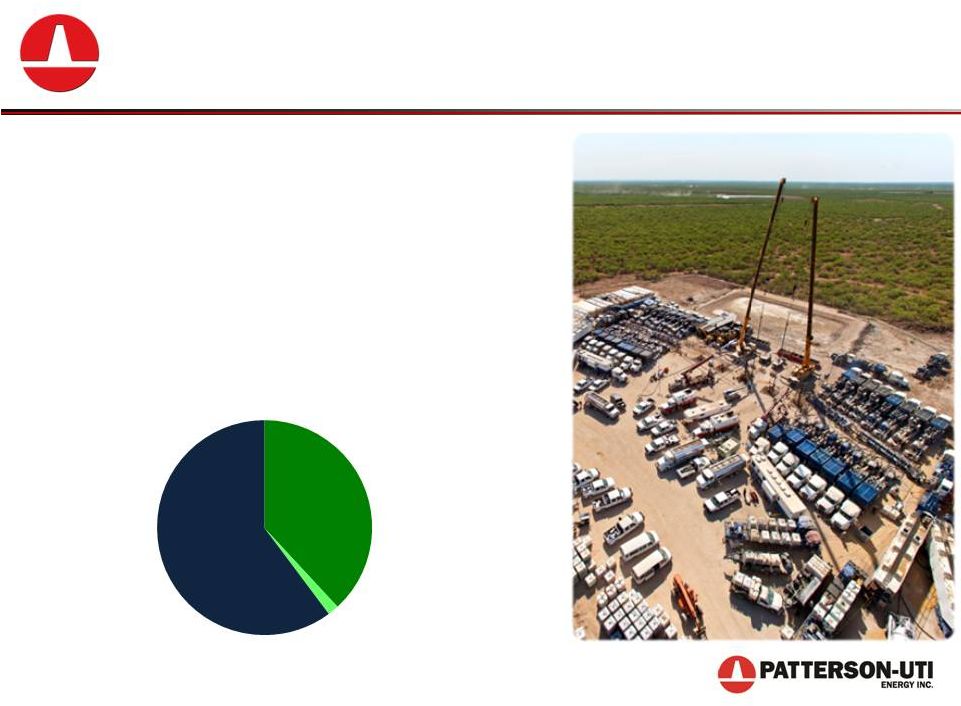 Pressure Pumping
•
High quality fleet of modern pressure
pumping equipment
•
A leader in natural gas bi-fuel
technology
•
Strong reputation for regional
knowledge and efficient operations
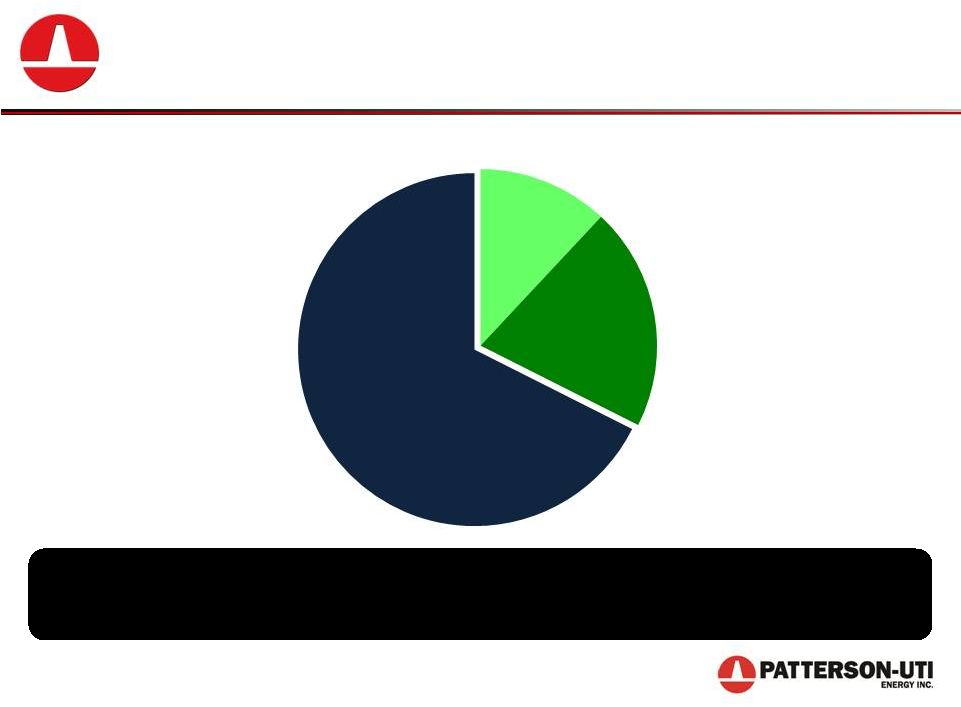
Patterson-UTI reported results for the six months ended June 30, 2014
5
Contract
Drilling
60%
Pressure
Pumping
36%
Oil &
Natural
Gas
2%
Components of Revenue |
 Contract Drilling |
 7
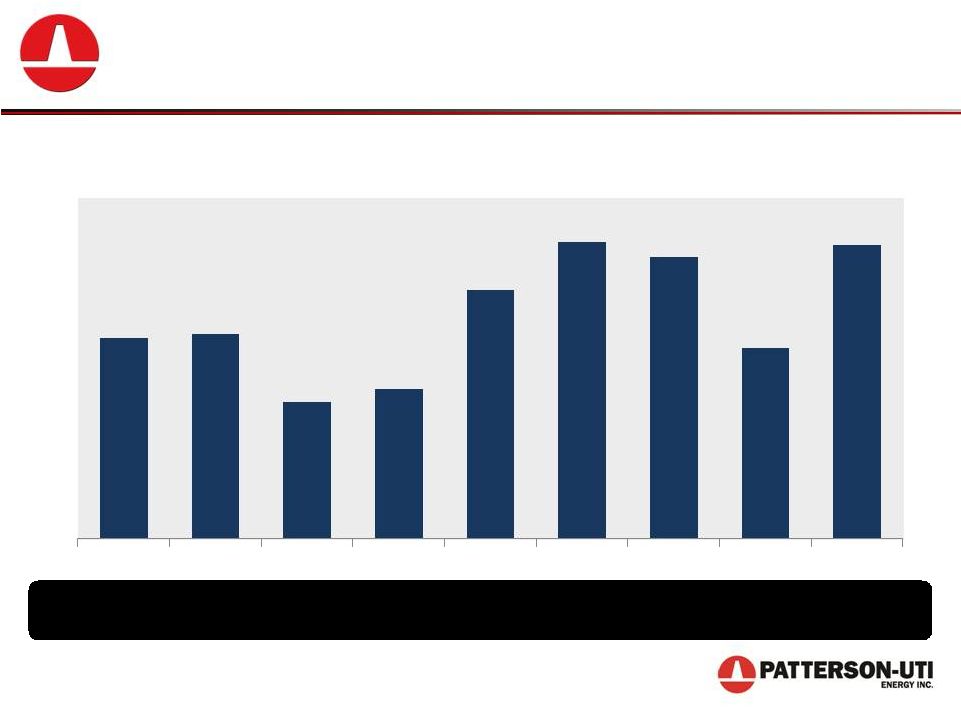
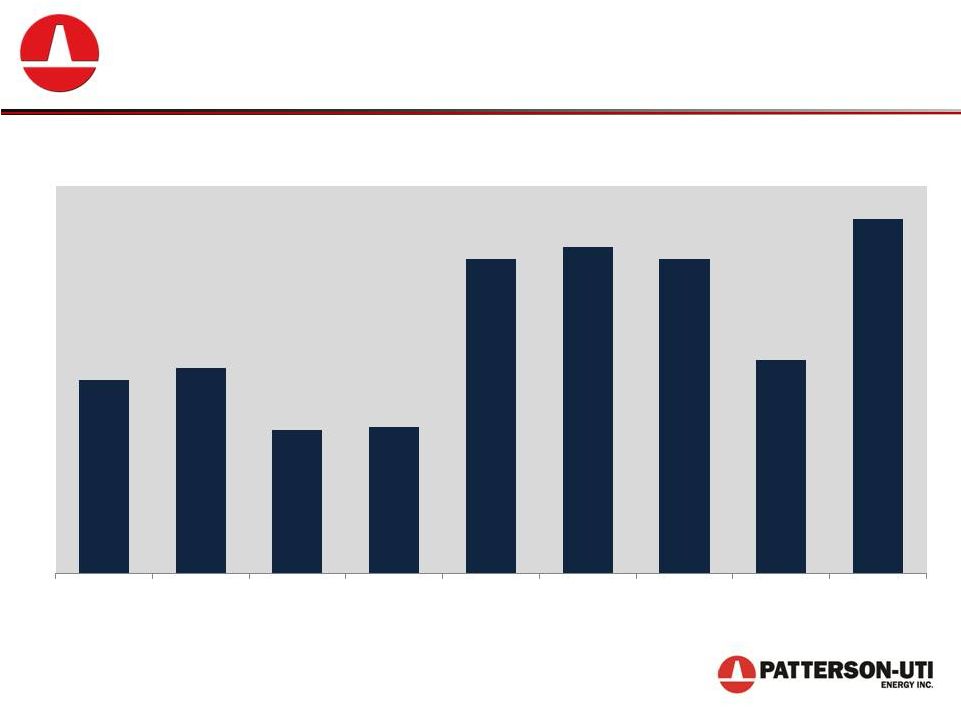
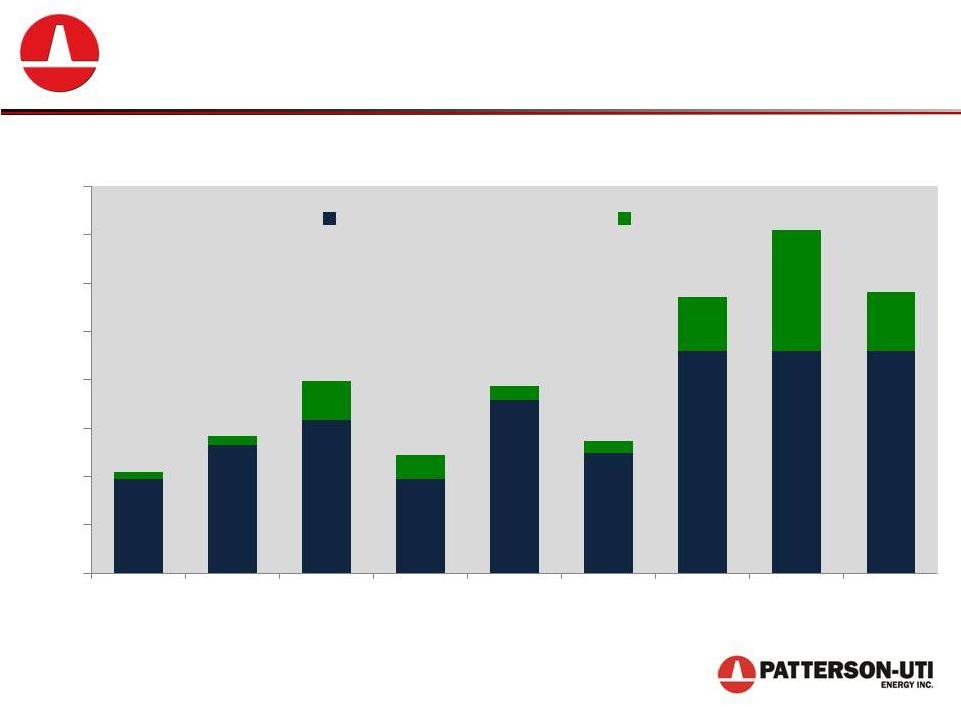
Contract Drilling Capital Expenditures and Acquisitions
($ in millions)
Investing in Our Drilling Rig Fleet
More than $4.5 billion invested since 2005
$531
$540
$361
$395
$656
$785
$745
$505
$775
2006
2007
2008
2009
2010
2011
2012
2013
2014E |
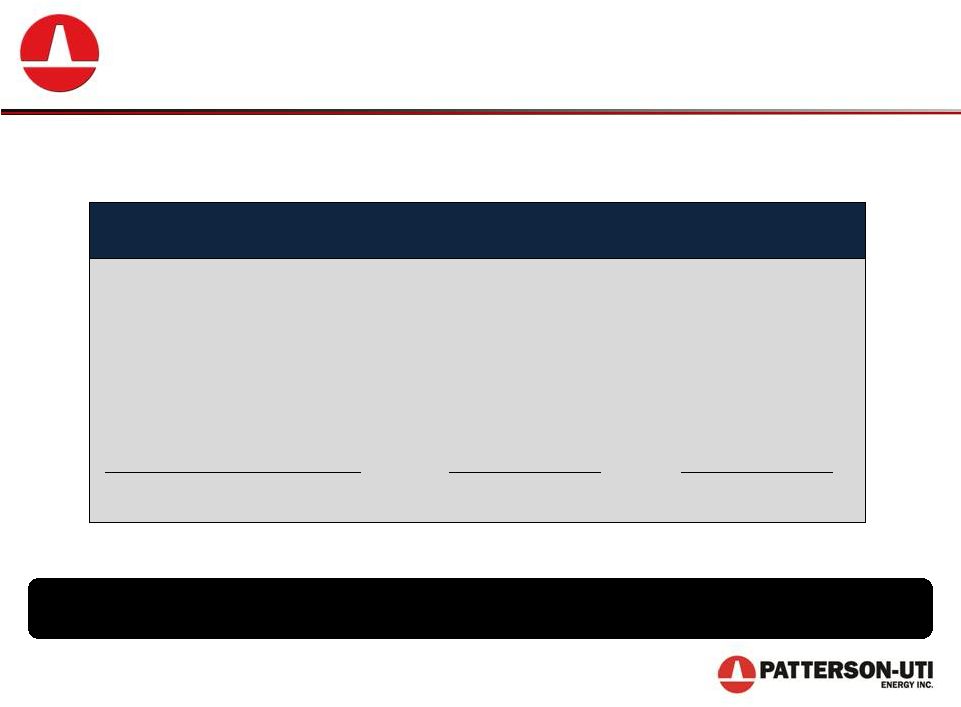 …and Expected as of June 30, 2015
APEX-XK
1500™
APEX-XK
1000™ APEX
WALKING ®
APEX 1500
®
APEX 1000
®
Total
APEX
®
Rigs
Class
APEX
®
Rigs as of September 2, 2014
6/30/2015
A leader in high specification drilling rigs
29
4
49
44
11
137
9/2/2014
APEX
®
Rig Fleet
8
50
4
49
44
11
158 |
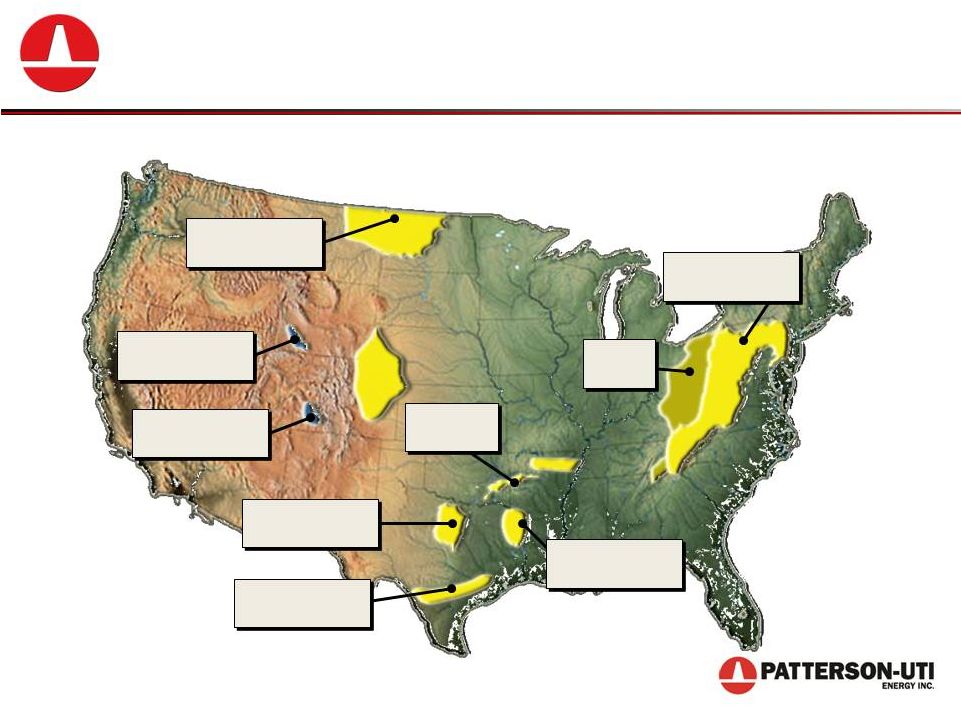
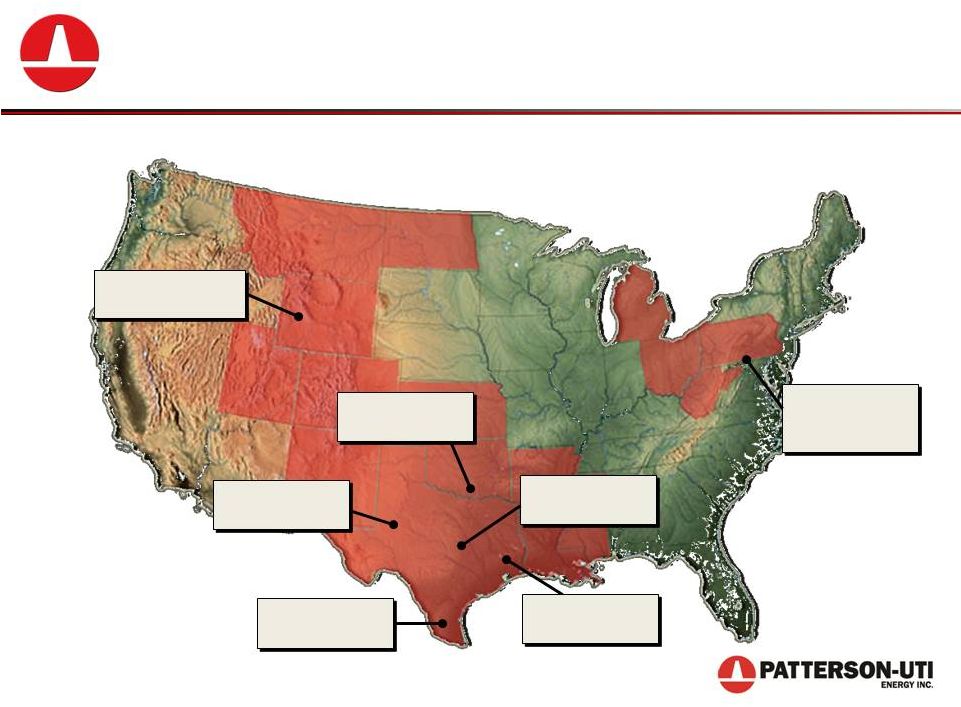 Large Geographic Footprint
9
PTEN’s Active U.S. Land Drilling Rigs
as of September 2014
Rockies
33 Rigs
Permian Basin
55 Rigs
South Texas
38 Rigs
Mid-Continent
26 Rigs
North Texas
7 Rigs
East Texas
15 Rigs
Appalachia
& Midwest
36 Rigs |
 Why invest in APEX
®
rigs?
…the impact has been transformative! |
 Increasing APEX
®
Drilling Activity
11
Active APEX
®
Rig Count
0
20
40
60
80
100
120
140 |
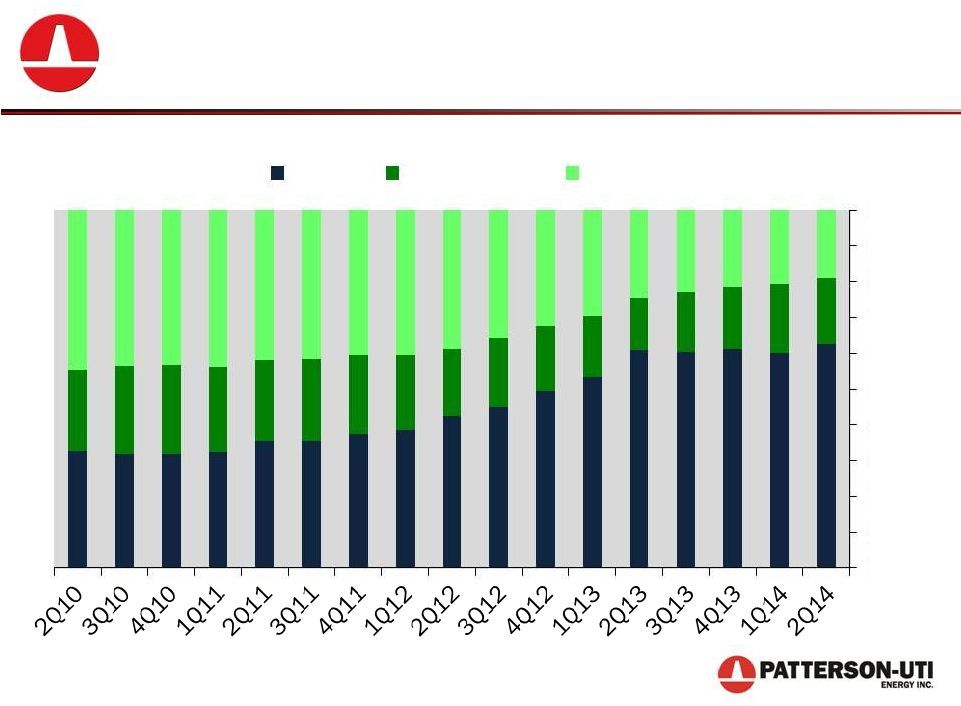 PTEN Relative Rig Count by Rig Class
12
0%
10%
20%
30%
40%
50%
60%
70%
80%
90%
100%
APEX®
Other Electric
Mechanical |
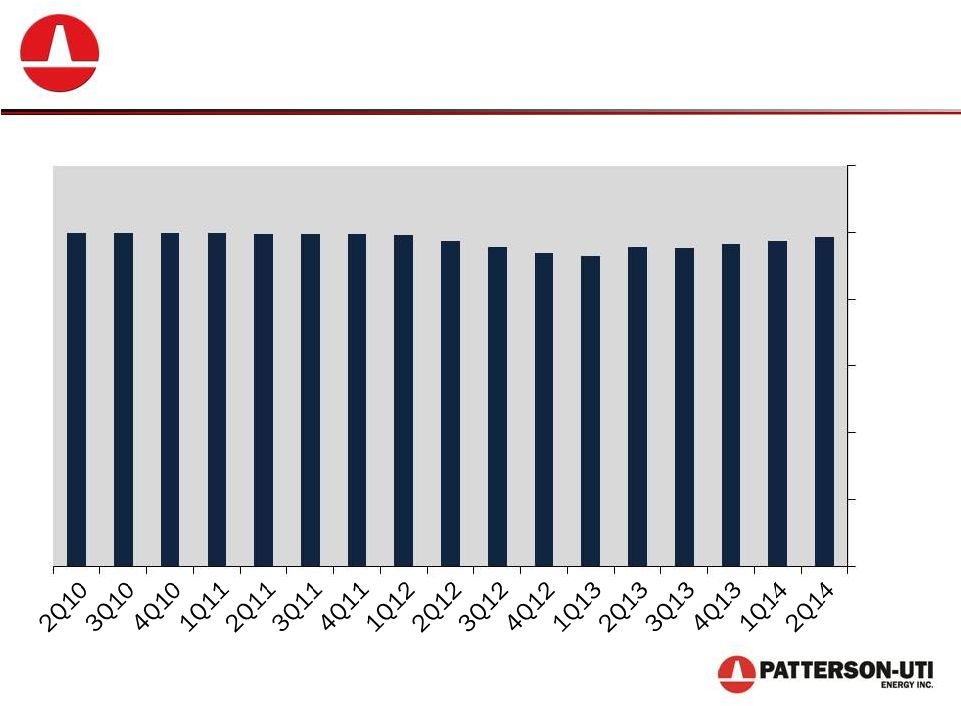 Greater Stability of Utilization
13
APEX
®
Rig Utilization
0%
20%
40%
60%
80%
100%
120% |
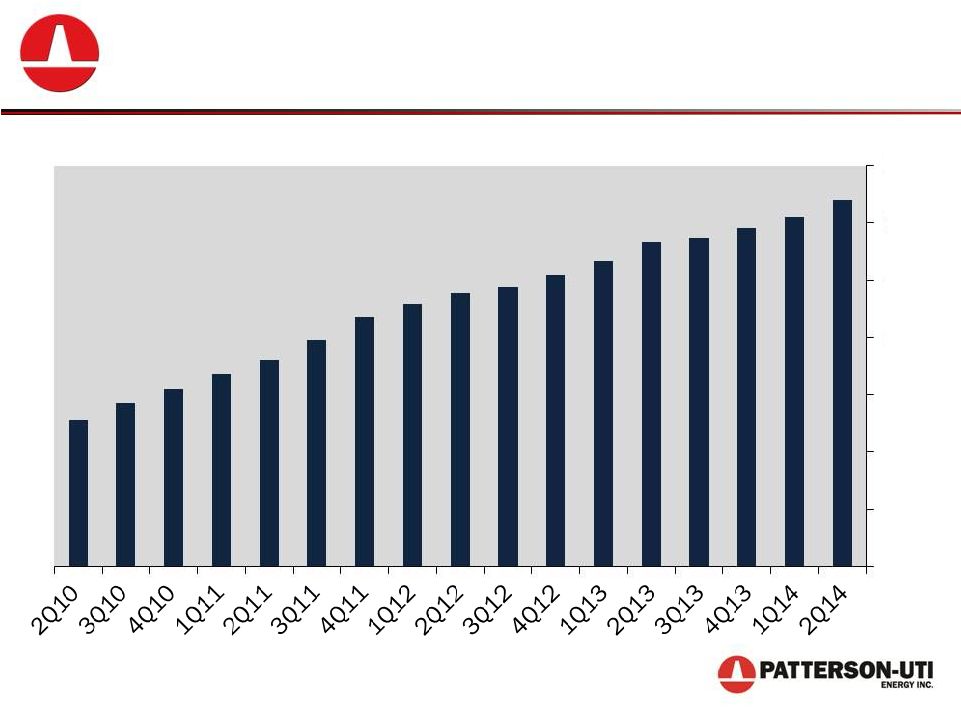
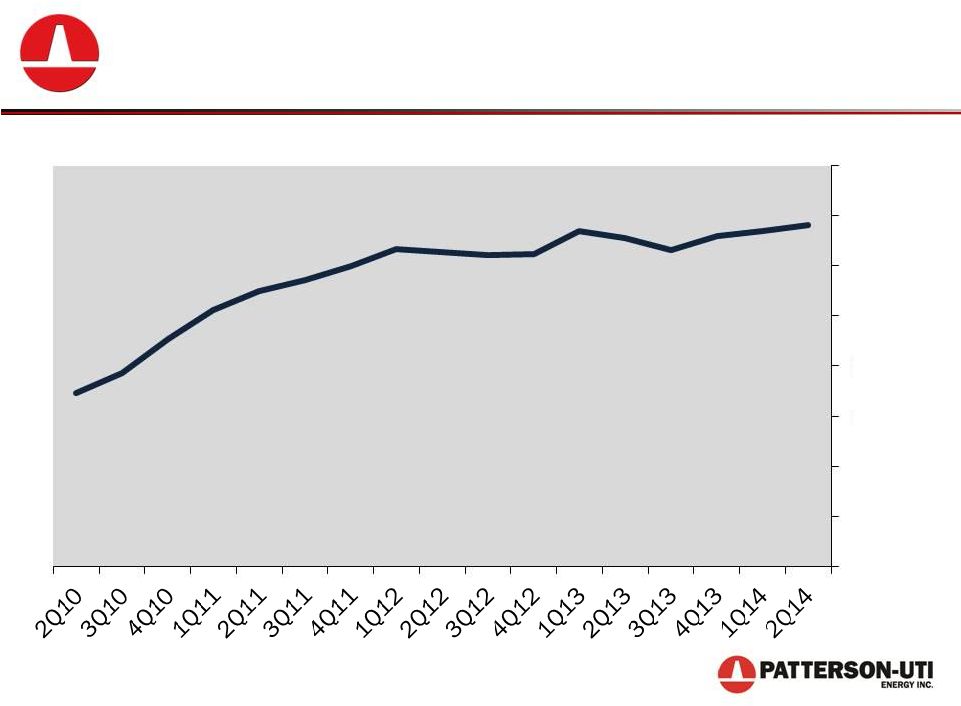 Improving Average Revenue Per Day
14
Patterson-UTI Total Average Revenue Per Day
Excludes
early-termination
revenues
during
the
third
and
fourth
quarter
of
2013
of
$3,600
per
day
and
$130
per day, respectively.
10,000
12,000
14,000
16,000
18,000
20,000
22,000
24,000
26,000 |
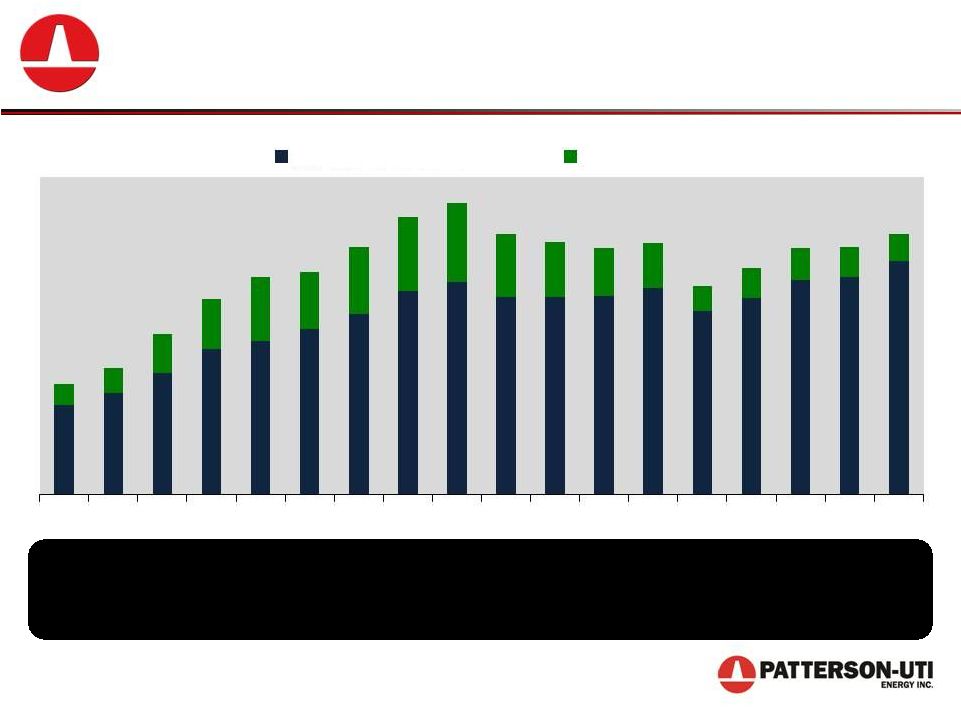 EBITDA Contribution from High Specification Rigs
15
Preferred rigs account for approximately
89% of Contract Drilling EBITDA
Excludes
early-termination
revenues
during
the
third
and
fourth
quarter
of
2013
of
$62.8
million
and
$2.4 million, respectively.
2010
2011
2012
2013
2014
APEX®
& Other Electric
Mechanical |
 Why invest in APEX
®
rigs?
…the outlook remains strong! |
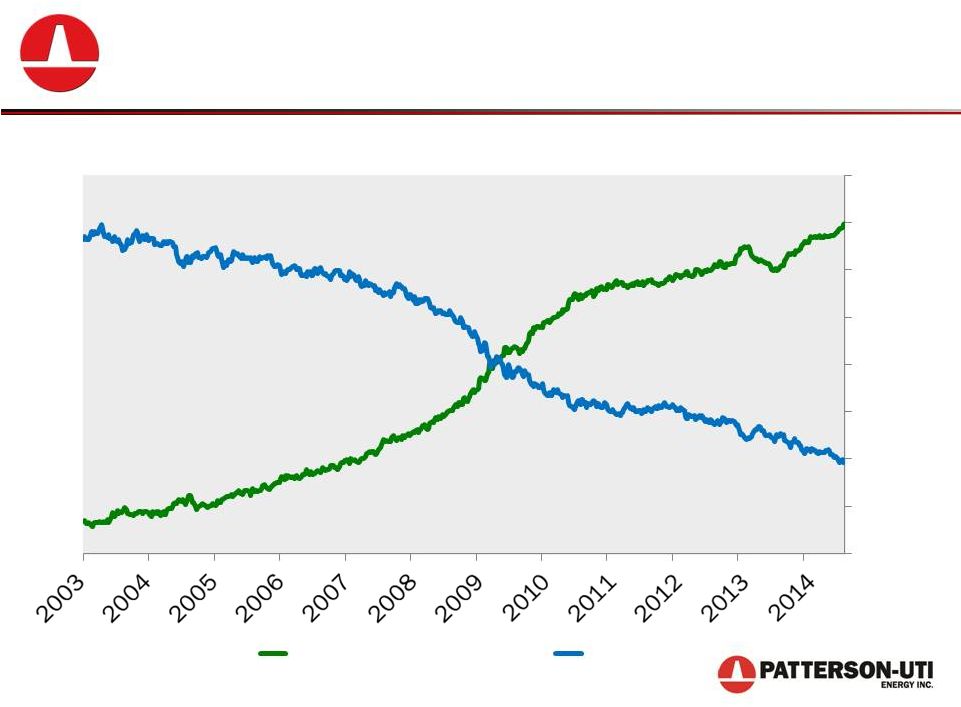 17
U.S. Rig Count % by Drilling Type
Continued Demand for APEX
®
Rigs
Source: Baker Hughes North America Rotary Rig Count
0%
10%
20%
30%
40%
50%
60%
70%
80%
% Horizontal
% Vertical |
 AC-powered rigs represent less than half
of the horizontal rig count
Total U.S. Horizontal Rig Count by Power Type
Continued Demand for APEX
®
Rigs
Analysis from Patterson-UTI Energy based on data from RigData and company
filings. 18
Mechanical
AC
SCR |
 19
High-Specification Rigs by Owner Type
Consolidated Segment of Industry
Big 3 U.S. land drillers have almost
70% of the high specification rigs in the U.S.
Based on data from multiple sources including Rig Data and corporate
filings. Others
Next 5
Largest
Public
Drillers
Big 3
U.S.
Land
Drillers |
 Why invest in APEX
®
rigs?
…Patterson-UTI is a technology leader!
|
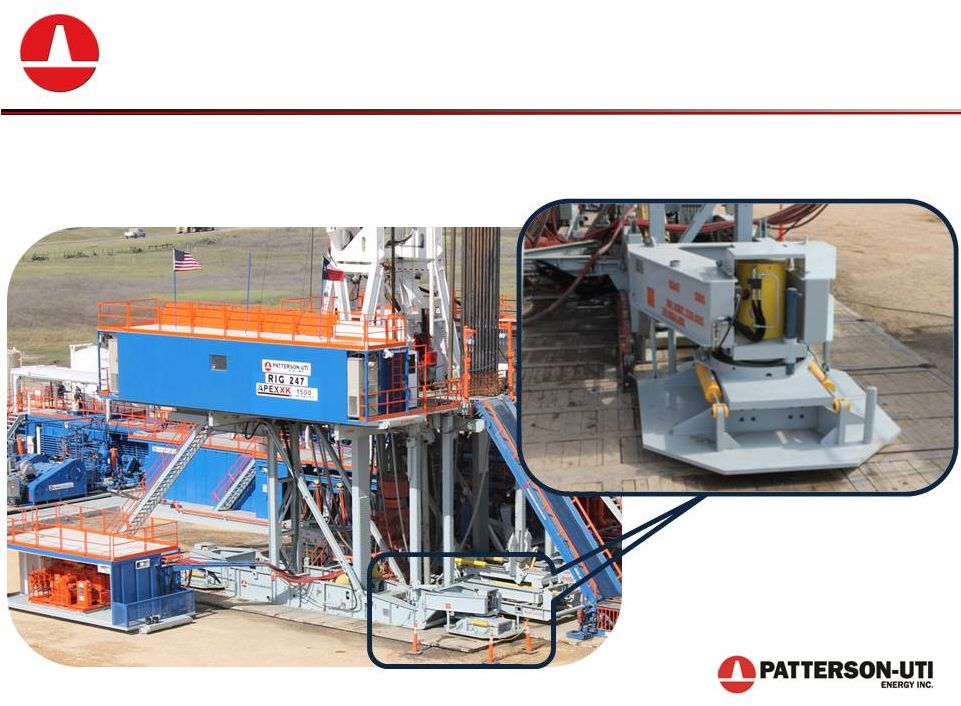
 APEX WALKING
®
Rigs
21
•
Capable of walking with drill pipe
and collars racked in derrick
•
Full multi-directional walking
capability
•
Walking times average 45 minutes
for 10’
–
15’
well spacing
http://patenergy.com/drilling/technology/apexwalk
21 |
 Strong Demand for Pad Drilling
22
•
Pad drilling is contributing to
increasing rig efficiency
•
Pad drilling capable rigs are
highly utilized
•
All new APEX
®
rigs
completed in 2014 are
expected to have walking
systems
http://patenergy.com/drilling/technology
22 |
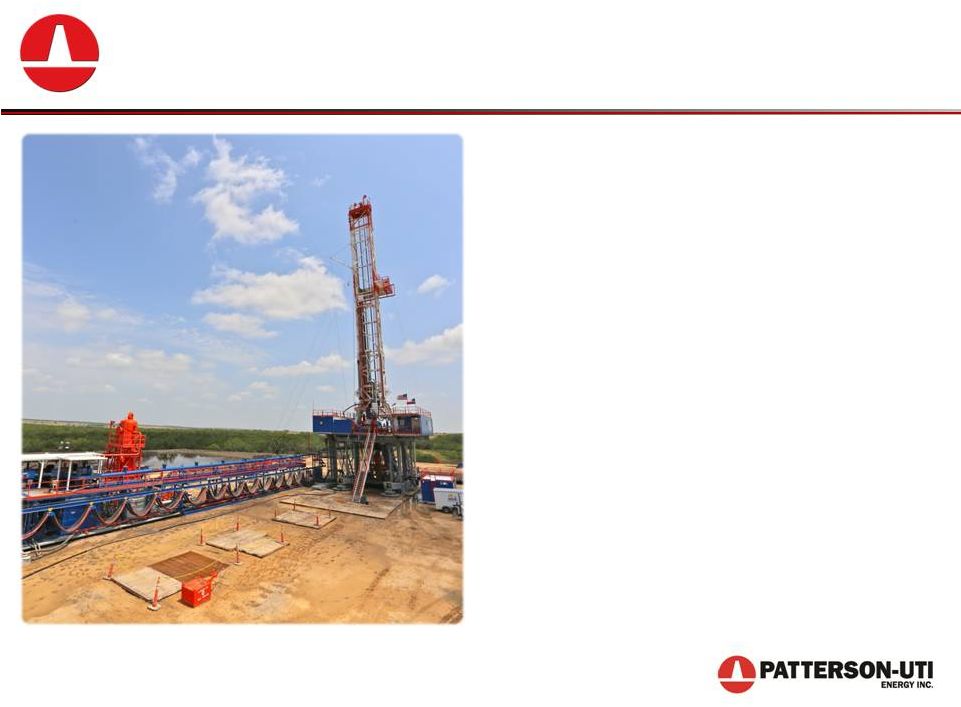
 APEX-XK™
Rig Walking on Pad
23
http://patenergy.com/drilling/technology/apexwalk/
Video of
APEX-XK™
Rig
23 |
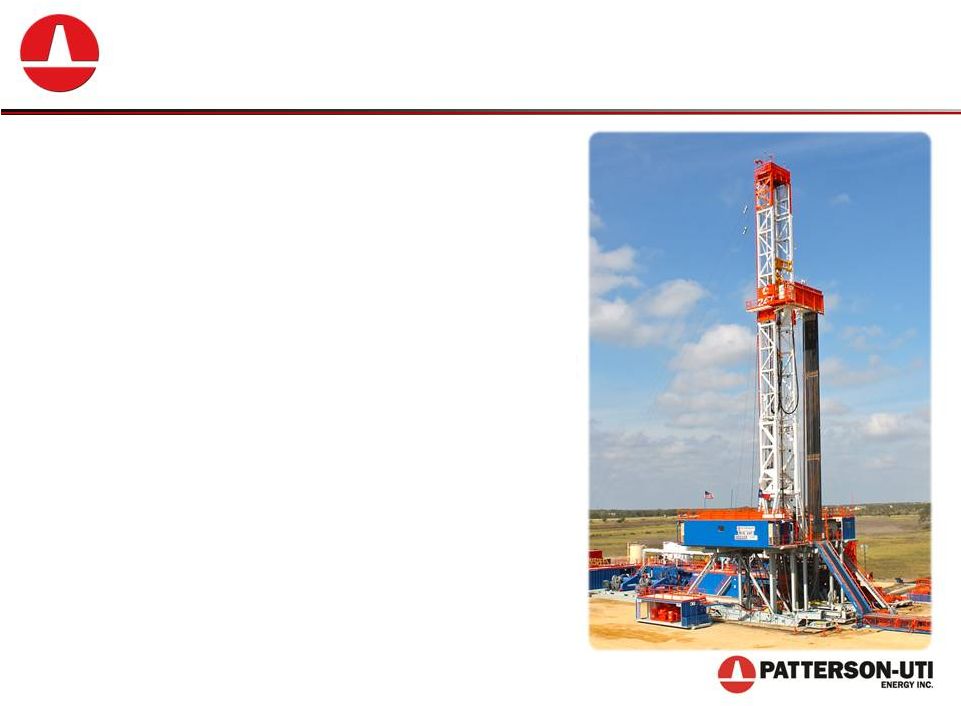 The APEX-XK
™
24
•
Enhanced mobility including more
efficient rig up and rig down
•
Greater clearance under rig floor for
optional walking system
•
Advanced environmental spill
control integrated into drilling floor
•
Minimized number of truck loads for
rig moves
•
Available in both 1500 HP and 1000
HP
http://patenergy.com/drilling/technology
24 |
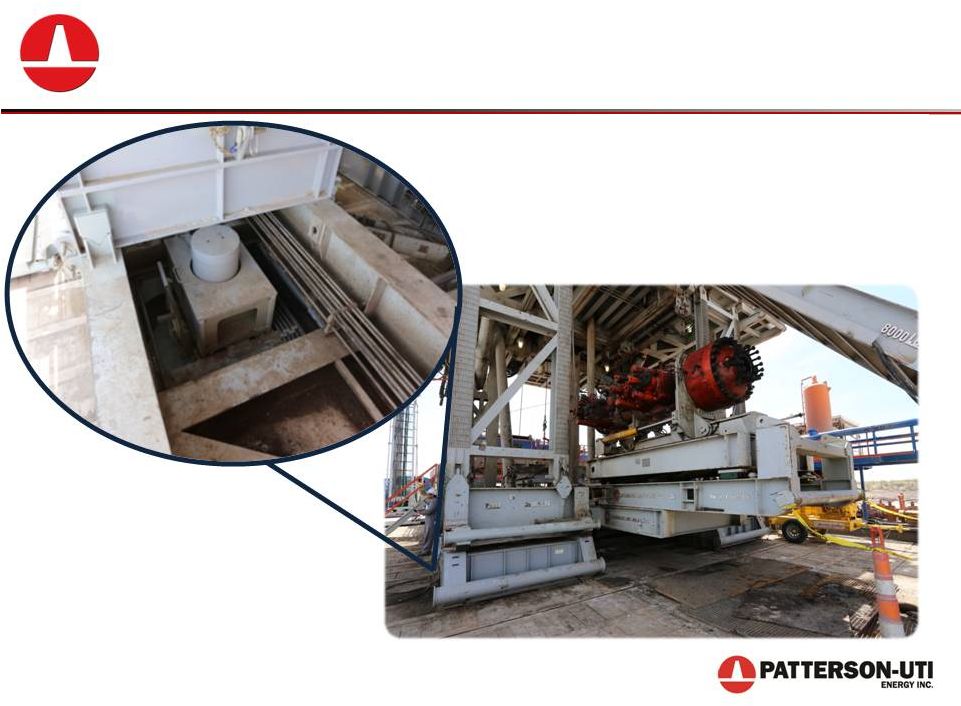
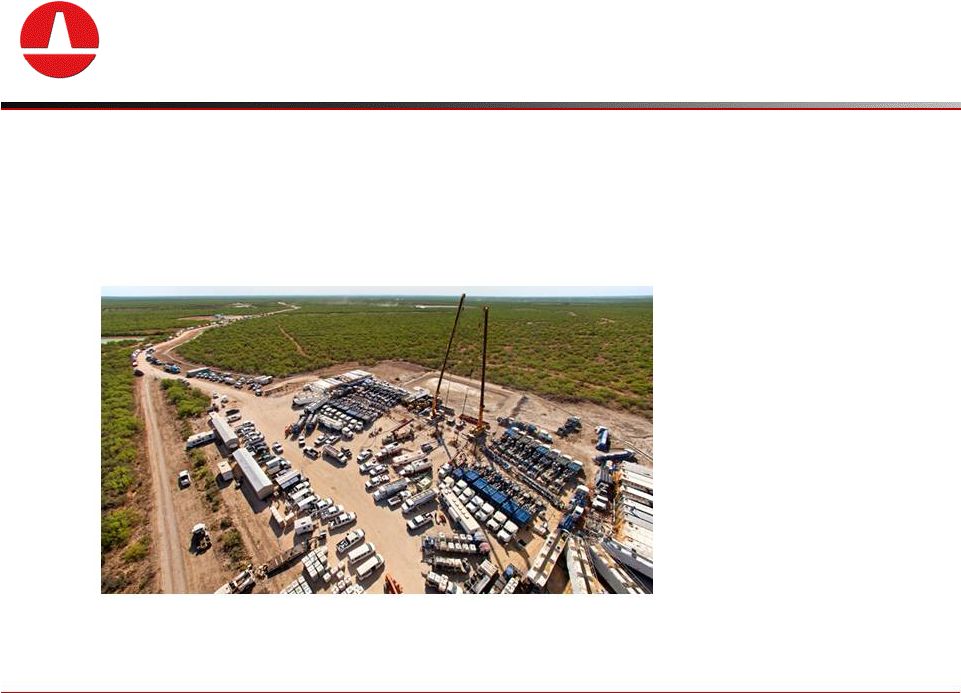
 Enhancing our Position in Pad Drilling
25
Walking Systems Can be Added to Any Rig in Our Fleet…
…Allowing for True Multi-Directional Pad Drilling Capabilities
25 |
 Enhancing our Position in Pad Drilling
26
http://patenergy.com/drilling/technology
26 |
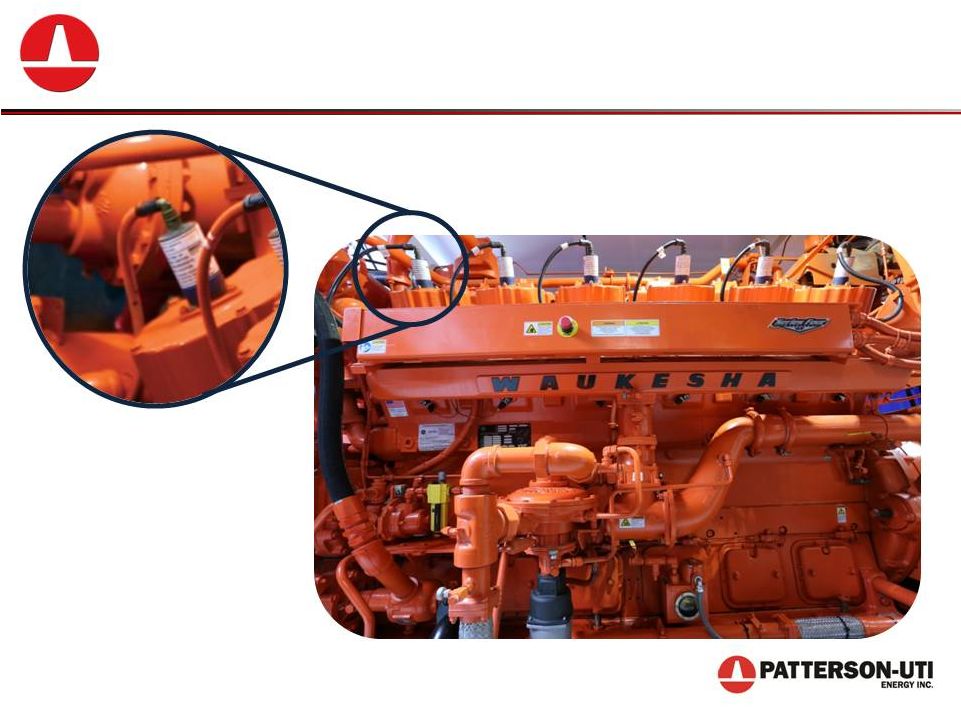 Early Adopter of Natural Gas Engines
27
http://patenergy.com/drilling/technology
27 |
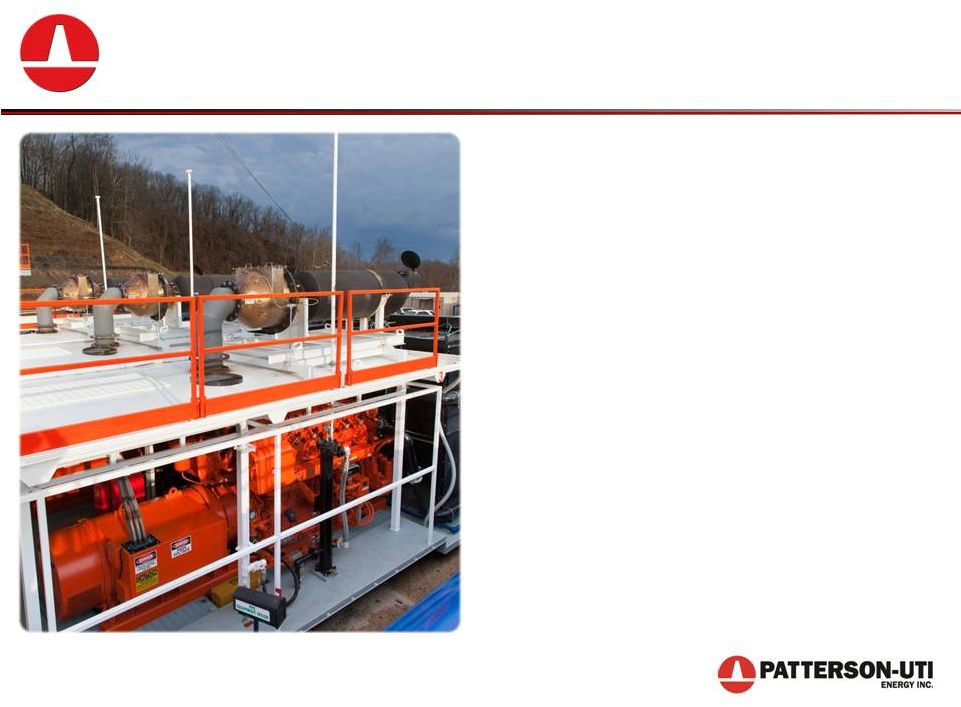 Using Natural Gas as a Fuel Source
28
•
First contract driller to use GE’s
Waukesha natural gas engines on
a modern land rig
•
43 rigs currently configured to use
natural gas as the primary fuel
source including 8 natural gas
powered rigs and 35 bi-fuel
capable rigs
•
We plan to add GE Waukesha
engines to three additional rigs
and upgrade nine additional rigs
with bi-fuel systems
•
Natural gas powered rigs can
result in up to 80% lower fuel
costs
http://patenergy.com/drilling/technology
28 |
 Pressure Pumping |
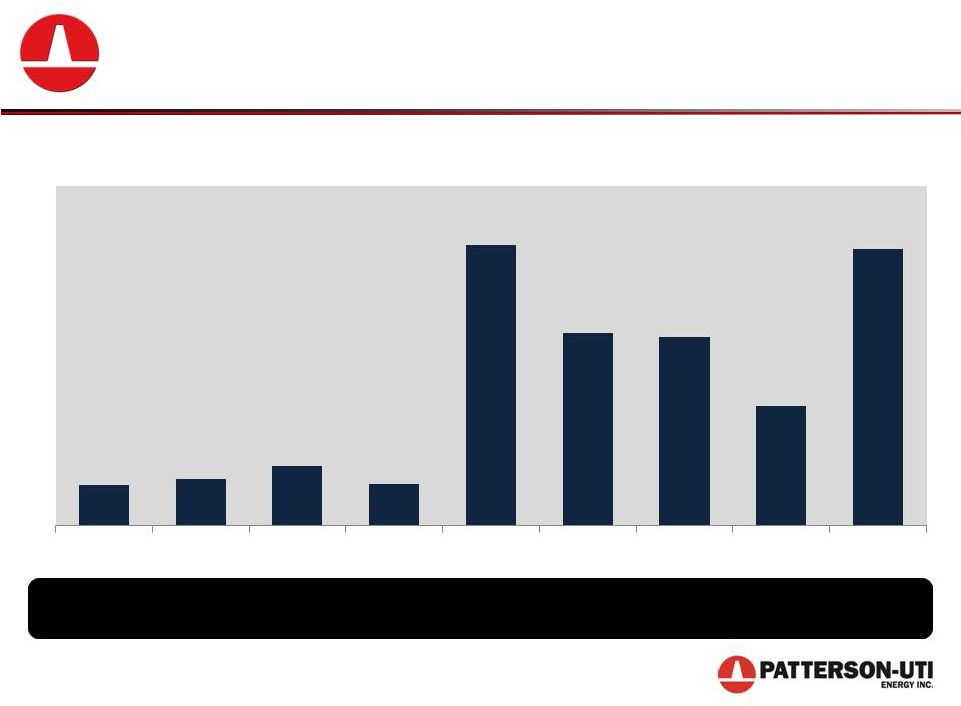 Investing in Pressure Pumping
30
Pressure Pumping Capital Expenditures and Acquisitions
($ in millions)
Approximately $1 billion invested since 2005
$41
$48
$61
$43
$289
$198
$194
$123
$285
2006
2007
2008
2009
2010
2011
2012
2013
2014E |
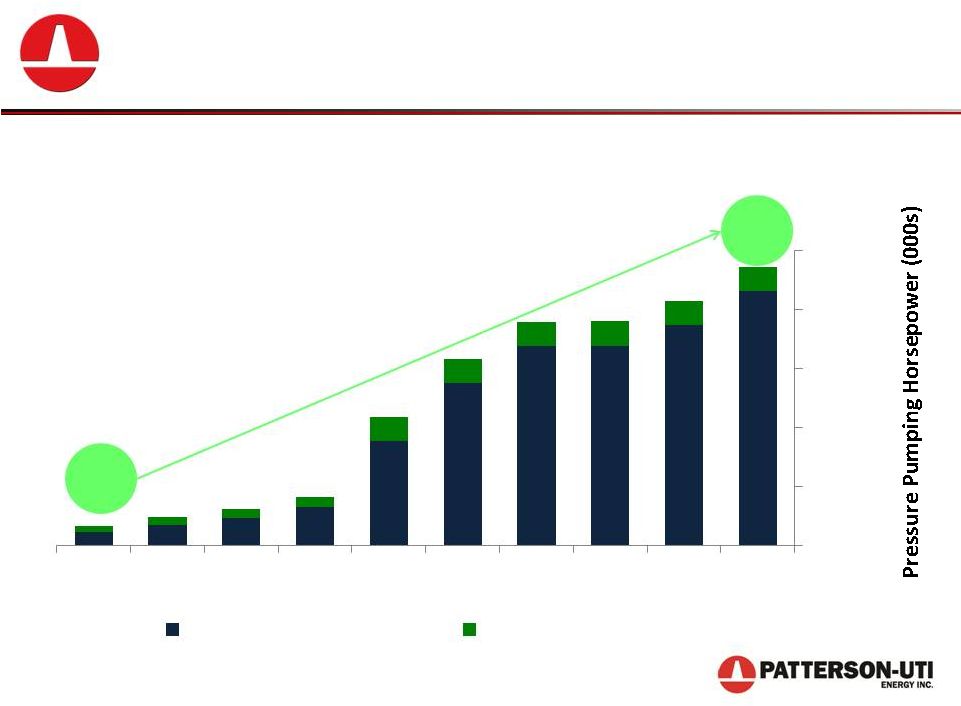 Growing Pressure Pumping Business
31
Investments in Pressure Pumping…
…Have Increased Fleet Size and Quality
65
945
* Includes
acquisition
of
approximately
210,000
pressure
pumping
horsepower
in
October
2010
0
200
400
600
800
1000
2006
2007
2008
2009
2010*
2011
2012
2013
2014E
June
2015E
Year End
Fracturing Horsepower
Other Horsepower |
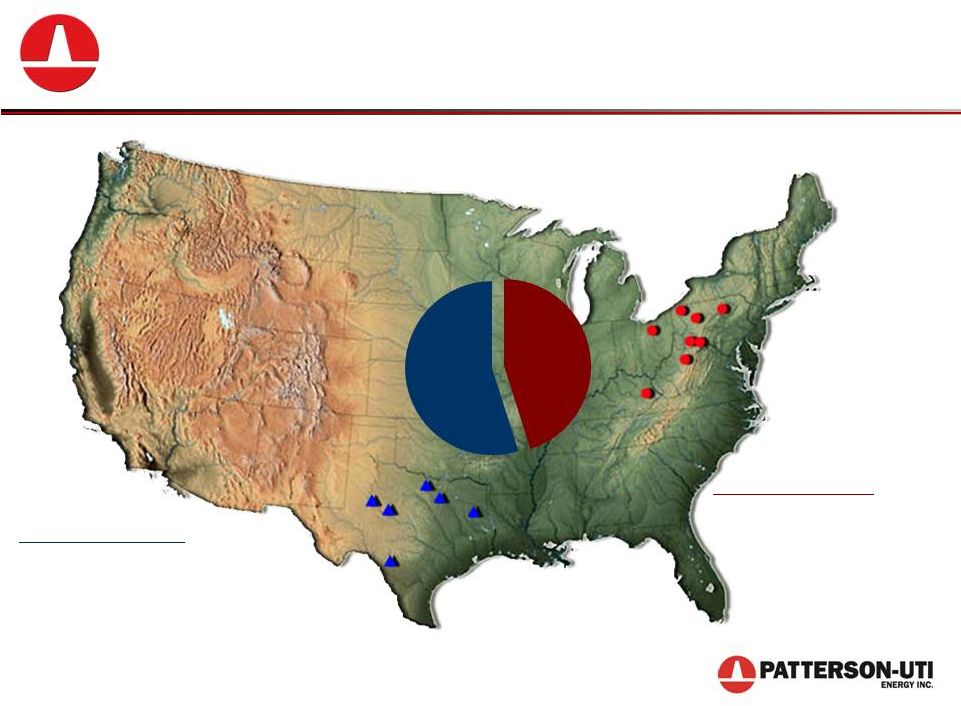 Southwest Region:
Northeast Region:
Fracturing horsepower: 389,000
Other horsepower: 28,000
Fracturing horsepower: 320,000
Other horsepower: 55,000
A Significant Player in Regional Markets
Pressure Pumping Areas
32
45%
55%
Fracturing Horsepower |
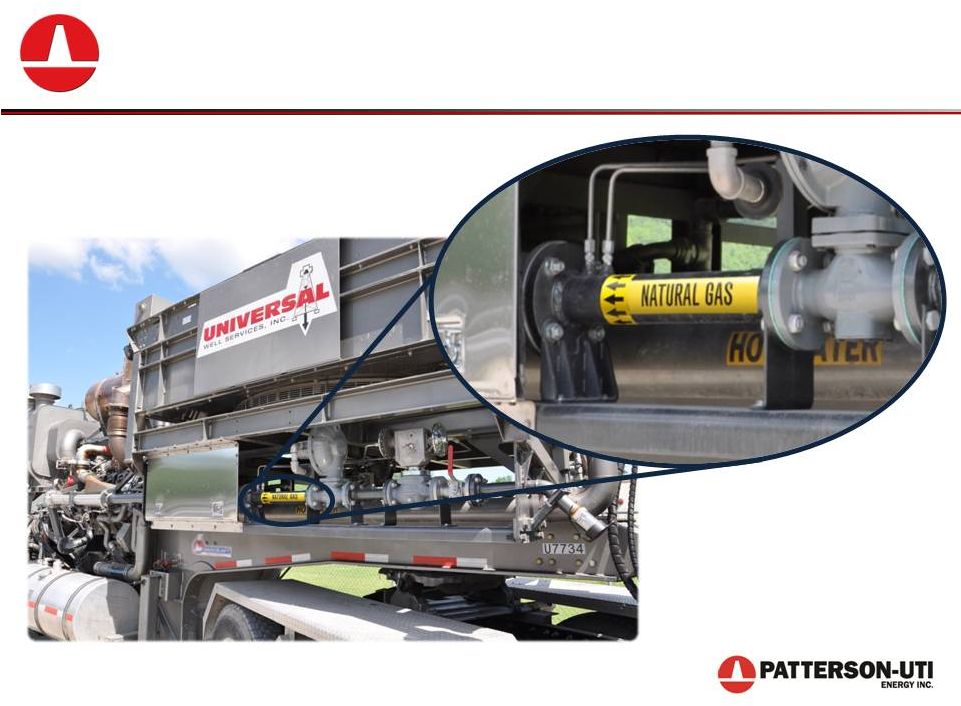
 A Leader in Bi-Fuel Technology
•
Engines can burn a fuel mix
comprised of up to 70% natural
gas
•
Comparable torque and
horsepower as an all diesel engine
•
Reduces operating costs by
lowering fuel costs
•
Good for environmental
sustainability
http://patenergy.com/pressurepumping/services
33 |
 A Leader in Bi-Fuel Technology
34
http://patenergy.com/pressurepumping/services
34 |
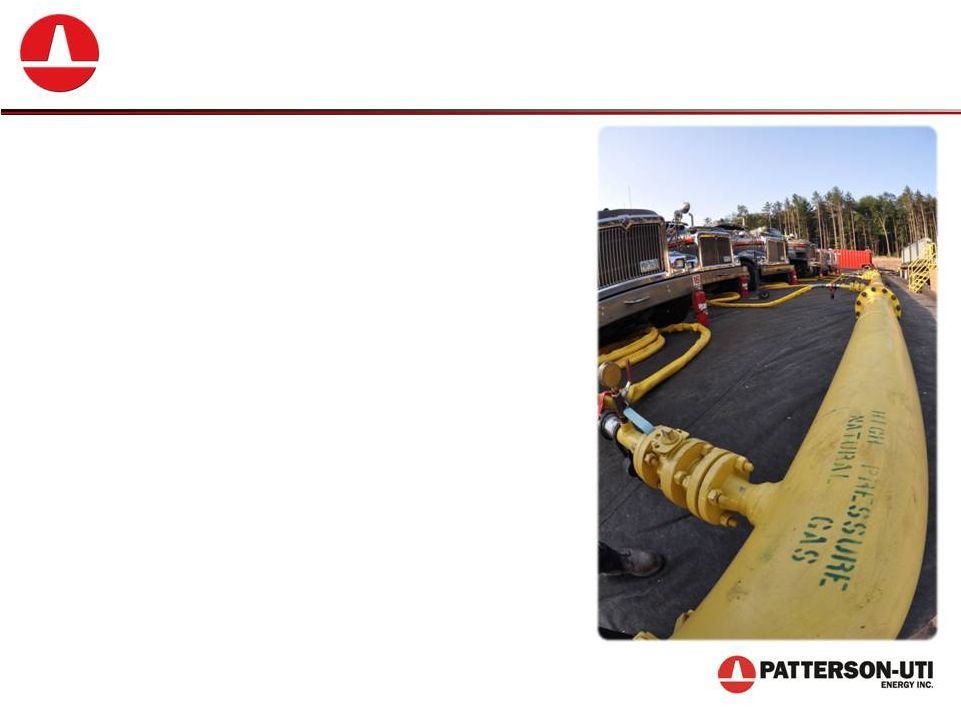
 A Leader in Bi-Fuel Technology
35
•
One of the largest bi-fuel frac
fleets in the Marcellus
•
Approximately 1,000 stages
completed using natural gas as a
fuel source
•
Replaced more than 547,000
gallons of diesel with cleaner
burning natural gas
•
Eliminated 3.8 million pounds of
transportation loads on local
roads
http://patenergy.com/pressurepumping/services
35 |
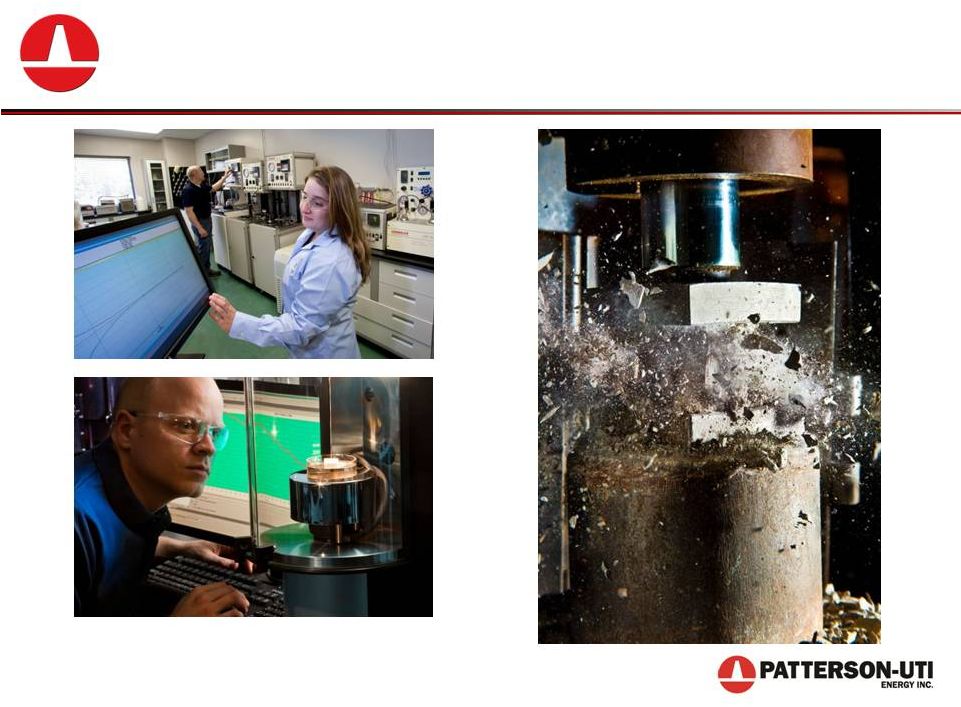 Comprehensive Lab Services
http://patenergy.com/pressurepumping/services
36 |
 Financial Flexibility |
 Investing in Our Company
38
Capital Expenditures and Acquisitions
($ in millions)
$598
$637
$445
$453
$976
$1,012
$974
$662
$1,100
2006
2007
2008
2009
2010
2011
2012
2013
2014E |
 Strong Financial Position
39
•
History of returning capital to investors
–
Cash Dividend
•
Initiated cash dividend in 2004
•
Recently announced doubling of quarterly cash dividend to
$0.10 per share
–
Stock Buyback
•
Total of $856 million repurchased since 2005
•
Repurchased $85.8 million of stock in 2013 at an average
price of $20.83
•
Approximately $187 million remaining authorization as of June
30, 2014
•
Returned approximately $1.2 billion to shareholders since
2005 |
 Strong Financial Position
40
Total Liquidity
($ in millions)
Liquidity defined as end of period cash plus availability under revolving line
of credit 208
283
398
244
387
273
571
710
581
0
100
200
300
400
500
600
700
800
2006
2007
2008
2009
2010
2011
2012
2013
2Q14
Year End
Line of Credit Availability
Cash |
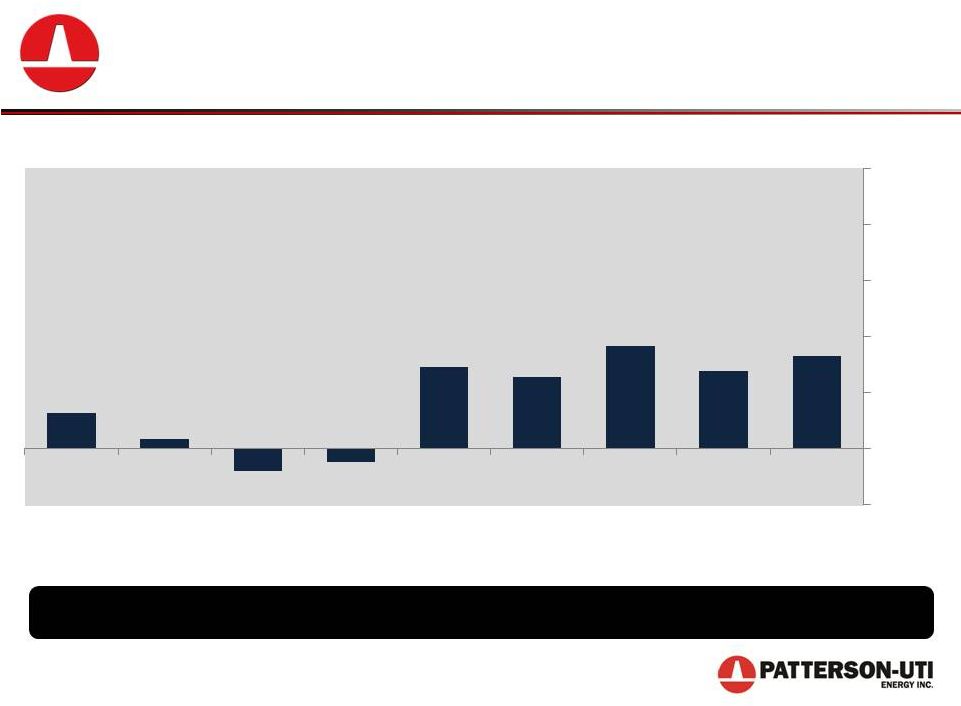 Strong Financial Position
41
Net Debt to Capital Ratio
$600 million of debt not due until at least 2020
6%
2%
-4%
-2%
15%
13%
18%
14%
17%
-10%
0%
10%
20%
30%
40%
50%
2006
2007
2008
2009
2010
2011
2012
2013
2Q14
Year End |
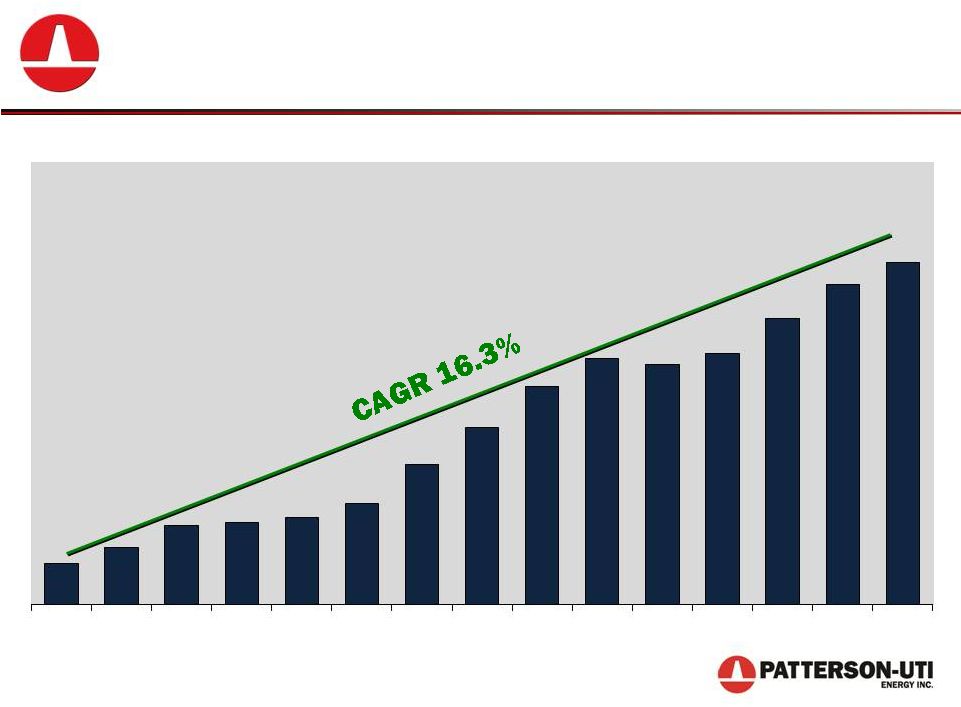 Strong Financial Returns
42
Growth in Per-Share Book Value
1999
2000
2001
2002
2003
2004
2005
2006
2007
2008
2009
2010
2011
2012
2013 |
 Why Invest in Patterson-UTI Energy?
•
Continuing Transformation
–
Committed to high-spec land rigs where
demand remains strong
–
Creating value through focus on well
site execution
•
Technology leader
–
Leader in walking rigs for pad drilling
–
Innovator in use of natural gas as a fuel
source for both drilling and pressure
pumping
•
Financially flexible
–
Strong balance sheet
–
History of share buybacks
–
Dividends
43 |
 Barclays
2014 CEO Energy-Power Conference
September 2-3, 2014 |
 Additional References |
 Active in Unconventional Plays
46
PTEN’s Active Rigs in Unconventional Areas
as of September 2014
Bakken
Piceance
Haynesville
Marcellus
Barnett
20 Rigs
Eagle Ford
2 Rigs
20 Rigs
3 Rigs
35 Rigs
6 Rigs
Utica
16 Rigs
Woodford
2 Rigs
Pinedale
4 Rigs |
 Based on term contracts in place as of July 24, 2014
–
An average of 149 rigs expected under term contract in the
third quarter of 2014
–
An average of 138 rigs expected under term contract during
the second half of 2014
Term Contract Coverage
Improving earnings visibility and returns stability
47
Drilling term contract revenue backlog of $1.5 billion at
June 30, 2014
PTEN expects to continue signing term contracts |
 Strong Financial Position
•
Total liquidity of approximately $581 million
–
$121 million of cash at June 30, 2014
–
$460 million revolver availability at June 30, 2014
•
$567 million net debt at June 30, 2014
–
16.6% Net Debt/Total Capitalization
–
$300 million of 4.97% Series A notes due October 5, 2020
–
$300 million of 4.27% Series B notes due June 14, 2022
–
$87.5 million of 5-year term loan
•
No equity sales in last 13 years
•
Reduced share count by 26.3 million shares since
2005
48 |
 PATTERSON-UTI ENERGY, INC.
Non-GAAP Financial Measures (Unaudited)
(dollars in thousands)
Non-GAAP Financial Measures
49
Three Months Ended
June 30,
Six Months Ended
June 30,
2014
2013
2014
2013
Earnings Before Interest, Taxes, Depreciation and Amortization
(EBITDA)(1):
Net income
$
54,283
$
40,768
$
89,105
$
96,998
Income tax expense
25,905
23,528
42,847
55,656
Net interest expense
7,041
6,691
14,053
13,284
Depreciation, depletion, amortization and impairment
153,426
137,182
300,748
273,617
EBITDA
$
240,655
$
208,169
$
446,753
$
439,555
Total revenue
$
757,276
$
659,316
$1,435,444
$1,326,355
EBITDA margin
31.8%
31.6%
31.1%
33.1%
EBITDA by operating segment:
Contract drilling
$
181,674
$
145,352
$
354,870
$
315,523
Pressure pumping
59,
62,043
95,118
120,794
Oil and natural gas
9,244
11,503
17,974
25,366
Corporate and other
(9,796)
(10,729)
(21,209)
(22,128)
Consolidated EBITDA
$
655
$
208,169
$
446,753
$
439,555
(1) EBITDA is not defined by generally accepted accounting principles
(“GAAP”). We present EBITDA (a non-GAAP measure)
because we believe it provides additional information with respect to both the
performance of our fundamental business activities and our ability to
meet our capital expenditures and working capital requirements. EBITDA should not be
construed as an alternative to the GAAP measures of net income or operating
cash flow. 240,
533 |
 Non-GAAP Financial Measures
50
PATTERSON-UTI ENERGY, INC.
Non-GAAP Financial Measures (Unaudited)
(dollars in thousands)
2013
2012
2011
2010
2009
2008
Earnings Before Interest, Taxes, Depreciation and Amortization
(EBITDA)(1): Net income (loss)
$
188,009
$
299,477
$
322,413
$
116,942
$
(38,290)
$
347,069
Income tax expense (benefit)
108,432
176,196
187,938
72,856
(17,595)
193,490
Net interest expense (income)
27,441
22,196
15,465
11,098
3,767
(923)
Depreciation, depletion, amortization and impairment
597,469
526,614
437,279
333,493
289,847
275,990
Net
impact of discontinued operations
-
-
(209)
1,778
1,979
15,190
EBITDA
$
921,351
$1,024,483
$
962,886
$
536,167
$
239,708
$
830,816
Total revenue
$2,716,034
$2,723,414
$2,565,943
$1,462,931
$
781,946
$2,063,880
EBITDA margin
33.9%
37.6%
37.5%
36.7%
30.7%
40.3%
(1) EBITDA is not defined by generally accepted accounting principles
(“GAAP”). We present EBITDA (a non-GAAP measure) because we believe it
provides additional information with respect to both the performance of our
fundamental business activities and our ability to meet our capital
expenditures and working capital requirements. EBITDA should not be
construed as an alternative to the GAAP measures of net income or
operating cash flow. |