Attached files
| file | filename |
|---|---|
| EX-5.1 - EX-5.1 - GrubHub Inc. | d773831dex51.htm |
| EX-23.1 - EX-23.1 - GrubHub Inc. | d773831dex231.htm |
| EX-23.2 - EX-23.2 - GrubHub Inc. | d773831dex232.htm |
Table of Contents
As filed with the Securities and Exchange Commission on September 2, 2014.
No. 333-198324
UNITED STATES
SECURITIES AND EXCHANGE COMMISSION
Washington, D.C. 20549
Amendment No. 1
FORM S-1
REGISTRATION STATEMENT
UNDER
THE SECURITIES ACT OF 1933
GRUBHUB INC.
(Exact name of registrant as specified in its charter)
| Delaware | 7389 | 46-2908664 | ||
| (State or other jurisdiction of incorporation or organization) |
(Primary Standard Industrial Classification Code Number) |
(I.R.S. Employer Identification No.) |
111 W. Washington Street, Suite 2100
Chicago, Illinois 60602
(877) 585-7878
(Address, including zip code, and telephone number, including area code, of registrant’s principal executive offices)
Margo Drucker, Esq.
SVP, General Counsel and Secretary
GrubHub Inc.
111 W. Washington Street, Suite 2100
Chicago, Illinois 60602
(877) 585-7878
(Name, address, including zip code, and telephone number, including area code, of agent for service)
Copies of all communications, including communications sent to agent for service, should be sent to:
| Joshua N. Korff, Esq. Ross M. Leff, Esq. Kirkland & Ellis LLP 601 Lexington Avenue New York, NY 10022 (212) 446-4800 |
David J. Goldschmidt, Esq. Skadden, Arps, Slate, Meagher & Flom LLP Four Times Square New York, NY 10036 (212) 735-3574 |
Approximate date of commencement of proposed sale to the public: As soon as practicable after this Registration Statement becomes effective.
If any of the securities being registered on this Form are to be offered on a delayed or continuous basis pursuant to Rule 415 under the Securities Act of 1933, check the following box: ¨
If this Form is filed to register additional securities for an offering pursuant to Rule 462(b) under the Securities Act, please check the following box and list the Securities Act registration statement number of the earlier effective registration statement for the same offering. ¨
If this Form is a post-effective amendment filed pursuant to Rule 462(c) under the Securities Act, check the following box and list the Securities Act registration statement number of the earlier effective registration statement for the same offering. ¨
If this Form is a post-effective amendment filed pursuant to Rule 462(d) under the Securities Act, check the following box and list the Securities Act registration statement number of the earlier effective registration statement for the same offering. ¨
Indicate by check mark whether the registrant is a large accelerated filer, an accelerated filer, a non-accelerated filer, or a smaller reporting company. See the definitions of “large accelerated filer,” “accelerated filer” and “smaller reporting company” in Rule 12b-2 of the Exchange Act. (Check one): ¨
| Large accelerated filer | ¨ | Accelerated filer | ¨ | |||||
| Non-accelerated filer | x | (Do not check if a smaller reporting company) | Smaller reporting company | ¨ |
CALCULATION OF REGISTRATION FEE
|
| ||||||
| Title of Each Class of Securities to be Registered |
Amount to be Registered(2) |
Proposed Maximum Aggregate Offering Price(1)(2) |
Amount of Registration Fee(3) | |||
| Common Stock, $0.0001 par value per share |
11,538,427 | $500,883,117 | $64,514 | |||
|
| ||||||
| (1) | Estimated solely for the purpose of calculating the registration fee based on the average of the high and low prices for the registrant’s common stock on the New York Stock Exchange on August 21, 2014 pursuant to Rule 457(c) under the Securities Act of 1933, as amended. |
| (2) | Includes the offering price of any additional shares of common stock that the underwriters have the option to purchase. |
| (3) | This amount was previously paid. |
The registrant hereby amends this Registration Statement on such date or dates as may be necessary to delay its effective date until the registrant shall file a further amendment which specifically states that this Registration Statement shall thereafter become effective in accordance with Section 8(a) of the Securities Act of 1933 or until this Registration Statement shall become effective on such date as the Securities and Exchange Commission, acting pursuant to said Section 8(a), may determine.
Table of Contents
The information in this prospectus is not complete and may be changed. We and the selling stockholders may not sell these securities until the registration statement filed with the Securities and Exchange Commission is effective. This prospectus is not an offer to sell these securities and we and the selling stockholders are not soliciting an offer to buy these securities in any jurisdiction where the offer or sale is not permitted.
SUBJECT TO COMPLETION
PRELIMINARY PROSPECTUS DATED SEPTEMBER 2, 2014
10,033,415 Shares

Common Stock
We are offering 1,250,000 shares of common stock to be sold in this offering. The selling stockholders identified in this prospectus, which include certain members of our board of directors and management, are offering 8,783,415 shares of our common stock. We will not receive any of the proceeds from the sale of shares being sold by the selling stockholders. See “Principal and Selling Stockholders.”
The selling stockholders have granted the underwriters an option to purchase up to 1,505,012 additional shares of our common stock.
Our common stock is listed on the New York Stock Exchange (“NYSE”) under the symbol “GRUB.” On August 29, 2014, the closing price of our common stock as reported on the NYSE was $38.44.
We are an “emerging growth company” as defined under the federal securities laws and, as such, may elect to comply with certain reduced public company reporting requirements for future filings.
Investing in our common stock involves risks. See the section titled “Risk Factors” beginning on page 12.
Neither the Securities and Exchange Commission nor any state securities commission has approved or disapproved of these securities or passed upon the accuracy or adequacy of this prospectus. Any representation to the contrary is a criminal offense.
| Per Share |
Total | |||||||
| Public Offering Price |
$ | $ | ||||||
| Underwriting Discount |
$ | $ | ||||||
| Proceeds to GrubHub Inc. (before expenses) |
$ | $ | ||||||
| Proceeds to Selling Stockholders (before expenses) |
$ | $ | ||||||
The underwriters expect to deliver the shares to purchasers on or about , 2014 through the book-entry facilities of The Depository Trust Company.
| Citigroup | Morgan Stanley |
BofA Merrill Lynch |
| Allen & Company LLC | ||||||||||
| BMO Capital Markets | Canaccord Genuity |
JMP Securities | Raymond James | William Blair | ||||
The date of this prospectus is , 2014.
Table of Contents

Table of Contents
We are responsible for the information contained in this prospectus and in any free-writing prospectus we prepare or authorize. We, the selling stockholders and the underwriters have not authorized anyone to provide you with different information, and we, the selling stockholders and the underwriters take no responsibility for any other information others may give you. We are not, and the underwriters are not, making an offer to sell these securities in any jurisdiction where the offer or sale is not permitted. You should not assume that the information contained in this prospectus is accurate as of any date other than its date.
| Page | ||||
| 1 | ||||
| 12 | ||||
| 31 | ||||
| 33 | ||||
| 35 | ||||
| 36 | ||||
| 37 | ||||
| 38 | ||||
| 39 | ||||
| 40 | ||||
| 44 | ||||
| MANAGEMENT’S DISCUSSION AND ANALYSIS OF FINANCIAL CONDITION AND RESULTS OF OPERATIONS |
48 | |||
| 73 | ||||
| 83 | ||||
| 91 | ||||
| 100 | ||||
| 102 | ||||
| 107 | ||||
| 111 | ||||
| 113 | ||||
| 117 | ||||
| 123 | ||||
| 123 | ||||
| 123 | ||||
| F-1 | ||||
i
Table of Contents
This summary highlights selected information that is presented in greater detail elsewhere in this prospectus. This summary does not contain all of the information you should consider before investing in our common stock. You should read this entire prospectus carefully, including the sections titled “Risk Factors” and “Management’s Discussion and Analysis of Financial Condition and Results of Operations” and our financial statements and the related notes included elsewhere in this prospectus, before making an investment decision. Unless otherwise stated or the context requires otherwise, (i) when we refer to the “Seamless Platform,” we refer to the operations for Seamless North America, LLC as of and for the year ended December 31, 2011 and from January 1, 2012 through October 28, 2012, the date when Aramark Corporation (“Aramark”) completed the spin-off of its interest in the Seamless business, and to the operations for Seamless Holdings Corporation, an entity formed for the purpose of completing the spin-off and whose assets primarily consist of Aramark’s former interest in the Seamless business and its subsidiaries (“Seamless Holdings”), beginning on October 29, 2012, (ii) when we refer to the “GrubHub Platform,” we refer to the operations of GrubHub Holdings Inc., formerly known as GrubHub, Inc. (“GrubHub Holdings”), and its subsidiaries and (iii) all share and per share data in this prospectus reflects a 1-for-2 reverse stock split of our capital stock issued and outstanding (including adjustments for fractional shares), which was effected on April 2, 2014. On August 8, 2013 (the “Merger Date”), we completed a merger of the GrubHub Platform and the Seamless Platform (the “Merger”). Through the Merger, we formed GrubHub Inc., formerly known as GrubHub Seamless Inc., which includes both the GrubHub Platform and the Seamless Platform. In this prospectus, unless the context otherwise requires, the terms “GrubHub,” the “Company,” “our platform,” “we,” “us,” and “our” refer, (i) prior to the Merger Date, to the Seamless Platform and (ii) after the Merger Date, to GrubHub Inc. and its subsidiaries.
References to operating metrics as “combined” reflect the combined results for the GrubHub Platform and the Seamless Platform beginning on the first day of the period for which the operating metric is presented. See “Basis of Presentation.”
Our Mission
Our mission is to make takeout better.
Our Company
GrubHub is the leading online and mobile platform for restaurant pick-up and delivery orders, which we refer to as takeout. We processed more than 177,800 Daily Average Grubs (as defined herein) on our platform during the six months ended June 30, 2014 and had approximately $855.6 million of Gross Food Sales (as defined herein) during the six months ended June 30, 2014. We connect local restaurants with hungry diners in more than 700 cities across the United States and are focused on transforming the takeout experience. For restaurants, GrubHub generates higher margin takeout orders at full menu prices. Our platform empowers diners with a “direct line” into the kitchen, avoiding the inefficiencies, inaccuracies and frustrations associated with paper menus and phone orders. We have a powerful two-sided network that creates additional value for both restaurants and diners as it grows.
Our target market is primarily independent restaurants. These independent restaurants, which account for 61% of all U.S. restaurants (according to a 2013 industry report prepared by Euromonitor International (“Euromonitor”)), remain local, highly fragmented and are mostly owner-operated family businesses. According to Euromonitor, Americans spent $204 billion at these approximately 350,000 independent restaurants in 2012. Of that amount, we believe that Americans spent approximately $67 billion on takeout at these independent restaurants in 2012.
1
Table of Contents
For restaurants, takeout enables them to grow their business without adding seating capacity or wait staff. Advertising for takeout, typically done through the distribution of menus to local households or advertisements in local publications, is often inefficient and requires upfront payment with no certainty of success. In contrast, we provide the restaurants on our platform with an efficient way to generate more takeout orders. We enable restaurants to access local diners at the moment when those diners are hungry and ready to purchase takeout. In addition, we do not charge the restaurants in our network any upfront or subscription fees, we do not require any discounts from their full price menus and we only get paid for the orders we generate for them, providing restaurants with a low-risk, high-return solution. We charge restaurants a per-order commission that is primarily percentage-based.
As our two-sided network of restaurants and diners has grown, many of our restaurants have chosen to pay higher rates to receive better exposure to more diners on our platform, and this has resulted in higher overall commission rates for us.
For diners, the traditional takeout ordering process is often a frustrating experience—from using paper menus to communicating an order by phone to a busy restaurant employee. In contrast, ordering on GrubHub is enjoyable and a dramatic improvement over the “menu drawer.” We provide diners on our platform with an easy-to-use, intuitive and personalized platform that helps them search for and discover local restaurants and then accurately and efficiently place an order from any Internet-connected device. We also provide diners with information and transparency about their orders and status and solve problems that may arise. In addition, we make re-ordering convenient by storing previous orders, preferences and payment information, helping us promote diner frequency and drive strong repeat business.
The proliferation of mobile devices over the past few years has significantly increased the value of our platform. With powerful, easy-to-use mobile applications for iPhone, iPad and Android, we enable diners to access GrubHub whenever and wherever they want takeout. All of the discovery and ordering capabilities that are available on our consumer websites are also available through our mobile applications. We monetize the orders placed through our mobile applications using the same rate as orders placed through our websites. Our mobile applications make ordering from GrubHub more accessible and personal, driving increased use of our platform by restaurants and diners. Orders placed on mobile devices increased from approximately 20% of our consumer orders during the quarter ended December 31, 2011 to approximately 48% of our consumer orders during the quarter ended June 30, 2014.
The GrubHub Platform was founded in 2004 and the Seamless Platform was founded in 1999. We completed the Merger of the two companies in August 2013. The Merger has enabled us to expand our two-sided network, connecting customers in the geographies we serve with more restaurants. Through the combination of the GrubHub Platform and the Seamless Platform, we are able to eliminate duplicative marketing expenses and restaurant sales and take advantage of a complementary geographic footprint.
Our business has grown rapidly. During the six months ended June 30, 2014, we generated revenue of $118.6 million, representing a 125% increase from the same period in 2013. Our revenue growth has been driven primarily by the inclusion of results from the GrubHub Platform and the increasing adoption of our platform by restaurants and diners, with 4.2 million Active Diners (as defined herein) as of June 30, 2014. During the six months ended June 30, 2013, there were approximately 1.8 million Active Diners and 46,400 Daily Average Grubs on the GrubHub Platform that would have been included had the Merger been completed as of January 1, 2013. For the six months ended June 30, 2014, our net income was $7.0 million and our Adjusted EBITDA was $33.3 million. See “Selected Historical Consolidated Financial and Other Data” for a discussion and reconciliation of Adjusted EBITDA to net income.
2
Table of Contents
The Takeout Market Opportunity
Food is an essential, social and enjoyable aspect of everyday life. However, there is often little time to cook at home or dine out. In addition, diners are increasingly looking for a broader and more diversified choice of cuisines and menu items. Takeout offers a convenient alternative, providing diners with a wide variety of options, wherever they want and whenever they want.
Large and Fragmented Market
Our primary target market is comprised of approximately 350,000 independent restaurants that account for 61% of all U.S. restaurants, according to Euromonitor. According to Euromonitor, Americans spent $204 billion at these independent restaurants in 2012. Of that amount, we believe that Americans spent approximately $67 billion on takeout at these independent restaurants.
Challenges for Independent Restaurants
Independent restaurant owners recognize that increasing takeout orders enables them to grow their business because they can service the additional orders by leveraging existing resources, including excess capacity and perishable inventory, without adding seating capacity or wait staff. Advertising for takeout is often done through the distribution of menus to local households or through local publications such as the yellow pages. These traditional methods of advertising are typically inefficient, require upfront payment with no certainty of success and are rapidly becoming obsolete as diners shift to online and mobile solutions for local search and discovery. Providing a quality experience for takeout diners is also a key challenge for restaurants. Because independent restaurants focus on serving on-premise diners, they typically have a limited ability to attend to the needs of takeout diners. The traditional takeout ordering process is highly manual and prone to errors and delays. Effectively and efficiently managing order delivery is also a challenge for independent restaurants given the nature of the process as well as their limited resources to handle follow-up calls.
Independent restaurants seek a simple and effective solution to expand their takeout business without significant investments or expertise in marketing and technology.
Challenges for Diners
For diners, ordering takeout is usually a chore and is often a frustrating experience. Typically, ordering takeout starts with the challenge of choosing where to order from and what to order—usually relying on a tired, outdated and limited choice of menus found in the “menu drawer.” Once a diner chooses and calls a restaurant, the ordering process can lead to angst, as the diner is faced with long hold times, distracted order-takers in an already error-prone process, difficulty communicating special requests, incomplete pricing information and the inevitable wait for delivery with limited transparency. Upon delivery, diners only have a few seconds to confirm that what they received is indeed what they ordered, with limited recourse in the event it is not.
Diners seek a simple, convenient and transparent takeout ordering solution with a wide variety of restaurant choices that provides them with a “direct line” into the kitchen.
The GrubHub Solution
At GrubHub, we focus on providing value to both restaurants and diners through our two-sided network. We provide restaurants with more orders, help them serve diners better and enable them to improve the efficiency of their takeout business. For diners, we make takeout accessible, simple and enjoyable, enabling them to discover new restaurants and accurately and easily place their orders anytime and from anywhere.
3
Table of Contents
Why Restaurants Love GrubHub
With more than 30,000 restaurants in our network as of June 30, 2014, we believe that we provide restaurants with the following key benefits:
| • | More Orders. Through GrubHub, restaurants in our network receive more orders at full menu prices. |
| • | Targeted Reach. Restaurants in our network gain an online and mobile presence with the ability to reach their most valuable target audience—hungry diners in their area. |
| • | Low Risk, High Return. GrubHub generates higher margin takeout orders for the restaurants in our network by enabling them to leverage their existing fixed costs. |
| • | Service and Efficiency. Restaurants in our network can receive and handle a larger volume of takeout orders more accurately, increasing their operational efficiency while providing their takeout diners with a high-quality experience. |
| • | Insights. We provide restaurants with actionable insights based on the significant amount of order data we gather, helping them to optimize their delivery footprints, menus, pricing and online profiles. |
Why Diners Love GrubHub
With 4.2 million Active Diners as of June 30, 2014 and more than 177,800 combined Daily Average Grubs during the six months ended June 30, 2014, we believe that we provide diners with the following key benefits:
| • | Discovery. GrubHub aggregates menus and enables ordering from restaurants across more than 700 cities in the United States, in most cases providing diners with more choices than the “menu drawer” and allowing them to discover hidden gems from local restaurants in our network. |
| • | Convenience. Using GrubHub, diners do not need to place their orders over the phone. We provide diners with an easy-to-use, intuitive and personalized platform that makes ordering simple from any connected device. |
| • | Control and Transparency. Our platform empowers diners with a “direct line” into the kitchen, without having to talk to a distracted order-taker in an already error-prone process. |
| • | Service. For diners, GrubHub’s role is similar to that of the waiter in a restaurant, providing a critical layer of customer service that is typically missing in takeout. |
Our Competitive Advantages
Our focus on making takeout better for both restaurants and diners has helped us to develop the following competitive advantages:
| • | Market Leader with Significant Scale. We are the largest takeout platform, with approximately $855.6 million in combined Gross Food Sales on our platform during the six months ended June 30, 2014; approximately 30,000 restaurants across over 700 cities in the United States; and 4.2 million Active Diners, yielding more than 177,800 combined Daily Average Grubs across our platform during the six months ended June 30, 2014. |
| • | Powerful Two-Sided Network Effect. As we continue to increase the number of restaurants in our network, we become a more compelling platform for diners. As we continue to increase the number of diners on our platform, we generate more orders for and become more compelling to restaurants. |
| • | Growing and Recurring Diner Base. We believe that our easy-to-use ordering system, restaurant choices and enjoyable user experience all inspire new diners to try GrubHub and encourage existing diners to make GrubHub a way of life, driving repeat and growing use of our platform. |
4
Table of Contents
| • | Product Innovation. We have a history of introducing new products that make our platform better, such as the introduction of our mobile applications and our restaurant-facing products, OrderHub and Boost. |
| • | Mobile Engagement and Monetization. We benefit from the growing adoption and increased use of our mobile applications, as they significantly increase the number of orders diners place through GrubHub. Orders placed on mobile devices increased from approximately 20% of our consumer orders during the quarter ended December 31, 2011 to approximately 48% of our consumer orders during the quarter ended June 30, 2014. We monetize the orders placed through our mobile applications using the same rate as orders placed through our websites. |
| • | Attractive Business Model. Our scalable platform enables us to process additional orders at low incremental cost. As our two-sided network of restaurants and diners has grown, many of our restaurants have chosen to pay higher rates to receive better exposure to more diners on our platform, and this has resulted in higher overall commission rates for us. |
Our Growth Strategy
We strive to make GrubHub an integral part of everyday life for our restaurants and diners through the following growth strategies:
| • | Grow our Two-Sided Network. We intend to grow the number of restaurants in our existing geographic markets by providing them with opportunities to generate more takeout orders. We intend to grow the number of diners and orders placed on our network primarily through word-of-mouth referrals, marketing that encourages adoption of our mobile applications and increased order frequency. |
| • | Enhance our Platform. We plan to continue to invest in our websites and mobile products, develop new products and better leverage the significant amount of order data that we collect. |
| • | Deliver Excellent Customer Service. By meeting and exceeding the expectations of both restaurants and diners through our customer service, we seek to gain their loyalty and support for our platform. |
| • | Pursue Strategic Acquisitions. We intend to continue to pursue expansion opportunities in existing and new markets, as well as in core and adjacent categories through strategic acquisitions. |
Risk Factors
Investing in our common stock involves a high degree of risk. You should carefully consider the risks and uncertainties described below, together with all of the other information in this prospectus, before making a decision to invest in our common stock. Some of these risks are:
| • | we have a limited operating history in an evolving industry, which makes it difficult to evaluate our future prospects and may increase the risk that we will not be successful; |
| • | if we fail to manage the integration of the Merger effectively, our results of operations and business could be harmed; |
| • | if we fail to retain our existing restaurants and diners or to acquire new restaurants and diners in a cost-effective manner, our revenue may decrease and our business may be harmed; |
| • | growth of our business will depend on a strong brand and any failure to maintain, protect and enhance our brand would hurt our ability to retain or expand our base of restaurants and diners and our ability to increase their level of engagement; |
| • | we rely on restaurants in our network for many aspects of our business, and any failure by them to maintain their service levels could harm our business; and |
| • | we experience significant seasonal fluctuations in our financial results, which could cause our stock price to fluctuate. |
5
Table of Contents
Our Corporate Information
The GrubHub Platform was founded in 2004 and the Seamless Platform was founded in 1999. We completed the Merger of the two platforms on the Merger Date.
Our principal executive offices are located at 111 W. Washington Street, Suite 2100, Chicago, Illinois 60602, and our telephone number is (877) 585-7878. Our website addresses are www.grubhub.com and www.seamless.com. Information contained on or that can be accessed through our website does not constitute part of this prospectus and inclusions of our website address in this prospectus are inactive textual references only.
As of June 30, 2014, we had more than 40 trademarks registered in the United States, including “GrubHub,” “happy eating,” “Seamless,” “OrderHub” and “Your food is here.” This prospectus may also contain trademarks, service marks, trade names and copyrights of other companies, which are the property of their respective owners. Solely for convenience, the trademarks, service marks, trade names and copyrights referred to in this prospectus are listed without the TM, SM, © and ® symbols, but we will assert, to the fullest extent under applicable law, our rights or the rights of the applicable owners, if any, to these trademarks, service marks, trade names and copyrights.
Emerging Growth Company Status
We qualify as an “emerging growth company,” as defined in Section 2(a) of the Securities Act of 1933, as amended, or the Securities Act, as modified by the Jumpstart Our Business Startups Act of 2012 (the “JOBS Act”). As such, we are eligible to take advantage of certain exemptions from various reporting requirements that are applicable to other public companies that are not “emerging growth companies” including, but not limited to:
| • | an exemption from complying with the auditor attestation requirements of Section 404 of the Sarbanes Oxley Act of 2002, as amended (“Section 404”); |
| • | a requirement to have only two years of audited financial statements and only two years of related selected financial data and management’s discussion and analysis of financial condition and results of operations disclosure; |
| • | reduced disclosure obligations regarding executive compensation in our periodic reports and proxy statements; and |
| • | an exemption from the requirement to seek non-binding advisory votes on executive compensation and shareholder approval of any golden parachute payments not previously approved. |
We have not made a decision regarding whether to take advantage of these exemptions. If we do take advantage of any of these exemptions, we do not know if some investors will find our common stock less attractive as a result. The result may be a less active trading market for our common stock and our stock price may be more volatile.
In addition, Section 107 of the JOBS Act provides that an “emerging growth company” can take advantage of the extended transition period provided in Section 7(a)(2)(B) of the Securities Act for complying with new or revised accounting standards. In other words, an “emerging growth company” can delay the adoption of certain accounting standards until those standards would otherwise apply to private companies. We have irrevocably opted out of the extended transition period for complying with new or revised accounting standards pursuant to Section 107(b) of the JOBS Act.
6
Table of Contents
We could remain an “emerging growth company” for up to five years following the completion of our initial public offering (the “IPO”) (which occurred on April 4, 2014), or until the earliest of (a) the last day of the first fiscal year in which our annual gross revenues exceed $1 billion, (b) the date that we become a “large accelerated filer” as defined in Rule 12b-2 under the Securities Exchange Act of 1934, as amended (the “Exchange Act”), which would occur if the market value of our common stock that is held by non-affiliates exceeds $700 million as of the last business day of our most recently completed second fiscal quarter, or (c) the date on which we have issued more than $1 billion in non-convertible debt during the preceding three-year period.
7
Table of Contents
The Offering
| Common stock offered by us |
1,250,000 shares. |
| Common stock offered by the selling stockholders |
8,783,415 shares (or 10,288,427 shares if the underwriters exercise their option to purchase additional shares in full). |
| Common stock to be outstanding after this offering |
80,081,644 shares. |
| Use of proceeds |
We intend to use the net proceeds from this offering, including any proceeds received by us in connection with the exercise of options or warrants to purchase our common stock by the selling stockholders in connection with this offering, for general corporate purposes. We will not receive any proceeds from the sale of the shares by the selling stockholders in this offering. See “Use of Proceeds.” For more information on the selling stockholders, see “Principal and Selling Stockholders.” |
| Concentration of ownership |
Upon completion of this offering, our executive officers and directors, and their affiliates, will beneficially own, in the aggregate, approximately 24% of our outstanding shares of common stock (or approximately 23% if the underwriters exercise their option to purchase additional shares in full). |
| Trading symbol |
“GRUB.” |
The number of shares of common stock that will be outstanding after this offering is based on 78,831,644 shares outstanding as of August 25, 2014, and excludes:
| • | 8,124,370 shares of common stock issuable upon the exercise of options to purchase common stock that were outstanding as of August 25, 2014, with a weighted average exercise price of $6.36 per share; and |
| • | 1,330,429 shares of common stock reserved for future issuance under our 2013 Omnibus Incentive Plan as of August 25, 2014, and any future increase in shares reserved for issuance under such plan. |
Except as otherwise indicated, information in this prospectus reflects or assumes no exercise by the underwriters of their option to purchase up to an additional 1,505,012 shares of common stock from the selling stockholders in this offering. All share and per share information referenced throughout this prospectus has been retroactively adjusted to reflect a 1-for-2 reverse stock split of our issued and outstanding common stock and preferred stock effected on April 2, 2014 (the “Reverse Stock Split”). No fractional shares of the Company’s common stock and preferred stock were issued as a result of the Reverse Stock Split. Any fractional shares resulting from the Reverse Stock Split have been rounded up to the nearest whole share.
8
Table of Contents
Summary Historical Consolidated Financial and Other Data
The Statement of Operations Data for the years ended December 31, 2011, 2012 and 2013 set forth below is derived from our audited consolidated financial statements included elsewhere in this prospectus. The Statement of Operations Data for each of the six months ended June 30, 2013 and 2014 and the balance sheet data as of June 30, 2014 are derived from our unaudited consolidated financial statements included elsewhere in this prospectus. Our consolidated financial statements included elsewhere in this prospectus reflect the results of operations and financial condition of (i) the Seamless Platform as of and for the years ended December 31, 2011 and 2012, (ii) the Seamless Platform from January 1, 2013 through the Merger Date and for both the GrubHub Platform and the Seamless Platform after the Merger Date and (iii) GrubHub Inc. as of December 31, 2013 and June 30, 2014. Our historical results are not necessarily indicative of the results that may be expected in the future. The following summary financial and other data should be read in conjunction with the section titled “Management’s Discussion and Analysis of Financial Condition and Results of Operations” and our consolidated financial statements and related notes included elsewhere in this prospectus.
| Year Ended December 31, | Six Months Ended June 30, | |||||||||||||||||||
| 2011 | 2012 | 2013(1) | 2013 | 2014(2) | ||||||||||||||||
| (in thousands) | (unaudited) | |||||||||||||||||||
| Statement of Operations Data: |
||||||||||||||||||||
| Revenues |
$ | 60,611 | $ | 82,299 | $ | 137,143 | $ | 52,658 | $ | 118,619 | ||||||||||
| Costs and expenses: |
||||||||||||||||||||
| Sales and marketing |
17,198 | 26,892 | 37,347 | 16,164 | 32,285 | |||||||||||||||
| Operations and support |
13,961 | 18,165 | 34,173 | 11,975 | 29,841 | |||||||||||||||
| Technology (exclusive of amortization) |
5,651 | 10,172 | 15,357 | 5,344 | 11,413 | |||||||||||||||
| General and administrative |
9,777 | 12,249 | 21,907 | 8,712 | 16,944 | |||||||||||||||
| Depreciation and amortization |
4,033 | 6,089 | 13,470 | 3,673 | 11,130 | |||||||||||||||
|
|
|
|
|
|
|
|
|
|
|
|||||||||||
| Total costs and expenses |
50,620 | 73,567 | 122,254 | 45,868 | 101,613 | |||||||||||||||
| Income before provision for income taxes |
9,991 | 8,732 | 14,889 | 6,790 | 17,006 | |||||||||||||||
| Provision (benefit) for income taxes |
(5,220 | ) | 813 | 8,142 | 3,711 | 9,961 | ||||||||||||||
|
|
|
|
|
|
|
|
|
|
|
|||||||||||
| Net income |
$ | 15,211 | $ | 7,919 | $ | 6,747 | $ | 3,079 | $ | 7,045 | ||||||||||
|
|
|
|
|
|
|
|
|
|
|
|||||||||||
| Other Financial Information: |
||||||||||||||||||||
| Adjusted EBITDA(3) |
$ | 14,827 | $ | 17,185 | $ | 38,134 | $ | 15,044 | $ | 33,315 | ||||||||||
|
|
|
|
|
|
|
|
|
|
|
|||||||||||
| (1) | Includes results for Seamless Platform through August 8, 2013, when we completed the Merger, and of GrubHub Inc., the combined company, for the remainder of the period presented. |
| (2) | Includes the results of GrubHub Inc., the combined company, for the period presented. |
| (3) | See the section titled “Non-GAAP Financial Measures” below for more information and for a reconciliation of Adjusted EBITDA to net income, the most directly comparable financial measure calculated and presented in accordance with U.S. generally accepted accounting principles. |
| As of June 30, 2014 | ||||||||
| Actual | As Adjusted(1) | |||||||
| (in thousands) | (unaudited) |
|||||||
| Balance Sheet Data: |
||||||||
| Cash and cash equivalents |
$ | 207,096 | $ | 252,529 | ||||
| Working capital |
149,130 | 194,563 | ||||||
| Total assets |
885,898 | 931,331 | ||||||
| Total stockholders’ equity |
681,304 | 726,737 | ||||||
| (1) | The as adjusted column above gives effect to the sale and issuance by us of 1,250,000 shares of common stock in this offering at an assumed public offering price of $38.44 per share, which is the last reported sale price of our common stock on the NYSE on August 29, 2014 after deducting the estimated underwriting discounts and commissions and estimated offering expenses payable by us. |
9
Table of Contents
Key Business Metrics
To analyze our business performance, determine financial forecasts and help develop long-term strategic plans, we review the following key business metrics:
| Year Ended December 31, | Six Months Ended June 30, | |||||||||||||||||||
| 2011 | 2012 | 2013 | 2013 | 2014 | ||||||||||||||||
| (unaudited) | ||||||||||||||||||||
| Active Diners(1) |
689,000 | 986,000 | 3,421,000 | 1,171,000 | 4,192,000 | |||||||||||||||
| Daily Average Grubs(2) |
45,700 | 62,000 | 107,900 | 83,200 | 177,800 | |||||||||||||||
| Gross Food Sales (in millions)(3) |
$ | 412.2 | $ | 568.8 | $ | 1,014.9 | $ | 381.4 | $ | 855.6 | ||||||||||
| (1) | We count Active Diners as the number of unique diner accounts from which an order has been placed in the past twelve months through our platform. We began including Active Diners from the GrubHub Platform as of the Merger Date. |
| (2) | We count Daily Average Grubs as the number of revenue generating orders placed on our platform divided by the number of days for a given period. |
| (3) | We calculate Gross Food Sales as the total value of food, beverages, taxes, prepaid gratuities, and any delivery fees processed through our platform. We include all revenue generating orders placed on our platform. Because we act as an agent of the merchant in the transaction, we recognize as revenue only our commissions from the transaction, which are a percentage of the total Gross Food Sales for such transaction. |
Non-GAAP Financial Measures
Adjusted EBITDA is a financial measure that is not calculated in accordance with generally accepted accounting principles in the United States (“GAAP”). We define Adjusted EBITDA as net income adjusted to exclude acquisition costs and related severance, incomes taxes, depreciation and amortization and stock-based compensation expense. Below, we have provided a reconciliation of Adjusted EBITDA to our net income, the most directly comparable financial measure calculated and presented in accordance with GAAP. Adjusted EBITDA should not be considered as an alternative to net income or any other measure of financial performance calculated and presented in accordance with GAAP. Our Adjusted EBITDA may not be comparable to similarly titled measures of other organizations because other organizations may not calculate Adjusted EBITDA in the same manner as we calculate the measure.
We include Adjusted EBITDA in this prospectus because it is an important measure upon which our management assesses our operating performance. We use Adjusted EBITDA as a key performance measure because we believe it facilitates operating performance comparisons from period to period by excluding potential differences primarily caused by variations in capital structures, tax positions, the impact of acquisitions and restructuring, the impact of depreciation and amortization expense on our fixed assets and the impact of stock-based compensation expense. Because Adjusted EBITDA facilitates internal comparisons of our historical operating performance on a more consistent basis, we also use Adjusted EBITDA for business planning purposes and in evaluating acquisition opportunities. In addition, we believe Adjusted EBITDA and similar measures are widely used by investors, securities analysts, ratings agencies and other parties in evaluating companies in our industry as a measure of financial performance and debt-service capabilities.
Our use of Adjusted EBITDA has limitations as an analytical tool, and you should not consider it in isolation or as a substitute for analysis of our results as reported under GAAP. Some of these limitations are:
| • | Adjusted EBITDA does not reflect our cash expenditures for capital equipment or other contractual commitments; |
| • | although depreciation and amortization are non-cash charges, the assets being depreciated and amortized may have to be replaced in the future, and Adjusted EBITDA does not reflect capital expenditure requirements for such replacements; |
10
Table of Contents
| • | Adjusted EBITDA does not reflect changes in, or cash requirements for, our working capital needs; and |
| • | other companies, including companies in our industry, may calculate Adjusted EBITDA measures differently, which reduces their usefulness as comparative measures. |
In evaluating Adjusted EBITDA, you should be aware that in the future we will incur expenses similar to some of the adjustments in this presentation. Our presentation of Adjusted EBITDA should not be construed as an inference that our future results will be unaffected by these expenses or any unusual or non-recurring items. When evaluating our performance, you should consider Adjusted EBITDA alongside other financial performance measures, including our net income and other GAAP results.
The following table presents a reconciliation of Adjusted EBITDA to our net income, the most comparable GAAP measure, for each of the periods indicated:
| Year Ended December 31, | Six Months Ended June 30, | |||||||||||||||||||
| 2011 | 2012 | 2013(1) | 2013 | 2014(2) | ||||||||||||||||
| (in thousands) | (unaudited) | |||||||||||||||||||
| Reconciliation of Adjusted EBITDA: |
||||||||||||||||||||
| Net income |
$ | 15,211 | $ | 7,919 | $ | 6,747 | $ | 3,079 | $ | 7,045 | ||||||||||
| Income taxes(3) |
(5,220 | ) | 813 | 8,142 | 3,711 | 9,961 | ||||||||||||||
| Depreciation and amortization |
4,033 | 6,089 | 13,470 | 3,673 | 11,130 | |||||||||||||||
|
|
|
|
|
|
|
|
|
|
|
|||||||||||
| EBITDA |
14,024 | 14,821 | 28,359 | 10,463 | 28,136 | |||||||||||||||
| Merger and restructuring costs(4) |
— | — | 4,842 | 3,343 | 492 | |||||||||||||||
| Stock-based compensation |
803 | 2,364 | 4,933 | 1,238 | 4,687 | |||||||||||||||
|
|
|
|
|
|
|
|
|
|
|
|||||||||||
| Adjusted EBITDA |
$ | 14,827 | $ | 17,185 | $ | 38,134 | $ | 15,044 | $ | 33,315 | ||||||||||
|
|
|
|
|
|
|
|
|
|
|
|||||||||||
| (1) | Includes results for Seamless Platform through August 8, 2013, when we completed the Merger, and of GrubHub Inc., the combined company, for the remainder of the period presented. |
| (2) | Includes the results of GrubHub Inc., the combined company, for the period presented. |
| (3) | The increase in income tax expense was primarily attributable to a reversal of deferred tax liability of $8.1 million in 2011 associated with the June 2011 sale of preferred stock to SLW Investors, LLC offset by 2011 income tax paid of $2.2 million, which represents the income tax expense from January 1, 2011 through May 31, 2011. For the period January 1, 2012 through October 27, 2012, the Company was a pass-through entity for income tax purposes. Immediately following the Merger Date, 100% of our taxable income is subject to income tax. |
| (4) | Merger and restructuring costs include transaction and integration-related costs, such as legal and accounting costs, associated with the Merger and restructuring initiatives. |
11
Table of Contents
Investing in our common stock involves a high degree of risk. You should carefully consider the risks and uncertainties described below, together with all of the other information in this prospectus, before making a decision to invest in our common stock. If any of the risks actually occur, our business, financial condition, results of operations and prospects could be harmed. In that event, the trading price of our common stock could decline, and you could lose part or all of your investment in us.
Risks Related to Our Business
We have a limited operating history in an evolving industry, which makes it difficult to evaluate our future prospects and may increase the risk that we will not be successful.
We have a limited operating history in an evolving industry that may not develop as expected. Assessing our business and future prospects is challenging in light of the risks and difficulties we may encounter. These risks and difficulties include our ability to:
| • | accurately forecast our revenues and plan our operating expenses; |
| • | increase the number of and retain existing restaurants and diners using our platform; |
| • | successfully compete with the traditional telephone, pen-and-paper takeout ordering process, along with other companies that are currently in, or may in the future enter, the business of allowing diners to order takeout food online; |
| • | successfully expand our business in existing markets and enter new markets; |
| • | adapt to rapidly evolving trends in the ways consumers and businesses interact with technology; |
| • | avoid interruptions or disruptions in our service; |
| • | develop a scalable, high-performance technology infrastructure that can efficiently and reliably handle increased usage, as well as the deployment of new features and products; |
| • | hire, integrate and retain talented sales, customer service, technology and other personnel; and |
| • | effectively manage rapid growth in our personnel and operations. |
If the demand for ordering food online and through mobile applications does not develop as we expect, or if we fail to address the needs of restaurants or diners, our business will be harmed. We may not be able to successfully address these risks and difficulties, which could harm our business and results of operations.
If we fail to manage the integration of the Merger effectively, our results of operations and business could be harmed.
Since the Merger, we have implemented and continue to implement a process of integration to merge the two businesses. The possible risks associated with such integration include the following:
| • | changes to unify our pricing models could affect our relationship with existing restaurants in our network; |
| • | we may experience difficulty with and may not succeed in rebranding a combined company; |
| • | we are in the process of closing our Sandy, Utah office in order to consolidate our customer care, operations and technology teams in Chicago, and we may not be able to retain employees in that office for the necessary transition period before we are able to transition our technology platform completely; |
| • | we may not assimilate the personnel, culture and operations of the two businesses in the combined company, including back-office functions and systems, such as accounting, human resources and others; |
| • | we may not be able to integrate smoothly the combined technologies or products with the current technologies and products, and customers may experience interruptions in their use of our platform as a result; and |
12
Table of Contents
| • | cost savings and/or marketing efficiencies may not meet our expectations. |
This integration may be difficult and unpredictable. It may be that resources invested in the Merger and integration efforts would have been or could be better utilized developing technology and products for our proprietary technology platform or on other strategic development initiatives. Additionally, our ongoing business could be disrupted, including management being distracted from other objectives, opportunities and risks. Successful integration also requires coordination of different functional teams. There can be no assurance that we will be successful in our business integration efforts or that we will realize the expected benefits.
If we fail to retain our existing restaurants and diners or to acquire new restaurants and diners in a cost-effective manner, our revenue may decrease and our business may be harmed.
We believe that growth of our business and revenue is dependent upon our ability to continue to grow our two-sided network in existing geographic markets by retaining our existing restaurants and diners and adding new restaurants and diners. The increase in restaurants attracts more diners to our platform and the increase in diners attracts more restaurants. This two-sided network takes time to build and may grow more slowly than we expect or than it has grown in the past. In addition, as we have become larger through organic growth, the growth rates for Active Diners, Daily Average Grubs and Gross Food Sales have at times slowed, and may similarly slow in the future, even if we continue to add restaurants and diners on an absolute basis. Although we expect that our growth rates will continue to slow during certain periods as our business increases in size, if we fail to retain either our existing restaurants (especially our most popular restaurants) or diners, the value of our two-sided network will be diminished. In addition, although we believe that many of our new restaurants and diners originate from word-of-mouth and other non-paid referrals from existing restaurants and diners, we also expect to continue to spend to acquire additional restaurants and diners. We cannot assure you that the revenue from the restaurants and diners we acquire will ultimately exceed the cost of acquisition.
While a key part of our business strategy is to add restaurants and diners in our existing geographic markets, to a lesser degree, we may also expand our operations into new geographic markets. In doing so, we may incur losses or otherwise fail to enter new markets successfully. Our expansion into new markets may place us in unfamiliar competitive environments and involve various risks, including the need to invest significant resources and the possibility that returns on such investments will not be achieved for several years or at all.
Growth of our business will depend on a strong brand and any failure to maintain, protect and enhance our brand would hurt our ability to retain or expand our base of restaurants and diners and our ability to increase their level of engagement.
We believe that a strong brand is necessary to continue to attract and retain diners and, in turn, the restaurants in our network. We need to maintain, protect and enhance our brand in order to expand our base of diners and increase their engagement with our websites and mobile applications. This will depend largely on our ability to continue to provide differentiated products, and we may not be able to do so effectively. While we may choose to engage in a broader marketing campaign to further promote our brand, this effort may not be successful or cost effective. If we are unable to maintain or enhance restaurant and diner awareness in a cost-effective manner, our brand, business, results of operations and financial condition could be harmed. Furthermore, negative publicity about our Company, including delivery problems, issues with our technology and complaints about our personnel or customer service, could diminish confidence in, and the use of, our products, which could harm our results of operations and business.
We rely on restaurants in our network for many aspects of our business, and any failure by them to maintain their service levels could harm our business.
We rely upon restaurants in our network, principally small and local independent businesses, to provide quality food to our diners on a timely basis. If these restaurants experience difficulty servicing diner demand, producing quality food, providing timely delivery and good service or meeting our other requirements or standards, our reputation and brand could be damaged. In addition, if restaurants in our network were to cease
13
Table of Contents
operations, temporarily or permanently, face financial distress or other business disruption, or if our relationships with restaurants in our network deteriorate, we may not be able to provide diners with restaurant choices. This risk is more pronounced in markets where we have fewer restaurants. In addition, if we are unsuccessful in choosing or finding popular restaurants, if we fail to negotiate satisfactory pricing terms with them or if we ineffectively manage these relationships, it could harm our business and results of operations.
We experience significant seasonal fluctuations in our financial results, which could cause our stock price to fluctuate.
Our business is highly dependent on diner behavior patterns that we have observed over time. In our metropolitan markets, we generally experience a relative increase in diner activity from September to April and a relative decrease in diner activity from May to August. In addition, we benefit from increased order volume in our campus markets when school is in session and experience a decrease in order volume when school is not in session, during summer breaks and other vacation periods. Diner activity can also be impacted by colder or more inclement weather, which typically increases order volume, and warmer or sunny weather, which typically decreases order volume. Seasonality will likely cause fluctuations in our financial results on a quarterly basis. In addition, other seasonality trends may develop and the existing seasonality and diner behavior that we experience may change or become more extreme.
We may not continue to grow at historical rates or maintain profitability in the future.
While our revenue has grown in recent periods, this growth rate may not be sustainable and we may not realize sufficient revenue to maintain profitability. We may incur significant losses in the future for a number of reasons, including insufficient growth in the number of restaurants and diners on our platform, increasing competition, as well as other risks described in this prospectus, and we may encounter unforeseen expenses, difficulties, complications and delays and other unknown factors. We expect to continue to make investments in the development and expansion of our business, which may not result in increased revenue or growth. In addition, as a public company, we incur and will continue to incur significant legal, accounting and other expenses that we did not incur as a private company. As a result of these increased expenditures, we will have to generate and sustain increased revenue to maintain profitability. Accordingly, we may not be able to maintain profitability and we may incur significant losses in the future, and this could cause the price of our common stock to decline.
If we fail to manage our growth effectively, our brand, results of operations and business could be harmed.
We have experienced rapid growth in our headcount and operations, both through organic growth as well as due to the Merger. This growth places substantial demands on management and our operational infrastructure. Many of our employees have been with us for fewer than 18 months. We have and intend to continue to make substantial investments in our technology, customer service, sales and marketing infrastructure. As we continue to grow, we must effectively integrate, develop and motivate a large number of new employees, while maintaining the beneficial aspects of our Company culture. We may not be able to manage growth effectively. If we do not manage the growth of our business and operations effectively, the quality of our platform and efficiency of our operations could suffer, which could harm our brand, business and results of operations.
The impact of economic conditions, including the resulting effect on consumer spending, may harm our business and results of operations.
Our performance is subject to economic conditions and their impact on levels of consumer spending. Some of the factors having an impact on discretionary consumer spending include general economic conditions, unemployment, consumer debt, reductions in net worth, residential real estate and mortgage markets, taxation, energy prices, interest rates, consumer confidence and other macroeconomic factors. Consumer purchases of discretionary items generally decline during recessionary periods and other periods in which disposable income
14
Table of Contents
is adversely affected. Small businesses that do not have substantial resources, like virtually all of the restaurants in our network, tend to be more adversely affected by poor economic conditions than large businesses. Also, because spending for food purchases from restaurants is generally considered to be discretionary, any decline in consumer spending may have a disproportionate effect on our business relative to those businesses that sell products or services considered to be necessities. If spending at many of the restaurants in our network declines, or if a significant number of these restaurants go out of business, diners may be less likely to use our service, which could harm our business and results of operations. In addition, significant adverse economic conditions could harm the businesses of our corporate customers, resulting in decreased use of our platform. Moreover, the majority of restaurants in our network are located in major metropolitan areas like New York City, Chicago and the San Francisco Bay Area. To the extent any one of these geographic areas experience any of the above described conditions to a greater extent than other geographic areas, the harm to our business and results of operations could be exacerbated.
We make the restaurant and diner experience our highest priority. Our dedication to making decisions based primarily on the best interests of restaurants and diners may cause us to forego short-term opportunities, which could impact our profitability.
We base many of our decisions upon the best interests of the restaurants and diners who use our platform. We believe that this approach has been essential to our success in increasing our growth rate and the frequency with which restaurants and diners use our platform and has served our long-term interests and those of our stockholders. We believe that it is our responsibility to make our diners happy. In the past, we have foregone, and we may in the future forego, certain expansion or revenue opportunities that we do not believe are in the best interests of our restaurants and diners, even if such decisions negatively impact our business or results of operations in the short term. Our focus on making decisions based primarily on the interests of the restaurants and diners who use our platform may not result in the long-term benefits that we expect, and our business and results of operations may be harmed.
If use of the Internet via websites, mobile devices and other platforms, particularly with respect to online food ordering, does not continue to increase as rapidly as we anticipate, our business and growth prospects will be harmed.
Our business and growth prospects are substantially dependent upon the continued and increasing use of the Internet as an effective medium of transactions by diners. Internet use may not continue to develop at historical rates, and diners may not continue to use the Internet and other online services to order their food at current or increased growth rates or at all. In addition, the Internet and mobile applications may not continue to be accepted as a viable platform or resource for a number of reasons, including:
| • | actual or perceived lack of security of information or privacy protection; |
| • | possible disruptions, computer viruses or other damage to Internet servers, users’ computers or mobile applications; |
| • | excessive governmental regulation; and |
| • | unacceptable delays due to actual or perceived limitations of wireless networks. |
We face potential liability, expenses for legal claims and harm to our business based on the nature of our business and the content on our platform.
We face potential liability, expenses for legal claims and harm to our business relating to the nature of the takeout food business, including potential claims related to food offerings, delivery and quality. For example, third parties could assert legal claims against us in connection with personal injuries related to food poisoning or tampering or accidents caused by the delivery drivers of restaurants in our network. Alternatively, we could be subject to legal claims relating to the sale of alcoholic beverages by our restaurants to underage diners.
15
Table of Contents
Reports, whether true or not, of food-borne illnesses (such as E. Coli, avian flu, bovine spongiform encephalopathy, hepatitis A, trichinosis or salmonella) and injuries caused by food tampering have severely injured the reputations of participants in the food business and could do so in the future as well. The potential for acts of terrorism on our nation’s food supply also exists and, if such an event occurs, it could harm our business and results of operations. In addition, reports of food-borne illnesses or food tampering, even those occurring solely at restaurants that are not in our network, could, as a result of negative publicity about the restaurant industry, harm our business and results of operations.
In addition, we face potential liability and expense for claims relating to the information that we publish on our websites and mobile applications, including claims for trademark and copyright infringement, defamation, libel and negligence, among others. For example, we could be subject to claims related to the content published on allmenus.com and MenuPages.com (“MenuPages”), which contain approximately 275,000 menus, based on the fact that we do not obtain prior permission from restaurants to include their menus.
We have incurred and expect to continue to incur legal claims. Potentially, the frequency of such claims could increase in proportion to the number of restaurants and diners that use our platform and as we grow. These claims could divert management time and attention away from our business and result in significant costs to investigate and defend, regardless of the merits of the claims. In some instances, we may elect or be compelled to remove content or may be forced to pay substantial damages if we are unsuccessful in our efforts to defend against these claims. If we elect or are compelled to remove valuable content from our websites or mobile applications, our platform may become less useful to restaurants and diners and our traffic may decline, which could harm our business and results of operations.
We may not timely and effectively scale and adapt our existing technology and network infrastructure to ensure that our platform is accessible, which would harm our reputation, business and results of operations.
It is critical to our success that restaurants and diners within our geographic markets be able to access our platform at all times. We have previously experienced service disruptions, and in the future, we may experience service disruptions, outages or other performance problems due to a variety of factors, including infrastructure changes, human or software errors, capacity constraints due to an overwhelming number of diners accessing our platform simultaneously, and denial of service or fraud or security attacks. In some instances, we may not be able to identify the cause or causes of these performance problems within an acceptable period of time. It may become increasingly difficult to maintain and improve the availability of our platform, especially during peak usage times and as our products become more complex and our diner traffic increases. If our platform is unavailable when diners attempt to access it or it does not load as quickly as they expect, diners may seek other services, and may not return to our platform as often in the future, or at all. This would harm our ability to attract restaurants and diners and decrease the frequency with which they use our platform. We expect to continue to make significant investments to maintain and improve the availability of our platform and to enable rapid releases of new features and products. To the extent that we do not effectively address capacity constraints, respond adequately to service disruptions, upgrade our systems as needed or continually develop our technology and network architecture to accommodate actual and anticipated changes in technology, our business and results of operations would be harmed.
Our failure to protect personal information provided by our diners against inappropriate disclosure, including security breaches, could violate applicable law and contracts with our service providers and could result in liability to us, damage to our reputation and brand and harm to our business.
We rely on third-party payment processors and encryption and authentication technology licensed from third parties that is designed to effect secure transmission of personal information provided by our diners. We may need to expend significant resources to protect against impermissible disclosure, including security breaches, or to address problems caused by such disclosure. If we, or our third-party providers, are unable to maintain the security of our diners’ personal information, our reputation and brand could be harmed and we may be exposed to litigation and possible liability.
16
Table of Contents
Because we process and transmit payment card information, we are subject to the Payment Card Industry (“PCI”) and Data Security Standard (the “Standard”). The Standard is a comprehensive set of requirements for enhancing payment account data security that was developed by the PCI Security Standards Council to help facilitate the broad adoption of consistent data security measures. We are required by payment card network rules to comply with the Standard, and our failure to do so may result in fines or restrictions on our ability to accept payment cards. Under certain circumstances specified in the payment card network rules, we may be required to submit to periodic audits, self-assessments or other assessments of our compliance with the Standard. Such activities may reveal that we have failed to comply with the Standard. If an audit, self-assessment or other test determines that we need to take steps to remediate any deficiencies, such remediation efforts may distract our management team and require us to undertake costly and time consuming remediation efforts. In addition, even if we comply with the Standard, there is no assurance that we will be protected from a security breach.
We are subject to payment-related risks, and if payment processors are unwilling or unable to provide us with payment processing service or impose onerous requirements on us in order to access their services, or if they increase the fees they charge us for these services, our business and results of operations could be harmed.
We accept payments using a variety of methods, including credit and debit cards. For certain payment methods, including credit and debit cards, we pay bank interchange and other fees. These fees may increase over time and raise our operating costs and lower our profitability. We rely on third parties to provide payment processing services, including the processing of credit and debit cards. Our business may be disrupted for an extended period of time if any of these companies becomes unwilling or unable to provide these services to us. We are also subject to payment card association operating rules, certification requirements and rules governing electronic funds transfers, which could change or be reinterpreted to make it difficult or impossible for us to comply. If we fail to comply with these rules or requirements, we may be subject to fines and higher transaction fees and/or lose our ability to accept credit and debit card payments from diners or facilitate other types of online payments, and our business and results of operations could be harmed.
We rely on third parties, including our payment processor and data center hosts, and if these or other third parties do not perform adequately or terminate their relationships with us, our costs may increase and our business and results of operations could be harmed.
Our success will depend upon our relationships with third parties, including our payment processor and data center hosts. We rely on a third-party payment processor and encryption and authentication technology licensed from third parties that is designed to effect secure transmission of personal information provided by our diners. We also rely on third-party data center hosts to provide a reliable network backbone with the speed, data capacity, security and hardware necessary for reliable Internet access and services. If our payment processor, or a data center host, or another third party, does not perform adequately, terminates its relationship with us or refuses to renew its agreement with us on commercially reasonable terms, we may have difficulty finding an alternate provider on similar terms and in an acceptable timeframe, our costs may increase and our business and results of operations could be harmed.
In addition, we rely on off-the-shelf hardware and software platforms developed by third parties to build and customize our OrderHub and Boost tablet and mobile applications. If third parties fail to continue to produce or maintain these hardware and software platforms, our OrderHub and Boost tablet and mobile applications may become less accessible to restaurants and diners, and our business and results of operations could be harmed.
If our security measures are compromised, or if our platform is subject to attacks that degrade or deny the ability of restaurants and diners to access our content, restaurants and diners may curtail or stop use of our platform.
Like all online services, our platform is vulnerable to computer viruses, break-ins, phishing attacks, attempts to overload our servers with denial-of-service, misappropriation of data through website scraping or other attacks
17
Table of Contents
and similar disruptions from unauthorized use of our computer systems, any of which could lead to interruptions, delays or website shutdowns, causing loss of critical data or the unauthorized disclosure or use of personally identifiable or other confidential information. Like most Internet companies, we have experienced interruptions in our service in the past due to software and hardware issues as well as denial-of-service and other cyber-attacks and, in the future, may experience compromises to our security that result in performance or availability problems, the complete shutdown of our websites or the loss or unauthorized disclosure of confidential information. In the event of a prolonged service interruption or significant breach of our security measures, our restaurants and diners may lose trust and confidence in us and decrease their use of our platform or stop using our platform entirely. We may be unable to implement adequate preventative measures against or proactively address techniques used to obtain unauthorized access, disable or degrade service or sabotage systems because such techniques change frequently, often remain undetected until launched against a target and may originate from remote areas around the world that are less regulated. Any or all of these issues could harm our ability to attract new restaurants and diners or deter current restaurants and diners from returning, reduce the frequency with which restaurants and diners use our platform or subject us to third-party lawsuits, regulatory fines or other action or liability, thereby harming our business and results of operations.
We compete primarily with the traditional offline ordering process and adherence to this traditional ordering method and pressure from existing and new companies that offer online ordering could harm our business and results of operations.
We primarily compete with the traditional offline ordering process used by the vast majority of restaurants and diners involving the telephone and paper menus that restaurants distribute to diners, as well as advertising that restaurants place in local publications to attract diners. Changing traditional ordering habits is difficult and if restaurants and diners do not embrace the transition to online food ordering as we expect, our business and results of operations could be harmed.
In addition to the traditional takeout ordering process, we compete with other online food ordering businesses, chain restaurants that have their own online ordering platforms, point of sale companies and restaurant delivery services. Our current and future competitors may enjoy competitive advantages, such as greater name recognition, longer operating histories, greater market share in certain markets and larger existing user bases in certain markets and substantially greater financial, technical and other resources than we have. Greater financial resources and product development capabilities may allow these competitors to respond more quickly to new or emerging technologies and changes in restaurant and diner requirements that may render our products less attractive or obsolete. These competitors could introduce new products with competitive price and performance characteristics or undertake more aggressive marketing campaigns than ours. Large Internet companies with substantial resources, users and brand power could also decide to enter our market and compete with us. Furthermore, independent restaurants could determine that it is more cost effective to develop their own platform to permit online takeout orders rather than use our service.
As part of the Merger, we completed an agreement with the New York Attorney General’s Office that required us to waive the exclusivity provisions in existing agreements with restaurants located in Manhattan and to refrain from entering into any new exclusive agreements in Manhattan until February 2015. Complying with the terms of this agreement could increase the ability of our competitors to compete in Manhattan and therefore could have an impact on our market position in Manhattan. If this agreement gives our competitors an advantage, our revenue may decrease and our business and results of operations may be harmed.
If we lose existing restaurants or diners in our network, fail to attract new restaurants or diners or are forced to reduce our commission percentage or make pricing concessions as a result of increased competition, our business and results of operations could be harmed.
18
Table of Contents
If we do not continue to innovate and provide useful products or if our introduced products do not perform or are not adopted by restaurants in accordance with our expectations, we may not remain competitive and our business and results of operations could suffer.
Our success depends in part on our ability to continue to innovate. To remain competitive, we must continuously enhance and improve the functionality and features of our platform, including our websites and mobile applications. The Internet and the online commerce industry are rapidly changing and becoming more competitive. If competitors introduce new products embodying new technologies, or if new industry standards and practices emerge, our existing websites, technology and mobile applications may become obsolete. Our future success could depend on our ability to:
| • | enhance our existing products and develop new products; |
| • | persuade restaurants to adopt our new technologies and products in a timely manner; and |
| • | respond to technological advances and emerging industry standards and practices on a cost-effective and timely basis. |
Developing our platform, which includes our mobile applications, websites and other technologies entails significant technical and business risks. We may use new technologies ineffectively, or we may fail to adapt to emerging industry standards. If we face material delays in introducing new or enhanced products or if our recently introduced products do not perform in accordance with our expectations, the restaurants and diners in our network may forego the use of our products in favor of those of our competitors.
Internet search engines drive traffic to our platform and our new diner growth could decline and our business and results of operations would be harmed if we fail to appear prominently in search results.
Our success depends in part on our ability to attract diners through unpaid Internet search results on search engines like Google, Yahoo! and Bing. The number of diners we attract to our platform from search engines is due in large part to how and where our websites rank in unpaid search results. These rankings can be affected by a number of factors, many of which are not under our direct control and may change frequently. For example, a search engine may change its ranking algorithms, methodologies or design layouts. As a result, links to our websites may not be prominent enough to drive traffic to our websites, and we may not know how or otherwise be in a position to influence the results. In some instances, search engine companies may change these rankings in a way that promotes their own competing products or services or the products or services of one or more of our competitors. Search engines may also adopt a more aggressive auction-pricing system for keywords that would cause us to incur higher advertising costs or reduce our market visibility to prospective diners. Our websites have experienced fluctuations in search result rankings in the past, and we anticipate similar fluctuations in the future. Any reduction in the number of diners directed to our platform could harm our business and results of operations.
We expect a number of factors to cause our results of operations to fluctuate on a quarterly and annual basis, which may make it difficult to predict our future performance.
Our results of operations could vary significantly from quarter to quarter and year to year because of a variety of factors, many of which are outside of our control. As a result, comparing our results of operations on a period-to-period basis may not be meaningful. In addition to other risk factors discussed in this section, factors that may contribute to the variability of our quarterly and annual results include:
| • | our ability to attract new restaurants and diners and retain existing restaurants and diners in our network in a cost-effective manner; |
| • | our ability to accurately forecast revenue and appropriately plan our expenses; |
| • | the effects of changes in search engine placement and prominence; |
| • | the effects of increased competition on our business; |
19
Table of Contents
| • | our ability to successfully expand in existing markets and successfully enter new markets; |
| • | the impact of worldwide economic conditions, including the resulting effect on diner spending on takeout; |
| • | the seasonality of our business, including the effect of academic calendars on college campuses and seasonal patterns in restaurant dining; |
| • | the impact of weather on our business; |
| • | our ability to protect our intellectual property; |
| • | our ability to maintain an adequate rate of growth and effectively manage that growth; |
| • | our ability to maintain and increase traffic to our platform; |
| • | our ability to keep pace with technology changes in the takeout industry; |
| • | the success of our sales and marketing efforts; |
| • | costs associated with defending claims, including intellectual property infringement claims and related judgments or settlements; |
| • | changes in governmental or other regulation affecting our business; |
| • | interruptions in service and any related impact on our business, reputation or brand; |
| • | the attraction and retention of qualified employees and key personnel; |
| • | our ability to choose and effectively manage third-party service providers; |
| • | changes in diner behavior with respect to takeout, especially in New York City, Chicago and the San Francisco Bay Area; |
| • | the effects of natural or man-made catastrophic events; |
| • | the effectiveness of our internal controls; |
| • | the impact of payment processor costs and procedures; |
| • | changes in the online payment transfer rate; and |
| • | changes in our tax rates or exposure to additional tax liabilities. |
The loss of key senior management personnel could harm our business and future prospects.
We depend on our senior management and other key personnel. We may not be able to retain the services of any of our senior management or other key personnel. Although we have employment agreements with our key senior management personnel, their employment is at-will and they could leave at any time. The loss of any of our executive officers or other key employees could harm our business and future prospects.
We depend on talented personnel to grow and operate our business, and if we are unable to hire, retain, manage and motivate our personnel, or if our new personnel do not perform as we anticipate, we may not be able to grow effectively.
Our future success will depend upon our ability to continue to identify, hire, develop, motivate and retain talented personnel. We may not be able to retain the services of any of our employees or other members of senior management in the future. In addition, from time to time, there may be changes in our senior management team that may be disruptive to our business. If our senior management team fails to work together effectively and to execute our plans and strategies, our business and results of operations could be harmed.
Our growth strategy also depends on our ability to expand our organization by attracting and hiring high-quality personnel. Identifying, attracting, recruiting, training, integrating, managing and motivating talented
20
Table of Contents
individuals will require significant time, expense and attention. Competition for talent is intense, particularly in technology driven industries such as ours. If we are not able to effectively recruit and retain our talent, our business and our ability to achieve our strategic objectives would be harmed.
Unfavorable media coverage could harm our business and results of operations.
We are the subject of media coverage from time to time. Unfavorable publicity regarding our business model, content, personnel, customer service, technology, product changes, product quality or privacy practices could harm our reputation. Such negative publicity could also harm the size of our network and engagement and loyalty of our restaurants and diners, which could adversely impact our business and results of operations.
Our business, and that of our third-party providers and third-party data center, is subject to the risks of severe weather, earthquakes, fires, floods, hurricanes and other natural catastrophic events and to interruption by man-made problems such as computer viruses or terrorism.
Our business, particularly in areas of significant concentration like New York, Chicago and San Francisco, is subject to damage or interruption from severe weather, earthquakes, fires, floods, tornadoes, hurricanes, power losses, telecommunications failures, terrorist attacks, acts of war and similar events. For example, severe weather in Chicago, the location of our corporate headquarters and most of our customer service staff, could inhibit the ability of our customer service staff to get to work, which could result in service problems and complaints from restaurants or diners. As we rely heavily on our servers, computer and communications systems, as well as those of our third-party providers and third-party data centers, and the Internet to conduct our business and provide high quality customer service, disruptions could harm our ability to run our business, which could harm our results of operations and financial condition. For example, in October 2012, Superstorm Sandy caused blackouts throughout significant portions of New York City, which resulted in restaurants and diners being unable to access our platform for several days. These events could also negatively impact diner activity or the ability of restaurants to continue to operate.
Increases in food, labor, energy and other costs could adversely affect results of operations.
An increase in restaurant operating costs could cause restaurants in our network to raise prices or cease operations. Factors such as inflation, increased food costs, increased labor and employee benefit costs, increased rent costs and increased energy costs may increase restaurant operating costs. Many of the factors affecting restaurant costs are beyond the control of the restaurants in our network. In many cases, these restaurants may not be able to pass along these increased costs to diners and, as a result, may cease operations, which could harm our profitability and results of operations. Additionally, if these restaurants raise prices, order volume may decline, which could harm our profitability and results of operations.
Future acquisitions could disrupt our business and harm our business and results of operations.
As part of our business strategy, we will continue to selectively explore acquisition opportunities of companies and technologies to strengthen our platform. The identification of suitable acquisition candidates can be difficult, time consuming and costly, and we may not be able to successfully complete identified acquisitions. The risks we face in connection with acquisitions include:
| • | regulatory hurdles; |
| • | anticipated benefits may not materialize; |
| • | diversion of management time and focus from operating our business to addressing acquisition integration challenges; |
| • | transition of the acquired company’s users to our websites and mobile applications; |
| • | retention of employees from the acquired company; |
21
Table of Contents
| • | cultural challenges associated with integrating employees from the acquired company into our organization; |
| • | integration of the acquired company’s accounting, management information, human resources and other administrative systems; |
| • | the need to implement or improve controls, procedures and policies at a business that prior to the acquisition may have lacked effective controls, procedures and policies; |
| • | coordination of product development and sales and marketing functions; |
| • | liability for activities of the acquired company before the acquisition, including patent and trademark infringement claims, violations of laws, commercial disputes, tax liabilities and other known and unknown liabilities; and |
| • | litigation or other claims in connection with the acquired company, including claims from terminated employees, users, former stockholders or other third parties. |
Our failure to address these risks or other problems encountered in connection with our past or future acquisitions and investments could cause us to fail to realize the anticipated benefits of these acquisitions or investments, cause us to incur unanticipated liabilities, and harm our business generally. Future acquisitions could also result in dilutive issuances of our equity securities, the incurrence of debt, contingent liabilities, amortization expenses or the impairment of goodwill, any of which could harm our business and results of operations.
Government regulation of the Internet and e-commerce is evolving, and unfavorable changes could substantially harm our business and results of operations.
We are subject to general business regulations and laws as well as federal and state regulations and laws specifically governing the Internet and e-commerce. Existing and future laws and regulations may impede the growth of the Internet, e-commerce or other online services, and increase the cost of providing online services. These regulations and laws may cover sweepstakes, taxation, tariffs, user privacy, data protection, pricing, content, copyrights, distribution, electronic contracts and other communications, consumer protection, broadband residential Internet access and the characteristics and quality of services. It is not clear how existing laws governing issues such as property ownership, sales, use and other taxes, libel and personal privacy apply to the Internet and e-commerce. Unfavorable resolution of these issues may harm our business and results of operations.
Our business is subject to a variety of U.S. laws, many of which are unsettled and still developing and which could subject us to claims or otherwise harm our business or results of operations.
We are subject to a variety of laws in the United States, including laws regarding data retention, online credit card payments, privacy, data security, distribution of user-generated content, consumer protection and tax, which are frequently evolving and developing. The scope and interpretation of the laws that are or may be applicable to us are often uncertain and may be conflicting. For example, laws relating to the liability of providers of online services for activities of their users and other third parties are currently being tested by a number of claims, including actions based on invasion of privacy and other torts, unfair competition, copyright and trademark infringement, and other theories based on the nature and content of the materials searched, the ads posted or the content provided by users. In addition, regulatory authorities in the United States and the European Union are considering a number of legislative and regulatory proposals concerning data protection and other matters that may be applicable to our business. It is also likely that if our business grows and evolves and our products are used in a greater number of geographies, we will become subject to laws and regulations in additional jurisdictions. It is difficult to predict how existing laws will be applied to our business and the new laws to which we may become subject.
22
Table of Contents
If we are not able to comply with these laws or regulations or if we become liable under these laws or regulations, we could be harmed, and we may be forced to implement new measures to reduce our exposure to this liability. This may require us to expend substantial resources or to discontinue certain products or features, which would negatively affect our business. In addition, the increased attention focused upon liability issues as a result of lawsuits and legislative proposals could harm our reputation or otherwise impact the growth of our business. Any costs incurred to prevent or mitigate this potential liability could also harm our business and results of operations.
Failure to adequately protect our intellectual property could harm our business and results of operations.
Our business depends on our intellectual property, the protection of which is crucial to the success of our business. We rely on a combination of patent, trademark, trade secret and copyright law and contractual restrictions to protect our intellectual property. In addition, we attempt to protect our intellectual property, technology and confidential information by requiring our employees and consultants who develop intellectual property on our behalf to enter into confidentiality and assignment of inventions agreements and non-competition agreements, and third parties to enter into nondisclosure agreements. These agreements may not effectively prevent unauthorized use or disclosure of our confidential information, intellectual property or technology and may not provide an adequate remedy in the event of unauthorized use or disclosure of our confidential information, intellectual property or technology. Despite our efforts to protect our proprietary rights, unauthorized parties may copy aspects of our website features, software and functionality or obtain and use information that we consider proprietary.
We have registered, among numerous other trademarks, “GrubHub,” “happy eating,” “Seamless,” “OrderHub” and “Your food is here.” as trademarks in the United States. Competitors have and may continue to adopt service names similar to ours, thereby harming our ability to build brand identity and possibly leading to user confusion. In addition, there could be potential trade name or trademark infringement claims brought by owners of other trademarks that are similar to our trademarks. Litigation or proceedings before the U.S. Patent and Trademark Office or other governmental authorities and administrative bodies in the United States and abroad may be necessary in the future to enforce our intellectual property rights and to determine the validity and scope of the proprietary rights of others. Our efforts to enforce or protect our proprietary rights may be ineffective and could result in substantial costs and diversion of resources, which could harm our business and results of operations.
We may be unable to continue to use the domain names that we use in our business, or prevent third parties from acquiring and using domain names that infringe on, are similar to, or otherwise decrease the value of our brand or our trademarks or service marks.
We have registered domain names for our websites that we use in our business, most importantly seamless.com, grubhub.com, MenuPages.com and allmenus.com. If we lose the ability to use a domain name, whether due to trademark claims, failure to renew the applicable registration, or any other cause, we may be forced to market our products under a new domain name, which could cause us substantial harm, or to incur significant expense in order to purchase rights to the domain name in question. In addition, our competitors and others could attempt to capitalize on our brand recognition by using domain names similar to ours. Domain names similar to ours have been registered in the United States and elsewhere. We may be unable to prevent third parties from acquiring and using domain names that infringe on, are similar to, or otherwise decrease the value of our brand or our trademarks or service marks. Protecting and enforcing our rights in our domain names may require litigation, which could result in substantial costs and diversion of resources, which could in turn harm our business and results of operations.
Intellectual property infringement assertions by third parties could result in significant costs and harm our business, results of operations and reputation.
We operate in an industry with extensive intellectual property litigation. Other parties have asserted, and in the future may assert, that we have infringed their intellectual property rights. Such litigation may involve patent
23
Table of Contents
holding companies or other adverse patent owners who have no relevant product revenue, and therefore our own issued and pending patents may provide little or no deterrence. We could be required to pay substantial damages or cease using intellectual property or technology that is deemed infringing.
For example, we are currently a defendant to a patent infringement suit filed by Ameranth, Inc. in which we are alleged to infringe on patents relating to online ordering software. See the section titled “Business—Legal Proceedings” for a further discussion of this litigation. This litigation could cause us to incur significant expenses and costs. In addition, the outcome of any litigation is inherently unpredictable and, as a result of this litigation, we may be required to pay damages, an injunction may be entered against us, or a license or other right to continue to deliver an unmodified version of the service may not be made available to us at all or may require us to pay ongoing royalties and comply with unfavorable terms. Any of these outcomes could harm our business. Even if we were to prevail, this litigation could be costly and time-consuming, could divert the attention of our management and key personnel from our business operations, and may discourage restaurants and diners from using our products.
Furthermore, we cannot predict whether other assertions of third-party intellectual property rights or claims arising from such assertions will substantially harm our business and results of operations. The defense of these claims and any future infringement claims, whether they are with or without merit or are determined in our favor, may result in costly litigation and diversion of technical and management personnel. Furthermore, an adverse outcome of a dispute may require us to pay damages, potentially including treble damages and attorneys’ fees if we are found to have willfully infringed a party’s patent or copyright rights; cease making, licensing or using products that are alleged to incorporate the intellectual property of others; expend additional development resources to redesign our products; and enter into potentially unfavorable royalty or license agreements in order to obtain the right to use necessary technologies. Royalty or licensing agreements, if required, may be unavailable on terms acceptable to us, or at all. In any event, we may need to license intellectual property which would require us to pay royalties or make one-time payments. Even if these matters do not result in litigation or are resolved in our favor or without significant cash settlements, the time and resources necessary to resolve them could harm our business, results of operations and reputation.
Some of our products contain open source software, which may pose particular risks to our proprietary software and products.
We use open source software in our products and will use open source software in the future. From time to time, we may face claims from third parties claiming ownership of, or demanding release of, the open source software and/or derivative works that we developed using such software (which could include our proprietary source code), or otherwise seeking to enforce the terms of the applicable open source license. These claims could result in litigation and could require us to purchase a costly license or cease offering the implicated products unless and until we can re-engineer them to avoid infringement. This re-engineering process could require significant additional research and development resources. In addition to risks related to license requirements, use of certain open source software can lead to greater risks than use of third-party commercial software, as open source licensors generally do not provide warranties or controls on the origin of software. Any of these risks could be difficult to eliminate or manage, and, if not addressed, could harm our business and results of operations.
We may require additional capital to support business growth, and this capital might not be available on acceptable terms, if at all.
We intend to continue to make investments to support our business growth and may require additional funds to respond to business challenges, including the need to develop new features and products or enhance our existing products, improve our operating infrastructure or acquire complementary businesses and technologies. Accordingly, we may need to engage in equity or debt financings to secure additional funds. If we raise additional funds through future issuances of equity or convertible debt securities, our existing stockholders could
24
Table of Contents
suffer significant dilution, and any new equity securities we issue could have rights, preferences and privileges superior to those of holders of our common stock. Any debt financing that we secure in the future could involve restrictive covenants relating to our capital raising activities and other financial and operational matters, which may make it more difficult for us to obtain additional capital and to pursue business opportunities, including potential acquisitions. We may not be able to obtain additional financing on terms favorable to us, if at all. If we are unable to obtain adequate financing or financing on terms satisfactory to us when we require it, our ability to continue to support our business growth and to respond to business challenges could be impaired, and our business may be harmed.
Our business and results of operations may be harmed if we are deemed responsible for the collection and remittance of state sales taxes for our restaurants.
If we are deemed an agent for the restaurants in our network under state tax law, we may be deemed responsible for collecting and remitting sales taxes directly to certain states. It is possible that one or more states could seek to impose sales, use or other tax collection obligations on us with regard to such food sales. These taxes may be applicable to past sales. A successful assertion that we should be collecting additional sales, use or other taxes or remitting such taxes directly to states could result in substantial tax liabilities for past sales and additional administrative expenses, which would harm our business and results of operations.
As a public company, we incur significant costs to comply with the laws and regulations affecting public companies which could harm our business and results of operations.
As a public company, we are subject to the reporting requirements of the Exchange Act, the Sarbanes-Oxley Act of 2002 (the “Sarbanes-Oxley Act”), the Dodd-Frank Wall Street Reform and Consumer Protection Act (the “Dodd-Frank Act”) and the listing requirements of the NYSE, and other applicable securities rules and regulations. These rules and regulations have increased and will continue to increase our legal, accounting and financial compliance costs and have made and will continue to make some activities more time consuming and costly, particularly after we cease to be an “emerging growth company” as defined in the JOBS Act. For example, these rules and regulations could make it more difficult and more costly for us to obtain director and officer liability insurance, and we may be required to accept reduced policy limits and coverage or to incur substantial costs to maintain the same or similar coverage. These rules and regulations could also make it more difficult for us to attract and retain qualified persons to serve on our board of directors or our board committees or as executive officers. Our management and other personnel devote a substantial amount of time to these compliance initiatives. As a result, management’s attention may be diverted from other business concerns, which could harm our business and operating results. Although we have hired additional employees to comply with these requirements, we may need to hire more employees in the future, which will increase our costs and expenses.
Our management team, including our CEO, has limited experience in managing publicly traded companies. Our management team and other personnel devote a substantial amount of time to new compliance initiatives and we may not successfully or efficiently manage our transition to a public company. To comply with the requirements of being a public company, including the Sarbanes-Oxley Act, we may need to undertake various actions, such as implementing new internal controls and procedures and hiring accounting or internal audit staff, which would require us to incur additional expenses and harm our results of operations.
Risks Related to Ownership of Our Common Stock and this Offering
A significant portion of our common stock is held by our existing executive officers, directors and their affiliates, whose interests may differ from yours.
Upon completion of this offering, our current executive officers, directors and holders of 5% or more of our outstanding common stock will beneficially own, in the aggregate, approximately 38% of our outstanding shares of common stock. Some of these persons or entities may have interests that are different from yours. For
25
Table of Contents
example, these stockholders may support proposals and actions with which you may disagree or which are not in your interests or which adversely impact the value of your investment. These stockholders will be able to exercise a significant level of control over all matters requiring stockholder approval, including the election of directors, amendment of our certificate of incorporation and approval of significant corporate transactions. This control could have the effect of delaying or preventing a change of control in us or changes in management and could also make the approval of certain transactions difficult or impossible without the support of these stockholders, which in turn could reduce the price of our common stock.
The price of our common stock has been and may continue to be volatile, and you could lose all or part of your investment.
Prior to our IPO in April 2014, there had been no public market for our common stock. Shares of our common stock were sold in our IPO in April 2014 at a price of $26.00 per share, and our common stock has subsequently traded as high as $45.80. An active, liquid and orderly market for our common stock may not be sustained, which could depress the trading price of our common stock. The trading price of our common stock has been and may continue to be subject to wide fluctuations in response to various factors, some of which are beyond our control. These fluctuations could cause you to lose all or part of your investment in our common stock since you might be unable to sell your shares at or above the price you paid in this offering. In addition to the factors discussed in this “Risk Factors” section and elsewhere in this prospectus, factors that could cause fluctuations in the trading price of our common stock include the following:
| • | price and volume fluctuations in the overall stock market from time to time; |
| • | volatility in the market prices and trading volumes of technology stocks, particularly Internet stocks; |
| • | changes in operating performance and stock market valuations of other technology companies generally, or those in our industry in particular; |
| • | sales of shares of our common stock by us or our stockholders; |
| • | failure of securities analysts to maintain coverage of us, changes in financial estimates by any securities analysts who follow our Company or our failure to meet these estimates or the expectations of investors; |
| • | the financial projections we may provide to the public, any changes in those projections or our failure to meet those projections; |
| • | announcements by us or our competitors of new products; |
| • | the public’s reaction to our press releases, other public announcements and filings with the Securities and Exchange Commission (the “SEC”); |
| • | rumors and market speculation involving us or other companies in our industry; |
| • | actual or anticipated changes in our results of operations or fluctuations in our results of operations; |
| • | actual or anticipated developments in our business, our competitors’ businesses or the competitive landscape generally; |
| • | litigation involving us, our industry or both, or investigations by regulators into our operations or those of our competitors; |
| • | developments or disputes concerning our intellectual property or other proprietary rights; |
| • | announced or completed acquisitions of businesses or technologies by us or our competitors; |
| • | new laws or regulations or new interpretations of existing laws or regulations applicable to our business; |
| • | changes in accounting standards, policies, guidelines, interpretations or principles; |
| • | any significant change in our management; and |
| • | general economic conditions and slow or negative growth of our markets. |
26
Table of Contents
Price and volume fluctuations may be even more pronounced in the trading market for our stock for a period of time following this offering. Securities class action litigation has often been instituted against companies following periods of volatility in the overall market and in the market price of a company’s securities. Such litigation, if instituted against us, could result in substantial costs, divert our management’s attention and resources and harm our business and results of operations.
Our stock price could decline due to the large number of outstanding shares of our common stock eligible for future sale or subject to rights requiring us to register them for public sale.
The market price of our common stock could decline as a result of sales of a large number of shares of our common stock in the market after this offering, and the perception that these sales could occur may also depress the market price of our common stock. Based on shares outstanding as of August 25, 2014, upon the completion of this offering, we will have 80,081,644 shares of our common stock outstanding, assuming no exercise of outstanding options or warrants other than those options or warrants exercised by the selling stockholders for the purpose of selling shares in this offering. Of these shares, the shares of common stock sold in our IPO and the shares of common stock sold in this offering will be freely tradable in the United States, except for any shares purchased by our “affiliates” as defined in Rule 144 under the Securities Act. The holders of 26,161,853 shares of our outstanding common stock have entered into lock-up agreements in connection with this offering under which they have agreed not to dispose of or hedge any of their shares of common stock, subject to specified exceptions, without the prior written consent of Citibank Global Markets Inc., for a period of 90 days after the date of this prospectus. In addition, in connection with our IPO, the holders of 69,869,330 shares of outstanding common stock agreed, subject to certain exceptions, not to dispose of or hedge any of their shares of common stock during the 180-day period following our IPO, which period is scheduled to expire on September 30, 2014, unless earlier waived by Citigroup Global Markets Inc. and Morgan Stanley & Co. LLC. After the expiration of the 90-day restricted period (in connection with this offering), and the 180-day restricted period (in connection with the IPO), these shares may be sold in the public market in the United States, subject to prior registration in the United States, if required, or reliance upon an exemption from United States registration, including, in the case of shares held by affiliates or control persons, compliance with the volume and other restrictions of Rule 144 and Rule 701 of the Securities Act.
In addition, as of August 25, 2014, stockholders owning an aggregate of 67,022,269 shares have rights, subject to certain conditions, under contracts providing for registration rights to require us to register shares of our common stock owned by them for public sale in the United States. In addition, as of August 25, 2014, options to purchase a total of 8,124,370 shares of common stock pursuant to our 2013 Omnibus Incentive Plan were outstanding, of which options to purchase 3,747,555 shares were exercisable. On July 18, 2014, we filed a registration statement on Form S-8 to register the approximately 10,351,283 shares of common stock subject to options outstanding or reserved for future issuance under our 2013 Omnibus Incentive Plan. Pursuant to that registration statement, subject to Rule 144 limitations applicable to affiliates, the satisfaction of applicable exercise periods and, in certain cases, lock-up agreements with the representatives of the underwriters referred to above, the shares of common stock issued upon exercise of outstanding options will be available for immediate resale in the United States in the open market.
Sales of our common stock as restrictions end or pursuant to registration rights may make it more difficult for us to sell equity securities in the future at a time and at a price that we deem appropriate. These sales also could cause our stock price to fall and make it more difficult for you to sell shares of our common stock. For more information on the registration rights, see “Certain Relationships and Related Party Transactions—Registration Rights Agreement.”
We are an “emerging growth company” and we cannot be certain if the reduced disclosure requirements applicable to “emerging growth companies” will make our common stock less attractive to investors.
We are an “emerging growth company” and we may take advantage of certain exemptions from various reporting requirements that are applicable to other public companies that are not “emerging growth companies.”
27
Table of Contents
We could remain an “emerging growth company” for up to five years following the completion of our IPO (which occurred on April 4, 2014) or until (i) we achieve total annual gross revenues in excess of $1 billion during a fiscal year, (ii) become a “large accelerated filer” as defined in Rule 12b-2 under the Exchange Act, as a result of achieving a public float of at least $700 million as of the end of a second fiscal quarter or (iii) we issue more than $1 billion in nonconvertible debt during the preceding three year period. The exemptions include not being required to comply with the auditor attestation requirements of Section 404, reduced disclosure obligations regarding executive compensation in our registration statement, periodic reports and proxy statements, and exemptions from the requirements of holding a nonbinding advisory vote on executive compensation and stockholder approval of any golden parachute payments not previously approved.
While we will be required to disclose changes made in our internal control and procedures on a quarterly basis, if we choose not to comply with the auditor attestation requirements of Section 404, our auditors will not be required to attest to the effectiveness of our internal control over financial reporting until the later of the year following our first annual report required to be filed with the SEC or the date we are no longer an “emerging growth company.” We could be an “emerging growth company” for up to five years. As a result, investors may become less comfortable with the effectiveness of our internal control and the risk that material weaknesses or other deficiencies in our internal controls go undetected may increase.
If we choose to provide reduced disclosures in our periodic reports and proxy statements while we are an emerging growth company, investors would have access to less information and analysis about our executive compensation, which may make it difficult for investors to evaluate our executive compensation practices. We cannot predict if investors will find our common stock less attractive because we may rely on these exemptions and provide reduced disclosure. If some investors find our common stock less attractive as a result, there may be a less active trading market for our common stock and our stock price may be more volatile.
After we are no longer an “emerging growth company,” we will be obligated to develop and maintain proper and effective internal control over financial reporting. We may not complete our analysis of our internal control over financial reporting in a timely manner, or these internal controls may not be determined to be effective, which may harm investor confidence in our company and, as a result, the value of our common stock.
After we are no longer an “emerging growth company,” we will be required, pursuant to Section 404, to furnish a report by management on, among other things, the effectiveness of our internal control over financial reporting for the first fiscal year beginning after the effective date of our IPO. This assessment will need to include disclosure of any material weaknesses identified by our management in our internal control over financial reporting.
We are in the early stages of the costly and challenging process of compiling the system and processing documentation necessary to perform the evaluation needed to comply with Section 404. We may not be able to complete our evaluation, testing and any required remediation in a timely fashion. During the evaluation and testing process, if we identify one or more material weaknesses in our internal control over financial reporting, we will be unable to assert that our internal controls are effective. If we are unable to assert that our internal control over financial reporting is effective, investors could lose confidence in the accuracy and completeness of our financial reports, which would cause the price of our common stock to decline.
Our independent registered public accounting firm has advised us that it identified a material weakness in the internal control over financial reporting of Seamless Holdings, now known as GrubHub Inc., for the years ended December 31, 2011 and 2012. If our internal control over financial reporting or our disclosure controls and procedures are not effective, we may not be able to accurately report our financial results, prevent fraud or file our periodic reports in a timely manner, which may cause investors to lose confidence in our reported financial information and may lead to a decline in our stock price.
Our independent registered public accounting firm has not conducted an audit of Seamless Holdings’ (which is now known as GrubHub Inc.) internal control over financial reporting. However, in connection with its audit
28
Table of Contents
of Seamless Holdings’ consolidated financial statements as of and for the years ended December 31, 2011 and 2012 included elsewhere in this prospectus, our independent registered public accounting firm discovered a material weakness relating to the documentation of journal entry review of Seamless Holdings. A “material weakness” is a deficiency, or a combination of deficiencies, in internal control over financial reporting such that there is a reasonable possibility that a material misstatement of our annual or interim financial statements will not be prevented or detected on a timely basis. Specifically, Seamless Holdings had not regularly documented its review of journal entries.
Since discovery of this material weakness, we have taken steps to fully understand the material weakness and to remediate it. We have implemented a formal review of all manual journal entries, including documentation, as part of our monthly close process. Additionally, in connection with the Merger, we retained the chief financial officer and controller that served in those roles for the GrubHub Platform. By utilizing their existing accounting and finance expertise, we have built a more experienced accounting and finance organization. While we have remediated this material weakness for the period ended December 31, 2013, we may identify additional related or unrelated material weaknesses or significant deficiencies in the future. If our internal control over financial reporting or our disclosure controls and procedures are not effective, we may not be able to accurately report our financial results, prevent fraud or file our periodic reports in a timely manner, which may cause investors to lose confidence in our reported financial information and may lead to a decline in our stock price.
In addition, implementing any appropriate changes to our internal controls may distract our officers and employees, entail substantial costs to implement new processes and modify our existing processes and take significant time to complete. Moreover, any such changes do not guarantee that we will be effective in maintaining the adequacy of our internal controls, and any failure to maintain that adequacy, or consequent inability to produce accurate financial statements on a timely basis, could increase our operating costs and harm our business. Furthermore, investors’ perceptions that our internal controls are inadequate or that we are unable to produce accurate financial statements on a timely basis may harm our stock price.
Anti-takeover provisions contained in our certificate of incorporation and bylaws, as well as provisions of Delaware law, could impair a takeover attempt.
Our certificate of incorporation and bylaws contain and Delaware law contains provisions which could have the effect of rendering more difficult, delaying or preventing an acquisition deemed undesirable by our board of directors. Our corporate governance documents include provisions:
| • | creating a classified board of directors whose members serve staggered three-year terms; |
| • | authorizing “blank check” preferred stock, which could be issued by our board of directors without stockholder approval and may contain voting, liquidation, dividend and other rights superior to our common stock; |
| • | limiting the liability of, and providing indemnification to, our directors and officers; |
| • | limiting the ability of our stockholders to call and bring business before special meetings; |
| • | requiring advance notice of stockholder proposals for business to be conducted at meetings of our stockholders and for nominations of candidates for election to our board of directors; |
| • | controlling the procedures for the conduct and scheduling of board of directors and stockholder meetings; and |
| • | providing our board of directors with the express power to postpone previously scheduled annual meetings and to cancel previously scheduled special meetings. |
These provisions, alone or together, could delay or prevent hostile takeovers and changes in control or changes in our management.
29
Table of Contents
As a Delaware corporation, we are also subject to provisions of Delaware law, including Section 203 of the Delaware General Corporation law, which prevents some stockholders holding more than 15% of our outstanding common stock from engaging in certain business combinations without approval of the holders of substantially all of our outstanding common stock.
Any provision of our certificate of incorporation, bylaws or Delaware law that has the effect of delaying or deterring a change in control could limit the opportunity for our stockholders to receive a premium for their shares of our common stock, and could also affect the price that some investors are willing to pay for our common stock.
We may invest or spend the proceeds of this offering in ways with which you may not agree or in ways which may not yield a return or enhance the price of our common stock.
The net proceeds from the sale of our shares of common stock by us in this offering will be used for general corporate purposes. We may also use a portion of the net proceeds to acquire complementary businesses, products, services or technologies. However, we do not have any agreements or commitments for any acquisitions at this time. Our management will have considerable discretion in the application of the net proceeds, and you will not have the opportunity, as part of your investment decision, to assess whether the proceeds are being used appropriately. The net proceeds may be invested with a view towards long-term benefits for our stockholders and this may not increase our results of operations or market value. Until the net proceeds are used, they may be placed in investments that do not produce significant income or that may lose value.
If securities or industry analysts issue an adverse or misleading opinion regarding our common stock or do not publish or cease publishing research or reports about us, our business or our market, or if they change their recommendations regarding our common stock adversely, our stock price and trading volume could decline.
The trading market for our common stock will be influenced, to some extent, by the research and reports that industry or securities analysts may publish about us, our business, our market or our competitors. We do not control these analysts or the content and opinions included in their reports. If any of the analysts who cover us change their recommendation regarding our common stock adversely, or provide more favorable relative recommendations about our competitors, our stock price would likely decline. If any analyst who covers us were to cease coverage of our Company or fail to publish reports on us regularly or if analysts elect not to provide research coverage of our common stock, we could lose visibility in the financial markets, which in turn could cause our stock price or trading volume to decline.
We do not expect to declare any dividends in the foreseeable future.
We do not anticipate declaring any cash dividends to holders of our common stock in the foreseeable future. Consequently, investors may need to rely on sales of their common stock after price appreciation, which may never occur, as the only way to realize any future gains on their investment. Investors seeking cash dividends should not purchase our common stock.
30
Table of Contents
SPECIAL NOTE REGARDING FORWARD-LOOKING STATEMENTS
In addition to historical information about the Company, we also make statements in this prospectus containing “forward-looking statements” within the meaning of the federal securities laws. Forward-looking statements involve substantial risks, known or unknown, and uncertainties that may cause actual results to differ materially from future results or outcomes expressed or implied by such forward-looking statements. Forward-looking statements generally relate to future events or our future financial or operating performance. In some cases, you can identify forward-looking statements because they contain words such as “anticipates,” “believes,” “contemplates,” “continue,” “could,” “estimates,” “expects,” “intends,” “may,” “plans,” “potential,” “predicts,” “projects,” “should,” “target” or “will” or the negative of these words or other similar terms or expressions that concern our expectations, strategy, plans or intentions. We cannot guarantee that any forward-looking statement will be realized. The following important factors, in addition to those discussed elsewhere in this prospectus, could affect our future results and could cause those results or other outcomes to differ materially from those expressed or implied in such forward-looking statements:
| • | our future financial performance, including our revenue, costs and expenses, our ability to generate positive cash flow and our ability to achieve and maintain profitability; |
| • | the sufficiency of our cash and cash equivalents to meet our liquidity needs; |
| • | our ability to effectively manage our integration after the Merger; |
| • | our ability to attract and retain restaurants in a cost-effective manner to use our platform; |
| • | our ability to increase the number of and retain existing diners using our websites and mobile applications and their level of engagement; |
| • | our ability to properly use and protect customer information and data; |
| • | our ability to strengthen our two-sided network; |
| • | the growth in the usage of our mobile applications and our ability to continue to successfully monetize this usage; |
| • | our ability to innovate and provide a superior experience to restaurants and diners; |
| • | our ability to successfully expand in our existing markets and into new markets; |
| • | our ability to effectively manage our growth and future expenses; |
| • | our ability to maintain, protect and enhance our intellectual property; |
| • | the impact of worldwide economic conditions, including the resulting effect on diner spending on takeout; |
| • | the impact of weather, natural or man-made catastrophic events on our business; |
| • | interruptions in service and any related impact on our business, reputation or brand; |
| • | the seasonality of our business, including the effect of academic calendars and college campuses and seasonal patterns in restaurant dining; |
| • | the effects of increased competition on our business; |
| • | costs associated with defending claims, including intellectual property, infringement claims and related judgments and settlements; |
| • | our ability to comply with new legislation and governmental regulations applicable to our business; and |
| • | the attraction and retention of qualified employees and key personnel. |
While we believe that our assumptions are reasonable, we caution that it is very difficult to predict the impact of known factors, and it is impossible for us to anticipate all factors that could affect our actual results.
31
Table of Contents
Important factors that could cause actual results to differ materially from our expectations, or cautionary statements, are disclosed under “Risk Factors” and “Management’s Discussion and Analysis of Financial Condition and Results of Operations” in this prospectus. All forward-looking statements are expressly qualified in their entirety by these cautionary statements. You should evaluate all forward-looking statements made in this prospectus in the context of these risks and uncertainties.
We caution you that the factors referenced above may not contain all of the factors that are important to you. In addition, we cannot assure you that we will realize the results or developments we expect or anticipate or, even if substantially realized, that they will result in the consequences we anticipate or affect us or our operations in the way we expect. The forward-looking statements included in this prospectus are made only as of the date hereof. We undertake no obligation to publicly update or revise any forward-looking statement as a result of new information, future events or otherwise, except as otherwise required by law. If we do update one or more forward-looking statements, no inference should be made that we will make additional updates with respect to those or other forward-looking statements.
32
Table of Contents
Unless otherwise stated or the context requires otherwise, (i) when we refer to the “Seamless Platform,” we refer to the operations for Seamless North America, LLC as of and for the year ended December 31, 2011 and from January 1, 2012 through October 28, 2012, the date when Aramark Corporation (“Aramark”) completed the spin-off of its interest in the Seamless business, and for Seamless Holdings Corporation, an entity formed for the purpose of completing the spin-off and whose assets primarily consist of Aramark’s former interest in the Seamless business and its subsidiaries (“Seamless Holdings”), beginning on October 29, 2012, (ii) when we refer to the “GrubHub Platform,” we refer to the operations of GrubHub Holdings Inc., formerly known as GrubHub, Inc. (“GrubHub Holdings”), and its subsidiaries and (iii) all share and per share data in this prospectus reflects the 1-for-2 reverse stock split of our issued and outstanding common stock and preferred stock (the “Reverse Stock Split”), which was effected on April 2, 2014. On August 8, 2013 (the “Merger Date”), we completed a merger of the GrubHub Platform and the Seamless Platform (the “Merger”). Through the Merger, we formed GrubHub Inc., formerly known as GrubHub Seamless Inc., which includes both the GrubHub Platform and the Seamless Platform.
Financial Information
Unless otherwise stated or the context requires otherwise, the historical financial information included throughout this prospectus reflects the historical financial condition and results of operations for the Seamless Platform as of and for the years ended December 31, 2011 and 2012 and the six months ended June 30, 2013. The results of operations for the year ended December 31, 2013 include the results of operations for the Seamless Platform alone from January 1, 2013 through the Merger Date and for both the GrubHub Platform and the Seamless Platform, as reflected in the financial statements of GrubHub Inc., after the Merger Date through December 31, 2013. The results of operations for the six months ended June 30, 2014 include the results of operations for GrubHub Inc., which includes both the GrubHub Platform and the Seamless Platform. The balance sheet data as of June 30, 2014 reflects the financial condition of GrubHub Inc.
Operating Metrics
Throughout this prospectus, we discuss key business metrics, including Active Diners, Daily Average Grubs and Gross Food Sales. Unless otherwise stated or the context requires otherwise, each of these metrics include results for the Seamless Platform alone prior to the Merger Date and for both the GrubHub Platform and the Seamless Platform, as GrubHub Inc., after the Merger Date. Our key business metrics are defined as follows:
| • | Active Diners. We count Active Diners as the number of unique diner accounts from which an order has been placed in the past twelve months through our platform. We began including Active Diners from the GrubHub Platform as of the Merger Date. Unless otherwise stated or the context requires otherwise, when we disclose the number of Active Diners as of December 31, 2013 and June 30, 2014, this includes the number of diner accounts from which an order has been placed in the twelve months prior to such dates through either the GrubHub Platform or the Seamless Platform. Some of our diners could have more than one account if they were to set up multiple accounts using a different e-mail address for each account. As a result, it is possible that our Active Diner metric may count certain diners more than once during any given period. |
| • | Daily Average Grubs. We count Daily Average Grubs as the number of revenue generating orders placed on our platform divided by the number of days for a given period. Unless otherwise stated or the context requires otherwise, when we disclose the Daily Average Grubs during the year ended December 31, 2013, this includes the sum of the number of revenue generating orders placed on the Seamless Platform between January 1, 2013 and August 8, 2013 and the number of revenue generating orders placed on both the GrubHub Platform and the Seamless Platform between August 9, 2013 and December 31, 2013, divided by the number of days in that period. Daily Average Grubs during the six months ended June 30, 2014, includes the number of revenue generating orders placed on the Seamless Platform and the GrubHub Platform, divided by the number of days in that period. |
33
Table of Contents
| • | Gross Food Sales. We calculate Gross Food Sales as the total value of food, beverages, taxes, prepaid gratuities, and any delivery fees processed through our platform. We include all revenue generating orders placed on our platform. Because we act as an agent of the merchant in the transaction, we recognize as revenues only our commissions from the transaction, which are a percentage of the total Gross Food Sales for such transaction. Unless otherwise stated or the context requires otherwise, when we disclose Gross Food Sales during the twelve months ended December 31, 2013 and the six months ended June 30, 2014, we include the total value of food, beverages, taxes, prepaid gratuities, and any delivery fees processed through the Seamless Platform from January 1, 2013 to August 8, 2013 and the total value of food, beverages, taxes, prepaid gratuities, and any delivery fees processed through both the GrubHub Platform and the Seamless Platform after August 9, 2013. |
References to Daily Average Grubs and Gross Food Sales as “combined” reflect the combined results for the GrubHub Platform and the Seamless Platform beginning on the first day of the period for which the operating metric is presented.
References herein to “diners” are to diners on our platform.
References to the number of restaurants on our platform include all restaurants that have an open contract with us (and exclude duplicate entries for restaurants on both the GrubHub Platform and the Seamless Platform), regardless of the restaurant’s level of activity on our platform.
34
Table of Contents
This prospectus also contains statistical data, estimates and forecasts that are based on independent industry publications, such as those published by Euromonitor, or other publicly available information, as well as other information based on our internal sources. The industry data presented in this prospectus related to the size of the U.S. independent restaurant market is based on data from the 2013 Euromonitor International report and our analysis of such data. References to independent restaurants included in this prospectus exclude chains with greater than ten outlets and street stalls, kiosks and self-service cafeterias. None of the independent industry publications referred to in this prospectus were prepared on our or on our affiliates’ behalf or at our expense. While we are not aware of any misstatements regarding any third-party information presented in this prospectus, Euromonitor International’s figures are based on official statistics, trade associations, trade press, company research, trade interviews and trade services, and as such have not been independently verified by Euromonitor International in each case.
35
Table of Contents
We expect to receive net proceeds from this offering of approximately $45.4 million, based upon an assumed public offering price of $38.44 per share, which is equal to the last reported sale price of our common stock on the NYSE on August 29, 2014, excluding any proceeds received by us in connection with the exercise of options or warrants to purchase shares of our common stock by the selling stockholders in connection with this offering and after deducting the estimated underwriting discounts and commissions and estimated offering expenses payable by us. We will not receive any proceeds from the sale of shares of common stock by the selling stockholders, including certain members of our board of directors and management. See “Principal and Selling Stockholders.”
We currently intend to use the net proceeds that we receive in connection with this offering, including any proceeds received in connection with the exercise of options or warrants to purchase shares of our common stock by the selling stockholders in connection with this offering, for general corporate purposes, which may include investments and acquisitions. We cannot specify with certainty the particular uses of the net proceeds that we will receive from this offering. Accordingly, we will have broad discretion in using these proceeds. Pending the use of proceeds from this offering as described above, we plan to invest the net proceeds that we receive in this offering in short-term and intermediate term interest-bearing obligations, investment-grade investments, certificates of deposit or direct or guaranteed obligations of the U.S. government.
36
Table of Contents
Our common stock began trading on the NYSE under the symbol “GRUB” on April 4, 2014. Before then, there was no public market for our common stock. The following table sets forth, for the periods indicated, the high and low sales prices of our common stock as reported by the NYSE:
| High | Low | |||||||
| Second Quarter (beginning April 4, 2014) |
$ | 40.80 | $ | 29.86 | ||||
| Third Quarter (through August 29, 2014) |
$ | 45.80 | $ | 30.62 | ||||
On August 29, 2014, the closing price as reported on the NYSE of our common stock was $38.44 per share. As of August 29, 2014, we had approximately 438 holders of record of our common stock. The number of holders of record is based upon the actual number of holders registered at such date and does not include holders of shares in “street name” or persons, partnerships, associates, corporations or other entities in security position listings maintained by depositories.
37
Table of Contents
We made dividend payments to our common and preferred stockholders in 2011, 2012, 2013 and 2014, but we currently intend to retain any future earnings and do not expect to pay any dividends in the foreseeable future. Any future determination to declare dividends will be made at the discretion of our board of directors, subject to applicable laws, and will depend on a number of factors, including our financial condition, results of operations, capital requirements, contractual restrictions, general business conditions and other factors that our board of directors may deem relevant.
38
Table of Contents
The following table sets forth our cash and cash equivalents and capitalization as of June 30, 2014 as follows:
| 1. | on an actual basis; and |
| 2. | on an as adjusted basis, giving effect to the sale and issuance by us of 1,250,000 shares of common stock in this offering, at an assumed public offering price of $38.44 per share, which is the last reported sale price of our common stock on the NYSE on August 29, 2014, after deducting estimated underwriting discounts and commissions and estimated offering expenses payable by us and excluding any proceeds received by us from the exercise of options or warrants to purchase our common stock by the selling stockholders in connection with this offering. |
You should read this table together with our financial statements and related notes, and the sections titled “Use of Proceeds” and “Selected Historical Consolidated Financial and Other Data” that are included elsewhere in this prospectus.
| As of June 30, 2014 | ||||||||
| Actual | As Adjusted | |||||||
| (in thousands, except share and per share data) | ||||||||
| Cash and cash equivalents |
$ | 207,096 | $ | 252,529 | ||||
|
|
|
|
|
|||||
| Stockholders’ equity: |
||||||||
| Common stock, par value $0.0001 per share: 500,000,000 shares authorized, 78,831,161 shares issued and outstanding, actual, 80,081,161 shares issued and outstanding, as adjusted |
8 | 8 | ||||||
| Accumulated other comprehensive income |
316 | 316 | ||||||
| Additional paid-in capital |
617,375 | 662,808 | ||||||
| Retained earnings |
63,605 | 63,605 | ||||||
|
|
|
|
|
|||||
| Total stockholders’ equity |
$ | 681,304 | $ | 726,737 | ||||
|
|
|
|
|
|||||
The outstanding share information set forth in the table above is as of June 30, 2014 and excludes the following:
| • | 8,119,867 shares of common stock issuable upon the exercise of options to purchase common stock that were outstanding as of June 30, 2014, with a weighted average exercise price of $6.44 per share; and |
| • | 1,439,129 shares of common stock reserved for future issuance under our 2013 Omnibus Incentive Plan as of June 30, 2014, and any future increase in shares reserved for issuance under such plan. |
39
Table of Contents
UNAUDITED PRO FORMA FINANCIAL INFORMATION
During the year ended December 31, 2013, we made the following acquisitions:
| • | on August 8, 2013, GrubHub Inc. acquired all of the equity interests of each of Seamless North America, LLC, Seamless Holdings and GrubHub Holdings, pursuant to the Reorganization and Contribution Agreement, dated as of May 19, 2013, by and among the Company, Seamless North America, LLC, Seamless Holdings, GrubHub Holdings and the other parties thereto. |
For purposes of the Unaudited Pro Forma Condensed Statement of Operations for the year ended December 31, 2013 and the six months ended June 30, 2013, we assumed that the Merger occurred on January 1, 2013. As a result, the Unaudited Pro Forma Condensed Statement of Operations was derived from:
| • | the audited historical statement of operations of Seamless Holdings (Acquirer) for the year ended December 31, 2013 and the six months ended June 30, 2013; and |
| • | the unaudited historical statement of operations of GrubHub Holdings (Acquiree) for the period January 1, 2013 to August 8, 2013 and the six months ended June 30, 2013. |
The Unaudited Pro Forma Condensed Statement of Operations is presented for illustration purposes only and does not necessarily indicate the results of operations that would have been achieved if the Merger had occurred at the beginning of period presented, nor is it indicative of future results of operations.
The Unaudited Pro Forma Condensed Statement of Operations should be read in conjunction with the Company’s historical financial statements and accompanying notes included in this prospectus.
GrubHub Inc. Basic and Diluted earnings per share:
Basic: The weighted average number of shares outstanding used to calculate basic earnings per share in the Unaudited Pro Forma Condensed Statement of Operations, after giving effect to the Reverse Stock Split, does not account for the automatic conversion of preferred stock into shares of common stock that occurred immediately prior to the closing of the IPO.
Diluted: Diluted net income per share attributable to common stockholders is computed by dividing net income by the weighted-average number of common shares outstanding during the period and potentially dilutive common stock equivalents, except in cases where the effect of the common stock equivalent would be antidilutive, after giving effect to the Reverse Stock Split. Potential common stock equivalents consist of common stock issuable upon exercise of stock options using the treasury stock method and common stock issuable upon conversion of our preferred stock.
Pro Forma Basic and Diluted earnings per share:
Basic: The weighted average number of shares outstanding used to calculate the pro forma basic earnings per share in the Unaudited Pro Forma Condensed Statement of Operations reflects the common stock issued at the time of the Merger as if the common stock had been issued as of the beginning of the year of acquisition after giving effect to the Reverse Stock Split, which was effected on April 2, 2014.
Diluted: Diluted net income per share attributable to common stockholders is computed by dividing net income by the weighted-average number of common shares outstanding during the period and potentially dilutive common stock equivalents, except in cases where the effect of the common stock equivalent would be antidilutive, after giving effect to the Reverse Stock Split. Potential common stock equivalents consist of common stock issuable upon exercise of stock options using the treasury stock method and common stock issuable upon conversion of our preferred stock.
40
Table of Contents
GrubHub Inc.
Unaudited Pro Forma Condensed Statement of Operations
For the Year Ended December 31, 2013
(in thousands, except per share data)
| GrubHub Inc. |
GrubHub Holdings from January 1, 2013 to August 8, 2013 |
Acquisition Adjustments (A) |
Acquisition Adjustments (B) |
Acquisition Adjustments (C) |
Acquisition Adjustments (D) |
Pro Forma | ||||||||||||||||||||||
| Revenues |
$ | 137,143 | $ | 32,943 | $ | — | $ | — | $ | — | $ | — | $ | 170,086 | ||||||||||||||
| Sales and marketing |
37,347 | 10,948 | — | 540 | — | — | 48,835 | |||||||||||||||||||||
| Operations and support |
34,173 | 11,466 | — | 491 | — | — | 46,130 | |||||||||||||||||||||
| Technology (exclusive of amortization) |
15,357 | 3,794 | — | 306 | — | — | 19,457 | |||||||||||||||||||||
| General and administrative |
21,907 | 10,495 | — | 1,660 | (9,131 | ) | — | 24,931 | ||||||||||||||||||||
| Depreciation and amortization |
13,470 | 1,536 | 6,475 | — | — | — | 21,481 | |||||||||||||||||||||
|
|
|
|
|
|
|
|
|
|
|
|
|
|
|
|||||||||||||||
| Total operating expenses |
122,254 | 38,239 | 6,475 | 2,997 | (9,131 | ) | — | 160,834 | ||||||||||||||||||||
| Income (loss) before provision for income taxes |
14,889 | (5,296 | ) | (6,475 | ) | (2,997 | ) | 9,131 | — | 9,252 | ||||||||||||||||||
| Provision (benefit) for income taxes |
8,142 | — | — | — | — | (3,050 | ) | 5,092 | ||||||||||||||||||||
|
|
|
|
|
|
|
|
|
|
|
|
|
|
|
|||||||||||||||
| Net income (loss) |
$ | 6,747 | $ | (5,296 | ) | $ | (6,475 | ) | $ | (2,997 | ) | $ | 9,131 | $ | 3,050 | $ | 4,160 | |||||||||||
| Preferred stock tax distributions |
(1,073 | ) | (1,073 | ) | ||||||||||||||||||||||||
|
|
|
|
|
|||||||||||||||||||||||||
| Net income attributable to common stockholders |
$ | 5,674 | $ | 3,087 | ||||||||||||||||||||||||
|
|
|
|
|
|||||||||||||||||||||||||
| Net income per share attributable to common stockholders: |
||||||||||||||||||||||||||||
| Basic |
$ | 0.14 | $ | 0.06 | ||||||||||||||||||||||||
| Diluted |
$ | 0.12 | $ | 0.06 | ||||||||||||||||||||||||
| Weighted average number of shares outstanding: |
||||||||||||||||||||||||||||
| Basic |
40,681 | 54,774 | ||||||||||||||||||||||||||
| Diluted |
56,645 | 75,634 | ||||||||||||||||||||||||||
41
Table of Contents
GrubHub Inc.
Unaudited Pro Forma Condensed Statement of Operations
For the Six Months Ended June 30, 2013
(in thousands, except per share data)
| GrubHub Inc. |
GrubHub Holdings for the Six Months Ended June 30, 2013 |
Acquisition Adjustments (A) |
Acquisition Adjustments (B) |
Acquisition Adjustments (C) |
Acquisition Adjustments (D) |
Pro Forma | ||||||||||||||||||||||
| Revenues |
$ | 52,658 | $ | 27,369 | $ | — | $ | — | $ | — | $ | — | $ | 80,027 | ||||||||||||||
| Sales and marketing |
16,164 | 9,350 | — | 437 | — | — | 25,951 | |||||||||||||||||||||
| Operations and support |
11,975 | 9,535 | — | 394 | — | — | 21,904 | |||||||||||||||||||||
| Technology (exclusive of amortization) |
5,344 | 3,164 | — | 246 | — | — | 8,754 | |||||||||||||||||||||
| General and administrative |
8,712 | 8,763 | — | 1,347 | (7,430 | ) | — | 11,392 | ||||||||||||||||||||
| Depreciation and amortization |
3,673 | 1,302 | 5,334 | — | — | — | 10,309 | |||||||||||||||||||||
|
|
|
|
|
|
|
|
|
|
|
|
|
|
|
|||||||||||||||
| Total operating expenses |
45,868 | 32,114 | 5,334 | 2,424 | (7,430 | ) | — | 78,310 | ||||||||||||||||||||
| Income (loss) before provision for income taxes |
6,790 | (4,745 | ) | (5,334 | ) | (2,424 | ) | 7,430 | — | 1,717 | ||||||||||||||||||
| Provision (benefit) for income taxes |
3,711 | — | — | — | — | (2,767 | ) | 944 | ||||||||||||||||||||
|
|
|
|
|
|
|
|
|
|
|
|
|
|
|
|||||||||||||||
| Net income (loss) |
$ | 3,079 | $ | (4,745 | ) | $ | (5,334 | ) | $ | (2,424 | ) | $ | 7,430 | $ | 2,767 | $ | 773 | |||||||||||
| Preferred stock tax distributions |
(648 | ) | (648 | ) | ||||||||||||||||||||||||
|
|
|
|
|
|||||||||||||||||||||||||
| Net income attributable to common stockholders |
$ | 2,431 | $ | 125 | ||||||||||||||||||||||||
|
|
|
|
|
|||||||||||||||||||||||||
| Net income per share attributable to common stockholders: |
||||||||||||||||||||||||||||
| Basic |
$ | 0.08 | $ | 0.00 | ||||||||||||||||||||||||
| Diluted |
$ | 0.07 | $ | 0.01 | ||||||||||||||||||||||||
| Weighted average number of shares outstanding: |
||||||||||||||||||||||||||||
| Basic |
31,368 | 54,687 | ||||||||||||||||||||||||||
| Diluted |
43,356 | 74,773 | ||||||||||||||||||||||||||
42
Table of Contents
GrubHub Inc.
Notes to Unaudited Pro Forma Condensed Statement of Operations
(in thousands, except share data)
(A) Amortization
The pro forma adjustments reflects the additional amortization that would have been recognized on the intangible assets had the acquisitions occurred on January 1, 2013.
| Useful life | GrubHub Holdings Amortization | |||||||||||
| January 1, 2013 to August 8, 2013 |
Six Months Ended June 30, 2013 |
|||||||||||
| Developed technology |
3 years | $ | 1,038 | $ | 857 | |||||||
| Customer list |
16.4 years | 6,171 | 5,105 | |||||||||
|
|
|
|
|
|||||||||
| Total pro forma impact |
7,209 | 5,962 | ||||||||||
| Less amounts already recorded |
(734 | ) | (628 | ) | ||||||||
|
|
|
|
|
|||||||||
| Adjustment necessary |
$ | 6,475 | $ | 5,334 | ||||||||
|
|
|
|
|
|||||||||
(B) Replacement stock option awards
In connection with the Merger, we were required to replace the GrubHub Platform share based payment awards. The fair value of the replacement options for services performed after the Merger was recognized as compensation cost. The pro forma adjustments reflect an adjustment of $2,997 and $2,424 for the year ended December 31, 2013 and the six months ended June 30, 2013, respectively, had the Merger occurred on January 1, 2013.
(C) Transaction costs
The pro forma adjustment reflects the elimination of the transaction costs incurred in connection with the Merger of $9,131 and $7,430 for the year ended December 31, 2013 and the six months ended June 30, 2013, respectively, including $4,667 and $3,343 of transaction costs at GrubHub Inc. for the year ended December 31, 2013 and the six months ended June 30, 2013, respectively, and $4,464 and $4,087 of transaction costs at GrubHub Holdings year ended December 31, 2013 and the six months ended June 30, 2013, respectively.
(D) Income taxes
The $3,050 and $2,767 pro forma adjustments reflect the estimated income tax benefit that would have been recognized for the year ended December 31, 2013 and the six months ended June 30, 2013, respectively, had the acquisition occurred on January 1, 2013. The pro forma tax benefit was determined by using the Company’s historical effective tax rate.
43
Table of Contents
SELECTED HISTORICAL CONSOLIDATED FINANCIAL AND OTHER DATA
The following selected historical consolidated financial and other data is derived from our consolidated financial statements included elsewhere in this prospectus. The consolidated financial statements included elsewhere in this prospectus reflect the results of operations and financial condition of (i) the Seamless Platform as of and for the years ended December 31, 2011 and 2012 (ii) the Seamless Platform from January 1, 2013 through the Merger Date and for both the Seamless Platform and the GrubHub Platform after the Merger Date and (iii) GrubHub Inc. as of December 31, 2013 and June 30, 2014. The share and per share amounts for all periods reflect the completion of the Reverse Stock Split, which was effected on April 2, 2014. The audited consolidated financial statements reflect, in the opinion of management, all adjustments of a normal, recurring nature that are necessary for the fair presentation of the financial statements. You should read the selected financial data below in conjunction with the section titled “Management’s Discussion and Analysis of Financial Condition and Results of Operations” and our consolidated financial statements and related notes included elsewhere in this prospectus.
| Year Ended December 31, | Six Months Ended June 30, |
|||||||||||||||||||
| (in thousands, except per share data) | 2011 | 2012 | 2013(1) | 2013(1) | 2014(2) | |||||||||||||||
| (unaudited) | ||||||||||||||||||||
| Statement of Operations Data: |
||||||||||||||||||||
| Revenues |
$ | 60,611 | $ | 82,299 | $ | 137,143 | $ | 52,658 | $ | 118,619 | ||||||||||
| Costs and expenses: |
||||||||||||||||||||
| Sales and marketing |
17,198 | 26,892 | 37,347 | 16,164 | 32,285 | |||||||||||||||
| Operations and support |
13,961 | 18,165 | 34,173 | 11,975 | 29,841 | |||||||||||||||
| Technology (exclusive of amortization) |
5,651 | 10,172 | 15,357 | 5,344 | 11,413 | |||||||||||||||
| General and administrative |
9,777 | 12,249 | 21,907 | 8,712 | 16,944 | |||||||||||||||
| Depreciation and amortization |
4,033 | 6,089 | 13,470 | 3,673 | 11,130 | |||||||||||||||
|
|
|
|
|
|
|
|
|
|
|
|||||||||||
| Total costs and expenses |
50,620 | 73,567 | 122,254 | 45,868 | 101,613 | |||||||||||||||
|
|
|
|
|
|
|
|
|
|
|
|||||||||||
| Income before provision for income taxes |
9,991 | 8,732 | 14,889 | 6,790 | 17,006 | |||||||||||||||
| Provision (Benefit) for income taxes |
(5,220 | ) | 813 | 8,142 | 3,711 | 9,961 | ||||||||||||||
|
|
|
|
|
|
|
|
|
|
|
|||||||||||
| Net income |
15,211 | 7,919 | 6,747 | 3,079 | 7,045 | |||||||||||||||
| Preferred stock tax distributions |
(334 | ) | (402 | ) | (1,073 | ) | (648 | ) | (320 | ) | ||||||||||
|
|
|
|
|
|
|
|
|
|
|
|||||||||||
| Net income attributable to common stockholders |
$ | 14,877 | $ | 7,517 | $ | 5,674 | $ | 2,431 | $ | 6,725 | ||||||||||
|
|
|
|
|
|
|
|
|
|
|
|||||||||||
| Net income per share attributable to common stockholders: |
||||||||||||||||||||
| Basic |
$ | 0.48 | $ | 0.24 | $ | 0.14 | $ | 0.08 | $ | 0.10 | ||||||||||
|
|
|
|
|
|
|
|
|
|
|
|||||||||||
| Diluted |
$ | 0.36 | $ | 0.19 | $ | 0.12 | $ | 0.07 | $ | 0.09 | ||||||||||
|
|
|
|
|
|
|
|
|
|
|
|||||||||||
| Weighted average shares used to compute net income per share attributable to common stockholders: |
||||||||||||||||||||
| Basic |
31,320 | 31,320 | 40,681 | 31,368 | 66,626 | |||||||||||||||
|
|
|
|
|
|
|
|
|
|
|
|||||||||||
| Diluted |
42,505 | 42,666 | 56,645 | 43,356 | 79,854 | |||||||||||||||
|
|
|
|
|
|
|
|
|
|
|
|||||||||||
| Pro forma net income per share attributable to common stockholders (unaudited)(3): |
||||||||||||||||||||
| Basic |
$ | 0.14 | $ | 0.12 | $ | 0.06 | ||||||||||||||
|
|
|
|
|
|
|
|||||||||||||||
| Diluted |
$ | 0.14 | $ | 0.12 | $ | 0.07 | ||||||||||||||
|
|
|
|
|
|
|
|||||||||||||||
| Weighted average shares used to compute pro forma net income per share attributable to common stockholders (unaudited)(3): |
||||||||||||||||||||
| Basic |
42,505 | 55,071 | 42,554 | |||||||||||||||||
|
|
|
|
|
|
|
|||||||||||||||
| Diluted |
42,666 | 56,645 | 43,356 | |||||||||||||||||
|
|
|
|
|
|
|
|||||||||||||||
| Other Financial Information: |
||||||||||||||||||||
| Adjusted EBITDA(4) |
$ | 14,827 | $ | 17,185 | $ | 38,134 | $ | 15,044 | $ | 33,315 | ||||||||||
| Cash Flows Data: |
||||||||||||||||||||
| Net cash provided by operating activities |
$ | 32,094 | $ | 29,578 | $ | 40,819 | $ | 19,415 | $ | 30,285 | ||||||||||
| Net cash provided by (used in) investing activities |
(36,949 | ) | 10,303 | 6,245 | (4,604 | ) | (3,490 | ) | ||||||||||||
| Net cash provided by (used in) financing activities |
7,321 | (2,218 | ) | (1,842 | ) | (1,806 | ) | 93,575 | ||||||||||||
| Preferred stock tax distributions |
(16,690 | ) | (1,588 | ) | (1,893 | ) | (651 | ) | (320 | ) | ||||||||||
44
Table of Contents
| (1) | Includes results for Seamless Platform through the Merger, and of GrubHub Inc., for the remainder of the period presented. |
| (2) | Includes the results of GrubHub Inc. |
| (3) | Pro forma net income per share attributable to common stockholders has been calculated assuming the conversion of all outstanding shares of our convertible preferred stock into shares of our common stock, as though the conversion had occurred as of the beginning of 2011 or the original date of issue, if later. |
| (4) | See the section titled “Non-GAAP Financial Measures” below for more information and for a reconciliation of Adjusted EBITDA to net loss, the most directly comparable financial measure calculated and presented in accordance with GAAP. |
| As of December 31, | As of June 30, 2014 | |||||||||||||||
| 2011 | 2012 | 2013 | Actual | |||||||||||||
| (in thousands) | (unaudited) | |||||||||||||||
| Balance Sheet Data: |
||||||||||||||||
| Cash and cash equivalents |
$ | 3,383 | $ | 41,161 | $ | 86,542 | $ | 207,096 | ||||||||
| Property and equipment, net |
11,233 | 13,341 | 17,096 | 16,529 | ||||||||||||
| Working capital |
(11,905 | ) | 3,837 | 29,568 | 149,130 | |||||||||||
| Total assets |
184,940 | 206,255 | 762,812 | 885,898 | ||||||||||||
| Convertible Preferred Stock |
1 | 1 | 2 | — | ||||||||||||
| Total stockholders’ equity |
131,971 | 137,888 | 557,375 | 681,304 | ||||||||||||
Key Business Metrics
To analyze our business performance, determine financial forecasts and help develop long-term strategic plans, we review the following key business metrics:
| Year Ended December 31, | Six Months Ended June 30, | |||||||||||||||||||
| 2011 | 2012 | 2013 | 2013 | 2014 | ||||||||||||||||
| (unaudited) | ||||||||||||||||||||
| Active Diners(1) |
689,000 | 986,000 | 3,421,000 | 1,171,000 | 4,192,000 | |||||||||||||||
| Daily Average Grubs(2) |
45,700 | 62,000 | 107,900 | 83,200 | 177,800 | |||||||||||||||
| Gross Food Sales (in millions)(3) |
$ | 412.2 | $ | 568.8 | $ | 1,014.9 | $ | 381.4 | $ | 855.6 | ||||||||||
| (1) | We count Active Diners as the number of unique diner accounts from which an order has been placed in the past twelve months through our platform. We began including Active Diners from the GrubHub Platform as of the Merger Date. |
| (2) | We count Daily Average Grubs as the number of revenue generating orders placed on our platform divided by the number of days for a given period. |
| (3) | We calculate Gross Food Sales as the total value of food, beverages, taxes, prepaid gratuities, and any delivery fees processed through our platform. We include all revenue generating orders placed on our platform. Because we act as an agent of the merchant in the transaction, we recognize as revenues only our commissions from the transaction, which are a percentage of the total Gross Food Sales for such transaction. |
Non-GAAP Financial Measures
Adjusted EBITDA is a financial measure that is not calculated in accordance with GAAP. We define Adjusted EBITDA as net income adjusted to exclude merger and restructuring costs, incomes taxes, depreciation and amortization and stock-based compensation expense. Below, we have provided a reconciliation of Adjusted EBITDA to our net income, the most directly comparable financial measure calculated and presented in accordance with GAAP. Adjusted EBITDA should not be considered as an alternative to net income or any other
45
Table of Contents
measure of financial performance calculated and presented in accordance with GAAP. Our Adjusted EBITDA may not be comparable to similarly titled measures of other organizations because other organizations may not calculate Adjusted EBITDA in the same manner as we calculate the measure.
We include Adjusted EBITDA in this prospectus because it is an important measure upon which our management assesses our operating performance. We use Adjusted EBITDA as a key performance measure because we believe it facilitates operating performance comparisons from period to period by excluding potential differences primarily caused by variations in capital structures, tax positions, the impact of acquisitions and restructuring, the impact of depreciation and amortization expense on our fixed assets and the impact of stock-based compensation expense. Because Adjusted EBITDA facilitates internal comparisons of our historical operating performance on a more consistent basis, we also use Adjusted EBITDA for business planning purposes and in evaluating acquisition opportunities. In addition, we believe Adjusted EBITDA and similar measures are widely used by investors, securities analysts, ratings agencies and other parties in evaluating companies in our industry as a measure of financial performance and debt-service capabilities.
Our use of Adjusted EBITDA has limitations as an analytical tool, and you should not consider it in isolation or as a substitute for analysis of our results as reported under GAAP. Some of these limitations are:
| • | Adjusted EBITDA does not reflect our cash expenditures for capital equipment or other contractual commitments; |
| • | although depreciation and amortization are non-cash charges, the assets being depreciated and amortized may have to be replaced in the future, and Adjusted EBITDA does not reflect capital expenditure requirements for such replacements; |
| • | Adjusted EBITDA does not reflect changes in, or cash requirements for, our working capital needs; and |
| • | other companies, including companies in our industry, may calculate Adjusted EBITDA measures differently, which reduces their usefulness as comparative measures. |
In evaluating Adjusted EBITDA, you should be aware that in the future we will incur expenses similar to some of the adjustments in this presentation. Our presentation of Adjusted EBITDA should not be construed as an inference that our future results will be unaffected by these expenses or any unusual or non-recurring items. When evaluating our performance, you should consider Adjusted EBITDA alongside other financial performance measures, including our net income and other GAAP results.
The following table presents a reconciliation of Adjusted EBITDA to our net income, the most comparable GAAP measure, for each of the periods indicated:
| Year Ended December 31, | Six Months Ended June 30, | |||||||||||||||||||
| 2011 | 2012 | 2013(1) | 2013 | 2014(2) | ||||||||||||||||
| (in thousands) | (unaudited) | |||||||||||||||||||
| Reconciliation of Adjusted EBITDA: |
||||||||||||||||||||
| Net income |
$ | 15,211 | $ | 7,919 | $ | 6,747 | $ | 3,079 | $ | 7,045 | ||||||||||
| Income taxes(3) |
(5,220 | ) | 813 | 8,142 | 3,711 | 9,961 | ||||||||||||||
| Depreciation and amortization |
4,033 | 6,089 | 13,470 | 3,673 | 11,130 | |||||||||||||||
|
|
|
|
|
|
|
|
|
|
|
|||||||||||
| EBITDA |
14,024 | 14,821 | 28,359 | 10,463 | 28,136 | |||||||||||||||
| Merger and restructuring costs(4) |
— | — | 4,842 | 3,343 | 492 | |||||||||||||||
| Stock-based compensation |
803 | 2,364 | 4,933 | 1,238 | 4,687 | |||||||||||||||
|
|
|
|
|
|
|
|
|
|
|
|||||||||||
| Adjusted EBITDA |
$ | 14,827 | $ | 17,185 | $ | 38,134 | $ | 15,044 | $ | 33,315 | ||||||||||
|
|
|
|
|
|
|
|
|
|
|
|||||||||||
| (1) | Includes results for Seamless Platform through August 8, 2013, when we completed the Merger, and of GrubHub Inc., the combined company, for the remainder of the period presented. |
46
Table of Contents
| (2) | Includes the results of operation for GrubHub Inc. for the six months ended June 30, 2014. |
| (3) | The increase in income tax expense was primarily attributable to a reversal of deferred tax liability of $8.1 million in 2011 associated with the June 2011 sale of preferred stock to SLW Investors, LLC offset by 2011 income tax paid of $2.2 million, which represents the income tax expense from January 1, 2011 through May 31, 2011. For the period January 1, 2012 through October 27, 2012, the Company was a pass-through entity for income tax purposes. Immediately following the Merger Date, 100% of our taxable income is subject to income tax. |
| (4) | Merger and restructuring costs include transaction and integration-related costs, such as legal and accounting costs, associated with the Merger and restructuring initiatives. |
47
Table of Contents
MANAGEMENT’S DISCUSSION AND ANALYSIS OF FINANCIAL CONDITION AND
RESULTS OF OPERATIONS
The following discussion should be read in conjunction with the sections titled “Unaudited Pro Forma Financial Information” and “Selected Historical Consolidated Financial and Other Data,” and the financial statements and related notes thereto included elsewhere in this prospectus. Unless otherwise stated, the discussion below primarily reflects the historical condition and results of operations for (i) the Seamless Platform as of and for the years ended December 31, 2011 and 2012 and the six months ended June 30, 2013, (ii) the Seamless Platform from January 1, 2013 through the Merger Date and for both the GrubHub Platform and the Seamless Platform after the Merger Date and (iii) GrubHub Inc. as of December 31, 2013 and June 30, 2014. Additionally, unless otherwise stated, all results from the GrubHub Platform refer to the period after the Merger Date. The share and per share amounts for all periods reflect the completion of the Reverse Stock Split, which was effected on April 2, 2014. For purposes of the following discussion of the financial condition and results of operations only, the terms, “GrubHub,” “we,” “us,” “our,” “our platform” and the “Company” refer to the Seamless Platform prior to the Merger Date and the GrubHub Platform and Seamless Platform combined following the Merger Date.
This discussion contains forward-looking statements that primarily relate to GrubHub Inc., the combined company of the GrubHub Platform and the Seamless Platform, and involve risks and uncertainties. Our actual results could differ materially from those discussed below, which primarily reflect the results of the Seamless Platform. Factors that could cause or contribute to such differences include, but are not limited to, those identified below and those discussed in the section titled “Risk Factors” included elsewhere in this prospectus.
Overview
GrubHub is the leading online and mobile platform for restaurant pick-up and delivery orders, which we refer to as takeout. We processed more than 177,800 combined Daily Average Grubs on our platform during the six months ended June 30, 2014 and had approximately $855.6 million of combined Gross Food Sales on our platforms during the six months ended June 30, 2014. We connect local restaurants with hungry diners in more than 700 cities across the United States and are focused on transforming the takeout experience. For restaurants, GrubHub generates higher margin takeout orders at full menu prices. Our platform empowers diners with a “direct line” into the kitchen, avoiding the inefficiencies, inaccuracies and frustrations associated with paper menus and phone orders. We have a powerful two-sided network that creates additional value for both restaurants and diners as it grows.
Our target market is primarily independent restaurants. These independent restaurants, which account for 61% of all U.S. restaurants (according to Euromonitor), remain local, highly fragmented and are mostly owner-operated family businesses. According to Euromonitor, Americans spent $204 billion at these approximately 350,000 independent restaurants in 2012. Of that amount, we believe that Americans spent approximately $67 billion on takeout at these independent restaurants.
For restaurants, takeout enables them to grow their business without adding seating capacity or wait staff. Advertising for takeout, typically done through the distribution of menus to local households or advertisements in local publications, is often inefficient and requires upfront payment with no certainty of success. In contrast, we provide the restaurants on our platform with an efficient way to generate more takeout orders. We enable restaurants to access local diners at the moment when those diners are hungry and ready to purchase takeout. In addition, we do not charge the restaurants in our network any upfront or subscription fees, we do not require any discounts from their full price menus and we only get paid for the orders we generate for them, providing restaurants with a low-risk, high-return solution. We charge restaurants a per-order commission that is primarily percentage-based.
As our two-sided network of restaurants and diners has grown, many of our restaurants have chosen to pay higher rates to receive better exposure to more diners on our platform, and this has resulted in higher overall commission rates for us.
48
Table of Contents
For diners, the traditional takeout ordering process is often a frustrating experience—from using paper menus to communicating an order by phone to a busy restaurant employee. In contrast, ordering on GrubHub is enjoyable and a dramatic improvement over the “menu drawer.” We provide the 4.2 million Active Diners on our platform (as of June 30, 2014) with an easy-to-use, intuitive and personalized platform that helps them search for and discover local restaurants and then accurately and efficiently place an order from any Internet-connected device. We also provide diners with information and transparency about their orders and status and solve problems that may arise. In addition, we make re-ordering convenient by storing previous orders, preferences and payment information, helping us promote diner frequency and drive strong repeat business.
The proliferation of mobile devices over the past few years has significantly increased the value of our platform. With powerful, easy-to-use mobile applications for iPhone, iPad and Android, we enable diners to access GrubHub whenever and wherever they want takeout. All of the discovery and ordering capabilities that are available on our consumer websites are also available through our mobile applications. We monetize the orders placed through our mobile applications using the same rate as orders placed through our websites. Our mobile applications make ordering from GrubHub more accessible and personal, driving increased use of our platform by restaurants and diners. Orders placed on mobile devices increased from approximately 20% of our consumer orders in the quarter ended December 31, 2011 to approximately 48% of our consumer orders in the quarter ended June 30, 2014.
Our business has grown rapidly. During the six months ended June 30, 2014, we generated revenue of $118.6 million, representing a 125% increase from the same period in 2013. Our revenue growth has been driven primarily by the inclusion of results from the GrubHub Platform and increasing adoption of our platform by restaurants and diners, with 4.2 million Active Diners as of June 30, 2014. During the six months ended June 30, 2013, there were approximately 1.8 million Active Diners and 46,400 Daily Average Grubs on the GrubHub Platform that would have been included had the Merger been completed as of January 1, 2013. For the six months ended June 30, 2014, our net income was $7.0 million and our Adjusted EBITDA was $33.3 million. See “Summary—Summary Historical Consolidated Financial and Other Data” for a discussion and reconciliation of Adjusted EBITDA to net income.
Since the inception of the GrubHub Platform in 2004, the two-sided network has grown by achieving key milestones, including:
| • | in 2005, the GrubHub Platform started taking orders from diners in the Chicago metropolitan market; |
| • | in 2010 and 2011, the GrubHub Platform expanded by adding over 20 metropolitan markets; |
| • | in 2010, the GrubHub Platform launched its first fully functional iPhone application and, in June 2011, it launched its first fully functional Android application; and |
| • | in September 2011, the GrubHub Platform acquired Dotmenu, Inc. (“DotMenu”), which operated campusfood.com and allmenus.com; campusfood.com provided the GrubHub Platform with an online presence in over 70 additional college markets and allmenus.com provided it with an online menu directory that contained approximately 250,000 menus and gave it a valuable source of leads for both restaurants and diners. |
The Seamless Platform was founded in 1999 as a corporate online ordering solution for employee meals, billing and invoicing automation. The Seamless Platform has grown by achieving, among others, the following key milestones:
| • | in 1999, the Seamless Platform started taking orders from its corporate ordering program in New York City; |
| • | in 2003, the Seamless Platform expanded by adding two additional markets: Chicago and Washington, D.C.; |
| • | in 2005, the Seamless Platform started taking orders from consumers; |
| • | in 2006, the Seamless Platform was acquired by Aramark; |
49
Table of Contents
| • | in 2010, the Seamless Platform launched its first iPhone application and, in January 2011, it launched its first Android application; |
| • | in June 2011, Spectrum Equity (“Spectrum”) made a minority investment in the Seamless Platform, which resulted in the Seamless Platform placing a greater focus on its consumer business; |
| • | in February 2012, the Seamless Platform launched its first iPad application; and |
| • | in October 2012, Aramark completed its spin-off of the Seamless Platform as an independent company. |
We completed the Merger of the GrubHub Platform and the Seamless Platform on the Merger Date. The Merger has enabled us to expand our two-sided network, connecting customers in the geographies we serve with more restaurants. Through the combination of the GrubHub Platform and the Seamless Platform, we are able to eliminate duplicative marketing expenses and restaurant sales and take advantage of a complementary geographic footprint.
We generate revenues primarily when diners place an order on our platform. Restaurants pay us a commission, typically a percentage of the transaction on orders that are processed through our platform. Most of our restaurants can choose their level of commission rate, at or above our base rate, to affect their relative priority in our sorting algorithms, with restaurants paying higher commission rates generally appearing higher in the search order than restaurants paying lower commission rates. The Merger caused our overall average commission rate to decrease by less than one percent of Gross Food Sales. For most of our orders, diners use a credit card to pay us for their meal when the order is placed. For these transactions, we collect the total amount of the order from the diner and remit the net proceeds to the restaurant less our commission. We generally accumulate funds and remit the net proceeds to the restaurants on at least a monthly basis. We also deduct our commissions for other transactions that go through our platform, such as cash transactions for restaurants in our network, from the aggregate proceeds we receive.
We face several key challenges in continuing to grow our business and maintaining profitability. These challenges include that:
| • | our ability to realize the benefits of the Merger depends on the successful integration of the two platforms; |
| • | our long-term growth depends on our ability to continue to expand our network of restaurants and diners in a cost-effective manner; and |
| • | while our primary competition remains the traditional offline takeout ordering method, new and existing online competitors could emerge or gain traction in our primary markets. These competitors may have greater resources than we do and could impact our growth rates and ability to maintain profitability. |
Factors Affecting Our Performance
| • | The Size of Our Two-Sided Network. Our growth has come, and we expect it to continue to come, from our ability to successfully expand our two-sided network, which occurs through the growth of the number of restaurants and diners on our platform. We believe that increases in the number of restaurants will make our platform more attractive to diners and increases in the number of diners will make our platform more attractive to restaurants. Furthermore, the number of popular restaurants in each of our local markets is an important factor in making our platform more attractive to diners. |
| • | Seasonality. Our business follows diner behavior patterns that we have observed over time. In our metropolitan markets, we generally experience a relative increase in diner activity from September to April and a relative decrease in diner activity from May to August. In addition, we benefit from increased order volumes in our campus markets when school is in session and experience a decrease in order volumes when school is not in session during summer breaks and other vacation periods. |
| • | Weather. Diner activity can also be impacted by colder or more inclement weather, which typically increases order volumes, and warmer or sunny weather, which typically decreases order volumes. |
50
Table of Contents
| • | Merger. On the Merger Date, we successfully completed the Merger of the GrubHub Platform and the Seamless Platform. |
Key Business Metrics
To analyze our business performance, determine financial forecasts and help develop long-term strategic plans, we review the following key business metrics:
| • | Active Diners. We count Active Diners as the number of unique diner accounts from which an order has been placed in the past twelve months through our platform. We began including Active Diners from the GrubHub Platform as of the Merger Date. Diner accounts from which an order has been placed on one of our websites or one of our mobile applications are included in our Active Diner metrics. Active Diners is an important metric for us because the number of diners using our platform is a key revenue driver and a valuable measure of the size of our engaged diner community. Some of our diners could have more than one account if they were to set up multiple accounts using a different e-mail address for each account. As a result, it is possible that our Active Diners metric may count certain diners more than once during any given period. |
| • | Daily Average Grubs. We count Daily Average Grubs as the number of revenue generating orders placed on our platform divided by the number of days for a given period. Daily Average Grubs is an important metric for us because the number of orders processed on our platform is a key revenue driver and, in conjunction with the number of Active Diners, a valuable measure of diner activity on our platform for a given period. |
| • | Gross Food Sales. We calculate Gross Food Sales as the total value of food, beverages, taxes, prepaid gratuities, and any delivery fees processed through our platform. We include all revenue generating orders placed on our platform. Gross Food Sales is an important metric for us because the total volume of food sales transacted through our platform is a key revenue driver. Because we act as an agent of the merchant in the transaction, we recognize as revenues only our commissions from the transaction, which are a percentage of the total Gross Food Sales for such transaction. |
Our key business metrics are as follows for the periods presented:
| Year Ended December 31, | Year Ended December 31, | Six Months Ended June 30, | ||||||||||||||||||||||||||||||||||
| 2011 | 2012 | % Change |
2012 | 2013 | % Change |
2013 | 2014 | % Change |
||||||||||||||||||||||||||||
| Active Diners |
689,000 | 986,000 | 43 | % | 986,000 | 3,421,000 | 247 | % | 1,171,000 | 4,192,000 | 258 | % | ||||||||||||||||||||||||
| Daily Average Grubs |
45,700 | 62,000 | 36 | % | 62,000 | 107,900 | 74 | % | 83,200 | 177,800 | 114 | % | ||||||||||||||||||||||||
| Gross Food Sales (in millions) |
$ | 412.2 | $ | 568.8 | 38 | % | $ | 568.8 | $ | 1,014.9 | 78 | % | $ | 381.4 | $ | 855.6 | 124 | % | ||||||||||||||||||
The growth of each of these metrics also reflects the impact of the Merger. For example, at the time of the acquisition, the GrubHub Platform added 1.7 million incremental active diners that had placed an order through the GrubHub Platform in the preceding twelve months. Our Active Diners metric for the year ended December 31, 2013 and the six months ended June 30, 2014 includes diners who placed orders on either the GrubHub Platform or the Seamless Platform during the twelve months prior to such dates. In addition, for the year ended December 31, 2013, as a result of the Merger, we estimate that the GrubHub Platform added approximately 21,800 Daily Average Grubs and $216.1 million in Gross Food Sales to the year ended December 31, 2013 totals of 107,900 and $1,014.9 million, respectively.
We experienced significant growth across all of our key business metrics, Active Diners, Daily Average Grubs and Gross Food Sales, in the years ended December 31, 2011, 2012 and 2013 and the six months ended June 30, 2013 and 2014. Growth in all metrics was attributable to a combination of organic growth and the impact of the Merger.
51
Table of Contents
Our organic growth was due primarily to increased product and brand awareness by diners, better restaurant choices for diners in our markets and the growth of our mobile applications, which allow diners to order takeout through our platform using their mobile devices.
Once we achieve a certain number of restaurants in a particular geographic area, including the key restaurants in the market, diners are afforded a broad and diverse range of choices, and the subsequent incremental growth or loss of restaurants in that geography may not have a direct impact on our revenue. While we believe it is generally important to increase the number of restaurants in our network to drive growth in our business, there are a number of additional factors that determine how robust our network is in a particular market, including the quality of the individual restaurants, the diversity of choice, individual market presence and the concentration of restaurants.
In 2012 and 2013 and during the six months ended June 30, 2014, we spent relatively fewer resources on adding restaurants in new markets and instead focused on continuing to build our restaurant coverage in all of our existing markets. We believe the restaurants we added in 2012 and 2013 and during the six months ended June 30, 2014 were generally similar to those on the network in the prior periods in terms of quality, diversity and market concentration. As we grow our network in the future, we will continue to focus on these factors, rather than singularly focusing on the number of restaurants we add.
Basis of Presentation
Revenues
We generate revenues primarily when diners place an order on our platform through our websites, our mobile applications, third-party websites that incorporate our API or one of our listed phone numbers. Restaurants pay us a commission, typically a percentage of the transaction, on orders that are processed through our platform. Most of our restaurants can choose their level of commission rate, at or above our base rates, to affect their relative priority in our sorting algorithms, with restaurants paying higher commission rates generally appearing higher in the search order than restaurants paying lower commission rates. Some restaurants on our platform pay a monthly system fee for better branding and more robust placement. Because we are acting as an agent of the merchant in the transaction, we recognize as revenues only our commissions from the transaction, which are a percentage of the total Gross Food Sales for such transaction.
We periodically provide incentive offers to restaurants and diners to use our platform. These promotions are generally cash credits to be applied against purchases. We record these incentive offers as reductions in revenues, generally on the date we record the corresponding revenue.
We generate a small amount of revenues directly from companies that participate in our corporate ordering program and by selling advertising on our allmenus.com and MenuPages websites to third parties. We do not anticipate that corporate fees or advertising will generate a significant portion of our revenues in the foreseeable future.
Cost and Expenses
Sales and Marketing
Sales and marketing expenses consist of salaries, commissions, benefits, stock-based compensation expense and bonuses for restaurant sales, restaurant sales support and marketing employees and contractors. Sales and marketing expenses also contain our advertising expenses including search engine marketing, television, online display, media and other programs and facilities costs allocated on a headcount basis.
Operations and Support
Operations and support expenses consist of salaries and benefits, stock-based compensation expense and bonuses for salaried employees and contractors engaged in customer service and operations at our Company.
52
Table of Contents
Operations and support expenses also include payment processing costs for diner orders, costs of uploading and maintaining restaurant menu content, communications costs related to orders and facilities costs allocated on a headcount basis.
Technology (exclusive of amortization)
Technology (exclusive of amortization) expenses consist of salaries and benefits, stock-based compensation expense and bonuses for salaried employees and contractors engaged in the design, development, maintenance and testing of our platform including our websites, mobile applications and other products. Technology expenses also include facilities costs allocated on a headcount basis but do not include amortization of capitalized website and software development costs.
General and Administrative
General and administrative expenses consist of salaries, benefits, stock-based compensation expense and bonuses for executive, finance, accounting, legal, human resources and administrative support. General and administrative expenses also include legal, accounting, other third-party professional services, other miscellaneous expenses and facilities costs allocated on a headcount basis.
Depreciation and Amortization
Depreciation and amortization expenses primarily consist of amortization of purchased intangibles from the Merger and depreciation of computer equipment, software development, leasehold improvements and capitalized website and software development costs.
Provision (Benefit) for Income Taxes
Provision for income taxes consists of federal and state income taxes in the United States and income taxes in certain foreign jurisdictions, deferred income taxes reflecting the net tax effects of temporary differences between the carrying amounts of assets and liabilities for financial reporting purposes and the amounts used for income tax purposes, and the realization of net operating loss carryforwards.
Results of Operations
The following tables set forth our results of operations for the periods presented in dollars and as a percentage of our revenues:
| Year Ended December 31, | Six Months Ended June 30, | |||||||||||||||||||
| (in thousands) |
2011 | 2012 | 2013 | 2013 | 2014 | |||||||||||||||
| (unaudited) | ||||||||||||||||||||
| Statement of Operations Information: |
||||||||||||||||||||
| Revenues |
$ | 60,611 | $ | 82,299 | $ | 137,143 | $ | 52,658 | $ | 118,619 | ||||||||||
| Costs and expenses: |
||||||||||||||||||||
| Sales and marketing |
17,198 | 26,892 | 37,347 | 16,164 | 32,285 | |||||||||||||||
| Operations and support |
13,961 | 18,165 | 34,173 | 11,975 | 29,841 | |||||||||||||||
| Technology (exclusive of amortization) |
5,651 | 10,172 | 15,357 | 5,344 | 11,413 | |||||||||||||||
| General and administrative |
9,777 | 12,249 | 21,907 | 8,712 | 16,944 | |||||||||||||||
| Depreciation and amortization |
4,033 | 6,089 | 13,470 | 3,673 | 11,130 | |||||||||||||||
|
|
|
|
|
|
|
|
|
|
|
|||||||||||
| Total costs and expenses |
50,620 | 73,567 | 122,254 | 45,868 | 101,613 | |||||||||||||||
| Income before provision for income taxes |
9,991 | 8,732 | 14,889 | 6,790 | 17,006 | |||||||||||||||
| Provision (benefit) for income taxes |
(5,220 | ) | 813 | 8,142 | 3,711 | 9,961 | ||||||||||||||
|
|
|
|
|
|
|
|
|
|
|
|||||||||||
| Net income |
15,211 | 7,919 | 6,747 | 3,079 | 7,045 | |||||||||||||||
| Preferred stock tax distributions |
(334 | ) | (402 | ) | (1,073 | ) | (648 | ) | (320 | ) | ||||||||||
|
|
|
|
|
|
|
|
|
|
|
|||||||||||
| Net income attributable to common stockholders |
$ | 14,877 | $ | 7,517 | $ | 5,674 | $ | 2,431 | $ | 6,725 | ||||||||||
|
|
|
|
|
|
|
|
|
|
|
|||||||||||
53
Table of Contents
| Year Ended December 31, | Six Months Ended June 30, | |||||||||||||||||||
| 2011 | 2012 | 2013 | 2013 | 2014 | ||||||||||||||||
| (unaudited) | ||||||||||||||||||||
| Percentage of Revenues: |
||||||||||||||||||||
| Revenues |
100 | % | 100 | % | 100 | % | 100 | % | 100 | % | ||||||||||
| Costs and expenses: |
||||||||||||||||||||
| Sales and marketing |
28 | 33 | 27 | 31 | 27 | |||||||||||||||
| Operations and support |
23 | 22 | 25 | 23 | 25 | |||||||||||||||
| Technology (exclusive of amortization) |
9 | 12 | 11 | 10 | 10 | |||||||||||||||
| General and administrative |
16 | 15 | 16 | 17 | 14 | |||||||||||||||
| Depreciation and amortization |
7 | 7 | 10 | 7 | 9 | |||||||||||||||
|
|
|
|
|
|
|
|
|
|
|
|||||||||||
| Total costs and expenses(1) |
84 | 89 | 89 | 87 | 86 | |||||||||||||||
| Income before provision for income taxes |
16 | 11 | 11 | 13 | 14 | |||||||||||||||
|
|
|
|
|
|
|
|
|
|
|
|||||||||||
| Provision (benefit) for income taxes |
(9 | ) | 1 | 6 | 7 | 8 | ||||||||||||||
|
|
|
|
|
|
|
|
|
|
|
|||||||||||
| Net income |
25 | % | 10 | % | 5 | % | 6 | % | 6 | % | ||||||||||
|
|
|
|
|
|
|
|
|
|
|
|||||||||||
| (1) | Totals may not foot due to rounding. |
Six Months Ended June 30, 2013 and 2014
Revenues
| Six Months Ended June 30, | % Change | |||||||||||
| 2013 | 2014 | |||||||||||
| (in thousands, except percentages) | (unaudited) | |||||||||||
| Revenues |
$ | 52,658 | $ | 118,619 | 125 | % | ||||||
Revenues increased by $66.0 million, or 125%, for the six months ended June 30, 2014 compared to the same period in 2013. The increase was primarily related to the inclusion of results from the GrubHub Platform and growth in Active Diners, which increased from 1.2 million to 4.2 million at the end of each period, driving an increase in Daily Average Grubs to 177,800 during the six months ended June 30, 2014 from 83,200 Daily Average Grubs during the same period in 2013. During the six months ended June 30, 2013, there were approximately 1.8 million Active Diners and 46,400 Daily Average Grubs on the GrubHub Platform that would have been included had the Merger been completed as of January 1, 2013. The growth in Active Diners and Daily Average Grubs unrelated to the Merger was due primarily to marketing efforts, investments in our platform to drive more orders and organic growth from word-of-mouth referrals. The implementation, in the quarter ended June 30, 2014, of a new feature on the Seamless Platform that allows restaurants to influence how high they appear in the search results based on their commission rate also contributed to the increase in revenue during the six months ended June 30, 2014 compared to the same period in 2013.
Sales and Marketing
| Six Months Ended June 30, | % Change | |||||||||||
| 2013 | 2014 | |||||||||||
| (in thousands, except percentages) | (unaudited) | |||||||||||
| Sales and marketing |
$ | 16,164 | $ | 32,285 | 100 | % | ||||||
| Percentage of revenues |
31 | % | 27 | % | ||||||||
Sales and marketing expense increased by $16.1 million, or 100%, for the six months ended June 30, 2014 compared to the same period in 2013. The increase was primarily attributable to the inclusion of results from the GrubHub Platform following the Merger Date, expansion of our advertising efforts and growth in our sales and
54
Table of Contents
marketing teams. For the six months ended June 30, 2014 versus the same period in 2013, advertising spending increased by $10.2 million primarily as a result of the inclusion of advertising spending for the GrubHub Platform as well as an increase in the our marketing and advertising efforts. During the same period, the number of sales personnel increased by 152% and the number of marketing personnel increased by 98%, primarily as a result of the addition of sales and marketing personnel from the GrubHub Platform.
Operations and Support
| Six Months Ended June 30, | % Change | |||||||||||
| 2013 | 2014 | |||||||||||
| (in thousands, except percentages) | (unaudited) | |||||||||||
| Operations and support |
$ | 11,975 | $ | 29,841 | 149 | % | ||||||
| Percentage of revenues |
23 | % | 25 | % | ||||||||
Operations and support expense increased by $17.9 million, or 149%, for the six months ended June 30, 2014 compared to the same period in 2013. This increase was primarily attributable to the inclusion of results from the GrubHub Platform following the date of the Merger, an increase in payment processing costs related to orders and growth in our customer service teams. In addition to the amounts in the table above, during the six months ended June 30, 2013, operations and support expense for the GrubHub Platform was $9.5 million, which would have been included here had the Merger been completed as of January 1, 2013. Payment processing costs increased $7.9 million, or 110%, for the six months ended June 30, 2014 compared to the same period in the prior year due to the 124% growth in Gross Food Sales. During the same period, the number of customer service personnel increased by 317%, primarily as a result of the addition of operations and support personnel from the GrubHub Platform as well as growth to support the increase in orders.
Technology (exclusive of amortization)
| Six Months Ended June 30, | % Change | |||||||||||
| 2013 | 2014 | |||||||||||
| (in thousands, except percentages) | (unaudited) | |||||||||||
| Technology (exclusive of amortization) |
$ | 5,344 | $ | 11,413 | 114 | % | ||||||
| Percentage of revenues |
10 | % | 10 | % | ||||||||
Technology expense increased by $6.1 million, or 114%, for the six months ended June 30, 2014 compared to the same period in 2013. The increase was primarily attributable to the inclusion of technology expense from the GrubHub Platform following the Merger Date and growth in our technology team. During the six months ended June 30, 2014, the number of technology personnel increased by 124% compared to the same period in the prior year, primarily due to the addition of technology personnel from the GrubHub Platform as well as growth to support the development of our platform, including its websites, mobile applications and other products.
General and Administrative
| Six Months Ended June 30, | % Change | |||||||||||
| 2013 | 2014 | |||||||||||
| (in thousands, except percentages) | (unaudited) | |||||||||||
| General and administrative |
$ | 8,712 | $ | 16,944 | 94 | % | ||||||
| Percentage of revenues |
17 | % | 14 | % | ||||||||
General and administrative expense increased by $8.2 million, or 94%, for the six months ended June 30, 2014 compared to the same period in 2013. The increase was primarily attributable to the inclusion of general and administrative expenses from the GrubHub Platform following the Merger Date, costs associated with being
55
Table of Contents
a public company, higher stock-based compensation expense and an increase in other miscellaneous expenses required to support growth in the business, partially offset by lower legal and professional fees relative to expenses incurred in 2013 related to the Merger.
Depreciation and Amortization
| Six Months Ended June 30, | % Change | |||||||||||
| 2013 | 2014 | |||||||||||
| (in thousands, except percentages) | (unaudited) | |||||||||||
| Depreciation and amortization |
$ | 3,673 | $ | 11,130 | 203 | % | ||||||
| Percentage of revenues |
7 | % | 9 | % | ||||||||
Depreciation and amortization expense increased by $7.5 million, or 203%, for the six months ended June 30, 2014 compared to the same period in 2013. The increase was primarily attributable to the amortization of intangible assets acquired in the Merger of $6.0 million for the six months ended June 30, 2014, and increased investment in infrastructure to support our growing business.
Provision for Income Taxes
| Six Months Ended June 30, | % Change | |||||||||||
| 2013 | 2014 | |||||||||||
| (in thousands, except percentages) | (unaudited) | |||||||||||
| Provision for income taxes |
$ | 3,711 | $ | 9,961 | 168 | % | ||||||
| Percentage of revenues |
7 | % | 8 | % | ||||||||
Income tax expense increased by $6.3 million for the six months ended June 30, 2014 compared to the same period in 2013. The increase was primarily attributable to the increase in income before provision for income taxes due to the factors described above. In addition, we recognized a $2.0 million increase in our deferred tax liabilities during the six months ended June 30, 2014 due to a change in state tax law. Changes in tax laws in other jurisdictions could result in similar adjustments. We have provided income tax expense for the periods presented based on the expected annual effective tax rate.
Years Ended December 31, 2011, 2012 and 2013
Revenues
| Year Ended December 31, | % Change | Year Ended December 31, | % Change | |||||||||||||||||||||
| 2011 | 2012 | 2012 | 2013 | |||||||||||||||||||||
| (in thousands, except percentages) | ||||||||||||||||||||||||
| Revenues |
$ | 60,611 | $ | 82,299 | 36 | % | $ | 82,299 | $ | 137,143 | 67 | % | ||||||||||||
2012 compared to 2013
Revenues increased by $54.8 million, or 67%, for the year ended December 31, 2013 compared to the year ended December 31, 2012. The increase was primarily related to the growth in Active Diners, which increased from 1.0 million to 3.4 million at the end of each period, and the inclusion of results from the GrubHub Platform, driving an increase in Daily Average Grubs to 107,900 during the year ended December 31, 2013 from 62,000 Daily Average Grubs during the same period in 2012. $26.3 million of the increase in revenues and 1.9 million of the increase in Active Diners were due to the inclusion of results from the GrubHub Platform following the Merger Date. We believe the growth in Active Diners and Daily Average Grubs unrelated to the Merger was due to our marketing efforts, investments in our platform to drive more orders and organic growth from word-of-mouth referrals.
56
Table of Contents
2011 compared to 2012
Revenues increased by $21.7 million, or 36%, during the year ended December 31, 2012 compared to the year ended December 31, 2011. The increase was primarily related to the growth in Active Diners, which increased from approximately 689,000 to approximately 986,000 at the end of each year, driving an increase in Daily Average Grubs from approximately 45,700 during 2011 to approximately 62,000 during 2012. These increases were primarily attributable to organic growth and advertising initiatives.
Sales and Marketing
| Year Ended December 31, | % Change | Year Ended December 31, | % Change | |||||||||||||||||||||
| 2011 | 2012 | 2012 | 2013 | |||||||||||||||||||||
| (in thousands, except percentages) | ||||||||||||||||||||||||
| Sales and marketing |
$ | 17,198 | $ | 26,892 | 56 | % | $ | 26,892 | $ | 37,347 | 39 | % | ||||||||||||
| Percentage of revenues |
28 | % | 33 | % | 33 | % | 27% | |||||||||||||||||
2012 compared to 2013
Sales and marketing expenses increased by $10.5 million, or 39%, for the year ended December 31, 2013 compared to the year ended December 31, 2012. The increase was primarily attributable to the inclusion of results from the GrubHub Platform following the Merger Date and growth in our sales and marketing teams. From the year ended December 31, 2012 to the year ended December 31, 2013, advertising spending increased a total of $4.9 million, of which $5.8 million was from the inclusion of advertising spending from the GrubHub Platform offset by a $0.9 million decrease in advertising spent on the Seamless Platform. During the same period, the number of sales personnel increased by 176%, with 94% of the total increase coming from the addition of sales personnel from the GrubHub Platform, and the number of marketing personnel increased by 110%, with 87% of the total increase coming from the addition of marketing personnel from the GrubHub Platform.
2011 compared to 2012
Sales and marketing expenses increased by $9.7 million, or 56%, during the year ended December 31, 2012 compared to the year ended December 31, 2011. The increase was primarily attributable to sizeable increases in our marketing team and advertising spending as well as growth in our sales team. During the year ended December 31, 2012, we increased the number of marketing personnel by 24% and total spending on marketing personnel and advertising activities increased from $13.7 million to $22.2 million, or 62%, to drive brand awareness, grow Active Diners and increase order frequency. During 2012, we also increased the size of our sales force by 28% to enhance the quality of the restaurants in our network.
Operations and Support
| Year Ended December 31, | % Change | Year Ended December 31, | % Change | |||||||||||||||||||||
| 2011 | 2012 | 2012 | 2013 | |||||||||||||||||||||
| (in thousands, except percentages) | ||||||||||||||||||||||||
| Operations and support |
$ | 13,961 | $ | 18,165 | 30 | % | $ | 18,165 | $ | 34,173 | 88 | % | ||||||||||||
| Percentage of revenues |
23 | % | 22 | % | 22 | % | 25 | % | ||||||||||||||||
2012 compared to 2013
Operations and support expenses increased by $16.0 million, or 88%, for the year ended December 31, 2013 compared to the year ended December 31, 2012. This increase was primarily attributable to the growth in payment processing costs, headcount and related expense and the inclusion of results from the GrubHub Platform following the Merger Date. Payment processing costs increased $9.0 million, or 93%, for the year ended
57
Table of Contents
December 31, 2013 to support the 78% growth in Gross Food Sales. Approximately 38% of the growth in Gross Food Sales was a result of the inclusion of results from the GrubHub Platform following the Merger Date. During the year ended December 31, 2013, headcount and related expenses increased $3.8 million due to the inclusion of operations and support personnel from the GrubHub Platform and $1.3 million as a result of the 29% growth in operations and support personnel on the Seamless Platform.
2011 compared to 2012
Operations and support expenses increased by $4.2 million, or 30%, during the year ended December 31, 2012 compared to the year ended December 31, 2011. The increase was primarily attributable to growth in payment processing costs and headcount and related expenses in customer service. During 2012, payment processing costs increased from $6.6 million to $9.7 million, or 45%, due to the 38% increase in Gross Food Sales during the period. During the same period, communications costs increased due to the 36% growth in Daily Average Grubs, and costs to update our restaurant menu database increased due to the growth in our restaurant base. We also increased the number of customer service personnel by 9% to support the growth in Daily Average Grubs and expected future growth of our business.
Technology (exclusive of amortization)
| Year Ended December 31, | % Change | Year Ended December 31, | % Change | |||||||||||||||||||||
| 2011 | 2012 | 2012 | 2013 | |||||||||||||||||||||
| (in thousands, except percentages) | ||||||||||||||||||||||||
| Technology (exclusive of amortization) |
$ | 5,651 | $ | 10,172 | 80 | % | $ | 10,172 | $ | 15,357 | 51 | % | ||||||||||||
| Percentage of revenues |
9 | % | 12 | % | 12 | % | 11 | % | ||||||||||||||||
2012 compared to 2013
Technology expenses increased by $5.2 million, or 51%, for the year ended December 31, 2013 compared to the year ended December 31, 2012. The increase was primarily attributable to the inclusion of technology expenses from the GrubHub Platform following the Merger Date of $3.3 million and an increase in headcount and related expenses of $1.9 million as we invested in technology personnel to expand our product offering, and technology-related infrastructure.
2011 compared to 2012
Technology expenses increased by $4.5 million, or 80%, during the year ended December 31, 2012 compared to the year ended December 31, 2011. The increase was primarily attributable to an increase in headcount, consulting and related expenses as we invested in technology personnel throughout 2011 to expand our product offering and technology-related infrastructure. The majority of new technology employees were hired in the third quarter of 2011 or later. This hiring disproportionately increased technology expenses in 2012.
General and Administrative
| Year Ended December 31, | % Change | Year Ended December 31, | % Change | |||||||||||||||||||||
| 2011 | 2012 | 2012 | 2013 | |||||||||||||||||||||
| (in thousands, except percentages) | ||||||||||||||||||||||||
| General and administrative |
$ | 9,777 | $ | 12,249 | 25 | % | $ | 12,249 | $ | 21,907 | 79 | % | ||||||||||||
| Percentage of revenues |
16 | % | 15 | % | 15 | % | 16 | % | ||||||||||||||||
2012 compared to 2013
General and administrative expenses increased by $9.7 million, or 79%, for the year ended December 31, 2013 compared to the year ended December 31, 2012. The increase was primarily attributable to the inclusion of general and administrative expenses from the GrubHub Platform following the Merger Date of $5.3 million and legal and professional fees of $4.7 million related to the Merger.
58
Table of Contents
2011 compared to 2012
General and administrative expenses increased by $2.5 million, or 25%, during the year ended December 31, 2012 compared to the year ended December 31, 2011. The increase was primarily attributable to an increase in headcount and related expenses and general overhead expenses, including professional fees, to support the growth and expected future growth in our business. During the year ended December 31, 2012, the number of general and administrative employees increased by 13%.
Depreciation and Amortization
| Year Ended December 31, | % Change | Year Ended December 31, | % Change | |||||||||||||||||||||
| 2011 | 2012 | 2012 | 2013 | |||||||||||||||||||||
| (in thousands, except percentages) | ||||||||||||||||||||||||
| Depreciation and amortization |
$ | 4,033 | $ | 6,089 | 51 | % | $ | 6,089 | $ | 13,470 | 121 | % | ||||||||||||
| Percentage of revenues |
7 | % | 7 | % | 7 | % | 10 | % | ||||||||||||||||
2012 compared to 2013
Depreciation and amortization expenses increased by $7.4 million, or 121%, for the year ended December 31, 2013 compared to the year ended December 31, 2012. The increase was primarily attributable to amortization of intangible assets resulting from the Merger, which was $4.7 million for the year ended December 31, 2013, and increased investment in infrastructure to support our growing business.
2011 compared to 2012
Depreciation and amortization increased by $2.1 million, or 51%, during the year ended December 31, 2012 compared to the year ended December 31, 2011. The increase was primarily attributable to amortization of intangible assets resulting from the MenuPages Acquisition (as defined below) and increased investment in infrastructure to support our growing business.
Provision (Benefit) for Income Taxes
| Year Ended December 31, | % Change | Year Ended December 31, | % Change | |||||||||||||||||||||
| 2011 | 2012 | 2012 | 2013 | |||||||||||||||||||||
| (in thousands, except percentages) | ||||||||||||||||||||||||
| Provision for income taxes |
$ | (5,220 | ) | $ | 813 | * | $ | 813 | $ | 8,142 | * | |||||||||||||
| Percentage of revenues |
(9 | %) | 1 | % | 1 | % | 6 | % | ||||||||||||||||
| * | Not meaningful |
2012 compared to 2013
Income tax expense increased by $7.3 million for the year ended December 31, 2013 compared to the year ended December 31, 2012. The increase was attributable to the creation of Seamless Holdings, which was taxed as a C-Corporation effective October 28, 2012 for federal and state income tax purposes. Prior to October 28, 2012, the sole legal entity was a limited liability company, which was considered a flow-through entity for both federal and the majority of state income taxes.
2011 compared to 2012
Income tax expense increased by $6.0 million during the year ended December 31, 2012 compared to the year ended December 31, 2011. The increase was primarily attributable to a reversal of deferred tax liability in the amount of $8.1 million in 2011 associated with the June 2011 sale of preferred stock to SLW Investors, LLC offset by 2011 income tax paid of $2.2 million, which represented the income tax expense from January 1, 2011 through May 31, 2011. For the period from January 1, 2012 through October 27, 2012, the Company was a pass-through entity for income tax purposes.
59
Table of Contents
Quarterly Results of Operations
The following table sets forth our unaudited quarterly statements of operations data for each of the ten quarters presented below. The results for the quarters ended September 30, 2013 and December 31, 2013 include the results of the GrubHub Platform after the Merger Date through December 31, 2013. The results for the quarters ended March 31, 2014 and June 30, 2014 include the results of GrubHub Inc., the combined company. In the opinion of management, the data has been prepared on the same basis as the audited financial statements included in this prospectus, and reflects all necessary adjustments, consisting only of normal recurring adjustments, necessary for a fair presentation of this data. The results of historical periods are not necessarily indicative of the results of operations of any future period, particularly as a result of the Merger. You should read this data together with our financial statements and the related notes included elsewhere in this prospectus.
| Three Months Ended | ||||||||||||||||||||||||||||||||||||||||
| March 31, 2012 |
June 30, 2012 |
September 30, 2012 |
December 31, 2012 |
March 31, 2013 |
June 30, 2013 |
September 30, 2013 |
December 31, 2013 |
March 31, 2014 |
June 30, 2014 |
|||||||||||||||||||||||||||||||
| (in thousands, except per share data) | (unaudited) | |||||||||||||||||||||||||||||||||||||||
| Revenues |
$ | 19,808 | $ | 20,119 | $ | 20,593 | $ | 21,779 | $ | 25,801 | $ | 26,857 | $ | 35,461 | $ | 49,024 | $ | 58,613 | $ | 60,006 | ||||||||||||||||||||
| Costs and expenses: |
||||||||||||||||||||||||||||||||||||||||
| Sales and marketing |
6,470 | 6,599 | 5,645 | 8,178 | 10,100 | 6,064 | 8,829 | 12,354 | 16,117 | 16,168 | ||||||||||||||||||||||||||||||
| Operations and support |
4,341 | 4,436 | 4,354 | 5,034 | 5,977 | 5,998 | 9,303 | 12,895 | 15,107 | 14,734 | ||||||||||||||||||||||||||||||
| Technology (exclusive of amortization) |
2,012 | 2,703 | 2,708 | 2,749 | 2,647 | 2,697 | 4,459 | 5,554 | 5,347 | 6,066 | ||||||||||||||||||||||||||||||
| General and administrative |
3,244 | 2,701 | 3,066 | 3,238 | 2,903 | 5,809 | 5,884 | 7,311 | 8,324 | 8,620 | ||||||||||||||||||||||||||||||
| Depreciation and amortization |
1,429 | 1,512 | 1,586 | 1,562 | 1,796 | 1,877 | 3,821 | 5,976 | 5,515 | 5,615 | ||||||||||||||||||||||||||||||
|
|
|
|
|
|
|
|
|
|
|
|
|
|
|
|
|
|
|
|
|
|||||||||||||||||||||
| Total costs and expenses |
17,496 | 17,951 | 17,359 | 20,761 | 23,423 | 22,445 | 32,296 | 44,090 | 50,410 | 51,203 | ||||||||||||||||||||||||||||||
|
|
|
|
|
|
|
|
|
|
|
|
|
|
|
|
|
|
|
|
|
|||||||||||||||||||||
| Income before provision for income taxes |
2,312 | 2,168 | 3,234 | 1,018 | 2,378 | 4,412 | 3,165 | 4,934 | 8,203 | 8,803 | ||||||||||||||||||||||||||||||
| Provision (Benefit) for income taxes |
167 | 206 | 140 | 300 | 1,122 | 2,589 | 1,111 | 3,320 | 3,850 | 6,111 | ||||||||||||||||||||||||||||||
|
|
|
|
|
|
|
|
|
|
|
|
|
|
|
|
|
|
|
|
|
|||||||||||||||||||||
| Net income |
2,145 | 1,962 | 3,094 | 718 | 1,256 | 1,823 | 2,054 | 1,614 | 4,353 | 2,692 | ||||||||||||||||||||||||||||||
| Preferred stock tax distributions |
— | (402 | ) | — | — | — | (648 | ) | (425 | ) | — | — | (320 | ) | ||||||||||||||||||||||||||
|
|
|
|
|
|
|
|
|
|
|
|
|
|
|
|
|
|
|
|
|
|||||||||||||||||||||
| Net income attributable to common stockholders |
$ | 2,145 | $ | 1,560 | $ | 3,094 | $ | 718 | $ | 1,256 | $ | 1,175 | $ | 1,629 | $ | 1,614 | $ | 4,353 | $ | 2,372 | ||||||||||||||||||||
|
|
|
|
|
|
|
|
|
|
|
|
|
|
|
|
|
|
|
|
|
|||||||||||||||||||||
| Net income per share attributable to common stockholders: |
||||||||||||||||||||||||||||||||||||||||
| Basic |
$ | 0.07 | $ | 0.05 | $ | 0.10 | $ | 0.02 | $ | 0.04 | $ | 0.04 | $ | 0.04 | $ | 0.03 | $ | 0.08 | $ | 0.03 | ||||||||||||||||||||
| Diluted |
$ | 0.05 | $ | 0.05 | $ | 0.07 | $ | 0.02 | $ | 0.03 | $ | 0.04 | $ | 0.03 | $ | 0.02 | $ | 0.06 | $ | 0.03 | ||||||||||||||||||||
Our key business metrics are as follows for the periods presented:
| Three Months Ended | ||||||||||||||||||||||||||||||||||||||||
| March 31, 2012 |
June 30, 2012 |
September 30, 2012 |
December 31, 2012 |
March 31, 2013 |
June 30, 2013 |
September 30, 2013 |
December 31, 2013 |
March 31, 2014 |
June 30, 2014 |
|||||||||||||||||||||||||||||||
| (unaudited) | ||||||||||||||||||||||||||||||||||||||||
| Active Diners(1) |
783,000 | 851,000 | 912,000 | 986,000 | 1,087,000 | 1,171,000 | 3,050,000 | 3,421,000 | 3,851,000 | 4,192,000 | ||||||||||||||||||||||||||||||
| Daily Average Grubs(2) |
60,400 | 60,300 | 60,500 | 66,900 | 82,700 | 83,600 | 111,500 | 152,900 | 181,200 | 174,500 | ||||||||||||||||||||||||||||||
| Gross Food Sales (in millions)(3) |
$ | 136.8 | $ | 137.3 | $ | 138.1 | $ | 156.6 | $ | 188.3 | $ | 193.1 | $ | 263.5 | $ | 370.0 | $ | 433.0 | $ | 422.6 | ||||||||||||||||||||
| (1) | We count Active Diners as the number of unique diner accounts from which an order has been placed in the past twelve months through our platform. We began including Active Diners from the GrubHub Platform as of the Merger Date. |
| (2) | We count Daily Average Grubs as the number of revenue generating orders placed on our platform divided by the number of days for a given period. |
| (3) | We calculate Gross Food Sales as the total value of food, beverages, taxes, prepaid gratuities, and any delivery fees processed through our platform. We include all revenue generating orders placed on our platform. Because we act as an agent of the merchant in the transaction, we recognize as revenues only our commission from the transaction, which are a percentage of the total Gross Food Sales for such transaction. |
Revenues and most key business metrics increased sequentially in the quarters presented. Due to seasonality, which generally drives an increase in diner activity from September to April and a relative decrease in diner activity from May to August, revenue growth was more significant in the fourth and first quarters than it was in the second and third quarters. There was a particularly steep increase in both revenues and expenses in the third and fourth quarters of 2013 because of the inclusion of results from the GrubHub Platform following the Merger.
Revenues in the fourth quarter of 2012 were negatively affected by an estimated $0.5 million to $1.0 million as a result of the impact of Superstorm Sandy on New York City area businesses and consumers. Sales and marketing costs were higher in the
60
Table of Contents
fourth quarter of 2012 and first quarter of 2013 due to a significant marketing campaign during these periods. General and administrative costs were higher in the second quarter of 2013 due to $2.9 million in costs related to the Merger.
Adjusted EBITDA
The following table sets forth our Adjusted EBITDA and a reconciliation to net income for each of the ten quarters presented below. Please refer to “Non-GAAP Financial Measures” in the section titled “Selected Historical Consolidated Financial and Other Data” for more information.
| Three Months Ended | ||||||||||||||||||||||||||||||||||||||||
| (in thousands) | March 31, 2012 |
June 30, 2012 |
September 30, 2012 |
December 31, 2012 |
March 31, 2013 |
June 30, 2013 |
September 30, 2013 |
December 31, 2013 |
March 31, 2014 |
June 30, 2014 |
||||||||||||||||||||||||||||||
| (unaudited) | ||||||||||||||||||||||||||||||||||||||||
| Net income |
$ | 2,145 | $ | 1,962 | $ | 3,094 | $ | 718 | $ | 1,256 | $ | 1,823 | $ | 2,054 | $ | 1,614 | $ | 4,353 | $ | 2,692 | ||||||||||||||||||||
| Income taxes |
167 | 206 | 140 | 300 | 1,122 | 2,589 | 1,111 | 3,320 | 3,850 | 6,111 | ||||||||||||||||||||||||||||||
| Depreciation and amortization |
1,429 | 1,512 | 1,586 | 1,562 | 1,796 | 1,877 | 3,821 | 5,976 | 5,515 | 5,615 | ||||||||||||||||||||||||||||||
|
|
|
|
|
|
|
|
|
|
|
|
|
|
|
|
|
|
|
|
|
|||||||||||||||||||||
| EBITDA |
3,741 | 3,680 | 4,820 | 2,580 | 4,174 | 6,289 | 6,986 | 10,910 | 13,718 | 14,418 | ||||||||||||||||||||||||||||||
| Merger and restructuring costs(1) |
— | — | — | — | 403 | 2,940 | 1,324 | 175 | 285 | 207 | ||||||||||||||||||||||||||||||
| Stock-based compensation |
679 | 529 | 552 | 604 | 621 | 617 | 1,786 | 1,909 | 2,403 | 2,284 | ||||||||||||||||||||||||||||||
|
|
|
|
|
|
|
|
|
|
|
|
|
|
|
|
|
|
|
|
|
|||||||||||||||||||||
| Adjusted EBITDA |
$ | 4,420 | $ | 4,209 | $ | 5,372 | $ | 3,184 | $ | 5,198 | $ | 9,846 | $ | 10,096 | $ | 12,994 | $ | 16,406 | $ | 16,909 | ||||||||||||||||||||
|
|
|
|
|
|
|
|
|
|
|
|
|
|
|
|
|
|
|
|
|
|||||||||||||||||||||
| (1) | Merger and restructuring costs include transaction and integration-related costs, such as legal and accounting costs, associated with the Merger and restructuring initiatives. |
Liquidity and Capital Resources
As of June 30, 2014, the Company had cash and cash equivalents of $207.1 million consisting of cash and money market funds. The Company’s primary source of liquidity is cash flows from operations as well as proceeds from the IPO and stock option exercises.
In April of 2014, we completed our IPO in which we issued and sold 4,000,000 shares of common stock at a public offering price of $26.00 per share. We received net proceeds of $94.9 million after deducting underwriting discounts and commissions of $6.5 million and other offering expenses of approximately $2.6 million. These expenses were recorded against the proceeds received from the IPO. The net offering proceeds were invested in non-interest bearing accounts, short-term and intermediate-term interest-bearing obligations, investment-grade investments, certificates of deposit or direct or guaranteed obligations of the U.S. government.
We believe that our existing cash and cash equivalents will be sufficient to meet our working capital requirements for at least the next twelve months. However, our liquidity assumptions may prove to be incorrect, and we could utilize our available financial resources sooner than we currently expect. Our future capital requirements and the adequacy of available funds will depend on many factors, including those set forth under “Risk Factors” in this prospectus. If we are unable to obtain needed additional funds, we will have to reduce our operating costs, which would impair our growth prospects and could otherwise negatively impact our business.
The following table sets forth certain cash flow information for the periods presented:
| Year Ended December 31, | Six Months Ended June 30, | |||||||||||||||||||
| 2011 | 2012 | 2013 | 2013 | 2014 | ||||||||||||||||
| (in thousands) | (unaudited) | |||||||||||||||||||
| Net cash provided by operating activities |
$ | 32,094 | $ | 29,578 | $ | 40,819 | $ | 19,415 | $ | 30,285 | ||||||||||
| Net cash provided by (used in) investing activities |
(36,949 | ) | 10,303 | 6,245 | (4,604 | ) | (3,490 | ) | ||||||||||||
| Net cash provided by (used in) financing activities |
7,321 | (2,218 | ) | (1,842 | ) | (1,806 | ) | 93,575 | ||||||||||||
61
Table of Contents
Cash Flows Provided By Operating Activities
For the six months ended June 30, 2014, net cash provided by operating activities was $30.3 million compared to $19.4 million for the same period in 2013. The increase in cash flow from operations was driven primarily by changes in deferred taxes of $8.3 million, an increase in non-cash expenses of $7.5 million related to depreciation and amortization, an increase in net income of $4.0 million and an increase of $3.4 million related to stock-based compensation. In addition, during the six months ended June 30, 2014 and 2013, significant changes in our operating assets and liabilities resulted from the following:
| • | an increase in accounts receivables of $8.7 million due to an increase in amounts owed to us by our payment processors for prepaid orders placed through the platform along with amounts owed by customers of our corporate ordering program for the six months ended June 30, 2014 compared to an increase of $7.1 million for the six months ended June 30, 2013; |
| • | an increase in restaurant food liability of $6.2 million due to the timing of orders and related payments at quarter-end for the six months ended June 30, 2014 compared to an increase of $11.2 million for the six months ended June 30, 2013; and |
| • | an increase in accrued expenses of $4.2 million primarily related to an increase in accrued payroll, accrued advertising costs, and other miscellaneous expenses during the six months ended June 30, 2014 compared to an increase of $5.6 million during the six months ended June 30, 2013. |
For the year ended December 31, 2013, net cash provided by operating activities was $40.8 million, driven primarily by net income of $6.7 million, non-cash expenses of $13.5 million related to depreciation and amortization and $4.9 million related to stock-based compensation. In addition, during the year ended December 31, 2013, significant changes in our operating assets and liabilities resulted from an increase in our accounts receivables of $8.3 million due to an increase in amounts owed from our payment processors for prepaid orders placed through our platform along with amounts owed from customers of our corporate ordering program and an increase in restaurant food liability of $26.5 million due to an increase in overall Gross Food Sales processed through our platform.
For the year ended December 31, 2012, cash provided by operating activities was $29.6 million, primarily resulting from our net income of $7.9 million, non-cash expenses of $6.1 million related to depreciation and amortization and $2.4 million related to stock-based compensation. In addition, significant changes in our operating assets and liabilities resulted from an increase in restaurant food liability of $12.9 million due to an increase in overall Gross Food Sales processed through our platform.
For the year ended December 31, 2011, cash provided by operating activities was $32.1 million, primarily resulting from our net income of $15.2 million, an increase in restaurant food liability of $8.5 million, and an increase in amounts due to a related party of $5.2 million, along with non-cash expense of $4.0 million related to depreciation and amortization.
Cash Flows Provided By / (Used In) Investing Activities
Our primary investing activities during the periods presented included cash paid for acquired companies, the purchase of property and equipment to support our growth in headcount, websites and internal-use software development and the issuance of notes receivable.
For the six months ended June 30, 2014, net cash used in investing activities was $3.5 million resulting from purchases of property and equipment of $2.4 million and capitalized website development costs of $1.1 million.
For the year ended December 31, 2013, net cash provided by investing activities was $6.2 million. This was the result of $13.3 million of cash acquired upon the Merger, partially offset by the purchase of property and equipment and capitalized website development costs of $7.0 million.
62
Table of Contents
For the year ended December 31, 2012, net cash provided by investing activities was $10.3 million. This was primarily the result of the issuance of a $42.4 million note receivable, partially offset by the subsequent repayment of $26.4 million of the note. In addition, we used $5.7 million for the purchase of property and equipment and capitalized website development.
For the year ended December 31, 2011, we used $36.9 million of net cash in investing activities. This was the result of $12.2 million paid for the MenuPages Acquisition, the $16.0 million repayment on an outstanding note receivable and $8.8 million for the purchase of property and equipment and capitalized website and software development costs.
Cash Flows Provided By / (Used In) Financing Activities
Our financing activities during the periods presented consisted primarily of net proceeds from the issuance of common stock in the IPO as well as proceeds from stock option exercises, amounts paid for preferred stock tax distributions, taxes paid related to net settlements of stock options, repurchases of common stock and the issuance of note receivables to related parties and subsequent cash collection.
For the six months ended June 30, 2014, net cash provided by financing activities was $93.6 million primarily resulting from net proceeds from the issuance of common stock for the IPO of $94.9 million.
For the year ended December 31, 2013, cash used in financing activities was $1.8 million, which primarily resulted from a $1.9 million dividend payment to stockholders.
For the year ended December 31, 2012, cash used in financing activities was $2.2 million, which primarily consisted of a $6.0 million contribution by Aramark to us, offset by a decrease in checks issued in excess of book balances of $3.9 million.
For the year ended December 31, 2011, cash provided by financing activities was $7.3 million, which primarily resulted from a $22.5 million contribution by Aramark to us, an increase in checks issued in excess of book balances of $1.6 million, and was offset by $16.7 million paid in distributions to stockholders.
Contractual Obligations and Other Commitments
We have offices located in Chicago, Illinois, New York, New York and Sandy, Utah. Our office lease for our headquarters expires in 2017. The terms of this lease agreement provide for rental payments that increase on an annual basis. We recognize rent expense on a straight-line basis over the lease period. We do not have any debt or material capital lease obligations, and all of our property, equipment and software have been purchased with cash. We have no material long-term purchase obligations outstanding with any vendors or third parties.
Our future minimum payments under non-cancelable operating leases for equipment and office facilities were as follows as of December 31, 2013:
| Payments Due by Period | ||||||||||||||||
| (in thousands) | Less than 1 Year |
1 to 3 Years |
3 to 5 Years |
Total | ||||||||||||
| Operating lease obligations |
$ | 3,737 | $ | 7,247 | $ | 4,689 | $ | 15,673 | ||||||||
The contractual commitment amounts in the table above are associated with agreements that are enforceable and legally binding. Obligations under contracts that we can cancel without a significant penalty are not included in the table above.
63
Table of Contents
Acquisitions
The Merger
On August 8, 2013, the Company acquired all of the equity interests of each of Seamless North America, LLC, Seamless Holdings and GrubHub Holdings pursuant to that certain Reorganization and Contribution Agreement, dated as of May 19, 2013, by and among the Company, Seamless North America, LLC, Seamless Holdings, GrubHub Holdings and the other parties thereto.
The fair value of the equity issued in connection with the Merger was approximately $421.5 million. The value of the equity was determined using the estimated fair value of GrubHub Holdings’ stock on the Merger Date based on a valuation of GrubHub Holdings, conducted by management. Included as part of the $421.5 million is approximately $11.0 million which represents the fair value of the replacement awards that were attributed to the pre-combination service period for GrubHub Holdings option holders. $12.5 million of post-combination expense is expected to be recognized post-Merger, which represents the unrecognized compensation expense related to GrubHub Holdings stock options. In connection with the Merger, we agreed to indemnify Aramark for negative income tax consequences associated with the October 2012 spin-off of Seamless Holdings that are the result of certain actions taken by us, including our solicitation of acquirers to purchase us prior to October 29, 2014, and in certain other instances subject to a $15 million limitation.
MenuPages Acquisition
On October 3, 2011, Seamless North America, LLC acquired the stock of Slick City Media, Inc., which owns and operates the MenuPages business, for an initial cash purchase price of $12.2 million and a note payable of approximately $2.0 million (the “MenuPages Acquisition”). The payments under the note payable were dependent on the seller, New York Media LLC, continuing to provide us with 15 months of website hosting and related services. The note payable was repaid during the year ended December 31, 2012.
Off-Balance Sheet Arrangements
We did not have any off-balance sheet arrangements as of June 30, 2014.
Quantitative and Qualitative Disclosures about Market Risk
We are exposed to certain market risks in the ordinary course of our business. These risks primarily consist of interest rate fluctuations and inflation rate risk as follows:
Interest Rate Risk
We did not have any long-term borrowings as of June 30, 2014.
We invest our excess cash primarily in money market accounts. Our current investment strategy seeks first to preserve principal, second to provide liquidity for our operating and capital needs and third to maximize yield without putting our principal at risk.
Our investments are exposed to market risk due to the fluctuation of prevailing interest rates that may reduce the yield on our investments or their fair value. As our investment portfolio is short-term in nature, we do not believe an immediate 100 basis point increase in interest rates would have a material effect on the fair market value of our portfolio, and therefore we do not expect our results of operations or cash flows to be materially affected to any degree by a sudden change in market interest rates.
Inflation Risk
We do not believe that inflation has had a material effect on our business, results of operations or financial condition.
64
Table of Contents
Critical Accounting Polices and Estimates
Our financial statements are prepared in accordance with GAAP. The preparation of these financial statements requires us to make estimates and assumptions that affect the reported amounts of assets, liabilities, revenues, expenses and related disclosures. We evaluate our estimates and assumptions on an ongoing basis. Our estimates are based on historical experience and various other assumptions that we believe to be reasonable under the circumstances. Our actual results could differ from these estimates.
We believe that the assumptions and estimates associated with revenue recognition, website and software development costs, recoverability of intangible assets with definite lives and other long-lived assets and stock-based compensation have the greatest potential impact on our financial statements. Therefore, we consider these to be our critical accounting policies and estimates. For further information on all of our significant accounting policies discussed below, see Note 2 of the accompanying notes to our financial statements.
Revenue Recognition
In general, we recognize revenue when (i) persuasive evidence of an arrangement exists, (ii) delivery has occurred or services have been rendered to the customer, (iii) the fee is fixed or determinable and (iv) collectability is reasonably assured. We consider a signed agreement, a binding contract with the restaurant or other similar documentation reflecting the terms and conditions under which products or services will be provided to be persuasive evidence of an arrangement.
We generate revenues primarily when diners place an order on our platform. Restaurants pay us a commission, typically a percentage of the transaction, on orders that are processed through our platform. Most of our restaurants can choose their level of commission rate, at or above our base rates, to affect their relative priority in our sorting algorithms, with restaurants paying higher commission rates generally appearing higher in the search order than restaurants paying lower commission rates. Commissions are generally based on a fixed percentage of the value of the order. Some restaurants on our platform pay a monthly system fee for better branding and more robust placement. Because we are acting as an agent of the merchant in the transaction, we recognize as revenues only our commissions from the transaction, which are a percentage of the total Gross Food Sales for such transaction.
Revenues from online and phone delivery orders are recognized when orders are placed to the restaurants. The amount of the revenue we record is based on the contractual arrangement with the related restaurant, and is adjusted for any cash credits, including incentive offers provided to restaurants and diners, related to the transaction. We record an amount representing the restaurant food liability for the net balance due the restaurant.
Website and Software Development Costs
The costs incurred in the preliminary stages of development are expensed as incurred. Once an application has reached the development stage, internal and external costs, if direct and incremental and deemed by management to be significant, are capitalized and amortized on a straight-line basis over their estimated useful lives. Maintenance and enhancement costs, including those costs in the post-implementation stages, are typically expensed as incurred, unless such costs relate to substantial upgrades and enhancements to the website or software that result in added functionality, in which case the costs are capitalized and amortized on a straight-line basis over the estimated useful lives. Amortization expense related to capitalized website and software development costs is included in depreciation and amortization.
Recoverability of Intangible Assets with Finite Lives and Other Long-Lived Assets
We evaluate intangible assets and other long-lived assets for impairment whenever events or circumstances indicate they may not be recoverable. Recoverability is measured by comparing the carrying amount of an asset group to future undiscounted net cash flows expected to be generated. We group assets for purposes of such
65
Table of Contents
review at the lowest level for which identifiable cash flows of the asset group are largely independent of the cash flows of the other groups of assets and liabilities. If this comparison indicates impairment, the amount of impairment to be recognized is calculated as the difference between the carrying value and the fair value of the asset group.
Stock-Based Compensation
We measure compensation expense for all stock-based awards at fair value on the date of grant and recognize compensation expense over the service period for awards expected to vest. We use the Black-Scholes option-pricing model to determine the fair-value for awards and recognize compensation expense on a straight-line basis over the awards’ vesting periods. Management has determined the Black-Scholes fair value of our stock option awards and related stock-based compensation expense with the assistance of third-party valuations. Determining the fair value of stock-based awards at the grant date requires judgment. The determination of the grant date fair value of options using an option-pricing model is affected by our estimated common stock fair value as well as assumptions regarding a number of other complex and subjective variables. If any of the assumptions used in the Black-Scholes model changes significantly, stock-based compensation for future awards may differ materially compared with the awards granted previously. In valuing our options, we make assumptions about risk-free interest rates, dividend yields, volatility, and weighted-average expected lives, including estimated forfeiture rates, of the options.
The Black-Scholes option-pricing model requires the use of highly subjective and complex assumptions, including the expected term and the price volatility of the underlying stock, which determine the fair value of stock-based awards. These assumptions include:
| • | Risk-free rate. Risk-free interest rates are derived from U.S. Treasury securities as of the option grant date. |
| • | Expected dividend yields. Expected dividend yields are based on our historical dividend payments, which have been zero to date (excluding the tax distributions made by Seamless Holdings in 2011, 2012 and 2013). |
| • | Volatility. Because there was no public market for our shares prior to our IPO, we historically estimated volatility of our share price based on the published historical volatilities of comparable publicly-traded companies in our vertical markets. |
| • | Expected term. We estimate the weighted-average expected life of the options as the average of the vesting option schedule and the term of the award, since, due to the limited period of time stock-based awards have been exercisable, we do not have sufficient historical exercise data to provide a reasonable basis upon which to estimate the expected term. The term of the award is estimated using the simplified method as the awards granted are plain vanilla stock options. |
| • | Forfeiture rate. Forfeiture rates are estimated using historical actual forfeiture trends as well as our judgment of future forfeitures. These rates are evaluated at least annually and any change in compensation expense is recognized in the period of the change. The estimation of stock awards that will ultimately vest requires judgment and, to the extent actual results or updated estimates differ from our current estimates, such amounts will be recorded as a cumulative adjustment in the period in which the estimates are revised. We consider many factors when estimating expected forfeitures, including the types of awards and employee class. Actual results, and future changes in estimates, may differ substantially from management’s current estimates. |
66
Table of Contents
The following table presents the weighted-average assumptions used to estimate the fair value of options granted during the periods presented:
| Year Ended December 31, | Six Months Ended June 30, | |||||||||||||||||||
| 2011 | 2012 | 2013 | 2013 | 2014 | ||||||||||||||||
| (unaudited) | ||||||||||||||||||||
| Expected term (in years) |
6.08 | 6.11 | 5.20 | 6.06 | 6.29 | |||||||||||||||
| Risk-free interest rate |
1.21 | % | 0.87 | % | 1.41 | % | 1.10 | % | 2.00 | % | ||||||||||
| Dividend yield |
None | None | None | None | None | |||||||||||||||
| Volatility rate |
60.40 | % | 54.80 | % | 50.7 | % | 53.8 | % | 50.5 | % | ||||||||||
Since June 2011, we have obtained periodic valuation analyses prepared by independent third-party valuation firms to assist us with the determination of the fair value of our common stock. The valuation firms utilized approaches and methodologies consistent with the American Institute of Certified Public Accountants Practice Aid, Valuation of Privately-Held-Company Equity Securities Issued as Compensation and information provided by our management, including historical and projected financial statements, prospects and risks, our performance, various corporate documents, capitalization, and economic and financial market conditions. The third-party valuation firms also utilized other economic, industry, and market information obtained from other resources considered reliable. The valuation analyses were reviewed by management and the board of directors in conjunction with share-based compensation grants. Management and our board of directors have considered these valuation analyses and other qualitative and quantitative factors to determine the best estimate of the fair value of our common stock at each stock option grant date. These factors included:
| • | key employee hires and terminations; |
| • | seasonality of our business; |
| • | general market conditions in the technology and food order industries; |
| • | our operating performance and competitive position within the online food ordering industry; |
| • | achievement of enterprise milestones; |
| • | financial statement projections; |
| • | our cash burn rate; |
| • | our need for future financing rounds to fund operations; |
| • | market value of companies considered comparable to our Company; and |
| • | likelihood of achieving certain liquidity events, such as a sale or merger, given prevailing market conditions. |
We obtained contemporaneous independent third-party valuations of our common stock as of June 6, 2011, May 31, 2012, October 26, 2012, March 1, 2013, August 15, 2013, September 30, 2013 and December 31, 2013. Given that option grants were completed periodically between the dates of the valuations prepared by the third-party valuation firms, the fair value of common stock has been interpolated on a monthly basis.
The valuation analyses employed market and income approaches to estimate our enterprise value and allocated our enterprise value among our various equity classes utilizing option pricing and probability-weighted expected return (“PWERM”) methods. The valuation analyses were based on contemporaneous information as of each respective valuation date.
Under the income approach, specifically the discounted cash flow (“DCF”) method, forecast cash flows are discounted to the present value at a risk-adjusted discount rate. The valuation analyses determine discrete free cash flows over several years based on forecast financial information provided by our management and a terminal value for the residual period beyond the discrete forecast, which are discounted at our estimated weighted average cost of capital to estimate our enterprise value.
67
Table of Contents
Under the market approach there are three standard methodologies, the guideline public company method, the guideline transaction method, and subject company transaction method. The guideline public company method involves selecting publicly traded companies with similar financial and operating characteristics as our Company, and calculating valuation multiples based on the guideline public company’s financial information and market data. Based on the observed valuation multiples, an appropriate multiple was selected to apply to our financial statistics. The guideline transaction method involves selecting sale transactions of companies with similar financial and operating characteristics as our Company and calculating valuation multiples based on the acquisition price and the acquired company’s financial information. An appropriate multiple was selected to apply to our financial statistics. The same set of guideline public companies was utilized for both the common stock valuation and the expected volatility estimate for the valuation of the stock-based compensation awards. In August 2013, the set of guideline public companies was revised to reflect the size, growth and risk of the Company in connection with the Merger. Additionally, we determined it was more appropriate to compare the Company to other Internet service companies, instead of other Internet retail companies, given the Company’s focus on providing online and mobile food ordering services for restaurants and customers. The subject company transaction method involves the utilization of a company’s own relevant stock transactions, such as a preferred stock issuance, to calculate the enterprise value based on the transaction price of the stock.
After determining an estimate of the fair value of the enterprise, the valuation analyses allocated the enterprise value among the equity classes outstanding at each valuation date utilizing the option pricing method (“OPM”), specifically the Black-Scholes-Merton option pricing model. The OPM requires inputs for the exercise price, term, expected volatility and risk-free rate. The exercise prices were calculated based on the enterprise values at which the equity classes either begin or stop participating in the next incremental enterprise value, which were determined based on the liquidation preferences and conversion rights of each equity class. The term was the estimated time to a liquidity event, such as a sale or merger or IPO, which was determined based on information provided by our management and outside research. The expected volatility for the enterprise was estimated based on a historical analysis of publicly traded companies with similar financial and operating characteristics as our company and consideration of the relative differences between our company and the selected comparable companies, such as stage of development, earning margins, leverage, and other risk factors. The risk-free rates were based on U.S. treasury securities with terms to maturity consistent with the estimated time to a liquidity event.
The PWERM was utilized in the March 1, 2013, August 15, 2013, September 30, 2013 and December 31, 2013 valuation analyses, which was determined to be appropriate given the expectation of a liquidity event in the near-term (approximately zero to two years) and a more discrete distribution of likely liquidity events. Under the PWERM, the fair value of common stock is estimated based on likely liquidity event scenarios. For each identified liquidity scenario it is necessary to estimate the timing to liquidity event, future enterprise value, probability of occurrence, and risk-adjusted discount rate. The valuation analyses estimated the future enterprise values utilizing the guideline public company method and guideline transaction method and information provided by our management. The timing to each liquidity event and the probability of occurrence were estimated based on information provided by our management and outside research. The risk-adjusted discount rates were estimated based on market data and outside research of required rates of return for companies at a similar stage of development and risk factors. The future enterprise values under each scenario were allocated to the various equity classes based on the liquidation preferences and conversion rights of each equity class. The future values for each equity class under each scenario were discounted to a present value at the selected risk-adjusted discount rate. The present values under each scenario were probability-weighted to determine the value of common stock before applicable discounts.
After obtaining the value allocated to the common stock under either the OPM or PWERM, several discounts were considered to adjust for the fact that a share of common stock is a minority, non-marketable interest. The discounts are determined based on qualitative and quantitative analyses.
The following table summarizes by grant date the number of shares of our common stock subject to stock options granted since January 1, 2013, the associated per share exercise price and the estimated fair value per
68
Table of Contents
share at the date of grant. We derived the estimated fair value per share as of each grant date by applying a linear proration of fair values between the valuation performed immediately prior to each set of grants and the valuation performed after each set of grants. In connection with the Merger, replacement options were issued as of August 8, 2013. We have accounted for these replacement options by revaluing the options after the Merger Date taking into consideration options that were vested as of the Merger Date which were recorded to purchase price consideration, and future options which have not vested and which are to be recorded as an expense post-Merger. All share and per share amounts reflect the Reverse Stock Split and the rounding associated with such Reverse Stock Split, which was effected on April 2, 2014.
| Grant Date |
Shares subject to option grant |
Exercise price per share | Fair value per share at Grant Date |
Intrinsic Value (in thousands) |
||||||||||||
| January 2013(1) |
368,750 | $ | 5.60 | $ | 6.20 | $ | 12,110 | |||||||||
| August 2013(2) |
8,554 | 0.06 | 10.82 | 328 | ||||||||||||
| August 2013(2) |
2,053 | 0.08 | 10.82 | 79 | ||||||||||||
| August 2013(2) |
95,714 | 0.08 | 10.82 | 3,672 | ||||||||||||
| August 2013(2) |
264 | 0.08 | 10.82 | 10 | ||||||||||||
| August 2013(2) |
101,388 | 0.44 | 10.82 | 3,853 | ||||||||||||
| August 2013(2) |
50,442 | 0.78 | 10.82 | 1,900 | ||||||||||||
| August 2013(2) |
524,365 | 0.88 | 10.82 | 19,695 | ||||||||||||
| August 2013(2) |
1,406,368 | 2.00 | 10.82 | 51,253 | ||||||||||||
| August 2013(2) |
63,248 | 2.60 | 10.82 | 2,266 | ||||||||||||
| August 2013(2) |
50,599 | 4.62 | 10.82 | 1,711 | ||||||||||||
| August 2013(2) |
238,639 | 5.06 | 10.82 | 7,966 | ||||||||||||
| August 2013(2) |
167,981 | 6.18 | 10.82 | 5,418 | ||||||||||||
| August 2013(2) |
327,593 | 8.40 | 10.82 | 9,841 | ||||||||||||
| August 2013(1) |
264,000 | 10.82 | 10.82 | 7,292 | ||||||||||||
| October 2013(1) |
1,250 | 11.50 | 12.24 | 34 | ||||||||||||
| December 2013(1) |
27,500 | 11.50 | 13.70 | 741 | ||||||||||||
| January 2014(1) |
882,500 | 13.70 | 20.00 | 21,833 | ||||||||||||
| February 2014(1) |
716,490 | 13.70 | 21.00 | 17,726 | ||||||||||||
| April 2014(1) |
18,183 | 35.31 | 15.50 | 57 | ||||||||||||
| May 2014(1) |
122,100 | 30.91 | 14.98 | 919 | ||||||||||||
| August 2014(1) |
108,700 | 43.45 | 21.06 | — | ||||||||||||
| (1) | Options issued in the ordinary course of business. |
| (2) | Options issued as replacement options in connection with the Merger. |
No single event caused the valuation of our common stock to increase from January 2013 to April 2014 (prior to our IPO). Instead, a combination of the factors described above led to the changes in the fair value of the underlying common stock as determined by our board of directors.
As of June 30, 2014, total unrecognized compensation expense, adjusted for estimated forfeitures, related to non-vested stock options was $21.1 million, which is expected to be recognized over the next 3.05 years.
We have granted options to purchase 1,847,973 shares of our common stock since December 31, 2013 with an estimated weighted average exercise term of 6.3 years.
Based on the closing price of our common stock on the NYSE on August 29, 2014, the options granted after December 31, 2012 had an intrinsic value of approximately $168.7 million.
Goodwill
Goodwill represents the excess of the cost of an acquired business over the fair value of the assets acquired at the date of acquisition. We assess the impairment of goodwill at least annually and also whenever events or
69
Table of Contents
changes in circumstances indicate that goodwill may be impaired. Absent any special circumstances that could require an interim test, we have elected to test for goodwill impairment as of September 30th of each year. We test for impairment using a two-step process. The first step of the goodwill impairment test identifies if there is potential goodwill impairment. If step one indicates that an impairment may exist, a second step is performed to measure the amount of the goodwill impairment, if any, by comparing the implied fair value of goodwill to the carrying amount. If the implied goodwill is less than the carrying amount, a write-down is recorded. We have determined that we have one reporting unit in testing goodwill for impairment.
We have reviewed the impairment analyses comparing the fair value of our aggregate equity to our carrying value as of September 30, 2013 to determine whether goodwill impairment exists under Step I of ASC 350. The valuation analyses employed market and income approaches to estimate our equity value utilizing the PWERM. We did not perform an assessment of qualitative factors in evaluating goodwill impairment as of September 30, 2013.
The PWERM was selected for the goodwill impairment analyses due to the potential of a liquidity event in the near-term, a more discrete distribution of likely liquidity events and to remain consistent with the valuation of our common stock as of the same date. Under the PWERM, the fair value of aggregate equity is estimated based on likely liquidity event scenarios, and the future values for each equity class under each scenario were discounted to a present value at the selected risk adjusted discount rate. The present values under each scenario were probability-weighted to determine the value of aggregate equity. Finally, the indicated fair value of aggregate equity was then compared to our carrying value as of the impairment test date to assist us in determining whether goodwill impairment existed under Step I of ASC 350. As of September 30, 2013, the indicated fair value of aggregate equity under the PWERM exceeded our carrying value of equity by 80%; therefore, no impairment was indicated at such time.
Additionally, as part of its interim review for indicators of impairment, management analyzed potential changes in value based on operating results for the six months ended June 30, 2014 compared to expected results. Management also considered how other key assumptions, including discount rates and expected long-term growth rates used in the last fiscal year’s impairment analysis, could be impacted by changes in market conditions and economic events. Since September 30, 2013, the fair market value of our stock has increased. Management considered these trends in performing its assessment of whether an interim impairment review was required. Based on this interim assessment, management concluded that as of June 30, 2014, there were no events or changes in circumstances that indicated it was more likely than not that our fair value was below our carrying value. Nevertheless, significant changes in global economic and market conditions could result in changes to expectations of future financial results and key valuation assumptions. Such changes could result in revisions of management’s estimates of our fair value and could result in a material impairment of goodwill as of September 30, 2014, our next annual measurement date.
Internal Control Over Financial Reporting
Our independent registered public accounting firm has not conducted an audit of Seamless Holdings’, which is now known as GrubHub Inc., internal control over financial reporting. However, in connection with its audit of Seamless Holdings’ consolidated financial statements as of and for the years ended December 31, 2011 and 2012 included elsewhere in this prospectus, our independent registered public accounting firm discovered a material weakness relating to the documentation of journal entry review. Specifically, we had not regularly documented our review of journal entries and, where there was a documented review of account reconciliations, we did not provide a listing of journal entries in such documentation. As a result of these items, we concluded that a material weakness in our internal control over financial reporting existed as of December 31, 2012. A “material weakness” is a deficiency, or a combination of deficiencies, in internal control over financial reporting such that there is a reasonable possibility that a material misstatement of our annual or interim financial statements will not be prevented or detected on a timely basis.
70
Table of Contents
Since discovery of this material weakness, we have taken steps to fully understand the material weakness and to remediate it. We are in the process of designing and implementing improved processes and controls. Additionally, in connection with the Merger, we retained the chief financial officer and controller that served in those roles for the GrubHub Platform. By utilizing their existing accounting and finance expertise, we have built a more experienced accounting and finance organization. While this material weakness was remediated for 2013, our efforts to remedy this material weakness may not prevent future material weaknesses or significant deficiencies in our internal control over financial reporting from occurring. See also “Risk Factors” for additional information on this matter.
Recently Issued and Adopted Accounting Pronouncements
Under the JOBS Act, we meet the definition of an “emerging growth company.” We have irrevocably elected to opt out of the extended transition period for complying with new or revised accounting standards pursuant to Section 107(b) of the JOBS Act. We will remain an “emerging growth company” for up to five years following the completion of our IPO (which occurred on April 4, 2014) or until we achieve total annual gross revenues in excess of $1 billion during a fiscal year or become a large accelerated filer as a result of achieving a public float of at least $700 million as of the end of our second fiscal quarter.
In May 2014, the Financial Accounting Standards Board (“FASB”) issued Accounting Standards Update No. 2014-09, “Revenue from Contracts with Customers (Topic 606)” (“ASU 2014-09”), which supersedes the revenue recognition requirements in Topic 605, Revenue Recognition, including most industry-specific requirements. ASU 2014-09 establishes a five-step revenue recognition process in which an entity will recognize revenue when it transfers promised goods or services to customers in an amount that reflects the consideration to which the company expects to be entitled in exchange for those goods or services. ASU 2014-09 also requires enhanced disclosures regarding the nature, amount, timing and uncertainty of revenues and cash flows from contracts with customers. ASU 2014-09 will be effective for us in the first quarter of 2017. Management is currently evaluating the impact the adoption of ASU 2014-09 will have on our condensed consolidated financial position, results of operations or cash flows and the method of retrospective application, either full or modified.
In July 2013, FASB issued a new accounting standard update on the financial statement presentation of unrecognized tax benefits. The new guidance provides that a liability related to an unrecognized tax benefit would be presented as a reduction of a deferred tax asset for a net operating loss carryforward, a similar tax loss or a tax credit carryforward if such settlement is required or expected in the event the uncertain tax position is disallowed. The new guidance was effective for and adopted by us on January 1, 2014 and applied prospectively to unrecognized tax benefits that existed at the effective date with retrospective application permitted. The adoption of ASU 2013-11 impacted our financial statement presentation and disclosures, but otherwise did not impact our condensed consolidated financial position, results of operations or cash flows.
In February 2013, FASB issued ASU No. 2013-02 “Reporting of Amounts Reclassified Out of Accumulated Other Comprehensive Income.” ASU No. 2013-02 requires an entity to disaggregate the total change of each component of other comprehensive income either on the face of the income statement or as a separate disclosure in the financial footnotes. The new guidance became effective for reporting periods beginning after December 15, 2012 and is applied prospectively. We adopted this guidance during the year ended December 31, 2013, and the adoption did not have any impact on our financial position, results of operations or cash flows, as the amounts reclassified out of accumulated other comprehensive income (loss) are not significant.
In September 2011, FASB issued ASU No. 2011-08, Intangibles—Goodwill and Other (Topic 350). The amended guidance will allow companies to assess qualitative factors to determine if it is more-likely-than-not that goodwill might be impaired and whether it is necessary to perform the two-step goodwill impairment test required. This pronouncement is effective for fiscal years beginning after December 15, 2011. We adopted this standard on January 1, 2012. The adoption of this accounting standard update did not have any material impact on our results of operations or financial position.
71
Table of Contents
In June 2011, FASB issued ASU No. 2011-05, Presentation of Comprehensive Income, which requires an entity to present total comprehensive income, the components of net income, and the components of other comprehensive income either in a single continuous statement of comprehensive income or in two separate but consecutive statements and eliminates the option to present the components of other comprehensive income as part of the statement of changes in stockholders’ equity. We early adopted this guidance on January 1, 2012, retrospectively.
In May 2011, FASB issued Accounting Standards Update (“ASU”) No. 2011-04, Fair Value Measurement (Topic 820), which amended existing rules covering fair value measurement and disclosure to clarify guidance and minimize differences between GAAP and International Financial Reporting Standards. The guidance requires entities to provide information about valuation techniques and unobservable inputs used in Level III fair value measurements and provide a narrative description of the sensitivity of Level III measurements to changes in unobservable inputs. The guidance is effective during interim and annual periods beginning after December 15, 2011. We adopted this guidance on January 1, 2012. The adoption of this guidance did not have any impact on our financial position, results of operations or cash flows.
72
Table of Contents
Our Mission
Our mission is to make takeout better.
Our Company
GrubHub is the leading online and mobile platform for restaurant pick-up and delivery orders, which we refer to as takeout. We processed more than 177,800 combined Daily Average Grubs during the six months ended June 30, 2014 and had approximately $855.6 million of combined Gross Food Sales on our platform during the six months ended June 30, 2014. We connect local restaurants with hungry diners in more than 700 cities across the United States and are focused on transforming the takeout experience. For restaurants, GrubHub generates higher margin takeout orders at full menu prices. Our platform empowers diners with a “direct line” into the kitchen, avoiding the inefficiencies, inaccuracies and frustrations associated with paper menus and phone orders. We have a powerful two-sided network that creates additional value for both restaurants and diners as it grows.
Our target market is primarily independent restaurants. These independent restaurants, which account for 61% of all U.S. restaurants (according to Euromonitor), remain local, highly fragmented and are mostly owner-operated family businesses. According to Euromonitor, Americans spent $204 billion at these approximately 350,000 independent restaurants in 2012. Of that amount, we believe that Americans spent approximately $67 billion on takeout at these independent restaurants.
For restaurants, takeout enables them to grow their business without adding seating capacity or wait staff. Advertising for takeout, typically done through the distribution of menus to local households or advertisements in local publications, is often inefficient and requires upfront payment with no certainty of success. In contrast, we provide the restaurants on our platform with an efficient way to generate more takeout orders. We enable restaurants to access local diners at the moment when those diners are hungry and ready to purchase takeout. In addition, we do not charge the restaurants in our network any upfront or subscription fees, we do not require any discounts from their full price menus and we only get paid for the orders we generate for them, providing restaurants with a low-risk, high-return solution. We charge restaurants a per-order commission that is primarily percentage-based.
As our two-sided network of restaurants and diners has grown, many of our restaurants have chosen to pay higher rates to receive better exposure to more diners on our platform, and this has resulted in higher overall commission rates for us.
For diners, the traditional takeout ordering process is often a frustrating experience—from using paper menus to communicating an order by phone to a busy restaurant employee. In contrast, ordering on GrubHub is enjoyable and a dramatic improvement over the “menu drawer.” We provide the 4.2 million Active Diners on our platform (as of June 30, 2014) with an easy-to-use, intuitive and personalized platform that helps them search for and discover local restaurants and then accurately and efficiently place an order from any Internet-connected device. We also provide diners with information and transparency about their orders and status and solve problems that may arise. In addition, we make re-ordering convenient by storing previous orders, preferences and payment information, helping us promote diner frequency and drive strong repeat business.
The proliferation of mobile devices over the past few years has significantly increased the value of our platform. With powerful, easy-to-use mobile applications for iPhone, iPad and Android, we enable diners to access GrubHub whenever and wherever they want takeout. All of the discovery and ordering capabilities that are available on our consumer websites are also available through our mobile applications. We monetize the orders placed through our mobile applications using the same rate as orders placed through our websites. Our mobile applications make ordering from GrubHub more accessible and personal, driving increased use of our platform by restaurants and diners. Orders placed on mobile devices increased from approximately 20% of our consumer orders in the quarter ended December 31, 2011 to approximately 48% of our consumer orders in the quarter ended June 30, 2014.
73
Table of Contents
Our business has grown rapidly. During the six months ended June 30, 2014, we generated revenue of $118.6 million, representing a 125% increase from the same period in 2013. Our revenue growth has been driven primarily by the inclusion of results from the GrubHub Platform and increasing adoption of our platform by restaurants and diners, with 4.2 million Active Diners as of June 30, 2014. During the six months ended June 30, 2013, there were approximately 1.8 million Active Diners and 46,400 Daily Average Grubs on the GrubHub Platform that would have been included had the Merger been completed as of January 1, 2013. For the six months ended June 30, 2014, our net income was $7.0 million and our Adjusted EBITDA was $33.3 million. See “Summary—Summary Historical Consolidated Financial and Other Data” for a discussion and reconciliation of Adjusted EBITDA to net income.
The following table details the key business metrics for both the GrubHub Platform and the Seamless Platform on a combined basis:
| Year Ended December 31, | Six Months Ended June 30, | |||||||||||||||||||
| 2011 | 2012 | 2013 | 2013 | 2014 | ||||||||||||||||
| (unaudited) | ||||||||||||||||||||
| Active Diners |
1,579,000 | 2,321,000 | 3,421,000 | 2,780,000 | 4,192,000 | |||||||||||||||
| Daily Average Grubs |
59,200 | 93,600 | 135,500 | 129,600 | 177,800 | |||||||||||||||
| Gross Food Sales (in millions) |
$ | 543.5 | $ | 871.0 | $ | 1,285.9 | $ | 606.7 | $ | 855.6 | ||||||||||
The Takeout Market Opportunity
Food is an essential, social and enjoyable aspect of everyday life. However, there is often little time to cook at home or dine out. In addition, diners are increasingly looking for a broader and more diversified choice of cuisines and menu items. Takeout offers a convenient alternative, providing diners with a wide variety of options, wherever they want and whenever they want.
Large and Fragmented Market
Our primary target market is comprised of approximately 350,000 independent restaurants that account for 61% of all U.S. restaurants, according to Euromonitor. Also according to Euromonitor, Americans spent $204 billion at these independent restaurants in 2012. Of that amount, we believe that Americans spent approximately $67 billion on takeout at these independent restaurants.
The takeout segment is one of the largest consumer markets in the United States. Excluding the large chains, the independent restaurant market remains a local and highly fragmented market, mostly comprised of owner-operated family businesses. Like most small business owners, independent restaurants are highly focused on their core expertise—cooking for and serving food to their on-premise diners. Both entrepreneurial and ambitious, these small business owners tend to be time and resource constrained.
Challenges for Independent Restaurants
Independent restaurant owners recognize that increasing takeout orders enables them to grow their business because they can service the additional orders by leveraging existing resources, including excess capacity and perishable inventory, without adding seating capacity or wait staff. Advertising for takeout is often done through the distribution of menus to local households or through local publications such as the yellow pages. These traditional methods of advertising are typically inefficient, require upfront payment with no certainty of success and are rapidly becoming obsolete as diners shift to online and mobile solutions for local search and discovery. Most online solutions such as search or display advertising tend to be similar to traditional offline advertising in that they lack targeted reach and impose upfront costs with no certainty of success. In addition, to be visible and effective online, restaurants typically need to invest in a website as well as in new solutions and technologies such as mobile applications. These can be complex, expensive and time-intensive tasks that require consistent updates and are beyond the core competencies of most independent restaurants.
74
Table of Contents
Providing a quality experience for takeout diners is also a key challenge for restaurants. Because independent restaurants focus on serving on-premise diners, they typically have a limited ability to attend to the needs of takeout diners. The traditional takeout ordering process is highly manual and prone to errors and delays. Effectively and efficiently managing order delivery is also a challenge for independent restaurants given the nature of the process as well as their limited resources to handle follow-up calls.
Independent restaurants seek a simple and effective solution to expand their takeout business without significant investments or expertise in marketing and technology.
Challenges for Diners
For diners, ordering takeout is usually a chore and is often a frustrating experience. Typically, ordering takeout starts with the challenge of choosing where to order from and what to order—usually relying on a tired, outdated and limited choice of menus found in the “menu drawer.” Once a diner chooses and calls a restaurant, the ordering process can lead to angst, as the diner is faced with long hold times, distracted order-takers in an already error-prone process, difficulty communicating special requests, incomplete pricing information and the inevitable wait for delivery with limited transparency. Upon delivery, diners only have a few seconds to confirm that what they received is indeed what they ordered, with limited recourse in the event it is not.
Diners seek a simple, convenient and transparent takeout ordering solution with a wide variety of restaurant choices that provides them with a “direct line” into the kitchen.
The GrubHub Solution
At GrubHub, we focus on providing value to both restaurants and diners through our two-sided network. We provide restaurants with more orders, help them serve diners better and enable them to improve the efficiency of their takeout business. For diners, we make takeout accessible, simple and enjoyable, enabling them to discover new restaurants and accurately and easily place their orders anytime and from anywhere.
Why Restaurants Love GrubHub
We believe that we provide restaurants with the following key benefits:
| • | More Orders. Through GrubHub, restaurants in our network receive more orders at full menu prices. By storing our diners’ prior orders and payment information, we facilitate convenient re-ordering, driving repeat business for our restaurants. |
| • | Targeted Reach. Restaurants in our network gain an online and mobile presence with the ability to reach their most valuable target audience—hungry diners in their area. |
| • | Low Risk, High Return. GrubHub generates higher margin takeout orders for the restaurants in our network by enabling them to leverage their existing fixed costs. We do not charge our restaurants any upfront or subscription fees, we do not require any discounts from their full-price menus and we only get paid for the orders we generate for them. |
| • | Service and Efficiency. Restaurants in our network can receive and handle a larger volume of takeout orders more accurately, increasing their operational efficiency while providing their takeout diners with a high-quality experience. Our customer service representatives can help resolve issues that arise in a timely and cost-effective manner. |
| • | Insights. We provide restaurants with actionable insights based on the significant amount of order data we gather, helping them to optimize their delivery footprints, menus, pricing and online profiles. |
75
Table of Contents
Why Diners Love GrubHub
With 4.2 million Active Diners as of June 30, 2014 and more than 177,800 combined Daily Average Grubs during the six months ended June 30, 2014, we believe that we provide diners with the following key benefits:
| • | Discovery. GrubHub aggregates menus and enables ordering from restaurants across more than 700 cities in the United States, in most cases providing diners with more choices than the “menu drawer” and allowing them to discover hidden gems from local restaurants in our network. In addition, with more than 177,800 combined Daily Average Grubs across our platform during the six months ended June 30, 2014, we gather a significant amount of order data which enables us to provide valuable information to our diners on popular restaurants and frequently ordered menu items. |
| • | Convenience. Using GrubHub, diners do not need to place their orders over the phone. We provide diners with an easy-to-use, intuitive and personalized platform that makes ordering simple from any connected device. We make re-ordering even more convenient by storing previous orders, preferences and payment information. |
| • | Control and Transparency. Our platform empowers diners with a “direct line” into the kitchen, without having to talk to a distracted order-taker in an already error-prone process. Prior to placing an order, diners can review and change their orders, see how their changes affect pricing and include special instructions. In many cases, we send text messages informing diners that their orders are on the way, thus further increasing their visibility and limiting the frustration associated with waiting for a meal while hungry. |
| • | Service. For diners, GrubHub’s role is similar to that of the waiter in a restaurant, providing a critical layer of customer service that is typically missing in takeout. Our customer service representatives are available by phone to serve our diners both before and after they have placed an order. To provide this customer service, we use our scale to help resolve issues and provide updates and information regarding orders, which ultimately improves our relationship with diners. |
Our Competitive Advantages
Our focus on making takeout better for both restaurants and diners has helped us to develop the following competitive advantages:
| • | Market Leader with Significant Scale. We are the largest takeout platform, with approximately $855.6 million in combined Gross Food Sales on our platform during the six months ended June 30, 2014; restaurants in approximately 700 cities in the United States; and 4.2 million Active Diners as of June 30, 2014, yielding more than 177,800 combined Daily Average Grubs across our platform during the six months ended June 30, 2014. |
| • | Powerful Two-Sided Network Effect. As we continue to increase the number of restaurants in our network, we become a more compelling platform for diners. As we continue to increase the number of diners on our platform, we generate more orders for and become more compelling to restaurants. The result is a self-reinforcing, mutually beneficial, two-sided network. |
| • | Growing and Recurring Diner Base. On average, for the quarter ended June 30, 2014, our Active Diners ordered food through our platform approximately 15 times on an annualized basis. We have grown the number of Active Diners using our platform from 0.7 million as of December 31, 2011 to 4.2 million as of June 30, 2014. We believe that our easy-to-use ordering system, restaurant choices and enjoyable user experience all inspire new diners to try GrubHub and encourage existing diners to make GrubHub a way of life, driving repeat and growing use of our platform. |
| • | Product Innovation. We have a history of introducing new products that make our platform better through our mobile applications and our restaurant-facing products, such as OrderHub and Boost. We help restaurants in our network streamline their operations, which enables us to provide better service to our diners. |
76
Table of Contents
| • | Mobile Engagement and Monetization. Our mobile applications, including our iPhone, iPad and Android applications, enable diners to place orders from wherever they may be and then get home in time for delivery or pick up orders on their way home. We benefit from the growing adoption and increased use of our mobile applications, as they significantly increase the number of orders diners place through GrubHub. Orders placed on mobile devices increased from approximately 20% of our consumer orders during the quarter ended December 31, 2011 to approximately 48% of our consumer orders during the quarter ended June 30, 2014. We monetize the orders placed through our mobile applications using the same rate as orders placed through our websites. |
| • | Attractive Business Model. Our scalable platform enables us to process additional orders at low incremental cost. As our two-sided network of restaurants and diners has grown, many of our restaurants have chosen to pay higher rates to receive better exposure to more diners on our platform, and this has resulted in higher overall commission rates for us. |
Our Growth Strategy
We strive to make GrubHub an integral part of everyday life for our restaurants and diners through the following growth strategies:
| • | Grow our Two-Sided Network. We intend to grow the number of restaurants in our existing geographic markets by providing them with opportunities to generate more takeout orders. We intend to grow the number of diners and orders placed on our network primarily through word-of-mouth referrals, marketing that encourages adoption of our mobile applications and increased order frequency. |
| • | Enhance our Platform. We plan to continue to invest in our websites and mobile products, develop new products and better leverage the significant amount of order data that we collect, helping us generate more takeout orders for restaurants while providing diners with more control and better transparency as we seek to make takeout better. |
| • | Deliver Excellent Customer Service. We plan to continue to deliver our excellent customer service experience for both restaurants and diners. By meeting and exceeding the expectations of both restaurants and diners through our customer service, we seek to gain their loyalty and support for our platform. |
| • | Pursue Strategic Acquisitions. In the past we have successfully completed several acquisitions such as MenuPages, DotMenu and FanGo, Inc. (“FanGo”). We intend to continue to pursue expansion opportunities in existing and new markets, as well as in core and adjacent categories through strategic acquisitions. |
Our Products
All of our products are designed with the goal of making takeout better, more efficient and enjoyable.
GrubHub and Seamless Websites
The primary way diners access our platform is through www.grubhub.com and www.seamless.com, both of which we have consistently improved since inception. To use our websites, diners enter their delivery address and are presented with local restaurants that provide takeout. Diners can further refine their search results using our search capability, enabling them to filter results across cuisine types, restaurant names, menu items, proximity, ratings and other criteria. Once diners have found what they are looking for, they place their orders using our easy-to-use and intuitive menus, enabling them to discover food choices, select options and provide specific instructions on a dish-by-dish basis. Once an order is received, we transmit it to the restaurant, while saving the diners’ preferences for future orders, thus providing diners with a convenient repeat order experience.
77
Table of Contents
GrubHub and Seamless Mobile Apps
We offer diners access to our network through our mobile applications designed for iPhone, iPad and Android devices. Our mobile applications provide diners with the same functionality as our websites, including restaurant discovery, search and ordering. For restaurants, mobile orders are received in the same way as our website-based orders, and we charge the same commission for both.
Seamless Corporate Program
On the Seamless Platform, we provide a corporate program that helps businesses address inefficiencies in food ordering and associated billing. Our corporate program offers employees a wide variety of food and ordering options, including options for individual meals, group ordering and catering, as well as proprietary tools that consolidate all food ordering into a single online account that enables companies to proactively manage food spend by automating the enforcement of budgets and rules. Our corporate tools provide consolidated ordering and invoicing, eliminating the need for employee expense reports and therefore significantly reducing administrative overhead relating to office food ordering.
Allmenus and MenuPages
Allmenus.com and MenuPages, both of which were acquired in September 2011 by GrubHub Holdings and Seamless North America, LLC, respectively, provide an aggregated database of approximately 275,000 menus from restaurants across all 50 states. The websites are searchable by cuisine type, restaurant name, menu items and other criteria. For those restaurants whose menus are posted on allmenus.com or MenuPages and who are also part of our restaurant network, we provide a link from their menus to our websites, through which diners can then place their orders, providing us with an efficient customer acquisition channel.
OrderHub and Boost
Restaurants have historically received orders from GrubHub through a facsimile or email and are required to confirm the order over the phone. Though most of our restaurants still use this traditional method, several thousand restaurants use our tablet solutions, OrderHub and Boost. These tools can electronically receive and display orders at the restaurant, providing operators with the capability to acknowledge receipt of the order and update the estimated completion time and status with an easy-to-use application. OrderHub and Boost allow us to monitor orders through the takeout process (receipt, ready for pickup, on the way, etc.). In turn, we can make that information available to hungry diners who are waiting for their orders, thus providing greater transparency, reducing their frustration and making the takeout experience more enjoyable.
Restaurant Websites
We offer the restaurants in our network a turnkey website design and hosting service powered by template-driven technology, which provides the restaurants in our network with a simple yet effective online presence. We process the orders placed through these websites through our platforms.
APIs
We have developed an application programming interface for third-party websites to easily incorporate our order delivery platform, driving additional orders for the restaurants in our network. Currently, third-party websites are not a material source of Active Diners for us.
Customer Service
Customer service is an important element of our value proposition to both restaurants and diners. Like our products, our customer service is designed to make takeout better, more efficient and enjoyable.
78
Table of Contents
Restaurants
Customer service is an important component of our value proposition for restaurants, enabling them to focus on food preparation and delivery. We provide restaurants with 24/7 service, where our operators are able to assist with problems that may arise. We track and manage restaurant performance on our platform, helping restaurants manage capacity issues while ensuring that our diners receive the service they expect.
In addition to our operations-related services, we offer restaurants actionable insights based on the significant amount of order data we gather, helping restaurants optimize their delivery footprint, menus, pricing and online profiles.
Diners
The customer service we offer to our diners is also an important component of our value proposition, helping us generate diner satisfaction and positive word-of-mouth referrals. We believe that it is our responsibility to make our diners happy. When diners call our 24/7 customer service line, we typically help them add items to orders that have already been placed and inform them of the status of their orders. While our goal is to ensure that every order is processed through our websites and mobile platforms smoothly, when problems arise, we welcome the chance to engage with our diners and resolve problems to their satisfaction. We believe that our excellent customer service is a driver for our business, enabling us to generate diner referrals, which in turn leads to more frequent ordering and overall loyalty to our platform.
Our Geographic Markets
Our geographic reach includes more than 700 cities across the United States as well as London. Our primary markets are: Boston, Chicago, Los Angeles, New York, Philadelphia, San Francisco and Washington, D.C.
Sales
Our sales team adds new restaurants to our network by emphasizing our low risk, high return proposition: we provide more orders, we do not charge any upfront payments or subscription fees, we do not require any discounts from a restaurant’s full price menus and we only get paid on orders we generate for them. We generate many of our leads for new restaurants through our allmenus.com and MenuPages websites, which give us insights into which restaurants are popular with diners and are not yet on our network. We then contact those restaurants either through our inside sales team, based in our Chicago office, or through our local, “feet-on-the-street” sales force. Once restaurants have joined our network, GrubHub representatives continue to work with them to maintain quality control and to increase their order volume. Our sales team also focuses on adding new corporate program clients by emphasizing our value proposition: a wide variety of ordering options for employees and proprietary tools that provide rule-based ordering and consolidated reporting and invoicing for employers.
Marketing
We believe that our online ordering platform, innovative products and excellent customer service are our best and most effective marketing tools, helping us generate strong word-of-mouth referrals, which have been the primary driver of our diner growth. Our integrated marketing efforts are aimed at driving existing diners to engage more frequently with our platform and encouraging new diners to try our platform. We use both online as well as offline advertising. Our advertisements educate people about GrubHub in an amusing and sometimes irreverent way, generating brand awareness among potential diners and driving overall order growth.
Technology
We generally develop additional features for our platform in-house, focusing on quick release cycles and constant improvement. Our web and mobile properties are hosted from three locations in Illinois, Texas and
79
Table of Contents
Utah, each of which are owned and operated by a third-party provider of hosting services. Our platform includes a variety of encryption, antivirus, firewall and patch-management technology to protect and maintain the systems and computers across our business. We rely on third-party off-the-shelf technology as well as internally developed and proprietary products and systems to ensure rapid, high-quality customer service, software development, website integration, updates and maintenance. We leverage off-the-shelf hardware and software platforms in order to build and customize our hardware-based products such as our OrderHub tablet, which is based on the Android operating system.
Competition
We primarily compete with the traditional offline ordering process used by the vast majority of restaurants and diners involving paper menus that restaurants distribute to diners, as well as advertising that restaurants place in local publications to attract diners. For diners, we compete with the traditional ordering process by aggregating restaurant and menu information in one place online so that it is easier and more convenient to find a desirable restaurant option and place a customized order without having to interact directly with the restaurants. For restaurants, we offer a more targeted marketing opportunity than the yellow pages, billboards or other local advertising mediums since our diners typically access our platform when they are looking to place a takeout order, and GrubHub captures the transaction right when a diner has made a decision.
Our online competition consists primarily of local service providers, point-of-sale module vendors that serve some independent restaurants who have their own standalone websites and the online interfaces of larger chain restaurants that also offer takeout. Compared to other online platforms, GrubHub offers diners choices, whereas many online platforms offer only one brand and menu, particularly the chain restaurants. We also compete for diners with these online competitors on the basis of convenience, control and customer service. For restaurants, we compete with other online platforms based on our ability to generate additional orders as well as on our reach, targeted scale and ability to help them improve their operational efficiency, with product innovations like OrderHub and Boost, and diner experience.
We believe we compete favorably based on these factors for both restaurants and diners. Although paper menus are still our biggest competition, based on available information regarding the number of diners and restaurants on our platform and the number of orders processed through our platform, we believe we are the largest online provider of takeout orders in the United States.
Employees
As of June 30, 2014, we had approximately 740 full-time employees. None of our employees is represented by a labor union with respect to his or her employment with us.
Intellectual Property
We protect our intellectual property through a combination of trademarks, trade dress, domain name registrations, copyrights, trade secrets and patents applications, as well as contractual provisions and restrictions on access to and use of our proprietary information.
As of June 30, 2014, we had more than 40 trademarks registered in the United States, including: “GrubHub,” “happy eating,” “Seamless,” “OrderHub” and “Your food is here.” We also have filed other trademark applications in the United States and abroad and may pursue additional trademark registrations to the extent we believe it will be beneficial and cost-effective.
As of June 30, 2014, we had four patents issued in the United States and 19 patent applications pending in the United States, which seek to cover proprietary inventions relevant to our products and services. We may pursue additional patent protection to the extent we believe it will be beneficial and cost effective.
80
Table of Contents
We are the registered holder of a variety of domestic and international domain names that include the terms “GrubHub,” “Seamless,” “Allmenus,” “MenuPages” and certain of our other trademarks and similar variations of such terms.
In addition to the protection provided by our intellectual property rights, we enter into confidentiality agreements with our employees, consultants, contractors and business partners who are given access to our confidential information. Further, our employees and contractors who contribute to the development of material intellectual property on our behalf are also subject to invention assignment and/or license agreements, as appropriate. We further control the use of our proprietary technology and intellectual property through our general websites and product-specific terms of use and policies.
Facilities
On September 1, 2012, we commenced a lease effective through August 31, 2017 for approximately 60,000 square feet of office space that houses our principal operations in Chicago, Illinois (the “Chicago Lease”). On December 11, 2013, we amended the Chicago Lease to add approximately 10,500 square feet of additional office space, commencing on March 1, 2014 through February 29, 2016. On August 4, 2011, we commenced a lease effective through June 30, 2022 for approximately 28,700 square feet of office space in New York, New York. We believe these facilities are sufficient for our current needs, but we may need to seek additional facilities if our business continues to grow.
Legal Proceedings
In August 2011, Ameranth filed a patent infringement action against a number of defendants, including GrubHub Holdings Inc. in the U.S. District Court for the Southern District of California (the “Court”), Case No. 3:11-cv-1810 (“’1810 action”). In September 2011, Ameranth amended its complaint in the ’1810 action to also accuse Seamless North America, LLC of infringement. Ameranth alleged that the GrubHub Holdings Inc. and Seamless North America, LLC ordering systems, products and services infringe claims 12 through 15 of U.S. Patent No. 6,384,850 (the “850 patent”) and claims 11 and 15 of U.S. Patent No. 6,871,325 (the “325 patent”).
In March 2012, Ameranth initiated eight additional actions for infringement of a third, related patent, U.S. Patent No. 8,146,077, (the “077 patent”) in the same forum, including separate actions against GrubHub Holdings Inc., Case No. 3:12-cv-739 (the “’739 action”), and Seamless North America, LLC., Case No. 3:12-cv-737 (the “’737 action”). In August 2012, the Court severed the claims against GrubHub Holdings Inc. and Seamless North America, LLC in the ’1810 action and consolidated them with the ’739 action and the ’737 action, respectively. Later, the Court consolidated these separate cases against GrubHub Holdings Inc. and Seamless North America, LLC, along with the approximately 40 other cases Ameranth filed in the same district, with the original ’1810 action. In their answers, GrubHub Holdings Inc. and Seamless North America, LLC denied infringement and interposed various defenses, including non-infringement, invalidity, unenforceability and inequitable conduct.
On November 26, 2013, the consolidated case was stayed pending the disposition of petitions for post-grant review of all the patents in the suit. These petitions were filed in the United States Patent and Trademark Office (the “PTO”) under the new Transitional Program for Covered Business Method Patents (the “CBM proceedings”). The CBM proceedings resulted in a March 26, 2014 ruling denying defendants’ petitions on the claims most relevant to GrubHub Holdings Inc. and Seamless North America LLC. The consolidated case remains stayed.
No trial date has been set for this case. We believe this case lacks merit and that we have strong defenses to all of the infringement claims. We intend to defend the suit vigorously. However, we are unable to predict the
81
Table of Contents
likelihood of success of Ameranth’s infringement claims and are unable to predict the likelihood of success of our counterclaims. We have not recorded an accrual related to this lawsuit as of June 30, 2014, as we do not believe a material loss is probable. It is a reasonable possibility that a loss may be incurred; however, the possible range of loss is not estimable given the early stage of the dispute and the uncertainty as to whether the claims at issue are with or without merit, will be settled out of court, or will be determined in our favor, whether we may be required to expend significant management time and financial resources on the defense of such claims, and whether we will be able to recover any losses under our insurance policies.
In addition to the matters described above, from time to time, we are involved in various other legal proceedings arising from the normal course of business activities.
82
Table of Contents
The following table provides information regarding our current executive officers and directors:
| Name |
Age |
Position(s) | ||||
| Matthew Maloney |
38 | Chief Executive Officer and Director | ||||
| Jonathan Zabusky |
40 | President and Director | ||||
| Adam DeWitt |
42 | Chief Financial Officer and Treasurer | ||||
| Margo Drucker |
50 | Senior Vice President, General Counsel and Secretary | ||||
| Brian McAndrews |
55 | Chairman of the Board | ||||
| David Fisher |
45 | Director | ||||
| Lloyd Frink |
49 | Director | ||||
| J. William Gurley |
48 | Director | ||||
| Justin Sadrian |
42 | Director | ||||
| Benjamin Spero |
38 | Director | ||||
Executive Officers
Matthew Maloney. Matthew Maloney has served, since the Merger Date, as Chief Executive Officer of GrubHub Inc., the leading online and mobile food-ordering company. Prior to the Merger, Mr. Maloney served as Chief Executive Officer of GrubHub Holdings, a company he co-founded in 2004. Mr. Maloney led GrubHub Holdings through five rounds of investment funding, the acquisition of DotMenu, the Merger with the Seamless Platform and the 2012 launch of OrderHub. Mr. Maloney currently serves as an advisory board member for The University of Chicago Booth School of Business and Polsky Center for Entrepreneurship and sits on the board of directors of Merge Healthcare Incorporated (Nasdaq: MRGE). He is a member of ChicagoNEXT, an organization dedicated to driving growth and opportunity in the Chicago business community. He is also the 2012 Built in Chicago Moxie Award winner for CEO of the Year and a regular contributor to The Wall Street Journal’s The Accelerators blog. Mr. Maloney holds an MBA and MSCS from the University of Chicago.
We believe that Mr. Maloney is qualified to serve as a member of our board of directors because of his perspective as a co-founder of GrubHub Holdings, his technology development experience and his strategic insight into the Company, gained from his role as Chief Executive Officer.
Jonathan Zabusky. Jonathan Zabusky has served as President of GrubHub Inc., where he oversees Product, Marketing, Business Development, Corporate Accounts and the Restaurant Network, since the Merger Date. From June 2011 until the Merger Date, Mr. Zabusky served as Chief Executive Officer of Seamless North America, LLC. During his tenure at Seamless, Mr. Zabusky led the spin-out/recapitalization from Aramark, the acquisition of MenuPages and the rollout of the mobile product portfolio. From December 2009 to June 2011, Mr. Zabusky served as President of SeamlessWeb Professional Solutions, Inc., and from April 2008 to December 2009, he served as Vice President of SeamlessWeb Professional Solutions, Inc. Mr. Zabusky holds a B.S. in Economics from The Wharton School of the University of Pennsylvania and an MBA from the Haas School of the University of California, Berkeley.
We believe that Mr. Zabusky is qualified to serve as a member of our board of directors because of the strategic perspective he brings from his tenure as Chief Executive Officer at Seamless North America, LLC and his operating experience focusing on the consumer market, mobile development and expanding the business into new customer segments and geographies.
Adam DeWitt. Adam DeWitt served as Chief Financial Officer of GrubHub Holdings from November 2011 until the Merger Date, and since the Merger Date, he has served in the same capacity for us. From March 2007 to October 2011, Mr. DeWitt served as Chief Financial Officer of optionsXpress Holdings, Inc., an online securities brokerage, and from March 2005 to March 2007, as its Vice President of Finance, where he managed financial reporting, budgeting, investor relations and corporate development. Mr. DeWitt holds an A.B. in Economics from Dartmouth College.
83
Table of Contents
Margo Drucker. Margo Drucker served as Vice President, General Counsel and Secretary of Seamless North America, LLC from June 2012 until the Merger Date, and since the Merger Date, she has served in the same capacities for us. From November 2005 to June 2012, Ms. Drucker served as Senior Vice President and Senior Deputy General Counsel at Martha Stewart Living Omnimedia, Inc. New York, where she oversaw all aspects of the legal department, including licensing, employment, SEC filings, corporate governance, litigation, and operational agreements. Ms. Drucker holds a B.A. in History and Economics from Brown University and a J.D. from New York University School of Law.
Non-Employee Directors
Brian McAndrews. Brian McAndrews served on the board of directors of Seamless North America, LLC from October 2011 until the Merger Date, and since the Merger Date, he has served in the same capacity for us. Mr. McAndrews currently serves as chairman, Chief Executive Officer and President of Pandora Media, Inc. From September 2009 to August 2013, Mr. McAndrews served as Managing Director and Venture Partner of Madrona Venture Group, LLC. From August 2007 to December 2008, Mr. McAndrews served as Senior Vice President, Advertiser and Publisher Solutions of the Microsoft Corporation. Mr. McAndrews also served on the board of AppNexus Inc. from November 2012 to December 2013, and he currently serves as chairman of the board of Pandora Media, Inc. and on the board of directors and compensation committee of the New York Times Company. Mr. McAndrews holds an A.B. in Economics from Harvard College and an MBA from the Stanford Graduate School of Business.
We believe that Mr. McAndrews is qualified to serve as a member of our board of directors because of his deep digital experience gained through his experience as a chief executive officer of public companies in the technology industry, as well as his private and public company director experience. His background in both traditional and digital media has also given him an understanding of digital advertising, mobile and the integration of emerging technologies, which is highly valued by the Company and the board of directors as the Company continues to expand its business.
David Fisher. David Fisher served on the board of directors of GrubHub Holdings from June 2012 until the Merger Date, and since the Merger Date, he has served in the same capacity for us. Mr. Fisher currently serves as Chief Executive Officer of Enova International, Inc. From September 2011 to March 2012, Mr. Fisher served as Chief Executive Officer of optionsXpress Holdings, Inc., and as Senior Vice President of Charles Schwab Corporation following its acquisition of optionsXpress Holdings, Inc. From October 2007 to September 2011, Mr. Fisher served as Chief Executive Officer of optionsXpress Holdings, Inc., from March 2007 to October 2007, as its President, and, from August 2004 to March 2007, as its Chief Financial Officer. Mr. Fisher currently serves on the board of directors and audit committee of Innerworkings, Inc., a global print management provider. Mr. Fisher holds a B.S. in Finance from the University of Illinois at Urbana-Champaign and a J.D. from Northwestern University School of Law.
We believe that Mr. Fisher is qualified to serve as a member of our board of directors because of his current and prior service on public company boards of directors and his experience as a chief executive officer and chief financial officer for a number of companies.
Lloyd Frink. Lloyd Frink has served on the board of directors of the Company since December 2013. Mr. Frink is co-founder of Zillow, Inc. and has served as Vice Chairman since March 2011, as a member of the board of directors since December 2004, and as President since February 2005. Mr. Frink previously served as Zillow, Inc.’s Vice President from December 2004 to February 2005, as its Treasurer from December 2009 to March 2011, and as Chief Strategy Officer from September 2010 to March 2011. From 1999 to 2004, Mr. Frink was at Expedia, Inc., where he held many leadership positions, including Senior Vice President, Supplier Relations, in which position he managed the air, hotel, car, destination services, content, merchandising and partner marketing groups from 2003 to 2004. Mr. Frink holds an A.B. in Economics from Stanford University.
84
Table of Contents
Mr. Frink is qualified to serve on our board of directors because of his extensive background and experience with Internet-based companies, including experience in marketing products to consumers through the Internet.
J. William Gurley. J. William Gurley served on the board of directors of GrubHub Holdings from November 2010 until the Merger Date, and since the Merger Date, he has served in the same capacity for us. Mr. Gurley is a general partner at Benchmark Capital, which he joined in 1999. Mr. Gurley is currently a member of the board of directors of Zillow, Inc., an online real estate marketplace. Mr. Gurley is a chartered financial analyst and holds a B.S. from the University of Florida and an MBA from the University of Texas.
We believe that Mr. Gurley is qualified to serve as a member of our board of directors because of the strategic insights he brings as a venture capital investor and his service on a variety of public company boards of directors.
Justin L. Sadrian. Justin L. Sadrian served on the board of directors of Seamless North America, LLC from October 2012 until the Merger Date, and since the Merger Date, he has served in the same capacity for us. He joined Warburg Pincus LLC in 2000. He is a partner at the firm of Warburg Pincus & Co., and a Member and Managing Director of Warburg Pincus LLC. Mr. Sadrian leads the firm’s West Coast office and focuses on media, Internet and information investments. Prior to joining the firm, Mr. Sadrian worked at J.P. Morgan in its investment banking and private equity groups. He is currently on the board of directors of Endurance International Group Holdings, Inc., MultiView, Inc., The Gordian Group, Inc. and A Place for Mom Inc. In addition, Mr. Sadrian is a Vice Chair of Friends of Hudson River Park and a director of Building Educated Leaders for Life. Mr. Sadrian received an A.B. from Dartmouth College and an MBA from Harvard Business School.
We believe that Mr. Sadrian is qualified to serve as a member of our board of directors because of the strategic insights he brings as a private equity investor in the technology and media spaces.
Benjamin Spero. Benjamin Spero served on the board of directors of Seamless North America, LLC from June 2011 until the Merger Date, and since the Merger Date, he has served in the same capacity for us. Mr. Spero currently serves as Managing Director of Spectrum, and was nominated to our board of directors by SLW Investors, LLC, an affiliate of Spectrum, pursuant to the terms of the Stockholders’ Agreement that we entered in connection with the Merger. Prior to joining Spectrum, Mr. Spero was a consultant at Bain & Company and co-founder of TouchPak, Inc. Mr. Spero has served on the boards of directors of Ancestry.com LLC, Animoto Inc., iPay Technologies, LLC, Mortgagebot LLC, NetQuote, Inc., SurveyMonkey Inc. and WeddingWire Inc. Mr. Spero is also Board Chair at Destination: Home, a public-private partnership to end homelessness in Santa Clara County. Mr. Spero holds a B.A. in Economics and History from Duke University.
We believe that Mr. Spero is qualified to serve as a member of our board of directors because of his extensive experience serving on boards of directors in the technology space as well as on public company boards.
Family Relationships
There are no family relationships among any of our directors or executive officers.
Codes of Business Conduct and Ethics
In December 2013, our board of directors adopted a code of business conduct and ethics that applies to all of our employees, officers and directors, including those officers responsible for financial reporting. The Company’s code of business conduct and ethics is available on our website at investors.grubhub.com. We expect that, to the extent required by law, any amendments to the code, or any waiver of its requirements, will be disclosed on our website.
85
Table of Contents
Board of Directors
Our business and affairs are managed under the direction of our board of directors, with Mr. McAndrews serving as Chairman. The number of directors is fixed by our board of directors, subject to the terms of our amended and restated certificate of incorporation and amended and restated bylaws. Our board of directors currently consists of 8 directors, 6 of whom qualify as “independent” under the NYSE listing standards.
In connection with the IPO, all of our then outstanding convertible preferred stock was converted into shares of common stock and all existing contractual rights to appoint directors were terminated. In accordance with our amended and restated certificate of incorporation and our amended and restated bylaws, our board of directors is divided into three classes with staggered three-year terms. Only one class of directors will be elected at each annual meeting of our stockholders, with the other classes continuing for the remainder of their respective three-year terms. Our directors are divided among the three classes as follows:
| • | the Class I directors are Messrs. Matthew Maloney, Brian McAndrews and William Gurley, and their terms expire at the annual meeting of stockholders to be held in 2015; |
| • | the Class II directors are Messrs. David Fisher, Justin Sadrian and Benjamin Spero, and their terms expire at the annual meeting of stockholders to be held in 2016; and |
| • | the Class III directors are Messrs. Lloyd Frink and Jonathan Zabusky, and their terms expire at the annual meeting of stockholders to be held in 2017. |
Any increase or decrease in the number of directors will be distributed among the three classes so that, as nearly as possible, each class will consist of one-third of the directors.
This classification of our board of directors may have the effect of delaying or preventing changes in control of our Company.
Director Independence
Our board of directors has undertaken a review of the independence of each director. Based on information provided by each director concerning his or her background, employment, and affiliations, our board of directors has determined that Messrs. Brian McAndrews, David Fisher, Lloyd Frink, William Gurley, Justin Sadrian and Benjamin Spero do not have a relationship that would interfere with the exercise of independent judgment in carrying out the responsibilities of a director and that each of these directors is “independent” as that term is defined under the applicable rules and regulations of the SEC and the listing standards of the NYSE. In making these determinations, our board of directors considered the current and prior relationships that each non-employee director has with our Company and all other facts and circumstances our board of directors deemed relevant in determining their independence, including the beneficial ownership of our capital stock by each non-employee director, and the transactions involving them described in the section titled “Certain Relationships and Related Party Transactions.”
Committees of the Board of Directors
Our board of directors has established an audit committee, a compensation committee and a nominating and governance committee. The composition and responsibilities of each of the committees of our board of directors is described below. Members will serve on these committees until their resignation or until as otherwise determined by our board of directors.
Audit Committee
Our audit committee consists of Messrs. David Fisher, William Gurley and Justin Sadrian, with Mr. David Fisher serving as Chairman. The composition of our audit committee meets the requirements for independence under current NYSE listing standards and SEC rules and regulations. Each member of our audit committee meets
86
Table of Contents
the financial literacy requirements of NYSE listing standards. In addition, our board of directors has determined that Mr. William Gurley is an audit committee financial expert within the meaning of Item 407(d) of Regulation S-K under the Securities Act. Our audit committee, among other things:
| • | selects a qualified firm to serve as the independent registered public accounting firm to audit our financial statements; |
| • | helps to ensure the independence and performance of the independent registered public accounting firm; |
| • | discusses the scope and results of the audit with the independent registered public accounting firm, and reviews, with management and the independent registered public accounting firm, our interim and year-end results of operations; |
| • | develops procedures for employees to submit concerns anonymously about questionable accounting or audit matters; |
| • | reviews our policies on risk assessment and risk management; |
| • | reviews related party transactions; |
| • | obtains and reviews a report by the independent registered public accounting firm at least annually that describes our internal control procedures, any material issues with such procedures, and any steps taken to deal with such issues; and |
| • | pre-approves (or, as permitted, approve) all audit and all permissible non-audit services, other than de minimis non-audit services, to be performed by the independent registered public accounting firm. |
Our audit committee operates under a written charter that satisfies the applicable rules of the SEC and the listing standards of NYSE.
Compensation Committee
Our compensation committee consists of Messrs. David Fisher, Lloyd Frink and Benjamin Spero, with Mr. Benjamin Spero serving as Chairman. The composition of our compensation committee meets the requirements for independence under NYSE listing standards and SEC rules and regulations. Each member of the compensation committee is also a non-employee director, as defined pursuant to Rule 16b-3 promulgated under the Exchange Act, and an outside director, as defined pursuant to Section 162(m) of the Internal Revenue Code. The purpose of our compensation committee is to discharge the responsibilities of our board of directors relating to compensation of our executive officers. Our compensation committee, among other things:
| • | reviews, approves and determines, or makes recommendations to our board of directors regarding, the compensation of our executive officers; |
| • | administers our stock and equity incentive plans; |
| • | reviews and approves and makes recommendations to our board of directors regarding incentive compensation and equity plans; and |
| • | establishes and reviews general policies relating to compensation and benefits of our employees. Our compensation committee operates under a written charter that satisfies the applicable rules of the SEC and the listing standards of the NYSE. |
Nominating and Corporate Governance Committee
Our nominating and corporate governance committee consists of Messrs. Brian McAndrews, Justin Sadrian and Benjamin Spero, with Mr. Justin Sadrian serving as Chairman. The composition of our nominating and corporate governance committee meets the requirements for independence under listing standards and SEC rules and regulations. Our nominating and corporate governance committee, among other things:
| • | identifies, evaluates and selects, or makes recommendations to our board of directors regarding, nominees for election to our board of directors and its committees; |
87
Table of Contents
| • | evaluates the performance of our board of directors and of individual directors; |
| • | considers and makes recommendations to our board of directors regarding the composition of our board of directors and its committees; |
| • | reviews developments in corporate governance practices; |
| • | evaluates the adequacy of our corporate governance practices and reporting; and |
| • | develops and makes recommendations to our board of directors regarding corporate governance guidelines and matters. |
The nominating and governance committee operates under a written charter that satisfies the applicable listing requirements and rules of the NYSE.
Compensation Committee Interlocks and Insider Participation
None of the members of our compensation committee is or has at any time during the past year been an officer or employee of ours. None of our executive officers currently serves, or in the past year has served, as a member of the board of directors or compensation committee of any entity that has one or more executive officers serving on our board of directors or compensation committee.
Director Compensation
The following table sets forth information concerning compensation paid or accrued for services rendered to us by members of our board of directors for the year ended December 31, 2013.
Director Compensation Table—2013
The following table sets forth information concerning compensation paid for services rendered to us by members of our board of directors for the year ended December 31, 2013.
| Name |
Fees Earned or Paid in Cash |
Option Awards |
Total | |||||||||
| Brian McAndrews |
$ | 75,000 | $ | — | $ | 75,000 | ||||||
| David Fisher |
— | — | — | |||||||||
| J. William Gurley |
— | — | — | |||||||||
| Justin Sadrian |
— | — | — | |||||||||
| Benjamin Spero |
— | — | — | |||||||||
| Lloyd Frink(1) |
— | 116,000 | 116,000 | |||||||||
| (1) | Mr. Lloyd Frink was appointed a director on December 19, 2013. In connection with his appointment, he was granted 20,000 options with a value of $116,000 (using the fair value of the award as of the grant date calculated in accordance with Accounting Standards Codification 718, Stock Compensation (“ASC 718”), excluding any estimate of future forfeitures). |
The table excludes Messrs. Matthew Maloney, Michael Evans and Jonathan Zabusky, who were also employees of the Company and did not received compensation for their services as directors for the year ended December 31, 2013. See the section titled “Executive Compensation” for more information about the compensation of such employees. Of our non-employee directors, Messrs. McAndrews and Frink are the only directors who received compensation in the year ended December 31, 2013, as shown in the table above.
Effective as of January 1, 2014, our policy is to provide Messrs. Lloyd Frink, Brian McAndrews and David Fisher (and any other non-employee director that is not serving on our board of directors by virtue of his or her relationship with a significant institutional shareholder) with compensation for their services on our board of
88
Table of Contents
directors (each an “Unaffiliated Director”). Each Unaffiliated Director receives an annual cash compensation of $30,000. The Unaffiliated Director chair of the board of directors receives a supplemental annual cash compensation of $30,000. Any Unaffiliated Director chairs of the audit and compensation committees receive a supplemental $20,000 in annual cash compensation, and any Unaffiliated Director chair of the nominating and corporate governance committee receives a supplemental $12,000 in annual cash compensation. Any Unaffiliated Director, non-chair members of the audit committee receive a supplemental annual cash compensation of $10,000. Any Unaffiliated Director, non-chair members of the compensation committee receive a supplemental annual cash compensation of $6,000, and any Unaffiliated Director, non-chair members of the nominating and corporate governance committee receive a supplemental annual cash compensation of $3,000. Upon completion of our IPO, each of the Unaffiliated Directors received an annual equity option grant of $100,000 in value. Any Unaffiliated Director who is appointed will receive an initial option grant of $250,000 upon appointment.
Directors have been and will continue to be reimbursed for travel, food, lodging and other expenses directly related to their activities as directors. Directors are also entitled to the protection provided by their indemnification agreements and the indemnification provisions in our amended and restated certificate of incorporation as described in further detail below.
Limitation of Liability and Indemnification of Officers and Directors
Our amended and restated certificate of incorporation contains provisions that limit the liability of our directors for monetary damages to the fullest extent permitted by Delaware law. Consequently, our directors will not be personally liable to us or our stockholders for monetary damages for any breach of fiduciary duties as directors, except liability for the following:
| • | any breach of their duty of loyalty to our Company or our stockholders; |
| • | any act or omission not in good faith or that involves intentional misconduct or a knowing violation of law; |
| • | unlawful payments of dividends or unlawful stock repurchases or redemptions as provided in Section 174 of the Delaware General Corporation Law (“DGCL”); or |
| • | any transaction from which they derived an improper personal benefit. |
Any amendment to, or repeal of, these provisions will not eliminate or reduce the effect of these provisions in respect of any act, omission or claim that occurred or arose prior to that amendment or repeal. If the DGCL is amended to provide for further limitations on the personal liability of directors of corporations, then the personal liability of our directors will be further limited to the greatest extent permitted by the DGCL.
Our amended and restated bylaws provide that we will indemnify, to the fullest extent permitted by law, any person who is or was a party or is threatened to be made a party to any action, suit or proceeding by reason of the fact that he or she is or was one of our directors or officers or is or was serving at our request as a director or officer of another corporation, partnership, joint venture, trust, or other enterprise. Our amended and restated bylaws provide that we may indemnify to the fullest extent permitted by law any person who is or was a party or is threatened to be made a party to any action, suit or proceeding by reason of the fact that he or she is or was one of our employees or agents or is or was serving at our request as an employee or agent of another corporation, partnership, joint venture, trust, or other enterprise. Our amended and restated bylaws also provide that we must advance expenses incurred by or on behalf of a director or officer in advance of the final disposition of any action or proceeding, subject to very limited exceptions.
Further, we have entered into indemnification agreements with each of our directors and executive officers that may be broader than the specific indemnification provisions contained in the DGCL. These indemnification agreements will require us, among other things, to indemnify our directors and executive officers against liabilities that may arise by reason of their status or service. These indemnification agreements will also require
89
Table of Contents
us to advance all expenses incurred by the directors and executive officers in investigating or defending any such action, suit, or proceeding. We believe that these agreements are necessary to attract and retain qualified individuals to serve as directors and executive officers.
The limitation of liability and indemnification provisions that are included in our amended and restated certificate of incorporation, amended restated bylaws, and in indemnification agreements that we entered into with our directors and executive officers may discourage stockholders from bringing a lawsuit against our directors and executive officers for breach of their fiduciary duties. They may also reduce the likelihood of derivative litigation against our directors and executive officers, even though an action, if successful, might benefit us and other stockholders. Further, a stockholder’s investment may be adversely affected to the extent that we pay the costs of settlement and damage awards against directors and executive officers as required by these indemnification provisions. At present, we are not aware of any pending litigation or proceeding involving any person who is or was one of our directors, officers, employees or other agents or is or was serving at our request as a director, officer, employee or agent of another corporation, partnership, joint venture, trust or other enterprise, for which indemnification is sought, and we are not aware of any threatened litigation that may result in claims for indemnification.
We have obtained insurance policies under which, subject to the limitations of the policies, coverage is provided to our directors and executive officers against loss arising from claims made by reason of breach of fiduciary duty or other wrongful acts as a director or executive officer, including claims relating to public securities matters, and to us with respect to payments that may be made by us to these directors and executive officers pursuant to our indemnification obligations or otherwise as a matter of law.
Certain of our non-employee directors may, through their relationships with their employers, be insured and/or indemnified against certain liabilities incurred in their capacity as members of our board of directors.
The underwriting agreement provides for indemnification by the underwriters of us and our officers, directors and employees for certain liabilities arising under the Securities Act, or otherwise.
Insofar as indemnification for liabilities arising under the Securities Act may be permitted to directors, officers or persons controlling our company pursuant to the foregoing provisions, we have been informed that, in the opinion of the SEC, such indemnification is against public policy as expressed in the Securities Act and is therefore unenforceable.
90
Table of Contents
The following section provides compensation information pursuant to the scaled disclosure rules applicable to “emerging growth companies” under the rules of the SEC.
Named Executive Officers
Our named executive officers (“NEOs”), for the year ending December 31, 2013, which consisted of our principal executive officer, our previous principal executive officer who serves as our president, and our two other most highly-compensated executives, are:
| • | Matthew Maloney, our Chief Executive Officer (“CEO”); |
| • | Jonathan Zabusky, our President (“President”); |
| • | Adam DeWitt, our Chief Financial Officer (“CFO”); and |
| • | Michael Evans, our former Chief Operating Officer (“COO”). Effective May 5, 2014, Michael Evans resigned from his position as COO of the Company. As previously disclosed in the prospectus filed with the SEC pursuant to Rule 424(b) under the Securities Act on April 7, 2014 (file no. 333-194219), Mr. Evans had planned to leave the Company on or before June 30, 2014 to pursue other opportunities. |
Introduction
In connection with the Merger, the Company entered into amended employment agreements with our NEOs, adopted the 2013 Omnibus Incentive Plan (the “2013 Plan”), and assumed under the 2013 Plan each of the NEO’s option awards that were outstanding prior to the Merger (the “Pre-Merger Options”), each of which are described in further detail below.
2013 Summary Compensation Table
The following table summarizes the compensation awarded to, earned by or paid to our NEOs for the fiscal year ended December 31, 2013. Amounts for the period of time prior to the Merger in 2013 reflect compensation earned by Messrs. Maloney, DeWitt and Evans in connection with their GrubHub Holdings employment and compensation earned by Mr. Zabusky prior to the Merger in connection with his Seamless North America, LLC employment.
| Name and Principal Position |
Year | Salary | Bonus(1) | Option Awards(2) |
All
Other Compensation(3) |
Total | ||||||||||||||||||
| Mathew Maloney (CEO) |
2013 | $ | 265,000 | $ | — | $ | 407,668 | $ | 10,159 | $ | 682,827 | |||||||||||||
| Jonathan H. Zabusky (President) |
2013 | 328,183 | 244,000 | — | 97,310 | (4) | 669,493 | |||||||||||||||||
| Adam DeWitt (CFO) |
2013 | 300,000 | 300,000 | 102,264 | 14,750 | 717,014 | ||||||||||||||||||
| Michael Evans (former COO) |
2013 | 265,000 | — | 374,119 | 10,159 | 649,278 | ||||||||||||||||||
| (1) | The bonus column for Mr. Zabusky displays the bonus earned by him in respect of Seamless North America, LLC’s fiscal year ended September 30, 2013 ($205,100, which was paid November 7, 2013) and the bonus earned by Mr. Zabusky in respect of the remaining portion of 2013 ($38,900, which was paid January 16, 2014), which was paid to reflect the Company’s change to a calendar fiscal year. Messrs. Maloney, DeWitt and Evans did not receive annual bonuses for 2013. However, Mr. DeWitt received a $300,000 retention bonus, which was paid on November 29, 2013. |
| (2) | Mr. Zabusky was not granted any new option awards in 2013. The value of Messrs. Maloney, DeWitt and Evans’ option awards are based on the fair value of the award as of the grant date calculated in accordance with ASC 718, excluding any estimate of future forfeitures. Regardless of such option awards’ fair value on the grant date, the actual value that may be recognized by the NEOs will depend on the market value of our common stock on a future date when such stock option vests. |
91
Table of Contents
| (3) | The amount reported in this column for Messrs. Maloney, DeWitt and Evans consists of the 401(k) company matching contributions made for each executive in 2013. |
| (4) | The compensation listed for Mr. Zabusky in this column includes (i) the Company’s reimbursement of Mr. Zabusky’s transportation costs to New York City with respect to 2013 and the associated tax gross-up amount (transportation costs—$22,249, hotel—$13,527, and tax gross-up amount—$30,623); (ii) Mr. Zabusky’s car payment for 2013 ($13,200); (iii) long-term disability and life insurance benefits for 2013 ($9,432); and (iv) the 401(k) plan company matching contributions made in 2013 on behalf of Mr. Zabusky ($8,279). |
Outstanding Equity Awards as of December 31, 2013
The following table sets forth information regarding outstanding equity awards as of December 31, 2013 for each of our NEOs. All share and per share amounts reflect the Reverse Stock Split and the rounding associated with such Reverse Stock Split, which was effected on April 2, 2014.
| Name |
Number of Securities underlying unexercised Options that are exercisable as of December 31, 2013(1) |
Number
of Securities underlying unexercised Options that are not exercisable as of December 31, 2013 |
Option Exercise Price |
Option Expiration Date |
Unvested Shares of Stock(2) |
Market Value of Unvested Shares of Stock |
||||||||||||||||||
| Matthew Maloney(3) |
0 | 36,178 | $ | 8.40 | 3/12/2023 | — | — | |||||||||||||||||
| Matthew Maloney(4) |
0 | 50,599 | $ | 8.40 | 1/28/2023 | — | — | |||||||||||||||||
| Matthew Maloney |
0 | 32,090 | $ | 6.18 | 11/16/2022 | — | — | |||||||||||||||||
| Matthew Maloney |
0 | 32,090 | $ | 5.06 | 7/26/2022 | — | — | |||||||||||||||||
| Matthew Maloney |
9,913 | 192,647 | $ | 2.00 | 4/23/2022 | — | — | |||||||||||||||||
| Matthew Maloney |
— | — | — | — | 92,035 | $ | 1,260,880 | |||||||||||||||||
| Jonathan H. Zabusky(5) |
101,563 | 273,437 | $ | 5.60 | 11/15/2022 | |||||||||||||||||||
| Jonathan H. Zabusky |
625,000 | 375,000 | $ | 3.80 | 9/13/2021 | — | — | |||||||||||||||||
| Adam DeWitt(6) |
0 | 18,414 | $ | 8.40 | 3/12/2023 | — | — | |||||||||||||||||
| Adam DeWitt |
0 | 16,333 | $ | 6.18 | 11/16/2022 | — | — | |||||||||||||||||
| Adam DeWitt |
0 | 16,333 | $ | 5.06 | 7/26/2022 | — | — | |||||||||||||||||
| Adam DeWitt |
0 | 16,333 | $ | 2.00 | 4/23/2022 | — | — | |||||||||||||||||
| Adam DeWitt(7) |
0 | 43,009 | $ | 2.00 | 12/7/2021 | — | — | |||||||||||||||||
| Adam DeWitt |
111,279 | 102,377 | $ | 2.00 | 12/7/2021 | — | — | |||||||||||||||||
| Michael Evans(8) |
0 | 30,130 | $ | 8.40 | 3/12/2023 | — | — | |||||||||||||||||
| Michael Evans(9) |
0 | 50,599 | $ | 8.40 | 1/28/2023 | — | — | |||||||||||||||||
| Michael Evans |
0 | 26,724 | $ | 6.18 | 11/16/2022 | — | — | |||||||||||||||||
| Michael Evans |
0 | 26,724 | $ | 5.06 | 7/26/2022 | — | — | |||||||||||||||||
| Michael Evans |
9,913 | 149,726 | $ | 2.00 | 4/23/2022 | — | — | |||||||||||||||||
| Michael Evans |
— | — | — | — | 92,035 | $ | 1,260,880 | |||||||||||||||||
| (1) | The amounts shown above have been converted to reflect the post-Merger amounts and the post-Merger exercise prices of option awards that were assumed by the Company. |
| (2) | Messrs. Maloney and Evans were each granted restricted stock in GrubHub Holdings, pursuant to Restricted Stock Purchase Agreements, each dated November 3, 2010. For each of Messrs. Maloney and Evans, the number of shares of restricted stock subject to repurchase upon a termination at the end of 2013 was 92,035 as set forth in the table. The number subject to repurchase has decreased and will continue to decrease in 2014 as follows: Upon a termination of employment of the applicable NEO for any reason between February 3, 2014 and May 2, 2014 (inclusive), 69,032 shares held by such NEO under his Restricted Stock Purchase Agreement will be subject to repurchase by the company at $0.78 per share. The number of shares subject to repurchase upon a termination decreases in two further installments between May 3, 2014 and November 2, 2014 until no shares are subject to repurchase if a termination occurs on November 2, 2014 or thereafter. However, pursuant to Mr. Evans’ employment agreement, 5,753 shares that would have been subject to repurchase pursuant to his Restricted Stock Purchase Agreement are no longer subject to repurchase as of February 8, 2014. |
| (3) | Awards originally granted to Mr. Maloney in 2013 include: (i) the 50,599 options that were granted in replacement of the IPO incentive award granted by GrubHub Holdings to Mr. Maloney in January 2013 and (ii) the 36,178 options that were granted in replacement of Mr. Maloney’s March 2013 option award pursuant to GrubHub Holdings’ existing quarterly |
92
Table of Contents
| grant program. Mr. Maloney’s IPO incentive award was determined to be appropriate by GrubHub Holdings’ board of directors in light of Mr. Maloney’s skills and importance to a successful public offering of GrubHub Holdings, as well as the value a successful offering would bring to GrubHub Holdings. Mr. Maloney’s March 2013 quarterly grant was deemed appropriate by GrubHub Holdings’ board of directors in light of Mr. Maloney’s contributions to GrubHub Holdings and thus the board of directors awarded Mr. Maloney a quarterly grant in a similar amount to the previous quarterly grant. The remaining option awards to Mr. Maloney that are listed above were granted in replacement for option awards made prior to 2013. |
| (4) | Pursuant to the option award agreement, this option vested and became exercisable upon the consummation of the IPO. |
| (5) | Awards granted to Mr. Zabusky that are listed above were granted in replacement for option awards made prior to 2013. Pursuant to Mr. Zabusky’s employment agreement, 104,818 of his options accelerated on February 8, 2014. |
| (6) | Awards originally granted to Mr. DeWitt in 2013 include the 18,414 options that were granted in replacement of Mr. DeWitt’s March 2013 option award pursuant to GrubHub Holdings’ existing quarterly grant program. Mr. DeWitt’s March 2013 quarterly grant was deemed appropriate by GrubHub Holdings’ board of directors in light of Mr. DeWitt’s contributions to GrubHub Holdings and thus, the board of directors awarded Mr. DeWitt a quarterly grant in a similar amount to the previous quarterly grant. The remaining option awards to Mr. DeWitt that are listed above were granted in replacement for option awards made prior to 2013. |
| (7) | Pursuant to the option award agreement, this option vested and became exercisable on February 8, 2014. |
| (8) | Awards originally granted to Mr. Evans in 2013 include: (i) the 50,599 options that were granted in replacement of the IPO incentive award granted by GrubHub Holdings to Mr. Evans in January 2013 and (ii) the 30,130 options that were granted in replacement of Mr. Evans’ March 2013 option award pursuant to GrubHub Holdings’ quarterly grant program. Mr. Evans’ IPO incentive award was determined to be appropriate by GrubHub Holdings’ board of directors in light of Mr. Evans’ skills and importance to a successful public offering of GrubHub Holdings, as well as the value a successful offering would bring to GrubHub Holdings. Mr. Evans’ March 2013 quarterly grant was deemed appropriate by GrubHub Holdings’ board of directors in light of Mr. Evans’ contributions to GrubHub Holdings and thus the board of directors awarded Mr. Evans a quarterly grant in a similar amount to the previous quarterly grant. The remaining option awards to Mr. Evans that are listed above were granted in replacement for option awards made prior to 2013. |
| (9) | Pursuant to the option award agreement, this option vested and became exercisable upon the consummation of our IPO. |
NEO Employment Agreements
We are party to employment agreements with each of our NEOs. The principal features of such employment agreements are summarized below. These summaries are qualified by reference to the actual text of the employment agreements, which will be filed as exhibits to the registration statement of which this prospectus forms a part. None of our NEOs is entitled to receive severance payments upon a termination of employment other than as described below.
Mr. Maloney’s CEO Employment Agreement
Overview
Mr. Maloney’s employment agreement provides for the payment of an annual base salary and customary employee benefits. Further, the employment agreement provides that Mr. Maloney is eligible to participate in any cash incentive compensation plan to the same extent as our other senior executives; however, GrubHub Holdings never implemented such a cash incentive plan and we did not implement any such plan for our NEOs for 2013 (except for Mr. Zabusky’s bonus arrangement, as described below). Thus, Mr. Maloney did not receive a bonus in 2013. Mr. Maloney’s employment agreement does not provide a specified employment term and thus he is employed at-will, subject to the below-described termination provisions of his employment agreement.
Termination Provisions
If Mr. Maloney’s employment is terminated by the Company without “cause” or by him for “good reason” (as such terms are defined in his employment agreement), he will be entitled to receive:
| • | twelve months of his then-current base salary, payable in equal installments over twelve months; and |
| • | reimbursement of “COBRA” premiums for up to twelve months for him and any of his eligible dependents. |
93
Table of Contents
If such termination occurs within the period beginning 45 days prior to and ending twelve months after the occurrence of a change in control (as defined in Mr. Maloney’s employment agreement, but not including the Merger), then Mr. Maloney shall be entitled to receive the above-referenced severance benefits and all of Mr. Maloney’s then outstanding stock options or stock-based awards (including any outstanding options granted in replacement of his Pre-Merger Options) shall immediately vest and become exercisable. In addition, Mr. Maloney would be entitled to receive a pro rata target-bonus, if applicable, for the year of termination.
Any severance payments are conditioned upon Mr. Maloney entering into a release of claims in favor of the Company. The employment agreement also provides that Mr. Maloney continues to be subject to the non-competition and non-solicitation restrictions contained in his prior employment agreement (dated March 9, 2009), which apply during Mr. Maloney’s employment and for a two-year period thereafter (provided that the post-termination period shall be shortened to one year in respect of non-competition restrictions in the event of Mr. Maloney’s termination without “cause” or resignation for “good reason”) and that the payment of severance benefits is subject to his continued compliance with such restrictions. Further, Mr. Maloney’s employment agreement contains a 280G cut-back provision pursuant to which any payments constituting “parachute payments” under Section 280G of the Internal Revenue Code (the “Code”) shall be reduced to the extent such reduction results in a greater payment to Mr. Maloney than if no such reduction had been made.
Effect of the Merger on Mr. Maloney’s Pre-Merger Options
In connection with the Merger, we assumed Mr. Maloney’s Pre-Merger Options and replaced such options for options under the 2013 Plan. Using a 1.01197 to 1 Company share to GrubHub Holdings share ratio after such replacement, Mr. Maloney’s Pre-Merger Options were converted to options to purchase an aggregate of 353,517 shares of our common stock.
Mr. Zabusky’s President Employment Agreement
Overview
Mr. Zabusky is party to an offer letter with Seamless North America, LLC (the “Original Offer Letter”) and an Agreement Relating to Employment and Post-Employment Competition (“Original Employment Agreement”), each dated as of June 6, 2011, which were subsequently amended by a letter dated May 13, 2013 in contemplation of the Merger (the “Merger Amendment” and together with the Original Offer Letter and the Original Employment Agreement, collectively referred to herein as Mr. Zabusky’s employment agreement).
Mr. Zabusky’s Original Offer Letter provides for the payment of base salary and customary employee benefits. Further, the Original Offer Letter provides that Mr. Zabusky is eligible to participate in the Company’s bonus plan. For 2013, Mr. Zabusky’s annual target bonus opportunity was 50% of his base salary, subject to the attainment of applicable performance goals.
The Merger Amendment provides for a retention incentive, whereby 25% of Mr. Zabusky’s Pre-Merger Options that would have been unvested on the one-year anniversary of the Merger Date accelerated on February 8, 2014 (104,818 options). Such acceleration was subject to Mr. Zabusky’s continued employment with the Company through February 8, 2014. The original vesting schedule of the remaining Pre-Merger Options has shortened due to such acceleration. For clarity, the number of options that will vest on each vesting date will remain the number that would have vested in the absence of such acceleration and thus, Mr. Zabusky’s Pre-Merger Options will vest in full over a shorter period, subject to any applicable vesting conditions.
Mr. Zabusky’s employment agreement does not provide a specified employment term and thus he is employed at-will, subject to the below-described termination provisions of his employment agreement.
94
Table of Contents
Termination Provisions
If Mr. Zabusky’s employment is terminated by the Company without “cause” (as such term is defined in the Original Employment Agreement), Mr. Zabusky will be entitled to receive:
| • | compensation equal to 100% of his then-current annual base salary for a 52-week period (the “Severance Period”) which is based on Mr. Zabusky’s years of service with the Company; |
| • | continued coverage under the Company’s group health plan during the Severance Period at the same cost to Mr. Zabusky as when he was actively employed; and |
| • | continued use of the leased vehicle during the Severance Period used by Mr. Zabusky at the time of his termination (if any) under the same terms and conditions as when Mr. Zabusky was actively employed (or, if Mr. Zabusky is receiving a car allowance at the time of termination, such car allowance will continue during the Severance Period). |
The above severance payments are conditioned upon Mr. Zabusky entering into a release of claims in favor of the Company. The Original Employment Agreement also provides that the payment of severance benefits is subject to his continued compliance with the two-year post-employment non-competition and non-solicitation restrictions contained in his Original Employment Agreement.
Further, pursuant to the Merger Amendment, upon a termination of Mr. Zabusky’s employment for any reason other than for “cause” (as such term is defined in the Original Employment Agreement), any common units issued to Mr. Zabusky pursuant to his Pre-Merger Options will not be subject to Company repurchase, call or similar rights.
Effect of the Merger on Mr. Zabusky’s Pre-Merger Options
In connection with the Merger, we assumed Mr. Zabusky’s Pre-Merger Options and replaced such options for options under the 2013 Plan. Using a one-to-one Company share to Seamless North America LLC share ratio, after such replacement , the Pre-Merger Options were converted to options to purchase 1,375,000 shares of our common stock. In connection with the replacement of Mr. Zabusky’s Pre-Merger Options, the replacement agreements provide that, in the event of a change in control (as such term is defined in the 2013 Plan), 100% of Mr. Zabusky’s then unvested Pre-Merger Options will vest concurrently with the consummation of such change in control event.
Mr. DeWitt’s CFO Employment Agreement
Overview
Mr. DeWitt’s employment agreement provides for the payment of an annual base salary and customary employee benefits. Further, the employment agreement provides that Mr. DeWitt is eligible to participate in any cash incentive compensation plan to the same extent as our other senior executives; however, GrubHub Holdings never implemented such a cash incentive plan and we did not implement any such plan for our NEOs for 2013 (other than Mr. Zabusky’s bonus arrangement, as described above). Thus, Mr. DeWitt did not receive an annual bonus in 2013. However, pursuant to his employment agreement, Mr. DeWitt was granted and earned a retention cash bonus of $300,000, which was subject to his continued employment with the Company through November 7, 2013. Mr. DeWitt’s employment agreement does not provide a specified employment term and thus he is employed at-will, subject to the termination provisions of his employment agreement as described below.
Mr. DeWitt was granted two options on December 7, 2011. One was subject to time vesting (the “Initial Option”) and the other was scheduled to vest upon the consummation of an initial public offering (the “IPO Option”). Both of these options were amended by the terms of Mr. DeWitt’s May 19, 2013 employment agreement with the Company, which provided that in exchange for his waiver of the acceleration provisions of the Initial Option, which had previously entitled him to acceleration upon the Merger, he would be entitled to
95
Table of Contents
vest in the IPO Option on the earlier of February 8, 2014 or the consummation of an initial public offering (which such IPO Option vested on February 8, 2014); and the Initial Option would continue to vest for 48 months, having begun vesting on December 7, 2011. Mr. DeWitt’s employment agreement also provided that the Initial Option would vest if Mr. DeWitt were to be terminated other than for “cause” or were to be “constructively terminated” (as such terms are defined in the Initial Option award agreement), during the 45 days prior to or in the two years following the Merger Date.
Termination Provisions
If Mr. DeWitt’s employment is terminated by the Company without “cause” or by him for “good reason” (as such terms are defined in his employment agreement), he will be entitled to:
| • | twelve months of Mr. DeWitt’s then-current base salary, payable in equal installments over twelve months; and |
| • | reimbursement of “COBRA” premiums for up to twelve months for him and any of his eligible dependents. |
If such termination occurs within the period beginning 45 days prior to and ending twelve months after the occurrence of a change in control (as defined in Mr. DeWitt’s employment agreement, but not including the Merger), then Mr. DeWitt will be entitled to receive the above-referenced severance benefits and, in addition, all of Mr. DeWitt’s then-outstanding stock options or stock-based awards (including any outstanding options granted in replacement of his Pre-Merger Options) shall immediately vest and become exercisable. In addition, Mr. DeWitt would be entitled to receive a pro rata target-bonus, if applicable, for the year of termination.
Any severance payments are conditioned upon Mr. DeWitt entering into a release of claims in favor of the Company. The employment agreement also provides that Mr. DeWitt continues to be subject to non-competition and non-solicitation restrictions contained in his Protective Agreement (dated October 7, 2011) during employment and for one year thereafter and that the payment of severance benefits is subject to his continued compliance with such restrictions. Further, Mr. DeWitt’s employment agreement contains a 280G cut-back provision pursuant to which any payments constituting “parachute payments” under Section 280G of the Code shall be reduced to the extent such reduction results in a greater payment to Mr. DeWitt than if no such reduction had been made.
Effect of the Merger on Mr. DeWitt’s Pre-Merger Options
In connection with the Merger, we assumed Mr. DeWitt’s Pre-Merger Options (including Mr. DeWitt’s Initial Option and IPO Option) and replaced such options for options under the 2013 Plan. Using a 1.01197 to 1 Company share to GrubHub Holdings share ratio, after such replacement, the Pre-Merger Options were converted to options to purchase an aggregate of 324,078 shares of our common stock.
Mr. Evans’ COO Employment Agreement
Overview
Mr. Evans’ employment agreement provided for the payment of an annual base salary and customary employee benefits. Further, the employment agreement provided that Mr. Evans was eligible to participate in any cash incentive compensation plan to the same extent as our other senior executives; however, GrubHub Holdings never implemented such a cash incentive plan and we did not implement any such plan for our NEOs for 2013 (other than Mr. Zabusky’s bonus arrangement, as described above). Thus, Mr. Evans did not receive a bonus in 2013. Mr. Evans’ employment agreement did not provide a specified employment term and thus he was employed at-will, subject to the termination provisions of his employment agreement as described below.
Mr. Evans’ employment agreement also provided that 25% of Mr. Evans’ Pre-Merger Options that would have been unvested on the one-year anniversary of the Merger Date vested effective February 8, 2014. Further,
96
Table of Contents
pursuant to Mr. Evans’ employment agreement, 5,753 of the shares of restricted stock subject to our repurchase pursuant to Mr. Evans’ Executive Restricted Stock Purchase Agreement, dated November 3, 2010, were no longer subject to repurchase effective on February 8, 2014.
Effective May 5, 2014, Mr. Evans resigned from his position as COO of the Company. Upon his resignation, Mr. Evans received an extension beyond the expiration date of his vested options, which allows him to exercise his options through the close of business on October 2, 2014.
Termination Provisions
If Mr. Evans’ employment were terminated by the Company without “cause” or by him for “good reason” (as such terms are defined in his employment agreement), he would have been entitled to receive:
| • | twelve months of Mr. Evans’ then-current base salary, payable in equal installments over twelve months; and |
| • | reimbursement of “COBRA” premiums for up to twelve months for him and any of his eligible dependents. |
If such termination occurred within the period beginning 45 days prior to and ending twelve months after the occurrence of a change in control (as defined in Mr. Evans’ employment agreement, but not including the Merger), then Mr. Evans would have been entitled to receive the above-referenced severance benefits and, in addition, all of Mr. Evans’ then outstanding stock options or stock-based awards (including any outstanding options granted in replacement of his Pre-Merger Options) would have immediately vested and become exercisable, and would have been subject to the Evans Extended Exercise Benefit. In addition, Mr. Evans would have been entitled to receive a pro rata target-bonus, if applicable, for the year of termination.
Any severance payments were conditioned upon Mr. Evans entering into a release of claims in favor of the Company. The employment agreement also provided that Mr. Evans continue to be subject to the non-competition and non-solicitation restrictions contained in his prior employment agreement (dated March 9, 2009), which applied during Mr. Evans’ employment and for a two-year period thereafter (provided that the post-termination period would be shortened to one year in respect of non-competition restrictions had Mr. Evans’ termination been without “cause” or resignation for “good reason”) and that the payment of severance benefits would have been subject to his continued compliance with such restrictions. Further, Mr. Evans’ employment agreement contained a 280G cut-back provision pursuant to which any payments constituting “parachute payments” under Section 280G of the Code would be reduced to the extent such reduction results in a greater payment to Mr. Evans than if no such reduction had been made.
Effect of the Merger on Mr. Evans’ Pre-Merger Options
In connection with the Merger, we assumed Mr. Evans’ Pre-Merger Options and replaced such options for options under the 2013 Plan. Using a 1.01197 to 1 Company share to GrubHub Holdings share ratio, after such replacement, Mr. Evans’ Pre-Merger Options were converted to options to purchase an aggregate of 293,816 shares of our common stock.
2013 Omnibus Incentive Plan
The following is a summary of the material terms of our 2013 Plan. This summary is qualified by reference to the actual text of the plan, which will be filed as an exhibit to the registration statement of which this prospectus forms a part.
Effectiveness and Term. The 2013 Plan was approved by our board of directors on August 8, 2013, and became effective on such date. The 2013 Plan will remain available for the grant of awards until the tenth anniversary of the effective date. The 2013 Plan is our only equity incentive plan. All other historic equity incentive plans were terminated effective as of the Merger Date.
97
Table of Contents
General. The 2013 Plan authorizes the grant of nonqualified stock options, incentive stock options, restricted stock, restricted stock units (“RSUs”), common stock and cash bonuses to employees, directors, officers and other service providers. The number of shares of common stock available for issuance pursuant to awards granted under the 2013 Plan may not exceed 10,351,283. The number of shares issued or reserved pursuant to the 2013 Plan (or pursuant to outstanding awards) is subject to adjustment as a result of mergers, consolidations, reorganizations, stock splits, stock dividends and other changes in our common stock, as further described below. Shares subject to awards that have been terminated, expired unexercised, forfeited or settled in cash shall be again available for the grant of awards under the 2013 Plan. Further, shares that have been delivered to us in payment or satisfaction of the exercise price, purchase price or tax withholding obligation of an award will be available for awards under the 2013 Plan.
Administration. The 2013 Plan is administered by our board of directors or a committee of the board of directors as designated by our board of directors. The plan administrator has the discretion to determine the individuals to whom awards may be granted under the 2013 Plan, the manner in which such awards will vest and the other conditions applicable to awards in accordance with the terms in the 2013 Plan. The plan administrator is authorized to interpret the 2013 Plan, to establish, amend and rescind any rules and regulations relating to the 2013 Plan and to make any other determinations that it deems necessary or desirable for the administration of the 2013 Plan.
Options, Restricted Stock, RSUs and Other Stock Based Awards. The plan administrator may award options, restricted common stock, RSUs and other stock-based awards. Other stock-based awards may be payable in shares of common stock, cash or other property, in the plan administrator’s discretion. The plan administrator will determine the terms and conditions applicable to any of the foregoing awards in accordance with the 2013 Plan.
Cash Bonuses. The plan administrator may award participants cash bonuses payable upon the attainment of performance goals or other criteria, as determined by the plan administrator. The plan administrator will determine the terms and conditions applicable to each award of a cash bonus, including any performance conditions, timing of payments and other terms.
Performance Criteria. Vesting of awards granted under the 2013 Plan may be subject to the satisfaction of one or more performance goals established by the plan administrator. The performance goals may vary from participant to participant, group to group and period to period.
Adjustments. In the event of any reorganizations, recapitalizations, stock splits, reverse stock splits, stock dividends, extraordinary dividends, distributions or similar events, the plan administrator will adjust the number of shares available under and subject to outstanding awards under the 2013 Plan.
Change in Control. Unless otherwise expressly provided in the award agreement or another contract, including an employment agreement, the plan administrator may provide for the acceleration of the vesting and, if applicable, exercisability of any outstanding award, or portion thereof, or the lapsing of any conditions or restrictions on or the time for payment in respect of any outstanding award, or portion thereof, upon a change in control. In addition, unless otherwise expressly provided in the award agreement or another contract, including an employment agreement, or under the terms of a transaction constituting a change in control, the plan administrator may provide that any or all of the following shall occur in connection with a change in control:
| (a) | the cancellation of any outstanding award in exchange for either an amount of cash or other property with a value equal to the amount that could have been obtained upon the exercise of the award to the extent vested; |
| (b) | the substitution for the common stock subject to any outstanding award, or portion thereof, of stock or other securities of the surviving corporation or any successor corporation to us, or a parent or subsidiary thereof, in which event the aggregate purchase or exercise price, if any, of such award, or portion thereof, shall remain the same; |
98
Table of Contents
| (c) | the acceleration of the vesting (and, as applicable, the exercisability) of any and all outstanding awards; |
| (d) | the termination of any award following the applicable event; |
| (e) | the replacement of any award with other rights or property; and/or |
| (f) | the cancellation of any outstanding and unexercised awards upon or following the completion of the change in control. |
Amendment and Termination. Our board of directors may amend, alter or discontinue the 2013 Plan in any respect at any time, but no amendment may diminish any of the rights of a participant under any awards previously granted without his or her consent.
2014 Changes
In the beginning of 2014, the Company made the following changes:
| • | Increased the base salary of our NEOs as follows: |
| • | Mr. Maloney: $400,000; |
| • | Mr. Zabusky: $333,000; |
| • | Mr. DeWitt: $300,000; and |
| • | Mr. Evans: $267,000. |
| • | Adopted a bonus plan for 2014 (the Management Incentive Bonus program) and designated a target bonus amount for each NEO equal to 50% of the applicable NEO’s annual base salary. |
| • | Granted options under the 2013 Plan to three of our NEOs in the following amounts: |
| • | Mr. Maloney: 225,000 options; |
| • | Mr. Zabusky: 137,500 options; and |
| • | Mr. DeWitt: 100,000 options. |
| • | Effective May 5, 2014, Michael Evans resigned from his position as COO of the Company. |
99
Table of Contents
CERTAIN RELATIONSHIPS AND RELATED PARTY TRANSACTIONS
In addition to the compensation arrangements, including employment, termination of employment and change in control arrangements and indemnification arrangements, discussed, when required, in the sections titled “Management” and “Executive Compensation,” the following is a description of each transaction since January 1, 2012 and each currently proposed transaction in which:
| • | we have been or are to be a participant; |
| • | the amount involved exceeded or exceeds $120,000; and |
| • | any of our directors, executive officers or holders of more than 5% of our capital stock, or any immediate family member of, or person sharing the household with, any of these individuals, had or will have a direct or indirect material interest. |
Stockholders’ Agreement
On May 19, 2013, we entered into a stockholders’ agreement, as amended on August 8, 2013 and February 7, 2014 (the “Stockholders’ Agreement”) with certain stockholders listed therein. The Stockholders’ Agreement was terminated concurrently with the consummation of the IPO.
The Stockholders’ Agreement granted each stockholder the right to vote its respective shares of stock to ensure that the size of our board of directors was set and remained at nine directors, and it also granted certain groups of stockholders, subject to certain conditions, the right to nominate representatives to committees of our board of directors. Each stockholder also agreed, immediately prior to the IPO, to vote to ensure that the board seat held by Mike Evans, and positions held by the board of directors observers, were automatically eliminated such that such individuals no longer occupy those seats and positions.
The Stockholders’ Agreement provided that, subject to certain exceptions, certain actions may not be taken without the written approval of the majority consent of each group of stockholders listed therein.
The Stockholders’ Agreement also contained agreements with respect to restrictions on the sale, issuance or transfer of shares that prevented certain stockholders from transferring their shares without the majority consent of each group of stockholders listed therein, unless otherwise provided for in the Stockholders’ Agreement. Furthermore, the Stockholders’ Agreement provided us and stockholders holding at least a 1% interest in our company a right of first refusal on any proposed transfer of shares. In the event of a transfer of shares approved by the majority of each group of stockholders listed therein, each non-transferring stockholder had tag-along rights to sell its shares. The Stockholders’ Agreement also granted us the rights to require stockholders to sell their shares in the event of a merger, sale, reorganization, recapitalization or other transaction that would result in a change of control.
Registration Rights Agreement
On August 8, 2013, we entered into a registration rights agreement (the “Registration Rights Agreement”) with certain holders of our stock listed therein (collectively, and as amended, “Holders”). Pursuant to the terms of the Registration Rights Agreement, and subject to the restrictions of the Lock-up Agreements described in “Shares Eligible for Future Sale,” Holders are entitled to demand and piggyback rights.
Demand Registrations. Under the Registration Rights Agreement, following our IPO, Holders are able to require us, by delivering written notice, to file a registration statement covering at least $25,000,000 of the common stock issued to the Holders and any of those securities issued to the Holders by way of share split, share dividend, recapitalization, exchange, merger, consolidation or similar event or otherwise, and held by all of the Holders immediately prior to the filing of the registration statement (any such written notice, a “Demand Notice” and any such registration, a “Demand Registration”). We are required to use our reasonable best efforts to effect
100
Table of Contents
such registration in accordance with the terms of the Demand Notice, subject to certain rights we will have to delay or postpone such registration. Certain Holders are limited by the number of Demand Registrations that they may require us to effect. At any time before the effective date of registration, the requisite Holders who provided the Demand Notice with respect to such Demand Registration, on behalf of all of the selling Holders, may revoke such request without liability to such selling Holders, by providing written notice to the Company revoking such request.
Piggyback Registrations. Under the Registration Rights Agreement, if at any time we propose to register any of our equity securities under the Securities Act (other than a registration statement on Form S-4, Form S-8 or any successor forms thereto, or pursuant to an employee benefit or dividend reinvestment plan), we will be required to notify the Holders 20 days before the anticipated filing date of their right to participate in such registration. We will use reasonable best efforts to cause all eligible securities requested to be included in the registration statement to be so included. We have the right to reduce the amount of securities to be offered by the Holders in such registration statement if the underwriters deem that the proposed amount of securities to be sold will adversely affect the success of the sale of securities. We have the right to withdraw or postpone the filing of a registration statement in which the Holders have elected to exercise piggyback registration rights.
Other Transactions
We have granted stock options to our executive officers and certain of our directors. See the sections titled “Executive Compensation” and “Management—Director Compensation” for more information regarding these grants.
In January 2012, Aramark repaid us for a $16.0 million loan made on December 31, 2011, including accumulated accrued interest. We also made short-term advances to Aramark, which were repaid during 2012.
In 2012 and 2013, we had a cash management program with Aramark whereby Aramark funded all payroll and related costs and we deposited all cumulative excess cash balances with Aramark. At December 31, 2012, the balance due to Aramark was $0.2 million. This program was terminated during 2013 and no balance was due at December 31, 2013.
During the year ended December 31, 2012, we had an arrangement with Aramark to provide support for certain corporate, accounting, information technology and other administrative services. Total expenses under this arrangement for the year ended December 31, 2012 were $0.4 million. The arrangement terminated upon the October 2012 spin-off of Seamless North America, LLC to Seamless Holdings.
Other than as described above under this section titled “Certain Relationships and Related Party Transactions,” since January 1, 2012, we have not entered into any transactions, nor are there any currently proposed transactions, between us and a related party where the amount involved exceeds, or would exceed, $120,000, and in which any related person had or will have a direct or indirect material interest. We believe the terms of the transactions described above were comparable to terms we could have obtained in arm’s-length dealings with unrelated third parties.
Policies and Procedures for Related Party Transactions
The audit committee has the primary responsibility for reviewing and approving or disapproving “related party transactions,” which are transactions between us and related persons in which the aggregate amount involved exceeds or may be expected to exceed $120,000 and in which a related person has or will have a direct or indirect material interest. For purposes of this policy, a related person will be defined as a director, executive officer, nominee for director, or greater than 5% beneficial owner of our common stock, in each case since the beginning of the most recently completed year, and their immediate family members. Our audit committee charter provides that the audit committee shall review and approve or disapprove any related party transactions. We have adopted a written policy governing the review and approval of related party transactions.
101
Table of Contents
PRINCIPAL AND SELLING STOCKHOLDERS
The following table sets forth certain information with respect to the beneficial ownership of our common stock as of August 25, 2014, as adjusted to reflect the sale of common stock offered by us in this offering, for:
| • | each of our named executive officers; |
| • | each of our directors; |
| • | all of our current executive officers and directors as a group; |
| • | each person known by us to be the beneficial owner of more than 5% of any class of our voting securities; and |
| • | each selling stockholder. |
We have determined beneficial ownership in accordance with the rules of the SEC, and thus it represents sole or shared voting or investment power with respect to our securities. Unless otherwise indicated below, to our knowledge, the persons and entities named in the table have sole voting and sole investment power with respect to all shares that they beneficially owned, subject to community property laws where applicable. We have deemed shares of our common stock subject to options that are currently exercisable or will become exercisable within 60 days of August 25, 2014 (October 24, 2014) to be outstanding and to be beneficially owned by the person holding the option for the purpose of computing the percentage ownership of that person but have not treated them as outstanding for the purpose of computing the percentage ownership of any other person.
We have based percentage ownership of our common stock before this offering on 78,831,644 shares of our common stock outstanding as of August 25, 2014. Percentage ownership of our common stock after this offering assumes the Company’s sale of shares of common stock in this offering. In addition, common stock issuable pursuant to stock options are deemed outstanding for computing the percentage of the person holding such options, but are not outstanding for computing the percentage of any other person.
Members of our senior management, including certain of our executive officers, intend to exercise vested stock options to purchase a number of shares of our common stock substantially concurrent with this offering, which shares are expected to be sold in this offering.
Unless otherwise indicated, the address of each beneficial owner listed in the table below is c/o GrubHub Inc., 111 W. Washington Street, Suite 2100, Chicago, Illinois 60602.
| Shares beneficially owned prior to offering |
Number of shares being offered |
Shares beneficially owned after the offering (assuming no exercise of the underwriters’ option to purchase additional shares) |
Number of additional shares offered if underwriters’ option is exercised in full |
Shares beneficially owned after the offering (assuming full exercise of the underwriters’ option to purchase additional shares) |
||||||||||||||||||||||||||||
| Name and Address of Beneficial Owner(1) |
Number | Percentage | Number | Percentage | Number | Percentage | ||||||||||||||||||||||||||
| Named Executive Officers and Directors |
||||||||||||||||||||||||||||||||
| Matthew Maloney(2) |
2,150,667 | 2.73 | % | 183,089 | 1,967,578 | 2.45 | % | 31,372 | 1,936,206 | 2.42 | % | |||||||||||||||||||||
| Jonathan Zabusky(3) |
971,514 | * | 298,801 | 672,713 | * | 51,199 | 621,514 | * | ||||||||||||||||||||||||
| Adam DeWitt(4) |
198,800 | * | 42,686 | 156,114 | * | 7,314 | 148,800 | * | ||||||||||||||||||||||||
| Michael Evans(5) |
2,131,371 | 2.70 | % | — | 2,113,371 | 2.64 | % | — | 2,113,371 | 2.64 | % | |||||||||||||||||||||
| Brian McAndrews(6) |
190,532 | * | 46,954 | 143,578 | * | 8,046 | 135,532 | * | ||||||||||||||||||||||||
| David Fisher(7) |
32,547 | * | — | 32,547 | * | — | 32,547 | * | ||||||||||||||||||||||||
| Lloyd Frink(8) |
80,031 | * | — | 80,031 | * | — | 80,031 | * | ||||||||||||||||||||||||
| J. William Gurley(9) |
6,194,300 | 7.86 | % | — | 6,194,300 | 7.73 | % | — | 6,194,300 | 7.73 | % | |||||||||||||||||||||
| Justin L. Sadrian(10) |
6,092,959 | 7.73 | % | 1,920,865 | 4,172,094 | 5.21 | % | 329,135 | 3,842,959 | 4.80 | % | |||||||||||||||||||||
| Benjamin Spero(11) |
7,606,264 | 9.65 | % | 1,920,865 | 5,685,399 | 7.10 | % | 329,135 | 5,356,264 | 6.69 | % | |||||||||||||||||||||
| Current executive officers and directors as a group (10 persons)(12) |
23,587,927 | 29.42 | % | 4,438,872 | 19,149,055 | 23.99 | % | 760,589 | 18,388,466 | 23.06 | % | |||||||||||||||||||||
102
Table of Contents
| Shares beneficially owned prior to offering |
Number of shares being offered |
Shares beneficially owned after the offering (assuming no exercise of the underwriters’ option to purchase additional shares) |
Number of additional shares offered if underwriters’ option is exercised in full |
Shares beneficially owned after the offering (assuming full exercise of the underwriters’ option to purchase additional shares) |
||||||||||||||||||||||||||||
| Name and Address of Beneficial Owner(1) |
Number | Percentage | Number | Percentage | Number | Percentage | ||||||||||||||||||||||||||
| 5% Stockholders |
||||||||||||||||||||||||||||||||
| Entities affiliated with Spectrum Equity(11) |
7,606,264 | 9.65% | 1,920,865 | 5,685,399 | 7.10% | 329,135 | 5,356,264 | 6.69% | ||||||||||||||||||||||||
| Warburg Pincus Private Equity IX, L.P.(10) |
6,092,959 | 7.73% | 1,920,865 | 4,172,094 | 5.21% | 329,135 | 3,842,959 | 4.80% | ||||||||||||||||||||||||
| GS Capital Partners V Fund, L.P.(13). |
6,297,779 | 7.99% | 1,344,132 | 4,953,647 | 6.19% | 230,313 | 4,723,334 | 5.90% | ||||||||||||||||||||||||
| Thomas H. Lee Partners, L.P.(14) |
6,297,778 | 7.99% | — | 6,297,778 | 7.86% | — | 6,297,778 | 7.86% | ||||||||||||||||||||||||
| Benchmark Capital Partners VI, LP(9) |
6,194,300 | 7.86% | — | 6,194,300 | 7.73% | — | 6,194,300 | 7.73% | ||||||||||||||||||||||||
| Affiliates of Origin Ventures II L.P.(15) |
4,019,794 | 5.10% | 609,802 | 3,409,992 | 4.26% | 104,488 | 3,305,504 | 4.13% | ||||||||||||||||||||||||
| Other Selling Stockholders: |
||||||||||||||||||||||||||||||||
| Lightspeed Venture Partners VIII LP (16) |
2,799,333 | 3.55% | 1,194,921 | 1,604,412 | 2.00% | 204,746 | 1,399,666 | 1.75% | ||||||||||||||||||||||||
| Mesirow Financial Capital Partners X LP(17) |
1,007,760 | 1.28% | 170,744 | 837,016 | 1.05% | 29,256 | 807,760 | 1.01% | ||||||||||||||||||||||||
| Red Devil(18) |
253,897 | * | 216,756 | 37,141 | * | 37,141 | — | * | ||||||||||||||||||||||||
| National Philanthropic Trust(19) |
250,000 | * | 213,429 | 36,571 | * | 36,571 | — | * | ||||||||||||||||||||||||
| Sanjay Tiwary(20) |
375,000 | * | 281,016 | 93,984 | * | 48,151 | 45,833 | * | ||||||||||||||||||||||||
| All Other Selling Stockholders(21) |
712,255 | * | 339,355 | 372,900 | * | 58,145 | 314,755 | * | ||||||||||||||||||||||||
| * | Less than 1% |
| (1) | A “beneficial owner” of a security is determined in accordance with Rule 13d-3 under the Exchange Act and generally means any person who, directly or indirectly, through any contract, arrangement, understanding, relationship, or otherwise, has or shares: |
| • | voting power which includes the power to vote, or to direct the voting of, such security; and/or |
| • | investment power which includes the power to dispose, or to direct the disposition of, such security. |
Unless otherwise indicated, each person named in the table above has sole voting and investment power, or shares voting and investment power with his spouse (as applicable), with respect to all shares of stock listed as owned by that person. Shares issuable upon the exercise of options exercisable on August 25, 2014 or within 60 days thereafter are considered outstanding and to be beneficially owned by the person holding such options for the purpose of computing such person’s percentage beneficial ownership, but are not deemed outstanding for the purposes of computing the percentage of beneficial ownership of any other person.
| (2) | Includes (i) 477,076 shares held as of August 25, 2014 by the Holly R. Maloney Revocable Trust; (ii) 489,792 shares held by the Matthew M. Maloney Revocable Trust; and (iii) 1,100,166 shares held by the Maloney Children’s 2014 Exempt Trust. Holly R. Maloney, as trustee of the Holly R. Maloney Revocable Trust, has sole voting and dispositive power over the shares held by the Holly R. Maloney Revocable Trust. Matthew M. Maloney, as trustee of the Matthew M. Maloney Revocable Trust, has sole voting and dispositive power over the shares held by the Matthew M. Maloney Revocable Trust. Kim Corbin, as trustee of the Maloney Children’s 2014 Exempt Trust, has sole voting and dispositive power over the shares held by the Maloney Children’s 2014 Exempt Trust. Also includes 83,633 shares of common stock that can be acquired upon the exercise of outstanding options, which are currently exercisable or will become exercisable within 60 days of August 25, 2014. Mr. Maloney pledged 796,179 shares of the Company to JPMorgan Chase Bank, NA on August 19, 2013. |
103
Table of Contents
| (3) | Includes 918,259 shares of common stock that can be acquired upon the exercise of outstanding options, which are currently exercisable or will become exercisable within 60 days of August 25, 2014. In connection with the offering, Mr. Zabusky will be exercising an option to purchase shares, of which he will sell 298,801 shares (or 350,000 shares if the underwriters exercise their option to purchase additional shares in full). |
| (4) | Includes 198,300 shares of common stock that can be acquired upon the exercise of outstanding options, which are currently exercisable or will become exercisable within 60 days of August 25, 2014. In connection with this offering, Mr. Dewitt will be exercising an option to purchase shares, of which he will sell 42,686 shares (or 50,000 shares if the underwriters exercise their option to purchase additional shares in full). |
| (5) | Includes 131,504 shares held prior to this offering by the Evans Trust. Michael Evans, as Investment Advisor of the Evans Trust, has sole voting and dispositive power over the shares held by the Evans Trust. Also includes 68,832 shares of common stock that can be acquired upon the exercise of outstanding options, which are exercisable on or prior to October 2, 2014. |
| (6) | Includes 44,697 shares of common stock that can be acquired upon the exercise of outstanding options, which are currently exercisable or will become exercisable within 60 days of August 25, 2014. Includes 72,917 shares and 72,918 shares held by each of Spiral I Irrevocable Trust and Spiral V Irrevocable Trust (the “Spiral Trusts”), respectively, which were transferred by Mr. McAndrews in February 2014. Christopher McAndrews, as trustee of the Spiral Trusts, has sole voting and dispositive power over the shares held by the Spiral Trusts. |
| (7) | Includes 32,547 shares of common stock that can be acquired upon the exercise of outstanding options, which are currently exercisable or will become exercisable within 60 days of August 25, 2014. |
| (8) | Includes 3,031 shares of common stock that can be acquired upon the exercise of outstanding options, which are currently exercisable or will become exercisable within 60 days of August 25, 2014. |
| (9) | Includes 6,194,300 shares of record held prior to this offering by Benchmark Capital Partners VI, L.P, as nominee for Benchmark Capital Partners VI, L.P., Benchmark Founders’ Fund VI, L.P., Benchmark Founders’ Fund VI-B, L.P. and related individuals, collectively, the Benchmark Funds. Benchmark Capital Management Co. VI, L.L.C., or BCMC VI, is the General Partner of Benchmark Capital Partners VI, L.P. J. William Gurley, a director of the Company, is a managing member of BCMC VI and may be deemed to have shared voting and investment power over the shares held by the Benchmark Funds. The mailing address of the individuals and entities affiliated with Benchmark Capital Partners VI, L.P. is 2965 Woodside Road, Woodside, CA 94062. |
| (10) | Includes 6,092,959 shares of record held prior to this offering by Warburg Pincus Private Equity IX, L.P., a Delaware limited partnership (“WP IX”). Warburg Pincus IX LLC, a New York limited liability company (“WP IX GP”), is the general partner of WP IX. Warburg Pincus Partners LLC, a New York limited liability company (“WP Partners”), is the sole member of WP IX GP. Warburg Pincus & Co., a New York general partnership (“WP”), is the managing member of WP Partners. Warburg Pincus LLC, a New York limited liability company (“WP LLC”) manages WP IX. Charles R. Kaye and Joseph P. Landy are each a Managing General Partner of WP and Co-Chief Executive Officers and Managing Members of WP LLC and may be deemed to control the above referenced Warburg Pincus entities. Messrs. Kaye and Landy disclaim beneficial ownership of all shares held by the above referenced Warburg Pincus entities. The address of the above referenced Warburg Pincus entities is 450 Lexington Avenue, New York, New York 10017. Justin L. Sadrian, a director of the Company, is a Partner of WP and a Member and Managing Director of WP LLC. All shares indicated as owned by Mr. Sadrian are included because of his affiliation with the above referenced Warburg Pincus entities. |
| (11) | Includes (i) 7,584,967 shares held prior to this offering by SEI VI Chow AIV, L.P. (“SEI VI”), the general partner of which is Spectrum Equity Associates VI, L.P., the general partner of which is SEA VI Management, LLC, over which Brion B. Applegate, William P. Collatos, Victor E. Parker, Christopher T. Mitchell, Benjamin C. Spero, James J. Quagliaroli and Randy J. Henderson exercise voting and dispositive power, (ii) 18,331 shares held prior to this offering by Spectrum VI Investment Managers’ Fund, L.P. (“IMF VI”), the general partner of which is SEA VI Management, LLC, over which Brion B. Applegate, William P. Collatos, Victor E. Parker, Christopher T. Mitchell, Benjamin C. Spero, James J. Quagliaroli and Randy J. Henderson exercise voting and dispositive power, and (iii) 2,966 shares held prior to this offering by Spectrum VI Co-Investment Fund, L.P. and together with SEI VI and IMF VI, the “Spectrum Funds,” the general partner of which is SEA VI Management, LLC, over which Brion B. Applegate, William P. Collatos, Victor E. Parker, Christopher T. Mitchell, Benjamin C. Spero, James J. Quagliaroli and Randy J. Henderson exercise voting and dispositive power. The principal |
104
Table of Contents
| business address of each of the Spectrum Funds is 333 Middlefield Road, Suite 200, Menlo Park, CA 94025. |
| (12) | Consists of (i) 22,242,147 shares of record held prior to this offering by our current directors and executive officers and (ii) 1,345,780 shares subject to outstanding options, which are currently exercisable or will become exercisable within 60 days of August 25, 2014. |
| (13) | Shares shown as beneficially owned prior to this offering by GS Capital Partners V Fund, L.P. reflect an aggregate of the following record ownership: (i) 3,316,160 shares of record held by GS Capital Partners V Fund, L.P., (ii) 1,712,989 shares of record held by GS Capital Partners V Offshore Fund, L.P., (iii) 1,137,158 shares of record held by GS Capital Partners V Institutional, L.P. and (iv) 131,472 shares of record held by GS Capital Partners V GmbH & Co. KG (collectively, the “GS Entities”). The GS Entities, of which affiliates of The Goldman Sachs Group, Inc. are the general partner, managing general partner or investment manager, share voting and investment power with certain of its respective affiliates. The address of the GS Entities and The Goldman Sachs Group, Inc. is c/o The Goldman Sachs Group, 200 West Street, New York, New York 10282. |
| (14) | Shares shown as beneficially owned prior to this offering by investment funds affiliated with Thomas H. Lee Partners, L.P. reflect an aggregate of the following record ownership: (i) 3,467,868 shares held by Thomas H. Lee Equity Fund VI, L.P.; (ii) 2,348,256 shares held by Thomas H. Lee Parallel Fund VI, L.P.; (iii) 410,193 shares held by Thomas H. Lee Parallel (DT) Fund VI, L.P.; (iv) 29,706 shares held by THL Equity Fund VI Investors (Aramark), LLC; (v) 6,362 shares held by THL Coinvestment Partners, L.P. (collectively, the “THL Funds”); (vi) 17,700 shares held by Putnam Investment Holdings, LLC; and (vii) 17,693 shares held by Putnam Investments Employees’ Securities Company III, LLC (collectively, the “Putnam Funds”). THL Holdco, LLC is the managing member of Thomas H. Lee Advisors, LLC, which is the general partner of Thomas H. Lee Partners, L.P., which is the sole member of THL Equity Advisors VI, LLC, which is the general partner of Thomas H. Lee Equity Fund VI, L.P., Thomas H. Lee Parallel Fund VI, L.P. and Thomas H. Lee Parallel (DT) Fund VI, L.P. and the manager of THL Equity Fund VI Investors (Aramark), LLC. Thomas H. Lee Partners, L.P. is the general partner of THL Coinvestment Partners, L.P. The Putnam Funds are co-investment entities of the THL Funds, and are contractually obligated to co-invest (and dispose of securities) alongside certain of the THL Funds on a pro rata basis. Voting and investment determinations with respect to the shares held by the THL Funds are made by the management committee of THL Holdco, LLC. Anthony J. DiNovi and Scott M. Sperling are the members of the management committee of THL Holdco, LLC, and as such may be deemed to share beneficial ownership of the shares held or controlled by the THL Funds. Putnam Investment Holdings, LLC is the managing member of Putnam Investments Employees’ Securities Company III, LLC. The address of each of the THL Funds and Messrs. DiNovi and Sperling is c/o Thomas H. Lee Partners, L.P., 100 Federal Street, 35th Floor, Boston, Massachusetts 02110. The address of each of the Putnam Funds is c/o Putnam Investment, Inc., 1 Post Office Square, Boston, Massachusetts 02109. |
| (15) | Includes (i) 2,538,817 shares of record held prior to this offering by HLM Group LLC; (ii) 863,199 shares of record held prior to this offering by Steven N. Miller Revocable Trust dated April 19, 1999; (iii) 607,200 shares of record held prior to this offering by Bruce N. Barron; and (iv) 10,578 shares of record held prior to this offering by Eric F. Achepohl Revocable Trust. These shares were previously held of record by Origin Ventures II, L.P. and were transferred to affiliates of such entity. The voting and investment control for the HLM Group LLC is held by The Benita Group LLC, as the managing member. The voting and investment control for the Steven N. Miller Revocable Trust is held by Steven N. Miller, as Trustee. The voting and investment control for the Eric F. Achepohl Revocable Trust is held by Eric F. Achepohl, as Trustee. The mailing address of each of the HLM Group LLC, the Steven N. Miller Revocable Trust and the Eric F. Achepohl Revocable Trust is c/o The Benida Group LLC, 485 Half Day Road, Suite 200, Buffalo Grove, Illinois 60089. The mailing address for Bruce N. Barron is c/o Origin Ventures, 1033 Skokie Boulevard, Suite 430, Northbrook, Illinois 60062. |
| (16) | The voting and investment control for Lightspeed Venture Partners VIII LP is held by Lightspeed Ultimate General Partner VIII, Ltd., as general partner of Lightspeed General Partner VIII, L.P., the general partner of Lightspeed Venture Partners VIII LP. The address for this stockholder is 2200 Sand Hill Road, Menlo Park, California 94025. |
105
Table of Contents
| (17) | The voting and investment control for Mesirow Financial Capital Partners X LP is held by Mesirow Financial Services, Inc., an Illinois corporation, as the general partner of Mesirow Financial Capital Partners X LP, a Delaware limited partnership. The address for this stockholder is c/o Bob DeBolt, 353 North Clark Street, Chicago, Illinois 60654. |
| (18) | The voting and investment control for Red Devil Investors, LLC is held by Brent J. Hill, James Hultquist, James M. Henige and Brian Oliver. The address for this stockholder is 229 E. Walnut Street, Hinsdale, Illinois 60521. |
| (19) | The voting and investment control for the National Philanthropic Trust, a Pennsylvania nonprofit corporation (“NPT”), is held by NPT’s Board of Trustees. For purposes of this offering, the voting and investment control over NPT’s shares of common stock was delegated to NPT’s corporate officers. The address for this stockholder is 165 Township Line Road, Suite 150, Jenkintown, Pennsylvania 19046. The shares held by the National Philanthropic Trust prior to this offering were donated to the trust by Joseph Neubauer. |
| (20) | Includes 350,000 shares of common stock that can be acquired upon the exercise of outstanding options, which are currently exercisable or will become exercisable within 60 days of August 25, 2014. In connection with this offering, Mr. Tiwary will be exercising options to purchase shares, of which he will sell 281,016 shares (or 329,167 shares if the underwriters exercise their option to purchase additional shares in full). |
| (21) | Includes an aggregate of 570,047 shares of common stock that can be acquired by the selling stockholders upon the exercise of outstanding options, which are currently exercisable or will become exercisable within 60 days of August 25, 2014, and that are held by six current employees and one former employee who in the aggregate beneficially own less than 1% of our outstanding common stock immediately prior to the offering. In connection with the offering, the selling stockholders will be exercising options to purchase shares, of which they will sell an aggregate of 321,832 shares (or 366,815 shares if the underwriters exercise their option to purchase additional shares in full). |
106
Table of Contents
General
The following description summarizes the most important terms of our capital stock and also summarizes provisions in our amended and restated certificate of incorporation and amended and restated bylaws. Because it is only a summary, it does not contain all of the information that may be important to you. For a complete description of the matters set forth in this “Description of Capital Stock,” you should refer to our amended and restated certificate of incorporation and amended and restated bylaws and Registration Rights Agreement, which are included as exhibits to the registration statement of which this prospectus forms a part, and to the applicable provisions of Delaware law.
After giving effect to the Reverse Stock Split, which was effected on April 2, 2014, our authorized capital stock consists of 500,000,000 shares of common stock, $0.0001 par value per share, and 25,000,000 shares of undesignated preferred stock, $ 0.0001 par value per share. All then outstanding shares of our convertible preferred stock were automatically converted into shares of our common stock upon the closing of the IPO. As of August 25, 2014, there were 78,831,644 shares of our common stock outstanding, held by 438 stockholders of record, and no shares of our convertible preferred stock outstanding. Our board of directors is authorized, without stockholder approval except as required by the listing standards of the NYSE, to issue additional shares of our capital stock.
Common Stock
Dividend Rights
Subject to preferences that may apply to any shares of preferred stock outstanding at the time, the holders of our common stock are entitled to receive dividends out of funds legally available if our board of directors, in its discretion, determines to issue dividends and then only at the times and in the amounts that our board of directors may determine. See the section titled “Dividend Policy” for further information.
Voting Rights
Holders of our common stock are entitled to one vote for each share held on all matters submitted to a vote of stockholders. We have not provided for cumulative voting for the election of directors in our amended and restated certificate of incorporation. Our amended and restated certificate of incorporation establishes a classified board of directors that is divided into three classes with staggered three-year terms. Only the directors in one class will be subject to election by a plurality of the votes cast at each annual meeting of our stockholders, with the directors in the other classes continuing for the remainder of their respective three-year terms.
No Preemptive or Similar Rights
Our common stock is not entitled to preemptive rights, and is not subject to conversion, redemption or sinking fund provisions.
Right to Receive Liquidation Distributions
If we become subject to a liquidation, dissolution or winding-up, the assets legally available for distribution to our stockholders would be distributable ratably among the holders of our common stock and any participating preferred stock outstanding at that time, subject to prior satisfaction of all outstanding debt and liabilities and the preferential rights of and the payment of liquidation preferences, if any, on any outstanding shares of preferred stock.
107
Table of Contents
Preferred Stock
Our board of directors is authorized, subject to limitations prescribed by Delaware law, to issue preferred stock in one or more series, to establish from time to time the number of shares to be included in each series, and to fix the designation, powers, preferences, and rights of the shares of each series and any of its qualifications, limitations or restrictions, in each case without further vote or action by our stockholders. Our board of directors can also increase or decrease the number of shares of any series of preferred stock, but not below the number of shares of that series then outstanding, without any further vote or action by our stockholders. Our board of directors may authorize the issuance of preferred stock with voting or conversion rights that could adversely affect the voting power or other rights of the holders of our common stock. The issuance of preferred stock, while providing flexibility in connection with possible acquisitions and other corporate purposes, could, among other things, have the effect of delaying, deferring, or preventing a change in our control of the Company and might adversely affect the market price of our common stock and the voting and other rights of the holders of our common stock. We have no current plan to issue any shares of preferred stock.
Options
As of August 25, 2014, we had outstanding options to purchase an aggregate of 8,124,370 shares of our common stock, with a weighted average exercise price of $6.36 per share.
Registration Rights
Certain holders of our common stock are entitled to rights with respect to the registration of their shares under the Securities Act. These registration rights are contained in our Registration Rights Agreement. For more information on the registration rights, see “Certain Relationships and Related Party Transactions—Registration Rights Agreement.” In connection with the IPO, each stockholder that had registration rights agreed not to sell or otherwise dispose of any securities without the prior written consent of the underwriters for a period of 180 days after April 4, 2014, which period is scheduled to expire on September 30, 2014. See the section titled “Underwriting” for more information regarding such restrictions.
Demand Registration Rights
As of August 25, 2014, the holders of approximately 67,022,269 shares of our common stock are entitled to certain demand registration rights. For more information on the demand registration rights, see “Certain Relationships and Related Party Transactions—Registration Rights Agreement.”
Piggyback Registration Rights
If we propose to register the offer and sale of our common stock under the Securities Act, in connection with the public offering of such common stock, as of August 25, 2014, the holders of up to approximately 67,022,269 shares of our common stock will be entitled to certain “piggyback” registration rights allowing such holders to include their shares in such registration, subject to certain marketing and other limitations. For more information on the piggyback registration rights, see “Certain Relationships and Related Party Transactions—Registration Rights Agreement.”
S-3 Registration Rights
As of August 25, 2014, the holders of up to approximately 67,022,269 shares of our common stock may make a written request that we register the offer and sale of their shares on a registration statement on Form S-3 if we are eligible to file a registration statement on Form S-3, so long as the request covers at least that number of shares with an anticipated offering price, net of underwriting discounts and commissions, of at least $10.0 million. These stockholders may make an unlimited number of requests for registration on Form S-3; however, we will not be required to effect a registration on Form S-3 if we have effected two such registrations
108
Table of Contents
within the twelve-month period preceding the date of the request. Additionally, if we determine that it would be seriously detrimental to our stockholders to effect such a registration, we have the right to defer such registration, not more than once in any twelve-month period, for a period of up to 90 days. For more information on the registration rights, see “Certain Relationships and Related Party Transactions—Registration Rights Agreement.”
Anti-Takeover Provisions
The provisions of Delaware law, our amended and restated certificate of incorporation and our amended and restated bylaws, which are summarized below, may have the effect of delaying, deferring or discouraging another person from acquiring control of our company. They are also designed, in part, to encourage persons seeking to acquire control of us to negotiate first with our board of directors. We believe that the benefits of increased protection of our potential ability to negotiate with an unfriendly or unsolicited acquirer outweigh the disadvantages of discouraging a proposal to acquire us because negotiation of these proposals could result in an improvement of their terms.
Section 203 of the Delaware General Corporation Law
We are governed by the provisions of Section 203 of the DGCL, which, in general, prohibits a public Delaware corporation from engaging in a “business combination” with an “interested stockholder” for a period of three years after the date of the transaction in which the person became an interested stockholder, unless the business combination is approved in a prescribed manner. A “business combination” includes mergers, asset sales or other transactions resulting in a financial benefit to the stockholder. An “interested stockholder” is a person who, together with affiliates and associates, owns, or within three years did own, 15% or more of the corporation’s outstanding voting stock. These provisions may have the effect of delaying, deferring, or preventing a change in our control.
Amended and Restated Certificate of Incorporation and Amended and Restated Bylaw Provisions
Our amended and restated certificate of incorporation and our amended and restated bylaws include a number of provisions that could deter hostile takeovers or delay or prevent changes in control of our board of directors or management team, including the following:
| • | Board of Directors Vacancies. Our amended and restated certificate of incorporation and amended and restated bylaws authorize only our board of directors to fill vacant directorships, including newly created seats. In addition, the number of directors constituting our board of directors is permitted to be set only by a resolution adopted by a majority vote of our entire board of directors. These provisions would prevent a stockholder from increasing the size of our board of directors and then gaining control of our board of directors by filling the resulting vacancies with its own nominees. This makes it more difficult to change the composition of our board of directors and promotes continuity of management. |
| • | Classified Board. Our amended and restated certificate of incorporation and amended and restated bylaws provide that our board of directors is classified into three classes of directors. A third party may be discouraged from making a tender offer or otherwise attempting to obtain control of us as it is more difficult and time consuming for stockholders to replace a majority of the directors on a classified board of directors. See the section titled “Management—Board of Directors.” |
| • | Stockholder Action; Special Meeting of Stockholders. Our amended and restated certificate of incorporation provide that our stockholders may not take action by written consent, but may only take action at annual or special meetings of our stockholders. As a result, a holder controlling a majority of our capital stock would not be able to amend our amended and restated bylaws or remove directors without holding a meeting of our stockholders called in accordance with our amended and restated bylaws. Our amended and restated bylaws further provide that special meetings of our stockholders may be called only by a majority of our board of directors, the Chairman of our board of directors, our Chief Executive |
109
Table of Contents
| Officer or our President, thus prohibiting a stockholder from calling a special meeting. These provisions might delay the ability of our stockholders to force consideration of a proposal or for stockholders controlling a majority of our capital stock to take any action, including the removal of directors. |
| • | Advance Notice Requirements for Stockholder Proposals and Director Nominations. Our amended and restated bylaws provide advance notice procedures for stockholders seeking to bring business before our annual meeting of stockholders or to nominate candidates for election as directors at our annual meeting of stockholders. Our amended and restated bylaws also specify certain requirements regarding the form and content of a stockholder’s notice. These provisions might preclude our stockholders from bringing matters before our annual meeting of stockholders or from making nominations for directors at our annual meeting of stockholders if the proper procedures are not followed. We expect that these provisions may also discourage or deter a potential acquirer from conducting a solicitation of proxies to elect the acquirer’s own slate of directors or otherwise attempting to obtain control of our Company. |
| • | No Cumulative Voting. The DGCL provides that stockholders are not entitled to cumulate votes in the election of directors unless a corporation’s certificate of incorporation provides otherwise. Our amended and restated certificate of incorporation do not provide for cumulative voting. |
| • | Directors Removed Only for Cause. Our amended and restated certificate of incorporation provides that stockholders may remove directors only for cause. |
| • | Amendment of Charter Provisions. Any amendment of the above provisions in our amended and restated certificate of incorporation requires approval by holders of at least two-thirds of our then outstanding common stock. |
| • | Issuance of Undesignated Preferred Stock. Our board of directors has the authority, without further action by the stockholders, to issue up to 12,500,000 shares of undesignated preferred stock with rights and preferences, including voting rights, designated from time to time by our board of directors. The existence of authorized but unissued shares of preferred stock would enable our board of directors to render more difficult or to discourage an attempt to obtain control of us by means of a merger, tender offer, proxy contest, or other means. |
Tax Indemnity Agreement
In connection with the Merger, the Company agreed to indemnify Aramark Holdings for negative income tax consequences associated with the October 2012 spin-off of Seamless Holdings that are the result of certain actions taken by us, including our solicitation of acquirers to purchase us prior to October 29, 2014, and in certain other instances subject to a $15 million limitation.
Transfer Agent and Registrar
The transfer agent and registrar for our common stock is American Stock Transfer & Trust Company, LLC. Its address is 6201 15th Avenue, Brooklyn, NY 11219. Its telephone number is (800) 937-5449.
Listing
Our shares of common stock are listed on the NYSE under the trading symbol “GRUB.”
110
Table of Contents
SHARES ELIGIBLE FOR FUTURE SALE
Future sales of our common stock in the public market, or the availability of such shares for sale in the public market, could adversely affect market prices prevailing from time to time. As described below, only a limited number of shares will be available for sale shortly after this offering due to contractual and legal restrictions on resale. Nevertheless, sales of our common stock in the public market after such restrictions lapse, or the perception that those sales may occur, could adversely affect the prevailing market price at such time and our ability to raise equity capital in the future.
Following the completion of this offering, based on the number of shares of our capital stock outstanding as of August 25, 2014, we will have a total of 80,081,644 shares of our common stock outstanding. Of these outstanding shares, all of the shares of common stock sold in our IPO are, and all of the shares of common stock sold in this offering will be freely tradable, except that any shares purchased in this offering by our “affiliates,” as that term is defined in Rule 144 under the Securities Act, would only be able to be sold in compliance with the Rule 144 limitations described below.
The remaining shares of common stock outstanding after this offering will be deemed “restricted securities” as defined in Rule 144. Restricted securities may be sold in the public market only if they are registered or if they qualify for an exemption from registration under Rule 144 or Rule 701 under the Securities Act, which rules are summarized below.
Lock-Up Agreements
We, the selling stockholders, our executive officers and directors have agreed that, subject to certain exceptions, for a 90-day restricted period after the date of this prospectus, we and they will not, without the prior written consent of Citigroup Global Markets Inc., dispose of or hedge any shares or any securities convertible into or exchangeable for shares of our capital stock. Citigroup Global Markets Inc. may, in their sole discretion, and with the Company’s consent, release any of the securities subject to these lock-up agreements at any time.
In connection with our IPO, we, the selling stockholders, our executive officers and directors and holders of substantially all of our common stock and securities convertible into or exchangeable for our common stock, agreed that, subject to certain exceptions, for a 180-day restricted period from the IPO, which period expires on September 30, 2014, we and they will not, without the prior written consent of Citigroup Global Markets Inc. and Morgan Stanley & Co. LLC, dispose of or hedge any shares or any securities convertible into or exchangeable for shares of our capital stock. Citigroup Global Markets Inc. and Morgan Stanley & Co. LLC may, in their sole discretion, and with the Company’s consent, release any of the securities subject to these lock-up agreements at any time. In the event that the lock-up restriction is waived for one of our officers or directors, a press release will be issued announcing the waiver prior to such waiver becoming effective. In connection with this proposed offering, the representatives of the underwriters for our IPO have agreed to waive the lock-up restrictions applicable to us and the selling stockholders in order to permit the filing of the registration statement of which this prospectus forms a part and the offer and sale of the shares by us and the selling stockholders.
Rule 144
In general, under Rule 144 as currently in effect, a person who is not deemed to have been one of our affiliates for purposes of the Securities Act at any time during the 90 days preceding a sale and who has beneficially owned the shares of our common stock for at least six months, including the holding period of any prior owner other than our affiliates, is entitled to sell those shares without complying with the manner of sale, volume limitation or notice provisions of Rule 144, subject to compliance with the public information requirements of Rule 144. If such a person has beneficially owned the shares proposed to be sold for at least one year, including the holding period of any prior owner other than our affiliates, then that person would be entitled to sell those shares without complying with any of the requirements of Rule 144.
111
Table of Contents
In general, under Rule 144, as currently in effect, our affiliates or persons selling shares on behalf of our affiliates are entitled to sell upon expiration of the market standoff and lock-up agreements described above, within any three-month period, a number of shares that does not exceed the greater of:
| • | 1% of the number of shares of our common stock then outstanding, which will equal approximately 800,816 shares immediately after this offering; or |
| • | the average weekly trading volume of our common stock during the four calendar weeks preceding the filing of a notice on Form 144 with respect to that sale. |
Sales under Rule 144 by our affiliates or persons selling shares on behalf of our affiliates are also subject to certain manner of sale provisions and notice requirements and to the availability of current public information about us. Notwithstanding the availability of Rule 144, the holders of substantially all of our restricted securities have entered into lock-up agreements as referenced above and their restricted securities will become eligible for sale (subject to the above limitations under Rule 144) upon the expiration of the restrictions set forth in those agreements.
Rule 701
Rule 701 generally allows a stockholder who purchased shares of our common stock pursuant to a written compensatory plan or contract and who is not deemed to have been an affiliate of our Company during the immediately preceding 90 days to sell these shares in reliance upon Rule 144 without being required to comply with the public information, holding period, volume limitation or notice provisions of Rule 144. Rule 701 also permits affiliates of our Company to sell their Rule 701 shares under Rule 144 without complying with the holding period requirements of Rule 144. All holders of Rule 701 shares, however, are required by that rule to wait until 90 days after the date of this prospectus before selling those shares pursuant to Rule 701.
Registration Rights
Pursuant to the Registration Rights Agreement, as of August 25, 2014, the holders of up to 67,022,269 shares of our common stock or their transferees, are entitled to certain rights with respect to the registration of the offer and sale of those shares under the Securities Act. See the section titled “Certain Relationships and Related Party Transactions—Registration Rights Agreement” for a description of these registration rights. If the offer and sale of these shares is registered, the shares will be freely tradable without restriction under the Securities Act, and a large number of shares may be sold into the public market.
Stock Options and Registration Statement on Form S-8
As of August 25, 2014, options to purchase a total of 8,124,370 shares of common stock pursuant to our 2013 Plan were outstanding, of which options to purchase 3,747,555 shares were exercisable. On July 18, 2014, we filed a registration statement on Form S-8 to register the approximately 10,351,283 shares of common stock subject to options outstanding or reserved for issuance pursuant to our 2013 Plan. Pursuant to this registration statement, subject to Rule 144 limitations applicable to affiliates, the satisfaction of applicable exercise periods and, in certain cases, applicable lock-up agreements and market standoff agreements referred to above, the shares of common stock issued upon exercise of outstanding options will be available for immediate resale in the United States in the open market. See the section titled “Executive Compensation—2013 Omnibus Incentive Plan” for a description of our equity incentive plans.
112
Table of Contents
U.S. FEDERAL TAX CONSIDERATIONS FOR NON-U.S. HOLDERS
The following is a summary of material U.S. federal income and estate tax consequences to non-U.S. holders, as defined below, of the purchase, ownership and disposition of shares of our common stock. This summary deals only with non-U.S. holders of shares of common stock that purchase the shares pursuant to this offering and will hold such shares as capital assets within the meaning of section 1221 of the Internal Revenue Code of 1986, as amended (the “Code”).
For purposes of this discussion, a “non-U.S. holder” is a beneficial owner of shares of our common stock that, for U.S. federal income tax purposes, is neither a partnership nor any of the following:
| • | an individual who is a citizen or resident of the United States; |
| • | a corporation (or other entity treated as a corporation for U.S. federal income tax purposes) created or organized in or under the laws of the United States, any state thereof or the District of Columbia; |
| • | an estate the income of which is subject to U.S. federal income taxation regardless of its source; or |
| • | a trust if it (1) is subject to the primary supervision of a court within the United States and one or more U.S. persons have the authority to control all substantial decisions of the trust or (2) has a valid election in effect under applicable U.S. Treasury regulations to be treated as a U.S. person for U.S. federal income tax purposes. |
This summary is based upon provisions of the Code, U.S. Treasury regulations promulgated under the Code, rulings and other administrative pronouncements, and judicial decisions, all as of the date hereof. These authorities are subject to different interpretations and may be changed, perhaps retroactively, so as to result in U.S. federal income tax consequences different from those summarized below. This summary does not address all aspects of U.S. federal income and estate taxation and does not deal with non-U.S., state, local, alternative minimum, gift, or other tax considerations that may be relevant to non-U.S. holders in light of their particular circumstances. In addition, this summary does not describe the U.S. federal income and estate tax consequences applicable to you if you are subject to special treatment under U.S. federal income or estate tax laws (including if you are a U.S. expatriate or subject to the U.S. anti-inversion rules, a bank or other financial institution, an insurance company, a tax-exempt organization, a broker, dealer, or trader in securities or currencies, a regulated investment company, a real estate investment trust, a “controlled foreign corporation,” a “passive foreign investment company,” a retirement plan, a partnership or other pass-through entity for U.S. federal income tax purposes (or an investor in such a pass-through entity), a person who acquired shares of our common stock as compensation or otherwise in connection with the performance of services, or a person who has acquired shares of our common stock as part of a straddle, hedge, conversion transaction, synthetic security or other integrated investment). We cannot assure you that a change in law will not significantly alter the tax considerations described in this summary.
We have not and will not seek any rulings from the U.S. Internal Revenue Service, or the IRS, regarding the matters discussed below. There can be no assurance that the IRS will not take positions concerning the tax consequences of the ownership or disposition of shares of our common stock that differ from those discussed below.
If any entity or arrangement treated as a partnership for U.S. federal income tax purposes holds shares of our common stock, the tax treatment of a partner generally will depend upon the status of the partner and the activities of the partner and the partnership. If you are a partner of a partnership holding shares of our common stock, you should consult your tax advisors.
This summary is for general information only and is not intended to constitute a complete description of all tax consequences for non-U.S. holders relating to the ownership and disposition of shares of our common stock. If you are considering the purchase of shares of our common stock, you should consult your tax advisors
113
Table of Contents
concerning the particular U.S. federal income tax consequences to you of the ownership and disposition of shares of our common stock, as well as the consequences to you arising under the laws of any other applicable taxing jurisdiction in light of your particular circumstances.
Dividends
In general, cash distributions on shares of our common stock will constitute dividends for U.S. federal income tax purposes to the extent paid from our current or accumulated earnings and profits, as determined under U.S. federal income tax principles. To the extent any such distributions exceed both our current and our accumulated earnings and profits, they will first be treated as a return of capital reducing your tax basis in our common stock, but not below zero, and thereafter will be treated as gain from the sale of the common stock, the treatment of which is discussed under “—Gain on Disposition of Shares of Common Stock.”
The gross amount of dividends paid to a non-U.S. holder generally will be subject to a U.S. withholding tax at a 30% rate, or such lower rate as may be specified by an applicable income tax treaty. A non-U.S. holder of shares of our common stock who wishes to claim the benefit of an applicable treaty rate and avoid backup withholding, as discussed below, for dividends generally will be required (a) to complete IRS Form W-8BEN or W-8BEN-E (or other applicable form) and certify under penalty of perjury that such holder is not a U.S. person as defined under the Code and is eligible for treaty benefits, and the withholding agent must not have actual knowledge or reason to know that the certification is incorrect, or (b) if such holder’s shares of our common stock are held through certain foreign intermediaries or foreign partnerships, satisfy the relevant certification requirements of applicable U.S. Treasury regulations. This certification must be provided to us or our paying agent prior to the payment to you of any dividends and must be updated periodically.
Dividends paid to a non-U.S. holder that are effectively connected with the conduct of a trade or business within the United States by such non-U.S. holder (and, if required by an applicable income tax treaty, are attributable to a U.S. permanent establishment) generally will not be subject to the aforementioned withholding tax, provided certain certification and disclosure requirements are satisfied (including providing a properly completed IRS Form W-8ECI). Instead, such dividends generally will be subject to U.S. federal income tax on a net income basis in the same manner as if the non-U.S. holder were a U.S. person as defined under the Code. A non-U.S. holder that is treated as a corporation for U.S. federal income tax purposes may be subject to an additional “branch profits tax” at a 30% rate (or such lower rate as may be specified by an applicable income tax treaty) on earnings and profits attributable to dividends that are effectively connected with its conduct of a U.S. trade or business (and, if an income tax treaty applies, are attributable to its U.S. permanent establishment).
A non-U.S. holder of shares of our common stock eligible for a reduced rate of U.S. withholding tax pursuant to an income tax treaty may obtain a refund of any excess amounts withheld by timely filing an appropriate claim for refund with the IRS.
Gain on Disposition of Shares of Common Stock
Subject to the discussions below on the backup withholding tax and the Foreign Account Tax Compliance Act (“FATCA”) legislation, any gain realized by a non-U.S. holder on the sale or other disposition of shares of our common stock generally will not be subject to U.S. federal income tax unless:
| • | the gain is effectively connected with a trade or business of the non-U.S. holder in the United States (and, if required by an applicable income tax treaty, is attributable to a U.S. permanent establishment); |
| • | the non-U.S. holder is an individual who is present in the United States for 183 days or more in the taxable year of that disposition, and certain other conditions are met; or |
| • | we are or have been a “U.S. real property holding corporation” for U.S. federal income tax purposes at any time during the shorter of the five-year period ending on the date of the disposition or the period that the non-U.S. holder held shares of our common stock. |
114
Table of Contents
In the case of a non-U.S. holder described in the first and third bullet points above, any gain generally will be subject to U.S. federal income tax on a net income basis in the same manner as if the non-U.S. holder were a U.S. person as defined under the Code, and a non-U.S. holder that is a foreign corporation may also be subject to the branch profits tax equal to 30% of its effectively connected earnings and profits attributable to such gain (or, if an income tax treaty applies, at such lower rate as may be specified by the treaty on its gains attributable to its U.S. permanent establishment). Except as otherwise provided by an applicable income tax treaty, an individual non-U.S. holder described in the second bullet point above will be subject to a flat 30% tax on any gain derived from the sale or disposition, which may be offset by certain U.S. source capital losses provided that the non-U.S. holder has timely filed U.S. federal income tax returns with respect to such losses, even though the individual is not considered a resident of the United States under the Code. We believe we are not and, although no assurance can be given, do not anticipate becoming a U.S. real property holding corporation for U.S. federal income tax purposes. If we are, or become, a U.S. real property holding corporation, then, as long as our common stock is regularly traded on an established securities market, any gain from the sale or other taxable disposition of our common stock will not be subject to the tax described above on the disposition of a U.S. real property interest unless a non-U.S. holder owns more than 5% of all our outstanding common stock at any time within the time period described above. You should consult your own tax advisor about the consequences that could result if we are, or become, a U.S. real property holding corporation.
Federal Estate Tax
Shares of our common stock beneficially owned by an individual who is not a citizen of the United States or a resident of the United States (as defined for U.S. federal estate tax purposes) at the time of death will generally be includible in the decedent’s gross estate for U.S. federal estate tax purposes, unless an applicable estate tax treaty provides otherwise, and therefore may be subject to U.S. federal estate tax.
Information Reporting and Backup Withholding
The amount of dividends paid to each non-U.S. holder, and the tax withheld with respect to such dividends generally will be reported annually to the IRS and to each such holder, regardless of whether withholding was reduced or eliminated by an applicable tax treaty. Copies of the information returns reporting such dividends and withholding may also be made available to the tax authorities in the country in which the non-U.S. holder resides or is established under the provisions of an applicable income tax treaty or agreement.
A non-U.S. holder generally will be subject to backup withholding for dividends paid to such holder unless such holder certifies under penalty of perjury (usually on an IRS Form W-8BEN or W-8BEN-E) that it is a non-U.S. holder (and the payor does not have actual knowledge or reason to know that such holder is a U.S. person as defined under the Code), or such holder otherwise establishes an exemption. Information reporting and, depending on the circumstances, backup withholding will apply to the proceeds of a sale of shares of our common stock within the United States or conducted through certain U.S.-related financial intermediaries, unless the beneficial owner certifies under penalty of perjury that it is a non-U.S. holder (and the payor does not have actual knowledge or reason to know that the beneficial owner is a United States person as defined under the Code), or such owner otherwise establishes an exemption.
Backup withholding is not an additional tax. Any amounts withheld under the backup withholding rules may be allowed as a refund or a credit against a non-U.S. holder’s U.S. federal income tax liability provided the required information is timely furnished to the IRS.
Foreign Account Tax Compliance Act
Legislation and administrative guidance, the FATCA legislation, generally will impose, a withholding tax of 30% on any dividends on our common stock paid to certain “foreign financial institutions,” as specifically defined under such rules, unless such institution enters into an agreement with the U.S. government to, among other things, collect and provide to the U.S. tax authorities substantial information regarding U.S. account
115
Table of Contents
holders of such institution (which includes certain equity and debt holders of such institution, as well as certain account holders that are foreign entities with U.S. owners) and to withhold on certain payments or another exception applies. An intergovernmental agreement between the United States and an applicable foreign country, or future Treasury regulations or other guidance, may modify these requirements. Accordingly, the entity through which our common stock is held will affect the determination of whether such withholding is required. The FATCA legislation will also generally impose a withholding tax of 30% on any dividends on our common stock paid to a non-financial foreign entity unless such entity provides the withholding agent with either a certification that such entity does not have any substantial U.S. owners or a certification identifying the direct and indirect substantial U.S. owners of the entity and meets certain other specified requirements. Finally, beginning on January 1, 2017, withholding of 30% also generally will apply to the gross proceeds of a disposition of our common stock paid to a foreign financial institution or to a non-financial foreign entity unless the reporting and certification requirements described above have been met or another exception applies. Under certain circumstances, a non-U.S. holder of our common stock may be eligible for refunds or credits of such taxes. Investors are encouraged to consult with their tax advisors regarding the possible implications of the FATCA legislation on their investment in our common stock.
THE SUMMARY OF MATERIAL U.S. FEDERAL INCOME TAX CONSIDERATIONS ABOVE IS INCLUDED FOR GENERAL INFORMATION PURPOSES ONLY. POTENTIAL PURCHASERS OF OUR COMMON STOCK ARE URGED TO CONSULT THEIR TAX ADVISORS TO DETERMINE THE U.S. FEDERAL, STATE, LOCAL AND NON-U.S. TAX CONSIDERATIONS OF PURCHASING, OWNING AND DISPOSING OF OUR COMMON STOCK.
116
Table of Contents
We and the selling stockholders are offering the shares of common stock described in this prospectus through a number of underwriters. Citigroup Global Markets Inc., Morgan Stanley & Co. LLC and Merrill Lynch, Pierce, Fenner & Smith Incorporated are acting as the book-running managers of this offering and Citigroup Global Markets Inc. is acting as the representative of the underwriters named below. Subject to the terms and conditions stated in the underwriting agreement dated the date of this prospectus, each underwriter named below has severally agreed to purchase, and we and the selling stockholders have agreed to sell to that underwriter, the number of shares set forth opposite the underwriter’s name.
| Underwriters |
Number of Shares |
|||
| Citigroup Global Markets Inc. |
||||
| Morgan Stanley & Co. LLC |
||||
| Merrill Lynch, Pierce, Fenner &
Smith |
||||
| Allen & Company LLC |
||||
| BMO Capital Markets Corp. |
||||
| Canaccord Genuity Inc. |
||||
| JMP Securities LLC |
||||
| Raymond James & Associates, Inc. |
||||
| William Blair & Company, L.L.C. |
||||
|
|
|
|||
| Total |
10,033,415 | |||
|
|
|
|||
The underwriting agreement provides that the obligations of the underwriters to purchase the shares included in this offering are subject to approval of legal matters by counsel and subject to other conditions. The underwriters are obligated to purchase all the shares (other than those covered by the underwriters’ option to purchase additional shares described below) if they purchase any of the shares.
Shares sold by the underwriters to the public will initially be offered at the initial public offering price set forth on the cover of this prospectus. Any shares sold by the underwriters to securities dealers may be sold at a discount from the initial public offering price not to exceed $ per share. If all the shares are not sold at the initial offering price, the underwriters may change the offering price and the other selling terms. The representatives have advised us that the underwriters do not intend to make sales to discretionary accounts.
If the underwriters sell more shares than the total number set forth in the table above, the selling stockholders have granted to the underwriters an option, exercisable for 30 days from the date of this prospectus, to purchase up to 1,505,012 additional shares at the public offering price less the underwriting discount. To the extent the option is exercised, each underwriter must purchase a number of additional shares approximately proportionate to that underwriter’s initial purchase commitment. Any shares issued or sold under the option will be issued and sold on the same terms and conditions as the other shares that are the subject of this offering.
We, the selling stockholders and our officers and directors have agreed that, subject to certain exceptions, for a period of 90 days from the date of this prospectus, we and they will not, without the prior written consent of Citigroup Global Markets Inc., dispose of or hedge any shares or any securities convertible into or exchangeable for shares of our capital stock. Citigroup Global Markets Inc. may, in its sole discretion, release any of the securities subject to these lock-up agreements at any time without notice. In connection with this proposed offering, the representatives of the underwriters for our IPO have agreed to waive the lock-up restrictions applicable to us and the selling stockholders in order to permit the filing of the registration statement of which this prospectus forms a part and the offer and sale of the shares by us and the selling stockholders.
117
Table of Contents
Our shares of common stock are listed on the NYSE under the symbol “GRUB”. The following table shows the underwriting discounts and commissions that we and the selling stockholders are to pay to the underwriters in connection with this offering. These amounts are shown assuming both no exercise and full exercise of the underwriters’ option to purchase additional shares.
| Paid by Us |
Paid by Selling Stockholders | |||||||
| No Exercise |
Full Exercise |
No Exercise |
Full Exercise | |||||
| Per share |
$ | $ | $ | $ | ||||
| Total |
$ | $ | $ | $ | ||||
We estimate that the total expenses of this offering payable by us, including the expenses of the selling stockholders but not including the underwriting discounts and commissions, will be approximately $719,835, which includes an amount not to exceed $25,000 that we have agreed to reimburse the underwriters for certain expenses (including fees of counsel for FINRA-related matters) incurred by them in connection with this offering.
In connection with the offering, the underwriters may purchase and sell shares in the open market. Purchases and sales in the open market may include short sales, purchases to cover short positions, which may include purchases pursuant to the underwriters’ option to purchase additional shares, and stabilizing purchases.
| • | Short sales involve secondary market sales by the underwriters of a greater number of shares than they are required to purchase in the offering. |
| • | “Covered” short sales are sales of shares in an amount up to the number of shares represented by the underwriters’ option to purchase additional shares. |
| • | “Naked” short sales are sales of shares in an amount in excess of the number of shares represented by the underwriters’ option to purchase additional shares. |
| • | Covering transactions involve purchases of shares either pursuant to the underwriters’ option to purchase additional shares or in the open market after the distribution has been completed in order to cover short positions. |
| • | To close a naked short position, the underwriters must purchase shares in the open market after the distribution has been completed. A naked short position is more likely to be created if the underwriters are concerned that there may be downward pressure on the price of the shares in the open market after pricing that could adversely affect investors who purchase in the offering. |
| • | To close a covered short position, the underwriters must purchase shares in the open market after the distribution has been completed or must exercise the underwriters’ option to purchase additional shares. In determining the source of shares to close the covered short position, the underwriters will consider, among other things, the price of shares available for purchase in the open market as compared to the price at which they may purchase shares through the underwriters’ option to purchase additional shares. |
| • | Stabilizing transactions involve bids to purchase shares so long as the stabilizing bids do not exceed a specified maximum. |
Purchases to cover short positions and stabilizing purchases, as well as other purchases by the underwriters for their own accounts, may have the effect of preventing or retarding a decline in the market price of the shares. They may also cause the price of the shares to be higher than the price that would otherwise exist in the open market in the absence of these transactions. The underwriters may conduct these transactions on the NYSE, in the over-the-counter market or otherwise. If the underwriters commence any of these transactions, they may discontinue them at any time.
The underwriters are full service financial institutions engaged in various activities, which may include securities trading, commercial and investment banking, financial advisory, investment management, principal investment, hedging, financing and brokerage activities. The underwriters and their affiliates may, from time to
118
Table of Contents
time, engage in transactions with and perform services for us or our directors and executive officers in the ordinary course of their business for which they may receive customary fees and reimbursement of expenses. In the ordinary course of their various business activities, the underwriters and their affiliates may make or hold a broad array of investments and actively trade debt and equity securities (or related derivative securities) and financial instruments (which may include bank loans and/or credit default swaps) for their own account and for the accounts of their customers and may at any time hold long and short positions in such securities and instruments. Such investment and securities activities may involve our securities and instruments.
Citigroup Global Markets Inc. advised GrubHub Holdings in regard to the Merger, for which services Citigroup Global Markets Inc. received an advisory fee. Certain of the underwriters in connection with this offering served as underwriters in connection with our IPO, for which services they received customary underwriting discounts and commissions. Joan Spero, a member of the board of directors of Citigroup Global Markets Inc., is the mother of Benjamin Spero. Mr. Spero is a director on our board of directors and the beneficial holder of approximately 12.0% of our voting securities by virtue of his relationship with SLW Investor, LLC. See “Principal and Selling Stockholders.”
We and the selling stockholders have agreed to indemnify the underwriters against certain liabilities, including liabilities under the Securities Act, or to contribute to payments the underwriters may be required to make because of any of those liabilities.
Notice to Prospective Investors in the European Economic Area
In relation to each member state of the European Economic Area that has implemented the Prospectus Directive (each, a “relevant member state”), with effect from and including the date on which the Prospectus Directive is implemented in that relevant member state (the “relevant implementation date”), an offer of shares described in this prospectus may not be made to the public in that relevant member state other than:
| • | to any legal entity which is a qualified investor as defined in the Prospectus Directive; |
| • | to fewer than 100, or if the relevant member state has implemented the relevant provision of the 2010 PD Amending Directive, 150 natural or legal persons (other than qualified investors as defined in the Prospectus Directive), as permitted under the Prospectus Directive, subject to obtaining the prior consent of the relevant Dealer or Dealers nominated by us for any such offer; or |
| • | in any other circumstances falling within Article 3(2) of the Prospectus Directive, provided that no such offer of shares shall require us or any underwriter to publish a prospectus pursuant to Article 3 of the Prospectus Directive. |
For purposes of this provision, the expression an “offer of securities to the public” in any relevant member state means the communication in any form and by any means of sufficient information on the terms of the offer and the shares to be offered so as to enable an investor to decide to purchase or subscribe for the shares, as the expression may be varied in that member state by any measure implementing the Prospectus Directive in that member state, and the expression “Prospectus Directive” means Directive 2003/71/EC (and amendments thereto, including the 2010 PD Amending Directive, to the extent implemented in the relevant member state) and includes any relevant implementing measure in the relevant member state. The expression 2010 PD Amending Directive means Directive 2010/73/EU.
The sellers of the shares have not authorized and do not authorize the making of any offer of shares through any financial intermediary on their behalf, other than offers made by the underwriters with a view to the final placement of the shares as contemplated in this prospectus. Accordingly, no purchaser of the shares, other than the underwriters, is authorized to make any further offer of the shares on behalf of the sellers or the underwriters.
Notice to Prospective Investors in the United Kingdom
This prospectus is only being distributed to, and is only directed at, persons in the United Kingdom that are qualified investors within the meaning of Article 2(1)(e) of the Prospectus Directive that are also (i) investment
119
Table of Contents
professionals falling within Article 19(5) of the Financial Services and Markets Act 2000 (Financial Promotion) Order 2005 (the “Order”) or (ii) high net worth entities, and other persons to whom it may lawfully be communicated, falling within Article 49(2)(a) to (d) of the Order (each such person being referred to as a “relevant person”). This prospectus and its contents are confidential and should not be distributed, published or reproduced (in whole or in part) or disclosed by recipients to any other persons in the United Kingdom. Any person in the United Kingdom that is not a relevant person should not act or rely on this document or any of its contents.
Notice to Prospective Investors in France
Neither this prospectus nor any other offering material relating to the shares described in this prospectus has been submitted to the clearance procedures of the Autorité des Marchés Financiers or of the competent authority of another member state of the European Economic Area and notified to the Autorité des Marchés Financiers. The shares have not been offered or sold and will not be offered or sold, directly or indirectly, to the public in France. Neither this prospectus nor any other offering material relating to the shares has been or will be:
| • | released, issued, distributed or caused to be released, issued or distributed to the public in France; or |
| • | used in connection with any offer for subscription or sale of the shares to the public in France. |
Such offers, sales and distributions will be made in France only:
| • | to qualified investors (investisseurs qualifiés) and/or to a restricted circle of investors (cercle restreint d’investisseurs), in each case investing for their own account, all as defined in, and in accordance with articles L.411-2, D.411-1, D.411-2, D.734-1, D.744-1, D.754-1 and D.764-1 of the French Code monétaire et financier; |
| • | to investment services providers authorized to engage in portfolio management on behalf of third parties; or |
| • | in a transaction that, in accordance with article L.411-2-II-1°-or-2°-or 3° of the French Code monétaire et financier and article 211-2 of the General Regulations (Règlement Général) of the Autorité des Marchés Financiers, does not constitute a public offer (appel public à l’épargne). |
The shares may be resold directly or indirectly, only in compliance with articles L.411-1, L.411-2, L.412-1 and L.621-8 through L.621-8-3 of the French Code monétaire et financier.
Notice to Prospective Investors in Switzerland
The shares may not be publicly offered in Switzerland and will not be listed on the SIX Swiss Exchange (“SIX”) or on any other stock exchange or regulated trading facility in Switzerland. This document has been prepared without regard to the disclosure standards for issuance prospectuses under art. 652a or art. 1156 of the Swiss Code of Obligations or the disclosure standards for listing prospectuses under art. 27 ff. of the SIX Listing Rules or the listing rules of any other stock exchange or regulated trading facility in Switzerland. Neither this document nor any other offering or marketing material relating to the shares or the offering may be publicly distributed or otherwise made publicly available in Switzerland.
Neither this document nor any other offering or marketing material relating to the offering, the Company or the shares have been or will be filed with or approved by any Swiss regulatory authority. In particular, this document will not be filed with, and the offer of shares will not be supervised by, the Swiss Financial Market Supervisory Authority FINMA (FINMA), and the offer of shares has not been and will not be authorized under the Swiss Federal Act on Collective Investment Schemes (“CISA”). The investor protection afforded to acquirers of interests in collective investment schemes under the CISA does not extend to acquirers of shares.
Notice to Prospective Investors in the Dubai International Financial Centre
This prospectus relates to an exempt offer in accordance with the Offered Securities Rules of the Dubai Financial Services Authority. This document is intended for distribution only to persons of a type specified in
120
Table of Contents
those rules. It must not be delivered to, or relied on by, any other person. The Dubai Financial Services Authority has no responsibility for reviewing or verifying any documents in connection with exempt offers. The Dubai Financial Services Authority has not approved this prospectus nor taken steps to verify the information set out herein, and has no responsibility for this prospectus. The shares which are the subject of the offering contemplated by this prospectus may be illiquid and/or subject to restrictions on their resale.
Prospective purchasers of the shares offered should conduct their own due diligence on the shares. If you do not understand the contents of this document you should consult an authorized financial adviser.
Notice to Prospective Investors in Hong Kong
The shares may not be offered or sold in Hong Kong by means of any document other than (i) in circumstances which do not constitute an offer to the public within the meaning of the Companies Ordinance (Cap. 32, Laws of Hong Kong), (ii) to “professional investors” within the meaning of the Securities and Futures Ordinance (Cap. 571, Laws of Hong Kong) and any rules made thereunder, or (iii) in other circumstances which do not result in the document being a “prospectus” within the meaning of the Companies Ordinance (Cap. 32, Laws of Hong Kong), and no advertisement, invitation or document relating to the shares may be issued or may be in the possession of any person for the purpose of issue (in each case whether in Hong Kong or elsewhere), which is directed at, or the contents of which are likely to be accessed or read by, the public in Hong Kong (except if permitted to do so under the laws of Hong Kong) other than with respect to shares which are or are intended to be disposed of only to persons outside Hong Kong or only to “professional investors” within the meaning of the Securities and Futures Ordinance (Cap. 571, Laws of Hong Kong) and any rules made thereunder.
Notice to Prospective Investors in Japan
The shares offered in this prospectus have not been and will not be registered under the Financial Instruments and Exchange Law of Japan. The shares have not been offered or sold and will not be offered or sold, directly or indirectly, in Japan or to or for the account of any resident of Japan (including any corporation or other entity organized under the laws of Japan), except (i) pursuant to an exemption from the registration requirements of the Financial Instruments and Exchange Law and (ii) in compliance with any other applicable requirements of Japanese law.
Notice to Prospective Investors in Singapore
This prospectus has not been registered as a prospectus with the Monetary Authority of Singapore. Accordingly, this prospectus and any other document or material in connection with the offer or sale, or invitation for subscription or purchase, of the shares may not be circulated or distributed, nor may the shares be offered or sold, or be made the subject of an invitation for subscription or purchase, whether directly or indirectly, to persons in Singapore other than (i) to an institutional investor under Section 274 of the Securities and Futures Act, Chapter 289 of Singapore (the “SFA”), (ii) to a relevant person pursuant to Section 275(1), or any person pursuant to Section 275(1A), and in accordance with the conditions specified in Section 275 of the SFA or (iii) otherwise pursuant to, and in accordance with the conditions of, any other applicable provision of the SFA, in each case subject to compliance with conditions set forth in the SFA.
Where the shares are subscribed or purchased under Section 275 of the SFA by a relevant person which is:
| • | a corporation (which is not an accredited investor (as defined in Section 4A of the SFA)) the sole business of which is to hold investments and the entire share capital of which is owned by one or more individuals, each of whom is an accredited investor; or |
| • | a trust (where the trustee is not an accredited investor) whose sole purpose is to hold investments and each beneficiary of the trust is an individual who is an accredited investor, then shares, debentures and units of shares and debentures of that corporation or the beneficiaries’ rights and interest (howsoever described) in that trust shall not be transferred within six months after that corporation or that trust has acquired the shares pursuant to an offer made under Section 275 of the SFA except: |
121
Table of Contents
| • | to an institutional investor (for corporations, under Section 274 of the SFA) or to a relevant person defined in Section 275(2) of the SFA, or to any person pursuant to an offer that is made on terms that such shares, debentures and units of shares and debentures of that corporation or such rights and interest in that trust are acquired at a consideration of not less than S$200,000 (or its equivalent in a foreign currency) for each transaction, whether such amount is to be paid for in cash or by exchange of securities or other assets, and further for corporations, in accordance with the conditions specified in Section 275 of the SFA; |
| • | where no consideration is or will be given for the transfer; or |
| • | where the transfer is by operation of law. |
Notice to Prospective Investors in Australia
No placement document, prospectus, product disclosure statement or other disclosure document has been lodged with the Australian Securities and Investments Commission (“ASIC”), in relation to the offering. This offering document does not constitute a prospectus, product disclosure statement or other disclosure document under the Corporations Act 2001 (the “Corporations Act”), and does not purport to include the information required for a prospectus, product disclosure statement or other disclosure document under the Corporations Act.
Any offer in Australia of the shares of our common stock may only be made to persons (the “Exempt Investors”) who are “sophisticated investors” (within the meaning of section 708(8) of the Corporations Act), “professional investors” (within the meaning of section 708(11) of the Corporations Act) or otherwise pursuant to one or more exemptions contained in section 708 of the Corporations Act so that it is lawful to offer the shares of our common stock without disclosure to investors under Chapter 6D of the Corporations Act.
The shares of our common stock applied for by Exempt Investors in Australia must not be offered for sale in Australia in the period of 12 months after the date of allotment under the offering, except in circumstances where disclosure to investors under Chapter 6D of the Corporations Act would not be required pursuant to an exemption under section 708 of the Corporations Act or otherwise or where the offer is pursuant to a disclosure document which complies with Chapter 6D of the Corporations Act. Any person acquiring shares of our common stock must observe such Australian on-sale restrictions.
This prospectus contains general information only and does not take account of the investment objectives, financial situation or particular needs of any particular person. It does not contain any securities recommendations or financial product advice. Before making an investment decision, investors need to consider whether the information in this prospectus is appropriate to their needs, objectives and circumstances, and, if necessary, seek expert advice on those matters.
122
Table of Contents
Kirkland & Ellis LLP, New York, New York will pass upon the validity of the common stock offered hereby on our behalf. Certain legal matters will be passed upon for the underwriters by Skadden, Arps, Slate, Meagher & Flom LLP, New York, New York.
The financial statements of GrubHub Inc. (formerly known as GrubHub Seamless Inc.) as of December 31, 2012 and 2013 and for the three years then ended, included in this prospectus, have been so included in reliance on the report of Crowe Horwath LLP, an independent registered public accounting firm, given on the authority of said firm, as experts in auditing and accounting.
The financial statements of GrubHub Holdings Inc. (formerly known as GrubHub, Inc.) as of December 31, 2011 and 2012 and for the years then ended, included in this prospectus, have been so included in reliance on the report of Crowe Horwath LLP, an independent registered public accounting firm, given on the authority of said firm, as experts in auditing and accounting.
WHERE YOU CAN FIND MORE INFORMATION
We have filed with the SEC a registration statement on Form S-1 under the Securities Act with respect to the shares of common stock offered by this prospectus. This prospectus, which constitutes a part of the registration statement, does not contain all of the information set forth in the registration statement, some of which is contained in exhibits to the registration statement as permitted by the rules and regulations of the SEC. For further information with respect to us and our common stock, we refer you to the registration statement, including the exhibits filed as a part of the registration statement. Statements contained in this prospectus concerning the contents of any contract or any other document is not necessarily complete. If a contract or document has been filed as an exhibit to the registration statement, please see the copy of the contract or document that has been filed. Each statement in this prospectus relating to a contract or document filed as an exhibit is qualified by the filed exhibit. You may obtain copies of this information by mail from the Public Reference Section of the SEC, 100 F Street, N.E., Room 1580, Washington, D.C. 20549, at prescribed rates. You may obtain information on the operation of the public reference rooms by calling the SEC at 1-800-SEC-0330. The SEC also maintains an Internet website that contains reports, proxy statements and other information about issuers, like us, that file electronically with the SEC. The address of that website is www.sec.gov.
We are subject to the information and reporting requirements of the Exchange Act and, in accordance with this law, will file periodic reports, proxy statements and other information with the SEC. These periodic reports, proxy statements and other information will be available for inspection and copying at the SEC’s public reference facilities and the website of the SEC referred to above. We also maintain websites at www.grubhub.com and www.seamless.com. You may access these materials free of charge as soon as reasonably practicable after they are electronically filed with, or furnished to, the SEC. Information contained on our websites is not a part of this prospectus and the inclusion of our website addresses in this prospectus is an inactive textual reference only. You should not rely on any such information in making your decision whether to purchase our securities.
123
Table of Contents
INDEX TO CONSOLIDATED FINANCIAL STATEMENTS
GRUBHUB INC.
| F-2 | ||||
| F-3 | ||||
| F-4 | ||||
| F-5 | ||||
| Consolidated Statements of Changes in Stockholders’ Equity and Redeemable Common Stock |
F-6 | |||
| F-8 | ||||
| F-9 |
GRUBHUB HOLDINGS INC.
| F-36 | ||||
| F-37 | ||||
| F-38 | ||||
| F-39 | ||||
| F-40 | ||||
| F-41 |
F-1
Table of Contents
REPORT OF INDEPENDENT REGISTERED PUBLIC ACCOUNTING FIRM
The Board of Directors and Stockholders of GrubHub Inc.
We have audited the accompanying consolidated balance sheets of GrubHub Inc. (formerly known as GrubHub Seamless Inc.) (the “Company”) as of December 31, 2012 and 2013, and the related consolidated statements of operations, comprehensive income, stockholders’ equity and redeemable common stock, and cash flows for each of the three years in the period ended December 31, 2013. These financial statements are the responsibility of the Company’s management. Our responsibility is to express an opinion on these financial statements based on our audits.
We conducted our audits in accordance with the standards of the Public Company Accounting Oversight Board (United States). Those standards require that we plan and perform the audit to obtain reasonable assurance about whether the financial statements are free of material misstatement. The Company is not required to have, nor were we engaged to perform, an audit of its internal control over financial reporting. Our audit included consideration of internal control over financial reporting as a basis for designing audit procedures that are appropriate in the circumstances, but not for the purpose of expressing an opinion on the effectiveness of the Company’s internal control over financial reporting. Accordingly, we express no such opinion. An audit includes examining, on a test basis, evidence supporting the amounts and disclosures in the consolidated financial statements. An audit also includes assessing the accounting principles used and significant estimates made by management, as well as evaluating the overall financial statement presentation. We believe that our audits provide a reasonable basis for our opinion.
In our opinion, the consolidated financial statements referred to above present fairly, in all material respects, the financial position of GrubHub Inc. (formerly known as GrubHub Seamless Inc.) at December 31, 2012 and 2013, and the results of its operations and its cash flows for each of the three years in the period ended December 31, 2013, in conformity with U.S. generally accepted accounting principles.
/s/ Crowe Horwath LLP
Oak Brook, Illinois
February 10, 2014 (except for the effect of the reverse stock split for the common stock and preferred stock discussed in Note 13, as to which the date is April 2, 2014).
F-2
Table of Contents
(F/K/A GRUBHUB SEAMLESS INC.)
Consolidated Balance Sheets
(in thousands, except share data)
| As of December 31, |
As of June 30, 2014 |
|||||||||||
| 2012 | 2013 | |||||||||||
| (unaudited) | ||||||||||||
| ASSETS |
||||||||||||
| CURRENT ASSETS: |
||||||||||||
| Cash and cash equivalents |
$ | 41,161 | $ | 86,542 | $ | 207,096 | ||||||
| Accounts receivable, net |
19,371 | 29,304 | 37,863 | |||||||||
| Deferred taxes, current |
26 | 3,688 | 3,688 | |||||||||
| Prepaid expenses |
1,447 | 2,625 | 2,505 | |||||||||
|
|
|
|
|
|
|
|||||||
| Total current assets |
62,005 | 122,159 | 251,152 | |||||||||
| PROPERTY AND EQUIPMENT: |
||||||||||||
| Property and equipment, net of depreciation and amortization |
13,341 | 17,096 | 16,529 | |||||||||
| OTHER ASSETS: |
||||||||||||
| Other assets |
— | 2,328 | 4,039 | |||||||||
| Goodwill |
113,442 | 352,788 | 352,788 | |||||||||
| Intangible assets, net of amortization |
17,467 | 268,441 | 261,390 | |||||||||
|
|
|
|
|
|
|
|||||||
| Total other assets |
130,909 | 623,557 | 618,217 | |||||||||
|
|
|
|
|
|
|
|||||||
| TOTAL ASSETS |
$ | 206,255 | $ | 762,812 | $ | 885,898 | ||||||
|
|
|
|
|
|
|
|||||||
| LIABILITIES, REDEEMABLE COMMON STOCK AND STOCKHOLDERS’ EQUITY |
||||||||||||
| CURRENT LIABILITIES: |
||||||||||||
| Restaurant food liability |
$ | 48,645 | $ | 78,245 | $ | 84,486 | ||||||
| Accounts payable |
781 | 3,353 | 2,390 | |||||||||
| Accrued payroll |
1,980 | 1,720 | 3,441 | |||||||||
| Taxes payable |
908 | 1,768 | 1,377 | |||||||||
| Restructuring accrual |
— | 176 | 478 | |||||||||
| Due to related party |
244 | — | — | |||||||||
| Other accruals |
5,610 | 7,329 | 9,850 | |||||||||
|
|
|
|
|
|
|
|||||||
| Total current liabilities |
58,168 | 92,591 | 102,022 | |||||||||
| LONG TERM LIABILITIES: |
||||||||||||
| Deferred taxes, non-current |
7,035 | 90,495 | 98,633 | |||||||||
| Other accruals |
3,164 | 3,936 | 3,939 | |||||||||
|
|
|
|
|
|
|
|||||||
| Total long term liabilities |
10,199 | 94,431 | 102,572 | |||||||||
|
|
|
|
|
|
|
|||||||
| Redeemable common stock, $0.0001 par value, 1,344,236 shares outstanding as of December 31, 2013 |
— | 18,415 | — | |||||||||
| STOCKHOLDERS’ EQUITY: |
||||||||||||
| Series A Convertible Preferred Stock, $0.0001 par value, 11,185,683 shares authorized, issued and outstanding as of December 31, 2012; 25,000,000 shares authorized as of December 31, 2013 and June 30, 2014; 19,284,113 shares issued and outstanding as of December 31, 2013; no shares issued and outstanding as of June 30, 2014; aggregate liquidation preference of $50,000 and $86,200 in 2012 and 2013, respectively. |
1 | 2 | — | |||||||||
| Common stock, $0.0001 par value, 31,349,777, 165,000,000 and 500,000,000 shares authorized at December 31, 2012 and 2013, and June 30, 2014, respectively; 31,349,777 shares issued, 31,218,164 shares outstanding; 53,757,437 shares issued and outstanding; and 78,831,161 shares issued and outstanding as of December 31, 2012, December 31, 2013 and June 30, 2014, respectively |
3 | 5 | 8 | |||||||||
| Treasury shares common stock, $0.0001 par value, 131,607 shares as of December 31, 2012 |
(858 | ) | — | — | ||||||||
| Accumulated other comprehensive income (loss) |
(27 | ) | 132 | 316 | ||||||||
| Additional paid-in capital |
86,743 | 500,356 | 617,375 | |||||||||
| Retained earnings |
52,026 | 56,880 | 63,605 | |||||||||
|
|
|
|
|
|
|
|||||||
| Total Stockholders’ Equity . |
$ | 137,888 | $ | 557,375 | $ | 681,304 | ||||||
|
|
|
|
|
|
|
|||||||
| TOTAL LIABILITIES, REDEEMABLE COMMON STOCK AND STOCKHOLDERS’ EQUITY |
$ | 206,255 | $ | 762,812 | $ | 885,898 | ||||||
|
|
|
|
|
|
|
|||||||
See accompanying notes to consolidated financial statements.
F-3
Table of Contents
(F/K/A GRUBHUB SEAMLESS INC.)
Consolidated Statements of Operations
(in thousands, except per share data)
| Year Ended December 31, | Six Months Ended June 30, |
|||||||||||||||||||
| 2011 | 2012 | 2013 | 2013 | 2014 | ||||||||||||||||
| (unaudited) | ||||||||||||||||||||
| Revenues |
$ | 60,611 | $ | 82,299 | $ | 137,143 | $ | 52,658 | $ | 118,619 | ||||||||||
| Costs and expenses: |
||||||||||||||||||||
| Sales and marketing |
17,198 | 26,892 | 37,347 | 16,164 | 32,285 | |||||||||||||||
| Operations and support |
13,961 | 18,165 | 34,173 | 11,975 | 29,841 | |||||||||||||||
| Technology (exclusive of amortization) |
5,651 | 10,172 | 15,357 | 5,344 | 11,413 | |||||||||||||||
| General and administrative |
9,777 | 12,249 | 21,907 | 8,712 | 16,944 | |||||||||||||||
| Depreciation and amortization |
4,033 | 6,089 | 13,470 | 3,673 | 11,130 | |||||||||||||||
|
|
|
|
|
|
|
|
|
|
|
|||||||||||
| Total costs and expenses |
50,620 | 73,567 | 122,254 | 45,868 | 101,613 | |||||||||||||||
|
|
|
|
|
|
|
|
|
|
|
|||||||||||
| Income before provision for income taxes |
9,991 | 8,732 | 14,889 | 6,790 | 17,006 | |||||||||||||||
| Provision (benefit) for income taxes |
(5,220 | ) | 813 | 8,142 | 3,711 | 9,961 | ||||||||||||||
|
|
|
|
|
|
|
|
|
|
|
|||||||||||
| Net income |
15,211 | 7,919 | 6,747 | 3,079 | 7,045 | |||||||||||||||
| Preferred stock tax distributions |
(334 | ) | (402 | ) | (1,073 | ) | (648 | ) | (320 | ) | ||||||||||
|
|
|
|
|
|
|
|
|
|
|
|||||||||||
| Net income attributable to common stockholders |
$ | 14,877 | $ | 7,517 | $ | 5,674 | $ | 2,431 | $ | 6,725 | ||||||||||
|
|
|
|
|
|
|
|
|
|
|
|||||||||||
| Net income per share attributable to common stockholders: |
||||||||||||||||||||
| Basic |
$ | 0.48 | $ | 0.24 | $ | 0.14 | $ | 0.08 | $ | 0.10 | ||||||||||
|
|
|
|
|
|
|
|
|
|
|
|||||||||||
| Diluted |
$ | 0.36 | $ | 0.19 | $ | 0.12 | $ | 0.07 | $ | 0.09 | ||||||||||
|
|
|
|
|
|
|
|
|
|
|
|||||||||||
| Weighted average shares used to compute net income per share attributable to common stockholders: |
||||||||||||||||||||
| Basic |
31,320 | 31,320 | 40,681 | 31,368 | 66,626 | |||||||||||||||
|
|
|
|
|
|
|
|
|
|
|
|||||||||||
| Diluted |
42,505 | 42,666 | 56,645 | 43,356 | 79,854 | |||||||||||||||
|
|
|
|
|
|
|
|
|
|
|
|||||||||||
| Pro forma net income per share attributable to common stockholders (Note 2) (unaudited): |
||||||||||||||||||||
| Basic |
$ | 0.12 | $ | 0.06 | ||||||||||||||||
|
|
|
|
|
|||||||||||||||||
| Diluted |
$ | 0.12 | $ | 0.07 | ||||||||||||||||
|
|
|
|
|
|||||||||||||||||
| Weighted average shares used to compute pro forma net income per share attributable to common stockholders (Note 2) (unaudited): |
||||||||||||||||||||
| Basic |
55,071 | 42,554 | ||||||||||||||||||
|
|
|
|
|
|||||||||||||||||
| Diluted |
56,645 | 43,356 | ||||||||||||||||||
|
|
|
|
|
|||||||||||||||||
See accompanying notes to consolidated financial statements.
F-4
Table of Contents
(F/K/A GRUBHUB SEAMLESS INC.)
Consolidated Statements of Comprehensive Income
(in thousands)
| Year Ended December 31, | Six Months Ended June 30, | |||||||||||||||||||
| 2011 | 2012 | 2013 | 2013 | 2014 | ||||||||||||||||
| (unaudited) | ||||||||||||||||||||
| Net Income |
$ | 15,211 | $ | 7,919 | $ | 6,747 | $ | 3,079 | $ | 7,045 | ||||||||||
| OTHER COMPREHENSIVE INCOME (LOSS): |
||||||||||||||||||||
| Foreign Currency Translation Adjustments |
(33 | ) | 115 | 159 | (225 | ) | 184 | |||||||||||||
|
|
|
|
|
|
|
|
|
|
|
|||||||||||
| COMPREHENSIVE INCOME |
$ | 15,178 | $ | 8,034 | $ | 6,906 | $ | 2,854 | $ | 7,229 | ||||||||||
|
|
|
|
|
|
|
|
|
|
|
|||||||||||
See accompanying notes to consolidated financial statements.
F-5
Table of Contents
(F/K/A GRUBHUB SEAMLESS INC.)
Consolidated Statements of Changes in Stockholders’ Equity and Redeemable Common Stock
(in thousands, except share data)
| Common Shares |
Common Stock |
Preferred Shares |
Preferred Stock |
Treasury Shares |
Treasury Stock |
APIC | Accumulated
Other Comprehensive Income (Loss) |
Retained Earnings |
Total Stockholders’ Equity |
Redeemable Common Stock |
||||||||||||||||||||||||||||||||||||||
| Shares | Amount | |||||||||||||||||||||||||||||||||||||||||||||||
| Balance December 31, 2010 |
31,319,911 | $ | 3 | 11,185,683 | $ | 1 | — | $ | — | $ | 79,853 | $ | (109 | ) | $ | 30,484 | $ | 110,232 | — | $ | — | |||||||||||||||||||||||||||
| Net Income |
— | — | — | — | — | — | — | — | 15,211 | 15,211 | — | — | ||||||||||||||||||||||||||||||||||||
| Currency translation |
— | — | — | — | — | — | — | (33 | ) | — | (33 | ) | — | — | ||||||||||||||||||||||||||||||||||
| Capital contribution from stockholders |
— | — | — | — | — | — | 5,758 | — | — | 5,758 | — | — | ||||||||||||||||||||||||||||||||||||
| Stock-based compensation |
— | — | — | — | — | — | 803 | — | — | 803 | — | — | ||||||||||||||||||||||||||||||||||||
|
|
|
|
|
|
|
|
|
|
|
|
|
|
|
|
|
|
|
|
|
|
|
|
|
|||||||||||||||||||||||||
| Balance December 31, 2011 |
31,319,911 | 3 | 11,185,683 | 1 | — | — | 86,414 | (142 | ) | 45,695 | 131,971 | — | — | |||||||||||||||||||||||||||||||||||
| Net Income |
— | — | — | — | — | — | — | — | 7,919 | 7,919 | — | — | ||||||||||||||||||||||||||||||||||||
| Common stock repurchase |
(131,607 | ) | — | — | — | 131,607 | (858 | ) | — | — | — | (858 | ) | — | — | |||||||||||||||||||||||||||||||||
| Currency translation |
— | — | — | — | — | — | — | 115 | — | 115 | — | — | ||||||||||||||||||||||||||||||||||||
| Capital contribution from stockholders |
— | — | — | — | — | — | 6,000 | — | — | 6,000 | — | — | ||||||||||||||||||||||||||||||||||||
| Stock-based compensation |
— | — | — | — | — | — | 2,364 | — | — | 2,364 | — | — | ||||||||||||||||||||||||||||||||||||
| Distributions to stockholders |
— | — | — | — | — | — | — | — | (1,588 | ) | (1,588 | ) | — | — | ||||||||||||||||||||||||||||||||||
| Stock option exercises |
29,860 | — | — | — | — | 116 | — | — | 116 | — | — | |||||||||||||||||||||||||||||||||||||
| Deferred tax effects resulting from partnership status |
— | — | — | — | — | — | (8,151 | ) | — | — | (8,151 | ) | — | — | ||||||||||||||||||||||||||||||||||
|
|
|
|
|
|
|
|
|
|
|
|
|
|
|
|
|
|
|
|
|
|
|
|
|
|||||||||||||||||||||||||
| Balance December 31, 2012 |
31,218,164 | 3 | 11,185,683 | 1 | 131,607 | (858 | ) | 86,743 | (27 | ) | 52,026 | 137,888 | — | — | ||||||||||||||||||||||||||||||||||
| Net Income |
— | — | — | — | — | — | — | — | 6,747 | 6,747 | — | — | ||||||||||||||||||||||||||||||||||||
| Common stock repurchases |
(176,082 | ) | — | — | — | 176,082 | (1,367 | ) | — | — | — | (1,367 | ) | — | — | |||||||||||||||||||||||||||||||||
| Treasury share reissuance |
307,689 | — | — | — | (307,689 | ) | 2,225 | (2,225 | ) | — | — | — | — | — | ||||||||||||||||||||||||||||||||||
| Currency translation |
— | — | — | — | — | — | — | 159 | — | 159 | — | — | ||||||||||||||||||||||||||||||||||||
| Stock based compensation |
— | — | — | — | — | 4,933 | — | — | 4,933 | — | — | |||||||||||||||||||||||||||||||||||||
| Equity issued from merger with GrubHub Holdings Inc. |
23,318,580 | 2 | 8,098,430 | 1 | — | — | 421,482 | — | — | 421,485 | — | — | ||||||||||||||||||||||||||||||||||||
| Preferred stock tax distributions |
— | — | — | — | — | — | — | — | (1,893 | ) | (1,893 | ) | — | — | ||||||||||||||||||||||||||||||||||
| Redeemable common stock |
(1,344,236 | ) | — | — | — | — | — | (18,415 | ) | — | — | (18,415 | ) | 1,344,236 | 18,415 | |||||||||||||||||||||||||||||||||
| Deferred tax effects attributable to merger of partnership interest |
— | — | — | — | — | — | 6,420 | — | — | 6,420 | — | — | ||||||||||||||||||||||||||||||||||||
| Stock option exercises |
433,322 | — | — | — | — | — | 1,418 | — | — | 1,418 | — | — | ||||||||||||||||||||||||||||||||||||
|
|
|
|
|
|
|
|
|
|
|
|
|
|
|
|
|
|
|
|
|
|
|
|
|
|||||||||||||||||||||||||
| Balance December 31, 2013 |
53,757,437 | $ | 5 | 19,284,113 | $ | 2 | — | $ | — | $ | 500,356 | $ | 132 | $ | 56,880 | $ | 557,375 | 1,344,236 | $ | 18,415 | ||||||||||||||||||||||||||||
|
|
|
|
|
|
|
|
|
|
|
|
|
|
|
|
|
|
|
|
|
|
|
|
|
|||||||||||||||||||||||||
See accompanying notes to consolidated financial statements.
F-6
Table of Contents
GRUBHUB INC.
(F/K/A GRUBHUB SEAMLESS INC.)
Consolidated Statements of Changes in Stockholders’ Equity and Redeemable Common Stock—Unaudited (Continued)
(in thousands, except share data)
| Common Shares |
Common Stock |
Preferred Shares |
Preferred Stock |
Treasury Shares |
Treasury Stock |
APIC | Accumulated
Other Comprehensive Income (Loss) |
Retained Earnings |
Total Stockholders’ Equity |
Redeemable Common Stock |
||||||||||||||||||||||||||||||||||||||
| Shares | Amount | |||||||||||||||||||||||||||||||||||||||||||||||
| Balance December 31, 2013 |
53,757,437 | $ | 5 | 19,284,113 | $ | 2 | — | $ | — | $ | 500,356 | $ | 132 | $ | 56,880 | $ | 557,375 | 1,344,236 | $ | 18,415 | ||||||||||||||||||||||||||||
| Net Income* |
— | — | — | — | — | — | — | — | 7,045 | 7,045 | — | — | ||||||||||||||||||||||||||||||||||||
| Common stock repurchases* |
(146,716 | ) | — | — | — | 146,716 | (3,225 | ) | — | — | — | (3,225 | ) | — | — | |||||||||||||||||||||||||||||||||
| Treasury stock retirement |
— | — | — | — | (146,716 | ) | 3,225 | (3,225 | ) | — | — | — | — | — | ||||||||||||||||||||||||||||||||||
| Currency translation* |
— | — | — | — | — | — | — | 184 | — | 184 | — | — | ||||||||||||||||||||||||||||||||||||
| Issuance of common stock in connection with the IPO, net of issuance costs* |
4,000,000 | 1 | — | — | — | — | 94,926 | — | — | 94,927 | — | — | ||||||||||||||||||||||||||||||||||||
| Stock based compensation* |
— | — | — | — | — | — | 4,709 | — | — | 4,709 | — | — | ||||||||||||||||||||||||||||||||||||
| Preferred stock tax distributions* |
— | — | — | — | — | — | — | — | (320 | ) | (320 | ) | — | — | ||||||||||||||||||||||||||||||||||
| Stock option exercises* |
592,091 | — | — | — | — | — | 2,194 | — | — | 2,194 | — | — | ||||||||||||||||||||||||||||||||||||
| Change in fair value of redeemable |
— | — | — | — | — | — | (16,535 | ) | — | — | (16,535 | ) | — | 16,535 | ||||||||||||||||||||||||||||||||||
| Termination of put rights of redeemable common stock in connection with the IPO* |
1,344,236 | — | — | — | — | — | 34,950 | — | — | 34,950 | (1,344,236 | ) | (34,950 | ) | ||||||||||||||||||||||||||||||||||
| Conversion of Preferred Stock to |
19,284,113 | 2 | (19,284,113 | ) | (2 | ) | — | — | — | — | — | — | — | — | ||||||||||||||||||||||||||||||||||
|
|
|
|
|
|
|
|
|
|
|
|
|
|
|
|
|
|
|
|
|
|
|
|
|
|||||||||||||||||||||||||
| Balance at June 30, 2014* |
78,831,161 | $ | 8 | — | $ | — | — | $ | — | $ | 617,375 | $ | 316 | $ | 63,605 | $ | 681,304 | — | $ | — | ||||||||||||||||||||||||||||
|
|
|
|
|
|
|
|
|
|
|
|
|
|
|
|
|
|
|
|
|
|
|
|
|
|||||||||||||||||||||||||
| * | Unaudited |
See accompanying notes to consolidated financial statements.
F-7
Table of Contents
(F/K/A GRUBHUB SEAMLESS INC.)
Statements of Cash Flows
(in thousands)
| Year Ended December 31, | Six Months Ended June 30, | |||||||||||||||||||
| 2011 | 2012 | 2013 | 2013 | 2014 | ||||||||||||||||
| (unaudited) | ||||||||||||||||||||
| CASH FLOWS FROM OPERATING ACTIVITIES |
||||||||||||||||||||
| Net income |
$ | 15,211 | $ | 7,919 | $ | 6,747 | $ | 3,079 | $ | 7,045 | ||||||||||
| Adjustments to reconcile net income to net cash from operating activities: |
||||||||||||||||||||
| Depreciation |
855 | 2,018 | 3,992 | 1,278 | 2,390 | |||||||||||||||
| Provision for doubtful accounts |
298 | 74 | 473 | 86 | 166 | |||||||||||||||
| Deferred taxes |
(8,051 | ) | — | 1,706 | (151 | ) | 8,138 | |||||||||||||
| Intangible asset amortization |
3,178 | 4,071 | 9,477 | 2,395 | 8,740 | |||||||||||||||
| Loss on disposal of equipment |
66 | — | — | — | — | |||||||||||||||
| Proceeds received under tenant allowance |
1,774 | — | — | — | — | |||||||||||||||
| Tenant allowance amortization |
(106 | ) | (160 | ) | (159 | ) | (79 | ) | (79 | ) | ||||||||||
| Stock based compensation |
803 | 2,364 | 4,933 | 1,238 | 4,687 | |||||||||||||||
| Deferred rent |
1,064 | 797 | (135 | ) | (64 | ) | 76 | |||||||||||||
| Change in assets and liabilities, net of the effects of business acquisitions: |
||||||||||||||||||||
| Accounts receivable |
335 | (526 | ) | (8,298 | ) | (7,081 | ) | (8,725 | ) | |||||||||||
| Prepaid expenses and other assets |
(432 | ) | (582 | ) | (2,388 | ) | 452 | (1,592 | ) | |||||||||||
| Accounts payable |
261 | 319 | 2,065 | 1,510 | (962 | ) | ||||||||||||||
| Restaurant food liability |
8,538 | 12,854 | 26,549 | 11,184 | 6,241 | |||||||||||||||
| Accrued payroll |
932 | 162 | (1,707 | ) | 1,192 | 1,721 | ||||||||||||||
| Other accruals |
2,128 | 2,678 | (2,192 | ) | 4,376 | 2,439 | ||||||||||||||
| Due to related party |
5,240 | (2,410 | ) | (244 | ) | — | — | |||||||||||||
|
|
|
|
|
|
|
|
|
|
|
|||||||||||
| Net cash provided by operating activities |
32,094 | 29,578 | 40,819 | 19,415 | 30,285 | |||||||||||||||
|
|
|
|
|
|
|
|
|
|
|
|||||||||||
| CASH FLOWS FROM INVESTING ACTIVITIES |
||||||||||||||||||||
| Acquisition of business. |
(12,171 | ) | — | — | — | — | ||||||||||||||
| Cash acquired in merger of GrubHub Holdings Inc. |
— | — | 13,266 | — | — | |||||||||||||||
| Issuance of note receivable to related party |
(16,000 | ) | (26,400 | ) | — | — | — | |||||||||||||
| Payments on note receivable from related party |
— | 42,400 | — | — | — | |||||||||||||||
| Capitalized website and development costs |
(2,398 | ) | (2,280 | ) | (2,592 | ) | (1,434 | ) | (1,112 | ) | ||||||||||
| Purchases of property and equipment |
(6,380 | ) | (3,417 | ) | (4,429 | ) | (3,170 | ) | (2,378 | ) | ||||||||||
|
|
|
|
|
|
|
|
|
|
|
|||||||||||
| Net cash provided by (used in) investing activities |
(36,949 | ) | 10,303 | 6,245 | (4,604 | ) | (3,490 | ) | ||||||||||||
|
|
|
|
|
|
|
|
|
|
|
|||||||||||
| CASH FLOWS FROM FINANCING ACTIVITIES |
||||||||||||||||||||
| Net proceeds from the issuance of common stock |
— | — | — | — | 94,927 | |||||||||||||||
| Proceeds from exercise of stock options |
— | 116 | 1,418 | 104 | 1,145 | |||||||||||||||
| Taxes paid related to net settlements of stock-based compensation awards |
— | — | — | — | (2,061 | ) | ||||||||||||||
| Checks issued in excess of bank balance |
1,563 | (3,923 | ) | — | — | — | ||||||||||||||
| Payment of note payable |
— | (1,965 | ) | — | — | — | ||||||||||||||
| Contributions from members |
22,448 | 6,000 | — | — | — | |||||||||||||||
| Repurchases of common stock |
— | (858 | ) | (1,367 | ) | (1,259 | ) | (116 | ) | |||||||||||
| Preferred stock tax distributions |
(16,690 | ) | (1,588 | ) | (1,893 | ) | (651 | ) | (320 | ) | ||||||||||
|
|
|
|
|
|
|
|
|
|
|
|||||||||||
| Net cash provided by (used in) financing activities |
7,321 | (2,218 | ) | (1,842 | ) | (1,806 | ) | 93,575 | ||||||||||||
|
|
|
|
|
|
|
|
|
|
|
|||||||||||
| Net change in cash and cash equivalents |
2,466 | 37,663 | 45,222 | 13,005 | 120,370 | |||||||||||||||
| Effect of exchange rates on cash |
(33 | ) | 115 | 159 | (225 | ) | 184 | |||||||||||||
| Cash and cash equivalents at beginning of year |
950 | 3,383 | 41,161 | 41,161 | 86,542 | |||||||||||||||
|
|
|
|
|
|
|
|
|
|
|
|||||||||||
| Cash and cash equivalents at end of year |
$ | 3,383 | $ | 41,161 | $ | 86,542 | $ | 53,941 | $ | 207,096 | ||||||||||
|
|
|
|
|
|
|
|
|
|
|
|||||||||||
| SUPPLEMENTAL DISCLOSURE OF NON CASH ITEMS |
||||||||||||||||||||
| Fair value of common and preferred stock issued in acquisition of GrubHub Holdings Inc. |
$ | — | $ | — | $ | 421,485 | $ | — | $ | — | ||||||||||
| Other information: |
||||||||||||||||||||
| Note payable issued in connection with acquisition of business |
1,965 | — | — | — | — | |||||||||||||||
| Cash paid for income taxes |
2,265 | 861 | 7,706 | 2,243 | 1,321 | |||||||||||||||
| Cashless exercise of stock options |
— | — | — | — | 1,049 | |||||||||||||||
| Settlement of receivable through cashless acquisition of treasury shares in connection with the cashless exercise of stop options |
— | — | — | — | (3,109 | ) | ||||||||||||||
See accompanying notes to consolidated financial statements.
F-8
Table of Contents
(F/K/A GRUBHUB SEAMLESS INC.)
Notes to Consolidated Financial Statements
(in thousands, except share amounts)
1. Organization and Reorganization
Organization
GrubHub Inc., a Delaware corporation, and its wholly-owned subsidiaries (collectively referred to as the “Company”) provide an online and mobile platform for restaurant pick-up and delivery orders. Diners enter their location through an online interface and the Company displays the menus and other relevant information for restaurants in its network. Orders may be placed directly online or over the phone at no cost to the diner. The Company charges the restaurant a per order commission that is largely fee based. In February 2014, the Company changed its name to GrubHub Inc. from GrubHub Seamless Inc. Reference to the “Company” throughout the financial statements relates to GrubHub Inc. and its wholly-owned subsidiaries.
Initial Public Offering
On April 4, 2014, the Company completed an initial public offering (the “IPO”) in which it issued and sold 4,000,000 shares of class A common stock at a public offering price of $26.00 per share. The Company received net proceeds of $94.9 million (unaudited) after deducting underwriting discounts and commissions of $6.5 million (unaudited) and other offering expenses of approximately $2.6 million (unaudited). These expenses were recorded against the proceeds received from the IPO.
Certain selling stockholders offered an additional 3,405,614 shares of common stock in the IPO and also granted the underwriters an option to purchase up to 1,110,842 additional shares of common stock. The Company did not receive any proceeds from the sale of the shares sold by the selling stockholders.
Upon the closing of the IPO, all shares of the Company’s then-outstanding convertible Series A Preferred Stock automatically converted into an aggregate of 19,284,113 shares of common stock. Additionally, the put rights for the Company’s redeemable common stock were terminated upon the closing of the IPO.
The Company has invested the funds received in non-interest bearing accounts, short-term and intermediate-term interest-bearing obligations, investment-grade investments, certificates of deposit or direct or guaranteed obligations of the U.S. government.
Reorganization and History
Overview of Reorganization
On August 8, 2013, GrubHub Inc. acquired, through a series of transactions, all of the equity interests of each of Seamless North America, LLC, Seamless Holdings Corporation (“Seamless Holdings”) and GrubHub Holdings Inc. pursuant to that certain Reorganization and Contribution Agreement, dated as of May 19, 2013, by and among GrubHub Inc., Seamless North America, LLC, Seamless Holdings, GrubHub Holdings Inc. and the other parties thereto (the “Reorganization Agreement”). Following this transaction, the Company concluded that Seamless Holdings was deemed the acquirer for financial reporting purposes (Note 3). Accordingly, the acquisition of GrubHub Holdings Inc. has been accounted for as a business combination. The results of operations of GrubHub Holdings Inc. have been included in the Company’s financial statements since August 9, 2013. In February 2014, GrubHub Seamless Inc. was renamed GrubHub Inc.
Prior to the Reorganization
Seamless North America, LLC was originally incorporated in Delaware in December 1999, and was converted to a Delaware limited liability company. Seamless North America was a single member LLC and wholly owned subsidiary of Aramark until June 6, 2011. In June 2011, Aramark sold an approximate 26%
F-9
Table of Contents
GRUBHUB INC.
(F/K/A GRUBHUB SEAMLESS INC.)
Notes to Consolidated Financial Statements (Continued)
(in thousands, except share amounts)
interest in Seamless North America, LLC in the form of convertible preferred stock to SLW Investors, LLC (“SLW Investors”), an entity controlled by a private equity firm.
On October 17, 2012, Aramark formed Seamless Holdings, as a wholly owned subsidiary for the purpose of completing a spin-off of its approximate 74% equity interest in Seamless North America, LLC. Prior to the spin-off, Aramark distributed all of the issued and outstanding shares of the common stock of Seamless Holdings to its parent company and sole shareholder, Aramark Intermediate Holdco Corporation (“Aramark Intermediate”). Thereafter, Aramark Intermediate distributed such shares to Aramark Holdings (the ultimate parent company of Aramark), which then distributed all of the shares of Seamless Holdings on a pro rata basis to the Aramark Holdings shareholders as of October 26, 2012, the record date. Each Aramark Holdings shareholder received one share of Seamless Holdings common stock for each share of Aramark Holdings common stock owned as of the record date.
The financial position and results of operations of Seamless Holdings and Seamless North America, LLC have been included in the consolidated financial statements for all periods presented.
2. Summary of Significant Accounting Policies
Basis of Presentation and Principles of Consolidation
The Company’s consolidated financial statements were prepared in conformity with accounting principles generally accepted in the United States of America (“GAAP”). The accompanying consolidated financial statements include all wholly owned subsidiaries. All significant intercompany accounts and transactions have been eliminated. The consolidated statements of operations include the results of entities acquired from the dates of the acquisitions for accounting purposes.
The share and per share amounts for all periods presented reflect the completion of the Company’s 1-for-2 reverse stock split, which the Company effected on April 2, 2014.
Use of Estimates
The preparation of consolidated financial statements in conformity with GAAP requires management to make certain estimates, judgments and assumptions that affect the reported amounts of assets and liabilities and the related disclosures at the date of the financial statements, as well as the reported amounts of revenue and expenses during the periods presented. Estimates include revenue recognition, the allowance for doubtful accounts, website development costs, goodwill, depreciable lives of property and equipment, recoverability of intangible assets with definite lives and other long-lived assets and stock-based compensation. To the extent there are material differences between these estimates, judgments or assumptions and actual results, the Company’s consolidated financial statements will be affected. In many cases, the accounting treatment of a particular transaction is specifically dictated by GAAP and does not require management’s judgment in its application.
Pro Forma Presentation
Upon consummation of the initial public offering, all of the outstanding shares of convertible preferred stock automatically converted on a one-for-one basis into shares of common stock and all put rights for outstanding redeemable common stock were terminated. Unaudited pro forma net income per share attributable to common stockholders and pro forma weighted average number of shares outstanding for the year ended December 31, 2013 and the six months ended June 30, 2013 have been computed to give effect to the automatic conversion of the convertible preferred stock and redeemable common stock into common stock as though the conversion had occurred on the original dates of issuance, unless otherwise indicated.
F-10
Table of Contents
GRUBHUB INC.
(F/K/A GRUBHUB SEAMLESS INC.)
Notes to Consolidated Financial Statements (Continued)
(in thousands, except share amounts)
Cash and Cash Equivalents
Cash includes demand deposits with banks or financial institutions. Cash equivalents include short-term, highly liquid investments that are both readily convertible to known amounts of cash, and that are so near their maturity that they present minimal risk of changes in value because of changes in interest rates. The Company’s cash equivalents include only investments with original maturities of three months or less. The Company regularly maintains cash in excess of federally insured limits at financial institutions.
Accumulated Other Comprehensive Income (Loss)
Accumulated other comprehensive income consists of foreign currency translation adjustments. The financial statements of non-U.S. entities are translated from their functional currencies into U.S. dollars. Assets and liabilities are translated at period end rates of exchange, and revenue and expenses are translated using average rates of exchange. The resulting gain or loss is included in accumulated other comprehensive income (loss) on the consolidated balance sheet.
Property and Equipment, Net
Property and equipment is recorded at cost and depreciated using the straight-line method over the estimated useful lives of the related assets. The useful lives are as follows:
| Computer equipment |
2-3 years | |
| Furniture and fixtures |
5 years | |
| Developed software |
1.5-3 years | |
| Purchased software |
3-5 years | |
| Leasehold improvements |
Shorter of expected useful life or lease term |
The Company has reduced the estimated useful life on any computer equipment, furniture and fixtures, and leasehold improvements related to its Sandy, Utah location to coincide with the expected closure date of December 31, 2014. (See Note 7, “Commitments and Contingencies”).
Maintenance and repair costs are charged to expense as incurred. Major improvements, which extend the useful life of the related asset, are capitalized. Upon disposal of a fixed asset, the Company records a gain or loss based on the differences between the proceeds received and the net book value of the disposed asset.
Accounts Receivable, Net
Accounts receivable primarily represent the net cash due from the Company’s payment processor for cleared transactions and amounts owed from corporate customers. The carrying amount of the Company’s receivables is reduced by an allowance for doubtful accounts that reflects management’s best estimate of amounts that will not be collected. The allowance is recorded through a charge to bad debt expense which is recorded within general and administrative expenses in the consolidated statements of operations. The allowance is based on historical loss experience and any specific risks identified in collection matters.
Management provides for probable uncollectible amounts through a charge against bad debt expense and a credit to an allowance based on its assessment of the current status of individual accounts. Balances still outstanding after management has used reasonable collection efforts are written off against the allowance. The Company does not charge interest on trade receivables.
F-11
Table of Contents
GRUBHUB INC.
(F/K/A GRUBHUB SEAMLESS INC.)
Notes to Consolidated Financial Statements (Continued)
(in thousands, except share amounts)
Changes in the Company’s allowance for doubtful accounts are as follows:
| Year Ended December 31, |
Six Months Ended June 30, |
|||||||||||||||
| 2012 | 2013 | 2013 | 2014 | |||||||||||||
| (unaudited) | ||||||||||||||||
| (in thousands) | ||||||||||||||||
| Allowance for doubtful accounts at beginning of period |
$ | 248 | $ | 210 | $ | 210 | $ | 510 | ||||||||
| Additions to expense |
74 | 473 | 86 | 166 | ||||||||||||
| Less: writeoffs, net of recoveries and other adjustments |
(112 | ) | (173 | ) | 16 | 3 | ||||||||||
|
|
|
|
|
|
|
|
|
|||||||||
| Balance at end of period |
$ | 210 | $ | 510 | $ | 312 | $ | 679 | ||||||||
|
|
|
|
|
|
|
|
|
|||||||||
Advertising Costs
Advertising costs are generally expensed as incurred in connection with the requisite service period. Certain advertising production costs are capitalized and expensed over the requisite service period of the advertisements. For the years ended December 31, 2011, 2012 and 2013, expenses attributable to advertising totaled approximately $12.6 million, $20.4 million and $25.0 million, respectively. For the six months ended June 30, 2013 and 2014, expenses attributable to advertising totaled approximately $12.2 million (unaudited) and $22.4 million (unaudited), respectively. Advertising costs are recorded in sales and marketing expense on the Company’s consolidated statements of operations.
Stock-Based Compensation
The Company measures compensation expense for all stock-based awards at fair value on the date of grant and recognizes compensation expense over the service period on a straight-line basis for awards expected to vest.
The Company uses the Black-Scholes option-pricing model to determine the fair value for stock options. In valuing the Company’s options, the Company makes assumptions about risk-free interest rates, dividend yields, volatility and weighted-average expected lives, including estimated forfeiture rates. Risk-free interest rates are derived from U.S. Treasury securities as of the option grant date. Expected dividend yield is based on the Company’s historical dividend payments, which have been zero to date. As the Company did not have public trading history for its common shares until April of 2014, the expected volatility for the Company’s common stock is estimated using the published historical volatilities of industry peers representing the verticals in which the Company operates. The Company estimates the weighted-average expected life of the options as the average of the vesting option schedule and the term of the award, since the Company does not have sufficient historical exercise data to provide a reasonable basis upon which to estimate expected term due to the limited period of time stock-based awards have been exercisable. The term of the award is estimated using the simplified method. Forfeiture rates are estimated using historical actual forfeiture trends as well as the Company’s judgment of future forfeitures. These rates are evaluated quarterly and any change in compensation expense is recognized in the period of the change. The estimation of stock awards that will ultimately vest requires judgment, and to the extent actual results or updated estimates differ from the Company’s current estimates, such amounts will be recorded as a cumulative adjustment in the period the estimates are revised. The Company considers many factors when estimating expected forfeitures, including the types of awards and employee class. Actual results, and future changes in estimates, may differ substantially from management’s current estimates.
F-12
Table of Contents
GRUBHUB INC.
(F/K/A GRUBHUB SEAMLESS INC.)
Notes to Consolidated Financial Statements (Continued)
(in thousands, except share amounts)
Provision (Benefit) for Income Taxes
The provision (benefit) for income taxes is determined using the asset and liability method. Under this method, deferred tax assets and liabilities are calculated based upon the temporary differences between the financial statement and income tax bases of assets and liabilities using the enacted tax rates that are applicable in a given year.
The Company utilizes a two-step approach to recognizing and measuring uncertain tax positions (“tax contingencies”). The first step is to evaluate the tax position for recognition by determining if the weight of available evidence indicates it is more likely than not that the position will be sustained on audit, including resolution of related appeals or litigation processes. The second step is to measure the tax benefit as the largest amount which is more than 50% likely to be realized upon ultimate settlement. The Company considers many factors when evaluating and estimating its tax positions and tax benefits, which may require periodic adjustments and which may not accurately forecast actual outcomes. The Company includes interest and penalties related to tax contingencies in the provision for income taxes in the consolidated statements of operations. See Note 9, “Income Taxes.” Management of the Company does not expect the total amount of unrecognized tax benefits to significantly change in the next twelve months.
Seamless North America, LLC became a partnership for tax purposes in June of 2011. The income tax consequences of a partnership are borne by its partners. The tax consequences of this partnership were borne by Aramark and SLW Investors from June of 2011 through October 29, 2012. Starting October 30, 2012, 74% of the partnership’s taxable income is reflected as taxable income at Seamless Holdings, a subsidiary of GrubHub Inc. Starting on August 9, 2013, 100% of the partnership’s taxable income was recognized as taxable income by the Company. If Seamless North America, LLC had been taxed as a C corporation for all of its earnings throughout 2011, 2012, and 2013 the tax expense recorded in these statements of operations would have increased by $1,493 million, $2,665 million, and $876 million, respectively.
Intangible Assets
Intangible assets with finite useful lives are amortized using the straight-line method over their useful lives and are reviewed for impairment. The Company evaluates intangible assets and other long-lived assets for impairment whenever events or circumstances indicate that they may not be recoverable or at least annually. Recoverability is measured by comparing the carrying amount of an asset group to future undiscounted net cash flows expected to be generated. If this comparison indicates impairment, the amount of impairment to be recognized is calculated as the difference between the carrying value and the fair value of the asset group, generally measured by discounting estimated future cash flows. There were no impairment indicators present during the years ended December 31, 2011, 2012 and 2013 or the six months ended June 30, 2013 and 2014.
Website and Software Development Costs
The costs incurred in the preliminary stages of development are expensed as incurred. Once an application has reached the development stage, internal and external costs, if direct and incremental and deemed by management to be significant, are capitalized and amortized on a straight-line basis over their estimated useful lives. Maintenance and enhancement costs, including those costs in the post-implementation stages, are typically expensed as incurred, unless such costs relate to substantial upgrades and enhancements to the website or software that result in added functionality, in which case the costs are capitalized and amortized on a straight-line basis over the estimated useful lives. Amortization expense related to capitalized website and software development costs is included in depreciation and amortization. The Company capitalized $2,398, $2,280 and
F-13
Table of Contents
GRUBHUB INC.
(F/K/A GRUBHUB SEAMLESS INC.)
Notes to Consolidated Financial Statements (Continued)
(in thousands, except share amounts)
$2,592 of website development costs during the years ended December 31, 2011, 2012 and 2013, respectively, and $1,434 (unaudited) and $1,112 (unaudited) of website development costs during the six months ended June 30, 2013 and 2014, respectively.
Goodwill
Goodwill represents the excess of the cost of an acquired business over the fair value of the assets acquired at the date of acquisition. Absent any special circumstances that could require an interim test, the Company has elected to test for goodwill impairment at September 30 of each year.
The Company tests for impairment using a two-step process. The first step of the goodwill impairment test identifies if there is potential goodwill impairment. If step one indicates that an impairment may exist, a second step is performed to measure the amount of the goodwill impairment, if any, by comparing the implied fair value of goodwill with the carrying amount. If the implied goodwill is less than the carrying amount, a write-down is recorded. The Company has determined that there was no goodwill impairment as of December 31, 2012 and 2013 and June 30, 2014.
Fair Value
Accounting standards define fair value as the price that would be received to sell an asset or paid to transfer a liability (an exit price) in the principal or most advantageous market in an orderly transaction between market participants on the measurement date. The standards also establish a fair value hierarchy, which requires an entity to maximize the use of observable inputs and minimize the use of unobservable inputs when measuring fair value. There are three levels of inputs that may be used to measure fair value:
The Company applied the following methods and assumptions in estimating its fair value measurements:
| Level 1 | Quoted prices in active markets for identical assets or liabilities. | |
| Level 2 | Assets and liabilities valued based on observable market data for similar instruments, such as quoted prices for similar assets or liabilities. | |
| Level 3 | Unobservable inputs that are supported by little or no market activity; instruments valued based on the best available data, some of which is internally developed, and considers risk premiums that a market participant would require. | |
The Company applied the following methods and assumptions in estimating its fair value measurements: Cash equivalents are comprised of highly liquid investments, including money market funds and certificates of deposit with original maturities of less than three months. The fair value measurement of these assets is based on quoted market prices in active markets and, therefore, these assets are recorded at fair value on a recurring basis and classified as Level 1 in the fair value hierarchy. Redeemable common stock consisted of put rights the Company had granted to certain shareholders which required common shares to be repurchased at fair value (as defined in the stockholders agreement) determined by the redemption date. The fair value measurement of redeemable common stock (as defined in the stockholders agreement) was based on Level 3 inputs which are defined in the fair value hierarchy as noted above. Accounts receivable and accounts payable approximate fair value due to their generally short-term maturities.
F-14
Table of Contents
GRUBHUB INC.
(F/K/A GRUBHUB SEAMLESS INC.)
Notes to Consolidated Financial Statements (Continued)
(in thousands, except share amounts)
The following tables present the balances of assets measured at fair value on a recurring basis as of the dates presented at December 31, 2012 and 2013 and June 30, 2014.
| December 31, | June 30,
2014 (unaudited) |
|||||||||||
| Fair Value |
2012 | 2013 | ||||||||||
| (in thousands) | ||||||||||||
| Cash equivalents |
$ | — | $ | 4,200 | $ | 4,203 | ||||||
The Company did not have any assets or liabilities measured on a recurring basis using Level 2 or Level 3 inputs at December 31, 2012 and 2013 or June 30, 2014.
The fair value of the Company’s redeemable common stock, determined to be Level 3 under the fair value hierarchy, was measured based on the required redemption at the most recent fair value of the common stock. The put rights for the Company’s then outstanding redeemable common stock were terminated and the shares converted on a one-for-one basis into common stock upon the closing of the IPO on April 4, 2014. The redeemable common stock fair value was prepared based on the required redemption at the most recent fair value of the common stock. The following table presents the fair value, valuation techniques and related unobservable inputs for the Level 3 measurement as of December 31, 2013:
| Fair value (in thousands) |
Valuation technique |
Unobservable input |
Range | |||||||
| Redeemable common stock |
$ | 18,415 | Probability Weighted Expected Return Method |
Discount rate of 15.3% Lack of Marketability— |
Based on computed estimated fair value | |||||
Concentration of Credit Risk
Financial instruments which potentially subject the Company to concentrations of credit risk consist principally of accounts receivable. For the fiscal years ended December 31, 2011, 2012 and 2013 and the six months ended June 30, 2014, the Company had no customers which accounted for more than 10% of revenue or accounts receivable.
Revenue Recognition
In general, the Company recognizes revenue when (i) persuasive evidence of an arrangement exists, (ii) delivery has occurred or services have been rendered to the customer, (iii) the fee is fixed or determinable and (iv) collectability is reasonably assured. The Company considers a signed agreement, a binding contract with the restaurant or other similar documentation reflecting the terms and conditions under which products or services will be provided to be persuasive evidence of an arrangement.
The Company generates revenues primarily when diners place an order on our platform through our websites, our mobile applications, third-party websites that incorporate our API or one of our listed phone numbers. Restaurants pay us a commission, typically a percentage of the transaction, on orders that are processed through our platform. Most of our restaurants can choose their level of commission rate, at or above our base rates, to affect their relative priority in our sorting algorithms, with restaurants paying higher commission rates generally appearing higher in the search order than restaurants paying lower commission rates. Some restaurants
F-15
Table of Contents
GRUBHUB INC.
(F/K/A GRUBHUB SEAMLESS INC.)
Notes to Consolidated Financial Statements (Continued)
(in thousands, except share amounts)
on our platform pay a monthly system fee for better branding and more robust placement. Because we are acting as an agent of the merchant in the transaction, we recognize as revenues only our commissions from the transaction, which are a percentage of the total Gross Food Sales for such transaction.
The Company periodically provides incentive offers to restaurants and diners to use our platform. These promotions are generally cash credits to be applied against purchases. We record these incentive offers as reductions in revenues, generally on the date we record the corresponding revenue.
Revenues from online and phone delivery orders are recognized when these orders are placed at the restaurants. The amount of revenue recorded by the Company is based on the contractual arrangement with the related restaurant, and is adjusted for any cash credits, including incentive offers provided to restaurants and diners, related to the transaction. Although the Company will process the entire amount of the transaction with the diner, it will record its revenue on a net basis because the Company is acting as an agent of the merchant in the transaction. The Company will record an amount representing the restaurant food liability for the net balance due the restaurant.
Deferred Rent
For the Company’s operating leases, the Company recognizes rent expenses on a straight-line basis over the terms of the leases. Accordingly, the Company records the difference between cash rent payments and the recognition of rent expenses as a deferred rent liability. The Company has landlord-funded leasehold improvements that are recorded as tenant allowances which are being amortized as a reduction of rent expense over the noncancelable terms of the operating leases.
Segments
The Company has one reportable segment. Our reportable segment has been identified based on how our chief operating decision maker manages our business, makes operating decisions and evaluates operating performance.
Recently Issued Accounting Pronouncements
In May 2014, the Financial Accounting Standards Board (“FASB”) issued Accounting Standards Update No. 2014-09, “Revenue from Contracts with Customers (Topic 606)” (“ASU 2014-09”), which supersedes the revenue recognition requirements in Topic 605, Revenue Recognition, including most industry-specific requirements. ASU 2014-09 establishes a five-step revenue recognition process in which an entity will recognize revenue when it transfers promised goods or services to customers in an amount that reflects the consideration to which the company expects to be entitled in exchange for those goods or services. ASU 2014-09 also requires enhanced disclosures regarding the nature, amount, timing and uncertainty of revenues and cash flows from contracts with customers. ASU 2014-09 will be effective for the Company in the first quarter of 2017. Management is currently evaluating the impact the adoption of ASU 2014-09 will have on the Company’s condensed consolidated financial position, results of operations or cash flows and the method of retrospective application, either full or modified.
In July 2013, the FASB issued Accounting Standards Update No. 2013-11 “Income Taxes (Topic 740): Presentation of an Unrecognized Tax Benefit When a Net Operating Loss Carryforward, a Similar Tax Loss, or a Tax Credit Carryforward Exists” (“ASU 2013-11”), which requires that a liability related to an unrecognized tax
F-16
Table of Contents
GRUBHUB INC.
(F/K/A GRUBHUB SEAMLESS INC.)
Notes to Consolidated Financial Statements (Continued)
(in thousands, except share amounts)
benefit be presented as a reduction of a deferred tax asset for a net operating loss carryforward, a similar tax loss or a tax credit carryforward that the entity intends to use and is available for settlement at the reporting date. ASU 2013-11 was effective for and adopted by the Company in the first quarter of 2014 and applied prospectively to unrecognized tax benefits that existed at the effective date. The adoption of ASU 2013-11 impacted the Company’s financial statement presentation and disclosures, but otherwise did not impact the Company’s condensed consolidated financial position, results of operations or cash flows.
In February 2013, the FASB issued Accounting Standards Update No. 2013-02 “Comprehensive Income (Topic 220): Reporting of Amounts Reclassified out of Accumulated Other Comprehensive Income” (“ASU 2013-02”), which requires an entity to disaggregate the total change of each component of other comprehensive income either on the face of the income statement or as a separate disclosure in the notes. ASU 2013-02 was effective for and adopted by the Company in the first quarter of 2013. The adoption of ASU 2013-02 impacted the Company’s financial statement presentation and disclosures, but otherwise did not impact the Company’s condensed consolidated financial position, results of operations or cash flows.
In September 2011, the FASB issued ASU No. 2011-08, “Intangibles—Goodwill and Other (Topic 350)” “(ASU 2011-08”), which allows companies to assess qualitative factors to determine if it is more-likely-than-not that goodwill might be impaired and whether it is necessary to perform the two-step goodwill impairment test. ASU 2011-08 was effective for and adopted by the Company in the first quarter of 2012. The adoption of this ASU 2011-08 did not have any material impact on the Company’s results of operations or financial position.
In June 2011, the FASB issued ASU No. 2011-05, “Presentation of Comprehensive Income” (“ASU 2011-05”), which requires an entity to present total comprehensive income, the components of net income, and the components of other comprehensive income either in a single continuous statement of comprehensive income or in two separate but consecutive statements and eliminates the option to present the components of other comprehensive income as part of the statement of changes in stockholders’ equity. The Company early adopted this guidance in the first quarter of 2012, retrospectively. The adoption of ASU 2011-05 impacted the Company’s financial statement presentation and disclosures, but otherwise did not impact the Company’s condensed consolidated financial position, results of operations or cash flows.
In May 2011, the FASB issued ASU No. 2011-04, “Fair Value Measurement (Topic 820),” (“ASU 2011-04”) which amended existing rules for fair value measurements and disclosures to clarify guidance and minimize differences between GAAP and International Financial Reporting Standards (“IFRS”). ASU 2011-04 requires entities to provide information about valuation techniques and unobservable inputs used in Level 3 fair value measurements and provide a narrative description of the sensitivity of Level 3 measurements to changes in unobservable inputs. ASU 2011-04 was for and adopted by the Company in the first quarter of 2012. The adoption of ASU 2011-04 did not have any impact on our financial position, results of operations or cash flows.
3. Acquisitions
GrubHub Holdings Inc.
On August 8, 2013, the Company acquired all of the equity interests of each of Seamless North America, LLC, Seamless Holdings and GrubHub Holdings Inc. pursuant to the Reorganization Agreement. In February 2014, GrubHub, Inc. changed its name to GrubHub Holdings Inc. The Company issued 23,318,580 shares of common stock and 8,098,430 shares of preferred stock to GrubHub Holdings Inc. in exchange for all of GrubHub Holdings Inc.’s equity interests (the “Merger”). The Company concluded that Seamless Holdings was deemed
F-17
Table of Contents
GRUBHUB INC.
(F/K/A GRUBHUB SEAMLESS INC.)
Notes to Consolidated Financial Statements (Continued)
(in thousands, except share amounts)
the acquirer for financial reporting purposes based on key deciding factors such as a majority ownership and majority of the board of director seats. Accordingly, the acquisition of GrubHub Holdings Inc. has been accounted for as a business combination. GrubHub Holdings Inc. provides online food ordering through its website grubhub.com, and also operates allmenus.com, a website that stores and displays approximately 275,000 menus.
The fair value of the equity issued to GrubHub Holdings Inc. in connection with the Merger was approximately $421.5 million. The value of the equity was determined using the estimated fair value of GrubHub Holdings Inc.’s stock at the merger date based on a valuation of GrubHub Holdings Inc. conducted by management. The assets acquired and liabilities assumed were recorded at their estimated fair values as of August 8, 2013. Included as part of the $421.5 million value is approximately $11.0 million which represents the fair value of the replacement awards using the Black-Scholes option-pricing model that were attributed to the pre-combination service period for GrubHub Holdings Inc. option holders. Post combination expense of $12.5 million is expected to be recognized post-Merger, which represents for the unrecognized compensation expense related to GrubHub Holdings Inc. stock options. See Note 8, Stock-Based Compensation, for further details.
The excess of the consideration transferred in the acquisition over the net amounts assigned to the fair value of the assets acquired was recorded as goodwill, which represents the opportunity to expand existing markets and access new customers and to create revenue and cost synergies that management believes will contribute to future profits. The goodwill is not deductible for income tax purposes.
The Company incurred certain expenses directly and indirectly related to the Merger of $4.7 million during the year ended December 31, 2013 and $3.3 million (unaudited) during the six months ended June 30, 2013, which were recognized in in general and administrative expenses within the consolidated statement of operations.
The following table summarizes the August 8, 2013 acquisition-date fair value of the assets and liabilities acquired in connection with the GrubHub Holdings Inc. business combination:
| (in thousands) | ||||
| Cash and cash equivalents |
$ | 13,266 | ||
| Accounts receivable |
2,108 | |||
| Other identifiable assets |
4,422 | |||
| Customer and vendor relationships |
167,450 | |||
| Deferred tax asset |
4,013 | |||
| Deferred tax liability |
(88,937 | ) | ||
| Developed technology |
5,143 | |||
| Goodwill |
239,346 | |||
| Liabilities assumed |
(10,602 | ) | ||
| Trademarks |
85,276 | |||
|
|
|
|||
| Total net assets acquired |
$ | 421,485 | ||
|
|
|
|||
The estimated fair values of the intangible assets acquired were determined based on a combination of the income, cost, and market approaches to measure the fair value of the customer (restaurant) relationships, developed technology and trademarks. The fair value of the trademarks was measured based on the relief from royalty method. The cost approach, specifically the cost to recreate method, was used to value the developed technology. The income approach, specifically the multi-period excess earnings method, was used to value the customer (restaurant) relationships. These fair value measurements were based on significant inputs not observable in the market and thus represent Level 3 measurements under the fair value hierarchy.
F-18
Table of Contents
GRUBHUB INC.
(F/K/A GRUBHUB SEAMLESS INC.)
Notes to Consolidated Financial Statements (Continued)
(in thousands, except share amounts)
The results of operations related to GrubHub Holdings Inc. have been included in the Company’s financial statements since August 9, 2013. The amount of revenues and net loss included in the Company’s operating results since the acquisition date through December 31, 2013 were $26.3 million and $3.6 million, respectively.
The following unaudited pro forma information presents a summary of the operating results of the Company for the year ended December 31, 2012 and 2013, and the six months ended June 30, 2013 as if GrubHub Inc. had acquired GrubHub Holdings Inc. as of January 1, 2012 and January 1, 2013, respectively:
| December 31, 2012 Pro forma combined |
December 31, 2013 Pro forma combined |
Six Months Ended June 30, 2013 Pro forma combined |
||||||||||
| (unaudited) (in thousands) |
||||||||||||
| Revenues |
$ | 118,854 | $ | 170,086 | $ | 80,027 | ||||||
| Net income (loss) |
$ | (17,028 | ) | $ | 4,160 | $ | 773 | |||||
The pro forma adjustments reflect the additional amortization that would have been recognized for the intangible assets, replacement stock option awards compensation cost for services performed after the Merger, elimination of transaction costs incurred and pro forma tax adjustments for the years ended December 31, 2012 and 2013 and the six months ended June 30, 2013 as follows:
| Year
Ended December 31, 2012 |
Year
Ended December 31, 2012 |
Six Months
Ended June 30, 2013 |
||||||||||
| (in thousands) | ||||||||||||
| (unaudited) | ||||||||||||
| Amortization of intangible assets |
$ | 9,761 | $ | 6,475 | $ | 5,334 | ||||||
| Stock-based compensation |
4,979 | 2,997 | 2,424 | |||||||||
| Transaction costs |
— | (9,131 | ) | (7,430 | ) | |||||||
| Income tax benefit |
— | (3,050 | ) | (2,767 | ) | |||||||
4. Related Party Transactions
Note Receivable
On December 31, 2011, the Company loaned Aramark $16.0 million and entered into a note receivable with an interest rate of 3.4% per annum. The note was paid in full along with the accumulated accrued interest in January 2012. Additionally during 2012, the Company made short-term advances to Aramark, which were also repaid in 2012.
Due to Related Party
During 2012 and 2013, the Company had a cash management program with Aramark whereby all payroll and related costs were funded by Aramark and all cumulative excess cash balances were deposited with Aramark. At December 31, 2012 the balance due to Aramark was $0.2 million. The program was terminated during 2013 and no balance was due as of December 31, 2013.
Corporate Service Agreement
The Company had an arrangement with Aramark pursuant to which the latter would provide support for certain corporate, accounting, information technology and other administrative services. Total expenses under this arrangement for the years ended December 31, 2011, 2012, and 2013 were $0.6 million, $0.4 million, and $0.1 million, respectively. The arrangement was terminated in 2013.
F-19
Table of Contents
GRUBHUB INC.
(F/K/A GRUBHUB SEAMLESS INC.)
Notes to Consolidated Financial Statements (Continued)
(in thousands, except share amounts)
5. Goodwill and Acquired Intangible Assets
The components of acquired intangible assets as of December 31, 2012, December 31, 2013 and June 30, 2014 were as follows:
| Useful Lives | Amounts | Accumulated Amortization |
Carrying Value |
|||||||||||
| (in thousands) | ||||||||||||||
| December 31, 2012 |
||||||||||||||
| Customer and vendor relationships, databases |
1 to 15 years | $ | 24,529 | $ | (11,462 | ) | $ | 13,067 | ||||||
|
|
|
|
|
|
|
|||||||||
| Total amortizable intangible assets |
24,529 | (11,462 | ) | 13,067 | ||||||||||
| Trademarks |
Indefinite | 4,400 | — | 4,400 | ||||||||||
|
|
|
|
|
|
|
|||||||||
| Total acquired intangible assets |
$ | 28,929 | $ | (11,462 | ) | $ | 17,467 | |||||||
|
|
|
|
|
|
|
|||||||||
| Useful Lives | Amounts | Accumulated Amortization |
Carrying Value |
|||||||||||
| (in thousands) | ||||||||||||||
| December 31, 2013 |
||||||||||||||
| Developed technology |
3 years | $ | 5,143 | $ | (677 | ) | $ | 4,466 | ||||||
| Customer and vendor relationships, databases |
1 to 16.4 years | 191,979 | (17,680 | ) | 174,299 | |||||||||
|
|
|
|
|
|
|
|||||||||
| Total amortizable intangible assets |
197,122 | (18,357 | ) | 178,765 | ||||||||||
| Trademarks |
Indefinite | 89,676 | — | 89,676 | ||||||||||
|
|
|
|
|
|
|
|||||||||
| Total acquired intangible assets |
$ | 286,798 | $ | (18,357 | ) | $ | 268,441 | |||||||
|
|
|
|
|
|
|
|||||||||
| Useful Lives | Amounts | Accumulated Amortization |
Carrying Value |
|||||||||||
| (in thousands) | ||||||||||||||
| June 30, 2014 (unaudited) |
||||||||||||||
| Developed technology |
3 years | $ | 5,143 | $ | (1,534 | ) | $ | 3,609 | ||||||
| Customer and vendor relationships, databases |
1 to 16.4 years | 191,979 | (23,874 | ) | 168,105 | |||||||||
|
|
|
|
|
|
|
|||||||||
| Total amortizable intangible assets |
197,122 | (25,408 | ) | 171,714 | ||||||||||
| Trademarks |
Indefinite | 89,676 | — | 89,676 | ||||||||||
|
|
|
|
|
|
|
|||||||||
| Total acquired intangible assets |
$ | 286,798 | $ | (25,408 | ) | $ | 261,390 | |||||||
|
|
|
|
|
|
|
|||||||||
Amortization expense recorded for acquired intangible assets for the years ended December 31, 2011, 2012 and 2013 was $2.0 million, $2.5 million and $6.9 million, respectively, and $1.1 million (unaudited) and $7.0 million (unaudited) for the six months ended June 30, 2013 and 2014, respectively. These amounts are included in depreciation and amortization in the consolidated statements of operations.
The Company recorded additions of $257.9 million for intangible assets acquired with the Merger during the year ended December 31, 2013.
F-20
Table of Contents
GRUBHUB INC.
(F/K/A GRUBHUB SEAMLESS INC.)
Notes to Consolidated Financial Statements (Continued)
(in thousands, except share amounts)
The components of acquired intangible assets added during 2013 were as follows:
| December 31, 2013 | ||||||
| Weighted Average Useful Life |
Amounts | |||||
| (in thousands) | ||||||
| Developed technology |
3 years | $ | 5,143 | |||
| Customer and vendor relationships, databases |
16.4 years | 167,450 | ||||
| Trademarks |
Indefinite | 85,276 | ||||
|
|
|
|||||
| Total acquired intangible assets |
$ | 257,869 | ||||
|
|
|
|||||
The remaining weighted average amortization period for acquired intangible assets was 14.6 years as of June 30, 2014. Estimated future amortization expense for intangible asset as of June 30, 2014 is as follows:
| (unaudited) (in thousands) |
||||
| The remainder of 2014 |
$ | 7,051 | ||
| 2015 |
14,102 | |||
| 2016 |
13,344 | |||
| 2017 |
12,068 | |||
| 2018 |
12,068 | |||
| Beyond |
113,081 | |||
|
|
|
|||
| Total |
$ | 171,714 | ||
|
|
|
|||
The changes in the carrying amount of goodwill during the periods presented were as follows:
| (in thousands) | ||||
| December 31, 2011 |
$ | 113,442 | ||
| Additions |
— | |||
|
|
|
|||
| December 31, 2012 |
113,442 | |||
| Acquisition of GrubHub Holdings Inc. |
239,346 | |||
|
|
|
|||
| December 31, 2013 |
352,788 | |||
|
|
|
|||
| Additions* |
— | |||
| June 30, 2014* |
$ | 352,788 | ||
|
|
|
|||
| * | Unaudited |
F-21
Table of Contents
GRUBHUB INC.
(F/K/A GRUBHUB SEAMLESS INC.)
Notes to Consolidated Financial Statements (Continued)
(in thousands, except share amounts)
6. Property and Equipment, Net
The components of the Company’s property and equipment as of December 31, 2012, December 31, 2013 and June 30, 2014 were as follows:
| As of December 31, | June 30, 2014 | |||||||||||
| 2012 | 2013 | |||||||||||
| (unaudited) | ||||||||||||
| (in thousands) | ||||||||||||
| Computer equipment |
$ | 5,612 | $ | 9,739 | $ | 11,495 | ||||||
| Furniture and fixtures |
1,645 | 2,176 | 2,440 | |||||||||
| Developed software |
11,470 | 13,930 | 15,064 | |||||||||
| Purchased software |
— | 2,124 | 2,129 | |||||||||
| Leasehold improvement |
5,194 | 6,120 | 6,473 | |||||||||
|
|
|
|
|
|
|
|||||||
| Property and equipment |
23,921 | 34,089 | 37,601 | |||||||||
| Accumulated amortization and depreciation |
(10,580 | ) | (16,993 | ) | (21,072 | ) | ||||||
|
|
|
|
|
|
|
|||||||
| Property and equipment, net |
$ | 13,341 | $ | 17,096 | $ | 16,529 | ||||||
|
|
|
|
|
|
|
|||||||
The Company recorded amortization and depreciation expense related to property and equipment other than developed software of $0.9 million, $2.0 million, and $4.0 million for the years ended December 31, 2011, 2012 and 2013, respectively, and $1.6 million (unaudited) and $2.7 million (unaudited) for the six months ended June 30, 2013 and 2014, respectively.
The Company capitalized $2.3 million and $2.6 million in developed software for the years ended December 31, 2012 and 2013, respectively, and $1.4 million (unaudited) and $1.1 million (unaudited) for the six months ended June 30, 2013 and 2014, respectively. Amortization expense for developed software costs recognized in depreciation and amortization in the consolidated statements of operations was $1.1 million, $1.6 million and $2.6 million, for the years ended December 31, 2011, 2012 and 2013, respectively, and $1.0 million (unaudited) and $1.4 million (unaudited) for the six months ended June 30, 2013 and 2014, respectively.
7. Commitments and Contingencies
Office Facility Leases
The Company has various operating lease agreements which expire at various dates through June 2022. The terms of the lease agreements provide for rental payments on a graduated basis. The Company recognizes rent expense on a straight-line basis over the lease period.
Rental expense, principally for leased office space under operating lease commitments, was $1.9 million, $2.2 million and $2.5 million for the years ended December 31, 2011, 2012 and 2013, respectively, and $0.9 million (unaudited) and $1.9 million (unaudited) for the six months ended June 30, 2013 and 2014, respectively.
F-22
Table of Contents
GRUBHUB INC.
(F/K/A GRUBHUB SEAMLESS INC.)
Notes to Consolidated Financial Statements (Continued)
(in thousands, except share amounts)
Future minimum lease payments under these leases as of June 30, 2014 were as follows:
| (in thousands) | ||||
| The remainder of 2014 |
$ | 2,346 | ||
| 2015 |
3,646 | |||
| 2016 |
3,482 | |||
| 2017 |
2,939 | |||
| 2018 |
1,750 | |||
| Thereafter |
6,123 | |||
|
|
|
|||
| Total minimum lease payments |
$ | 20,286 | ||
|
|
|
|||
Legal
In August 2011, Ameranth filed a patent infringement action against a number of defendants, including GrubHub Holdings Inc., in the U.S. District Court for the Southern District of California (the “Court”), Case No. 3:11-cv-1810 (“’1810 action”). In September 2011, Ameranth amended its complaint in the ’1810 action to also accuse Seamless North America, LLC of infringement. Ameranth alleged that the GrubHub Holdings Inc. and Seamless North America, LLC ordering systems, products and services infringe claims 12 and 15 of U.S. Patent No. 6,384,850 (“’850 patent”) and claims 11 and 15 of U.S. Patent No. 6,871,325 (“’325 patent”).
In March 2012, Ameranth initiated eight additional actions for infringement of a third, related patent, U.S. Patent No. 8,146,077 (“’077 patent”), in the same forum, including separate actions against GrubHub Holdings Inc., Case No. 3:12-cv-739 (“’739 action”), and Seamless North America, LLC, Case No. 3:12-cv-737 (“’737 action”). In August 2012, the Court severed the claims against GrubHub Holdings Inc. and Seamless North America, LLC in the ’1810 action and consolidated them with the ’739 action and the ’737 action, respectively. Later, the Court consolidated these separate cases against GrubHub Holdings Inc. and Seamless North America, LLC, along with the approximately 40 other cases Ameranth filed in the same district, with the original ’1810 action. In their answers, GrubHub Holdings Inc. and Seamless North America, LLC denied infringement and interposed various defenses, including non-infringement, invalidity, unenforceability and inequitable conduct.
On November 26, 2013, the consolidated case was stayed pending the disposition of petitions for post-grant review of all the patents in the suit. These petitions were filed in the United States Patent and Trademark Office (the “PTO”) under the new Transitional Program for Covered Business Method Patents (the “CBM proceedings”). The CBM proceedings resulted in a March 26, 2014 ruling denying defendants’ petitions on the claims most relevant to GrubHub Holdings Inc. and Seamless North America LLC. The consolidated case remains stayed.
No trial date has been set for this case. The Company believes this case lacks merit and that it has strong defenses to all of the infringement claims. The Company intends to defend the suit vigorously. However, the Company is unable to predict the likelihood of success of Ameranth’s infringement claims and is unable to predict the likelihood of success of its counterclaims. The Company has not recorded an accrual related to this lawsuit as of June 30, 2014, as it does not believe a material loss is probable. It is a reasonable possibility that a loss may be incurred; however, the possible range of loss is not estimable given the early stage of the dispute and the uncertainty as to whether the claims at issue are with or without merit, will be settled out of court, or will be determined in the Company’s favor, whether the Company may be required to expend significant management time and financial resources on the defense of such claims, and whether the Company will be able to recover any losses under its insurance policies.
F-23
Table of Contents
GRUBHUB INC.
(F/K/A GRUBHUB SEAMLESS INC.)
Notes to Consolidated Financial Statements (Continued)
(in thousands, except share amounts)
In addition to the matters described above, from time to time, the Company is involved in various other legal proceedings arising from the normal course of business activities. As of June 30, 2014, the Company had reserved $0.6 million (unaudited) for such litigation.
Indemnification
In connection with the Merger, the Company agreed to indemnify Aramark Holdings for negative income tax consequences associated with the October 2012 spin-off of Seamless Holdings that are the result of certain actions taken by us, including our solicitation of acquirers to purchase us prior to October 29, 2014, and in certain other instances subject to a $15 million limitation. Management is not aware of any actions that would impact the indemnification obligation.
Restructuring
On November 20, 2013 the Company announced plans to close its Sandy, Utah office location in 2014. The Company recorded a restructuring accrual in the condensed consolidated balance sheets for severance and payroll related benefits as a result of the restructuring announcement. This amount represents the service vesting requirements for identified employees required to work through the expected closure date of the facility of December 31, 2014. The Company estimates total restructuring costs to be incurred will be approximately $1.2 million, including expense of $0.5 million (unaudited) to be recognized in the second half of 2014 related to the termination of the Sandy, Utah office lease agreement. Restructuring expense of $0.2 million and $0.5 million (unaudited) was recognized in general and administrative expenses in the condensed consolidated statements of operations for the year ended December 31, 2013 and the six months ended June 30, 2014, respectively.
The following tables summarize the Company’s restructuring activity during the year ended December 31, 2013 and the six months ended June 30, 2014:
| (in thousands) | ||||
| Restructuring reserve balance at December 31, 2012 |
$ | — | ||
| Restructuring expense |
176 | |||
| Cash payments |
— | |||
|
|
|
|||
| Restructuring reserve balance at December 31, 2013 |
$ | 176 | ||
| Restructuring expense* |
492 | |||
| Cash payments* |
(190 | ) | ||
|
|
|
|||
| Restructuring reserve balance at June 30, 2014* |
$ | 478 | ||
|
|
|
|||
| * | Unaudited |
8. Stock-Based Compensation
During 2011, the Company established a stock incentive plan (the “Plan”). The Plan allows the Company to grant stock options to individuals or groups of individuals as specified in the Plan. The exercise price of stock options cannot be less than the fair value of the common stock at the time of the grant, and the stock options generally expire ten years after the date of issuance.
As part of the Reorganization Agreement, the Company was required to replace GrubHub Holdings Inc.’s share based payment awards. The Company determined the fair value of the replacement awards at the time of
F-24
Table of Contents
GRUBHUB INC.
(F/K/A GRUBHUB SEAMLESS INC.)
Notes to Consolidated Financial Statements (Continued)
(in thousands, except share amounts)
the Merger. The fair value based measure of the replacement awards that was attributable to pre-combination services was approximately $11.0 million, and was included as part of the purchase price of $421.5 million, as additional consideration transferred in the business combination. The Company also determined that the fair value based measure of the replacement options attributable to post combination services was approximately $12.5 million. The fair value of the post combination services replacement awards is recognized as compensation cost in the Company’s post-Merger consolidated financial statements over the remaining vesting period.
The Company granted 3,992,500, 1,619,167, 3,698,708 and 1,739,273 (unaudited) stock options during the year ended December 31, 2011, 2012 and 2013 and the six months ended June 30, 2014, respectively. The fair market value of each stock option award was estimated based on the assumptions below as of the grant date using the Black-Scholes-Merton option pricing model. Expected volatilities are based on historical volatilities of comparable publicly traded companies. The Company uses historical data to estimate option exercises and employee terminations within the valuation model. Separate groups of employees that have similar historical exercise behavior are considered separately for valuation purposes. The expected term of the award is estimated using a simplified method. The fair value at grant date was determined considering the performance of the Company at the grant date as well as future growth and profitability expectations by applying market and income approaches. The risk-free rate for the period within the contractual life of the option is based on the U.S. Treasury yield curve in effect at the time of grant. The following assumptions were utilized for the years ended December 31, 2011, 2012, and 2013 and the six months ended June 30, 2014:
| December 31, | June 30, 2014 | |||||||||||||||
| 2011 | 2012 | 2013 | ||||||||||||||
| (unaudited) | ||||||||||||||||
| Weighted average fair value options granted |
$ | 1.09 | $ | 1.46 | $ | 3.97 | $ | 13.12 | ||||||||
| Average risk-free interest rate |
1.21 | % | 0.87 | % | 1.41 | % | 2.00 | % | ||||||||
| Expected stock price volatilities(a) |
60.40 | % | 54.80 | % | 50.7 | % | 50.5 | % | ||||||||
| Dividend yield |
None | None | None | None | ||||||||||||
| Expected stock option life (years) |
6.08 | 6.11 | 5.20 | 6.29 | ||||||||||||
| a) | There was no active external or internal market for the Company’s shares until April of 2014. Thus, it was not possible to estimate the expected volatility of the Company’s share price in estimating fair value of options granted. As a substitute for such volatility, the Company used the historical volatility of comparable companies. |
The stock options vest over different lengths of time depending upon the grantee. Compensation expense is recorded over the vesting period. The Company recorded compensation expense of $0.8 million, $2.6 million and $4.9 million for the years ended December 31, 2011, 2012 and 2013, respectively, and $1.2 million (unaudited) and $4.7 million (unaudited) during the six months ended June 30, 2013 and 2014, respectively.
F-25
Table of Contents
GRUBHUB INC.
(F/K/A GRUBHUB SEAMLESS INC.)
Notes to Consolidated Financial Statements (Continued)
(in thousands, except share amounts)
A summary of the Company’s stock option activity is as follows:
| Fiscal Year Ended December 31, 2011 | ||||||||||||||||
| Options | Weighted Average Exercise Price |
Average Intrinsic Value (in thousands) |
Weighted Average Exercise Term (years) |
|||||||||||||
| Outstanding at beginning of period |
— | N/A | ||||||||||||||
| Granted |
3,992,500 | $ | 3.80 | |||||||||||||
| Forfeited |
(135,000 | ) | 3.80 | |||||||||||||
|
|
|
|||||||||||||||
| Outstanding at end of period |
3,875,500 | $ | 3.80 | $ | 2,003 | 9.79 | ||||||||||
|
|
|
|||||||||||||||
| Vested and expected to vest at end of period |
3,310,894 | 3.80 | 1,722 | 9.73 | ||||||||||||
| Exercisable at end of period |
2,344 | 3.80 | $ | 1 | 9.70 | |||||||||||
| Fiscal Year Ended December 31, 2012 | ||||||||||||||||
| Options | Weighted Average Exercise Price |
Average Intrinsic Value (in thousands) |
Weighted Average Exercise Term (years) |
|||||||||||||
| Outstanding at beginning of period |
3,857,500 | $ | 3.80 | $ | 2,003 | 9.79 | ||||||||||
| Granted |
1,619,167 | 5.16 | ||||||||||||||
| Forfeited |
(541,799 | ) | 3.88 | |||||||||||||
| Exercised |
(29,860 | ) | 3.80 | |||||||||||||
|
|
|
|||||||||||||||
| Outstanding at end of period |
4,905,008 | $ | 4.24 | 8,632 | 9.37 | |||||||||||
|
|
|
|||||||||||||||
| Vested and expected to vest at end of period |
4,323,108 | 4.22 | 7,687 | 9.41 | ||||||||||||
| Exercisable at end of period |
1,222,222 | 3.80 | $ | 2,689 | 9.41 | |||||||||||
| Fiscal Year Ended December 31, 2013 | ||||||||||||||||
| Options | Weighted Average Exercise Price |
Average Intrinsic Value (in thousands) |
Weighted Average Exercise Term (years) |
|||||||||||||
| Outstanding at beginning of period |
4,905,008 | $ | 4.24 | $ | 8,632 | 9.37 | ||||||||||
| Granted |
3,698,708 | 3.78 | ||||||||||||||
| Forfeited |
(458,204 | ) | 4.40 | |||||||||||||
| Exercised |
(475,959 | ) | 3.04 | |||||||||||||
|
|
|
|||||||||||||||
| Outstanding at end of period |
7,669,553 | $ | 4.08 | 56,844 | 8.29 | |||||||||||
|
|
|
|||||||||||||||
| Vested and expected to vest at end of period |
7,193,713 | 4.02 | 53,870 | 8.27 | ||||||||||||
| Exercisable at end of period |
3,081,017 | 3.64 | $ | 24,197 | 8.18 | |||||||||||
F-26
Table of Contents
GRUBHUB INC.
(F/K/A GRUBHUB SEAMLESS INC.)
Notes to Consolidated Financial Statements (Continued)
(in thousands, except share amounts)
| Six Months Ended June 30, 2014 | ||||||||||||||||
| Options | Weighted Average Exercise Price |
Average Intrinsic Value (in thousands) |
Weighted Average Exercise Term (years) |
|||||||||||||
| (unaudited) | ||||||||||||||||
| Outstanding at beginning of period |
7,669,553 | $ | 4.08 | $ | 56,844 | 8.29 | ||||||||||
| Granted |
1,739,273 | 15.13 | ||||||||||||||
| Forfeited |
(558,820 | ) | 4.27 | |||||||||||||
| Exercised |
(695,627 | ) | 3.31 | |||||||||||||
|
|
|
|||||||||||||||
| Outstanding at end of period |
8,154,379 | 6.44 | 236,210 | 8.20 | ||||||||||||
|
|
|
|||||||||||||||
| Vested and expected to vest at end of period |
6,587,727 | 5.60 | 196,389 | 8.06 | ||||||||||||
| Exercisable at end of period |
3,493,142 | $ | 3.88 | $ | 110,146 | 7.76 | ||||||||||
The aggregate intrinsic value in the tables above represents the total pre-tax intrinsic value (the difference between the fair value of the common stock on December 31, 2011, 2012 and 2013 and June 30, 2014, respectively, and the exercise price, multiplied by the number of in-the-money options) that would have been received by the option holders had all option holders exercised their in-the-money options on each date. This amount will change in future periods based on the fair market value of the Company’s stock and the number of options outstanding. The aggregate intrinsic value of awards exercised during the years ended December 31, 2012, and 2013 was $0.07 million and $3.4 million, respectively, and $11.6 million (unaudited) during the six months ended June 30, 2014. There were no awards exercised during the year ended December 31, 2011.
F-27
Table of Contents
GRUBHUB INC.
(F/K/A GRUBHUB SEAMLESS INC.)
Notes to Consolidated Financial Statements (Continued)
(in thousands, except share amounts)
The options outstanding and exercisable as of June 30, 2014 have been segregated into ranges for additional disclosure as follows:
| Exercise Price |
Outstanding on June 30, 2014(1) |
Weighted Average Remaining Term (years) |
Vested and Expected to Vest on June 30, 2014 |
Weighted Average Exercise Term (years) |
Exercisable on June 30, 2014 |
Weighted Average Exercise Term (years) |
||||||||||||||||||
| (unaudited) | ||||||||||||||||||||||||
| $0.06 |
8,554 | 4.47 | 8,544 | 4.47 | 8,554 | 4.47 | ||||||||||||||||||
| 0.08 |
87,654 | 4.98 | 87,654 | 4.98 | 87,654 | 4.98 | ||||||||||||||||||
| 0.44 |
74,823 | 6.03 | 74,212 | 6.03 | 69,067 | 6.01 | ||||||||||||||||||
| 0.78 |
77,867 | 6.45 | 73,971 | 6.45 | 32,632 | 6.52 | ||||||||||||||||||
| 0.90 |
255,793 | 6.86 | 239,093 | 6.86 | 138,714 | 6.88 | ||||||||||||||||||
| 2.00 |
1,098,402 | 7.59 | 889,702 | 7.56 | 439,976 | 7.47 | ||||||||||||||||||
| 2.62 |
50,000 | 7.31 | 50,000 | 7.31 | 50,000 | 7.31 | ||||||||||||||||||
| 3.80 |
2,546,905 | 7.98 | 2,397,213 | 7.99 | 1,768,388 | 8.00 | ||||||||||||||||||
| 4.62 |
50,599 | 7.97 | 40,930 | 7.97 | 25,298 | 7.97 | ||||||||||||||||||
| 5.06 |
59,725 | 8.07 | 49,386 | 8.07 | 3,582 | 8.08 | ||||||||||||||||||
| 5.08 |
155,797 | 8.14 | 90,184 | 8.14 | 50,352 | 8.14 | ||||||||||||||||||
| 5.20 |
338,952 | 7.42 | 288,053 | 7.39 | 161,020 | 7.41 | ||||||||||||||||||
| 5.60 |
1,070,535 | 8.00 | 916,871 | 8.04 | 446,447 | 8.06 | ||||||||||||||||||
| 6.20 |
125,058 | 8.35 | 98,269 | 8.35 | 28,617 | 8.32 | ||||||||||||||||||
| 6.22 |
125 | 8.38 | 104 | 8.38 | — | n/a | ||||||||||||||||||
| 8.40 |
164,888 | 8.63 | 153,399 | 8.62 | 106,173 | 8.59 | ||||||||||||||||||
| 8.42 |
93,739 | 8.60 | 66,633 | 8.60 | 31,072 | 8.59 | ||||||||||||||||||
| 10.82 |
199,000 | 8.80 | 123,791 | 8.80 | 42,177 | 8.81 | ||||||||||||||||||
| 11.50 |
28,750 | 9.44 | 13,422 | 9.42 | 389 | 8.69 | ||||||||||||||||||
| 13.70 |
1,566,930 | 9.60 | 820,956 | 9.60 | — | n/a | ||||||||||||||||||
| 30.91 |
122,100 | 9.89 | 57,147 | 9.89 | — | n/a | ||||||||||||||||||
| 35.31 |
18,183 | 9.78 | 18,183 | 9.78 | 3,030 | 9.78 | ||||||||||||||||||
|
|
|
|
|
|
|
|
|
|
|
|
|
|||||||||||||
| Total |
8,154,379 | 8.20 | 6,587,727 | 8.06 | 3,493,142 | 7.76 | ||||||||||||||||||
|
|
|
|
|
|
|
|
|
|
|
|
|
|||||||||||||
| (1) | Includes 34,512 shares of restricted common stock owned by officers of the Company that contain forfeiture provisions. |
As of June 30, 2014, total unrecognized compensation cost, adjusted for estimated forfeitures, related to non-vested stock options was $21.1 million (unaudited) and is expected to be recognized over a weighted average period of 3.05 years.
9. Income Taxes
The Company files income tax returns in the U.S. federal, the United Kingdom and various state jurisdictions. The Company’s primary operating unit is Seamless North America, LLC, which was incorporated in 1999 as a taxable C-Corporation, and acquired by Aramark in April of 2006. The Company was converted to a single member limited liability company (“LLC”) in April of 2007. In June of 2011, the entity was converted into a partnership for tax purposes upon the sale of a 26% interest to SLW Investors. In October of 2012, Aramark spun off its interest in Seamless North America, LLC by contributing the partnership interest to a newly formed C-Corporation, Seamless Holdings, and distributing those shares to the shareholders of Aramark. The income
F-28
Table of Contents
GRUBHUB INC.
(F/K/A GRUBHUB SEAMLESS INC.)
Notes to Consolidated Financial Statements (Continued)
(in thousands, except share amounts)
taxes paid on behalf of Seamless North America, LLC by Aramark, while it was a single member LLC, have been reflected as income tax expense and as contributed capital for the period prior to the sale to SLW Investors in June of 2011. On that date, the Company recorded tax benefits of approximately $8.1 million relating to the reversal of existing deferred tax liabilities relating to the C-Corporation and recognition of a deferred tax asset at the partnership level relating to tax status of the underlying LLC. A deferred tax liability of approximately $8.2 million was assumed by Seamless Holdings at the time it was spun off from Aramark in October of 2012. This liability was reflected as an offset to equity, as part of the spin off.
The income tax provision (benefit) was comprised of the following:
| Year Ended December 31, | ||||||||||||
| 2011 | 2012 | 2013 | ||||||||||
| (in thousands) | ||||||||||||
| Current: |
||||||||||||
| Federal |
$ | 1,514 | $ | 316 | $ | 2,912 | ||||||
| State |
893 | 132 | 3,056 | |||||||||
| Foreign |
424 | 365 | 468 | |||||||||
|
|
|
|
|
|
|
|||||||
| Total current |
2,831 | 813 | 6,436 | |||||||||
| Deferred: |
||||||||||||
| Federal |
(4,493 | ) | — | 1,300 | ||||||||
| State |
(3,558 | ) | — | 406 | ||||||||
|
|
|
|
|
|
|
|||||||
| Total deferred |
(8,051 | ) | — | 1,706 | ||||||||
|
|
|
|
|
|
|
|||||||
| Total income tax expense |
$ | (5,220 | ) | $ | 813 | $ | 8,142 | |||||
|
|
|
|
|
|
|
|||||||
Income before income taxes was as follows:
| Year Ended December 31, | ||||||||||||
| 2011 | 2012 | 2013 | ||||||||||
| (in thousands) | ||||||||||||
| Domestic source |
$ | 8,506 | $ | 7,153 | $ | 12,986 | ||||||
| Foreign source |
1,485 | 1,579 | 1,903 | |||||||||
|
|
|
|
|
|
|
|||||||
| Income before income tax |
$ | 9,991 | $ | 8,732 | $ | 14,889 | ||||||
|
|
|
|
|
|
|
|||||||
The following is a reconciliation of income taxes computed at the U.S. federal statutory rate to the income taxes reported in the consolidated statements of operations:
| Year Ended December 31, | ||||||||||||
| 2011 | 2012 | 2013 | ||||||||||
| (in thousands) | ||||||||||||
| Tax at statutory rate |
$ | 3,497 | $ | 3,056 | $ | 5,211 | ||||||
| State income taxes |
622 | 251 | 2,522 | |||||||||
| Nondeductible transaction costs |
— | — | 1,148 | |||||||||
| Tax benefit of partnership status |
(1,239 | ) | (2,211 | ) | (726 | ) | ||||||
| Tax impact of change in tax status of LLC |
(7,956 | ) | — | — | ||||||||
| Valuation allowance reversal |
— | — | (502 | ) | ||||||||
| Foreign rate differential |
(96 | ) | (188 | ) | (220 | ) | ||||||
| All other |
(48 | ) | (95 | ) | 709 | |||||||
|
|
|
|
|
|
|
|||||||
| Total provision (benefit) for income taxes |
$ | (5,220 | ) | $ | 813 | $ | 8,142 | |||||
|
|
|
|
|
|
|
|||||||
F-29
Table of Contents
GRUBHUB INC.
(F/K/A GRUBHUB SEAMLESS INC.)
Notes to Consolidated Financial Statements (Continued)
(in thousands, except share amounts)
The tax effects of temporary differences giving rise to deferred income tax assets and liabilities were as follows:
| As of December 31, | ||||||||
| 2012 | 2013 | |||||||
| (in thousands) | ||||||||
| Deferred tax assets: |
||||||||
| Loss and credit carryforwards |
$ | 1,157 | $ | 16,606 | ||||
| Accrued expenses |
26 | 620 | ||||||
| Intangible assets |
592 | — | ||||||
| Share-based compensation |
111 | 5,200 | ||||||
|
|
|
|
|
|||||
| Total deferred tax assets |
1,886 | 22,426 | ||||||
| Deferred tax (liabilities): |
||||||||
| Fixed assets |
$ | (241 | ) | $ | (1,145 | ) | ||
| Intangible assets |
— | (105,435 | ) | |||||
| Investment in partnership |
(8,150 | ) | (1,751 | ) | ||||
|
|
|
|
|
|||||
| Total deferred tax (liabilities) |
(8,391 | ) | (108,331 | ) | ||||
| (Less) valuation allowance |
(504 | ) | (902 | ) | ||||
|
|
|
|
|
|||||
| Net deferred tax asset (liability) |
$ | (7,009 | ) | $ | (86,807 | ) | ||
|
|
|
|
|
|||||
Classification of net deferred tax assets (liabilities) on the consolidated balance sheet was as follows:
| As of December 31, | ||||||||
| 2012 | 2013 | |||||||
| (in thousands) | ||||||||
| Current assets |
$ | 26 | $ | 3,688 | ||||
| Non-current assets |
— | — | ||||||
| Non-current (liabilities) |
(7,035 | ) | (90,495 | ) | ||||
|
|
|
|
|
|||||
| Total deferred tax asset (liabilities) |
$ | (7,009 | ) | $ | (86,807 | ) | ||
|
|
|
|
|
|||||
During 2013, the Company reversed the $0.5 million valuation allowance it previously established against the net deferred tax assets of its subsidiary, Slick City Media, Inc., as the Company now believes that it is more likely than not that these assets will be utilized, based on projected future income levels. The NOL carryover of this subsidiary, which was acquired in October of 2011, as well as the NOL and credit carryovers of GrubHub Holdings Inc., which was acquired on August 8, 2013, are subject to Section 382 and 383 of the Internal Revenue Code, which places limits on the utilization of acquired NOL and credit carryovers. Based on preliminary analysis performed by the Company, it does not believe that Sections 382 and 383 will significantly delay the utilization of these subsidiaries’ NOL and credit carryovers. A partial valuation reserve of $0.9 million is recorded at December 31, 2013 against certain state only credits as those credits have a short carryover period and the Company believes that this portion of the credit carryovers will more likely than not expire before they are utilized.
The Company has not provided U.S. income tax on the accumulated earnings of approximately $5.1 million of its UK subsidiary, Seamless Europe, Ltd., as it intends to permanently reinvest those undistributed earnings into future operations in that country. We estimate the potential additional U.S. tax liabilities that would result from the complete repatriation of those accumulated earnings to be approximately $0.8 million.
F-30
Table of Contents
GRUBHUB INC.
(F/K/A GRUBHUB SEAMLESS INC.)
Notes to Consolidated Financial Statements (Continued)
(in thousands, except share amounts)
The Company had the following tax loss and credit carryforwards as of December 31, 2012 and 2013:
| 2012 | 2013 | Years of Expiration: Beginning |
||||||||||
| (in thousands) | ||||||||||||
| U.S. federal loss carryforwards |
$ | 3,380 | $ | 34,297 | 2027 | |||||||
| U.S. state and local loss carryforwards |
3,380 | 36,201 | 2027 | |||||||||
| U.S. contribution carryforwards |
— | 85 | 2015 | |||||||||
| Illinois Edge Credits |
— | 1,075 | 2017 | |||||||||
| U.S. R&D Credits |
— | 53 | 2031 | |||||||||
| U.S. Alternative Minimum Tax Credit carryover |
8 | 240 | No expiration | |||||||||
In addition to the federal and state NOL carryforwards shown above, the Company has $3.7 million in additional loss carryovers attributable to excess tax benefits on stock option exercises that will be recorded to additional paid-in capital when those losses are deemed utilized applying the “with and without” method of accounting for excess tax benefits.
The Company is not currently under examination in any taxing jurisdiction, and its tax returns are subject to the normal statute of limitations, three years form the filing date for federal income tax purposes. The federal and state statute of limitations generally remain open for years in which tax losses are generated until three years from the year those losses are utilized. Under these rules, the 2006 and later NOLs of Slick City Media, Inc. are still subject to audit by the IRS and state and local jurisdictions. Also, the 1999 and later year NOLs of GrubHub Holdings Inc. and its acquired businesses are still subject to audit by the IRS and state and local jurisdictions. The September 30, 2010 and later UK returns of Seamless Europe Ltd. are subject to exam by the UK tax authorities.
The Company is subject to taxation in the U.S. federal and various state jurisdictions. Significant judgment is required in determining the provision for income taxes and recording the related income tax assets and liabilities. The Company’s practice for accounting for uncertainty in income taxes is to recognize the financial statement benefit of a tax position only after determining that the relevant tax authority would more likely than not sustain the position following an audit. For tax positions meeting the more-likely-than-not criteria, the amount recognized in the financial statements is the largest benefit that has a greater than 50% likelihood of being realized upon ultimate settlement with the relevant tax authority.
The following table summarizes the Company’s unrecognized tax benefit activity, excluding the related accrual for interest:
| December 31, | ||||||||
| 2013 | 2012 | |||||||
| (in thousands) | ||||||||
| Balance at beginning of year |
$ | — | $ | — | ||||
| Increase in positions relating to prior periods |
166 | — | ||||||
| Increases in positions taken in the current period |
931 | — | ||||||
|
|
|
|
|
|||||
| Balance at end of year |
$ | 1,097 | $ | — | ||||
|
|
|
|
|
|||||
The Company records interest and penalties, if any, as a component of its income tax expenses. The non-current income tax liabilities are recorded in other long-term liabilities in the consolidated balance sheet. At December 31, 2013, the Company did not anticipate any significant adjustments to its unrecognized tax benefits
F-31
Table of Contents
GRUBHUB INC.
(F/K/A GRUBHUB SEAMLESS INC.)
Notes to Consolidated Financial Statements (Continued)
(in thousands, except share amounts)
caused by the settlement of tax examinations or other factors, within the next twelve months. Included in the balance sheet at December 31, 2013 were deferred tax assets that relate to the potential settlement of these unrecognized tax benefits. After consideration of these amounts, $0.5 million and $0 of the amount accrued at December 31, 2013 and 2012, respectively, would impact the effective tax rate, if reversed.
10. Stockholders’ Equity
The Company is authorized to issue two classes of stock: common stock and Series A Preferred Stock. Each share of Series A Preferred Stock was convertible, at the option of the holder thereof, into common stock on a one-for-one basis, subject to adjustment as defined in the Company’s amended and restated certificate of incorporation. The Company entered into a stockholders agreement in 2013 with certain stockholders. The agreement prevented those stockholders from transferring their shares without the consent of a majority of the stockholders.
On April 4, 2014, the Company completed the IPO in which the Company issued and sold 4,000,000 shares of common stock at a public offering price of $26.00 per share. The Company received net proceeds of $94.9 million (unaudited) after deducting underwriting discounts and commissions of $6.5 million (unaudited) and other offering expenses of approximately $2.6 million (unaudited). Upon the closing of the IPO, the stockholder’s agreement ceased to be in effect.
Common Stock
Each holder of common stock will have one vote per share of common stock held on all matters that are submitted for stockholder vote. Upon liquidation, the common stock was junior to the rights and preferences of the Series A preferred stock as of December 31, 2013. At December 31, 2012 and 2013, and June 30, 2014 there were 31,349,777, 165,000,000 and 500,000,000 shares (unaudited) of common stock authorized, respectively. The Company increased the number of authorized shares at the time of the Merger. At December 31, 2012, there were 31,349,777 shares issued and 31,218,164 shares of common stock outstanding. At December 31, 2013, there were 53,757,437 shares of common stock issued and outstanding. At June 30, 2014 there were 78,831,161 shares (unaudited) of common stock issued and outstanding. The Company held 131,607 shares as treasury shares for the year ended December 31, 2012.
Series A Preferred Stock
Upon the closing of the IPO on April 4, 2014, all shares of the Company’s then-outstanding convertible Series A Preferred Stock automatically converted on a one-for-one basis into an aggregate of 19,284,113 shares of common stock. There were no issued or outstanding shares of preferred stock as of June 30, 2014.
In the event of a liquidation event, the holders of Series A preferred stock were entitled to receive pari passu to each other, and prior in preference to any distribution of any assets of the Company to the holders of common stock. The Series A preferred stock had a liquidation preference of an amount per share equal to the original Series A preferred stock issue price. The aggregate liquidation preference of the Series A Preferred Stock as of December 31, 2012 and 2013 was approximately $50.0 million and $86.2 million, respectively.
Redeemable Common Stock
The put rights that would have required the Company to repurchase the Company’s then outstanding redeemable common stock at fair value (as defined in the stockholders agreement) determined at the redemption
F-32
Table of Contents
GRUBHUB INC.
(F/K/A GRUBHUB SEAMLESS INC.)
Notes to Consolidated Financial Statements (Continued)
(in thousands, except share amounts)
date were terminated and the shares converted on a one-for-one basis into an aggregate of 1,344,236 shares common stock upon the closing of the IPO on April 4, 2014.
There were 1,344,236 shares of common stock with put rights that would have required the Company to repurchase these shares at fair value determined at the redemption date. As the redemption price is equivalent to the fair value of the instrument, the Company adjusted the carrying value of the redeemable common stock to its fair value with an adjustment to equity. The fair value of the redeemable common stock was $18.4 million at December 31, 2013. The Company had an annual redemption limit of $4.0 million.
11. Retirement Plan
Beginning February 1, 2012, the Company maintained a defined contribution plan for employees. The plan is qualified under section 401(k) of the Internal Revenue Code. From February 1, 2012 to September 30, 2012, the Company matched 67% of the first 6% of eligible contributions. From October 1, 2012 to December 31, 2013, and during the six months ended June 30, 2014, the Company matched 100% of the first 3% of employees’ contributions and 50% of the next 2% of employees’ contributions that were made. The Company may also make discretionary profit sharing contributions as determined by the Company’s Board of Directors. The Company’s matching contributions to the plan were $0.3 million and $0.7 million during the years ended December 31, 2012 and 2013, respectively, and $0.5 million (unaudited) during the six months ended June 30, 2014. The Company did not make matching contributions during the year ended December 31, 2011.
12. Net Income Per Share Attributable to Common Stockholders
Basic earnings per share is computed by dividing net income attributable to common stockholders by the weighted average number of common shares outstanding during the period without consideration for common stock equivalents. Diluted net income per share attributable to common stockholders is computed by dividing net income by the weighted average number of common shares outstanding during the period and potentially dilutive common stock equivalents, except in cases where the effect of the common stock equivalent would be antidilutive. Potential common stock equivalents consist of common stock issuable upon exercise of stock options using the treasury stock method and common stock issuable upon conversion of the Series A Preferred Stock. Upon the closing of the IPO, all shares of the Company’s then-outstanding convertible Series A Preferred Stock automatically converted into an aggregate of 19,284,113 shares of common stock.
The following tables present the calculation of basic and diluted net income per share attributable to common stockholders for the periods presented:
| For the Year Ended December 31, 2011 | ||||||||||||
| Income (Numerator) |
Shares (Denominator) |
Per Share Amount |
||||||||||
| (in thousands, except per share data) | ||||||||||||
| Net income |
$ | 15,211 | ||||||||||
| Preferred stock tax distributions |
(334 | ) | ||||||||||
|
|
|
|||||||||||
| Basic EPS |
||||||||||||
| Net income attributable to common stockholders |
14,877 | 31,320 | $ | 0.48 | ||||||||
|
|
|
|||||||||||
| Effect of Dilutive Securities |
||||||||||||
| Preferred Stock |
334 | 11,185 | ||||||||||
| Stock options |
— | — | ||||||||||
|
|
|
|
|
|||||||||
| Diluted EPS |
||||||||||||
| Net income attributable to common stockholders |
$ | 15,211 | 42,505 | $ | 0.36 | |||||||
|
|
|
|
|
|
|
|||||||
F-33
Table of Contents
GRUBHUB INC.
(F/K/A GRUBHUB SEAMLESS INC.)
Notes to Consolidated Financial Statements (Continued)
(in thousands, except share amounts)
| For the Year Ended December 31, 2012 | ||||||||||||
| Income (Numerator) |
Shares (Denominator) |
Per Share Amount |
||||||||||
| (in thousands, except per share data) | ||||||||||||
| Net income |
$ | 7,919 | ||||||||||
| Preferred stock tax distributions |
(402 | ) | ||||||||||
|
|
|
|||||||||||
| Basic EPS |
||||||||||||
| Net income attributable to common stockholders |
7,517 | 31,320 | $ | 0.24 | ||||||||
|
|
|
|||||||||||
| Effect of Dilutive Securities |
||||||||||||
| Preferred Stock |
402 | 11,185 | ||||||||||
| Stock options |
— | 161 | ||||||||||
|
|
|
|
|
|||||||||
| Diluted EPS |
||||||||||||
| Net income attributable to common stockholders |
$ | 7,919 | 42,666 | $ | 0.19 | |||||||
|
|
|
|
|
|
|
|||||||
| For the Year Ended December 31, 2013 | ||||||||||||
| Income (Numerator) |
Shares (Denominator) |
Per Share Amount |
||||||||||
| (in thousands, except per share data) | ||||||||||||
| Net income |
$ | 6,747 | ||||||||||
| Preferred stock tax distributions |
(1,073 | ) | ||||||||||
|
|
|
|||||||||||
| Basic EPS |
||||||||||||
| Net income attributable to common stockholders |
5,674 | 40,681 | $ | 0.14 | ||||||||
|
|
|
|||||||||||
| Effect of Dilutive Securities |
||||||||||||
| Preferred Stock |
1,073 | 14,390 | ||||||||||
| Stock options |
— | 1,574 | ||||||||||
|
|
|
|
|
|||||||||
| Diluted EPS |
||||||||||||
| Net income attributable to common stockholders |
$ | 6,747 | 56,645 | $ | 0.12 | |||||||
|
|
|
|
|
|
|
|||||||
| For the Six Months Ended June 30, 2013 | For the Six Months Ended June 30, 2014 | |||||||||||||||||||||||
| Income (Numerator) |
Shares (Denominator) |
Per Share Amount |
Income (Numerator) |
Shares (Denominator) |
Per Share Amount |
|||||||||||||||||||
| (in thousands, except per share data) | ||||||||||||||||||||||||
| (unaudited) | ||||||||||||||||||||||||
| Net income |
$ | 3,079 | $ | 7,045 | ||||||||||||||||||||
| Preferred stock tax distributions |
(648 | ) | (320 | ) | ||||||||||||||||||||
|
|
|
|
|
|
|
|
|
|||||||||||||||||
| Basic EPS |
||||||||||||||||||||||||
| Net income attributable to common stockholders |
2,431 | 31,368 | $ | 0.08 | 6,725 | 66,626 | $ | 0.10 | ||||||||||||||||
|
|
|
|||||||||||||||||||||||
| Effect of Dilutive Securities |
||||||||||||||||||||||||
| Preferred Stock |
648 | 11,186 | 320 | 9,960 | ||||||||||||||||||||
| Stock options |
— | 802 | — | 3,268 | ||||||||||||||||||||
|
|
|
|
|
|
|
|
|
|
|
|||||||||||||||
| Diluted EPS |
||||||||||||||||||||||||
| Net income attributable to common stockholders |
$ | 3,079 | 43,356 | $ | 0.07 | $ | 7,045 | 79,854 | $ | 0.09 | ||||||||||||||
|
|
|
|
|
|
|
|
|
|
|
|
|
|||||||||||||
F-34
Table of Contents
GRUBHUB INC.
(F/K/A GRUBHUB SEAMLESS INC.)
Notes to Consolidated Financial Statements (Continued)
(in thousands, except share amounts)
For the years ended December 31, 2011, 2012, and 2013, 3,857,500, 1,330,521, and 477,452 shares of common stock underlying stock options, respectively, were excluded from the calculation of diluted net income per share attributable to common stockholders because their effect would have been antidilutive. For the six months ended June 30, 2013 and 2014, 328,750 shares (unaudited) and 140,283 shares (unaudited) of common stock underlying stock options, respectively, were excluded because their effect would have been antidilutive.
Pro Forma Net Income per Share Attributable to Common Stockholders
Pro forma basic and diluted net income per share were computed to give effect to the conversion of the convertible preferred stock (using the if-converted method) into common stock as though the conversion had occurred on the dates of issuance and to give effect to the provision for income taxes during the period when the Company was a pass through entity for tax purposes.
The following table presents the calculation of pro forma basic and diluted net income per share attributable to common stockholders.
| Six Months Ended June 30, 2013 |
Year Ended December 31, 2013 |
|||||||
| (in thousands, except per share data) | ||||||||
| (unaudited) | ||||||||
| Net income attributable to common stockholders |
$ | 2,431 | $ | 5,674 | ||||
| Dividends on preferred stock |
648 | 1,073 | ||||||
|
|
|
|
|
|||||
| Pro forma net income |
$ | 3,079 | $ | 6,747 | ||||
| Weighted average shares used to compute basic net income per share attributable to common stockholders |
31,368 | 40,681 | ||||||
| Adjustment for assumed conversion of preferred stock to common stock |
11,186 | 14,390 | ||||||
|
|
|
|
|
|||||
| Weighted average shares used to compute diluted net income per share |
42,554 | 55,071 | ||||||
| Dilutive effect of stock options |
802 | 1,574 | ||||||
|
|
|
|
|
|||||
| Weighted average shares used to compute diluted pro forma net income per share |
43,356 | 56,645 | ||||||
|
|
|
|
|
|||||
| Pro forma net income per share attributable to common stockholders: |
||||||||
| Basic |
$ | 0.06 | $ | 0.12 | ||||
| Diluted |
$ | 0.07 | $ | 0.12 | ||||
F-35
Table of Contents
REPORT OF INDEPENDENT REGISTERED PUBLIC ACCOUNTING FIRM
The Board of Directors and Stockholders of GrubHub Holdings Inc.
We have audited the accompanying balance sheets of GrubHub Holdings Inc. (formerly known as GrubHub, Inc.) as of December 31, 2011 and 2012 and the related statements of operations, stockholders’ equity, and cash flows for the years then ended. These financial statements are the responsibility of the Company’s management. Our responsibility is to express an opinion on these financial statements based on our audits.
We conducted our audits in accordance with the standards of the Public Company Accounting Oversight Board (United States). Those standards require that we plan and perform the audit to obtain reasonable assurance about whether the financial statements are free of material misstatement. The Company is not required to have, nor were we engaged to perform, an audit of its internal control over financial reporting. Our audits included consideration of internal control over financial reporting as a basis for designing audit procedures that are appropriate in the circumstances, but not for the purpose of expressing an opinion on the effectiveness of the Company’s internal control over financial reporting. Accordingly, we express no such opinion. An audit also includes examining, on a test basis, evidence supporting the amounts and disclosures in the financial statements. An audit also includes assessing the accounting principles used and significant estimates made by management, as well as evaluating the overall financial statement presentation. We believe that our audits provide a reasonable basis for our opinion.
In our opinion, the financial statements referred to above present fairly, in all material respects, the financial position of GrubHub Holdings Inc. (formerly known as GrubHub, Inc.) at December 31, 2011 and 2012 and the results of its operations and its cash flows for the years then ended, in conformity with U.S. generally accepted accounting principles.
/s/ Crowe Horwath LLP
Oak Brook, Illinois
February 18, 2013
F-36
Table of Contents
(F/K/A GRUBHUB, INC.)
Balance Sheets
(in thousands, except share data)
| December 31, | June 30, 2013 |
|||||||||||
| 2011 | 2012 | |||||||||||
| (unaudited) | ||||||||||||
| ASSETS |
||||||||||||
| CURRENT ASSETS: |
||||||||||||
| Cash and cash equivalents |
$ | 22,184 | $ | 18,708 | $ | 17,253 | ||||||
| Credit card receivables, net |
1,496 | 1,860 | 4,120 | |||||||||
| Accounts receivable-other |
365 | 303 | 112 | |||||||||
| Prepaid expenses |
577 | 1,146 | 504 | |||||||||
|
|
|
|
|
|
|
|||||||
| Total current assets |
24,622 | 22,017 | 21,989 | |||||||||
| PROPERTY AND EQUIPMENT: |
||||||||||||
| Net property and equipment |
1,163 | 3,975 | 4,417 | |||||||||
| OTHER ASSETS: |
||||||||||||
| Other assets |
149 | 570 | 547 | |||||||||
| Goodwill |
38,708 | 38,708 | 38,708 | |||||||||
| Intangible assets, net of amortization |
9,625 | 8,509 | 8,202 | |||||||||
|
|
|
|
|
|
|
|||||||
| Total other assets |
48,482 | 47,787 | 47,457 | |||||||||
|
|
|
|
|
|
|
|||||||
| TOTAL ASSETS |
$ | 74,267 | $ | 73,779 | $ | 73,863 | ||||||
|
|
|
|
|
|
|
|||||||
| LIABILITIES AND STOCKHOLDERS’ EQUITY |
||||||||||||
| CURRENT LIABILITIES: |
||||||||||||
| Accounts payable |
$ | 839 | $ | 1,111 | $ | 694 | ||||||
| Restaurant food liability |
3,837 | 8,140 | 9,631 | |||||||||
| Accrued payroll |
927 | 866 | 1,322 | |||||||||
| Deferred rent, current portion |
46 | 27 | 127 | |||||||||
| Tenant allowance, current portion |
— | 368 | 368 | |||||||||
| Other accruals |
644 | 2,042 | 4,499 | |||||||||
|
|
|
|
|
|
|
|||||||
| Total current liabilities |
6,293 | 12,554 | 16,641 | |||||||||
| LONG TERM LIABILITIES: |
||||||||||||
| Tenant allowance, net of current portion |
— | 1,351 | 1,166 | |||||||||
| Deferred rent, net of current portion |
— | 607 | 595 | |||||||||
|
|
|
|
|
|
|
|||||||
| Total long term liabilities |
— | 1,958 | 1,761 | |||||||||
|
|
|
|
|
|
|
|||||||
| STOCKHOLDERS’ EQUITY: |
||||||||||||
| Convertible preferred stock, $0.0001 par value, issuable in Series A, B, C, D, E and 1. 48,291,764 shares authorized, 48,151,812 shares issued and outstanding as of December 31, 2011; and 48,291,764 shares authorized and 48,257,785 shares issued and outstanding as of December 31, 2012. 48,291,764 shares authorized and 48,178,252 shares issued and outstanding as of June 30, 2013 |
5 | 5 | 5 | |||||||||
| Series B preferred stock warrants, 139,952 warrants outstanding as of December 31, 2011 and 2,799 warrants outstanding as of December 31, 2012 |
100 | 1 | — | |||||||||
| Common stock, $0.0001 par value, 70,000,000 shares authorized, 14,015,704 shares issued, and 12,829,048 shares outstanding as of December 31, 2011; and 70,000,000 shares authorized, 13,603,314 shares issued, and outstanding as of December 31, 2012. 70,000,000 shares authorized, 14,055,062 shares issued and outstanding as of June 30, 2013 |
1 | 1 | 1 | |||||||||
| Treasury shares |
(534 | ) | — | — | ||||||||
| Stockholder note receivable |
(567 | ) | — | — | ||||||||
| Additional paid-in capital |
86,550 | 87,048 | 87,988 | |||||||||
| Accumulated deficit |
(17,581 | ) | (27,788 | ) | (32,533 | ) | ||||||
|
|
|
|
|
|
|
|||||||
| TOTAL STOCKHOLDERS’ EQUITY |
67,974 | 59,267 | 55,461 | |||||||||
|
|
|
|
|
|
|
|||||||
| TOTAL LIABILITIES AND STOCKHOLDERS’ EQUITY |
$ | 74,267 | $ | 73,779 | $ | 73,863 | ||||||
|
|
|
|
|
|
|
|||||||
See accompanying notes to financial statements.
F-37
Table of Contents
(F/K/A GRUBHUB, INC.)
Statements of Operations
(in thousands, except per share data)
| Year Ended December 31, |
Six Months Ended June 30, |
|||||||||||||||
| 2011 | 2012 | 2012 | 2013 | |||||||||||||
| (unaudited) | ||||||||||||||||
| Revenues |
$ | 17,294 | $ | 36,555 | $ | 16,400 | $ | 27,369 | ||||||||
| Costs and expenses: |
||||||||||||||||
| Sales and marketing |
9,980 | 15,305 | 7,510 | 9,350 | ||||||||||||
| Operations and support |
6,334 | 14,988 | 7,133 | 9,535 | ||||||||||||
| Technology (exclusive of amortization) |
2,871 | 5,524 | 2,597 | 3,164 | ||||||||||||
| Depreciation and amortization |
673 | 2,155 | 1,011 | 1,302 | ||||||||||||
| General and administrative |
10,631 | 8,790 | 4,794 | 8,763 | ||||||||||||
|
|
|
|
|
|
|
|
|
|||||||||
| Total costs and expenses |
30,489 | 46,762 | 23,045 | 32,114 | ||||||||||||
|
|
|
|
|
|
|
|
|
|||||||||
| Loss before provision for income taxes |
(13,195 | ) | (10,207 | ) | (6,645 | ) | (4,745 | ) | ||||||||
| Provision for income taxes |
— | — | — | — | ||||||||||||
|
|
|
|
|
|
|
|
|
|||||||||
| Net loss |
$ | (13,195 | ) | $ | (10,207 | ) | $ | (6,645 | ) | $ | (4,745 | ) | ||||
|
|
|
|
|
|
|
|
|
|||||||||
See accompanying notes to financial statements.
F-38
Table of Contents
(F/K/A GRUBHUB, INC.)
Statement of Changes in Stockholders’ Equity
For the Years Ended December 31, 2011 and 2012 and
the Six Months Ended June 30, 2013 (Unaudited)
(in thousands, except share data)
| Common Stock | Preferred Stock | Additional Paid-In Capital |
Treasury Stock | Note Receivable |
Preferred Stock Warrants |
Accumulated Deficit |
Total | |||||||||||||||||||||||||||||||||||||||||
| Shares | Amount | Shares | Amount | Shares | Amount | Shares | Amount | |||||||||||||||||||||||||||||||||||||||||
| Balance at January 1, 2011 |
12,331,471 | $ | 1 | 30,507,783 | $ | 3 | $ | 14,867 | — | $ | — | $ | (567 | ) | 223,924 | $ | 158 | $ | (4,386 | ) | $ | 10,076 | ||||||||||||||||||||||||||
| Issuance of Series D Preferred Stock |
— | — | 5,914,709 | 1 | 19,919 | — | — | — | — | — | — | 19,920 | ||||||||||||||||||||||||||||||||||||
| Issuance of Series E Preferred Stock |
— | — | 11,101,442 | 1 | 50,096 | — | — | — | — | — | — | 50,097 | ||||||||||||||||||||||||||||||||||||
| Issuance of Series 1 Preferred Stock |
— | — | 543,906 | — | 1,246 | — | — | — | — | — | — | 1,246 | ||||||||||||||||||||||||||||||||||||
| Share Redemption |
— | — | — | — | — | (1,186,656 | ) | (534 | ) | — | — | — | — | (534 | ) | |||||||||||||||||||||||||||||||||
| Warrants Exercised |
— | — | 83,972 | — | 75 | — | — | — | (83,972 | ) | (58 | ) | — | 17 | ||||||||||||||||||||||||||||||||||
| Stock Options Exercised |
1,684,233 | — | — | — | 97 | — | — | — | — | — | — | 97 | ||||||||||||||||||||||||||||||||||||
| Stock Options Expense |
— | — | — | — | 250 | — | — | — | — | — | — | 250 | ||||||||||||||||||||||||||||||||||||
| Net Loss |
— | — | — | — | — | — | — | — | — | — | (13,195 | ) | (13,195 | ) | ||||||||||||||||||||||||||||||||||
|
|
|
|
|
|
|
|
|
|
|
|
|
|
|
|
|
|
|
|
|
|
|
|
|
|||||||||||||||||||||||||
| Balance at December 31, 2011 |
14,015,704 | 1 | 48,151,812 | 5 | 86,550 | (1,186,656 | ) | (534 | ) | (567 | ) | 139,952 | 100 | (17,581 | ) | 67,974 | ||||||||||||||||||||||||||||||||
| Warrants Exercised |
— | — | 137,153 | — | 127 | — | — | — | (137,153 | ) | (99 | ) | — | 28 | ||||||||||||||||||||||||||||||||||
| Vesting of Series 1 Preferred Stock |
— | — | — | — | 526 | — | — | — | — | — | — | 526 | ||||||||||||||||||||||||||||||||||||
| Series 1 Preferred Stock Cancellation |
— | — | (31,207 | ) | — | — | — | — | — | — | — | — | — | |||||||||||||||||||||||||||||||||||
| Treasury Share Retirement |
(1,186,656 | ) | — | — | — | (534 | ) | 1,186,656 | 534 | — | — | — | — | — | ||||||||||||||||||||||||||||||||||
| Share Redemption |
(145,380 | ) | — | — | — | (617 | ) | — | — | — | — | — | — | (617 | ) | |||||||||||||||||||||||||||||||||
| Repayment of Shareholder Note Receivable |
— | — | — | — | — | — | — | 567 | — | — | — | 567 | ||||||||||||||||||||||||||||||||||||
| Stock Options Exercised |
919,646 | — | — | — | 269 | — | — | — | — | — | — | 269 | ||||||||||||||||||||||||||||||||||||
| Stock Options Expense |
— | — | — | — | 727 | — | — | — | — | — | — | 727 | ||||||||||||||||||||||||||||||||||||
| Net Loss |
— | — | — | — | — | — | — | — | — | — | (10,207 | ) | (10,207 | ) | ||||||||||||||||||||||||||||||||||
|
|
|
|
|
|
|
|
|
|
|
|
|
|
|
|
|
|
|
|
|
|
|
|
|
|||||||||||||||||||||||||
| Balance at December 31, 2012 |
13,603,314 | 1 | 48,257,758 | 5 | 87,048 | — | — | — | 2,799 | 1 | (27,788 | ) | 59,267 | |||||||||||||||||||||||||||||||||||
| Series 1 Preferred Stock Cancellation |
— | — | (76,707 | ) | — | — | — | — | — | — | — | — | — | |||||||||||||||||||||||||||||||||||
| Warrants Exercised |
— | — | (2,799 | ) | — | 1 | — | — | — | (2,799 | ) | (1 | ) | — | — | |||||||||||||||||||||||||||||||||
| Stock Options Exercised |
452,288 | — | — | — | 167 | — | — | — | — | — | — | 167 | ||||||||||||||||||||||||||||||||||||
| Stock Options Expense |
— | — | — | — | 772 | — | — | — | — | — | — | 772 | ||||||||||||||||||||||||||||||||||||
| Net Loss |
— | — | — | — | — | — | — | — | (4,745 | ) | (4,745 | ) | ||||||||||||||||||||||||||||||||||||
|
|
|
|
|
|
|
|
|
|
|
|
|
|
|
|
|
|
|
|
|
|
|
|
|
|||||||||||||||||||||||||
| Balance at June 30, 2013 (Unaudited) |
14,055,602 | $ | 1 | 48,178,252 | $ | 5 | $ | 87,988 | — | $ | — | $ | — | — | $ | — | $ | (32,533 | ) | $ | 55,461 | |||||||||||||||||||||||||||
|
|
|
|
|
|
|
|
|
|
|
|
|
|
|
|
|
|
|
|
|
|
|
|
|
|||||||||||||||||||||||||
See accompanying notes to financial statements.
F-39
Table of Contents
(F/K/A GRUBHUB, INC.)
Statements of Cash Flows
(in thousands)
| Year Ended December 31, |
Six Months Ended June 30, |
|||||||||||||||
| 2011 | 2012 | 2012 | 2013 | |||||||||||||
| (unaudited) | ||||||||||||||||
| CASH FLOWS FROM OPERATING ACTIVITIES |
||||||||||||||||
| Net loss |
$ | (13,195 | ) | $ | (10,207 | ) | $ | (6,645 | ) | $ | (4,745 | ) | ||||
| Adjustments to reconcile net loss to net cash from operating activities: |
||||||||||||||||
| Depreciation |
203 | 718 | 241 | 674 | ||||||||||||
| Provision for doubtful accounts |
53 | 187 | — | 20 | ||||||||||||
| Loss on disposal of property and equipment |
— | 162 | — | — | ||||||||||||
| Intangible asset amortization |
470 | 1,437 | 770 | 628 | ||||||||||||
| Proceeds received under tenant allowance |
— | 1,842 | — | — | ||||||||||||
| Tenant allowance amortization |
— | (123 | ) | — | (184 | ) | ||||||||||
| Stock based compensation |
389 | 1,253 | 714 | 772 | ||||||||||||
| Deferred compensation |
113 | 340 | 340 | — | ||||||||||||
| Deferred rent |
12 | 588 | (19 | ) | 88 | |||||||||||
| Change in assets and liabilities, net of the effects of business acquisitions: |
||||||||||||||||
| Accounts receivable |
(692 | ) | (536 | ) | (60 | ) | (2,089 | ) | ||||||||
| Prepaid expenses and other assets |
(170 | ) | (712 | ) | (759 | ) | 666 | |||||||||
| Accounts payable |
221 | 272 | (337 | ) | (417 | ) | ||||||||||
| Restaurant food liability |
1,948 | 4,303 | 1,514 | 1,491 | ||||||||||||
| Accrued payroll |
52 | (61 | ) | 222 | 453 | |||||||||||
| Other accruals |
(407 | ) | 769 | 273 | 2,458 | |||||||||||
|
|
|
|
|
|
|
|
|
|||||||||
| Net cash from operating activities |
$ | (11,003 | ) | $ | 232 | $ | (3,746 | ) | $ | (185 | ) | |||||
|
|
|
|
|
|
|
|
|
|||||||||
| CASH FLOWS FROM INVESTING ACTIVITIES |
||||||||||||||||
| Acquisition of FanGo, net of cash acquired |
(1,351 | ) | — | — | — | |||||||||||
| Capitalized website and development costs |
(284 | ) | (834 | ) | (151 | ) | (376 | ) | ||||||||
| Acquisition of Dotmenu, net of cash acquired |
(44,240 | ) | — | — | — | |||||||||||
| Purchases of property and equipment |
(893 | ) | (3,171 | ) | (404 | ) | (1,062 | ) | ||||||||
|
|
|
|
|
|
|
|
|
|||||||||
| Net cash from investing activities |
$ | (46,768 | ) | $ | (4,005 | ) | $ | (555 | ) | $ | (1,438 | ) | ||||
|
|
|
|
|
|
|
|
|
|||||||||
| CASH FLOWS FROM FINANCING ACTIVES |
||||||||||||||||
| Proceeds from exercise of stock options |
96 | 269 | 79 | 167 | ||||||||||||
| Share redemption |
(534 | ) | — | — | — | |||||||||||
| Proceeds from issuance of Series D Preferred Stock |
19,919 | — | — | — | ||||||||||||
| Proceeds from issuance of Series E Preferred Stock |
49,192 | — | — | — | ||||||||||||
| Proceeds from exercise of warrants |
17 | 28 | 5 | 1 | ||||||||||||
|
|
|
|
|
|
|
|
|
|||||||||
| Net cash from financing activities |
$ | 68,690 | $ | 297 | $ | 84 | $ | 168 | ||||||||
|
|
|
|
|
|
|
|
|
|||||||||
| NET CHANGE IN CASH AND CASH EQUIVALENTS |
10,919 | (3,476 | ) | (4,217 | ) | (1,455 | ) | |||||||||
| CASH AND CASH EQUIVALENTS AT BEGINNING OF YEAR |
11,265 | 22,184 | 22,184 | 18,708 | ||||||||||||
|
|
|
|
|
|
|
|
|
|||||||||
| CASH AND CASH EQUIVALENTS AT END OF YEAR |
$ | 22,184 | $ | 18,708 | $ | 17,967 | $ | 17,253 | ||||||||
|
|
|
|
|
|
|
|
|
|||||||||
| SUPPLEMENTAL DISCLOSURES OF NON CASH RELATED ITEMS |
||||||||||||||||
| Series 1 Preferred Stock issued in acquisition of FanGo |
$ | 1,106 | $ | — | $ | — | $ | — | ||||||||
|
|
|
|
|
|
|
|
|
|||||||||
| Property acquired under tenant allowance |
— | 1,841 | — | — | ||||||||||||
|
|
|
|
|
|
|
|
|
|||||||||
| Series E Preferred Stock issued in acquisition of Dotmenu |
904 | — | — | — | ||||||||||||
|
|
|
|
|
|
|
|
|
|||||||||
| Cancellation of notes receivable and accrued interest in exchange for common stock |
— | 617 | — | — | ||||||||||||
|
|
|
|
|
|
|
|
|
|||||||||
| IN CONNECTION WITH THE ACQUISITIONS, ASSETS ACQUIRED AND LIABILITIES ASSUMED WERE AS FOLLOWS: |
||||||||||||||||
| Fair value of assets acquired, net of cash acquired |
$ | 49,725 | $ | — | $ | — | $ | — | ||||||||
|
|
|
|
|
|
|
|
|
|||||||||
| Liabilities assumed |
(2,124 | ) | — | — | — | |||||||||||
|
|
|
|
|
|
|
|
|
|||||||||
| Stock issued for acquisitions |
(2,010 | ) | — | — | — | |||||||||||
|
|
|
|
|
|
|
|
|
|||||||||
| Cash paid for acquisitions, net of cash acquired |
$ | 45,591 | $ | — | $ | — | $ | — | ||||||||
|
|
|
|
|
|
|
|
|
|||||||||
See accompanying notes to financial statements.
F-40
Table of Contents
(F/K/A GRUBHUB, INC.)
Notes to Financial Statements
1. Organization
GrubHub Holdings Inc. (“GrubHub” or the “Company”), was founded in 2004 and incorporated under the laws of the State of Delaware in 2007. The Company is an online and mobile platform for restaurant pick-up and delivery orders. Diners enter their location through an online interface and the Company displays the menus and other relevant information for restaurants in its network. Orders may be placed directly online or over the phone at no cost to the diner. The Company charges the restaurant a fee for each order. In February 2014, the Company changed its name to GrubHub Holdings Inc. from GrubHub, Inc. Reference to the “Company” throughout the financial statements relates to GrubHub Holdings Inc.
2. Summary of Significant Accounting Policies
Basis of Presentation
The Company’s financial statements were prepared in conformity with accounting principles generally accepted in the United States of America (“GAAP”). The statements of operations include the results of entities acquired from the date of the acquisition for accounting purposes.
Use of Estimates
The preparation of financial statements in conformity with accounting principles generally accepted in the United States of America require management to make certain estimates, judgments and assumptions that affect the reported amounts of assets and liabilities and the related disclosures at the date of the financial statements, as well as the reported amounts of revenue and expenses during the periods presented. Estimates include revenue recognition, the allowance for doubtful accounts, website development costs, goodwill, depreciable lives of property and equipment, recoverability of intangible assets with definite lives and other long-lived assets and stock-based compensation. To the extent there are material differences between these estimates, judgments or assumptions and actual results, the Company’s financial statements will be affected. In many cases, the accounting treatment of a particular transaction is specifically dictated by GAAP and does not require management’s judgment in its application.
Cash and Cash Equivalents
Cash includes currency on hand as well as demand deposits with banks or financial institutions. Cash equivalents include short-term, highly liquid investments that are both readily convertible to known amounts of cash, and that are so near their maturity that they present minimal risk of changes in value because of changes in interest rates. The Company’s cash equivalents include only investments with original maturities of three months or less. The Company regularly maintains cash in excess of federally insured limits at financial institutions.
Property and Equipment, Net
Property and equipment is recorded at cost and depreciated using the straight-line method over the estimated useful lives of the related assets. The useful lives are as follows:
| Office equipment, computers and furniture and fixtures |
5 years | |
| Developed software |
2 years | |
| Purchased software |
4 years | |
| Restaurant facing technology |
2 years | |
| Leasehold improvements |
Shorter of expected useful life or lease term |
F-41
Table of Contents
GRUBHUB HOLDINGS INC.
(F/K/A GRUBHUB, INC.)
Notes to Financial Statements (Continued)
Maintenance and repair costs are charged to expense as incurred. Major improvements, which extend the useful life of the related asset, are capitalized. Upon disposal of a fixed asset, the Company records a gain or loss based on the differences between the proceeds received and the net book value of the disposed asset.
Credit Card Receivables, Net
Credit card receivables primarily represent the net cash due from the Company’s payment processor for cleared transactions. The carrying amount of the Company’s receivables is reduced by an allowance for doubtful accounts that reflects management’s best estimate of amounts that will not be collected. The allowance is recorded through a charge to bad debt expense which is recorded within general and administrative expenses in the statements of operations. The allowance is based on historical loss experience and any specific risks identified in collection matters.
Management provides for probable uncollectible amounts through a charge against bad debt expense and a credit to an allowance based on its assessment of the current status of individual accounts. Balances still outstanding after management has used reasonable collection efforts are written off against the allowance and a credit to credit card receivables. The Company does not charge interest on trade receivables.
The following table presents the changes in the allowance for doubtful accounts for the periods presented (in thousands):
| Year Ended December 31, |
Six Months Ended June 30, 2013 |
|||||||||||
| 2011 | 2012 | |||||||||||
| (unaudited) | ||||||||||||
| Allowance for doubtful accounts: |
||||||||||||
| Balance, beginning of year |
$ | 22 | $ | 75 | $ | 238 | ||||||
| Additions charged to expense |
53 | 187 | 20 | |||||||||
| Less: write-offs, net of recoveries and other adjustments |
— | (24 | ) | — | ||||||||
|
|
|
|
|
|
|
|||||||
| Balance, end of year |
$ | 75 | $ | 238 | $ | 258 | ||||||
|
|
|
|
|
|
|
|||||||
Advertising Costs
Advertising costs are generally expensed as incurred in connection with the requisite service period. Certain advertising production costs are capitalized and expensed over the requisite service period of the advertisements. For the years ended December 31, 2011 and 2012, expenses attributable to advertising totaled approximately $3.8 million, and $6.4 million, respectively. For the six months ended June 30, 2012 (unaudited) and 2013 (unaudited), expenses attributable to advertising totaled approximately $3.3 million and $4.9 million, respectively. Advertising costs are recorded in sales and marketing expense on the Company’s statements of operations.
Stock-Based Compensation
The Company measures compensation expense for all stock-based awards at fair value on the date of grant and recognizes compensation expense over the service period on a straight-line basis for awards expected to vest.
The Company uses the Black-Scholes option-pricing model to determine the fair value for stock options. In valuing the Company’s options, the Company makes assumptions about risk-free interest rates, dividend yields,
F-42
Table of Contents
GRUBHUB HOLDINGS INC.
(F/K/A GRUBHUB, INC.)
Notes to Financial Statements (Continued)
volatility and weighted-average expected lives, including estimated forfeiture rates. Risk-free interest rates are derived from U.S. Treasury securities as of the option grant date. Expected dividend yield is based on the Company’s historical dividend payments, which have been zero to date. As the Company does not have public trading history for its common shares, the expected volatility for the Company’s common stock is estimated using the published historical volatilities of industry peers representing the verticals in which the Company operates. The Company estimates the weighted-average expected life of the options as the average of the vesting option schedule and the term of the award, since the Company does not have sufficient historical exercise data to provide a reasonable basis upon which to estimate expected term due to the limited period of time stock-based awards have been exercisable. The term of the award is estimated using the simplified method. Forfeiture rates are estimated using historical actual forfeiture trends as well as the Company’s judgment of future forfeitures. These rates are evaluated quarterly and any change in compensation expense is recognized in the period of the change. The estimation of stock awards that will ultimately vest requires judgment, and to the extent actual results or updated estimates differ from the Company’s current estimates, such amounts will be recorded as a cumulative adjustment in the period the estimates are revised. The Company considers many factors when estimating expected forfeitures, including the types of awards and employee class. Actual results, and future changes in estimates, may differ substantially from management’s current estimates.
Income Taxes
The provision for income taxes is determined using the asset and liability method. Under this method, deferred tax assets and liabilities are calculated based upon the temporary differences between the financial statement and income tax bases of assets and liabilities using the enacted tax rates that are applicable in a given year. A valuation allowance is provided when it is more likely than not that some portion or all of a deferred tax asset will not be realized. As of December 31, 2011 and 2012 and June 30, 2013 (unaudited), the Company has recorded a full valuation allowance against its net deferred tax assets based on current and historical performance as it is more likely than not that these deferred tax assets will not be realized. No provision for income taxes has been recorded as there are no taxes payable due to the Company’s current net operating loss. A change in the estimate of future taxable income (loss) may require an increase or decrease to the valuation allowance.
The Company utilizes a two-step approach to recognizing and measuring uncertain tax positions (“tax contingencies”). The first step is to evaluate the tax position for recognition by determining if the weight of available evidence indicates it is more likely than not that the position will be sustained on audit, including resolution of related appeals or litigation processes. The second step is to measure the tax benefit as the largest amount which is more than 50% likely to be realized upon ultimate settlement. The Company considers many factors when evaluating and estimating its tax positions and tax benefits, which may require periodic adjustments and which may not accurately forecast actual outcomes. The Company includes interest and penalties related to tax contingencies in the provision for income taxes on the statements of operations. See Note 10, “Income Taxes.” Management of the Company does not expect the total amount of unrecognized tax benefits to significantly change in the next twelve months.
Intangible Assets
The Company accounts for intangible assets in accordance with Accounting Standards Codification (“ASC”) Topic 350 Intangibles—Goodwill and Other (“Topic 350”). Intangible assets with finite useful lives are amortized using the straight-line method over their useful lives and are reviewed for impairment in accordance with Topic 350.
The Company evaluates intangible assets and other long-lived assets for impairment whenever events or circumstances indicate that they may not be recoverable or at least annually. Recoverability is measured by
F-43
Table of Contents
GRUBHUB HOLDINGS INC.
(F/K/A GRUBHUB, INC.)
Notes to Financial Statements (Continued)
comparing the carrying amount of an asset group to future undiscounted net cash flows expected to be generated. If this comparison indicates impairment, the amount of impairment to be recognized is calculated as the difference between the carrying value and the fair value of the asset group. There were no impairment indicators present during the years ended December 31, 2011 and 2012 and the six months ended June 30, 2013.
Website and Software Development Costs
The costs incurred in the preliminary stages of development are expensed as incurred. Once an application has reached the development stage, internal and external costs, if direct and incremental and deemed by management to be significant, are capitalized and amortized on a straight-line basis over their estimated useful lives. Maintenance and enhancement costs, including those costs in the post-implementation stages, are typically expensed as incurred, unless such costs relate to substantial upgrades and enhancements to the website or software that result in added functionality, in which case the costs are capitalized and amortized on a straight-line basis over the estimated useful lives. Amortization expense related to capitalized website and software development costs is included in depreciation and amortization.
Goodwill
Goodwill represents the excess of the cost of an acquired business over the fair value of the assets acquired at the date of acquisition. Absent any special circumstances that could require an interim test, the Company has elected to test for goodwill impairment at September 30th of each year.
The Company tests for impairment using a two-step process. The first step of the goodwill impairment test identifies if there is potential goodwill impairment. If step one indicates that an impairment may exist, a second step is performed to measure the amount of the goodwill impairment, if any, by comparing the implied fair value of goodwill with the carrying amount. If the implied goodwill is less than the carrying amount, a write-down is recorded. We have determined that there was no goodwill impairment as of December 31, 2011 and 2012 and June 30, 2013 (unaudited).
Fair Value
Accounting standards define fair value as the price that would be received to sell an asset or paid to transfer a liability (an exit price) in the principal or most advantageous market in an orderly transaction between market participants on the measurement date. The standards also establish a fair value hierarchy, which requires an entity to maximize the use of observable inputs and minimize the use of unobservable inputs when measuring fair value. There are three levels of inputs that may be used to measure fair value:
The Company applied the following methods and assumptions in estimating its fair value measurements:
| Level 1 | Quoted prices in active markets for identical assets or liabilities. | |
| Level 2 | Assets and liabilities valued based on observable market data for similar instruments, such as quoted prices for similar assets or liabilities. | |
| Level 3 | Unobservable inputs that are supported by little or no market activity; instruments valued based on the best available data, some of which is internally developed, and considers risk premiums that a market participant would require. | |
F-44
Table of Contents
GRUBHUB HOLDINGS INC.
(F/K/A GRUBHUB, INC.)
Notes to Financial Statements (Continued)
Cash Equivalents
Cash equivalents are comprised of highly liquid investments, including money market funds and certificates of deposit with original maturities of less than three months. The fair value measurement of these assets is based on quoted market prices in active markets and, therefore, these assets are recorded at fair value on a recurring basis and classified as Level 1 in the fair value hierarchy.
The following tables present the balances of assets measured at fair value on a recurring basis as of the dates presented, all of which are classified as Level 1 in the fair value hierarchy at December 31, 2011 and 2012 and June 30, 2013 (unaudited) (in thousands):
| As of December 31, |
As of Six Months Ended June 30, 2013 |
|||||||||||
| 2011 | 2012 | |||||||||||
| (unaudited) | ||||||||||||
| Cash equivalents: |
||||||||||||
| Money market funds |
$ | 2,322 | $ | 2,232 | $ | 1,728 | ||||||
The Company did not have any assets measured on a recurring basis using Level 2 or Level 3 inputs at December 31, 2011 and 2012 and June 30, 2013 (unaudited). There were no liabilities measured at fair value on a recurring basis as of December 31, 2011 and 2012 and June 30, 2013 (unaudited).
Revenue Recognition
In general, the Company recognizes revenue when (i) persuasive evidence of an arrangement exists, (ii) delivery has occurred or services have been rendered to the customer, (iii) the fee is fixed or determinable, and (iv) collectability is reasonably assured. The Company considers a signed agreement, a binding contract with the restaurant or other similar documentation reflecting the terms and conditions under which products or services will be provided to be persuasive evidence of an arrangement.
The Company generates revenues primarily when diners place an order on the GrubHub platform. Restaurants pay a commission, typically a percentage of the transaction, for orders that are processed through the GrubHub platform. Restaurants can choose their level of commission rate, at or above the Company’s base rates, to affect their relative priority in its sorting algorithms, with restaurants paying higher commission rates generally appearing higher in the search order than restaurants paying lower commission rates. Commissions are generally based on a fixed percentage of the value of the order.
Revenues from online and phone delivery orders are recognized when these orders are placed at the restaurants. The amount of revenue recorded by the Company is based on the contractual arrangement with the related restaurant, and is adjusted for any cash credits, including incentive offers provided to restaurants and diners, related to the transaction. Although the Company will process the entire amount of the transaction with the diner, it will record its revenue on a net basis because the Company is acting as an agent of the merchant in the transaction. The Company will record an amount representing the restaurant food liability for the net balance due the restaurant.
The Company periodically provides incentive offers to diners to use its platform. These promotions include dollar off discounts to be applied against future purchases. The Company generally records the discounts as a reduction in revenue at the date it records the corresponding revenue in accordance with Topic 605-50-revenue recognition customer payments and incentives.
F-45
Table of Contents
GRUBHUB HOLDINGS INC.
(F/K/A GRUBHUB, INC.)
Notes to Financial Statements (Continued)
Deferred Rent
For the Company’s operating leases, the Company recognizes rent expenses on a straight-line basis over the terms of the leases and, accordingly, the Company records the difference between cash rent payments and the recognition of rent expenses as a deferred rent liability. The Company has landlord-funded leasehold improvements that are recorded as tenant allowances which are being amortized as a reduction of rent expense over the noncancelable terms of the operating leases.
Segments
The chief executive officer acts as the chief operating decision maker and reviews financial and operational information on an entity-wide basis. The Company has one business activity and there are no segment managers who are held accountable for operations, results of operations or plans for levels or components. Accordingly, the Company has determined that it has a single reporting segment and operating unit structure consisting of the operations of GrubHub Holdings Inc.
Recently Issued Accounting Pronouncements
In January 2010, the Financial Accounting Standards Board (“FASB”) issued ASU No. 2010-06, Improving Disclosures about Fair Value Measurements (Topic 820)—Fair Value Measurements and Disclosures, which requires additional disclosures about the different classes of assets and liabilities measured at fair value, the valuation techniques and inputs used, and the activity in Level III fair value measurements. This guidance was effective for interim and annual reporting periods beginning after December 15, 2009, except for certain Level III activity disclosure requirements that became effective for reporting periods beginning after December 15, 2010. Accordingly, the Company adopted this new guidance beginning January 1, 2010, except for the additional Level III requirements, which were adopted beginning January 1, 2011. Level III assets and liabilities are those whose fair value inputs are unobservable and reflect management’s best estimate of what market participants would use in pricing the asset or liability at the measurement date. The adoption of this guidance required additional disclosures but did not have a material impact on the Company’s results of operations or financial position.
In May 2011, the FASB issued ASU No. 2011-04, Fair Value Measurement (Topic 820), which amended existing rules covering fair value measurement and disclosure to clarify guidance and minimize differences between GAAP and International Financial Reporting Standards (“IFRS”). The guidance requires entities to provide information about valuation techniques and unobservable inputs used in Level 3 fair value measurements and provide a narrative description of the sensitivity of Level 3 measurements to changes in unobservable inputs. The guidance is effective during interim and annual periods beginning after December 15, 2011. We adopted this guidance on January 1, 2012. The adoption of this guidance did not have any impact on our financial position, results of operations or cash flows.
In June 2011, the FASB issued ASU No. 2011-05, Presentation of Comprehensive Income, which requires an entity to present total comprehensive income, the components of net income, and the components of other comprehensive income either in a single continuous statement of comprehensive income or in two separate but consecutive statements and eliminates the option to present the components of other comprehensive income as part of the statement of changes in stockholders’ equity. The Company early adopted this guidance on January 1, 2012, retrospectively. During the years ended December 31, 2010, 2011 and 2012, the Company did not have any other comprehensive income, and therefore, the net loss and comprehensive loss was the same for all periods presented.
In September 2011, the FASB issued ASU No. 2011-08, Intangibles—Goodwill and Other (Topic 350). The amended guidance will allow companies to assess qualitative factors to determine if it is more-likely-than-not
F-46
Table of Contents
GRUBHUB HOLDINGS INC.
(F/K/A GRUBHUB, INC.)
Notes to Financial Statements (Continued)
that goodwill might be impaired and whether it is necessary to perform the two-step goodwill impairment test required. This pronouncement is effective for fiscal years beginning after December 15, 2011. The Company adopted this standard on January 1, 2012. The adoption of this accounting standard update does not have any material impact on the Company’s results of operations or financial position. At December 31, 2012, the Company did not perform an assessment using qualitative factors in evaluating goodwill impairment.
3. Acquisitions
Dotmenu
On September 30, 2011, GrubHub Holdings acquired Dotmenu, Inc. (“Dotmenu”) through a reverse triangular merger, pursuant to which Dotmenu became a wholly-owned subsidiary of GrubHub Holdings. Dotmenu provided online food ordering primarily to college campuses through its website campusfood.com, and also operated allmenus.com, a website that stores and displays approximately 250,000 menus.
The purchase price was approximately $46.4 million, consisting of approximately $45.5 million of cash and 200,000 shares of Series E Preferred Stock valued at approximately $0.9 million. The value of the Series E Preferred Stock issued was determined using arm’s length transactions for the Series E Preferred Stock issued shortly prior to the transaction. GrubHub Holdings Inc.’s acquisition of 100% of the outstanding stock of Dotmenu has been accounted for as a business combination, and assets acquired and liabilities assumed were recorded at their estimated fair values as of September 30, 2011. Goodwill is measured as of the acquisition date as the residual of consideration transferred, which is also generally measured at fair value, and the net of the acquisition date fair value of the assets acquired, including identified intangibles and the liabilities assumed. The Company incurred certain expenses directly and indirectly related to the acquisition. These expenses totaled $0.2 million and are included in general and administrative expenses in the accompanying 2011 statement of operations.
The following table summarizes the acquisition-date fair value of the assets and liabilities acquired in connection with the business combination (in thousands):
| Identifiable assets |
$ | 2,269 | ||
| Developed technology |
493 | |||
| Customer relationships |
8,894 | |||
| Trademarks |
178 | |||
| Goodwill |
36,651 | |||
| Liabilities assumed |
(2,122 | ) | ||
|
|
|
|||
| Total net assets acquired |
$ | 46,363 | ||
|
|
|
The preliminary estimated fair value of the intangible assets acquired was determined based on a combination of the income, cost, and market approach to measure the fair value of the developed technology, the customer relationships and the trademarks. The fair value of the trademarks was measured based on the relief from royalty method. The cost approach, specifically the cost to recreate method, was used to value the developed technology. The income approach, specifically the multi-period excess earnings method, was used to value the customer relationships.
These fair value measurements were based on significant inputs not observable in the market and thus represent Level 3 measurements under the fair value hierarchy.
F-47
Table of Contents
GRUBHUB HOLDINGS INC.
(F/K/A GRUBHUB, INC.)
Notes to Financial Statements (Continued)
The results of operations related to this acquisition have been included in the Company’s financial statements since October 1, 2011, the date subsequent to the acquisition. Pro forma financial information for the acquisition accounted for as a business combination is presented below.
The following unaudited pro forma information presents a summary of the operating results of the Company for the year ended December 31, 2011, as if the Company had acquired Dotmenu as of January 1, 2011 (in thousands):
| Pro Forma Combined 2011 | ||||
| Revenues |
$ | 23,718 | ||
| Net loss |
$ | (18,007 | ) | |
FanGo, Inc.
On August 25, 2011, GrubHub Holdings Inc. acquired FanGo, Inc. (“FanGo”) through a reverse triangular merger, pursuant to which FanGo became a wholly-owned subsidiary of GrubHub Holdings Inc. FanGo provided mobile/online food delivery to consumers in professional sports venues.
Under the terms of the merger agreement, GrubHub Holdings Inc. assumed certain operating liabilities, paid FanGo approximately $1.4 million in cash and issued 543,906 restricted shares of Series 1 Preferred Stock valued at $2.3 million to FanGo stockholders. Of the $2.3 million issued in stock, $1.1 million was allocated to the purchase price of FanGo, with the remaining value accounted for as post combination employment services. The Company negotiated the total consideration paid to the stockholders of FanGo in an arms-length transaction. The fair value of the shares of Series 1 Preferred Stock that were issued to the stockholders was determined to be $4.23 per share, which the Company deemed to be the price that would be received to sell one share of Series 1 Preferred Stock in an orderly transaction between market participants at the measurement date. In determining the fair value, the Company considered the fair value of Preferred Stock issued during 2011. Specifically, the Company considered the share value of the Series D Preferred Stock ($3.38) issued on March 9, 2011, as well as the share value of the Series E Preferred Stock ($4.51) subsequently issued on September 9, 2011. The Company determined that the valuation of the Series 1 Preferred Stock ($4.23) that was utilized in the acquisition of FanGo, which took place on August 25, 2011, was consistent with the fair value of the Preferred Stock in the Series D Preferred Stock and Series E Preferred Stock issuances. The Series 1 Preferred Stock was created exclusively for issuance to FanGo stockholders in connection with the acquisition.
The purchase price was approximately $2.5 million, reflecting the cash amount issued and the estimated fair market value of Series 1 Preferred Stock that did not relate to post-combination service. The portion of the Series 1 Preferred Stock related to post-combination services is recorded as stock-based compensation expense over the vesting period and has not been included in the purchase price noted above.
GrubHub Holdings Inc.’s acquisition of FanGo, has been accounted for as a business combination, and assets acquired and liabilities assumed were recorded at their estimated fair values as of August 25, 2011. Goodwill is measured as of the acquisition date as the residual of consideration transferred, which is also generally measured at fair value, and the net of the acquisition date fair value of the assets acquired, including identified intangible assets and the liabilities assumed.
F-48
Table of Contents
GRUBHUB HOLDINGS INC.
(F/K/A GRUBHUB, INC.)
Notes to Financial Statements (Continued)
The following table summarizes the acquisition-date fair value of the assets and liabilities acquired in connection with the business combination (in thousands):
| Identifiable assets |
$ | 13 | ||
| Developed technology |
389 | |||
| Goodwill |
2,057 | |||
| Liabilities assumed |
(2 | ) | ||
|
|
|
|||
| Total net assets acquired |
$ | 2,457 | ||
|
|
|
The estimated fair value of the developed technology acquired was determined based on a cost to recreate approach. This fair value measurement was based on significant inputs not observable in the market and thus represent Level 3 measurements under the fair value hierarchy.
The results of operations related to this acquisition have been included in the Company’s financial statements since August 26, 2011, the date of acquisition. Pro forma financial information for the acquisition accounted for as a business combination has not been presented, as the effects were not material to the Company’s financial statements.
4. Intangible Assets
The following table presents the detail of intangible assets subject to amortization as of the dates presented is as follows (in thousands):
| Amortization Period (Years) |
December 31, | June
30, 2013 |
||||||||||||||
| 2011 | 2012 | |||||||||||||||
| (unaudited) | ||||||||||||||||
| Developed technology |
1-4 | $ | 882 | $ | 389 | $ | 389 | |||||||||
| Customer relationships |
17.25 | 8,894 | 8,894 | 8,894 | ||||||||||||
| Trademarks |
1 | 178 | — | — | ||||||||||||
| Less: accumulated amortization |
(329 | ) | (774 | ) | (1,081 | ) | ||||||||||
|
|
|
|
|
|
|
|||||||||||
| Total intangible assets |
$ | 9,625 | $ | 8,509 | $ | 8,202 | ||||||||||
|
|
|
|
|
|
|
|||||||||||
Amortization expense recorded for intangible assets for the years ended December 31, 2011 and 2012 was $0.3 million and $1.1 million, respectively, and these amounts were included in depreciation and amortization. Amortization expense recorded for intangible assets for the six months ended June 30, 2012 (unaudited) and 2013 (unaudited) was $0.6 million and $0.3 million, respectively, and these amounts were included in depreciation and amortization. The remaining weighted-average amortization period as of June 30, 2013 (unaudited) was approximately 14.7 years. Amortization is recorded on a straight line basis.
F-49
Table of Contents
GRUBHUB HOLDINGS INC.
(F/K/A GRUBHUB, INC.)
Notes to Financial Statements (Continued)
Estimated future amortization expense for intangible assets as of June 30, 2013 is as follows (in thousands):
| (6 months remaining) 2013 |
$ | 307 | ||
| 2014 |
613 | |||
| 2015 |
580 | |||
| 2016 |
516 | |||
| 2017 |
516 | |||
| 2018 |
516 | |||
|
|
|
|||
| Thereafter |
5,154 | |||
|
|
|
|||
| Total |
$ | 8,202 | ||
|
|
|
5. Goodwill
During the year ended December 31, 2011, the Company recorded goodwill of $38.7 million in conjunction with the acquisitions of the operating assets of FanGo and Dotmenu. None of the goodwill is deductible for tax purposes.
6. Property and Equipment, Net
The following table presents the detail of property and equipment as of the dates presented (in thousands):
| December 31, | June 30, 2013 |
|||||||||||
| 2011 | 2012 | |||||||||||
| (unaudited) | ||||||||||||
| Office equipment, computers, and furniture and fixtures |
$ | 710 | $ | 1,122 | $ | 1,481 | ||||||
| Developed software |
438 | 1,271 | 1,646 | |||||||||
| Leasehold improvements acquired under tenant allowance |
— | 1,841 | 1,841 | |||||||||
| Restaurant facing technology |
— | 824 | 1,526 | |||||||||
| Purchased software |
127 | 127 | 127 | |||||||||
| Leasehold improvements |
295 | — | — | |||||||||
|
|
|
|
|
|
|
|||||||
| Property and equipment |
1,570 | 5,185 | 6,621 | |||||||||
| Less: accumulated amortization and depreciation |
(407 | ) | (1,210 | ) | (2,204 | ) | ||||||
|
|
|
|
|
|
|
|||||||
| Property and equipment, net |
$ | 1,163 | $ | 3,975 | $ | 4,417 | ||||||
|
|
|
|
|
|
|
|||||||
The Company recorded amortization and depreciation expense related to property and equipment other than developed software for the years ended December 31, 2011 and 2012 and the six months ended June 30, 3012 (unaudited) and June 30, 2013 (unaudited) of $0.2 million, $0.7 million, $0.2 million and $0.7 million, respectively.
For the years ended December 31, 2011 and 2012 and the six months ended June 30, 2013 (unaudited), the Company capitalized $0.3 million, $0.8 million and $0.7 million, respectively, in developed software. Amortization expense for website development costs included in depreciation and amortization for the years ended December 31, 2011 and 2012 and the six months ended June 30,2012 (unaudited) and June 30, 2013 (unaudited) totaled $0.1 million, $0.3 million, $0.1 million and $0.3 million, respectively.
F-50
Table of Contents
GRUBHUB HOLDINGS INC.
(F/K/A GRUBHUB, INC.)
Notes to Financial Statements (Continued)
7. Commitments and Contingencies
Office Facility Lease
The Company leases its office facility under an operating lease agreement that expires in 2017. The terms of the lease agreement provides for rental payments on a graduated basis. The Company recognizes rent expense on a straight-line basis over the lease period.
Rental expense, principally for leased office space under operating lease commitments, was $0.4 million, $1.4 million, $0.4 million and $0.6 million for the years ended December 31, 2011 and 2012 and the six months ended June 30, 2012 (unaudited) and June 30 2013 (unaudited), respectively.
The Company entered into a non-cancellable office lease with rent commencing on September 1, 2012. As part of the lease agreement, rent abatement is being provided for the first six months of the lease for 50% of the monthly rental obligation owed. The office lease began on September 1, 2012 and ends on August 31, 2017. Monthly rental payments start at $0.1 million and increase 3% a year over the life of the lease agreement. In connection with entering into the non-cancellable office lease, the Company established a restricted cash account with a bank for $0.5 million as collateral for a $0.5 million letter of credit to the landlord as a security deposit.
Aggregate Future Lease Commitments
The Company’s minimum payments under non-cancelable operating leases for office space having initial terms in excess of one year, at June 30, 2013 (unaudited), are as follows (in thousands):
| Operating Leases | ||||
| 2013 (6 months remaining) |
$ | 843 | ||
| 2014 |
1,704 | |||
| 2015 |
1,734 | |||
| 2016 |
1,764 | |||
| 2017 |
1,189 | |||
| Thereafter |
— | |||
|
|
|
|||
| Total minimum lease payments |
$ | 7,234 | ||
|
|
|
|||
Deferred Offering Costs
At December 31, 2012, the Company had deferred approximately $0.9 million of costs associated with a planned stock offering, which were included in prepaid expenses. The Company had subsequently expensed these amounts during the six month period ended June 30, 2013 since the planned stock offering did not take place in 2013.
Legal
In August 2011, Ameranth, Inc., a patent licensing company, filed a lawsuit against the Company in the U.S. District Court for the Southern District of California, or the California Court (Ameranth, Inc. v. Pizza Hut, Inc. et al., Case No 11-CV1810 JLS (NLS)). Ameranth has alleged infringement of two U.S. patents. In March 2012, Ameranth filed an additional lawsuit against the Company in the California Court (Ameranth, Inc. v. GrubHub Holdings Inc., Case No. 12-CV0739-DMS (POR)) alleging infringement of one additional U.S. patent. These two lawsuits have been consolidated. The Company has denied Ameranth’s claims, asserted various affirmative defenses, and has asserted counterclaims seeking a declaration that its products do not infringe the patents and that the patents are invalid and in some cases, unenforceable.
F-51
Table of Contents
GRUBHUB HOLDINGS INC.
(F/K/A GRUBHUB, INC.)
Notes to Financial Statements (Continued)
No trial date has been set for this case. The Company believes this case lacks merit, it has strong defenses to all of the infringement claims and intends to defend itself vigorously against such claims. However, the Company is unable to predict the likelihood of success of Ameranth’s infringement claims and is unable to predict the likelihood of success of its counterclaims. The Company has not recorded an accrual related to this lawsuit as of December 31, 2011 or 2012, or June 30, 2013 as it does not believe a material loss is probable. It is a reasonable possibility that a loss may be incurred; however, the possible range of loss is not estimable given the early stage of the dispute and the uncertainty as to whether the claims at issue are with or without merit, will be settled out of court, or will be determined in the Company’s favor, whether the Company may be required to expend significant management time and financial resources on the defense of such claims, and whether the Company will be able to recover any losses under its insurance policies.
In addition to the matters described above, from time to time, the Company is involved in various other legal proceedings arising from the normal course of business activities.
8. Related-Party Transactions
During November 2010, the Company received promissory notes receivable in the amount of $0.6 million from two officers for the issuance of 1,455,092 shares of common stock. These promissory notes bear interest at a rate of 4% per year, originally maturing during November 2020 and were reported as a reduction of stockholders’ equity. The portion of the stock having non-recourse provisions has been included in the Company’s ASC 718 stock option grants. In December 2012, the Company repurchased an aggregate of 145,380 shares of common stock at a purchase price equal to the fair market value of $4.25 per share from our chief executive officer and chief operating officer, in exchange for the cancellation of the aggregate principal and accrued interest due under the promissory notes described as noted above.
In November 2010, the Company sold 12,557,327 shares of Series C Preferred Stock for an aggregate price of $10,931,153 to investors that are the Company’s affiliates, including entities affiliated with Benchmark Capital Partners, Leo Capital Holdings and Origin Ventures.
During March 2011, the Company redeemed 1,186,656 shares of common stock at a price of $4.0 million from stockholders of the Company at a price that exceeded the fair market value of the common stock at the time of the redemption. The excess of the purchase price over the fair market value of the common stock was $3.5 million, which was recorded within general and administrative expense in the 2011 statement of operations. The shares were subsequently retired during 2012. The common stock repurchase occurred concurrent with the issuance of the Series D Preferred Stock.
In March 2011, the Company sold 5,855,562 shares of Series D Preferred Stock for an aggregate price of $19,799,997 to investors that are the Company’s affiliates, including entities affiliated with Benchmark Capital Partners and DAG Ventures.
In October 2011, the Company sold 6,860,227 shares of Series E Preferred Stock for an aggregate price of $30,999,993 to investors that are the Company’s affiliates, including entities affiliated with Benchmark Capital Partners, DAG Ventures and Lightspeed Ventures.
9. Stock-Based Compensation
During 2007, the Company established a stock incentive plan (the “Plan”). The Plan allows the Company to grant stock options to individuals or groups of individuals as specified in the Plan. The exercise price of stock options cannot be less than the fair value of the common stock at the time of the grant, and the stock options generally expire ten years after the date of issuance.
F-52
Table of Contents
GRUBHUB HOLDINGS INC.
(F/K/A GRUBHUB, INC.)
Notes to Financial Statements (Continued)
The fair value of each option award is estimated on the date of grant using the Black-Scholes option valuation model that uses the assumptions noted in the table below. Expected volatilities are based on historical volatilities of comparable publicly traded companies. The Company uses historical data to estimate option exercise and employee termination within the valuation model. Separate groups of employees that have similar historical exercise behavior are considered separately for valuation purposes. The expected term of the award is estimated using a simplified method, as awards are plain vanilla share options. The fair value at grant date was determined considering the performance of the Company at the grant date as well as future growth and profitability expectations by applying an appropriate multiple to the Company’s earnings. The risk-free rate for the period within the contractual life of the option is based on the U.S. Treasury yield curve in effect at the time of grant.
The following assumptions were utilized for the years ended December 31, 2011 and 2012 and the six months ended June 30, 2013 (unaudited):
| Years Ended December 31, | Six Months Ended June 30, 2013 |
|||||||||||
| 2011 | 2012 | |||||||||||
| (unaudited) | ||||||||||||
| Weighted average fair value of options granted |
$ | 0.38 | $ | 1.25 | $ | 2.35 | ||||||
| Average risk-free interest rate |
1.75 | % | 0.85 | % | 1.16 | % | ||||||
| Expected stock price volatilities |
60.9 | % | 58.5 | % | 53.2 | % | ||||||
| Dividend yield |
None | None | None | |||||||||
| Expected stock option life |
6.11 | 5.4 | 6.38 | |||||||||
The options vest over different lengths of time depending upon the grantee. Compensation expense is recorded over the vesting period. The Company recorded stock-based compensation expense of $0.3 million, $0.7 million, and $0.8 million for the years ended December 31, 2011 and 2012 and the six months ended June 30, 2013 (unaudited), respectively.
There is no active external or internal market for the Company’s shares. Thus, it was not possible to estimate the expected volatility of the Company’s share price in estimating fair value of options granted. Accordingly, as a substitute for such volatility, the Company used the historical volatility of comparable online companies in its industry.
A summary of the Company’s stock option activity is as follows:
| Year Ended December 31, 2011 | ||||||||||||||||
| Options | Weighted Average Exercise Price |
Aggregate Intrinsic Value |
Weighted Average Remaining Term |
|||||||||||||
| Outstanding at beginning of year |
3,173,581 | $ | 0.10 | |||||||||||||
| Granted |
4,176,077 | 0.63 | ||||||||||||||
| Forfeited |
(305,312 | ) | 0.31 | |||||||||||||
| Exercised |
(1,587,262 | ) | 0.06 | |||||||||||||
| Expired |
— | N/A | ||||||||||||||
|
|
|
|
|
|
|
|
|
|||||||||
| Outstanding at end of year |
5,457,084 | $ | 0.52 | $ | 2,642,330 | 9.05 | ||||||||||
| Vested and expected to vest at end of year |
4,722,872 | $ | 0.51 | $ | 2,371,025 | 9.03 | ||||||||||
| Exercisable at end of year |
781,857 | $ | 0.23 | $ | 609,616 | 8.35 | ||||||||||
|
|
|
|
|
|
|
|
|
|||||||||
F-53
Table of Contents
GRUBHUB HOLDINGS INC.
(F/K/A GRUBHUB, INC.)
Notes to Financial Statements (Continued)
| Year Ended December 31, 2012 | ||||||||||||||||
| Options | Weighted Average Exercise Price |
Aggregate Intrinsic Value |
Weighted Average Remaining Term |
|||||||||||||
| Outstanding at beginning of year |
5,457,084 | $ | 0.52 | |||||||||||||
| Granted |
3,044,987 | 1.62 | ||||||||||||||
| Forfeited |
(694,304 | ) | 0.81 | |||||||||||||
| Exercised |
(1,461,663 | ) | 0.34 | |||||||||||||
| Expired |
— | N/A | ||||||||||||||
|
|
|
|
|
|
|
|
|
|||||||||
| Outstanding at end of year |
6,346,104 | $ | 1.13 | $ | 18,110,280 | 8.83 | ||||||||||
| Vested and expected to vest at end of year |
4,783,657 | $ | 1.10 | $ | 15,078,282 | 8.78 | ||||||||||
| Exercisable at end of year |
822,186 | $ | 0.54 | $ | 3,046,790 | 7.93 | ||||||||||
|
|
|
|
|
|||||||||||||
| Six Months Ended June 30, 2013 (Unaudited) | ||||||||||||||||
| Options | Weighted Average Exercise Price |
Aggregate Intrinsic Value |
Weighted Average Remaining Term |
|||||||||||||
| Outstanding at beginning of year |
6,346,104 | $ | 1.06 | |||||||||||||
| Granted |
667,427 | 4.25 | ||||||||||||||
| Forfeited |
(418,617 | ) | 1.16 | |||||||||||||
| Exercised |
(452,288 | ) | 0.51 | |||||||||||||
| Expired |
— | N/A | ||||||||||||||
|
|
|
|
|
|
|
|
|
|||||||||
| Outstanding at end of year |
6,142,626 | $ | 1.45 | $ | 21,921,404 | 8.47 | ||||||||||
| Vested and expected to vest at end of year |
5,219,893 | $ | 1.40 | $ | 18,891,392 | 8.41 | ||||||||||
| Exercisable at end of year |
891,899 | $ | 0.62 | $ | 3,922,913 | 7.58 | ||||||||||
|
|
|
|
|
|||||||||||||
The Company has computed the aggregate intrinsic value amounts disclosed in the above tables based on the difference between the original exercise price of the options and the fair value of the Company’s common stock as of December 31, 2011, 2012 and the six months ended June 30, 2013. The aggregate intrinsic value of awards exercised during the years ended December 31, 2011 and 2012 and the six months ended June 30, 2013 was $1.2 million, $4.9 million, and $1.9 million, respectively.
As of June 30, 2013 (unaudited) total unrecognized compensation expense, adjusted for estimated forfeitures, related to non-vested stock options was $3.6 million, which is expected to be recognized over the next 3.4 years.
F-54
Table of Contents
GRUBHUB HOLDINGS INC.
(F/K/A GRUBHUB, INC.)
Notes to Financial Statements (Continued)
The options outstanding and exercisable as of June 30, 2013 have been segregated into ranges for additional disclosure as follows:
| Exercise Price |
Outstanding on June 30, 2013 |
Weighted Average Remaining Term |
Vested and Expected to Vest on June 30, 2013 |
Weighted Average Remaining Term |
Exercisable on June 30, 2013 |
Weighted Average Remaining Term |
||||||||||||||||||
| $0.03 |
16,906 | 5.47 | 16,906 | 5.47 | 16,906 | |||||||||||||||||||
| 0.04 |
4,057 | 5.90 | 3,999 | 5.90 | 3,151 | |||||||||||||||||||
| 0.04 |
78,056 | 6.02 | 76,605 | 6.02 | 64,460 | |||||||||||||||||||
| 0.04 |
113,296 | 5.98 | 112,968 | 5.98 | 90,441 | |||||||||||||||||||
| 0.04 |
521 | 6.00 | 480 | 6.00 | — | |||||||||||||||||||
| 0.22 |
198,187 | 7.07 | 185,953 | 7.06 | 112,772 | |||||||||||||||||||
| 0.39 |
505,184 | 7.38 | 474,084 | 7.38 | 41,561 | |||||||||||||||||||
| 0.45 |
715,070 | 7.84 | 642,852 | 7.84 | 215,262 | |||||||||||||||||||
| 1.01 |
2,901,666 | 8.59 | 2,418,717 | 8.57 | 310,396 | |||||||||||||||||||
| 2.34 |
100,000 | 8.97 | 76,086 | 8.97 | 25,000 | |||||||||||||||||||
| 2.56 |
505,272 | 9.11 | 400,656 | 9.11 | 7,700 | |||||||||||||||||||
| 3.13 |
341,984 | 9.35 | 270,029 | 9.35 | — | |||||||||||||||||||
| 4.25 |
662,427 | 9.63 | 540,558 | 9.63 | 4,250 | |||||||||||||||||||
|
|
|
|
|
|
|
|||||||||||||||||||
| Total |
6,142,626 | 8.47 | 5,219,893 | 8.41 | 891,899 | 7.58 | ||||||||||||||||||
|
|
|
|
|
|
|
|||||||||||||||||||
Restricted Stock
In consideration for the acquisition of substantially all of FanGo under the terms of the merger agreement, GrubHub Holdings Inc. issued to FanGo key employees 376,242 restricted shares of GrubHub Holdings Inc.’s Series 1 Preferred Stock, effective on August 25, 2011. The grant date fair value of the restricted shares was approximately $1.6 million. Of the 376,242 shares of restricted stock granted to FanGo employees, 94,061 immediately vested at an aggregate amount of $0.4 million which was part of the purchase price of FanGo.
During 2012, a key employee received an acceleration of 85,819 vested shares and forfeited 31,208 shares in return for signing and abiding by a termination agreement signed upon his departure from the Company. The Company recorded $250,000 in compensation expense related to the acceleration in 2012. As of December 31, 2012, 282,707 shares were vested and no longer subject to forfeiture. Approximately 93,535 restricted shares remain as of December 31, 2012 subject to forfeiture, which will vest ratably over a range of 20 to 24 months following December 31, 2012, subject to continued employment or service to GrubHub Holdings Inc. During the six months ended June 30, 2013 76,707 shares forfeited as a result of employees who departed the Company. 22,828 shares remain as of June 30, 2013 subject to forfeiture which will vest ratably over a range of 14 to 18 months as of June 30, 2013 (unaudited). The fair value of the restricted shares relate to post-combination services and will be recorded as stock-based compensation expense over the vesting period. As of December 31, 2012, there was $0.4 million in total unrecognized cost related to the restricted shares. There was no unrecognized cost on these shares at June 30, 2013 (unaudited).
10. Income Taxes
The Company is subject to federal income taxes in the United States. For the years ended December 31, 2011 and 2012 and the six months ended June 30, 2013 (unaudited), the Company did not have taxable income, and therefore, no current tax liability or expense has been recorded in the financial statements.
F-55
Table of Contents
GRUBHUB HOLDINGS INC.
(F/K/A GRUBHUB, INC.)
Notes to Financial Statements (Continued)
The income tax provision (benefit) is comprised of the following at December 31, 2011 and 2012 and the six months ended June 30, 2013 (unaudited) (in thousands):
| As of December 31, | ||||||||
| 2011 | 2012 | |||||||
| Current |
$ | — | $ | — | ||||
| Deferred |
(10,069 | ) | (3,359 | ) | ||||
| Change in valuation allowance |
10,069 | 3,359 | ||||||
|
|
|
|
|
|||||
| Total |
$ | — | $ | — | ||||
|
|
|
|
|
|||||
Deferred federal income taxes reflect the net tax impact of temporary differences between the carrying amounts of assets and liabilities for financial reporting purposes and such amounts for tax purposes. The following table presents the significant components of the Company’s deferred tax assets and liabilities as of the dates presented (in thousands):
| As of December 31, | ||||||||
| 2011 | 2012 | |||||||
| Deferred tax assets: |
||||||||
| Net operating loss carryforward |
$ | 14,472 | $ | 16,874 | ||||
| Bad debt |
24 | 95 | ||||||
| Accrued vacation |
179 | 37 | ||||||
| Accrued bonus |
— | 75 | ||||||
| Deferred rent |
19 | 253 | ||||||
| Gift card income |
54 | 13 | ||||||
| Research and development credits |
166 | 53 | ||||||
| State tax credits |
300 | 654 | ||||||
| Tenant allowance |
— | 686 | ||||||
| Other |
— | 20 | ||||||
| Stock-based compensation |
734 | 933 | ||||||
|
|
|
|
|
|||||
| Total deferred tax assets |
15,948 | 19,693 | ||||||
| Deferred tax liabilities: |
||||||||
| Depreciation |
(250 | ) | (916 | ) | ||||
| Intangibles |
(3,797 | ) | (3,361 | ) | ||||
| Website and software development costs |
(155 | ) | (310 | ) | ||||
|
|
|
|
|
|||||
| Total deferred tax liabilities |
(4,202 | ) | (4,587 | ) | ||||
|
|
|
|
|
|||||
| Net deferred tax assets before valuation allowance |
11,746 | 15,106 | ||||||
|
|
|
|
|
|||||
| Less valuation allowance |
(11,746 | ) | (15,106 | ) | ||||
|
|
|
|
|
|||||
| $ | — | $ | — | |||||
|
|
|
|
|
|||||
F-56
Table of Contents
GRUBHUB HOLDINGS INC.
(F/K/A GRUBHUB, INC.)
Notes to Financial Statements (Continued)
The following table presents a reconciliation of the federal statutory rate and the Company’s effective tax rate for the periods presented:
| 2011 | 2012 | |||||||
| Pre-tax book loss |
34.00 | % | 34.00 | % | ||||
| Restricted stock |
— | (1.75 | ) | |||||
| Stock redemptions |
(8.96 | ) | — | |||||
| Interest expense on warrants |
— | — | ||||||
| State income taxes, net of federal tax effect |
4.56 | 5.80 | ||||||
| Tax credits |
3.53 | 3.37 | ||||||
| All other adjustments, net |
(0.34 | ) | (1.82 | ) | ||||
| Change in valuation allowance |
(32.79 | ) | (39.60 | ) | ||||
|
|
|
|
|
|||||
| Effective rate |
— | — | ||||||
|
|
|
|
|
|||||
At December 31, 2011 and 2012 and the six months June 30, 2013, the Company had $36.0 million, $42.8 million and $46.7 million, respectively, of federal and state net operating loss carryforwards, which will expire beginning in 2019. The Company’s federal and state net operating loss carryforwards for tax return purposes are $1.9 million greater than its recognized Net Operating Loss for financial accounting purposes, as excess tax benefits (stock compensation deductions in excess of book compensation costs) are not recognized until realized. The tax benefit of this loss would be recognized for financial statement purposes in the period in which the tax benefit reduces income taxes payable, and will be reflected as an increase to paid in capital. The Company acquired approximately $20 million of net operating loss carryforwards during 2011 as part of the Dotmenu and FanGo acquisitions. The Company is limited in the amount that may be deducted in future periods under Section 382 of the Internal Revenue Code. In addition, at December 31, 2012, the Company has $0.1 million of federal research tax credit carryforwards which will expire beginning in 2026 and $0.7 million of Illinois Edge Credits which will expire beginning in 2015.
The Company is subject to taxation in the U.S. federal and various state jurisdictions. Significant judgment is required in determining the provision for income taxes and recording the related income tax assets and liabilities. The Company’s practice for accounting for uncertainty in income taxes is to recognize the financial statement benefit of a tax position only after determining that the relevant tax authority would more-likely-than-not sustain the position following an audit. For tax positions meeting the more-likely-than-not criteria, the amount recognized in the financial statements is the largest benefit that has a greater than 50% likelihood of being realized upon ultimate settlement with the relevant tax authority. At December 31, 2011, 2012 and June 30, 2013 (unaudited), the Company did not have any material unrecognized tax benefits recorded on its balance sheets.
The Company’s practice is to recognize interest and penalties related to income tax matters in income tax expense. The Company did not recognize any interest or penalties in its statement of operations for the years ended December 31, 2011 and 2012 and the six months ended June 30, 2013 (unaudited).
The Company is not currently under audit in any tax jurisdiction. Tax years after 2008 are still currently open for audit by federal taxing authorities. The time period currently open for audit at the state level varies by jurisdiction.
F-57
Table of Contents
GRUBHUB HOLDINGS INC.
(F/K/A GRUBHUB, INC.)
Notes to Financial Statements (Continued)
11. Stockholders’ Equity
The Company is authorized to issue seven classes of stock: Common Stock, Series A Preferred Stock, Series B Preferred Stock, Series C Preferred Stock, Series D Preferred Stock, Series E Preferred Stock and Series 1 Preferred Stock. Each share of Preferred Stock is convertible, at the option of the holder thereof, into Common Stock on a one-for-one basis at the following conversion prices per share subject to adjustment in the case of certain dilutive issuances, stock splits or combinations: $0.142 for the Series A Preferred Stock, $0.200961 for the Series B Preferred Stock, $0.8705 for the Series C Preferred Stock, $3.3814 for the Series D Preferred Stock, $4.5188 for the Series E Preferred Stock and $4.2268 for the Series 1 Preferred Stock. In addition, all shares of Preferred Stock automatically convert into Common Stock, on a one-for-one basis at the conversion prices set forth above, (i) upon the closing of an initial public offering, the aggregate public offering price of which is at least $30,000,000, or (ii) on the date, or the occurrence of an event, specified by vote or written consent or agreement of the holders of at least 66 2/3% of the then outstanding shares of Preferred Stock (other than the Series 1 Preferred Stock). As of December 31, 2012, 48,257,758 shares of Common Stock would have been required to be issued assuming conversion of all of the issued outstanding shares of Series A, B, C, D, E and 1 Preferred Stock. No shares of Preferred Stock are redeemable by stockholders or the Company.
Common Stock
Each holder of common stock will have one vote held on all matters that are submitted for stockholder vote.
Upon liquidation, the common stock will be junior to the rights and preferences of the Series A, B, C, D, E and Series 1 Preferred Stock.
At December 31, 2011 and 2012 and June 30, 2013 (unaudited), there were 70,000,000 shares of Common Stock authorized, respectively. As of December 31, 2011, there were 14,015,704 shares issued and 12,829,048 shares outstanding. As of December 31, 2012, there were 13,603,314 shares issued and outstanding. As of June 30, 2013 (unaudited), there were 14,055,602 shares issued and outstanding.
Series A Preferred Stock
Holders of shares of Series A Preferred Stock will be entitled to receive cumulative dividends at the annual rate of eight percent (8%) of the original Series A issue price through March 9, 2009. Thereafter, dividends accrued at the annual rate of six percent (6%) of the original Series A issue price through November 3, 2010. Cumulative undeclared dividends at December 31, 2011 and 2012 and June 30, 2013 (unaudited) and were $0.2 million.
In the event of a liquidation event, the holders of Series A, Series B, Series C, Series D, Series E and Series 1 Preferred Stock will be entitled to receive pari passu to each other, and prior and in preference to any distribution of any assets of the Company to the holders of Common Stock. The Series A Preferred Stock will have a liquidation preference of an amount per share equal to the original Series A issue price plus the accrued dividends on each such share. The aggregate liquidation preference of the Series A Preferred Stock as of December 31, 2011 and 2012 and June 30, 2013 (unaudited) was $1.3 million.
At December 31, 2011 and 2012 and June 30, 2013 (unaudited), there were 7,746,897 shares of Series A Preferred Stock authorized, issued and outstanding.
F-58
Table of Contents
GRUBHUB HOLDINGS INC.
(F/K/A GRUBHUB, INC.)
Notes to Financial Statements (Continued)
Series B Preferred Stock
Holders of shares of Series B Preferred Stock will be entitled to receive cumulative dividends at the annual rate of six percent (6%) of the original Series B issue price through November 3, 2010. Cumulative undeclared dividends at December 31, 2011 and 2012 and June 30, 2013 (unaudited) were $0.2 million.
In the event of a liquidation event, the holders of Series A, Series B, Series C, Series D, Series E and Series 1 Preferred Stock will be entitled to receive pari passu to each other, and prior and in preference to any distribution of any assets of the Company to the holders of Common Stock. The Series B Preferred Stock will have a liquidation preference of an amount per share equal to the original Series B issue price plus the accrued dividends on each such share. The aggregate liquidation preference of the Series B Preferred Stock as of December 31, 2011 and 2012 and June 30, 2013 (unaudited) was $2.2 million.
At December 31, 2011 and 2012 and June 30, 2013 (unaudited), there were 10,176,092 shares of Series B Preferred Stock authorized, of which 10,036,140, 10,173,293, and 10,176,092 were issued and outstanding, respectively.
Series C Preferred Stock
In the event of a liquidation event, the holders Series A, Series B, Series C, Series D, Series E and Series 1 Preferred Stock will be entitled to receive pari passu to each other, and prior and in preference to any distribution of any assets of the Company to the holders of Common Stock. The Series C Preferred Stock will have a liquidation preference of an amount per share equal to the original Series C issue price. The aggregate liquidation preference of the Series C Preferred Stock as of December 31, 2011 and 2012 and June 30, 2013 (unaudited) was $11.3 million.
As of December 31, 2011 and 2012 and June 30, 2013 (unaudited), there were 12,808,718 shares of Series C Preferred Stock authorized, issued and outstanding.
Series D Preferred Stock
In the event of a liquidation event, the holders Series A, Series B, Series C, Series D, Series E and Series 1 Preferred Stock will be entitled to receive pari passu to each other, and prior and in preference to any distribution of any assets of the Company to the holders of Common Stock. The Series D Preferred Stock will have a liquidation preference of an amount per share equal to the original Series D issue price. The aggregate liquidation preference of the Series D Preferred Stock as of December 31, 2011 and 2012 and June 30, 2013 (unaudited) was $20.0 million.
As of December 31, 2011 and 2012 and June 30, 2013 (unaudited), there were 5,914,709 shares of Series D Preferred Stock authorized, issued and outstanding.
Series E Preferred Stock
In the event of a liquidation event, the holders Series A, Series B, Series C, Series D, Series E and Series 1 Preferred Stock will be entitled to receive pari passu to each other, and prior and in preference to any distribution of any assets of the Company to the holders of Common Stock. The Series E Preferred Stock will have a liquidation preference of an amount per share equal to the original Series E issue price. The aggregate liquidation preference of the Series E Preferred Stock as of December 31, 2011 and 2012 and June 30, 2013 (unaudited) was $50.2 million.
F-59
Table of Contents
GRUBHUB HOLDINGS INC.
(F/K/A GRUBHUB, INC.)
Notes to Financial Statements (Continued)
As of December 31, 2011 and 2012 and June 30, 2013 (unaudited), there were 11,101,442 shares of Series E Preferred Stock authorized, issued and outstanding.
Series 1 Preferred Stock
In the event of a liquidation event, the holders Series A, Series B, Series C, Series D, Series E and Series 1 Preferred Stock will be entitled to receive pari passu to each other, and prior and in preference to any distribution of any assets of the Company to the holders of Common Stock. The Series 1 Preferred Stock will have a liquidation preference of an amount per share equal to the original Series 1 issue price. The aggregate liquidation preference of the Series 1 Preferred Stock as of December 31, 2011 and 2012 and June 30, 2013 (unaudited) was $2.3 million.
As of December 31, 2011 and 2012 and June 30, 2013 (unaudited), there were 543,906 shares of Series 1 Preferred Stock authorized, and 543,906, 512,699, and 435,992 shares, respectively, issued and outstanding.
Preferred Stock Warrants
In May 2010, the Company issued a convertible promissory note payable to existing investors in the aggregate amount of $0.3 million, which included warrants to purchase 223,924 shares of Series B Preferred Stock. The note bears interest at 6% and was scheduled to mature in May 2011. In November 2010, the note payable was exchanged for shares of Series C Preferred Stock. The warrants are exercisable at any time up to expiration in May 2020. Each warrant is exercisable for $0.20 per share of Series B Preferred Stock. In 2011, warrants were exercised to purchase 83,972 shares of Series B Preferred Stock at a price per share of $0.20. Between January 1 and December 31, 2012, warrants were exercised to purchase 137,153 shares of Series B Preferred Stock at a price per share of $0.20. During the six months ended June 30, 2013 (unaudited), warrants were exercised to purchase 2,799 shares of Series B Preferred Stock at a price per share $0.20 per share.
12. Retirement Plan
During 2011, the Company formed a 401(k) plan for employees that provides for matching contributions of 100% of the first 3% of employees’ contributions and 50% of the next 2% of employees’ contributions that are made. The Company may make discretionary profit sharing contributions as determined by the Company’s Board of Directors. The Company’s matching contributions to the plan were $0.2 million, $0.4 million and $0.2 million, respectively, during the years ended December 31, 2011 and the years ended December 31, 2012 and the six months ended June 30, 2013 (unaudited). There were no discretionary contributions during the years ended December 31, 2011 or 2012 or the six months ended June 30, 2013 (unaudited).
13. Subsequent Event
On August 8, 2013, GrubHub Inc. acquired, through a series of transactions, all of the equity interests of each of Seamless North America, LLC, Seamless Holdings Corporation and the Company pursuant to that certain Reorganization and Contribution Agreement, dated as of May 19, 2013, by and among GrubHub Inc., Seamless North America, LLC, Seamless Holdings Corporation, the Company and the other parties thereto. As a result of this transaction, the Company concluded that Seamless Holdings Corporation was deemed the acquirer for financial reporting purposes. Accordingly, the acquisition of GrubHub Holdings Inc. has been accounted for as a business combination post combination financial statements.
F-60
Table of Contents
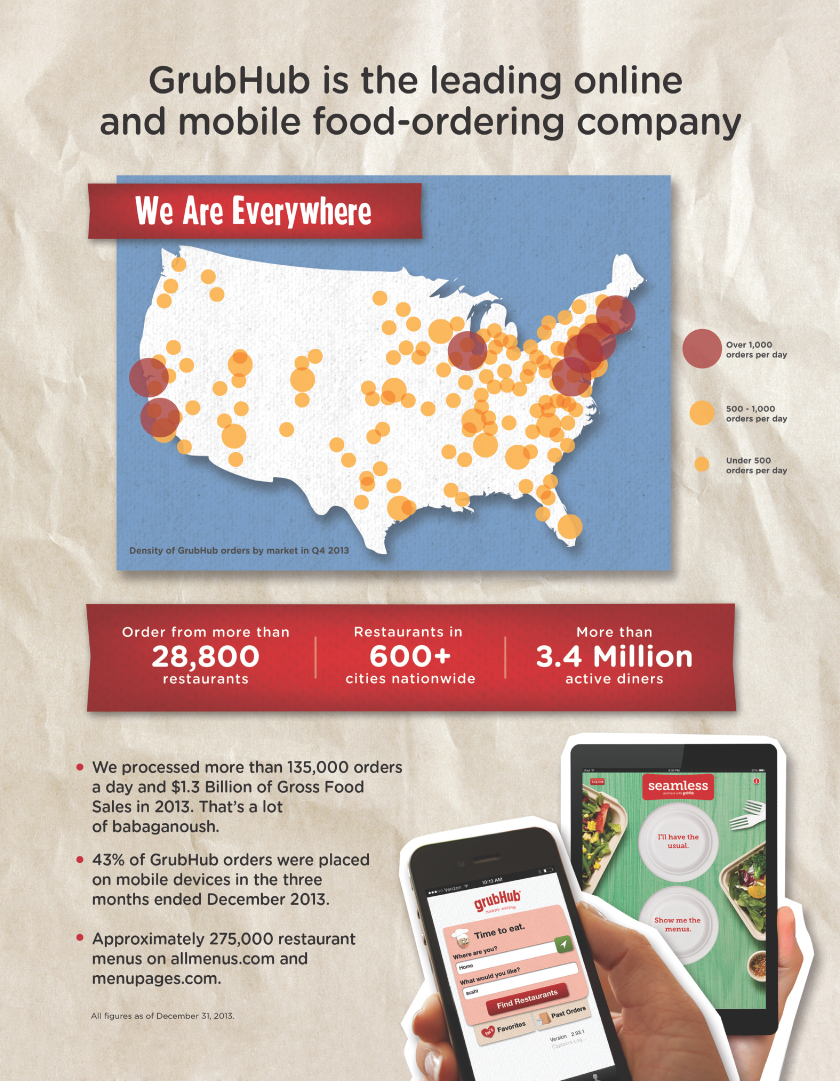
Table of Contents
Until , 2014 (25 days after the date of this prospectus), all dealers that buy, sell or trade shares of our common stock, whether or not participating in this offering, may be required to deliver a prospectus. This is in addition to the dealer’s obligation to deliver a prospectus when acting as underwriters and with respect to their unsold allotments or subscriptions.
Table of Contents
INFORMATION NOT REQUIRED IN PROSPECTUS
Item 13. Other Expenses of Issuance and Distribution.
The following table sets forth all costs and expenses, other than the underwriting discounts and commissions payable by us, in connection with the offer and sale of the securities being registered. All amounts shown are estimates except for the SEC registration fee and the Financial Industry Regulatory Authority, Inc. (“FINRA”) filing fee.
| Amount | ||||
| SEC registration fee |
$ | 64,514 | ||
| FINRA filing fee |
75,633 | |||
| NYSE listing fee |
4,688 | |||
| Printing expenses |
150,000 | |||
| Accounting fees and expenses |
100,000 | |||
| Legal fees and expenses |
250,000 | |||
| Miscellaneous expenses |
75,000 | |||
|
|
|
|||
| Total |
$ | 719,835 | ||
|
|
|
|||
Item 14. Indemnification of Directors and Officers.
Section 145 of the Delaware General Corporation Law authorizes a corporation’s board of directors to grant, and authorizes a court to award, indemnity to officers, directors, and other corporate agents.
In addition, our amended and restated certificate of incorporation contains provisions that limit the liability of our directors for monetary damages to the fullest extent permitted by Delaware law. Consequently, our directors will not be personally liable to us or our stockholders for monetary damages for any breach of fiduciary duties as directors, except liability for the following:
| • | any breach of their duty of loyalty to our company or our stockholders; |
| • | any act or omission not in good faith or that involves intentional misconduct or a knowing violation of law; |
| • | unlawful payments of dividends or unlawful stock repurchases or redemptions as provided in Section 174 of the Delaware General Corporation Law; or |
| • | any transaction from which they derived an improper personal benefit. |
Any amendment to, or repeal of, these provisions will not eliminate or reduce the effect of these provisions in respect of any act, omission or claim that occurred or arose prior to that amendment or repeal. If the Delaware General Corporation Law is amended to provide for further limitations on the personal liability of directors of corporations, then the personal liability of our directors will be further limited to the greatest extent permitted by the Delaware General Corporation Law.
In addition, our amended and restated bylaws provide that we will indemnify, to the fullest extent permitted by law, any person who is or was a party or is threatened to be made a party to any action, suit or proceeding by reason of the fact that he or she is or was one of our directors or officers or is or was serving at our request as a director or officer of another corporation, partnership, joint venture, trust, or other enterprise. Our amended and restated bylaws provide that we may indemnify to the fullest extent permitted by law any person who is or was a party or is threatened to be made a party to any action, suit, or proceeding by reason of the fact that he or she is or was one of our employees or agents or is or was serving at our request as an employee or agent of another
II-1
Table of Contents
corporation, partnership, joint venture, trust, or other enterprise. Our amended and restated bylaws also provide that we must advance expenses incurred by or on behalf of a director or officer in advance of the final disposition of any action or proceeding, subject to very limited exceptions.
Further, we have entered into indemnification agreements with each of our directors and executive officers that may be broader than the specific indemnification provisions contained in the Delaware General Corporation Law. These indemnification agreements require us, among other things, to indemnify our directors and executive officers against liabilities that may arise by reason of their status or service. These indemnification agreements also require us to advance all expenses incurred by the directors and executive officers in investigating or defending any such action, suit, or proceeding. We believe that these agreements are necessary to attract and retain qualified individuals to serve as directors and executive officers.
The limitation of liability and indemnification provisions that are included in our amended and restated certificate of incorporation, amended restated bylaws, and in indemnification agreements that we entered into with our directors and executive officers may discourage stockholders from bringing a lawsuit against our directors and executive officers for breach of their fiduciary duties. They may also reduce the likelihood of derivative litigation against our directors and executive officers, even though an action, if successful, might benefit us and other stockholders. Further, a stockholder’s investment may be adversely affected to the extent that we pay the costs of settlement and damage awards against directors and executive officers as required by these indemnification provisions. At present, we are not aware of any pending litigation or proceeding involving any person who is or was one of our directors, officers, employees or other agents or is or was serving at our request as a director, officer, employee or agent of another corporation, partnership, joint venture, trust or other enterprise, for which indemnification is sought, and we are not aware of any threatened litigation that may result in claims for indemnification.
We have obtained insurance policies under which, subject to the limitations of the policies, coverage is provided to our directors and executive officers against loss arising from claims made by reason of breach of fiduciary duty or other wrongful acts as a director or executive officer, including claims relating to public securities matters, and to us with respect to payments that may be made by us to these directors and executive officers pursuant to our indemnification obligations or otherwise as a matter of law.
The underwriting agreement filed as Exhibit 1.1 to this registration statement provides for indemnification by the underwriters of the registrant and its officers and directors for certain liabilities arising under the Securities Act and otherwise.
Item 15. Recent Sales of Unregistered Securities
Within the past three years, we made sales of the following unregistered securities (share and per share amounts give effect to the Reverse Stock Split, which was effected by the Company on April 2, 2014):
| • | we granted to our employees, not including our named executive officers, options to purchase an aggregate of 7,979,225 shares of our common stock pursuant to the 2013 Omnibus Incentive Plan at exercise prices ranging from $0.06 to $30.91 per share, with 1,919,791 of these options issued on August 9, 2013 as replacement awards in connection with the Merger; |
| • | we granted to our named executive officers and directors options to purchase an aggregate of 2,859,504 shares of our common stock pursuant to the 2013 Omnibus Incentive Plan at exercise prices ranging from $2.00 to $13.70 per share, with 1,117,241 of these options issued on August 9, 2013 as replacement awards in connection with the Merger; |
| • | we granted options to purchase an aggregate of 38,183 shares of our common stock at exercise prices ranging from $11.50 to $35.31 per share to certain directors pursuant to the 2013 Omnibus Incentive Plan; |
| • | we issued 23,318,580 shares of our common stock and 8,098,430 shares of our convertible preferred stock to GrubHub Holdings Inc. in exchange for all of GrubHub Holdings Inc.’s equity interest on August 8, 2013, pursuant to the Reorganization and Contribution Agreement, dated as of May 19, 2013; and |
II-2
Table of Contents
| • | we issued an aggregate of 1,055,273 shares of common stock to employees, including 146,716 shares repurchased or withheld for tax liabilities and subsequently retired, at exercise prices ranging from $0.06 to $10.82 per share pursuant to exercises of options granted under the 2013 Omnibus Incentive Plan. |
We believe these transactions were exempt from registration under the Securities Act in reliance upon Section 4(2) of the Securities Act or Regulation D promulgated thereunder, or Rule 701 promulgated under Section 3(b) of the Securities Act as transactions by an issuer not involving any public offering or pursuant to benefit plans and contracts relating to compensation as provided under Rule 701. The recipients of the securities in each of these transactions represented their intentions to acquire the securities for investment only and not with a view to or for sale in connection with any distribution thereof, and appropriate legends were placed upon the stock certificates issued in these transactions. All recipients had adequate access, through their relationships with us, to information about GrubHub Inc.
Item 16. Exhibits and Financial Statement Schedules
(a) Exhibits.
See the Exhibit Index on the page immediately following the signature page for a list of exhibits filed as part of this registration statement on Form S-1, which Exhibit Index is incorporated herein by reference.
(b) Financial Statement Schedules.
All schedules are omitted because the required information is either not present, not present in material amounts or is presented within the consolidated financial statements included in the prospectus that is part of this registration statement.
Item 17. Undertakings.
The undersigned registrant hereby undertakes to provide to the underwriters at the closing specified in the underwriting agreement certificates in such denominations and registered in such names as required by the underwriters to permit prompt delivery to each purchaser.
Insofar as indemnification for liabilities arising under the Securities Act may be permitted to directors, officers and controlling persons of the registrant pursuant to the foregoing provisions, or otherwise, the registrant has been advised that in the opinion of the Commission such indemnification is against public policy as expressed in the Securities Act and is, therefore, unenforceable. In the event that a claim for indemnification against such liabilities (other than the payment by the registrant of expenses incurred or paid by a director, officer or controlling person of the registrant in the successful defense of any action, suit or proceeding) is asserted by such director, officer or controlling person in connection with the securities being registered, the registrant will, unless in the opinion of its counsel the matter has been settled by controlling precedent, submit to a court of appropriate jurisdiction the question whether such indemnification by it is against public policy as expressed in the Securities Act and will be governed by the final adjudication of such issue.
The undersigned registrant hereby undertakes that:
| (1) | For the purposes of determining any liability under the Securities Act of 1933, the information omitted from the form of prospectus filed as part of this registration statement in reliance upon Rule 430A and contained in a form of prospectus filed by the registrant pursuant to Rule 424(b)(1) or (4) or 497(h) under the Securities Act shall be deemed to be part of this registration statement as of the time it was declared effective. |
| (2) | For the purpose of determining any liability under the Securities Act of 1933, each post-effective amendment that contains a form of prospectus shall be deemed to be a new registration statement relating to the securities offered therein, and the offering of such securities at that time shall be deemed to be the initial bona fide offering thereof. |
II-3
Table of Contents
SIGNATURES
Pursuant to the requirements of the Securities Act of 1933, the registrant certifies that it has duly caused this registration statement to be signed on its behalf by the undersigned, thereunto duly authorized, in the City of Chicago, Illinois on September 2, 2014.
| GRUBHUB INC. | ||
| By: |
/s/ Adam DeWitt | |
| Name: Adam DeWitt Title: Chief Financial Officer | ||
II-4
Table of Contents
Pursuant to the requirements of the Securities Act of 1933, as amended, this Registration Statement on Form S-1 has been signed by the following persons in the capacities and on the dates indicated.
| Name |
Title |
Date | ||
| * Matthew Maloney |
Chief Executive Officer and Director (Principal Executive Officer) |
September 2, 2014
| ||
| /s/ Adam DeWitt Adam DeWitt |
Chief Financial Officer (Principal Financial Officer and Principal Accounting Officer) |
September 2, 2014
| ||
| * Jonathan Zabusky |
President and Director | September 2, 2014 | ||
| * David Fisher |
Director | September 2, 2014 | ||
| * Brian McAndrews |
Director | September 2, 2014 | ||
| * Lloyd Frink |
Director | September 2, 2014 | ||
| * J. William Gurley |
Director | September 2, 2014 | ||
| * Justin Sadrian |
Director | September 2, 2014 | ||
| * Benjamin Spero |
Director | September 2, 2014 | ||
| *By | /s/ Adam DeWitt | |
| Adam DeWitt | ||
| Attorney-in-Fact | ||
II-5
Table of Contents
EXHIBIT LIST
| Incorporated by Reference | ||||||||||||
| Exhibit |
Description |
Form | File No. | Exhibit | Filing Date | |||||||
| 1.1 | ** | Form of Underwriting Agreement. | ||||||||||
| 3.1 | Amended and Restated Certificate of Incorporation of GrubHub Inc. | 10-Q | 001-36389 | 3.1 | August 7, 2014 | |||||||
| 3.2 | Amended and Restated By-laws of GrubHub Inc. | 10-Q | 001-36389 | 3.2 | August 7, 2014 | |||||||
| 4.1 | Form of common stock certificate of the Registrant. | S-1/A | 333-194219 | 4.1 | March 20, 2014 | |||||||
| 5.1 | * | Opinion of Kirkland & Ellis LLP. | ||||||||||
| 10.1 | Registration Rights Agreement, dated August 8, 2013 by and among GrubHub Inc. (f/k/a GrubHub Seamless Inc. f/k/a Seamless GrubHub Holdings Inc.) and certain stockholders listed therein. | S-1/A | 333-194219 | 10.1 | March 14, 2014 | |||||||
| 10.2 | Tax Matters Agreement, dated May 19, 2013, by and among GrubHub Holdings, Inc. Seamless Holdings Corporation and Aramark Holdings Corporation. | S-1/A | 333-194219 | 10.2 | March 14, 2014 | |||||||
| 10.3 | Assurance of Discontinuance (Assurance Agreement), dated August 2, 2013, by and among the New York Attorney General’s Office and Seamless North America, LLC and GrubHub Holdings Inc. (f/k/a GrubHub, Inc.). | S-1/A | 333-194219 | 10.3 | February 18, 2014 | |||||||
| 10.4 | Stockholders’ Agreement of Seamless GrubHub Holdings Inc., dated as of May 19, 2013, as amended on August 8, 2013 by and between Seamless GrubHub Holdings Inc. and certain stockholders listed therein. | S-1/A | 333-194219 | 10.4 | February 18, 2014 | |||||||
| 10.5 | First Amendment to Stockholders’ Agreement of GrubHub Holdings Inc., dated as of August 8, 2013 by and between Seamless GrubHub Holdings Inc. and certain stockholders listed therein. | S-1/A | 333-194219 | 10.5 | February 18, 2014 | |||||||
| 10.6 | Second Amendment to Stockholders’ Agreement of GrubHub Holdings Inc., dated as of February 7, 2014 by and between Seamless GrubHub Holdings Inc. and certain stockholders listed therein. | S-1/A | 333-194219 | 10.6 | February 18, 2014 | |||||||
| 10.7 | Reorganization and Contribution Agreement, dated May 19, 2013, by and among Seamless North America, LLC, GrubHub Inc. (f/k/a GrubHub Seamless Inc.), GrubHub Holdings Inc. (f/k/a GrubHub, Inc.), Pizza 1 Co., Pizza 2 Co., SLW Investor, LLC and Seamless Holdings Corporation. | S-1/A | 333-194219 | 10.7 | March 14, 2014 | |||||||
| 10.8† | Employment Agreement between GrubHub Holdings Inc. (f/k/a GrubHub, Inc.) and Matthew Maloney, dated as of May 19, 2013. | S-1/A | 333-194219 | 10.8 | February 18, 2014 | |||||||
Table of Contents
| Incorporated by Reference | ||||||||||||
| Exhibit |
Description |
Form | File No. | Exhibit | Filing Date | |||||||
| 10.9† | Employment Agreement between GrubHub Holdings Inc. (f/k/a GrubHub, Inc.) and Matthew Maloney, dated as of March 9, 2009. | S-1/A | 333-194219 | 10.9 | February 18, 2014 | |||||||
| 10.10† | Employment Agreement between GrubHub Holdings Inc. (f/k/a GrubHub, Inc.) and Adam DeWitt, dated as of May 19, 2013. | S-1/A | 333-194219 | 10.10 | February 18, 2014 | |||||||
| 10.11† | Employment Offer Letter between GrubHub Holdings Inc. (f/k/a GrubHub, Inc.) and Adam DeWitt, dated October 17, 2011. | S-1/A | 333-194219 | 10.11 | February 18, 2014 | |||||||
| 10.12† | Protective Agreement and Agreement Not To Compete between GrubHub Holdings Inc. (f/k/a GrubHub, Inc.) and Adam DeWitt, dated as of October 7, 2011. | S-1/A | 333-194219 | 10.12 | February 18, 2014 | |||||||
| 10.13† | Employment Agreement between GrubHub Holdings Inc. (f/k/a GrubHub, Inc.) and Michael Evans, dated as of May 22, 2013. | S-1/A | 333-194219 | 10.13 | February 18, 2014 | |||||||
| 10.14† | Employment Agreement between GrubHub Holdings Inc. (f/k/a GrubHub, Inc.) and Michael Evans, dated as of March 9, 2009. | S-1/A | 333-194219 | 10.14 | February 18, 2014 | |||||||
| 10.15† | GrubHub Inc. (f/k/a GrubHub Seamless Inc.) 2013 Omnibus Incentive Plan. | S-1/A | 333-194219 | 10.15 | February 18, 2014 | |||||||
| 10.16† | Stock Option Grant Notice and Stock Option Agreement between GrubHub Inc. (f/k/a GrubHub Seamless Inc.) and Matthew Maloney, granted in replacement of options originally granted on April 23, 2012. | S-1/A | 333-194219 | 10.16 | February 18, 2014 | |||||||
| 10.17† | Stock Option Grant Notice and Stock Option Agreement between GrubHub Inc. (f/k/a GrubHub Seamless Inc.) and Matthew Maloney, granted in replacement of options originally granted on July 26, 2012. | S-1/A | 333-194219 | 10.17 | February 18, 2014 | |||||||
| 10.18† | Stock Option Grant Notice and Stock Option Agreement between GrubHub Inc. (f/k/a GrubHub Seamless Inc.) and Matthew Maloney, granted in replacement of options originally granted on November 16, 2012. | S-1/A | 333-194219 | 10.18 | February 18, 2014 | |||||||
| 10.19† | Stock Option Grant Notice and Stock Option Agreement between GrubHub Inc. (f/k/a GrubHub Seamless Inc.) and Matthew Maloney, granted in replacement of options originally granted on January 28, 2013. | S-1/A | 333-194219 | 10.19 | February 18, 2014 | |||||||
| 10.20† | Stock Option Grant Notice and Stock Option Agreement between GrubHub Inc. (f/k/a GrubHub Seamless Inc.) and Matthew Maloney, granted in replacement of options originally granted on March 12, 2013. | S-1/A | 333-194219 | 10.20 | February 18, 2014 | |||||||
Table of Contents
| Incorporated by Reference | ||||||||||||
| Exhibit |
Description |
Form | File No. | Exhibit | Filing Date | |||||||
| 10.21† | Stock Option Grant Notice and Stock Option Agreement between GrubHub Inc. (f/k/a GrubHub Seamless Inc.) and Adam DeWitt, granted in replacement of options originally granted on December 7, 2011. | S-1/A | 333-194219 | 10.21 | February 18, 2014 | |||||||
| 10.22† | Stock Option Grant Notice and Stock Option Agreement between GrubHub Inc. (f/k/a GrubHub Seamless Inc.) and Adam DeWitt, granted in replacement of options originally granted on December 7, 2011. | S-1/A | 333-194219 | 10.22 | February 18, 2014 | |||||||
| 10.23† | Stock Option Grant Notice and Stock Option Agreement between GrubHub Inc. (f/k/a GrubHub Seamless Inc.) and Adam DeWitt, granted in replacement of options originally granted on April 23, 2012. | S-1/A | 333-194219 | 10.23 | February 18, 2014 | |||||||
| 10.24† | Stock Option Grant Notice and Stock Option Agreement between GrubHub Inc. (f/k/a GrubHub Seamless Inc.) and Adam DeWitt, granted in replacement of options originally granted on July 26, 2012. | S-1/A | 333-194219 | 10.24 | February 18, 2014 | |||||||
| 10.25† | Stock Option Grant Notice and Stock Option Agreement between GrubHub Inc. (f/k/a GrubHub Seamless Inc.) and Adam DeWitt, granted in replacement of options originally granted on November 16, 2012. | S-1/A | 333-194219 | 10.25 | February 18, 2014 | |||||||
| 10.26† | Stock Option Grant Notice and Stock Option Agreement between GrubHub Inc. (f/k/a GrubHub Seamless Inc.) and Adam DeWitt, granted in replacement of options originally granted on March 12, 2013. | S-1/A | 333-194219 | 10.26 | February 18, 2014 | |||||||
| 10.27† | Stock Option Grant Notice and Stock Option Agreement between GrubHub Inc. (f/k/a GrubHub Seamless Inc.) and Michael Evans, granted in replacement of options originally granted on April 23, 2012. | S-1/A | 333-194219 | 10.27 | February 18, 2014 | |||||||
| 10.28† | Stock Option Grant Notice and Stock Option Agreement between GrubHub Inc. (f/k/a GrubHub Seamless Inc.) and Michael Evans, granted in replacement of options originally granted on July 26, 2012. | S-1/A | 333-194219 | 10.28 | February 18, 2014 | |||||||
| 10.29† | Stock Option Grant Notice and Stock Option Agreement between GrubHub Inc. (f/k/a GrubHub Seamless Inc.) and Michael Evans, granted in replacement of options originally granted on November 16, 2012. | S-1/A | 333-194219 | 10.29 | February 18, 2014 | |||||||
Table of Contents
| Incorporated by Reference | ||||||||||||
| Exhibit |
Description |
Form | File No. | Exhibit | Filing Date | |||||||
| 10.30† | Stock Option Grant Notice and Stock Option Agreement between GrubHub Inc. (f/k/a GrubHub Seamless Inc.) and Michael Evans, granted in replacement of options originally granted on January 28, 2013. | S-1/A | 333-194219 | 10.30 | February 18, 2014 | |||||||
| 10.31† | Stock Option Grant Notice and Stock Option Agreement between GrubHub Inc. (f/k/a GrubHub Seamless Inc.) and Michael Evans, granted in replacement of options originally granted on March 12, 2013. | S-1/A | 333-194219 | 10.31 | February 18, 2014 | |||||||
| 10.32† | Employment Offer Letter between SeamlessWeb Professional Solutions, LLC and Jonathan H. Zabusky, dated as of June 6, 2011. | S-1/A | 333-194219 | 10.32 | February 18, 2014 | |||||||
| 10.33† | Agreement Relating to Employment and Post-Employment Competition between SeamlessWeb Professional Solutions, LLC and Jonathan H. Zabusky, dated as of June 6, 2011. | S-1/A | 333-194219 | 10.33 | February 18, 2014 | |||||||
| 10.34† | Transaction and Severance Benefits Letter between Seamless North America, LLC and Jonathan H. Zabusky, dated as of May 13, 2013. | S-1/A | 333-194219 | 10.34 | February 18, 2014 | |||||||
| 10.35† | Stock Option Grant Notice and Stock Option Agreement between GrubHub Inc. (f/k/a GrubHub Seamless Inc.) and Jonathan H. Zabusky, granted in substitution of options originally granted on September 13, 2011. | S-1/A | 333-194219 | 10.35 | February 18, 2014 | |||||||
| 10.36† | Stock Option Grant Notice and Stock Option Agreement between GrubHub Inc. (f/k/a GrubHub Seamless Inc.) and Jonathan H. Zabusky, granted in substitution of options originally granted on November 15, 2012. | S-1/A | 333-194219 | 10.36 | February 18, 2014 | |||||||
| 10.37† | Employee Restricted Stock Purchase Agreement, dated November 3, 2010, by and between GrubHub Holdings Inc. (f/k/a GrubHub, Inc.) and Michael Evans. | S-1/A | 333-194219 | 10.37 | February 18, 2014 | |||||||
| 10.38† | Employee Restricted Stock Purchase Agreement, dated November 3, 2010, by and between GrubHub Holdings Inc. (f/k/a GrubHub, Inc.) and Matthew Maloney. | S-1/A | 333-194219 | 10.38 | February 18, 2014 | |||||||
| 10.39† | Note Cancellation and Stock Repurchase Agreement, dated December 21, 2012, by and between GrubHub Holdings Inc. (f/k/a GrubHub, Inc.), Matthew Maloney and Matt and Holly Maloney Family Limited. | S-1/A | 333-194219 | 10.39 | February 18, 2014 | |||||||
| 10.40† | Note Cancellation and Stock Repurchase Agreement, dated December 21, 2012, by and between GrubHub Holdings Inc. (f/k/a GrubHub, Inc.) and Michael Evans. | S-1/A | 333-194219 | 10.40 | February 18, 2014 | |||||||
Table of Contents
| Incorporated by Reference | ||||||||||
| Exhibit |
Description |
Form | File No. | Exhibit | Filing Date | |||||
| 10.41† | Stock Option Grant Notice and Stock Option Agreement between GrubHub Inc. (f/k/a GrubHub Seamless Inc.) and Matthew Maloney, granted in |
S-1/A | 333-194219 | 10.41 | February 28, 2014 | |||||
| 10.42† | Stock Option Grant Notice and Stock Option Agreement between GrubHub Inc. (f/k/a GrubHub Seamless Inc.) and Adam DeWitt, granted in |
S-1/A | 333-194219 | 10.42 | February 28, 2014 | |||||
| 10.43† | Stock Option Grant Notice and Stock Option Agreement between GrubHub Inc. (f/k/a GrubHub Seamless Inc.) and Jonathan Zabusky, granted in |
S-1/A | 333-194219 | 10.43 | February 28, 2014 | |||||
| 10.44 | Form of Indemnification Agreement |
S-1/A | 333-194219 | 10.44 | April 3, 2014 | |||||
| 21.1 | List of Subsidiaries of the Registrant. | S-1/A | 333-194219 | 21.1 | March 14, 2014 | |||||
| 23.1 |
Consent of Crowe Horwath LLP, independent registered public accounting firm. | |||||||||
| 23.2 |
Consent of Crowe Horwath LLP, independent registered public accounting firm. | |||||||||
| 23.3 |
Consent of Kirkland & Ellis LLP (included in Exhibit 5.1). | |||||||||
| 24.1 |
Power of Attorney (included on the signature page of this Registration Statement). | |||||||||
| 101.INS**†† | XBRL Instance Document. | |||||||||
| 101.SCH**†† | XBRL Taxonomy Extension Schema. | |||||||||
| 101.CAL**†† | XBRL Taxonomy Extension Calculation Linkbase. | |||||||||
| 101.LAB**†† | XBRL Taxonomy Extension Label Linkbase. | |||||||||
| 101.PRE**†† | XBRL Taxonomy Extension Presentation Linkbase. | |||||||||
| 101.DEF**†† | XBRL Taxonomy Extension Definition Linkbase. | |||||||||
| * | Filed herewith |
| ** |
| † | Indicates a management contract or compensatory plan |
| †† | XBRL (Extensible Business Reporting Language) information is furnished and not filed or a part of a registration statement or prospectus for purposes of Sections 11 or 12 of the Securities Act of 1933, as amended, is deemed not filed for purposes of Section 18 of the Securities Exchange Act of 1934, as amended, and is not otherwise subject to liability under these sections. |