Attached files
| file | filename |
|---|---|
| 8-K - FORM 8-K - Glori Energy Inc. | v388187_8k.htm |
Exhibit 99.1

Corporate Presentation September 2014

Confidential Forward Looking Statements 1 Any statements contained herein which are not statements of historical fact may be deemed to be forward - looking statements, including, without limitation, statements identified by or containing words like “believes,” “expects,” “anticipates,” “intends,” “estimates,” “projects,” “potential,” “target,” “goal,” “plans,” “objective,” “should”, or similar expressions . All statements by us regarding our possible or assumed future results of our business, financial condition, liquidity, results of operations, plans and objectives and similar matters are forward - looking statements . Glori gives no assurances that the assumptions upon which such forward - looking statements are based will prove correct . Forward - looking statements are not guarantees of future performance and involve risks, uncertainties and assumptions (many of which are beyond our control), and are based on information currently available to us . Actual results may differ materially from those expressed herein due to many factors, including, without limitation : the risk that any projections, including earnings, revenues, expenses, margins, or any other financial expectations are not realized ; competition and competitive factors in the markets in which Glori operates ; the expected cost of recovering oil using the AERO System, demand for Glori’s AERO System and expectations regarding future projects ; adaptability of the AERO System and development of additional capabilities that will expand the types of oil fields to which Glori can apply its technology ; plans to acquire and develop additional oil fields and the availability of debt and equity financing to fund any such acquisitions ; the percentage of the world’s reservoirs that are suitable for the AERO System ; the advantages of the AERO System compared to other enhanced oil recovery methods ; and Glori’s ability to develop and maintain positive relationships with its customers and prospective customers . Although Glori believes that the expectations reflected in such forward looking statements are reasonable, it can give no assurances that such expectations will prove to be correct . These risks are more fully discussed in Glori’s filings with the Securities and Exchange Commission . Glori undertakes no obligation to update any forward - looking statements contained herein to reflect events or circumstances, which arise after the date of this document except as required by law .

Confidential Opportunity Overview 2 Glori Energy is an energy technology company that deploys its proprietary biotechnology to enhance recovery of oil from producing reservoirs 2/3 of discovered oil remains in the reservoir after using today’s conventional oil and gas development technologies 2.4 trillion barrels of unrecovered reserves (1) _____________________ (1) Source : EIA International Energy Annual Report 2006 . Glori Energy technology can improve cash flow by 80% with just a 30% increase in production

Confidential TECHNOLOGY 3

Confidential “Spectacular results have been recorded by Statoil at its Norne Field in the Norwegian North Sea. Following 25 years of research and development (R&D) and deployment, the recovery factor at Norne is approaching 55%. More than 30 MMbbl of additional produced oil has been attributed to the applied microbial EOR (AMEOR) program there . In Russia, the Winogradsky Institute of Biotechnology has done decades of work with the objective of harnessing the power of microbes to improve production. Biotopics in Argentina has had 20 years of experience in the area. And the Energy Resource Institute (TERI) in India is a derivative of the huge TATA Corp. All are energized by the aspect of recovering a significant fraction of crude oil left behind by initial production methods . A North American company has benefited from all this R&D by mining the above sources for the most successful techniques ” Offshore Magazine June 2014
Confidential AERO Has Received Multiple Awards F or Innovation 5

Confidential How it Works 6 Post - AERO™ Technology Injection well with AERO™ technology New water pathways Newly dislodged oil New water flow Sand grains Microbial nutrients _____________________ Source: Company data. Pre - AERO™ Technology Sand grains Trapped oil Water pathway Injection well Production Output Production Cost Total Cost: $70 + $6 = $76 Average Cost / Bbl: $25.33 Production Output Production Cost Total Cost: $70 Average Cost / Bbl: $35.00

Confidential Model Return Potential 7 A Pre - AERO Production B Projected Production without AERO C Incremental Production due to AERO Today Time Economic Limit Barrels of Oil per Day Log Scale A B C AERO Start Projected Original Oil Projected Additional Oil Post - AERO Start Comparative Production: Production without AERO: B = 1,500 Mbbls Production due to AERO: B + C = 3,300 Mbbls Illustrative Impact of AERO TM Technology B = 1,500 Mbbls C = 1,800 Mbbls _____________________ Source: Company estimates for illustrative purposes only.

Confidential $92 $80 $50 $32 $6 $0 $10 $20 $30 $40 $50 $60 $70 $80 $90 $100 Non-OPEC Marginal Cost Fracking / Horizontal Drilling Mainstream EOR USA AERO Biology Is Low Cost 8 _____________________ (1) Source: Company data. (2) Source: Mackenzie, Kate. “Marginal Oil Costs are Heading Towards $100/barrel.” FT Alphaville , May 2, 2012. http://talphaville.ft.com/2012/05/02/983171/marginal - oil - production - costs - are - heading - towards - 100barrel/. Estimated Production Costs Per Barrel ($ / bbl ) Low CAPEX (typical pilot expenditure $100k) + Low OPEX (ultra low concentration nutrients) = Low Risk

Confidential INTELLECTUAL PROPERTY 9

Confidential Technology & Statoil Collaboration 10 Glori Energy Ownership of Jointly Developed IP Statoil ASA ( OB: STL) • International public energy company with ~$92 billion market capitalization (1) • Winner of the National Petroleum Directorate IOR award in 2001 Deployment at Norne field anticipated to increase production by up to 30 million barrels Glori / Statoil strategic partnership facilitates an accelerated technology development cycle to optimize biotech - based EOR _____________________ (1) As of close on August 30, 2014. U nrestricted Restricted to owned assets Perpetual Irrevocable Royalty - Free License to IP

Confidential Key AERO Patent – Systems and Methods of Microbial Enhanced Oil Recovery • R eceived notice of allowance July 23, 2014 • Will be issued September 9 th • Owned by Glori. License to Statoil • Inventors: Glori & Statoil personnel Microbial Enhanced Oil Recovery Delivery Systems and Methods (Capillary Delivery ), US Patent 8,783,345 issued July 22, 2014 • Owned by Glori. License to Statoil • Inventors: Glori personnel Additional IP filed • U.S. Appl. No. 13/826827 (Ultra Low Concentration Surfactant Flooding, filed 3/14/13), and U.S. Appl. No. 13/827639 (Optimizing Enhanced Oil Recovery by the Use of Oil Tracers, filed 3/14/13) Strong Intellectual Property Protection 11

Confidential FIELD PERFORMANCE 12

Confidential AERO Implementation Data 13 -20% 30% 80% 130% 180% 230% 280% 330% 380% -1000 -800 -600 -400 -200 0 200 400 600 800 1000 Percent Uplift Days Relative to AERO Start Linear Regression Applied to Data Before AERO and During AERO Implementation Project A Linear (Pre-AERO) Linear (AERO Active) Production from a single responding well is shown

Confidential AERO Implementation Data 14 -20% -10% 0% 10% 20% 30% 40% 50% 60% -160 -110 -60 -10 40 90 140 190 Percent Uplift Days Relative to AERO Start Linear Regression Applied to Data During AERO Implementation Project B Data Full Field: AERO Applied to Only =20% of Field Linear (AERO Active) Percent uplift, full field, measured against the client's stated baseline

Confidential AERO Implementation Data 15 -20% 0% 20% 40% 60% 80% 100% 120% -250 -200 -150 -100 -50 0 50 100 150 200 250 Percent Uplift Days Relative to AERO Start Linear Regression Applied to Data Before AERO and During AERO Implementation Project C Linear (Pre-AERO) Percent uplift measured against the 243 - day exponential decline prior to AERO start

Confidential AERO Implementation Data 16 -20% 0% 20% 40% 60% 80% 100% 120% -250 -150 -50 50 150 250 350 450 550 650 750 Percent Uplift Days Relative to AERO Start Linear Regression Applied to Data Before AERO and During AERO Implementation Project D Linear (AERO Active) Linear (Series1) Percent uplift measured against the 250 - day exponential decline prior to AERO start

Confidential AERO Implementation Data 17 0% 50% 100% 150% 200% 250% 300% 350% 400% -1000 -800 -600 -400 -200 0 200 400 600 Percent Uplift Days Relative to AERO Start Linear Regression Applied to Data Before AERO and During AERO Implementation Project E Linear (Pre-AERO) Percent uplift measured against the 1897 - day exponential decline prior to AERO start

Confidential AERO Implementation Data 18 -20% 0% 20% 40% 60% 80% 100% 120% -400 -200 0 200 400 600 800 Percent Uplift Days Relative to AERO Start Linear Regression Applied to Data Before AERO and During AERO Implementation Project F Data Full Field: AERO Applied to Only =10% of Field Linear (Pre-AERO) Linear (AERO on) Full field data are shown as p ercent uplift measured against the 333 - day exponential decline prior to AERO start AERO was applied to less than 10% of the total field injection

Confidential Glori In The Field In Brazil 19

Confidential BUSINESS MODEL

Confidential Synergistic Dual Business Model 21 Oil Operations: Acquisition and operation of producing oil fields, upgrading with AERO technology • East Texas Coke field acquisition • Potential 35% - 40 % IRR from PV8 acquisition AERO Technology as a service: deployment of technology for oil and gas companies around the world under fee for services agreements • US & Canada • Brazil

Confidential Global Market Services Model 22

Confidential Coke Field Acquisition (closed March 14, 2014) 23 Coke + Quitman Fields • 28 wells • Estimated 19 years reserves to production ratio • 3 producing horizons - Paluxy , Sub - Clarksville, Young. • Proved reserves of approximately 2.8 MM Boe of which 56% are proved developed producing • Highly experienced operations personnel retained • Well suited to benefit from AERO implementation Coke Paluxy Formation – Main Aero Target • Anticline Structure • 76 mmbbl OOIP • Sandstone with good permeability Coke Paluxy Structure Map:

Confidential Production at Coke is ahead of forecast Multiple failures and maintenance challenges in Q2 caused loss in production and increased expenses Maintenance enabled upgrades where appropriate to improve performance going forward Glori engineers are now focused on conventional production enhancements Unitization anticipated complete at year end – AERO will start Coke Operations Performing Well 24

Confidential Coke Field Acquired 3/14/2014 Demonstrates Return Potential and Economics 25 6 16 3 2 5 COKE EBITDA OPERATIONS IMPROVEMENT (CURRENT) OPERATIONS IMPROVEMENT (PLANNED) AERO (PROJECTED) TOTAL Coke Field: PROJECTED EBITDA GROWTH Source: Company estimates for EBITDA contribution. EBITDA is Earnings before Interest, Taxes and Depreciation

Confidential Coke Field Projected Economics 26 Assumptions _____________________ (1) Compares projected base production (PDP reserves) to projected base production after AERO. Does not include other proved unde vel oped reserves. (2) Includes development of conventional Proved Undeveloped Reserves and AERO full field implementation. (3) Multiple of Invested Capital (MOIC) calculated based on the ratio of cumulative cash flows to the initial equity investment. ($ in millions) Cash Acquisition Cost: $38.0 Oil Price: $90 flat AERO Start: AERO field - wide implementation in Q4 2014 completed 1H 2015 Year 5 Exit EBITDA Multiple: 4.5x Projected Base Production (1) Projected with AERO (1) AERO & PUD Development (2) Year 1 – 5 Projected Cumulative Operating Metrics Net Production (Mbbls) 640 1,002 1,194 Revenue $52.8 $85.4 $102.4 EBITDA $28.6 $58.6 $72.3 Acquisition Returns Analysis with AERO Production MOIC (3) 1.2x 3.3x 4.0x Projected IRR (Unlevered) 7.6% 38.5% 42.8%
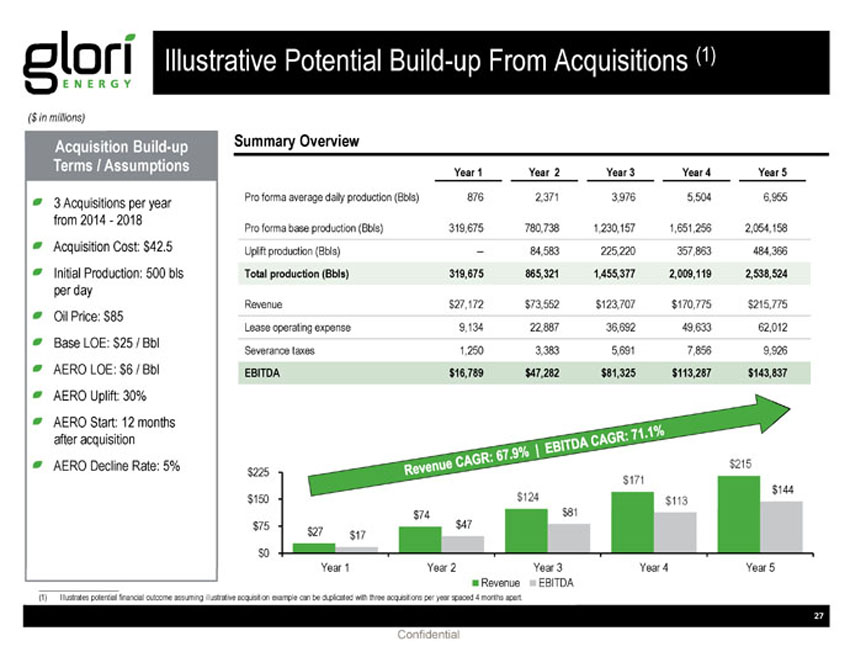
Confidential Illustrative Potential Build - up From Acquisitions (1) 27 Acquisition Build - up Terms / Assumptions _____________________ (1) Illustrates potential financial outcome assuming illustrative acquisition example can be duplicated with three acquisitions p er year spaced 4 months apart. ($ in millions) $27 $74 $124 $171 $215 $17 $47 $81 $113 $144 $0 $75 $150 $225 Year 1 Year 2 Year 3 Year 4 Year 5 Revenue EBITDA 3 Acquisitions per year from 2014 - 2018 Acquisition Cost: $42.5 Initial Production: 500 bls per day Oil Price: $85 Base LOE: $25 / Bbl AERO LOE: $6 / Bbl AERO Uplift: 30% AERO Start: 12 months after acquisition AERO Decline Rate: 5% Summary Overview Year 1 Year 2 Year 3 Year 4 Year 5 Pro forma average daily production (Bbls) 876 2,371 3,976 5,504 6,955 Pro forma base production (Bbls) 319,675 780,738 1,230,157 1,651,256 2,054,158 Uplift production (Bbls) – 84,583 225,220 357,863 484,366 Total production (Bbls) 319,675 865,321 1,455,377 2,009,119 2,538,524 Revenue $27,172 $73,552 $123,707 $170,775 $215,775 Lease operating expense 9,134 22,887 36,692 49,633 62,012 Severance taxes 1,250 3,383 5,691 7,856 9,926 EBITDA $16,789 $47,282 $81,325 $113,287 $143,837

Confidential 3 leases from Private Seller at the Coke field Acquisition closed 8/27/2014 27 bopd , net @ approx. $74,000 per flowing barrel Operational synergy opportunity to increase production rates Injection well facilitates AERO for all Coke field Strategic Add - on Acquisition at Coke 28 Acquired Lease Acquired Leases

Confidential FINANCIAL HIGHLIGHTS

Confidential Financial Strategy 30 Deploy capital to acquire mostly producing oil assets to be enhanced by implementing Glori’s AERO technology. Leverage acquisitions with debt secured by Proved reserves and supported by historical cash flow. Benefit from expanding production base, low cost of AERO and growth in revenues and cash flow. Generate additional cash and upside from momentum achieved from new high - margin client contracts Achievement of milestones from acquisitions, deployment of technology on owned fields and new service contracts create opportunities for value creation.
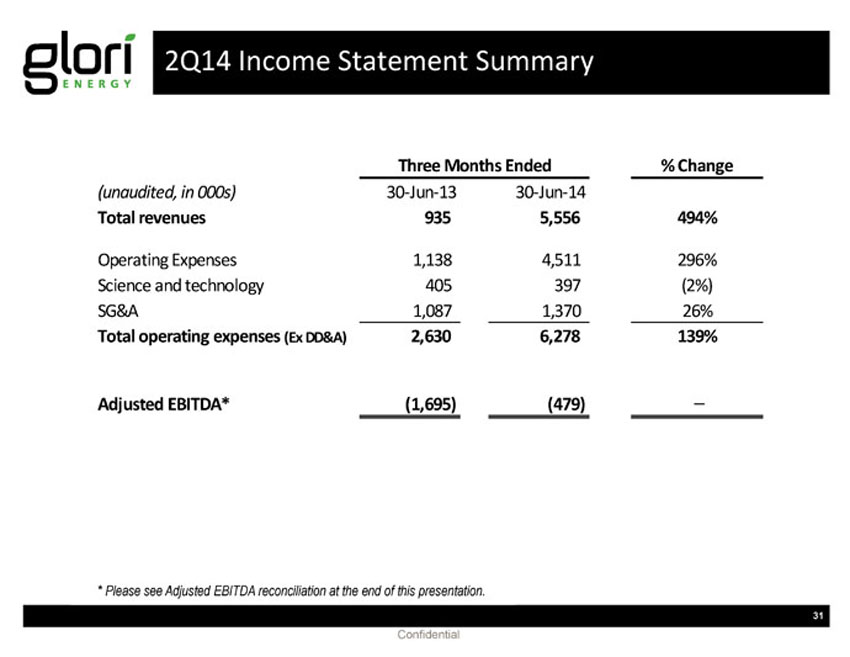
Confidential 2Q14 Income Statement Summary 31 * Please see Adjusted EBITDA reconciliation at the end of this presentation. (unaudited, in 000s) 30-Jun-13 30-Jun-14 Total revenues 935 5,556 494% Operating Expenses 1,138 4,511 296% Science and technology 405 397 (2%) SG&A 1,087 1,370 26% Total operating expenses (Ex DD&A) 2,630 6,278 139% Adjusted EBITDA* (1,695) (479) – Three Months Ended % Change

Confidential Summary Balance Sheet 32 (In millions) June 30, 2014 Cash $38.2 Debt 21.5 Net Debt (16.7) Stockholders'equity 53.0 Total Assets $82.7 Debt/Cap 29%

Confidential E&P Innovation Trends: The Path to Mass Adoption 1972 : First CO 2 EOR project initiated in West Texas 2001: DNR pursues CO 2 EOR growth strategy via acquisition of oil fields 1989: Oryx Energy significantly expands horizontal drilling activities in South Texas region 1920: Horizontal drilling first used to increase production 1985 : Oryx Energy begins horizontal drilling 1990 : NFX begins using 3D seismic to aid production in Gulf of Mexico 1963 : 3D seismic pioneered at research arm of large oil firm 1995: NFX expands significantly onshore, applying 3D seismic technology R&D / Technology Innovation First Mover Begins Adopting Technology First Mover Employs Growth Strategy Market Response to Mass Adoption 1999: DNR begins adopting CO 2 EOR project _____________________ Source: SEC Filings, company disclosures and Capital IQ as of January 24, 2014. Note: Tickers are used for publicly traded companies: Chesapeake Energy (CHK), Denburry Resources (DNR), Newfield Exploration (NFX) and Royal Dutch Shell (RDSA). 3D Seismic MEOR 2008: DNR grows market capitalization 14x from 2001 1990: Success leads to a $2 billion increase in market capitalization in one year 2001: NFX market capitalization grows at a 35.2% CAGR from 1995 1978: Modern version of deepwater drilling is first pioneered off the Gulf of Mexico 1947: Fracking first experimented by Stanolind Oil 1995: RDSA continues investing in deepwater drilling operations , setting water depth record 1993: RDSA establishes world’s deepest underwater drilling platform (Auger) 2003: RDSA adds $130 billion in revenue from 1995 2000: CHK diversifies production strategy and expands fracking operations 1994: CHK applies fracking techniques to drive production in Texas 2006: CHK grows revenue 47x from 2000 2014: Glori begins growth strategy of acquiring and operating oil fields 1980: MEOR (microbial enhanced oil recovery) developed from laboratory - based studies 2009: Glori enters into technology cooperation agreement with Statoil TBD Developed over Decades Growth Strategy Implemented within Several Years Fracking CO 2 EOR Deepwater Drilling Rapid Commercialization Horizontal Drilling 33

Confidential Experienced Management, Board, Advisors & Investors Proven & Proprietary Technology Compelling Unit Economics More Oil From Yesterday’s Wells Summary Highlights 34 Robust Acquisition Pipeline Generating Attractive Returns Large and Growing Market
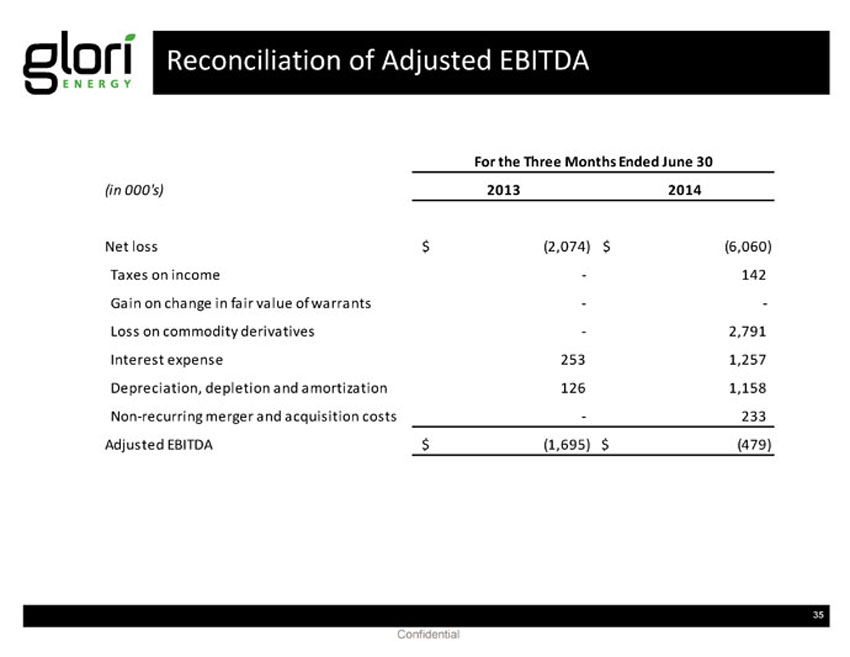
Confidential Reconciliation of Adjusted EBITDA 35 (in 000's) Net loss Taxes on income - 142 Gain on change in fair value of warrants - - Loss on commodity derivatives - 2,791 Interest expense 253 1,257 Depreciation, depletion and amortization 126 1,158 Non-recurring merger and acquisition costs - 233 Adjusted EBITDA (1,695)$ (479)$ 2013 2014 (2,074)$ (6,060)$ For the Three Months Ended June 30

Confidential Non GAAP Financial Information We use both GAAP and certain non - GAAP financial measures to assess performance . Generally, a non - GAAP financial measure is a numerical measure of a company’s performance, financial position or cash flows that either excludes or includes amounts that are not normally excluded or included in the most directly comparable measure calculated and presented in accordance with GAAP . Our management believes that these non - GAAP measures provide useful supplemental information to investors in order that they may evaluate our financial performance using the same measures as management . These non - GAAP financial measures should not be considered as a substitute for, or superior to, measures of financial performance prepared in accordance with GAAP . In evaluating these measures, investors should consider that the methodology applied in calculating such measures may differ among companies and analysts . A reconciliation is provided below outlining the differences between these non - GAAP measures and their most directly comparable financial measure calculated in accordance with GAAP . 36