Attached files
| file | filename |
|---|---|
| 8-K - 8-K - Alpha Natural Resources, Inc. | anr8-k09x02x2014investorpr.htm |

[September 2,] 2014 Barclays CEO Energy-Power Conference September 2, 2014
2 Forward-Looking Statements Statements in this presentation which are not statements of historical fact are “forward-looking statements” within the Safe Harbor provision of the Private Securities Litigation Reform Act of 1995. Such statements are not guarantees of future performance. Many factors could cause our actual results, performance or achievements, or industry results, to be materially different from any future results, performance or achievements expressed or implied by such forward looking-statements. These factors are discussed in detail in our Annual Report on Form 10-K, Quarterly Reports on Form 10-Q and in our other filings with the SEC. We make forward-looking statements based on currently available information, and we assume no obligation to update the statements made today or contained in our Annual Report or other filings due to changes in underlying factors, new information, future developments, or otherwise, except as required by law. Third Party Information This presentation, including certain forward-looking statements herein, include information obtained from third party sources that we believe to be reliable. However, we have not independently verified this third party information and cannot assure you of its accuracy or completeness. While we are not aware of any misstatements regarding any third party data contained in this presentation, such data involve risks and uncertainties and are subject to change based on various factors, including those discussed in detail in our Annual Report on Form 10-K, Quarterly Reports on Form 10-Q and in our other filings with the SEC. We assume no obligation to revise or update this third party information to reflect future events or circumstances.

Well Managed and Strategically Diversified Global Producer

4 Moving Alpha Forward • Experienced management team focused on rational portfolio management to mitigate near-term pressure and drive long-term shareholder value creation • Continued focus on managing balance sheet and liquidity - Preserving financial flexibility, maintaining resilience through commodity cycle, and maintaining current credit rating to manage cost of capital • Unique positioning and ability to capitalize on market improvements - $350 million in targeted cost reductions since 2012 have significantly increased operating leverage - Rebalancing portfolio opportunistically during market downturn • Strategically positioned for market upturn or sustained soft markets in metallurgical coal • Active, ongoing commitment to optimizing thermal portfolio - Aggressively managing costs and production of our coal reserves • Early success diversifying into natural gas - Creating value by growing exposure to natural gas while selectively monetizing holdings
5 Experienced Industry Leadership Management Team with Long Track Record and Deep Expertise • Track record of selective growth and conservative balance sheet management through all market cycles • Periodic portfolio reviews to proactively manage Alpha’s operating profile • Demonstrated ability to make difficult proactive decisions during challenging markets conditions - Cost reductions – Operations, SG&A, Capex Demonstrating Industry Leadership • Conducting congressional education and advocacy on all coal-related issues, including proposed GHG rules • Working closely with the Partnership for a Better Energy Future (PBEF) to modify or halt EPA’s GHG rules • Actively working to pass legislative relief at both the federal and state levels • Leadership roles at major trade associations (Chairman, ACCCE; Vice-Chair, NMA and Board Member, WCA) • Encouraging stakeholders and leaders at regional and state levels to engage on local impacts of federal rulemaking

6 Alpha’s Inherent Strengths Operational diversification Leading global supplier Large port capacity Positioned to react nimbly to upturn or continued softness in Met market Aggressive management of Thermal costs and production Effective early diversification into natural gas Prudent liquidity and long-term capital structure management

7 * As of December 31, 2013 Eastern Thermal 42% PRB 11% Metallurgical 47% 2013 Coal Revenue Mix Total $4.3B Eastern Thermal 2.2B tons 51% Metallurgical 1.4B Tons 33% PRB 0.7B tons 16% Coal Reserve Breakdown* Total 4.3B tons * As of December 31, 2013 Operational Diversification – Revenues & Product Mix • One of the strongest reserve positions in the industry with ~4.3 billion tons, including ~1.4 billion tons of metallurgical coal • Well balanced product mix with 47% of 2013 coal revenues from metallurgical coal and 53% from thermal coal • Well balanced revenue mix with 45% of 2013 revenues from export markets

8 Western Coal Operations – 2013 38.2 million tons thermal * As of June 30, 2014 Total Mines: 81* (Underground 56; Surface 25) Prep Plants: 24* Operational Diversification – Geography Eastern Coal Operations – 2013 28.6 million tons thermal 20.1 million tons met

9 ~170 Customers in 29 Countries on 5 Continents Leading Global Supplier Note: All amounts represent full year 2013 shipments in short tons 2013 Total Alpha shipments 86.9 million tons 2013 Total Export shipments 19.5 million tons (14.9 tons Met; 4.6mm tons Thermal) Africa/Middle East 2.1mm tons Met 1.6mm tons Thermal Asia 3.6mm tons Met 0.3mm tons Thermal Europe 6.8mm tons Met 2.6mm tons Thermal South America 1.3mm tons Met 0.1mm tons Thermal Canada/Mexico 1.1mm tons Met
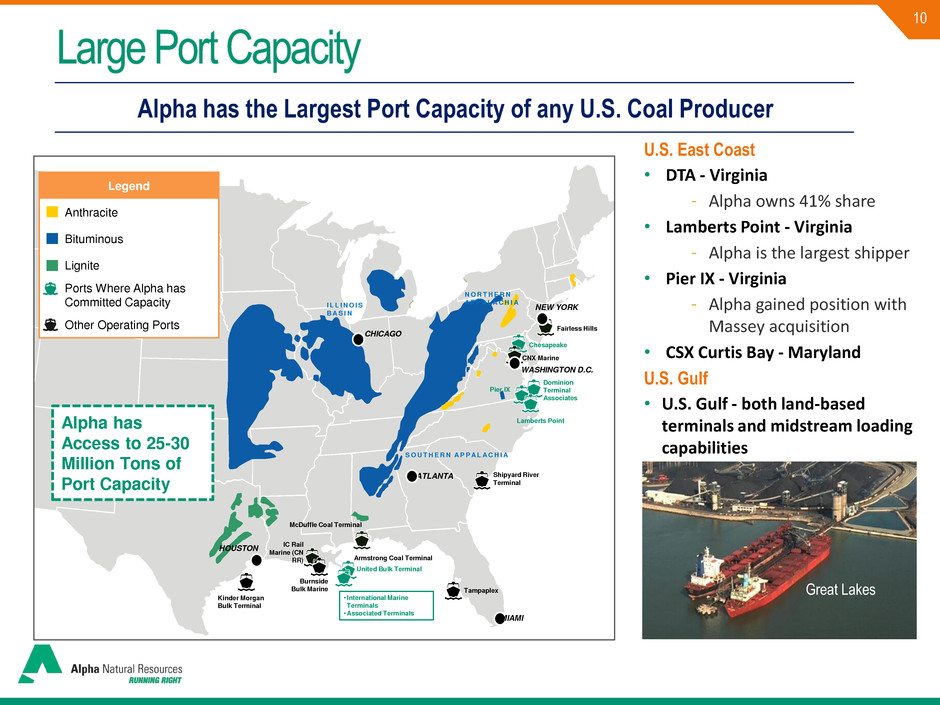
10 U.S. East Coast • DTA - Virginia - Alpha owns 41% share • Lamberts Point - Virginia - Alpha is the largest shipper • Pier IX - Virginia - Alpha gained position with Massey acquisition • CSX Curtis Bay - Maryland U.S. Gulf • U.S. Gulf - both land-based terminals and midstream loading capabilities Alpha has the Largest Port Capacity of any U.S. Coal Producer Large Port Capacity Great Lakes CHICAGO Kinder Morgan Bulk Terminal IC Rail Marine (CN RR) Armstrong Coal Terminal United Bulk Terminal Tampaplex Shipyard River Terminal Lamberts Point Dominion Terminal Associates Pier IX Chesapeake Fairless Hills CNX Marine Burnside Bulk Marine NEW YORK WASHINGTON D.C. ATLANTA MIAMI HOUSTON I L L I N O I S B A S I N N O R T H E R N A P P A L A C H I A S O U T H E R N A P P A L A C H I A McDuffle Coal Terminal • International Marine Terminals •Associated Terminals Alpha has Access to 25-30 Million Tons of Port Capacity Legend Anthracite Bituminous Lignite Ports Where Alpha has Committed Capacity Other Operating Ports

11 Global Coal Market Overview

12 • Expanding global energy needs lead to rising coal demand • Coal is the world’s fastest growing major fuel, and least expensive and most reliable form of electricity generation • Rapid population growth, urbanization and industrialization trends driving increased coal demand in India and China Global Demand • Coal fuels ~ 40% of electricity generation in the U.S. • Coal use has rebounded significantly in the past two years (up 9% YTD) • Coal stockpiles remain well below historical levels U.S. Demand • Global seaborne market showing very little price improvement, exhibiting dynamics of oversupplied market • Increases in production, primarily from Australia, continue to cause oversupply • Announcements of global production cuts in the 20 million tonne range • Announced production cuts yet to be fully reflected in market prices Metallurgical Coal Thermal Coal • Very challenging domestic regulatory environment will reduce future coal demand • MATS will become effective in 2015 • GHG standards proposed for new and existing power plants • Coal ash rule expected to be finalized by December 2014 Regulatory Environment Market Overview • Despite below normal domestic utility stockpile levels, soft pricing environment affected by softer natural gas prices, increased Illinois Basis supply and increased imports • Rail underperformance continues to hinder shipping volumes across all regions • API2 spot pricing and 2015 calendar year pricing below breakeven point for majority of US producers Sources: EIA, IEA, SNL, EVA, Internal Analysis

Metallurgical Coal
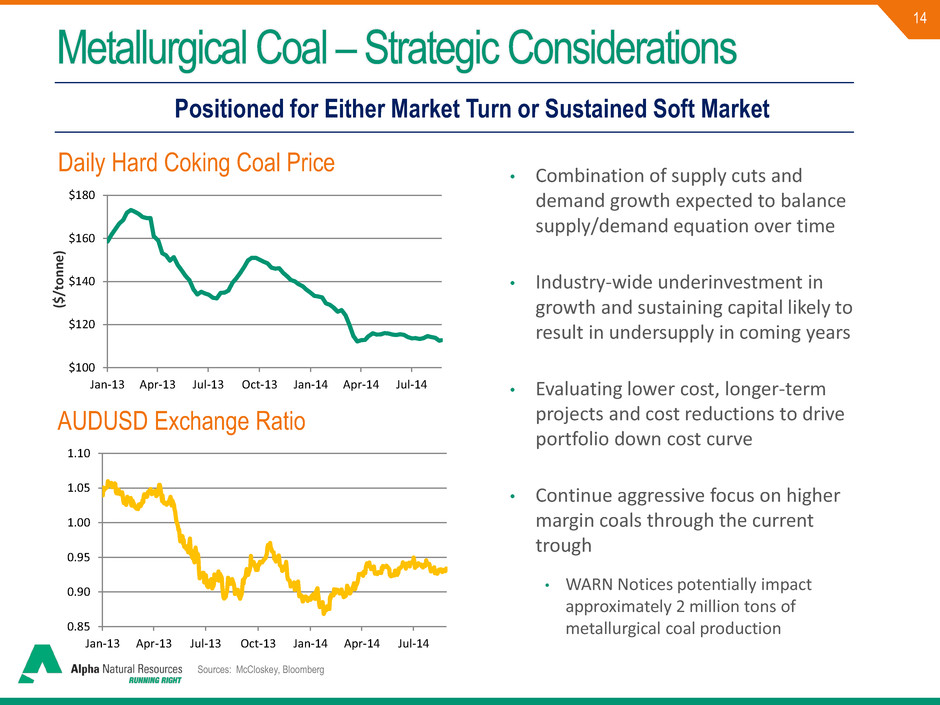
14 • Combination of supply cuts and demand growth expected to balance supply/demand equation over time • Industry-wide underinvestment in growth and sustaining capital likely to result in undersupply in coming years • Evaluating lower cost, longer-term projects and cost reductions to drive portfolio down cost curve • Continue aggressive focus on higher margin coals through the current trough • WARN Notices potentially impact approximately 2 million tons of metallurgical coal production Positioned for Either Market Turn or Sustained Soft Market $100 $120 $140 $160 $180 Jan-13 Apr-13 Jul-13 Oct-13 Jan-14 Apr-14 Jul-14 ($ /t o n n e ) 0.85 0.90 0.95 1.00 1.05 1.10 Jan-13 Apr-13 Jul-13 Oct-13 Jan-14 Apr-14 Jul-14 Sources: McCloskey, Bloomberg Daily Hard Coking Coal Price AUDUSD Exchange Ratio Metallurgical Coal – Strategic Considerations

15 Global Steel Growth Rates 2013-2015 Key Alpha End Markets Projecting Solid Growth in 2014 and 2015 More Balanced Growth Forecast for 2014 and 2015 Source: World Steel Association - Apparent Steel Use -0.2% 8.5% -2.4% 4.3% -1.1% 4.9% 3.6% 3.1% 3.9% 3.8% 3.4% 5.8% 2.8% 3.1% 3.0% 4.2% 3.4% 2.7% 9.5% 2.8% 3.3% -4.0% -2.0% 0.0% 2.0% 4.0% 6.0% 8.0% 10.0% 12.0% European Union (28) Other Europe NAFTA Central & South America Middle East Asia & Oceania World 2013 2014F 2015F

16 Global Seaborne Metallurgical Growth Rate Nearly 4% from 2013 to 2020 Key Alpha End Markets Projecting Solid Growth through 2020 Steady Metallurgical Coal Growth Expected Source: Wood Mackenzie 77 36 54 17 103 74 76 41 58 18 106 80 82 42 59 18 108 81 116 48 70 19 115 95 0 20 40 60 80 100 120 140 China India Europe South America ROW Total Atlantic 2013 2014F 2015F 2020F 6% 4% 4% 1% 2% 4% M ill io n s o f To n n es

Thermal Coal
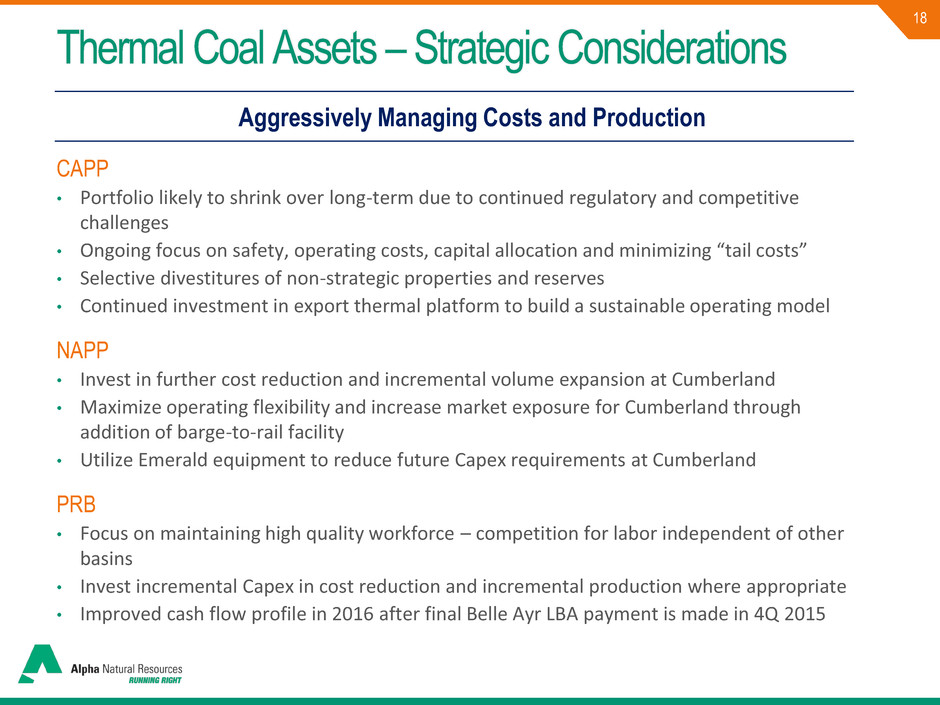
18 Aggressively Managing Costs and Production Thermal Coal Assets – Strategic Considerations CAPP • Portfolio likely to shrink over long-term due to continued regulatory and competitive challenges • Ongoing focus on safety, operating costs, capital allocation and minimizing “tail costs” • Selective divestitures of non-strategic properties and reserves • Continued investment in export thermal platform to build a sustainable operating model NAPP • Invest in further cost reduction and incremental volume expansion at Cumberland • Maximize operating flexibility and increase market exposure for Cumberland through addition of barge-to-rail facility • Utilize Emerald equipment to reduce future Capex requirements at Cumberland PRB • Focus on maintaining high quality workforce – competition for labor independent of other basins • Invest incremental Capex in cost reduction and incremental production where appropriate • Improved cash flow profile in 2016 after final Belle Ayr LBA payment is made in 4Q 2015
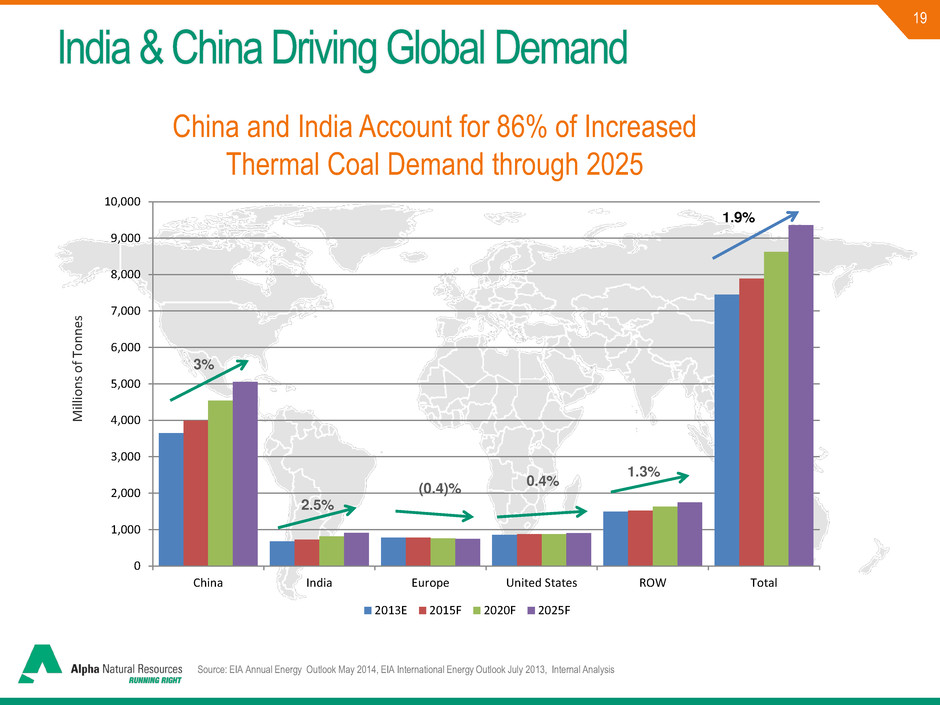
19 India & China Driving Global Demand China and India Account for 86% of Increased Thermal Coal Demand through 2025 Source: EIA Annual Energy Outlook May 2014, EIA International Energy Outlook July 2013, Internal Analysis 0 1,000 2,000 3,000 4,000 5,000 6,000 7,000 8,000 9,000 10,000 China India Europe United States ROW Total 2013E 2015F 2020F 2025F 1.9% 3% 0.4% (0.4)% 2.5% 1.3% Mil lions o f To n n es

20 Evolving Domestic Coal Markets STRUCTURAL Regulation • Plant retirements • Permitting Interregional competition focused on • Operating costs • Relative geology CYCLICAL Competition from low- priced natural gas and other coal basins Access to export markets Oversupply

21 Days of Burn Jul-14 Jun-14 Jul-13 5-Year Average % Change YoY NAPP 54.9 57.4 63.3 62.2 (13%) CAPP 69.4 68.1 119.8 93.9 (42%) ILB 64.4 68.4 78.7 71.7 (18%) PRB 48.3 52.0 63.6 66.2 (24%) TOTALS 53.0 55.8 69.5 68.2 (24%) Coal Remains #1 Fuel for Electricity Generation Coal Averaging approximately 40% of U.S Power Generation Source: EVA Note: The basins represented in the stockpile table don’t add up to the total as not all basins are included Days of Burn 37% 27% 0 20 40 60 80 100 120 140 160 180 200 Dec-07 Jun-08 Dec-08 Jun-09 Dec-09 Jun-10 Dec-10 Jun-11 Dec-11 Jun-12 Dec-12 Jun-13 Dec-13 T W h Coal Natural Gas Coal and natural gas generation were about even in April 2012 at ~32%; natural gas prices averaged $1.95/mmBTU then
Natural Gas
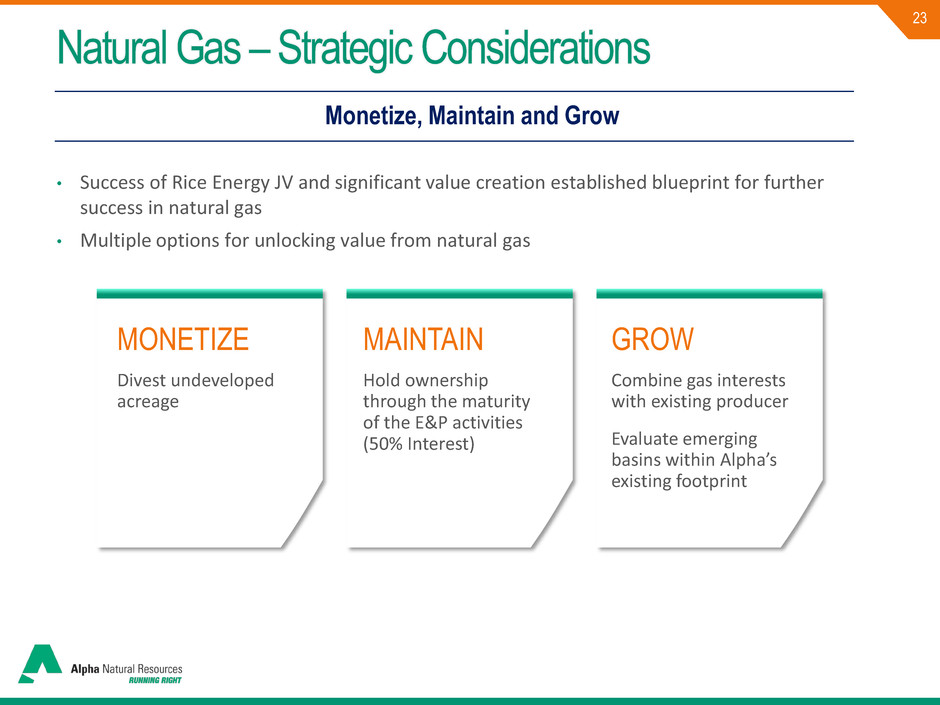
23 MONETIZE Divest undeveloped acreage MAINTAIN Hold ownership through the maturity of the E&P activities (50% Interest) GROW Combine gas interests with existing producer Evaluate emerging basins within Alpha’s existing footprint Monetize, Maintain and Grow Natural Gas – Strategic Considerations • Success of Rice Energy JV and significant value creation established blueprint for further success in natural gas • Multiple options for unlocking value from natural gas
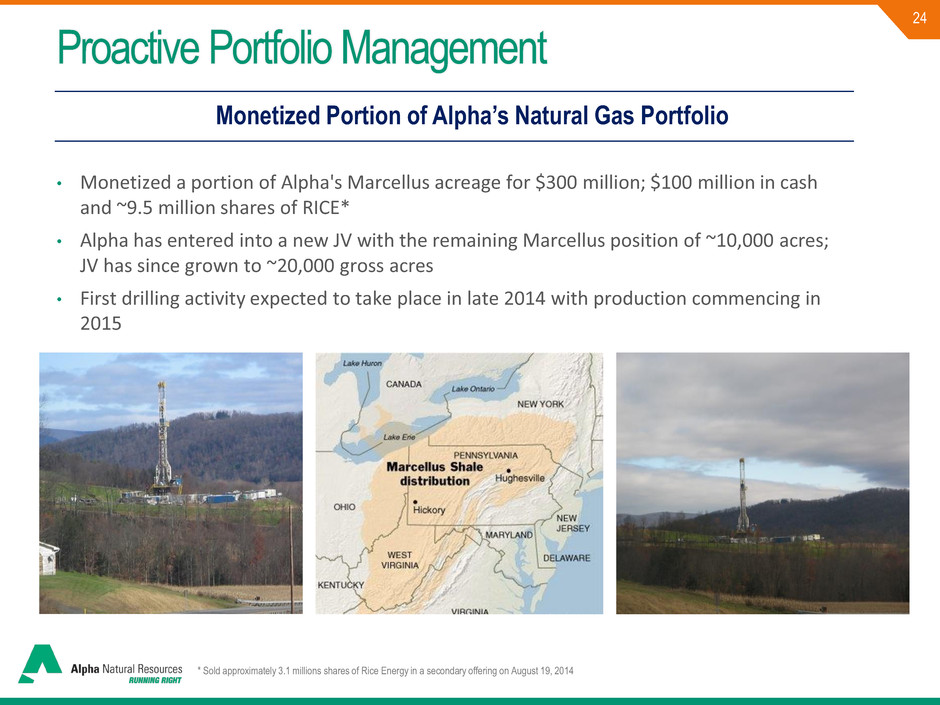
24 Monetized Portion of Alpha’s Natural Gas Portfolio Proactive Portfolio Management • Monetized a portion of Alpha's Marcellus acreage for $300 million; $100 million in cash and ~9.5 million shares of RICE* • Alpha has entered into a new JV with the remaining Marcellus position of ~10,000 acres; JV has since grown to ~20,000 gross acres • First drilling activity expected to take place in late 2014 with production commencing in 2015 * Sold approximately 3.1 millions shares of Rice Energy in a secondary offering on August 19, 2014

Cost Control, Capital Structure and Liquidity Management

26 $73.77 $71.40 $65.00 $60.00 $62.00 $64.00 $66.00 $68.00 $70.00 $72.00 $74.00 $76.00 2012 2013 MP 2014* Eastern cost/ton** Category 2012 2013 MP 2014* Est. Change from 2012 Eastern cost/ton** $73.77 $71.40 $65.00 -$8.77 Western cost/ton** $10.15 $9.91 $11.00 $0.85 Implemented ~$150mm annual cost reduction initiative in 2012 and further ~200mm reduction in 2013 Majority of cost reductions reflected in cost of coal sales $10.15 $9.91 $11.00 $9.00 $9.50 $10.00 $10.50 $11.00 $11.50 $12.00 2012 2013 MP 2014* Western cost/ton** Proactive Portfolio Management Aggressive Operating Cost Reductions in 2013 and 2014 to Enhance Cost Structure for Current Market Environment * Reflects midpoint of August 6, 2014 guidance. ** Adjusted cost of coal sales per ton. Adjusted cost of coal sales per ton is a non-GAAP measure. A reconciliation of this non-GAAP measure to the most comparable GAAP measure has been included in the tables accompanying this presentation.
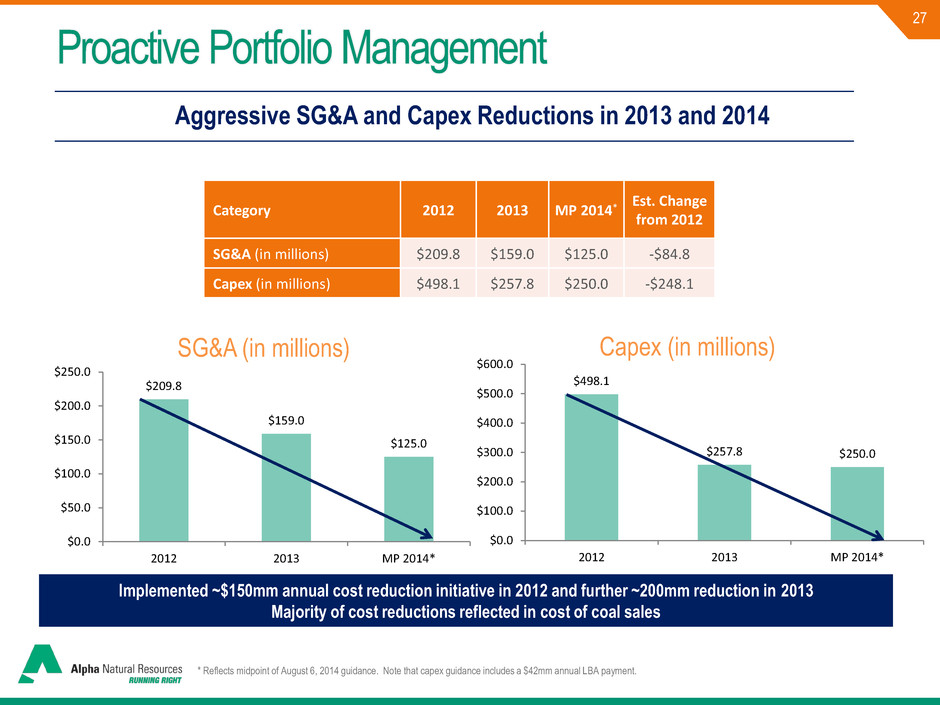
27 $498.1 $257.8 $250.0 $0.0 $100.0 $200.0 $300.0 $400.0 $500.0 $600.0 2012 2013 MP 2014* Capex (in millions) $209.8 $159.0 $125.0 $0.0 $50.0 $100.0 $150.0 $200.0 $250.0 2012 2013 MP 2014* SG&A (in millions) Category 2012 2013 MP 2014* Est. Change from 2012 SG&A (in millions) $209.8 $159.0 $125.0 -$84.8 Capex (in millions) $498.1 $257.8 $250.0 -$248.1 Implemented ~$150mm annual cost reduction initiative in 2012 and further ~200mm reduction in 2013 Majority of cost reductions reflected in cost of coal sales Proactive Portfolio Management Aggressive SG&A and Capex Reductions in 2013 and 2014 * Reflects midpoint of August 6, 2014 guidance. Note that capex guidance includes a $42mm annual LBA payment.
28 Prudently Managing Capital Structure & Liquidity • Maintain maturity profile with limited near-term maturities and manage liquidity to support focused operations while ensuring financial flexibility - Re-financings to extend maturity profile and improve liquidity - Prepared to execute debt deferral and/or reduction strategies when market conditions warrant - Selective asset disposals to bolster cash position and liquidity or deleveraging • Lowered annual Capex by nearly 50% from $498 million in 2012 to an estimated $250 million in 2014 based on midpoint of guidance as of August 6, 2014 • Proactive in management of debt maturities, liquidity and long-term capital structure • Evaluate additional actions to manage debt, preserve financial flexibility, ensure resilience through commodity cycle, and maintain credit rating to manage cost of capital Preserve Cash, Maintain Financial Flexibility

29 • Amended credit agreement: - Suspends interest coverage ratio through 2015 - Provided incremental senior debt capacity under the accordion - Senior secured net leverage ratio modified to first lien net secured leverage ratio test - No reduction or extension of revolver commitment • Sr. Sec. 2nd Lien Notes: - Preserved liquidity position - Took advantage of strong high yield markets Enhanced Financial Flexibility Recent Proactive Steps:
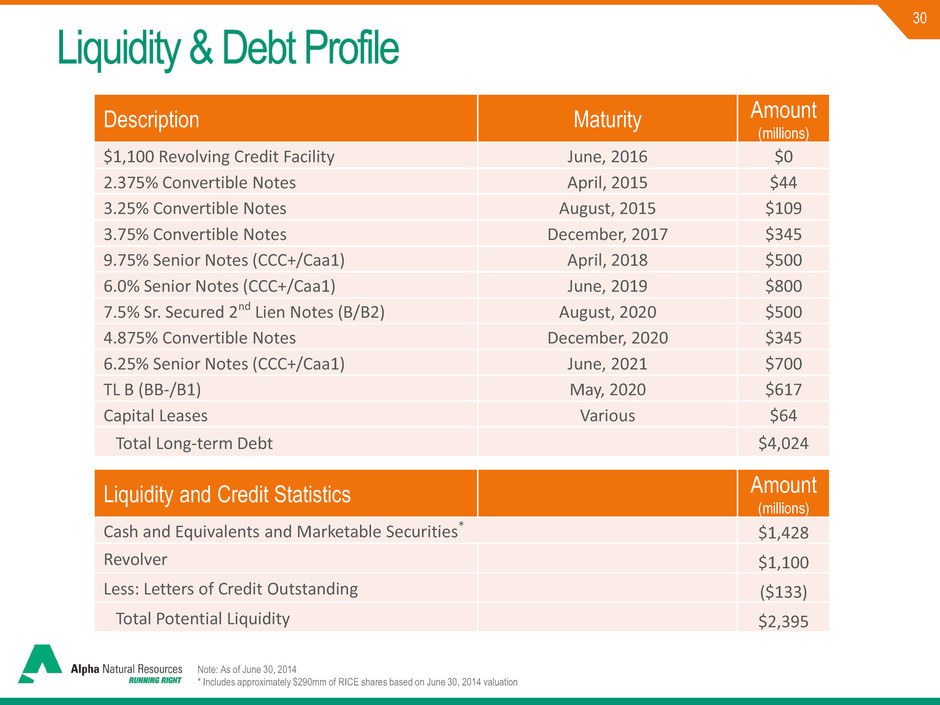
30 Description Maturity Amount (millions) $1,100 Revolving Credit Facility June, 2016 $0 2.375% Convertible Notes April, 2015 $44 3.25% Convertible Notes August, 2015 $109 3.75% Convertible Notes December, 2017 $345 9.75% Senior Notes (CCC+/Caa1) April, 2018 $500 6.0% Senior Notes (CCC+/Caa1) June, 2019 $800 7.5% Sr. Secured 2nd Lien Notes (B/B2) August, 2020 $500 4.875% Convertible Notes December, 2020 $345 6.25% Senior Notes (CCC+/Caa1) June, 2021 $700 TL B (BB-/B1) May, 2020 $617 Capital Leases Various $64 Total Long-term Debt $4,024 Liquidity and Credit Statistics Amount (millions) Cash and Equivalents and Marketable Securities* $1,428 Revolver $1,100 Less: Letters of Credit Outstanding ($133) Total Potential Liquidity $2,395 Liquidity & Debt Profile Note: As of June 30, 2014 * Includes approximately $290mm of RICE shares based on June 30, 2014 valuation

31 Key Takeaways Leading global coal producer with broad product and regional diversification • Top 5 in worldwide met shipments • Diversified customer base in nearly 30 countries • Most port capacity among US producers Strong, experienced management team proactively managing difficult environment Management focus on free cash flow generation • Major operating cost and SG&A reductions • Disciplined capex investment Prudent fiscal management • Improved liquidity since beginning of down cycle • Proactive debt maturity management with limited maturities until end of 2017 Strategically positioned for future

alphanr.com Appendices

33 Use of Non-GAAP Measures In addition to information prepared in accordance with generally accepted accounting principles in the United States (GAAP) provided throughout this presentation, Alpha has presented the following non-GAAP financial measures, which management uses to gauge operating performance: adjusted EBITDA, adjusted cost of coal sales per ton and free cash flow. These non- GAAP financial measures exclude various items detailed in the attached reconciliation tables. The definition of these non-GAAP measures may be changed periodically by management to adjust for significant items important to an understanding of operating trends. These measures are not intended to replace financial performance measures determined in accordance with GAAP. Rather, they are presented as supplemental measures of the Company’s performance that management believes are useful to securities analysts, investors and others in assessing the Company’s performance over time. Moreover, these measures are not calculated identically by all companies and therefore may not be comparable to similarly titled measures used by other companies. A reconciliation of each of these measures to its most directly comparable GAAP measure is provided in the tables below. Reconciliation

34 Reconciliation of Adjusted Cost of Coal Sales Per Ton-East to Cost of Coal Sales Per Ton December 31, 2013 December 31, 2012 Cost of coal sales per ton-East $ 72.51 $ 71.76 Impact of provision for regulatory costs (0.53) - Impact of merger-related expenses (0.58) (1.07) Impact of changes in future costs of asset retirement obligations - 2.48 Impact of benefits-related accrual reversal - 0.64 Impact of write-off of weather-related property damage - (0.04) Adjusted cost of coal sales per ton-East $ 71.40 $ 73.77 Reconciliation of Adjusted Cost of Coal Sales Per Ton-West to Cost of Coal Sales Per Ton December 31, 2013 December 31, 2012 Cost of coal sales per ton-West $ 9.91 $ 10.10 Impact of benefits-related accrual reversal - 0.05 Adjusted cost of coal sales per ton-West $ 9.91 $ 10.15 Twelve months ended Twelve months ended Reconciliation of Cost of Coal Sales

alphanr.com
