Attached files
| file | filename |
|---|---|
| 8-K - FORM 8-K - ASPEN INSURANCE HOLDINGS LTD | d782466d8k.htm |
Exhibit 99.1
| Aspen Insurance Holdings Limited INVESTOR PRESENTATION SECOND QUARTER 2014 |
| This slide presentation is for information purposes only. It should be read in conjunction with our financial supplement posted on our website on the Investor Relations page and with other documents filed or to be filed shortly by Aspen Insurance Holdings Limited (the "Company" or "Aspen") with the U.S. Securities and Exchange Commission. Non-GAAP Financial Measures: In presenting Aspen's results, management has included and discussed certain "non-GAAP financial measures" as such term is defined in Regulation G. Management believes that these non-GAAP financial measures, which may be defined differently by other companies, better explain Aspen's results of operations in a manner that allows for a more complete understanding of the underlying trends in Aspen's business. However, these measures should not be viewed as a substitute for those determined in accordance with GAAP. The reconciliation of such non-GAAP financial measures to their respective most directly comparable GAAP financial measures in accordance with Regulation G is included herein or in the financial supplement, as applicable, which can be obtained from the Investor Relations section of Aspen's website at www.aspen.co. Application of the Safe Harbor of the Private Securities Litigation Reform Act of 1995: This presentation contains written or oral "forward-looking statements" within the meaning of the U.S. federal securities laws. These statements are made pursuant to the safe harbor provisions of the Private Securities Litigation Reform Act of 1995. Forward-looking statements include all statements that do not relate solely to historical or current facts, and can be identified by the use of words such as "expect," "assume," "objective," "intend," "plan," "believe," "do not believe," "aim," "project," "anticipate," "seek," "will," "likely," "estimate," "may," "continue," "guidance," "outlook," "trends," "future," "could," "would," "should," "target," and similar expressions of a future or forward-looking nature. All forward-looking statements address matters that involve risks and uncertainties. Accordingly, there are or will be important factors that could cause actual results to differ materially from those indicated in these statements. Aspen believes these factors include, but are not limited to: our ability to successfully implement steps to further optimize the business portfolio, ensure capital efficiency and enhance investment returns; the possibility of greater frequency or severity of claims and loss activity, including as a result of natural or man-made (including economic and political risks) catastrophic or material loss events, than our underwriting, reserving, reinsurance purchasing or investment practices have anticipated; the assumptions and uncertainties underlying reserve levels that may be impacted by future payments for settlements of claims and expenses or by other factors causing adverse or favorable development; the reliability of, and changes in assumptions to, natural and man-made catastrophe pricing, accumulation and estimated loss models; decreased demand for our insurance or reinsurance products and cyclical changes in the highly competitive insurance and reinsurance industry; increased competition from existing insurers and reinsurers and from alternative capital providers and insurance-linked funds and collateralized special purpose insurers on the basis of pricing, capacity, coverage terms, new capital, binding authorities to brokers or other factors and the related demand and supply dynamics as contracts come up for renewal; changes in the availability, cost or quality of reinsurance or retrocessional coverage; changes in general economic conditions, including inflation, deflation, foreign currency exchange rates, interest rates and other factors that could affect our financial results; the risk of a material decline in the value or liquidity of all or parts of our investment portfolio; evolving issues with respect to interpretation of coverage after major loss events; our ability to adequately model and price the effects of climate cycles and climate change; any intervening legislative or governmental action and changing judicial interpretation and judgments on insurers' liability to various risks; the effectiveness of our risk management loss limitation methods, including our reinsurance purchasing; changes in the total industry losses, or our share of total industry losses, resulting from past events and, with respect to such events, our reliance on loss reports received from cedants and loss adjustors, our reliance on industry loss estimates and those generated by modeling techniques, changes in rulings on flood damage or other exclusions as a result of prevailing lawsuits and case law; the impact of one or more large losses from events other than natural catastrophes or by an unexpected accumulation of attritional losses and deterioration in loss estimates; the impact of acts of terrorism, acts of war and related legislation; any changes in our reinsurers' credit quality and the amount and timing of reinsurance recoverables; the continuing and uncertain impact of the current depressed lower growth economic environment in many of the countries in which we operate; the level of inflation in repair costs due to limited availability of labor and materials after catastrophes; a decline in our operating subsidiaries' ratings with S&P, A.M. Best or Moody's; the failure of our reinsurers, policyholders, brokers or other intermediaries to honor their payment obligations; our ability to execute our business plan to enter new markets, introduce new products and develop new distribution channels, including their integration into our existing operations; our reliance on the assessment and pricing of individual risks by third parties; our dependence on a few brokers for a large portion of our revenues; the persistence of heightened financial risks, including excess sovereign debt, the banking system and the Eurozone debt crisis; changes in our ability to exercise capital management initiatives (including our share repurchase program) or to arrange banking facilities as a result of prevailing market conditions or changes in our financial position; changes in government regulations or tax laws in jurisdictions where we conduct business; changes in accounting principles or policies or in the application of such accounting principles or policies; Aspen or Aspen Bermuda Limited becoming subject to income taxes in the United States or the United Kingdom; loss of one or more of our senior underwriters or key personnel; our reliance on information technology and third-party service providers for our operations and systems; and increased counterparty risk due to the credit impairment of financial institutions. For a more detailed description of these uncertainties and other factors, please see the "Risk Factors" section in Aspen's Annual Report on Form 10-K as filed with the U.S. Securities and Exchange Commission on February 20, 2014. Aspen undertakes no obligation to publicly update or revise any forward-looking statements, whether as a result of new information, future events or otherwise. Readers are cautioned not to place undue reliance on these forward-looking statements, which speak only as of the dates on which they are made. The guidance in this presentation relating to 10% Operating ROE in 2014, 11% Operating ROE in 2015 and between 11% and 12% Operating ROE in 2016 is made as at July 23, 2014. For 2014 such guidance assumes a pre-tax catastrophe load of $185 million, normal loss experience and the current interest rate and insurance pricing environment. For 2015 and 2016, such guidance assumes normal loss experience, our expectations for rising interest rates, and a less favorable insurance pricing environment. Aspen has identified and described in the following slides actions and additional underlying assumptions in each of its three operating return on equity levers - optimization of the business portfolio (including particular lines of business), capital efficiency and enhancing investment returns - to seek to achieve the targeted Operating ROE in 2014, 2015 and 2016. These forward looking statements are subject to the assumptions, risks and uncertainties, as discussed above and in the following slides, which could cause actual results to differ materially from these statements. In addition, any estimates relating to loss events involve the exercise of considerable judgment and reflect a combination of ground-up evaluations, information available to date from brokers and cedants, market intelligence, initial tentative loss reports and other sources. The actuarial range of reserves and management's best estimate represents a distribution from our internal capital model for reserving risk based on our then current state of knowledge and explicit and implicit assumptions relating to the incurred pattern of claims, the expected ultimate settlement amount, inflation and dependencies between lines of business. Due to the complexity of factors contributing to the losses and the preliminary nature of the information used to prepare these estimates, there can be no assurance that Aspen's ultimate losses will remain within the stated amount. SAFE HARBOR DISCLOSURE 2 AHL: NYSE |
| CONTENTS Aspen Overview: Who We Are The Aspen Strategy for Creating Shareholder Value Optimization of Business Portfolio: Tangible and Growing Financial Benefits Capital Efficiency: Proactive Management of Capital Enhancing Investment Return: Delivering Strong Investment Returns with High Quality Portfolio Conclusion: Focused on Shareholder Value Appendix AHL: NYSE 3 |
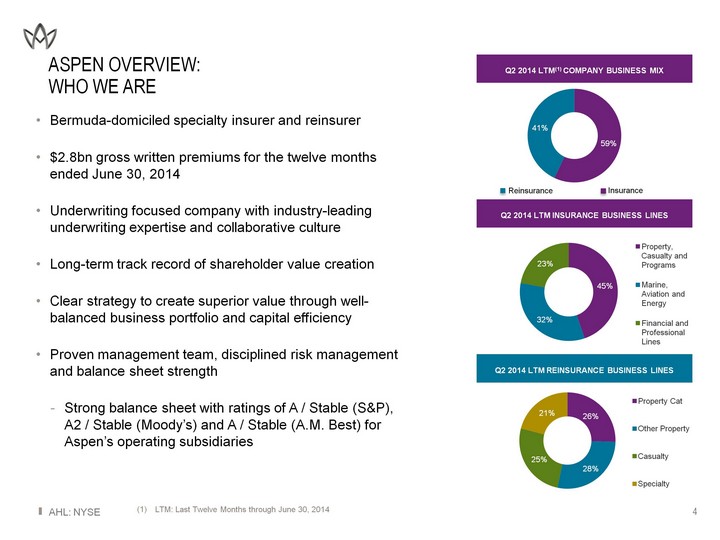
| AHL: NYSE ASPEN OVERVIEW: WHO WE ARE Bermuda-domiciled specialty insurer and reinsurer $2.8bn gross written premiums for the twelve months ended June 30, 2014 Underwriting focused company with industry-leading underwriting expertise and collaborative culture Long-term track record of shareholder value creation Clear strategy to create superior value through well- balanced business portfolio and capital efficiency Proven management team, disciplined risk management and balance sheet strength Strong balance sheet with ratings of A / Stable (S&P), A2 / Stable (Moody's) and A / Stable (A.M. Best) for Aspen's operating subsidiaries 4 Q2 2014 LTM INSURANCE BUSINESS LINES Q2 2014 LTM REINSURANCE BUSINESS LINES Q2 2014 LTM(1) COMPANY BUSINESS MIX (CHART) (CHART) (CHART) LTM: Last Twelve Months through June 30, 2014 Insurance Reinsurance |
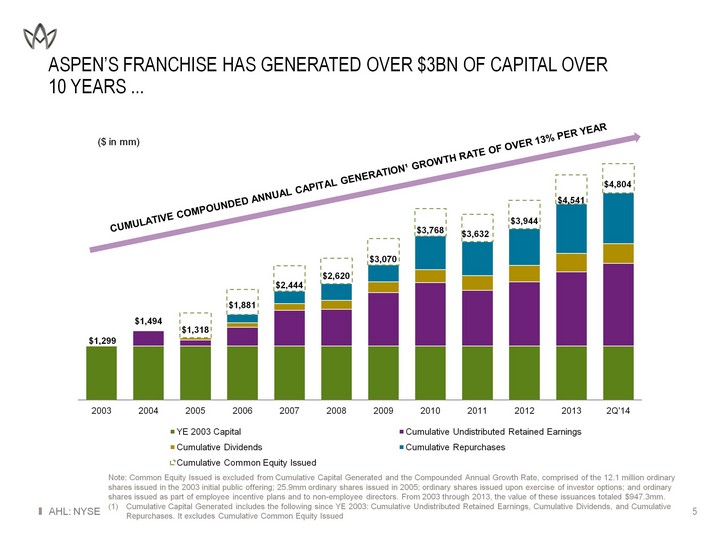
| Aspen's franchise has generated over $3bn of capital over 10 years ... AHL: NYSE 5 CUMULATIVE COMPOUNDED ANNUAL CAPITAL GENERATION1 GROWTH RATE OF OVER 13% PER YEAR ($ in mm) Note: Common Equity Issued is excluded from Cumulative Capital Generated and the Compounded Annual Growth Rate, comprised of the 12.1 million ordinary shares issued in the 2003 initial public offering; 25.9mm ordinary shares issued in 2005; ordinary shares issued upon exercise of investor options; and ordinary shares issued as part of employee incentive plans and to non-employee directors. From 2003 through 2013, the value of these issuances totaled $947.3mm. Cumulative Capital Generated includes the following since YE 2003: Cumulative Undistributed Retained Earnings, Cumulative Dividends, and Cumulative Repurchases. It excludes Cumulative Common Equity Issued (CHART) |
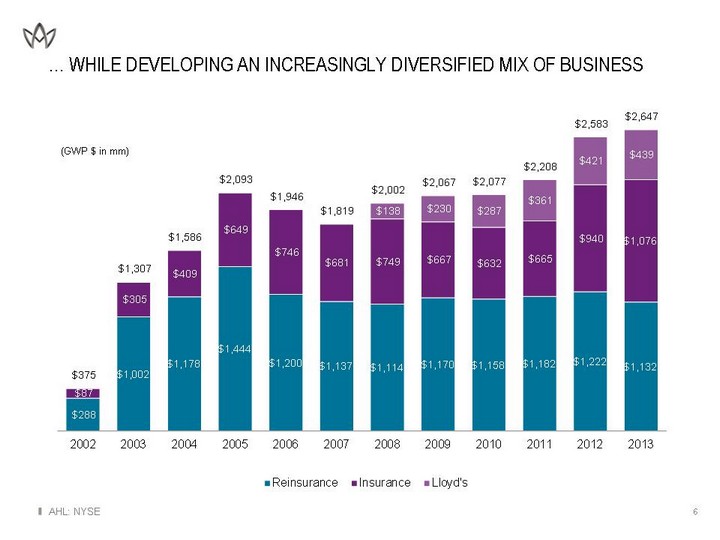
| ... while developing an increasingly diversified mix of business AHL: NYSE 6 (GWP $ in mm) |
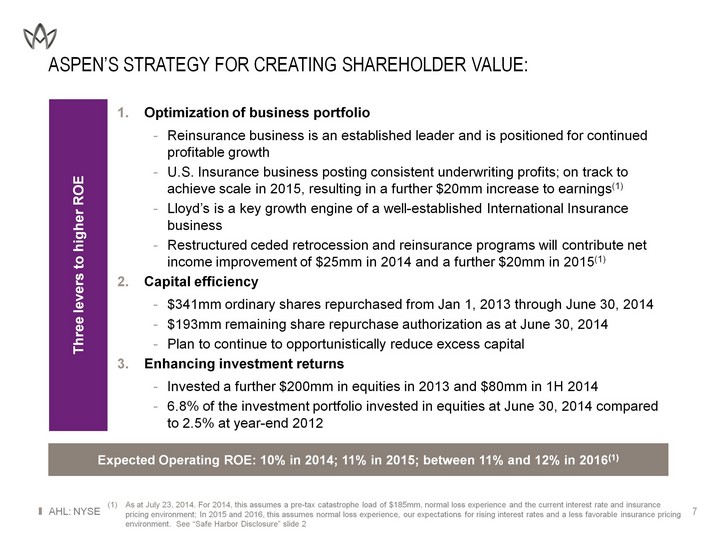
| AHL: NYSE Aspen's strategy for CREATING SHAREHOLDER VALUE: Optimization of business portfolio Reinsurance business is an established leader and is positioned for continued profitable growth U.S. Insurance business posting consistent underwriting profits; on track to achieve scale in 2015, resulting in a further $20mm increase to earnings(1) Lloyd's is a key growth engine of a well-established International Insurance business Restructured ceded retrocession and reinsurance programs will contribute net income improvement of $25mm in 2014 and a further $20mm in 2015(1) Capital efficiency $341mm ordinary shares repurchased from Jan 1, 2013 through June 30, 2014 $193mm remaining share repurchase authorization as at June 30, 2014 Plan to continue to opportunistically reduce excess capital Enhancing investment returns Invested a further $200mm in equities in 2013 and $80mm in 1H 2014 6.8% of the investment portfolio invested in equities at June 30, 2014 compared to 2.5% at year-end 2012 7 Three levers to higher ROE Expected Operating ROE: 10% in 2014; 11% in 2015; between 11% and 12% in 2016(1) As at July 23, 2014. For 2014, this assumes a pre-tax catastrophe load of $185mm, normal loss experience and the current interest rate and insurance pricing environment; In 2015 and 2016, this assumes normal loss experience, our expectations for rising interest rates and a less favorable insurance pricing environment. See "Safe Harbor Disclosure" slide 2 |
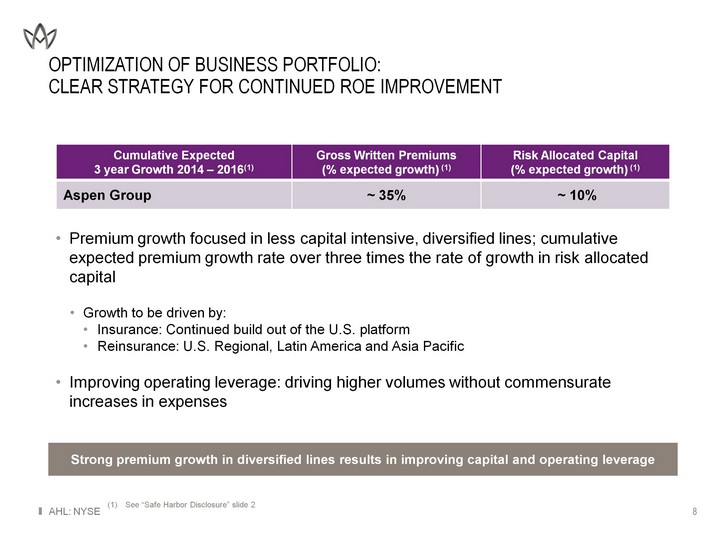
| optimization of business portfolio: clear strategy for continued roe improvement AHL: NYSE 8 Strong premium growth in diversified lines results in improving capital and operating leverage Cumulative Expected 3 year Growth 2014 - 2016(1) Gross Written Premiums (% expected growth) (1) Risk Allocated Capital (% expected growth) (1) Aspen Group ~ 35% ~ 10% Premium growth focused in less capital intensive, diversified lines; cumulative expected premium growth rate over three times the rate of growth in risk allocated capital Growth to be driven by: Insurance: Continued build out of the U.S. platform Reinsurance: U.S. Regional, Latin America and Asia Pacific Improving operating leverage: driving higher volumes without commensurate increases in expenses See "Safe Harbor Disclosure" slide 2 |
| optimization of business portfolio: reinsurance business has strong prospects AHL: NYSE 9 Exceptional client relationships, reflecting consistent, seasoned management team that supports clients with a long term focus and continuity Diversified portfolio across four sub-segments: Property Catastrophe, Other Property, Casualty and Specialty Successful 2014 renewals affirm Aspen's strategy and broad reach in a difficult market Regional structure to meet increasing demand for local market solutions Significant growth prospects in emerging markets expected to account for 20% of premiums(1) Utilizing multi-line capability and Aspen Capital Markets to leverage third-party capital (1) 2014E premiums from APAC, LatAm and MENA. See "Safe Harbor Disclosure" slide 2 Strongest contributor to group ROE - expected to continue generating high profitability |
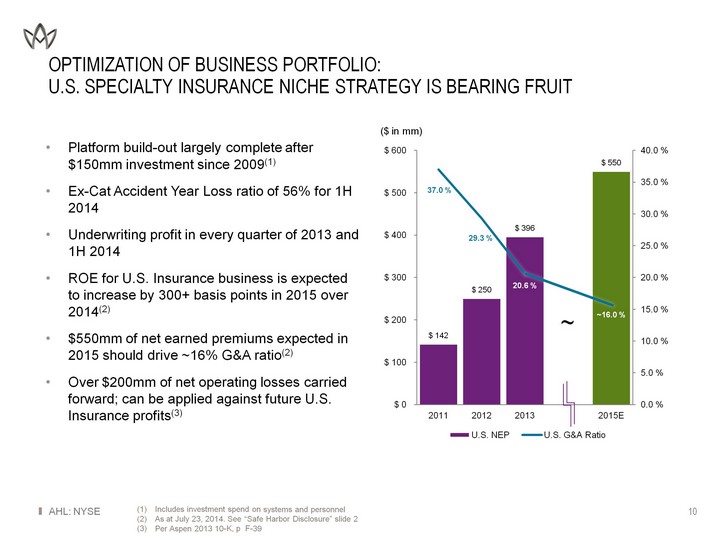
| optimization of business portfolio: U.S. SPECIALTY insurance NICHE strategy is BEARING FRUIT AHL: NYSE 10 Includes investment spend on systems and personnel As at July 23, 2014. See "Safe Harbor Disclosure" slide 2 Per Aspen 2013 10-K, p F-39 ($ in mm) (CHART) ~ Platform build-out largely complete after $150mm investment since 2009(1) Ex-Cat Accident Year Loss ratio of 56% for 1H 2014 Underwriting profit in every quarter of 2013 and 1H 2014 ROE for U.S. Insurance business is expected to increase by 300+ basis points in 2015 over 2014(2) $550mm of net earned premiums expected in 2015 should drive ~16% G&A ratio(2) Over $200mm of net operating losses carried forward; can be applied against future U.S. Insurance profits(3) |
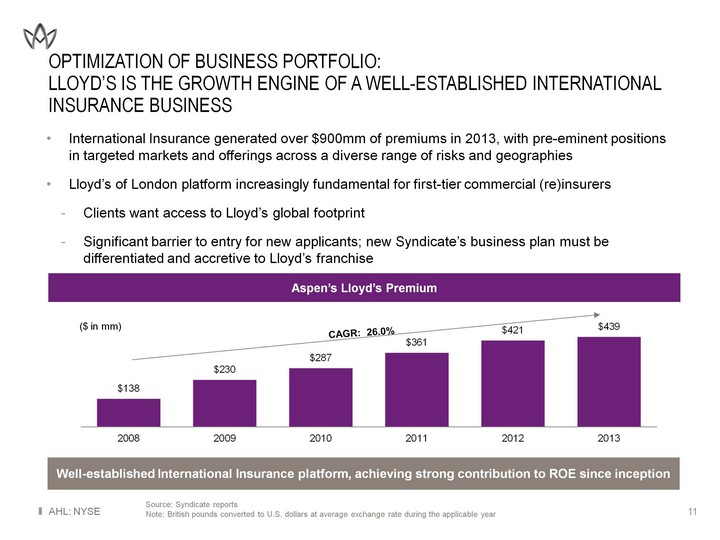
| optimization of business portfolio: Lloyd's is the growth engine of a well-established international insurance business AHL: NYSE 11 Source: Syndicate reports Note: British pounds converted to U.S. dollars at average exchange rate during the applicable year International Insurance generated over $900mm of premiums in 2013, with pre-eminent positions in targeted markets and offerings across a diverse range of risks and geographies Lloyd's of London platform increasingly fundamental for first-tier commercial (re)insurers Clients want access to Lloyd's global footprint Significant barrier to entry for new applicants; new Syndicate's business plan must be differentiated and accretive to Lloyd's franchise ($ in mm) Aspen's Lloyd's Premium Well-established International Insurance platform, achieving strong contribution to ROE since inception |
| optimization of business portfolio: RESTRUCTURED CEDED RETROCESSION AND REINSURANCE PROGRAMS AHL: NYSE 12 Expected improvement to net income of $25mm in 2014 and a further $20mm in 2015 In 2014, expect $6mm from Reinsurance and $19mm from Insurance; in 2015, expect all of the additional $20mm from Insurance(1) Rate environment allows increased retrocession coverage at lower price; expected to drive $6mm improvement to net income in 2014 given normal loss expectancy Insurance teams, particularly in U.S., have matured and have established, favorable track records at Aspen, supporting an increased retention strategy Restructuring of reinsurance purchasing and higher premium retention expected to generate incremental net income of $19mm in 2014 and $20mm in 2015 given normal loss expectancy Ratio of net written premium to gross written premium expected to increase by 5 percentage points in 2014 Diversified nature of non cat exposed, non correlated portfolio results in only $20mm increase in capital to support increased retention and expected to have little impact to PML's G&A expense level not expected to change following restructuring of reinsurance purchasing As at July 23, 2014. See "Safe Harbor Disclosure" slide 2 REINSURANCE: ARRANGED INCREASED AMOUNT OF RETRO FOR LOWER PRICE INSURANCE: RESTRUCTURING REINSURANCE EXPECTED TO IMPROVE NET INCOME |
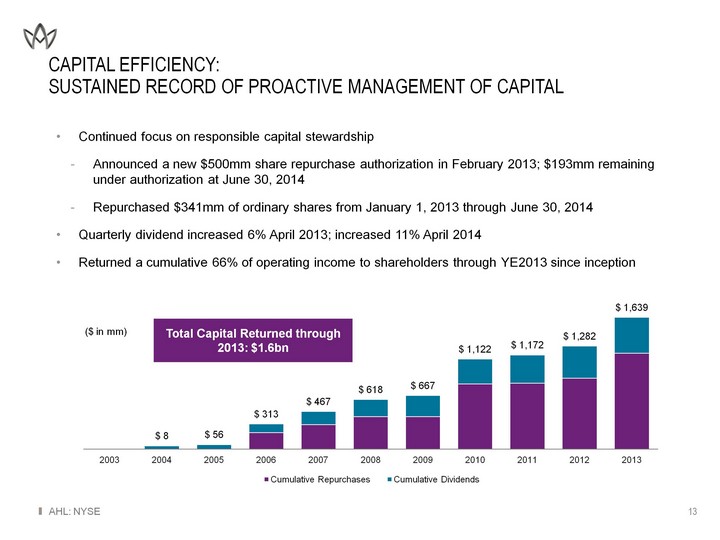
| Capital efficiency: SUSTAINED RECORD OF PROACTIVE MANAGEMENT OF CAPITAL AHL: NYSE 13 Continued focus on responsible capital stewardship Announced a new $500mm share repurchase authorization in February 2013; $193mm remaining under authorization at June 30, 2014 Repurchased $341mm of ordinary shares from January 1, 2013 through June 30, 2014 Quarterly dividend increased 6% April 2013; increased 11% April 2014 Returned a cumulative 66% of operating income to shareholders through YE2013 since inception (CHART) ($ in mm) Total Capital Returned through 2013: $1.6bn |
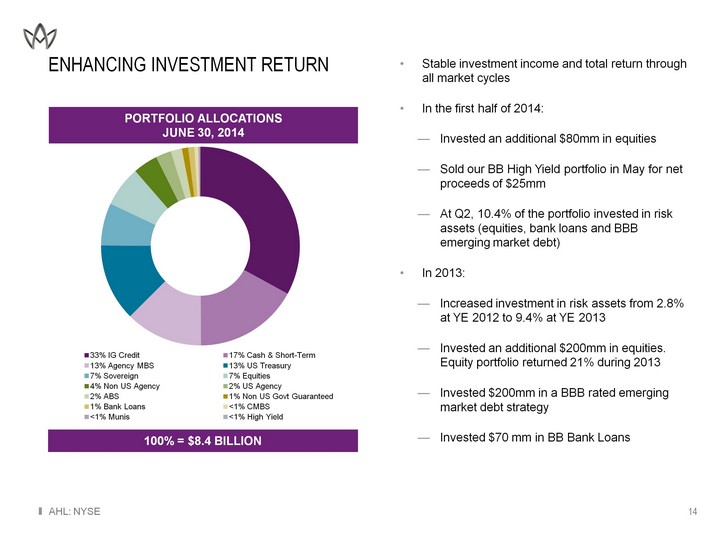
| Enhancing investment return AHL: NYSE 14 PORTFOLIO ALLOCATIONS JUNE 30, 2014 100% = $8.4 BILLION Stable investment income and total return through all market cycles In the first half of 2014: Invested an additional $80mm in equities Sold our BB High Yield portfolio in May for net proceeds of $25mm At Q2, 10.4% of the portfolio invested in risk assets (equities, bank loans and BBB emerging market debt) In 2013: Increased investment in risk assets from 2.8% at YE 2012 to 9.4% at YE 2013 Invested an additional $200mm in equities. Equity portfolio returned 21% during 2013 Invested $200mm in a BBB rated emerging market debt strategy Invested $70 mm in BB Bank Loans (CHART) |
| CONCLUSION: FOCUSED ON SHAREHOLDER VALUE Deep underwriting expertise and understanding of client needs and risks Executing plan to drive higher ROE and BVPS growth Optimizing business portfolio to free up capital and improve risk-adjusted returns Improving capital efficiency Enhancing investment return within acceptable risk parameters Pursuing selective, profitable growth in exposures we know and understand, subject to market conditions Diversified platform allows us to take advantage of areas where rates are improving Expected premium growth across diversified lines is projected to be greater than both growth in expenses and risk allocated capital which should equate to meaningful increased premium leverage AHL: NYSE 15 As at July 23, 2014. For 2014, this assumes a pre-tax catastrophe load of $185mm, normal loss experience and given the current interest rate and insurance pricing environment; In 2015 and 2016, this assumes normal loss experience, our expectations for rising interest rates, and a less favorable insurance pricing environment. See "Safe Harbor Disclosure" slide 2 Expected Operating ROE: 10% in 2014; 11% in 2015; between 11% and 12% in 2016(1) |

| APPENDIX |
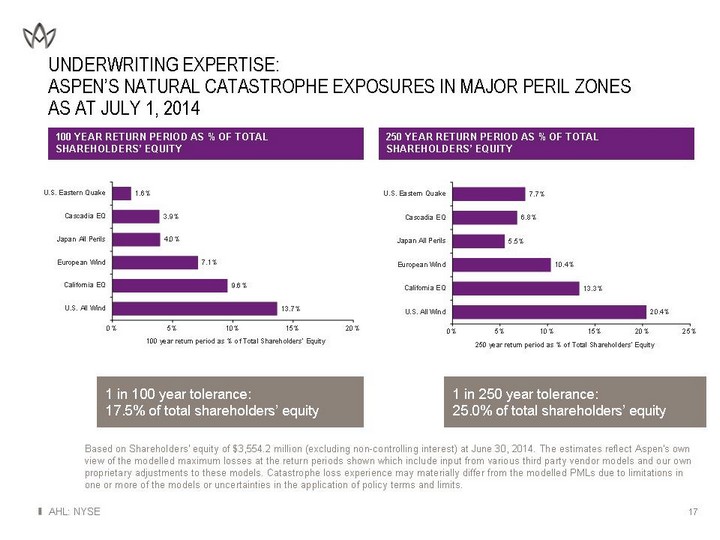
| UNDERWRITING EXPERTISE: ASPEN'S NATURAL CATASTROPHE EXPOSURES IN MAJOR PERIL ZONES AS AT July 1, 2014 100 YEAR RETURN PERIOD AS % OF TOTAL SHAREHOLDERS' EQUITY 250 YEAR RETURN PERIOD AS % OF TOTAL SHAREHOLDERS' EQUITY 1 in 100 year tolerance: 17.5% of total shareholders' equity 1 in 250 year tolerance: 25.0% of total shareholders' equity AHL: NYSE 17 Based on Shareholders' equity of $3,554.2 million (excluding non-controlling interest) at June 30, 2014. The estimates reflect Aspen's own view of the modelled maximum losses at the return periods shown which include input from various third party vendor models and our own proprietary adjustments to these models. Catastrophe loss experience may materially differ from the modelled PMLs due to limitations in one or more of the models or uncertainties in the application of policy terms and limits. |

| Aspen Insurance Holdings Limited INVESTOR PRESENTATION SECOND QUARTER 2014 |