Attached files
| file | filename |
|---|---|
| 8-K - 8-K - ABERCROMBIE & FITCH CO /DE/ | q220148k8282014.htm |
| EX-99.4 - EXHIBIT 99.4 - ABERCROMBIE & FITCH CO /DE/ | anftranscript20140828fin.htm |
| EX-99.2 - EXHIBIT 99.2 - ABERCROMBIE & FITCH CO /DE/ | ex992q22014quarterlyhistory.htm |
| EX-99.1 - EXHIBIT 99.1 - ABERCROMBIE & FITCH CO /DE/ | ex991q22014earningsrelease.htm |

INVESTOR PRESENTATION 2014 SECOND QUARTER

SAFE HARBOR STATEMENT UNDER THE PRIVATE SECURITIES LITIGATION REFORM ACT OF 1995 A&F cautions that any forward-looking statements (as such term is defined in the Private Securities Litigation Reform Act of 1995) contained in this presentation or made by management or spokespeople of A&F involve risks and uncertainties and are subject to change based on various important factors, many of which may be beyond the Company’s control. Words such as “estimate,” “project,” “plan,” “believe,” “expect,” “anticipate,” “intend,” and similar expressions may identify forward-looking statements. Except as may be required by applicable law, we assume no obligation to publicly update or revise our forward-looking statements. The factors included in the disclosure under the heading “FORWARD-LOOKING STATEMENTS AND RISK FACTORS” in “ITEM 1A. RISK FACTORS” of A&F’s Annual Report on Form 10-K for the fiscal year ended February 1, 2014, in some cases have affected and in the future could affect the Company’s financial performance and could cause actual results for the 2014 fiscal year and beyond to differ materially from those expressed or implied in any of the forward-looking statements included in this presentation or otherwise made by management. OTHER INFORMATION All dollar and share amounts are in 000’s unless otherwise stated. Sub-totals and totals may not foot due to rounding. 2

Q2 ADJUSTED P&L SUMMARY * 2013 2014 % OF NET SALES % OF NET SALES NET SALES GROSS PROFIT OPERATING EXPENSE OTHER OPERATING INCOME, NET OPERATING INCOME INTEREST EXPENSE, NET INCOME BEFORE TAXES TAX PROVISION NET INCOME NET INCOME PER SHARE BASIC DILUTED WEIGHTED-AVERAGE SHARES OUTSTANDING BASIC DILUTED $890,605 $945,698 604,122 586,793 (4,411) 21,740 1,750 19,990 6,975 $0.17 $0.16 $13,015 552,956 72,436 73,756 77,382 79,267 535,370 (4,290) 21,876 2,020 19,856 5,794 $14,062 $0.19 $0.19 100.0% 100.0% 63.9% 62.0% -0.4% 2.3% 0.2% 2.1% 0.7% 1.4% 62.1% 60.1% -0.5% 2.5% 0.2% 2.3% 0.7% 1.6% * The Q2 Adjusted P&L Summary for the current period is presented on an adjusted non-GAAP basis and excludes the charges set out on page 4. A reconciliation between GAAP and non-GAAP results is included as an appendix to the presentation. 3

Q1 Q1 Q2 Q2 Q3 Q3 Q4 Q4 YEAR TO DATE FULL YEAR 2014 2013 5,025 13,8392,575 $44,708 $36,792 3,674 3,144 $43,610 7,590 43,571 $95,869$2,575 3,061 1,964 6,903 46,715 6,903 - $17,981 $142,054 $15,598 $2,383 $6,052 $81,500 $5,633 $419 -- GILLY HICKS RESTRUCTURING CHARGES PROFIT IMPROVEMENT INITIATIVE CHARGES CORPORATE GOVERNANCE CHARGES TOTAL GILLY HICKS RESTRUCTURING CHARGES PROFIT IMPROVEMENT INITIATIVE CHARGES OTHER IMPAIRMENT CHARGES TOTAL -- - - EXCLUDED CHARGES (PRE-TAX) 4

TOTAL COMPANY GEOGRAPHIC: U.S. INTERNATIONAL BRAND: ABERCROMBIE & FITCH abercrombie kids HOLLISTER CO. - 7% - 5% - 9% - 1% - 6% - 10% Q2 COMPARABLE SALES * 61.3% U.S. 38.7% INTERNATIONAL GEOGRAPHIC SALES MIXQ2 * Includes comparable store and DTC sales 5

TOTAL COMPANY GEOGRAPHIC: U.S. INTERNATIONAL BRAND: ABERCROMBIE & FITCH abercrombie kids HOLLISTER CO. - 6% - 5% - 7% - 1% - 6% - 9% YTD COMPARABLE SALES * 61.3% U.S. 38.7% INTERNATIONAL GEOGRAPHIC SALES MIXYTD * Includes comparable store and DTC sales 6

Q2 ADJUSTED OPERATING EXPENSE* 20132014 % OF NET SALESSECOND QUARTER % OF NET SALES bps(3) STORE OCCUPANCY (1) ALL OTHER (2) STORES AND DISTRIBUTION MARKETING, GENERAL & ADMINISTRATIVE TOTAL 279,273 471,722 115,071 $190,786 $192,449 234,270 425,056 110,314 $535,370 $586,793 20.3% 110 29.5% (320) 49.8% (210) 12.2% 20 62.0% (190) 21.4% 26.3% 47.7% 12.4% 60.1% * Excludes charges set out on page 4. (1) Includes rent, other landlord charges, utilities, depreciation, and other occupancy expense. (2) Includes selling payroll, store management and support, other store expense, DTC, and distribution center costs. (3) Rounded based on reported percentages. 7

* Operating Income excludes the charges set out on page 4. A reconciliation between GAAP and non-GAAP results is included as an appendix to the presentation. (1) Operating Income for U.S. Stores and International Stores is reported on an aggregate four-wall basis, and excludes pre-opening costs. Also includes third party sell-off of excess merchandise. (2) Store Pre-Opening Costs include pre-opening rent, payroll, travel, and other expenses. (3) All Other includes Store Management & Support, DC and Other Expenses, net of Other Income. $449,202 $504,674 286,727 154,297 - $51,117 $58,973 69,359 55,008 (40,841) 11.4% 11.7% 24.2% 35.7% 67,173 25.1% 31.6% 54,862 (110,314) (115,071) (5,688)(3,515) (37,447) $21,876 $21,740 267,881 - - -- - 173,522 $890,605 $945,698 SALES SALES2014 OPERATING INCOME 2013 OPERATING INCOME U.S. STORES (1) INTERNATIONAL STORES (1) DIRECT TO CONSUMER MARKETING, GENERAL & ADMINISTRATIVE EXPENSES STORE PRE-OPENING COSTS (2) ALL OTHER, NET (3) TOTAL Q2 ADJUSTED P&L ANALYSIS* 8

Q2 SHARE REPURCHASES 3,825.7 1,459.4 - - $150,000 $60,000 - - $39.21 $41.11 - - 349.7 $16,305 $46.63 $39.73 $99,501 $48.94 $210,000 $115,806 $48.605,285.1 2,382.7 2,033.0 SHARES REPURCHASED SHARES REPURCHASEDCOST COST AVERAGE COST AVERAGE COST FY 2014 FY 2013 FIRST QUARTER SECOND QUARTER THIRD QUARTER FOURTH QUARTER TOTAL 9

CUMULATIVE STORE COUNT - INTERNATIONAL HOLLISTER YEAR END 2007 3 3 6 9 6 9 12 12 12 12 26 29 31 31 77 107 129 131 11 17 18 18 5 8 10 10 8 12 12 12 1 1 1 1 2 3 3 3 1 2 2 2 2 2 2 2 4 7 14 14 3 6 6 6 2 4 7 8 2 2 2 1 1 3 3 2 2 1 1 2 3 1 1 19 38 4 3 3 3 10 18 1 1 2008 2009 2010 2012 2013 Q2 20142011 CANADA UK GERMANY ITALY SPAIN IRELAND SWEDEN HONG KONG BELGIUM FRANCE AUSTRIA CHINA S. KOREA NETHERLANDS POLAND AUSTRALIA JAPAN UAE TOTAL 10

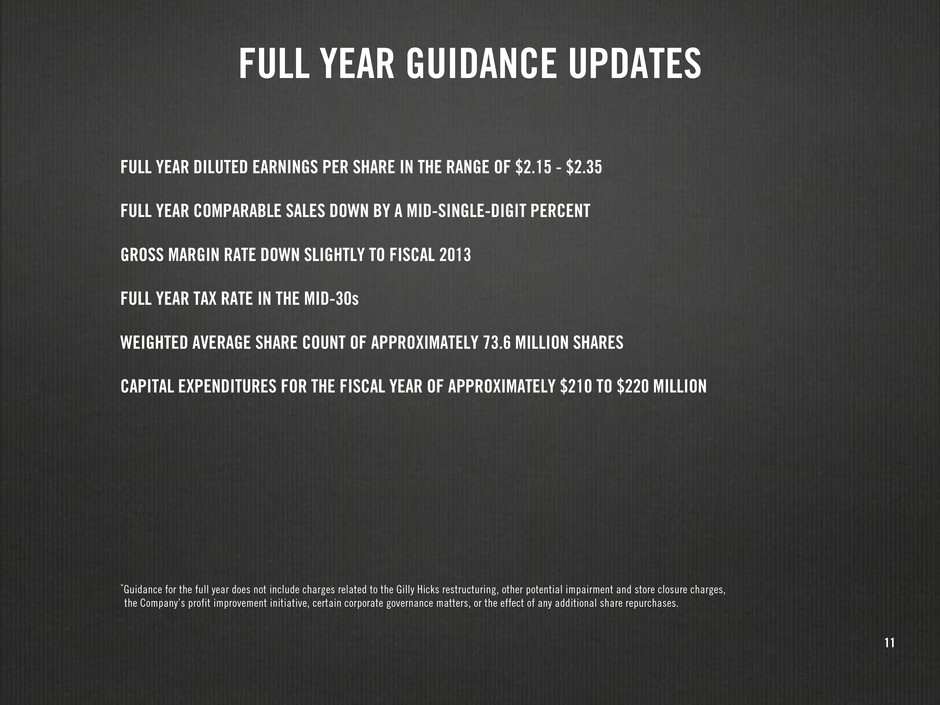
*Guidance for the full year does not include charges related to the Gilly Hicks restructuring, other potential impairment and store closure charges, the Company’s profit improvement initiative, certain corporate governance matters, or the effect of any additional share repurchases. FULL YEAR DILUTED EARNINGS PER SHARE IN THE RANGE OF $2.15 - $2.35 FULL YEAR COMPARABLE SALES DOWN BY A MID-SINGLE-DIGIT PERCENT GROSS MARGIN RATE DOWN SLIGHTLY TO FISCAL 2013 FULL YEAR TAX RATE IN THE MID-30s WEIGHTED AVERAGE SHARE COUNT OF APPROXIMATELY 73.6 MILLION SHARES CAPITAL EXPENDITURES FOR THE FISCAL YEAR OF APPROXIMATELY $210 TO $220 MILLION FULL YEAR GUIDANCE UPDATES 11

Q2 STORE COUNT ACTIVITY * Asia includes Australia and UAE. TOTAL U.S. CANADA EUROPE ASIA *ALL BRANDS HOLLISTER CO. A&F abercrombie kids START OF Q2 2014 OPENINGS CLOSINGS END OF Q2 2014 START OF Q2 2014 OPENINGS CLOSINGS END OF Q2 2014 START OF Q2 2014 OPENINGS CLOSINGS END OF Q2 2014 START OF Q2 2014 OPENINGS CLOSINGS END OF Q2 2014 998 841 18 119 24 117 22 18 5 -- - - - - - -3 21 -- - - -- - - --- - - - - - 2 21 - - -(6) (6) (2) (2) 997 836 276 136 585 456 12 101 101 12454585 2 2 131 133 128 253 279 254 4 13 6 3 2 2 6 3 16 18 (3) (3) 4 15 12

(1) Excluded charges for the second quarter include pre-tax charges of $2.0 million related to the Company’s profit improvement initiative and $0.4 million related to restructuring of the Gilly Hicks brand. (2) Prior period excluded charges, in the first quarter, for a benefit in the effective tax rate primarily as a result of the application of the estimated full year tax rate applied to the year-to-date results. (3) Non-GAAP financial measures should not be used as alternatives to net income and net income per diluted share and are also not intended to supersede or replace the Company’s GAAP financial measures. The Company believes it is useful to investors to provide the non-GAAP financial measures to assess the Company’s operating performance. $0.19 $14,062 $19,856 5,794 $0.17 73,75673,756 $12,877 $17,473 4,596 788 410 $1,595 $(410) $2,383 - GAAP EXCLUDED CHARGES(1) ADJUSTED NON-GAAP (3) PRIOR PERIOD EXCLUDED CHARGES(2) INCOME (LOSS) BEFORE TAXES TAX (BENEFIT) EXPENSES NET (LOSS) INCOME NET INCOME (LOSS) PER DILUTED SHARE DILUTED WEIGHTED-AVERAGE SHARES OUTSTANDING: APPENDIX: RECONCILIATION OF Q2 2014 NON-GAAP FINANCIAL MEASURES 13 (IN THOUSANDS, EXCEPT PER SHARE DATA) (UNAUDITED) THIRTEEN WEEKS ENDED AUGUST 2, 2014

(1) Excluded charges for the year to date period include pre-tax charges of $6.9 million for legal, advisory and other charges related to certain corporate governance matters, $6.1 million related to restructuring of the Gilly Hicks brand, and $5.0 million related to the Company’s profit improvement initiative. (2) Non-GAAP financial measures should not be used as alternatives to net loss and net loss per basic and diluted share and are also not intended to supersede or replace the Company’s GAAP financial measures. The Company believes it is useful to investors to provide the non-GAAP financial measures to assess the Company’s operating performance. $0.01 $1,083 $1,951 868 $(0.15) $(10,794) $(16,030) (5,236) $11,877 6,104 $17,981 73,459 74,741 GAAP EXCLUDED CHARGES(1) ADJUSTED NON-GAAP (2) INCOME (LOSS) BEFORE TAXES TAX EXPENSE (BENEFIT) NET INCOME (LOSS) NET INCOME (LOSS) PER DILUTED SHARE DILUTED WEIGHTED-AVERAGE SHARES OUTSTANDING APPENDIX: RECONCILIATION OF 2014 YTD NON-GAAP FINANCIAL MEASURES 14 (IN THOUSANDS, EXCEPT PER SHARE DATA) (UNAUDITED) TWENTY-SIX WEEKS ENDED AUGUST 2, 2014

15 APPENDIX: RECONCILIATION OF Q2 2013 NON-GAAP FINANCIAL MEASURES (1) Excluded charges for the second quarter include pre-tax charges of $2.6 million related to the Company’s profit improvement initiative. (2) Non-GAAP financial measures should not be used as alternatives to net loss and net loss per basic and diluted share and are also not intended to supersede or replace the Company’s GAAP financial measures. The Company believes it is useful to investors to provide the non-GAAP financial measures to assess the Company’s operating performance. $0.16 $13,015 $19,990 6,975 $0.14 $11,370 $17,415 6,045 $1,645 930 $2,575 79,267 79,267 GAAP EXCLUDED CHARGES(1) ADJUSTED NON-GAAP (2) INCOME (LOSS) BEFORE TAXES TAX EXPENSE (BENEFIT) NET INCOME (LOSS) NET INCOME (LOSS) PER BASIC & DILUTED SHARE BASIC & DILUTED WEIGHTED- AVERAGE SHARES OUTSTANDING (IN THOUSANDS, EXCEPT PER SHARE DATA) (UNAUDITED) THIRTEEN WEEKS ENDED AUGUST 3, 2013

(1) Excluded charges for the year to date period include pre-tax charges of $2.6 million related to the Company’s profit improvement initiative. (2) Non-GAAP financial measures should not be used as alternatives to net loss and net loss per basic and diluted share and are also not intended to supersede or replace the Company’s GAAP financial measures. The Company believes it is useful to investors to provide the non-GAAP financial measures to assess the Company’s operating performance. $0.07 $5,812 $4,441 (1,371) $0.05 $4,167 $1,866 (2,301) $1,645 930 $2,575 79,709 79,709 GAAP EXCLUDED CHARGES(1) ADJUSTED NON-GAAP (2) INCOME (LOSS) BEFORE TAXES TAX EXPENSE (BENEFIT) NET INCOME (LOSS) NET INCOME (LOSS) PER DILUTED SHARE DILUTED WEIGHTED-AVERAGE SHARES OUTSTANDING APPENDIX: RECONCILIATION OF 2013 YTD NON-GAAP FINANCIAL MEASURES 16 (IN THOUSANDS, EXCEPT PER SHARE DATA) (UNAUDITED) TWENTY-SIX WEEKS ENDED AUGUST 3, 2013
