Attached files
| file | filename |
|---|---|
| 8-K - CURRENT REPORT - BOB EVANS FARMS INC | d781426d8k.htm |
 Investor Presentation
August 2014 (revised 8.27.14)
Steve Davis, Chairman and Chief Executive Officer
Mark Hood, Chief Financial Officer
Scott Taggart, VP, Investor Relations
1
Exhibit 99.1 |
 Safe
Harbor Statement 2
Under the Private Securities Litigation Reform Act of 1995
Certain statements in this presentation that are not historical facts are
forward-looking statements. Forward-looking statements involve various
important
assumptions,
risks
and
uncertainties.
Actual
results
may
differ
materially
from
those
predicted
by
the
forward-looking
statements because of
various factors and possible events, including, without limitation:
Negative publicity or litigation regarding allegations of food-related
illness, Failure to achieve and maintain positive same-store sales,
Changing business conditions, including energy costs,
Overall macroeconomic conditions that may affect consumer spending, either
nationwide or in one or more of the Company’s major markets Competition
in the restaurant and food products industries, Ability to control restaurant
operating costs, which are impacted by market changes in the cost or availability of labor and food, minimum wage and
other employment laws, health care costs, fuel and utility costs,
Changes
in
the
cost
or
availability
of
acceptable
new
restaurant
sites,
Adverse weather conditions in locations where we operate our restaurants,
Consumer acceptance of changes in menu offerings, price, atmosphere and/or service
procedures, Consumer
acceptance
of
our
restaurant
concepts
in
new
geographic
areas,
and
Changes in hog and other commodity costs.
We also bear the risk of incorrectly analyzing these risks or developing strategies
to address them that prove to be unsuccessful. Certain
risks,
uncertainties
and
assumptions
are
discussed
under
the
heading
“Risk
Factors”
in
Item
1A
of
our
Annual
Report
on
Form
10-K
for the fiscal
year ended April 25, 2014. We note these factors for investors as
contemplated by the Private Securities Litigation Reform Act of 1995. It is impossible to
predict or identify all such risk factors. Consequently, you should not
consider any such list to be a complete set of all potential risks and uncertainties.
Forward-looking statements speak only as of the date on which they are made,
and we undertake no obligation to update any forward-looking statement
to reflect circumstances or events that occur after the date on which the statement
is made to reflect unanticipated events. Any further disclosures in our
filings with the Securities and Exchange Commission should also be consulted.
All subsequent written and oral forward-looking statements attributable to
us or any person acting on behalf of the company are qualified by the cautionary
statements in this section. |
 COMPANY FACT
SHEET FISCAL 2015 Q1
NASDAQ: BOBE
NEW RESTAURANTS
FY’14 4
FY’15E up to 8
562 Restaurants
19 States
as of 7/25/14
192
60
16
21
3
51
31
39
8
2
7
28
23
3
17
7
4
48
AVERAGE UNIT VOLUME
$1.71 million (FY’
14)
2
Bob
Evans
Farms,
Inc.
is
comprised
of
two
key
business
segments:
Bob
Evans
Restaurants
and
BEF
Foods.
Bob Evans
Restaurants operates 562 full-service restaurants located in 19 states with a heavy
concentration in the Midwest. BEF Foods produces and distributes refrigerated
side dishes, pork sausage and a variety of refrigerated and frozen convenience food
items through retail and food service channels. .
FOUR KEY LINES OF BUSINESS
Sausage, Refrigerated Sides, Frozen and Food Service
Sold at 30,000+ retail locations in 50 states and Mexico 3
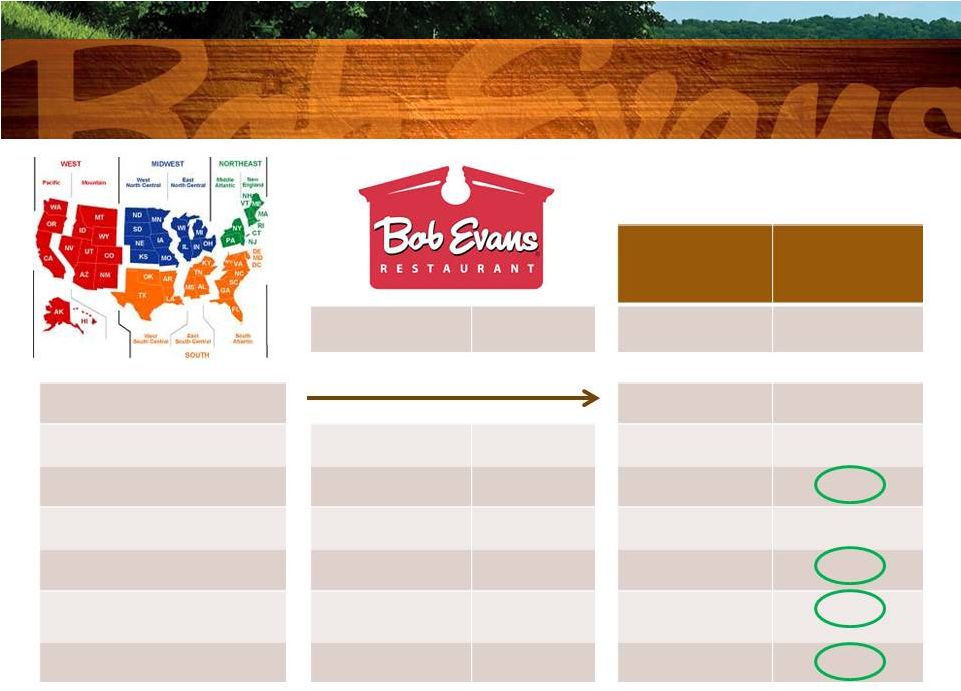
Bob Evans Growth Opportunity Markets
Bob Evans Core Markets
Bob Evans Farms Investor Relations
www.bobevans.com
8111 Smith’s Mill Road
New Albany, Ohio 43054
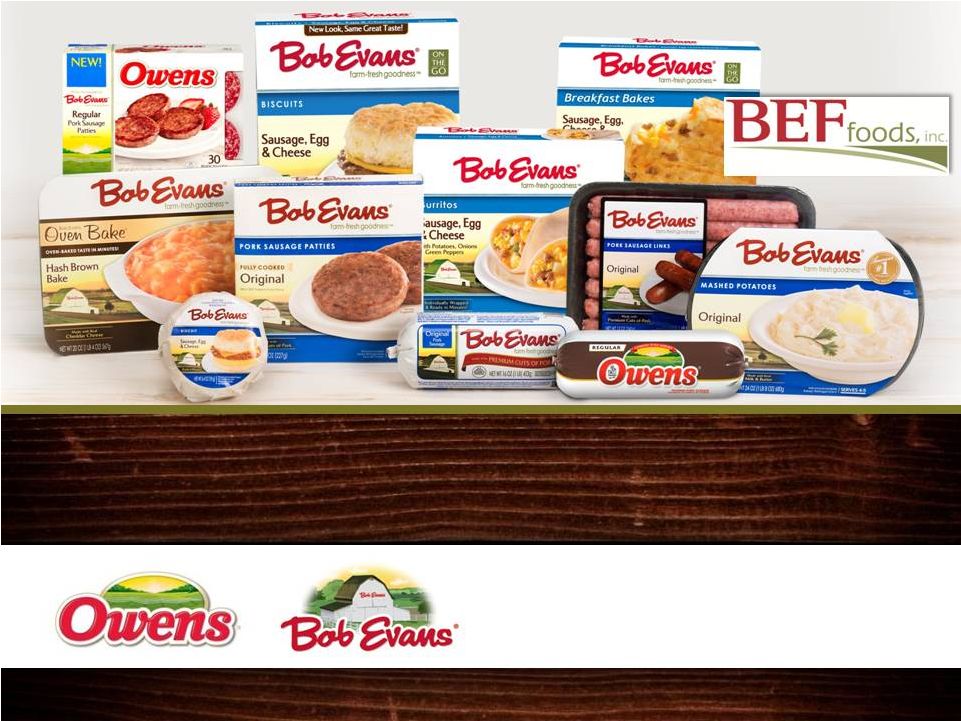
GROWING OUR REGIONAL BRANDS INTO POWERFUL
NATIONAL BRANDS |
 4
Powerful
NATIONAL
BRANDS
Make
Our
REGIONAL
BRANDS
BOB EVANS RESTAURANTS
BEF FOODS, INC. |
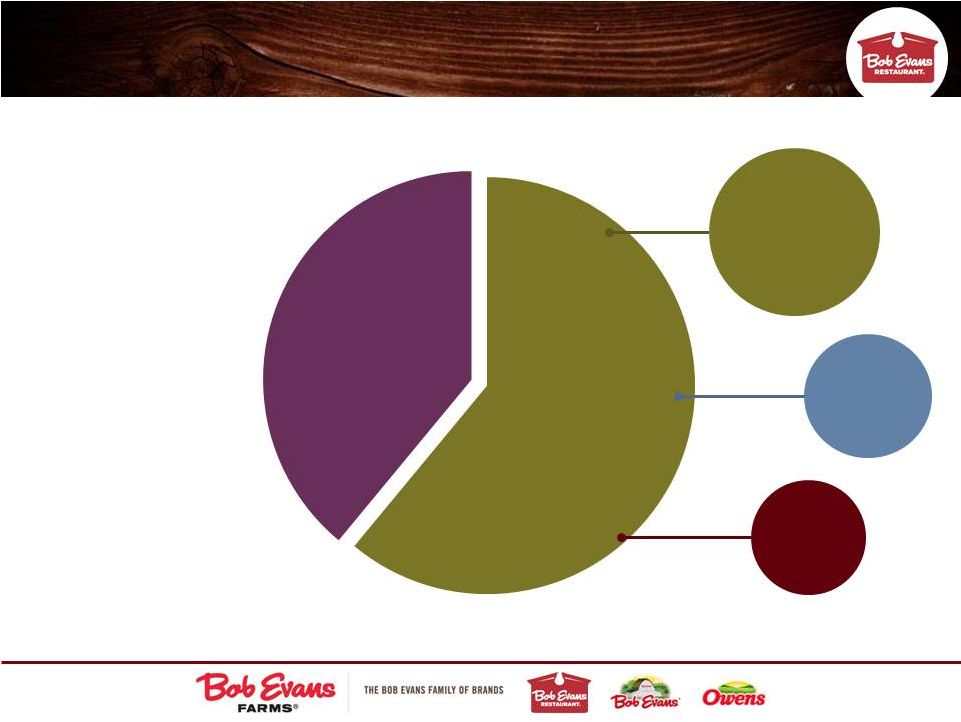
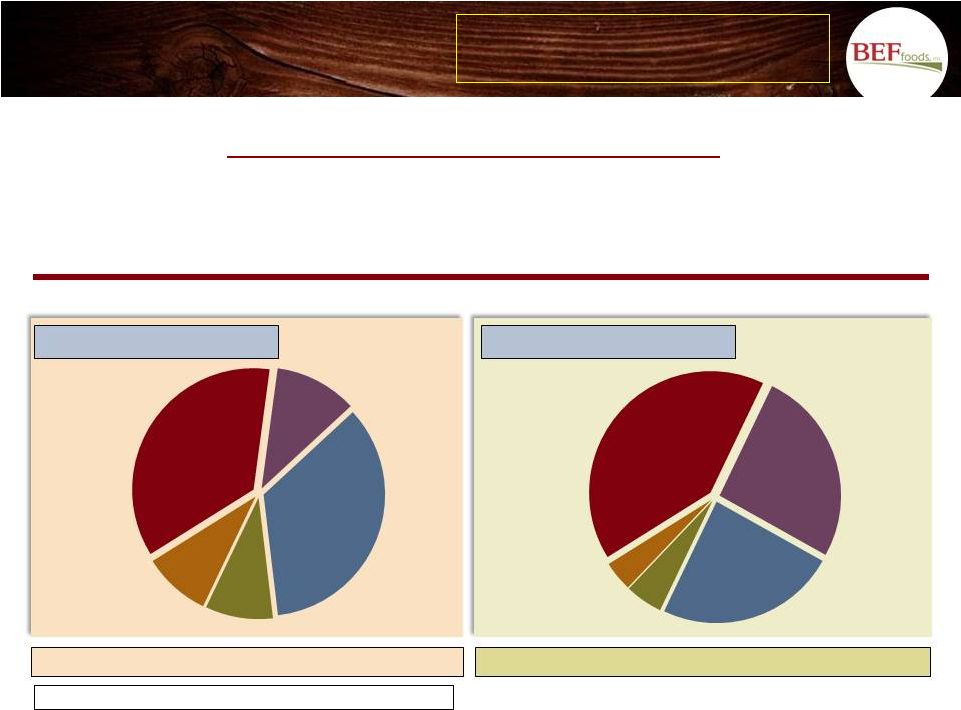
 Business
Segments
(FY
2014)
5
28%
72% |
 Bob
Evans is Well-Positioned to Capture Both Grocery and Restaurant
Consumption Percent Dollars Spent Over Time
6
35%
40%
45%
50%
55%
60%
65%
82
83
84
85
86
87
88
89
90
91
92
93
94
95
96
97
98
99
00
01
02
03
04
05
06
07
08
09
10
11
12
13
Restaurant
Grocery
$13
Billion+
(The value of a
single share
point)
Source: IFMA Forecast & Outlook
‘82-’11 Technomic
’12-‘13 |
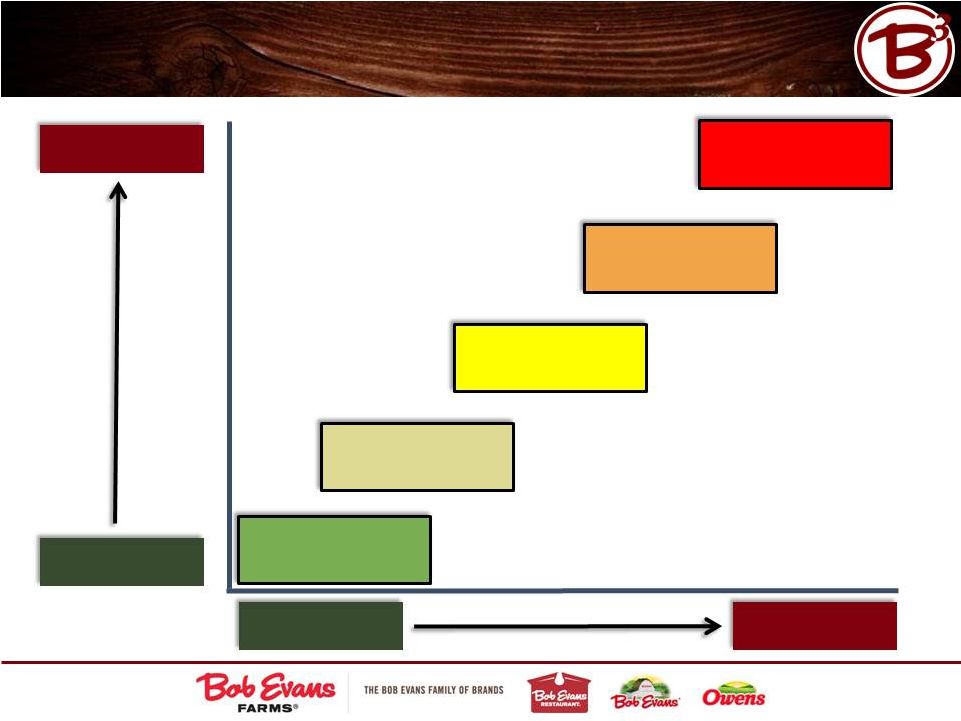
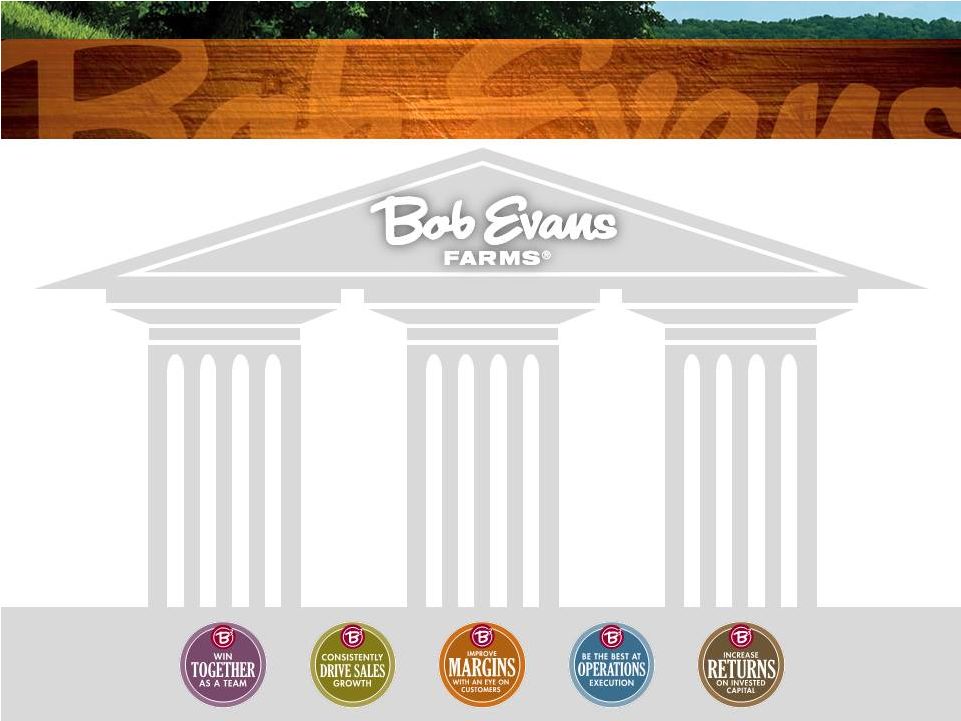 Our
Shareholder Value Creation Guiding Principles
7
PROFITABLY
PROFITABLY
GROW &
GROW &
CONTINUE
CONTINUE
TO TRANSFORM
TO TRANSFORM
OUR CORE
OUR CORE
BUSINESS
BUSINESS
DRIVE
DRIVE
SHAREHOLDER
SHAREHOLDER
VALUE WITH
VALUE WITH
DISCIPLINED
DISCIPLINED
CAPITAL
CAPITAL
ALLOCATION
ALLOCATION
SELECTIVELY
SELECTIVELY
INVEST IN
INVEST IN
HIGH R.O.I.C.
HIGH R.O.I.C.
GROWTH
GROWTH
OPPORTUNITIES
OPPORTUNITIES
(Internal & External)
(Internal & External) |
 8
Our Plan: Transformed and Poised for Growth
Farm Fresh Refresh Completed
Up to 8 New Restaurants in FY15
10-12 Annually Thereafter
10-20 BEX to be
Licensed/Franchised Annually
Side Dish Vertical Integration
Sausage Network Optimization
Transportation Consolidation
Capital and Resource Allocation
Enterprise Resource Planning
Margin Innovation
Bob Evans Restaurants
Bob Evans Foods
Corporate |
 9
Significant Asset Closures/Dispositions:
Over $125 Million of Asset Dispositions Since FY06
Asset
Consolidation
Sausage operations
(five facilities into two)
Ready-to-eat
operations
(four facilities into one)
Business
Closure
76 restaurants closed
Business
Reengineering
Direct-store-delivery to
warehouse conversion
Springfield, OH
transportation center
(four facilities into one)
Business
Sold/Divested
Mimi’s Cafe
Springfield, Ohio
distribution center
The Board does not hesitate to re-evaluate strategic decisions;
every business asset is subject to a review every quarter
Mimi’s Café
(California)
Headquarters closures
Owens HQ (Texas) |
 Key
Components of 10-12% Long-Term Diluted EPS Growth Guidance
10
3.0% to 3.5%
sales forecasting/labor management
food cost optimization
menu management
back-of-the-house optimization
side dish vertical integration
implement lean manufacturing
w/side dish production
transformational systems upgrades
Refinancing/interest reduction
ERP implementation
6.0% to 7.0%
Avg. Annual Net Sales
Growth:
Margin Innovation:
(300-350 basis point
improvement)
same-store sales and new
restaurants expected to
contribute equally to net sales
growth (~1.50% to 1.75% each)
expand points of distribution and
average SKU count per point of
distribution
refrigerated side dish and food
service products to drive growth
up to10 new restaurants
annually |
 11
BOBE’S Strategic and Balanced Approach to Capital Allocation Drives
Significant Shareholder Value
INTERNAL FACTORS
Potential future investment opportunities
Lifecycle stage of firm
Projected operating performance
Regularity and certainty of income
Structure of assets
Financial covenants
Desire to return capital
Period and purpose of financing
EXTERNAL FACTORS
Macroeconomic environment
Economic fluctuations
Seasonal variations
Nature of industry competition
Capital market conditions
Bank market conditions
Nature/orientation of investors
Statutory requirements
Taxation policy
Maximize
flexibility
Minimize
financial risk
Minimize
cost of capital
Maximize return
to shareholders
Minimize
complexity
Between Fiscal Year 2007 and 2014, BOBE returned over $800 million
to shareholders through dividends and share repurchases
DRIVE
OPTIMAL CAPITAL
STRUCTURE |
 12
A Track Record of Balanced Capital Allocation
Fiscal 2007-2012
Bob Evans has returned meaningful capital to stockholders in a prudent, consistent
fashion Debt Repayment
Capex
Share Repurchases
Dividends
Acquisition
Fiscal 2013
Over $800 million returned
to stockholders through
share repurchases and
dividends since FY07
Fiscal 2014
FY15 Capex expected to
be $85 to $90 million, in-
line with historical average
$339M
$485M
$167M
$130M
$52M
$30M
$118M
$63M
$191M
$225M |
 13
Track Record of Meaningful Dividends and
Share Repurchase
Trailing 12-month yield
(8/8/14):
BOBE: 2.6%
S&P 500: 1.9%
Annual Dividend Per Share has Doubled Since FY08
Weighted Average Diluted Shares Decreased by 27% since FY07 (000’s)
36,484
33,315
30,744
30,890
30,422
29,925
28,488
26,704
FY 2007
FY 2008
FY 2009
FY 2010
FY 2011
FY 2012
FY 2013
FY 2014
FY 2007
FY 2008
FY 2009
FY 2010
FY 2011
FY 2012
FY 2013
FY 2014
$0.54
$0.56
$0.60
$0.68
$0.78
$0.95
$1.075
$1.205 |
 14
Weighted Average Diluted Shares Outstanding (000’s)
Ongoing Share Repurchase Programs have Reduced
Diluted Shares Outstanding by 27%
Since Fiscal 2007
36,484
33,315
30,744
30,890
30,422
29,925
28,488
26,704
23,000
25,000
27,000
29,000
31,000
33,000
35,000
37,000
FY 2007
FY 2008
FY 2009
FY 2010
FY 2011
FY 2012
FY 2013
FY 2014 |
 Annual Dividend has Doubled Over the Last Five Years
15
Trailing 12-month
yield
(7/3/14):
BOBE –
2.4%
S&P 500 –
1.9%
$0.54
$0.56
$0.60
$0.68
$0.78
$0.95
$1.075
$1.205
FY 2007
FY 2008
FY 2009
FY 2010
FY 2011
FY 2012
FY 2013
FY 2014 |
 16
($ millions)
Capital Expenditures
2
Transforming our Company and
Rewarding
Shareholders
1
For additional details concerning FY 2015 guidance, see the Company’s 1Q Fiscal
2015 earnings release dated August 26, 2014. 2
Note: excludes Mimi’s Café.
Share Repurchases
1
Since FY’07, annual capital
expenditures have averaged
approximately
$80
million.
$69
$155
$5
$21
$19
$70
$63
$225
up to
$100
$45
$64
$65
$41
$39
$81
$118
$191
$85-$90
$0
$50
$100
$150
$200
$250
2007
2008
2009
2010
2011
2012
2013
2014
2015E
2 |
 17
($ millions)
Investing Efficiently with Prudent Debt Management
1
Note: excludes Mimi’s Café.
Net Debt
Capital Expenditures
1
$177
$276
$238
$173
$92
$100
$193
$452
$45
$64
$65
$41
$39
$81
$118
$191
$0
$100
$200
$300
$400
$500
2007
2008
2009
2010
2011
2012
2013
2014 |
 Target Leverage Ratio In-line with Other
Restaurant Companies
18
Adjusted net debt peer average (ex-BOBE):
3.4x
Adjusted Leverage Benchmarking Analysis
Note:
Rent expense is capitalized at 8.0x; LTM EBITDAR represents LTM EBITDA plus
annualized rent expense for the most recent filing; balance sheet data
based on latest publicly available information as of 7/25/14.
(a)
(b)
(c)
Franchise Mix
(a)
11%
98%
91%
11%
2%
45%
0%
26%
0%
0%
0%
17%
56%
Real Estate
Ownership
(b)
82%
36%
21%
20%
84%
83%
86%
8%
0%
66%
3%
36%
26%
BOBE’s 7/25/14 leverage ratio:
3.69x 6.2x
5.8x
4.3x
4.3x
4.1x
3.0x
3.0x
2.9x
2.9x
2.6x
2.1x
1.1x
1.0x
Owned property applies to both land or building and accounts for only company-operated
restaurants based on most recently available filings.
Data excludes Red Lobster.
Defined as number of franchised locations as a percentage of total systemwide units based on most
recent quarterly filings as of 7/25/14. |
 19
Focused on Low-Cost, Flexible Financing
Revolving
Credit Facility
Incremental
Term Debt
Secured
Financing
Unsecured
Bonds
Sale
Leaseback
Minimally
Minimally
restrictive
restrictive
Highly
Highly
restrictive
restrictive
Low
Low
cost
cost
High
High
cost
cost |
 1
See reconciliation of Adjusted Operating Income (non-GAAP) to Reported
Operating Income (GAAP) in the Appendix of this presentation. Mimi’s
Café Divestiture Improves Adjusted
Operating Margin
1
Profile
20
FY 2015E
FY 2013
7.8%
8.8%
8.1%
4.4%
3.5%
4.2%
FY 2014
Significant FY ‘14 Costs:
($ millions)
4.8-5.2%
6.2-8.2%
5.3-6.1%
BER
BEF
Consol
BER
BEF
Consol
BER
BEF
Consol
BER: Severe winter weather -
$13
BER: FFR remodel costs -
$7
BER: Workforce management -
$2.5
BEF: Supplier dispute -
$4
BEF: Plant startup inefficiencies -
$6
Corp: Activist stockholder costs -
$3
Corp: Strengthening internal controls -
$3 |
 1
For additional details concerning FY 2015 guidance, see the Company’s 1Q
Fiscal 2015 earnings release dated August 26, 2014.
21
Key Drivers of FY’14 to FY’15 Margin Expansion
FY 2014
4.8-5.2%
6.2-8.2%
5.3-6.1%
Key FY ’15 Drivers
1
Bob Evans Restaurants
•
SSS: 1.5% to 2.5%
•
up to 8 new restaurants
BEF Foods
•
•
Corporate
•
Activist stockholder costs
~$6.5M
•
Strengthening internal
controls ~$2.0M
BER
BEF
Consol
10 to 12% net sales growth
on 2014 base of $372M
(excludes ~$22M interco
sales)
Efficiencies from plant
network
consolidation/optimization
and supply integration
BER
BEF
Consol
4.4%
3.5%
4.2%
FY 2015E
1 |
 $10M
of Mimi’s Café Carryover Costs Eliminated,
Further Savings Opportunities Remain
22 |
 *
40% sales flow-through assumed Farm Fresh Refresh Financial Impact
Improves Free Cash Flow in FY2015
-$3.1
23
($ millions)
4/25/14 -
4/24/15
-$7.2
-$6.8
$2.5
$2.4
$2.0
$4.3
$4.8
$0.0
FY2012
FY2013
FY2014E
FY2015E
Est. Closed Day Sales Impact*
Expenses
-
-
-
-
-
$1.1
-
# of remodels
195
0
87
229
Impact
to P&L |
 1
See reconciliation of Adjusted Operating Income (non-GAAP) to Reported
Operating Income (GAAP) in the Appendix of this presentation. Strategic Plant
Network Optimization Leading to a New Adjusted Operating Margin
1
Trajectory at BEF Foods
24
8.8%
3.5%
11.8-12.3%
6.2-8.2%
FY13
FY14
FY15E
FY18E
2Q’14:
2Q’14:
Richardson, Texas, fresh sausage plant closure
3Q’14:
3Q’14:
Completion
of
Bidwell
and
Springfield,
Ohio
plant
consolidations
to state-of-the-art Sulphur Springs, Texas plant
FY’14:
FY’14:
Vertical
integration
and
expansion
of
Kettle
Creations’
Lima,
Ohio,
plant |
 1
See reconciliation of Adjusted Operating Income (non-GAAP) to Reported
Operating Income (GAAP) in the Appendix of this presentation. 25
Transformations Drive Estimated Five-Year 300-350
Adjusted Operating Margin Basis Point Improvement
4.8-5.2%
6.2-8.2%
5.3-6.1%
BER
BEF
Consol
FY 2013
7.8%
8.8%
8.1%
FY 2015E
FY 2018E
BER
BEF
Consol
11.2-11.8%
11.8-12.3%
10.8-11.3%
1
BER
BEF
Consol |
 26
“Get in on something good”
562 restaurants in 19 states
as of 7/25/14
Full-service family restaurants featuring a
wide variety of menu items for both on-and-off premise dining
TM |
 Net
Sales (FY 2014) $957 million Average Annual Unit Sales (FY
2014) $1.71 million Overview: Bob Evans Restaurants
ALL THREE DAYPARTS SERVED (1Q FY 2015)
Breakfast
Lunch
Dinner
27
34%
36%
30%
Avg. Dine-In Guest Check/Per Guest (1Q FY 2015) $18.25/$9.21
Average Carryout Check (1Q FY 2015) $14.93 |
 Accelerated Farm Fresh Refresh Program:
-
Completed April 2014 -
28
Dining Room &
Lobby
Restrooms
Bakery,
Catering &
Carryout
Exterior,
Signage,
& Landscaping
CapEx Summary
(24% growth
capital, 76% maintenance capital)
44%
10%
24%
22%
FY11
FY12
FY13
FY14
5%
20%
100%
56%
(32 units)
(87 units)
(195 units)
(229 units)
Approximate % of Chain Remodeled by Fiscal Year
Average capital investment per remodeled restaurant: ~$225k
|
 BER:
Remodeled and Ready to Grow 29
Recently completed Farm Fresh
Refresh
o
First comprehensive remodeling
program in brand history
o
76% maintenance capex and 24%
growth capex
o
Refreshed restaurants have
consistently outperformed non-
refreshed restaurants
We are confident BER has exciting
growth potential:
o
New sales layer growth (e.g.,
carryout, Broasted platform and
five-dollar soups to go)
o
Leveraging our regional strength
to catalyze new unit growth
o
Developing
the
compelling
new
Bob
Evans
Express
("BEX")
license/franchise format
Farm Fresh Refresh Transformation
Exciting New Restaurant Design
Compelling New BEX Growth Format |
 30
Refreshed stores consistently outperformed the non-refreshed stores over
the last three years
The Company Recently Completed a Multi-Year
Renovation Program
Dining Room &
Lobby
Restrooms
Bakery,
Catering &
Carryout
Exterior,
Signage,
& Landscaping
CapEx Summary
(76% maintenance capital, 24% growth capital)
Average Capital Investment per
Remodeled Restaurant: ~$225K
According to WD Partners and Nation’s Restaurant News, Bob Evans has
made significant progress in areas of food quality, value, service, menu
variety
and
atmosphere,
and
took
top
position
in
the
“cleanliness”
category
44%
10%
24%
22%
(1) Nation’s Restaurant News, Consumer Picks, March 24, 2014.
Farm
Fresh
Stores
–
Incremental
SSS
(Year-One Stores vs. Non-Refreshed Stores)
4.3%
4.8%
2.6%
3.6%
4.5%
4.0%
2.2%
2.8%
2.7%
3.4%
3.6%
FY12
Q1
FY12
Q2
FY12
Q3
FY12
Q4
FY13
Q1
FY13
Q2
FY13
Q3
FY13
Q4
FY14
Q1
FY14
Q2
FY14
Q3
1 |
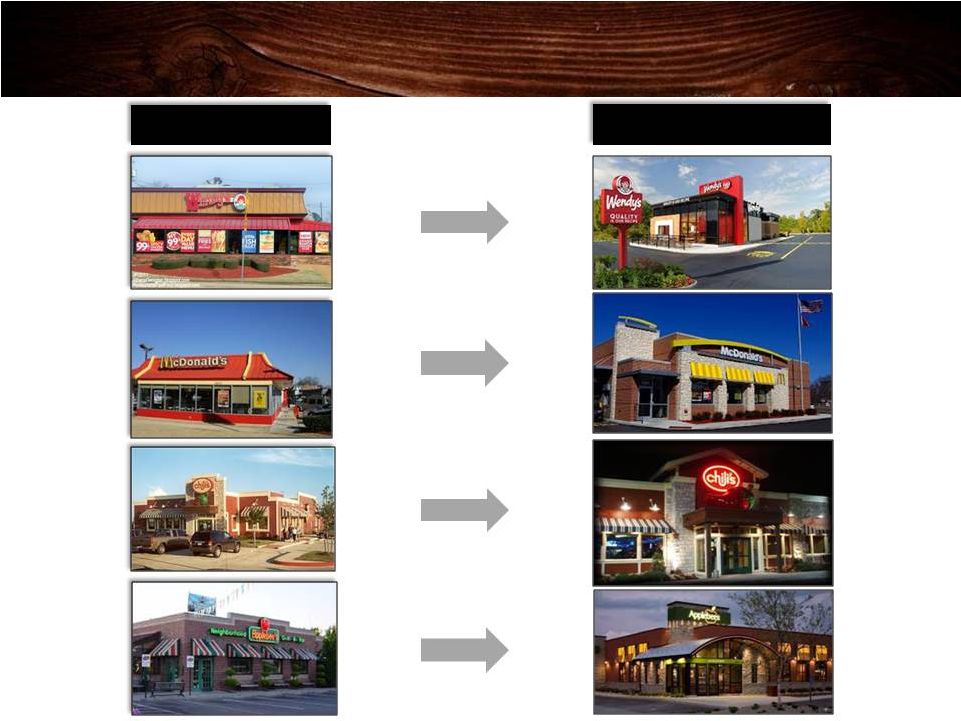 Aspirational Concepts Reimage their Brands to
Remain Relevant
31
Before
After |
 Dinner is Our Challenge….and Opportunity
32
First-Quarter Fiscal 2015 SSS% Daypart Performance
Daypart
On-Premise
Off-Premise
Total
-1.2%
-1.6%
-4.0%
-2.1%
Breakfast
0.1%
7.4%
0.7%
Lunch
-2.3%
0.3%
-2.0%
Dinner
-5.6%
0.5%
-4.7%
Total
-2.5%
1.9%
-2.0% |
 BE
Outperformed Knapp Family Trends in key geographies for first quarter of
FY15 Same Store
Sales Trend
(%)
Same Store
Sales Trend
(%)
States
# BE
Restaurants
Family
Excluding BE
BE
Total U.S
-1.6
-2.0
West North Central
KS, MO
24
-1.3
-4.0
East North Central
IL, IN, OH, MI
318
-2.8
-2.2
East &West South Central
AR, KY, TN
28
-2.0
-5.0
FLA
N/A
48
-1.9
+4.5
South Atlantic
DE, MD, NC, SC,
VA , WV
94
-3.6
-2.4
Mid Atlantic
NJ, NY, PA
49
-4.4
-3.2
Source: Knapp Track May/June/July results, Family Category. Category trend
aggregated results of participants |
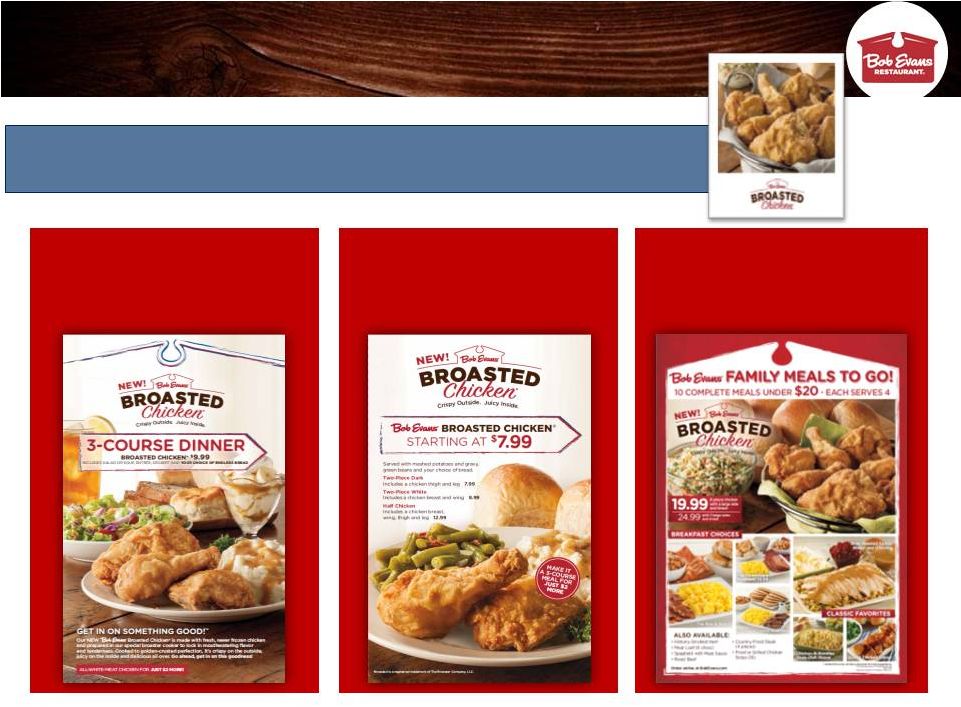 New
Broasted Chicken Platform 34
Quickly rose to top-selling item in the Cincinnati test market,
replacing the long-time best seller Rise & Shine Breakfast
3-Course meal
starting at $9.99
2-Piece meal at
$7.99
Family Meals to Go
at $19.99 |
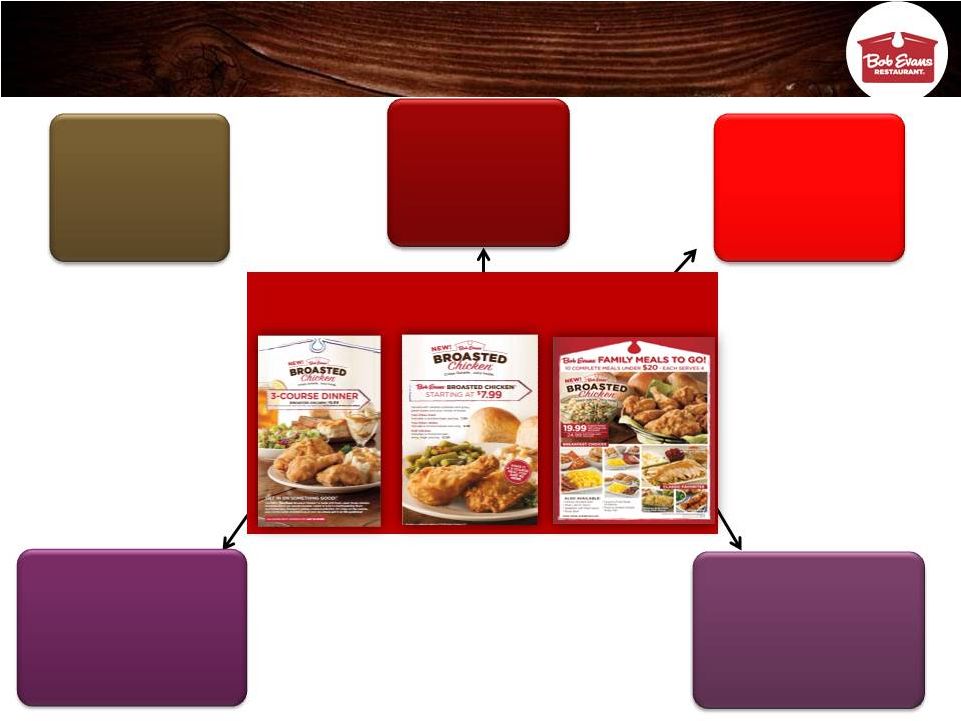 Positioning Broasted Chicken Will Immediately
Impact 68% of the Business, and Ultimately 100%
35
Lunch
36%
Dinner
30%
2-Piece meal
at $7.99
Family Meals to Go
at $19.99
3-Course meal
starting at $9.99
Breakfast
34%
Dine-In
66%
(lunch & dinner)
Off-Premise
~12% |
 Dine-In Value Sales Layers
36
BREAKFAST
Rise & Shine Breakfast
~ $65 million / 7%
of annual revenue.
LUNCH
$7.99 Knife & Fork and
Lunch Combos
~ $40 million / 4%
of annual revenue.
3-Course Dinners
~ $72 million / 8%
of annual revenue.
DINNER |
 Bob
Evans’ Off-Premise Opportunity
37
Annual Consumption of Restaurant Meals (per capita)
Dine-In
39%
Off-Premise
61%
QSR
74%
FULL
SERVICE
16%
Source: NPD Group -
12 months ending 4/30/14
FAMILY
SEGMENT
10% |
 +8.6%
+8.6%
Bold Goal: Drive Off-Premise to 25% of Sales Mix
Off-Premise Sales Mix and Growth % by Year
Sales Mix
Growth %
38
+5.3%
+5.3%
+8.5%
+8.5%
+3.9%
+3.9%
+0.6%
+0.6%
+15.4%
+15.4%
+12.9%
+12.9%
+7.9%
+7.9%
+2.4%
+2.4%
2014
8.0%
7.5%
6.5%
7.0%
8.5%
9.0%
9.5%
12.0%
11.5%
11.0%
10.5%
10.0%
2006
2007
2008
2009
2010
2011
2012
2013
12.5%
Family Meals to Go
Bakery
Catering/Carryout |
 Off-Premise Sales Layers
39
CATERING
FY 2014 Growth / Mix
13.1% / 0.6%
BAKERY
FY 2014 Growth / Mix
18.5% / 1.7%
CARRYOUT
FY 2014 Growth / Mix
1.8% / 11.7% |
 Leveraging a Remodeled Base: Product and Operational Innovation to
Drive Positive Same-Store Sales in FY'15 and Beyond
40
Menu Innovation
Operational Innovation
Labor
Management
Carryout Service
Enhancements
New Kitchen
Technology &
Equipment
Objectives:
Drive traffic
Increase avg. check
Leverage off-premise
Enhance margins
Carryout
Catering
Bakery
New Sales Layers
All Initiatives
Rigorously Tested
KDS (kitchen
displays)
Clamshell grill
Broaster
Batch holding |
 New
Restaurant Opening Strategy 41
NEW CONTIGUOUS MARKETS
FILL-IN EXISTING MARKETS
4 new restaurants opened FY 2014.
4 new restaurants opened FY 2014.
Open up to 8 new restaurants during FY 2015.
Open up to 8 new restaurants during FY 2015.
Altoona, PA
Harrison, OH |
 Reduced
building cost by approximately 13%
through efficient design in
Finneytown, OH and
Altoona, PA
Objectives:
•
•
•
42
Accentuate Farm heritage
Leverage Farm Fresh
Refresh program insights
Test new “back-of-the-
house”
technologies and
layouts
New Restaurant Prototype:
Brand relevant/lower investment |
 Bob
Evans Express Licensing Opportunity •
Popular favorites covering all
dayparts
•
High quality menu to ensure
serving guests in a quick manner
•
License up to 10 new locations by
the end of FY 2015
•
Potential to independently
develop locations
Bob Evans Express produces four
revenue streams:
1.
A one-time licensing fee of up to $15k;
2.
A royalty fee of up to 6% of gross
sales;
3.
An ad fund of up to 4% of gross sales;
and
4.
Products “insourced”
from Bob Evans
Farms Foods business.
43
•
•
First location, BMW USA manufacturing plant
First location, BMW USA manufacturing plant
in Spartanburg, SC, opened August 2013
in Spartanburg, SC, opened August 2013
•
•
Second location, Bob Evans Farms, Inc.
Second location, Bob Evans Farms, Inc.
corporate headquarters, opened October 2013
corporate headquarters, opened October 2013
•
•
Finalizing details for airport and mall locations
Finalizing details for airport and mall locations
to open late summer/ early fall
to open late summer/ early fall |
 44
Revolutionary People Development/Culture
Drive profitable guest counts –
on and
off-premise by being relevant and reliable
Improve controllable expenses: Cost of Sales,
Cost of Labor, Direct Operating Expenses
Deliver the brand promise through a “Best for
my Guest”
experience both on and off-premise
Successfully open up to 8 new Bob Evans
Restaurants and license up to 10 BE Express
locations
FY’15 Vital Few Priorities |
 “Discover farm-fresh goodness ”
TWO BRANDS
distinct geographic strengths
45
TM |
 Overview: BEF Foods
46
FOUR KEY LINES OF BUSINESS
Sausage, Refrigerated Side Dishes, Frozen and Food Service
Sold at 30,000+ retail locations in 50 states and Mexico
sausage mix (% of total sales): 42%
sausage mix (% of total sales): 33%
Net Sales (FY’14) $387 million
28% of total
*Note: Insourced sales data reflects sales to Bob Evans Restaurants.
FY 2010 Sales Mix (pounds)
Food Service
Side
Dishes
36%
11%
35%
9%
9%
Other
Frozen
Retail
Sausage
FY 2014 Sales Mix (pounds)
Side
Dishes
Food
Service
(4% insourced*)
Other
4%
Frozen
5%
Retail Sausage
41%
26%
24%
(2% insourced*) |
 Source:
IRI BEF Foods: Store/SKU Count
11.6
11.7
10.2
17
2010
Q1 2014
Q1 2015
2018
average SKUs per store
28,407
31,382
31,181
40,000
2010
Q1 2014
Q1 2015
2018
#
of
stores
47 |
 CORE MARKETS
NON CORE MARKETS
SKUs/Store ACV
BEF Foods: SKU Count and ACV Distribution
Core vs. Non-Core
SOURCE: IRI, Q1, FY15 ending 7/13/14
Core Market: Chicago, Cincinnati, Cleveland, Columbus, Toledo, Detroit, Grand Rapids,
Indianapolis, Peoria/Springfield, Pittsburgh, Philadelphia, Baltimore/Washington,
Buffalo/Rochester
Opportunity
in Non-Core
Markets
SKUs/Store ACV
SKUs/Store ACV
SKUs/Store ACV
Q1 FY 14
Q1 FY 15
FY ‘14
FY15
81.4
67.7
67.9
7.1
8.9
21.3
81.4
21.9
48 |
 BEF
Foods Inc. Network Optimization 49
Hillsdale, MI
Hillsdale, MI
2014 and beyond
4 Facilities,
Limited co-packing relationships
Xenia, OH
Xenia, OH
Sulphur Springs, TX
Sulphur Springs, TX
Lima, OH
Lima, OH
Asset Actions:
FY2011:
Bidwell and Galva fresh sausage
operations closed
FY2012:
Bidwell and Hillsdale transportation
centers closed; Springfield
distribution center sold
FY2013:
Consolidated transportation
operations; Kettle Creations (Lima)
acquired;
FY2014:
Bidwell, Springfield, Richardson
plant, office, and transportation
center closed; SWH sold; Sulphur
Springs and Lima expanded
Fresh sausage
Fresh sausage
Ready-to-eat
Side dishes
2007
Galva, IL
Galva, IL
Bidwell, OH
Bidwell, OH
Richardson, TX
Richardson, TX
Xenia, OH
Xenia, OH
Sulphur Springs, TX
Sulphur Springs, TX
SWH Fullerton, CA
SWH Fullerton, CA
Hillsdale, MI
Hillsdale, MI
Lima, OH
Lima, OH
9 Facilities, 2 co-packers
50% Vertical Integration
Springfield, OH
Springfield, OH
Ready-to-eat
Fresh sausage
Sausage/Ready-
to-eat/ Dist. Ctr.
Fresh sausage
Copacker
Copacker
Fresh sausage/
Ready-to-eat
Fresh sausage
Mimi’s Café
prep kitchen
Fresh sausage/
Ready-to-eat |
 1
See reconciliation of Adjusted Operating Income (non-GAAP) to Reported
Operating Income (GAAP) in the Appendix of this presentation. BEF
Foods’ Transformation Expected to Offset
~$44MM Sow Cost Impact in Fiscal 2015
50
Adjusted Operating Income ($ millions)
FY 12
No Mitigation
Launched lean mfg. program
Transitioned from DSD
to warehouse
Expanded side dish products
(Kettle Creations acquisition)
Optimized sausage plant
network
Enhanced pricing and trade
spending capabilities
Avg
Sow
Cost
$44.93
$61.58
$53.87
$73.23
Est. Sow
cost
impact vs
2009
($ millions)
$17
$9
$28
NOTE: daily sow cost information available at:
http://www.ams.usda.gov/mnreports/lm_hg230.txt $87
$44
~$25-$35
$16.0
$1.8
$18.8
$30.7
$12.9
FY 09
FY 12
FY 13
FY 14
FY 15E
1 |
 1
For
additional
detail
concerning
risks
associated
with
sow
costs,
please
refer
to
Item
1A,
“Risk
Factors”
in
the
Company’s
FY
2014
10K
filing.
Sow Costs: Enterprise Risk
(1)
1)
BEF Foods’
Retail cost of goods sold
~73%
2)
BEF Foods’
Food Service cost of goods sold
~17%
3)
Bob Evans Restaurants’
cost of goods sold
~10%
4)
BEF Foods’
Retail
Sales Volume impact
A $1 change in average annual sow costs impacts cost of goods
sold by approximately $1.1 million.
51
Most mitigation activities trail sow cost increases by 30 to
120 days and do not typically achieve 100% price realization.
1)
BEF Retail: Pricing, Trade Spending, Lean Manufacturing,
Mix 2)
BEF Food Service: Indexed Pricing
3)
Restaurants: Pricing, Portion Size, Menu
Optimization 4)
BEF Foods’
Retail Sales Volume: Mix
Market Structure
and Competitor
Actions
BOBE Mitigation
Activities |
 The
Cumulative Sow Cost Impact was $66 Million Versus Fiscal 2009 Average Sow
Cost of $44.93/cwt 52
~$66 million
cumulative annual
cost impact relative to
2009
sow price levels.
$ avg
cost/cwt
($ 000’s)
$73.23
$53.87
$42.18
$61.58
$57.17
NOTE: daily sow cost information available at:
http://www.ams.usda.gov/mnreports/lm_hg230.txt |
 The
Increase in Sow Costs, Largely Driven by Unforeseen PED Virus Outbreaks, Was
the Main Driver of Reduced Guidance 53
Note: USDA data reflects top of trading range
$65-$70/cwt
(issued 8/19/13)
$60-$65/cwt
(issued 6/4/13)
$72-$77/cwt
(issued 1/21/14)
BOBE
Guidance
There is no effective sow cost hedging mechanism in the U.S.
$88-$90/cwt
(issued 7/8/14)
Bob Evans
Cost
USDA
Cost |
 Publicly Available Sow Cost Pricing and
Livestock Commentary
(1)
54
daily sow cost report:
http://www.ams.usda.gov/mnreports/lm_hg230.txt
daily livestock commentary:
http://www.dailylivestockreport.com/
1
Information provided by external entities. Bob Evans Farms Inc. disclaims any
and all responsibility for the information provided at these sites. |
 BER
and BEF: Synergies Drive Value Across Multiple Dimensions
55
Brand and Advertising Synergies
Product Innovation
Supply Chain Savings
Food Service Credibility/Expansion
Margin Expansion and G&A leverage at
BER and BEF
Restaurant Operational Efficiencies |
 FY
2014: Vital Few Priorities 56
Expand “in-source”
supplier relationships for the
restaurant segments and the food service industry
Drive sales through new authorizations
and geographic expansion
Drive margin expansion through cost reductions
and Lean manufacturing efficiencies
Optimize our plant and distribution network
Drive best-in-class ROIC |
 57
Appendix |
 Summary of Performance Drivers: Fiscal 2015
Guidance Relative to Fiscal 2014 Results
58
1Q (actual)
2Q
3Q
4Q
Full
Year
sss% 2015 (guidance)
-2.0%
flat to low
single-digit
high single-
digit
high single-
digit
1.5% to
2.5%
sss% 2014 (actual)
-0.6%
-1.9%
-1.8%
-4.1%
-2.1%
sow costs (per hundredweight) 2015 (guidance)
$87.87
$90 to $95
$80 to $90
$80 to $90
$87
sow costs (per hundredweight) 2014 (actual)
$63.24
$77.33
$72.36
$78.47
$73.23
estimated Broasted Chicken®
rollout
(% of restaurants)
6%
41%
51%
100% |
 Board
Composition and Governance Track Record 59
•
Governance Ranking
•
Peer Group Comparisons |
 Strong Corporate Governance is a Priority at
Bob Evans Farms
(1) Source: Yahoo Finance –
per Yahoo Finance, ISS
QuickScore data is presented as of July 1, 2014.
ISS
Overall
Governance
Quickscore
versus
Selected
Peers
1
1
2
3
4
5
6
7
8
9
10
Mean ex. BOBE: 5.2
60
1
1
1
1
1
1
2
2
3
4
4
4
5
5
5
6
6
7
7
7
8
9
9
9
10
10
•
An overwhelming majority of independent directors (all but the CEO);
•
Institutional
Shareholder
Services
(“ISS”)
has
awarded
Bob
Evans’
overall
corporate
governance
the
highest
possible
score per QuickScore rankings.
•
Bob Evans’
Board has:
•
Annual director elections –
no classified board;
•
Majority vote election standard with a director resignation policy;
•
Entirely independent nominating, audit and compensation committees;
•
A lead independent director empowered with robust responsibilities;
•
Strong stock ownership guidelines for directors;
•
Board and committee-level self-evaluations for board effectiveness;
•
No authorization to issue blank check preferred stock without shareholder approval.
|
 BOBE’s Strong Balance Sheet Enables Above-
Average Returns of Capital
Return of Capital by Casual Dining Companies
Payout Ratios
Dividends
Net Share
Repurchases
(c)
Source: FactSet and company filings.
(a)
Payout ratio calculated as a percentage of cash flow from operations for the last
30 fiscal quarters. (b)
Indicative annual dividend yield defined as most recent quarterly dividend
multiplied by 4, divided by stock price as of 7/25/14. (c)
Share repurchases are net of any equity issuance.
Return of Capital
(a)
Dividend Yield
(b)
Median of Dividend
Paying Companies: 2.6%
61
16%
4%
16%
21%
16%
22%
4%
11%
77%
64%
48%
36%
38%
16%
25%
17%
93%
68%
63%
57%
54%
38%
28%
28%
23%
14%
(2%)
(2%)
Median: 33%
4.9%
3.9%
3.1%
2.6%
2.4%
2.1%
1.3%
0.0%
0.0%
0.0%
0.0%
0.0%
0.0%
0.0% |
 Other Mature
Casual
BOBE’s
Valuation
Relative
to
Other
Restaurant
and Branded Protein Companies
EV/CY 2014E EBITDA
Differentiated Casual
Family Dining
Branded Protein
Mean:
9.5x
Mean:
9.1x
Mean:
9.6x
Mean:
9.3x
(a)
Excludes Red Lobster.
(b)
Market data as of 5/26/14, one-day prior to Pilgrim’s Pride’s
announced bid for Hillshire Brands. 62
10.1x
10.2x
9.2x
9.1x
11.6x
8.4x
8.2x
8.1x
12.2x
11.3x
9.3x
9.0x
9.0x
6.8x
11.7x
9.6x
6.6x
Source:
Company filings and FactSet as of 7/25/14. |
 Over
$125 Million of Strategic Asset Dispositions 63
•
Consolidation of Three Home Office Locations
into One State-of-the-Art Facility
•
Business Dispositions
•
Restaurant Closures
•
Plant Closures/Consolidations
•
Real Estate Sales and Disposals
•
Business Transformations
•
DSD to warehouse conversion
•
Distribution center sale |
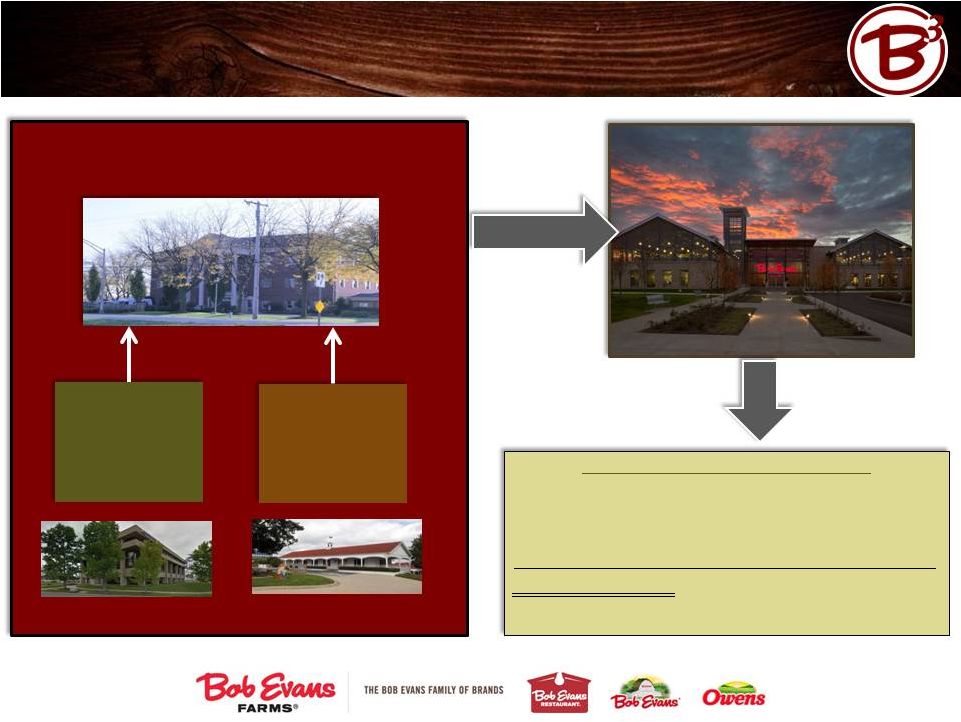 64
New Corporate Campus Consolidates Three
Former Locations Into One
New Corporate HQ
New Albany, Ohio
(constructed 2013)
Previous Corporate HQ:
Columbus, Ohio
(constructed 1968)
Mimi’s Café
Divisional HQ:
Irvine, California
(acquired 2004)
Owens Sausage
Divisional HQ:
Richardson,
Texas
(acquired 1987)
Consolidation Project Summary*
($ millions)
$48.2
Land/Building Cost
($12.1)
Sale of Columbus HQ/Richardson HQ (est.)
($4.7)
Tax Savings/Incentives (realized over 10 to 15 years)
$31.4
Net Cost
*$1.3M
of
annual
operating
expenses
of
Owens’
and
Mimi’s
HQ
offices
eliminated in consolidation. |
  Significant Asset Closures/Dispositions:
over $125M since FY 2006
Every
business
segment
subject
to
review
every
quarter.
65
continued on following page…
Fiscal
Year
Announced
Business Unit
Action(s) Announced
Strategic Rationale
2006
Bob Evans Restaurants
16 underperforming restaurants closed
margin/ROIC improvement
Corporate
8 underperforming restaurants closed
margin/ROIC improvement
(Owens restaurant chain closed)
2007
Bob Evans Restaurants
18 underperforming restaurants closed
margin/ROIC improvement
BEF Foods
Initiates transition from direct-store-delivery to direct-ship-
upgrade to the distribution model required by most large retailers
warehouse distribution model (multi-year evolution of fleet
and other transportation assets including the 2012
transportation center consolidation)
2008
Bob Evans Restaurants
10 underperforming restaurants closed
margin/ROIC improvement
2009
Bob Evans Restaurants
2 underperforming restaurants closed
margin/ROIC improvement
2010
Bob Evans Restaurants
1 underperforming restaurant closed
margin/ROIC improvement
2011
Bob Evans Restaurants
8 underperforming restaurants closed
margin/ROIC improvement
Corporate
1 underperforming Mimi's Café restaurant closed
margin/ROIC improvement
BEF Foods
Bidwell, Ohio (fresh sausage) production line closed
plant network optimization (reduce fresh sausage over-capacity)
BEF Foods
Galva, Illinois (fresh sausage) plant closure
plant network optimization (reduce fresh sausage over-capacity) |
 66
Significant Asset Closures/Dispositions: $125M+ since FY
2006 Every
business
segment
subject
to
review
every
quarter.
Fiscal
Year
Announced
Business Unit
Action(s) Announced
Strategic Rationale
2012
Bob Evans Restaurants
2 underperforming restaurants closed
margin/ROIC improvement
BEF Foods
Bidwell/Hillsdale Transportation Center closures
transportation hubs consolidated in Springfield, Ohio
BEF Foods
Springfield Distribution Center sold
sold facility to best-in-class distribution co.; retained access to
facility 2013
Bob Evans Restaurants
7 underperforming restaurants closed
margin/ROIC improvement
Corporate
Divestiture of Mimi's Café
and HQ consolidation
focus on driving profitable growth of the Bob Evans brand
BEF Foods
Bidwell, Ohio and Springfield, Ohio plant closures
plant network optimization: consolidate pre-cooked/ready-to-eat
estimated $7 million to $8 million annual pre-tax benefit (FY
'15->) production at state-of-the-art Sulphur Springs,
Texas plant YTD 2014
Bob Evans Restaurants
3 underperforming restaurants closed; 31 closed/excess
margin/ROIC improvement
restaurant properties sold
Corporate
Closure and sale of Columbus home office
focus on driving profitable growth of the Bob Evans brand
BEF Foods
Richardson, Texas (fresh sausage) plant and hq closure
plant network optimization (reduce fresh sausage over-capacity)
estimated $2 million to $2.5 million annual pre-tax benefit (FY
'16->) BEF Foods
Sale of Fullerton, California prep kitchen facility
plant network optimization: consolidate pre-cooked/ready-to-eat
production at state-of-the-art Sulphur Springs, Texas plant
Bob Evans Restaurants
Close underperforming locations to improve local market performance and reinvest
in higher potential locations BEF Foods: Reinvest proceeds from sale of
non-core/low-growth assets in high-growth refrigerated side dish and prepared foods assets
Corporate:
Disposals/divestitures
to
improve
margins
and
focus
on
growth |
 Additional Information
67
•
ERP
Implementation Schedule
•
Reconciliation of Adjusted Operating Income
(Non-GAAP) to Reported Operating Income
(GAAP) |
 68
Updated 7/2014
Fiscal Yr.
Key Actions
$ Millions
Capex
Expense
Benefits
2013
-
RFP Completed & Software Purchased.
-
Team Formulation.
(3.8)
(1.0)
0.0
-
Project Planning and Scoping Defined.
2014
Corporate: Financials Design
(7.6)
(1.9)
0.0
Foods: Manufacturing and Supply Chain Design
2015
Corporate: Financials, HR & Payroll
(13.9)
(4.6)
0.0
Foods: Manufacturing, Procurement, ASCP
Restaurants: Employee Self-Service
2016
Corporate: Order to Cash
(7.1)
(8.1)
3.7
Foods: Transportation, Order Mgt, Trade Planning
2017
Corporate: Property Manager, Enterprise Asset Mgt
(3.3)
(7.7)
6.5
Foods: Product Lifecycle Management
2018
Expenses Stabilize, Benefits Continue to Ramp Up
0.0
(6.9)
8.8
ERP Implementation Schedule |
 69
Consolidated Results
Bob Evans Restaurants
BEF Foods
Three Months Ended
Three Months Ended
Three Months Ended
July 25, % of
2014
Sales
July 26, % of
2013
Sales
July 25, % of
2014
Sales
July 26,
2013
% of Sales
July 25, % of
2014
Sales
July 26,
2013
% of Sales
Operating income as reported
Net sales
326,341
329,449
240,151
244,551
86,190
84,898
Cost of sales
113,463
34.8%
106,641
32.4%
63,211
26.3%
62,653
25.6%
50,252
58.3%
43,988
51.8%
Operating wage and fringe benefit
expenses
104,228
31.9%
102,847
31.2%
94,639
39.4%
93,221
38.1%
9,589
11.1%
9,626
11.3%
Other operating expenses
49,508
15.2%
48,847
14.8%
42,505
17.7%
41,313
16.9%
7,003
8.1%
7,534
8.9%
Selling, general and administrative
expenses
38,847
11.9%
33,276
10.1%
22,482
9.4%
18,082
7.4%
16,365
19.0%
15,194
17.9%
Depreciation and amortization expense
19,973
6.1%
17,230
5.2%
15,341
6.4%
14,191
5.8%
4,632
5.4%
3,039
3.6%
Impairment of assets held for sale
258
0.1%
8,609
2.6%
258
0.1%
8,609
0.0%
-
0.0%
-
0.0%
Total as Reported
64
0.0%
11,999
3.6%
1,715
0.7%
6,482
2.7%
(1,651)
-1.9%
5,517
6.5%
Adjustments
Net sales
-
-
-
-
-
-
Cost of sales
-
-
-
-
-
-
Operating wage and fringe benefit
expenses
(14)
-
(14)
-
-
-
Other operating expenses
(149)
107
(149)
-
-
107
Selling, general and administrative
expenses
(4,611)
(2,258)
(3,381)
(963)
(1,230)
(1,295)
Depreciation and amortization expense
-
51
-
51
-
-
Impairment of assets held for sale
(258)
(8,609)
(258)
(8,609)
-
-
Total adjustments
5,032
10,709
3,802
9,521
1,230
1,188
Non-GAAP operating income
Net sales
326,341
329,449
240,151
244,551
86,190
84,898
Cost of sales
113,463
34.8%
106,641
32.4%
63,211
26.3%
62,653
25.6%
50,252
58.3%
43,988
51.8%
Operating wage and fringe benefit
expenses
104,214
31.9%
102,847
31.2%
94,625
39.4%
93,221
38.1%
9,589
11.1%
9,626
11.3%
Other operating expenses
49,359
15.1%
48,954
14.9%
42,356
17.6%
41,313
16.9%
7,003
8.1%
7,641
9.0%
Selling, general and administrative
expenses
34,236
10.5%
31,018
9.4%
19,101
8.0%
17,119
7.0%
15,135
17.6%
13,899
16.4%
Depreciation and amortization expense
19,973
6.1%
17,281
5.2%
15,341
6.4%
14,242
5.8%
4,632
5.4%
3,039
3.6%
Impairment of assets held for sale
-
0.0%
-
0.0%
-
0.0%
-
0.0%
-
0.0%
-
0.0%
Total non-GAAP operating income
5,096
1.6%
22,708
6.9%
5,517
2.3%
16,003
6.5%
(421)
-0.5%
6,705
7.9%
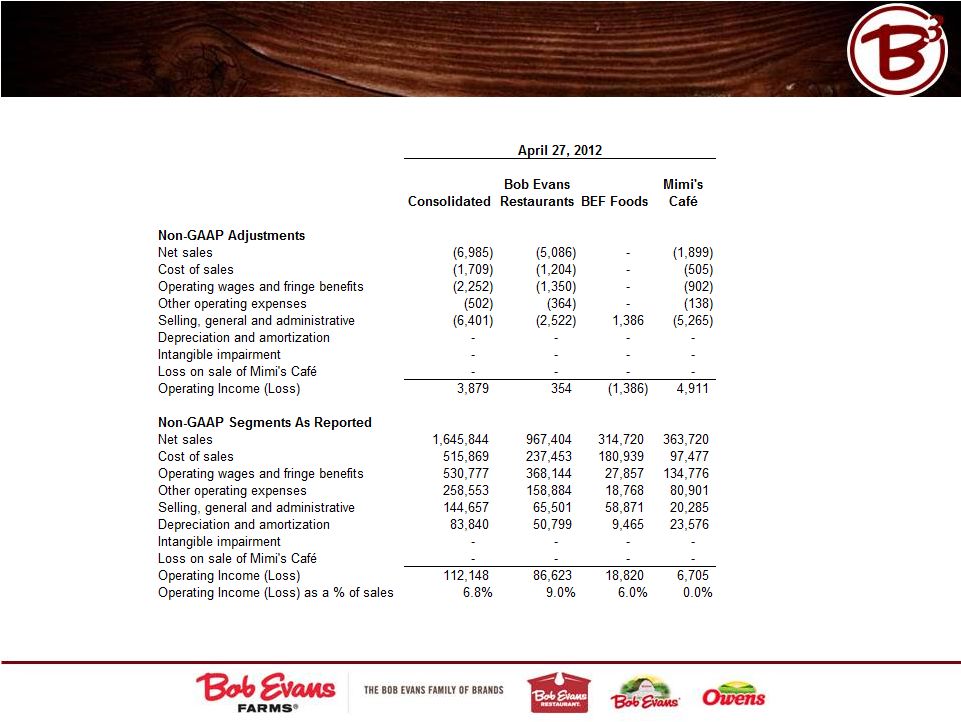
Reconciliation of Adjusted Operating Income
(Non-GAAP) to Reported Operating Income (GAAP) |
 Reconciliation of Adjusted Operating Income
(Non-GAAP) to Reported Operating Income (GAAP)
70
This schedule continues on the following page. |
 Reconciliation of Adjusted Operating Income
(Non-GAAP) to Reported Operating Income (GAAP)
71 |
 Reconciliation of Adjusted Operating Income
(Non-GAAP) to Reported Operating Income (GAAP)
72
This schedule continues on the following page. |
 Reconciliation of Adjusted Operating Income
(Non-GAAP) to Reported Operating Income (GAAP)
73 |
 Reconciliation of Adjusted Operating Income
(Non-GAAP) to Reported Operating Income (GAAP)
Fiscal 2009 BEF reported operating income (GAAP)
$15,571
Non-GAAP adjustment: Other operating expenses
400
Fiscal 2009 BEF reported operating income (GAAP)
$15,971
($ thousands)
74
2009 BEF Foods’ (formerly “Food Products”) Operating
Income Reconciliation |