Attached files
| file | filename |
|---|---|
| 8-K - 8-K - NTELOS HOLDINGS CORP. | d779279d8k.htm |
 Investor Presentation
August 2014
NASDAQ: NTLS
Exhibit 99.1 |
 Presentation of Financial and Other Important Information
2
USE OF NON-GAAP FINANCIAL MEASURES
Included in this presentation are certain non-GAAP
financial measures that are not determined in accordance with US generally accepted accounting principles
(“GAAP”). These financial performance measures are not
indicative of cash provided or used by operating activities and exclude the effects of certain operating,
capital and financing costs and may differ from comparable information
provided by other companies, and they should not be considered in isolation, as an
alternative to, or more meaningful than measures of financial
performance determined in accordance with US generally accepted accounting principles. These
financial performance measures are commonly used in the industry and
are presented because NTELOS believes they provide relevant and useful information to
investors. NTELOS utilizes these financial performance measures to
assess its ability to meet future capital expenditure and working capital requirements, to
incur indebtedness if necessary, and to fund continued growth.
NTELOS also uses these financial performance measures to evaluate the performance of its
business, for budget planning purposes and as factors in its employee
compensation programs. Adjusted EBITDA is defined as net income attributable to
NTELOS Holdings Corp. before interest, income taxes, depreciation and
amortization, accretion of asset retirement obligations, deferred SNA revenue, gain/loss
on derivatives, net income attributable to non-controlling
interests, other expenses/income, equity based compensation charges, business separation charges,
certain employee separation charges, gain/loss on sale of assets,
secondary offering costs and net loss from discontinued operations and costs related to the
separation of the wireless and wireline companies. SPECIAL NOTE REGARDING
FORWARD-LOOKING STATEMENTS
Any statements contained in this presentation that are not statements
of historical fact, including statements about our beliefs and expectations, are forward-
looking statements and should be evaluated as such. The words
“anticipates,” “believes,” “expects,” “intends,” “plans,” “estimates,” “targets,” “projects,”
“should,” “may,” “will” and similar words
and expressions are intended to identify forward-looking statements. Such forward-looking statements reflect, among
other things, our current expectations, plans and strategies, and
anticipated financial results, all of which are subject to known and unknown risks, uncertainties
and factors that may cause our actual results to differ materially from
those expressed or implied by these forward-looking statements. Many of these risks are
beyond our ability to control or predict. Because of these risks,
uncertainties and assumptions, you should not place undue reliance on these forward-looking
statements. Furthermore, forward-looking statements speak only as
of the date they are made. We do not undertake any obligation to update or review any
forward-looking information, whether as a result of new
information, future events or otherwise. Important factors with respect to any such forward-looking
statements, including certain risks and uncertainties that could cause
actual results to differ from those contained in the forward-looking statements, include, but
are not limited to: our ability to attract and retain retail
subscribers to our services; our dependence on our strategic relationship with Sprint Corporation
(“Sprint”); a potential increase in roaming rates and
wireless handset subsidy costs; rapid development and intense competition in the telecommunications
industry; our ability to finance, design, construct and realize the
benefits of any planned network technology upgrade; our ability to acquire or gain access to
additional spectrum; the potential to experience a high rate of
customer turnover; the potential for competitors to build networks in our markets; cash and capital
requirements; operating and financial restrictions imposed by our
credit agreement; adverse economic conditions; federal and state regulatory fees, requirements
and developments; loss of ability to use our current cell sites; our
continued reliance on indirect channels of retail distribution; our reliance on certain suppliers
and vendors; and other unforeseen difficulties that may occur. These
risks and uncertainties are not intended to represent a complete list of all risks and
uncertainties inherent in our business, and should be read in
conjunction with the more detailed cautionary statements and risk factors included in our SEC
filings, including our quarterly reports filed on Form 10-Q and
our most recent Annual Report filed on Form 10-K. |
 •
Leading “pure-play”
publicly traded regional wireless carrier
•
8.0 million licensed POPs; 6.0 million covered POPs; 458,100
subscribers
•
Branded retail business and stable wholesale business with
recurring revenue stream
•
Exclusive wholesale network provider for Sprint in WV and
Western Va. through December 2022
Company Overview
About nTelos
Headquarters
Waynesboro,
Va.
Ticker
NTLS
Exchange
NASDAQ
Price
$12.64
Market Cap
$274 million
Shares
21.7 million
52 Week Range
$11.20
–
$23.03
As of August 18, 2014
3 |
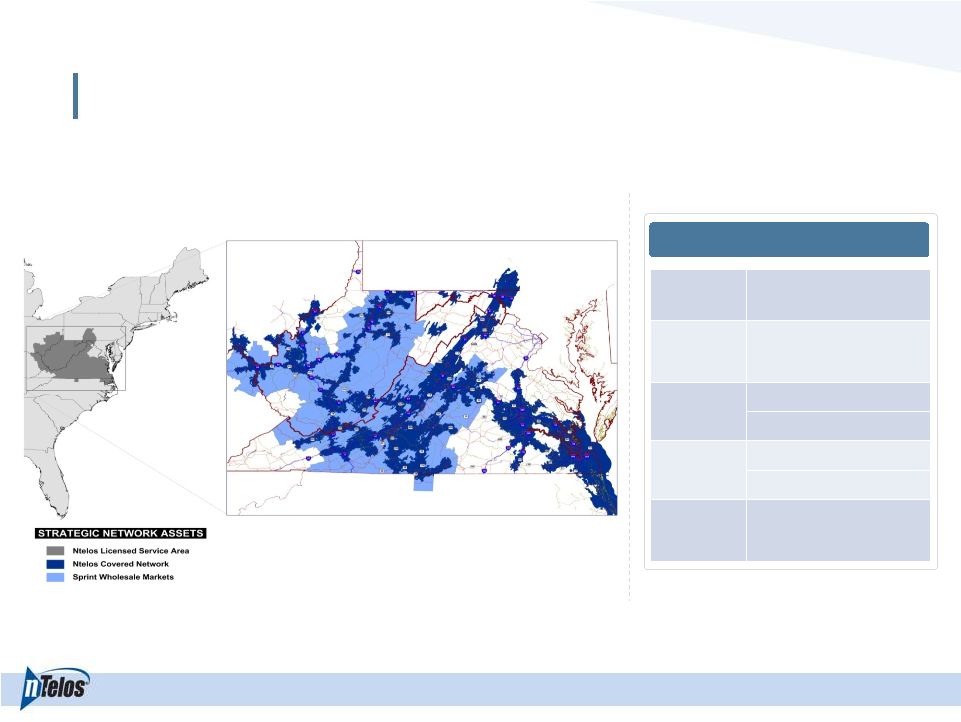 4
nTelos Network
Operational Footprint
POPs
8.0 million
Covered
POPs
6.0 million
LTE
POPs
2.8 million (6/30/14)
3.3 million (Est. 12/31/14)
Spectrum
nTelos: AWS / PCS / 2.5 GHz
Sprint: 800 MHz / PCS / 2.5 GHz
Total Cell
Sites
1,445 |
 5
Retail
Prepay
Retail subscriber base
comprised of two-thirds
postpay subscribers
Postpay
458,100
33%
67%
Retail revenues of $79.5
million
in
2Q14,
or
67%
of
total revenues
•
High quality device offering
including iPhone, Samsung
Galaxy, and Moto X
•
127 branded retail locations
•
715 total points of distribution
nTelos operates the postpay
business under NTELOS
brand and prepay under the
FRAWG brand
Subscriber Base
Platform
Revenue
$60.0
$70.0
$80.0
$90.0 |
 6
Wholesale and Other Revenues
nTelos provides wholesale services to
other wireless carriers. The primary
source of wholesale revenues comes from
the Strategic Network Alliance (SNA) with
Sprint.
Wholesale & Other Revenues
Wholesale and other revenue
accounted for 33%
of total
revenues in 2Q14
SNA covers 2.1 mm
covered POPs in West Virginia and
western Virginia; 853
cell sites
SNA billed revenue accounted for
96%
of wholesale and other
revenues in 2Q14
Includes $9.0 million from September 2013 SNA Settlement with Sprint
1
$118
$145
$169
$83
$79
$0
$40
$80
$120
$160
$200
2010
2011
2012
2013
YTD 2013
YTD 2014
Wholesale and Other Revenues
$175
1 |
 7
Wireless Industry Trends
Adjusted EBITDA (billions)
EIP as % of Total Subs
Wireless Service Revenue (billions)
% Data
Deal Value (billions)
Sources: Bloomberg, SNL Kagan
Competition
Data Usage
Consolidation
Deal Count
Data Revenue Growth
Telecom M&A
EIP Lifting Big Four’s Adjusted EBITDA
Fierce competition has led to
increased promotional activity
that has pressured revenue.
However, the popularity of
Equipment Installment Plans
(EIP) over the traditional
subsidy models has muted
the impact and lifted
Adjusted EBITDA.
As more consumers use
smartphones and tablets,
data usage on the networks
has continued to grow
dramatically. Carriers have
introduced shared data plans
and increased data
allowances to leverage their
investments in 4G.
Wireless M&A has been
particularly strong in the past
few years as carriers use
acquisitions to bolster their
spectrum position to meet the
increases in data traffic,
generate increased scale and
grow their subscriber base.
0
2
4
6
8
10
12
14
16
18
20
2010
2011
2012
2013
YTD 2014
$0
$20
$40
$60
$80
$100
$120
$140
$160
2013
2014E
2015E
2016E
2017E
$0
$50
$100
$150
$200
$250
$300
40%
45%
50%
55%
60%
65%
70%
1Q13
2Q13
3Q13
4Q13
1Q14
0%
1%
2%
3%
4%
5%
6%
$15
$16
$16
$17
$17
$18
$18
$19
$19
$20 |
 Strategic Objectives
8
of our assets
strategic relevance
Increase the
nTelos’s operations
Sprint to enhance
relationship with
strategic
Leverage our
performance
retail sales
Strengthen our
efficient
become more
processes and
Improve our |
 Operating Objectives
9
Grow
strategic
partnerships
Strengthen
brand and
customer
loyalty
Enhance
network
capabilities
Improve
operating
efficiency
Sprint/DISH
Subscribers
4G LTE
Operations |
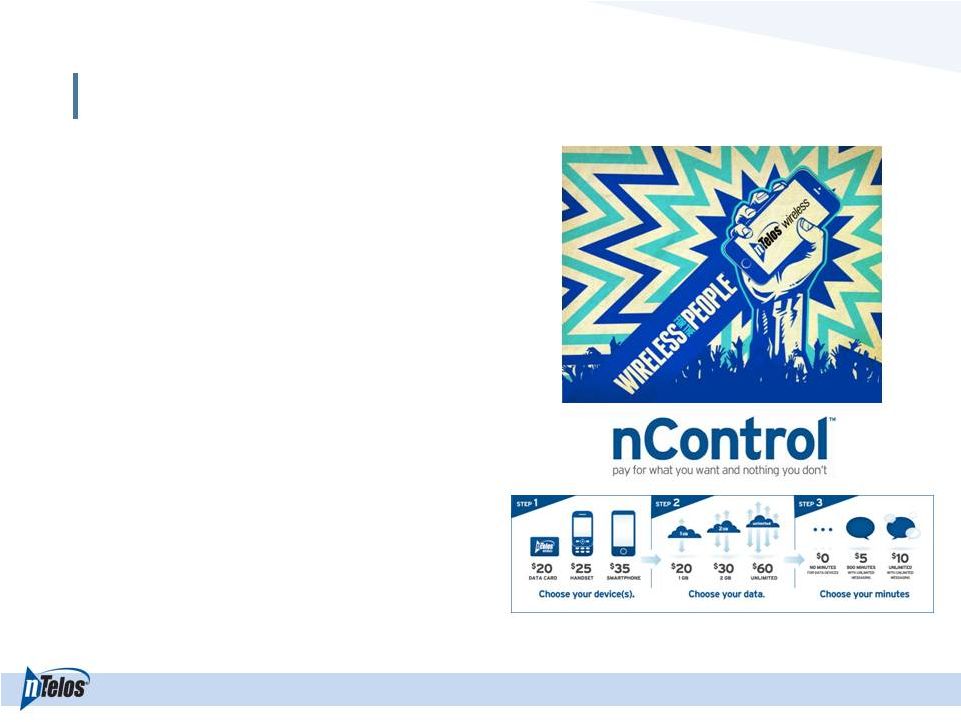 Retail Growth Drivers Going Forward
•
nControl pricing plans
•
Equipment Installment Plan (EIP)
•
Prepay rate plan resets
•
Expansion of 4G LTE network
•
Improved device line up
Prices as of July 28, 2014
10 |
 EIP Features
Launched in mid-
August
No money down
on device
purchases
Eligible for early
upgrade after 12
months
Customers can
still choose a
subsidized device
plan
11 |
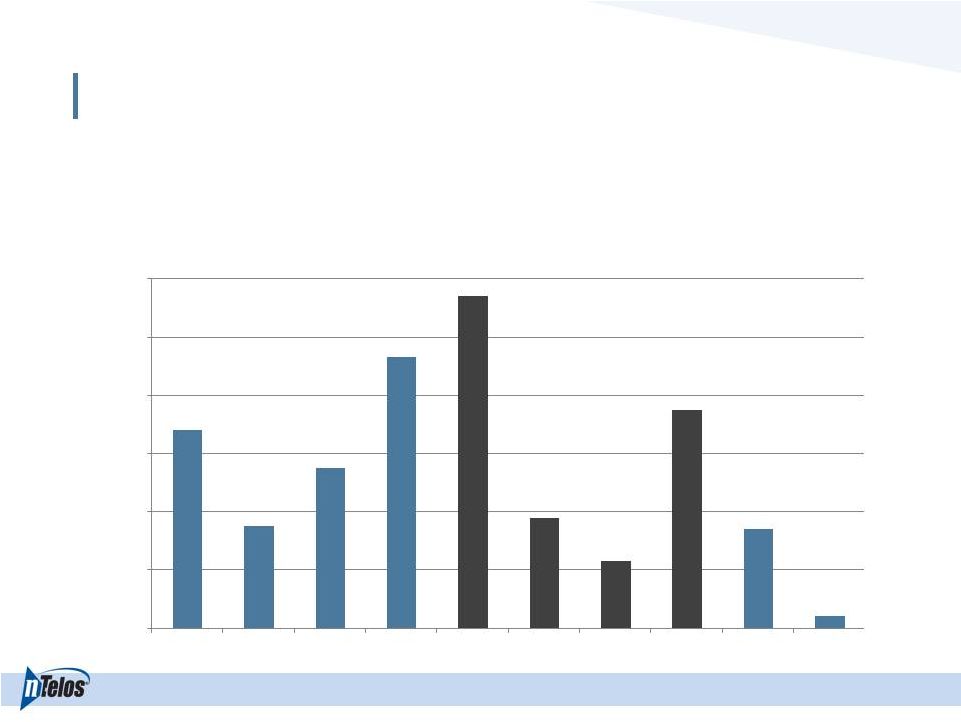 Subscribers –
Net Addition Trend
•
Ten consecutive quarters of positive net adds
12
6,800
3,500
5,500
9,300
11,400
3,800
2,300
7,500
3,400
400
0
2,000
4,000
6,000
8,000
10,000
12,000
1Q 2012
2Q 2012
3Q 2012
4Q 2012
1Q 2013
2Q 2013
3Q 2013
4Q 2013
1Q 2014
2Q 2014 |
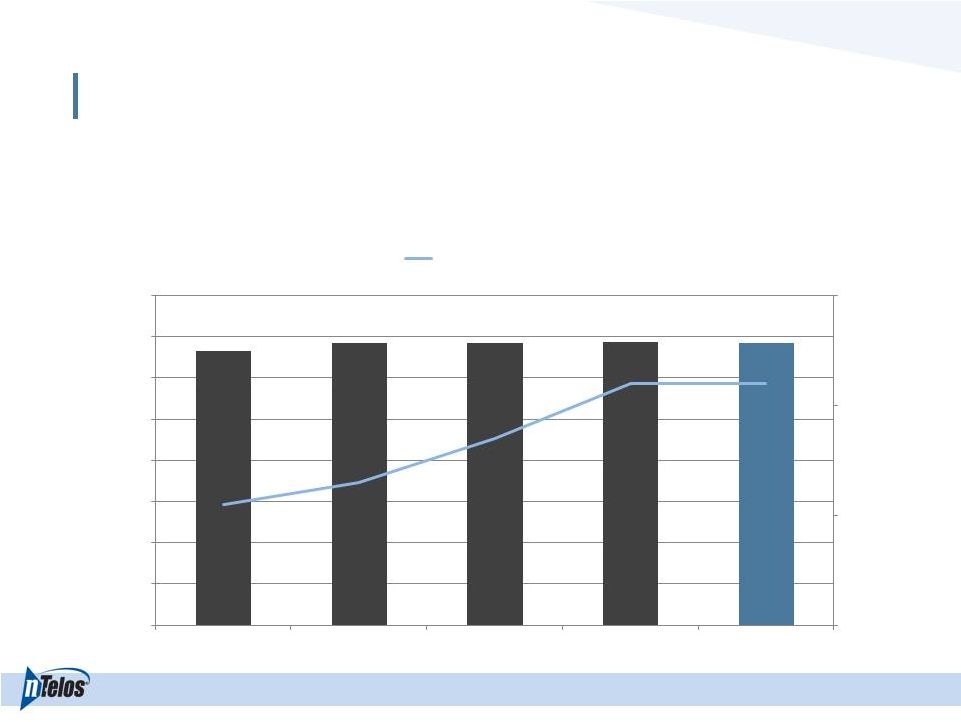 Average Revenue Per Account (ARPA)
ARPA
Subscribers Per Account
•
2Q14 postpay subscribers per account of 2.2
13
$133.34
$136.90
$136.88
$137.47
$137.20
2.0
2.1
2.2
2.3
$0.00
$20.00
$40.00
$60.00
$80.00
$100.00
$120.00
$140.00
$160.00
2Q 2013
3Q 2013
4Q 2013
1Q 2014
2Q 2014
Subscribers Per Account |
 Continued Focus on Operational Efficiencies
Steps
Refine retail offerings
Right-Fitting retail customer base
Enhance online support and self-service
Streamline legacy processes and systems
Align organization
Goals
Improve customer experience
Increase productivity
Reduce costs
14 |
 Sprint Agreement –
Platform For Growth
Terms
Amended SNA (Announced May 22, 2014)
Expiration
December 31, 2022
Coverage Area
•
2.1 mm covered POPs in West Virginia and western Virginia
•
853 cell sites
•
36,800 square miles
Network
2G/3G/4G LTE / future feature upgrades
Spectrum
800/1.9/2.5 (nTelos & Sprint)
Anticipated 4G LTE Buildout Timeline
Expect to be completed no later than May 2017
Nationwide Roaming
2G/3G/4G LTE
Exclusivity
•
Exclusive wholesale provider in SNA territory
•
Can sign wholesale agreements with other carriers
Equipment Vendor Relationships
Leverage Sprint’s device and equipment relationships
Incremental Investment
Agreed
to
build
4G
LTE
network
($150mm
-
$175mm)
15 |
 •
Solidifies Sprint relationship through December 2022 and allows for additional
collaboration •
Contributes recurring wholesale revenues to nTelos
•
Provides access to Sprint’s 800 MHz/1.9 GHz/2.5 GHz spectrum and vendor
relationships •
Attracts high-value customers by facilitating a robust LTE experience in SNA
territory •
Provides 4G LTE nationwide roaming for nTelos retail customers
Extended Agreement
–
Beneficial Impact
16 |
 Financial Overview |
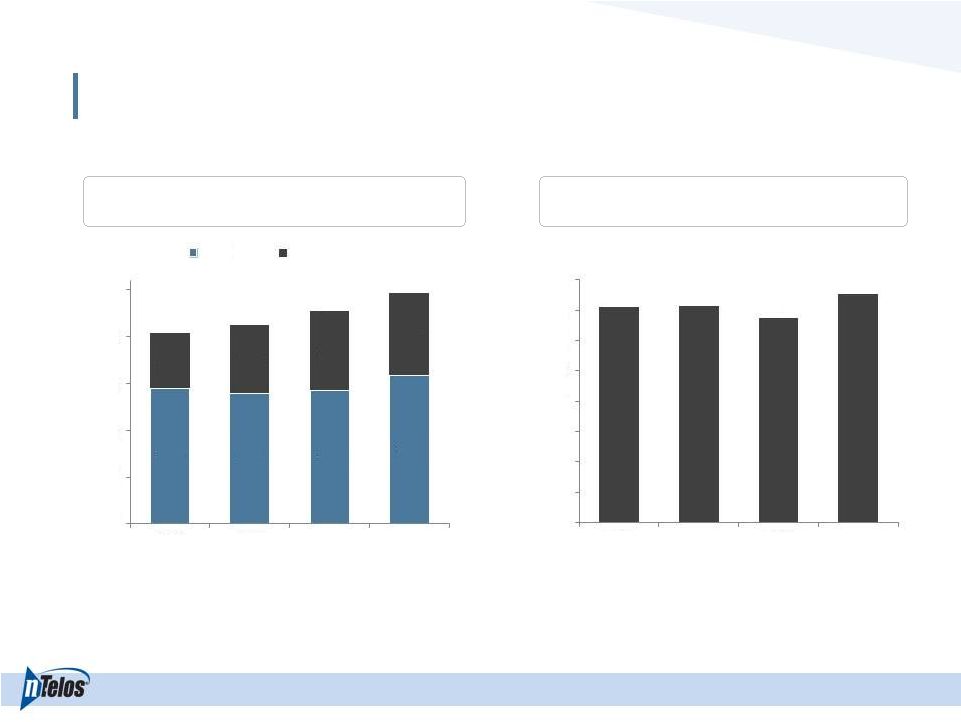 Historical Financial Overview
Revenue
Adjusted EBITDA
¹
Includes $9.0 million of revenues and $9.6 million of EBITDA related to September
2013 SNA Settlement with Sprint .
1
1
($mm)
($mm)
18
$289
$278
$285
$317
$118
$145
$169
$175
$407
$423
$454
$492
$0
$100
$200
$300
$400
$500
2010
2011
2012
2013
Retail
Sprint, Wholesale & Other
$142
$143
$135
$151
$0
$20
$40
$60
$80
$100
$120
$140
$160
2010
2011
2012
2013 |
 Capital Expenditure
CapEx vs. Revenues
Note: Excludes wireline revenue generated and capex incurred prior to October 2011
business separation 19
$85
$97
$71
$52
$58
$72
$81
$350
$375
$400
$425
$450
$475
$500
$0
$25
$50
$75
$100
2007
2008
2009
2010
2011
2012
2013
Maintenance, IT & Other
Capacity
Growth
Technology Upgrade
CapEx ($mm)
Revenues ($mm) |
  Capitalization Overview
($ in millions)
June 30, 2014
Cash, unrestricted
$108.3
Total Debt
$527.8
Net Debt
$419.5
LTM Adjusted EBITDA
$140.6
Secured Term Loan
$526.9
Net Debt Leverage
3.0x
20 |
 Guidance (as of July 28, 2014)
21
For the year ended December 31, 2014:
•
Adjusted
EBITDA
of
$128
-
$135
million
•
CapEx
of
$110
-
$120
million |
 Strategic Objectives
22
Increase the
strategic relevance
of our assets
Strengthen our
retail sales
performance
Leverage our
strategic
relationship with
Sprint to enhance
nTelos’s operations
Improve our
processes and
become more
efficient |
 Appendix |
 Adjusted EBITDA Reconciliation
24
Reconciliation of Net Income Attributable to NTELOS Holdings Corp. to Adjusted EBITDA
(In thousands)
2Q14
1Q14
4Q13
3Q13
2Q13
Net Income Attributable to NTELOS Holdings Corp.
484
$
1,286
$
(784)
$
10,583
$
9,386
$
Net income attributable to noncontrolling interests
373
436
403
588
541
Net Income
857
1,722
(381)
11,171
9,927
Interest expense
8,315
7,959
7,504
7,480
7,398
Income taxes
640
1,110
80
8,340
6,380
Other expense (income), net
92
1,072
161
431
(151)
Operating income
9,904
11,863
7,364
27,422
23,554
Depreciation and amortization
19,929
19,067
17,486
16,559
20,443
Gain on sale of intangible assets
-
-
-
-
(4,442)
Accretion of asset retirement obligations
331
315
171
135
173
Equity-based compensation
1,283
1,311
1,330
1,442
1,460
SNA Straight Line Adjustment
2,043
1
-
-
-
-
Other
2
874
1,367
375
-
-
Adjusted EBITDA
34,364
$
33,923
$
26,726
$
45,558
$
41,188
$
1
Adjustment for impact of recognizing a portion of the billed SNA contract on a straight line
basis 2
Includes legal and advisory fees, employee seperation charges
and secondary offering costs. |
 ARPA Reconciliation
 - Postpay
Average Monthly Revenue per Account (ARPA) ¹
2Q14
1Q14
4Q13
3Q13
2Q13
(In thousands, except for accounts and ARPA)
Operating revenues
117,795
$
122,082
$
121,766
$
130,912
$
119,859
$
Less: prepay service revenues
(16,206)
(16,960)
(16,956)
(16,478)
(16,182)
Less: equipment revenues
(6,560)
(7,491)
(6,573)
(6,541)
(5,499)
Less: wholesale and other adjustments
(37,900)
(40,018)
(40,525)
(50,142)
(41,179)
Postpay service revenues
57,129
$
57,613
$
57,712
$
57,751
$
56,999
$
Average number of postpay accounts
138,800
139,700
140,500
140,600
142,500
Postpay ARPA
137.20
$
137.47
$
136.88
$
136.90
$
133.34
$
¹
Average
monthly
revenue
per
account
(ARPA)
is
computed
by
dividing
postpay
service
revenues
per
period
by
the
average
number
of
postpay
accounts
during
that
period.
As
defined,
ARPA
may
not
be
similar
to
ARPA
measures
of
other
companies,
is
not
a
measurement
under
GAAP
and
should
be
considered
in
addition
to,
but
not
as
a
substitute
for,
the
information
contained
in
the
Company’s
consolidated
Income
Statement.
The
Company
closely
monitors
the
effects
of
new
rate
plans
and
service
offerings
on
ARPA
in
order
to
determine
their
effectiveness.
ARPA
provides
management
useful
information
concerning
the
appeal
of
NTELOS
rate
plans
and
service
offerings
and
the
Company’s performance in attracting and retaining high-value customers.
25 |
 Key Metrics
26
Key Metrics
Quarter Ended:
6/30/2013
9/30/2013
12/31/2013
3/31/2014
6/30/2014
6/30/2013
6/30/2014
Subscribers
Beginning Subscribers
451,000
454,800
457,100
464,600
468,000
439,600
464,600
Postpay
299,700
298,700
298,000
306,700
306,800
297,400
306,700
Prepay
151,300
156,100
159,100
157,900
161,200
142,200
157,900
Gross Additions
40,100
44,500
50,800
45,400
39,000
88,600
84,400
Postpay
16,300
20,000
28,700
20,200
20,400
36,500
40,600
Prepay
23,800
24,500
22,100
25,200
18,600
52,100
43,800
Disconnections
1
36,300
42,200
43,300
42,000
38,600
73,400
80,600
Postpay
16,100
19,600
19,800
19,900
17,100
33,000
37,000
Prepay
20,200
22,600
23,500
22,100
21,500
40,400
43,600
Net Additions (Losses)
1
3,800
2,300
7,500
3,400
400
15,200
3,800
Postpay
200
400
8,900
300
3,300
3,500
3,600
Prepay
3,600
1,900
(1,400)
3,100
(2,900)
11,700
200
Ending Subscribers
¹
454,800
457,100
464,600
468,000
458,100
454,800
458,100
Postpay
298,700
298,000
306,700
306,800
308,200
298,700
308,200
Prepay
156,100
159,100
157,900
161,200
149,900
156,100
149,900
Churn, net
¹
2.7%
3.1%
3.1%
3.0%
2.8%
2.7%
2.9%
Postpay
1.8%
2.2%
2.2%
2.2%
1.8%
1.8%
2.0%
Prepay
4.4%
4.8%
4.9%
4.6%
4.5%
4.5%
4.6%
¹
During the quarter, the Company terminated approximately 2,100 postpay subscribers
that repeatedly exceeded their terms and conditions relating to permitted usage.
Additionally, the Company changed its business rules related to reporting of
long-term, non-revenue prepay subscribers. This change resulted in approximately
8,200 prepay subscribers being excluded from our ending subscriber base. The
impact of these Company-initiated terminations and change in business rules
is reflected in our ending subscriber totals as of June 30, 2014, and is not
reflected in our disconnections, net additions and churn calculations for the periods
ended June 30, 2014.
Six Months Ended |