Attached files
| file | filename |
|---|---|
| 8-K - FORM 8-K - HomeStreet, Inc. | form8-k2q14investorpresent.htm |

SECOND QUARTER 2014 NASDAQ:HMST
Important Disclosures Forward-Looking Statements This presentation includes forward-looking statements, as that term is defined for purposes of applicable securities laws, about our industry, our future financial performance and business activity. These statements are, in essence, attempts to anticipate or forecast future events, and thus subject to many risks and uncertainties. These forward-looking statements are based on our management's current expectations, beliefs, projections, future plans and strategies, anticipated events or trends, and similar expressions concerning matters that are not historical facts, as well as a number of assumptions concerning future events. Forward-looking statements in this release include, among other matters, statements regarding our business plans and strategies (including our expansion strategies) and the expected effects of those initiatives, general economic trends, particularly those that affect mortgage origination and refinance activity, and growth scenarios and performance targets. Readers should note, however, that all statements in this presentation other than assertions of historical fact are forward-looking in nature. These statements are subject to risks, uncertainties, assumptions and other important factors set forth in our SEC filings, including but not limited to our most recent Annual Report on Form 10-K for the fiscal year ended December 31, 2013, and our most recent Quarterly Report on Form 10-Q. Many of these factors are beyond our control. Such factors could cause actual results to differ materially from the results discussed or implied in the forward- looking statements. These risks include statements predicated on our ability to integrate our recent acquisitions and to continue to expand our banking operations geographically and across market sectors, grow our franchise and capitalize on market opportunities; our ability to manage these efforts cost-effectively and to attain the desired operational and financial outcomes; our ability to manage the losses inherent in our loan portfolio; our ability to make accurate estimates of the value of our non-cash assets and liabilities; our ability to maintain electronic and physical security of customer data; our ability to respond to an increasingly restrictive and complex regulatory environment; and our ability to attract and retain key personnel. Actual results may fall materially short of our expectations and projections, and we may change our plans or take additional actions that differ in material ways from our current intentions. Accordingly, we can give no assurance of future performance, and you should not rely unduly on forward-looking statements. All forward-looking statements are based on information available to the Company as of the date hereof, and we do not undertake to update or revise any forward-looking statements, for any reason. Basis of Presentation of Financial Data Unless noted otherwise in this presentation, all reported financial data is being presented as of the period ending June 30, 2014. Non-GAAP Financial Measures Information on any non-GAAP financial measures referenced in this presentation, including a reconciliation of those measures to GAAP measures, may also be found in our SEC filings and in the earnings release available on our web site. 2
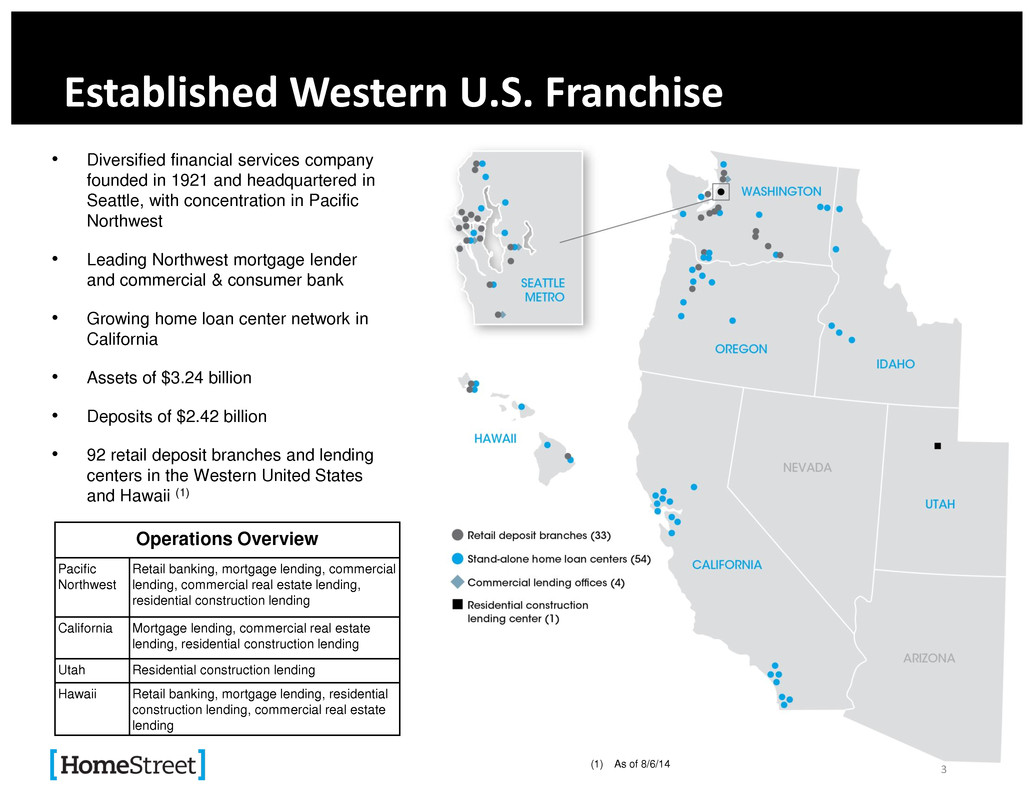
3 Established Western U.S. Franchise • Diversified financial services company founded in 1921 and headquartered in Seattle, with concentration in Pacific Northwest • Leading Northwest mortgage lender and commercial & consumer bank • Growing home loan center network in California • Assets of $3.24 billion • Deposits of $2.42 billion • 92 retail deposit branches and lending centers in the Western United States and Hawaii (1) (1) As of 8/6/14 Operations Overview Pacific Northwest Retail banking, mortgage lending, commercial lending, commercial real estate lending, residential construction lending California Mortgage lending, commercial real estate lending, residential construction lending Utah Residential construction lending Hawaii Retail banking, mortgage lending, residential construction lending, commercial real estate lending
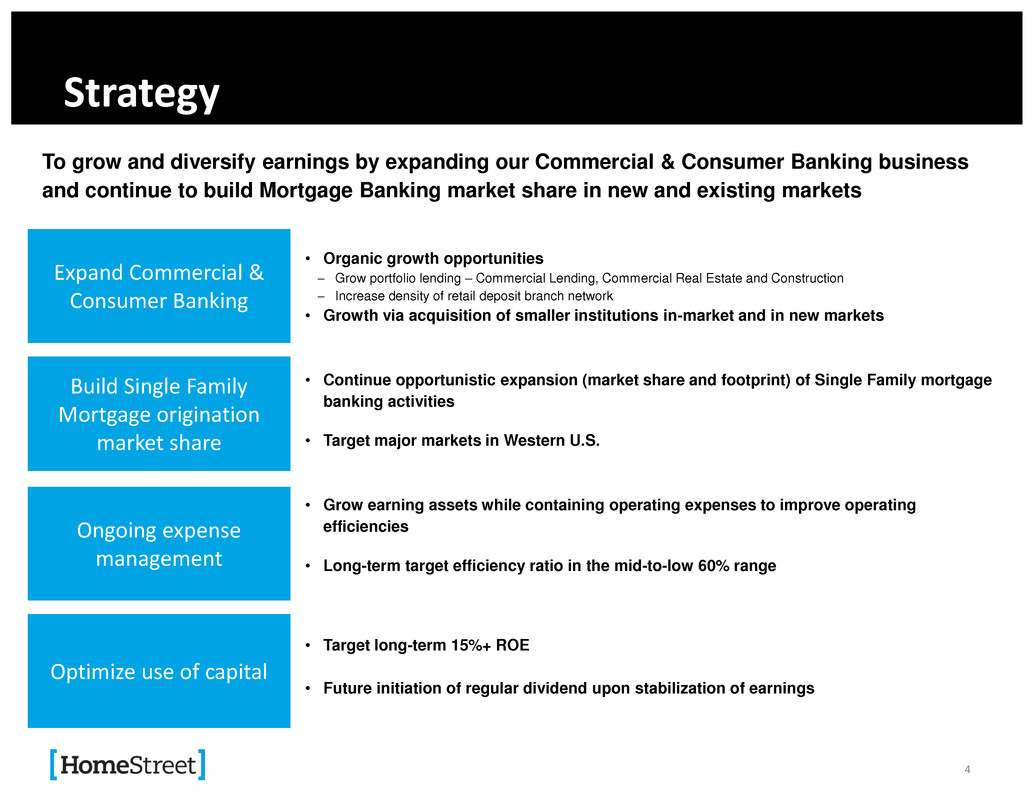
Strategy Build Single Family Mortgage origination market share • Organic growth opportunities Grow portfolio lending – Commercial Lending, Commercial Real Estate and Construction Increase density of retail deposit branch network • Growth via acquisition of smaller institutions in-market and in new markets • Continue opportunistic expansion (market share and footprint) of Single Family mortgage banking activities • Target major markets in Western U.S. • Grow earning assets while containing operating expenses to improve operating efficiencies • Long-term target efficiency ratio in the mid-to-low 60% range • Target long-term 15%+ ROE • Future initiation of regular dividend upon stabilization of earnings Expand Commercial & Consumer Banking Ongoing expense management Optimize use of capital To grow and diversify earnings by expanding our Commercial & Consumer Banking business and continue to build Mortgage Banking market share in new and existing markets 4
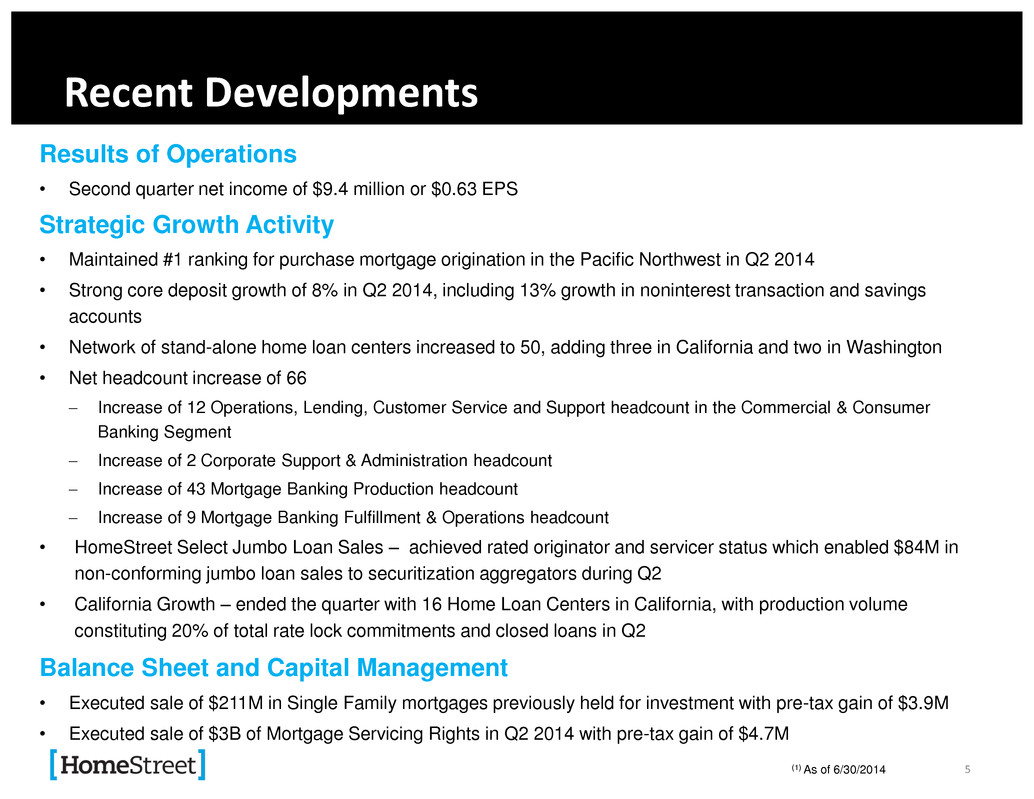
Recent Developments Results of Operations • Second quarter net income of $9.4 million or $0.63 EPS Strategic Growth Activity • Maintained #1 ranking for purchase mortgage origination in the Pacific Northwest in Q2 2014 • Strong core deposit growth of 8% in Q2 2014, including 13% growth in noninterest transaction and savings accounts • Network of stand-alone home loan centers increased to 50, adding three in California and two in Washington • Net headcount increase of 66 Increase of 12 Operations, Lending, Customer Service and Support headcount in the Commercial & Consumer Banking Segment Increase of 2 Corporate Support & Administration headcount Increase of 43 Mortgage Banking Production headcount Increase of 9 Mortgage Banking Fulfillment & Operations headcount • HomeStreet Select Jumbo Loan Sales – achieved rated originator and servicer status which enabled $84M in non-conforming jumbo loan sales to securitization aggregators during Q2 • California Growth – ended the quarter with 16 Home Loan Centers in California, with production volume constituting 20% of total rate lock commitments and closed loans in Q2 Balance Sheet and Capital Management • Executed sale of $211M in Single Family mortgages previously held for investment with pre-tax gain of $3.9M • Executed sale of $3B of Mortgage Servicing Rights in Q2 2014 with pre-tax gain of $4.7M (1) As of 6/30/2014 5
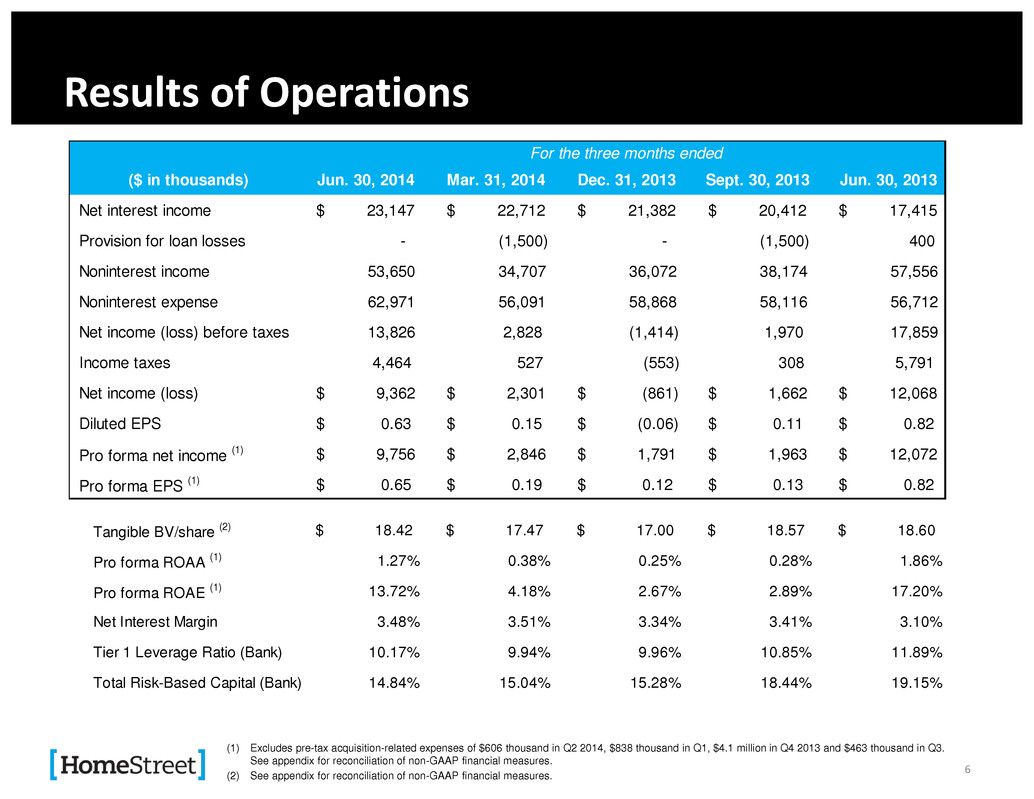
Results of Operations For the three months ended (1) Excludes pre-tax acquisition-related expenses of $606 thousand in Q2 2014, $838 thousand in Q1, $4.1 million in Q4 2013 and $463 thousand in Q3. See appendix for reconciliation of non-GAAP financial measures. (2) See appendix for reconciliation of non-GAAP financial measures. For the nine months ended ($ in thousands) Jun. 30, 2014 Mar. 31, 2014 Dec. 31, 2013 Sept. 30, 2013 Jun. 30, 2013 Net interest income $ 23,147 $ 22,712 $ 21,382 $ 20,412 $ 17,415 Provision for loan losses - (1,500) - (1,500) 400 Noninterest income 53,650 34,707 36,072 38,174 57,556 Noninterest expense 62,971 56,091 58,868 58,116 56,712 Net income (loss) before taxes 13,826 2,828 (1,414) 1,970 17,859 Income taxes 4,464 527 (553) 308 5,791 Net income (loss) $ 9,362 $ 2,301 $ (861) $ 1,662 $ 12,068 Diluted EPS $ 0.63 $ 0.15 $ (0.06) $ 0.11 $ 0.82 Pro forma net income (1) $ 9,756 $ 2,846 $ 1,791 $ 1,963 $ 12,072 Pro forma EPS (1) $ 0.65 $ 0.19 $ 0.12 $ 0.13 $ 0.82 Tangible BV/share (2) $ 18.42 $ 17.47 $ 17.00 $ 18.57 $ 18.60 Pro forma ROAA (1) 1.27% 0.38% 0.25% 0.28% 1.86% Pro forma ROAE (1) 13.72% 4.18% 2.67% 2.89% 17.20% Net In erest Margin 3.48% 3.51% 3.34% 3.41% 3.10% Tier 1 Leverage Ratio (Bank) 10.17% 9.94% 9.96% 10.85% 11.89% Total Risk-Based Capital (Bank) 14.84% 15.04% 15.28% 18.44% 19.15% For the three months ended 6
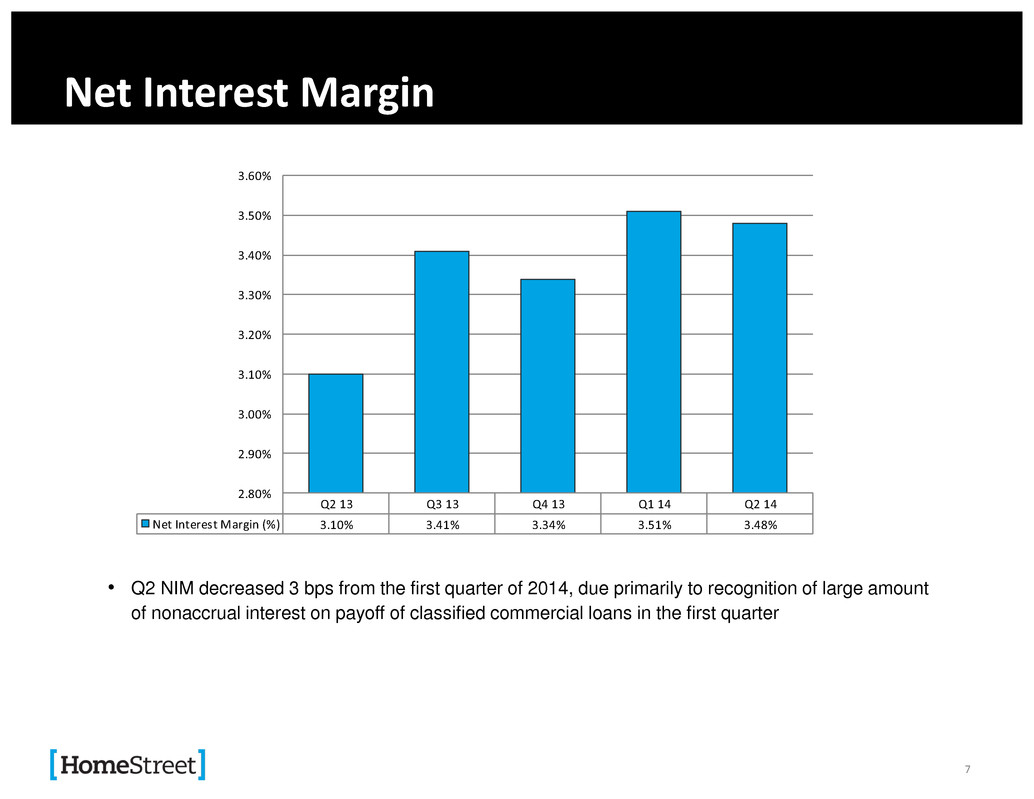
Q2 13 Q3 13 Q4 13 Q1 14 Q2 14 Net Interest Margin (%) 3.10% 3.41% 3.34% 3.51% 3.48% 2.80% 2.90% 3.00% 3.10% 3.20% 3.30% 3.40% 3.50% 3.60% Net Interest Margin • Q2 NIM decreased 3 bps from the first quarter of 2014, due primarily to recognition of large amount of nonaccrual interest on payoff of classified commercial loans in the first quarter 7
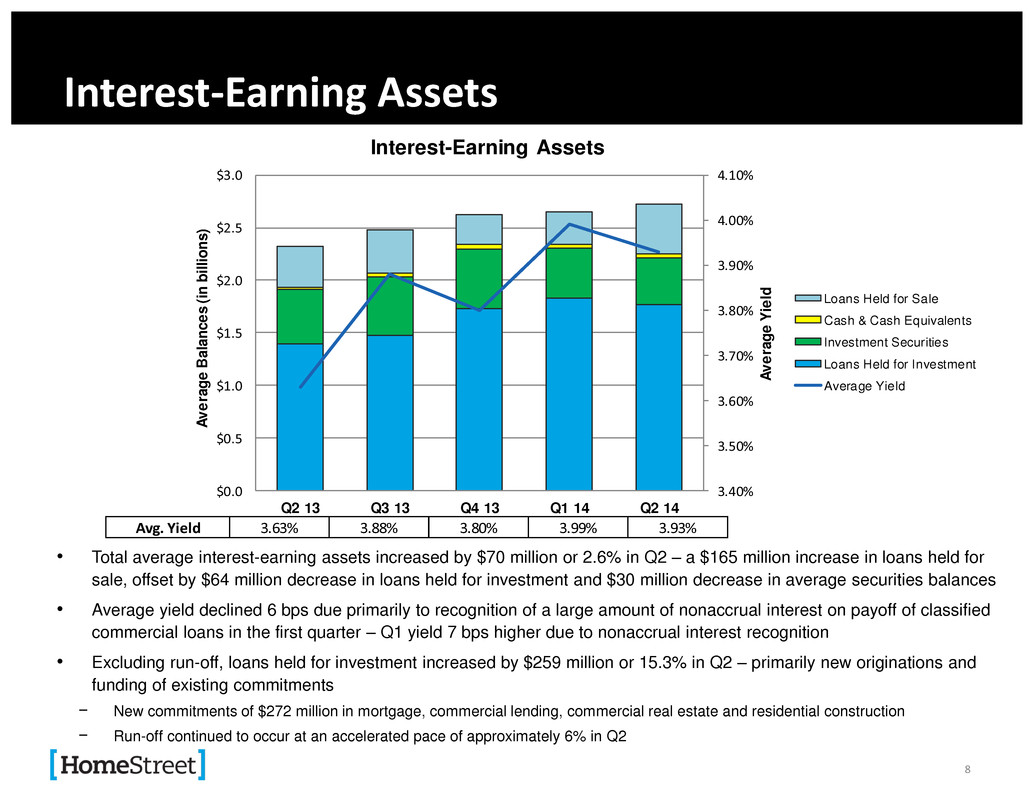
Avg. Yield 3.40% 3.50% 3.60% 3.70% 3.80% 3.90% 4.00% 4.10% $0.0 $0.5 $1.0 $1.5 $2.0 $2.5 $3.0 Q2 13 Q3 13 Q4 13 Q1 14 Q2 14 Av era ge Yi eld Av era ge Ba lan ce s ( in bil lio ns ) Interest-Earning Assets Loans Held for Sale Cash & Cash Equivalents Investment Securities Loans Held for Investment Average Yield Interest-Earning Assets • Total average interest-earning assets increased by $70 million or 2.6% in Q2 – a $165 million increase in loans held for sale, offset by $64 million decrease in loans held for investment and $30 million decrease in average securities balances • Average yield declined 6 bps due primarily to recognition of a large amount of nonaccrual interest on payoff of classified commercial loans in the first quarter – Q1 yield 7 bps higher due to nonaccrual interest recognition • Excluding run-off, loans held for investment increased by $259 million or 15.3% in Q2 – primarily new originations and funding of existing commitments − New commitments of $272 million in mortgage, commercial lending, commercial real estate and residential construction − Run-off continued to occur at an accelerated pace of approximately 6% in Q2 Avg. Yield 3.63% 3.88% 3.80% 3.99% 3.93% 8
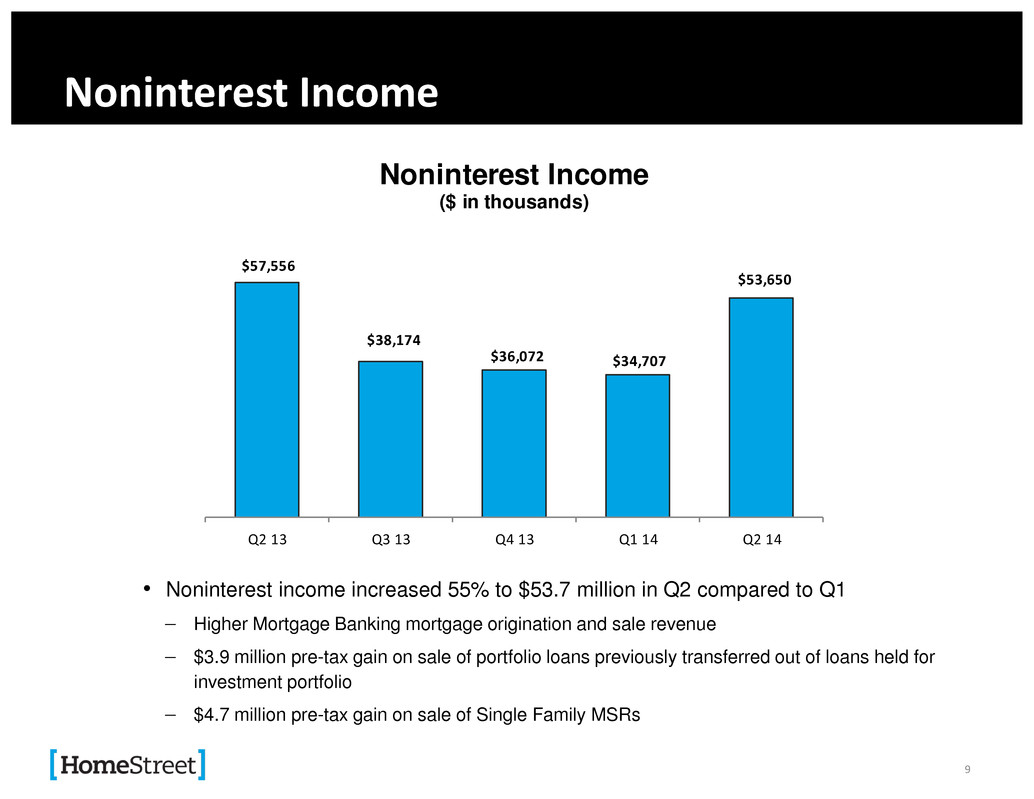
Noninterest Income • Noninterest income increased 55% to $53.7 million in Q2 compared to Q1 Higher Mortgage Banking mortgage origination and sale revenue $3.9 million pre-tax gain on sale of portfolio loans previously transferred out of loans held for investment portfolio $4.7 million pre-tax gain on sale of Single Family MSRs $57,556 $38,174 $36,072 $34,707 $53,650 Q2 13 Q3 13 Q4 13 Q1 14 Q2 14 Noninterest Income ($ in thousands) 9
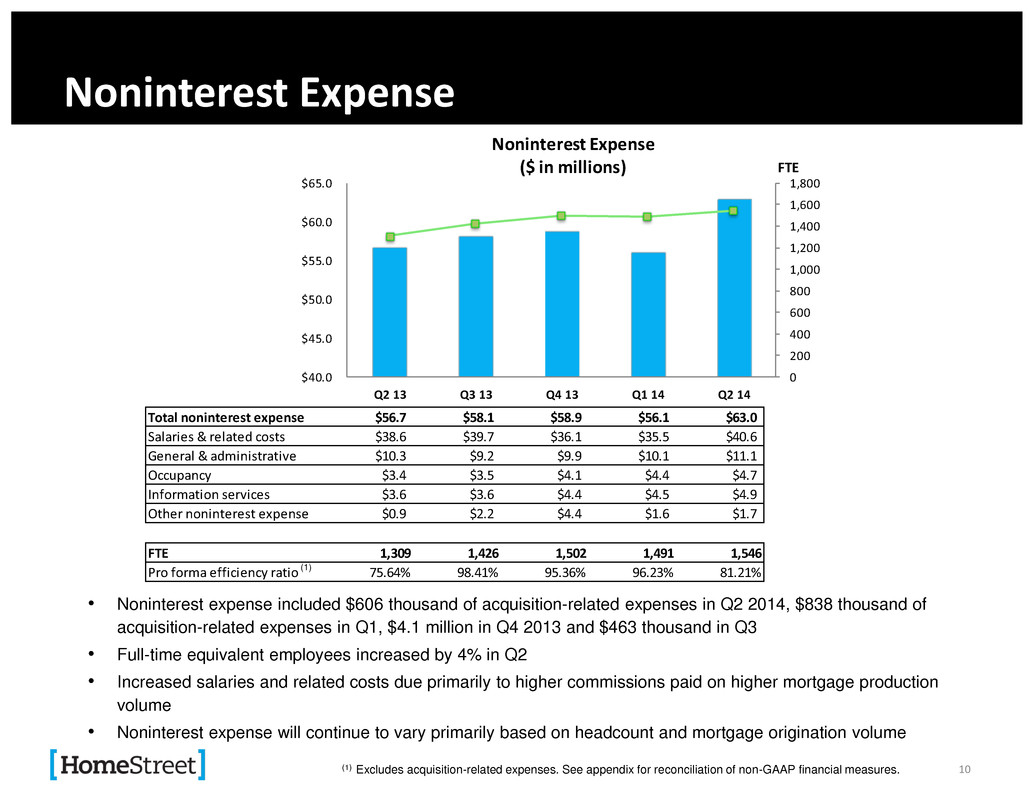
0 200 400 600 800 1,000 1,200 1,400 1,600 1,800 $40.0 $45.0 $50.0 $55.0 $60.0 $65.0 Q2 13 Q3 13 Q4 13 Q1 14 Q2 14 Noninterest Expense ($ in millions) FTE Total noninterest expense $56.7 $58.1 $58.9 $56.1 $63.0 Salaries & related costs $38.6 $39.7 $36.1 $35.5 $40.6 General & administrative $10.3 $9.2 $9.9 $10.1 $11.1 Occupancy $3.4 $3.5 $4.1 $4.4 $4.7 Information services $3.6 $3.6 $4.4 $4.5 $4.9 Other noninterest expense $0.9 $2.2 $4.4 $1.6 $1.7 FTE 1,309 1,426 1,502 1,491 1,546 Pro forma efficiency ratio 75.64% 98.41% 95.36% 96.23% 81.21% Noninterest Expense • Noninterest expense included $606 thousand of acquisition-related expenses in Q2 2014, $838 thousand of acquisition-related expenses in Q1, $4.1 million in Q4 2013 and $463 thousand in Q3 • Full-time equivalent employees increased by 4% in Q2 • Increased salaries and related costs due primarily to higher commissions paid on higher mortgage production volume • Noninterest expense will continue to vary primarily based on headcount and mortgage origination volume (1) Excludes acquisition-related expenses. See appendix for reconciliation of non-GAAP financial measures. (1) 10
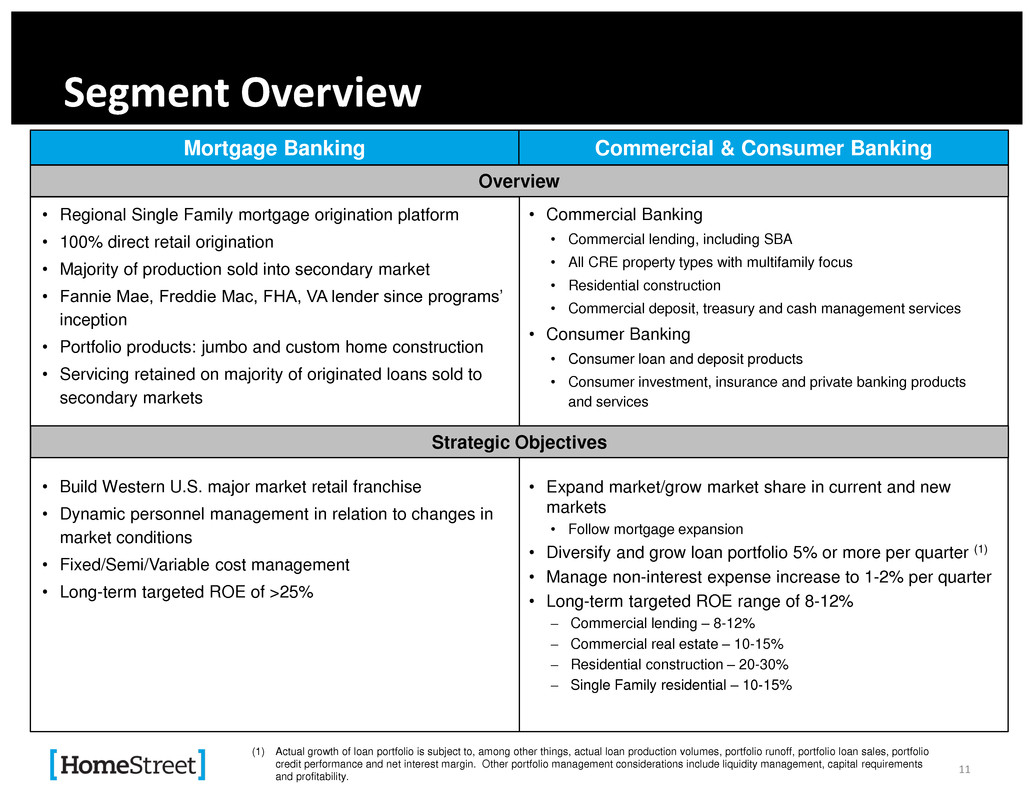
Segment Overview Mortgage Banking • Regional Single Family mortgage origination platform • 100% direct retail origination • Majority of production sold into secondary market • Fannie Mae, Freddie Mac, FHA, VA lender since programs’ inception • Portfolio products: jumbo and custom home construction • Servicing retained on majority of originated loans sold to secondary markets • Build Western U.S. major market retail franchise • Dynamic personnel management in relation to changes in market conditions • Fixed/Semi/Variable cost management • Long-term targeted ROE of >25% Commercial & Consumer Banking Overview • Commercial Banking • Commercial lending, including SBA • All CRE property types with multifamily focus • Residential construction • Commercial deposit, treasury and cash management services • Consumer Banking • Consumer loan and deposit products • Consumer investment, insurance and private banking products and services • Expand market/grow market share in current and new markets • Follow mortgage expansion • Diversify and grow loan portfolio 5% or more per quarter (1) • Manage non-interest expense increase to 1-2% per quarter • Long-term targeted ROE range of 8-12% Commercial lending – 8-12% Commercial real estate – 10-15% Residential construction – 20-30% Single Family residential – 10-15% Strategic Objectives (1) Actual growth of loan portfolio is subject to, among other things, actual loan production volumes, portfolio runoff, portfolio loan sales, portfolio credit performance and net interest margin. Other portfolio management considerations include liquidity management, capital requirements and profitability. 11

Commercial & Consumer Banking 12
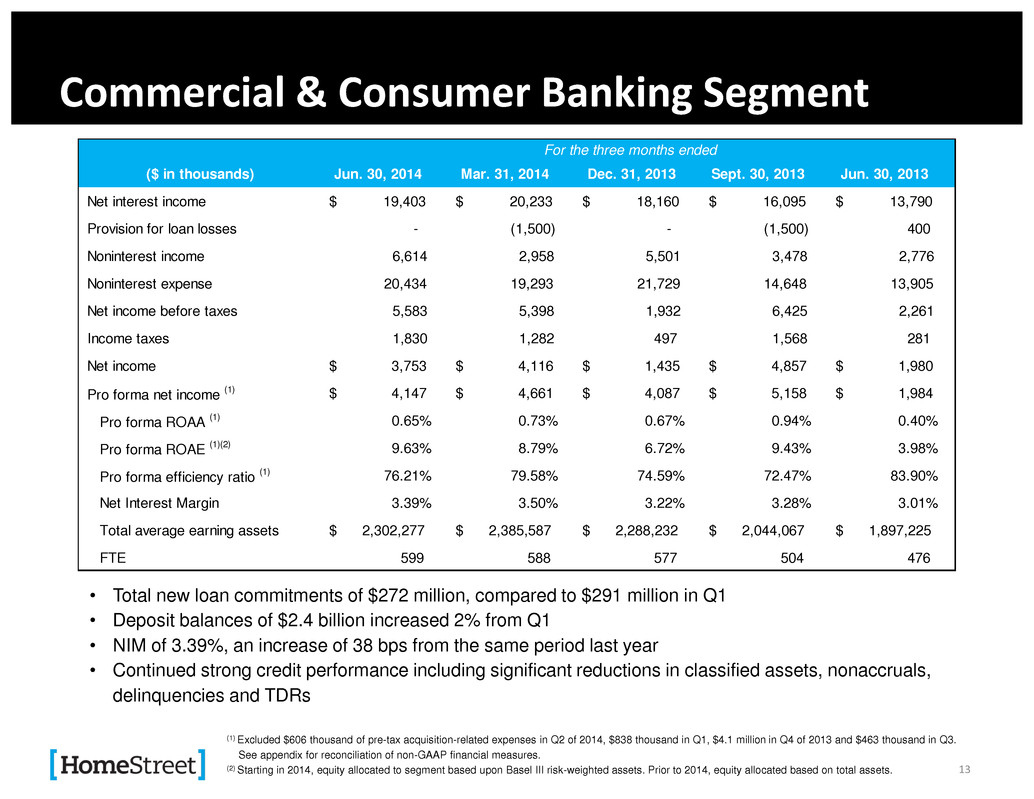
Commercial & Consumer Banking Segment • Total new loan commitments of $272 million, compared to $291 million in Q1 • Deposit balances of $2.4 billion increased 2% from Q1 • NIM of 3.39%, an increase of 38 bps from the same period last year • Continued strong credit performance including significant reductions in classified assets, nonaccruals, delinquencies and TDRs (1) Excluded $606 thousand of pre-tax acquisition-related expenses in Q2 of 2014, $838 thousand in Q1, $4.1 million in Q4 of 2013 and $463 thousand in Q3. See appendix for reconciliation of non-GAAP financial measures. (2) Starting in 2014, equity allocated to segment based upon Basel III risk-weighted assets. Prior to 2014, equity allocated based on total assets. ($ in thousands) Jun. 30, 2014 Mar. 31, 2014 Dec. 31, 2013 Sept. 30, 2013 Jun. 30, 2013 Net interest income $ 19,403 $ 20,233 $ 18,160 $ 16,095 $ 13,790 Provision for loan losses - (1,500) - (1,500) 400 Noninterest income 6,614 2,958 5,501 3,478 2,776 Noninterest expense 20,434 19,293 21,729 14,648 13,905 Net income before taxes 5,583 5,398 1,932 6,425 2,261 Income taxes 1,830 1,282 497 1,568 281 Net income $ 3,753 $ 4,116 $ 1,435 $ 4,857 $ 1,980 Pro forma net income (1) $ 4,147 $ 4,661 $ 4,087 $ 5,158 $ 1,984 Pro forma ROAA (1) 0.65% 0.73% 0.67% 0.94% 0.40% Pro forma ROAE (1)(2) 9.63% 8.79% 6.72% 9.43% 3.98% Pro forma efficiency ratio (1) 76.21% 79.58% 74.59% 72.47% 83.90% Net Interest Margin 3.39% 3.50% 3.22% 3.28% 3.01% Total average earning assets $ 2,302,277 $ 2,385,587 $ 2,288,232 $ 2,044,067 $ 1,897,225 FTE 599 588 577 504 476 For the three months ended 13
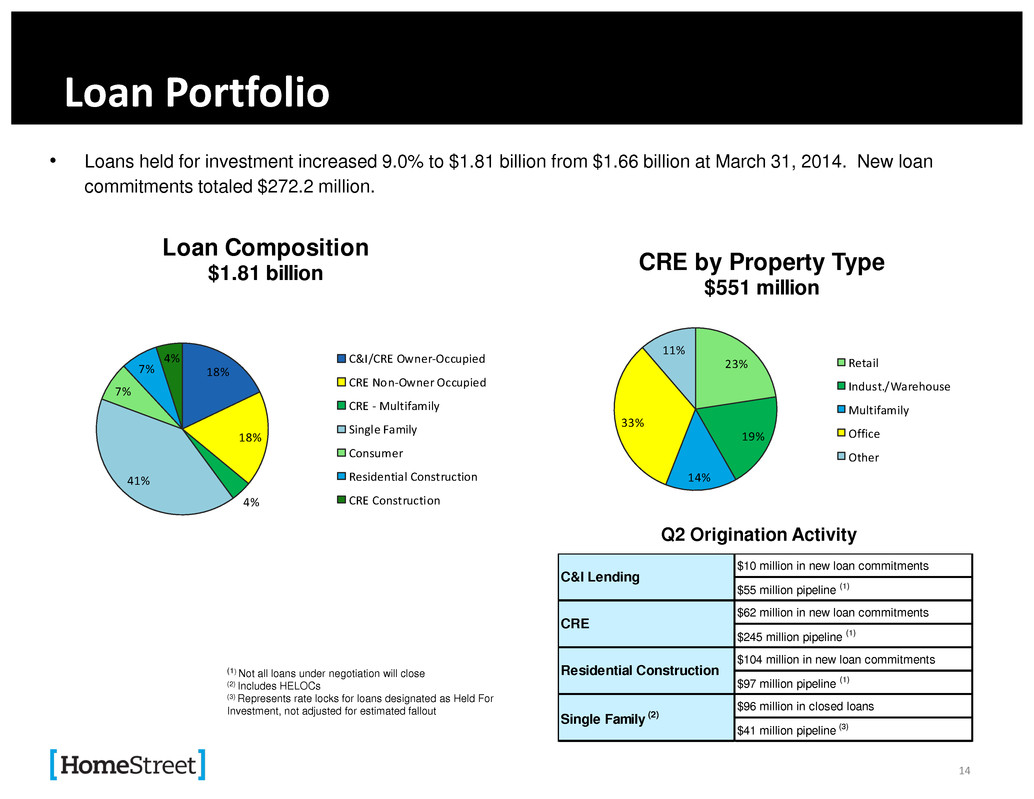
Loan Portfolio • Loans held for investment increased 9.0% to $1.81 billion from $1.66 billion at March 31, 2014. New loan commitments totaled $272.2 million. (1) Not all loans under negotiation will close (2) Includes HELOCs (3) Represents rate locks for loans designated as Held For Investment, not adjusted for estimated fallout Q2 Origination Activity 14 18% 18% 4% 41% 7% 7% 4% Loan Composition $1.81 billion C&I/CRE Owner-Occupied CRE Non-Owner Occupied CRE - Multifamily Single Family Consumer Residential Construction CRE Construction 23% 19% 14% 33% 11% CRE by Property Type $551 million Retail Indust./Warehouse Multifamily Office Other $10 million in new loan commitments $55 million pipeline (1) $62 million in new loan commitments $245 million pipeline (1) $104 million in new loan commitments $97 million pipeline (1) $96 million in closed loans $41 million pipeline (3) C&I Lending CRE Residential Construction Single Family (2)
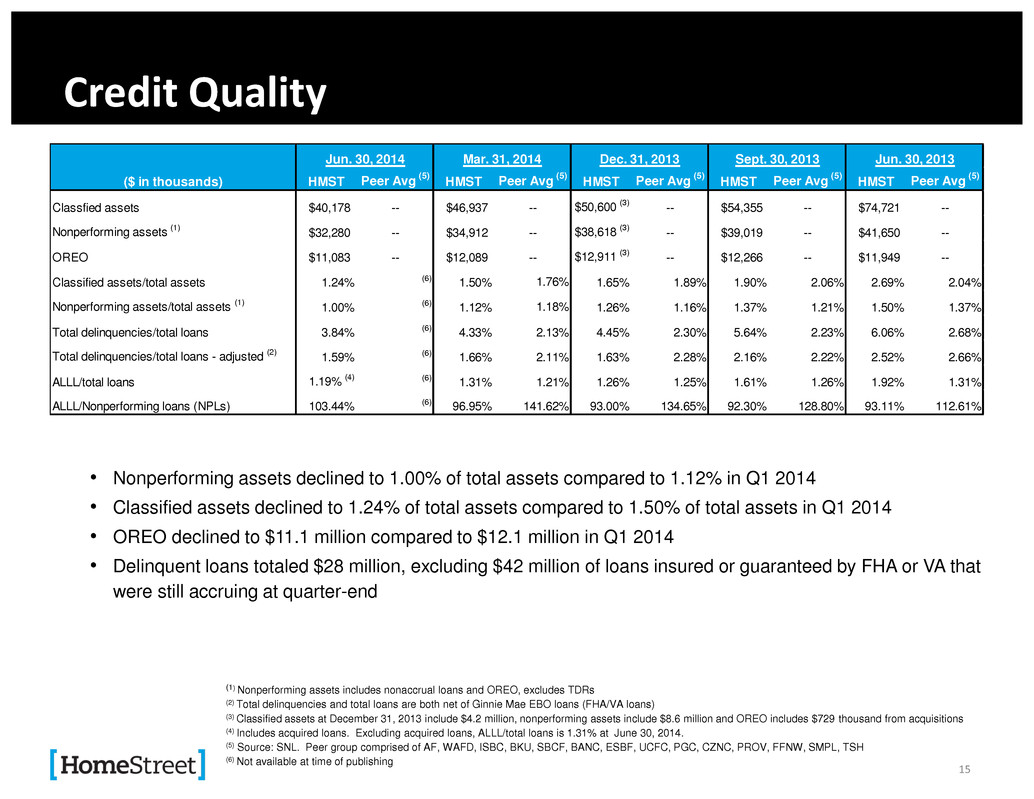
Credit Quality • Nonperforming assets declined to 1.00% of total assets compared to 1.12% in Q1 2014 • Classified assets declined to 1.24% of total assets compared to 1.50% of total assets in Q1 2014 • OREO declined to $11.1 million compared to $12.1 million in Q1 2014 • Delinquent loans totaled $28 million, excluding $42 million of loans insured or guaranteed by FHA or VA that were still accruing at quarter-end (1) Nonperforming assets includes nonaccrual loans and OREO, excludes TDRs (2) Total delinquencies and total loans are both net of Ginnie Mae EBO loans (FHA/VA loans) (3) Classified assets at December 31, 2013 include $4.2 million, nonperforming assets include $8.6 million and OREO includes $729 thousand from acquisitions (4) Includes acquired loans. Excluding acquired loans, ALLL/total loans is 1.31% at June 30, 2014. (5) Source: SNL. Peer group comprised of AF, WAFD, ISBC, BKU, SBCF, BANC, ESBF, UCFC, PGC, CZNC, PROV, FFNW, SMPL, TSH (6) Not available at time of publishing 15 ($ in thousands) HMST Peer Avg (5) HMST Peer Avg (5) HMST Peer Avg (5) HMST Peer Avg (5) HMST Peer Avg (5) Classfied assets $40,178 -- $46,937 -- $50,600 (3) -- $54,355 -- $74,721 -- Nonperforming assets (1) $32,280 -- $34,912 -- $38,618 (3) -- $39,019 -- $41,650 -- OREO $11,083 -- $12,089 -- $12,911 (3) -- $12,266 -- $11,949 -- Classified assets/total assets 1.24% (6) 1.50% 1.76% 1.65% 1.89% 1.90% 2.06% 2.69% 2.04% Nonperforming assets/total assets (1) 1.00% (6) 1.12% 1.18% 1.26% 1.16% 1.37% 1.21% 1.50% 1.37% Total delinquencies/total loans 3.84% (6) 4.33% 2.13% 4.45% 2.30% 5.64% 2.23% 6.06% 2.68% Total delinquencies/total loans - adjusted (2) 1.59% (6) 1.66% 2.11% 1.63% 2.28% 2.16% 2.22% 2.52% 2.66% ALLL/total loans 1.19% (4) (6) 1.31% 1.21% 1.26% 1.25% 1.61% 1.26% 1.92% 1.31% ALLL/Nonperforming loans (NPLs) 103.44% (6) 96.95% 141.62% 93.00% 134.65% 92.30% 128.80% 93.11% 112.61% Jun. 30, 2014 Mar. 31, 2014 Jun. 30, 2013Sept. 30, 2013Dec. 31, 2013
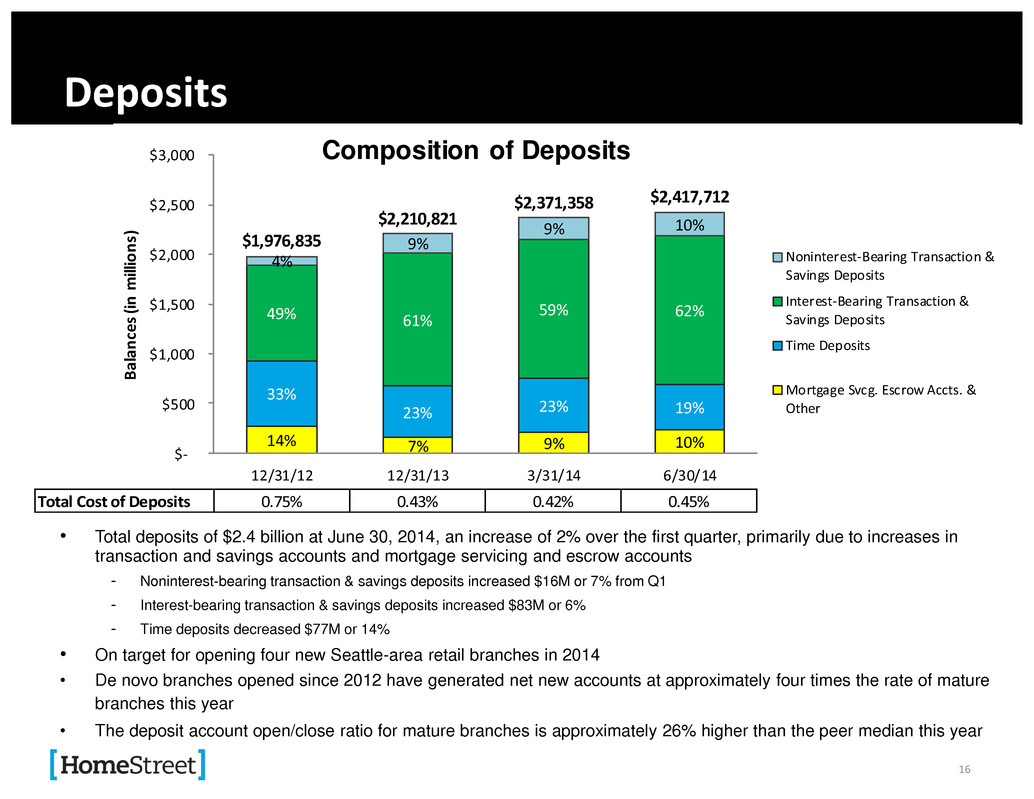
Deposits • Total deposits of $2.4 billion at June 30, 2014, an increase of 2% over the first quarter, primarily due to increases in transaction and savings accounts and mortgage servicing and escrow accounts - Noninterest-bearing transaction & savings deposits increased $16M or 7% from Q1 - Interest-bearing transaction & savings deposits increased $83M or 6% - Time deposits decreased $77M or 14% • On target for opening four new Seattle-area retail branches in 2014 • De novo branches opened since 2012 have generated net new accounts at approximately four times the rate of mature branches this year • The deposit account open/close ratio for mature branches is approximately 26% higher than the peer median this year 16 Total Cost of Deposits 14% 7% 9% 10% 33% 23% 23% 19% 49% 61% 59% 62% 4% 9% 9% 10% $1,976,835 $2,210,821 $2,371,358 $2,417,712 $- $500 $1,000 $1,500 $2,000 $2,500 $3,000 12/31/12 12/31/13 3/31/14 6/30/14 Bala nce s (in mil lion s) Composition of Deposits Noninterest-Bearing Transaction & Savings Deposits Interest-Bearing Transaction & Savings Deposits Time Deposits Mortgage Svcg. Escrow Accts. & Other Total Cost of Deposits 0.75% 0.43% 0.42% 0.45%
Mortgage Banking 17
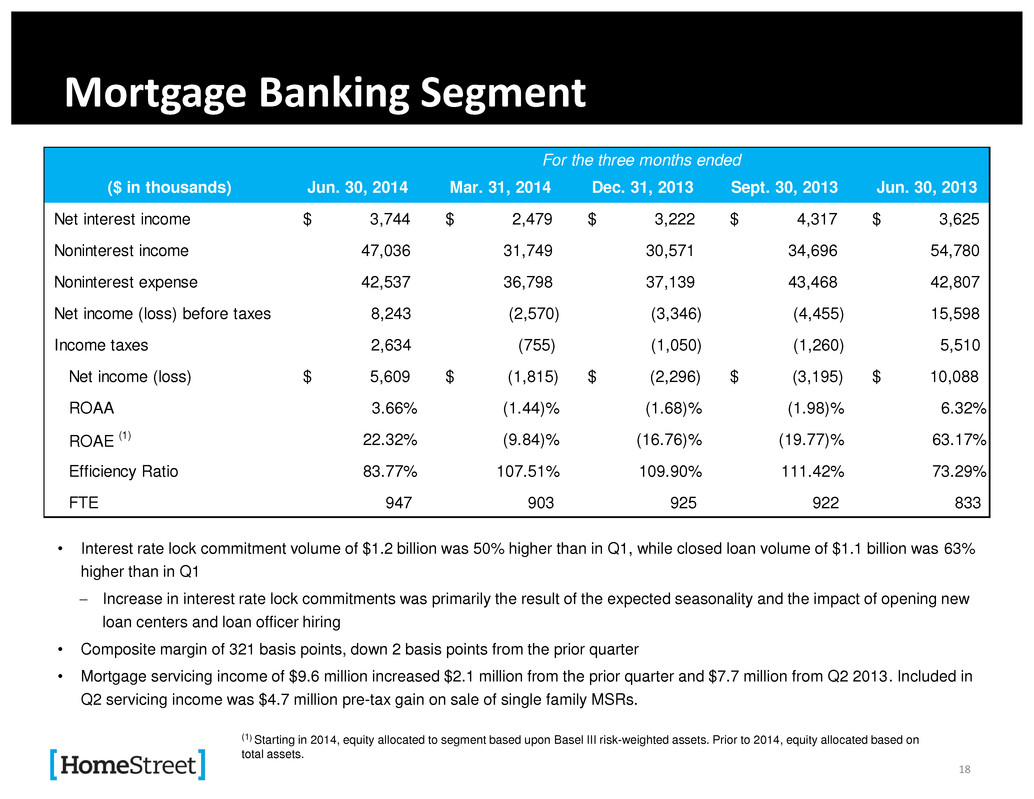
($ in thousands) Jun. 30, 2014 Mar. 31, 2014 Dec. 31, 2013 Sept. 30, 2013 Jun. 30, 2013 Net interest income $ 3,744 $ 2,479 $ 3,222 $ 4,317 $ 3,625 Noninterest income 47,036 31,749 30,571 34,696 54,780 Noninterest expense 42,537 36,798 37,139 43,468 42,807 Net income (loss) before taxes 8,243 (2,570) (3,346) (4,455) 15,598 Income taxes 2,634 (755) (1,050) (1,260) 5,510 Net income (loss) $ 5,609 $ (1,815) $ (2,296) $ (3,195) $ 10,088 ROAA 3.66% (1.44)% (1.68)% (1.98)% 6.32% ROAE (1) 22.32% (9.84)% (16.76)% (19.77)% 63.17% Efficiency Ratio 83.77% 107.51% 109.90% 111.42% 73.29% FTE 947 903 925 922 833 For the three months ended Mortgage Banking Segment • Interest rate lock commitment volume of $1.2 billion was 50% higher than in Q1, while closed loan volume of $1.1 billion was 63% higher than in Q1 Increase in interest rate lock commitments was primarily the result of the expected seasonality and the impact of opening new loan centers and loan officer hiring • Composite margin of 321 basis points, down 2 basis points from the prior quarter • Mortgage servicing income of $9.6 million increased $2.1 million from the prior quarter and $7.7 million from Q2 2013. Included in Q2 servicing income was $4.7 million pre-tax gain on sale of single family MSRs. (1) Starting in 2014, equity allocated to segment based upon Basel III risk-weighted assets. Prior to 2014, equity allocated based on total assets. 18
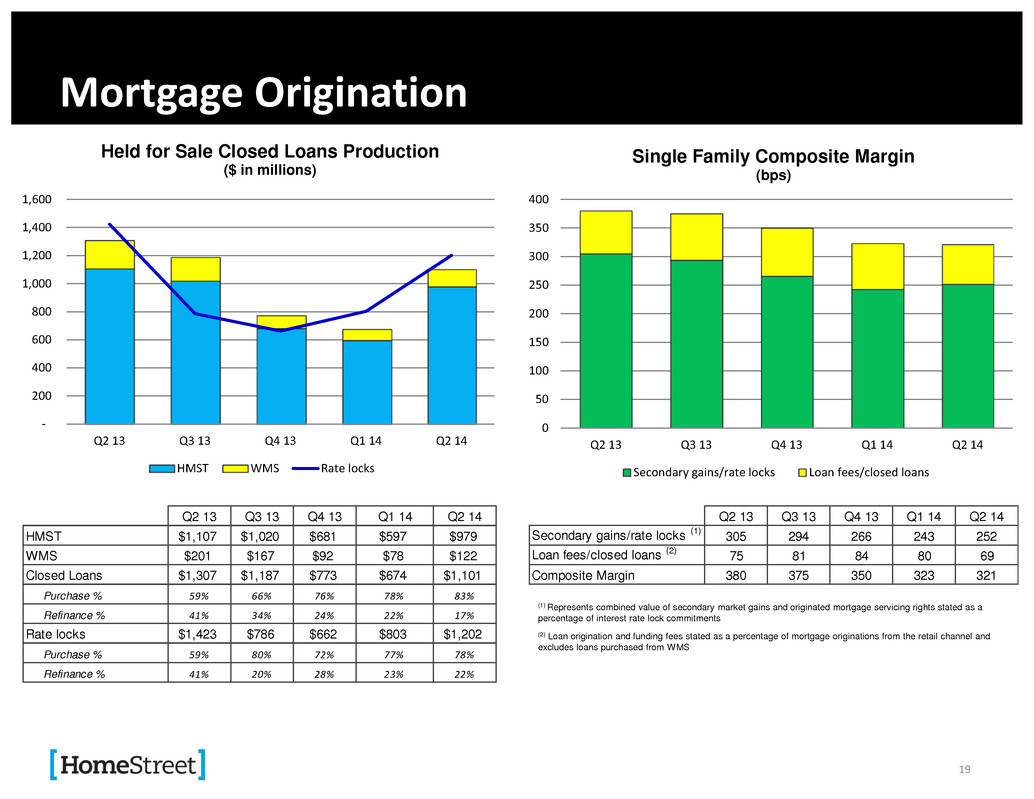
Mortgage Origination (1) Represents combined value of secondary market gains and originated mortgage servicing rights stated as a percentage of interest rate lock commitments (2) Loan origination and funding fees stated as a percentage of mortgage originations from the retail channel and excludes loans purchased from WMS 19 0 50 100 150 200 250 300 350 400 Q2 13 Q3 13 Q4 13 Q1 14 Q2 14 Single Family Composite Margin (bps) Secondary gains/rate locks Loan fees/closed loans Q2 13 Q3 13 Q4 13 Q1 14 Q2 14 Secondary gains/rate locks (1) 305 294 266 243 252 Loan fees/closed loans (2) 75 81 84 80 69 Composite Margin 380 375 350 323 321 - 200 400 600 800 1,000 1,200 1,400 1,600 Q2 13 Q3 13 Q4 13 Q1 14 Q2 14 Held for Sale Closed Loans Production ($ in millions) HMST WMS Rate locks Bps Q2 13 Q3 13 Q4 13 Q1 14 Q2 14 HMST $1,107 $1,020 $681 $597 $979 WMS $201 $167 $92 $78 $122 Closed Loans $1,307 $1,187 $773 $674 $1,101 Purchase % 59% 66% 76% 78% 83% Refinance % 41% 34% 24% 22% 17% Rate locks $1,423 $786 $662 $803 $1,202 Purchase % 59% 80% 72% 77% 78% Refinance % 41% 20% 28% 23% 22%
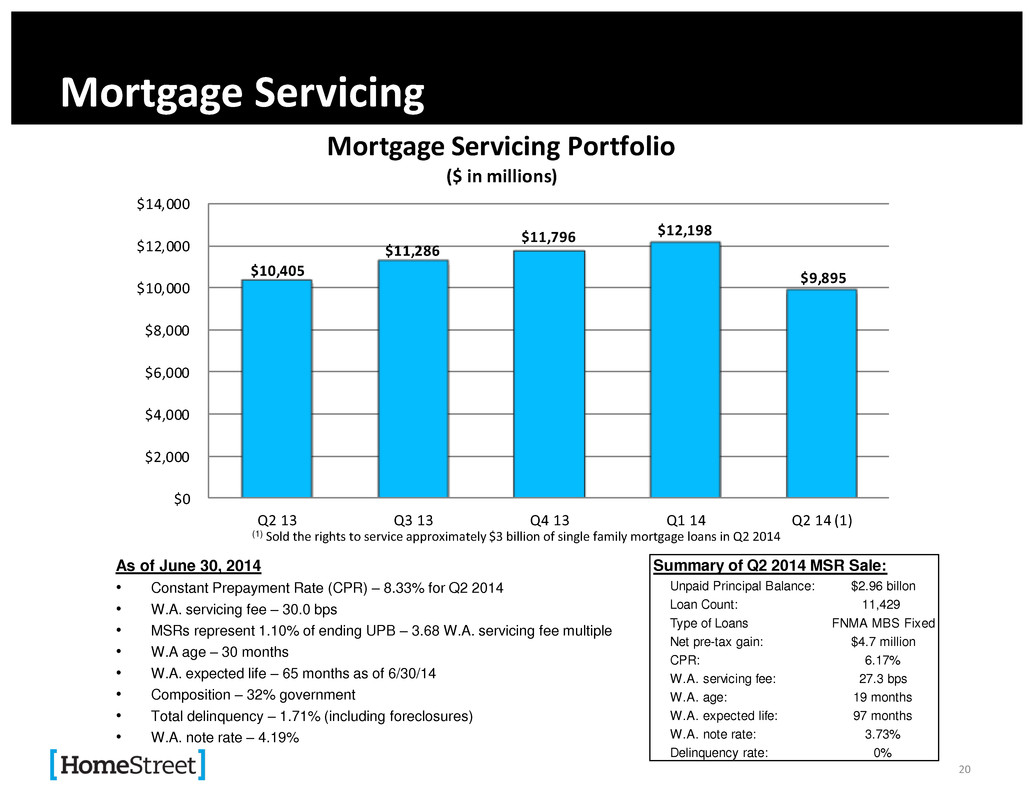
Mortgage Servicing As of June 30, 2014 • Constant Prepayment Rate (CPR) – 8.33% for Q2 2014 • W.A. servicing fee – 30.0 bps • MSRs represent 1.10% of ending UPB – 3.68 W.A. servicing fee multiple • W.A age – 30 months • W.A. expected life – 65 months as of 6/30/14 • Composition – 32% government • Total delinquency – 1.71% (including foreclosures) • W.A. note rate – 4.19% 20 (1) Sold the rights to service approximately $3 billion of single family mortgage loans in Q2 2014 Summary of Q2 2014 MSR Sale: Unpaid Principal Balance: $2.96 billon Loan Count: 11,429 Type of Loans FNMA MBS Fixed Net pre-tax gain: $4.7 million CPR: 6.17% W.A. servicing fee: 27.3 bps W.A. age: 19 months W.A. expected life: 97 months W.A. note rate: 3.73% Delinquency rate: 0% $10,405 $11,286 $11,796 $12,198 $9,895 $0 $2,000 $4,000 $6,000 $8,000 $10,000 $12,000 $14,000 Q2 13 Q3 13 Q4 13 Q1 14 Q2 14 (1) Mortgage Servicing Portfolio ($ in millions)
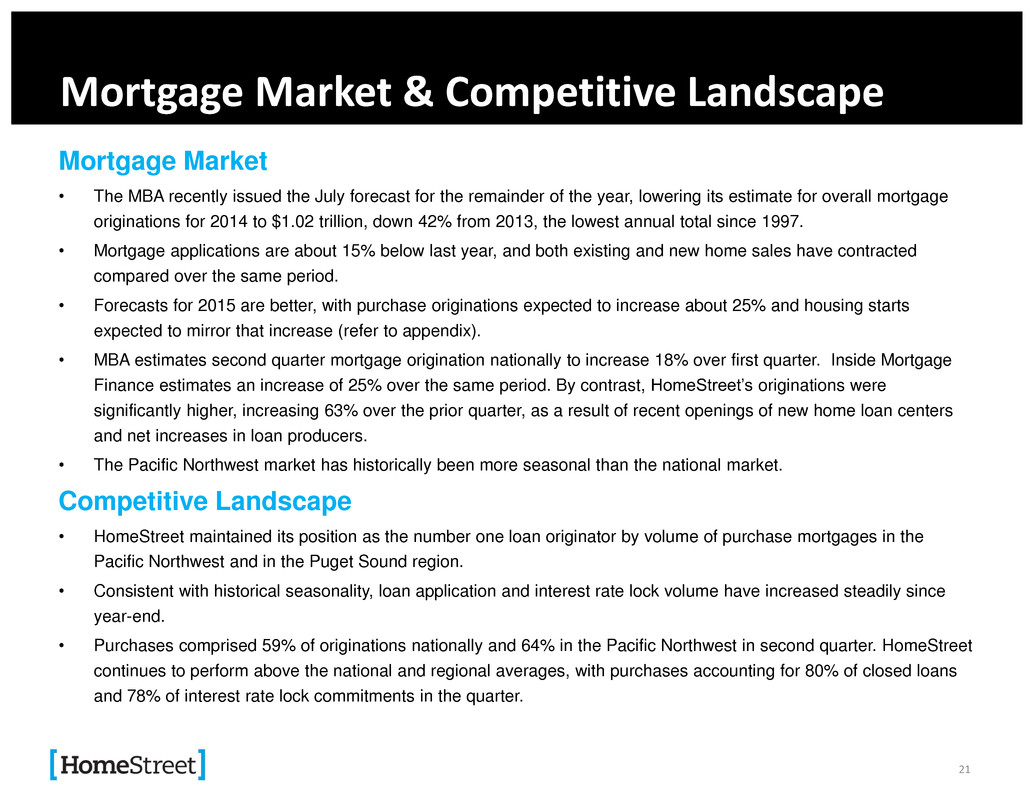
Mortgage Market & Competitive Landscape Mortgage Market • The MBA recently issued the July forecast for the remainder of the year, lowering its estimate for overall mortgage originations for 2014 to $1.02 trillion, down 42% from 2013, the lowest annual total since 1997. • Mortgage applications are about 15% below last year, and both existing and new home sales have contracted compared over the same period. • Forecasts for 2015 are better, with purchase originations expected to increase about 25% and housing starts expected to mirror that increase (refer to appendix). • MBA estimates second quarter mortgage origination nationally to increase 18% over first quarter. Inside Mortgage Finance estimates an increase of 25% over the same period. By contrast, HomeStreet’s originations were significantly higher, increasing 63% over the prior quarter, as a result of recent openings of new home loan centers and net increases in loan producers. • The Pacific Northwest market has historically been more seasonal than the national market. Competitive Landscape • HomeStreet maintained its position as the number one loan originator by volume of purchase mortgages in the Pacific Northwest and in the Puget Sound region. • Consistent with historical seasonality, loan application and interest rate lock volume have increased steadily since year-end. • Purchases comprised 59% of originations nationally and 64% in the Pacific Northwest in second quarter. HomeStreet continues to perform above the national and regional averages, with purchases accounting for 80% of closed loans and 78% of interest rate lock commitments in the quarter. 21
Origination Growth Strategy • Grow market share in many of our existing and new regions. California accounted for 20% of our closed loans and interest rate lock volume in the second quarter. • Our strategy of continuing to grow our retail mortgage banking franchise and mitigating the effects of a constrained market through this growth helped us increase our closed loan production at two to three times the rate of the industry in the second quarter. • The mortgage origination business returned to profitability in the second quarter, a first since the second quarter of last year, benefiting from significant increases in closed loans and interest rate lock commitments. • Average loan amount increased 9% to $292,500 in June compared to December of last year. This growth in average loan size is attributable to a number of factors including the growth in jumbo non-conforming loans as a percent of our total, our growing franchise and market share in California and overall home price appreciation in all markets we serve. • Over the last year, HomeStreet became a rated originator and servicer of non-conforming jumbo mortgage loans to enable us to sell our loans to securitization aggregators. 22
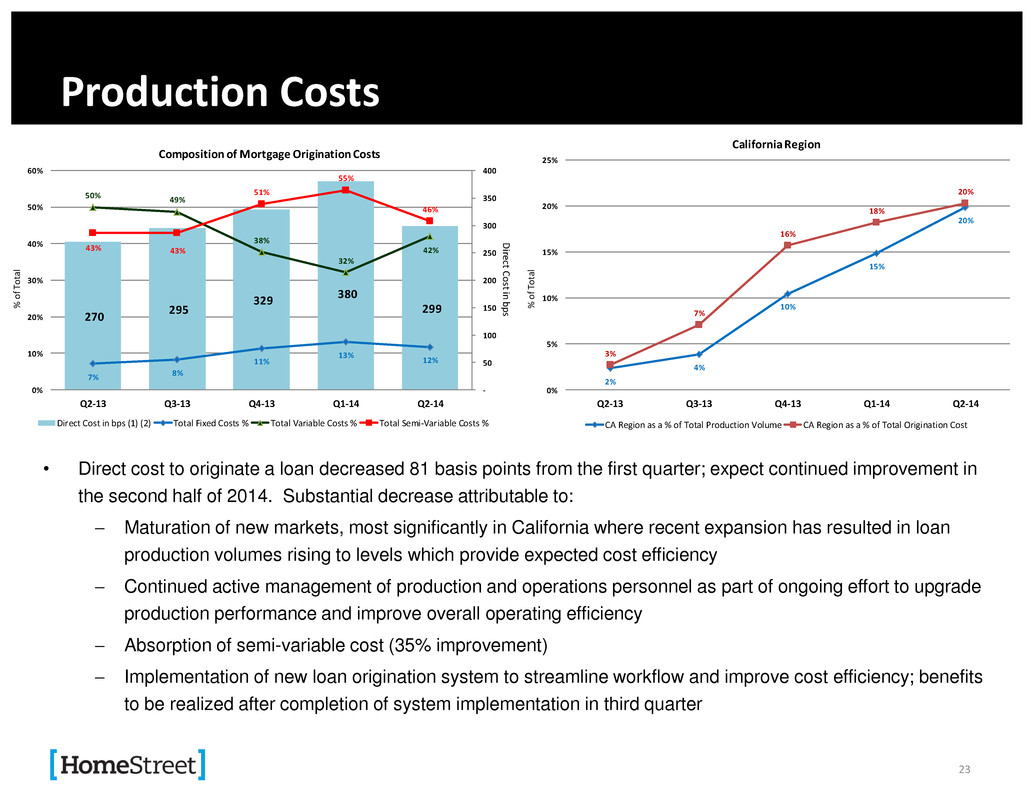
Production Costs • Direct cost to originate a loan decreased 81 basis points from the first quarter; expect continued improvement in the second half of 2014. Substantial decrease attributable to: Maturation of new markets, most significantly in California where recent expansion has resulted in loan production volumes rising to levels which provide expected cost efficiency Continued active management of production and operations personnel as part of ongoing effort to upgrade production performance and improve overall operating efficiency Absorption of semi-variable cost (35% improvement) Implementation of new loan origination system to streamline workflow and improve cost efficiency; benefits to be realized after completion of system implementation in third quarter 23 270 295 329 380 299 7% 8% 11% 13% 12% 50% 49% 38% 32% 42%43% 43% 51% 55% 46% - 50 100 150 200 250 300 350 400 0% 10% 20% 30% 40% 50% 60% Q2-13 Q3-13 Q4-13 Q1-14 Q2-14 Direct Cost in bps% of To tal Composition of Mortgage Origination Costs Direct Cost in bps (1) (2) Total Fixed Costs % Total Variable Costs % Total Semi-Variable Costs % 2% 4% 10% 15% 20% 3% 7% 16% 18% 20% 0% 5% 10% 15% 20% 25% Q2-13 Q3-13 Q4- 3 Q1-14 Q2-14 % of To tal California Region CA Region as a % f Total Production Volume CA Regi n as a % of Total Origination Cost
Franchise Value • Established and growing financial institution concentrated in the Pacific Northwest • Leading regional Single Family mortgage lender • Focus on business diversification: growth of Commercial & Consumer Banking to balance Mortgage Banking earnings • High historical returns on equity due to high noninterest income • Attractive valuation transition opportunity as company diversifies http://ir.homestreet.com ir@homestreet.com 24
. Appendix 25
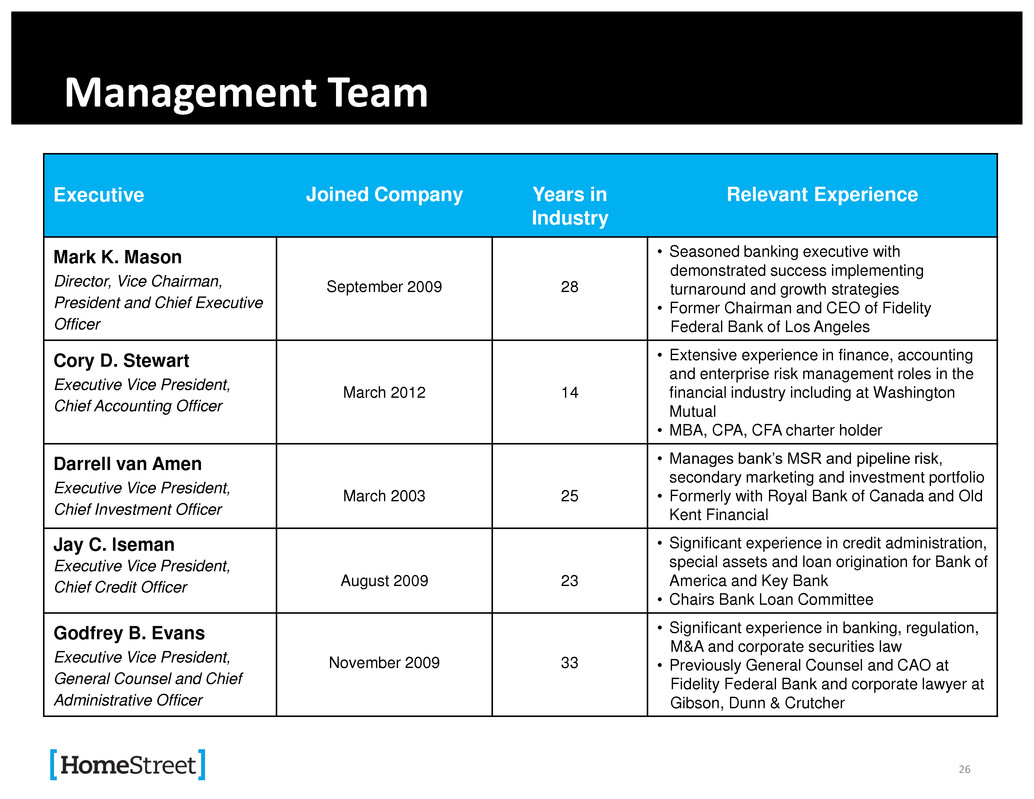
Management Team Executive Joined Company Years in Industry Relevant Experience Mark K. Mason Director, Vice Chairman, President and Chief Executive Officer September 2009 28 • Seasoned banking executive with demonstrated success implementing turnaround and growth strategies • Former Chairman and CEO of Fidelity Federal Bank of Los Angeles Cory D. Stewart Executive Vice President, Chief Accounting Officer March 2012 14 • Extensive experience in finance, accounting and enterprise risk management roles in the financial industry including at Washington Mutual • MBA, CPA, CFA charter holder Darrell van Amen Executive Vice President, Chief Investment Officer March 2003 25 • Manages bank’s MSR and pipeline risk, secondary marketing and investment portfolio • Formerly with Royal Bank of Canada and Old Kent Financial Jay C. Iseman Executive Vice President, Chief Credit Officer August 2009 23 • Significant experience in credit administration, special assets and loan origination for Bank of America and Key Bank • Chairs Bank Loan Committee Godfrey B. Evans Executive Vice President, General Counsel and Chief Administrative Officer November 2009 33 • Significant experience in banking, regulation, M&A and corporate securities law • Previously General Counsel and CAO at Fidelity Federal Bank and corporate lawyer at Gibson, Dunn & Crutcher 26
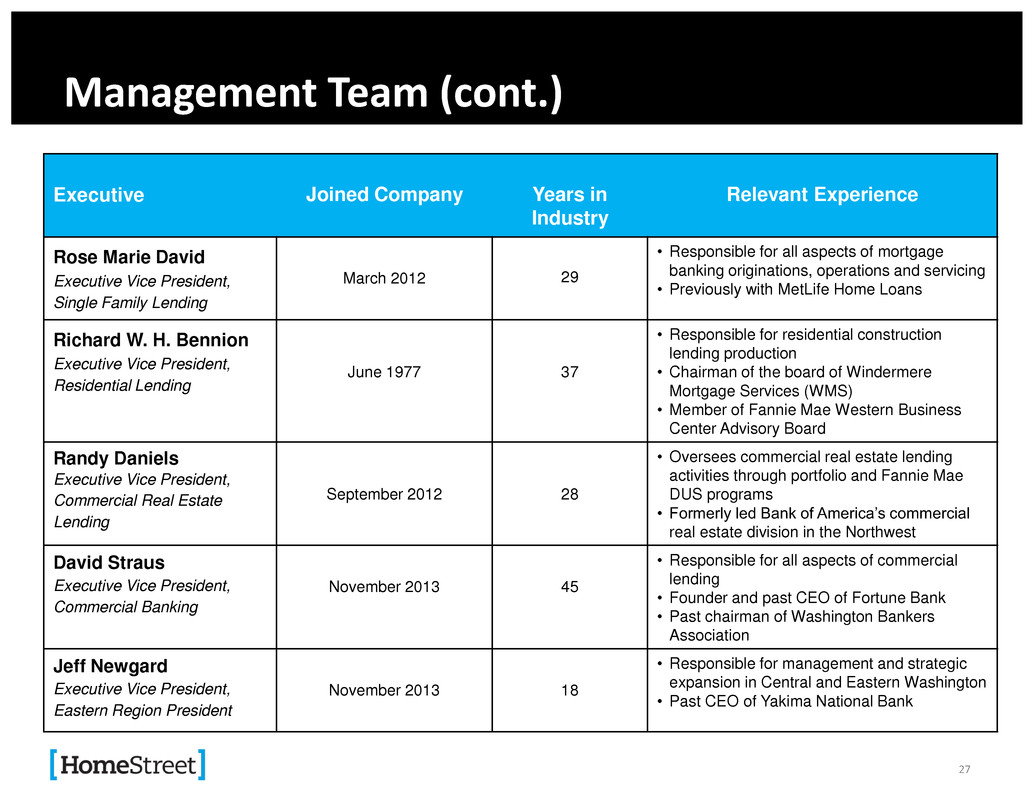
Management Team (cont.) Executive Joined Company Years in Industry Relevant Experience Rose Marie David Executive Vice President, Single Family Lending March 2012 29 • Responsible for all aspects of mortgage banking originations, operations and servicing • Previously with MetLife Home Loans Richard W. H. Bennion Executive Vice President, Residential Lending June 1977 37 • Responsible for residential construction lending production • Chairman of the board of Windermere Mortgage Services (WMS) • Member of Fannie Mae Western Business Center Advisory Board Randy Daniels Executive Vice President, Commercial Real Estate Lending September 2012 28 • Oversees commercial real estate lending activities through portfolio and Fannie Mae DUS programs • Formerly led Bank of America’s commercial real estate division in the Northwest David Straus Executive Vice President, Commercial Banking November 2013 45 • Responsible for all aspects of commercial lending • Founder and past CEO of Fortune Bank • Past chairman of Washington Bankers Association Jeff Newgard Executive Vice President, Eastern Region President November 2013 18 • Responsible for management and strategic expansion in Central and Eastern Washington • Past CEO of Yakima National Bank 27
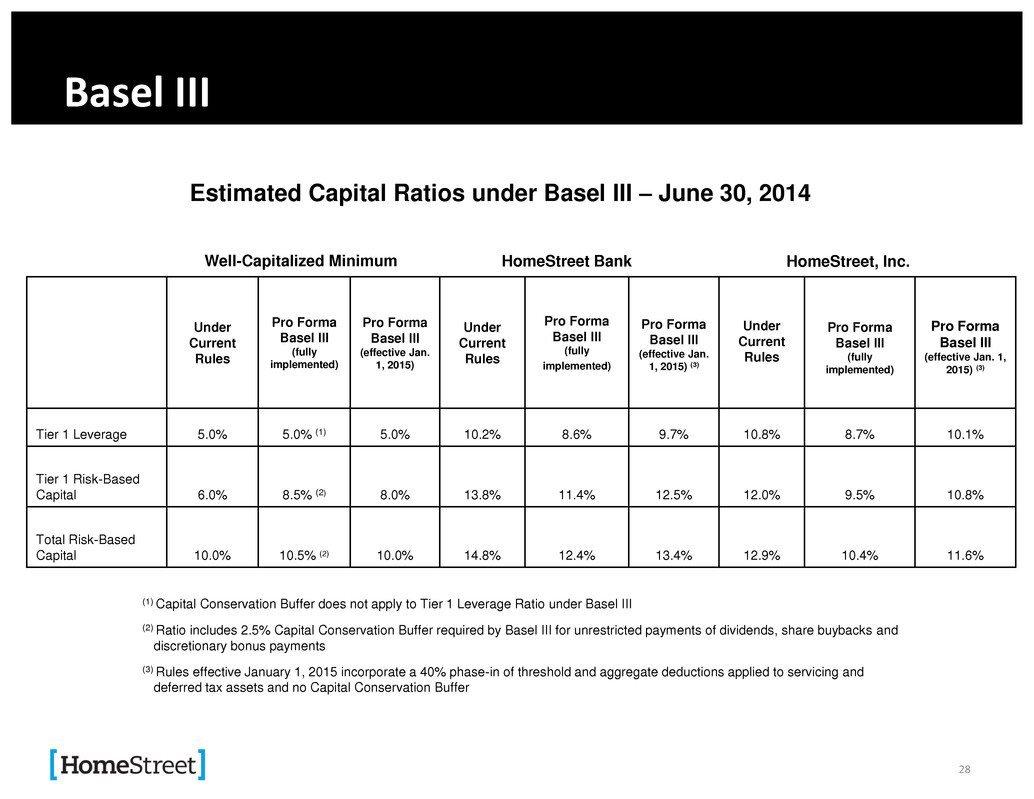
Basel III Estimated Capital Ratios under Basel III – June 30, 2014 Under Current Rules Pro Forma Basel III (fully implemented) Pro Forma Basel III (effective Jan. 1, 2015) Under Current Rules Pro Forma Basel III (fully implemented) Pro Forma Basel III (effective Jan. 1, 2015) (3) Under Current Rules Pro Forma Basel III (fully implemented) Pro Forma Basel III (effective Jan. 1, 2015) (3) Tier 1 Leverage 5.0% 5.0% (1) 5.0% 10.2% 8.6% 9.7% 10.8% 8.7% 10.1% Tier 1 Risk-Based Capital 6.0% 8.5% (2) 8.0% 13.8% 11.4% 12.5% 12.0% 9.5% 10.8% Total Risk-Based Capital 10.0% 10.5% (2) 10.0% 14.8% 12.4% 13.4% 12.9% 10.4% 11.6% HomeStreet Bank HomeStreet, Inc. (1) Capital Conservation Buffer does not apply to Tier 1 Leverage Ratio under Basel III (2) Ratio includes 2.5% Capital Conservation Buffer required by Basel III for unrestricted payments of dividends, share buybacks and discretionary bonus payments (3) Rules effective January 1, 2015 incorporate a 40% phase-in of threshold and aggregate deductions applied to servicing and deferred tax assets and no Capital Conservation Buffer Well-Capitalized Minimum 28
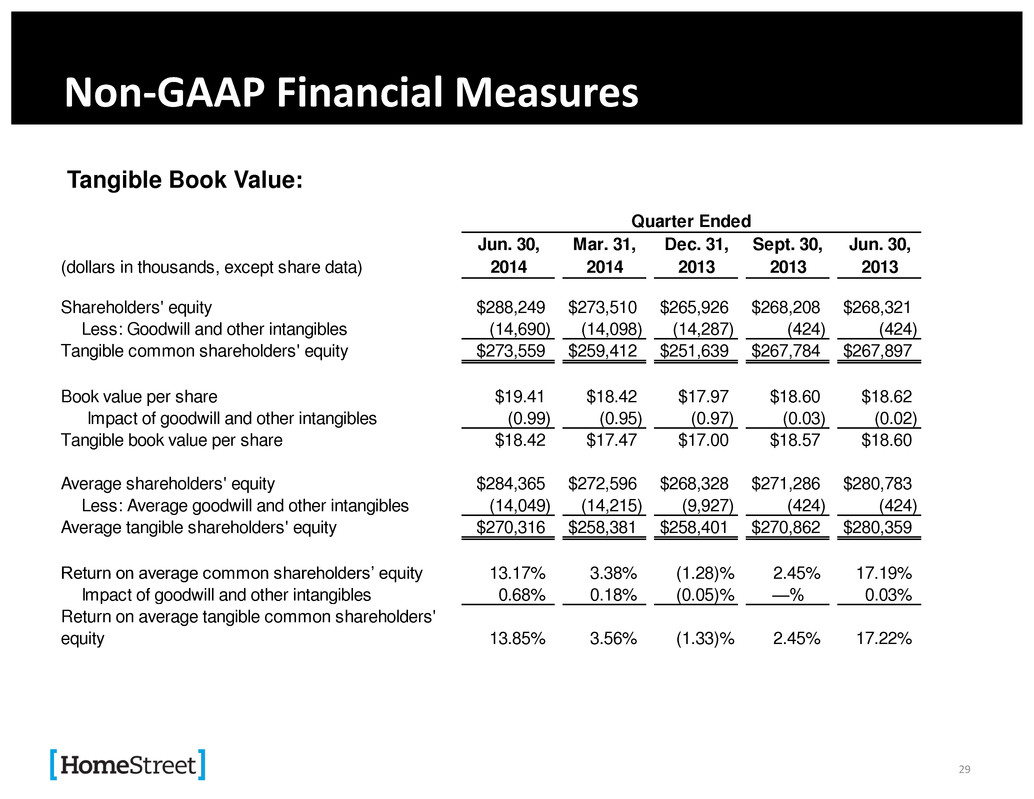
Non-GAAP Financial Measures Tangible Book Value: Jun. 30, Mar. 31, Dec. 31, Sept. 30, Jun. 30, (dollars in thousands, except share data) 2014 2014 2013 2013 2013 Shareholders' equity $288,249 $273,510 $265,926 $268,208 $268,321 Less: Goodwill and other intangibles (14,690) (14,098) (14,287) (424) (424) Tangible common shareholders' equity $273,559 $259,412 $251,639 $267,784 $267,897 Book value per share $19.41 $18.42 $17.97 $18.60 $18.62 Impact of goodwill and other intangibles (0.99) (0.95) (0.97) (0.03) (0.02) Tangible book value per share $18.42 $17.47 $17.00 $18.57 $18.60 Average shareholders' equity $284,365 $272,596 $268,328 $271,286 $280,783 Less: Average goodwill and other intangibles (14,049) (14,215) (9,927) (424) (424) Average tangible shareholders' equity $270,316 $258,381 $258,401 $270,862 $280,359 Return on average common shareholders’ equity 13.17% 3.38% (1.28)% 2.45% 17.19% Impact of goodwill and other intangibles 0.68% 0.18% (0.05)% —% 0.03% Return on average tangible common shareholders' equity 13.85% 3.56% (1.33)% 2.45% 17.22% Quarter Ended 29
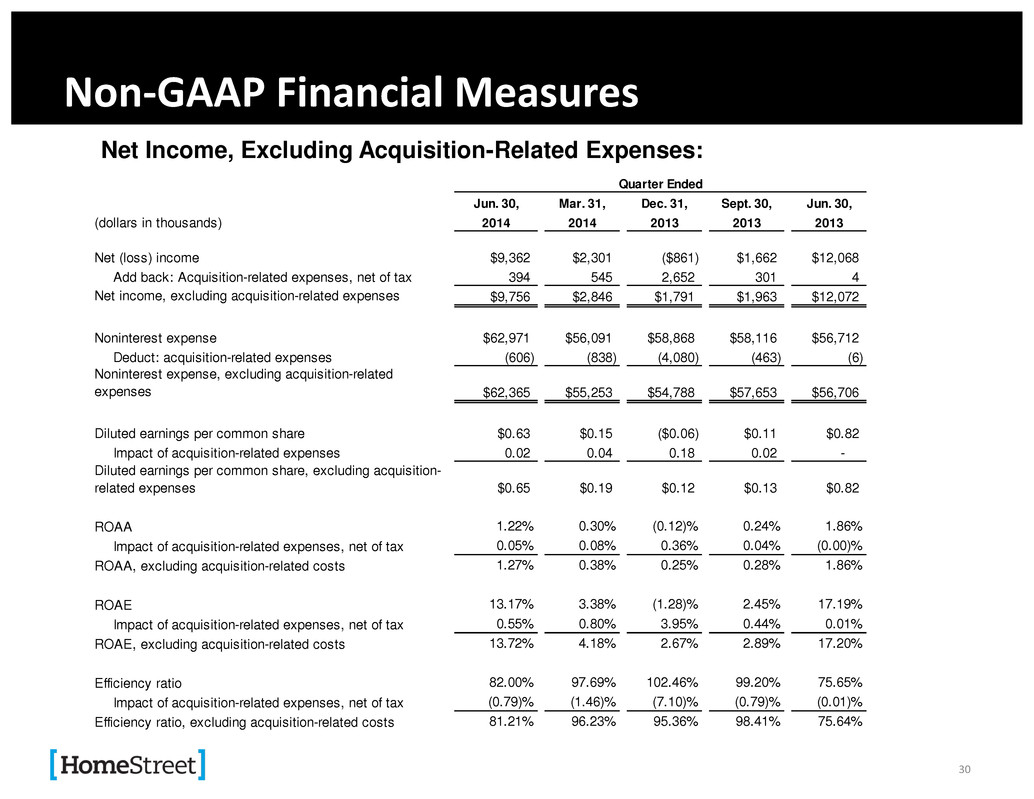
Non-GAAP Financial Measures Net Income, Excluding Acquisition-Related Expenses: Jun. 30, Mar. 31, Dec. 31, Sept. 30, Jun. 30, (dollars in thousands) 2014 2014 2013 2013 2013 Net (loss) income $9,362 $2,301 ($861) $1,662 $12,068 Add back: Acquisition-related expenses, net of tax 394 545 2,652 301 4 Net income, excluding acquisition-related expenses $9,756 $2,846 $1,791 $1,963 $12,072 Noninterest expense $62,971 $56,091 $58,868 $58,116 $56,712 Deduct: acquisition-related expenses (606) (838) (4,080) (463) (6) Noninterest expense, excluding acquisition-related expenses $62,365 $55,253 $54,788 $57,653 $56,706 Diluted earnings per common share $0.63 $0.15 ($0.06) $0.11 $0.82 Impact of acquisition-related expenses 0.02 0.04 0.18 0.02 - Diluted earnings per common share, excluding acquisition- related expenses $0.65 $0.19 $0.12 $0.13 $0.82 ROAA 1.22% 0.30% (0.12)% 0.24% 1.86% Impact of acquisition-related expenses, net of tax 0.05% 0.08% 0.36% 0.04% (0.00)% ROAA, excluding acquisition-related costs 1.27% 0.38% 0.25% 0.28% 1.86% ROAE 13.17% 3.38% (1.28)% 2.45% 17.19% Impact of acquisition-related expenses, net of tax 0.55% 0.80% 3.95% 0.44% 0.01% ROAE, excluding acquisition-related costs 13.72% 4.18% 2.67% 2.89% 17.20% Efficiency ratio 82.00% 97.69% 102.46% 99.20% 75.65% Impact of acquisition-related expenses, net of tax (0.79)% (1.46)% (7.10)% (0.79)% (0.01)% Efficiency ratio, excluding acquisition-related costs 81.21% 96.23% 95.36% 98.41% 75.64% Quarter Ended 30
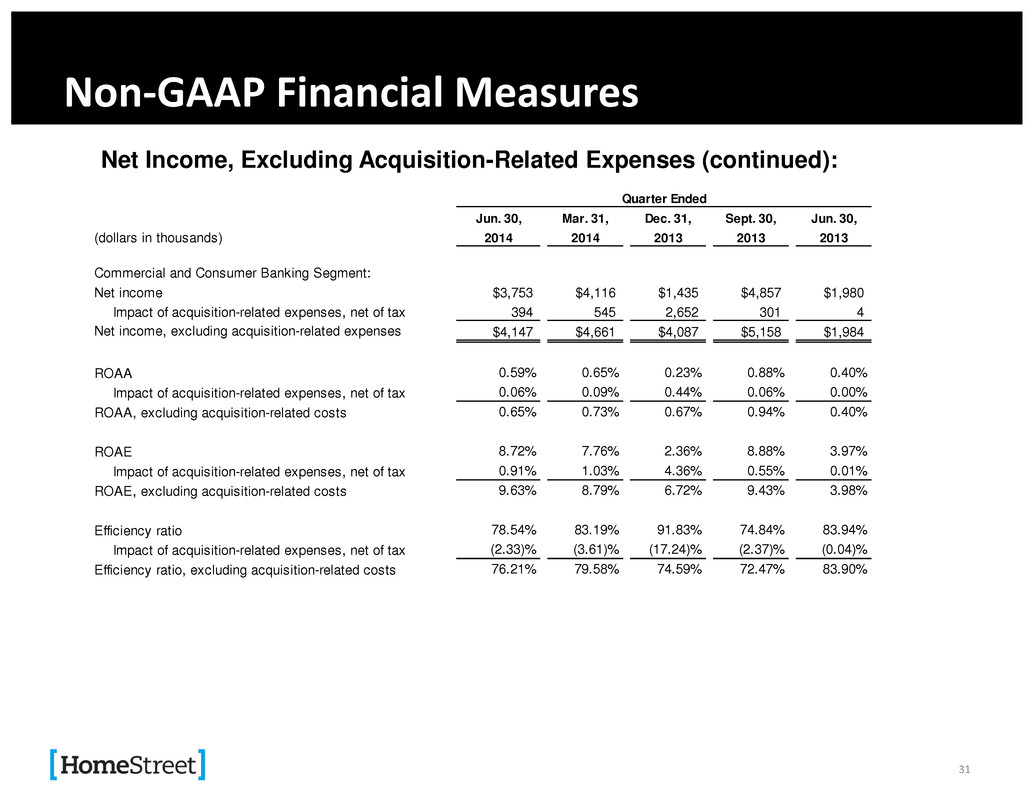
Non-GAAP Financial Measures Net Income, Excluding Acquisition-Related Expenses (continued): Jun. 30, Mar. 31, Dec. 31, Sept. 30, Jun. 30, (dollars in thousands) 2014 2014 2013 2013 2013 Commercial and Consumer Banking Segment: Net income $3,753 $4,116 $1,435 $4,857 $1,980 Impact of acquisition-related expenses, net of tax 394 545 2,652 301 4 Net income, excluding acquisition-related expenses $4,147 $4,661 $4,087 $5,158 $1,984 ROAA 0.59% 0.65% 0.23% 0.88% 0.40% Impact of acquisition-related expenses, net of tax 0.06% 0.09% 0.44% 0.06% 0.00% ROAA, excluding acquisition-related costs 0.65% 0.73% 0.67% 0.94% 0.40% ROAE 8.72% 7.76% 2.36% 8.88% 3.97% Impact of acquisition-related expenses, net of tax 0.91% 1.03% 4.36% 0.55% 0.01% ROAE, excluding acquisition-related costs 9.63% 8.79% 6.72% 9.43% 3.98% Efficiency ratio 78.54% 83.19% 91.83% 74.84% 83.94% Impact of acquisition-related expenses, net of tax (2.33)% (3.61)% (17.24)% (2.37)% (0.04)% Efficiency ratio, excluding acquisition-related costs 76.21% 79.58% 74.59% 72.47% 83.90% Quarter Ended 31
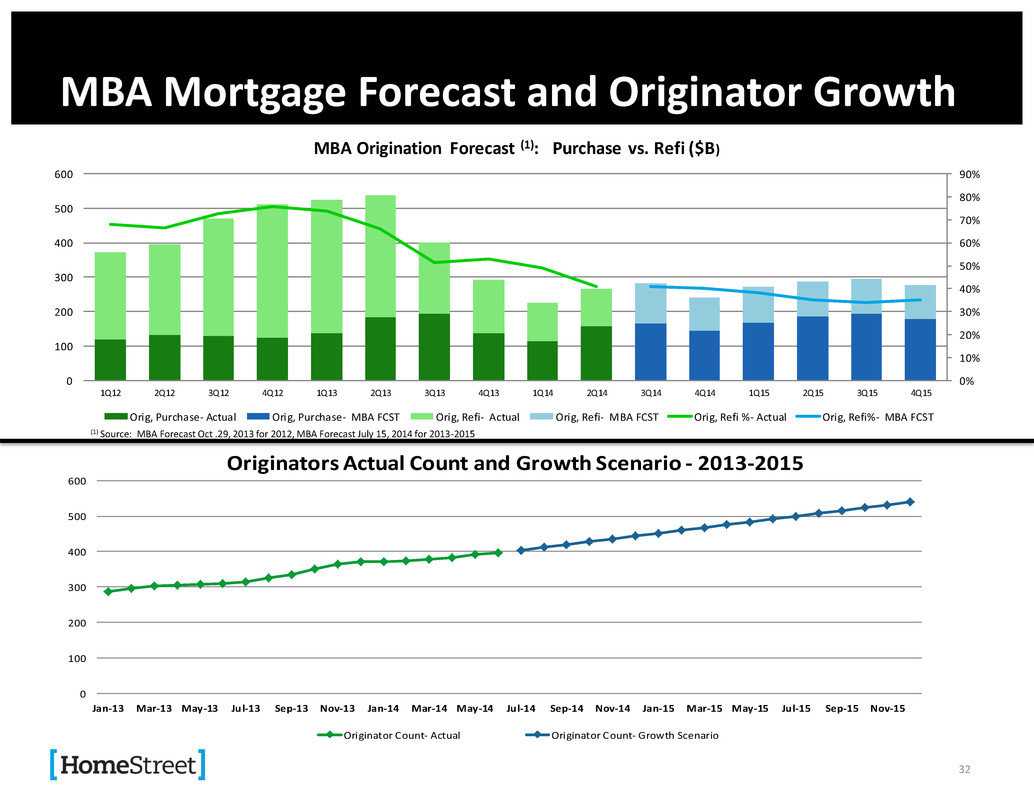
0% 10% 20% 30% 40% 50% 60% 70% 80% 90% 0 100 200 300 400 500 600 1Q12 2Q12 3Q12 4Q12 1Q13 2Q13 3Q13 4Q13 1Q14 2Q14 3Q14 4Q14 1Q15 2Q15 3Q15 4Q15 MBA Origination Forecast (1): Purchase vs. Refi ($B) Orig, Purchase- Actual Orig, Purchase- MBA FCST Orig, Refi- Actual Orig, Refi- MBA FCST Orig, Refi %- Actual Orig, Refi%- MBA FCST 0 100 200 300 400 500 600 Jan-13 Mar-13 May-13 Jul-13 Sep-13 Nov-13 Jan-14 Mar-14 May-14 Jul-14 Sep-14 Nov-14 Jan-15 Mar-15 May-15 Jul-15 Sep-15 Nov-15 Originators Actual Count and Growth Scenario - 2013-2015 Originator Count- Actual Originator Count- Growth Scenario (1) Source: MBA Forecast Oct .29, 2013 for 2012, MBA Forecast July 15, 2014 for 2013-2015 MBA Mortgage Forecast and Originator Growth 32
