Attached files
| file | filename |
|---|---|
| 8-K - CURRENT REPORT - BOB EVANS FARMS INC | d778543d8k.htm |
| EX-99.2 - PRESS RELEASE - BOB EVANS FARMS INC | d778543dex992.htm |
 Investor Presentation
2014 Annual Stockholder
Meeting
Steve Davis, Chairman and Chief Executive Officer
Mark Hood, Chief Financial Officer
Scott Taggart, VP, Investor Relations
1
Exhibit 99.1 |
 Safe
Harbor Statement 2
Under the Private Securities Litigation Reform Act of 1995
Certain statements in this presentation that are not historical facts are
forward-looking statements. Forward-looking statements involve various
important
assumptions,
risks
and
uncertainties.
Actual
results
may
differ
materially
from
those
predicted
by
the
forward-looking
statements because of
various factors and possible events, including, without limitation:
Negative publicity or litigation regarding allegations of food-related
illness, Failure to achieve and maintain positive same-store sales,
Changing business conditions, including energy costs,
Overall macroeconomic conditions that may affect consumer spending, either
nationwide or in one or more of the Company’s major markets Competition
in the restaurant and food products industries, Ability to control restaurant
operating costs, which are impacted by market changes in the cost or availability of labor and food, minimum wage and
other employment laws, health care costs, fuel and utility costs,
Changes
in
the
cost
or
availability
of
acceptable
new
restaurant
sites,
Adverse weather conditions in locations where we operate our restaurants,
Consumer acceptance of changes in menu offerings, price, atmosphere and/or service
procedures, Consumer
acceptance
of
our
restaurant
concepts
in
new
geographic
areas,
and
Changes in hog and other commodity costs.
We also bear the risk of incorrectly analyzing these risks or developing strategies
to address them that prove to be unsuccessful. Certain
risks,
uncertainties
and
assumptions
are
discussed
under
the
heading
“Risk
Factors”
in
Item
1A
of
our
Annual
Report
on
Form
10-K
for the fiscal
year ended April 25, 2014. We note these factors for investors as
contemplated by the Private Securities Litigation Reform Act of 1995. It is impossible to
predict or identify all such risk factors. Consequently, you should not
consider any such list to be a complete set of all potential risks and uncertainties.
Forward-looking statements speak only as of the date on which they are made,
and we undertake no obligation to update any forward-looking statement
to reflect circumstances or events that occur after the date on which the statement
is made to reflect unanticipated events. Any further disclosures in our
filings with the Securities and Exchange Commission should also be consulted.
All subsequent written and oral forward-looking statements attributable to
us or any person acting on behalf of the company are qualified by the cautionary
statements in this section. |
 Important Additional Information
3
Bob Evans Farms Inc. (the “Company”), its directors and certain of its
executive officers are participants in the solicitation of proxies in
connection with the Company's 2014 Annual Meeting of Stockholders. The Company has filed a definitive proxy statement and
form of WHITE proxy card with the U.S. Securities and Exchange Commission (the
“SEC”) in connection with such solicitation of proxies from the
Company's stockholders. WE URGE INVESTORS TO READ THE DEFINITIVE PROXY STATEMENT
(INCLUDING ANY AMENDMENTS AND SUPPLEMENTS THERETO) AND ACCOMPANYING WHITE PROXY
CARD CAREFULLY AND IN THEIR ENTIRETY, BECAUSE THEY CONTAIN IMPORTANT
INFORMATION. Information regarding the names of the Company's directors and
executive officers and their respective interests in the Company by
security
holdings
or
otherwise,
is
set
forth
in
the
Company's
proxy
statement
for
its
2014
Annual
Meeting
of
Stockholders,
filed
with
the SEC on July 11, 2014. Stockholders will be able to obtain, free of charge,
copies of the definitive proxy statement (and amendments or supplements
thereto) and accompanying WHITE proxy card, and other documents filed with the SEC at the SEC's
website at www.sec.gov. In addition, copies will also be available at no charge at
the Investors section of the Company's website at
http://investors.bobevans.com/sec.cfm.
This document contains quotes and excerpts from certain previously published
material. Consent of the author and publication has not been sought or
obtained to use the material as proxy soliciting material. |
 GROWING
OUR REGIONAL BRANDS INTO POWERFUL NATIONAL BRANDS
COMPANY FACT SHEET
FISCAL 2014 Q4
NASDAQ: BOBE
NEW RESTAURANTS
FY’14 4
FY’15E up to 8
561 Restaurants
19 States
as of 4/25/14
191
60
16
21
3
51
31
39
8
2
7
28
23
3
17
7
4
48
AVERAGE UNIT VOLUME
$1.71 million (FY’
14)
2
Bob Evans Farms, Inc. is comprised of two key business segments:
Bob Evans Restaurants and BEF Foods. Bob Evans
Restaurants operates 561 full-service restaurants located in 19 states with a heavy
concentration in the Midwest. BEF Foods produces and distributes refrigerated
side dishes, pork sausage and a variety of refrigerated and frozen convenience food
items through retail and food service channels. .
FOUR KEY LINES OF BUSINESS
Sausage, Refrigerated Sides, Frozen and Food Service
Sold at 30,000+ retail locations in 50 states and Mexico Bob Evans Growth Opportunity Markets
Bob Evans Core Markets
Bob
Evans
Farms
Investor
Relations
www.bobevans.com
8111
Smith’s
Mill
Road
New
Albany,
Ohio
43054
4 |
 5
Powerful
NATIONAL
BRANDS
Make
Our
REGIONAL
BRANDS
BOB EVANS RESTAURANTS
BEF FOODS, INC. |
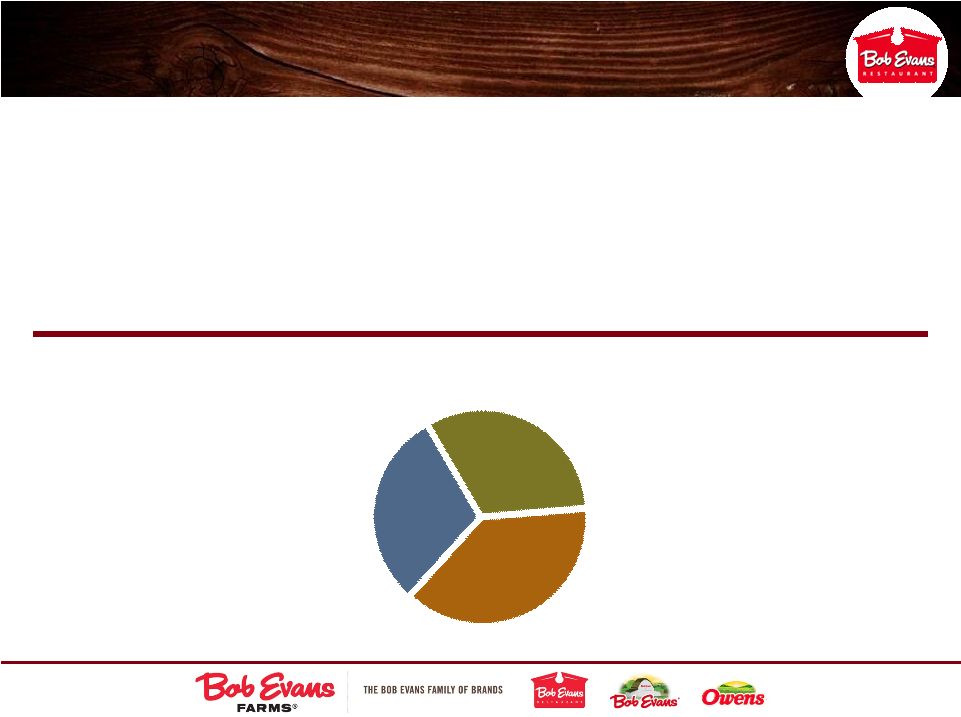
 Business
Segments
(FY
2014)
6
28%
72% |
 Source: IFMA Forecast & Outlook ‘82-’11
Technomic ’12-‘13
Bob Evans is Well-Positioned to Capture
Both Grocery and Restaurant Consumption
Percent Dollars Spent Over Time
7
$13
Billion+
(The value of a
single share
point) |
 PROFITABLY
GROW &
GROW &
CONTINUE
CONTINUE
TO TRANSFORM
TO TRANSFORM
OUR CORE
OUR CORE
BUSINESS
BUSINESS
DRIVE
DRIVE
SHAREHOLDER
SHAREHOLDER
VALUE WITH
VALUE WITH
DISCIPLINED
DISCIPLINED
CAPITAL
CAPITAL
ALLOCATION
ALLOCATION
SELECTIVELY
SELECTIVELY
INVEST IN
INVEST IN
HIGH R.O.I.C.
HIGH R.O.I.C.
GROWTH
GROWTH
OPPORTUNITIES
OPPORTUNITIES
(Internal & External)
(Internal & External)
Our Shareholder Value Creation
Guiding Principles
8 |
  9
Our Plan: Transformed and Poised for Growth
Bob Evans Restaurants
Farm Fresh Refresh Completed
Up to 8 New Restaurants in FY15
10-12 Annually Thereafter
10-20 BEX to be
Licensed/Franchised Annually
Bob Evans Foods
Side Dish Vertical Integration
Sausage Network Optimization
Transportation Consolidation
Capital and Resource Allocation
Enterprise Resource Planning
Margin Innovation
Corporate |
 10
Significant Asset Closures/Dispositions:
Over $125 Million of Asset Dispositions Since FY06
Asset
Consolidation
Sausage operations
(five facilities into two)
Ready-to-eat
operations
(four facilities into one)
Business
Closure
76 restaurants closed
Headquarters closures
Owens HQ (Texas)
Mimi’s Café
(California)
Business
Reengineering
Direct-store-delivery to
warehouse conversion
Springfield, OH
transportation center
(four facilities into one)
Business
Sold/Divested
Mimi’s Cafe
Springfield, Ohio
distribution center
The Board does not hesitate to re-evaluate strategic decisions;
every business asset is subject to a review every quarter
|
 11
BOBE’S Strategic and Balanced Approach to Capital Allocation Drives
Significant Shareholder Value
INTERNAL FACTORS
Potential future investment opportunities
Lifecycle stage of firm
Projected operating performance
Regularity and certainty of income
Structure of assets
Financial covenants
Desire to return capital
Period and purpose of financing
EXTERNAL FACTORS
Macroeconomic environment
Economic fluctuations
Seasonal variations
Nature of industry competition
Capital market conditions
Bank market conditions
Nature/orientation of investors
Statutory requirements
Taxation policy
Maximize
flexibility
Minimize
financial risk
Minimize
cost of capital
Maximize return
to shareholders
Minimize
complexity
DRIVE
OPTIMAL CAPITAL
STRUCTURE
Between
Fiscal
Year
2007
and
2014,
BOBE
returned
over
$800
million
to
shareholders
through
dividends
and
share
repurchases
Between
Fiscal
Year
2007
and
2014,
BOBE
returned
over
$800
million
to
shareholders
through
dividends
and
share
repurchases |
 12
A Track Record of Balanced Capital Allocation
Fiscal 2007-2012
Bob Evans has returned meaningful capital to stockholders in a prudent, consistent
fashion Debt Repayment
Capex
Share Repurchases
Dividends
Acquisition
$339M
$485M
$167M
$130M
Fiscal 2013
Over $800 million returned
to stockholders through
share repurchases and
dividends since FY07
$52M
$30M
$118M
$63M
Fiscal 2014
FY15 Capex expected to
be $85 to $90 million, in-
line with historical average
$191M
$225M |
 Weighted Average Diluted Shares Decreased by 27% since FY07 (000’s)
13
Track Record of Meaningful Dividends and
Share Repurchase
Trailing 12-month yield
(8/8/14):
BOBE: 2.6%
S&P 500: 1.9%
Annual Dividend Per Share has Doubled Since FY08 |
 14
“Get in on something good”
561 restaurants in 19 states
as of 4/25/14
Full-service family restaurants featuring a
wide variety of menu items for both on-and-off premise dining
TM |
 Net
Sales (FY 2014) $957 million Average Annual Unit Sales (FY
2014) $1.71 million Overview: Bob Evans Restaurants
ALL THREE DAYPARTS SERVED (4Q FY 2014)
Breakfast
Lunch
Dinner
15
32%
38%
30%
Avg. Dine-In Guest Check/Per Guest (4Q FY 2014) $18.24/$9.38
Average Carryout Check (4Q FY 2014) $15.34 |
 BER:
Remodeled and Ready to Grow 16
Recently completed Farm Fresh
Refresh
o
First comprehensive remodeling
program in brand history
o
76% maintenance capex and 24%
growth capex
o
Refreshed restaurants have
consistently outperformed non-
refreshed restaurants
Farm Fresh Refresh Transformation
Exciting New Restaurant Design
Compelling New BEX Growth Format
We are confident BER has exciting
growth potential:
o
New sales layer growth (e.g.,
carryout, Broasted platform and
five-dollar soups to go)
o
Leveraging our regional strength
to catalyze new unit growth
o
Developing the compelling new
Bob Evans Express ("BEX")
license/franchise format |
 17
Refreshed stores consistently outperformed the non-refreshed stores over
the last three years
The Company Recently Completed a Multi-Year
Renovation Program
Dining Room &
Lobby
Restrooms
Bakery,
Catering &
Carryout
Exterior,
Signage,
& Landscaping
CapEx Summary
(76% maintenance capital, 24% growth capital)
Average Capital Investment per
Remodeled Restaurant: ~$225K
Farm
Fresh
Stores
–
Incremental
SSS
(Year-One Stores vs. Non-Refreshed Stores)
(1) Nation’s Restaurant News, Consumer Picks, March 24, 2014.
According to WD Partners and Nation’s Restaurant News, Bob Evans has
made significant progress in areas of food quality, value, service, menu
variety and atmosphere, and took top position in the “cleanliness”
category
1 |
 Aspirational Concepts Reimage their Brands to
Remain Relevant
18
Before
After |
 Farm
Fresh Refresh Transformation Old Exterior
Old Interior
New Interior
New Exterior
19 |
 Farm
Fresh Refresh: Designed to Drive Dine-in and Off-Premise Sales
20
New Carryout
New Bakery
New Counter
Expanded Dining Room |
 Dinner is Our Challenge….and Opportunity
21
Fiscal 2014 SSS% Daypart Performance
Daypart
On-Premise
Off-Premise
Total
-1.2%
-1.6%
-4.0%
-2.1%
-1.6%
-0.5%
Breakfast
-1.8%
7.7%
-1.2%
Lunch
-2.0%
3.7%
-1.6%
Dinner
-4.5%
1.0%
-4.0%
Total
-2.5%
2.4%
-2.1%
Less: Estimated weather impact
-1.6%
Adjusted SSS%
-0.5% |
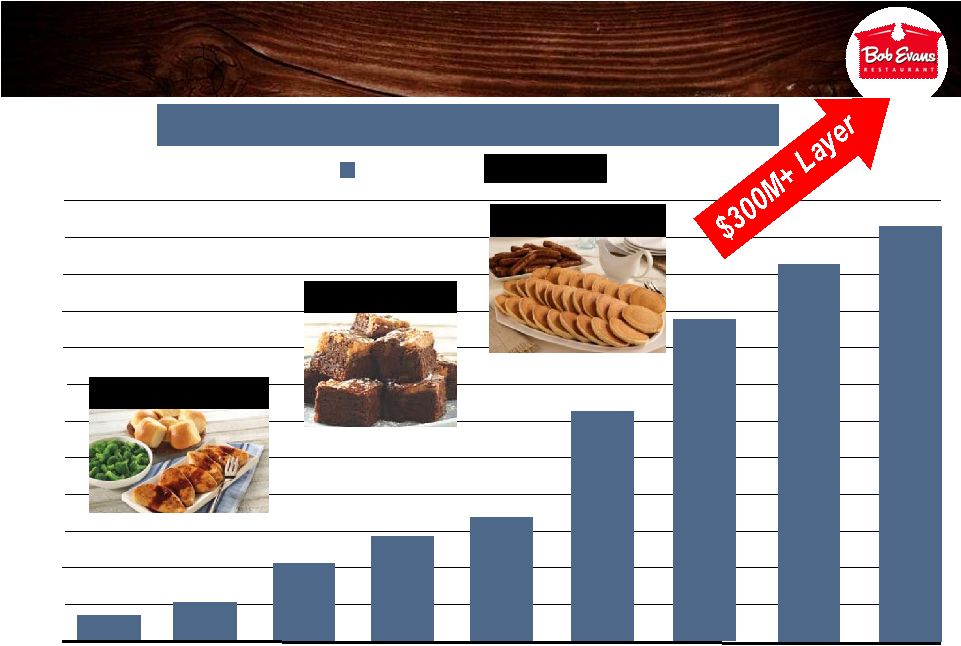
 Dine-In Value Sales Layers
22
BREAKFAST
Rise & Shine Breakfast
~ $65 million / 7%
of annual revenue.
LUNCH
$7.99 Knife & Fork and
Lunch Combos
~ $40 million / 4%
of annual revenue.
DINNER
3-Course Dinners
~ $72 million / 8%
of annual revenue. |
 New
Broasted Chicken Platform 23
Family
Meals
to
Go
at
$19.99
3-Course
meal
starting
at
$9.99
2-Piece
meal
at
$7.99
Quickly rose to top-selling item in the Cincinnati test market,
replacing the long-time best seller Rise & Shine Breakfast
|
 Positioning Broasted Chicken Will Immediately
Impact 68% of the Business, and Ultimately 100%
24
Lunch
38%
Dinner
30%
Breakfast
32%
Off-Premise
12%
Dine-In
68%
(lunch & dinner)
3-Course meal
starting at $9.99
2-Piece meal
at $7.99
Family Meals to Go
at $19.99 |
 25
Broasted Chicken has Reversed Dinner and Lunch
Sales and Traffic Declines in its Test Markets
Change in Same-Store Sales Since Mid-March Launch of Broasted in
Cincinnati •
Broasted chicken is now the number one top seller in its test markets
•
Already accounts for 12% of sales mix (as compared to the previous top
seller Rise-and-Shine which accounts for 7% of sales)
|
 Bob
Evans’ Off-Premise Opportunity
26
Annual Consumption of Restaurant Meals (per capita)
Dine-In
39%
Off-Premise
61%
QSR
74%
Source: NPD Group -
12 months ending 4/30/14 |
 Bold
Goal: Drive Off-Premise to 25% of Sales Mix Off-Premise Sales Mix and
Growth % by Year Off-Premise Sales Mix and Growth % by Year
Sales Mix
Growth %
27
+8.6%
+8.6%
+5.3%
+5.3%
+8.5%
+8.5%
+3.9%
+3.9%
+0.6%
+0.6%
+15.4%
+15.4%
+12.9%
+12.9%
+7.9%
+7.9%
+2.4%
+2.4%
2014
8.0%
7.5%
6.5%
7.0%
8.5%
9.0%
9.5%
12.0%
11.5%
11.0%
10.5%
10.0%
2006
2007
2008
2009
2010
2011
2012
2013
12.5%
Family Meals to Go
Bakery
Catering/Carryout |
 Off-Premise Sales Layers
28
CARRYOUT
FY 2014 Growth / Mix
1.8% / 11.7%
BAKERY
FY 2014 Growth / Mix
18.5% / 1.7%
CATERING
FY 2014 Growth / Mix
13.1% / 0.6% |
 Leveraging a Remodeled Base: Product and Operational Innovation to
Drive Positive Same-Store Sales in FY'15 and Beyond
29
Menu Innovation
Operational Innovation
Labor
Management
Carryout Service
Enhancements
New Kitchen
Technology &
Equipment
KDS (kitchen
displays)
Clamshell grill
Broaster
Batch holding
Objectives:
Drive traffic
Increase avg. check
Leverage off-premise
Enhance margins
Carryout
Catering
Bakery
New Sales Layers
All Initiatives
Rigorously Tested |
 New
Restaurant Opening Strategy 30
NEW CONTIGUOUS MARKETS
FILL-IN EXISTING MARKETS
4 new restaurants opened FY 2014.
Open up to 8 new restaurants during FY 2015.
Altoona, PA
Harrison, OH |
 New
Restaurant Prototype: Brand relevant/lower investment
Reduced building cost by
approximately 13%
through efficient design in
Finneytown, OH and
Altoona, PA
Objectives:
•
Accentuate Farm heritage
•
Leverage Farm Fresh
Refresh
program
insights
•
Test new “back-of-the-
house”
technologies and
layouts
31 |
 Bob
Evans Express Licensing Opportunity •
•
Popular favorites covering all
Popular favorites covering all
dayparts
dayparts
•
•
High quality menu to ensure
High quality menu to ensure
serving guests in a quick manner
serving guests in a quick manner
•
•
License up to 10 new locations by
License up to 10 new locations by
the end of FY 2015
the end of FY 2015
•
•
Potential to independently
Potential to independently
develop locations
develop locations
Bob Evans Express produces four
revenue streams:
1.
A one-time licensing fee of up to
$15k;
2.
A royalty fee of up to 6% of gross
sales;
3.
An ad fund of up to 4% of gross
sales; and
4.
Products “insourced”
from Bob
Evans Farms Foods business.
32
•
First location, BMW USA manufacturing plant
in Spartanburg, SC, opened August 2013
•
Second location, Bob Evans Farms, Inc.
corporate headquarters, opened October 2013
•
Finalizing details for 2 airport and 2 mall
locations to open late summer/ early fall |
 33
Revolutionary People Development/Culture
Drive profitable guest counts –
on and
off-premise by being relevant and reliable
Improve controllable expenses: Cost of Sales,
Cost of Labor, Direct Operating Expenses
Deliver the brand promise through a “Best for
my Guest”
experience both on and off-premise
Successfully open up to 8 new Bob Evans
Restaurants and license up to 10 BE Express
locations
FY’15 Vital Few Priorities |
 “Discover farm-fresh goodness ”
TWO BRANDS
distinct geographic strengths
34
TM |
 Overview: BEF Foods
35
FOUR KEY LINES OF BUSINESS
Sausage, Refrigerated Side Dishes, Frozen and Food Service
Sold at 30,000+ retail locations in 50 states and Mexico
Side
Dishes
Other
4%
Frozen
5%
Food
Service
(4% insourced*)
Retail Sausage
26%
24%
41%
FY 2014 Sales Mix (pounds)
sausage mix (% of total sales): 42%
sausage mix (% of total sales): 33%
Net Sales (FY’14) $387 million
28% of total
*Note: Insourced sales data reflects sales to Bob Evans Restaurants.
Side
Dishes
Other
Frozen
Retail
Sausage
11%
35%
36%
FY 2010 Sales Mix (pounds)
9%
9%
Food Service
(2% insourced*) |
 BEF
Foods: SKU Count and ACV Distribution Core vs. Non-Core
36
SOURCE: IRI, FY14 ending 4/20/14
Core Market: Chicago, Cincinnati, Cleveland, Columbus, Toledo, Detroit, Grand Rapids,
Indianapolis, Peoria/Springfield, Pittsburgh, Philadelphia, Baltimore/Washington,
Buffalo/Rochester
CORE MARKETS
SKUs/Store ACV
SKUs/Store ACV
FY ‘10
FY14
Opportunity
in Non-Core
Markets
NON CORE MARKETS
SKUs/Store ACV
SKUs/Store ACV
FY ‘10
FY14 |
 BEF
Foods Inc. Network Optimization 37
Hillsdale, MI
Hillsdale, MI
2014 and beyond
4 Facilities,
Limited co-packing relationships
Xenia, OH
Xenia, OH
Sulphur Springs, TX
Sulphur Springs, TX
Lima, OH
Lima, OH
Asset Actions:
FY2011:
Bidwell and Galva fresh sausage
operations closed
FY2012:
Bidwell and Hillsdale transportation
centers closed; Springfield
distribution center sold
FY2013:
Consolidated transportation
operations; Kettle Creations (Lima)
acquired;
FY2014:
Bidwell, Springfield, Richardson
plant, office, and transportation
center closed; SWH sold; Sulfur
Springs and Lima expanded
Fresh sausage
Fresh sausage
Ready-to-eat
Side dishes
2007
Galva, IL
Galva, IL
Bidwell, OH
Bidwell, OH
Richardson, TX
Richardson, TX
Xenia, OH
Xenia, OH
Sulphur Springs, TX
Sulphur Springs, TX
SWH Fullerton, CA
SWH Fullerton, CA
Hillsdale, MI
Hillsdale, MI
Lima, OH
Lima, OH
9 Facilities, 2 co-packers
50% Vertical Integration
Springfield, OH
Springfield, OH
Ready-to-eat
Fresh sausage
Sausage/Ready-
to-eat/ Dist. Ctr.
Fresh sausage
Copacker
Copacker
Fresh sausage/
Ready-to-eat
Fresh sausage
Mimi’s Café
prep kitchen
Fresh sausage/
Ready-to-eat |
 The
Cumulative Sow Cost Impact was $66 Million Versus Fiscal 2009 Average Sow
Cost of $44.93/cwt 38
~$66 million
cumulative annual
cost impact relative to
2009
sow
price
levels.
$ avg
cost/cwt
($ 000’s)
$73.23
$53.87
$42.18
$61.58
$57.17
NOTE: daily sow cost information available at:
http://www.ams.usda.gov/mnreports/lm_hg230.txt |
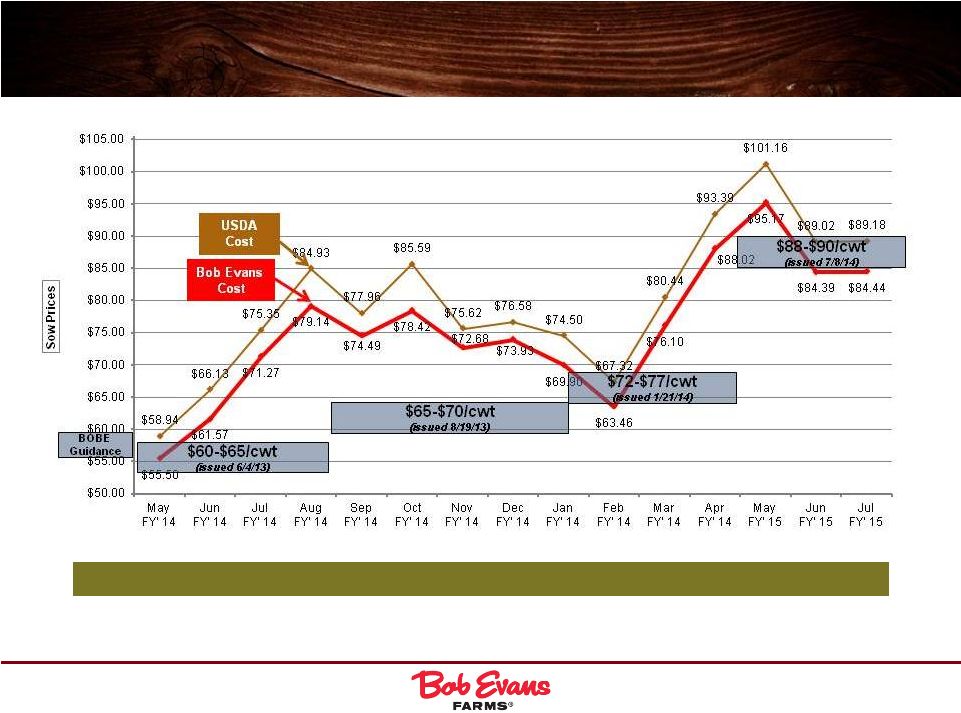 The
Increase in Sow Costs, Largely Driven by Unforeseen PED Virus Outbreaks, Was
the Main Driver of Reduced Guidance 39
Note: USDA data reflects top of trading range
There is no effective sow cost hedging mechanism in the U.S.
|
 FY
2014: Vital Few Priorities 40
Expand “in-source”
supplier relationships for the
restaurant segments and the food service industry
Drive sales through new authorizations
and geographic expansion
Drive margin expansion through cost reductions
and Lean manufacturing efficiencies
Optimize our plant and distribution network
Drive best-in-class ROIC |
 BER
and BEF: Synergies Drive Value Across Multiple Dimensions
41
Brand and Advertising Synergies
Product Innovation
Supply Chain Savings
Food Service Credibility/Expansion
Margin Expansion and G&A leverage
at BER and BEF
Restaurant Operational Efficiencies |
 42
Powerful
NATIONAL
BRANDS
Make
Our
REGIONAL
BRANDS
VISION
BOB EVANS RESTAURANTS
BEF FOODS, INC.
Our Growth Story |
 43 |
 44
2014 Annual Meeting
Q&A
********************
*
* |