Attached files
| file | filename |
|---|---|
| 8-K - FORM 8-K - CareTrust REIT, Inc. | d772474d8k.htm |
| EX-99.1 - EX-99.1 - CareTrust REIT, Inc. | d772474dex991.htm |
 Investor Presentation
August 18, 2014
Exhibit 99.2 |
 This
presentation
contains
forward-looking
statements
within
the
meaning
of
the
Private
Securities
Litigation
Reform
Act
of
1995.
These
forward-looking
statements
include
all
statements
that
are
not
historical
statements
of
fact
and
those
regarding
our
intent,
belief
or
expectations,
including,
but
not
limited
to,
statements
regarding
future
financing
plans,
business
strategies,
growth
prospects
and
operating
and
financial
performance;
expectations
regarding
the
making
of
distributions
and
the
payment
of
dividends;
and
compliance
with
and
changes
in
governmental
regulations.
Words
such
as
"anticipate(s),"
"expect(s),"
"intend(s),"
"plan(s),"
"believe(s),"
"may,"
"will,"
"would,"
"could,"
"should,"
"seek(s)"
and
similar
expressions,
or
the
negative
of
these
terms,
are
intended
to
identify
such
forward-looking
statements.
These
statements
are
based
on
Management's
current
expectations
and
beliefs,
and
are
subject
to
a
number
of
risks
and
uncertainties
that
could
lead
to
actual
results
differing
materially
from
those
projected,
forecasted
or
expected.
Although
Management
believes
that
the
assumptions
underlying
the
forward-looking
statements
are
reasonable,
they
are
not
guarantees
and
the
Company
can
give
no
assurance
that
their
expectations
will
be
attained.
Factors
which
could
have
a
material
adverse
effect
on
CareTrust's
operations
and
future
prospects
or
which
could
cause
actual
results
to
differ
materially
from
expectations
include,
but
are
not
limited
to:
(i)
the
ability
to
achieve
some
or
all
of
the
expected
benefits
from
the
completed
spin-off
and
to
successfully
conduct
CareTrust's
business
following
the
spin-off;
(ii)
the
ability
and
willingness
of
Ensign
to
meet
and/or
perform
its
obligations
under
the
contractual
arrangements
that
it
entered
into
with
CareTrust
in
connection
with
the
spin-off,
including
the
Master
Leases,
and
any
of
its
obligations
to
indemnify,
defend
and
hold
CareTrust
harmless
from
and
against
various
claims,
litigation
and
liabilities;
(iii)
the
ability
and
willingness
of
CareTrust's
tenants
to
(a)
comply
with
laws,
rules
and
regulations
in
the
operation
of
the
properties
CareTrust
leases
to
them,
and
(b)
renew
their
leases
with
CareTrust
upon
expiration,
or
in
the
alternative,
(c)
CareTrust's
ability
to
reposition
and
re-let
its
properties
on
the
same
or
better
terms
in
the
event
of
nonrenewal
or
replacement
of
an
existing
tenant
and
any
obligations,
including
indemnification
obligations,
that
CareTrust
may
incur
in
replacing
an
existing
tenant;
(iv)
the
availability
of,
and
the
ability
to
identify
and
acquire,
suitable
acquisition
opportunities
and
lease
the
same
to
reliable
tenants
on
accretive
terms;
(v)
the
ability
to
generate
sufficient
cash
flows
to
service
CareTrust's
outstanding
indebtedness;
(vi)
access
to
debt
and
equity
capital
markets;
(vii)
fluctuating
interest
rates;
(viii)
the
ability
to
retain
and
properly
incentivize
key
management
personnel;
(ix)
the
ability
to
qualify
or
maintain
CareTrust's
status
as
a
REIT;
(x)
changes
in
the
U.S.
tax
laws
and
other
state,
federal
or
local
laws,
whether
or
not
specific
to
REITs;
(xi)
other
risks
inherent
in
the
real
estate
business,
including
potential
liability
relating
to
environmental
matters
and
illiquidity
of
real
estate
investments;
and
(xii)
any
additional
factors
included
in
this
presentation
and
any
included
in
the
section
entitled
"Risk
Factors"
in
CareTrust's
Registration
Statement
on
Form
10
and
in
Item
1A
of
Part
II
of
CareTrust's
most
recently
filed
Form
10-Q.
Forward-looking
statements
speak
only
as
of
the
date
made.
Except
in
the
normal
course
of
the
CareTrust's
public
disclosure
obligations,
CareTrust
expressly
disclaims
any
obligation
to
release
publicly
any
updates
or
revisions
to
any
forward-looking
statements
to
reflect
any
change in its expectations or any change in events, conditions or circumstances on
which any statement is based. Reconciliations
of
certain
non-GAAP
financial
measures
used
in
this
presentation,
including
a
reconciliation
of
our
net
income
(loss)
per
GAAP
to
EBITDA,
Adjusted
EBITDA,
FFO,
normalized
FFO,
FAD
and
normalized
FAD,
are
included
in
this
presentation.
The
definitions
of
our
non-
GAAP
measures
used
in
this
presentation
are
included
in
our
press
release
dated
August
13,
2014,
which
is
incorporated
herein
by
reference
and
available
on
our
website
at
www.investors.caretrustreit.com.
Safe Harbor Statement
2 |
 Geographically
Diverse
Portfolio
Strong
Tenant
Rent
Coverage
Experienced
Management
Team
Growth &
Diversification
Opportunities
Attractive Industry
Fundamentals
Investment Highlights Summary
3
Financially
Secure “Platform”
Tenant
Favorable Long-Term
Lease Structure |
 Greg Stapley
CEO
Management
4
Bill Wagner
CFO
Dave Sedgwick
VP Operations
•
27 years of experience in the
acquisition, development and
disposition of real estate
•
Co-Founder of Ensign,
instrumental in assembling the
real estate portfolio was
transferred to CareTrust
•
Previously the General Counsel
of a 192-location national
retailer and Partner at a law
firm
•
22 years of accounting and
finance experience, primarily
in real estate, including
11 years with publicly-traded
REITs
•
Served as SVP and CAO of
Nationwide Health Properties,
Inc. and Sunstone Hotel
Investors, Inc.
•
Ernst & Young Kenneth
Leventhal Real Estate Group
•
12 years of experience in
skilled nursing operations
•
Trained over 100 Ensign
nursing home administrators as
Ensign’s Chief Human Capital
Officer
•
Led five SNFs as Administrator/
CEO; developed Ensign’s
approach to cultural, clinical
and financial performance
Mark Lamb
Director of Investments
•
Three years as Director of
Investments at Nationwide
Health Properties, underwriting
over $1 billion of new
investments across the Seniors
Housing and Skilled Nursing
sectors.
•
Led three SNFs as
Administrator for Plum
Healthcare & North American
Health Care in California.
•
Investment Associate at The
Bascom Group, a private equity
real estate investment firm. |
 •
A leading provider of skilled nursing
care and assisted living services
•
Strong financial performance with
dependable cash flows and liquidity
•
Long-tenured and successful
management team
•
Portfolio of 97 quality assets with Ensign
as initial tenant except for three facilities
operated by CareTrust
•
“Platform”
tenant initially has attractive
1.85x rent coverage supported by long-
term, triple-net lease structures
•
Focus will be on broadening geographic
reach, tenant base and asset class
•
Management team with deep real estate
and healthcare industry expertise
Transaction Overview
5
Spin-Off
On June 1, 2014 The Ensign Group split into
two publicly traded
companies
through a
tax-free spin-off
transaction.
Operations
Real Estate |
 Strong Liquidity for Growth
6
(1) Does not reflect deduction of cash portion of earnings and profits
(“E&P”) purge, to be determined after spin-off, which will be 20% to
25% of CTRE’s allocation of Ensign’s historical E&P (Ensign’s
E&P estimated to be between $350 to $385 million before spin-off)
Cash on hand as of June 30, 2014¹
$80
million
Undrawn Senior Secured Credit Facility with
approximately $84 million of availability as
of June 30, 2014
$150
million
Plus access to public equity and debt
markets, and other forms of long-term
capital. |
 INVESTMENT HIGHLIGHTS
7 |
 Portfolio Snapshot
Triple Net Leased Properties
CareTrust Operated ILF
8 |
 Varying Deal Size
(One-Offs to Portfolios)
Multiple
Operator
Partnerships
No Geographic
Constraints
Promising &
Stabilized
SNF/ALF Assets
Future
Diversification
into MOB,
Acute Care and
Life Sciences
Wider Investment Parameters
9
Cluster
Cluster
Ready
Ready
Local
Local
Leader
Leader
Pipeline
Pipeline
Geographic
Geographic
Limits
Limits
Turnaround
Turnaround
Opportunities
Opportunities
Ensign Strategy
Ensign Strategy
Note: For one year after the Spin-Off, CareTrust is subject to the
Opportunities Agreement with Ensign which affords Ensign certain rights of
first refusal to some of CareTrust’s investment opportunities under certain circumstances
CareTrust Strategy |
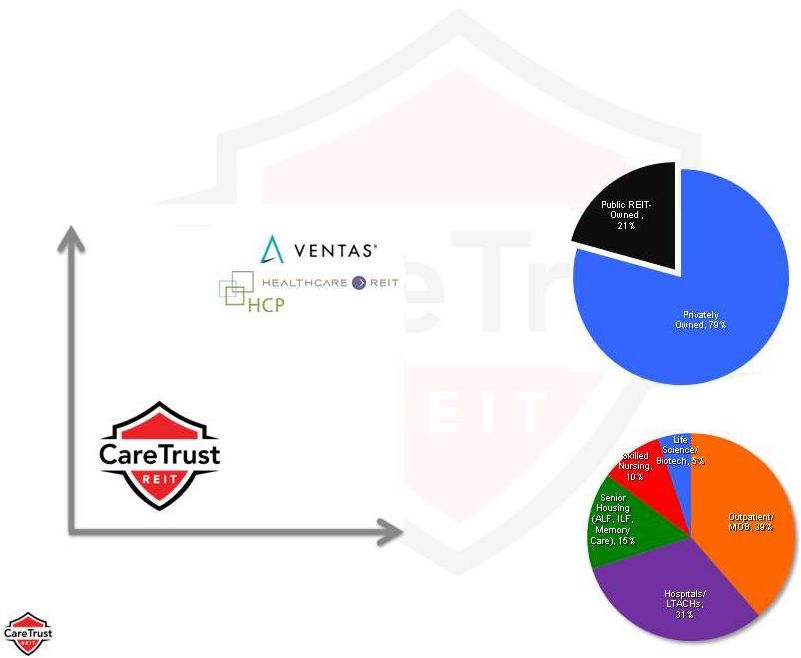 Healthcare Real Estate Ownership
Real Estate Asset Breakdown
Note:
Healthcare
Real
Estate
Ownership
Breakdown
and
Real
Estate
Asset
Breakdown
from
Stifel
Nicolaus
industry
analysis
Healthcare Real Estate Market
Estimated at Over $1 Trillion
10
Deal
Size
Tenant Size
Large REITs focused on larger acquisitions |
 Fragmented Markets With Value
Arbitrage Opportunities
11
Fragmented market,
underserved by capital
providers
Limited access to capital
and liquidity for local and
regional operators
Limited competition from
other REITs for SNFs
and mid-market assisted
living properties
Quality one-off, small-
&
mid-sized portfolios
Conservative
underwriting strategy
Leverage robust number
of existing relationships
Partner with successful
local & regional players
Creative capital solutions
Attractive investment
spreads over cost of
capital
Public/private market
discrepancies
Substantial growth
through smaller, non-
marketed transactions
Market Backdrop
CareTrust Role
Results |
 Disciplined Investment Strategy
Focused on Driving Value
12
Senior Housing
Facilities
(ALF, ILF, MC)
Skilled Nursing
Facilities
Medical Office
Buildings
Acute Care
Triple Net Leases
Core
Core
Opportunistic
Opportunistic
Mortgage Debt
Relationship
Relationship
Opportunistic
Opportunistic
Development
Funding
Relationship
Relationship
RIDEA
Opportunistic |
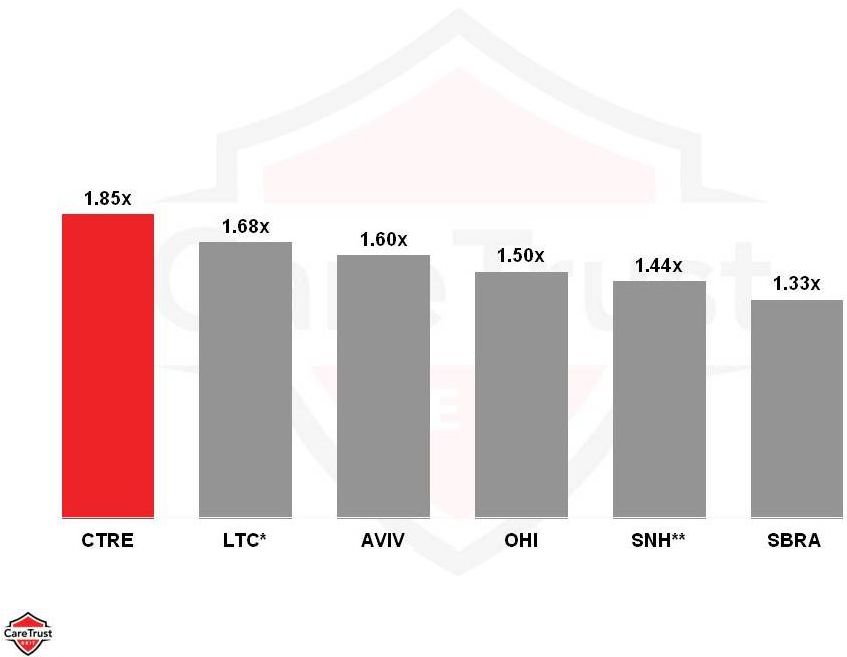 Total LTM EBITDAR Tenant Rent Coverage
*
Represents
facility
EBITDAR
coverage
for
LTC’s
skilled
nursing
portfolio
**
Rent
coverage
is
calculated
as
operating
cash
flow
from
SNH
tenants’
operations
of
SNH
properties,
before
subordinated
charges,
divided
by
rents
payable
to
SNH
Source:
Company
filings,
as
of
12/31/13
for
AVIV,
LTC,
and
SBRA
12/31/13,
and
9/30/13
for
SNH
and
OHI.
Rent
coverage
is
as
of
3/31/14
for
the
reported
EBITDAR
from
CTRE’s
Ensign
portfolio
Leading Tenant Rent Coverage
13 |
 Real Estate Acquisition & Development Experience
The CareTrust Team brings its
Experience, Relationships & Track Record
from Ensign
14
Ensign Annual Facilities Growth
Ensign Historical Asset Acquisitions |
 Attractive Industry Dynamics for SNF Operators
15
Numbers in millions
Relative Costs of Treatment Across Care Providers
SNF
IRF
LTAC
Source: AHCA, CMS OSCAR data, U.S. Census Bureau, Medpac
Number of Skilled Nursing Facilities
Age 65+ Population
US SNF Properties |
 Skilled Nursing Reimbursement Rates:
Stable and Increasing Over Time
16
Source: Eljay LLC and composite of CMS, AHCA, AQNHC and Avalere Group Data; ENSG
company filings Skilled Nursing Reimbursement Rates (2000-2013)
4.2%
4.2%
4.0%
4.0%
3.4%
3.4%
CAGR
In
In
May
May
2014,
2014,
CMS
CMS
proposed
proposed
a
a
2%
2%
aggregate
aggregate
increase
increase
for
for
2015
2015
SNF
SNF
payments
payments |
 “THE”
Platform Tenant
17
As of June 30, 2014, Ensign operated 125 facilities, 10 home health
and 8 hospice operations, 12 urgent care centers and a mobile
x-ray diagnostic company, all located in 12 states
Ensign has a strong track record of integrating turnaround
opportunities
–
Improves operations through increased occupancy, quality mix
and acuity shift
Long-tenured and successful management team has been an
integral part of Ensign’s business strategy
Ensign Operated Facilities
SNFs, ALFs & ILFs
Home Health & Hospice
Urgent Care Clinics
Note:
EBITDAR is a non-GAAP measure and represents net income before (a) interest
expense, net, (b) provision for income taxes, (c) depreciation and (d)
facility rent expense. See Ensign’s public filings for a reconciliation of EBITDAR to GAAP and additional
information on Ensign’s performance.
Revenue
Ensign Business Overview
Adjusted EBITDAR |
 Turnaround Track Record
Acquisition Track Record based on an average for all SNF
acquisitions from 2001 through October 1, 2012 measuring
five quarters of operating performance.
4-Quarter
Performance
Q1
Q5
Improvement
EBITDAR
Margin
11.3%
14.5%
322 bps
Occupancy
70.9%
74.0%
316 bps
Skilled Mix
(Rev)
31.3%
38.7%
732 bps
Quality Mix
(Rev)
48.4%
51.6%
321 bps
Ensign Track Record
Operational Excellence
18
Recognized Skilled Nursing Facility Quality
CMS Star ratings as reported on cms.gov
http://www.medicare.gov/nursinghomecompare/ |
 FINANCIAL SUMMARY
19 |
 Guidance
20
CareTrust’s
guidance
for
the
12
months
immediately
post-spin
1
is:
•
$56 million in rent from Ensign
•
$24
million
in
interest
expense
2
•
$4.5 million to $5.0 million in G&A expense
•
$1.23 to $1.25 in normalized FFO per diluted common share
•
$1.33 to $1.35 in normalized FAD per diluted common share
•
$0.24
to
$0.26
of
net
income
per
diluted
common
share
2
(1)
June
1,
2014
though
May
31,
2015
projections
(i)
are
based
on
22.4
million
diluted
weighted
average
common
shares,
and
exclude
any
shares
to
be
issued
in
connection
with
the
purging
distribution;
and
(ii)
assume
no
additional
acquisitions
or
dispositions
beyond
those
made
to
date,
exclusion
of
stock-
and
incentive-
based
cash
compensation,
exclusion
of
spin-related
costs,
and
exclusion
of
acquisition-related
costs
and
amortization
costs
related
to
intangible
assets
acquired.
(2)
Includes
$2.2
million
in
amortization
of
deferred
financing
costs. |
 Guidance
RECONCILIATION OF NET INCOME TO
NON-GAAP FINANCIAL MEASURES
1
21
Low Guide
High Guide
Net income
$0.24
$0.26
Depreciation and amortization
0.98
0.98
FFO
1.22
1.24
Costs associated with the spin-off
0.01
0.01
Normalized FFO
$1.23
$1.25
Net income
$0.24
$0.26
Depreciation and amortization
0.98
0.98
Amortization of deferred financing costs
0.10
0.10
FAD
1.31
1.34
Costs associated with the spin-off
0.01
0.01
Normalized FAD
$1.33
$1.35
(1) Per share amounts based on 22.4 million weighted average shares outstanding on
a per diluted common share basis |
 APPENDIX
22 |
 23
Assets
Real estate investments
$420,059
Cash and cash equivalents*
80,345
Accounts receivable
1,871
Prepaid expenses and other assets
77
Deferred financing costs, net
11,000
Total assets
$513,352
Liabilities and Stockholders' Equity
Senior unsecured notes payable
$260,000
Mortgage notes payable
99,504
Accounts payable and accrued liabilities
6,190
Total liabilities
365,694
Stockholders' Equity:
Common stock
222
Additional paid-in capital
146,980
Retained earnings
456
Total
stockholders'
equity
147,658
Total
liabilities
and
stockholders' equity
$513,352
* Does not reflect pending deduction of cash portion of E&P purge, to be
determined and paid prior to year-end, which will be 20% to 25% of
CTRE’s allocation of Ensign’s E&P (Ensign’s E&P estimated to be between $350 to $385 million before spin-off)
Q2 2014 Financial Summary
BALANCE SHEET
(in thousands) |
 Q2
2014 Financial Summary DEBT SUMMARY
(in thousands)
24
Interest Rate/
Maturity
June 30, 2014
Debt
Collateral
Spread
Date
Balance
Fixed Rate Debt
Senior unsecured notes payable
Unsecured
5.875%
2021
$260,000
GECC mortgage notes payable (1)
10 properties
7.252%
2017
48,220
Other mortgage note payable
1 property
6.000%
2019
607
308,827
Floating Rate Debt
GECC mortgage notes payable (1)
10 properties
L + 3.35%
2017
50,677
Senior secured revolving credit facility (2)
11 properties
L + 2%-2.5%
2018
-
50,677
Total Debt
$359,504
Debt Statistics
% Fixed Rate Debt
85.9%
% Floating Rate Debt
14.1%
Total
100.0%
Average Interest Rates:
Fixed
6.1%
Floating
3.9%
Blended
5.8%
(1) The fixed rate portion of the GECC mortgage notes payable converts to the
floating rate in May 2017. The floating rate portion is subject to a
Libor floor of 0.50%. The GECC mortgage notes have two 12-month
extension options.
(2) Borrowings available under the senior secured revolving credit facility totaled
$84.2 million at June 30, 2014. Funds can also be borrowed at the Base Rate
(as defined) plus 1.0% to 1.5%. |
 25
One Month
Ended
June 30, 2014
Revenues:
Rental income
$4,667
Tenant reimbursement
396
Other revenue
211
Total revenues
5,274
Expenses:
Depreciation and amortization
1,794
Interest expense
1,967
Property taxes
396
Operating expenses
161
General and administrative
500
Total expenses
4,818
Net income
$456
Earnings per common share:
Basic
$0.02
Diluted
$0.02
Weighted average shares outstanding:
Basic
22,237
Diluted
22,436
Q2 2014 Financial Summary
STATEMENT OF INCOME
(in thousands, except per share amounts) |
 Q2
2014 Financial Summary NON-GAAP FINANCIAL MEASURES
(in thousands, except per share amounts)
26
One Month
Ended
June 30, 2014
Net income
$456
Real estate related depreciation and amortization
1,794
Interest expense
1,967
EBITDA
4,217
Costs associated with the spin-off
254
Adjusted EBITDA
$4,471
Net income
$456
Real estate related depreciation and amortization
1,794
Funds from Operations (FFO)
2,250
Costs associated with the spin-off
254
Normalized FFO
$2,504
Net income
$456
Real estate related depreciation and amortization
1,794
Amortization of deferred financing costs
175
Funds Available for Distribution (FAD)
2,425
Costs associated with the spin-off
254
Normalized FAD
$2,679
FFO per share
$0.10
Normalized FFO per share
$0.11
FAD per share
$0.11
Normalized FAD per share
$0.12
Diluted weighted average shares outstanding
22,436 |
 Total
Skilled Nursing
Facilities
Multi-Specialty Campuses
Assisted Living and
Independent Living
Facilities ¹
Independent Living
Facilities Operated
by CareTrust ¹
State
Properties
Beds/Units
Facilities
Beds
Campuses
SNF Beds
ALF Units
ILF Units
Facilities
Units
Facilities
Units
California
18
1,991
14
1,465
2
158
121
24
2
223
---
---
Texas
27
3,241
22
2,699
1
123
77
20
2
115
2
207
Arizona
10
1,327
7
799
1
162
100
---
2
266
---
---
Utah
12
1,305
9
907
1
235
37
---
1
69
1
57
Colorado
5
463
3
210
---
---
---
---
2
253
---
---
Idaho
6
477
5
408
1
45
24
---
---
---
---
---
Washington
6
555
5
453
---
---
---
---
1
102
---
---
Nevada
3
304
1
92
---
---
---
---
2
212
---
---
Nebraska
5
366
3
220
2
105
41
---
---
---
---
---
Iowa
5
356
3
185
2
109
62
---
---
---
---
---
Total
97
10,385
72
7,438
10
937
462
44
12
1,240
3
264
(1) The initial portfolio of four ILFs includes one that is leased to and operated
by Ensign and three owned and operated by CareTrust CareTrust Geographic
Detail 27 |