Attached files
| file | filename |
|---|---|
| 8-K - 8-K - BUCKEYE PARTNERS, L.P. | a14-19305_18k.htm |
Exhibit 99.1
|
|
Citi MLP/Midstream Infrastructure Conference Las Vegas, NV August 20-21, 2014 |
|
|
FORWARD-LOOKING STATEMENTS This presentation contains “forward-looking statements” that we believe to be reasonable as of the date of this presentation. These statements, which include any statement that does not relate strictly to historical facts, use terms such as “anticipate,” “assume,” “believe,” “estimate,” “expect,” “forecast,” “intend,” “plan,” “position,” “potential,” “predict,” “project,” or “strategy” or the negative connotation or other variations of such terms or other similar terminology. In particular, statements, express or implied, regarding future results of operations or ability to generate sales, income or cash flow, to make acquisitions, or to make distributions to unitholders are forward-looking statements. These forward-looking statements are based on management’s current plans, expectations, estimates, assumptions and beliefs concerning future events impacting Buckeye Partners, L.P. (the “Partnership” or “BPL”) and therefore involve a number of risks and uncertainties, many of which are beyond management’s control. Although the Partnership believes that its expectations stated in this presentation are based on reasonable assumptions, actual results may differ materially from those expressed or implied in the forward-looking statements. The factors listed in the “Risk Factors” sections of, as well as any other cautionary language in, the Partnership’s public filings with the Securities and Exchange Commission, provide examples of risks, uncertainties and events that may cause the Partnership’s actual results to differ materially from the expectations it describes in its forward-looking statements. Each forward-looking statement speaks only as of the date of this presentation, and the Partnership undertakes no obligation to update or revise any forward-looking statement. © Copyright 2014 Buckeye Partners, L.P. 2 |
|
|
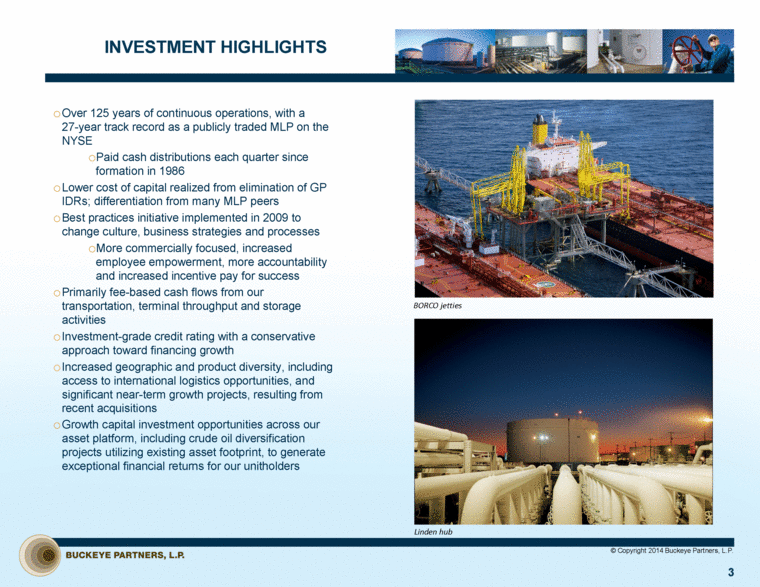
INVESTMENT HIGHLIGHTS Over 125 years of continuous operations, with a 27-year track record as a publicly traded MLP on the NYSE Paid cash distributions each quarter since formation in 1986 Lower cost of capital realized from elimination of GP IDRs; differentiation from many MLP peers Best practices initiative implemented in 2009 to change culture, business strategies and processes More commercially focused, increased employee empowerment, more accountability and increased incentive pay for success Primarily fee-based cash flows from our transportation, terminal throughput and storage activities Investment-grade credit rating with a conservative approach toward financing growth Increased geographic and product diversity, including access to international logistics opportunities, and significant near-term growth projects, resulting from recent acquisitions Growth capital investment opportunities across our asset platform, including crude oil diversification projects utilizing existing asset footprint, to generate exceptional financial returns for our unitholders © Copyright 2014 Buckeye Partners, L.P. 3 Linden hub BORCO jetties |
|
|
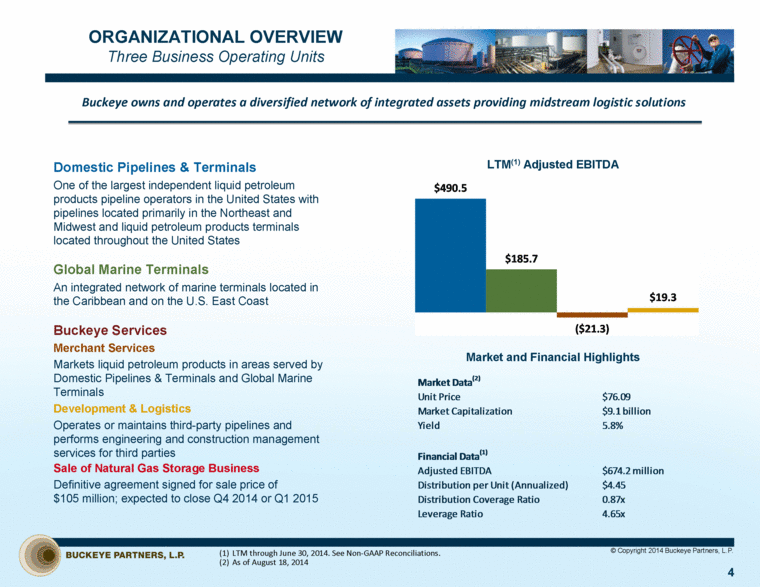
ORGANIZATIONAL OVERVIEW Three Business Operating Units Domestic Pipelines & Terminals One of the largest independent liquid petroleum products pipeline operators in the United States with pipelines located primarily in the Northeast and Midwest and liquid petroleum products terminals located throughout the United States Global Marine Terminals An integrated network of marine terminals located in the Caribbean and on the U.S. East Coast Buckeye Services Merchant Services Markets liquid petroleum products in areas served by Domestic Pipelines & Terminals and Global Marine Terminals Development & Logistics Operates or maintains third-party pipelines and performs engineering and construction management services for third parties Sale of Natural Gas Storage Business Definitive agreement signed for sale price of $105 million; expected to close Q4 2014 or Q1 2015 © Copyright 2014 Buckeye Partners, L.P. 4 Buckeye owns and operates a diversified network of integrated assets providing midstream logistic solutions LTM(1) Adjusted EBITDA Market and Financial Highlights LTM through June 30, 2014. See Non-GAAP Reconciliations. As of August 18, 2014 Market Data (2) Unit Price $76.09 Market Capitalization $9.1 billion Yield 5.8% Financial Data (1) Adjusted EBITDA $674.2 million Distribution per Unit (Annualized) $4.45 Distribution Coverage Ratio 0.87x Leverage Ratio 4.65x |
|
|
PIPELINE AND TERMINAL SYSTEM MAP © Copyright 2014 Buckeye Partners, L.P. 5 |
|
|
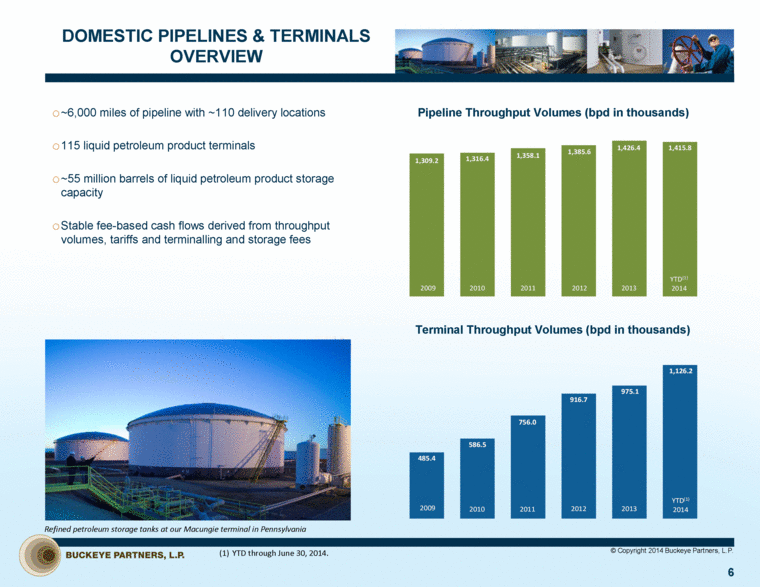
DOMESTIC PIPELINES & TERMINALS OVERVIEW ~6,000 miles of pipeline with ~110 delivery locations 115 liquid petroleum product terminals ~55 million barrels of liquid petroleum product storage capacity Stable fee-based cash flows derived from throughput volumes, tariffs and terminalling and storage fees © Copyright 2014 Buckeye Partners, L.P. 6 Pipeline Throughput Volumes (bpd in thousands) Terminal Throughput Volumes (bpd in thousands) Refined petroleum storage tanks at our Macungie terminal in Pennsylvania YTD through June 30, 2014. 485.4 586.5 756.0 916.7 975.1 1,126.2 2009 2010 2011 2012 2013 2009 2010 2011 2012 2013 YTD (1) 2014 |
|
|
GLOBAL MARINE TERMINALS OVERVIEW CARIBBEAN BORCO, St. Lucia and Yabucoa ~41 million barrels of liquid petroleum product storage capacity Deep-water access and the ability to berth ULCCs and VLCCs in The Bahamas and St. Lucia Take or pay contracts along with capabilities for ancillary services such as berthing, blending, bunkering and transshipping NEW YORK HARBOR Perth Amboy, Port Reading and Raritan Bay ~16 million barrels of liquid petroleum products storage capacity Deep-water ports Expanded Colonial pipeline and Buckeye 6-mile interconnect pipeline to Buckeye Linden hub now in service Ship, barge, truck, rail and pipeline transportation capabilities © Copyright 2014 Buckeye Partners, L.P. 7 LTM(1) Leased Capacity LTM(1) Revenue Buckeye’s network of marine terminals enables it to facilitate global flows of liquid petroleum products and offer customers connectivity to some of the worlds most important bulk storage and blending hubs LTM through June 30, 2014. See Non-GAAP Reconciliations. 29% 38% 33% Fuel Oil Crude Oil Refined Products |
|
|
BUCKEYE SERVICES OVERVIEW Merchant Services Provides valuable market insight and transparency to our logistics businesses Focuses on providing incremental product flow through Buckeye’s core assets Captures optionality in underutilized assets through limited and well-understood strategies with appropriate amount of risk Contributed approximately $30 million in revenues to Buckeye’s logistics businesses during last twelve months Recent developments: New leadership is working to rationalize the size and scope of the business model Focus on optimizing utilization where commodity risks can be efficiently and effectively limited © Copyright 2014 Buckeye Partners, L.P. 8 Development & Logistics Operates or maintains third-party pipelines under agreements with major oil and gas, petrochemical and chemical companies Performs engineering and construction management services for third parties Potential for further growth: Recent project wins provide footprint in important shale plays Operating Eagle Ford crude oil gathering pipeline Operating Permian-based pipeline system Exploring opportunities in NGL logistics Potential repurposing projects Merchant Services Development & Logistics |
|
|
CRUDE OIL DIVERSIFICATION Perth Amboy Crude by rail capability to be completed Q3 2014 Outbound transportation options include ship, barge and rail Chicago Complex (CCX) Long-term storage and throughput agreement with construction of incremental 1.1 million barrels of crude oil storage; two tanks placed-in-service in Q2 2014 and one tank expected to be operational in Q3 2014 Long-term crude oil storage, throughput and rail loading services agreement; rail operations began in Q4 2013 Tank construction being completed early and under budget Albany Multi-year contract providing crude oil services, including offloading unit trains, storage and throughput; rail operations began in Q4 2012 Albany terminal has two ship docks on the Hudson River, allowing transport of crude oil directly to customer’s facility BORCO ~9 million barrels of crude oil storage; includes expansion of 1.2 million barrels in Q3 2013 Project to upgrade storage capabilities to allow additional handling of heavy crude nearing completion © Copyright 2014 Buckeye Partners, L.P. Crude Oil Revenue (in millions) Buckeye is successfully leveraging its assets to provide crude oil logistics solutions to producers and refiners wherever possible 9 St. Lucia ~9 million barrels of crude oil storage 2014 & Beyond CCX Storage (Q2 & Q3) and Perth Amboy Rail (Q3) $0 $20 $40 $60 $80 $100 2011 2012 2013 BORCO Acquisition (Q1) Albany Rail (Q4) BORCO Expansion (Q3), CCX Rail (Q4) and St. Lucia (Q4) 2010 |
|
|
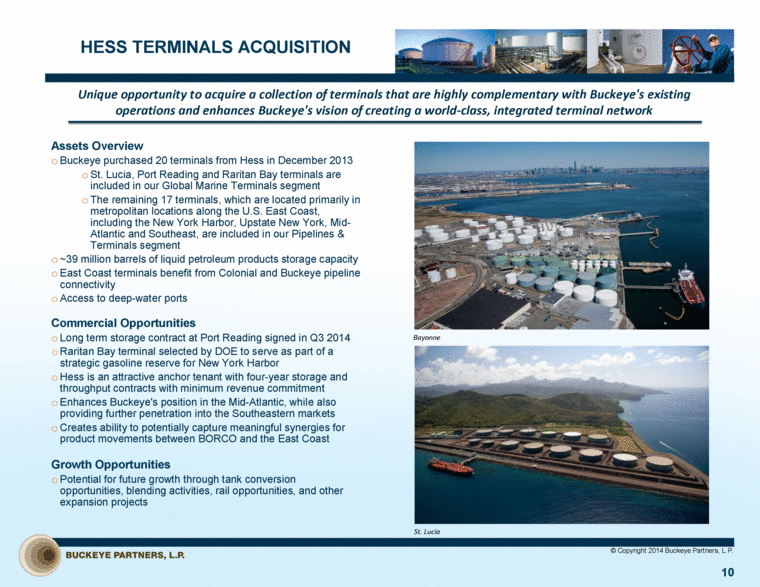
HESS TERMINALS ACQUISITION Assets Overview Buckeye purchased 20 terminals from Hess in December 2013 St. Lucia, Port Reading and Raritan Bay terminals are included in our Global Marine Terminals segment The remaining 17 terminals, which are located primarily in metropolitan locations along the U.S. East Coast, including the New York Harbor, Upstate New York, Mid-Atlantic and Southeast, are included in our Pipelines & Terminals segment ~39 million barrels of liquid petroleum products storage capacity East Coast terminals benefit from Colonial and Buckeye pipeline connectivity Access to deep-water ports Commercial Opportunities Long term storage contract at Port Reading signed in Q3 2014 Raritan Bay terminal selected by DOE to serve as part of a strategic gasoline reserve for New York Harbor Hess is an attractive anchor tenant with four-year storage and throughput contracts with minimum revenue commitment Enhances Buckeye's position in the Mid-Atlantic, while also providing further penetration into the Southeastern markets Creates ability to potentially capture meaningful synergies for product movements between BORCO and the East Coast Growth Opportunities Potential for future growth through tank conversion opportunities, blending activities, rail opportunities, and other expansion projects © Copyright 2014 Buckeye Partners, L.P. 10 Unique opportunity to acquire a collection of terminals that are highly complementary with Buckeye's existing operations and enhances Buckeye's vision of creating a world-class, integrated terminal network Bayonne St. Lucia |
|
|
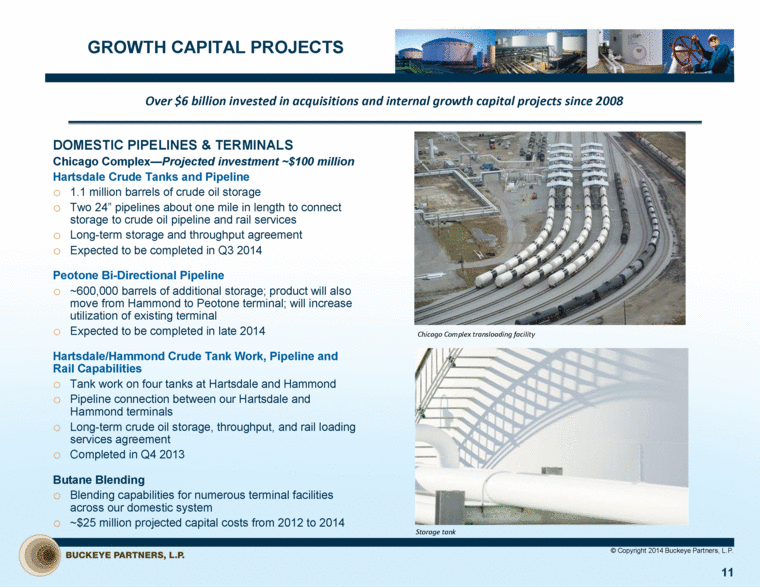
GROWTH CAPITAL PROJECTS DOMESTIC PIPELINES & TERMINALS Chicago Complex—Projected investment ~$100 million Hartsdale Crude Tanks and Pipeline 1.1 million barrels of crude oil storage Two 24” pipelines about one mile in length to connect storage to crude oil pipeline and rail services Long-term storage and throughput agreement Expected to be completed in Q3 2014 Peotone Bi-Directional Pipeline ~600,000 barrels of additional storage; product will also move from Hammond to Peotone terminal; will increase utilization of existing terminal Expected to be completed in late 2014 Hartsdale/Hammond Crude Tank Work, Pipeline and Rail Capabilities Tank work on four tanks at Hartsdale and Hammond Pipeline connection between our Hartsdale and Hammond terminals Long-term crude oil storage, throughput, and rail loading services agreement Completed in Q4 2013 Butane Blending Blending capabilities for numerous terminal facilities across our domestic system ~$25 million projected capital costs from 2012 to 2014 © Copyright 2014 Buckeye Partners, L.P. 11 Over $6 billion invested in acquisitions and internal growth capital projects since 2008 Chicago Complex transloading facility Storage tank |
|
|
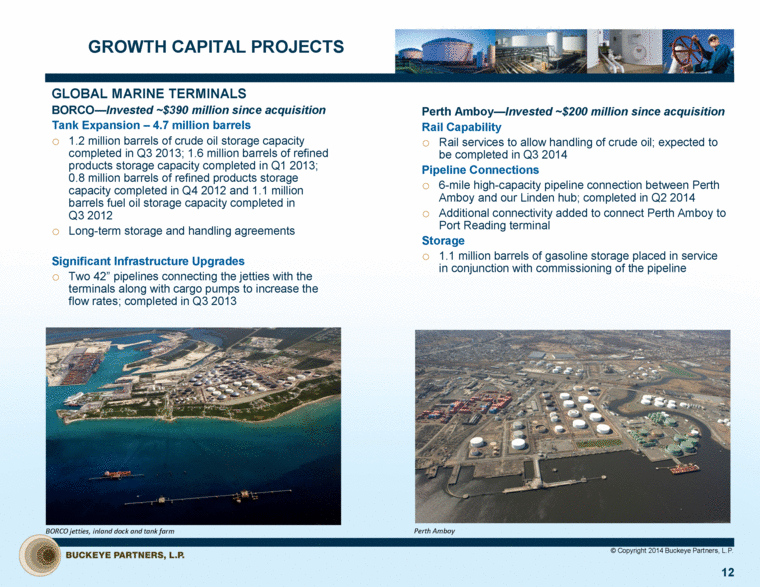
GROWTH CAPITAL PROJECTS GLOBAL MARINE TERMINALS BORCO—Invested ~$390 million since acquisition Tank Expansion – 4.7 million barrels 1.2 million barrels of crude oil storage capacity completed in Q3 2013; 1.6 million barrels of refined products storage capacity completed in Q1 2013; 0.8 million barrels of refined products storage capacity completed in Q4 2012 and 1.1 million barrels fuel oil storage capacity completed in Q3 2012 Long-term storage and handling agreements Significant Infrastructure Upgrades Two 42” pipelines connecting the jetties with the terminals along with cargo pumps to increase the flow rates; completed in Q3 2013 © Copyright 2014 Buckeye Partners, L.P. 12 Perth Amboy—Invested ~$200 million since acquisition Rail Capability Rail services to allow handling of crude oil; expected to be completed in Q3 2014 Pipeline Connections 6-mile high-capacity pipeline connection between Perth Amboy and our Linden hub; completed in Q2 2014 Additional connectivity added to connect Perth Amboy to Port Reading terminal Storage 1.1 million barrels of gasoline storage placed in service in conjunction with commissioning of the pipeline Perth Amboy BORCO jetties, inland dock and tank farm |
|
|
FINANCIAL OVERVIEW |
|
|
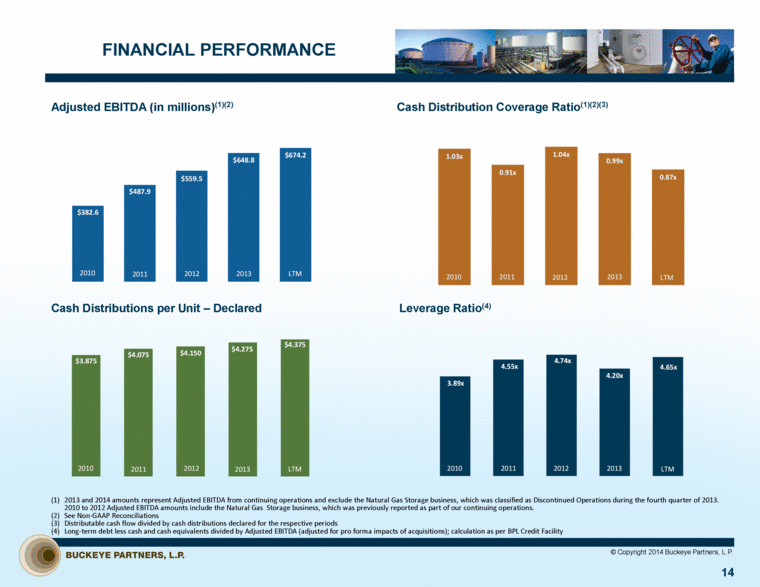
FINANCIAL PERFORMANCE 14 Adjusted EBITDA (in millions)(1)(2) Cash Distributions per Unit – Declared Cash Distribution Coverage Ratio(1)(2)(3) 2013 and 2014 amounts represent Adjusted EBITDA from continuing operations and exclude the Natural Gas Storage business, which was classified as Discontinued Operations during the fourth quarter of 2013. 2010 to 2012 Adjusted EBITDA amounts include the Natural Gas Storage business, which was previously reported as part of our continuing operations. See Non-GAAP Reconciliations Distributable cash flow divided by cash distributions declared for the respective periods Long-term debt less cash and cash equivalents divided by Adjusted EBITDA (adjusted for pro forma impacts of acquisitions); calculation as per BPL Credit Facility Leverage Ratio(4) © Copyright 2014 Buckeye Partners, L.P. 1.03x 0.91x 1.04x 0.99x 0.87x 2012 2011 2010 2013 LTM 3.89x 4.55x 4.74x 4.20x 4.65x 2012 2011 2010 2013 LTM $382.6 $487.9 $559.5 $648.8 $674.2 2012 2011 2010 2013 LTM $3.875 $4.075 $4.150 $4.275 $4.375 2012 2010 2013 LTM 2011 |
|
|
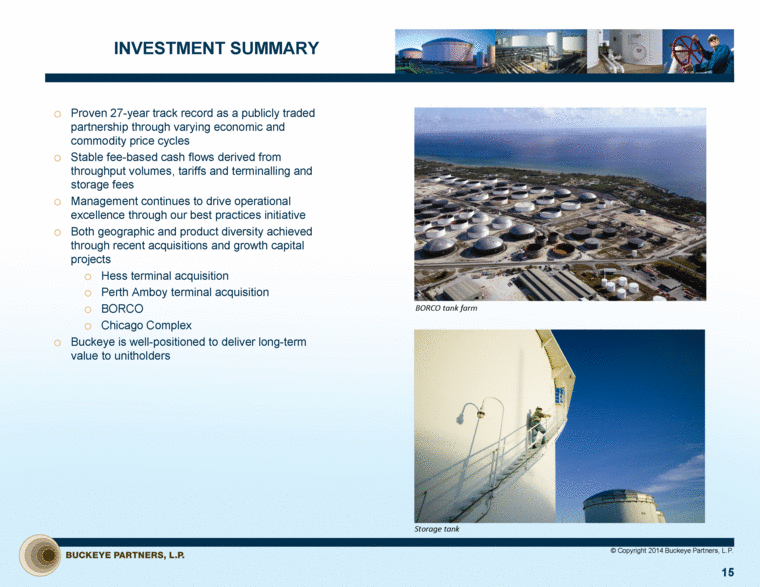
INVESTMENT SUMMARY Proven 27-year track record as a publicly traded partnership through varying economic and commodity price cycles Stable fee-based cash flows derived from throughput volumes, tariffs and terminalling and storage fees Management continues to drive operational excellence through our best practices initiative Both geographic and product diversity achieved through recent acquisitions and growth capital projects Hess terminal acquisition Perth Amboy terminal acquisition BORCO Chicago Complex Buckeye is well-positioned to deliver long-term value to unitholders © Copyright 2014 Buckeye Partners, L.P. 15 Storage tank BORCO tank farm |
|
|
NON-GAAP RECONCILIATIONS |
|
|
NON-GAAP FINANCIAL MEASURES Adjusted EBITDA and distributable cash flow are measures not defined by GAAP. Adjusted EBITDA is the primary measure used by our senior management, including our Chief Executive Officer, to (i) evaluate our consolidated operating performance and the operating performance of our business segments, (ii) allocate resources and capital to business segments, (iii) evaluate the viability of proposed projects, and (iv) determine overall rates of return on alternative investment opportunities. Distributable cash flow is another measure used by our senior management to provide a clearer picture of Buckeye’s cash available for distribution to its unitholders. Adjusted EBITDA and distributable cash flow eliminate (i) non-cash expenses, including, but not limited to, depreciation and amortization expense resulting from the significant capital investments we make in our businesses and from intangible assets recognized in business combinations, (ii) charges for obligations expected to be settled with the issuance of equity instruments, and (iii) items that are not indicative of our core operating performance results and business outlook. Buckeye believes that investors benefit from having access to the same financial measures used by senior management and that these measures are useful to investors because they aid in comparing Buckeye’s operating performance with that of other companies with similar operations. The Adjusted EBITDA and distributable cash flow data presented by Buckeye may not be comparable to similarly titled measures at other companies because these items may be defined differently by other companies. Please see the attached reconciliations of each of Adjusted EBITDA and distributable cash flow to income from continuing operations. © Copyright 2014 Buckeye Partners, L.P. 17 |
|
|
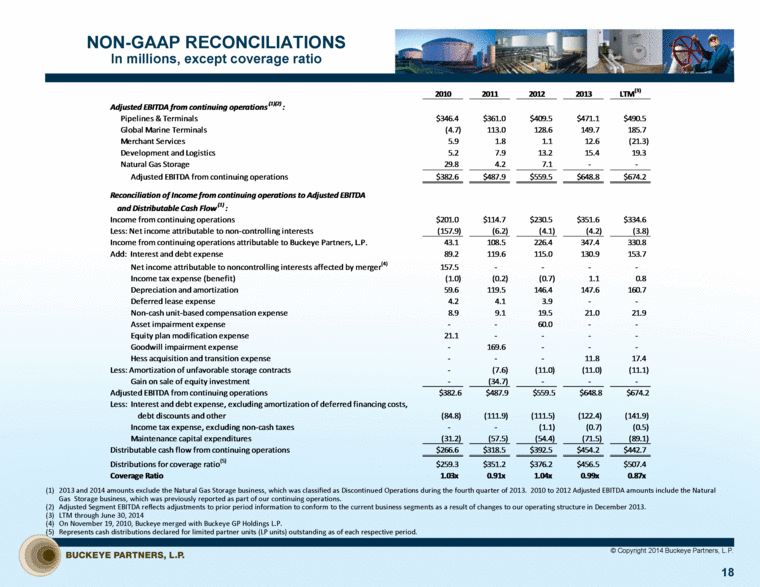
NON-GAAP RECONCILIATIONS In millions, except coverage ratio © Copyright 2014 Buckeye Partners, L.P. 18 2013 and 2014 amounts exclude the Natural Gas Storage business, which was classified as Discontinued Operations during the fourth quarter of 2013. 2010 to 2012 Adjusted EBITDA amounts include the Natural Gas Storage business, which was previously reported as part of our continuing operations. Adjusted Segment EBITDA reflects adjustments to prior period information to conform to the current business segments as a result of changes to our operating structure in December 2013. LTM through June 30, 2014 On November 19, 2010, Buckeye merged with Buckeye GP Holdings L.P. Represents cash distributions declared for limited partner units (LP units) outstanding as of each respective period. 2010 2011 2012 2013 LTM (3) Adjusted EBITDA from continuing operations (1)(2) : Pipelines & Terminals $346.4 $361.0 $409.5 $471.1 $490.5 Global Marine Terminals (4.7) 113.0 128.6 149.7 185.7 Merchant Services 5.9 1.8 1.1 12.6 (21.3) Development and Logistics 5.2 7.9 13.2 15.4 19.3 Natural Gas Storage 29.8 4.2 7.1 - - Adjusted EBITDA from continuing operations $382.6 $487.9 $559.5 $648.8 $674.2 Reconciliation of Income from continuing operations to Adjusted EBITDA and Distributable Cash Flow (1) : Income from continuing operations $201.0 $114.7 $230.5 $351.6 $334.6 Less: Net income attributable to non-controlling interests (157.9) (6.2) (4.1) (4.2) (3.8) Income from continuing operations attributable to Buckeye Partners, L.P. 43.1 108.5 226.4 347.4 330.8 Add: Interest and debt expense 89.2 119.6 115.0 130.9 153.7 Net income attributable to noncontrolling interests affected by merger (4) 157.5 - - - - Income tax expense (benefit) (1.0) (0.2) (0.7) 1.1 0.8 Depreciation and amortization 59.6 119.5 146.4 147.6 160.7 Deferred lease expense 4.2 4.1 3.9 - - Non-cash unit-based compensation expense 8.9 9.1 19.5 21.0 21.9 Asset impairment expense - - 60.0 - - Equity plan modification expense 21.1 - - - - Goodwill impairment expense - 169.6 - - - Hess acquisition and transition expense - - - 11.8 17.4 Less: Amortization of unfavorable storage contracts - (7.6) (11.0) (11.0) (11.1) Gain on sale of equity investment - (34.7) - - - Adjusted EBITDA from continuing operations $382.6 $487.9 $559.5 $648.8 $674.2 Less: Interest and debt expense, excluding amortization of deferred financing costs, debt discounts and other (84.8) (111.9) (111.5) (122.4) (141.9) Income tax expense, excluding non-cash taxes - - (1.1) (0.7) (0.5) Maintenance capital expenditures (31.2) (57.5) (54.4) (71.5) (89.1) Distributable cash flow from continuing operations $266.6 $318.5 $392.5 $454.2 $442.7 Distributions for coverage ratio (5) $259.3 $351.2 $376.2 $456.5 $507.4 Coverage Ratio 1.03x 0.91x 1.04x 0.99x 0.87x |

