Attached files
| file | filename |
|---|---|
| 8-K - 8-K - NEWTEK BUSINESS SERVICES, INC. | d776442d8k.htm |
 www.thesba.com
Newtek Business Services, Inc.
“The Small Business Authority®”
Hosted by:
Hosted by:
Barry Sloane, President & CEO
Barry Sloane, President & CEO
Jennifer Eddelson, EVP & CAO
Jennifer Eddelson, EVP & CAO
Second Quarter 2014
Second Quarter 2014
Financial Results Conference Call
Financial Results Conference Call
August 14, 2014 4:15pm ET
August 14, 2014 4:15pm ET
NASDAQ: NEWT
NASDAQ: NEWT
www.thesba.com
www.thesba.com
Investor Relations
Public Relations
Newtek Investor Relations
Hayden Investor Relations
Newtek Public Relations
Jayne Cavuoto
Director of Investor Relations
jcavuoto@thesba.com
(212) 273-8179
Brett Maas
brett@haydenir.com
(646) 536-7331
Peter Seltzberg
peter@haydenir.com
(646) 415-8972
Simrita Singh
Director of Marketing
ssingh@thesba.com
(212) 356-9566
Exhibit 99.1 |
 www.thesba.com
Safe Harbor Statement
The statements in this slide presentation including statements regarding anticipated future
financial performance, Newtek's beliefs, expectations, intentions or strategies for the
future, may be "forward-looking statements" under the Private Securities
Litigation Reform Act of 1995. All forward-looking statements involve a number of
risks and uncertainties that could cause actual results to differ materially from the
plans, intentions and expectations reflected in or suggested by the forward-looking
statements. Such risks and uncertainties include, among others, intensified
competition, operating problems and their impact on revenues and profit margins,
anticipated future business strategies and financial performance, anticipated future
number of customers, business prospects, legislative developments and similar matters. Risk
factors, cautionary statements and other conditions which could cause Newtek’s
actual results to differ from management's current expectations are contained in
Newtek’s filings with the Securities and Exchange Commission and available through
http://www.sec.gov 2 |
 www.thesba.com
Business Development Company
The Company expects to present to its shareholders a proposal to
convert to a Business Development Company (“BDC”) once cleared
to do so by the SEC
In addition, the Company has filed preliminary materials to conduct a
public offering of up to $50 million of the shares of the BDC in
conjunction with the conversion
We are unable to offer any further information or take any questions
regarding this proposed conversion or offering at this time
3 |
 www.thesba.com
Adjusted Earnings* Presentation
GAAP financial results for the three and six months ended June 30, 2014 include
one-time non-cash charge of $1.9 million related to the extinguishment of the
Company’s mezzanine debt with Summit Partners Credit Advisors, L.P.
Pretax income, net income attributable to Newtek Business Services, Inc., and
diluted EPS are reported on an adjusted basis to reflect the reversal of the one-
time non-cash charge of $1.9 million
Charge represents total remaining unamortized debt discount and deferred
financing costs attributable to the Summit mezzanine debt
Management believes adjusted amounts provide a more accurate depiction of
the Company’s operating performance and year-over-year comparison with the
prior year’s GAAP results
2014 consolidated guidance for Adjusted pretax income and Adjusted diluted
EPS reflect the reversal of this charge
4
*See slide 30 for definition of Adjusted pretax income and Adjusted diluted EPS
|
 www.thesba.com
Q2 2014 Adjusted Financial Highlights
Adjusted diluted EPS* of $0.07; an increase of 40.0% over GAAP diluted EPS
of $0.05 Q2 2013
For the six months ended June 30, 2014, adjusted diluted EPS of $0.10; an
increase of 11.1% over GAAP diluted EPS of $0.09 for the six months ended
June 30, 2013
Adjusted pretax income* of $4.2 million; an increase of 45.6% over Q2 2013
Adjusted EBITDA* was $7.1 million; an increase of 37.0% over Q2 2013
2014 consolidated adjusted guidance**
•
Expect double-digit top-
and bottom-line percentage growth in 2014
•
Over the past 3 years bottom-line performance on average in the 2nd half of
the year has comprised approximately 60% of total full year earnings
•
Anticipate
experiencing
similar
trend
this
year
and
believe
2014
Adjusted
diluted EPS will grow to between $0.21 and $0.25 from $0.20 in 2013.
5
**As of 8/14/2014; Adjusted pretax income and Adjusted diluted EPS guidance reflect reversal
of $1.9 million one-time non-cash charge *See slide 30 for definition of
Adjusted pretax income, Adjusted diluted EPS and Adjusted EBITDA |
 www.thesba.com
Q2 2014 GAAP Results
Operating revenues of $38.1 million; an increase of 3.0% over $37.0
million in Q2 2013
GAAP diluted EPS of $0.04; a decrease of 20.0% from $0.05 in Q2 2013
For the six months ended June 30, 2014, GAAP diluted EPS of $0.07; a
decrease of 22.2% from $0.09 for the six months ended June 30, 2013
Pretax income of $2.3 million; a decrease of 20.5% over $2.9 in Q2 2013
Small Business Finance Segment
•
Pretax income: $3.9 million; a year-over-year increase of 90.8%
•
Revenue: $10.2 million; a year-over-year increase of 22.2%
6 |
 www.thesba.com
Q2 2014 Operational Highlights
The Company entered into a $20.0 million credit agreement with Capital
One, N.A., refinancing existing mezzanine debt at a lower cost of interest
•
Refinance will reduce the Company’s interest expense by approximately $1.0
million annually, or $4.2 million, over the remaining term of the retired
Summit loan
Announced in August 2014 that Lender received approval from Capital
One, N.A. to increase lending revolving credit facility by $23 million to
$50 million; currently subject to regulatory approval
Standard and Poor’s reaffirmed ratings on two of Newtek Small Business
Loan Trusts under stricter rating methodology
Standard and Poor’s affirmed Newtek’s business-based real estate
servicer rankings
Made significant upgrades to senior and middle-level management
7 |
 www.thesba.com
Company Reduces Cost of Capital
Lower cost of debt financing
Reduced cost of equity capital
Ability to attract lower-cost debt financing and intention to raise cost-
effective equity capital leaves Management optimistic regarding
ability to grow balance sheet, revenue and net income going forward
8 |
 www.thesba.com
2014 Adjusted Consolidated Guidance*
9
Operating Revenue:
•
Midpoint of $161.0 million, with a range of $154.0 million and $168.0 million
•
Increase of 12.1% over 2013 revenue of $143.6 million
Adjusted Pretax Income**:
•
Midpoint of $13.5 million, with a range of $12.5 million and $14.5 million
•
Increase of 21.6% over 2013 GAAP pretax income $11.1 million
Adjusted Diluted EPS**:
•
Midpoint of $0.23, with a range of $0.21 and $0.25 per share
•
Increase of 15.0% over 2013 GAAP diluted EPS of $0.20
Adjusted EBITDA**:
•
Midpoint of $26.0 million, with a range of $24.5 million and $27.5 million
•
Increase of 26.2% over 2013 Adjusted EBITDA* of $20.6 million
**See slide 30 for definition of Adjusted pretax income, Adjusted diluted EPS and Adjusted
EBITDA Expect double-digit top-
and bottom-line percentage growth in 2014
*As of 8/14/2014: Adjusted pretax income and Adjusted diluted EPS guidance reflect reversal of
$1.9 million one-time non-cash charge |
 www.thesba.com
Consolidated Balance Sheet
10
$ in thousands
Balance at
June 30, 2014
Balance at
Dec 31, 2013
Total Cash & Cash Equivalents*
$27,817
$29,385
Total Assets
$200,896
$198,612
Total Liabilities
$120,332
$121,603
Total Equity
$80,564
$77,009
Selected Items
*Includes restricted cash of $18.8 million at June 30, 2014, and $16.9 million at
December 31, 2013 |
 www.thesba.com
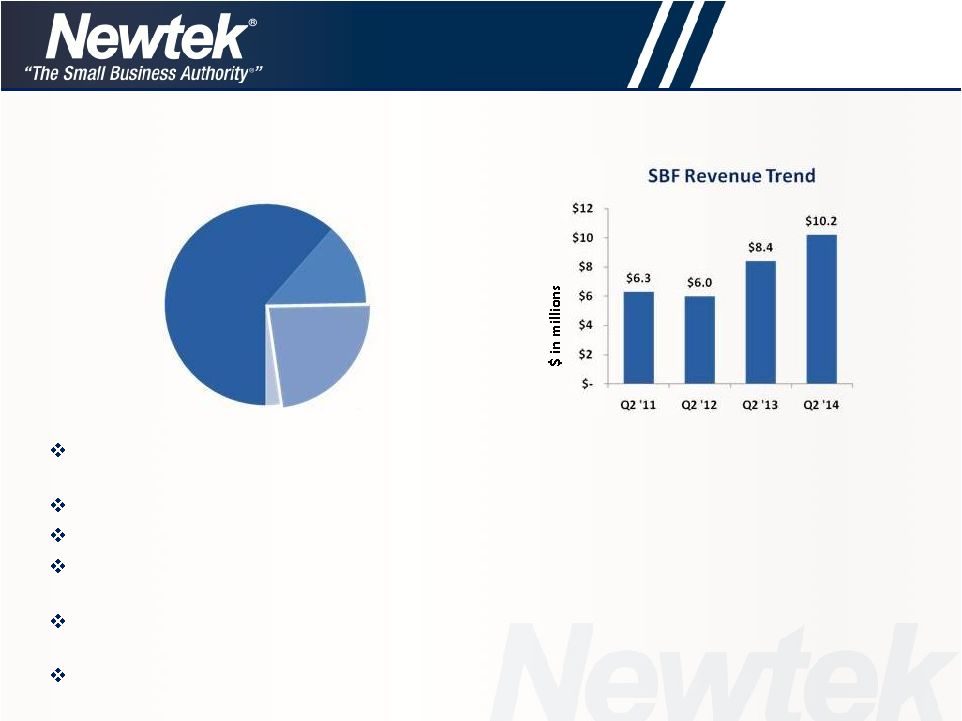
Small Business Finance
11
Q2 2014 SBF pretax income increased by 90.8% to $3.9 million; SBF revenue increased by 22.2%
to $10.2 million
Capital One, N.A. approved additional $23 million in financing for Lender
Expanded breadth and depth of senior management team
Six months ended June 30, 2013, loan originations increased by 13.6% to $88.2 million compared
to six months ended June 30, 2013
Expect second half of 2014 to yield stronger loan origination volume than the first half of
the year based on historical trends
New referral partners in pipeline: Union Bank of Switzerland, Randolph-Brooks Credit Union
and others
Q2 2014 SBF revenue was 26.8% of total operating revenue
Newtek Business Service, Inc.
Q2
2014
Total
Operating
Revenue:
$38.1
million
SBF
$10.2M |
 www.thesba.com
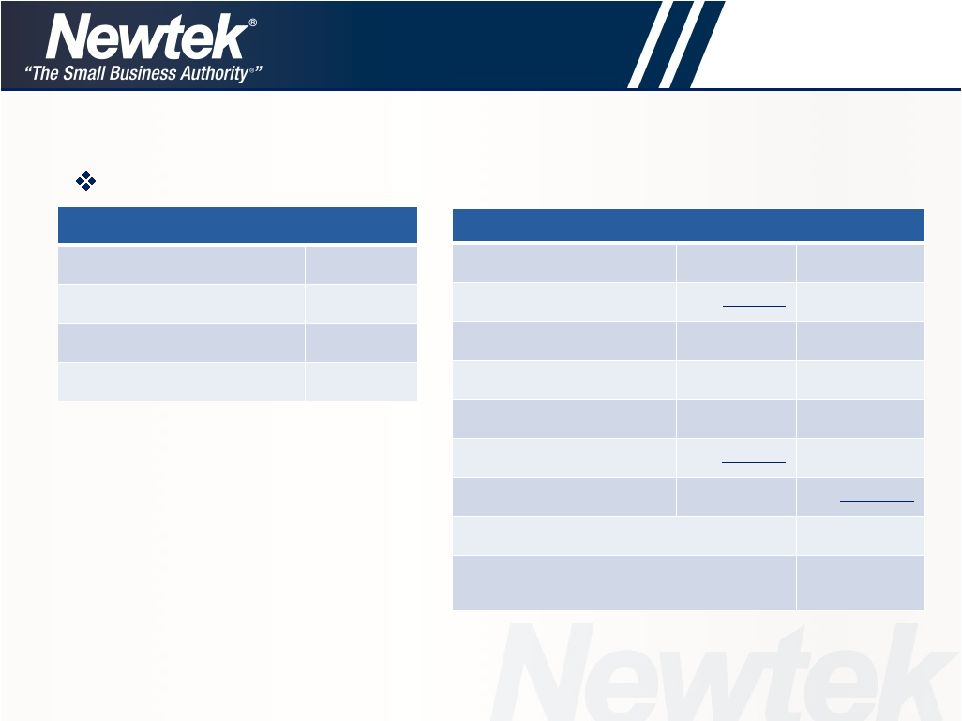
Key Variables in Loan Sale Transaction
Loan Amount
$1,000,000
Guaranteed Balance (75%)
$750,000
Unguaranteed Balance (25%)
$250,000
Premium*
12.5%
12
Loan Sale Transaction
Direct
Revenue
/
Expense
of
a
Loan
Sale
Transaction
–
An
Example
Resulting Revenue (Expense)
Associated Premium**
$93,750
Servicing Asset***
$18,630
Total Premium Income
$112,380
Packaging Fee Income
$2,500
FV Discount
$(15,000)
Referral Fees
$(7,500)
Total Direct Expenses
$(22,500)
Net Risk-adjusted Profit Recognized
$92,380
Net Cash Created pretax
(post securitization)****
$11,250
**Assumes 12.5% of the Guaranteed balance
***
Value determined by GAAP servicing value; a
present value of future servicing income
**** Assuming the loan is sold in a securitization in
12 months
*Premiums above 10% split 50/50 with SBA. This
example assumes guaranteed balance is sold at
15%. The additional 5% (15%-10%) is split with SBA.
Newtek nets 12.5% |
 www.thesba.com
13
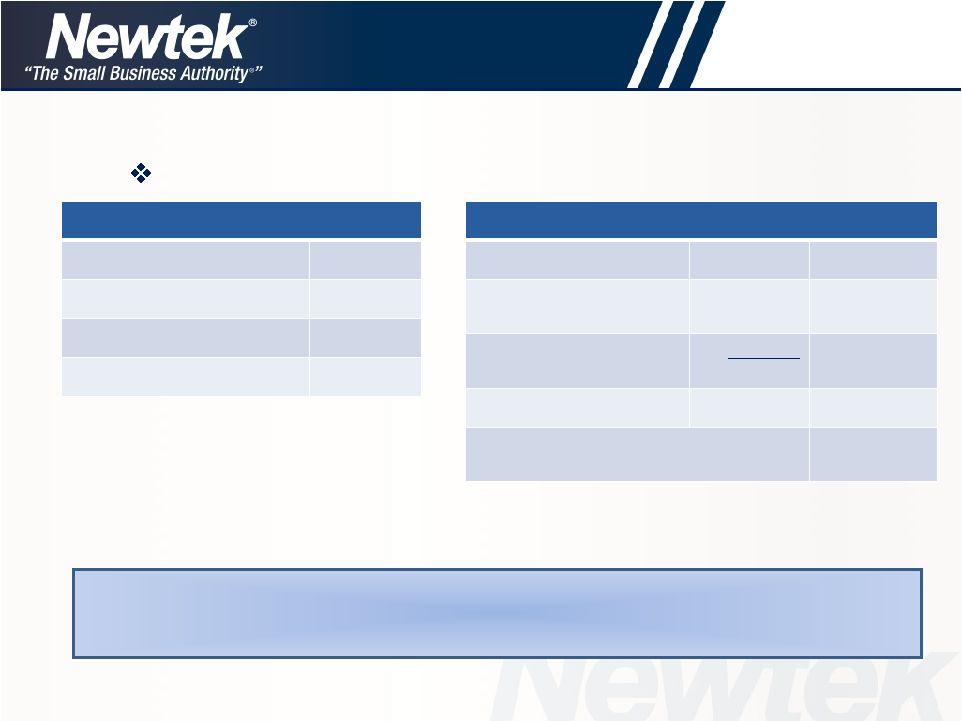
Loan Sale Transaction
Net Cash Created Pretax
Guaranteed Balance
$750,000
Premium Received on
Guaranteed Balance**
$93,750
Cash received in
Securitization***
$167,500
Total
$1,011,250
Net Cash Created pretax
(post securitization)****
$11,250
**Assumes 12.5% of the Guaranteed balance
***
Assumes 67% advance rate in securitization on
unguaranteed balance
**** Assuming the loan is sold in a securitization in 12 months
*Premiums above 10% split 50/50 with SBA. This
example assumes guaranteed balance is sold at
15%. The additional 5% (15%-10%) is split with SBA.
Newtek nets 12.5%
Net cash assumes: cash premium on guaranteed balance after sale PLUS
cash from
securitizing unguaranteed balance in an S&P-rated structured-finance
transaction Key Variables in Loan Sale Transaction
Loan Amount
$1,000,000
Guaranteed Balance (75%)
$750,000
Unguaranteed Balance (25%)
$250,000
Premium*
12.5%
Net
Cash
Created
in
Loan
Sale
Transaction
–
An
Example |
 www.thesba.com
14
Comparative Loan Portfolio Data
Loan Characteristic
As of 12/31/10
As of 6/30/14
Business Type:
Existing Businesses
53.93%
79.64%
Business Acquisition
25.89%
13.59%
Start-Ups
20.18%
6.77%
Primary Collateral:
Commercial RE
45.33%
55.65%
Machinery & Equipment
22.79%
23.33%
Residential RE
22.27%
11.05%
Other
9.61%
6.17%
Percentage First Lien on RE:
Commercial RE
84.84%
95.02%
Residential RE
9.87%
29.78%
Other:
Weighted Average Mean FICO
675
705
Weighted Average Current LTV
78.23%
72.50%
(12/31/10 vs. 6/30/2014)
Loan Characteristic
As of 12/31/10
Loan Characteristic
As of 6/30/14
Industry:
Industry:
Restaurant
10.60%
Restaurant
7.52%
Hotels & Motels
7.58%
Amusement,
Gambling and
Recreation
6.02%
State Concentration:
State Concentration:
Florida
21.55%
New York
12.69%
New York
12.66%
Florida
9.16%
Georgia
14.08%
Connecticut
7.00% |
 www.thesba.com
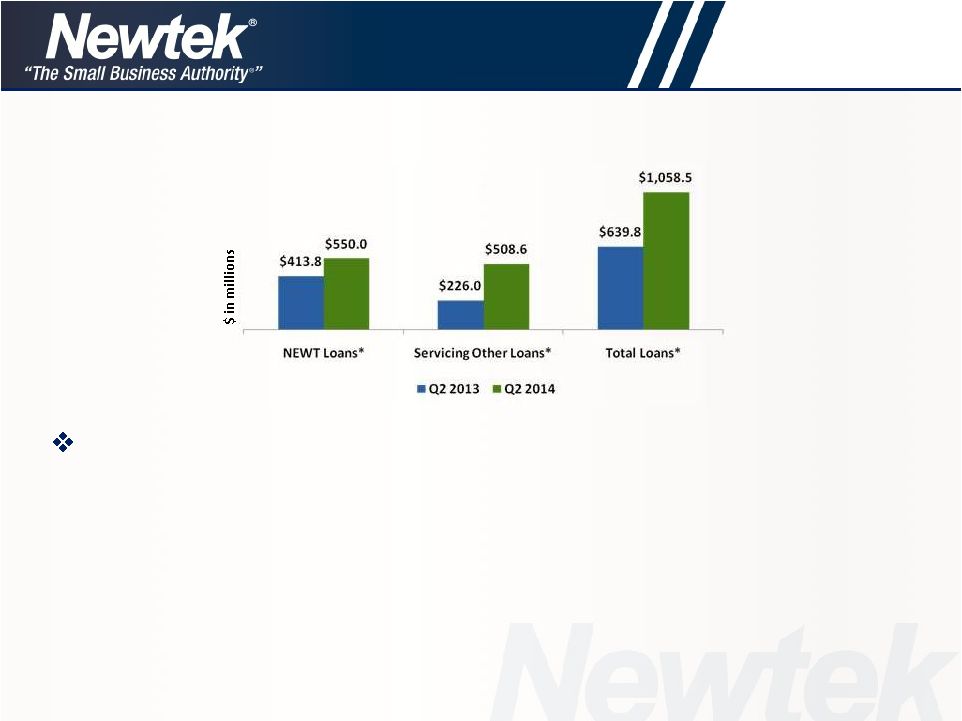
Servicing Portfolio
15
The
SBF
servicing
portfolio
–
Q2
2013
vs.
Q2
2014
•
Total servicing portfolio increased by 65.4% to $1.1 billion
–
Newtek portfolio increased by 32.9%
–
Third-party servicing portfolio increased by 125.0%
–
Plan to continue to grow the loan servicing aspect of the business both
organically, through growth in loan originations, as well as through acquisition
of third-party loan servicing portfolios
–
Currently have numerous third-party opportunities in the pipeline
*Principal balance of loans serviced (dollars in millions) |
 www.thesba.com
Building Our Senior Executive Team
Susan
Streich:
Named
Chief
Risk
Officer
and
Chief
Compliance
Officer
for
Newtek
Business Services, Inc. and Newtek Small Business Finance
•
Over 30 years’
experience as an executive-level finance professional; extensive experience
initiating and leading national small business lending departments and ensuring their
compliance with federal and corporate requirements
•
Former
Senior
Advisor,
Project
Lead
and
Subject
Matter
Expert
at
Booz
Allen
Hamilton,
advising clients including the U.S. Department of Treasury, Community Development Financial
Institutions
Fund
and
the
State
Small
Business
Credit
Initiative
Fund
•
Former Director of Capital One Bank and President of Transamerica Small Business
Capital Harold
Gartner:
Named
President
and
Chief
Operating
Officer,
Newtek
Business
Credit
•
Nearly 30 years’
experience in receivables finance, asset-backed lending, factoring, warehouse
lending, asset-backed securitization, principal finance, whole-loan acquisitions and
corporate M&A
•
Held executive management positions at Morgan Stanley, Chase Manhattan Corporation (now
JP Morgan Chase Bank), Nomura Securities International, Daiwa Securities America and
ING Capital Markets
•
Former consultant to institutional clients in the U.S. Capital Markets and Receivables
Servicing industries
16 |
 www.thesba.com
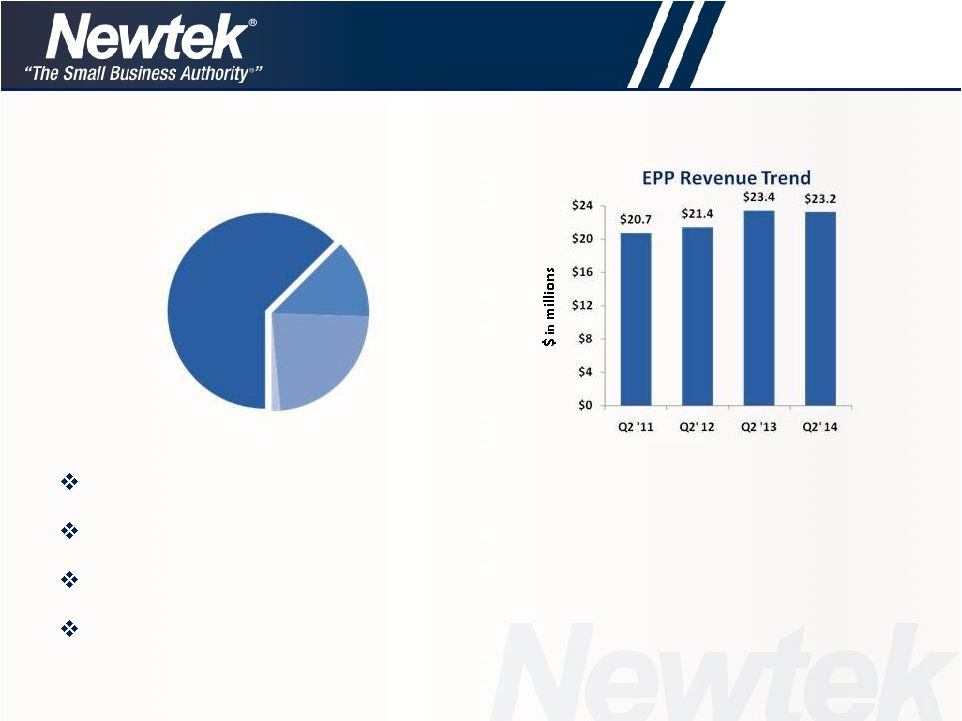
Q2 2014 EPP revenue decreased slightly by approximately 1.0% to $23.2 million
Implementing price changes in EPP to support revenue growth going forward
Introduction of competitive new products
Management changes to support new strategic initiatives
Electronic Payment Processing
17
EPP
Revenue
$23.2M
Q2 2014 EPP revenue was 60.8% of total operating revenue
Newtek Business Services, Inc.
Q2
2014
Total
Operating
Revenue:
$38.1
million |
 www.thesba.com
Implementation of Price Changes &
New Security Programs
18
Company enacted first price increase in 3 years for its clients;
effective July 2014
Company will implement new Payment Card Industry Data
Security Standards (“PCI DSS”) programs for merchants in
second half of 2014
Increased transaction volumes, July price increase, and the
planned new merchant security programs will improve
margins and add a forecasted $562,000 to pretax income in
the second half of 2014 compared to the first half of 2014 |
 www.thesba.com
New Product Development
19
Eric Turille:
Named Director of Business Development
•
Relocated to Phoenix, Arizona, where he leads business
development for the following product offerings:
–
Point of Sale (“POS”) in the Cloud
Creates revenue for EPP segment
–
Further penetration with Secure Cyber Gateway product
–
Free Cyber Scan product with protective shield for WordPress
websites |
 www.thesba.com
Management Changes in EPP Segment
20
Bruce
Hopkins:
Named
President
of
Newtek
Merchant
Solutions
•
Over 25 years’
experience in financial institutions and payment services spaces
•
Former General Manager, Debit & Credit Solutions at Fiserv Corporation
•
Former Senior Vice President, Merchant Solutions at FIS Corporation
•
Former Division President, Acquiring Solutions Group at Metavante Corporation
David
Karcher:
Named
Business
Service
Specialist
(“BSS”)
Manager
•
Extensive experience in direct sales, business development for start-ups and
strategic alliances
•
As a BSS, responsible for alliance partner sales team as well as
responsible for
Independent Sales Organization (“ISO”) and Agent sales teams
•
Previously held senior sales and business development positions at iStream
Financial Services, and Diversinet, and formerly responsible for
development of
alliance relationships at Clear2Pay Americas, Aliaswire, Inc., iPay Technologies,
LLC, and Metavante Corporation |
 www.thesba.com
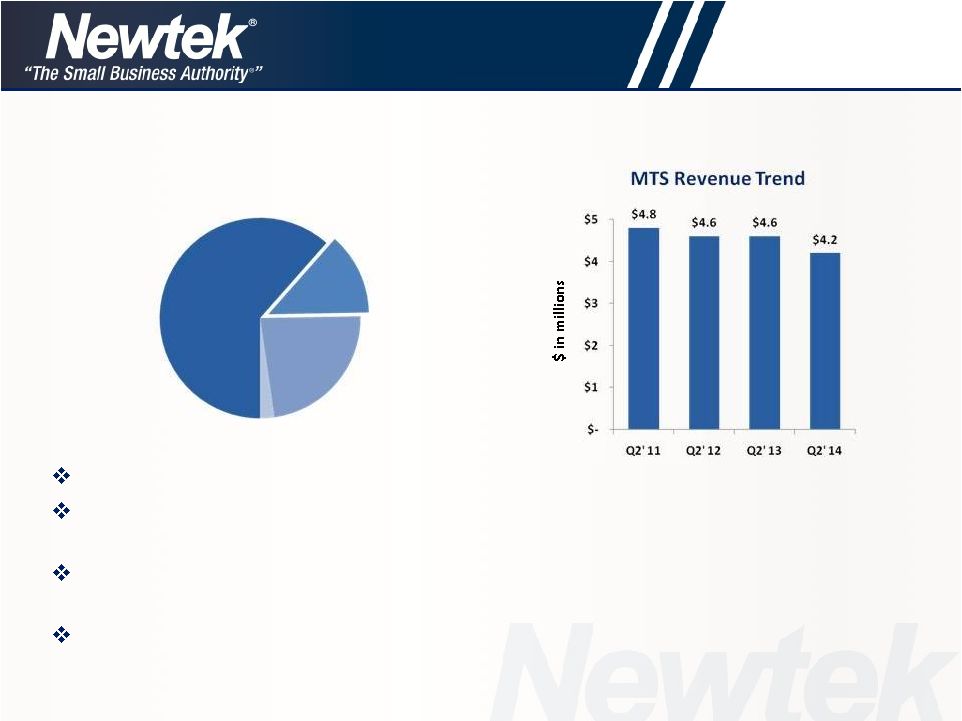
Managed Technology Solutions
21
MTS
$4.2M
Q2 2014 MTS revenue decreased by 8.8% to $4.2 million
This segment is being transformed to take advantage of shift to cloud-based business
trends including: eCommerce, Payroll and Insurance
Implementing cost-reduction measures and new product introductions as part of
repositioning strategy
Several changes with MTS senior management team
Q2 2014 MTS revenue was 11.0% of total operating revenue
Newtek Business Services, Inc.
Q2
2014
Total
Operating
Revenue:
$38.1
million |
 www.thesba.com
Cost Reduction Measures
22
Implemented cost-reduction measures in the MTS segment in July
2014, which are expected to take full effect in the second half of 2014
Recurring forecasted monthly
cost reductions*:
•
Gross Wages: $25,000
•
SPLA (Microsoft licensing) expenses: $30,000
•
Discontinuation of certain non-performing marketing programs: $22,000
•
Maintenance & Support –
Hardware & Software: $8,000
•
Miscellaneous fees: $8,000
•
Offset by Rent expense which will increase monthly by $19,500
(monthly
rent
expense
will
remain
static
over
next
5
years
under
current
lease
agreement)
Total
Forecasted
Monthly
Recurring
Cost
Reduction*:
$80,500
•
Equivalent to a forecast of cost reduction* of $966,000
on an annualized
basis
*
Forecasted
cost
reduction
for
2
nd
half
of
2014
compared
to
2
nd
half
of
2013
actuals. |
 www.thesba.com
New Competitive Product Offerings
23
Point of Sale (“POS”) in the Cloud
•
Creates hosting revenue for MTS segment
Cyber Scanning
Newtek Partners Program (PAR) Program |
 www.thesba.com
Management Changes in MTS
24
Richard
Rebetti:
Named
President
and
Chief
Operating
Officer
of
Newtek
Technology
Services
•
Over 20 years’
experience in both business development and executive operations of high
technology and communications companies
•
Former Chief Operating Officer of Data Storage Corporation and Telco Group Inc.
•
Former Chief Technology Officer of STi Prepaid, LLC
Mark
Denzin:
Named
Senior
Vice
President
of
Business
Development
•
Depth
and
breadth
of
experience
in
hosting
industry;
with
Newtek
since
2009
•
Responsible for growing partner and end-user business
Dan
Lukenda:
Named
Senior
Vice
President
of
Customer
Operations
•
Extensive industry experience in sales, client management, and technical operations; with
Newtek since 2011
•
Focused on bringing Newtek’s customers exceptional service and improving client
offerings Andew
Lacquire:
Named
Vice
President
of
Customer
Operations
•
Responsible for continuing Newtek’s high levels of customer support with his several
years of experience in key areas of customer operations; with Newtek since 2009
|
 www.thesba.com
Competition
25 |
 www.thesba.com
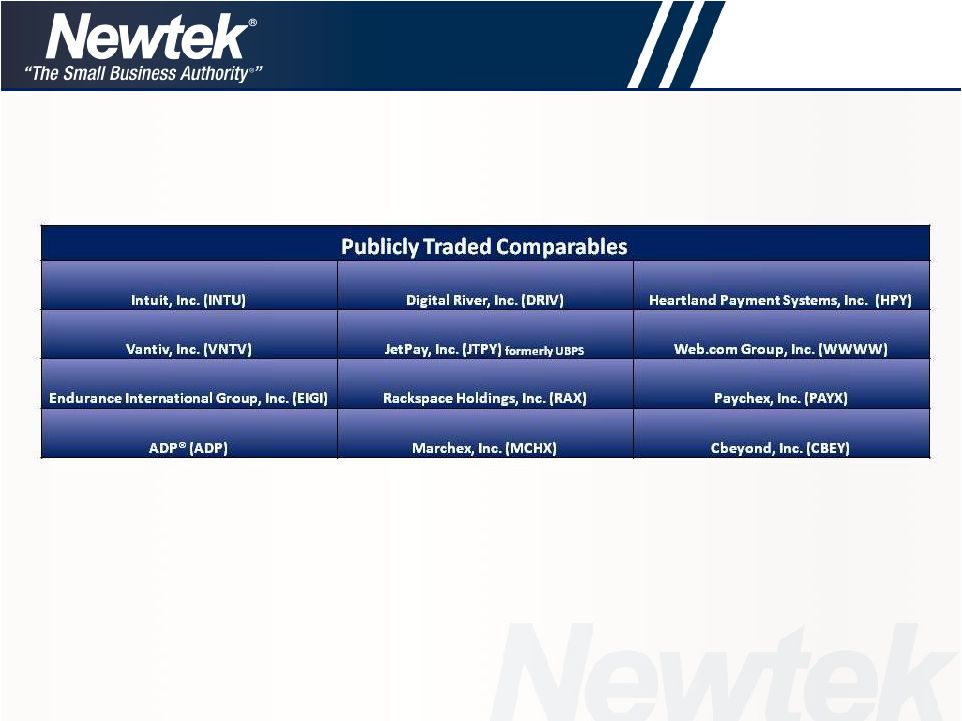
Comparable Company Statistics
Lending Club –
$3.8 billion market valuation
•
4/17/2014: raised $115 million in debt and equity
On Deck Capital –
recently raised $180 million in venture capital
•
Have made less than $1.0 billion in loans
Go Daddy estimated worth more than $6 billion in an IPO, based on GoDaddy’s
CEO’s sales growth projections; IPO planned for 2
nd
half of 2014
•
GoDaddy previously announced strategic purchase of a cloud-based financial
management application company to reach more small businesses
Digital River (DRIV) purchased LML Payment Systems (LMLP)
Universal Business Payment Solutions (UBPS), now JetPay, LLC (JTPY), completed
$179 million acquisition of credit/debit card sales and processing (JetPay, LLC),
payroll processing and tax filing companies (AD Computer Corporation)
Newtek’s competitive advantage
is its experience of providing a “suite of services”
which are integrated on a similar, coordinated platform, and are
available in the
Cloud; it’s called The Newtek Advantage™
26 |
 www.thesba.com
Investment Summary
Publicly traded Company since 2000
Management’s interests aligned with shareholders
•
CEO alone owns approximately 13.4% of outstanding shares*
•
Founders, Management and Board combined own over 25% of outstanding shares*
Trades at approximately 3.6x 2014 forecasted Adjusted EBITDA**
•
2014 forecasted Adjusted EBITDA** of $26.0 million, an increase of approximately 26.2%
over FY 2013 Adjusted EBITDA** of $20.6 million
Growing revenues
•
Expect to grow revenues by approximately 12% in 2014
Tremendous opportunity to penetrate market
•
Over 27.5 million small businesses in the U.S.
Inexpensive relative to market comparables
•
Market comps: DRIV, WWWW, VNTV, JTPY, EIGI, INTU
27
**See slide 30 for definition of Adjusted EBITDA
*As of 8/13/2014 |
 www.thesba.com
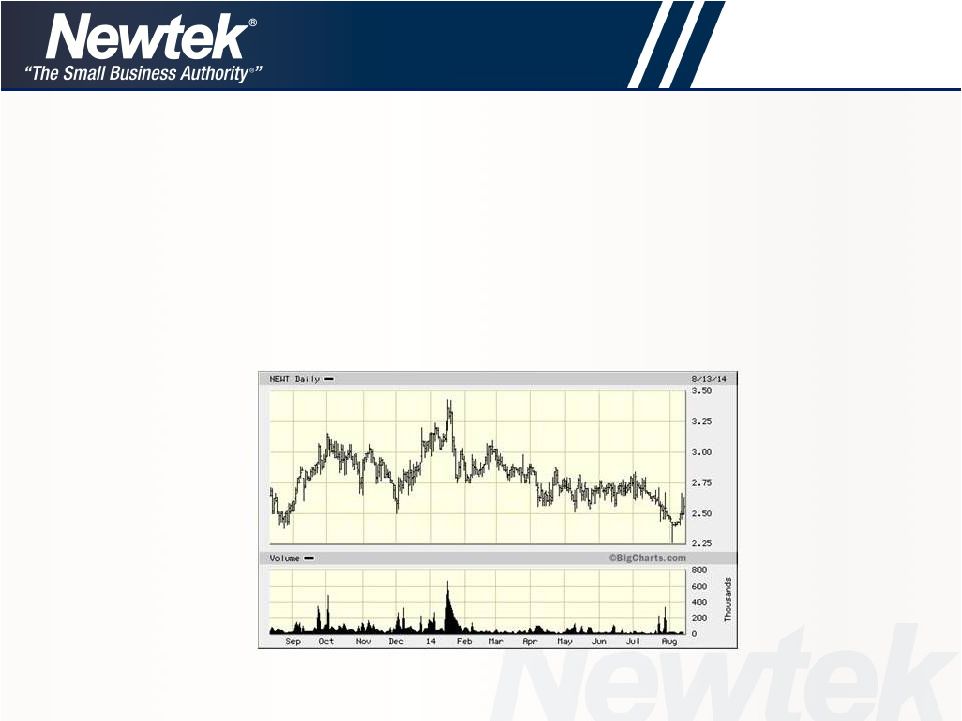
Key Statistics –
NASDAQ: NEWT
28
Stock
Price $2.55
52-Week
Range $2.26-$3.43
Common Shares O/S 37.0M
Market
Cap $96.4M
Avg. Daily Trading Vol. 67,140
(200-day average)
Share Statistics* (USD)
………………………...............
2014 Guidance***
……………………….....................
Revenue
$161.0M
Adjusted Pre-tax Income**
$13.5M
Adjusted Diluted EPS**
$0.23
Adjusted EBITDA**
$26.0M
*As of 8/13/2014:
**See slide 30 for definition of Adjusted pretax income, Adjusted diluted EPS and Adjusted
EBITDA *** As of 8/14/2014. Represents midpoint of expected range. Adjusted pretax
income and Adjusted diluted EPS guidance reflect reversal of $1.9 million one-time
non-cash charge |
 www.thesba.com
Financial Review
Jennifer C. Eddelson -
CAO |
 www.thesba.com
Non-GAAP Financial Measures
In evaluating its business, Newtek considers and uses adjusted EBITDA as a supplemental measure
of its operating performance. The Company defines adjusted EBITDA as earnings
before income from tax credits, interest expense, taxes, depreciation and amortization,
stock compensation expense, other than temporary decline in value of investments,
Capco
fair
value
change
and
the
amortization
of
the
2011
accrued
loss
on
the
lease
restructure.
Newtek
uses adjusted EBITDA as a supplemental measure to review and assess its operating
performance. The Company also presents adjusted EBITDA because it believes it is
frequently used by securities analysts, investors and other interested parties as a
measure of financial performance. The terms Adjusted EBITDA, Adjusted pretax income and
Adjusted diluted EPS are not defined under U.S. generally accepted accounting principles,
or U.S. GAAP, and is not a measure of operating income, operating performance or
liquidity presented in accordance with U.S. GAAP. Adjusted EBITDA, Adjusted pretax income
and Adjusted diluted EPS have limitations as analytical tools and, when assessing the
Company’s operating performance, investors should not consider Adjusted EBITDA,
Adjusted pretax income and Adjusted diluted EPS in isolation, or as a substitute for net
income (loss) or other consolidated income statement data prepared in accordance with U.S.
GAAP. Among other things, Adjusted EBITDA, does not reflect the Company’s
actual cash expenditures. Other companies may calculate similar measures
differently than Newtek, limiting their usefulness as comparative tools. The Company compensates
for these limitations by relying primarily on its GAAP results supplemented by Adjusted EBITDA,
Adjusted pretax income and Adjusted diluted EPS.
Beginning in the second quarter of 2014, the Company included two new Non-GAAP financial
measures, Adjusted pretax income and Adjusted diluted EPS, to reflect the Company’s
pretax earnings and diluted EPS as adjusted for a non- recurring charge to income
related to the refinancing of debt. The Company incurred a one time, non-cash charge to
income of $1.9 million which represented the remaining deferred financing costs and debt
discount. Our
Capcos
operate
under
a
different
set
of
rules
in
each
of
the
7
jurisdictions
and
these
place
varying
requirements
on
the
structure
of
our
investments.
In
some
cases,
particularly
in
Louisiana
or
in
certain
situations
in
New
York,
we
do
not
control the equity or management of a qualified business, but that cannot always be presented
orally or in written presentations.
30 |
 www.thesba.com
In millions of dollars
*Note: totals may not add due to rounding
Q2 2014 Actual vs. Q2 2013 Actual
31
Revenue For
The Quarter
Ended
June 30, 2014
Revenue For
The Quarter
Ended
June 30, 2013
Pretax Income
(Loss) For The
Quarter Ended
June 30, 2014
Pretax Income
(Loss) For The
Quarter Ended
June 30, 2013
ADJUSTED
EBITDA For The
Quarter Ended
June 30, 2014
ADJUSTED
EBITDA For The
Quarter Ended
June 30, 2013
Electronic
Payment
Processing
23.163
23.447
2.162
2.465
2.291
2.554
Small
Business
Finance
10.236
8.376
3.874
2.030
5.934
3.674
Managed
Technology
Solutions
4.193
4.600
0.921
1.042
1.263
1.396
All Other
0.630
0.657
(0.301)
(0.439)
(0.240)
(0.383)
Corporate
Activities
0.202
0.200
(4.091)
(1.924)
(1.920)
(1.805)
CAPCO
0.106
0.038
(0.189)
(0.293)
(0.179)
(0.283)
Interco
Eliminations
(0.402)
(0.307)
(0.087)
–
(0.087)
–
Total
38.128
37.011
2.289
2.881
7.063
5.153 |
 www.thesba.com
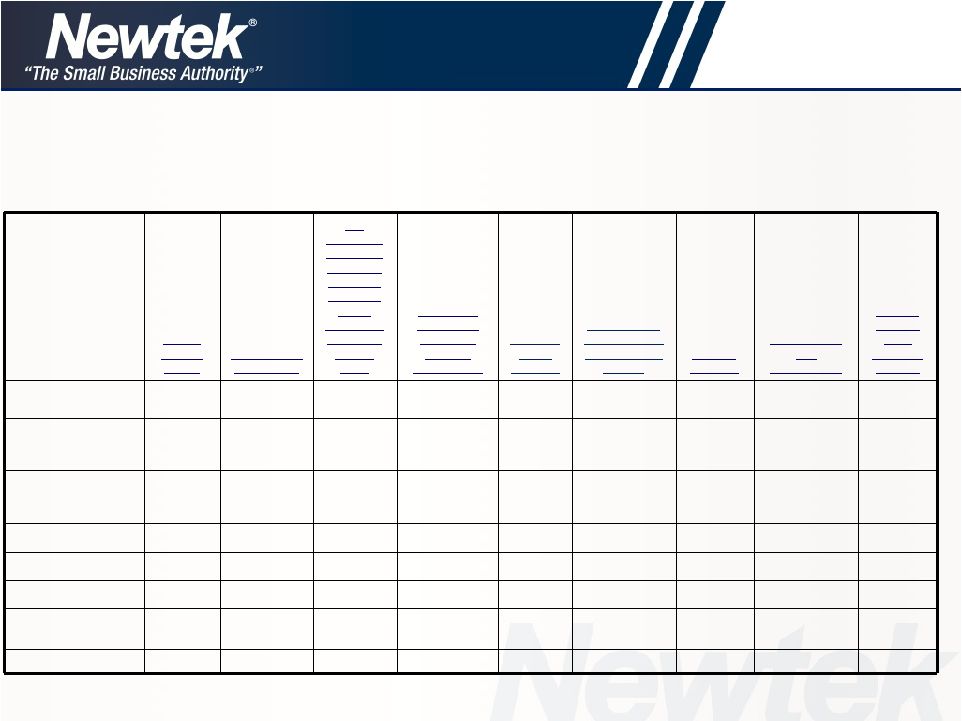
2014 Adjusted Segment Guidance*
*Note: totals may not add due to rounding
In millions of dollars
Electronic
Small
Managed
Total
Inter-
Payment
Business
Technology
All
Corporate
Business
CAPCO
Company
Processing
Finance
Solutions
Other
Activities
Segments
Segment
Eliminations
Total
Low
High
Low
High
Low
High
Low
High
Low
High
Low
High
Low
High
Low
High
2014 Full Year
Revenue
90.2
99.2
44.0
47.0
17.4
19.2
2.6
2.8
0.8
0.8
155.0
169.0
0.2
0.2
(1.2)
154.0
168.0
Pretax Income (Loss)
8.3
9.2
14.2
14.7
3.3
3.7
(1.1)
(1.1)
(10.9)
(10.7)
13.8
15.8
(1.3)
(1.3)
-
12.5
14.5
Income from tax credits
-
-
-
-
-
-
-
-
-
-
-
-
(0.1)
(0.1)
-
(0.1)
(0.1)
Net change in fair value of
credits in lieu of cash and
notes payable in credits in
lieu of cash
-
-
-
-
-
-
-
-
-
-
-
-
-
-
-
-
-
Deferred compensation
expense
-
-
0.1
0.1
0.1
-
-
-
0.6
0.5
0.9
0.7
-
-
-
0.9
0.7
Lease loss amortization
-
-
-
-
-
-
-
-
(0.3)
(0.3)
(0.3)
(0.3)
-
-
-
(0.3)
(0.3)
Interest Expense
-
-
8.5
8.3
0.1
0.1
-
-
-
-
8.6
8.4
0.2
0.2
-
8.8
8.6
Depreciation and
Amortization
0.4
0.4
1.5
1.5
1.3
1.3
0.2
0.2
0.1
0.1
3.5
3.5
-
-
-
3.5
3.5
Adjusted EBITDA
8.7
9.5
23.8
25.1
4.8
5.2
(0.9)
(0.8)
(10.5)
(10.2)
26.8
28.8
(1.4)
(1.2)
-
24.5
27.5
32
*As of 8/14/2014; consolidated pretax income guidance adjusted to reflect reversal of $1.9
million one-time non-cash charge |
 www.thesba.com
Addenda |
 www.thesba.com
Pretax
Income
(Loss)
Income from
Tax Credits
Net
Change in
Fair Value
of Credits
in Lieu of
Cash and
Notes
Payable in
Credits in
Lieu of
Cash
Other than
Temporary
Decline in
Value of
Investments
Deferred
Comp
Expense
Amortization
of 2011 Lease
Restructuring
Charge
Interest
Expense
Depreciation
and
Amortization
Second
Quarter
2014
Adjusted
EBITDA
Electronic Payment
Processing
2.162
-
-
-
0.070
-
-
0.059
2.291
Small Business
Finance
3.874
-
-
-
0.026
-
1.615
0.418
5.933
Managed
Technology
Solutions
0.921
-
-
-
(0.002)
-
0.014
0.330
1.263
All Other
(0.301)
-
-
-
0.009
-
-
0.051
(0.241)
Corporate Activities
(4.091)
-
-
-
0.271
(0.073)
1.937
0.037
(1.919)
CAPCO
(0.189)
(0.014)
0.001
-
-
-
0.023
-
(0.179)
Interco
Eliminations
(0.087)
(0.087)
Total
2.289
(0.014)
0.001
-
0.374
(0.073)
3.589
0.895
7.062
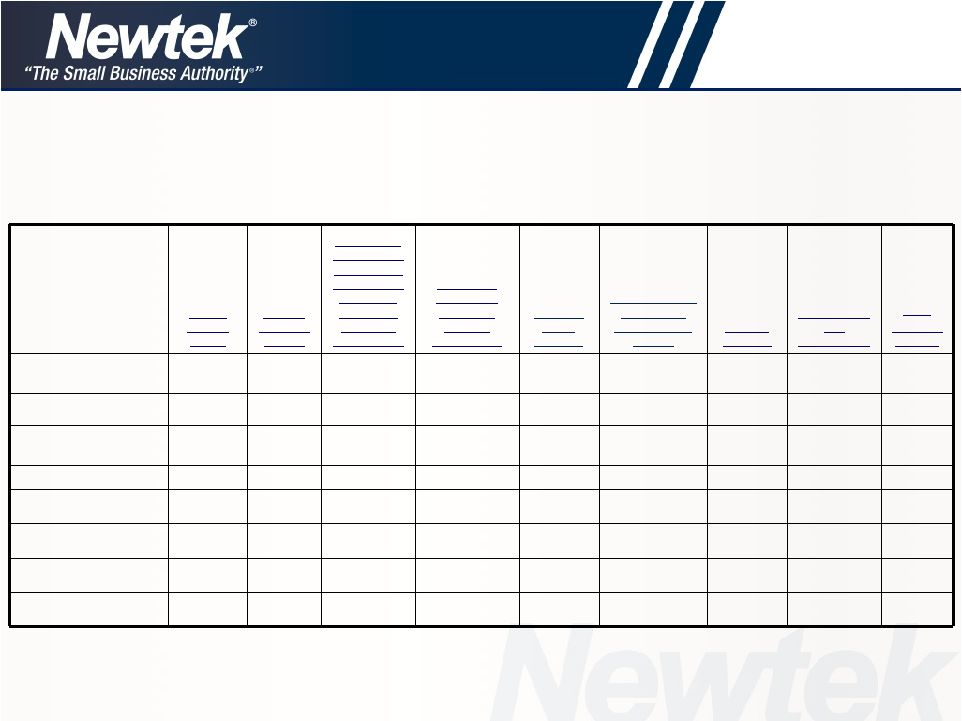
Adjusted EBITDA Reconciliation
Adjusted EBITDA Reconciliation from Pretax Income (Loss)
For the three months ended June 30, 2014
In millions of dollars
*Note: totals may not add due to rounding
34 |
 www.thesba.com
Pretax
Income
(Loss)
Income
from Tax
Credits
Net Change
in Fair Value
of Credits in
Lieu of Cash
and Notes
Payable in
Credits in
Lieu of Cash
Deferred
Comp
Expense
Amortization of
2011 Lease
Restructuring
Charge
Interest
Expense
Depreciation
and
Amortization
Second
Quarter
2013
Adjusted
EBITDA
Electronic Payment
Processing
2.465
-
-
(0.002)
-
-
0.091
2.554
Small Business Finance
2.030
-
-
0.026
-
1.323
0.295
3.674
Managed Technology
Solutions
1.042
-
-
0.012
-
0.006
0.336
1.396
All Other
(0.439)
-
-
0.006
-
-
0.050
(0.383)
Corporate Activities
(1.924)
-
-
0.143
(0.073)
0.006
0.043
(1.805)
CAPCO
(0.293)
(0.029)
(0.007)
-
-
0.045
0.001
(0.283)
Total
2.881
(0.029)
(0.007)
0.185
(0.073)
1.381
0.816
5.153
Adjusted EBITDA Reconciliation
Adjusted EBITDA Reconciliation from Pretax Income (Loss)
For the three months ended June 30, 2013
In millions of dollars
*Note: totals may not add due to rounding
35 |
 www.thesba.com
Pretax
Income
(Loss)
Income
from Tax
Credits
Net Change
in Fair Value
of Credits in
Lieu of Cash
and Notes
Payable in
Credits in
Lieu of Cash
Other than
Temporary
Decline in
Value of
Investments
Deferred
Comp
Expense
Amortization of
2011 Lease
Restructuring
Charge
Interest
Expense
Depreciation
and
Amortization
2013
Adjusted
EBITDA
Electronic Payment
Processing
8.304
-
-
-
0.019
-
-
0.358
8.681
Small Business Finance
10.143
-
-
-
0.103
-
5.568
1.242
17.055
Managed Technology
Solutions
3.564
-
-
-
0.051
-
0.094
1.316
5.025
All Other
(1.606)
-
-
-
0.035
-
-
0.202
(1.366)
Corporate Activities
(8.002)
-
-
-
0.575
(0.291)
0.027
0.161
(7.529)
CAPCO
(1.284)
(0.113)
(0.021)
0.017
-
-
0.174
0.005
(1.222)
Interco Eliminations
(0.050)
(0.051)
Total
11.069
(0.113)
(0.021)
0.017
0.784
(0.291)
5.863
3.284
20.593
Adjusted EBITDA Reconciliation
Adjusted EBITDA Reconciliation from Pretax Income (Loss)
For the year ended December 31, 2013
In millions of dollars
*Note: totals may not add due to rounding
36 |
 www.thesba.com
Adjusted Earnings Reconciliation
Adjusted Earnings Reconciliation
37
NEWTEK BUSINESS SERVICES, INC. AND SUBSIDIARIES
RECONCILIATION OF ADJUSTED PRETAX INCOME AND DILUTED EPS
FOR THE THREE AND SIX MONTHS ENDED JUNE 30, 2014
(In Thousands, except for Per Share Data)
For the three
months ended
June 30, 2014
For the six
months ended
June 30, 2014
Pretax income reconciliation:
GAAP pretax income
$
2,289
$
4,505
Add: Interest expense charge related to repayment of Summit
debt 1,905
1,905
Adjusted pretax income
$
4,194
$
6,410
Diluted EPS reconciliation:
Net income attributable to Newtek
$
1,394
$
2,785
Add: Interest expense charge related to repayment of Summit
debt 1,905
1,905
Deduct: Tax effect of interest expense charge related to
repayment of Summit debt (744)
(744)
Adjusted net income attributable to Newtek Business Services,
Inc. $
2,555
$
3,946
Weighted average common shares outstanding –
diluted
38,477
38,462
Adjusted EPS –
diluted
$
0.07
$
0.10 |