Attached files
| file | filename |
|---|---|
| EXCEL - IDEA: XBRL DOCUMENT - LendingClub Corp | Financial_Report.xls |
| EX-31.1 - EX-31.1 - LendingClub Corp | d749970dex311.htm |
| EX-31.2 - EX-31.2 - LendingClub Corp | d749970dex312.htm |
| EX-32.1 - EX-32.1 - LendingClub Corp | d749970dex321.htm |
Table of Contents
UNITED STATES
SECURITIES AND EXCHANGE COMMISSION
Washington, D.C. 20549
FORM 10-Q
(Mark One)
| x | QUARTERLY REPORT PURSUANT TO SECTION 13 OR 15(d) OF THE SECURITIES EXCHANGE ACT OF 1934 |
For the quarterly period ended June 30, 2014
or
| ¨ | TRANSITION REPORT PURSUANT TO SECTION 13 OR 15(d) OF THE SECURITIES EXCHANGE ACT OF 1934 |
For the transition period from to
Commission File Number: 000-54752
LendingClub Corporation
(Exact name of registrant as specified in its charter)
| Delaware | 51-0605731 | |
| (State or other jurisdiction of incorporation or organization) |
(I.R.S. Employer Identification No.) | |
| 71 Stevenson St., Suite 300 San Francisco, California |
94105 | |
| (Address of principal executive offices) | (Zip Code) | |
(415) 632-5600
(Registrant’s telephone number, including area code)
Indicate by check mark whether the registrant (1) has filed all reports required to be filed by Section 13 or 15(d) of the Securities Exchange Act of 1934 during the preceding 12 months (or for such shorter period that the registrant was required to file such reports), and (2) has been subject to such filing requirements for the past 90 days. Yes x No ¨
Indicate by check mark whether the registrant has submitted electronically and posted on its corporate Web site, if any, every Interactive Data File required to be submitted and posted pursuant to Rule 405 of Regulation S-T (§232.405 of this chapter) during the preceding 12 months (or for such shorter period that the registrant was required to submit and post such files). Yes x No ¨
Indicate by check mark whether the registrant is a large accelerated filer, an accelerated filer, a non-accelerated filer, or a smaller reporting company. See the definitions of “large accelerated filer,” “accelerated filer” and “smaller reporting company” in Rule 12b-2 of the Exchange Act. (Check one):
| Large accelerated filer | ¨ | Accelerated filer | ¨ | |||
| Non-accelerated filer | ¨ (Do not check if a smaller reporting company) | Smaller reporting company | x | |||
Indicate by check mark whether the registrant is a shell company (as defined in Rule 12b-2 of the Exchange Act). Yes ¨ No x
As of July 31, 2014, there were 29,703,877 shares of the registrant’s common stock outstanding.
Table of Contents
LENDINGCLUB CORPORATION
Table of Contents
Except as the context requires otherwise, as used herein, “Lending Club,” “LC,” the “Company,” “we,” “us,” and “our,” refer to LendingClub Corporation and its wholly owned subsidiaries; Springstone Financial, LLC (“Springstone”) and LC Advisors, LLC, (“LCA”). “Trust” refers to LC Trust I, an independent Delaware business trust that acquires and holds loans for the sole benefit of certain investors that purchase trust certificates issued by the Trust and that are related to underlying loans.
Cautionary Note Regarding Forward-Looking Statements
This Quarterly Report on Form 10-Q (“Report”) contains forward-looking statements within the meaning of Section 27A of the Securities Act of 1933 (“Securities Act”), as amended, and Section 21E of the Securities Exchange Act of 1934 (“Exchange Act”), as amended, that involve substantial risks and uncertainties. Those sections of the Securities Act and Exchange Act provide a “safe harbor” for forward-looking statements to encourage companies to provide prospective information about their financial performance so long as they provide meaningful, cautionary statements identifying important factors that could cause actual results to differ significantly from projected results.
All statements, other than statements of historical facts, included in this Report regarding borrowers, credit scoring, Fair Isaac Corporation (“FICO”) or other credit scores, our strategy, future operations, future financial position, future revenue, projected costs, prospects, plans, objectives of management and expected market growth are forward-looking statements. The words “anticipate,” “believe,” “continue,” “could,” “estimate,” “expect,” “intend,” “may,” “plan,” “predict,” “project,” “will,” “would” or similar expressions are intended to identify forward-looking statements, although not all forward-looking statements contain these identifying words. These forward-looking statements include, among other things, statements about:
| • | our ability to attract potential borrowers to our marketplace; |
| • | the degree to which potential borrowers apply for, are approved for and actually borrow via a loan; |
| • | the status of borrowers, the ability of borrowers to repay loans and the plans of borrowers; |
| • | interest rates and transaction fees on loans; |
| • | our ability to service loans and our ability, or the ability of third party collection agents, to pursue collection of delinquent and defaulted loans; |
| • | our ability to retain WebBank and other third party banking institution as the issuer of loans facilitated by us; |
| • | our ability to attract additional investors to the platform, to our funds, to separately managed accounts (“SMAs”) or to purchase loans; |
| • | our ability to successfully integrate our recent acquisition of Springstone; |
| • | our ability to expand the number of providers that use the products provided through Springstone; |
| • | the available functionality of a secondary market trading program; |
| • | expected rates of return provided to investors; |
| • | our financial condition and performance, including our ability to remain cash flow positive; |
| • | our ability to retain and hire competent employees and appropriately staff our operations; |
| • | our ability to prevent security breaks, disruptions in service and comparable events that could compromise the personal and confidential information held in our data systems, reduce the attractiveness of the platform or adversely impact our ability to service loans; |
| • | our ability to prevent and detect identity theft; |
| • | our ability to develop and maintain effective internal controls; |
| • | our compliance with applicable local, state and federal laws, including the Investment Advisors Act of 1940, the Investment Company Act of 1940 and other laws; and |
| • | our compliance with applicable regulations and regulatory developments. |
We may not actually achieve the plans, intentions or expectations disclosed in forward-looking statements, and you should not place undue reliance on forward-looking statements. We have included important factors in the cautionary statements included in this Report, including the “Risk Factors” section of our Annual Report on Form 10-K, for a description of certain risks that could, among other things, cause actual results or events to differ materially from forward-looking statements contained in this Report. Forward-looking statements do not reflect the potential impact of any future acquisitions, mergers, dispositions, joint ventures or investments we may make.
1
Table of Contents
You should read this Report carefully and completely and with the understanding that actual future results may be materially different from what we expect. We do not assume any obligation to update or revise any forward-looking statements, whether as a result of new information, future events or otherwise, other than as required by law.
2
Table of Contents
Condensed Consolidated Balance Sheets (Unaudited)
(in thousands, except share and per share amounts)
| June 30, 2014 | December 31, 2013 | |||||||
| ASSETS | ||||||||
| Cash and cash equivalents |
$ | 68,958 | $ | 49,299 | ||||
| Restricted cash |
20,448 | 12,208 | ||||||
| Loans at fair value (includes $1,465,090 and $1,158,302 from consolidated Trust at June 30, 2014 and December 31, 2013, respectively) |
2,326,202 | 1,829,042 | ||||||
| Accrued interest receivable (includes $13,336 and $10,061 from consolidated Trust at June 30, 2014 and December 31, 2013, respectively) |
21,244 | 15,975 | ||||||
| Property, equipment and software, net |
19,420 | 12,595 | ||||||
| Intangible assets, net |
39,077 | — | ||||||
| Goodwill |
72,679 | — | ||||||
| Other assets |
12,185 | 23,921 | ||||||
| Due from related parties |
411 | 355 | ||||||
|
|
|
|
|
|||||
| Total Assets |
$ | 2,580,624 | $ | 1,943,395 | ||||
|
|
|
|
|
|||||
| LIABILITIES | ||||||||
| Accounts payable |
$ | 3,969 | $ | 4,524 | ||||
| Accrued interest payable (includes $14,587 and $11,176 from consolidated Trust at June 30, 2014 and December 31, 2013, respectively) |
23,232 | 17,741 | ||||||
| Accrued expenses and other liabilities |
17,515 | 9,128 | ||||||
| Payable to investors |
12,659 | 3,918 | ||||||
| Notes and certificates, at fair value (includes $1,465,090 and $1,158,302 from consolidated Trust at June 30, 2014 and December 31, 2013, respectively) |
2,336,595 | 1,839,990 | ||||||
| Term loan |
49,516 | — | ||||||
|
|
|
|
|
|||||
| Total Liabilities |
2,443,486 | 1,875,301 | ||||||
|
|
|
|
|
|||||
| Commitments and contingencies (see Note 16) |
||||||||
| STOCKHOLDERS’ EQUITY | ||||||||
| Preferred stock |
$ | 173,674 | $ | 103,244 | ||||
| Common stock, $0.01 par value; 186,000,000 and 180,000,000 shares authorized at June 30, 2014 and December 31, 2013, respectively; 29,675,065 and 27,493,320 shares issued and outstanding at June 30, 2014 and December 31, 2013, respectively |
297 | 138 | ||||||
| Additional paid-in capital |
29,982 | 15,041 | ||||||
| Accumulated deficit |
(66,815 | ) | (50,329 | ) | ||||
|
|
|
|
|
|||||
| Total Stockholders’ Equity |
137,138 | 68,094 | ||||||
|
|
|
|
|
|||||
| Total Liabilities and Stockholders’ Equity |
$ | 2,580,624 | $ | 1,943,395 | ||||
|
|
|
|
|
|||||
The accompanying notes are an integral part of these condensed consolidated financial statements.
3
Table of Contents
Condensed Consolidated Statements of Operations (Unaudited)
(in thousands, except share and per share amounts)
| Three Months Ended June 30, | Six Months Ended June 30, | |||||||||||||||
| 2014 | 2013 | 2014 | 2013 | |||||||||||||
| Operating Revenue |
||||||||||||||||
| Transaction fees |
$ | 45,801 | $ | 16,393 | $ | 81,213 | $ | 29,975 | ||||||||
| Servicing fees |
1,468 | 882 | 3,248 | 1,597 | ||||||||||||
| Management fees |
1,461 | 720 | 2,555 | 1,214 | ||||||||||||
| Other (expense) revenue |
(109 | ) | 2,847 | 307 | 4,299 | |||||||||||
|
|
|
|
|
|
|
|
|
|||||||||
| Total Operating Revenue |
48,621 | 20,842 | 87,323 | 37,085 | ||||||||||||
|
|
|
|
|
|
|
|
|
|||||||||
| Net Interest Income: |
||||||||||||||||
| Total interest income |
85,212 | 41,021 | 158,260 | 73,385 | ||||||||||||
| Total interest expense |
(85,594 | ) | (41,032 | ) | (158,594 | ) | (73,357 | ) | ||||||||
|
|
|
|
|
|
|
|
|
|||||||||
| Net Interest (Expense) Income |
(382 | ) | (11 | ) | (334 | ) | 28 | |||||||||
|
|
|
|
|
|
|
|
|
|||||||||
| Fair value adjustments, loans |
(26,405 | ) | (13,047 | ) | (51,154 | ) | (22,264 | ) | ||||||||
| Fair value adjustments, notes and certificates |
26,391 | 13,055 | 51,108 | 22,241 | ||||||||||||
|
|
|
|
|
|
|
|
|
|||||||||
| Net Interest (Expense) Income after Fair Value Adjustments |
(396 | ) | (3 | ) | (380 | ) | 5 | |||||||||
|
|
|
|
|
|
|
|
|
|||||||||
| Total Net Revenue |
48,225 | 20,839 | 86,943 | 37,090 | ||||||||||||
|
|
|
|
|
|
|
|
|
|||||||||
| Operating Expenses: |
||||||||||||||||
| Sales and marketing |
19,225 | 8,410 | 39,807 | 16,117 | ||||||||||||
| Origination and servicing |
8,566 | 3,414 | 15,968 | 6,048 | ||||||||||||
| General and administrative |
28,981 | 7,233 | 47,014 | 13,103 | ||||||||||||
|
|
|
|
|
|
|
|
|
|||||||||
| Total Operating Expenses |
56,772 | 19,057 | 102,789 | 35,268 | ||||||||||||
|
|
|
|
|
|
|
|
|
|||||||||
| (Loss) Income before Provision for Income Taxes |
(8,547 | ) | 1,782 | (15,846 | ) | 1,822 | ||||||||||
| Provision for income taxes |
640 | 85 | 640 | 85 | ||||||||||||
|
|
|
|
|
|
|
|
|
|||||||||
| Net (Loss) Income |
$ | (9,187 | ) | $ | 1,697 | $ | (16,486 | ) | $ | 1,737 | ||||||
|
|
|
|
|
|
|
|
|
|||||||||
| Basic net loss per share attributable to common stockholders |
$ | (0.32 | ) | $ | — | $ | (0.58 | ) | $ | — | ||||||
| Diluted net loss per share attributable to common stockholders |
$ | (0.32 | ) | $ | — | $ | (0.58 | ) | $ | — | ||||||
| Weighted-average shares of common stock used in computing basic net loss per share |
28,985,590 | 25,117,624 | 28,451,564 | 24,471,528 | ||||||||||||
| Weighted-average shares of common stock used in computing diluted net loss per share |
28,985,590 | 37,699,888 | 28,451,564 | 37,908,644 | ||||||||||||
The accompanying notes are an integral part of these condensed consolidated financial statements.
4
Table of Contents
Condensed Consolidated Statements of Cash Flows (Unaudited)
(in thousands)
| Six Months Ended June 30, | ||||||||
| 2014 | 2013 | |||||||
| Cash flows from Operating Activities: |
||||||||
| Net (loss) income |
$ | (16,486 | ) | $ | 1,737 | |||
| Adjustments to reconcile net income to net cash provided by operating activities: |
||||||||
| Fair value adjustments of loans, notes and certificates, net |
46 | 23 | ||||||
| Change in loan servicing liability carried at fair value |
1,800 | 454 | ||||||
| Change in loan servicing asset carried at fair value |
(500 | ) | (6 | ) | ||||
| Stock-based compensation and warrant expense, net |
15,352 | 1,474 | ||||||
| Depreciation and amortization |
3,463 | 495 | ||||||
| Loss (gain) on sales of loans at fair value |
781 | (3,862 | ) | |||||
| Other, net |
123 | (68 | ) | |||||
| Purchase of whole loans held for sale |
(632,740 | ) | (114,902 | ) | ||||
| Proceeds from sales of whole loans held for sale |
631,959 | 118,764 | ||||||
| Net change in operating assets and liabilities excluding the effects of the acquisition: |
||||||||
| Accrued interest receivable |
(5,269 | ) | (3,772 | ) | ||||
| Other assets |
14,057 | (1,137 | ) | |||||
| Due from related parties |
(56 | ) | (138 | ) | ||||
| Accounts payable |
68 | 1,874 | ||||||
| Accrued interest payable |
5,491 | 4,903 | ||||||
| Accrued expenses and other liabilities |
4,048 | 693 | ||||||
|
|
|
|
|
|||||
| Net cash provided by operating activities |
22,137 | 6,532 | ||||||
|
|
|
|
|
|||||
| Cash flows from Investing Activities: |
||||||||
| Purchase of loans at fair value |
(1,002,301 | ) | (680,262 | ) | ||||
| Principal payments of loans at fair value |
451,403 | 201,100 | ||||||
| Proceeds from recoveries and sales of charged-off loans at fair value |
2,584 | 645 | ||||||
| Payments for business acquisition, net of cash acquired |
(109,464 | ) | — | |||||
| Net change in restricted cash |
(6,659 | ) | (926 | ) | ||||
| Purchase of property, equipment and software |
(9,380 | ) | (3,955 | ) | ||||
|
|
|
|
|
|||||
| Net cash used in investing activities |
(673,817 | ) | (483,398 | ) | ||||
|
|
|
|
|
|||||
| Cash flows from Financing Activities: |
||||||||
| Net change in payable to investors |
8,227 | (1,502 | ) | |||||
| Proceeds from issuance of notes and certificates |
1,001,976 | 680,205 | ||||||
| Principal payments on notes and certificates |
(451,699 | ) | (199,999 | ) | ||||
| Payments on charged-off notes and certificates from recoveries and sales of related charged off loans at fair value |
(2,564 | ) | (613 | ) | ||||
| Proceeds from term loan, net of debt discount |
49,813 | — | ||||||
| Payment for debt issuance cost |
(1,192 | ) | — | |||||
| Principal payment on term loan |
(313 | ) | — | |||||
| Proceeds from exercise of warrants to acquire common stock |
90 | 247 | ||||||
| Proceeds from issuance of Series F convertible preferred stock, net of issuance costs |
64,803 | — | ||||||
| Proceeds from stock options exercised |
2,198 | 571 | ||||||
|
|
|
|
|
|||||
| Net cash provided by financing activities |
671,339 | 478,909 | ||||||
|
|
|
|
|
|||||
| Net increase in cash and cash equivalents |
19,659 | 2,043 | ||||||
| Cash and cash equivalents, beginning of period |
49,299 | 52,551 | ||||||
|
|
|
|
|
|||||
| Cash and cash equivalents, end of period |
$ | 68,958 | $ | 54,594 | ||||
|
|
|
|
|
|||||
| Supplemental disclosure of cash flow information: |
||||||||
| Cash paid for interest |
$ | 152,679 | $ | 68,398 | ||||
| Non-cash investing activity - accrual for property, equipment and software, net |
$ | 1,094 | $ | — | ||||
| Non-cash investing and financing activity - issuance of Series F convertible preferred stock for business acquisition |
$ | 2,762 | $ | — | ||||
The accompanying notes are an integral part of these condensed consolidated financial statements.
5
Table of Contents
Notes to Condensed Consolidated Financial Statements
(Unaudited)
1. Basis of Presentation
The condensed consolidated financial statements as of June 30, 2014 and December 31, 2013 and for the three and six months ended June 30, 2014 and 2013, respectively have been prepared by LendingClub Corporation in conformity with U.S. generally accepted accounting principles (“GAAP”) for interim financial information. Accordingly, they do not include all of the information and footnotes required by GAAP for complete financial statements.
The Company did not have any items of other comprehensive income (loss) during any of the periods presented in the condensed consolidated financial statements as of and for the three and six months ended June 30, 2014 and 2013, respectively.
In the opinion of management, all necessary adjustments (including only those of a normal recurring nature) have been made for a fair presentation of the financial position, results of operations, and cash flows for the interim periods presented. The results of operations for the interim periods are not necessarily indicative of the results for the full fiscal year. The unaudited interim condensed consolidated financial statements should be read in conjunction with the audited financial statements and notes thereto for the year ended December 31, 2013.
The preparation of our condensed consolidated financial statements and related disclosures in conformity with GAAP requires management to make judgments, assumptions and estimates that affect the amounts reported in our condensed consolidated financial statements and accompanying notes. We base our estimates on historical experience and on various other factors we believe to be reasonable under the circumstances, the results of which form the basis for making judgments about the carrying values of certain assets and liabilities. These judgments, estimates and assumptions are inherently subjective in nature and actual results may differ from these estimates and assumptions, and the differences could be material.
Certain prior period amounts have been reclassified to conform to the current presentation. These reclassifications had no impact on previously reported results of consolidated operations.
On April 15, 2014, the Board of Directors approved a 2 for 1 equity stock split in which each outstanding share of each series or class of equity capital stock was split into two outstanding shares of such series or class of equity capital stock. All share and per share data has been adjusted to reflect this stock split.
On April 17, 2014, we acquired all the outstanding limited liability company interests of Springstone. As such, our condensed consolidated financial statements include Springstone’s results of operations and financial position from this date (see Note 7 – Springstone Acquisition).
2. Summary of Significant Accounting Policies
Our significant accounting policies are included in Note 2 – Summary of Significant Accounting Policies in our Annual Report on Form 10-K for the year ended December 31, 2013. There have been no changes to these accounting policies during the first six months of 2014 except for the application of the acquisition method in accounting for a business combination, the accounting for intangible assets, including goodwill and the accounting for servicing assets and liabilities, as described below.
Goodwill and Intangible Assets
Goodwill represents the fair value of acquired businesses in excess of the fair value of the individually identified net assets acquired. Goodwill is not amortized but is tested for impairment annually or whenever indications of impairment exist. Our annual impairment testing date is April 1. We can elect to qualitatively assess goodwill for impairment if it is more likely than not that the fair value of a reporting unit (defined as business for which financial information is available and reviewed regularly by management) exceeds its carrying value. A qualitative assessment may consider macroeconomic and other industry-specific factors, such as trends in short-term and long-term interest rates and the ability to access capital, or company specific factors such as market capitalization in excess of net assets, trends in revenue generating activities and merger or acquisition activity.
If we elect to bypass qualitatively assessing goodwill, or it is not more likely than not that the fair value of a reporting unit exceeds its carrying value, management will estimate the fair values of our reporting units and compare them to their carrying values. The estimated fair values of the reporting units will generally be established using an income approach based on a discounted cash flow model or a market approach which compares each reporting unit to comparable companies in their respective industries.
Intangible assets are amortized over their useful lives in a manner that best reflects their economic benefit. Intangible assets are reviewed for impairment whenever events or changes in circumstances indicate that the carrying amount of such assets may not be recoverable. We do not have any indefinite-lived intangible assets.
6
Table of Contents
Servicing Asset/Liability
For whole loans sold to unrelated third party purchasers with servicing retained, we use a discounted cash flow model to estimate the fair value of the loan servicing asset or liability which considers the contractual servicing fee revenue we earn on the sold loans, an estimated market servicing rate to service such loans, the current principal balances of the loans and projected servicing revenues over the remaining terms of the loans. We record servicing assets and liabilities at their estimated fair values at the time the loans are sold. Changes in the estimated fair value of servicing assets and liabilities are reported in “Servicing Fees” in the period in which the change occurs. Servicing assets and liabilities are recorded in “Other Assets” and “Accrued Expenses and Other Liabilities”, respectively, on the condensed consolidated balance sheets.
3. Fair Value of Financial Instruments Measured at Fair Value
We determined the fair values of loans, notes and certificates and servicing assets and liabilities using inputs and methods that are categorized in the fair value hierarchy, as follows (in thousands):
| Level 1 Inputs | Level 2 Inputs | Level 3 Inputs | Fair Value | |||||||||||||
| June 30, 2014 |
||||||||||||||||
| Assets |
||||||||||||||||
| Loans |
$ | — | $ | — | $ | 2,326,202 | $ | 2,326,202 | ||||||||
| Servicing asset |
— | — | 1,034 | 1,034 | ||||||||||||
|
|
|
|
|
|
|
|
|
|||||||||
| Total Assets |
$ | — | $ | — | $ | 2,327,236 | $ | 2,327,236 | ||||||||
|
|
|
|
|
|
|
|
|
|||||||||
| Liabilities |
||||||||||||||||
| Notes and certificates |
$ | — | $ | — | $ | 2,336,595 | $ | 2,336,595 | ||||||||
| Servicing liability |
— | — | 2,736 | 2,736 | ||||||||||||
|
|
|
|
|
|
|
|
|
|||||||||
| Total Liabilities |
$ | — | $ | — | $ | 2,339,331 | $ | 2,339,331 | ||||||||
|
|
|
|
|
|
|
|
|
|||||||||
| December 31, 2013 |
||||||||||||||||
| Assets |
||||||||||||||||
| Loans |
$ | — | $ | — | $ | 1,829,042 | $ | 1,829,042 | ||||||||
| Servicing asset |
— | — | 534 | 534 | ||||||||||||
|
|
|
|
|
|
|
|
|
|||||||||
| Total Assets |
$ | — | $ | — | $ | 1,829,576 | $ | 1,829,576 | ||||||||
|
|
|
|
|
|
|
|
|
|||||||||
| Liabilities |
||||||||||||||||
| Notes and certificates |
$ | — | $ | — | $ | 1,839,990 | $ | 1,839,990 | ||||||||
| Servicing liability |
— | — | 936 | 936 | ||||||||||||
|
|
|
|
|
|
|
|
|
|||||||||
| Total Liabilities |
$ | — | $ | — | $ | 1,840,926 | $ | 1,840,926 | ||||||||
|
|
|
|
|
|
|
|
|
|||||||||
Financial instruments are categorized in the Level 3 valuation hierarchy based on the significance of unobservable factors in the overall fair value measurement. Our fair value approach for Level 3 instruments primarily uses unobservable inputs, but may also include observable, actively quoted components derived from external sources. As a result, the realized and unrealized gains and losses for assets and liabilities within the Level 3 category presented in the tables below may include changes in fair value that were attributable to both observable and unobservable inputs.
Loans, Notes and Certificates
We use fair value measurements to record fair value adjustments to loans and the related notes and certificates that are recorded at fair value on a recurring basis. Loans and the related notes and certificates do not trade in an active market with readily observable prices. Accordingly, the fair value of loans and the related notes and certificates are determined using a discounted cash flow methodology utilizing assumptions market participants use for credit losses, changes in the interest rate environment and other factors. Fair value measurements of our loans and the related notes and certificates use significant unobservable inputs and, accordingly, we classify them as Level 3.
At June 30, 2014 and December 31, 2013, loans and notes and certificates (in thousands) were:
| Loans | Notes and Certificates | |||||||||||||||
| June 30, 2014 | December 31, 2013 | June 30, 2014 | December 31, 2013 | |||||||||||||
| Aggregate principal balance outstanding |
$ | 2,351,515 | $ | 1,849,042 | $ | 2,361,902 | $ | 1,859,982 | ||||||||
| Fair value adjustments |
(25,313 | ) | (20,000 | ) | (25,307 | ) | (19,992 | ) | ||||||||
|
|
|
|
|
|
|
|
|
|||||||||
| Fair Value |
$ | 2,326,202 | $ | 1,829,042 | $ | 2,336,595 | $ | 1,839,990 | ||||||||
|
|
|
|
|
|
|
|
|
|||||||||
Loans facilitated by Springstone are held by the issuing bank on and after origination and are therefore not recorded on our condensed consolidated balance sheet.
7
Table of Contents
Loan Servicing Rights
We use fair value measurements to record fair value adjustments to loan servicing rights that are recorded at fair value on a recurring basis. Loan servicing rights do not trade in an active market with readily observable prices. Accordingly, the fair value of loan servicing rights are determined using a discounted cash flow methodology utilizing assumptions market participants use for adequate servicing compensation, credit losses, discount rates and contractual fee income. Fair value measurements of our loan servicing rights use significant unobservable inputs and, accordingly, we classify them as Level 3.
Significant Unobservable Inputs
The following table presents quantitative information about the significant unobservable inputs used for our Level 3 fair value measurements at June 30, 2014 and December 31, 2013:
| June 30, 2014 | December 31, 2013 | ||||||||||||||||||||||||
| Range of Inputs | Range of Inputs | ||||||||||||||||||||||||
| Unobservable Input | Minimum | Maximum | Minimum | Maximum | |||||||||||||||||||||
| Loans, notes & certificates and servicing asset/liability |
Discount rate | 5.6% | 17.0% | 5.9% | 15.9% | ||||||||||||||||||||
| Loans, notes & certificates and servicing asset/liability |
Net cumulative expected loss | 2.0% | 21.9% | 2.1% | 23.7% | ||||||||||||||||||||
| Servicing asset/liability |
Market servicing rate (% per annum on loan |
0.5% | 0.5% | 0.4% | 0.4% | ||||||||||||||||||||
The valuation technique used for our Level 3 assets and liabilities is described below.
Loans, Notes and Certificates
Discounted cash flow – Discounted cash flow valuation techniques generally consist of developing an estimate of future cash flows that are expected to occur over the life of a financial instrument and then discounting those cash flows at a rate of return that results in the fair value amount.
Significant unobservable inputs presented in the table above are those we consider significant to the estimated fair values of the Level 3 assets and liabilities. We consider unobservable inputs to be significant, if by their exclusion, the estimated fair value of the Level 3 asset or liability would be impacted by a significant percentage change, or based on qualitative factors such as the nature of the instrument and significance of the unobservable inputs relative to other inputs used within the valuation. The following is a description of the significant unobservable inputs provided in the table.
Discount rate – Discount rate is a rate of return used to discount future expected cash flows to arrive at a present value, the fair value, of the loans, notes and certificates. The discount rates for the projected net cash flows of loans are our estimates of the rates of return that investors in unsecured consumer credit obligations would require when investing in the various credit grades of loans. The discount rates for the projected net cash flows of the notes and certificates are our estimates of the rates of return that investors in unsecured consumer credit obligations would require when investing in notes and certificates with cash flows dependent on specific grades of loans. Discount rates for existing loans, notes and certificates are adjusted to reflect the time value of money. A risk premium component is implicitly included in the discount rates to reflect the amount of compensation market participants require due to the uncertainty inherent in the instruments’ cash flows resulting from risks such as credit and liquidity.
Net cumulative expected loss – Net cumulative expected loss is an estimate of the net cumulative principal payments that will not be repaid over the entire life of a loan, note or certificate, expressed as a percentage of the original principal amount of the loan, note or certificate. The estimated net cumulative loss is the sum of the net losses estimated to occur each month of the life of a new loan, note or certificate. Therefore, the total net losses estimated to occur over the remaining maturity of existing loans, notes and certificates are less than the estimated net cumulative losses of comparable new loans, notes and certificates. A given month’s estimated net losses are a function of two variables:
| (i) | estimated default rate, which is an estimate of the probability of not collecting the remaining contractual principal amounts owed and, |
| (ii) | estimated net loss severity, which is the percentage of contractual principal cash flows lost in the event of a default, net of the average net recovery, expected to be received on a defaulted loan, note or certificate. |
Our obligation to pay principal and interest on any note or certificate is equal to the pro-rata portion of the payments, if any, received on the related loan subject to applicable fees. The gross effective interest rate associated with notes or certificates is the same as the interest rate paid on the underlying loan. At June 30, 2014, the discounted cash flow methodology used to estimate the notes’ and certificates’ fair values uses the same projected net cash flows as their related loan. The discount rates for the projected net cash flows of the notes and certificates are our estimates of the rates of return, including risk premiums (if significant) that investors in unsecured consumer credit obligations would require when investing in notes and certificates with cash flows dependent on specific credit grades of loans.
8
Table of Contents
The following table presents additional information about Level 3 loans, notes and certificates measured at fair value on a recurring basis for the six months ended June 30, 2014 (in thousands):
| Loans | Notes and Certificates |
|||||||
| Fair value at December 31, 2013 |
$ | 1,829,042 | $ | 1,839,990 | ||||
| Purchases of loans |
1,634,260 | — | ||||||
| Issuances of notes and certificates |
— | 1,001,976 | ||||||
| Principal payments |
(451,403 | ) | (451,699 | ) | ||||
| Whole loan sales |
(631,959 | ) | — | |||||
| Recoveries and sales of charged-off loans |
(2,584 | ) | (2,564 | ) | ||||
|
|
|
|
|
|||||
| Carrying value before fair value adjustments |
2,377,356 | 2,387,703 | ||||||
| Fair value adjustments, included in earnings |
(51,154 | ) | (51,108 | ) | ||||
|
|
|
|
|
|||||
| Fair value at June 30, 2014 |
$ | 2,326,202 | $ | 2,336,595 | ||||
|
|
|
|
|
|||||
At June 30, 2014, outstanding loans underlying notes and certificates have original terms between 12 months and 60 months and are paid monthly with fixed interest rates ranging from 5.42% to 29.90% and various maturity dates through June 2019.
The fair value of loans and the related notes and certificates are determined using a discounted cash flow model utilizing estimates for credit losses, changes in the interest rate environment, and other factors. For notes and certificates, we also consider risk factors such as our ability to operate on a cash-flow positive basis and liquidity position. The majority of fair value adjustments included in earnings is attributable to changes in estimated instrument-specific future credit losses. All fair valuation adjustments were related to Level 3 instruments for the six months ended June 30, 2014 and 2013. A specific loan that is projected to have higher future default losses than previously estimated has lower expected future cash flows over its remaining life, which reduces its estimated fair value. Conversely, a specific loan that is projected to have lower future default losses than previously estimated has increased expected future cash flows over its remaining life, which increases its fair value. Because the payments to holders of notes and certificates directly reflect the payments received on loans, a reduction or increase of the expected future payments on loans will decrease or increase the estimated fair values of the related notes and certificates. Expected losses and actual loan charge-offs on loans are offset to the extent that the loans are financed by notes and certificates that absorb the related loan losses.
The fair value adjustments for loans were largely offset by the fair value adjustments of the notes and certificates due to the member payment dependent design of the notes and certificates and because the total principal balances of the loans were very close to the combined principal balances of the notes and certificates.
We place loans on non-accrual status once they are 120 days past due or if the borrower has filed for bankruptcy or is deceased. At June 30, 2014, we had 1,032 loans that were 90 days or more past due which had a total outstanding principal balance of $11.9 million, aggregate adverse fair value adjustments totaling $10.9 million and an aggregate fair value of $1.0 million. At June 30, 2014, we had 42 loans that were over 120 days past due and classified as non-accrual loans, which had a total outstanding principal balance of $0.5 million, aggregate adverse fair value adjustments totaling $0.4 million and an aggregate fair value of $0.1 million.
At December 31, 2013, we had 989 loans that were 90 days or more past due which had a total outstanding principal balance of $10.2 million, aggregate adverse fair value adjustments totaling $9.1 million and an aggregate fair value of $1.1 million. At December 31, 2013, we had 111 loans that were over 120 days past due and classified as non-accrual loans, which had a total outstanding principal balance of $1.1 million, aggregate adverse fair value adjustments totaling $0.9 million and an aggregate fair value of $0.2 million.
Loan Servicing Rights
Discounted cash flow – Discounted cash flow valuation techniques generally consist of developing an estimate of future cash flows that are expected to occur over the life of a financial instrument and then discounting those cash flows at a rate of return that results in the fair value amount.
Significant unobservable inputs presented in the table above are those we consider significant to the estimated fair values of the Level 3 assets and liabilities. We consider unobservable inputs to be significant, if by their exclusion, the estimated fair value of the Level 3 asset or liability would be impacted by a significant percentage change, or based on qualitative factors such as the nature of the instrument and significance of the unobservable inputs relative to other inputs used within the valuation. The following is a description of the significant unobservable inputs provided in the table.
9
Table of Contents
Market servicing rate – The Company estimates an adequate servicing compensation assumption as a measure of what a market participant would earn to service the loans that we sell to third parties. The Company estimated this market servicing rate based on observable market rates for other loan types in the industry, adjusted for the unique loan attributes that are present in such loans the Company sells (i.e., unsecured fixed rate fully amortizing loans, ACH loan payments, intermediate terms, prime credit grades and sizes) and a market servicing benchmarking analysis performed by an independent valuation firm.
Discount rate – Discount rate is a rate of return used to discount future expected cash flows to arrive at a present value, the fair value, of the loan servicing rights. The discount rates for the projected net cash flows of loan servicing rights are our estimates of the rates of return that investors in servicing rights for unsecured consumer credit obligations would require for the various credit grades of the underlying loans. Discount rates for servicing rights on existing loans are adjusted to reflect the time value of money. A risk premium component is implicitly included in the discount rates to reflect the amount of compensation market participants require due to the uncertainty inherent in the instruments’ cash flows resulting from risks such as credit and liquidity.
Net cumulative expected loss – Net cumulative expected loss is an estimate of the net cumulative principal payments that will not be repaid over the entire life of a loan expressed as a percentage of the original principal amount of the loan. The estimated net cumulative loss is the sum of the net losses estimated to occur each month of the life of a new loan. A given month’s estimated net losses are a function of two variables:
| (i) | estimated default rate, which is an estimate of the probability of not collecting the remaining contractual principal amounts owed and, |
| (ii) | estimated net loss severity, which is the percentage of contractual principal cash flows lost in the event of a default, net of the average net recovery, expected to be received on a defaulted loan. |
The following table presents additional information about Level 3 servicing assets and liabilities measured at fair value on a recurring basis for the six months ended June 30, 2014 (in thousands):
| Servicing Assets |
Servicing Liabilities |
|||||||
| Fair value at December 31, 2013 |
$ | 534 | $ | 936 | ||||
| Additions |
1,159 | 1,655 | ||||||
| Changes in fair value due to: |
||||||||
| Realization of expected cash flows |
(286 | ) | (560 | ) | ||||
| Changes in market inputs or assumptions used in the valuation model |
(373 | ) | 705 | |||||
|
|
|
|
|
|||||
| Fair value at June 30, 2014 |
$ | 1,034 | $ | 2,736 | ||||
|
|
|
|
|
|||||
At June 30, 2014, outstanding loans underlying loan servicing rights have original terms between 36 months and 60 months and are paid monthly with fixed interest rates ranging from 6.00% to 26.06% and various maturity dates through June 2019.
Significant Recurring Level 3 Fair Value Asset and Liability Input Sensitivity
The discounted cash flow valuation technique that we use to determine the fair value of our Level 3 loans, notes and certificates requires determination of relevant inputs and assumptions, some of which represent significant unobservable inputs as described above. Accordingly, changes in these unobservable inputs may have a significant impact on fair value. Certain of these unobservable inputs will (in isolation) have a directionally consistent impact on the fair value of the instrument for a given change in that input. Alternatively, the fair value of the instrument may move in an opposite direction for a given change in another input. For example, increases in the discount rates and estimated net cumulative loss rates each will reduce the estimated fair value of loans, notes and certificates. When multiple inputs are used within the valuation technique of a loan, note or certificate, a change in one input in a certain direction may be offset by an opposite change in another input.
The discounted cash flow valuation technique we use determine the fair value of Level 3 loan servicing rights requires certain significant unobservable inputs including adequate servicing compensation, net cumulative loss rates, and discount rates. An increase in any of these unobservable inputs will reduce the fair value of the loan servicing rights and alternatively, a decrease in any one of these inputs would result in the loan servicing rights increasing in value.
10
Table of Contents
4. Fair Value of Financial Instruments Not Measured at Fair Value on a Recurring Basis
The following are descriptions of the valuation methodologies used for estimating the fair value of financial instruments not recorded at fair value on a recurring basis in the balance sheet; these financial instruments are carried at historical cost or amortized cost in the condensed consolidated balance sheets.
| • | Short-term financial assets: Short-term financial assets include cash and cash equivalents, restricted cash, accrued interest receivable, and other assets. These assets are carried at historical cost. The carrying amount approximates fair value due to the short term nature of the financial instruments. |
| • | Short-term financial liabilities: Short-term financial liabilities include accounts payable, accrued interest payable, other accrued expenses and payables to investors. These liabilities are carried at historical cost. The carrying amount approximates fair value due to the short term nature of the financial instruments. |
| • | Term Loan: Based on the frequent interest reset features of the term loan, the Company considers the carrying value of the term loan to approximate its fair value as of June 30, 2014. |
5. Property, Equipment and Software, net
Property, equipment and software consist of the following (in thousands):
| June 30, 2014 | December 31, 2013 | |||||||
| Internally developed software |
$ | 8,926 | $ | 4,188 | ||||
| Computer equipment |
6,291 | 4,019 | ||||||
| Leasehold improvements |
3,931 | 2,700 | ||||||
| Software |
2,262 | 913 | ||||||
| Furniture and fixtures |
1,912 | 836 | ||||||
| Construction in progress |
493 | 1,978 | ||||||
| Other |
— | 26 | ||||||
|
|
|
|
|
|||||
| Total property, equipment and software |
23,815 | 14,660 | ||||||
| Accumulated depreciation and amortization |
(4,395 | ) | (2,065 | ) | ||||
|
|
|
|
|
|||||
| Property, equipment and software, net |
$ | 19,420 | $ | 12,595 | ||||
|
|
|
|
|
|||||
Depreciation and amortization expense on property, equipment and software for the three months ended June 30, 2014 and 2013 was $1.3 million and $0.3 million, respectively. Depreciation and amortization expense on property, equipment and software for the six months ended June 30, 2014 and 2013 was $2.3 million and $0.5 million, respectively.
11
Table of Contents
6. Other Assets
Other assets consist of the following (in thousands):
| June 30, 2014 | December 31, 2013 | |||||||
| Prepaid expenses |
$ | 3,666 | $ | 3,546 | ||||
| Prepaid compensation |
3,281 | — | ||||||
| Accounts receivable |
1,496 | 439 | ||||||
| Debt issuance costs, net |
1,092 | — | ||||||
| Loan servicing assets at fair value |
1,034 | 534 | ||||||
| Receivable from investors |
536 | 18,116 | ||||||
| Tenant improvement receivable |
376 | 504 | ||||||
| Deposits |
216 | 193 | ||||||
| Other |
488 | 589 | ||||||
|
|
|
|
|
|||||
| Total other assets |
$ | 12,185 | $ | 23,921 | ||||
|
|
|
|
|
|||||
7. Springstone Acquisition
On April 17, 2014, we acquired all of the outstanding limited liability company interests of Springstone (the “Acquisition”). As a result of the closing of the acquisition, Springstone is now a wholly owned subsidiary of Lending Club.
Springstone facilitates financing options for consumers looking to finance education or private medical expenses through an active network of over 3,300 aggregate schools and healthcare providers, as of August 1, 2014 on behalf of two issuing banks. Springstone earns fee revenue from providers for facilitating loans to their customers and/or transaction fees from the issuing banks. The acquisition of Springstone expands the services we offer. We have included the financial results of Springstone in the condensed consolidated financial statements from the date of acquisition.
Under the terms of the purchase agreement, the sellers received at the closing an aggregate of $113 million in cash and $25 million worth of shares of Lending Club’s Series F Preferred Stock (the “Share Consideration”). In connection with the acquisition, we also paid $2.4 million for transaction costs incurred by Springstone. For accounting purposes the purchase price was $111.9 million which was comprised of $109.1 million in cash and $2.8 million of Share Consideration. Additionally, a total of $25.6 million comprised of $22.1 million of Share Consideration and $3.5 million of cash was placed in a third party escrow, and is subject to certain vesting and forfeiture conditions applicable to certain key continuing employees over a three-year period from the closing. This will be accounted for as a compensation arrangement and expensed over the three-year vesting period.
The cash portion of the consideration was funded by a combination of cash from Lending Club and proceeds from a debt financing and Series F preferred stock financing (see Note 10 – Term Loan and Note 11 – Stockholders’ Equity—Convertible Preferred Stock).
We have completed the allocation of the purchase price to acquired assets and liabilities with the exception of finalizing the determination of certain contingent liabilities and the finalization of a revenue refund liability, any deferred tax asset or liability and the net working capital balance as of the acquisition date. The preliminary purchase price allocation is as follows (in thousands):
| Fair Value | ||||
| Assets: |
||||
| Cash |
$ | 2,256 | ||
| Restricted cash |
1,581 | |||
| Property, equipment and software |
367 | |||
| Other assets |
512 | |||
| Identified intangible assets |
40,200 | |||
| Goodwill |
72,679 | |||
| Liabilities: |
||||
| Accounts payable |
239 | |||
| Accrued expenses and other liabilities |
5,449 | |||
|
|
|
|||
| Total purchase consideration |
$ | 111,907 | ||
|
|
|
|||
The goodwill balance is primarily attributed to expected operational synergies, the assembled workforce, and the future development initiatives of the assembled workforce. Goodwill is expected to be deductible for U.S. income tax purposes.
12
Table of Contents
The amounts of revenue and earnings(losses) of Springstone included in the Company’s condensed consolidated statement of operations from the acquisition date of April 17, 2014 to June 30, 2014 were $4.7 million and $(1.7) million, respectively. We have recognized acquisition-related costs of $1.1 million and $2.3 million for the three and six months ended June 30, 2014, respectively and have reported this in general and administrative expense. We did not recognize acquisition-related costs for the three and six months ended June 30, 2013.
The following pro forma financial information summarizes the combined results of operations for the Company and Springstone, as though the companies were combined as of January 1, 2013. These pro forma results have been prepared for comparative purposes only and do not purport to be indicative of the results of operations which would have resulted had the acquisition occurred as of January 1, 2013, nor is it indicative of future operating results. The pro forma results presented include interest expense on the debt financing, amortization of acquired intangible assets and compensation expense related to the post-acquisition compensation arrangements entered into with the continuing employees (in thousands):
| Three Months Ended June 30, | Six Months Ended June 30, | |||||||||||||||
| 2014 | 2013 | 2014 | 2013 | |||||||||||||
| Total Net Revenue |
$ | 48,720 | $ | 24,851 | $ | 92,234 | $ | 44,462 | ||||||||
| Net Loss (1) |
$ | (7,470 | ) | $ | (1,889 | ) | $ | (15,178 | ) | $ | (14,766 | ) | ||||
| Basic net loss per share attributable to common stockholders |
$ | (0.26 | ) | $ | (0.08 | ) | $ | (0.53 | ) | $ | (0.60 | ) | ||||
| Diluted net loss per share attributable to common stockholders |
$ | (0.26 | ) | $ | (0.08 | ) | $ | (0.53 | ) | $ | (0.60 | ) | ||||
| (1) | Net loss for the six months ended June 30, 2013 includes $8.6 million of one-time acquistion-related costs and compensation expenses. |
8. Goodwill and Other Intangible Assets
Goodwill
Goodwill consisted of the following (in thousands):
| Balance at December 31, 2013 |
$ | — | ||
| Acquisition of Springstone |
72,679 | |||
|
|
|
|||
| Balance at June 30, 2014 |
$ | 72,679 | ||
|
|
|
There was no impairment of goodwill during both the three and six months ended June 30, 2014.
Intangible Assets
Intangible assets as of June 30, 2014 are as follows (in thousands):
| June 30, 2014 | ||||||||||||||||
| Gross | Accumulated | Net | Remaining | |||||||||||||
| Carrying Value | Amortization | Carrying Value | Useful Life | |||||||||||||
| Customer relationships |
$ | 39,500 | $ | (1,066 | ) | $ | 38,434 | 13.8 | ||||||||
| Technology |
400 | (27 | ) | 373 | 2.8 | |||||||||||
| Brand name |
300 | (30 | ) | 270 | 1.8 | |||||||||||
|
|
|
|
|
|
|
|||||||||||
| Total intangible assets subject to amortization |
$ | 40,200 | $ | (1,123 | ) | $ | 39,077 | 13.6 | ||||||||
|
|
|
|
|
|
|
|||||||||||
The customer relationships intangible asset is being amortized on an accelerated basis over a 14 year period. The technology and brand name intangible assets are being amortized on a straight line basis over 3 and 2 year periods, respectively. Amortization expense associated with intangible assets for both the three and six months ended June 30, 2014 was $1.1 million.
13
Table of Contents
The expected future amortization expense for intangible assets as of June 30, 2014 is as follows (in thousands):
| Remainder of 2014 |
$ | 1,652 | ||
| 2015 |
5,533 | |||
| 2016 |
4,779 | |||
| 2017 |
4,265 | |||
| 2018 |
3,856 | |||
| Thereafter |
18,992 | |||
|
|
|
|||
| Total |
$ | 39,077 | ||
|
|
|
9. Accrued Expenses and Other Liabilities
Accrued expenses and other liabilities consist of the following (in thousands):
| June 30, 2014 | December 31, 2013 | |||||||
| Accrued compensation |
$ | 5,741 | $ | 5,243 | ||||
| Accrued service fees |
4,441 | 2,057 | ||||||
| Loan servicing liability at fair value |
2,736 | 936 | ||||||
| Contingent liabilities |
1,830 | — | ||||||
| Deferred rent |
959 | 653 | ||||||
| Deferred tax liability |
640 | — | ||||||
| Transaction fee refund reserve |
522 | — | ||||||
| Other accrued expenses |
646 | 239 | ||||||
|
|
|
|
|
|||||
| Total accrued expenses and other liabilities |
$ | 17,515 | $ | 9,128 | ||||
|
|
|
|
|
|||||
10. Term Loan
In connection with the Springstone acquisition, Lending Club entered into a Credit and Guaranty Agreement (the “Credit Agreement”) with a series of banks (the “Lenders”) on April 16, 2014, under which the Lenders made a $50.0 million term loan to Lending Club (the “Term Loan”). In connection with the Credit Agreement, Lending Club entered into a Pledge and Security Agreement with Morgan Stanley Senior Funding, Inc. as Collateral Agent (the “Pledge and Security Agreement”).
The Term Loan matures on April 16, 2017 and requires principal payments of $312,500 per quarter, with the remaining then unpaid principal amount payable at maturity. The Term Loan can be prepaid at any time without premium or penalty, subject to a minimum prepayment of $1.0 million. The Term Loan is required to be prepaid in certain circumstances, including upon sales of assets other than loans and upon the issuance of debt or redeemable capital stock.
Borrowings under the Credit Agreement bear interest, which at the option of the Company may be either (a) a floating base rate tied to an underlying index plus an additional 1.25% per annum or (b) a Eurocurrency rate (for an interest period of one, two, three or six months) plus an additional 2.25% per annum (a “Eurocurrency Rate Loan”). The Term Loan was originally tied to the prime rate but was subsequently converted to a Eurocurrency rate. The weighted average interest rate on the Term Loan was 2.75% for both the three and six months ended June 30, 2014.
The Term Loan is also guaranteed by Springstone and LCA and is secured by a first priority lien and security interest in substantially all of the Company’s and its subsidiaries’ assets, subject to certain exceptions.
The Credit Agreement and Pledge and Security Agreement contain certain affirmative and negative covenants applicable to the Company and its subsidiaries. These include restrictions on the Company’s ability to make certain restricted payments, including restrictions on the Company’s ability to pay dividends, incur additional indebtedness, place liens on assets, merge or consolidate, make investments and enter into certain affiliate transactions. The Credit Agreement also requires Lending Club to maintain a maximum total leverage ratio (as defined in the Credit Agreement) of less than 5.50:1 initially, and decreasing to 3.50:1 after September 30, 2015 (on a consolidated basis). The total leverage ratio as of June 30, 2014 was 2.59.
As of June 30, 2014, the carrying value of the Term Loan was $49.5 million. At June 30, 2014, the current portion of the Term Loan was $1.2 million and the noncurrent portion of the outstanding balance was $48.3 million. We did not have a Term Loan outstanding balance at December 31, 2013.
14
Table of Contents
In connection with the Term Loan, we capitalized $1.2 million of debt issuance costs. As of June 30, 2014, the net balance of debt issuance costs was $1.1 million. Interest expense on the Term Loan, including amortization of debt issuance cost, was $0.1 million during both the three and six months ended June 30, 2014. We did not have interest expense on the Term Loan for the three and six months ended June 30, 2013.
Future principal payments on the Term Loan are payable as follows (in thousands):
| Remainder of 2014 |
$ | 625 | ||
| 2015 |
1,250 | |||
| 2016 |
1,250 | |||
| 2017 |
46,563 | |||
|
|
|
|||
| Total principal payments |
49,688 | |||
| Unamortized discount, net |
(172 | ) | ||
|
|
|
|||
| Total |
$ | 49,516 | ||
|
|
|
11. Stockholders’ Equity
Convertible Preferred Stock (in thousands, except share amounts)
Preferred stock is issuable in series, and the Board of Directors is authorized to determine the rights, preferences and terms of each series. The following table provides details regarding each series of preferred stock authorized by the Board of Directors. The outstanding shares of convertible preferred stock are not mandatorily redeemable. A description of the preferred stock including conversion, liquidation preference, dividends and voting rights are included in Note 9 – Stockholders’ Equity in the Company’s Annual Report on Form 10-K for the year ended December 31, 2013, with the exception of Series F Preferred stock which is described below.
| June 30, 2014 |
December 31, 2013 |
|||||||
| Preferred stock, $0.01 par value; 125,307,087 and 123,235,032 total shares authorized at June 30, 2014 and December 31, 2013, respectively: |
||||||||
| Series A convertible preferred stock, 33,825,798 and 34,012,550 shares designated at June 30, 2014 and December 31, 2013, respectively; 33,050,172 shares issued and outstanding at June 30, 2014 and December 31, 2013; aggregate liquidation preference of $17,599 at June 30, 2014 and December 31, 2013. |
$ | 17,402 | $ | 17,402 | ||||
| Series B convertible preferred stock, 32,788,650 and 32,821,052 shares designated at June 30, 2014 and December 31, 2013, respectively; 32,788,650 shares issued and outstanding at June 30, 2014 and December 31, 2013; aggregate liquidation preference of $12,268 at June 30, 2014 and December 31, 2013. |
12,164 | 12,164 | ||||||
| Series C convertible preferred stock, 31,243,218 shares designated at June 30, 2014 and December 31, 2013; 31,243,218 shares issued and outstanding at June 30, 2014 and December 31, 2013; aggregate liquidation preference of $24,490 at June 30, 2014 and December 31, 2013. |
24,388 | 24,388 | ||||||
| Series D convertible preferred stock, 18,015,356 shares designated at June 30, 2014 and December 31, 2013; 18,015,356 shares issued and outstanding at June 30, 2014 and December 31, 2013; aggregate liquidation preference of $32,044 at June 30, 2014 and December 31, 2013. |
31,943 | 31,943 | ||||||
| Series E convertible preferred stock, 5,000,000 and 7,142,856 shares designated at June 30, 2014 and December 31, 2013, respectively; 5,000,000 shares issued and outstanding at June 30, 2014 and December 31, 2013; aggregate liquidation preference of $17,500 at June 30, 2014 and December 31, 2013. |
17,347 | 17,347 | ||||||
| Series F convertible preferred stock, 4,434,065 shares designated at June 30, 2014; 4,417,243 shares issued and outstanding at June 30, 2014; aggregate liquidation preference of $89,858 at June 30, 2014. |
89,661 | — | ||||||
|
|
|
|
|
|||||
| Subtotal |
$ | 192,905 | $ | 103,244 | ||||
|
|
|
|
|
|||||
| Unamortized compensation associated with Series F convertible preferred stock |
(19,231 | ) | — | |||||
|
|
|
|
|
|||||
| Total Preferred Stock |
$ | 173,674 | $ | 103,244 | ||||
|
|
|
|
|
|||||
In connection with the Acquisition, Lending Club sold an aggregate of 3,195,278 shares of its Series F Preferred Stock, par value $0.01 per share (the “Financing Shares”) for aggregate gross proceeds of approximately $65.0 million, pursuant to a Series F Preferred Stock Purchase Agreement (the “Preferred Stock Purchase Agreement”). Lending Club sold the Financing Shares pursuant to an
15
Table of Contents
exemption from registration under Section 4(a)(2) of the Securities Act of 1933, as amended; all investors in the Preferred Stock Financing were “accredited investors” (as defined under Rule 501 of Regulation D) and Lending Club made no general solicitation for the sale of the Financing Shares. The Financing Shares are convertible into shares of Lending Club common stock, par value $0.01 per share, on a one-for-one basis, as adjusted from time to time pursuant to the anti-dilution provisions of the Lending Club Restated Certificate of Incorporation.
As part of the Acquisition, the sellers received $25 million worth of Series F Preferred Stock (the “Share Consideration”). A portion of the Share Consideration ($22.1 million) is subject to certain vesting and forfeiture conditions over a three-year period for key continuing employees. This is accounted for as a compensation arrangement and expensed over the three-year vesting period. For the three months ended June 30, 2014, we recognized $2.9 million of compensation expense which is reported in general and administrative expenses related to this arrangement.
At June 30, 2014, we have 761,376 shares of convertible preferred Series A stock warrants authorized and reserved for future issuance. Convertible preferred Series A stock warrants are fully exercisable with exercise prices of $0.5325 or $0.5350 per share. The warrants may be exercised at any time on or before August 2018.
Common Stock
At June 30, 2014, we have shares of common stock authorized and reserved for future issuance as follows:
| Options to purchase common stock |
27,401,307 | |||
| Options available for future issuance |
2,335,498 | |||
| Common stock warrants |
139,788 | |||
|
|
|
|||
| Total common stock authorized and reserved for future issuance |
29,876,593 | |||
|
|
|
During the six months ended June 30, 2014, 2,056,177 stock options were exercised in exchange for proceeds of $2.2 million upon the exercise of stock options. During the six months ended June 30, 2014, we issued 125,568 common shares for proceeds of $0.1 million upon the exercise of common stock warrants. Common stock warrants are fully exercisable with exercise prices of $0.005 to $0.785 per share.
12. Stock-Based Compensation and Other Employee Benefit Plans
Stock Incentive Plan
We recognized $5.5 million and $0.9 million of stock-based compensation expense related to stock options for the three months ended June 30, 2014 and 2013, respectively. We recognized $12.5 million and $1.4 million of stock-based compensation expense related to stock options for the six months ended June 30, 2014 and 2013, respectively. Included in the three and six months ended June 30, 2014, stock-based compensation was $3.0 million of expense for the accelerated vesting of stock options for a terminated employee that was accounted for as a stock option modification. As of June 30, 2014, total unrecognized compensation cost was approximately $96.7 million and these costs are expected to be recognized over the next 3.8 years.
For the six months ended June 30, 2014, we granted service-based stock options to purchase 8,525,686 shares of common stock with a weighted average exercise price of $11.29 per share, a weighted average grant date fair value of $8.19 per share and an aggregate estimated fair value of approximately $73.5 million.
For the six months ended June 30, 2013, we granted service-based stock options to purchase 3,133,500 shares of common stock with a weighted average exercise price of $2.91 per share, a weighted average grant date fair value of $1.71 per share and a total estimated fair value of approximately $10.6 million.
We used the Black-Scholes option pricing model to estimate the fair value of stock options granted with the following assumptions:
| Three Months Ended June 30, | Six Months Ended June 30, | |||||||||||||||
| 2014 | 2013 | 2014 | 2013 | |||||||||||||
| Assumed forfeiture rate (annual %) |
5.0 | % | 5.0 | % | 5.0 | % | 5.0 | % | ||||||||
| Expected dividend yield |
0.0 | % | 0.0 | % | 0.0 | % | 0.0 | % | ||||||||
| Weighted average assumed stock price volatility |
52.4 | % | 63.5 | % | 54.3 | % | 63.5 | % | ||||||||
| Weighted average risk-free rate |
1.94 | % | 1.10 | % | 1.91 | % | 1.10 | % | ||||||||
| Weighted average expected life (years) |
6.26 | 6.25 | 6.37 | 6.25 | ||||||||||||
16
Table of Contents
Options activity under the Option Plan for the six months ended June 30, 2014 is summarized as follows:
| Options Outstanding | ||||||||||||||||
| Number of Shares |
Weighted- Average Exercise Price Per Share |
Weighted-Average Remaining Contractual Life (in years) |
Aggregate Intrinsic Value |
|||||||||||||
| Outstanding at December 31, 2013 |
21,657,364 | $ | 1.88 | |||||||||||||
| Options Granted |
8,525,686 | $ | 11.29 | |||||||||||||
| Options Exercised |
(2,056,177 | ) | $ | 1.07 | ||||||||||||
| Options Forfeited/Expired |
(725,566 | ) | $ | 4.49 | ||||||||||||
|
|
|
|||||||||||||||
| Outstanding at June 30, 2014 |
27,401,307 | $ | 4.80 | 8.33 | $ | 425,816,311 | ||||||||||
|
|
|
|
|
|
|
|
|
|||||||||
| Vested and expected to vest at June 30, 2014 |
25,890,428 | $ | 4.60 | 8.28 | $ | 407,515,337 | ||||||||||
|
|
|
|
|
|
|
|
|
|||||||||
| Exercisable at June 30, 2014 |
9,164,318 | $ | 0.82 | 6.84 | $ | 178,887,487 | ||||||||||
|
|
|
|
|
|
|
|
|
|||||||||
401(k) Plan
We maintain a 401(k) defined contribution plan that covers substantially all of our employees. Participants may elect to contribute their annual compensation up to the maximum limit allowed by federal tax law. In the second quarter of 2014, management approved an employer 401(k) match of up to 3% of an employee’s eligible compensation with a maximum annual match of $5,000 per employee. Total 401(k) match expense for both the three and six months ended June 30, 2014 was $0.4 million. For the fiscal year 2014 401(k) match, the match will be retroactively applied to employees’ eligible contributions from January 1, 2014.
13. Income Taxes
For the three and six months ended June 30, 2014, we recorded $0.6 million of provision for income taxes. The $0.6 million of tax expense relates to the amortization of tax deductible goodwill from the Acquisition which gives rise to an indefinite-lived deferred tax liability. There was no income tax benefit recorded on the pre-tax loss due to an increase in deferred tax asset valuation allowance. The Company recorded a net provision of $0.1 million for income taxes for the three and six months ended June 30, 2013.
Management assesses the available positive and negative evidence to estimate if sufficient future taxable income will be generated to utilize the existing deferred tax assets. On the basis of this evaluation, a full valuation allowance has been recorded to recognize only deferred tax assets that are more likely than not to be realized.
At December 31, 2013, we had federal and state net operating loss (“NOL”) carry forwards of approximately $43.9 million and $40.7 million, respectively, to offset future taxable income. These federal and state net operating loss carry forwards will begin expiring in 2027 and 2016, respectively. Additionally, at December 31, 2013, we had federal and state research and development (“R&D”) tax credit carry forwards of approximately $0.6 million and $0.5 million, respectively. The federal credit carry forwards will begin expiring in 2016 and the state credits may be carried forward indefinitely.
In general, a corporation’s ability to utilize its NOL and R&D carryforwards may be substantially limited due to ownership changes that may have occurred or that could occur in the future, as required by Section 382 of the Internal Revenue Code of 1986, as amended (the “Code”), as well as similar state provisions. These ownership changes may limit the amount of NOL and R&D credit carryforwards that can be utilized annually to offset future taxable income and tax, respectively. In general, an “ownership change,” as defined by Section 382 of the Code, results from a transaction or series of transactions over a three-year period resulting in an ownership change of more than 50 percent of the capital (as defined) of a company by certain stockholders or public groups.
Due to the nature of the unrecognized tax benefits and the existence of tax attributes, we have not accrued any interest or penalties associated with unrecognized tax benefits in the condensed consolidated statement of operations nor have we recognized a liability in the condensed consolidated balance sheet.
We do not believe the total amount of unrecognized tax benefit as of June 30, 2014, will increase or decrease significantly in the next twelve months.
14. Net Income (Loss) Attributable to Common Stockholders
Basic earnings (loss) per share (“EPS”) is the amount of earnings available to each share of common stock outstanding during the reporting period. Diluted EPS is the amount of earnings available to each share of common stock outstanding during the reporting period adjusted to include the effect of potentially dilutive common shares. Potentially dilutive common shares include incremental shares issued for stock options, convertible preferred stock and warrants. Potentially dilutive common shares are excluded from the computation of dilutive EPS in periods in which the effect would be antidilutive.
17
Table of Contents
We calculate EPS using the two-class method. The two-class method allocates earnings that otherwise would have been available to common shareholders to holders of participating securities. We consider all series of our convertible preferred stock to be participating securities due to their non-cumulative dividend rights. As such, earnings allocated to these participating securities, which include participation rights in undistributed earnings (see Note 11– Stockholders’ Equity), are subtracted from net income to determine total undistributed earnings to be allocated to common stockholders. All participating securities are excluded from basic weighted-average common shares outstanding.
The following table details the computation of the basic and diluted net loss per share (in thousands, except share and per share data):
| Three Months Ended June 30, | Six Months Ended June 30, | |||||||||||||||
| 2014 | 2013 | 2014 | 2013 | |||||||||||||
| Net (loss) income |
$ | (9,187 | ) | $ | 1,697 | $ | (16,486 | ) | $ | 1,737 | ||||||
| Less: Earnings allocated to participating securities (1) |
$ | — | $ | (1,697 | ) | $ | — | $ | (1,737 | ) | ||||||
|
|
|
|
|
|
|
|
|
|||||||||
| Net loss available to common shareholders after required adjustments for the calculation of basic and diluted earnings per common share |
$ | (9,187 | ) | $ | — | $ | (16,486 | ) | $ | — | ||||||
|
|
|
|
|
|
|
|
|
|||||||||
| Basic weighted average common shares outstanding |
28,985,590 | 25,117,624 | 28,451,564 | 24,471,528 | ||||||||||||
| Weighted average effect of dilutive securities: |
||||||||||||||||
| Stock Options |
— | 11,750,364 | — | 12,574,948 | ||||||||||||
| Warrants |
— | 831,900 | — | 862,168 | ||||||||||||
|
|
|
|
|
|
|
|
|
|||||||||
| Diluted weighted average common shares outstanding |
28,985,590 | 37,699,888 | 28,451,564 | 37,908,644 | ||||||||||||
|
|
|
|
|
|
|
|
|
|||||||||
| Loss per common share |
||||||||||||||||
| Basic |
$ | (0.32 | ) | $ | — | $ | (0.58 | ) | $ | — | ||||||
| Diluted |
$ | (0.32 | ) | $ | — | $ | (0.58 | ) | $ | — | ||||||
| (1) | In a period with net income, both earnings and dividends (if any) are allocated to participating securities. In a period with a net loss, only dividends (if any) are allocated to participating securities. |
15. Related Party Transactions
Several of our executive officers and directors (including their immediate family members) have opened investor accounts with us, made deposits and withdrawals to their accounts and purchased notes and certificates. All note and certificate purchases made by related parties were transacted on terms and conditions that were not more favorable than those obtained by other investors.
The following table summarizes deposits and withdrawals made by related parties whose transactions totaled $120,000 or more for the six months ended June 30, 2014 and 2013 (in thousands):
| Six Months Ended June 30, | ||||||||||
| 2014 | ||||||||||
| Related Party |
Role |
Deposits | Withdrawals | |||||||
| Daniel Ciporin |
Director | $ | 500 | $ | 41 | |||||
| John J. Mack |
Director | 450 | 69 | |||||||
| Larry Summers |
Director | 200 | — | |||||||
|
|
|
|
|
|||||||
| Total |
$ | 1,150 | $ | 110 | ||||||
|
|
|
|
|
|||||||
| Six Months Ended June 30, | ||||||||||
| 2013 | ||||||||||
| Related Party |
Role |
Deposits | Withdrawals | |||||||
| Daniel Ciporin |
Director | $ | 600 | $ | 51 | |||||
| Jeffrey Crowe |
Director | 400 | — | |||||||
| John J. Mack |
Director | 5 | 144 | |||||||
| Larry Summers |
Director | 363 | — | |||||||
|
|
|
|
|
|||||||
| Total |
$ | 1,368 | $ | 195 | ||||||
|
|
|
|
|
|||||||
18
Table of Contents
16. Commitments and Contingencies
Operating Lease Commitments
We have operating lease agreements for space at 71 Stevenson Street in San Francisco, California, where our corporate headquarters are located. These leases expire in June 30, 2019 with a renewal option that would extend the leases for five years. We also have an operating lease agreement for space in Westborough, Massachusetts where Springstone is headquartered. This lease expires in January 31, 2020 with a renewal option that would extend the lease for five years.
Total facilities rental expense for the three and six months ended June 30, 2014 was $0.9 million and $1.6 million, respectively. Total facilities rental expense for the three and six months ended June 30, 2013 was $0.4 million and $0.8 million, respectively. We did not have any sublease rental expense for the three and six months ended June 31, 2014. Sublease rental expense for the three and six months ended June 30, 2013 was $0.2 million and $0.4 million, respectively. Minimum rental expense for the three and six months ended June 30, 2014 was $0.8 million and $1.4 million, respectively. Minimum rental expense for the three and six months ended June 30, 2013 was $0.3 million and $0.6 million, respectively. As part of these lease agreements, we currently have pledged $0.2 million of cash and arranged for a $0.2 million letter of credit as security deposits.
Loan Funding Commitments
For loans listed on the platform as a result of direct marketing efforts, the Company has committed to invest in such loans if investors do not provide funding for all or a portion of such loans. At June 30, 2014, there were 427 such loans on the platform with an unfunded balance of $4.4 million. All of these loans were fully funded by investors by July 3, 2014.
In connection with transitional activities related to the Acquisition, in June 2014 we entered into a contingent loan purchase agreement with an issuing bank that originates loans facilitated by Springstone and a third party investor that has agreed to purchase certain of those loans from such bank (“Contingent Loan Purchase Commitment”). The Contingent Loan Purchase Commitment provides that the Company will purchase such loans from the bank if the third party investor defaults on its loan purchase obligations to the bank through December 31, 2014. The Contingent Loan Purchase Commitment limits the aggregate amount of such loan originations from inception of the Contingent Loan Purchase Commitment through December 31, 2014 to a maximum of $5.0 million. As of June 30, 2014, the amount remaining under the overall limit on the cumulative amount of such loan originations through December 31, 2014 was $3.6 million. We were not required to purchase any such loans pursuant to the Contingent Loan Purchase Commitment in the quarter ended June 30, 2014. The Company does not expect we will be required to purchase any such loans under the Contingent Loan Purchase Commitment through its expiration on December 31, 2014.
Credit Support Agreement
We are subject to a credit support agreement with a Certificate investor. The credit support agreement requires us to pledge and restrict cash in support of this contingent obligation to reimburse the investor for credit losses on loans underlying the investor’s Certificate, that are in excess of a specified, aggregate loss threshold. The amount of cash to be pledged varies based on the investor’s Certificate purchase volume and cannot exceed $5.0 million. As of June 30, 2014, cash of $3.4 million was pledged and restricted to support this contingent obligation. The amount pledged and restricted to support this contingent obligation has not changed since July 31, 2013.
As of June 30, 2014, the credit losses pertaining to the investor’s Certificate have not exceeded the specified threshold, nor are future credit losses expected to exceed the specified threshold, and thus no liability has been recorded. If losses related to the credit support agreement are later determined to be probable to occur and are reasonably estimable, results of operations could be affected in the period in which such losses are recorded.
Legal
We may be subject to legal matters and regulatory actions in the ordinary course of business. Certain of these matters are described below.
In the second quarter of 2014, the Company offered to settle a dispute with a consultant that previously performed work for the Company. The Company offered the claimant a certain number of the Company’s common shares and cash consideration. Since part of this offer was in the form of the Company’s common shares, the Company valued the liability based on an estimated price of the common shares at June 30, 2014. If such offer is accepted by the claimant, the shares will be valued on the date of such agreement.
Separately, during the second quarter of 2014, the Company received notice from the California Employment Development Department (“EDD”) that it had commenced an examination of the Company’s records concerning the employment relationship of certain individuals who performed services for the Company from 2011 through 2014. Based on the EDD’s preliminary determination, certain of these individuals should have been classified as employees with appropriate tax withholding and employer
19
Table of Contents
related taxes incurred and paid. The Company continues to evaluate a submission of a settlement offer to the EDD or whether it will pursue an appeal of any final notice of assessment that the EDD may levy against the Company with respect to misclassified individuals.
Additionally, during the second quarter of 2014, a previous employee asserted a claim of wrongful termination. The Company offered to settle this claim during the second quarter of 2014.
In connection with these matters, the Company recorded a charge in the second quarter of 2014 to operations in the aggregate amount of $1.8 million to establish a liability. This aggregate amount represents the Company’s probable estimate of tax and settlement liabilities. The ultimate liability for such matters could differ from the accrued liability at June 30, 2014. As of June 30, 2014, the Company estimates the aggregate range of reasonably possible losses in excess of any amounts accrued for these matters as of such date, to be up to approximately $0.7 million.
The Company received a Civil Investigative Demand from the Consumer Financial Protection Bureau dated June 5, 2014 related to the operations of Springstone. The purpose of the investigation is to determine whether the Springstone is engaging in unlawful acts or practices in connection with the marketing, issuance, and servicing of installment loans for healthcare related financing. The Company continues to be in the fact-finding stage related to this matter, and as such, we have concluded that as of June 30, 2014, there are no probable or estimable losses related to this matter.
In addition to the foregoing, the Company may be subject to legal proceedings and regulatory actions in the ordinary course of business. After consultation with legal counsel, the Company does not anticipate that the ultimate liability, if any, arising out of any such matter will have a material effect on its financial condition, results of operations or cash flows.
17. Subsequent Event
On August 12, 2014, the Company entered into a lease agreement to lease additional office space at its corporate headquarters. The lease agreement commences over time starting in the third quarter of 2014. However, the lease commencement date for the majority of the space is expected to be in the third quarter of 2015. The lease has a term of 7 years. The annual lease payments for this additional lease are approximately $1.7 million.
20
Table of Contents
Item 2. Management’s Discussion and Analysis of Financial Condition and Results of Operations
The following discussion and analysis should be read in conjunction with the condensed consolidated financial statements and related notes included elsewhere in this Report. In addition to historical information, this Report contains forward-looking statements that involve risks and uncertainties that could cause actual results to differ materially from those projected. Factors that might cause or contribute to such differences include, but are not limited to, those discussed in the following “Management’s Discussion and Analysis of Financial Condition and Results of Operations” as well as in Part II Item 1A, “Risk Factors.” Actual results could differ materially. Important factors that could cause actual results to differ materially include, but are not limited to; the level of demand for our products and services; the intensity of competition; our ability to effectively expand and improve internal infrastructure; maintenance of positive cash flows from operations, and adverse financial, customer and employee consequences that might result if litigation were to be initiated and resolved in an adverse manner to us. Readers are cautioned not to place undue reliance on the forward-looking statements, including statements regarding our expectations, beliefs, intentions or strategies regarding the future, which speak only as of the date of this Report. We assume no obligation to update these forward-looking statements.
Overview
General Corporate Overview
Lending Club is an online marketplace that facilitates loans to consumers and businesses and offers investors an opportunity to invest in the loans. Our mission is to transform the banking system to make it more cost efficient, transparent and customer friendly.
Lending Club is headquartered in San Francisco, California, was incorporated in 2006 and began operations in 2007.
At June 30, 2014, our marketplace had facilitated 379,060 loans totaling approximately $5.0 billion since inception.
At June 30, 2014, we had 628 employees and contractors.
Business Overview
We are the world’s largest online marketplace connecting borrowers and investors. We believe a technology-powered online marketplace is a more efficient mechanism to allocate capital between borrowers and investors than the traditional banking system. Consumers and small business owners borrow through Lending Club to lower the cost of their credit and enjoy a better experience than through a traditional bank. Investors use Lending Club to earn attractive risk-adjusted returns from an asset class that has historically been closed to individual investors and only available on a limited basis to institutional investors. Since our marketplace launched in 2007, our platform has facilitated over $5 billion in loans, and we have built a trusted brand with a track record of delivering exceptional value and satisfaction to both borrowers and investors.
Key advantages we have over the traditional banking system include:
| • | An innovative marketplace model efficiently connecting the supply and demand of capital; |
| • | Online operations that eliminate the need for physical infrastructure and improve convenience; and |
| • | Automation that increases efficiency and reduces manual processes. |
Our platform offers personal loans, which are unsecured obligations of individual borrowers that are issued in amounts ranging from $1,000 up to $35,000, depending on the applicable policy, with fixed interest rates, and three-year or five-year original maturities. Personal loans that have a FICO score of at least 660 and meet other strict credit criteria are issued under WebBank’s standard program policy and can be invested in through member payment dependent notes pursuant to our shelf registration. We and WebBank, a FDIC-insured, state chartered industrial bank organized under the laws of Utah, are also partnering with other sophisticated institutional investors to tailor credit decisioning specifications for personal loans to meet specific credit and investment criteria of these investors that are outside of the standard program policy and therefore are not publicly available. In addition, in March 2014, we launched a program focused on loans to small businesses with loan amounts between $15,000 and $100,000 and fixed interest rates and maturities between one and five years. Small business loans and personal loans are referred to as loans in this Report.
Investors can invest in loans or securities related to loans through one or all of the following channels:
| • | Notes. Pursuant to an effective shelf registration statement, investors may purchase unsecured, borrower payment dependent notes issued by us that correspond to payments received on an underlying loan selected by the investor. |
| • | Certificates and Funds. Investors can purchase trust certificates or interests in limited partnerships that purchase a trust certificate. The trust certificates are settled with cash flows from underlying loans in a manner similar to the notes. |
| • | Whole Loan Purchases. Certain investors seek to hold the actual loan on their balance sheet. To meet this need, we also sell the entire loan to institutions and retain the servicing rights. |
21
Table of Contents
In addition, through the acquisition of Springstone (detailed below), we can now provide financing options for consumers looking to finance education and elective medical procedures through an active network of over 3,300 schools and healthcare providers, as of August 1, 2014. Springstone facilitates installment loans and deferred interest loans through their platform. Installment loans have loan amounts between $2,000 and $40,000 and fixed interest rates and maturities between 24 – 84 months. Installment loans are originated by NBT Bank, N.A. Deferred interest loans have loan amounts between $499 and $25,000 and promotional terms of 6, 12, 18 and 24 months. Deferred interest loans are originated by Alliance Data Systems Corporation and have a variable rate if not paid in full by the end of the promotional period. Loans facilitated by Springstone are held by the issuing bank on and after origination and are therefore not recorded on our condensed consolidated balance sheet.
We have funded our operations with proceeds from debt financing, preferred stock issuances and common stock issuances. Currently, we are able to fund our operations with the cash flow generated from operations, which are described under “Liquidity and Capital Resources” in our “Management’s Discussion and Analysis of Financial Condition and Results of Operations.” From inception through June 30, 2014, we have raised approximately $168.0 million, net of issuance costs through preferred stock equity financings.
For the three and six months ended June 30, 2014, our net loss was $9.2 million and $16.5 million, respectively. For the three and six months ended June 30, 2014, we were cash-flow positive on an operating basis. If our assumptions regarding continued growth and operating plan are incorrect, we may need to slow our investment spending, which could slow our rate of growth or ability to continue operating on a cash-flow positive basis, and our current liquidity resources may be consumed.
We earn revenue primarily from transaction fees paid by the issuing bank, and in the case of Springstone also the provider, to us, as well as from servicing fees and management fees which are charged to investors. We expect that the number of borrowers, service providers, investors and unrelated third party purchasers and the volume of loans we facilitate will continue to increase, and that we will generate increased revenues from these fees.
Stock Split
On April 15, 2014, the Board of Directors approved a 2 for 1 equity stock split in which each outstanding share of each series or class of equity capital stock was split into two outstanding shares of such series or class of equity capital stock. All share and per share data has been adjusted to reflect this stock split.
Springstone Acquisition
On April 17, 2014, we acquired all of the outstanding limited liability company interests of Springstone. We have included the financial results of Springstone in the consolidated financial statements from the date of acquisition.
Under the terms of the Purchase Agreement, the sellers received at the closing an aggregate of $113 million in cash and $25 million worth of Share Consideration. A total of $25.6 million comprised of cash and stock was placed in a third party escrow, and is subject to certain forfeiture conditions over a 36 month period as applicable. This is accounted for as a compensation arrangement and expensed over the three-year vesting period.
To fund the acquisition, we issued 3,195,278 shares of Series F Preferred Stock, par value $0.01 per share for aggregate gross proceeds of approximately $65.0 million and entered into a Credit Agreement with Lenders, under which the Lenders agreed to make a $50.0 million term loan to Lending Club. In connection with the Credit Agreement, Lending Club entered into a Pledge and Security Agreement with Morgan Stanley Senior Funding, Inc. as Collateral Agent.
Key Operating and Financial Metrics
We regularly review a number of metrics to evaluate our business, measure our performance, identify trends, formulate financial projections and make strategic decisions.
22
Table of Contents
The following table includes key operating and financial data (in thousands except per share data):
| Three Months Ended June 30, | Six Months Ended June 30, | |||||||||||||||
| 2014 | 2013 | 2014 | 2013 | |||||||||||||
| Originations |
$ | 1,005,946 | $ | 446,225 | $ | 1,797,294 | $ | 799,110 | ||||||||
| Total Operating Revenue |
$ | 48,621 | $ | 20,842 | $ | 87,323 | $ | 37,085 | ||||||||
| Total Net Revenue |
$ | 48,225 | $ | 20,839 | $ | 86,943 | $ | 37,090 | ||||||||
| Total Operating Expenses |
$ | 56,772 | $ | 19,057 | $ | 102,789 | $ | 35,268 | ||||||||
| Net (Loss) Income |
$ | (9,187 | ) | $ | 1,697 | $ | (16,486 | ) | $ | 1,737 | ||||||
| Adjusted EBITDA |
$ | 4,009 | $ | 3,047 | $ | 5,890 | $ | 3,781 | ||||||||
| Adjusted EBITDA as % of Net Revenue |
8.3 | % | 14.6 | % | 6.8 | % | 10.2 | % | ||||||||
| Basic net loss per share attributable to common stockholders |
$ | (0.32 | ) | $ | — | $ | (0.58 | ) | $ | — | ||||||
| Diluted net loss per share attributable to common stockholders |
$ | (0.32 | ) | $ | — | $ | (0.58 | ) | $ | — | ||||||
Originations
Loans to qualified borrowers are originated by our issuing bank partners. We generate revenue from transaction fees from our role in matching borrowers with investors to enable loans originations. We believe originations are a key indicator of the adoption rate of our platform, growth of our brand, scale of our business, strength of our network effect, economic competitiveness of our products and future growth. Loan originations have increased significantly over time due to the effectiveness of our borrower acquisition channels, a strong track record of loan performance and the expansion of our capital sources. Factors that could affect loan originations include the current interest rate and economic environment, the competitiveness of our products, our ability to develop new products or enhance existing products for borrowers and investors and the success of borrower and investor acquisition and retention.
Adjusted EBITDA
Adjusted EBITDA is a non-GAAP financial measure that we calculate as net income (loss), adjusted to exclude: provision (benefit) for income taxes, net interest income (expense) and adjustments, acquisition and related expense, depreciation and amortization, amortization of intangible assets and stock-based compensation. This non-GAAP information is not necessarily comparable to non-GAAP information of other companies. Non-GAAP information should not be viewed as a substitute for, or superior to, net income (loss) prepared in accordance with GAAP as a measure of our profitability or liquidity. Users of this financial measure should consider the types of events and transactions for which adjustments have been made.
Adjusted EBITDA is a key measure used by our management and Board of Directors to understand and evaluate our core operating performance and trends. We use Adjusted EBITDA because we believe it facilitates operating performance comparisons from period to period by excluding potential differences primarily caused by variations in tax positions, capital structures, the impact of depreciation and amortization expense on our fixed assets and intangible assets, acquisition-related expenses and the impact of stock-based compensation expense. Adjusted EBITDA has improved over each of the periods due to our increased revenue and efficiencies in the scale of our operations.
Our use of Adjusted EBITDA has limitations as an analytical tool, and you should not consider it in isolation or as a substitute for analysis of our results as reported under GAAP. Some of these limitations are:
| • | Although depreciation and amortization are non-cash charges, the assets being depreciated and amortized may have to be replaced in the future and Adjusted EBITDA does not reflect cash capital expenditure requirements for such replacements or for new capital expenditure requirements; |
| • | Adjusted EBITDA does not reflect changes in, or cash requirements for, our working capital needs; |
23
Table of Contents
| • | Adjusted EBITDA does not consider the potentially dilutive impact of stock-based compensation and warrant expense; |
| • | Adjusted EBITDA does not reflect tax payments that may represent a reduction in cash available to us; and |
| • | Other companies, including companies in our industry, may calculate Adjusted EBITDA differently, which reduces its usefulness as a comparative measure. |
In evaluating Adjusted EBITDA, you should be aware that in the future we will incur expenses and earn income similar to the adjustments in this presentation. Our presentation of Adjusted EBITDA should not be construed as an inference that our future results will be unaffected by these expenses or any unusual or non-recurring items. When evaluating our performance, you should consider Adjusted EBITDA alongside other financial performance measures, including our net (loss) income and other GAAP results.
Net (loss) income is the most comparable GAAP measure to Adjusted EBITDA. The following table presents a reconciliation of net (loss) income to Adjusted EBITDA for each of the periods indicated (in thousands):
| Three Months Ended June 30, | Six Months Ended June 30, | |||||||||||||||
| 2014 | 2013 | 2014 | 2013 | |||||||||||||
| Reconciliation of Adjusted EBITDA: |
||||||||||||||||
| Net (loss) income |
$ | (9,187 | ) | $ | 1,697 | $ | (16,486 | ) | $ | 1,737 | ||||||
| Stock-based compensation |
8,319 | 949 | 15,352 | 1,474 | ||||||||||||
| Other expense (income), net |
640 | (4 | ) | 639 | (10 | ) | ||||||||||
| Acquisition-related expenses |
1,141 | — | 2,282 | — | ||||||||||||
| Depreciation and amortization |
1,333 | 320 | 2,340 | 495 | ||||||||||||
| Amortization of intangible assets |
1,123 | — | 1,123 | — | ||||||||||||
| Provision for income taxes |
640 | 85 | 640 | 85 | ||||||||||||
|
|
|
|
|
|
|
|
|
|||||||||
| Adjusted EBITDA |
$ | 4,009 | $ | 3,047 | $ | 5,890 | $ | 3,781 | ||||||||
|
|
|
|
|
|
|
|
|
|||||||||
Results of Operations
Overview
The following table summarizes our net (loss) income for the three and six months ended June 30, 2014 and 2013 (in thousands):
| Three Months Ended June 30, | ||||||||||||||||
| 2014 | 2013 | $ Change | % Change | |||||||||||||
| Net Revenue |
$ | 48,225 | $ | 20,839 | $ | 27,386 | 131 | % | ||||||||
| Operating Expenses |
56,772 | 19,057 | 37,715 | 198 | % | |||||||||||
|
|
|
|
|
|
|
|||||||||||
| (Loss) Income before provision for income taxes |
(8,547 | ) | 1,782 | (10,329 | ) | -580 | % | |||||||||
| Provision for income taxes |
640 | 85 | 555 | 653 | % | |||||||||||
|
|
|
|
|
|
|
|||||||||||
| Net (Loss) Income |
$ | (9,187 | ) | $ | 1,697 | $ | (10,884 | ) | -641 | % | ||||||
|
|
|
|
|
|
|
|||||||||||
| Six Months Ended June 30, | ||||||||||||||||
| 2014 | 2013 | $ Change | % Change | |||||||||||||
| Net Revenue |
$ | 86,943 | $ | 37,090 | $ | 49,853 | 134 | % | ||||||||
| Operating Expenses |
102,789 | 35,268 | 67,521 | 191 | % | |||||||||||
|
|
|
|
|
|
|
|||||||||||
| (Loss) Income before provision for income taxes |
(15,846 | ) | 1,822 | (17,668 | ) | -970 | % | |||||||||
| Provision for income taxes |
640 | 85 | 555 | 653 | % | |||||||||||
|
|
|
|
|
|
|
|||||||||||
| Net (Loss) Income |
$ | (16,486 | ) | $ | 1,737 | $ | (18,223 | ) | -1049 | % | ||||||
|
|
|
|
|
|
|
|||||||||||
Net revenue was $48.2 million for the three months ended June 30, 2014, a 131% increase over the three months ended June 30, 2013 primarily due to higher originations. Operating expenses were $56.8 million for the three months ended June 30, 2014, a 198% increase over the three months ended June 30, 2013 primarily due to higher compensation costs, loan credit decisioning costs, borrower acquisition costs, acquisition-related expenses and operational costs related to Springstone.
Net revenue was $86.9 million for the six months ended June 30, 2014, a 134% increase over the six months ended June 30, 2013 primarily due to higher originations. Operating expenses were $102.8 million for the six months ended June 30, 2014, a 191% increase over the six months ended June 30, 2013 primarily due to higher compensation costs, loan credit decisioning costs, borrower acquisition costs, acquisition-related expenses and operational costs for Springstone.
Revenue
Our primary sources of revenue consist of transaction fees paid to us by issuing banks related to loan originations facilitated by us, and for Springstone also the providers, as well as servicing fees and management fees which are charged to investors. During the three months ended June 30, 2014 and 2013, we facilitated $1,005.9 million and $446.2 million of loans, respectively, through our platform. During the six months ended June 30, 2014 and 2013, we facilitated $1,797.3 million and $799.1 million of loans, respectively, through our platform.
24
Table of Contents
The following table summarizes our revenue for the three and six months ended June 30, 2014 and 2013 (in thousands):
| Three Months Ended June 30, | ||||||||||||||||
| 2014 | 2013 | $ Change | % Change | |||||||||||||
| Transaction fees |
$ | 45,801 | $ | 16,393 | $ | 29,408 | 179 | % | ||||||||
| Servicing fees |
1,468 | 882 | 586 | 66 | % | |||||||||||
| Management fees |
1,461 | 720 | 741 | 103 | % | |||||||||||
| Other (expense) revenue |
(109 | ) | 2,847 | (2,956 | ) | -104 | % | |||||||||
|
|
|
|
|
|
|
|||||||||||
| Total Operating Revenue |
48,621 | 20,842 | 27,779 | 133 | % | |||||||||||
|
|
|
|
|
|
|
|||||||||||
| Net Interest Expense after fair value adjustments |
(396 | ) | (3 | ) | (393 | ) | N/M | |||||||||
|
|
|
|
|
|
|
|||||||||||
| Net Revenue |
$ | 48,225 | $ | 20,839 | $ | 27,386 | 131 | % | ||||||||
|
|
|
|
|
|
|
|||||||||||
| Six Months Ended June 30, | ||||||||||||||||
| 2014 | 2013 | $ Change | % Change | |||||||||||||
| Transaction fees |
$ | 81,213 | $ | 29,975 | $ | 51,238 | 171 | % | ||||||||
| Servicing fees |
3,248 | 1,597 | 1,651 | 103 | % | |||||||||||
| Management fees |
2,555 | 1,214 | 1,341 | 110 | % | |||||||||||
| Other revenue |
307 | 4,299 | (3,992 | ) | -93 | % | ||||||||||
|
|
|
|
|
|
|
|||||||||||
| Total Operating Revenue |
87,323 | 37,085 | 50,238 | 135 | % | |||||||||||
|
|
|
|
|
|
|
|||||||||||
| Net Interest (Expense) Income after fair value adjustments |
(380 | ) | 5 | (385 | ) | N/M | ||||||||||
|
|
|
|
|
|
|
|||||||||||
| Net Revenue |
$ | 86,943 | $ | 37,090 | $ | 49,853 | 134 | % | ||||||||
|
|
|
|
|
|
|
|||||||||||
N/M - Not meaningful.
Transaction Fees
Transaction fees are fees paid by the issuing banks to us for the work we perform in facilitating originations. In addition, transaction fees include fees earned from service providers for education and patient financing products. The amount of these fees is based upon the terms of the loan, including grade, rate, term and other factors. These fees are recognized as a component of operating revenue at the time of loan issuance. As of June 30, 2014, these fees ranged from 1% to 6% of the initial principal amount of a loan.
Transaction fees were $45.8 million and $16.4 million for the three months ended June 30, 2014 and 2013, respectively, an increase of 179%. The increase in these fees was primarily due to an increase in loan volume. Average loan transaction fees were 4.6% and 4.4% of the principal amount of loans facilitated for the three months ended June 30, 2014 and 2013, respectively. The increase in the average loan transaction fee was primarily due to higher percentages of 60 month loans and higher risk loans, which have higher corresponding transaction fees.
Transaction fees were $81.2 million and $30.0 million for the six months ended June 30, 2014 and 2013, respectively, an increase of 171%. The increase in these fees was primarily due to an increase in loan volume. Average loan transaction fees were 4.5% and 4.4% of the principal amount of loans facilitated for the six months ended June 30, 2014 and 2013, respectively. The increase in the average loan transaction fee was primarily due to higher percentages of 60 month loans and higher risk loans, which have higher corresponding transaction fees.
Servicing Fees
We earn a fee from investors for servicing the ongoing borrower-investor relationship. The servicing fee compensates us for the costs we incur in servicing the related loan, including managing payments from borrowers, payments to investors and maintaining investors’ account portfolios. These fees are typically 1% of each payment amount received from the borrower.
Servicing fees were $1.5 million and $0.9 million for the three months ended June 30, 2014 and 2013, respectively, an increase of 66%, primarily due to increased balances of notes, sold loans and certificates outstanding during the three months ended June 30, 2014, versus the three months ended June 30, 2013, offset by changes in the fair value of servicing assets/liabilities.
Servicing fees were $3.2 million and $1.6 million for the six months ended June 30, 2014 and 2013, respectively, an increase of 103%, primarily due to increased balances of notes, sold loans and certificates outstanding during the six months ended June 30, 2014, versus the six months ended June 30, 2013, offset by changes in the fair value of servicing assets/liabilities.
25
Table of Contents
Management Fees and Assets Under Management
Accredited investors and qualified purchasers can invest in limited partner interests in funds managed by LCA, a registered investment advisor and our wholly owned subsidiary. LCA typically charges certificate holders a management fee based on their assets under management, ranging from 0.70% - 1.25% per year. This fee may be waived or reduced for individual limited partners at the discretion of the general partner.
LCA earned management fees totaling $1.5 million and $0.7 million for the three months ended June 30, 2014 and 2013, respectively, an increase of 103%. LCA earned management fees totaling $2.6 million and $1.2 million for the six months ended June 30, 2014 and 2013, respectively, an increase of 110%. The increase in management fees was due primarily to an increase in assets under management, which were $845.4 million at June 30, 2014 and $547.2 million at June 30, 2013.
As of June 30, 2014, the funds had $739.7 million in assets with $12.3 million of pending capital contributions from limited partners in escrow, which was contributed to the funds on the first business day of July 2014. As of June 30, 2014, LCA managed $105.7 million in assets in SMAs.
The table below presents our summary of changes in assets under management for LCA (in millions):
| Balance at December 31, 2013 |
$ | 740.2 | ||
| Net capital contributions |
71.7 | |||
| Net appreciation |
33.5 | |||
|
|
|
|||
| Balance at June 30, 2014 |
$ | 845.4 | ||
|
|
|
Other Revenue (Expense)
Other revenue consists of revenue from gains and losses on sales of whole loans and referral revenue. Certain banks investing through our platform acquire loans in their entirety. In connection with these whole loan sales, in addition to the transaction fee earned in respect of the corresponding loan, we recognize a small gain or loss on the sale of that loan (loans are typically sold at par). From January 1, 2013 through June 30, 2013, we included in the gain calculation on whole loan sales the amount of the transaction fees that was earned in respect of those loans, resulting in higher gains on sale and lower transaction fees.
Other (expense) revenue was $(0.1) million and $2.8 million for the three months ended June 30, 2014 and 2013, respectively, a decrease of 104%. The decrease was primarily due to a $3.4 million decrease in gain on sale of whole loans to third party purchasers.
Other revenue was $0.3 million and $4.3 million for the six months ended June 30, 2014 and 2013, respectively, a decrease of 93%. The decrease was primarily due to a $4.6 million decrease in gain on sale of whole loans to third party purchasers.
Net Interest Income
The following table summarizes interest income, interest expense and net interest income for the three and six months ended June 30, 2014 and 2013, as follows (in thousands):
| Three Months Ended June 30, | Six Months Ended June 30, | |||||||||||||||
| 2014 | 2013 | 2014 | 2013 | |||||||||||||
| Interest Income |
||||||||||||||||
| Loans |
$ | 85,210 | $ | 41,017 | $ | 158,257 | $ | 73,375 | ||||||||
| Cash and cash equivalents |
2 | 4 | 3 | 10 | ||||||||||||
|
|
|
|
|
|
|
|
|
|||||||||
| Total Interest Income |
85,212 | 41,021 | 158,260 | 73,385 | ||||||||||||
|
|
|
|
|
|
|
|
|
|||||||||
| Interest Expense |
||||||||||||||||
| Notes and certificates |
(85,193 | ) | (41,032 | ) | (158,193 | ) | (73,357 | ) | ||||||||
| Term Loan |
(401 | ) | — | (401 | ) | — | ||||||||||
|
|
|
|
|
|
|
|
|
|||||||||
| Total Interest Expense |
(85,594 | ) | (41,032 | ) | (158,594 | ) | (73,357 | ) | ||||||||
|
|
|
|
|
|
|
|
|
|||||||||
| Net Interest (Expense) Income |
$ | (382 | ) | $ | (11 | ) | $ | (334 | ) | $ | 28 | |||||
|
|
|
|
|
|
|
|
|
|||||||||
Due to the payment dependent feature of notes and certificates for payments on related loans, interest income earned on loans equals the interest expense on the notes and certificates associated with such loans. Differences between reported interest income earned on loans and interest expense on notes and certificates is due to interest earned on loans in which we have invested for which there is no corresponding note or certificate.
We had net interest expense of $0.38 million and $0.01 million for the three months ended June 30, 2014 and 2013, respectively. Net interest income decreased in the three months ended June 30, 2014, when compared to the same period in the prior year primarily due to the interest expense incurred on the Term Loan. We had net interest (expense) income of $(0.33) million and $0.03 million for the
26
Table of Contents
six months ended June 30, 2014 and 2013, respectively. Net interest income decreased in the six months ended June 30, 2014, when compared to the same period in the prior year primarily due to the interest expense incurred on the Term Loan that was drawn by the Company in April 2014.
For the three months ended June 30, 2014 and 2013, interest income from loans was $85.2 million and $41.0 million, respectively. For the six months ended June 30, 2014 and 2013, interest income from loans was $158.3 million and $73.4 million, respectively. The increase in interest income is primarily due to the increase in the outstanding balances of loans. The average balance of loans outstanding during the three months ended June 30, 2014, was $2,251.0 million as compared to an average balance of $1,150.1 million during the three months ended June 30, 2013, an increase of 96%. The average balance of loans outstanding during the six months ended June 30, 2014, was $2,121.5 million as compared to an average balance of $1,034.0 million during the six months ended June 30, 2013, an increase of 105%.
For the three months ended June 30, 2014 and 2013, we recorded interest expense for notes and certificates of $85.2 million and $41.0 million, respectively. For the six months ended June 30, 2014 and 2013, we recorded interest expense for notes and certificates of $158.2 million and $73.4 million, respectively. The increase in interest expense was primarily due to the increase in the outstanding balances of notes and certificates. The average balance of notes and certificates outstanding during the three months ended June 30, 2014, was $2,263.5 million as compared to the average balance of $1,157.4 million during the three months ended June 30, 2013, an increase of 96%. The average balance of notes and certificates outstanding during the six months ended June 30, 2014, was $2,131.8 million as compared to the average balance of $1,041.1 million during the six months ended June 30, 2013, an increase of 105%.
Fair Value Adjustments on Loans and Notes and Certificates
At June 30, 2014, we estimated the fair value of loans and their related notes and certificates using a discounted cash flow valuation methodology. The discounted cash flow valuation methodology uses the historical defaults and losses and recoveries on our loans over the past several years to project future losses and net cash flows on loans.
The fair value adjustments for loans were largely offset by the fair value adjustments of the notes and certificates at fair value due to the member payment dependent design of the notes and certificates, and because the principal balances of the loans are similar to the combined principal balances of the related notes and certificates. Accordingly, the net fair value adjustment (losses) gains for loans and notes and certificates were immaterial for the three months ended June 30, 2014 and 2013 and for the six months ended June 30, 2014 and 2013.
Operating Expenses
The following table summarizes our operating expenses for the three and six months ended June 30, 2014 and 2013 (in thousands):
| Three Months Ended June 30, | ||||||||||||||||
| 2014 | 2013 | $ Change | % Change | |||||||||||||
| Sales and marketing |
$ | 19,225 | $ | 8,410 | $ | 10,815 | 129 | % | ||||||||
| Origination and servicing |
8,566 | 3,414 | 5,152 | 151 | % | |||||||||||
| General and administrative |
||||||||||||||||
| Engineering and Product Development |
8,030 | 3,043 | 4,987 | 164 | % | |||||||||||
| Other |
20,951 | 4,190 | 16,761 | 400 | % | |||||||||||
|
|
|
|
|
|
|
|||||||||||
| Total Operating Expenses |
$ | 56,772 | $ | 19,057 | $ | 37,715 | 198 | % | ||||||||
|
|
|
|
|
|
|
|||||||||||
| Six Months Ended June 30, | ||||||||||||||||
| 2014 | 2013 | $ Change | % Change | |||||||||||||
| Sales and marketing |
$ | 39,807 | $ | 16,117 | $ | 23,690 | 147 | % | ||||||||
| Origination and servicing |
15,968 | 6,048 | 9,920 | 164 | % | |||||||||||
| General and administrative |
||||||||||||||||
| Engineering and Product Development |
13,752 | 5,291 | 8,461 | 160 | % | |||||||||||
| Other |
33,262 | 7,812 | 25,450 | 326 | % | |||||||||||
|
|
|
|
|
|
|
|||||||||||
| Total Operating Expenses |
$ | 102,789 | $ | 35,268 | $ | 67,521 | 191 | % | ||||||||
|
|
|
|
|
|
|
|||||||||||
Sales and Marketing
Sales and marketing expense consists primarily of borrower and investor acquisition costs and salaries, benefits and stock-based compensation expense related to our sales and marketing staff. Sales and marketing expenses for the three months ended June 30, 2014 and 2013 were $19.2 million and $8.4 million, respectively, an increase of 129%. The increase was primarily due to a $9.7 million increase in borrower acquisition costs.
27
Table of Contents
Sales and marketing expenses for the six months ended June 30, 2014 and 2013 were $39.8 million and $16.1 million, respectively, an increase of 147%. The increase was primarily due to a $20.3 million increase in borrower acquisition costs.
Origination and Servicing
Origination and servicing expense consists primarily of salaries, benefits and stock-based compensation expense related to our credit, collections, customer support and payment processing staff and vendor costs associated with facilitating and servicing loans. Origination and servicing expenses for the three months ended June 30, 2014 and 2013 were $8.6 million and $3.4 million, respectively, an increase of 151%. The increase was primarily due to a $3.7 million increase in compensation expense as we expanded our credit and customer support teams due to increasing loan applications and a $1.2 million increase in consumer reporting agency and loan processing costs which was also driven by higher loan volume.
Origination and servicing expenses for the six months ended June 30, 2014 and 2013 were $16.0 million and $6.0 million, respectively, an increase of 164%. The increase was primarily due to a $7.0 million increase in compensation expense as we expanded our credit and customer support teams due to increasing loan applications and a $2.5 million increase in consumer reporting agency and loan processing costs which was also driven by higher loan volume.
General and Administrative
General and administrative expenses are incurred by our engineering and product development and other administrative teams to support the overall business.
Engineering and Product Development
Engineering and product development expense consists primarily of salaries, benefits and stock-based compensation expense for our technology team and the cost of subcontractors who work on the development and maintenance of our platform. Engineering and product development expense also includes non-capitalized hardware and software costs and depreciation and amortization of technology assets. Engineering and product development expenses for the three months ended June 30, 2014 and 2013 were $8.0 million and $3.0 million, respectively, an increase of 164%. The increase was primarily due to a $3.6 million increase in personnel related expenses resulting from increased headcount and contract labor expense as we enhanced our website tools and functionality and a $1.0 million increase in expensed equipment and software and depreciation expense reflecting our continued investment in technology infrastructure.
Engineering and product development expenses for the six months ended June 30, 2014 and 2013 were $13.8 million and $5.3 million, respectively, an increase of 160%. The increase was primarily due to a $6.1 million increase in personnel related expenses resulting from increased headcount and contract labor expense as we enhanced our website tools and functionality and a $1.9 million increase in expensed equipment and software and depreciation expense reflecting our continued investment in technology infrastructure.
During the three and six months ended June 30, 2014, we capitalized $2.4 million and $4.7 million of software development costs, respectively. During the three and six months ended June 30, 2013, we capitalized $0.6 million and $1.0 million of software development costs, respectively. These costs generally are amortized over a three year period.
Other
Other general and administrative expense consists primarily of salaries, benefits and stock-based compensation expense for our accounting and finance, business development, legal, human resources and facilities staff, professional fees related to legal and accounting and facilities expense. Other general and administrative expenses for the three months ended June 30, 2014 and 2013 were $21.0 million and $4.2 million, respectively, an increase of 400%. The increase was primarily due to a $9.8 million increase in compensation expense, $3.1 million of which was the amortization of the compensation arrangement related to certain key continuing employees of Springstone with the remainder primarily related to an increase in headcount and stock based compensation expense, a $1.9 million increase in contingent legal liabilities and a $2.3 million increase in professional services and amortization of intangibles related to the Acquisition.
Other general and administrative expenses for the six months ended June 30, 2014 and 2013 were $33.3 million and $7.8 million, respectively, an increase of 326%. The increase was primarily due to a $15.0 million increase in compensation expense, $3.1 million of which was the amortization of the compensation arrangement related to certain key continuing employees of Springstone with the remainder primarily related to an increase in headcount and stock based compensation expense, a $3.4 million increase in professional services and amortization of intangibles related to the Acquisition, a $1.8 million increase in audit and legal fees and a $1.9 million increase in contingent legal liabilities.
28
Table of Contents
Income Taxes
For the three and six months ended June 30, 2014, we recorded $0.6 million of provision for income taxes. The $0.6 million of tax expense relates to the amortization of tax deductible goodwill from the Acquisition which gives rise to an indefinite-lived deferred tax liability. There was no income tax benefit recorded on the pre-tax loss due to an increase in deferred tax asset valuation allowance. The Company recorded a net provision of $0.1 million for income taxes for the three and six months ended June 30, 2013, which represented minimum corporate income tax liabilities due for the Company’s taxable income that cannot be offset by usage of prior years’ net operating loss and tax credit carryforwards.
Deferred tax assets, such as the future benefit of net operating loss deductions against future taxable income, can be recognized if realization of such tax-related assets is more likely than not. Given our history of operating losses, it is difficult to accurately forecast when and in what amounts future results will be affected by the realization, if any, of the tax benefits of future deductions for our net operating loss carry forwards. Based upon the weight of available evidence, which includes our historical operating performance and the reported cumulative net losses in all prior years, we have provided a full valuation allowance against our net deferred tax assets.
Legal
We may be subject to legal matters and regulatory actions in the ordinary course of business. Certain of these matters are described below.
In the second quarter of 2014, the Company offered to settle a dispute with a consultant that previously performed work for the Company. The Company offered the claimant a certain number of the Company’s common shares and cash consideration. Since part of this offer was in the form of the Company’s common shares, the Company valued the liability based on an estimated price of the common shares at June 30, 2014. If such offer is accepted by the claimant, the shares will be valued on the date of such agreement.
Separately, during the second quarter of 2014, the Company received notice from the California Employment Development Department (“EDD”) that it had commenced an examination of the Company’s records concerning the employment relationship of certain individuals who performed services for the Company from 2011 through 2014. Based on the EDD’s preliminary determination, certain of these individuals should have been classified as employees with appropriate tax withholding and employer related taxes incurred and paid. The Company continues to evaluate a submission of a settlement offer to the EDD or whether it will pursue an appeal of any final notice of assessment that the EDD may levy against the Company with respect to misclassified individuals.
Additionally, during the second quarter of 2014, a previous employee asserted a claim of wrongful termination. The Company offered to settle this claim during the second quarter of 2014.
In connection with these matters, the Company recorded a charge in the second quarter of 2014 to operations in the aggregate amount of $1.8 million to establish a liability. This aggregate amount represents the Company’s probable estimate of tax and settlement liabilities. The ultimate liability for such matters could differ from the accrued liability at June 30, 2014. As of June 30, 2014, the Company estimates the aggregate range of reasonably possible losses in excess of any amounts accrued for these matters as of such date, to be up to approximately $0.7 million.
The Company received a Civil Investigative Demand from the Consumer Financial Protection Bureau dated June 5, 2014 related to the operations of Springstone. The purpose of the investigation is to determine whether the Springstone is engaging in unlawful acts or practices in connection with the marketing, issuance, and servicing of installment loans for healthcare related financing. The Company continues to be in the fact-finding stage related to this matter, and as such, we have concluded that as of June 30, 2014, there are no probable or estimable losses related to this matter.
In addition to the foregoing, the Company may be subject to legal proceedings and regulatory actions in the ordinary course of business. After consultation with legal counsel, the Company does not anticipate that the ultimate liability, if any, arising out of any such matter will have a material effect on its financial condition, results of operations or cash flows.
Liquidity and Capital Resources
At June 30, 2014, we had $69.0 million in available cash and cash equivalents. We primarily hold our excess unrestricted cash in short-term interest-bearing money market funds at highly-rated financial institutions. We believe that our current cash position is sufficient to meet our current liquidity needs.
At June 30, 2014, we had $20.4 million in restricted cash that consisted primarily of pledged cash of $3.0 million as security for WebBank, $3.4 million for an investor as part of a credit support agreement, $12.0 million of investor cash and $1.7 million as security for a correspondent bank that clears our borrowers’ and investors’ cash transactions.
At June 30, 2014, the net outstanding balance on the term loan was $49.5 million. This term loan matures on April 16, 2017 and requires principal payments of $312,500 per quarter, with the remaining then unpaid principal amount payable at maturity. The weighted average interest rate on the term loan was 2.75% for both the three and six months ended June 30, 2014. At June 30, 2014, we were in compliance with the leverage ratio covenant.
29
Table of Contents
The following table summarizes our cash flows for the six months ended June 30, 2014 and 2013 (in thousands).
| Six Months Ended June 30, | ||||||||
| 2014 | 2013 | |||||||
| Cash provided by (used in) |
||||||||
| Operating activities |
$ | 22,137 | $ | 6,532 | ||||
| Investing activities |
(673,817 | ) | (483,398 | ) | ||||
| Financing activities |
671,339 | 478,909 | ||||||
|
|
|
|
|
|||||
| Net increase in cash |
$ | 19,659 | $ | 2,043 | ||||
|
|
|
|
|
|||||
Net cash provided by operating activities for the six months ended June 30, 2014 was positive primarily due to collection of investor receivables outstanding at December 31, 2013 and the impact of non-cash expenses including stock-based compensation and warrant expense. Net cash used in investing primarily represents acquisitions of loans (excluding acquisition of loans sold to unrelated third parties which is included in cash flow from operations along with the corresponding proceeds from sale of loans) and the acquisition of Springstone, offset by repayment of loans. Net cash provided by financing activities primarily represents proceeds from the issuance of notes and certificates, partially offset by payments on notes and certificates. Additionally, in the second quarter of 2014 the Company issued debt of $49.8 million, net of discount related to the Acquisition and raised additional preferred stock of $64.8 million, net of issuance cost (see Note 10 – Term Loan and Note 11 – Stockholders’ Equity in the Notes to the condensed consolidated financial statements).
Critical Accounting Policies
The Company’s significant accounting policies are included in Note 2 – Summary of Significant Accounting Policies in the Company’s Annual Report on Form 10-K for the year ended December 31, 2013. There have been no changes to these accounting policies during the first six months of 2014 except for the application of the acquisition method in accounting for a business combination, the accounting for intangible assets, including goodwill and the accounting for servicing assets and liabilities, as described below.
Goodwill and Intangible Assets
Goodwill represents the fair value of acquired businesses in excess of the fair value of the individually identified net assets acquired. Goodwill is not amortized but is tested for impairment annually or whenever indications of impairment exist. The Company’s annual impairment testing date is April 1. The Company can elect to qualitatively assess goodwill for impairment if it is more likely than not that the fair value of a reporting unit exceeds its carrying value. A qualitative assessment may consider macroeconomic and other industry-specific factors, such as trends in short-term and long-term interest rates and the ability to access capital, or company-specific factors such as market capitalization in excess of net assets, trends in revenue generating activities and merger or acquisition activity.
If the Company elects to bypass qualitatively assessing goodwill, or it is not more likely than not that the fair value of a reporting unit exceeds its carrying value, management estimates the fair values of each of the Company’s reporting units (defined as the Company’s businesses for which financial information is available and reviewed regularly by management) and compares it to their carrying values. The estimated fair values of the reporting units are established using an income approach based on a discounted cash flow model that includes significant assumptions about the future operating results and cash flows of each reporting unit, a market approach which compares each reporting unit to comparable companies in their respective industries, and a market capitalization analysis.
Intangible assets are amortized over their useful lives in a manner that best reflects their economic benefit. Intangible assets are reviewed for impairment whenever events or changes in circumstances indicate that the carrying amount of such assets may not be recoverable. The Company does not have any indefinite-lived intangible assets.
Servicing Asset/Liability
For whole loans sold to unrelated third party purchasers with servicing retained, we use a discounted cash flow model to estimate the fair value of the loan servicing asset or liability which considers the contractual servicing fee revenue we earn on the sold loans, an estimated market servicing rate to service such loans, the current principal balances of the loans and projected servicing revenues over the remaining terms of the loans. We record servicing assets and liabilities at their estimated fair values at the time the loans are sold. Changes in the fair value of servicing assets and liabilities are reported in “Servicing Fees” in the period in which the change occurs. Servicing assets and liabilities are recorded in “Other Assets” and “Accrued Expenses and Other Liabilities”, respectively, on the condensed consolidated balance sheets.
30
Table of Contents
Statistical Information on the Standard Program Loan Portfolio
The tables and charts set forth below relate only to loans issued under the standard program.
In regards to the following historical information, prior performance is no guarantee of future results or outcomes.
From inception to June 30, 2014, we facilitated standard program loans with an average original principal amount of $14,056 and an aggregate original principal amount of $4.7 billion. Out of 333,475 facilitated standard program loans, 56,380 standard program loans with an aggregate original principal amount of $669.8 million, or 14.29%, were fully paid as of June 30, 2014.
The following table presents aggregated information about standard program loans for the period from inception to June 30, 2014, grouped by the loan grade assigned by us:
Standard Program Loans Issued from Inception to June 30, 2014 by Grade
| Loan Grade |
Number of Loans |
Average Interest Rate |
Total Amount Issued |
|||||||||
| A1 | 6,941 | 5.99 | % | $ | 82,891,375 | |||||||
| A2 | 7,510 | 6.58 | % | 89,761,975 | ||||||||
| A3 | 9,123 | 7.50 | % | 119,070,575 | ||||||||
| A4 | 13,831 | 7.86 | % | 181,347,375 | ||||||||
| A5 | 15,545 | 8.76 | % | 213,040,800 | ||||||||
| B1 | 16,954 | 9.83 | % | 211,144,425 | ||||||||
| B2 | 20,318 | 10.87 | % | 265,805,625 | ||||||||
| B3 | 24,570 | 11.80 | % | 311,263,425 | ||||||||
| B4 | 23,088 | 12.60 | % | 303,777,975 | ||||||||
| B5 | 18,165 | 13.18 | % | 229,287,275 | ||||||||
| C1 | 19,212 | 13.81 | % | 250,576,350 | ||||||||
| C2 | 18,906 | 14.46 | % | 255,467,450 | ||||||||
| C3 | 17,799 | 15.01 | % | 254,678,425 | ||||||||
| C4 | 16,730 | 15.61 | % | 247,167,750 | ||||||||
| C5 | 15,760 | 16.26 | % | 239,100,350 | ||||||||
| D1 | 13,291 | 16.94 | % | 190,681,000 | ||||||||
| D2 | 11,922 | 17.51 | % | 165,257,475 | ||||||||
| D3 | 10,208 | 18.01 | % | 145,526,925 | ||||||||
| D4 | 9,633 | 18.56 | % | 148,622,600 | ||||||||
| D5 | 8,067 | 19.21 | % | 130,056,650 | ||||||||
| E1 | 5,874 | 19.66 | % | 100,496,800 | ||||||||
| E2 | 5,879 | 20.30 | % | 102,118,875 | ||||||||
| E3 | 4,735 | 20.86 | % | 84,333,850 | ||||||||
| E4 | 4,110 | 21.49 | % | 74,804,150 | ||||||||
| E5 | 3,501 | 22.02 | % | 63,564,950 | ||||||||
| F1 | 2,797 | 22.65 | % | 50,619,500 | ||||||||
| F2 | 2,188 | 23.04 | % | 42,007,525 | ||||||||
| F3 | 1,950 | 23.59 | % | 35,166,325 | ||||||||
| F4 | 1,499 | 23.86 | % | 29,065,450 | ||||||||
| F5 | 1,098 | 24.09 | % | 23,146,075 | ||||||||
| G1 | 783 | 24.42 | % | 16,455,125 | ||||||||
| G2 | 564 | 24.52 | % | 11,622,100 | ||||||||
| G3 | 397 | 24.63 | % | 8,547,700 | ||||||||
| G4 | 279 | 23.87 | % | 5,951,000 | ||||||||
| G5 | 248 | 23.89 | % | 4,878,200 | ||||||||
|
|
|
|
|
|||||||||
| Total | 333,475 | 13.98 | % | $ | 4,687,303,425 | |||||||
|
|
|
|
|
|||||||||
31
Table of Contents
The following table presents aggregated consumer reporting agency information for standard program loans issued from our inception to June 30, 2014, grouped by the loan grade assigned by us. This information is reported in the table as of the time of the loan application. As used in this table, “Delinquencies in the Last Two Years” means the number of 30+ days past-due incidences of delinquency in the borrower’s credit file for the preceding two years from the date of loan application. We do not independently verify this information. All figures other than loan grade are agency reported at the time of application.
Consumer Reporting Agency Information for Standard Program Loans Issued from Inception to June 30, 2014, Grouped by Grade
| Loan Grade |
Average FICO |
Average Open Credit Lines |
Average Total Credit Lines |
Average Revolving Credit Balance |
Average Revolving Line Utilization |
Average Inquiries in the Last Six Months |
Average Delinquencies in the Last Two Years |
Average Months Since Last Delinquency |
||||||||||||||||||||||||
| A1 |
770 | 11 | 27 | $ | 14,070 | 25.75 | % | 0 | 0 | 41 | ||||||||||||||||||||||
| A2 |
751 | 11 | 26 | 14,987 | 32.02 | % | 1 | 0 | 39 | |||||||||||||||||||||||
| A3 |
740 | 11 | 26 | 16,726 | 37.25 | % | 1 | 0 | 38 | |||||||||||||||||||||||
| A4 |
730 | 11 | 25 | 16,361 | 42.45 | % | 1 | 0 | 37 | |||||||||||||||||||||||
| A5 |
722 | 11 | 25 | 17,590 | 46.47 | % | 1 | 0 | 37 | |||||||||||||||||||||||
| B1 |
713 | 11 | 25 | 15,733 | 49.38 | % | 1 | 0 | 36 | |||||||||||||||||||||||
| B2 |
707 | 11 | 25 | 16,168 | 52.57 | % | 1 | 0 | 35 | |||||||||||||||||||||||
| B3 |
701 | 11 | 24 | 15,400 | 55.17 | % | 1 | 0 | 35 | |||||||||||||||||||||||
| B4 |
698 | 11 | 25 | 15,459 | 56.42 | % | 1 | 0 | 35 | |||||||||||||||||||||||
| B5 |
695 | 11 | 24 | 14,729 | 57.72 | % | 1 | 0 | 35 | |||||||||||||||||||||||
| C1 |
693 | 11 | 24 | 15,259 | 58.42 | % | 1 | 0 | 34 | |||||||||||||||||||||||
| C2 |
692 | 11 | 24 | 15,060 | 59.80 | % | 1 | 0 | 34 | |||||||||||||||||||||||
| C3 |
691 | 11 | 25 | 15,685 | 59.88 | % | 1 | 0 | 34 | |||||||||||||||||||||||
| C4 |
688 | 11 | 25 | 15,992 | 61.64 | % | 1 | 0 | 34 | |||||||||||||||||||||||
| C5 |
687 | 11 | 25 | 16,093 | 62.27 | % | 1 | 0 | 33 | |||||||||||||||||||||||
| D1 |
684 | 11 | 24 | 15,531 | 63.32 | % | 1 | 0 | 34 | |||||||||||||||||||||||
| D2 |
684 | 11 | 24 | 15,372 | 63.50 | % | 1 | 0 | 34 | |||||||||||||||||||||||
| D3 |
684 | 11 | 24 | 15,253 | 63.73 | % | 1 | 0 | 34 | |||||||||||||||||||||||
| D4 |
684 | 11 | 24 | 15,582 | 64.71 | % | 1 | 0 | 34 | |||||||||||||||||||||||
| D5 |
684 | 11 | 24 | 16,541 | 65.24 | % | 1 | 0 | 34 | |||||||||||||||||||||||
| E1 |
683 | 11 | 25 | 16,315 | 65.74 | % | 1 | 0 | 33 | |||||||||||||||||||||||
| E2 |
683 | 11 | 25 | 16,573 | 65.53 | % | 1 | 0 | 32 | |||||||||||||||||||||||
| E3 |
681 | 11 | 25 | 17,181 | 66.83 | % | 1 | 0 | 33 | |||||||||||||||||||||||
| E4 |
681 | 11 | 25 | 17,632 | 67.25 | % | 1 | 0 | 33 | |||||||||||||||||||||||
| E5 |
680 | 11 | 25 | 17,857 | 67.45 | % | 1 | 0 | 32 | |||||||||||||||||||||||
| F1 |
679 | 11 | 25 | 17,615 | 68.25 | % | 1 | 0 | 32 | |||||||||||||||||||||||
| F2 |
679 | 11 | 25 | 17,451 | 68.16 | % | 1 | 0 | 31 | |||||||||||||||||||||||
| F3 |
678 | 11 | 24 | 16,617 | 67.93 | % | 1 | 0 | 31 | |||||||||||||||||||||||
| F4 |
677 | 12 | 25 | 17,452 | 68.87 | % | 2 | 0 | 31 | |||||||||||||||||||||||
| F5 |
677 | 12 | 26 | 18,617 | 69.51 | % | 2 | 0 | 32 | |||||||||||||||||||||||
| G1 |
676 | 12 | 26 | 18,206 | 68.58 | % | 2 | 1 | 29 | |||||||||||||||||||||||
| G2 |
675 | 12 | 26 | 20,885 | 70.61 | % | 2 | 0 | 28 | |||||||||||||||||||||||
| G3 |
675 | 12 | 26 | 19,490 | 71.79 | % | 2 | 1 | 28 | |||||||||||||||||||||||
| G4 |
673 | 13 | 29 | 23,623 | 70.09 | % | 2 | 0 | 31 | |||||||||||||||||||||||
| G5 |
671 | 13 | 28 | 30,452 | 71.08 | % | 3 | 0 | 29 | |||||||||||||||||||||||
| Average |
700 | 11 | 25 | $ | 15,868 | 56.44 | % | 1 | 0 | 34 | ||||||||||||||||||||||
32
Table of Contents
The following table presents additional aggregated information for standard program loans issued from our inception to June 30, 2014, about current and paid off standard program loans, grouped by the loan grade assigned by us.
| Loan Grade |
Number of Current Loans |
Current Loan Outstanding Principal ($) |
Number of Loans Fully Paid |
Fully Paid ($) | Fully Paid (%) of Originated Issued Loans |
Number of All Issued Loans |
Total Origination Amount for All Issued Loans |
|||||||||||||||||||||
| A1 | 4,802 | $ | 42,536,991 | 1,629 | $ | 14,550,625 | 17.55 | % | 6,941 | $ | 82,891,375 | |||||||||||||||||
| A2 | 5,034 | 48,112,822 | 1,989 | 16,670,225 | 18.57 | % | 7,510 | 89,761,975 | ||||||||||||||||||||
| A3 | 6,274 | 66,875,229 | 2,346 | 21,706,975 | 18.23 | % | 9,123 | 119,070,575 | ||||||||||||||||||||
| A4 | 9,383 | 96,155,788 | 3,421 | 35,246,400 | 19.44 | % | 13,831 | 181,347,375 | ||||||||||||||||||||
| A5 | 10,930 | 120,918,573 | 3,449 | 37,384,000 | 17.55 | % | 15,545 | 213,040,800 | ||||||||||||||||||||
| B1 | 12,802 | 125,884,391 | 2,840 | 30,490,025 | 14.44 | % | 16,954 | 211,144,425 | ||||||||||||||||||||
| B2 | 15,427 | 156,999,071 | 3,375 | 38,902,000 | 14.64 | % | 20,318 | 265,805,625 | ||||||||||||||||||||
| B3 | 18,156 | 173,109,258 | 4,368 | 51,191,475 | 16.45 | % | 24,570 | 311,263,425 | ||||||||||||||||||||
| B4 | 17,023 | 174,914,895 | 3,866 | 45,401,050 | 14.95 | % | 23,088 | 303,777,975 | ||||||||||||||||||||
| B5 | 12,931 | 129,981,257 | 3,351 | 38,155,675 | 16.64 | % | 18,165 | 229,287,275 | ||||||||||||||||||||
| C1 | 14,031 | 146,408,953 | 3,126 | 35,880,750 | 14.32 | % | 19,212 | 250,576,350 | ||||||||||||||||||||
| C2 | 13,713 | 153,388,040 | 3,043 | 36,012,425 | 14.10 | % | 18,906 | 255,467,450 | ||||||||||||||||||||
| C3 | 13,410 | 166,402,489 | 2,362 | 28,160,950 | 11.06 | % | 17,799 | 254,678,425 | ||||||||||||||||||||
| C4 | 12,608 | 163,835,750 | 2,250 | 27,411,500 | 11.09 | % | 16,730 | 247,167,750 | ||||||||||||||||||||
| C5 | 11,818 | 159,520,359 | 2,074 | 25,593,900 | 10.70 | % | 15,760 | 239,100,350 | ||||||||||||||||||||
| D1 | 9,644 | 120,438,635 | 1,840 | 22,313,950 | 11.70 | % | 13,291 | 190,681,000 | ||||||||||||||||||||
| D2 | 8,344 | 99,360,797 | 1,803 | 21,374,200 | 12.93 | % | 11,922 | 165,257,475 | ||||||||||||||||||||
| D3 | 7,229 | 87,785,225 | 1,533 | 19,495,200 | 13.40 | % | 10,208 | 145,526,925 | ||||||||||||||||||||
| D4 | 6,737 | 89,849,685 | 1,408 | 18,868,375 | 12.70 | % | 9,633 | 148,622,600 | ||||||||||||||||||||
| D5 | 5,667 | 78,369,572 | 1,204 | 17,932,100 | 13.79 | % | 8,067 | 130,056,650 | ||||||||||||||||||||
| E1 | 4,075 | 61,134,898 | 801 | 12,385,175 | 12.32 | % | 5,874 | 100,496,800 | ||||||||||||||||||||
| E2 | 4,086 | 62,227,058 | 821 | 12,952,150 | 12.68 | % | 5,879 | 102,118,875 | ||||||||||||||||||||
| E3 | 3,304 | 52,480,590 | 666 | 10,649,350 | 12.63 | % | 4,735 | 84,333,850 | ||||||||||||||||||||
| E4 | 2,814 | 44,601,059 | 584 | 10,165,450 | 13.59 | % | 4,110 | 74,804,150 | ||||||||||||||||||||
| E5 | 2,414 | 38,140,459 | 498 | 8,717,825 | 13.71 | % | 3,501 | 63,564,950 | ||||||||||||||||||||
| F1 | 1,931 | 30,032,087 | 386 | 6,722,725 | 13.28 | % | 2,797 | 50,619,500 | ||||||||||||||||||||
| F2 | 1,511 | 25,230,686 | 325 | 6,018,200 | 14.33 | % | 2,188 | 42,007,525 | ||||||||||||||||||||
| F3 | 1,345 | 21,027,640 | 269 | 4,938,650 | 14.04 | % | 1,950 | 35,166,325 | ||||||||||||||||||||
| F4 | 1,010 | 17,234,832 | 198 | 3,662,300 | 12.60 | % | 1,499 | 29,065,450 | ||||||||||||||||||||
| F5 | 725 | 13,283,448 | 152 | 3,117,900 | 13.47 | % | 1,098 | 23,146,075 | ||||||||||||||||||||
| G1 | 502 | 9,434,457 | 121 | 2,493,225 | 15.15 | % | 783 | 16,455,125 | ||||||||||||||||||||
| G2 | 361 | 6,582,725 | 84 | 1,641,600 | 14.12 | % | 564 | 11,622,100 | ||||||||||||||||||||
| G3 | 244 | 4,817,971 | 69 | 1,406,600 | 16.46 | % | 397 | 8,547,700 | ||||||||||||||||||||
| G4 | 145 | 2,747,442 | 63 | 1,221,800 | 20.53 | % | 279 | 5,951,000 | ||||||||||||||||||||
| G5 | 117 | 2,418,298 | 66 | 953,550 | 19.55 | % | 248 | 4,878,200 | ||||||||||||||||||||
|
|
|
|
|
|
|
|
|
|
|
|
|
|||||||||||||||||
| Total | 240,547 | $ | 2,792,241,430 | 56,380 | $ | 669,788,300 | 14.29 | % | 333,475 | $ | 4,687,303,425 | |||||||||||||||||
|
|
|
|
|
|
|
|
|
|
|
|
|
|||||||||||||||||
33
Table of Contents
The following graph presents the dollar weighted average interest rate for standard program loans issued from inception to June 30, 2014, by grade.
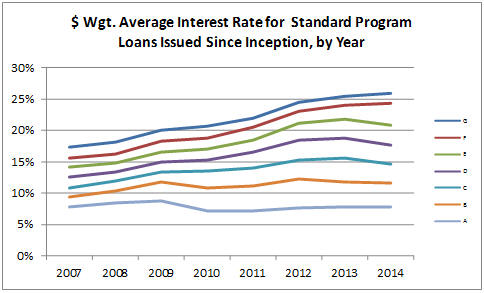
34
Table of Contents
The following table presents outstanding standard program loan balances in dollars, delinquent standard program loan balances in dollars, principal amount of standard program loans charged-off during the quarter, delinquency rate and annualized charge-off rate as of June 30, 2014. This information excludes standard program loans that we classified as identity theft. In cases of verified identity theft, we write-off the standard program loan and pay the holder of the related notes or certificates an amount equal to the unpaid principal balances due. Dollars presented below in thousands.
| Outstandings (1) | ||||||||||||||||||||||||||||||||||||||||||||||||
| 2014-Q2 | 2014-Q1 | 2013-Q4 | 2013-Q3 | 2013-Q2 | 2013-Q1 | 2012-Q4 | 2012-Q3 | 2012-Q2 | 2012-Q1 | 2011-Q4 | 2011-Q3 | |||||||||||||||||||||||||||||||||||||
| Total |
$ | 3,118,617 | $ | 2,630,408 | $ | 2,189,446 | $ | 1,750,365 | $ | 1,377,064 | $ | 1,058,994 | $ | 805,763 | $ | 614,889 | $ | 464,367 | $ | 372,220 | $ | 300,982 | $ | 242,941 | ||||||||||||||||||||||||
| Grade A |
409,525 | 352,276 | 295,722 | 230,596 | 199,205 | 167,636 | 130,845 | 108,620 | 89,352 | 74,014 | 56,698 | 45,181 | ||||||||||||||||||||||||||||||||||||
| Grade B |
829,946 | 741,021 | 645,779 | 524,253 | 416,396 | 328,331 | 241,219 | 184,015 | 136,785 | 108,647 | 86,459 | 69,078 | ||||||||||||||||||||||||||||||||||||
| Grade C |
878,362 | 736,004 | 595,967 | 471,686 | 351,184 | 253,472 | 169,706 | 122,985 | 89,615 | 70,357 | 57,785 | 47,470 | ||||||||||||||||||||||||||||||||||||
| Grade D |
548,745 | 423,880 | 325,608 | 249,749 | 199,912 | 153,861 | 127,701 | 94,518 | 67,603 | 53,708 | 44,555 | 37,435 | ||||||||||||||||||||||||||||||||||||
| Grade E |
299,648 | 239,745 | 200,315 | 166,245 | 130,030 | 99,329 | 86,250 | 65,673 | 50,562 | 41,236 | 34,243 | 26,804 | ||||||||||||||||||||||||||||||||||||
| Grade F |
121,781 | 110,870 | 102,390 | 88,311 | 66,519 | 46,617 | 40,439 | 30,864 | 23,707 | 18,277 | 15,680 | 12,230 | ||||||||||||||||||||||||||||||||||||
| Grade G |
30,610 | 26,612 | 23,665 | 19,525 | 13,818 | 9,748 | 9,603 | 8,214 | 6,743 | 5,981 | 5,562 | 4,743 | ||||||||||||||||||||||||||||||||||||
| Outstandings of Delinquent Loans (2) | ||||||||||||||||||||||||||||||||||||||||||||||||
| 2014-Q2 | 2014-Q1 | 2013-Q4 | 2013-Q3 | 2013-Q2 | 2013-Q1 | 2012-Q4 | 2012-Q3 | 2012-Q2 | 2012-Q1 | 2011-Q4 | 2011-Q3 | |||||||||||||||||||||||||||||||||||||
| Total |
$ | 39,498 | $ | 33,644 | $ | 32,904 | $ | 24,628 | $ | 17,262 | $ | 14,850 | $ | 12,789 | $ | 9,587 | $ | 7,375 | $ | 5,527 | $ | 5,850 | $ | 5,502 | ||||||||||||||||||||||||
| Grade A |
1,276 | 1,290 | 1,373 | 1,172 | 1,037 | 986 | 845 | 646 | 502 | 244 | 356 | 273 | ||||||||||||||||||||||||||||||||||||
| Grade B |
6,064 | 5,981 | 6,243 | 4,975 | 3,485 | 2,866 | 2,283 | 1,852 | 1,449 | 1,283 | 1,110 | 1,061 | ||||||||||||||||||||||||||||||||||||
| Grade C |
10,197 | 7,894 | 7,994 | 5,763 | 3,588 | 3,026 | 2,552 | 1,991 | 1,300 | 1,163 | 1,172 | 1,204 | ||||||||||||||||||||||||||||||||||||
| Grade D |
8,752 | 7,599 | 7,215 | 5,393 | 3,964 | 3,605 | 2,870 | 2,070 | 1,492 | 1,163 | 1,364 | 1,279 | ||||||||||||||||||||||||||||||||||||
| Grade E |
7,275 | 5,938 | 5,623 | 4,298 | 2,681 | 2,335 | 2,329 | 1,613 | 1,240 | 1,009 | 951 | 849 | ||||||||||||||||||||||||||||||||||||
| Grade F |
4,778 | 3,719 | 3,552 | 2,502 | 1,970 | 1,450 | 1,461 | 1,014 | 1,086 | 438 | 582 | 532 | ||||||||||||||||||||||||||||||||||||
| Grade G |
1,156 | 1,223 | 904 | 525 | 537 | 582 | 449 | 401 | 306 | 227 | 315 | 304 | ||||||||||||||||||||||||||||||||||||
| Charge-Off Amount (3) | ||||||||||||||||||||||||||||||||||||||||||||||||
| 2014-Q2 | 2014-Q1 | 2013-Q4 | 2013-Q3 | 2013-Q2 | 2013-Q1 | 2012-Q4 | 2012-Q3 | 2012-Q2 | 2012-Q1 | 2011-Q4 | 2011-Q3 | |||||||||||||||||||||||||||||||||||||
| Total |
$ | 26,610 | $ | 25,788 | $ | 18,425 | $ | 12,500 | $ | 10,598 | $ | 8,950 | $ | 6,117 | $ | 4,878 | $ | 3,342 | $ | 3,366 | $ | 2,888 | $ | 1,757 | ||||||||||||||||||||||||
| Grade A |
1,005 | 1,052 | 906 | 849 | 858 | 655 | 516 | 361 | 130 | 226 | 157 | 107 | ||||||||||||||||||||||||||||||||||||
| Grade B |
4,908 | 5,228 | 3,692 | 2,731 | 2,156 | 1,833 | 1,265 | 932 | 709 | 602 | 551 | 366 | ||||||||||||||||||||||||||||||||||||
| Grade C |
6,422 | 6,639 | 4,645 | 2,574 | 2,122 | 1,672 | 1,252 | 972 | 868 | 722 | 728 | 500 | ||||||||||||||||||||||||||||||||||||
| Grade D |
6,007 | 5,531 | 4,105 | 2,724 | 2,585 | 1,880 | 1,283 | 853 | 694 | 653 | 588 | 378 | ||||||||||||||||||||||||||||||||||||
| Grade E |
4,554 | 4,066 | 3,113 | 1,921 | 1,468 | 1,608 | 963 | 854 | 632 | 554 | 470 | 289 | ||||||||||||||||||||||||||||||||||||
| Grade F |
2,718 | 2,707 | 1,661 | 1,261 | 992 | 1,029 | 607 | 736 | 220 | 372 | 288 | 64 | ||||||||||||||||||||||||||||||||||||
| Grade G |
996 | 565 | 303 | 440 | 417 | 273 | 232 | 170 | 89 | 237 | 106 | 53 | ||||||||||||||||||||||||||||||||||||
| Delinquent Rate (4) | ||||||||||||||||||||||||||||||||||||||||||||||||
| 2014-Q2 | 2014-Q1 | 2013-Q4 | 2013-Q3 | 2013-Q2 | 2013-Q1 | 2012-Q4 | 2012-Q3 | 2012-Q2 | 2012-Q1 | 2011-Q4 | 2011-Q3 | |||||||||||||||||||||||||||||||||||||
| Total |
1.27 | % | 1.28 | % | 1.50 | % | 1.41 | % | 1.25 | % | 1.40 | % | 1.59 | % | 1.56 | % | 1.59 | % | 1.48 | % | 1.94 | % | 2.26 | % | ||||||||||||||||||||||||
| Grade A |
0.31 | % | 0.37 | % | 0.46 | % | 0.51 | % | 0.52 | % | 0.59 | % | 0.65 | % | 0.59 | % | 0.56 | % | 0.33 | % | 0.63 | % | 0.60 | % | ||||||||||||||||||||||||
| Grade B |
0.73 | % | 0.81 | % | 0.97 | % | 0.95 | % | 0.84 | % | 0.87 | % | 0.95 | % | 1.01 | % | 1.06 | % | 1.18 | % | 1.28 | % | 1.54 | % | ||||||||||||||||||||||||
| Grade C |
1.16 | % | 1.07 | % | 1.34 | % | 1.22 | % | 1.02 | % | 1.19 | % | 1.50 | % | 1.62 | % | 1.45 | % | 1.65 | % | 2.03 | % | 2.54 | % | ||||||||||||||||||||||||
| Grade D |
1.59 | % | 1.79 | % | 2.22 | % | 2.16 | % | 1.98 | % | 2.34 | % | 2.25 | % | 2.19 | % | 2.21 | % | 2.17 | % | 3.06 | % | 3.42 | % | ||||||||||||||||||||||||
| Grade E |
2.43 | % | 2.48 | % | 2.81 | % | 2.59 | % | 2.06 | % | 2.35 | % | 2.70 | % | 2.46 | % | 2.45 | % | 2.45 | % | 2.78 | % | 3.17 | % | ||||||||||||||||||||||||
| Grade F |
3.92 | % | 3.35 | % | 3.47 | % | 2.83 | % | 2.96 | % | 3.11 | % | 3.61 | % | 3.29 | % | 4.58 | % | 2.40 | % | 3.71 | % | 4.35 | % | ||||||||||||||||||||||||
| Grade G |
3.78 | % | 4.60 | % | 3.82 | % | 2.69 | % | 3.89 | % | 5.97 | % | 4.67 | % | 4.88 | % | 4.54 | % | 3.79 | % | 5.66 | % | 6.41 | % | ||||||||||||||||||||||||
| Annualized Charge-off Rate (5) | ||||||||||||||||||||||||||||||||||||||||||||||||
| 2014-Q2 | 2014-Q1 | 2013-Q4 | 2013-Q3 | 2013-Q2 | 2013-Q1 | 2012-Q4 | 2012-Q3 | 2012-Q2 | 2012-Q1 | 2011-Q4 | 2011-Q3 | |||||||||||||||||||||||||||||||||||||
| Total |
3.41 | % | 3.92 | % | 3.37 | % | 2.86 | % | 3.08 | % | 3.38 | % | 3.04 | % | 3.17 | % | 2.88 | % | 3.62 | % | 3.84 | % | 2.89 | % | ||||||||||||||||||||||||
| Grade A |
0.98 | % | 1.19 | % | 1.23 | % | 1.47 | % | 1.72 | % | 1.56 | % | 1.58 | % | 1.33 | % | 0.58 | % | 1.22 | % | 1.11 | % | 0.95 | % | ||||||||||||||||||||||||
| Grade B |
2.37 | % | 2.82 | % | 2.29 | % | 2.08 | % | 2.07 | % | 2.23 | % | 2.10 | % | 2.03 | % | 2.07 | % | 2.22 | % | 2.55 | % | 2.12 | % | ||||||||||||||||||||||||
| Grade C |
2.92 | % | 3.61 | % | 3.12 | % | 2.18 | % | 2.42 | % | 2.64 | % | 2.95 | % | 3.16 | % | 3.87 | % | 4.11 | % | 5.04 | % | 4.22 | % | ||||||||||||||||||||||||
| Grade D |
4.38 | % | 5.22 | % | 5.04 | % | 4.36 | % | 5.17 | % | 4.89 | % | 4.02 | % | 3.61 | % | 4.11 | % | 4.86 | % | 5.28 | % | 4.04 | % | ||||||||||||||||||||||||
| Grade E |
6.08 | % | 6.78 | % | 6.22 | % | 4.62 | % | 4.52 | % | 6.47 | % | 4.47 | % | 5.20 | % | 5.00 | % | 5.37 | % | 5.49 | % | 4.32 | % | ||||||||||||||||||||||||
| Grade F |
8.93 | % | 9.77 | % | 6.49 | % | 5.71 | % | 5.97 | % | 8.83 | % | 6.00 | % | 9.54 | % | 3.72 | % | 8.14 | % | 7.35 | % | 2.09 | % | ||||||||||||||||||||||||
| Grade G |
13.02 | % | 8.49 | % | 5.13 | % | 9.02 | % | 12.06 | % | 11.21 | % | 9.65 | % | 8.27 | % | 5.26 | % | 15.83 | % | 7.63 | % | 4.44 | % | ||||||||||||||||||||||||
| 1) | Principal balance at quarter-end. |
| 2) | Principal balance as of quarter-end for standard program loans that are “Late 31-120” or in Default status at quarter-end. |
| 3) | Principal balance charged off during the quarter. |
| 4) | Principal balance at quarter-end for standard program loans that are “Late 31-120” or in Default status at quarter-end divided by Principal balance at quarter-end. |
| 5) | Principal balance charged off during the quarter multiplied by four then divided by principal balance at quarter-end. |
35
Table of Contents
The following table presents dollars collected on delinquent standard program loans and recoveries received on charged-off standard program loans (which include collection recoveries on charged-off standard program loans and proceeds from the sale of charged-off standard program loans), in the quarter presented. This information excludes standard program loans that we classified as identity theft. In cases of verified identity theft, we write-off the standard program loan and pay the holder of the related notes or certificates an amount equal to the unpaid principal balances due. Dollars presented below in thousands.
| Dollars Collected From Delinquent Loans (1) | ||||||||||||||||||||||||||||||||||||||||||||||||
| 2014-Q2 | 2014-Q1 | 2013-Q4 | 2013-Q3 | 2013-Q2 | 2013-Q1 | 2012-Q4 | 2012-Q3 | 2012-Q2 | 2012-Q1 | 2011-Q4 | 2011-Q3 | |||||||||||||||||||||||||||||||||||||
| Total |
$ | 2,448 | $ | 2,660 | $ | 1,892 | $ | 1,207 | $ | 943 | $ | 1,029 | $ | 739 | $ | 652 | $ | 507 | $ | 681 | $ | 533 | $ | 424 | ||||||||||||||||||||||||
| Grade A |
129 | 165 | 82 | 81 | 66 | 96 | 66 | 45 | 44 | 40 | 30 | 38 | ||||||||||||||||||||||||||||||||||||
| Grade B |
492 | 533 | 392 | 244 | 159 | 237 | 151 | 161 | 128 | 143 | 109 | 78 | ||||||||||||||||||||||||||||||||||||
| Grade C |
575 | 588 | 467 | 242 | 228 | 188 | 154 | 105 | 77 | 171 | 149 | 103 | ||||||||||||||||||||||||||||||||||||
| Grade D |
539 | 609 | 410 | 291 | 187 | 191 | 156 | 139 | 106 | 137 | 122 | 106 | ||||||||||||||||||||||||||||||||||||
| Grade E |
402 | 397 | 227 | 185 | 168 | 137 | 121 | 106 | 77 | 136 | 74 | 58 | ||||||||||||||||||||||||||||||||||||
| Grade F |
233 | 256 | 251 | 141 | 71 | 111 | 51 | 62 | 61 | 33 | 27 | 27 | ||||||||||||||||||||||||||||||||||||
| Grade G |
78 | 112 | 63 | 23 | 64 | 69 | 40 | 34 | 14 | 21 | 22 | 14 | ||||||||||||||||||||||||||||||||||||
| Recoveries (2) | ||||||||||||||||||||||||||||||||||||||||||||||||
| 2014-Q2 | 2014-Q1 | 2013-Q4 | 2013-Q3 | 2013-Q2 | 2013-Q1 | 2012-Q4 | 2012-Q3 | 2012-Q2 | 2012-Q1 | 2011-Q4 | 2011-Q3 | |||||||||||||||||||||||||||||||||||||
| Total |
$ | 2,566 | $ | 1,733 | $ | 704 | $ | 463 | $ | 460 | $ | 549 | $ | 105 | $ | 78 | $ | 383 | $ | 89 | $ | 36 | $ | 91 | ||||||||||||||||||||||||
| Grade A |
81 | 66 | 42 | 30 | 35 | 39 | 9 | 8 | 15 | 3 | 3 | 19 | ||||||||||||||||||||||||||||||||||||
| Grade B |
462 | 377 | 126 | 83 | 66 | 120 | 10 | 2 | 76 | 10 | 6 | 5 | ||||||||||||||||||||||||||||||||||||
| Grade C |
576 | 375 | 178 | 90 | 101 | 107 | 39 | 27 | 84 | 22 | 10 | 23 | ||||||||||||||||||||||||||||||||||||
| Grade D |
533 | 369 | 150 | 104 | 103 | 113 | 11 | 14 | 110 | 15 | 6 | 15 | ||||||||||||||||||||||||||||||||||||
| Grade E |
472 | 317 | 117 | 88 | 76 | 88 | 14 | 13 | 54 | 12 | 4 | 3 | ||||||||||||||||||||||||||||||||||||
| Grade F |
355 | 199 | 68 | 47 | 59 | 58 | 8 | 2 | 24 | 18 | 4 | 23 | ||||||||||||||||||||||||||||||||||||
| Grade G |
87 | 30 | 23 | 21 | 20 | 24 | 14 | 12 | 20 | 9 | 3 | 3 | ||||||||||||||||||||||||||||||||||||
| 1) | Dollars collected during the quarter for standard program loans that are in “Late 31-120” or in Default status. |
| 2) | Total payments received from borrowers of charged-off standard program loans and proceeds from sale of charged-off standard program loans. |
36
Table of Contents
Cumulative Charge-off Rate – 36 Month Standard Program Loans
The graph and corresponding tables below show the cumulative net lifetime charge-offs for standard program loans with original terms of 36 months by grade and by annual vintage booked from January 1, 2008 through June 30, 2014, as a percentage of the aggregate principal amount of originations. The charge-offs are tracked by annual vintage, meaning each line represents all 36 month standard program loans originated in that year.
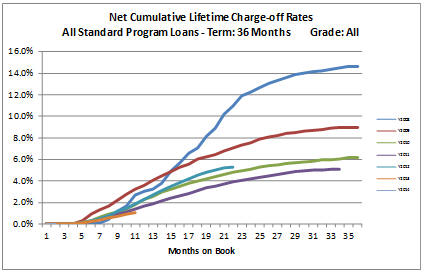
Net Cumulative Lifetime Charge-off Rates by Booking Year
All Standard Program Loans - Term: 36 Months Grade: All
| Mo # |
Y2008 | Y2009 | Y2010 | Y2011 | Y2012 | Y2013 | Y2014 | |||||||||||||||||||||
| 1 | 0.0 | % | 0.0 | % | 0.0 | % | 0.0 | % | 0.0 | % | 0.0 | % | 0.0 | % | ||||||||||||||
| 2 | 0.0 | % | 0.0 | % | 0.0 | % | 0.0 | % | 0.0 | % | 0.0 | % | 0.0 | % | ||||||||||||||
| 3 | 0.0 | % | 0.0 | % | 0.0 | % | 0.0 | % | 0.0 | % | 0.0 | % | ||||||||||||||||
| 4 | 0.0 | % | 0.0 | % | 0.0 | % | 0.0 | % | 0.0 | % | 0.0 | % | ||||||||||||||||
| 5 | 0.0 | % | 0.3 | % | 0.1 | % | 0.1 | % | 0.1 | % | 0.1 | % | ||||||||||||||||
| 6 | 0.0 | % | 0.9 | % | 0.3 | % | 0.3 | % | 0.3 | % | 0.2 | % | ||||||||||||||||
| 7 | 0.1 | % | 1.3 | % | 0.7 | % | 0.5 | % | 0.5 | % | 0.4 | % | ||||||||||||||||
| 8 | 0.4 | % | 1.6 | % | 0.9 | % | 0.7 | % | 0.8 | % | 0.6 | % | ||||||||||||||||
| 9 | 1.2 | % | 2.2 | % | 1.1 | % | 0.9 | % | 1.2 | % | 0.7 | % | ||||||||||||||||
| 10 | 1.7 | % | 2.8 | % | 1.4 | % | 1.1 | % | 1.5 | % | 0.9 | % | ||||||||||||||||
| 11 | 2.7 | % | 3.2 | % | 1.8 | % | 1.4 | % | 1.9 | % | 1.1 | % | ||||||||||||||||
| 12 | 3.0 | % | 3.6 | % | 2.3 | % | 1.6 | % | 2.3 | % | ||||||||||||||||||
| 13 | 3.3 | % | 4.0 | % | 2.5 | % | 1.9 | % | 2.7 | % | ||||||||||||||||||
| 14 | 3.8 | % | 4.5 | % | 3.0 | % | 2.1 | % | 3.1 | % | ||||||||||||||||||
| 15 | 4.9 | % | 4.8 | % | 3.2 | % | 2.4 | % | 3.5 | % | ||||||||||||||||||
| 16 | 5.7 | % | 5.3 | % | 3.5 | % | 2.6 | % | 3.9 | % | ||||||||||||||||||
| 17 | 6.6 | % | 5.5 | % | 3.8 | % | 2.8 | % | 4.2 | % | ||||||||||||||||||
| 18 | 7.1 | % | 6.0 | % | 4.0 | % | 3.1 | % | 4.5 | % | ||||||||||||||||||
| 19 | 8.1 | % | 6.2 | % | 4.2 | % | 3.4 | % | 4.8 | % | ||||||||||||||||||
| 20 | 8.9 | % | 6.4 | % | 4.4 | % | 3.5 | % | 5.0 | % | ||||||||||||||||||
| 21 | 10.2 | % | 6.8 | % | 4.6 | % | 3.7 | % | 5.2 | % | ||||||||||||||||||
| 22 | 10.9 | % | 7.0 | % | 4.8 | % | 3.9 | % | 5.3 | % | ||||||||||||||||||
| 23 | 11.9 | % | 7.3 | % | 5.0 | % | 4.0 | % | ||||||||||||||||||||
| 24 | 12.3 | % | 7.6 | % | 5.1 | % | 4.2 | % | ||||||||||||||||||||
| 25 | 12.6 | % | 7.9 | % | 5.3 | % | 4.3 | % | ||||||||||||||||||||
| 26 | 13.1 | % | 8.1 | % | 5.4 | % | 4.5 | % | ||||||||||||||||||||
| 27 | 13.3 | % | 8.2 | % | 5.5 | % | 4.6 | % | ||||||||||||||||||||
| 28 | 13.6 | % | 8.4 | % | 5.6 | % | 4.8 | % | ||||||||||||||||||||
| 29 | 13.9 | % | 8.5 | % | 5.7 | % | 4.9 | % | ||||||||||||||||||||
| 30 | 14.0 | % | 8.6 | % | 5.8 | % | 4.9 | % | ||||||||||||||||||||
| 31 | 14.1 | % | 8.7 | % | 5.9 | % | 5.0 | % | ||||||||||||||||||||
| 32 | 14.2 | % | 8.8 | % | 5.9 | % | 5.0 | % | ||||||||||||||||||||
| 33 | 14.3 | % | 8.9 | % | 6.0 | % | 5.1 | % | ||||||||||||||||||||
| 34 | 14.5 | % | 8.9 | % | 6.1 | % | 5.1 | % | ||||||||||||||||||||
| 35 | 14.6 | % | 9.0 | % | 6.1 | % | ||||||||||||||||||||||
| 36 | 14.7 | % | 9.0 | % | 6.2 | % | ||||||||||||||||||||||
37
Table of Contents
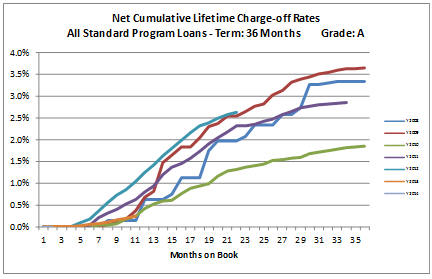
Net Cumulative Lifetime Charge-off Rates by Booking Year
All Standard Program Loans - Term: 36 Months Grade: A
| Mo # |
Y2008 | Y2009 | Y2010 | Y2011 | Y2012 | Y2013 | Y2014 | |||||||||||||||||||||
| 1 | 0.0 | % | 0.0 | % | 0.0 | % | 0.0 | % | 0.0 | % | 0.0 | % | 0.0 | % | ||||||||||||||
| 2 | 0.0 | % | 0.0 | % | 0.0 | % | 0.0 | % | 0.0 | % | 0.0 | % | 0.0 | % | ||||||||||||||
| 3 | 0.0 | % | 0.0 | % | 0.0 | % | 0.0 | % | 0.0 | % | 0.0 | % | ||||||||||||||||
| 4 | 0.0 | % | 0.0 | % | 0.0 | % | 0.0 | % | 0.0 | % | 0.0 | % | ||||||||||||||||
| 5 | 0.0 | % | 0.0 | % | 0.0 | % | 0.0 | % | 0.1 | % | 0.0 | % | ||||||||||||||||
| 6 | 0.0 | % | 0.0 | % | 0.0 | % | 0.0 | % | 0.2 | % | 0.1 | % | ||||||||||||||||
| 7 | 0.0 | % | 0.0 | % | 0.0 | % | 0.2 | % | 0.4 | % | 0.1 | % | ||||||||||||||||
| 8 | 0.1 | % | 0.1 | % | 0.0 | % | 0.3 | % | 0.6 | % | 0.1 | % | ||||||||||||||||
| 9 | 0.1 | % | 0.1 | % | 0.1 | % | 0.4 | % | 0.7 | % | 0.2 | % | ||||||||||||||||
| 10 | 0.1 | % | 0.2 | % | 0.2 | % | 0.5 | % | 0.8 | % | 0.2 | % | ||||||||||||||||
| 11 | 0.1 | % | 0.4 | % | 0.2 | % | 0.6 | % | 1.0 | % | 0.2 | % | ||||||||||||||||
| 12 | 0.6 | % | 0.7 | % | 0.4 | % | 0.8 | % | 1.2 | % | ||||||||||||||||||
| 13 | 0.6 | % | 0.8 | % | 0.5 | % | 0.9 | % | 1.4 | % | ||||||||||||||||||
| 14 | 0.6 | % | 1.5 | % | 0.6 | % | 1.2 | % | 1.6 | % | ||||||||||||||||||
| 15 | 0.8 | % | 1.6 | % | 0.6 | % | 1.4 | % | 1.8 | % | ||||||||||||||||||
| 16 | 1.1 | % | 1.8 | % | 0.8 | % | 1.5 | % | 2.0 | % | ||||||||||||||||||
| 17 | 1.1 | % | 1.8 | % | 0.9 | % | 1.6 | % | 2.2 | % | ||||||||||||||||||
| 18 | 1.1 | % | 2.1 | % | 0.9 | % | 1.7 | % | 2.3 | % | ||||||||||||||||||
| 19 | 1.8 | % | 2.3 | % | 1.0 | % | 1.9 | % | 2.4 | % | ||||||||||||||||||
| 20 | 2.0 | % | 2.4 | % | 1.2 | % | 2.0 | % | 2.5 | % | ||||||||||||||||||
| 21 | 2.0 | % | 2.5 | % | 1.3 | % | 2.2 | % | 2.6 | % | ||||||||||||||||||
| 22 | 2.0 | % | 2.5 | % | 1.3 | % | 2.3 | % | 2.6 | % | ||||||||||||||||||
| 23 | 2.1 | % | 2.6 | % | 1.4 | % | 2.3 | % | ||||||||||||||||||||
| 24 | 2.3 | % | 2.8 | % | 1.4 | % | 2.4 | % | ||||||||||||||||||||
| 25 | 2.3 | % | 2.8 | % | 1.4 | % | 2.4 | % | ||||||||||||||||||||
| 26 | 2.3 | % | 3.0 | % | 1.5 | % | 2.5 | % | ||||||||||||||||||||
| 27 | 2.6 | % | 3.1 | % | 1.5 | % | 2.6 | % | ||||||||||||||||||||
| 28 | 2.6 | % | 3.3 | % | 1.6 | % | 2.6 | % | ||||||||||||||||||||
| 29 | 2.7 | % | 3.4 | % | 1.6 | % | 2.7 | % | ||||||||||||||||||||
| 30 | 3.3 | % | 3.4 | % | 1.7 | % | 2.8 | % | ||||||||||||||||||||
| 31 | 3.3 | % | 3.5 | % | 1.7 | % | 2.8 | % | ||||||||||||||||||||
| 32 | 3.3 | % | 3.5 | % | 1.8 | % | 2.8 | % | ||||||||||||||||||||
| 33 | 3.3 | % | 3.6 | % | 1.8 | % | 2.8 | % | ||||||||||||||||||||
| 34 | 3.3 | % | 3.6 | % | 1.8 | % | 2.9 | % | ||||||||||||||||||||
| 35 | 3.3 | % | 3.6 | % | 1.8 | % | ||||||||||||||||||||||
| 36 | 3.3 | % | 3.6 | % | 1.9 | % | ||||||||||||||||||||||
38
Table of Contents
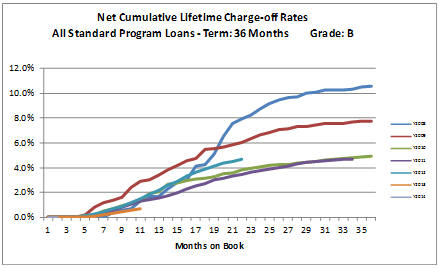
Net Cumulative Lifetime Charge-off Rates by Booking Year
All Standard Program Loans - Term: 36 Months Grade: B
| Mo # |
Y2008 | Y2009 | Y2010 | Y2011 | Y2012 | Y2013 | Y2014 | |||||||||||||||||||||
| 1 | 0.0 | % | 0.0 | % | 0.0 | % | 0.0 | % | 0.0 | % | 0.0 | % | 0.0 | % | ||||||||||||||
| 2 | 0.0 | % | 0.0 | % | 0.0 | % | 0.0 | % | 0.0 | % | 0.0 | % | 0.0 | % | ||||||||||||||
| 3 | 0.0 | % | 0.0 | % | 0.0 | % | 0.0 | % | 0.0 | % | 0.0 | % | ||||||||||||||||
| 4 | 0.0 | % | 0.0 | % | 0.0 | % | 0.0 | % | 0.0 | % | 0.0 | % | ||||||||||||||||
| 5 | 0.0 | % | 0.2 | % | 0.1 | % | 0.1 | % | 0.1 | % | 0.0 | % | ||||||||||||||||
| 6 | 0.0 | % | 0.8 | % | 0.2 | % | 0.2 | % | 0.2 | % | 0.1 | % | ||||||||||||||||
| 7 | 0.0 | % | 1.2 | % | 0.5 | % | 0.4 | % | 0.5 | % | 0.2 | % | ||||||||||||||||
| 8 | 0.4 | % | 1.4 | % | 0.7 | % | 0.6 | % | 0.7 | % | 0.3 | % | ||||||||||||||||
| 9 | 0.6 | % | 1.6 | % | 0.9 | % | 0.8 | % | 0.9 | % | 0.4 | % | ||||||||||||||||
| 10 | 0.7 | % | 2.4 | % | 1.1 | % | 1.1 | % | 1.2 | % | 0.6 | % | ||||||||||||||||
| 11 | 1.3 | % | 2.9 | % | 1.3 | % | 1.3 | % | 1.5 | % | 0.7 | % | ||||||||||||||||
| 12 | 1.7 | % | 3.0 | % | 1.9 | % | 1.4 | % | 1.9 | % | ||||||||||||||||||
| 13 | 1.7 | % | 3.4 | % | 2.1 | % | 1.6 | % | 2.2 | % | ||||||||||||||||||
| 14 | 2.3 | % | 3.8 | % | 2.7 | % | 1.7 | % | 2.6 | % | ||||||||||||||||||
| 15 | 2.8 | % | 4.2 | % | 2.8 | % | 2.0 | % | 2.9 | % | ||||||||||||||||||
| 16 | 3.0 | % | 4.5 | % | 3.0 | % | 2.3 | % | 3.3 | % | ||||||||||||||||||
| 17 | 4.1 | % | 4.8 | % | 3.1 | % | 2.5 | % | 3.6 | % | ||||||||||||||||||
| 18 | 4.3 | % | 5.5 | % | 3.2 | % | 2.7 | % | 3.9 | % | ||||||||||||||||||
| 19 | 5.1 | % | 5.5 | % | 3.3 | % | 3.0 | % | 4.1 | % | ||||||||||||||||||
| 20 | 6.5 | % | 5.7 | % | 3.5 | % | 3.1 | % | 4.4 | % | ||||||||||||||||||
| 21 | 7.5 | % | 5.8 | % | 3.6 | % | 3.3 | % | 4.5 | % | ||||||||||||||||||
| 22 | 7.9 | % | 6.0 | % | 3.8 | % | 3.5 | % | 4.7 | % | ||||||||||||||||||
| 23 | 8.3 | % | 6.3 | % | 3.9 | % | 3.6 | % | ||||||||||||||||||||
| 24 | 8.7 | % | 6.6 | % | 4.1 | % | 3.7 | % | ||||||||||||||||||||
| 25 | 9.1 | % | 6.8 | % | 4.2 | % | 3.9 | % | ||||||||||||||||||||
| 26 | 9.5 | % | 7.0 | % | 4.2 | % | 4.0 | % | ||||||||||||||||||||
| 27 | 9.6 | % | 7.1 | % | 4.3 | % | 4.1 | % | ||||||||||||||||||||
| 28 | 9.7 | % | 7.3 | % | 4.3 | % | 4.3 | % | ||||||||||||||||||||
| 29 | 10.0 | % | 7.3 | % | 4.4 | % | 4.4 | % | ||||||||||||||||||||
| 30 | 10.1 | % | 7.4 | % | 4.5 | % | 4.5 | % | ||||||||||||||||||||
| 31 | 10.2 | % | 7.5 | % | 4.6 | % | 4.6 | % | ||||||||||||||||||||
| 32 | 10.2 | % | 7.6 | % | 4.7 | % | 4.6 | % | ||||||||||||||||||||
| 33 | 10.2 | % | 7.6 | % | 4.7 | % | 4.7 | % | ||||||||||||||||||||
| 34 | 10.3 | % | 7.7 | % | 4.8 | % | 4.7 | % | ||||||||||||||||||||
| 35 | 10.5 | % | 7.7 | % | 4.8 | % | ||||||||||||||||||||||
| 36 | 10.6 | % | 7.7 | % | 4.9 | % | ||||||||||||||||||||||
39
Table of Contents
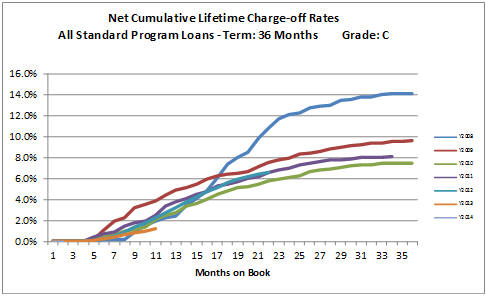
Net Cumulative Lifetime Charge-off Rates by Booking Year
All Standard Program Loans - Term: 36 Months Grade: C
| Mo # |
Y2008 | Y2009 | Y2010 | Y2011 | Y2012 | Y2013 | Y2014 | |||||||||||||||||||||
| 1 | 0.0 | % | 0.0 | % | 0.0 | % | 0.0 | % | 0.0 | % | 0.0 | % | 0.0 | % | ||||||||||||||
| 2 | 0.0 | % | 0.0 | % | 0.0 | % | 0.0 | % | 0.0 | % | 0.0 | % | 0.0 | % | ||||||||||||||
| 3 | 0.0 | % | 0.0 | % | 0.0 | % | 0.0 | % | 0.0 | % | 0.0 | % | ||||||||||||||||
| 4 | 0.0 | % | 0.0 | % | 0.0 | % | 0.0 | % | 0.0 | % | 0.0 | % | ||||||||||||||||
| 5 | 0.0 | % | 0.2 | % | 0.3 | % | 0.4 | % | 0.1 | % | 0.1 | % | ||||||||||||||||
| 6 | 0.2 | % | 1.2 | % | 0.5 | % | 0.8 | % | 0.3 | % | 0.2 | % | ||||||||||||||||
| 7 | 0.2 | % | 1.9 | % | 0.7 | % | 0.9 | % | 0.5 | % | 0.4 | % | ||||||||||||||||
| 8 | 0.2 | % | 2.3 | % | 1.0 | % | 1.5 | % | 0.9 | % | 0.6 | % | ||||||||||||||||
| 9 | 0.9 | % | 3.2 | % | 1.1 | % | 1.8 | % | 1.4 | % | 0.8 | % | ||||||||||||||||
| 10 | 1.6 | % | 3.6 | % | 1.4 | % | 1.9 | % | 1.8 | % | 1.0 | % | ||||||||||||||||
| 11 | 1.9 | % | 3.9 | % | 2.1 | % | 2.5 | % | 2.2 | % | 1.2 | % | ||||||||||||||||
| 12 | 2.2 | % | 4.4 | % | 2.5 | % | 3.4 | % | 2.7 | % | ||||||||||||||||||
| 13 | 2.4 | % | 4.9 | % | 2.8 | % | 3.8 | % | 3.2 | % | ||||||||||||||||||
| 14 | 3.5 | % | 5.1 | % | 3.4 | % | 4.1 | % | 3.8 | % | ||||||||||||||||||
| 15 | 4.1 | % | 5.5 | % | 3.7 | % | 4.5 | % | 4.3 | % | ||||||||||||||||||
| 16 | 4.8 | % | 5.9 | % | 4.0 | % | 4.8 | % | 4.7 | % | ||||||||||||||||||
| 17 | 6.1 | % | 6.3 | % | 4.5 | % | 5.3 | % | 5.1 | % | ||||||||||||||||||
| 18 | 7.4 | % | 6.4 | % | 4.9 | % | 5.5 | % | 5.6 | % | ||||||||||||||||||
| 19 | 8.0 | % | 6.5 | % | 5.2 | % | 5.7 | % | 5.9 | % | ||||||||||||||||||
| 20 | 8.5 | % | 6.7 | % | 5.3 | % | 6.0 | % | 6.2 | % | ||||||||||||||||||
| 21 | 9.9 | % | 7.1 | % | 5.5 | % | 6.2 | % | 6.4 | % | ||||||||||||||||||
| 22 | 10.8 | % | 7.5 | % | 5.8 | % | 6.6 | % | 6.6 | % | ||||||||||||||||||
| 23 | 11.7 | % | 7.8 | % | 5.9 | % | 6.8 | % | ||||||||||||||||||||
| 24 | 12.1 | % | 8.0 | % | 6.1 | % | 7.0 | % | ||||||||||||||||||||
| 25 | 12.2 | % | 8.4 | % | 6.3 | % | 7.3 | % | ||||||||||||||||||||
| 26 | 12.8 | % | 8.4 | % | 6.7 | % | 7.4 | % | ||||||||||||||||||||
| 27 | 12.9 | % | 8.6 | % | 6.8 | % | 7.6 | % | ||||||||||||||||||||
| 28 | 13.0 | % | 8.8 | % | 6.9 | % | 7.8 | % | ||||||||||||||||||||
| 29 | 13.5 | % | 9.0 | % | 7.1 | % | 7.8 | % | ||||||||||||||||||||
| 30 | 13.6 | % | 9.1 | % | 7.2 | % | 7.9 | % | ||||||||||||||||||||
| 31 | 13.8 | % | 9.2 | % | 7.3 | % | 8.0 | % | ||||||||||||||||||||
| 32 | 13.8 | % | 9.4 | % | 7.3 | % | 8.1 | % | ||||||||||||||||||||
| 33 | 14.0 | % | 9.4 | % | 7.4 | % | 8.1 | % | ||||||||||||||||||||
| 34 | 14.1 | % | 9.6 | % | 7.5 | % | 8.1 | % | ||||||||||||||||||||
| 35 | 14.1 | % | 9.6 | % | 7.5 | % | ||||||||||||||||||||||
| 36 | 14.1 | % | 9.6 | % | 7.5 | % | ||||||||||||||||||||||
40
Table of Contents
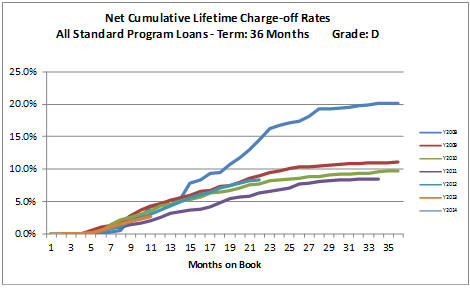
Net Cumulative Lifetime Charge-off Rates by Booking Year
All Standard Program Loans - Term: 36 Months Grade: D
| Mo # |
Y2008 | Y2009 | Y2010 | Y2011 | Y2012 | Y2013 | Y2014 | |||||||||||||||||||||
| 1 | 0.0 | % | 0.0 | % | 0.0 | % | 0.0 | % | 0.0 | % | 0.0 | % | 0.0 | % | ||||||||||||||
| 2 | 0.0 | % | 0.0 | % | 0.0 | % | 0.0 | % | 0.0 | % | 0.0 | % | 0.0 | % | ||||||||||||||
| 3 | 0.0 | % | 0.0 | % | 0.0 | % | 0.0 | % | 0.0 | % | 0.0 | % | ||||||||||||||||
| 4 | 0.0 | % | 0.0 | % | 0.0 | % | 0.0 | % | 0.0 | % | 0.0 | % | ||||||||||||||||
| 5 | 0.0 | % | 0.5 | % | 0.1 | % | 0.2 | % | 0.2 | % | 0.2 | % | ||||||||||||||||
| 6 | 0.0 | % | 1.0 | % | 0.5 | % | 0.4 | % | 0.4 | % | 0.6 | % | ||||||||||||||||
| 7 | 0.3 | % | 1.3 | % | 1.4 | % | 0.9 | % | 0.8 | % | 1.0 | % | ||||||||||||||||
| 8 | 0.6 | % | 1.7 | % | 2.1 | % | 1.1 | % | 1.2 | % | 1.6 | % | ||||||||||||||||
| 9 | 2.4 | % | 2.8 | % | 2.6 | % | 1.4 | % | 1.9 | % | 2.0 | % | ||||||||||||||||
| 10 | 2.7 | % | 3.6 | % | 3.1 | % | 1.7 | % | 2.5 | % | 2.3 | % | ||||||||||||||||
| 11 | 4.2 | % | 4.3 | % | 3.6 | % | 2.1 | % | 3.0 | % | 2.7 | % | ||||||||||||||||
| 12 | 4.4 | % | 4.6 | % | 4.3 | % | 2.6 | % | 3.7 | % | ||||||||||||||||||
| 13 | 5.3 | % | 5.2 | % | 4.5 | % | 3.1 | % | 4.3 | % | ||||||||||||||||||
| 14 | 5.3 | % | 5.6 | % | 5.1 | % | 3.4 | % | 4.9 | % | ||||||||||||||||||
| 15 | 7.8 | % | 5.9 | % | 5.3 | % | 3.6 | % | 5.5 | % | ||||||||||||||||||
| 16 | 8.3 | % | 6.6 | % | 5.7 | % | 3.8 | % | 6.1 | % | ||||||||||||||||||
| 17 | 9.4 | % | 6.8 | % | 6.3 | % | 4.1 | % | 6.5 | % | ||||||||||||||||||
| 18 | 9.4 | % | 7.3 | % | 6.5 | % | 4.8 | % | 7.0 | % | ||||||||||||||||||
| 19 | 10.7 | % | 7.5 | % | 6.6 | % | 5.4 | % | 7.5 | % | ||||||||||||||||||
| 20 | 11.8 | % | 8.0 | % | 7.1 | % | 5.7 | % | 7.8 | % | ||||||||||||||||||
| 21 | 13.0 | % | 8.6 | % | 7.6 | % | 5.8 | % | 8.2 | % | ||||||||||||||||||
| 22 | 14.5 | % | 9.0 | % | 7.8 | % | 6.3 | % | 8.3 | % | ||||||||||||||||||
| 23 | 16.2 | % | 9.5 | % | 8.2 | % | 6.6 | % | ||||||||||||||||||||
| 24 | 16.8 | % | 9.8 | % | 8.3 | % | 6.8 | % | ||||||||||||||||||||
| 25 | 17.1 | % | 10.1 | % | 8.5 | % | 7.0 | % | ||||||||||||||||||||
| 26 | 17.4 | % | 10.3 | % | 8.6 | % | 7.7 | % | ||||||||||||||||||||
| 27 | 18.1 | % | 10.3 | % | 8.8 | % | 7.8 | % | ||||||||||||||||||||
| 28 | 19.2 | % | 10.5 | % | 8.9 | % | 8.1 | % | ||||||||||||||||||||
| 29 | 19.3 | % | 10.6 | % | 9.1 | % | 8.2 | % | ||||||||||||||||||||
| 30 | 19.3 | % | 10.7 | % | 9.2 | % | 8.3 | % | ||||||||||||||||||||
| 31 | 19.5 | % | 10.8 | % | 9.3 | % | 8.4 | % | ||||||||||||||||||||
| 32 | 19.8 | % | 10.9 | % | 9.3 | % | 8.4 | % | ||||||||||||||||||||
| 33 | 19.9 | % | 11.0 | % | 9.4 | % | 8.5 | % | ||||||||||||||||||||
| 34 | 20.1 | % | 11.0 | % | 9.6 | % | 8.5 | % | ||||||||||||||||||||
| 35 | 20.2 | % | 11.0 | % | 9.7 | % | ||||||||||||||||||||||
| 36 | 20.2 | % | 11.0 | % | 9.8 | % | ||||||||||||||||||||||
41
Table of Contents
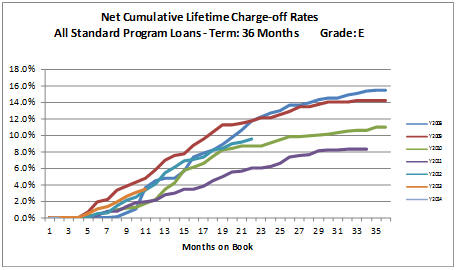
Net Cumulative Lifetime Charge-off Rates by Booking Year
All Standard Program Loans - Term: 36 Months Grade: E
| Mo # |
Y2008 | Y2009 | Y2010 | Y2011 | Y2012 | Y2013 | Y2014 | |||||||||||||||||||||
| 1 | 0.0 | % | 0.0 | % | 0.0 | % | 0.0 | % | 0.0 | % | 0.0 | % | 0.0 | % | ||||||||||||||
| 2 | 0.0 | % | 0.0 | % | 0.0 | % | 0.0 | % | 0.0 | % | 0.0 | % | 0.0 | % | ||||||||||||||
| 3 | 0.0 | % | 0.0 | % | 0.0 | % | 0.0 | % | 0.0 | % | 0.0 | % | ||||||||||||||||
| 4 | 0.0 | % | 0.0 | % | 0.0 | % | 0.0 | % | 0.0 | % | 0.0 | % | ||||||||||||||||
| 5 | 0.0 | % | 0.7 | % | 0.2 | % | 0.1 | % | 0.0 | % | 0.5 | % | ||||||||||||||||
| 6 | 0.0 | % | 2.0 | % | 0.4 | % | 0.3 | % | 0.5 | % | 1.1 | % | ||||||||||||||||
| 7 | 0.0 | % | 2.2 | % | 0.7 | % | 0.8 | % | 0.6 | % | 1.4 | % | ||||||||||||||||
| 8 | 0.1 | % | 3.3 | % | 1.0 | % | 0.8 | % | 1.4 | % | 1.9 | % | ||||||||||||||||
| 9 | 0.6 | % | 3.9 | % | 1.1 | % | 1.4 | % | 2.1 | % | 2.6 | % | ||||||||||||||||
| 10 | 1.1 | % | 4.3 | % | 1.2 | % | 1.8 | % | 2.5 | % | 3.1 | % | ||||||||||||||||
| 11 | 3.6 | % | 4.8 | % | 1.8 | % | 1.9 | % | 3.4 | % | 3.5 | % | ||||||||||||||||
| 12 | 4.5 | % | 5.9 | % | 2.3 | % | 2.1 | % | 4.2 | % | ||||||||||||||||||
| 13 | 4.8 | % | 7.0 | % | 3.4 | % | 2.8 | % | 5.4 | % | ||||||||||||||||||
| 14 | 4.8 | % | 7.5 | % | 4.2 | % | 3.0 | % | 6.1 | % | ||||||||||||||||||
| 15 | 5.6 | % | 7.7 | % | 5.8 | % | 3.4 | % | 6.9 | % | ||||||||||||||||||
| 16 | 7.3 | % | 8.8 | % | 6.1 | % | 3.4 | % | 7.1 | % | ||||||||||||||||||
| 17 | 7.8 | % | 9.6 | % | 6.6 | % | 3.8 | % | 7.4 | % | ||||||||||||||||||
| 18 | 8.2 | % | 10.4 | % | 7.5 | % | 4.5 | % | 8.2 | % | ||||||||||||||||||
| 19 | 8.9 | % | 11.2 | % | 8.2 | % | 5.0 | % | 8.5 | % | ||||||||||||||||||
| 20 | 9.7 | % | 11.2 | % | 8.5 | % | 5.5 | % | 9.0 | % | ||||||||||||||||||
| 21 | 10.7 | % | 11.4 | % | 8.7 | % | 5.7 | % | 9.2 | % | ||||||||||||||||||
| 22 | 11.7 | % | 11.7 | % | 8.7 | % | 6.0 | % | 9.5 | % | ||||||||||||||||||
| 23 | 12.2 | % | 12.1 | % | 8.7 | % | 6.0 | % | ||||||||||||||||||||
| 24 | 12.7 | % | 12.1 | % | 9.1 | % | 6.2 | % | ||||||||||||||||||||
| 25 | 13.0 | % | 12.5 | % | 9.5 | % | 6.6 | % | ||||||||||||||||||||
| 26 | 13.7 | % | 12.9 | % | 9.8 | % | 7.4 | % | ||||||||||||||||||||
| 27 | 13.7 | % | 13.4 | % | 9.8 | % | 7.6 | % | ||||||||||||||||||||
| 28 | 14.0 | % | 13.5 | % | 9.9 | % | 7.6 | % | ||||||||||||||||||||
| 29 | 14.3 | % | 13.7 | % | 10.1 | % | 8.1 | % | ||||||||||||||||||||
| 30 | 14.5 | % | 14.0 | % | 10.2 | % | 8.2 | % | ||||||||||||||||||||
| 31 | 14.5 | % | 14.0 | % | 10.3 | % | 8.2 | % | ||||||||||||||||||||
| 32 | 14.8 | % | 14.0 | % | 10.5 | % | 8.3 | % | ||||||||||||||||||||
| 33 | 15.1 | % | 14.2 | % | 10.6 | % | 8.3 | % | ||||||||||||||||||||
| 34 | 15.4 | % | 14.2 | % | 10.6 | % | 8.3 | % | ||||||||||||||||||||
| 35 | 15.4 | % | 14.2 | % | 11.0 | % | ||||||||||||||||||||||
| 36 | 15.5 | % | 14.2 | % | 11.0 | % | ||||||||||||||||||||||
42
Table of Contents
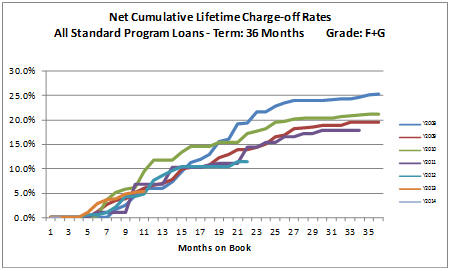
Net Cumulative Lifetime Charge-off Rates by Booking Year
All Standard Program Loans - Term: 36 Months Grade: F+G
| Mo # |
Y2008 | Y2009 | Y2010 | Y2011 | Y2012 | Y2013 | Y2014 | |||||||||||||||||||||
| 1 | 0.0 | % | 0.0 | % | 0.0 | % | 0.0 | % | 0.0 | % | 0.0 | % | 0.0 | % | ||||||||||||||
| 2 | 0.0 | % | 0.0 | % | 0.0 | % | 0.0 | % | 0.0 | % | 0.0 | % | 0.0 | % | ||||||||||||||
| 3 | 0.0 | % | 0.0 | % | 0.0 | % | 0.0 | % | 0.0 | % | 0.0 | % | ||||||||||||||||
| 4 | 0.0 | % | 0.0 | % | 0.0 | % | 0.0 | % | 0.0 | % | 0.0 | % | ||||||||||||||||
| 5 | 0.0 | % | 0.0 | % | 0.0 | % | 0.0 | % | 0.6 | % | 1.1 | % | ||||||||||||||||
| 6 | 0.0 | % | 1.2 | % | 0.4 | % | 1.1 | % | 0.6 | % | 2.8 | % | ||||||||||||||||
| 7 | 0.0 | % | 2.7 | % | 3.6 | % | 1.1 | % | 1.0 | % | 3.7 | % | ||||||||||||||||
| 8 | 1.6 | % | 3.5 | % | 5.1 | % | 1.1 | % | 2.2 | % | 3.9 | % | ||||||||||||||||
| 9 | 2.6 | % | 3.8 | % | 5.8 | % | 1.1 | % | 4.3 | % | 4.9 | % | ||||||||||||||||
| 10 | 4.6 | % | 5.1 | % | 6.2 | % | 6.8 | % | 4.3 | % | 5.1 | % | ||||||||||||||||
| 11 | 6.0 | % | 6.0 | % | 9.4 | % | 6.8 | % | 4.9 | % | 5.3 | % | ||||||||||||||||
| 12 | 6.0 | % | 6.6 | % | 11.7 | % | 6.8 | % | 7.6 | % | ||||||||||||||||||
| 13 | 6.0 | % | 7.0 | % | 11.7 | % | 6.8 | % | 8.6 | % | ||||||||||||||||||
| 14 | 7.4 | % | 7.9 | % | 11.7 | % | 10.4 | % | 9.6 | % | ||||||||||||||||||
| 15 | 9.5 | % | 9.9 | % | 13.4 | % | 10.4 | % | 10.5 | % | ||||||||||||||||||
| 16 | 11.3 | % | 10.2 | % | 14.6 | % | 10.4 | % | 10.5 | % | ||||||||||||||||||
| 17 | 11.9 | % | 10.2 | % | 14.6 | % | 10.4 | % | 10.5 | % | ||||||||||||||||||
| 18 | 12.8 | % | 10.8 | % | 14.6 | % | 10.8 | % | 10.5 | % | ||||||||||||||||||
| 19 | 15.5 | % | 12.3 | % | 15.4 | % | 11.1 | % | 10.5 | % | ||||||||||||||||||
| 20 | 16.0 | % | 13.0 | % | 15.4 | % | 11.1 | % | 10.5 | % | ||||||||||||||||||
| 21 | 19.2 | % | 13.9 | % | 15.4 | % | 11.1 | % | 11.4 | % | ||||||||||||||||||
| 22 | 19.3 | % | 13.9 | % | 17.3 | % | 14.4 | % | 11.4 | % | ||||||||||||||||||
| 23 | 21.7 | % | 14.3 | % | 17.7 | % | 14.4 | % | ||||||||||||||||||||
| 24 | 21.7 | % | 15.1 | % | 18.2 | % | 15.4 | % | ||||||||||||||||||||
| 25 | 22.9 | % | 16.5 | % | 19.5 | % | 15.4 | % | ||||||||||||||||||||
| 26 | 23.5 | % | 17.0 | % | 19.7 | % | 16.6 | % | ||||||||||||||||||||
| 27 | 23.9 | % | 18.2 | % | 20.2 | % | 16.6 | % | ||||||||||||||||||||
| 28 | 23.9 | % | 18.4 | % | 20.4 | % | 17.2 | % | ||||||||||||||||||||
| 29 | 24.0 | % | 18.5 | % | 20.4 | % | 17.2 | % | ||||||||||||||||||||
| 30 | 24.0 | % | 18.8 | % | 20.4 | % | 17.8 | % | ||||||||||||||||||||
| 31 | 24.2 | % | 18.8 | % | 20.4 | % | 17.8 | % | ||||||||||||||||||||
| 32 | 24.2 | % | 18.9 | % | 20.7 | % | 17.8 | % | ||||||||||||||||||||
| 33 | 24.2 | % | 19.5 | % | 20.8 | % | 17.8 | % | ||||||||||||||||||||
| 34 | 24.7 | % | 19.5 | % | 20.9 | % | 17.8 | % | ||||||||||||||||||||
| 35 | 25.1 | % | 19.5 | % | 21.1 | % | ||||||||||||||||||||||
| 36 | 25.3 | % | 19.5 | % | 21.1 | % | ||||||||||||||||||||||
43
Table of Contents
Cumulative Charge-off Rate – 60 Month Standard Program Loans
The graph and corresponding tables below show the cumulative net lifetime charge-offs for standard program loans with original terms of 60 months by grade and by annual vintage booked from May 1, 2010 through June 30, 2014, as a percentage of the aggregate principal amount of originations. The charge-offs are tracked by annual vintage, meaning each line represents all 60 month standard program loans originated in that year.
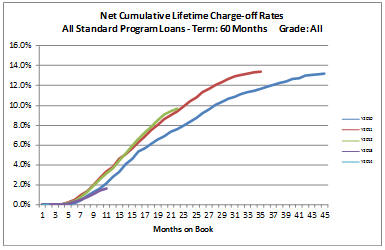
Net Cumulative Lifetime Charge-off Rates by Booking Year
All Standard Program Loans - Term: 60 Months Grade: All
| Mo # |
Y2010 | Y2011 | Y2012 | Y2013 | Y2014 | |||||||||||||||
| 1 | 0.0 | % | 0.0 | % | 0.0 | % | 0.0 | % | 0.0 | % | ||||||||||
| 2 | 0.0 | % | 0.0 | % | 0.0 | % | 0.0 | % | 0.0 | % | ||||||||||
| 3 | 0.0 | % | 0.0 | % | 0.0 | % | 0.0 | % | ||||||||||||
| 4 | 0.0 | % | 0.0 | % | 0.0 | % | 0.0 | % | ||||||||||||
| 5 | 0.0 | % | 0.2 | % | 0.1 | % | 0.1 | % | ||||||||||||
| 6 | 0.2 | % | 0.5 | % | 0.4 | % | 0.3 | % | ||||||||||||
| 7 | 0.4 | % | 0.9 | % | 0.8 | % | 0.5 | % | ||||||||||||
| 8 | 0.9 | % | 1.4 | % | 1.3 | % | 0.8 | % | ||||||||||||
| 9 | 1.3 | % | 2.0 | % | 1.9 | % | 1.1 | % | ||||||||||||
| 10 | 1.6 | % | 2.7 | % | 2.5 | % | 1.4 | % | ||||||||||||
| 11 | 2.2 | % | 3.4 | % | 3.2 | % | 1.6 | % | ||||||||||||
| 12 | 2.8 | % | 3.8 | % | 3.7 | % | ||||||||||||||
| 13 | 3.3 | % | 4.6 | % | 4.4 | % | ||||||||||||||
| 14 | 4.1 | % | 5.1 | % | 5.1 | % | ||||||||||||||
| 15 | 4.6 | % | 5.7 | % | 5.9 | % | ||||||||||||||
| 16 | 5.3 | % | 6.3 | % | 6.6 | % | ||||||||||||||
| 17 | 5.7 | % | 6.9 | % | 7.3 | % | ||||||||||||||
| 18 | 6.1 | % | 7.5 | % | 7.9 | % | ||||||||||||||
| 19 | 6.6 | % | 8.0 | % | 8.5 | % | ||||||||||||||
| 20 | 6.9 | % | 8.6 | % | 9.0 | % | ||||||||||||||
| 21 | 7.3 | % | 9.0 | % | 9.4 | % | ||||||||||||||
| 22 | 7.6 | % | 9.4 | % | 9.7 | % | ||||||||||||||
| 23 | 7.9 | % | 9.9 | % | ||||||||||||||||
| 24 | 8.3 | % | 10.4 | % | ||||||||||||||||
| 25 | 8.7 | % | 10.8 | % | ||||||||||||||||
| 26 | 9.2 | % | 11.3 | % | ||||||||||||||||
| 27 | 9.6 | % | 11.6 | % | ||||||||||||||||
| 28 | 10.1 | % | 12.1 | % | ||||||||||||||||
| 29 | 10.4 | % | 12.3 | % | ||||||||||||||||
| 30 | 10.6 | % | 12.7 | % | ||||||||||||||||
| 31 | 10.9 | % | 12.9 | % | ||||||||||||||||
| 32 | 11.1 | % | 13.1 | % | ||||||||||||||||
| 33 | 11.4 | % | 13.2 | % | ||||||||||||||||
| 34 | 11.5 | % | 13.3 | % | ||||||||||||||||
| 35 | 11.7 | % | 13.4 | % | ||||||||||||||||
| 36 | 11.9 | % | ||||||||||||||||||
| 37 | 12.1 | % | ||||||||||||||||||
| 38 | 12.3 | % | ||||||||||||||||||
| 39 | 12.4 | % | ||||||||||||||||||
| 40 | 12.7 | % | ||||||||||||||||||
| 41 | 12.8 | % | ||||||||||||||||||
| 42 | 13.0 | % | ||||||||||||||||||
| 43 | 13.1 | % | ||||||||||||||||||
| 44 | 13.1 | % | ||||||||||||||||||
| 45 | 13.2 | % | ||||||||||||||||||
44
Table of Contents
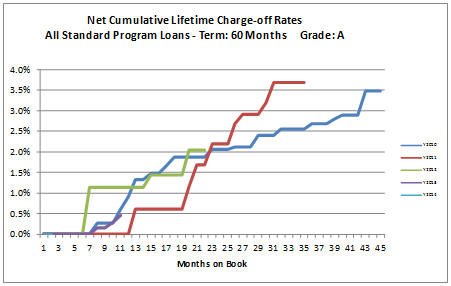
Net Cumulative Lifetime Charge-off Rates by Booking Year
All Standard Program Loans - Term: 60 Months Grade: A
| Mo # |
Y2010 | Y2011 | Y2012 | Y2013 | Y2014 | |||||||||||||||
| 1 | 0.0 | % | 0.0 | % | 0.0 | % | 0.0 | % | 0.0 | % | ||||||||||
| 2 | 0.0 | % | 0.0 | % | 0.0 | % | 0.0 | % | 0.0 | % | ||||||||||
| 3 | 0.0 | % | 0.0 | % | 0.0 | % | 0.0 | % | ||||||||||||
| 4 | 0.0 | % | 0.0 | % | 0.0 | % | 0.0 | % | ||||||||||||
| 5 | 0.0 | % | 0.0 | % | 0.0 | % | 0.0 | % | ||||||||||||
| 6 | 0.0 | % | 0.0 | % | 0.0 | % | 0.0 | % | ||||||||||||
| 7 | 0.0 | % | 0.0 | % | 1.1 | % | 0.0 | % | ||||||||||||
| 8 | 0.3 | % | 0.0 | % | 1.1 | % | 0.2 | % | ||||||||||||
| 9 | 0.3 | % | 0.0 | % | 1.1 | % | 0.2 | % | ||||||||||||
| 10 | 0.3 | % | 0.0 | % | 1.1 | % | 0.3 | % | ||||||||||||
| 11 | 0.6 | % | 0.0 | % | 1.1 | % | 0.5 | % | ||||||||||||
| 12 | 0.9 | % | 0.0 | % | 1.1 | % | ||||||||||||||
| 13 | 1.3 | % | 0.6 | % | 1.1 | % | ||||||||||||||
| 14 | 1.3 | % | 0.6 | % | 1.1 | % | ||||||||||||||
| 15 | 1.5 | % | 0.6 | % | 1.4 | % | ||||||||||||||
| 16 | 1.5 | % | 0.6 | % | 1.4 | % | ||||||||||||||
| 17 | 1.7 | % | 0.6 | % | 1.4 | % | ||||||||||||||
| 18 | 1.9 | % | 0.6 | % | 1.4 | % | ||||||||||||||
| 19 | 1.9 | % | 0.6 | % | 1.4 | % | ||||||||||||||
| 20 | 1.9 | % | 1.2 | % | 2.0 | % | ||||||||||||||
| 21 | 1.9 | % | 1.7 | % | 2.0 | % | ||||||||||||||
| 22 | 1.9 | % | 1.7 | % | 2.0 | % | ||||||||||||||
| 23 | 2.1 | % | 2.2 | % | ||||||||||||||||
| 24 | 2.1 | % | 2.2 | % | ||||||||||||||||
| 25 | 2.1 | % | 2.2 | % | ||||||||||||||||
| 26 | 2.1 | % | 2.7 | % | ||||||||||||||||
| 27 | 2.1 | % | 2.9 | % | ||||||||||||||||
| 28 | 2.1 | % | 2.9 | % | ||||||||||||||||
| 29 | 2.4 | % | 2.9 | % | ||||||||||||||||
| 30 | 2.4 | % | 3.2 | % | ||||||||||||||||
| 31 | 2.4 | % | 3.7 | % | ||||||||||||||||
| 32 | 2.5 | % | 3.7 | % | ||||||||||||||||
| 33 | 2.5 | % | 3.7 | % | ||||||||||||||||
| 34 | 2.5 | % | 3.7 | % | ||||||||||||||||
| 35 | 2.5 | % | 3.7 | % | ||||||||||||||||
| 36 | 2.7 | % | ||||||||||||||||||
| 37 | 2.7 | % | ||||||||||||||||||
| 38 | 2.7 | % | ||||||||||||||||||
| 39 | 2.8 | % | ||||||||||||||||||
| 40 | 2.9 | % | ||||||||||||||||||
| 41 | 2.9 | % | ||||||||||||||||||
| 42 | 2.9 | % | ||||||||||||||||||
| 43 | 3.5 | % | ||||||||||||||||||
| 44 | 3.5 | % | ||||||||||||||||||
| 45 | 3.5 | % | ||||||||||||||||||
45
Table of Contents
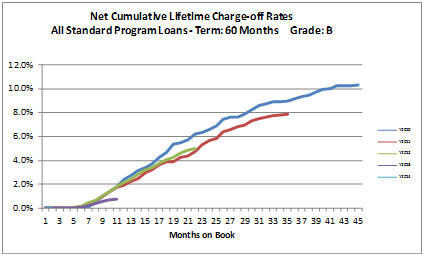
Net Cumulative Lifetime Charge-off Rates by Booking Year
All Standard Program Loans - Term: 60 Months Grade: B
| Mo # |
Y2010 | Y2011 | Y2012 | Y2013 | Y2014 | |||||||||||||||
| 1 | 0.0 | % | 0.0 | % | 0.0 | % | 0.0 | % | 0.0 | % | ||||||||||
| 2 | 0.0 | % | 0.0 | % | 0.0 | % | 0.0 | % | 0.0 | % | ||||||||||
| 3 | 0.0 | % | 0.0 | % | 0.0 | % | 0.0 | % | ||||||||||||
| 4 | 0.0 | % | 0.0 | % | 0.0 | % | 0.0 | % | ||||||||||||
| 5 | 0.0 | % | 0.0 | % | 0.1 | % | 0.0 | % | ||||||||||||
| 6 | 0.0 | % | 0.2 | % | 0.2 | % | 0.1 | % | ||||||||||||
| 7 | 0.1 | % | 0.4 | % | 0.4 | % | 0.2 | % | ||||||||||||
| 8 | 0.5 | % | 0.6 | % | 0.6 | % | 0.4 | % | ||||||||||||
| 9 | 1.0 | % | 1.0 | % | 1.1 | % | 0.6 | % | ||||||||||||
| 10 | 1.4 | % | 1.4 | % | 1.4 | % | 0.7 | % | ||||||||||||
| 11 | 1.8 | % | 1.7 | % | 1.8 | % | 0.8 | % | ||||||||||||
| 12 | 2.4 | % | 1.9 | % | 2.1 | % | ||||||||||||||
| 13 | 2.7 | % | 2.2 | % | 2.4 | % | ||||||||||||||
| 14 | 3.1 | % | 2.5 | % | 2.8 | % | ||||||||||||||
| 15 | 3.4 | % | 2.9 | % | 3.2 | % | ||||||||||||||
| 16 | 3.7 | % | 3.2 | % | 3.4 | % | ||||||||||||||
| 17 | 4.2 | % | 3.7 | % | 3.7 | % | ||||||||||||||
| 18 | 4.7 | % | 3.9 | % | 4.0 | % | ||||||||||||||
| 19 | 5.3 | % | 3.9 | % | 4.2 | % | ||||||||||||||
| 20 | 5.5 | % | 4.2 | % | 4.6 | % | ||||||||||||||
| 21 | 5.7 | % | 4.4 | % | 4.8 | % | ||||||||||||||
| 22 | 6.2 | % | 4.7 | % | 5.0 | % | ||||||||||||||
| 23 | 6.3 | % | 5.3 | % | ||||||||||||||||
| 24 | 6.5 | % | 5.6 | % | ||||||||||||||||
| 25 | 6.9 | % | 5.8 | % | ||||||||||||||||
| 26 | 7.4 | % | 6.4 | % | ||||||||||||||||
| 27 | 7.6 | % | 6.6 | % | ||||||||||||||||
| 28 | 7.6 | % | 6.8 | % | ||||||||||||||||
| 29 | 7.8 | % | 7.0 | % | ||||||||||||||||
| 30 | 8.3 | % | 7.3 | % | ||||||||||||||||
| 31 | 8.6 | % | 7.5 | % | ||||||||||||||||
| 32 | 8.7 | % | 7.6 | % | ||||||||||||||||
| 33 | 8.9 | % | 7.7 | % | ||||||||||||||||
| 34 | 8.9 | % | 7.8 | % | ||||||||||||||||
| 35 | 8.9 | % | 7.8 | % | ||||||||||||||||
| 36 | 9.2 | % | ||||||||||||||||||
| 37 | 9.3 | % | ||||||||||||||||||
| 38 | 9.5 | % | ||||||||||||||||||
| 39 | 9.7 | % | ||||||||||||||||||
| 40 | 9.9 | % | ||||||||||||||||||
| 41 | 10.0 | % | ||||||||||||||||||
| 42 | 10.2 | % | ||||||||||||||||||
| 43 | 10.2 | % | ||||||||||||||||||
| 44 | 10.3 | % | ||||||||||||||||||
| 45 | 10.3 | % | ||||||||||||||||||
46
Table of Contents
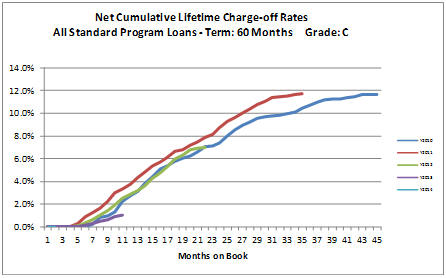
Net Cumulative Lifetime Charge-off Rates by Booking Year
All Standard Program Loans - Term: 60 Months Grade: C
| Mo # |
Y2010 | Y2011 | Y2012 | Y2013 | Y2014 | |||||||||||||||
| 1 | 0.0 | % | 0.0 | % | 0.0 | % | 0.0 | % | 0.0 | % | ||||||||||
| 2 | 0.0 | % | 0.0 | % | 0.0 | % | 0.0 | % | 0.0 | % | ||||||||||
| 3 | 0.0 | % | 0.0 | % | 0.0 | % | 0.0 | % | ||||||||||||
| 4 | 0.0 | % | 0.0 | % | 0.0 | % | 0.0 | % | ||||||||||||
| 5 | 0.0 | % | 0.3 | % | 0.1 | % | 0.1 | % | ||||||||||||
| 6 | 0.0 | % | 0.9 | % | 0.3 | % | 0.2 | % | ||||||||||||
| 7 | 0.2 | % | 1.3 | % | 0.6 | % | 0.3 | % | ||||||||||||
| 8 | 0.8 | % | 1.6 | % | 1.0 | % | 0.5 | % | ||||||||||||
| 9 | 1.0 | % | 2.3 | % | 1.4 | % | 0.7 | % | ||||||||||||
| 10 | 1.3 | % | 3.0 | % | 1.9 | % | 0.9 | % | ||||||||||||
| 11 | 2.2 | % | 3.4 | % | 2.5 | % | 1.1 | % | ||||||||||||
| 12 | 2.7 | % | 3.8 | % | 2.8 | % | ||||||||||||||
| 13 | 3.2 | % | 4.3 | % | 3.2 | % | ||||||||||||||
| 14 | 3.8 | % | 4.8 | % | 3.6 | % | ||||||||||||||
| 15 | 4.4 | % | 5.4 | % | 4.3 | % | ||||||||||||||
| 16 | 5.1 | % | 5.7 | % | 4.8 | % | ||||||||||||||
| 17 | 5.4 | % | 6.1 | % | 5.3 | % | ||||||||||||||
| 18 | 5.7 | % | 6.7 | % | 6.0 | % | ||||||||||||||
| 19 | 6.0 | % | 6.8 | % | 6.3 | % | ||||||||||||||
| 20 | 6.2 | % | 7.2 | % | 6.8 | % | ||||||||||||||
| 21 | 6.6 | % | 7.5 | % | 6.9 | % | ||||||||||||||
| 22 | 7.0 | % | 7.9 | % | 7.0 | % | ||||||||||||||
| 23 | 7.2 | % | 8.2 | % | ||||||||||||||||
| 24 | 7.4 | % | 8.8 | % | ||||||||||||||||
| 25 | 8.0 | % | 9.3 | % | ||||||||||||||||
| 26 | 8.5 | % | 9.6 | % | ||||||||||||||||
| 27 | 8.9 | % | 10.0 | % | ||||||||||||||||
| 28 | 9.2 | % | 10.4 | % | ||||||||||||||||
| 29 | 9.5 | % | 10.8 | % | ||||||||||||||||
| 30 | 9.7 | % | 11.1 | % | ||||||||||||||||
| 31 | 9.8 | % | 11.4 | % | ||||||||||||||||
| 32 | 9.9 | % | 11.4 | % | ||||||||||||||||
| 33 | 10.0 | % | 11.6 | % | ||||||||||||||||
| 34 | 10.1 | % | 11.6 | % | ||||||||||||||||
| 35 | 10.4 | % | 11.7 | % | ||||||||||||||||
| 36 | 10.7 | % | ||||||||||||||||||
| 37 | 11.0 | % | ||||||||||||||||||
| 38 | 11.2 | % | ||||||||||||||||||
| 39 | 11.3 | % | ||||||||||||||||||
| 40 | 11.3 | % | ||||||||||||||||||
| 41 | 11.4 | % | ||||||||||||||||||
| 42 | 11.5 | % | ||||||||||||||||||
| 43 | 11.6 | % | ||||||||||||||||||
| 44 | 11.6 | % | ||||||||||||||||||
| 45 | 11.6 | % | ||||||||||||||||||
47
Table of Contents
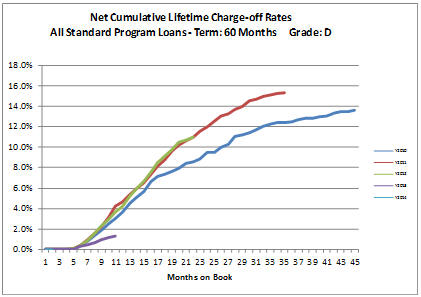
Net Cumulative Lifetime Charge-off Rates by Booking Year
All Standard Program Loans - Term: 60 Months Grade: D
| Mo # |
Y2010 | Y2011 | Y2012 | Y2013 | Y2014 | |||||||||||||||
| 1 | 0.0 | % | 0.0 | % | 0.0 | % | 0.0 | % | 0.0 | % | ||||||||||
| 2 | 0.0 | % | 0.0 | % | 0.0 | % | 0.0 | % | 0.0 | % | ||||||||||
| 3 | 0.0 | % | 0.0 | % | 0.0 | % | 0.0 | % | ||||||||||||
| 4 | 0.0 | % | 0.0 | % | 0.0 | % | 0.0 | % | ||||||||||||
| 5 | 0.0 | % | 0.1 | % | 0.1 | % | 0.0 | % | ||||||||||||
| 6 | 0.4 | % | 0.4 | % | 0.4 | % | 0.3 | % | ||||||||||||
| 7 | 0.8 | % | 1.0 | % | 0.9 | % | 0.5 | % | ||||||||||||
| 8 | 1.4 | % | 1.6 | % | 1.6 | % | 0.7 | % | ||||||||||||
| 9 | 1.9 | % | 2.3 | % | 2.3 | % | 1.0 | % | ||||||||||||
| 10 | 2.5 | % | 3.2 | % | 3.0 | % | 1.2 | % | ||||||||||||
| 11 | 3.0 | % | 4.2 | % | 3.7 | % | 1.3 | % | ||||||||||||
| 12 | 3.6 | % | 4.6 | % | 4.2 | % | ||||||||||||||
| 13 | 4.5 | % | 5.3 | % | 5.2 | % | ||||||||||||||
| 14 | 5.1 | % | 5.9 | % | 5.9 | % | ||||||||||||||
| 15 | 5.6 | % | 6.5 | % | 6.6 | % | ||||||||||||||
| 16 | 6.6 | % | 7.3 | % | 7.6 | % | ||||||||||||||
| 17 | 7.1 | % | 8.1 | % | 8.5 | % | ||||||||||||||
| 18 | 7.3 | % | 8.8 | % | 9.2 | % | ||||||||||||||
| 19 | 7.6 | % | 9.7 | % | 9.8 | % | ||||||||||||||
| 20 | 7.9 | % | 10.2 | % | 10.5 | % | ||||||||||||||
| 21 | 8.4 | % | 10.6 | % | 10.7 | % | ||||||||||||||
| 22 | 8.6 | % | 11.0 | % | 11.0 | % | ||||||||||||||
| 23 | 8.8 | % | 11.5 | % | ||||||||||||||||
| 24 | 9.5 | % | 11.9 | % | ||||||||||||||||
| 25 | 9.5 | % | 12.5 | % | ||||||||||||||||
| 26 | 10.0 | % | 13.0 | % | ||||||||||||||||
| 27 | 10.3 | % | 13.2 | % | ||||||||||||||||
| 28 | 11.0 | % | 13.7 | % | ||||||||||||||||
| 29 | 11.2 | % | 14.0 | % | ||||||||||||||||
| 30 | 11.4 | % | 14.5 | % | ||||||||||||||||
| 31 | 11.7 | % | 14.7 | % | ||||||||||||||||
| 32 | 12.0 | % | 15.0 | % | ||||||||||||||||
| 33 | 12.2 | % | 15.1 | % | ||||||||||||||||
| 34 | 12.4 | % | 15.3 | % | ||||||||||||||||
| 35 | 12.4 | % | 15.3 | % | ||||||||||||||||
| 36 | 12.5 | % | ||||||||||||||||||
| 37 | 12.7 | % | ||||||||||||||||||
| 38 | 12.8 | % | ||||||||||||||||||
| 39 | 12.8 | % | ||||||||||||||||||
| 40 | 13.0 | % | ||||||||||||||||||
| 41 | 13.0 | % | ||||||||||||||||||
| 42 | 13.3 | % | ||||||||||||||||||
| 43 | 13.4 | % | ||||||||||||||||||
| 44 | 13.4 | % | ||||||||||||||||||
| 45 | 13.6 | % | ||||||||||||||||||
48
Table of Contents
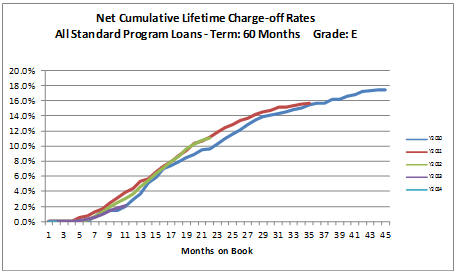
Net Cumulative Lifetime Charge-off Rates by Booking Year
All Standard Program Loans - Term: 60 Months Grade: E
| Mo # |
Y2010 | Y2011 | Y2012 | Y2013 | Y2014 | |||||||||||||||
| 1 | 0.0 | % | 0.0 | % | 0.0 | % | 0.0 | % | 0.0 | % | ||||||||||
| 2 | 0.0 | % | 0.0 | % | 0.0 | % | 0.0 | % | 0.0 | % | ||||||||||
| 3 | 0.0 | % | 0.0 | % | 0.0 | % | 0.0 | % | ||||||||||||
| 4 | 0.0 | % | 0.0 | % | 0.0 | % | 0.0 | % | ||||||||||||
| 5 | 0.0 | % | 0.6 | % | 0.1 | % | 0.1 | % | ||||||||||||
| 6 | 0.0 | % | 0.7 | % | 0.3 | % | 0.4 | % | ||||||||||||
| 7 | 0.7 | % | 1.3 | % | 0.6 | % | 0.6 | % | ||||||||||||
| 8 | 1.4 | % | 1.7 | % | 1.3 | % | 1.0 | % | ||||||||||||
| 9 | 1.4 | % | 2.6 | % | 2.0 | % | 1.5 | % | ||||||||||||
| 10 | 1.4 | % | 3.1 | % | 2.5 | % | 1.9 | % | ||||||||||||
| 11 | 2.1 | % | 3.9 | % | 3.0 | % | 2.1 | % | ||||||||||||
| 12 | 3.0 | % | 4.5 | % | 3.7 | % | ||||||||||||||
| 13 | 3.7 | % | 5.4 | % | 4.6 | % | ||||||||||||||
| 14 | 5.1 | % | 5.6 | % | 5.4 | % | ||||||||||||||
| 15 | 5.8 | % | 6.6 | % | 6.4 | % | ||||||||||||||
| 16 | 7.1 | % | 7.3 | % | 7.2 | % | ||||||||||||||
| 17 | 7.4 | % | 8.0 | % | 8.0 | % | ||||||||||||||
| 18 | 7.9 | % | 8.8 | % | 8.7 | % | ||||||||||||||
| 19 | 8.5 | % | 9.5 | % | 9.6 | % | ||||||||||||||
| 20 | 8.9 | % | 10.3 | % | 10.2 | % | ||||||||||||||
| 21 | 9.5 | % | 10.7 | % | 10.7 | % | ||||||||||||||
| 22 | 9.6 | % | 11.2 | % | 11.1 | % | ||||||||||||||
| 23 | 10.2 | % | 11.8 | % | ||||||||||||||||
| 24 | 11.0 | % | 12.4 | % | ||||||||||||||||
| 25 | 11.6 | % | 12.9 | % | ||||||||||||||||
| 26 | 12.1 | % | 13.3 | % | ||||||||||||||||
| 27 | 12.8 | % | 13.7 | % | ||||||||||||||||
| 28 | 13.5 | % | 14.3 | % | ||||||||||||||||
| 29 | 13.9 | % | 14.5 | % | ||||||||||||||||
| 30 | 14.1 | % | 14.7 | % | ||||||||||||||||
| 31 | 14.3 | % | 15.1 | % | ||||||||||||||||
| 32 | 14.5 | % | 15.1 | % | ||||||||||||||||
| 33 | 14.8 | % | 15.3 | % | ||||||||||||||||
| 34 | 15.0 | % | 15.5 | % | ||||||||||||||||
| 35 | 15.5 | % | 15.6 | % | ||||||||||||||||
| 36 | 15.6 | % | ||||||||||||||||||
| 37 | 15.7 | % | ||||||||||||||||||
| 38 | 16.2 | % | ||||||||||||||||||
| 39 | 16.2 | % | ||||||||||||||||||
| 40 | 16.6 | % | ||||||||||||||||||
| 41 | 16.9 | % | ||||||||||||||||||
| 42 | 17.2 | % | ||||||||||||||||||
| 43 | 17.4 | % | ||||||||||||||||||
| 44 | 17.4 | % | ||||||||||||||||||
| 45 | 17.4 | % | ||||||||||||||||||
49
Table of Contents
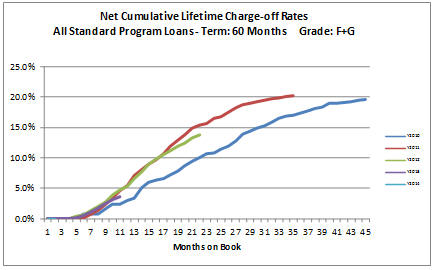
Net Cumulative Lifetime Charge-off Rates by Booking Year
All Standard Program Loans - Term: 60 Months Grade: F+G
| Mo # |
Y2010 | Y2011 | Y2012 | Y2013 | Y2014 | |||||||||||||||
| 1 | 0.0 | % | 0.0 | % | 0.0 | % | 0.0 | % | 0.0 | % | ||||||||||
| 2 | 0.0 | % | 0.0 | % | 0.0 | % | 0.0 | % | 0.0 | % | ||||||||||
| 3 | 0.0 | % | 0.0 | % | 0.0 | % | 0.0 | % | ||||||||||||
| 4 | 0.0 | % | 0.0 | % | 0.1 | % | 0.0 | % | ||||||||||||
| 5 | 0.1 | % | 0.2 | % | 0.4 | % | 0.2 | % | ||||||||||||
| 6 | 0.8 | % | 0.2 | % | 0.7 | % | 0.5 | % | ||||||||||||
| 7 | 0.8 | % | 0.7 | % | 1.4 | % | 1.1 | % | ||||||||||||
| 8 | 0.8 | % | 1.5 | % | 2.1 | % | 1.8 | % | ||||||||||||
| 9 | 1.6 | % | 2.3 | % | 2.8 | % | 2.5 | % | ||||||||||||
| 10 | 2.4 | % | 3.4 | % | 3.9 | % | 3.2 | % | ||||||||||||
| 11 | 2.4 | % | 4.7 | % | 4.8 | % | 3.7 | % | ||||||||||||
| 12 | 3.0 | % | 5.5 | % | 5.4 | % | ||||||||||||||
| 13 | 3.4 | % | 7.1 | % | 6.6 | % | ||||||||||||||
| 14 | 5.1 | % | 8.1 | % | 7.7 | % | ||||||||||||||
| 15 | 6.0 | % | 8.9 | % | 8.9 | % | ||||||||||||||
| 16 | 6.4 | % | 9.7 | % | 9.9 | % | ||||||||||||||
| 17 | 6.5 | % | 10.7 | % | 10.6 | % | ||||||||||||||
| 18 | 7.2 | % | 12.0 | % | 11.2 | % | ||||||||||||||
| 19 | 7.8 | % | 12.9 | % | 11.9 | % | ||||||||||||||
| 20 | 8.7 | % | 13.7 | % | 12.5 | % | ||||||||||||||
| 21 | 9.4 | % | 14.9 | % | 13.2 | % | ||||||||||||||
| 22 | 10.0 | % | 15.4 | % | 13.7 | % | ||||||||||||||
| 23 | 10.7 | % | 15.7 | % | ||||||||||||||||
| 24 | 10.8 | % | 16.6 | % | ||||||||||||||||
| 25 | 11.5 | % | 16.7 | % | ||||||||||||||||
| 26 | 11.9 | % | 17.5 | % | ||||||||||||||||
| 27 | 12.8 | % | 18.2 | % | ||||||||||||||||
| 28 | 13.9 | % | 18.7 | % | ||||||||||||||||
| 29 | 14.4 | % | 19.0 | % | ||||||||||||||||
| 30 | 14.9 | % | 19.3 | % | ||||||||||||||||
| 31 | 15.2 | % | 19.5 | % | ||||||||||||||||
| 32 | 15.9 | % | 19.7 | % | ||||||||||||||||
| 33 | 16.6 | % | 19.9 | % | ||||||||||||||||
| 34 | 16.9 | % | 20.1 | % | ||||||||||||||||
| 35 | 17.0 | % | 20.3 | % | ||||||||||||||||
| 36 | 17.3 | % | ||||||||||||||||||
| 37 | 17.7 | % | ||||||||||||||||||
| 38 | 18.1 | % | ||||||||||||||||||
| 39 | 18.4 | % | ||||||||||||||||||
| 40 | 18.9 | % | ||||||||||||||||||
| 41 | 18.9 | % | ||||||||||||||||||
| 42 | 19.2 | % | ||||||||||||||||||
| 43 | 19.3 | % | ||||||||||||||||||
| 44 | 19.5 | % | ||||||||||||||||||
| 45 | 19.6 | % | ||||||||||||||||||
50
Table of Contents
Item 3. Quantitative and Qualitative Disclosures about Market Risk
Not applicable for smaller reporting companies.
Item 4. Controls and Procedures
We have adopted and maintain disclosure controls and procedures that are designed to ensure that information required to be disclosed in our reports under the Exchange Act is recorded, processed, summarized and reported within the time periods specified in the SEC’s rules and forms and that the information is accumulated and communicated to our management, including our Chief Executive Officer and Chief Financial Officer, as appropriate, to allow for timely decisions regarding required disclosure. In designing and evaluating our disclosure controls and procedures, management recognizes that any controls and procedures, no matter how well designed and operated, can provide only reasonable assurance of achieving the desired control objectives, and we are required to apply our judgment in evaluating the cost-benefit relationship of possible controls and procedures.
As required by Rule 13a-15(b) of the Exchange Act, we carried out an evaluation, under the supervision and with the participation of management, including our Chief Executive Officer and Chief Financial Officer, of the effectiveness of the design and operation of our disclosure controls and procedures as of the end of the quarter covered by this report. Based on the foregoing, our Chief Executive Officer and Chief Financial Officer have concluded that our disclosure controls and procedures were effective at a reasonable assurance level.
There has been no adverse change in our internal control over financial reporting during our most recent fiscal quarter that has materially affected, or is reasonably likely to materially affect, our internal control over financial reporting.
51
Table of Contents
For a description of our material pending legal proceedings, please refer to Note 16—Commitments and Contingencies—Legal of the Notes to condensed consolidated financial statements included in Part I, Item 1 of this Quarterly Report on Form 10-Q, which is incorporated herein by reference.
The discussion in this Report should be read together with the risk factors contained in Part I, Item 1A, “Risk Factors,” of our Annual Report on Form 10-K for the period ended December 31, 2013. These risk factors describe various risks and uncertainties. These risks and uncertainties have the potential to affect our business, financial condition, results of operations, cash flows, strategies or prospects in a material and adverse manner. In addition, these risks could have a material adverse effect on the value of any notes or other securities you purchase and could cause you to lose all or part of your initial purchase price or future principal and interest payments you expect to receive.
In addition, you should consider the following:
RISKS RELATING TO LC AND THE LC PLATFORM
We have incurred substantial debt and may issue debt securities or otherwise incur substantial debt, to complete acquisitions, which may adversely affect our leverage and financial condition and thus negatively impact our operations.
In connection with our acquisition of Springstone, we entered into a Credit and Guaranty Agreement, or Credit Agreement, with several lenders led by Morgan Stanley Senior Funding, Inc., or Morgan Stanley, under which Morgan Stanley and the other lenders agreed to make a $50.0 million term loan to Lending Club. We also entered into a Pledge and Security Agreement with Morgan Stanley as collateral agent.
The Credit Agreement and Pledge and Security Agreement contain restrictions on our ability to, among other things, pay dividends, incur indebtedness, place liens on assets, merge or consolidate, make investments, and enter into certain affiliate transactions. The Credit Agreement also requires us to maintain a maximum Total Leverage Ratio (as defined in the Credit Agreement) of 5.50:1 initially, and decreasing to 3.50:1 after September 30, 2015 (on a consolidated basis).
If we fail to perform under the Credit Agreement or Pledge and Security Agreement by, for example, failing to make timely payments or failing to comply with the required Total Leverage Ratio, our operations and financial condition could be adversely affected.
For additional details regarding the Credit Agreement, Pledge and Security Agreement and the Term Loan, see our Current Report on Form 8-K filed April 17, 2014, which is incorporated by reference into this Report.
In the future, we may incur additional substantial debt to complete acquisitions. The incurrence of debt could have a variety of negative effects, including:
| • | default and foreclosure on our assets if our operating revenue after an acquisition is insufficient to repay debt obligations; |
| • | acceleration of obligations to repay the indebtedness even if we make all principal and interest payments when due if we breach any covenants that require the maintenance of certain financial ratios or reserves without a waiver or renegotiation of that covenant; |
| • | our inability to obtain necessary additional financing if the debt security contains covenants restricting our ability to obtain such financing while the debt security is outstanding; |
| • | diverting a substantial portion of cash flow to pay principal and interest on such debt, which would reduce the funds available for expenses, capital expenditures, acquisitions and other general corporate purposes; and |
| • | creating potential limitations on our flexibility in planning for and reacting to changes in our business and in the industry in which we operate; |
any of which could adversely affect our operations or financial condition.
The increased scrutiny of third-party medical financing by governmental agencies may lead to increased regulatory burdens on Springstone and adversely affect our condensed consolidated financial statements.
Recently, third-party financing of procedures generally not covered by health insurance have come under increased regulatory scrutiny. In December 2013, the Consumer Financial Protection Bureau fined GE Capital Retail Bank $34.1 million for insufficient training, disclosures and practices related to their medical financing services. In addition, Attorneys General in Massachusetts, New York and Minnesota have conducted investigations on alleged abusive lending practices or exploitation regarding third party medical financing services.
52
Table of Contents
Springstone, through its banking partners, provides financing options for elective medical procedures. In June 2014, Springstone received a civil investigative demand from the CFPB for documents and other tangible things related to its programs that provide healthcare financing. If Springstone’s practices are ultimately found to be deficient, resulting in fines, penalties or increased burdens on Springstone’s activities, our consolidated operating costs could increase. Additionally, such regulatory inquiries or actions could damage Springstone’s and our reputations and limit Springstones’ ability to conduct operations, which could adversely impact our condensed consolidated financial statements.
The adoption of any law, rule or regulation affecting this industry may increase Springstone’s administrative costs, modify its practices to comply with applicable requirements, and reduce its ability to participate competitively, which could have a material adverse effect on our consolidated revenue or results of operations
RISKS RELATING TO THE NOTES AND THE CORRESPONDING LOANS ON WHICH THE NOTES ARE DEPENDENT
We have incurred net losses in the past. If we become insolvent or bankrupt, you may lose your investment.
As of June 30, 2014, our accumulated deficit was $66.8 million and our total stockholders’ equity was $137.1 million. Our net loss for the three and six months ended June 30, 2014 was $9.2 million and $16.5 million, respectively. Our net income for both the three and six months ended June 30, 2013 was $1.7 million. We believe we will generate positive net income in the future. However, if our assumptions regarding our growth and operating plan are incorrect, we may need to slow our investment spending and/or find new funding to continue to operate our business. We believe that such funding would be available to us on terms that we would find acceptable. Any delay in securing, or failing to secure, any necessary funding could result in delays and operational slowdowns that could adversely affect the regularity of our processing payments, the cash flows on your investment and ultimately the value of your investment.
Item 2. Unregistered Sales of Equity Securities and Use of Proceeds
We have no publicly traded equity securities. At July 31, 2014, there were 236 holders of record of our common stock. We have not paid cash dividends since our inception, and we do not anticipate paying cash dividends in the foreseeable future.
Item 3. Defaults Upon Senior Securities
Not applicable.
Item 4. Mine Safety Disclosures
None.
None.
See Exhibit Index. The exhibits noted in the accompanying Exhibit Index are filed or incorporated by reference as a part of this Report and such Exhibit Index is incorporated herein by reference.
53
Table of Contents
Pursuant to the requirements of the Securities Exchange Act of 1934, the registrant has duly caused this report to be signed on its behalf by the undersigned thereunto duly authorized.
| LENDINGCLUB CORPORATION | ||
| By: | /s/ RENAUD LAPLANCHE | |
| Name: | Renaud Laplanche | |
| Title: | Chief Executive Officer | |
| (principal executive officer) | ||
| By: | /s/ CARRIE DOLAN | |
| Name: | Carrie Dolan | |
| Title: | Chief Financial Officer | |
| (principal financial officer and principal accounting officer) | ||
Dated: August 14, 2014
54
Table of Contents
| Exhibit Number |
Exhibit | |
| 2.1 | Interest Purchase Agreement dated as of April 17, 2014 (incorporated by reference to Exhibit 2.1 of the Company’s 8-K, filed April 17, 2014) | |
| 3.1 | Certificate of Incorporation of LendingClub Corporation, as amended (incorporated by reference to Exhibit 3.1 of the Company’s 8-K, filed April 17, 2014) | |
| 4.1 | Amended and Restated Investor Rights Agreement, dated as of April 16, 2014 (incorporated by reference to Exhibit 4.1 of the Company’s 8-K, filed April 17, 2014) | |
| 4.2 | Amended and Restated Voting Agreement, dated as of April 16, 2014 (incorporated by reference to Exhibit 4.2 of the Company’s 8-K, filed April 17, 2014) | |
| 4.3 | Amended and Restated Right of First Refusal and Co-Sale Agreement, dated as of April 16, 2014 (incorporated by reference to Exhibit 4.3 of the Company’s 8-K, filed April 17, 2014) | |
| 10.1 | Series F Preferred Stock Purchase Agreement, dated as of April 16, 2014 (incorporated by reference to Exhibit 10.1 of the Company’s 8-K, filed April 17, 2014) | |
| 10.2 | Credit and Guaranty Agreement, dated April 16, 2014 (incorporated by reference to Exhibit 10.23 of the Company’s Post-Effective Amendment No. 4, Registration No. 333-177230, filed April 29, 2014) | |
| 10.3 | Pledge and Security Agreement, dated April 16, 2014 (incorporated by reference to Exhibit 4.5 of the Company’s Post-Effective Amendment No. 4, Registration No. 333-177230, filed April 29, 2014) | |
| 31.1 | Certification of Chief Executive Officer, Pursuant to Section 302 of Sarbanes-Oxley Act of 2002 | |
| 31.2 | Certification of Chief Financial Officer, Pursuant to Section 302 of Sarbanes-Oxley Act of 2002 | |
| 32.1 | Certification of Chief Executive Officer and Chief Financial Officer, Pursuant to Section 906 of Sarbanes-Oxley Act of 2002 | |
| 101.INS | XBRL Instance Document | |
| 101.SCH | XBRL Taxonomy Extension Schema Document | |
| 101.CAL | Taxonomy Extension Calculation Linkbase Document | |
| 101.DEF | Taxonomy Extension Definition Linkbase Document | |
| 101.LAB | Taxonomy Extension Label Linkbase Document | |
| 101.PRE | Taxonomy Extension Presentation Linkbase Document | |
55