Attached files
| file | filename |
|---|---|
| EX-23.1 - EX-23.1 - Rexford Industrial Realty, Inc. | d773913dex231.htm |
| EX-10.1 - EX-10.1 - Rexford Industrial Realty, Inc. | d773913dex101.htm |
| EX-10.2 - EX-10.2 - Rexford Industrial Realty, Inc. | d773913dex102.htm |
UNITED STATES
SECURITIES AND EXCHANGE COMMISSION
Washington, D.C. 20549
FORM 8-K
CURRENT REPORT
Pursuant to Section 13 or 15(d)
of The Securities Exchange Act of 1934
Date of Report (Date of earliest event reported): August 12, 2014
REXFORD INDUSTRIAL REALTY, INC.
(Exact name of registrant as specified in its charter)
| Maryland | 001-36008 | 46-2024407 | ||
| (State or other jurisdiction of incorporation) |
(Commission File Number) |
(IRS Employer Identification No.) |
| 11620 Wilshire Boulevard, Suite 1000, Los Angeles, California | 90025 | |||
| (Address of principal executive offices) | (Zip Code) | |||
Registrant’s telephone number, including area code: (310) 996-1680
N/A
(Former name or former address, if changed since last report.)
Check the appropriate box below if the Form 8-K filing is intended to simultaneously satisfy the filing obligation of the registrant under any of the following provisions (see General Instructions A.2.):
| ¨ | Written communications pursuant to Rule 425 under the Securities Act (17 CFR 230.425) |
| ¨ | Soliciting material pursuant to Rule 14a-12 under the Exchange Act (17 CFR 240.14a-12) |
| ¨ | Pre-commencement communications pursuant to Rule 14d-2(b) under the Exchange Act (17 CFR 240.14d-2(b)) |
| ¨ | Pre-commencement communications pursuant to Rule 13e-4(c) under the Exchange Act (17 CFR 240.13e-4(c)) |
| ITEM 8.01 | OTHER EVENTS |
Modification of Term Loan Agreement
On January 24, 2014, certain subsidiaries of Rexford Industrial Realty, Inc. (the “Company”) and Bank of America, N.A. entered into a Modification and Loan Assumption Agreement (the “Modification Agreement”), which provides for certain immaterial amendments to the existing Term Loan Agreement dated as of July 24, 2013 between such subsidiaries and Bank of America, N.A.
In connection with the entry into the Modification Agreement, the Company executed a Reaffirmation of Guaranty (the “Reaffirmation”) dated January 24, 2014, which reaffirmed the Company’s obligations under the existing Guaranty Agreement dated as of July 24, 2013, in favor of Bank of America, N.A.
The Company inadvertently omitted to file the Modification Agreement and Reaffirmation with its Quarterly Report on Form 10-Q for the quarter ended March 31, 2014, and is filing such agreements as Exhibits 10.1 and 10.2, respectively, to this Current Report on Form 8-K.
Recent Developments
The following discussion provides information with respect to certain recent developments of the Company. Unless otherwise expressly stated or the context otherwise requires, “we,” “us” and “our” refer collectively to the Company, Rexford Industrial Realty, L.P. and the Company’s other subsidiaries.
Acquisitions and Acquisition Pipeline. Since completing our IPO, we have acquired 31 properties totaling 3.1 million rentable square feet for an aggregate purchase price of approximately $309 million, which has expanded the total rentable square footage of our portfolio by approximately 50%, including 2.2 million square feet acquired in 2014. We believe that we enjoy superior access to off-market and lightly marketed acquisition opportunities, many of which may be difficult for competing investors to access. Off-market and lightly marketed transactions are characterized by a lack of a formal marketing process and a lack of widely disseminated marketing materials. Approximately 62% of our acquisitions since our IPO and approximately 58% of our acquisitions pre-IPO have been what we consider to be “off-market” or “lightly marketed.” As we are principally focused on the Southern California infill markets, our executive management and acquisition teams have developed and maintain a deep, broad network of relationships among key market participants, including property brokers, lenders, owners and tenants. We employ an extensive broker marketing, incentives and loyalty program. We also utilize data-driven and event-driven analytics and primary research to identify and pursue events and circumstances, including financial distress, related to owners, lenders, and tenants that we believe tend to generate early access to emerging investment opportunities. We believe that our relationship network, creative sourcing approach and research-driven originations methods contribute to a superior level of attractive investment opportunities.
We believe that the combination of our proprietary origination methods and the experience and relationships of our management team provide us access to and allow us to capitalize on attractive transaction opportunities.
2
The following table provides a summary of our acquisition activity since our IPO:
Acquisitions (unaudited results, data presented on a wholly-owned basis)
| Acquisition Date |
Property | Address | Submarket | Rentable Square Feet |
Purchase Price ($ in millions) |
Occupancy % at Acquisition |
Occupancy % at June 30, 2014 |
Annualized Base Rent at June 30, 2014(1) |
Total Annualized Base Rent per Square Foot at June 30, 2014 |
Single or Multi- Tenant |
||||||||||||||||||||||||
| July 2013 |
Orion | 8101-8117 Orion Ave. |
LA - San Fern. Valley |
48,394 | $ | 5.6 | 90 | % | 100 | % | $ | 593,188 | $ | 12.26 | Multi | |||||||||||||||||||
| August 2013 |
Tarzana | 18310-18330 Oxnard St. |
LA - San Fern. Valley |
75,288 | $ | 8.4 | 81 | % | 96 | % | $ | 782,502 | $ | 10.78 | Multi | |||||||||||||||||||
| November 2013 |
Yorba Linda Business Park |
22343-22349 La Palma Ave. |
OC - North | 115,760 | $ | 12.7 | 79 | % | 77 | % | $ | 1,036,373 | $ | 11.60 | Multi | |||||||||||||||||||
| November 2013 |
The Park | 1100-1170 Gilbert St., 2353-2373 La Palma Ave. |
OC - North | 120,313 | $ | 10.6 | 85 | % | 98 | % | $ | 1,158,344 | $ | 9.79 | Multi | |||||||||||||||||||
| December 2013 |
Bonita Thompson |
280 Bonita Ave., 2743 Thompson Creek Rd. |
LA - San Gabriel |
365,859 | $ | 27.2 | 100 | % | 100 | % | $ | 1,580,511 | $ | 4.32 | Single | |||||||||||||||||||
| December 2013 |
Madera (2) | 2900-2950 N. Madera Road |
LA - San Fern. Valley |
199,370 | $ | 15.8 | 68 | % | 100 | % | $ | 800,062 | $ | 5.88 | Single | |||||||||||||||||||
| December 2013 |
Vanowen | 10635 W. Vanowen St. |
LA - San Fern. Valley |
31,037 | $ | 3.4 | 100 | % | 100 | % | $ | 254,621 | $ | 8.20 | Multi | |||||||||||||||||||
| January 2014 |
Rosecrans | 7110 Rosecrans Avenue |
LA - South Bay |
72,000 | $ | 5.0 | 50 | % | 50 | % | $ | 254,880 | $ | 7.08 | Multi | |||||||||||||||||||
| January 2014 |
14723-14825 Oxnard |
14723-14825 Oxnard Street |
LA - San Fern. Valley |
78,000 | $ | 8.9 | 98 | % | 98 | % | $ | 887,352 | $ | 11.58 | Multi | |||||||||||||||||||
| February 2014 |
Ontario Airport |
Ana Street | Inland Empire |
113,612 | $ | 8.6 | 95 | % | 92 | % | $ | 594,876 | $ | 5.66 | Multi | |||||||||||||||||||
| February 2014 |
228th Street | 1500-1510 West 228th Street |
LA - South Bay |
88,330 | $ | 6.6 | 100 | % | 95 | % | $ | 423,120 | $ | 5.02 | Multi | |||||||||||||||||||
| March 2014 |
24105 Frampton |
24105 & 24201 Frampton Avenue |
LA - South Bay |
47,903 | $ | 3.9 | 100 | % | 100 | % | $ | 278,964 | $ | 5.82 | Single | |||||||||||||||||||
| April 2014 |
Saturn Way | 1700 Saturn Way |
OC-West | 170,865 | $ | 21.1 | 100 | % | 100 | % | $ | 1,307,682 | $ | 7.65 | Single | |||||||||||||||||||
| May 2014 |
San Fernando | 2980 & 2990 N. San Fernando Blvd. |
OC-South | 130,800 | $ | 15.4 | 100 | % | 100 | % | $ | 1,325,664 | $ | 10.14 | Multi | |||||||||||||||||||
| May 2014 |
Crescent Bay | 20531 Crescent Bay Drive |
LA- San Fern. Valley |
46,178 | $ | 6.5 | 100 | % | 100 | % | $ | 371,271 | $ | 8.04 | Single | |||||||||||||||||||
| June 2014 |
Birch | 2610 & 2701 S. Birch Street |
OC- Airport | 98,105 | $ | 11.0 | 100 | % | 100 | % | $ | 0 | (3) | $ | 0.00 | (3) | Single | |||||||||||||||||
| June 2014 |
Dupont | 4051 Santa Ana St. & 701 Dupont Ave. |
Inland Empire West |
111,890 | $ | 10.2 | 100 | % | 100 | % | $ | 638,255 | $ | 5.70 | Multi | |||||||||||||||||||
S-3
| Acquisition Date |
Property | Address | Submarket | Rentable Square Feet |
Purchase Price ($ in millions) |
Occupancy % at Acquisition |
Occupancy % at June 30, 2014 |
Annualized Base Rent at June 30, 2014(1) |
Total Annualized Base Rent per Square Foot at June 30, 2014 |
Single or Multi- Tenant |
||||||||||||||||||||||||
| June 2014 |
9755 Distribution Ave |
9755 Distribution Ave |
San Diego- Central |
47,666 | $ | 5.4 | 100 | % | 100 | % | $ | 341,100 | $ | 7.16 | Multi | |||||||||||||||||||
| June 2014 |
9855 Distribution Ave |
9855 Distribution Ave |
San Diego- Central |
60,819 | $ | 8.5 | 100 | % | 100 | % | $ | 537,756 | $ | 8.84 | Multi | |||||||||||||||||||
| June 2014 |
9340 Cabot Drive |
9340 Cabot Drive |
San Diego- Central |
86,564 | $ | 11.0 | 84 | % | 84 | % | $ | 576,897 | $ | 7.95 | Multi | |||||||||||||||||||
| June 2014 |
9404 Cabot Drive |
9404 Cabot Drive |
San Diego- Central |
46,846 | $ | 6.4 | 100 | % | 100 | % | $ | 478,296 | $ | 10.21 | Single | |||||||||||||||||||
| June 2014 |
9455 Cabot Drive |
9455 Cabot Drive |
San Diego- Central |
96,840 | $ | 12.1 | 84 | % | 84 | % | $ | 651,240 | $ | 8.04 | Multi | |||||||||||||||||||
| June 2014 |
14955- 14971 E Salt Lake Ave |
14955-14971 E Salt Lake Ave |
LA- San Gabriel Valley |
126,036 | $ | 10.9 | 100 | % | 100 | % | $ | 853,647 | $ | 6.77 | Multi | |||||||||||||||||||
| June 2014 |
5235 Hunter Ave |
5235 Hunter Ave |
OC- North | 119,692 | $ | 11.3 | 100 | % | 100 | % | $ | 842,439 | $ | 7.04 | Single | |||||||||||||||||||
| June 2014 |
3880 W Valley Blvd |
3880 W Valley Blvd |
LA- San Gabriel Valley |
108,703 | $ | 9.6 | 100 | % | 100 | % | $ | 705,888 | $ | 6.49 | Single | |||||||||||||||||||
| June 2014 |
1601 & 1621 Alton Pkwy |
1601 & 1621 Alton Pkwy |
OC- Airport |
124,000 | $ | 13.3 | 40 | % | 40 | % | $ | 467,896 | $ | 9.48 | Multi | |||||||||||||||||||
| July 2014 |
3116 Avenue 32 |
3116 W. Avenue 32 |
LA- San Fern. Valley |
100,500 | $ | 11.0 | 100 | % | 100 | %(4) | $ | 688,720 | (4) | $ | 6.85 | (4) | Multi | |||||||||||||||||
| July 2014 |
Chatsworth Industrial Park |
21040 Nordoff Street; 9035 Independence Avenue; 21019-21045 Osborne Street |
LA- San Fern. Valley |
153,212 | $ | 16.8 | 100 | % | 100 | %(4) | $ | 1,083,465 | (4) | $ | 7.07 | (4) | Multi | |||||||||||||||||
| July 2014 |
24935 & 24955 Avenue Kearny |
24935 & 24955 Avenue Kearny |
LA- San Fern. Valley |
138,980 | $ | 11.5 | 100 | % | 100 | %(4) | $ | 917,891 | (4) | $ | 6.60 | (4) | Multi | |||||||||||||||||
| (1) | Calculated as monthly contracted base rent per the terms of the lease(s) at such property, as of June 30, 2014, multiplied by 12. Excludes billboard and antenna revenue and rent abatements. Annualized base rent includes rent from triple net leases, modified gross leases and gross leases. |
| (2) | Madera acquisition includes a 136,065 square foot industrial building and a 63,035 square foot office building. The office building was subsequently sold in March 2014. |
| (3) | Reflecting a short-term sale leaseback to the prior owner at no rent. |
| (4) | Reflecting values at the time of acquisition. |
We intend to continue to grow our portfolio through disciplined acquisitions in prime Southern California infill markets. Since our IPO, we have acquired approximately 3.1 million square feet of property that we believe provide opportunities for repositioning or redevelopment that will increase the occupancy and the cash flow from the property, which we sometimes refer to as a “value-add play.” We believe that our relationship-, data- and event-driven research allows us to identify and exploit asset mispricing and market inefficiencies. Through these proprietary origination methods, we are actively monitoring, as of the date of this prospectus supplement, approximately 40 million square feet of properties in our markets that we believe represent attractive potential investment opportunities, including properties containing approximately 7.1 million square feet on which we have submitted non-binding offers that remain outstanding.
S-4
We believe there are a large number of leveraged industrial properties within our target markets with unfavorable debt terms characterized by high loan to value rates, relatively high cost of debt service or high pre-payment costs, which can create illiquidity for owners facing loan maturities over the next several years. We seek to source transactions from owners with maturing loans, some facing pressing liquidity needs or financial distress, including loans that lack economical refinancing options. We also seek to transact with lenders, which, following the recent recession, may face a need to divest or resolve underperforming loans in order to meet increased capital and regulatory requirements.
We also believe there is a large number of owners increasingly experiencing a generational shift in ownership of infill industrial property in our target markets. With over one billion square feet of industrial property built prior to 1980 within infill Southern California, we are also focused on opportunities to identify and transact with such owners in an effort to address their generational needs with flexible purchase solutions that may include UPREIT-type transactions or straight purchases for cash.
Dispositions. Since our IPO, we have also disposed of two properties totaling approximately 188,000 square feet for approximately $14.5 million. The following table provides a summary of our disposition activity since our IPO:
Dispositions (unaudited results, data presented on a wholly-owned basis)
| Date |
Property | Address |
Submarket |
Rentable SF |
Purchase Price ($ in millions) |
Reason for Selling | ||||||||||
| January 2014 |
Kaiser | 1335 Park Center Drive | San Diego - North | 124,997 | $ | 10.1 | Sale to user | |||||||||
| March 2014 |
Madera – Office | 2900 N. Madera Road | LA - San Fern. Valley | 63,305 | $ | 4.4 | Non core business | |||||||||
Leasing Activity. From July 1, 2013 to June 30, 2014, we have entered into 180 new leases covering approximately 800,000 square feet and renewed 236 leases covering approximately 1,100,000 square feet.(3) The following table provides a summary of our GAAP and cash releasing spreads since our IPO.
| Leasing Spreads |
Three Months Ended June 30, 2014 |
Three Months Ended March 31, 2014 |
Three Months Ended December 31, 2013 |
Three Months Ended September 30, 2013(3) | ||||
| Cash(1) |
5.2% | 3.6% | 3.5% | (1.1)% | ||||
| GAAP(2) |
17.1% | 11.5% | 12.9% | 6.7% |
| (1) | Compares the first month cash rent excluding any abatement on new leases to the last month rent for the most recent expiring lease. Data included for comparable leases only. Comparable leases generally exclude properties under repositioning, short-term leases, and space that has been vacant for over one year. |
| (2) | Compares GAAP rent, which straightlines rental rate increases and abatement, on new leases to GAAP rent for the most recent expiring leases. Data included for comparable leases only. Comparable leases generally exclude properties under reposition, short-term leases, and space that has been vacant for over one year. |
| (3) | Includes operations of our predecessor business from July 1, 2013 to July 23, 2013. |
Business
Overview
Rexford Industrial Realty, Inc. is a Maryland corporation formed to operate as a self-administered and self-managed REIT focused on owning and operating industrial properties in Southern California infill markets. We were formed to succeed our predecessor business, which was controlled and operated by our principals, Richard Ziman, Howard Schwimmer and Michael Frankel, who collectively have decades of experience acquiring,
S-5
owning and operating industrial properties in Southern California infill markets. We completed our IPO in July 2013. As of June 30, 2014, our portfolio consists of 82 properties with approximately 7.9 million rentable square feet in infill locations. We also own a 15% interest in a joint venture (the “JV”) that indirectly owns 3 properties with approximately 1.2 million rentable square feet. In addition, we currently manage an additional 20 properties with approximately 1.2 million rentable square feet.
Our goal is to generate attractive risk-adjusted returns for our stockholders by providing superior access to industrial property investments in Southern California infill markets. Our target markets provide us with opportunities to acquire both stabilized properties generating favorable cash flow, as well as properties where we can enhance returns through value-add renovations and redevelopment. We believe that Southern California infill markets are among the most attractive industrial real estate markets for investment in the United States. Significant fragmentation, scarcity of available space and high barriers limiting new construction all contribute to create superior long-term supply/demand fundamentals. We built our company from the ground up as an institutional quality, vertically integrated platform with extensive value-add investment and management capabilities to focus on this specific market opportunity.
We own both multi-tenant and single-tenant properties comprising approximately 73% and 27% of our portfolio, respectively. Our properties are highly adaptable and appeal to a wide range of potential tenants and uses, which, in our experience, reduces re-tenanting costs, time and risk, thereby enhancing our return on investment. Our tenants generally are small and medium sized businesses that are structurally tied to the Southern California economy and therefore find that locating within our target markets is critical to the ongoing operations of their business. Our portfolio is highly diversified by tenant and industry. Of our 1,001 tenants, no single tenant accounted for more than 2.2% of our total annualized rent as of June 30, 2014. Our average tenant size is approximately 7,146 square feet, with approximately 98% of tenants occupying less than 50,000 square feet each.
We benefit from our management team’s extensive market knowledge, long-standing business and personal relationships and research- and relationship-driven origination methods developed over more than 30 years to generate attractive investment opportunities. In our view, the fragmented and complex nature of our target markets generally makes it difficult for less experienced or less focused investors to access comparable opportunities on a consistent basis.
We plan to grow our business through disciplined acquisitions of additional industrial properties in Southern California infill markets, and believe that there are substantial and attractive acquisition opportunities available to us in our target markets. According to DAUM, citing to a CoStar Industrial Report, the Southern California infill industrial property market consists of approximately 2 billion square feet of industrial properties. Our portfolio represents substantially less than 1% of this target market.
We and our predecessor have acquired 5.1 million square feet of industrial real estate since 2011 through a broad range of transaction catalysts, which we estimate as follows (based on the number of transactions closed since the start of 2011): generational ownership shift (32%); fund divestment (21%); realization of capital (5%); sale-leaseback (5%); near term debt maturity (5%); and sale-leaseback/corporate surplus (5%). Of the properties acquired since our IPO, we believe approximately 62% of these transactions were sourced through a combination of off-market and lightly marketed transactions. We believe the current market environment represents an attractive time in the real estate cycle to invest in our target properties as the many small and medium sized businesses that our properties seek to serve are just beginning to participate in the economic recovery. Despite being consistently one of the highest occupied markets in the United States approaching 95% occupancy rates as of the second quarter of 2014 according to DAUM, citing CBRE, particularly for multi-tenant properties, rental rates in our target markets have only recently begun to recover from their recessionary lows.
We will elect to be taxed as a REIT for federal income tax purposes on our federal income tax return, commencing with the year ended December 31, 2013, and generally are not subject to U.S. federal taxes on our income to the extent we annually distribute at least 90% of our REIT taxable income, determined without regard
6
to the deduction for dividends paid, to our stockholders and otherwise maintain our qualification as a REIT. We are structured as an UPREIT and own substantially all of our assets and conduct substantially all of our business through our operating partnership. We serve as the sole general partner and, as of June 30, 2014, own an approximately 89.4% interest in our operating partnership.
Experienced Management and Vertically Integrated Team
Our predecessor business was founded in 2001 by our Chairman Richard Ziman, and our Co-Chief Executive Officer, Howard Schwimmer, to take advantage of what they believed to be a particularly attractive opportunity to invest in industrial properties in Southern California infill markets. Messrs. Ziman and Schwimmer were joined by Michael Frankel, our Co-Chief Executive Officer, in 2004. These three members of our senior executive management team have worked together for over a decade, and each has substantial experience investing in and managing Southern California industrial properties.
Rexford’s vertically integrated company and team provides an entrepreneurial set of processes and personnel experienced in virtually every facet of industrial property investment and management, from originations, finance and underwriting, to asset, construction and property management.
Competitive Strengths
In addition to our infill Southern California target market and asset focus, we believe that our investment strategy and operating model distinguish us from other owners, operators and acquirers of industrial real estate in several important ways, including the following:
Attractive Existing Portfolio with Diversified Tenant Mix: We have built a difficult-to-replicate portfolio of interests in 87 properties totaling approximately 8.4 million rentable square feet. We own 100% of the interests in 84 of these properties and own a 15% interest in the remaining three properties. We believe our portfolio is attractively positioned to participate in a recovery in rental rates in our markets. As of June 30, 2014, we had 1,001 individual tenants, with no single tenant accounting for more than 2.2% of our total annualized rent. Our portfolio is also geographically diversified within the Southern California market across the following submarkets: Los Angeles (53%); Orange (17%); San Diego (14%); San Bernardino (10%); Ventura (5%).
Superior Access to Deal Flow: We believe that we enjoy superior access to distressed, off-market and lightly marketed acquisition opportunities, many of which are difficult for competing investors to access. We believe approximately 62% of the acquisitions completed by us since our IPO were off-market or lightly-marketed transactions. Off-market and lightly marketed transactions are characterized by a lack of a formal marketing process and a lack of widely disseminated marketing materials. As we are principally focused on the Southern California market, our executive management and acquisition teams have developed and maintain a deep, broad network of relationships among key market participants, including property brokers, lenders, owners and tenants. We employ an extensive broker marketing, incentives and loyalty program. We also utilize data-driven and event-driven analytics and primary research to identify and pursue events and circumstances, including financial distress, related to owners, lenders, and tenants that tend to generate early access to emerging investment opportunities. We believe that our relationship network, creative sourcing approach and research-driven originations methods contribute to a superior level of attractive investment opportunities.
Experienced Management Team: Members of our senior management team contribute over 64 years of prior public company experience, and collectively have been involved with over $25 billion of real estate acquisitions over multiple cycles. Members of our senior management team bring 130 years of experience focused on creating value by investing in infill Southern California industrial property.
7
Ability to Execute Opportunistic Transactions: The combination of our proprietary origination methods and the experience and relationships of our management team provide us access to and allow us to capitalize on unique transaction opportunities, for example:
| • | Tarzana: Tarzana is a 75,288 square foot two building, multi-tenant complex, with units ranging from 1,150 square feet to 4,595 square feet located in Los Angeles, California with 100% occupancy. We acquired this property in August 2013 for a purchase price of $8.4 million. This off-market transaction was driven by a generational ownership shift and value-add opportunity to drive rent growth through building and site modernization and professional management. We increased occupancy from 81% to 100% within 10 months following acquisition, with new leases and renewals up 8% above current in-place rents at the time of the acquisition. |
| • | The Park: The Park is a 120,313 square foot six building multi-tenant industrial complex located in Anaheim, California with 98% occupancy. We acquired this property in November 2013 in an off-market transaction where the seller was liquidating a long-term ownership partnership. We acquired this property for a purchase price of $10.6 million. We have increased occupancy from 85% to 98% eighteen months ahead of our plan, with new leases driving monthly rent up 6% in eight months. |
| • | Birch: Birch is 98,105 square feet comprised of two industrial buildings and excess land located in Santa Ana, California. We acquired this property in June 2014 for a purchase price of $11 million in an off-market transaction. We signed a six month lease-back agreement with the seller. We have the opportunity to modernize and reposition this asset and are currently negotiating two letters of intent to lease both sites for long-term leases at terms that would out-perform our initial underwriting. |
| • | Avenue Kearny: Avenue Kearny is comprised of two fully occupied single-tenant industrial buildings totaling 138,980 square feet located in Santa Clarita, California. We acquired the property in July 2014 for a purchase price of $11.5 million in an off-market transaction. We have value-add plans for the property, including adding dock high loading, ESFR sprinklers, seismic retrofitting and cosmetic upgrades, and believe the short term leases on the properties will allow near term rents to increase closer to market levels. The buildings are on two parcels allowing for possible user sales at premium values. |
| • | Westcore: Westcore consists of nine industrial projects in attractive locations, diversified over three strong infill Southern California markets, including Los Angeles, Orange and San Diego counties aggregating 817,166 square feet. We acquired this portfolio in June 2014 for a purchase price of $88.5 million as part of a corporate re-capitalization and leveraged our seller-broker relationship to exclude undesired ground lease assets from the portfolio. The portfolio is 87.3% occupied. The 24 total units are leased to 17 tenants with staggered lease expirations. We have engaged in value-add improvements, which include demising to smaller spaces and adding dock-high loading which we believe will support higher rents and cash flow. |
| • | 240th Street: 240th Street is a 100,851 square foot single-tenant industrial warehouse and distribution building in the Southbay area of Los Angeles, California. We acquired this property in May 2013 for a purchase price of $5.0 million in an off-market transaction. We maintained a partial sale-leaseback through March 2014 and have commenced a development plan to create a “like new” institutional quality building which will include 14 new docks, new offices, a new entry façade and landscape upgrades. Construction is underway with a September 2014 target date for completion. |
Vertically Integrated Platform: We are a full-service real estate operating company, with in-house capabilities in all aspects of our business. Our platform includes experienced in-house teams focused on acquisitions, analytics and underwriting, asset management and repositioning, property management, leasing, construction management and sales, as well as finance, accounting, legal and human relations departments.
Growth-Oriented Capital Structure: As of June 30, 2014, our total debt (pro rata) to total market capitalization was approximately 48.1%. We have a $200.0 million senior unsecured revolving credit facility. As of the date of this prospectus supplement, we had $137.9 million outstanding on this facility, leaving
8
$62.1 million available, plus additional capacity through other potential third-party debt providers outside of our revolving credit facility. The facility has an accordion feature that may be utilized upon our exercise and consent of the lenders.
Value-Add Repositioning and Redevelopment Expertise: Our in-house redevelopment and construction management team collectively has over 75 years of industrial property development and redevelopment experience. Our in-house team employs an entrepreneurial approach to redevelopment and repositioning activities that are designed to increase the functionality and cash flow of our properties. These activities include converting large underutilized spaces into a series of smaller and more functional spaces, adding additional square footage and modernizing properties by, among other things, modernizing fire, life-safety and building operating systems, resolving functional obsolescence, adding or enhancing loading areas and truck access and making certain other accretive improvements.
Our Business and Growth Strategies
Our primary objective is to generate attractive risk-adjusted returns for our stockholders through dividends and capital appreciation. We believe that pursuing the following strategies will enable us to achieve this objective:
External Growth through Acquisitions
We continue to grow our portfolio through disciplined acquisitions in prime Southern California infill markets. We believe that our relationship-, data- and event-driven research allows us to identify and exploit asset mispricing and market inefficiencies. Through these proprietary origination methods, we are actively monitoring, as of August 8, 2014, approximately 40 million square feet of properties in our markets that we believe represent attractive potential investment opportunities, including properties containing approximately 7.1 million square feet on which we have submitted non-binding offers that remain outstanding. We believe there are a large number of leveraged industrial properties within our target markets with unfavorable debt terms characterized by high loan to value ratios, relatively high cost of debt service or high pre-payment costs, which can create illiquidity for owners or facing loan maturities over the next several years. We seek to source transactions from owners with maturing loans, some facing liquidity needs or financial distress, including loans that lack economical refinancing options. We also seek to transact with lenders, which, following the recent recession, may face a need to divest or resolve underperforming loans in order to meet increased capital and regulatory requirements.
We also believe there is a large number of owners increasingly experiencing a generational shift in ownership of infill industrial property in our target markets. With over one billion square feet of industrial property built prior to 1980 within infill Southern California, we are also focused on opportunities to identify and transact with such owners in an effort to address their generational needs with flexible purchase solutions that may include UPREIT-type transactions or straight purchases for cash.
Internal Growth through Intensive, Value-Added Asset Management
We employ an intensive asset management strategy that is designed to increase cash flow and occupancy from our properties. Our strategy includes repositioning industrial property by renovating, modernizing or increasing functionality to increase cash flow and value. For example, we sometimes convert formerly single-tenant properties to multi-tenant occupancy to capitalize upon the higher per square foot rents generated by smaller spaces in our target markets. We believe that by undertaking such conversions or other functional enhancements, we can position our properties to attract a larger universe of potential tenants, increase occupancy, tenant quality and rental rates. We also believe that multi-tenant properties help to limit our exposure to tenant default risk and diversify our sources of cash flow.
9
Our proactive approach to leasing and asset management is driven by our in-house team of leasing, portfolio and property managers, which maintains direct, day-to-day relationships and dialogue with our tenants. In addition, we motivate listing brokers through leasing incentives combined with highly entrepreneurial leasing plans that we develop for each of our properties. We believe our proactive approach to leasing and asset management enhances recurring cash flow and reduces periods of vacancy. We have successfully increased cash flow through the leasing up of value-add acquisitions.
| Property(1) |
Square Feet | Date Acquired | Occupancy % at Acquisition |
Occupancy % at 6/30/14 |
Occupancy Change |
|||||||||||||||
| Grand Commerce Center |
101,210 | Sep-10 | 80 | % | 99 | % | +19 ppt | |||||||||||||
| Arroyo |
76,993 | Dec-10 | — | (2) | 100 | % | +100 ppt | |||||||||||||
| Odessa |
29,544 | Aug-11 | — | (2) | 100 | % | +100 ppt | |||||||||||||
| Golden Valley |
58,084 | Nov-11 | 70 | % | 98 | % | +28 ppt | |||||||||||||
| Jersey |
107,568 | Nov-11 | 80 | % | 82 | % | +2 ppt | |||||||||||||
| Arrow Business Center |
69,592 | Dec-11 | 91 | % | 97 | % | +6 ppt | |||||||||||||
| Normandie Business Center |
49,519 | Dec-11 | 73 | % | 100 | % | +27 ppt | |||||||||||||
| Paramount Business Center |
30,224 | Dec-11 | 88 | % | 100 | % | +12 ppt | |||||||||||||
| Shoemaker Industrial Park |
85,950 | Dec-11 | 68 | % | 95 | % | +27 ppt | |||||||||||||
| 3001 Mission Oaks Blvd. |
309,500 | Jun-12 | 97 | % | 100 | % | +3 ppt | |||||||||||||
| Orion |
48,394 | Jul-13 | 90 | % | 100 | % | +10 ppt | |||||||||||||
| Tarzana |
75,288 | Aug-13 | 81 | % | 96 | % | +15 ppt | |||||||||||||
| The Park |
120,313 | Nov-13 | 87 | % | 98 | % | +11 ppt | |||||||||||||
| (1) | Acquisitions that we consider “value-add” where we have demonstrated increases in occupancy since the acquisition. |
| (2) | Reflecting vacancy at acquisition. |
We believe that our current portfolio vacancy of 8.9% represents a significant internal growth opportunity to lease-up repositioned space and re-tenant for higher rents based on the average vacancy of 2.8% in our markets. As of June 30, 2014, our consolidated portfolio was 91.1% leased. We believe key factors will continue to contribute to increasing our cash flow from leasing in the near term, including:
| • | a number of our properties are in their final lease-up stage after being repositioned through our value-add activities, |
| • | we expect the firming up of supply and demand in certain markets, such as San Diego, that has generally lagged the infill markets of Los Angeles County and Orange County through the 2010 to 2012 recovery, and are now experiencing net positive absorption, and |
| • | expected market rental rate increases in the multi-tenant industrial market, as smaller and medium sized business tenants begin to gain access to increased liquidity and available credit as the economy recovers. |
10
Post-IPO Execution
Since our IPO, we have focused on leveraging our competitive strengths and executing on our business and growth strategies to drive the growth of our business. In addition to substantially increasing the size of our portfolio and increasing rents and occupancy in our portfolio, these efforts have resulted in substantial improvements in our financial performance since the IPO, as evidenced by the notable growth in our FFO, Cash NOI and EBITDA:
FFO(1)
| (in thousands except share and (unaudited results) |
||||||||||||||||||||
| Rexford Industrial Realty, Inc.(2) | Rexford Industrial Realty, Inc. Predecessor |
|||||||||||||||||||
| Three Months Ended | July 24, 2013 to Sep. 30, 2013 |
July 1, 2013 to July 23, 2013 |
||||||||||||||||||
| June 30, 2014 |
March 31, 2014 |
December 31, 2013 |
||||||||||||||||||
| Funds From Operations (FFO) |
||||||||||||||||||||
| Net income (loss) attributable to common stockholders/predecessor |
$ | 73 | $ | 1,277 | $ | (881 | ) | $ | 256 | $ | (5,868 | ) | ||||||||
| Add: |
||||||||||||||||||||
| Depreciation and amortization, including amounts in discontinued operations |
6,003 | 6,137 | 5,716 | 3,062 | 901 | |||||||||||||||
| Depreciation and amortization from unconsolidated joint ventures |
103 | 85 | 153 | 96 | 107 | |||||||||||||||
| Loss from early extinguishment of debt |
— | — | — | — | 3,935 | |||||||||||||||
| Net income (loss) attributable to noncontrolling interests |
8 | 152 | (125 | ) | 39 | — | ||||||||||||||
| Deduct: |
||||||||||||||||||||
| Gains on sale of real estate |
— | 2,125 | — | — | — | |||||||||||||||
|
|
|
|
|
|
|
|
|
|
|
|||||||||||
| FFO available to common shareholders and unitholders |
$ | 6,187 | $ | 5,526 | $ | 4,863 | $ | 3,453 | $ | (925 | ) | |||||||||
|
|
|
|
|
|
|
|
|
|
|
|||||||||||
| Company share of FFO |
$ | 5,532 | (3) | $ | 4,941 | $ | 4,308 | $ | 3,001 | |||||||||||
|
|
|
|
|
|
|
|
|
|||||||||||||
| FFO per share - basic and diluted |
$ | 0.22 | $ | 0.19 | $ | 0.17 | $ | 0.12 | ||||||||||||
|
|
|
|
|
|
|
|
|
|||||||||||||
| FFO available to common shareholders and unitholders |
$ | 6,187 | $ | 5,526 | $ | 4,863 | $ | 3,453 | ||||||||||||
| Add: |
||||||||||||||||||||
| Non-recurring legal fees |
— | — | 225 | 235 | ||||||||||||||||
| Acquisition Expenses |
652 | 333 | 421 | 119 | ||||||||||||||||
|
|
|
|
|
|
|
|
|
|||||||||||||
| FFO available to common shareholders and unitholders before non-recurring legal fees |
$ | 6,839 | $ | 5,859 | $ | 5,509 | $ | 3,807 | ||||||||||||
|
|
|
|
|
|
|
|
|
|||||||||||||
| Company share of FFO before non-recurring legal fees and acquisition expenses(3) |
$ | 6,115 | $ | 5,239 | $ | 4,880 | $ | 3,373 | ||||||||||||
|
|
|
|
|
|
|
|
|
|||||||||||||
| FFO per share before non-recurring legal fees and acquisition expenses—basic and diluted |
$ | 0.24 | $ | 0.21 | $ | 0.19 | $ | 0.14 | ||||||||||||
|
|
|
|
|
|
|
|
|
|||||||||||||
| Weighted-average shares outstanding—basic and diluted |
25,419,757 | 25,419,418 | 25,191,570 | 24,574,432 | ||||||||||||||||
| Weighted-average diluted shares and units |
28,429,016 | 28,428,677 | 28,436,531 | 28,271,518 | ||||||||||||||||
11
| (1) | We calculate FFO before non-controlling interest in accordance with the standards established by the National Association of Real Estate Investment Trusts (“NAREIT”). FFO represents net income (loss) (computed in accordance with GAAP), excluding gains (or losses) from sales of depreciable operating property, real estate related depreciation and amortization (excluding amortization of deferred financing costs) and after adjustments for unconsolidated partnerships and joint ventures. |
Management uses FFO as a supplemental performance measure because, in excluding real estate related depreciation and amortization, gains and losses from property dispositions, other than temporary impairments of unconsolidated real estate entities, and impairment on our investment in real estate, it provides a performance measure that, when compared year over year, captures trends in occupancy rates, rental rates and operating costs. We also believe that, as a widely recognized measure of performance used by other REITs, FFO may be used by investors as a basis to compare our operating performance with that of other REITs.
However, because FFO excludes depreciation and amortization and captures neither the changes in the value of our properties that result from use or market conditions nor the level of capital expenditures and leasing commissions necessary to maintain the operating performance of our properties, all of which have real economic effects and could materially impact our results from operations, the utility of FFO as a measure of our performance is limited. Other equity REITs may not calculate or interpret FFO in accordance with the NAREIT definition as we do, and, accordingly, our FFO may not be comparable to such other REITs’ FFO. FFO should not be used as a measure of our liquidity, and is not indicative of funds available for our cash needs, including our ability to pay dividends.
| (2) | Reflects operations since the completion of our IPO on July 24, 2013. |
| (3) | Based on weighted average interest in our operating partnership of 89.4% for the three months ended June 30, 2014. |
12
NOI and Cash NOI(1)
| (in thousands, unaudited results) |
||||||||||||||||||||
| Rexford Industrial Realty, Inc.(2) | Rexford Industrial Realty, Inc. Predecessor |
|||||||||||||||||||
| Three Months ended | Period from July 24, 2013 to Sep. 30, 2013 |
Period from July 1, 2013 to July 23, 2013 |
||||||||||||||||||
| June 30, 2014 | March 31, 2014 | December 31, 2013 |
||||||||||||||||||
| Net Operating Income (NOI) |
||||||||||||||||||||
| Rental revenues |
$ | 12,773 | $ | 11,628 | $ | 10,809 | $ | 7,640 | $ | 2,384 | ||||||||||
| Tenant reimbursements |
1,681 | 1,511 | 1,333 | 828 | 254 | |||||||||||||||
| Other income |
15 | 42 | 53 | 40 | 20 | |||||||||||||||
|
|
|
|
|
|
|
|
|
|
|
|||||||||||
| Total operating revenues |
14,469 | 13,181 | 12,195 | 8,508 | 2,658 | |||||||||||||||
| Property expenses |
3,892 | 4,134 | 3,869 | 2,527 | 689 | |||||||||||||||
|
|
|
|
|
|
|
|
|
|
|
|||||||||||
| Total operating expenses |
3,892 | 4,134 | 3,869 | 2,527 | 689 | |||||||||||||||
|
|
|
|
|
|
|
|
|
|
|
|||||||||||
| NOI |
$ | 10,577 | $ | 9,047 | $ | 8,326 | $ | 5,981 | $ | 1,969 | ||||||||||
|
|
|
|
|
|
|
|
|
|
|
|||||||||||
| Fair value lease revenue |
73 | 81 | 63 | 122 | 44 | |||||||||||||||
| Straight line rent adjustment |
(436 | ) | (208 | ) | (342 | ) | (156 | ) | 29 | |||||||||||
|
|
|
|
|
|
|
|
|
|
|
|||||||||||
| Cash NOI |
$ | 10,214 | $ | 8,920 | $ | 8,047 | $ | 5,947 | $ | 2,042 | ||||||||||
|
|
|
|
|
|
|
|
|
|
|
|||||||||||
| Net Income (Loss) |
$ | 81 | $ | 1,429 | $ | (1,006 | ) | $ | 295 | $ | (5,868 | ) | ||||||||
| Add: |
||||||||||||||||||||
| General and administrative |
2,780 | 2,605 | 2,827 | 2,500 | 1,885 | |||||||||||||||
| Depreciation and amortization |
6,003 | 6,130 | 5,661 | 3,025 | 888 | |||||||||||||||
| Acquisition expenses |
652 | 333 | 421 | 119 | 7 | |||||||||||||||
| Interest expense |
1,537 | 1,251 | 1,046 | 717 | 1,233 | |||||||||||||||
| Subtract: |
||||||||||||||||||||
| Management, leasing, and development services |
249 | 234 | 253 | 281 | 13 | |||||||||||||||
| Interest income |
278 | 276 | 190 | 191 | 63 | |||||||||||||||
| Equity in income from unconsolidated real estate entities |
(51 | ) | 45 | 9 | 83 | 9 | ||||||||||||||
| Loss on extinguishment of debt |
— | — | — | — | (3,919 | ) | ||||||||||||||
| Income from discontinued operations |
— | 2,146 | 171 | 120 | 10 | |||||||||||||||
|
|
|
|
|
|
|
|
|
|
|
|||||||||||
| NOI |
$ | 10,577 | $ | 9,047 | $ | 8,326 | $ | 5,981 | $ | 1,969 | ||||||||||
|
|
|
|
|
|
|
|
|
|
|
|||||||||||
| Fair value lease revenue |
73 | 81 | 63 | 122 | 44 | |||||||||||||||
| Straight line rent adjustment |
(436 | ) | (208 | ) | (342 | ) | (156 | ) | 29 | |||||||||||
|
|
|
|
|
|
|
|
|
|
|
|||||||||||
| Cash NOI |
$ | 10,214 | $ | 8,920 | $ | 8,047 | $ | 5,947 | $ | 2,042 | ||||||||||
|
|
|
|
|
|
|
|
|
|
|
|||||||||||
| (1) | NOI includes the revenue and expense directly attributable to our real estate properties calculated in accordance with GAAP. Calculated as total revenue from real estate operations including i) rental revenues ii) tenant reimbursements, and iii) other income less property expenses (before interest expense, depreciation and amortization). We use NOI as a supplemental performance measure because, in excluding real estate depreciation and amortization expense and gains (or losses) from property dispositions, it provides a performance measure that, when compared year over year, captures trends in occupancy rates, rental rates and operating costs. We also believe that NOI is useful to investors as a basis to compare our operating performance with that of other REITs. However, because NOI excludes depreciation and amortization expense and captures neither the changes in the value of our properties that result from use or market conditions, nor the level of capital expenditures and leasing commissions necessary to maintain the operating performance of our properties (all of which have real economic effect and could materially impact our results from operations), the utility of NOI as a measure of our performance is limited. Other equity REITs may not calculate NOI in a similar manner and, accordingly, our NOI may not be comparable to such other REITs’ NOI. Accordingly, NOI should |
13
| be considered only as a supplement to net income as a measure of our performance. NOI should not be used as a measure of our liquidity, nor is it indicative of funds available to fund our cash needs. NOI should not be used as a substitute for cash flow from operating activities in accordance with GAAP. |
Cash NOI is a non-GAAP measure, which we calculate by adding or subtracting from NOI i) fair value lease revenue and ii) straight-line rent adjustment. We use Cash NOI, together with NOI, as a supplemental performance measure.
Cash NOI should not be used as a measure of our liquidity, nor is it indicative of funds available to fund our cash needs. Cash NOI should not be used as a substitute for cash flow from operating activities computed in accordance with GAAP.
| (2) | Reflect operations since the completion of our IPO on July 24, 2013. |
EBITDA and Pro Forma Adjusted EBITDA(1)
| (in thousands) | ||||||||||||||||
| (unaudited results) | ||||||||||||||||
| Rexford Industrial Realty, Inc. | ||||||||||||||||
| Three Months Ended | Period from July 24, 2013 to September 30, 2013 |
|||||||||||||||
| June 30, 2014 | March 31, 2014 | December 31, 2013 | ||||||||||||||
| Net income (loss) |
$ | 81 | $ | 1,429 | $ | (1,006 | ) | $ | 295 | |||||||
| Interest expense |
1,537 | 1,251 | 1,046 | 717 | ||||||||||||
| Proportionate share of interest expense from unconsolidated joint ventures |
45 | 57 | 42 | 32 | ||||||||||||
| Depreciation and amortization |
6,003 | 6,130 | 5,661 | 3,025 | ||||||||||||
| Depreciation and amortization included in discontinued operations |
— | 7 | 55 | 37 | ||||||||||||
| Proportionate share of real estate related depreciation and amortization from unconsolidated joint ventures |
103 | 85 | 153 | 72 | ||||||||||||
|
|
|
|
|
|
|
|
|
|||||||||
| EBITDA |
$ | 7,769 | $ | 8,959 | $ | 5,951 | $ | 4,178 | ||||||||
|
|
|
|
|
|
|
|
|
|||||||||
| Stock-based compensation amortization |
279 | 172 | (59 | ) | 326 | |||||||||||
| Gain on sale of real estate |
— | (2,125 | ) | — | — | |||||||||||
| Non-recurring legal fees |
— | — | 225 | 235 | ||||||||||||
| Acquisition expenses |
652 | 333 | 421 | 119 | ||||||||||||
| Pro forma effect of acquisitions(2) |
1,625 | 203 | 606 | 23 | ||||||||||||
| Pro forma effect of assets sold subsequent to end of the quarter(3) |
— | (28 | ) | (226 | ) | (157 | ) | |||||||||
|
|
|
|
|
|
|
|
|
|||||||||
| Pro Forma Adjusted EBITDA |
$ | 10,325 | $ | 7,514 | $ | 6,918 | $ | 4,724 | ||||||||
|
|
|
|
|
|
|
|
|
|||||||||
| (1) | We believe that EBITDA is helpful to investors as a supplemental measure of our operating performance as a real estate company because it is a direct measure of the actual operating results of our industrial properties. We also use this measure in ratios to compare our performance to that of our industry peers. In addition, we believe EBITDA is frequently used by securities analysts, investors and other interested parties in the evaluation of Equity REITs. However, because EBITDA is calculated before recurring cash charges including interest expense and income taxes, and is not adjusted for capital expenditures or other recurring cash requirements of our business, its utility as a measure of our liquidity is limited. Accordingly, EBITDA should not be considered an alternative to cash flow from operating activities (as computed in accordance with GAAP) as a measure of our liquidity. EBITDA should not be considered as an alternative to net income or loss as an indicator of our operating performance. Other Equity REITs may calculate EBITDA differently than we do; accordingly, our EBITDA may not be comparable to such other Equity REITs’ EBITDA. Pro Forma Adjusted EBITDA includes add backs of non-cash stock based compensation expense, loss on extinguishment of debt, non-recurring legal fees and the pro-forma effects of acquisitions and assets classified as held for sale. |
14
| (2) | Represents the estimated impact of second quarter 2014 acquisitions as if they had been acquired on April 1, 2014, first quarter 2014 acquisitions as if they had been acquired on January 1, 2014, fourth quarter 2013 acquisitions calculating as if they had been acquired on October 1, 2013, and third quarter 2013 acquisitions as if they had been acquired on July 24, 2013. We have made a number of assumptions in such estimates and there can be no assurance that we would have generated the projected levels of EBITDA had we owned the acquired entities as of the beginning of each period. |
| (3) | Represents the estimated impact of Kaiser, which was sold on January 29, 2014, and Madera, which was sold on March 13, 2014, as if they had been disposed of as of the beginning of each period presented. |
Market Overview
Unless otherwise indicated, all information contained in this Market Overview section is derived from market materials prepared by DAUM Commercial Real Estate Services (“DAUM”) as of December 31, 2013, citing CoStar Property Database, CBRE and other sources.
Southern California Infill Industrial Market
The Southern California industrial real estate market is the largest in the United States, with approximately 2.0 billion square feet of space, approximately 1.7 times larger than the next largest industrial real estate market (Chicago, Illinois) when measured by square footage, as illustrated below:
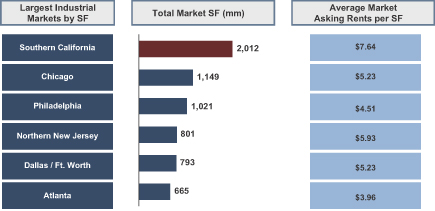
Source: DAUM market materials, citing CoStar Property Database and CoStar Industrial Report 1Q2014
Note: Southern California market comprised of Los Angeles, Orange, Ventura, San Bernardino, Riverside and San Diego Counties.
Southern California is generally segmented into infill and non-infill industrial markets. Infill markets are considered high-barrier to-entry markets and have characteristics that tend to limit new construction.
Our investment strategy focuses on the 1.73 billion square foot infill market comprised of Los Angeles County, Orange County, West Inland Empire, San Diego County and Ventura County. These markets benefit from some of the highest rents in the country. While the United States average asking rent per square foot is $4.80, the average annualized base rent of our properties located in Los Angeles County, Orange County, San Bernardino County, San Diego County and Ventura County as of June 30, 2014 was $8.45, $7.90, $7.95, $9.05 and $7.81, respectively. Over $7.2 billion of industrial property was sold in Southern California during the 12 month period ended May 2014. We believe the market trends and conditions discussed below have created favorable investment opportunities that we are competitively positioned to capitalize upon.
15
Limited, Diminishing Supply with Substantial Barriers to Entry
Southern California is generally considered to be nearly fully developed and is characterized by a scarcity of vacant or developable land. Further, lease rates typically do not justify development of new industrial properties for lease in infill markets, which presents an economic barrier for those seeking to develop new industrial properties. The entitlement process is also restrictive and requires particular expertise to navigate. Consequently, there has been a dearth of new multi-tenant industrial properties built for lease since 1999, with infill development generally limited to relatively few owner-user and build-to-suit developments. Multi-tenant development represented only 1.2% of total new industrial property construction in Southern California markets during 2013. Further, as a majority of infill product is multi-tenant, a majority of new construction occurred in the Inland Empire, much of which is non-infill and generally outside of our primary target markets.
% Change in Southern California Existing Industrial Stock
Source: DAUM market materials, citing CoStar Property Database as of December 2013
16
High Current Occupancy and High Rental Rates
The Southern California infill industrial market has consistently out-performed other national markets on the basis of occupancy and asking rents. As of December 31, 2013, occupancy was 95.5% and 95.2% for Los Angeles and Orange Counties, respectively, versus the national average of 92.0%. Since 2001, average Los Angeles and Orange County asking rents were 68.5% higher than the average of the next nine largest markets in the nation over the same thirteen-year period. As shown in the charts below, the occupancy rates for Los Angeles and Southern California have consistently been above the other large markets in the United States since the fourth quarter of 2001 and the occupancy rates never dipped below 90%, even during the most recent recession.
Market Leading Occupancy
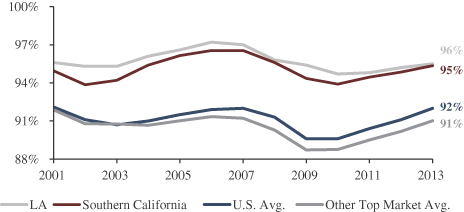
Source: DAUM market report, citing CoStar Property Database and data provided by CBRE as of December 2013
Market Leading Rental Rates
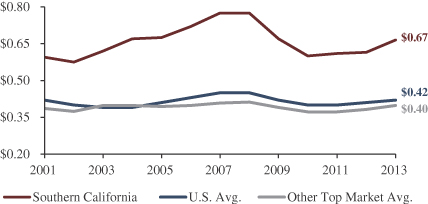
Source: DAUM market report, citing CoStar Property Database and data provided by CBRE as of December 2013
17
Low Vacancy Rates in Target Markets
Due to the supply constrained nature of the Southern California infill industrial market, industrial vacancies in our markets remain very low at 2.8%(1), compared to 11.1% nationally. The vacancy rate by submaket is as follows:
| Submarket |
Market Size |
Triple Net Asking Rent |
Vacancy Rate |
|||||
| Ventura County |
62 million SF | $0.63 / SF | 5.4 | % | ||||
| San Fernando Valley |
172 million SF | $0.69 / SF | 1.3 | % | ||||
| Central Los Angeles |
124 million SF | $0.70 / SF | 2.5 | % | ||||
| Vernon/ Commerce |
160 million SF | $0.53 / SF | 2.4 | % | ||||
| San Gabriel Valley |
146 million SF | $0.56 / SF | 1.3 | % | ||||
| South Bay |
218 million SF | $0.59 / SF | 2.1 | % | ||||
| Mid-Counties |
108 million SF | $0.57 / SF | 3.2 | % | ||||
| North Orange County |
110 million SF | $0.58 / SF | 1.8 | % | ||||
| West Orange County |
41 million SF | $0.64 / SF | 2.0 | % | ||||
| Orange County Airport |
69 million SF | $0.70 / SF | 3.0 | % | ||||
| San Diego County - Warehouse |
47 million SF | $0.63 / SF | 6.6 | % | ||||
| San Diego County - Light Industrial |
69 million SF | $0.75 / SF | 5.4 | % | ||||
| (1) | Represents the weighted average vacancy based on our square footage in each of the submarkets in the table above |
Diverse Tenant Demand Base
Southern California is home to the nation’s largest and most diverse manufacturing, distribution and consumer staples sector, as well as the largest number of high-tech jobs. We draw our tenants from over 17 industry sectors. The trend of off-shoring domestic manufacturing to Asia further fuels Southern California industrial tenant demand, as Asian goods pass through the Los Angeles-area ports and require regional warehousing and distribution to access the broader U.S. market. As of December 31, 2013, approximately 18.5% of our tenants imported product from outside the U.S. Additionally, the emergence of e-commerce and the growth of Internet retailers and wholesalers are expanding the universe of tenants seeking industrial space in our target markets. Forrester Research Inc. projects that online shoppers in the United States will spend $327 billion in 2016, up 45% from the $226 billion spent in 2012, increasing to an estimated 9.0% of total retail sales by 2016.
Large and Growing Regional Population
Southern California represents the largest regional population in the United States, with over 21 million residents, comprising over 57% of California residents. The population has increased by approximately 2 million since 2000 and is projected to increase to over 25 million residents by 2030. California’s 2.6% GDP growth in 2013 exceeded the national average and is expected to exceed the national average again in 2014. Our infill tenant base tends to disproportionately serve the direct consumption needs of this growing regional Southern California population.
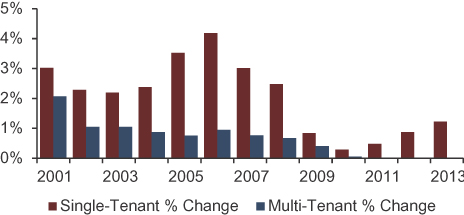
Smaller Spaces and Multi-Tenant Properties Tend to Outperform Larger, Single-Tenant Properties
Our target infill markets feature a majority of properties valued below $25 million or sized below 300,000 square feet. We believe smaller spaces, generally under 40,000 square feet, are positioned for rental rate recovery as economic conditions improve for smaller- and mid-sized tenants in the face of ongoing scarcity of supply of these spaces. Rental rates for larger, single-tenant spaces have recovered nearly to their pre-recession levels. Conversely, rental rates for small- and mid-sized tenants on average remain fifteen percent below their pre-recession levels and have lagged in recovery compared to larger spaces in our target markets. Consequently, we believe the potential for rental rates to increase in the smaller- and medium-sized spaces and buildings may be
18
substantially greater in the near- to medium-term than for larger spaces fueled, in part, by improving liquidity and access to working capital for small and medium sized businesses as the economy continues to recover more broadly.
As shown in the chart below, rental rates in the Southern California industrial infill market are projected to increase over the next three years. Moreover, multi-tenant space under 40,000 square feet, which has been slower to recover from the recent recession, is projected to outperform single-tenant space containing 100,000 or more square feet according to DAUM, utilizing data provided by CBRE.
Southern California Industrial—Asking Rent Growth
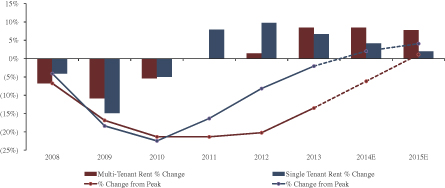
Source: DAUM market materials, citing CoStar Property
Database and data provided by CBRE as of December 2013
| ITEM 9.01 | FINANCIAL STATEMENTS AND EXHIBITS |
(d) Exhibits.
| 10.1 | Modification and Loan Assumption Agreement, dated January 24, 2014, by and among RIF I—Don Julian, LLC, RIF I—Lewis Road, LLC, RIF I—Oxnard, LLC, RIF I—Walnut, LLC, REXFORD BUSINESS CENTER—FULLERTON, LLC, RIF II—Kaiser, LLC, RIF III—Irwindale, LLC and REXFORD INDUSTRIAL—MADERA INDUSTRIAL, LLC collectively as Borrower, and Bank of America, N.A., as Lender | |
| 10.2 | Reaffirmation of Guaranty, dated January 24, 2014 by Rexford Industrial Realty, Inc. | |
| 23.1 | Consent of DAUM Commercial Real Estate Services | |
19
SIGNATURES
Pursuant to the requirements of the Securities Exchange Act of 1934, as amended, the registrant has duly caused this report to be signed on its behalf by the undersigned hereunto duly authorized.
| Rexford Industrial Realty, Inc. | ||||
| August 12, 2014 | /s/ Michael S. Frankel | |||
| Michael S. Frankel Co-Chief Executive Officer (Principal Executive Officer) | ||||
| Rexford Industrial Realty, Inc. | ||||
| August 12, 2014 | /s/ Howard Schwimmer | |||
| Howard Schwimmer Co-Chief Executive Officer (Principal Executive Officer) | ||||
20
EXHIBIT INDEX
| Exhibit Number |
Description | |
| 10.1 | Modification and Loan Assumption Agreement, dated January 24, 2014, by and among RIF I—Don Julian, LLC, RIF I—Lewis Road, LLC, RIF I—Oxnard, LLC, RIF I—Walnut, LLC, REXFORD BUSINESS CENTER—FULLERTON, LLC, RIF II—Kaiser, LLC, RIF III—Irwindale, LLC and REXFORD INDUSTRIAL—MADERA INDUSTRIAL, LLC collectively as Borrower, and Bank of America, N.A., as Lender | |
| 10.2 | Reaffirmation of Guaranty, dated January 24, 2014 by Rexford Industrial Realty, Inc. | |
| 23.1 | Consent of DAUM Commercial Real Estate Services | |
21