Attached files
| file | filename |
|---|---|
| 8-K - 8-K - MERCER INTERNATIONAL INC. | d770076d8k.htm |
Exhibit 99.1

MERCER INTERNATIONAL GROUP
Jefferies 2014 Global Industrials Conference
August 14, 2014
Forward Looking Statements
The Private Securities Litigation Reform Act of 1995 provides a “safe harbor” for forward-looking statements. Certain information included in this presentation contains statements that are forward-looking, such as statements relating to results of operations and financial conditions and business development activities, as well as capital spending and financing sources. Such forward-looking information involves important risks and uncertainties that could significantly affect anticipated results in the future and, accordingly, such results may differ materially from those expressed in any forward-looking statements made by or on behalf of Mercer. For more information regarding these risks and uncertainties, review Mercer’s filings with the United States Securities and Exchange Commission. Unless required by law, we do not assume any obligation to update forward-looking statements based on unanticipated events or changed expectations.
NASDAQ:MERC | TSX:MRI.U | www.mercerint.com MERCER 2
Mercer International Inc.
NASDAQ:MERC | TSX:MRI.U | www.mercerint.com MERCER 3
Corporate Structure
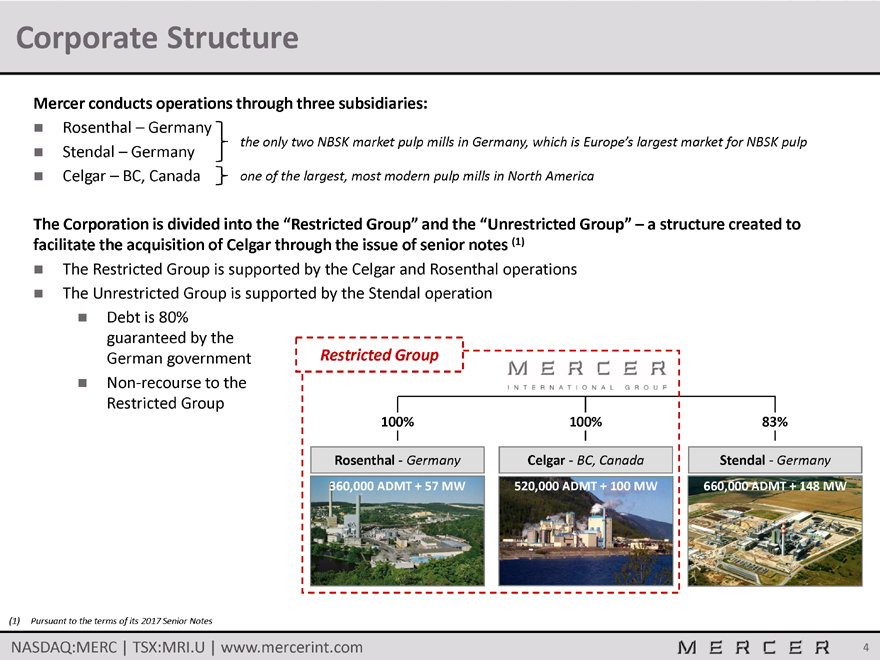
Mercer conducts operations through three subsidiaries:
Rosenthal – Germany
the only two NBSK market pulp mills in Germany, which is Europe’s largest market for NBSK pulp
Stendal – Germany
Celgar – BC, Canada one of the largest, most modern pulp mills in North America
The Corporation is divided into the “Restricted Group” and the “Unrestricted Group” – a structure created to
facilitate the acquisition of Celgar through the issue of senior notes (1)
The Restricted Group is supported by the Celgar and Rosenthal operations
The Unrestricted Group is supported by the Stendal operation
Debt is 80% guaranteed by the German government
Non-recourse to the Restricted Group
Restricted Group MERCER INTERNATIONAL GROUP
100% 100% 83%
Rosenthal - Germany Celgar - BC, Canada Stendal - Germany
360,000 ADMT + 57 MW 520,000 ADMT + 100 MW 660,000 ADMT + 148 MW
(1) Pursuant to the terms of its 2017 Senior Notes
NASDAQ:MERC | TSX:MRI.U | www.mercerint.com MERCER 4
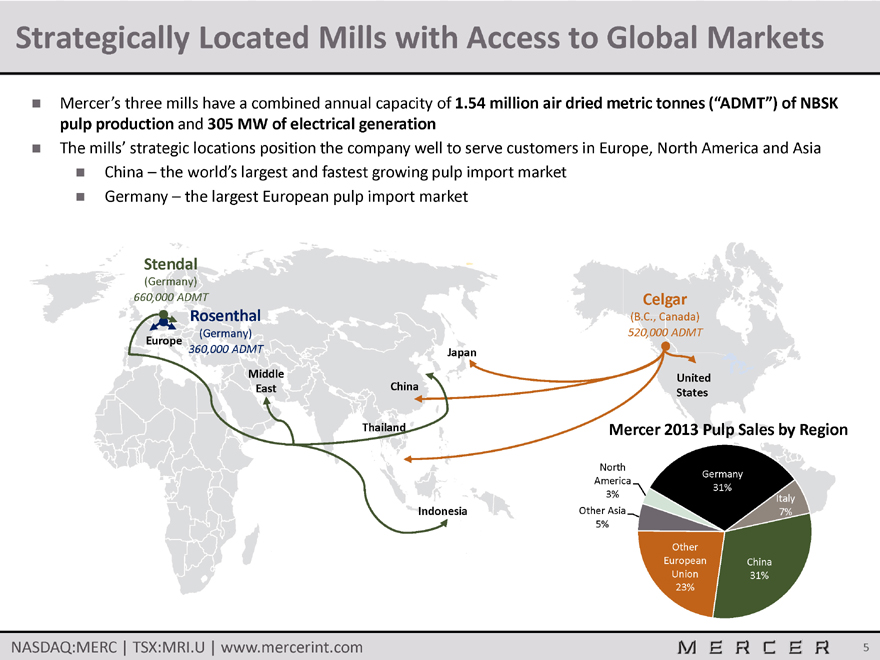
Strategically Located Mills with Access to Global Markets
Mercer’s three mills have a combined annual capacity of 1.54 million air dried metric tonnes (“ADMT”) of NBSK
pulp production and 305 MW of electrical generation
The mills’ strategic locations position the company well to serve customers in Europe, North America and Asia
China – the world’s largest and fastest growing pulp import market
Germany – the largest European pulp import market
Stendal
(Germany)
660,000 ADMT
Rosenthal
(Germany)
Europe
360,000 ADMT
Celgar
(B.C., Canada)
520,000 ADMT
Japan
Middle East
China
Thailand
Indonesia
United
States
Mercer 2013 Pulp Sales by Region
North America 3%
Germany 31%
Italy 7%
Other Asia
5%
Other
European
Union 23%
China 31%
NASDAQ:MERC | TSX:MRI.U | www.mercerint.com MERCER 5
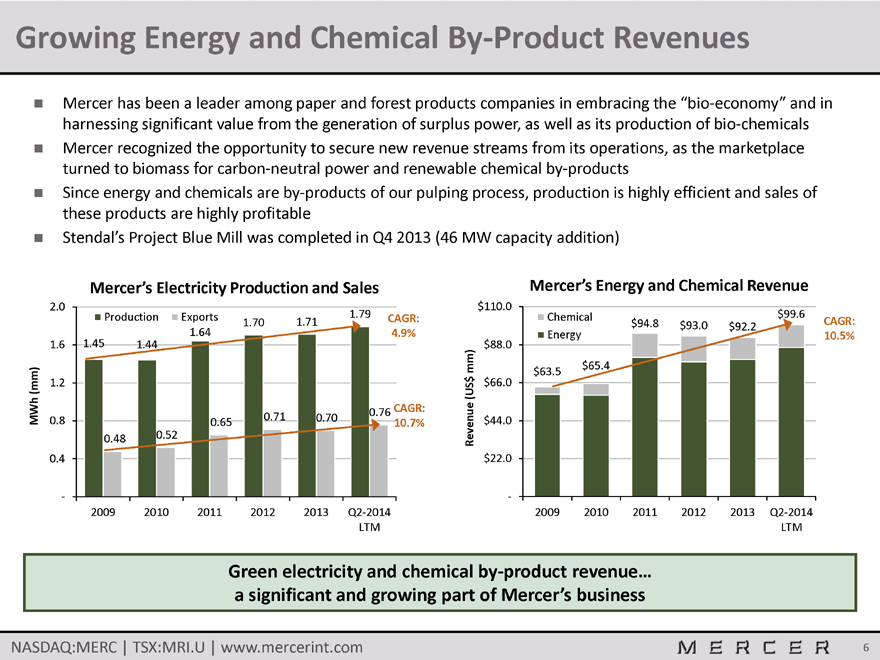
Growing Energy and Chemical By-Product Revenues
Mercer has been a leader among paper and forest products companies in embracing the “bio-economy” and in harnessing significant value from the generation of surplus power, as well as its production of bio-chemicals
Mercer recognized the opportunity to secure new revenue streams from its operations, as the marketplace turned to biomass for carbon-neutral power and renewable chemical by-products
Since energy and chemicals are by-products of our pulping process, production is highly efficient and sales of these products are highly profitable
Stendal’s Project Blue Mill was completed in Q4 2013 (46 MW capacity addition)
Mercer’s Electricity Production and Sales
Mercer’s Energy and Chemical Revenue
2.0
1.6
1.2
0.8
0.4
-
Production Exports 1.79
1.45 1.44 1.64 1.70 1.71
CAGR: 4.9%
0.48
0.52
0.65
0.71
0.70
0.76
MWh (mm)
CAGR: 10.7%
2009 2010 2011 2012 2013 Q2-2014 LTM
$110.0
$88.0
$66.0
$44.0
$22.0
-
Chemical
Energy
$63.5 $65.4 $94.8 $93.0 $92.2 $99.6
CAGR: 10.5%
Revenue (US$ mm)
2009 2010 2011 2012 2013 Q2-2014 LTM
Green electricity and chemical by-product revenue…
a significant and growing part of Mercer’s business
NASDAQ:MERC | TSX:MRI.U | www.mercerint.com MERCER 6
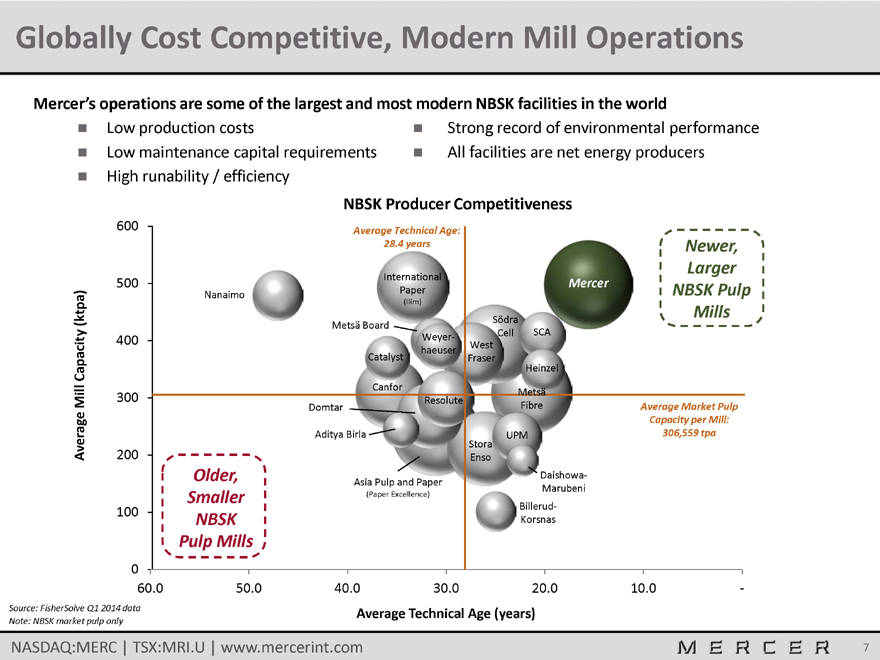
Globally Cost Competitive, Modern Mill Operations
Mercer’s operations are some of the largest and most modern NBSK facilities in the world
Low production costs Strong record of environmental performance
Low maintenance capital requirements All facilities are net energy producers
High runability / efficiency
NBSK Producer Competitiveness
Average Mill Capacity (ktpa)
0 100 200 300 400 500 600
Average Technical Age:
28.4 years
International
Paper
(Ilim)
Nanaimo
Metsa Board
Weyer-
haeuser
Catalyst
Canfor
Resolute
Domtar
Aditya Birla
Asia Pulp and Paper (Paper Excellence)
Older, Smaller
NBSK
Pulp Mills
Newer,
Larger
NBSK Pulp
Mills
Mercer
Sodra
Cell SCA
West
Fraser
Heinzel
Metsa
Fibre Average Market Pulp
Capacity per Mill:
306,559 tpa
UPM
Stora
Enso
Daishowa-
Marubeni
Billerud-
Korsnas
60.0 50.0 40.0 30.0 20.0 10.0 -
Source: FisherSolve Q1 2014 data Average Technical Age (years)
Note: NBSK market pulp only
NASDAQ:MERC | TSX:MRI.U | www.mercerint.com MERCER 7
The NBSK Market
NASDAQ:MERC | TSX:MRI.U | www.mercerint.com MERCER 8
Introduction to the Major Themes in NBSK
Current themes surrounding the NBSK market include:
The effect of China and other emerging economies’ continuing growth
The impact of digital media on paper demand
The potential supply impact of integrated players selling their pulp on the market
The net supply impact of mill closures, starts / restarts, and facility conversions
The impact of additional hardwood capacity coming online
NASDAQ:MERC | TSX:MRI.U | www.mercerint.com MERCER 9
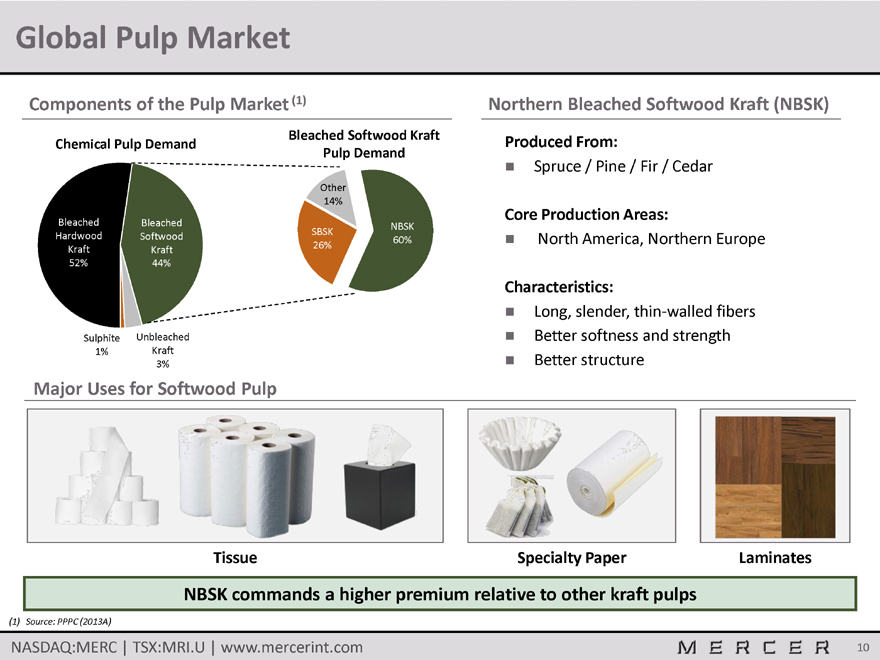
Global Pulp Market
Components of the Pulp Market (1)
Chemical Pulp Demand
Bleached Hardwood Kraft 52%
Bleached Softwood Kraft 44%
Sulphite 1% Unbleached Kraft 3%
Bleached Softwood Kraft
Pulp Demand
Other 14%
SBSK 26% NBSK 60%
Northern Bleached Softwood Kraft (NBSK)
Produced From:
Spruce / Pine / Fir / Cedar
Core Production Areas:
North America, Northern Europe
Characteristics:
Long, slender, thin-walled fibers
Better softness and strength
Better structure
Major Uses for Softwood Pulp
Tissue Specialty Paper Laminates
NBSK commands a higher premium relative to other kraft pulps
(1) Source: PPPC (2013A)
NASDAQ:MERC | TSX:MRI.U | www.mercerint.com MERCER 10
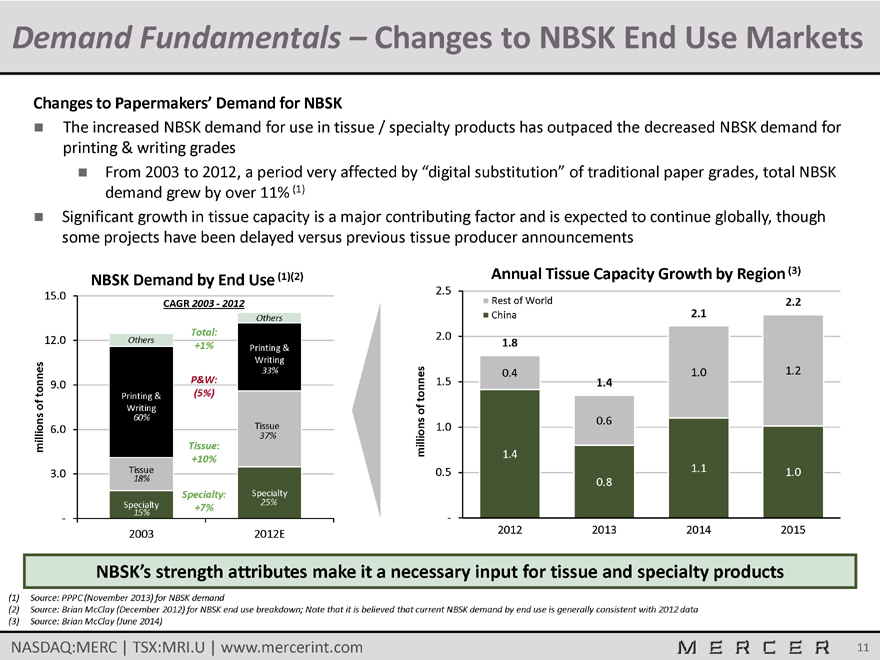
Demand Fundamentals – Changes to NBSK End Use Markets
Changes to Papermakers’ Demand for NBSK
The increased NBSK demand for use in tissue / specialty products has outpaced the decreased NBSK demand for printing & writing grades
From 2003 to 2012, a period very affected by “digital substitution” of traditional paper grades, total NBSK demand grew by over 11% (1)
Significant growth in tissue capacity is a major contributing factor and is expected to continue globally, though some projects have been delayed versus previous tissue producer announcements
NBSK Demand by End Use (1)(2)
15.0 12.0 9.0 6.0 3.0 -
CAGR 2003 - 2012
Others Printing & Writing 33% Tissue 37% Specialty 25%
Total: +1% P&W: (5%) Tissue: +10% Specialty: +7%
Others Printing & Writing 60% Tissue 18% Specialty 15%
millions of tonnes
2003 2012E
Annual Tissue Capacity Growth by Region (3)
2.5 2.0 1.5 1.0 0.5 -
Rest of World China
millions of tonnes
1.8 0.4 1.4
1.4 0.6 0.8
2.1 1.0 1.1
2.2 1.2 1.0
2012 2013 2014 2015
NBSK’s strength attributes make it a necessary input for tissue and specialty products
(1) Source: PPPC (November 2013) for NBSK demand
(2) Source: Brian McClay (December 2012) for NBSK end use breakdown; Note that it is believed that current NBSK demand by end use is generally consistent with 2012 data
(3) Source: Brian McClay (June 2014)
NASDAQ:MERC | TSX:MRI.U | www.mercerint.com MERCER 11
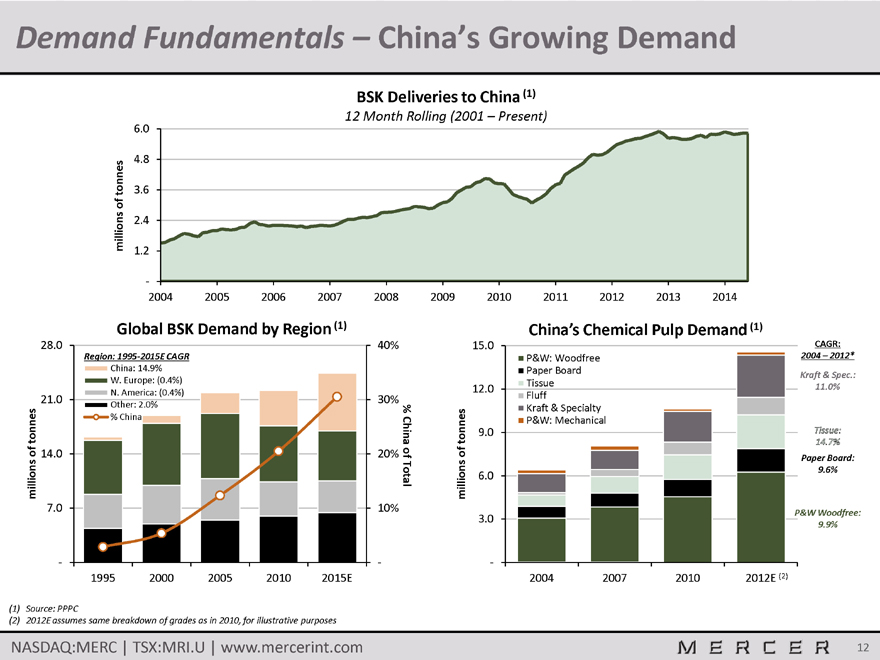
Demand Fundamentals – China’s Growing Demand
BSK Deliveries to China (1)
12 Month Rolling (2001 – Present)
millions of tonnes
6.0 4.8 3.6 2.4 1.2 -
2004 2005 2006 2007 2008 2009 2010 2011 2012 2013 2014
Global BSK Demand by Region (1)
28.0 40%
21.0 30%
14.0 20%
7.0 10%
- -
Region: 1995-2015E CAGR
China: 14.9%
W. Europe: (0.4%)
N. America: (0.4%)
Other: 2.0%
% China
% China of Total
millions of tonnes
1995 2000 2005 2010 2015E
(1) Source: PPPC
(2) 2012E assumes same breakdown of grades as in 2010, for illustrative purposes
China’s Chemical Pulp Demand (1)
15.0 12.0 9.0 6.0 3.0 - CAGR: 2004 – 2012* Kraft & Spec.: 11.0% Tissue: 14.7% Paper Board: 9.6% P&W Woodfree: 9.9%
P&W: Woodfree Paper Board Tissue Fluff Kraft & Specialty P&W: Mechanical
millions of tonnes
2004 2007 2010 2012E (2)
NASDAQ:MERC | TSX:MRI.U | www.mercerint.com MERCER 12
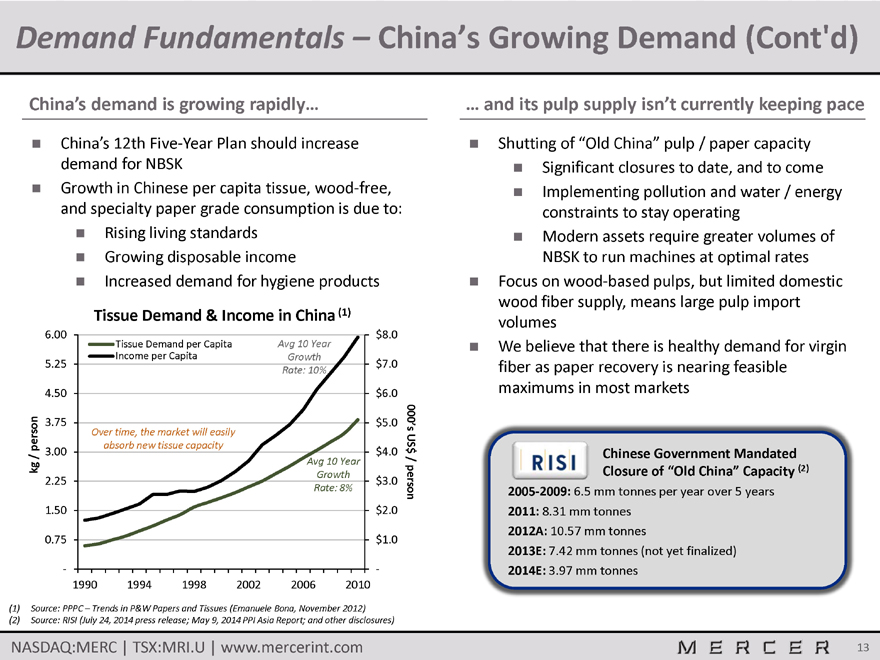
Demand Fundamentals – China’s Growing Demand (Cont’d)
China’s demand is growing rapidly…
China’s 12th Five-Year Plan should increase
demand for NBSK
Growth in Chinese per capita tissue, wood-free,
and specialty paper grade consumption is due to:
Rising living standards
Growing disposable income
Increased demand for hygiene products
Tissue Demand & Income in China (1)
6.00 $8.0
Tissue Demand per Capita Avg 10 Year
Income per Capita Growth
5.25 $7.0
Rate: 10%
4.50 $6.0
3.75 $5.0 000’s US$ / person
Over time, the market will easily
absorb new tissue capacity
3.00 $4.0
kg / person Avg 10 Year
Growth
2.25 $3.0
Rate: 8%
1.50 $2.0
0.75 $1.0
- -
1990 1994 1998 2002 2006 2010
(1) Source: PPPC – Trends in P&W Papers and Tissues (Emanuele Bona, November 2012)
(2) Source: RISI (July 24, 2014 press release; May 9, 2014 PPI Asia Report; and other disclosures)
… and its pulp supply isn’t currently keeping pace
Shutting of “Old China” pulp / paper capacity
Significant closures to date, and to come
Implementing pollution and water / energy
constraints to stay operating
Modern assets require greater volumes of
NBSK to run machines at optimal rates
Focus on wood-based pulps, but limited domestic
wood fiber supply, means large pulp import
volumes
We believe that there is healthy demand for virgin
fiber as paper recovery is nearing feasible
maximums in most markets RISI
Chinese Government Mandated
Closure of “Old China” Capacity (2)
2005-2009: 6.5 mm tonnes per year over 5 years
2011: 8.31 mm tonnes
2012A: 10.57 mm tonnes
2013E: 7.42 mm tonnes (not yet finalized)
2014E: 3.97 mm tonnes
NASDAQ:MERC | TSX:MRI.U | www.mercerint.com 13
MERCER
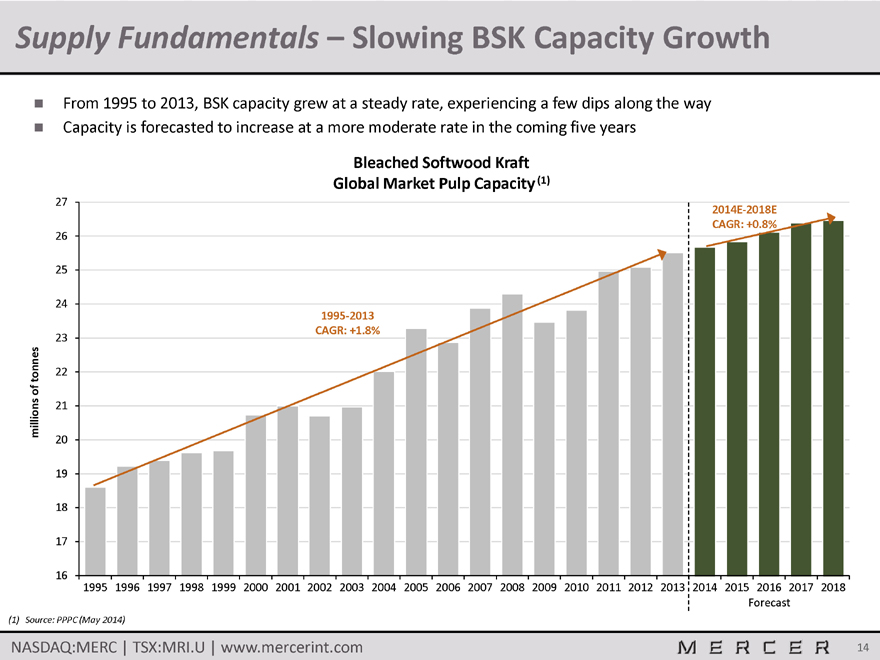
Supply Fundamentals – Slowing BSK Capacity Growth
From 1995 to 2013, BSK capacity grew at a steady rate, experiencing a few dips along the way
Capacity is forecasted to increase at a more moderate rate in the coming five years
Bleached Softwood Kraft
Global Market Pulp Capacity (1)
27
2014E-2018E
26 CAGR: +0.8%
25
24 1995-2013
CAGR: +1.8%
23 22
millions of tonnes
21
20
19
18
17
16 1995 1996 1997 1998 1999 2000 2001 2002 2003 2004 2005 2006 2007 2008 2009 2010 2011 2012 2013 2014 2015 2016 2017 2018
Forecast
(1) Source: PPPC (May 2014)
NASDAQ:MERC | TSX:MRI.U | www.mercerint.com 14
MERCER
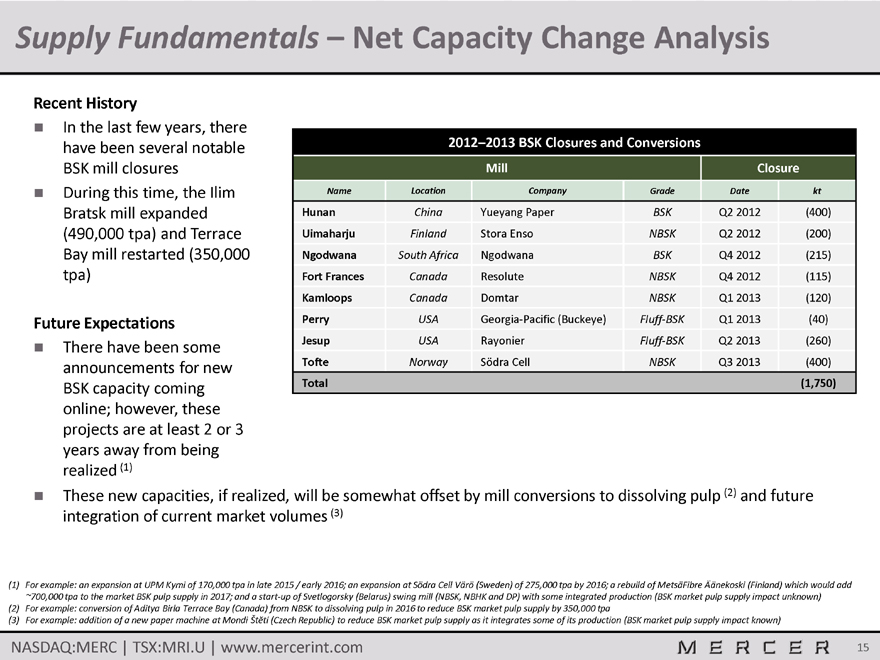
Supply Fundamentals – Net Capacity Change Analysis
Recent History
In the last few years, there
have been several notable
BSK mill closures
During this time, the Ilim
Bratsk mill expanded
(490,000 tpa) and Terrace
Bay mill restarted (350,000
tpa)
Future Expectations
There have been some
announcements for new
BSK capacity coming
online; however, these
projects are at least 2 or 3
years away from being
realized (1)
2012–2013 BSK Closures and Conversions
Mill Closure
Name Location Company Grade Date kt
Hunan China Yueyang Paper BSK Q2 2012 (400)
Uimaharju Finland Stora Enso NBSK Q2 2012 (200)
Ngodwana South Africa Ngodwana BSK Q4 2012 (215)
Fort Frances Canada Resolute NBSK Q4 2012 (115)
Kamloops Canada Domtar NBSK Q1 2013 (120)
Perry USA Georgia-Pacific (Buckeye) Fluff-BSK Q1 2013 (40)
Jesup USA Rayonier Fluff-BSK Q2 2013 (260)
Tofte Norway Södra Cell NBSK Q3 2013 (400)
Total (1,750)
These new capacities, if realized, will be somewhat offset by mill conversions to dissolving pulp (2) and future
integration of current market volumes (3)
(1) For example: an expansion at UPM Kymi of 170,000 tpa in late 2015 / early 2016; an expansion at Södra Cell Värö (Sweden) of 275,000 tpa by 2016; a rebuild of MetsäFibre Äänekoski (Finland) which would add
~700,000 tpa to the market BSK pulp supply in 2017; and a start-up of Svetlogorsky (Belarus) swing mill (NBSK, NBHK and DP) with some integrated production (BSK market pulp supply impact unknown)
(2) For example: conversion of Aditya Birla Terrace Bay (Canada) from NBSK to dissolving pulp in 2016 to reduce BSK market pulp supply by 350,000 tpa
(3) For example: addition of a new paper machine at Mondi Štĕtí (Czech Republic) to reduce BSK market pulp supply as it integrates some of its production (BSK market pulp supply impact known)
NASDAQ:MERC | TSX:MRI.U | www.mercerint.com 15
MERCER
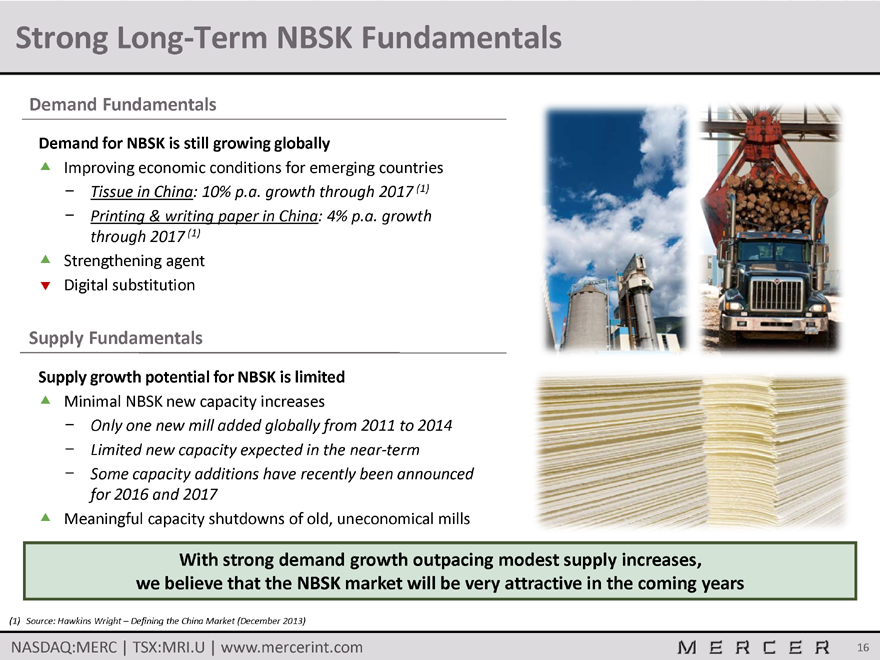
Strong Long-Term NBSK Fundamentals
Demand Fundamentals
Demand for NBSK is still growing globally
Improving economic conditions for emerging countries
- Tissue in China: 10% p.a. growth through 2017 (1)
- Printing & writing paper in China: 4% p.a. growth
through 2017 (1)
Strengthening agent
Digital substitution
Supply Fundamentals
Supply growth potential for NBSK is limited
Minimal NBSK new capacity increases
- Only one new mill added globally from 2011 to 2014
- Limited new capacity expected in the near-term
- Some capacity additions have recently been announced
for 2016 and 2017
Meaningful capacity shutdowns of old, uneconomical mills
With strong demand growth outpacing modest supply increases,
we believe that the NBSK market will be very attractive in the coming years
(1) Source: Hawkins Wright – Defining the China Market (December 2013)
NASDAQ:MERC | TSX:MRI.U | www.mercerint.com 16
MERCER
Financial Performance and Recent Developments
NASDAQ:MERC | TSX:MRI.U | www.mercerint.com 17
MERCER
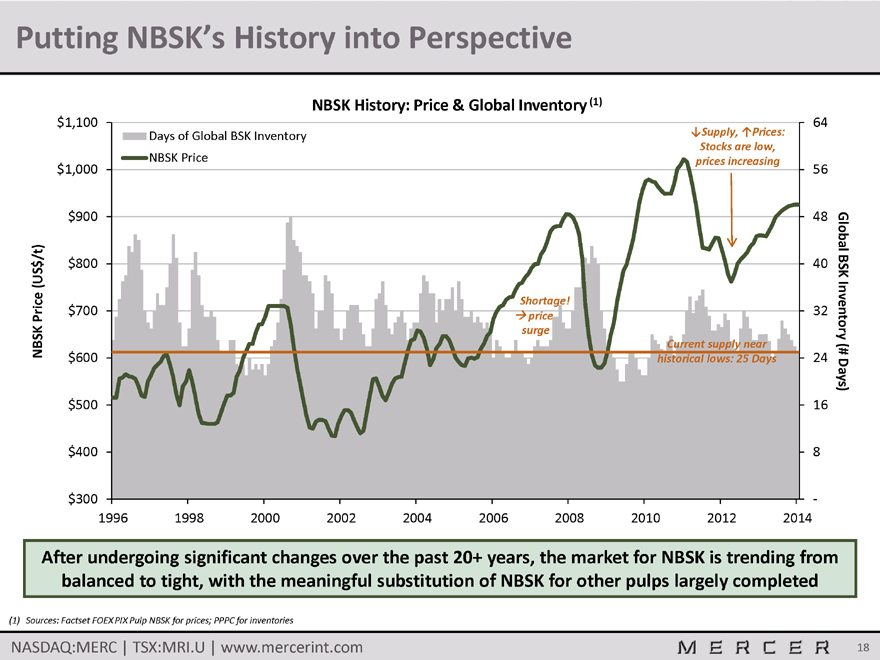
Putting NBSK’s History into Perspective
NBSK History: Price & Global Inventory (1)
Days of Global BSK Inventory
NBSK Price
Supply, Prices: Stocks are low, prices increasing
NBSK Price (US$/t)
$1,100 64
$1,000 56
$900 48
$800 40
$700 32
$600 24
$500 16
$400 8
$300 -
Global BSK Inventory (# Days)
Shortage! price surge
Current supply near historical lows: 25 Days
1996 1998 2000 2002 2004 2006 2008 2010 2012 2014
After undergoing significant changes over the past 20+ years, the market for NBSK is trending from balanced to tight, with the meaningful substitution of NBSK for other pulps largely completed
(1) Sources: Factset FOEX PIX Pulp NBSK for prices; PPPC for inventories
NASDAQ:MERC | TSX:MRI.U | www.mercerint.com MERCER 18
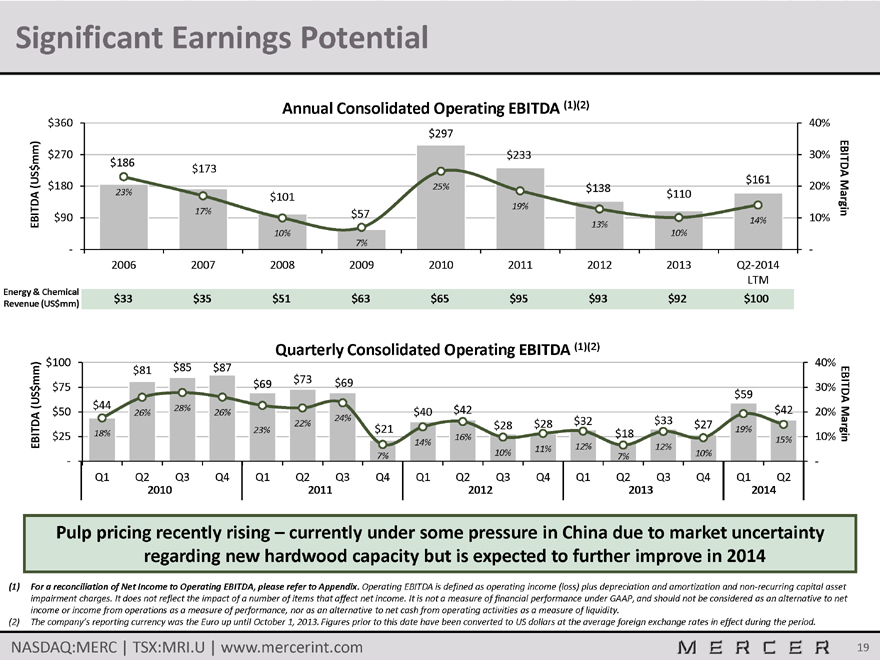
Significant Earnings Potential
Annual Consolidated Operating EBITDA (1)(2)
EBITDA (US$mm)
$360 $270 $180 $90 -
EBITDA Margin
40%30% 20% 10% -
$186 $173 $101 $57 $297 $233 $138 $110 $161
23% 17% 10% 7% 25% 19% 13% 10% 14%
2006 2007 2008 2009 2010 2011 2012 2013 Q2-2014 LTM
Energy & Chemical Revenue (US$mm) $33 $35 $51 $63 $65 $95 $93 $92 $100
Quarterly Consolidated Operating EBITDA (1)(2)
EBITDA (US$mm)
$100 $75 $50 $25 -
EBITDA Margin
40% 30% 20% 10% -
$44 $81 $85 $87 $69 $73 $69 $21 $40 $42 $28 $28 $32 $18 $33 $27 $59 $42
18% 26% 28% 26% 23% 22% 24% 7% 14% 16% 10% 11% 12% 7% 12% 10% 19% 15%
Q1 Q2 Q3 Q4 Q1 Q2 Q3 Q4 Q1 Q2 Q3 Q4 Q1 Q2 Q3 Q4 Q1 Q2
2010 2011 2012 2013 2014
Pulp pricing recently rising – currently under some pressure in China due to market uncertainty regarding new hardwood capacity but is expected to further improve in 2014
(1) For a reconciliation of Net Income to Operating EBITDA, please refer to Appendix. Operating EBITDA is defined as operating income (loss) plus depreciation and amortization and non-recurring capital asset
impairment charges. It does not reflect the impact of a number of items that affect net income. It is not a measure of financial performance under GAAP, and should not be considered as an alternative to net
income or income from operations as a measure of performance, nor as an alternative to net cash from operating activities as a measure of liquidity.
(2) The company’s reporting currency was the Euro up until October 1, 2013. Figures prior to this date have been converted to US dollars at the average foreign exchange rates in effect during the period.
NASDAQ:MERC | TSX:MRI.U | www.mercerint.com MERCER 19
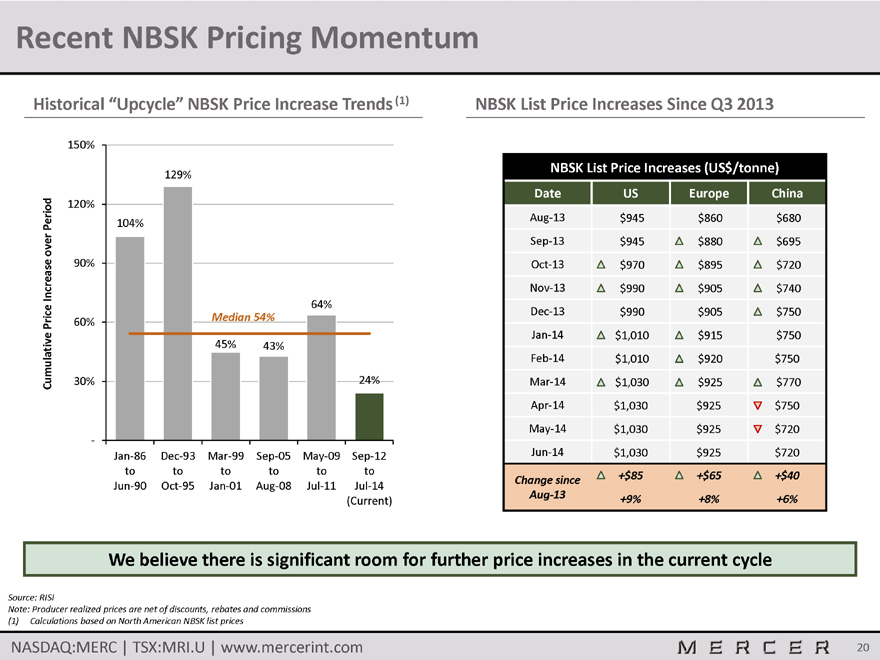
Recent NBSK Pricing Momentum
Historical “Upcycle” NBSK Price Increase Trends (1)
150%
129%
120%
104%
90%
64%
Price 60% Median 54%
45% 43%
Cumulative Price Increase over Period
30% 24%
-
Jan-86 Dec-93 Mar-99 Sep-05 May-09 Sep-12
to to to to to to
Jun-90 Oct-95 Jan-01 Aug-08 Jul-11 Jul-14
(Current)
NBSK List Price Increases Since Q3 2013
NBSK List Price Increases (US$/tonne)
Date US Europe China
Aug-13 $945 $860 $680
Sep-13 $945 $880 $695
Oct-13 $970 $895 $720
Nov-13 $990 $905 $740
Dec-13 $990 $905 $750
Jan-14 $1,010 $915 $750
Feb-14 $1,010 $920 $750
Mar-14 $1,030 $925 $770
Apr-14 $1,030 $925 $750
May-14 $1,030 $925 $720
Jun-14 $1,030 $925 $720
+$85 +$65 +$40
Change since
Aug-13 +9% +8% +6%
We believe there is significant room for further price increases in the current cycle
Source: RISI
Note: Producer realized prices are net of discounts, rebates and commissions
(1) Calculations based on North American NBSK list prices
NASDAQ:MERC | TSX:MRI.U | www.mercerint.com 20
MERCER
Mercer’s Recent Developments
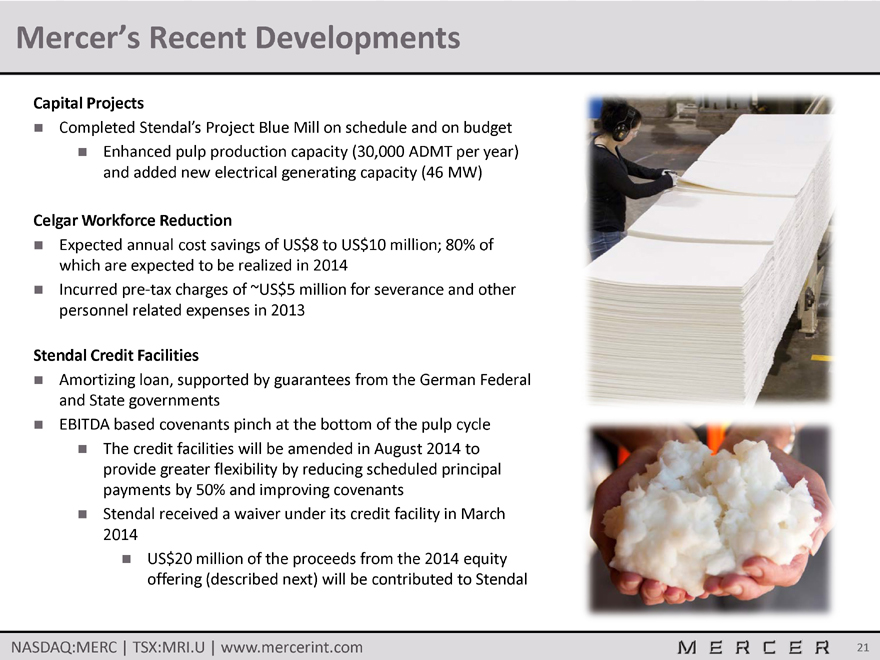
Capital Projects
Completed Stendal’s Project Blue Mill on schedule and on budget
Enhanced pulp production capacity (30,000 ADMT per year) and added new electrical generating capacity (46 MW)
Celgar Workforce Reduction
Expected annual cost savings of US$8 to US$10 million; 80% of which are expected to be realized in 2014
Incurred pre-tax charges of ~US$5 million for severance and other personnel related expenses in 2013
Stendal Credit Facilities
Amortizing loan, supported by guarantees from the German Federal and State governments
EBITDA based covenants pinch at the bottom of the pulp cycle
The credit facilities will be amended in August 2014 to provide greater flexibility by reducing scheduled principal payments by 50% and improving covenants
Stendal received a waiver under its credit facility in March
2014
US$20 million of the proceeds from the 2014 equity offering (described next) will be contributed to Stendal
NASDAQ:MERC | TSX:MRI.U | www.mercerint.com 21
MERCER
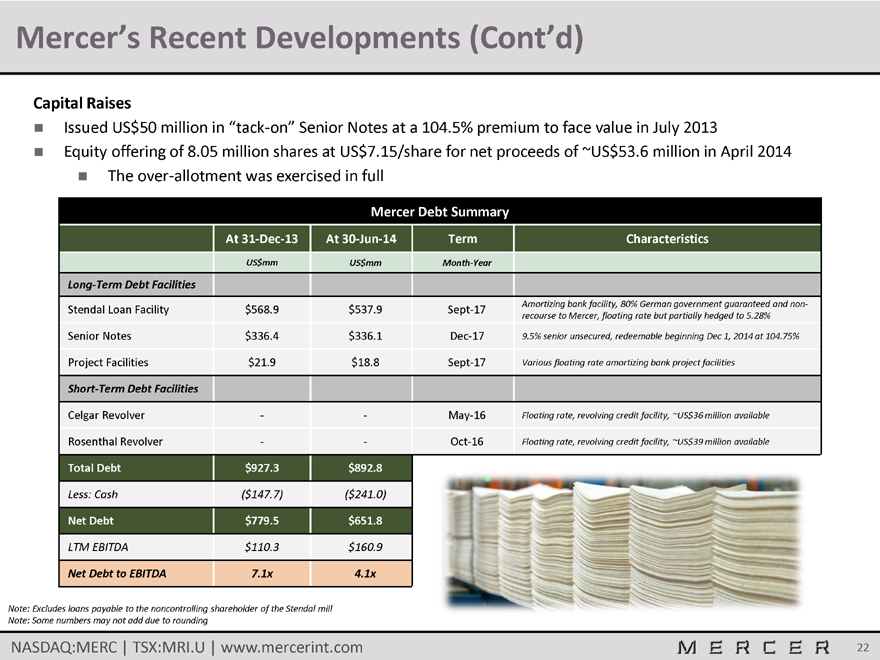
Mercer’s Recent Developments (Cont’d)
Capital Raises
Issued US$50 million in “tack-on” Senior Notes at a 104.5% premium to face value in July 2013
Equity offering of 8.05 million shares at US$7.15/share for net proceeds of ~US$53.6 million in April 2014
The over-allotment was exercised in full
Mercer Debt Summary
At 31-Dec-13 At 30-Jun-14 Term Characteristics
US$mm US$mm Month-Year
Long-Term Debt Facilities
Stendal Loan Facility $568.9 $537.9 Sept-17 Amortizing bank facility, 80% German government guaranteed and non-recourse to Mercer, floating rate but partially hedged to 5.28%
Senior Notes $336.4 $336.1 Dec-17 9.5% senior unsecured, redeemable beginning Dec 1, 2014 at 104.75%
Project Facilities $21.9 $18.8 Sept-17 Various floating rate amortizing bank project facilities
Short-Term Debt Facilities
Celgar Revolver - - May-16 Floating rate, revolving credit facility, ~US$36 million available
Rosenthal Revolver - - Oct-16 Floating rate, revolving credit facility, ~US$39 million available
Total Debt $927.3 $892.8
Less: Cash ($147.7) ($241.0)
Net Debt $779.5 $651.8
LTM EBITDA $110.3 $160.9
Net Debt to EBITDA 7.1x 4.1x
Note: Excludes loans payable to the noncontrolling shareholder of the Stendal mill
Note: Some numbers may not add due to rounding
NASDAQ:MERC | TSX:MRI.U | www.mercerint.com 22
MERCER
Mercer’s Recent Developments (Cont’d)
Performance BioFilaments
In June 2014, Mercer and Resolute Forest Products launched a new
50/50 joint venture company called Performance BioFilaments
The joint venture is set to commercialize novel product applications for cellulose filaments, an innovative biomaterial derived from wood fiber
Annual Maintenance Shuts
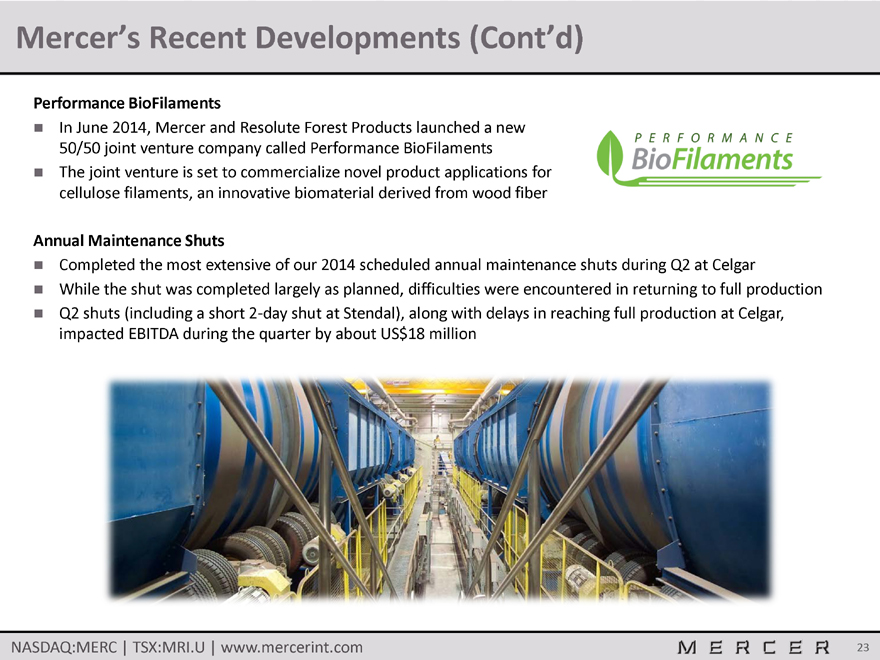
Completed the most extensive of our 2014 scheduled annual maintenance shuts during Q2 at Celgar
While the shut was completed largely as planned, difficulties were encountered in returning to full production
Q2 shuts (including a short 2-day shut at Stendal), along with delays in reaching full production at Celgar, impacted EBITDA during the quarter by about US$18 million
NASDAQ:MERC | TSX:MRI.U | www.mercerint.com 23
MERCER
Mercer – Summary
The largest “pure-play” NBSK market pulp producer
Globally cost competitive, modern mill operations
Strategically located mills with excellent access to key markets
Stable and growing revenue from high-margin energy & bio-chemical by-product sales
Strong long-term NBSK fundamentals
Significant leverage to the NBSK pulp cycle
Experienced management team
NASDAQ:MERC | TSX:MRI.U | www.mercerint.com 24
MERCER
Appendix A
Additional Information on Mercer International Inc.
NASDAQ:MERC | TSX:MRI.U | www.mercerint.com 25
MERCER
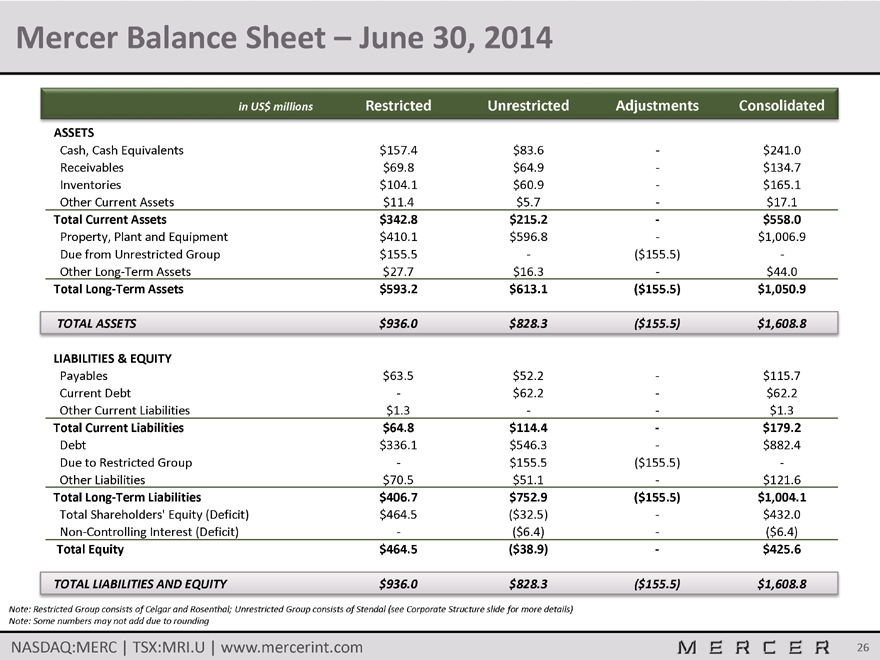
Mercer Balance Sheet – June 30, 2014
in US$ millions Restricted Unrestricted Adjustments Consolidated
ASSETS
Cash, Cash Equivalents $157.4 $83.6 - $241.0
Receivables $69.8 $64.9 - $134.7
Inventories $104.1 $60.9 - $165.1
Other Current Assets $11.4 $5.7 - $17.1
Total Current Assets $342.8 $215.2 - $558.0
Property, Plant and Equipment $410.1 $596.8 - $1,006.9
Due from Unrestricted Group $155.5 - ($155.5) -
Other Long-Term Assets $27.7 $16.3 - $44.0
Total Long-Term Assets $593.2 $613.1 ($155.5) $1,050.9
TOTAL ASSETS $936.0 $828.3 ($155.5) $1,608.8
LIABILITIES & EQUITY
Payables $63.5 $52.2 - $115.7
Current Debt - $62.2 - $62.2
Other Current Liabilities $1.3 - $1.3
Total Current Liabilities $64.8 $114.4 - $179.2
Debt $336.1 $546.3 - $882.4
Due to Restricted Group - $155.5 ($155.5)-
Other Liabilities $70.5 $51.1 - $121.6
Total Long-Term Liabilities $406.7 $752.9 ($155.5) $1,004.1
Total Shareholders’ Equity (Deficit) $464.5 ($32.5) - $432.0
Non-Controlling Interest (Deficit) - ($6.4) - ($6.4)
Total Equity $464.5 ($38.9) - $425.6
TOTAL LIABILITIES AND EQUITY $936.0 $828.3 ($155.5) $1,608.8
Note: Restricted Group consists of Celgar and Rosenthal; Unrestricted Group consists of Stendal (see Corporate Structure slide for more details)
Note: Some numbers may not add due to rounding
NASDAQ:MERC | TSX:MRI.U | www.mercerint.com 26
MERCER
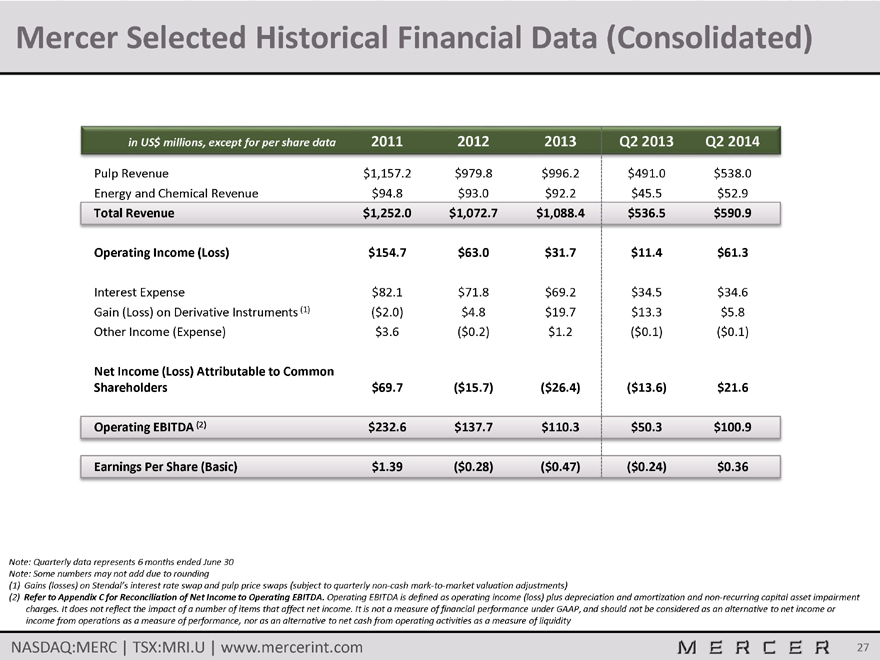
Mercer Selected Historical Financial Data (Consolidated)
in US$ millions, except for per share data 2011 2012 2013 Q2 2013 Q2 2014
Pulp Revenue $1,157.2 $979.8 $996.2 $491.0 $538.0
Energy and Chemical Revenue $94.8 $93.0 $92.2 $45.5 $52.9
Total Revenue $1,252.0 $1,072.7 $1,088.4 $536.5 $590.9
Operating Income (Loss) $154.7 $63.0 $31.7 $11.4 $61.3
Interest Expense $82.1 $71.8 $69.2 $34.5 $34.6
Gain (Loss) on Derivative Instruments (1) ($2.0) $4.8 $19.7 $13.3 $5.8
Other Income (Expense) $3.6 ($0.2) $1.2 ($0.1) ($0.1)
Net Income (Loss) Attributable to Common
Shareholders $69.7 ($15.7) ($26.4) ($13.6) $21.6
Operating EBITDA (2) $232.6 $137.7 $110.3 $50.3 $100.9
Earnings Per Share (Basic) $1.39 ($0.28) ($0.47) ($0.24) $0.36
Note: Quarterly data represents 6 months ended June 30
Note: Some numbers may not add due to rounding
(1) Gains (losses) on Stendal’s interest rate swap and pulp price swaps (subject to quarterly non-cash mark-to-market valuation adjustments)
(2) Refer to Appendix C for Reconciliation of Net Income to Operating EBITDA. Operating EBITDA is defined as operating income (loss) plus depreciation and amortization and non-recurring capital asset impairment charges. It does not reflect the impact of a number of items that affect net income. It is not a measure of financial performance under GAAP, and should not be considered as an alternative to net income or income from operations as a measure of performance, nor as an alternative to net cash from operating activities as a measure of liquidity
NASDAQ:MERC | TSX:MRI.U | www.mercerint.com MERCER 27
Appendix B
Detailed Overview of Operations
NASDAQ:MERC | TSX:MRI.U | www.mercerint.com MERCER 28
Rosenthal Mill
Mercer International Group: Restricted Group
Location: Blankenstein, Germany (~300 km south of Berlin)
Pulp Production Capacity: 360,000 ADMT per year
Electricity Generating Capacity: 57 MW
Certification: ISO 9001, 14001, and 50001
2013 Green Electricity Sales: US$21.5 million
Key Features:
Built in 1999 – modern and efficient
Strategically located in central Europe
Close proximity to stable fiber supply and nearby sawmills
Allows customers to operate using just in time inventory process, lowering their costs and making Rosenthal a preferred supplier
In 2013, the mill sold nearly 180,000 MWh of green electricity
One of the largest biomass power plants in Germany
Regularly setting new pulp and energy production records
NASDAQ:MERC | TSX:MRI.U | www.mercerint.com MERCER 29
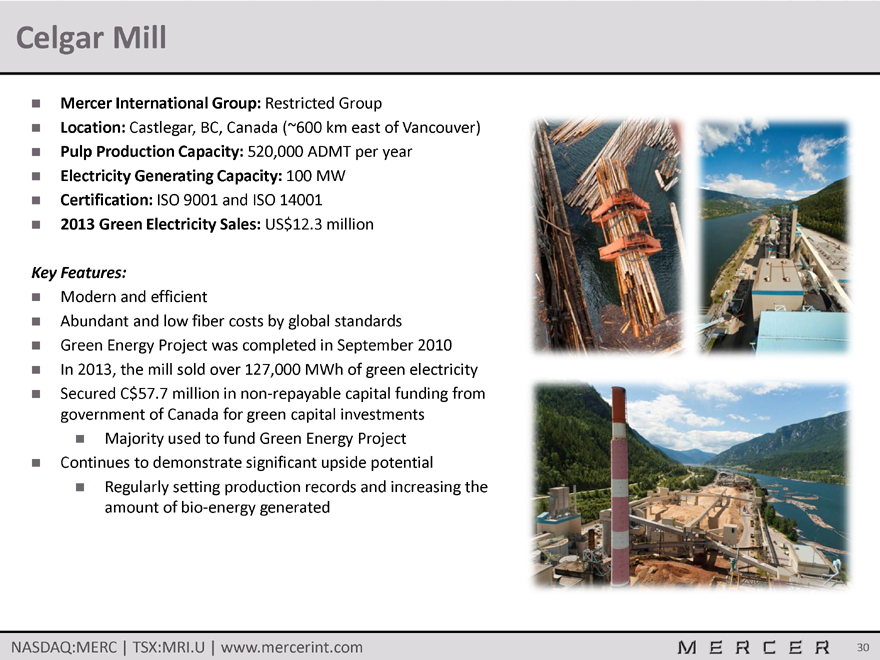
Celgar Mill
Mercer International Group: Restricted Group
Location: Castlegar, BC, Canada (~600 km east of Vancouver)
Pulp Production Capacity: 520,000 ADMT per year
Electricity Generating Capacity: 100 MW
Certification: ISO 9001 and ISO 14001
2013 Green Electricity Sales: US$12.3 million
Key Features:
Modern and efficient
Abundant and low fiber costs by global standards
Green Energy Project was completed in September 2010
In 2013, the mill sold over 127,000 MWh of green electricity
Secured C$57.7 million in non-repayable capital funding from government of Canada for green capital investments
Majority used to fund Green Energy Project
Continues to demonstrate significant upside potential
Regularly setting production records and increasing the amount of bio-energy generated
NASDAQ:MERC | TSX:MRI.U | www.mercerint.com MERCER 30
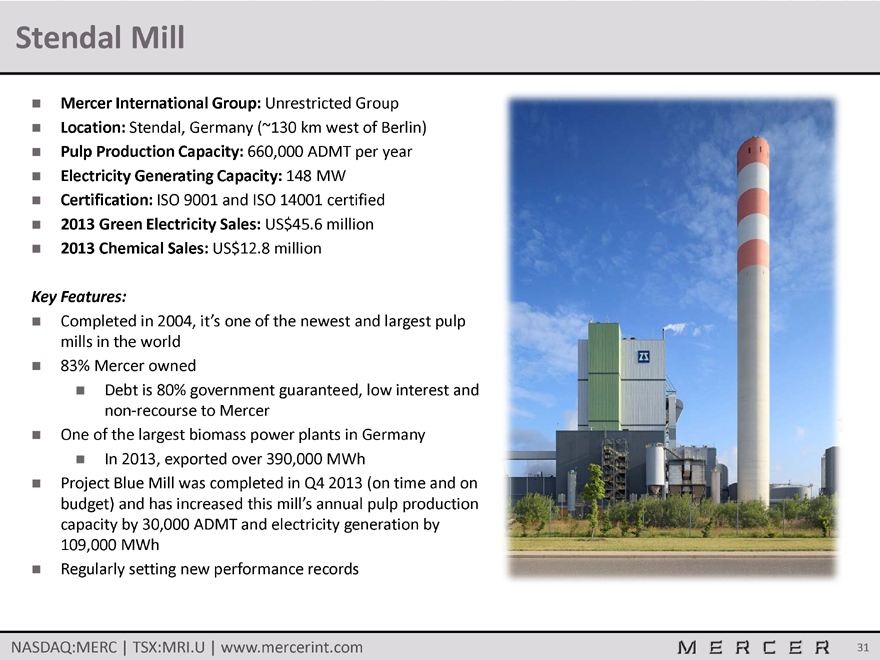
Stendal Mill
Mercer International Group: Unrestricted Group
Location: Stendal, Germany (~130 km west of Berlin)
Pulp Production Capacity: 660,000 ADMT per year
Electricity Generating Capacity: 148 MW
Certification: ISO 9001 and ISO 14001 certified
2013 Green Electricity Sales: US$45.6 million
2013 Chemical Sales: US$12.8 million
Key Features:
Completed in 2004, it’s one of the newest and largest pulp mills in the world
83% Mercer owned
Debt is 80% government guaranteed, low interest and non-recourse to Mercer
One of the largest biomass power plants in Germany
In 2013, exported over 390,000 MWh
Project Blue Mill was completed in Q4 2013 (on time and on budget) and has increased this mill’s annual pulp production capacity by 30,000 ADMT and electricity generation by 109,000 MWh
Regularly setting new performance records
NASDAQ:MERC | TSX:MRI.U | www.mercerint.com MERCER 31

Appendix C
Reconciliation of Net Income to Operating EBITDA
NASDAQ:MERC | TSX:MRI.U | www.mercerint.com MERCER 32
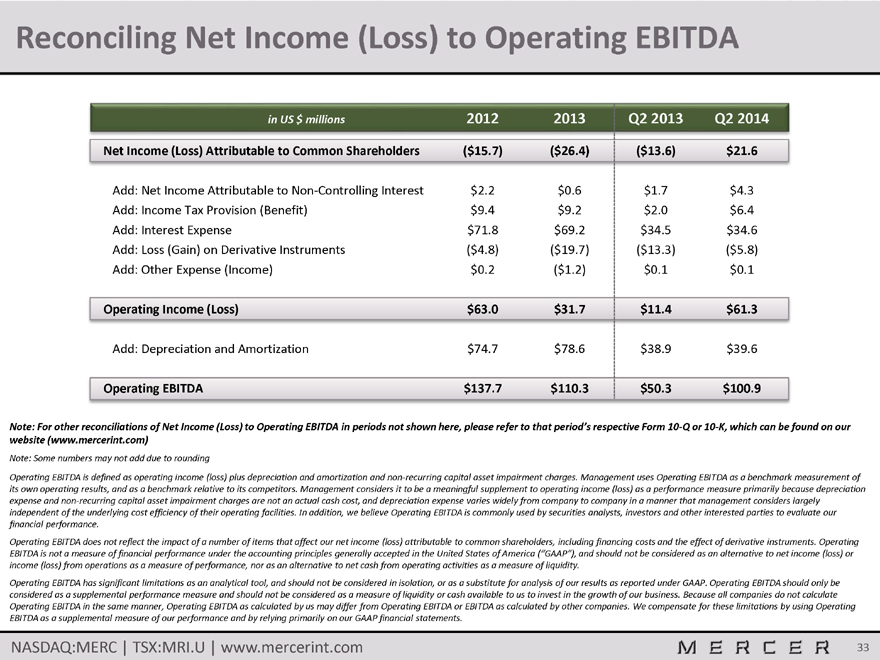
Reconciling Net Income (Loss) to Operating EBITDA
in US $ millions 2012 2013 Q2 2013 Q2 2014
Net Income (Loss) Attributable to Common Shareholders ($15.7) ($26.4) ($13.6) $21.6
Add: Net Income Attributable to Non-Controlling Interest $2.2 $0.6 $1.7 $4.3
Add: Income Tax Provision (Benefit) $9.4 $9.2 $2.0 $6.4
Add: Interest Expense $71.8 $69.2 $34.5 $34.6
Add: Loss (Gain) on Derivative Instruments ($4.8) ($19.7) ($13.3) ($5.8)
Add: Other Expense (Income) $0.2 ($1.2) $0.1 $0.1
Operating Income (Loss) $63.0 $31.7 $11.4 $61.3
Add: Depreciation and Amortization $74.7 $78.6 $38.9 $39.6
Operating EBITDA $137.7 $110.3 $50.3 $100.9
Note: For other reconciliations of Net Income (Loss) to Operating EBITDA in periods not shown here, please refer to that period’s respective Form 10-Q or 10-K, which can be found on our website (www.mercerint.com)
Note: Some numbers may not add due to rounding
Operating EBITDA is defined as operating income (loss) plus depreciation and amortization and non-recurring capital asset impairment charges. Management uses Operating EBITDA as a benchmark measurement of its own operating results, and as a benchmark relative to its competitors. Management considers it to be a meaningful supplement to operating income (loss) as a performance measure primarily because depreciation expense and non-recurring capital asset impairment charges are not an actual cash cost, and depreciation expense varies widely from company to company in a manner that management considers largely independent of the underlying cost efficiency of their operating facilities. In addition, we believe Operating EBITDA is commonly used by securities analysts, investors and other interested parties to evaluate our financial performance.
Operating EBITDA does not reflect the impact of a number of items that affect our net income (loss) attributable to common shareholders, including financing costs and the effect of derivative instruments. Operating
EBITDA is not a measure of financial performance under the accounting principles generally accepted in the United States of America (“GAAP”), and should not be considered as an alternative to net income (loss) or income (loss) from operations as a measure of performance, nor as an alternative to net cash from operating activities as a measure of liquidity.
Operating EBITDA has significant limitations as an analytical tool, and should not be considered in isolation, or as a substitute for analysis of our results as reported under GAAP. Operating EBITDA should only be considered as a supplemental performance measure and should not be considered as a measure of liquidity or cash available to us to invest in the growth of our business. Because all companies do not calculate
Operating EBITDA in the same manner, Operating EBITDA as calculated by us may differ from Operating EBITDA or EBITDA as calculated by other companies. We compensate for these limitations by using Operating EBITDA as a supplemental measure of our performance and by relying primarily on our GAAP financial statements.
NASDAQ:MERC | TSX:MRI.U | www.mercerint.com MERCER 33