Attached files
| file | filename |
|---|---|
| 8-K - FORM 8-K 8/11/2014 - KITE REALTY GROUP TRUST | form8k_08122014.htm |
Investor Presentation August 2014
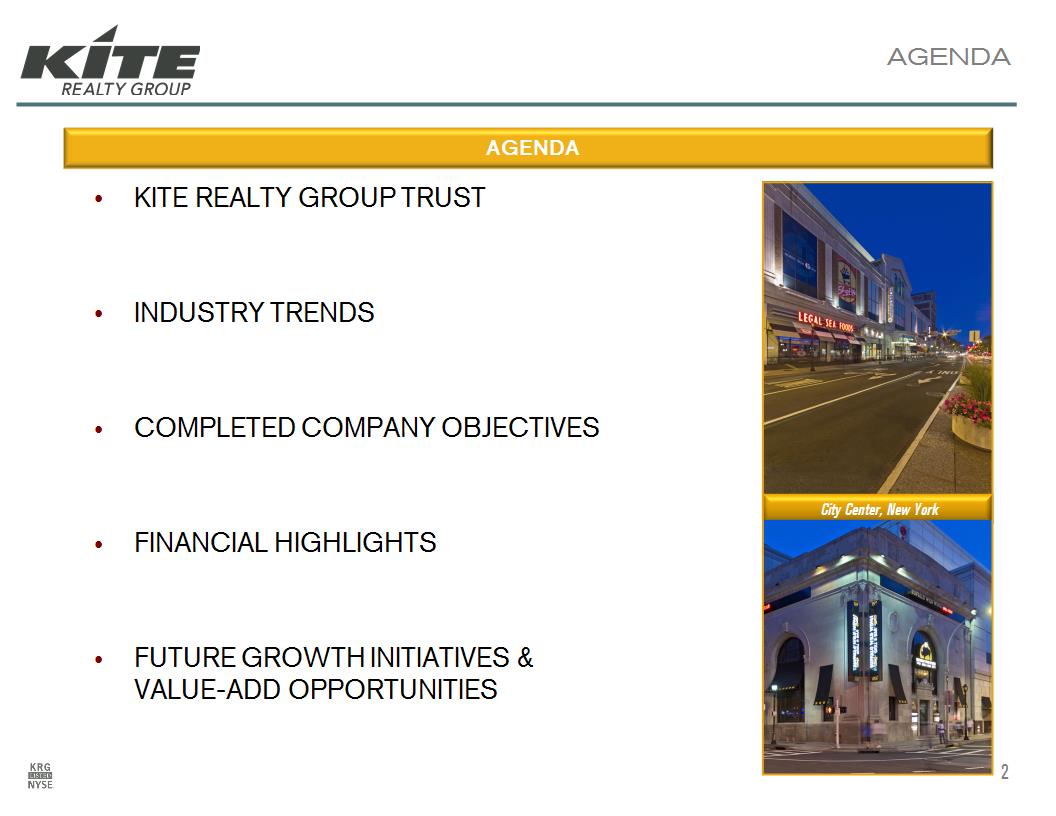
AGENDA KITE REALTY GROUP TRUST INDUSTRY TRENDS COMPLETED COMPANY OBJECTIVES FINANCIAL HIGHLIGHTS FUTURE GROWTH INITIATIVES & VALUE-ADD OPPORTUNITIES * AGENDA City Center, New York

KITE REALTY GROUP TRUST

* KITE REALTY GROUP TRUST TICKER SYMBOL :: KRG (NYSE since 2004) FOUNDED :: 1971 HEADQUARTERS :: Indianapolis, Indiana PORTFOLIO :: (1) 124 OPERATING RETAIL 2 OPERATING OFFICE 4 REDEVELOPMENT 3 DEVELOPMENT 133 PROPERTIES SQUARE FOOTAGE :: (1) (MILLIONS) 19.6 OPERATING PROPERTIES 1.0 TOTAL REDEVELOPMENT/DEVELOPMENT 20.6 GLA/NRA ANNUAL DIVIDEND :: $1.04 (2) 2013 TOTAL RETURN :: 22.3% (3) KITE REALTY GROUP TRUST is a full-service, vertically-integrated real estate company engaged primarily in the ownership, operation, development, construction, and acquisition of high-quality neighborhood and community shopping centers in selected growth markets in the United States. These figures include the merger with Inland Diversified which closed on July 1, 2014. Annual amount adjusted for 1 for 4 reverse share split; reflects the most recently paid quarterly dividend. Per SNL. *
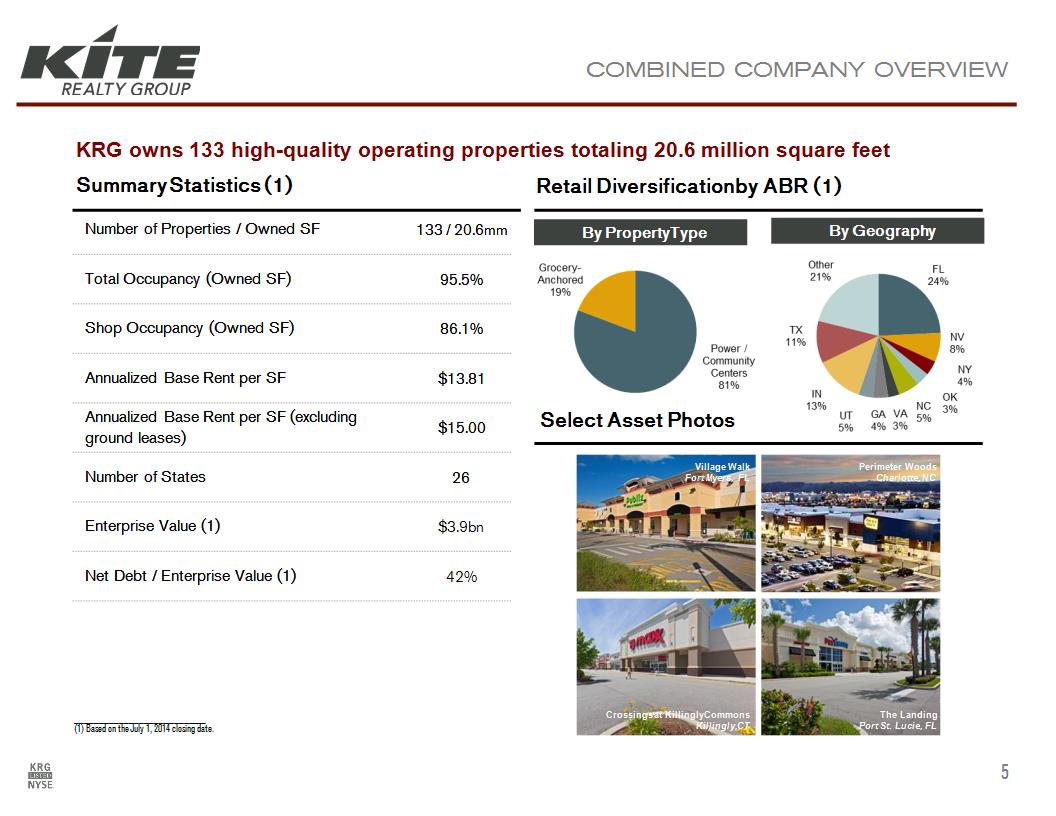
Number of Properties / Owned SF 133 / 20.6mm Total Occupancy (Owned SF) 95.5% Shop Occupancy (Owned SF) 86.1% Annualized Base Rent per SF $13.81 Annualized Base Rent per SF (excluding ground leases) $15.00 Number of States 26 Enterprise Value (1) $3.9bn Net Debt / Enterprise Value (1) 42% Retail Diversification by ABR (1) KRG owns 133 high-quality operating properties totaling 20.6 million square feet Select Asset Photos Summary Statistics (1) COMBINED COMPANY OVERVIEW ___________________________ (1) Based on the July 1, 2014 closing date. By Property Type By Geography Village Walk Fort Myers, FL Perimeter Woods Charlotte, NC The Landing Port St. Lucie, FL Crossings at Killingly Commons Killingly, CT *
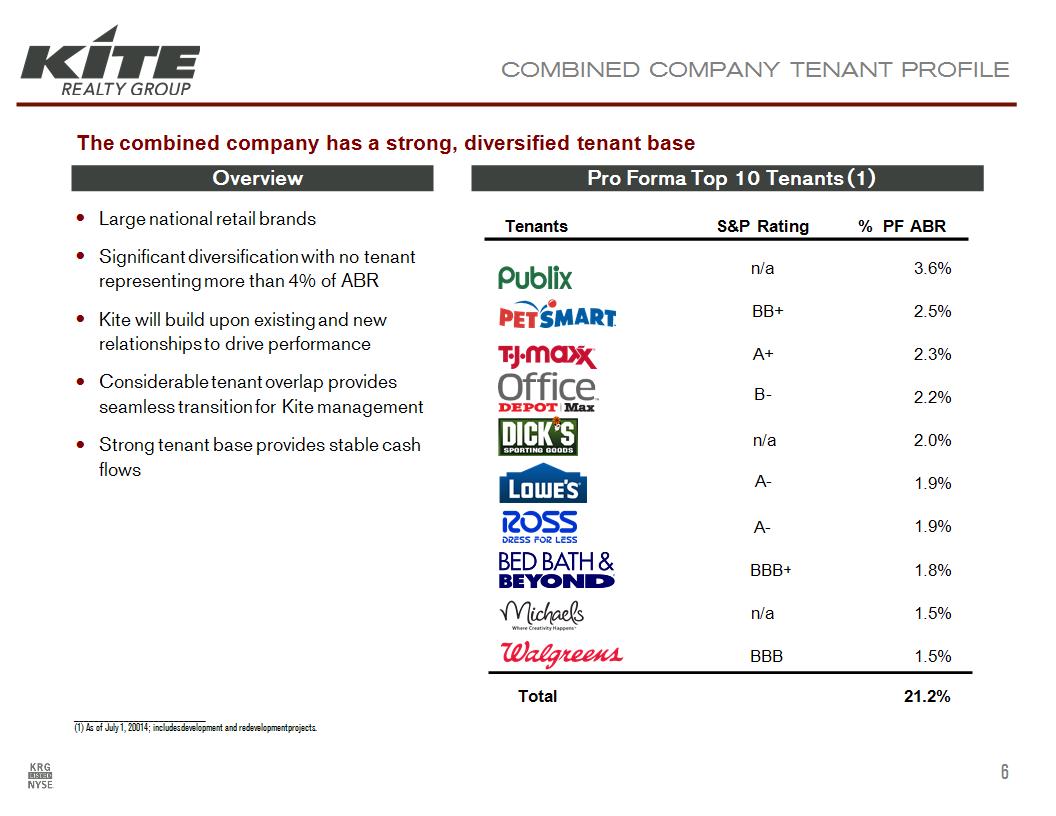
Pro Forma Top 10 Tenants (1) COMBINED COMPANY TENANT PROFILE Overview Large national retail brands Significant diversification with no tenant representing more than 4% of ABR Kite will build upon existing and new relationships to drive performance Considerable tenant overlap provides seamless transition for Kite management Strong tenant base provides stable cash flows The combined company has a strong, diversified tenant base ___________________________ (1) As of July 1, 20014; includes development and redevelopment projects. Tenants S&P Rating % PF ABR n/a x x 3.6% BB+ x x 2.5% A+ x x 2.3% B- x x 2.2% x x 2.0% A- x x 1.9% A- x x 1.9% BBB+ x x 1.8% n/a x x 1.5% BBB x 1.5% Total 21.2% n/a *
INDUSTRY TRENDS

10-Year / 20-Year Average GDP Growth: 1.76% / 2.57% 10-Year / 20-Year Average CPI Growth: 2.39% / 2.43% DEFENSIBILITY IN RISING RATE ENVIRONMENT Economic growth drives NOI while monetary policy and U.S. Treasury yields have historically shown little effect on capitalization rates REITs yielded positive returns in six out of eight “rising rate” environments since 1976 (1) Average return during these periods for the REIT sector was 12.2% (1) GDP, credit spreads to U.S. corporate bonds, and job growth tend to be more impactful to REIT performance than changing interest rates Source: MPS Loria Financial Planners, LLC. GDP Rates from The World Bank; CPI Rates through Bureau of Labor Statistics. Source: Ned Davis Research, Inc. and Green Street Advisors. * +1.75% +2.25% +2.75% NOI $1,000,000 $1,017,500 $1,022,500 $1,027,500 Cap Rate 6.25% 6.36% 6.39% 6.42% Price $16,000,000 $16,000,000 $16,000,000 $16,000,000 Growth Expectations Drive Increasing NOI… U.S. Cap Rates Not Linked to Risk-Free Rates (3) U.S. Cap Rates Not Linked to Risk-Free Rates (3) U.S. Cap Rates Not Linked to Risk-Free Rates (3) U.S. Cap Rates Not Linked to Risk-Free Rates (3) U.S. Cap Rates Not Linked to Risk-Free Rates (3) U.S. Cap Rates Not Linked to Risk-Free Rates (3) U.S. Cap Rates Not Linked to Risk-Free Rates (3) Cumulative Changes (bps) Cumulative Changes (bps) Periods of Fed Fund Rate Hikes Periods of Fed Fund Rate Hikes Periods of Fed Fund Rate Hikes Periods of Fed Fund Rate Hikes Periods of Fed Fund Rate Hikes Fed Funds Rate Capitalization Rate 09/04/87-02/29/89 09/04/87-02/29/89 09/04/87-02/29/89 09/04/87-02/29/89 214 -20 02/04/94-02/01/95 02/04/94-02/01/95 02/04/94-02/01/95 02/04/94-02/01/95 267 -10 06/30/99-05/16/00 06/30/99-05/16/00 06/30/99-05/16/00 06/30/99-05/16/00 128 0 06/30/04-06/30/06 06/30/04-06/30/06 06/30/04-06/30/06 06/30/04-06/30/06 373 -140 Cumulative Changes (bps) Cumulative Changes (bps) Periods of Rising U.S. Treasury Yields Periods of Rising U.S. Treasury Yields Periods of Rising U.S. Treasury Yields Periods of Rising U.S. Treasury Yields Periods of Rising U.S. Treasury Yields 10-Yr. Treasury Yield Capitalization Rate 08/29/86-10/16/87 08/29/86-10/16/87 08/29/86-10/16/87 08/29/86-10/16/87 193 0 10/15/93-11/07/94 10/15/93-11/07/94 10/15/93-11/07/94 10/15/93-11/07/94 248 -40 10/05/98-01/20/00 10/05/98-01/20/00 10/05/98-01/20/00 10/05/98-01/20/00 204 -10 06/13/03-06/12/07 06/13/03-06/12/07 06/13/03-06/12/07 06/13/03-06/12/07 149 -260 07/25/12-06/30/14 07/25/12-06/30/14 07/25/12-06/30/14 07/25/12-06/30/14 110 -60 …But Monetary Policy Shows No Link To Cap Rates

COMPLETED COMPANY OBJECTIVES & FINANCIAL HIGHLIGHTS

KITE REALTY GROUP * KEY MILESTONES Successfully completed merger with Inland Diversified on July 1st, 2014. KRG now has 133 properties across 26 states totaling 20.6 million square feet Acquired nine-property portfolio in November 2013 – 38% of ABR in Houston, Texas FURTHER ENHANCE BALANCE SHEET FLEXIBILITY Increased liquidity, lowered borrowing costs and de-levered the balance sheet Increased borrowing capacity on the Revolver from $200 million to $500 million Reduced rate on the Revolver by 25-50 bps and the Term Loan rate by 10-55 bps across the leverage grid Pro forma Net Debt to Adjusted EBITDA expected to improve from the current 7.2x to 6.5x with closing of merger DEVELOPMENT AND REDEVELOPMENT PROGRESS Complete development and redevelopment opportunities within our existing portfolio, totaling $183 million and 77% pre-leased, as well as execute on opportunities from acquired assets PARKSIDE TOWN COMMONS: Raleigh MSA, North Carolina. Anchored by Target, Harris Teeter, Petco, Frank Theatre, Field & Stream and Golf Galaxy. Opened Phase I in 2nd quarter; Phase II is scheduled to partially open in 3rd quarter HOLLY SPRINGS TOWNE CENTER (Phase II): Raleigh MSA, North Carolina. Construction is underway with a projected opening in the 3rd quarter of 2015 BOLTON PLAZA: Jacksonville, Florida. Projected to be substantially completed in September of 2014. Anchored by Academy Sports & LA Fitness GAINESVILLE PLAZA: Gainesville, Florida. Project is underway and will be anchored by Burlington Coat Factory and Ross Dress for Less. Projected opening in late 2014 CONSISTENT OPERATING PERFORMANCE (1) Same-store NOI (“SSNOI”) growth of 4.4% for quarter ended June 30, 2014 6th consecutive quarter of SSNOI growth above 4% Averaging 16% blended leasing spreads in 2013 and 2014 Portfolio is 95.2% leased; has never been less than 90% leased since IPO in 2004 Small shop leased percentage increased to 85.5%, up from 84.5% at June 30, 2013 * (1) KRG portfolio as of June 30, 2014. COMPANY HIGHLILGHTS
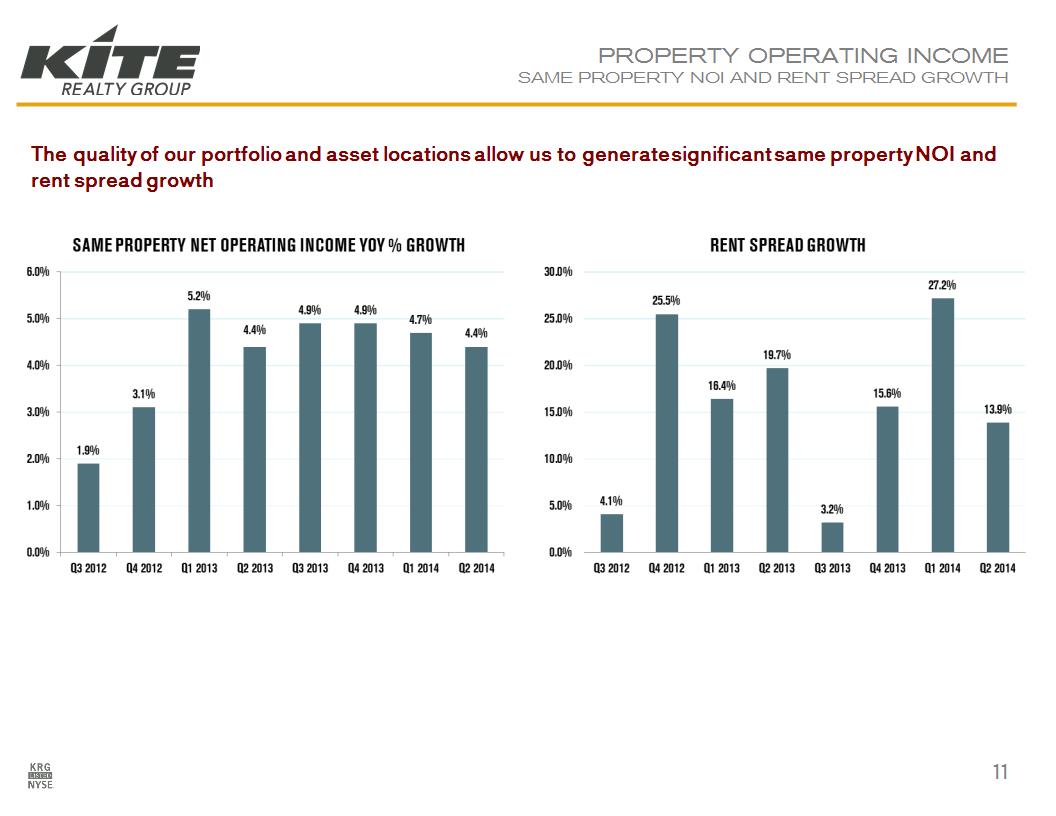
PROPERTY OPERATING INCOME SAME PROPERTY NOI AND RENT SPREAD GROWTH The quality of our portfolio and asset locations allow us to generate significant same property NOI and rent spread growth *

MERGER TRANSACTION WITH INLAND DIVERSIFIED REAL ESTATE TRUST
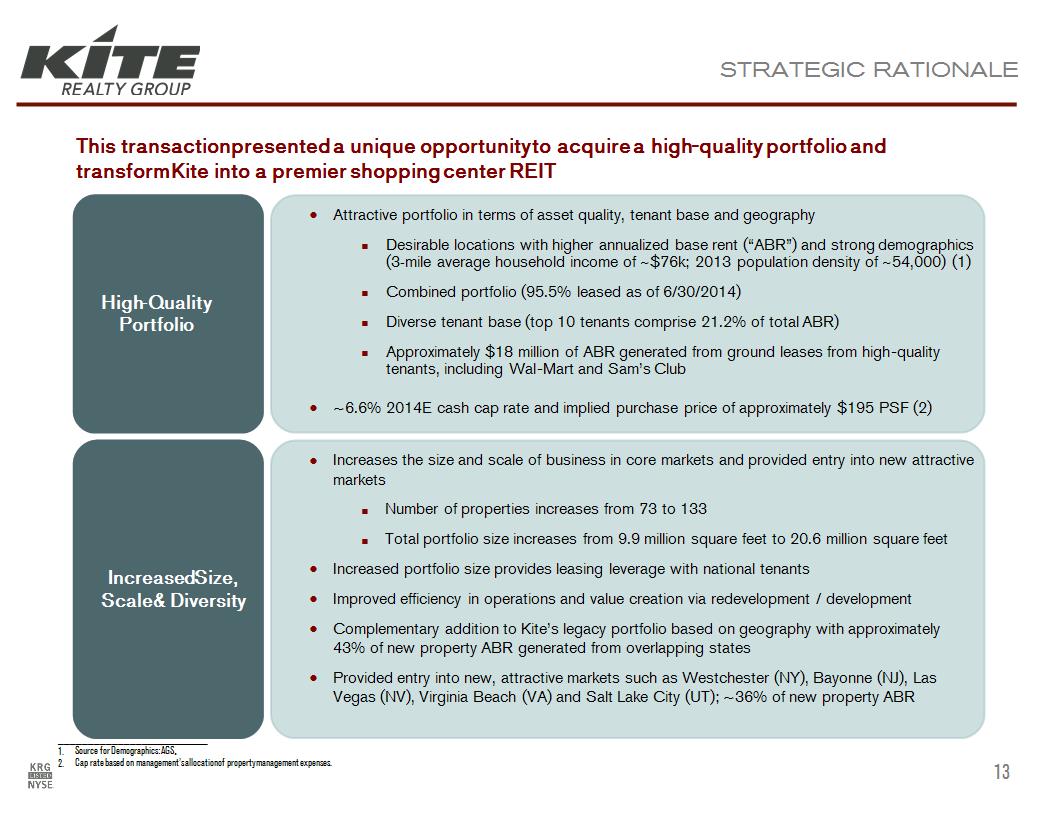
Attractive portfolio in terms of asset quality, tenant base and geography Desirable locations with higher annualized base rent (“ABR”) and strong demographics (3-mile average household income of ~$76k; 2013 population density of ~54,000) (1) Combined portfolio (95.5% leased as of 6/30/2014) Diverse tenant base (top 10 tenants comprise 21.2% of total ABR) Approximately $18 million of ABR generated from ground leases from high-quality tenants, including Wal-Mart and Sam’s Club ~6.6% 2014E cash cap rate and implied purchase price of approximately $195 PSF (2) High-Quality Portfolio Increases the size and scale of business in core markets and provided entry into new attractive markets Number of properties increases from 73 to 133 Total portfolio size increases from 9.9 million square feet to 20.6 million square feet Increased portfolio size provides leasing leverage with national tenants Improved efficiency in operations and value creation via redevelopment / development Complementary addition to Kite’s legacy portfolio based on geography with approximately 43% of new property ABR generated from overlapping states Provided entry into new, attractive markets such as Westchester (NY), Bayonne (NJ), Las Vegas (NV), Virginia Beach (VA) and Salt Lake City (UT); ~36% of new property ABR Increased Size, Scale & Diversity STRATEGIC RATIONALE This transaction presented a unique opportunity to acquire a high-quality portfolio and transform Kite into a premier shopping center REIT ___________________________ Source for Demographics: AGS. Cap rate based on management’s allocation of property management expenses. *
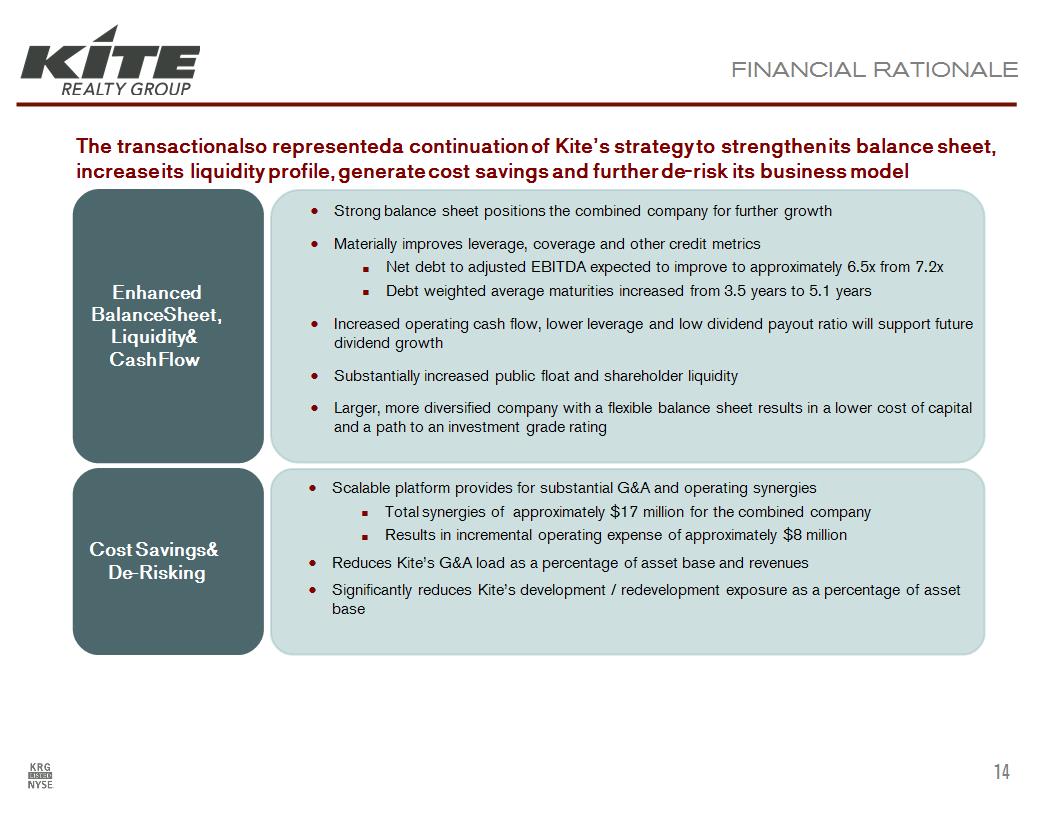
Scalable platform provides for substantial G&A and operating synergies Total synergies of approximately $17 million for the combined company Results in incremental operating expense of approximately $8 million Reduces Kite’s G&A load as a percentage of asset base and revenues Significantly reduces Kite’s development / redevelopment exposure as a percentage of asset base Cost Savings & De-Risking Strong balance sheet positions the combined company for further growth Materially improves leverage, coverage and other credit metrics Net debt to adjusted EBITDA expected to improve to approximately 6.5x from 7.2x Debt weighted average maturities increased from 3.5 years to 5.1 years Increased operating cash flow, lower leverage and low dividend payout ratio will support future dividend growth Substantially increased public float and shareholder liquidity Larger, more diversified company with a flexible balance sheet results in a lower cost of capital and a path to an investment grade rating Enhanced Balance Sheet, Liquidity & Cash Flow FINANCIAL RATIONALE The transaction also represented a continuation of Kite’s strategy to strengthen its balance sheet, increase its liquidity profile, generate cost savings and further de-risk its business model *
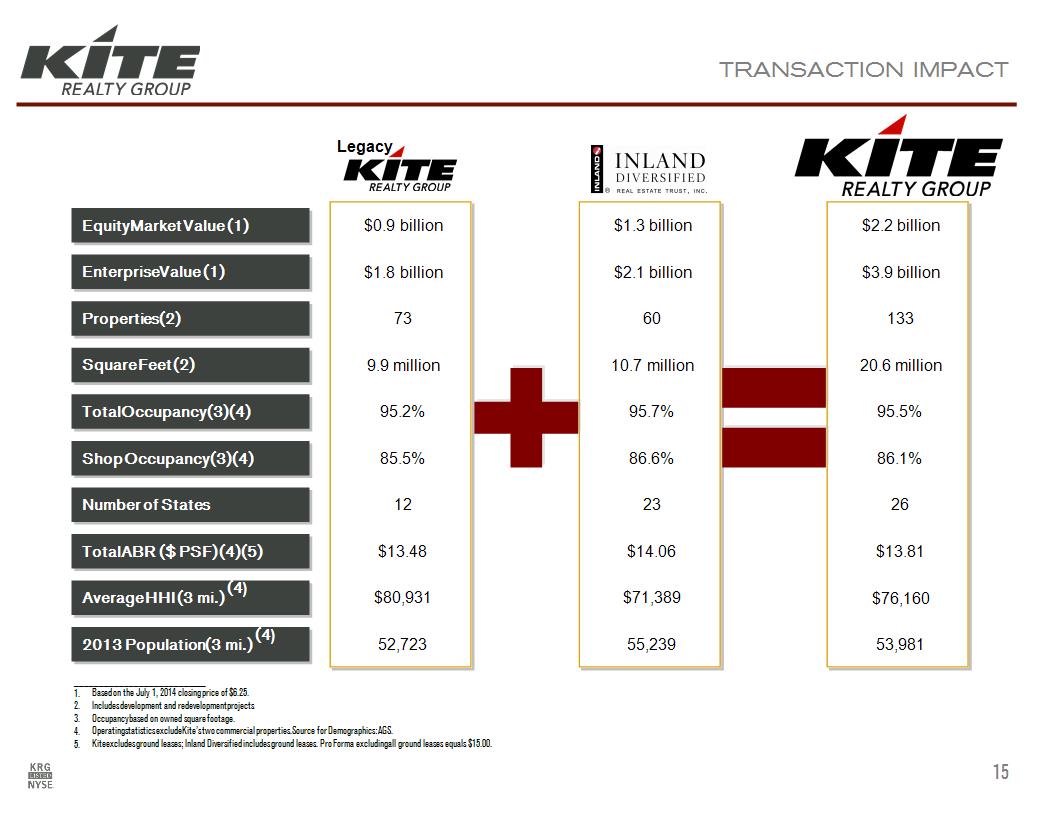
60 133 Properties (2) Square Feet (2) Total Occupancy (3)(4) Number of States Total ABR ($ PSF) (4)(5) Average HHI (3 mi.) (4) 73 9.9 million 95.2% $13.48 $80,931 10.7 million 95.7% 23 $14.06 $71,389 20.6 million 95.5% 26 $13.81 $76,160 Legacy Equity Market Value (1) $0.9 billion $1.3 billion $2.2 billion TRANSACTION IMPACT 12 2013 Population (3 mi.) (4) 52,723 55,239 53,981 ___________________________ Based on the July 1, 2014 closing price of $6.25. Includes development and redevelopment projects Occupancy based on owned square footage. Operating statistics exclude Kite’s two commercial properties. Source for Demographics: AGS. Kite excludes ground leases; Inland Diversified includes ground leases. Pro Forma excluding all ground leases equals $15.00. Enterprise Value (1) $1.8 billion $2.1 billion $3.9 billion Shop Occupancy (3)(4) 85.5% 86.6% 86.1% *
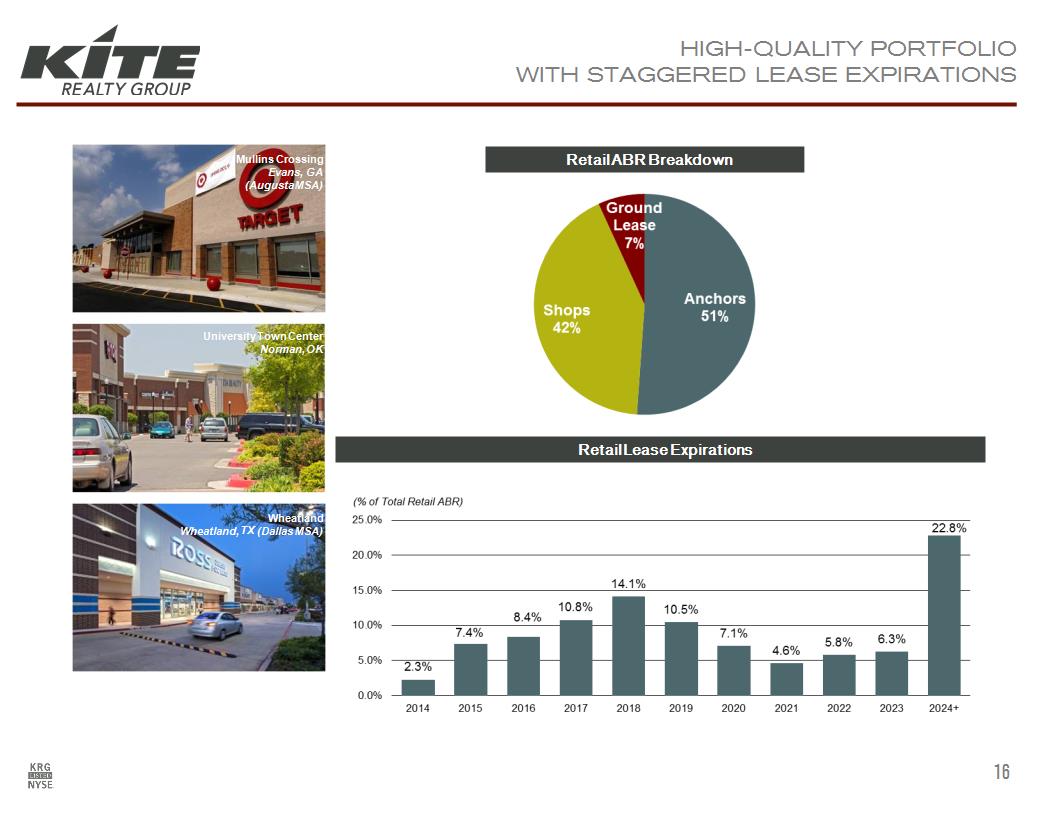
HIGH-QUALITY PORTFOLIO WITH STAGGERED LEASE EXPIRATIONS Retail ABR Breakdown Retail Lease Expirations Wheatland Wheatland, TX (Dallas MSA) Mullins Crossing Evans, GA (Augusta MSA) University Town Center Norman, OK *

STRONG OPERATING METRICS Portfolio Occupancy (1) Total ABR ($ PSF) (1)(2) 2013 Population (000s) (1)(3) ___________________________ Includes development and redevelopment projects. Pro Forma at $13.81 includes Ground Leases for Kite and excludes for Inland Diversified. Pro Forma Excluding Ground Leases excludes from both Kite and Inland Diversified. Source for Demographics: AGS. High occupancy, improved annualized base rent and attractive demographics will continue to drive operating results *
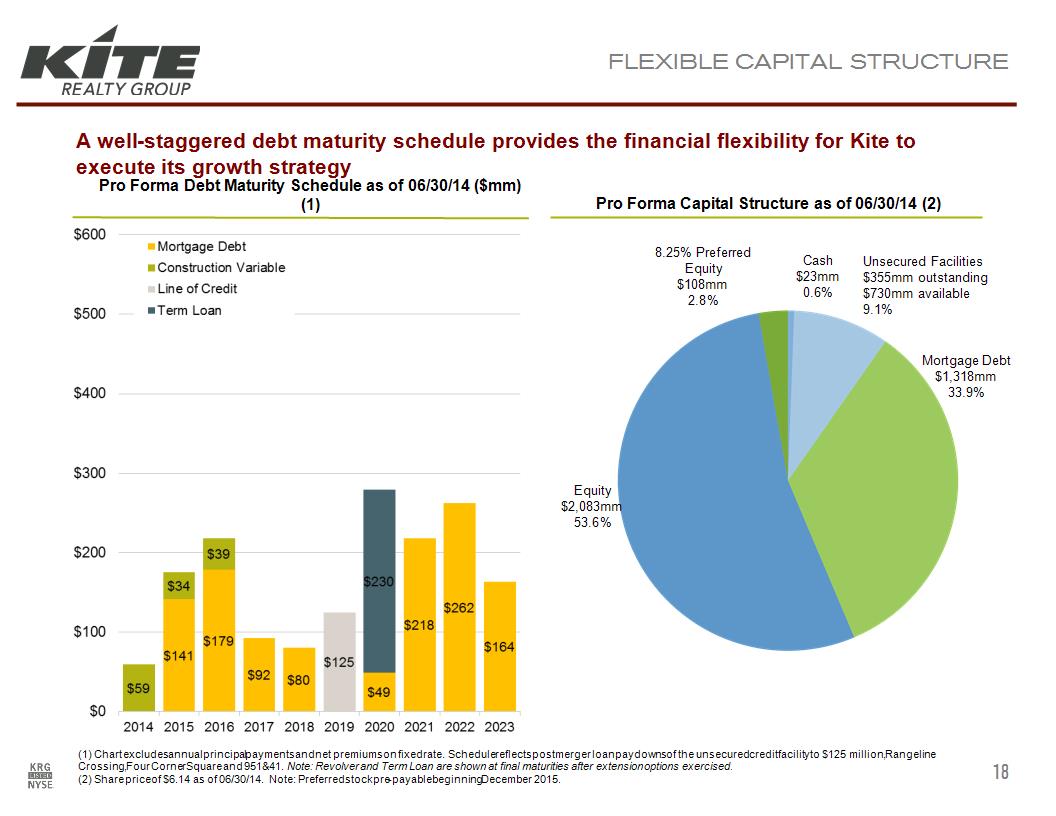
FLEXIBLE CAPITAL STRUCTURE A well-staggered debt maturity schedule provides the financial flexibility for Kite to execute its growth strategy Pro Forma Capital Structure as of 06/30/14 (2) Pro Forma Debt Maturity Schedule as of 06/30/14 ($mm) (1) Cash $23mm 0.6% Unsecured Facilities $355mm outstanding $730mm available 9.1% Mortgage Debt $1,318mm 33.9% Equity $2,083mm 53.6% 8.25% Preferred Equity $108mm 2.8% * (1) Chart excludes annual principal payments and net premiums on fixed rate. Schedule reflects post merger loan paydowns of the unsecured credit facility to $125 million, Rangeline Crossing, Four Corner Square and 951&41. Note: Revolver and Term Loan are shown at final maturities after extension options exercised. (2) Share price of $6.14 as of 06/30/14. Note: Preferred stock pre-payable beginning December 2015.
FUTURE GROWTH INITIATIVES & VALUE-ADD OPPORTUNITIES
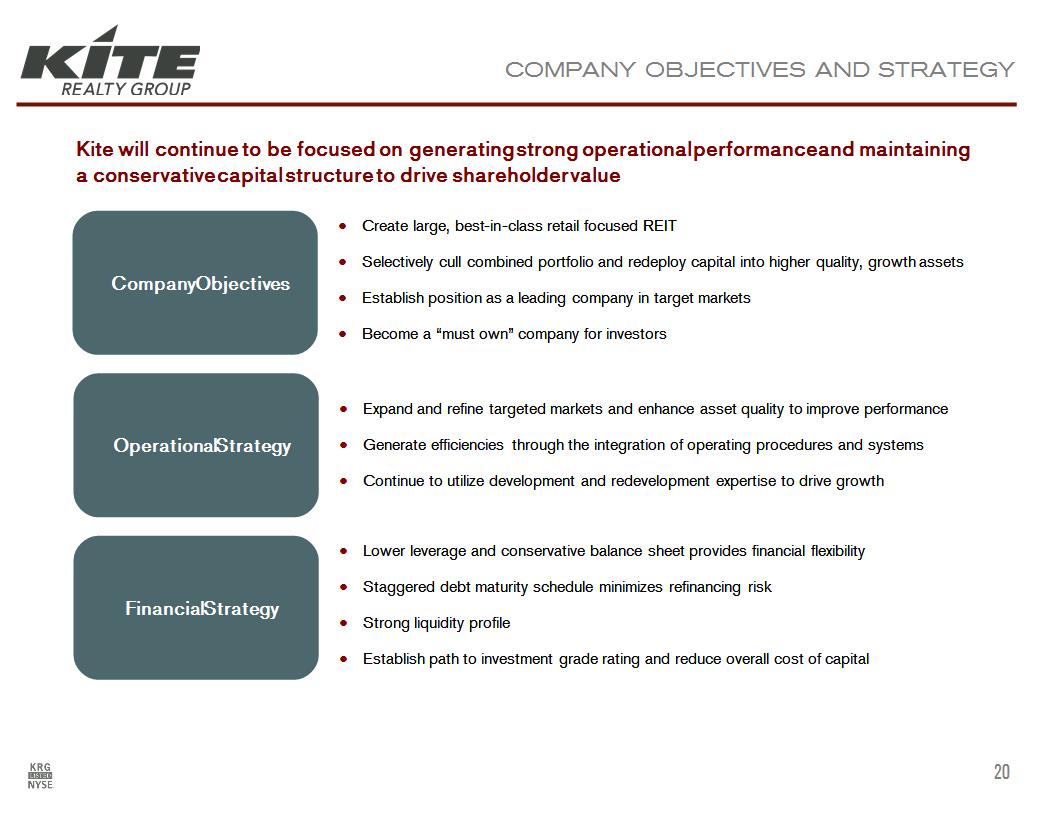
COMPANY OBJECTIVES AND STRATEGY Company Objectives Lower leverage and conservative balance sheet provides financial flexibility Staggered debt maturity schedule minimizes refinancing risk Strong liquidity profile Establish path to investment grade rating and reduce overall cost of capital Create large, best-in-class retail focused REIT Selectively cull combined portfolio and redeploy capital into higher quality, growth assets Establish position as a leading company in target markets Become a “must own” company for investors Expand and refine targeted markets and enhance asset quality to improve performance Generate efficiencies through the integration of operating procedures and systems Continue to utilize development and redevelopment expertise to drive growth Kite will continue to be focused on generating strong operational performance and maintaining a conservative capital structure to drive shareholder value Operational Strategy Financial Strategy *
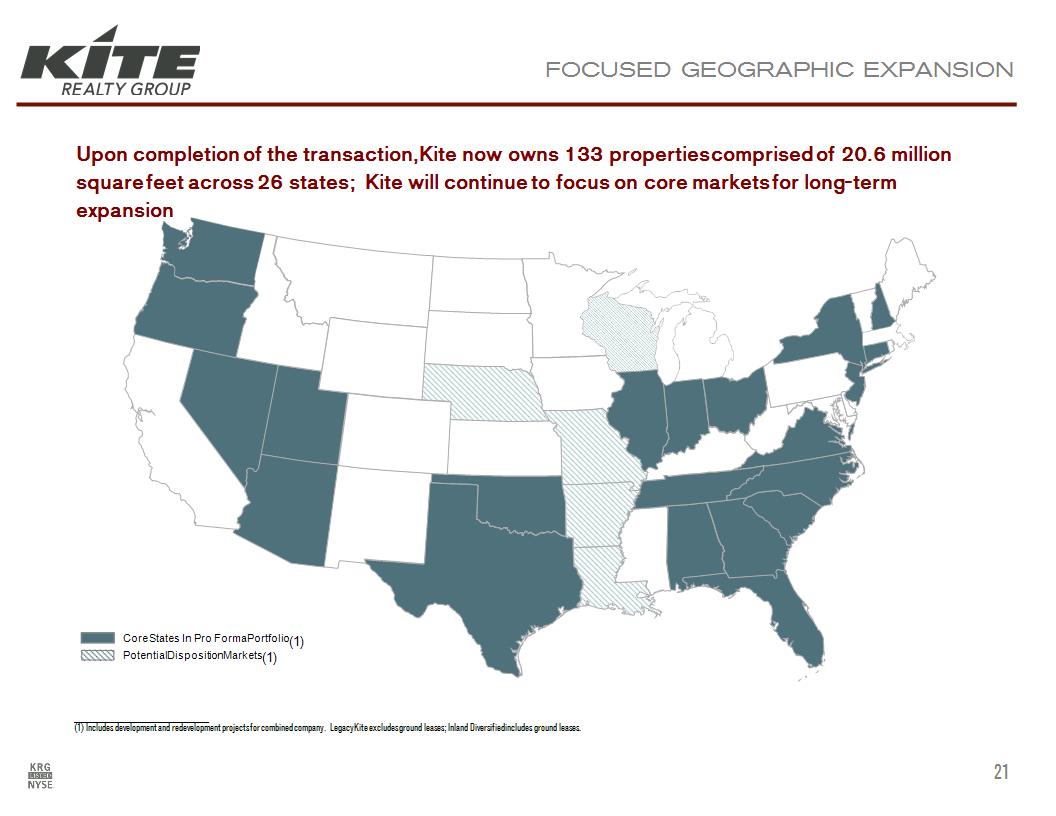
Upon completion of the transaction, Kite now owns 133 properties comprised of 20.6 million square feet across 26 states; Kite will continue to focus on core markets for long-term expansion FOCUSED GEOGRAPHIC EXPANSION ___________________________ (1) Includes development and redevelopment projects for combined company. Legacy Kite excludes ground leases; Inland Diversified includes ground leases. * Core States In Pro Forma Portfolio Potential Disposition Markets (1) (1)

MARKET DISCOUNTING KITE PERFORMANCE CONSISTENT OPERATING PERFORMANCE (1) ___________________________ Source: SNL. KRG number pro forma for merger. Kite’s operating fundamentals have outperformed its shopping center peers and the Company is focused on continuing to improve its balance sheet and maintain financial flexibility * Same Property NOI Q2, 2014 (%) CONSERVATIVE BALANCE SHEET (1)(2) Debt / EBITDA Q2, 2014 N/A FFO / SHARE GROWTH, 2014E N/A
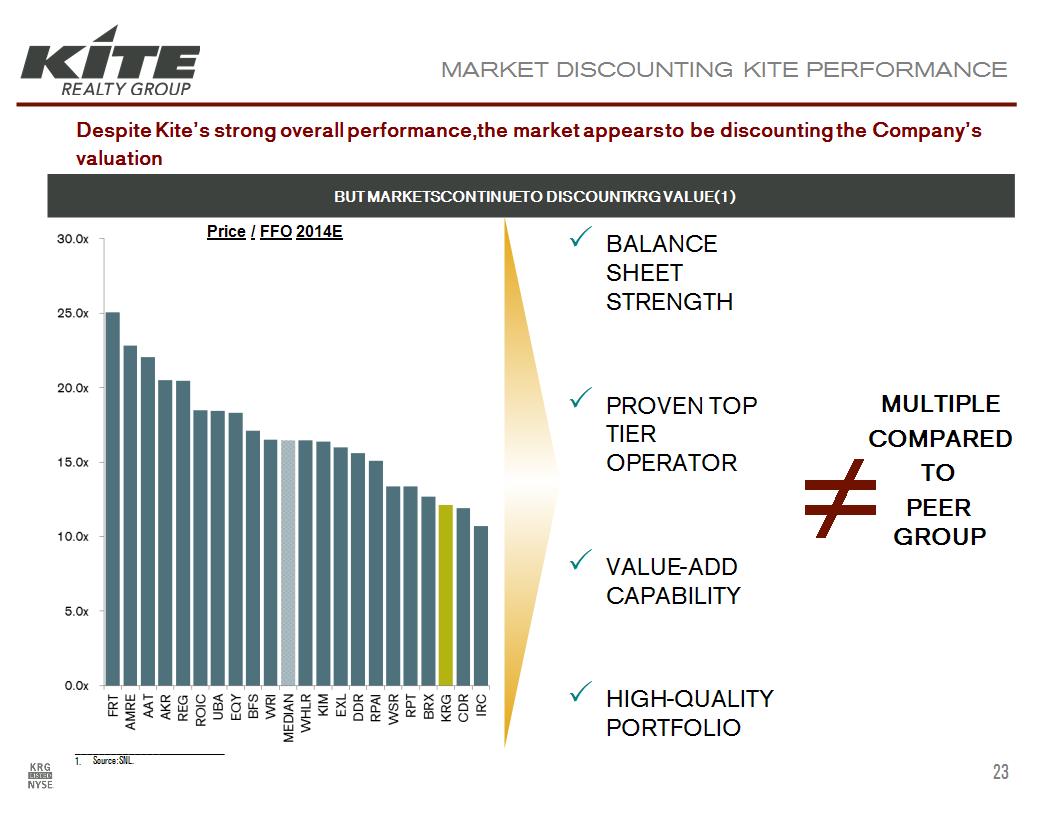
MARKET DISCOUNTING KITE PERFORMANCE BUT MARKETS CONTINUE TO DISCOUNT KRG VALUE (1) ___________________________ Source: SNL. Despite Kite’s strong overall performance, the market appears to be discounting the Company’s valuation * Price / FFO 2014E BALANCE SHEET STRENGTH PROVEN TOP TIER OPERATOR VALUE-ADD CAPABILITY HIGH-QUALITY PORTFOLIO ≠ MULTIPLE COMPARED TO PEER GROUP
Certain statements in this presentation that are not in the present or past tense or that discuss the Company’s expectations (including any use of the words “anticipate,” “assume,” “believe,” “estimate,” “expect,” “forecast,” “guidance,” “intend,” “may,” “might,” “outlook,” “project”, “should” or similar expressions) are forward-looking statements within the meaning of the federal securities laws and as such are based upon current beliefs as to the outcome and timing of future events. These forward-looking statements, which are based on current expectations, estimates and projections about the industry and markets in which the Company operates and beliefs of and assumptions made by management, involve uncertainties that could significantly affect the financial results of the Company. There can be no assurance that actual future developments affecting the Company will be those anticipated by the Company. These forward-looking statements involve risks and uncertainties (some of which are beyond the control of the Company) and are subject to change based upon various factors including, but not limited to, the following risks and uncertainties: changes in the real estate industry and in performance of the financial markets and interest rates; the demand for and market acceptance of the Company’s properties for rental purposes; the ability of the Company to enter into new leases or renewal leases on favorable terms; the amount and growth of the Company’s expenses; tenant financial difficulties and general economic conditions, including interest rates, as well as economic conditions and competition in those areas where the Company owns properties; risks associated with joint venture partners; risks associated with the ownership and development of real property; the outcome of claims and litigation involving or affecting the Company; the ability to satisfy conditions necessary to close pending transactions and the ability to successfully integrate pending transactions; applicable regulatory changes; risks associated with acquisitions, including the integration of the Company’s and Inland Diversified Real Estate Trust, Inc.’s businesses; risks associated with achieving expected revenue synergies or cost savings; and other risks and uncertainties detailed from time to time in the Company’s filings with the Securities and Exchange Commission (the “SEC”). Should one or more of these risks or uncertainties occur, or should underlying assumptions prove incorrect, the business, financial condition, liquidity, cash flows and financial results of the Company could differ materially from those expressed in the forward-looking statements. Any forward-looking statement speaks only as of the date on which it is made. New risks and uncertainties arise over time, and it is not possible for us to predict the occurrence of those matters or the manner in which they may affect us. The Company does not undertake to update forward-looking statements (including EBITDA and net debt to adjusted EBITDA estimates) except as may be required by law. FORWARD – LOOKING STATEMENTS *