Attached files
| file | filename |
|---|---|
| 8-K - FORM 8-K - Allegiant Travel CO | mgmtpresentation0811148k.htm |
Management Presentation August 2014

Forward looking statements 2 This presentation as well as oral statements made by officers or directors of Allegiant Travel Company, its advisors and affiliates (collectively or separately, the "Company“) will contain forward- looking statements that are only predictions and involve risks and uncertainties. Forward-looking statements may include, among others, references to future performance and any comments about our strategic plans. There are many risk factors that could prevent us from achieving our goals and cause the underlying assumptions of these forward-looking statements, and our actual results, to differ materially from those expressed in, or implied by, our forward-looking statements. These risk factors and others are more fully discussed in our filings with the Securities and Exchange Commission. Any forward-looking statements are based on information available to us today and we undertake no obligation to update publicly any forward-looking statements, whether as a result of future events, new information or otherwise. The Company cautions users of this presentation not to place undue reliance on forward looking statements, which may be based on assumptions and anticipated events that do not materialize.
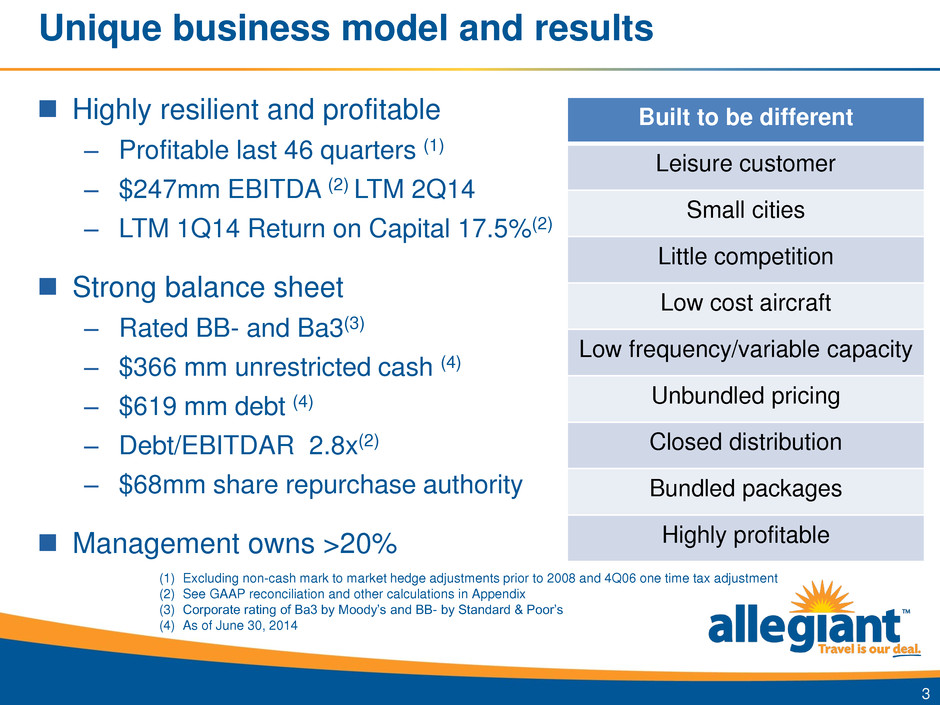
Unique business model and results Highly resilient and profitable – Profitable last 46 quarters (1) – $247mm EBITDA (2) LTM 2Q14 – LTM 1Q14 Return on Capital 17.5%(2) Strong balance sheet – Rated BB- and Ba3(3) – $366 mm unrestricted cash (4) – $619 mm debt (4) – Debt/EBITDAR 2.8x(2) – $68mm share repurchase authority Management owns >20% 3 (1) Excluding non-cash mark to market hedge adjustments prior to 2008 and 4Q06 one time tax adjustment (2) See GAAP reconciliation and other calculations in Appendix (3) Corporate rating of Ba3 by Moody’s and BB- by Standard & Poor’s (4) As of June 30, 2014 Built to be different Leisure customer Small cities Little competition Low cost aircraft Low frequency/variable capacity Unbundled pricing Closed distribution Bundled packages Highly profitable
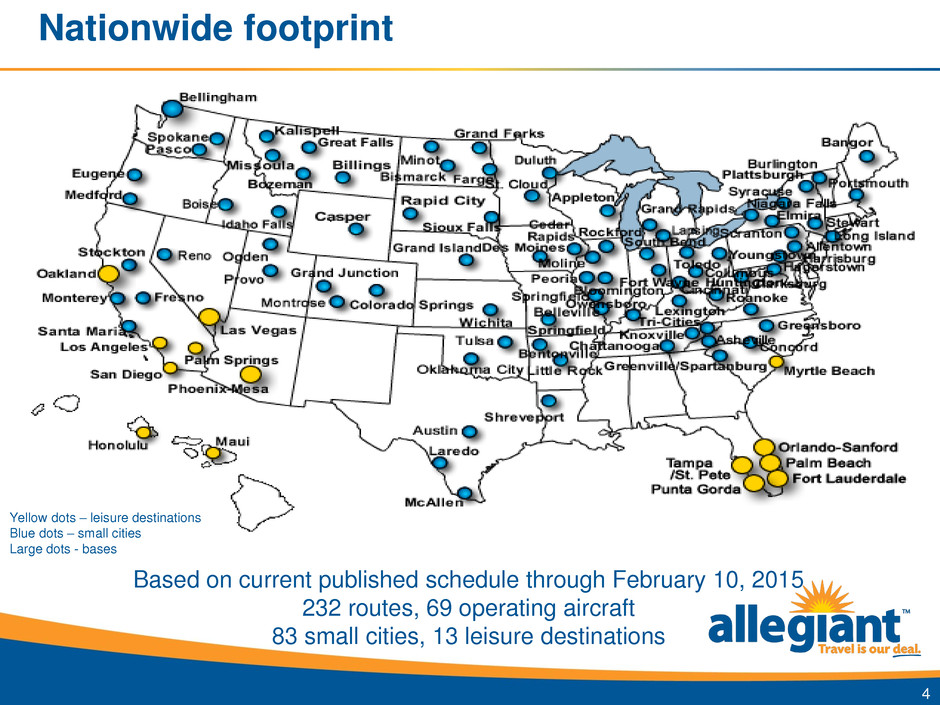
Nationwide footprint Based on current published schedule through February 10, 2015 232 routes, 69 operating aircraft 83 small cities, 13 leisure destinations 4 Yellow dots – leisure destinations Blue dots – small cities Large dots - bases
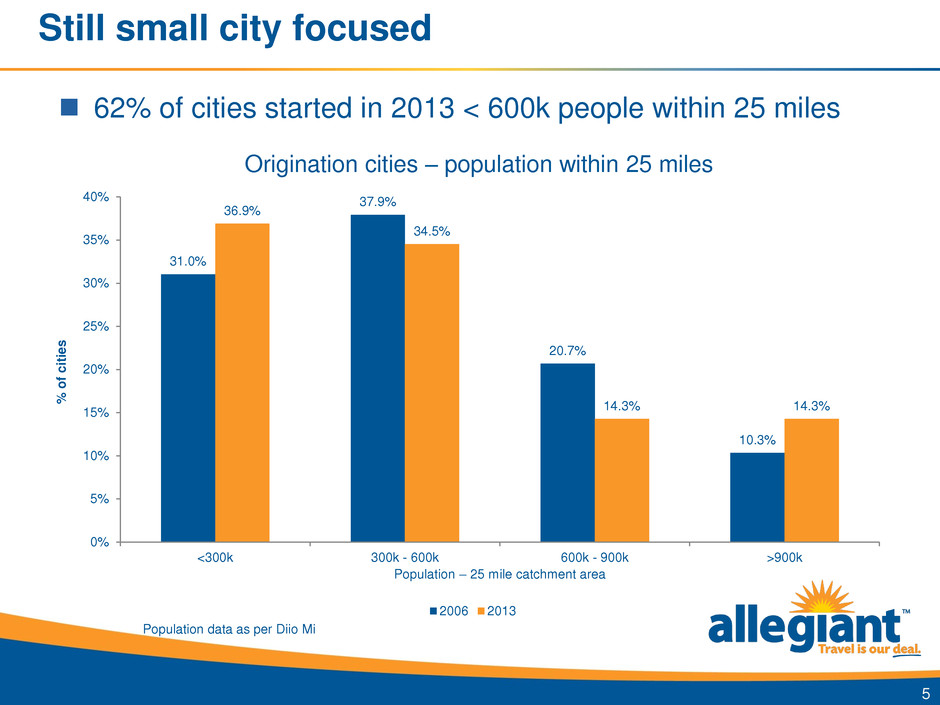
Still small city focused 31.0% 37.9% 20.7% 10.3% 36.9% 34.5% 14.3% 14.3% 0% 5% 10% 15% 20% 25% 30% 35% 40% <300k 300k - 600k 600k - 900k >900k % o f c it ie s Population – 25 mile catchment area 2006 2013 5 62% of cities started in 2013 < 600k people within 25 miles Origination cities – population within 25 miles Population data as per Diio Mi
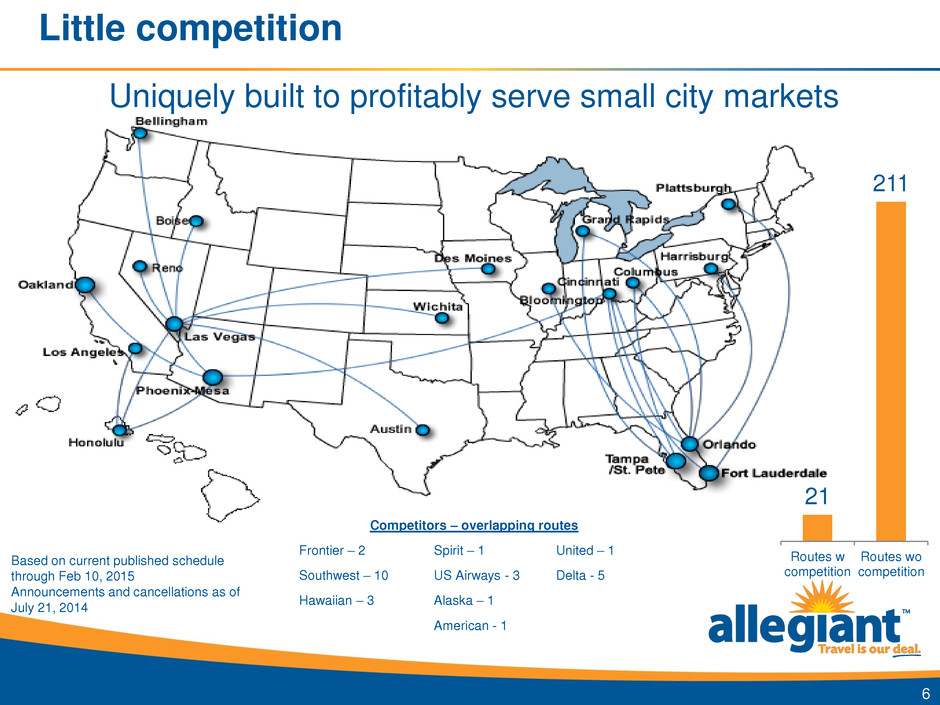
Little competition 21 211 Routes w competition Routes wo competition Uniquely built to profitably serve small city markets 6 Competitors – overlapping routes Frontier – 2 Spirit – 1 United – 1 Southwest – 10 US Airways - 3 Delta - 5 Hawaiian – 3 Alaska – 1 American - 1 Based on current published schedule through Feb 10, 2015 Announcements and cancellations as of July 21, 2014
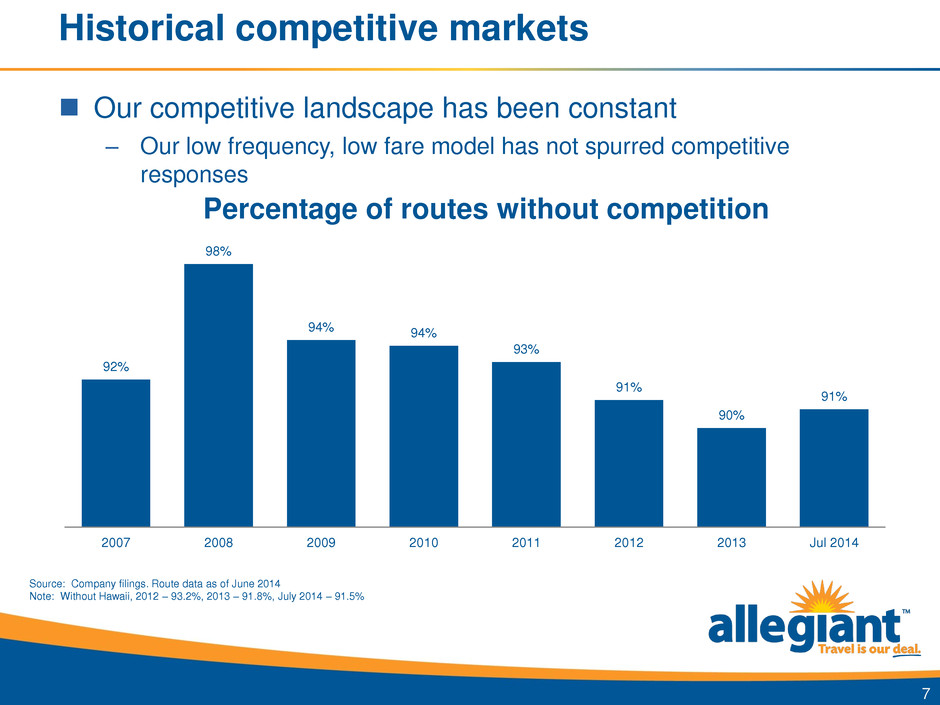
Historical competitive markets 7 92% 98% 94% 94% 93% 91% 90% 91% 2007 2008 2009 2010 2011 2012 2013 Jul 2014 Percentage of routes without competition Our competitive landscape has been constant – Our low frequency, low fare model has not spurred competitive responses Source: Company filings. Route data as of June 2014 Note: Without Hawaii, 2012 – 93.2%, 2013 – 91.8%, July 2014 – 91.5%
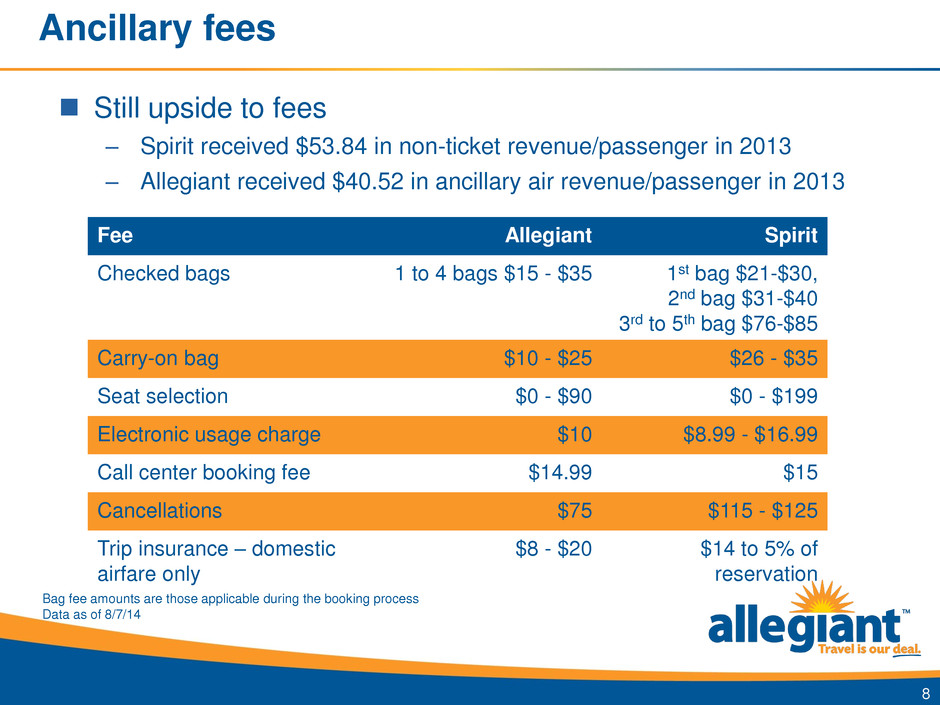
Ancillary fees Fee Allegiant Spirit Checked bags 1 to 4 bags $15 - $35 1st bag $21-$30, 2nd bag $31-$40 3rd to 5th bag $76-$85 Carry-on bag $10 - $25 $26 - $35 Seat selection $0 - $90 $0 - $199 Electronic usage charge $10 $8.99 - $16.99 Call center booking fee $14.99 $15 Cancellations $75 $115 - $125 Trip insurance – domestic airfare only $8 - $20 $14 to 5% of reservation 8 Bag fee amounts are those applicable during the booking process Data as of 8/7/14 Still upside to fees – Spirit received $53.84 in non-ticket revenue/passenger in 2013 – Allegiant received $40.52 in ancillary air revenue/passenger in 2013
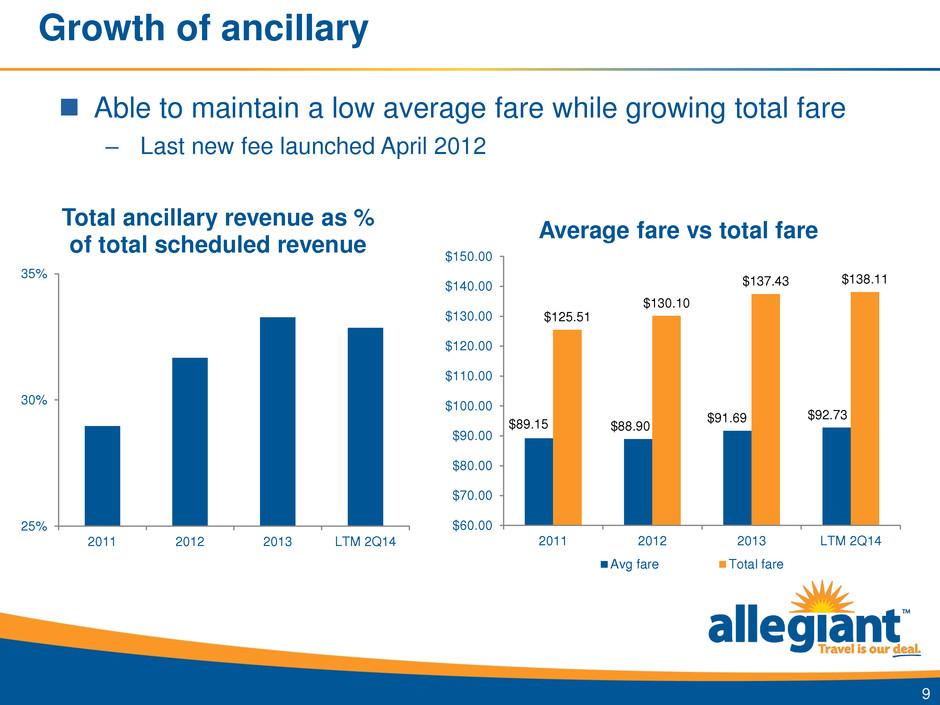
Growth of ancillary 25% 30% 35% 2011 2012 2013 LTM 2Q14 Total ancillary revenue as % of total scheduled revenue 9 $89.15 $88.90 $91.69 $92.73 $125.51 $130.10 $137.43 $138.11 $60.00 $70.00 $80.00 $90.00 $100.00 $110.00 $120.00 $130.00 $140.00 $150.00 2011 2012 2013 LTM 2Q14 Average fare vs total fare Avg fare Total fare Able to maintain a low average fare while growing total fare – Last new fee launched April 2012
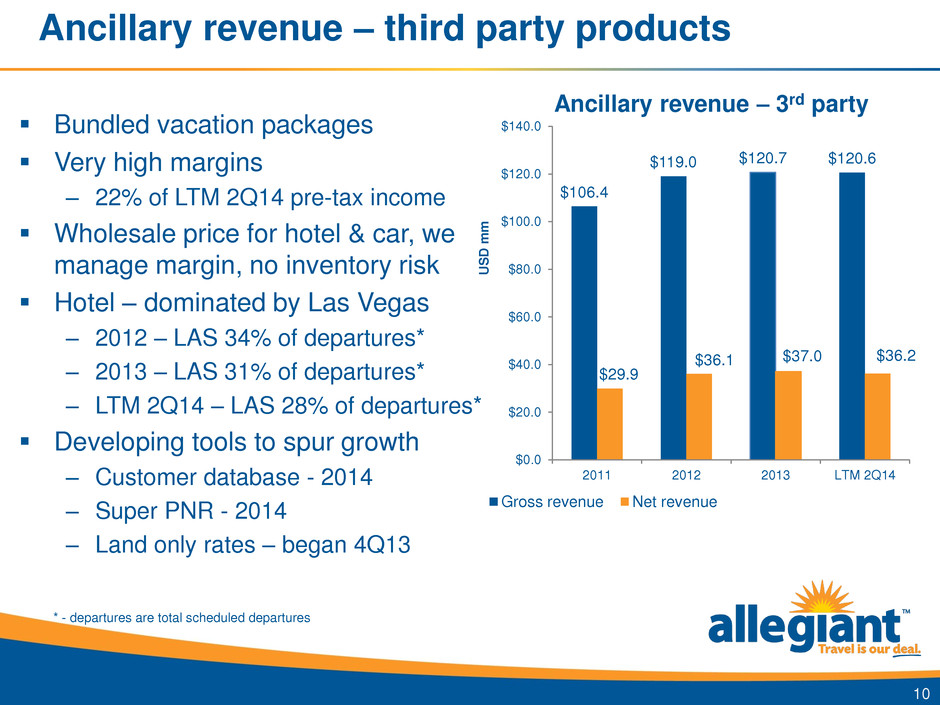
Ancillary revenue – third party products Bundled vacation packages Very high margins – 22% of LTM 2Q14 pre-tax income Wholesale price for hotel & car, we manage margin, no inventory risk Hotel – dominated by Las Vegas – 2012 – LAS 34% of departures* – 2013 – LAS 31% of departures* – LTM 2Q14 – LAS 28% of departures* Developing tools to spur growth – Customer database - 2014 – Super PNR - 2014 – Land only rates – began 4Q13 $106.4 $119.0 $120.7 $120.6 $29.9 $36.1 $37.0 $36.2 $0.0 $20.0 $40.0 $60.0 $80.0 $100.0 $120.0 $140.0 2011 2012 2013 LTM 2Q14 U S D m m Gross revenue Net revenue 10 Ancillary revenue – 3rd party * - departures are total scheduled departures
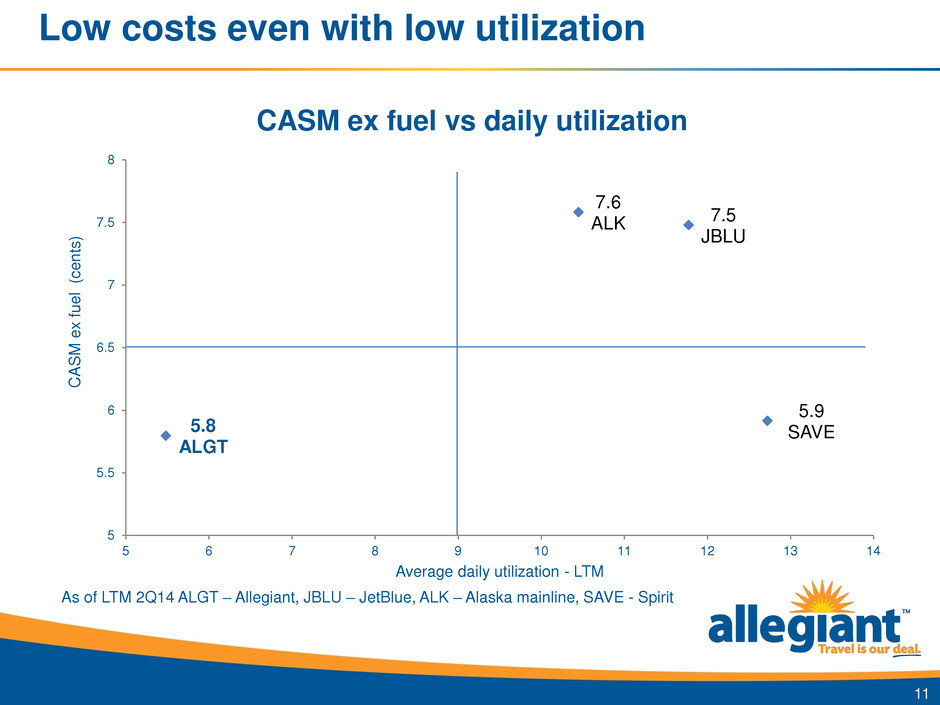
Low costs even with low utilization 7.5 JBLU 5.9 SAVE 7.6 ALK 5.8 ALGT 5 5.5 6 6.5 7 7.5 8 5 6 7 8 9 10 11 12 13 14 CA S M e x f u e l (ce n ts ) Average daily utilization - LTM CASM ex fuel vs daily utilization 11 As of LTM 2Q14 ALGT – Allegiant, JBLU – JetBlue, ALK – Alaska mainline, SAVE - Spirit
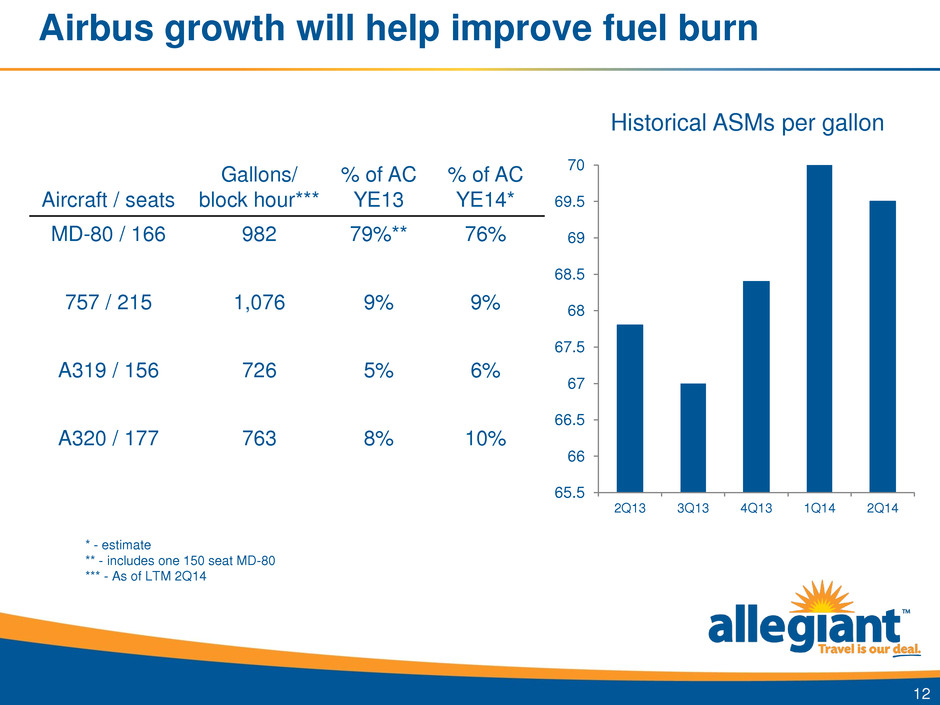
Airbus growth will help improve fuel burn 12 65.5 66 66.5 67 67.5 68 68.5 69 69.5 70 2Q13 3Q13 4Q13 1Q14 2Q14 Historical ASMs per gallon Aircraft / seats Gallons/ block hour*** % of AC YE13 % of AC YE14* MD-80 / 166 982 79%** 76% 757 / 215 1,076 9% 9% A319 / 156 726 5% 6% A320 / 177 763 8% 10% * - estimate ** - includes one 150 seat MD-80 *** - As of LTM 2Q14
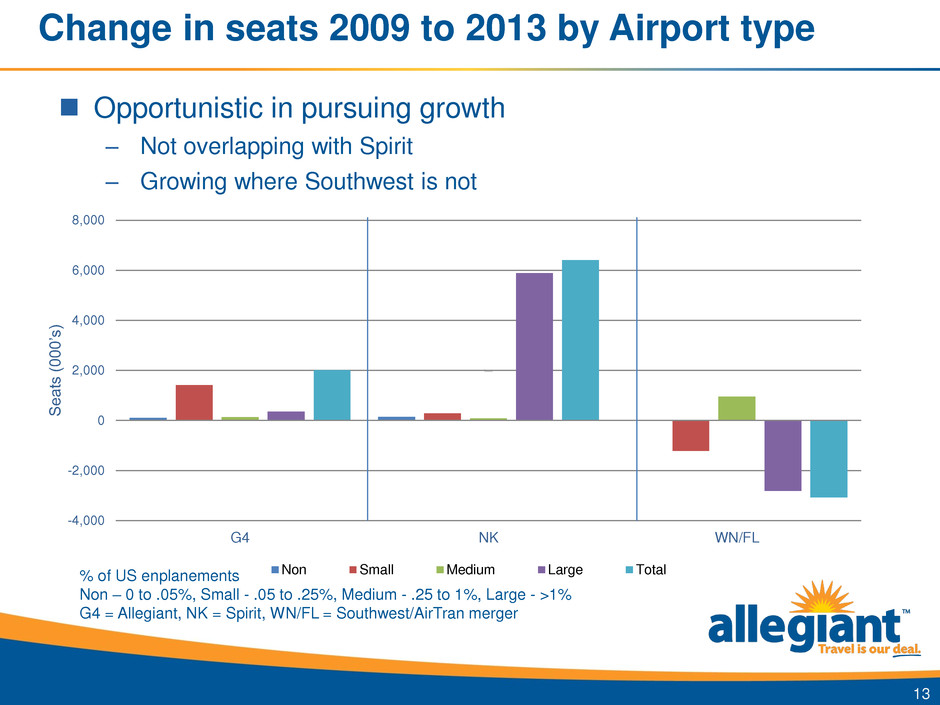
Change in seats 2009 to 2013 by Airport type 13 -4,000 -2,000 0 2,000 4,000 6,000 8,000 G4 NK WN/FL S e a ts (00 0 ’s) Non Small Medium Large Total% of US enplanements Non – 0 to .05%, Small - .05 to .25%, Medium - .25 to 1%, Large - >1% G4 = Allegiant, NK = Spirit, WN/FL = Southwest/AirTran merger Opportunistic in pursuing growth – Not overlapping with Spirit – Growing where Southwest is not
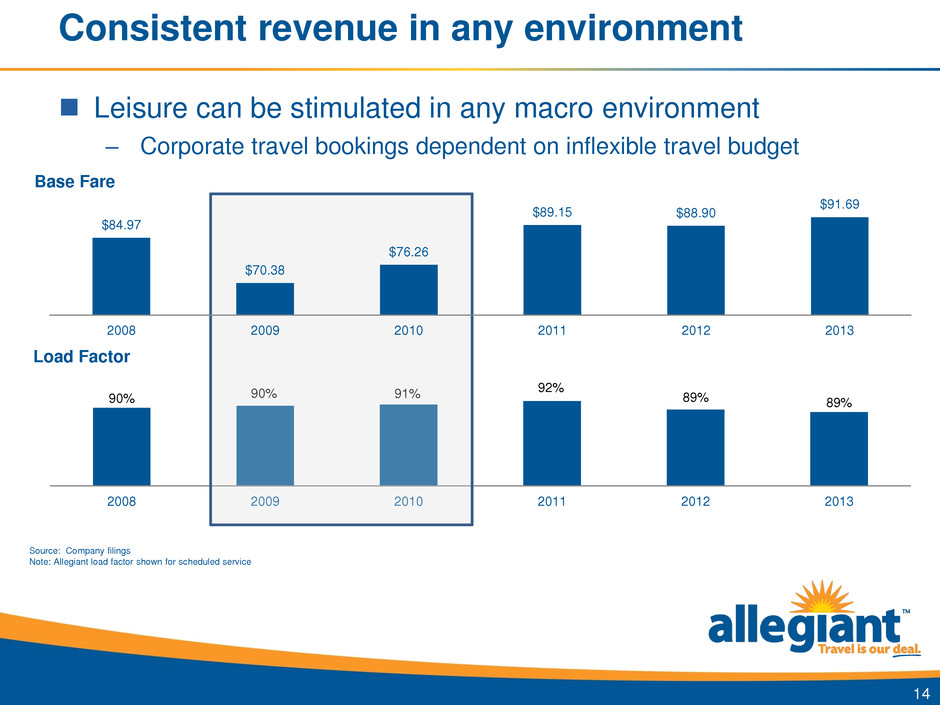
Consistent revenue in any environment 14 Leisure can be stimulated in any macro environment – Corporate travel bookings dependent on inflexible travel budget 90% 90% 91% 92% 89% 89% 2008 2009 2010 2011 2012 2013 Load Factor $84.97 $70.38 $76.26 $89.15 $88.90 $91.69 2008 2009 2010 2011 2012 2013 Base Fare Source: Company filings Note: Allegiant load factor shown for scheduled service
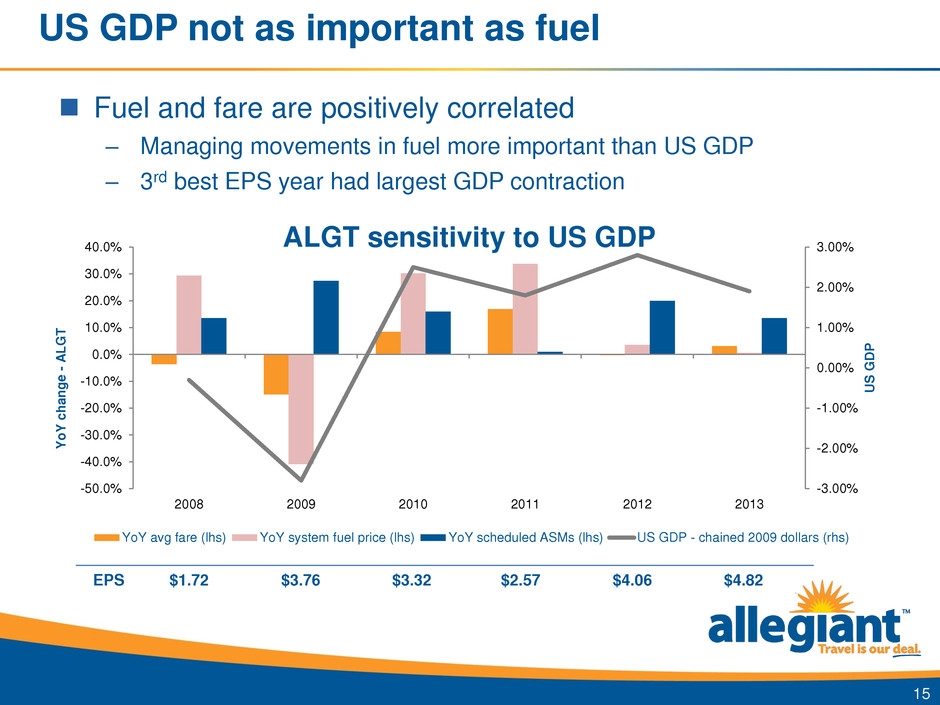
US GDP not as important as fuel -3.00% -2.00% -1.00% 0.00% 1.00% 2.00% 3.00% -50.0% -40.0% -30.0% -20.0% -10.0% 0.0% 10.0% 20.0% 30.0% 40.0% 2008 2009 2010 2011 2012 2013 U S G D P Y o Y cha n g e - A L G T ALGT sensitivity to US GDP YoY avg fare (lhs) YoY system fuel price (lhs) YoY scheduled ASMs (lhs) US GDP - chained 2009 dollars (rhs) 15 EPS $1.72 $3.76 $3.32 $2.57 $4.06 $4.82 Fuel and fare are positively correlated – Managing movements in fuel more important than US GDP – 3rd best EPS year had largest GDP contraction
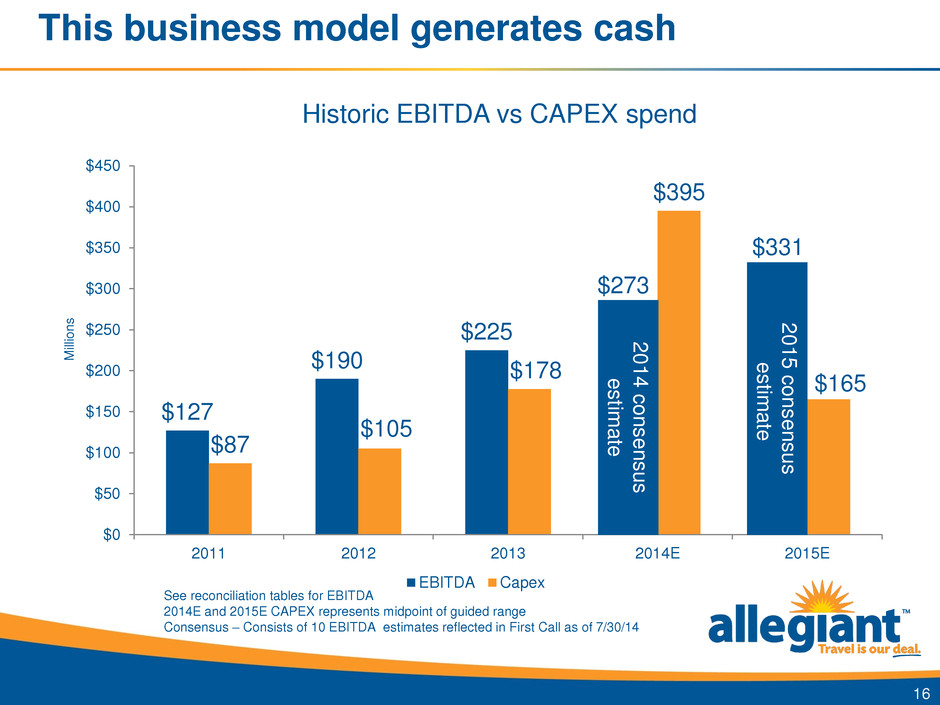
This business model generates cash $127 $190 $225 $273 $331 $87 $105 $178 $395 $165 $0 $50 $100 $150 $200 $250 $300 $350 $400 $450 2011 2012 2013 2014E 2015E M ill io n s EBITDA Capex 16 See reconciliation tables for EBITDA 2014E and 2015E CAPEX represents midpoint of guided range Consensus – Consists of 10 EBITDA estimates reflected in First Call as of 7/30/14 Historic EBITDA vs CAPEX spend 2014 c on s en s u s e s timat e 2015 c on s en s u s e s timat e
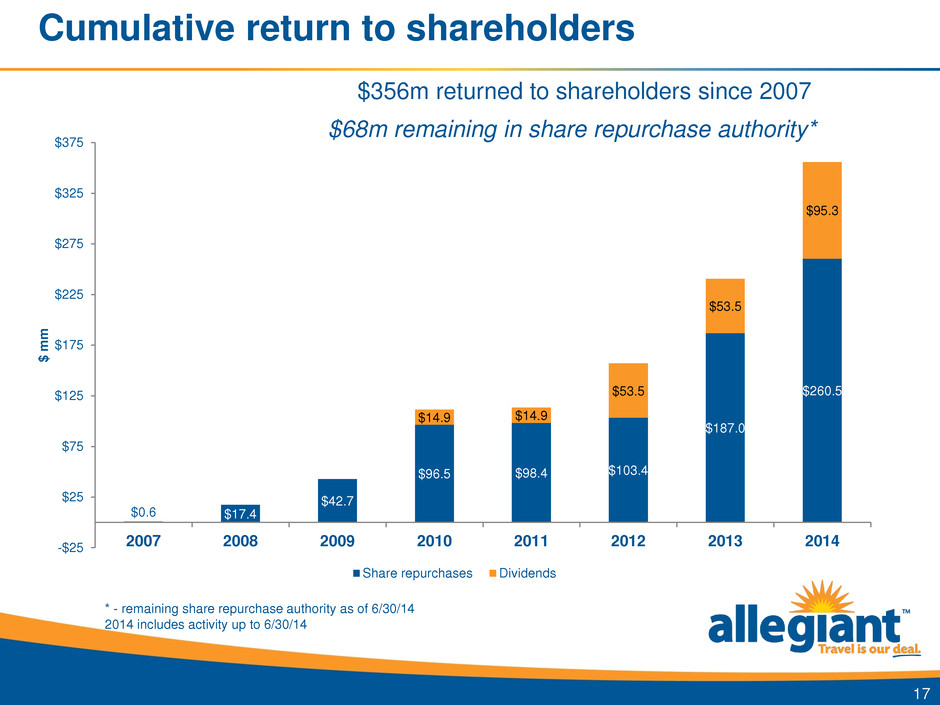
Cumulative return to shareholders $0.6 $17.4 $42.7 $96.5 $98.4 $103.4 $187.0 $260.5 $14.9 $14.9 $53.5 $53.5 $95.3 -$25 $25 $75 $125 $175 $225 $275 $325 $375 2007 2008 2009 2010 2011 2012 2013 2014 $ m m Share repurchases Dividends 17 $356m returned to shareholders since 2007 $68m remaining in share repurchase authority* * - remaining share repurchase authority as of 6/30/14 2014 includes activity up to 6/30/14
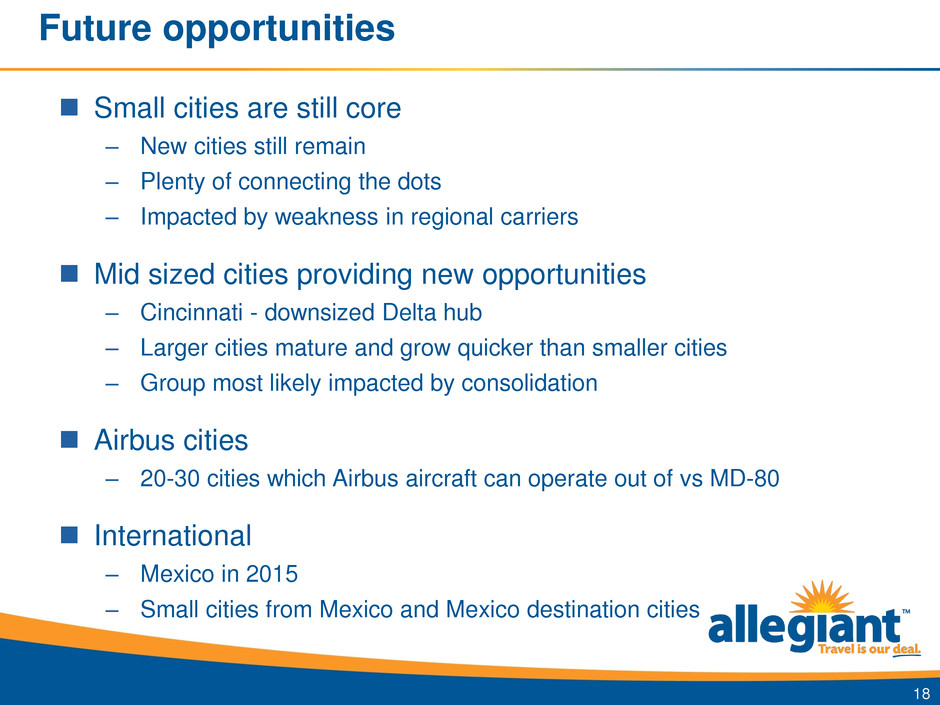
Future opportunities 18 Small cities are still core – New cities still remain – Plenty of connecting the dots – Impacted by weakness in regional carriers Mid sized cities providing new opportunities – Cincinnati - downsized Delta hub – Larger cities mature and grow quicker than smaller cities – Group most likely impacted by consolidation Airbus cities – 20-30 cities which Airbus aircraft can operate out of vs MD-80 International – Mexico in 2015 – Small cities from Mexico and Mexico destination cities
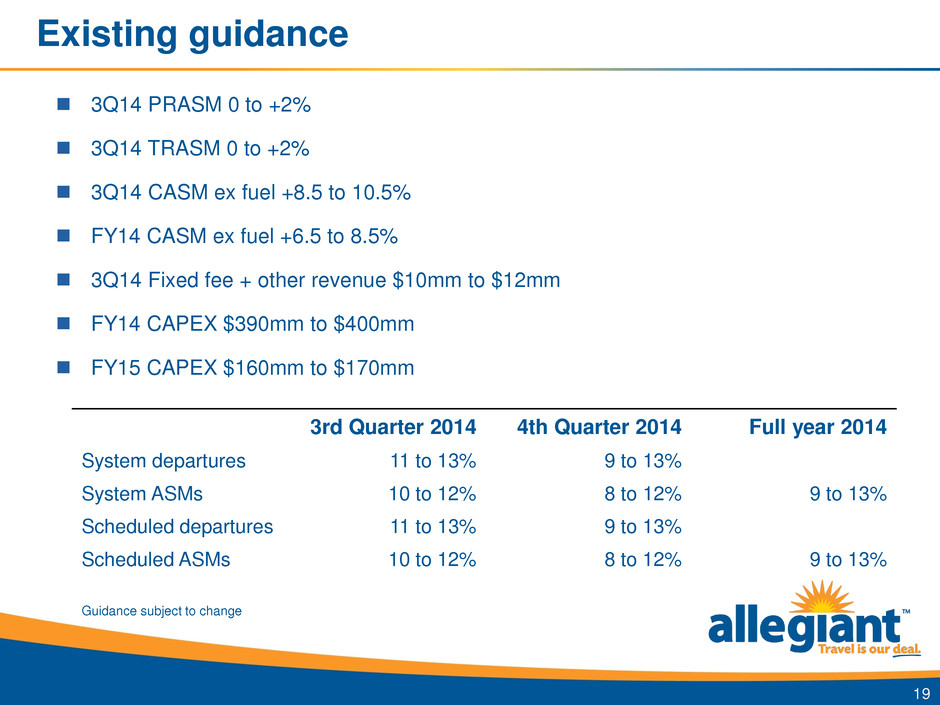
3Q14 PRASM 0 to +2% 3Q14 TRASM 0 to +2% 3Q14 CASM ex fuel +8.5 to 10.5% FY14 CASM ex fuel +6.5 to 8.5% 3Q14 Fixed fee + other revenue $10mm to $12mm FY14 CAPEX $390mm to $400mm FY15 CAPEX $160mm to $170mm 3rd Quarter 2014 4th Quarter 2014 Full year 2014 System departures 11 to 13% 9 to 13% System ASMs 10 to 12% 8 to 12% 9 to 13% Scheduled departures 11 to 13% 9 to 13% Scheduled ASMs 10 to 12% 8 to 12% 9 to 13% Existing guidance 19 Guidance subject to change

Appendix
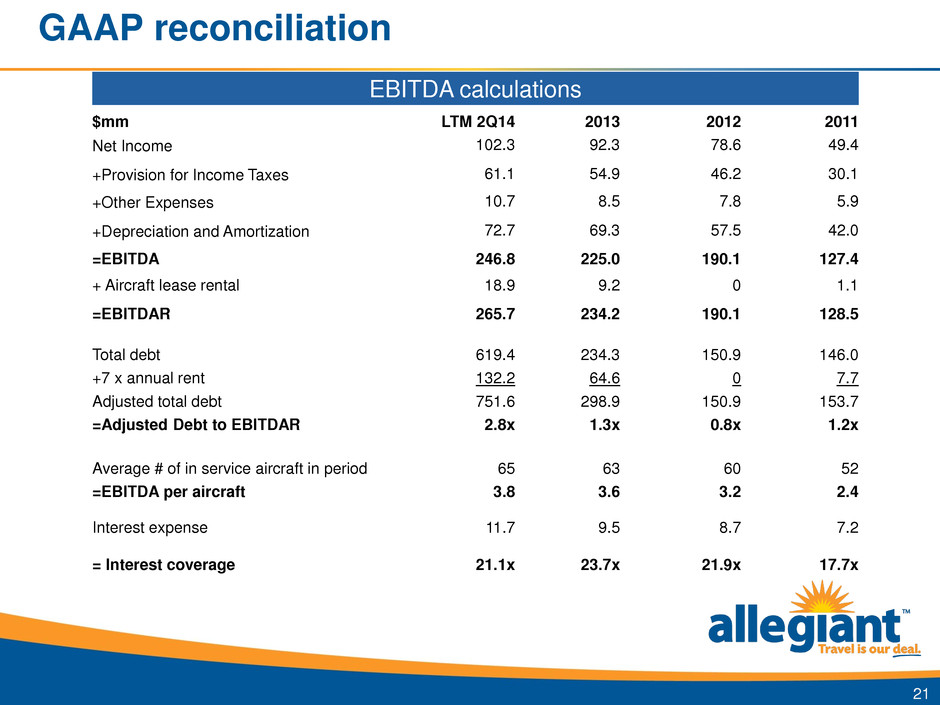
GAAP reconciliation EBITDA calculations 21 $mm LTM 2Q14 2013 2012 2011 Net Income 102.3 92.3 78.6 49.4 +Provision for Income Taxes 61.1 54.9 46.2 30.1 +Other Expenses 10.7 8.5 7.8 5.9 +Depreciation and Amortization 72.7 69.3 57.5 42.0 =EBITDA 246.8 225.0 190.1 127.4 + Aircraft lease rental 18.9 9.2 0 1.1 =EBITDAR 265.7 234.2 190.1 128.5 Total debt 619.4 234.3 150.9 146.0 +7 x annual rent 132.2 64.6 0 7.7 Adjusted total debt 751.6 298.9 150.9 153.7 =Adjusted Debt to EBITDAR 2.8x 1.3x 0.8x 1.2x Average # of in service aircraft in period 65 63 60 52 =EBITDA per aircraft 3.8 3.6 3.2 2.4 Interest expense 11.7 9.5 8.7 7.2 = Interest coverage 21.1x 23.7x 21.9x 17.7x
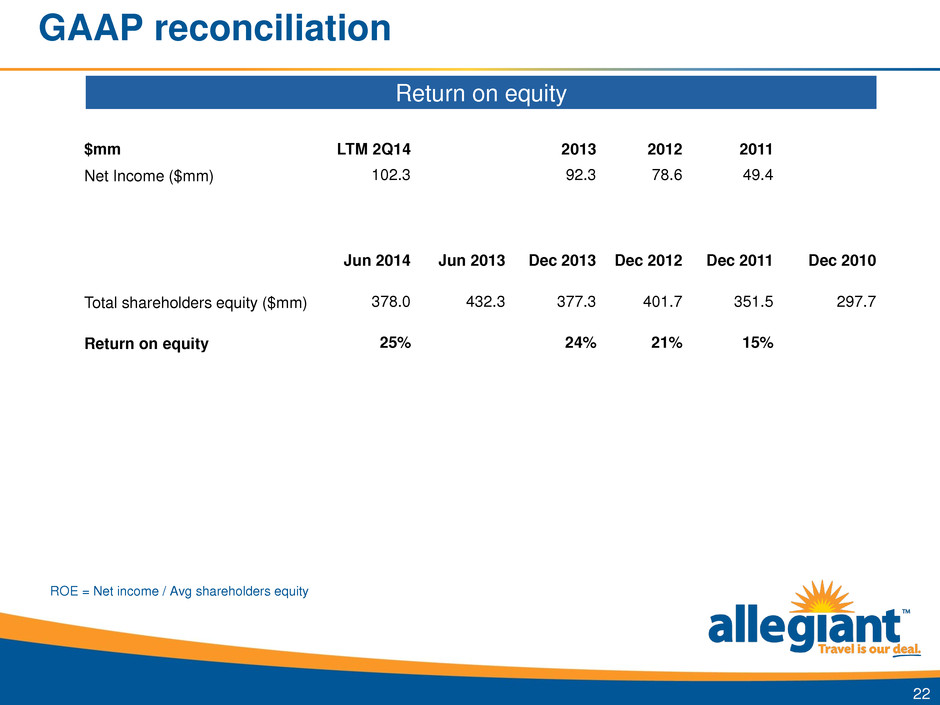
GAAP reconciliation Return on equity 22 $mm LTM 2Q14 2013 2012 2011 Net Income ($mm) 102.3 92.3 78.6 49.4 Jun 2014 Jun 2013 Dec 2013 Dec 2012 Dec 2011 Dec 2010 Total shareholders equity ($mm) 378.0 432.3 377.3 401.7 351.5 297.7 Return on equity 25% 24% 21% 15% ROE = Net income / Avg shareholders equity

GAAP reconciliation Return on capital employed calculation $mm LTM 2Q14 2013 2012 2011 + Net income 102.3 92.3 78.6 49.4 + Income tax 61.1 54.9 46.2 30.1 + Interest expense 11.7 9.5 8.7 7.2 - Interest income 1.0 1.0 1.0 1.2 174.1 155.7 132.5 85.5 + Interest income 1.0 1.0 1.0 1.2 Tax rate 37.4% 37.4% 37.1% 37.9% Numerator 109.6 98.1 84.0 53.9 Total assets prior year 862.6 798.2 706.7 501.3 - Current liabilities prior year 247.5 210.7 177.6 166.6 + ST debt of prior year 12.0 11.6 8.0 16.5 Denominator 627.1 599.3 537.1 351.2 = Return on capital employed 17.5% 16.4% 15.6% 15.3% 23
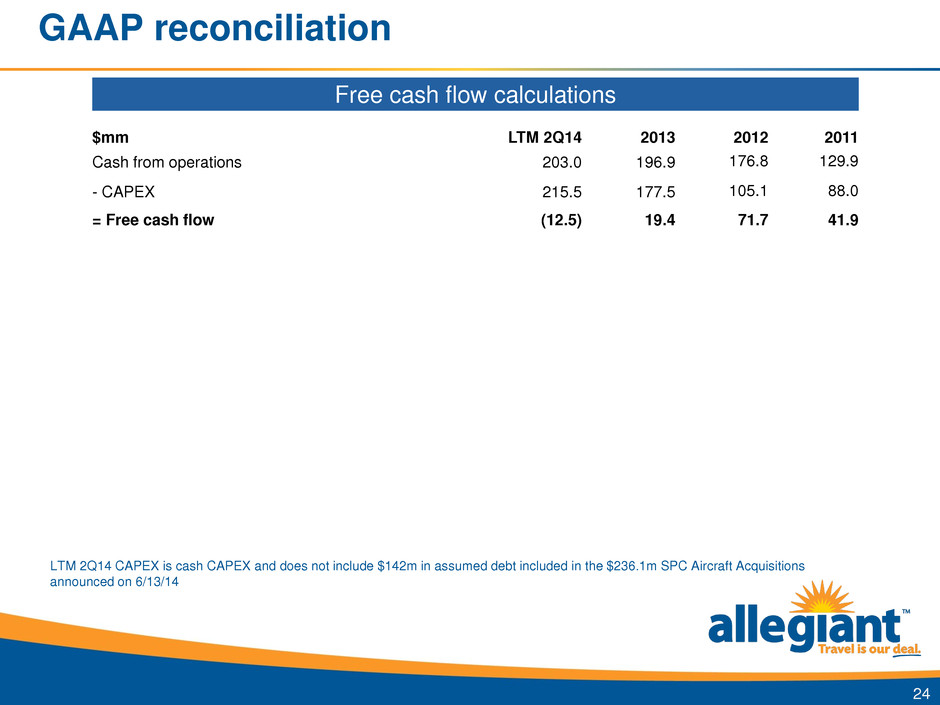
GAAP reconciliation Free cash flow calculations 24 $mm LTM 2Q14 2013 2012 2011 Cash from operations 203.0 196.9 176.8 129.9 - CAPEX 215.5 177.5 105.1 88.0 = Free cash flow (12.5) 19.4 71.7 41.9 LTM 2Q14 CAPEX is cash CAPEX and does not include $142m in assumed debt included in the $236.1m SPC Aircraft Acquisitions announced on 6/13/14
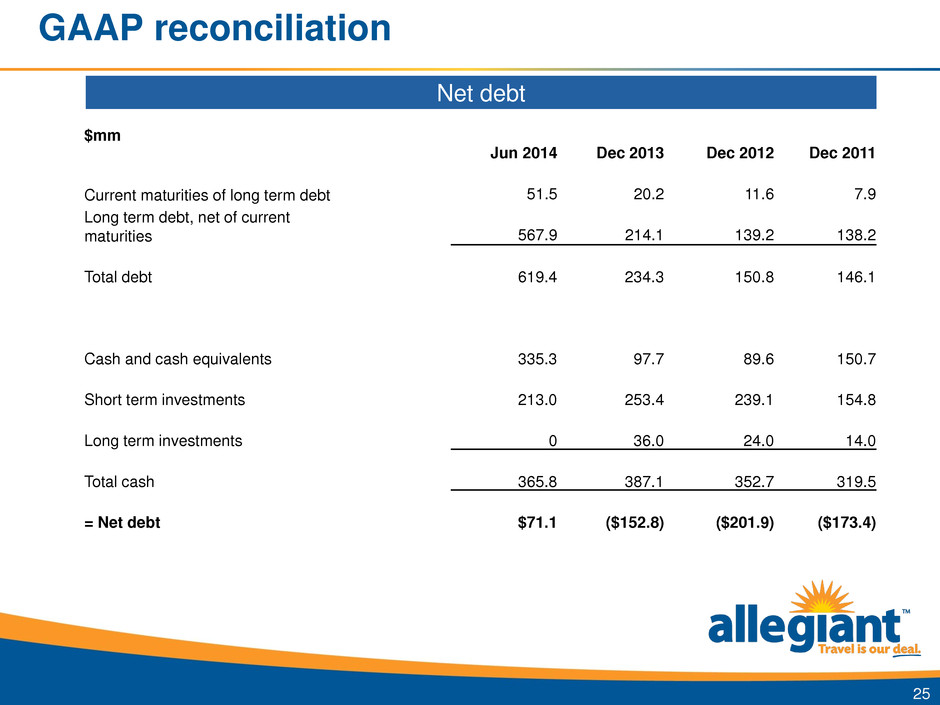
GAAP reconciliation Net debt 25 $mm Jun 2014 Dec 2013 Dec 2012 Dec 2011 Current maturities of long term debt 51.5 20.2 11.6 7.9 Long term debt, net of current maturities 567.9 214.1 139.2 138.2 Total debt 619.4 234.3 150.8 146.1 Cash and cash equivalents 335.3 97.7 89.6 150.7 Short term investments 213.0 253.4 239.1 154.8 Long term investments 0 36.0 24.0 14.0 Total cash 365.8 387.1 352.7 319.5 = Net debt $71.1 ($152.8) ($201.9) ($173.4)
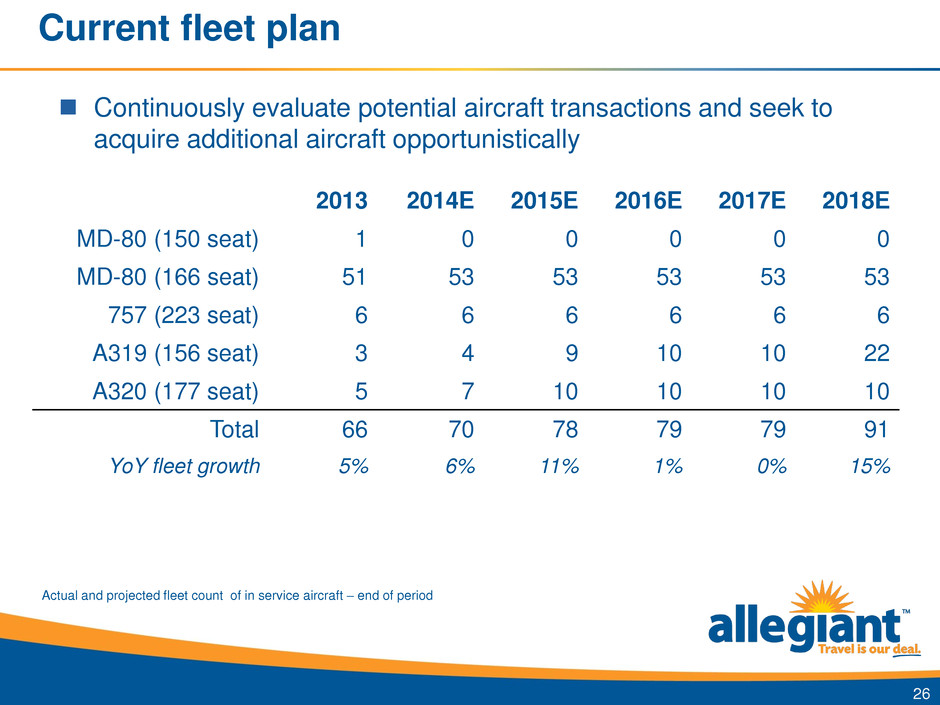
Current fleet plan 2013 2014E 2015E 2016E 2017E 2018E MD-80 (150 seat) 1 0 0 0 0 0 MD-80 (166 seat) 51 53 53 53 53 53 757 (223 seat) 6 6 6 6 6 6 A319 (156 seat) 3 4 9 10 10 22 A320 (177 seat) 5 7 10 10 10 10 Total 66 70 78 79 79 91 YoY fleet growth 5% 6% 11% 1% 0% 15% 26 Actual and projected fleet count of in service aircraft – end of period Continuously evaluate potential aircraft transactions and seek to acquire additional aircraft opportunistically
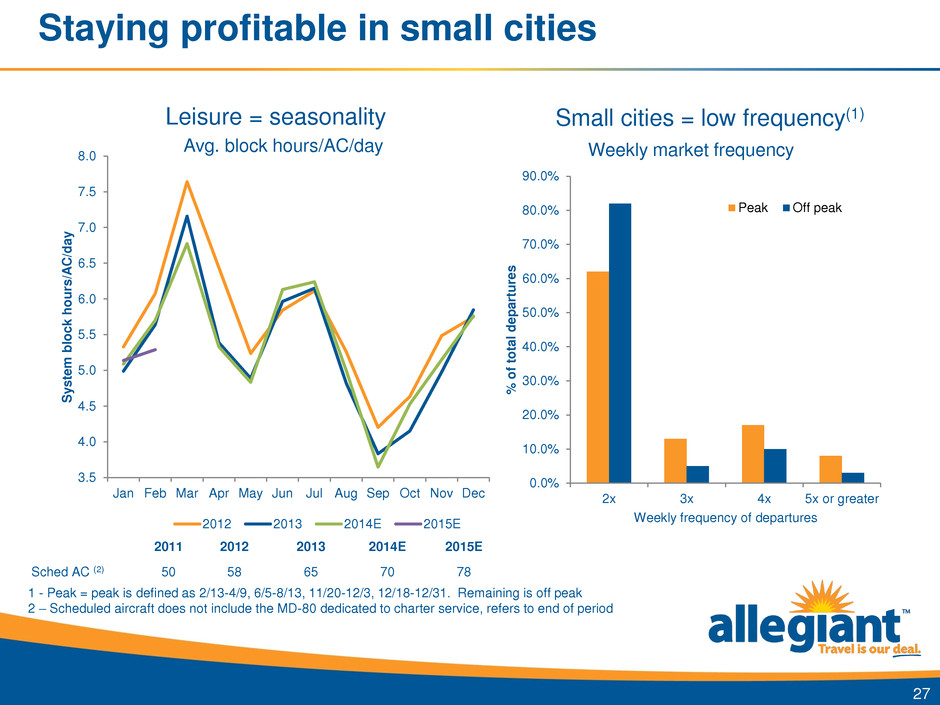
Staying profitable in small cities 27 3.5 4.0 4.5 5.0 5.5 6.0 6.5 7.0 7.5 8.0 Jan Feb Mar Apr May Jun Jul Aug Sep Oct Nov Dec S y ste m b lock h o u rs/ A C/ d a y 2012 2013 2014E 2015E Avg. block hours/AC/day 1 - Peak = peak is defined as 2/13-4/9, 6/5-8/13, 11/20-12/3, 12/18-12/31. Remaining is off peak 2 – Scheduled aircraft does not include the MD-80 dedicated to charter service, refers to end of period 0.0% 10.0% 20.0% 30.0% 40.0% 50.0% 60.0% 70.0% 80.0% 90.0% 2x 3x 4x 5x or greater % o f to tal d epa rt u re s Weekly frequency of departures Weekly market frequency Peak Off peak Leisure = seasonality Small cities = low frequency(1) 2011 2012 2013 2014E 2015E Sched AC (2) 50 58 65 70 78
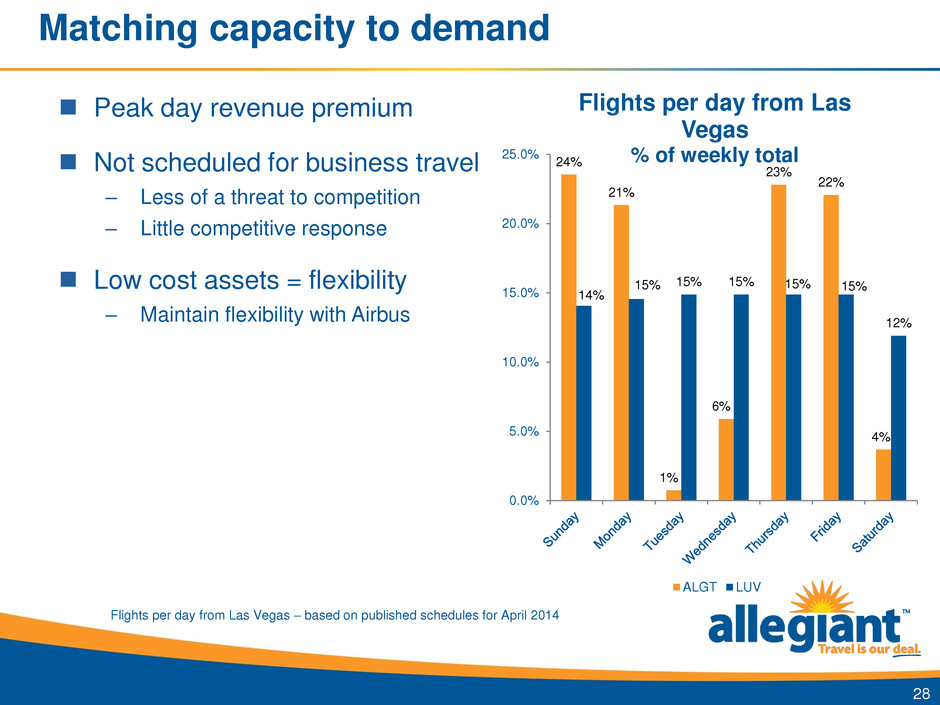
Matching capacity to demand 24% 21% 1% 6% 23% 22% 4% 14% 15% 15% 15% 15% 15% 12% 0.0% 5.0% 10.0% 15.0% 20.0% 25.0% Flights per day from Las Vegas % of weekly total ALGT LUV 28 Flights per day from Las Vegas – based on published schedules for April 2014 Peak day revenue premium Not scheduled for business travel – Less of a threat to competition – Little competitive response Low cost assets = flexibility – Maintain flexibility with Airbus
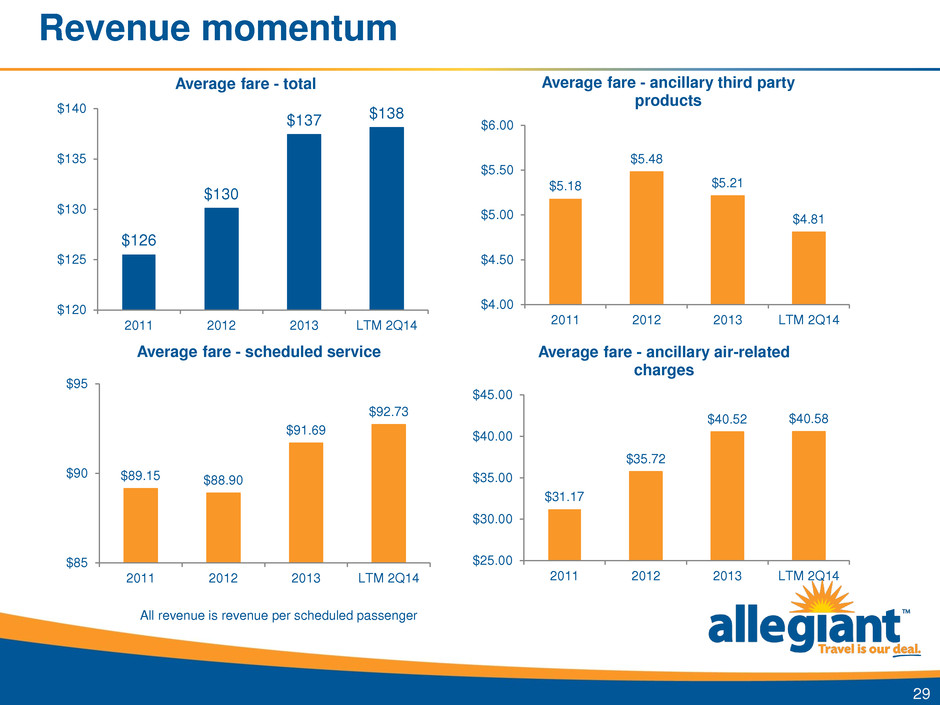
Revenue momentum 29 $89.15 $88.90 $91.69 $92.73 $85 $90 $95 2011 2012 2013 LTM 2Q14 Average fare - scheduled service $5.18 $5.48 $5.21 $4.81 $4.00 $4.50 $5.00 $5.50 $6.00 2011 2012 2013 LTM 2Q14 Average fare - ancillary third party products $31.17 $35.72 $40.52 $40.58 $25.00 $30.00 $35.00 $40.00 $45.00 2011 2012 2013 LTM 2Q14 Average fare - ancillary air-related charges $126 $130 $137 $138 $120 $125 $130 $135 $140 2011 2012 2013 LTM 2Q14 Average fare - total All revenue is revenue per scheduled passenger
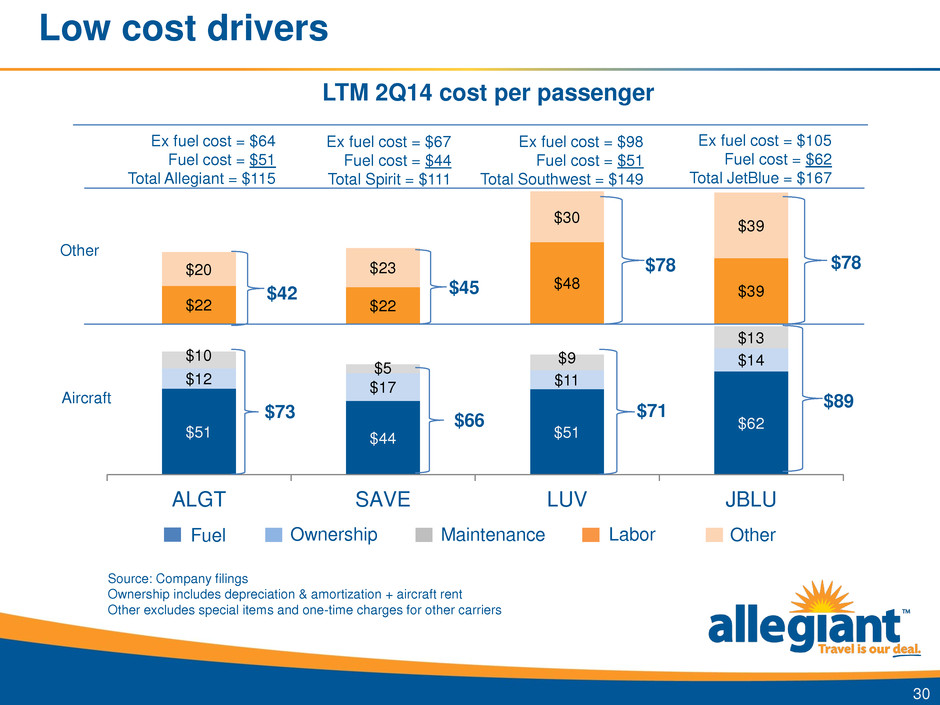
LTM 2Q14 cost per passenger Low cost drivers $51 $44 $51 $62 $12 $17 $11 $14 $10 $5 $9 $13 $22 $22 $48 $39 $20 $23 $30 $39 ALGT SAVE LUV JBLU 30 Source: Company filings Ownership includes depreciation & amortization + aircraft rent Other excludes special items and one-time charges for other carriers Other Aircraft $73 $71 $89 $42 $78 $78 Ex fuel cost = $64 Fuel cost = $51 Total Allegiant = $115 Ex fuel cost = $98 Fuel cost = $51 Total Southwest = $149 Ex fuel cost = $105 Fuel cost = $62 Total JetBlue = $167 $66 $45 Ex fuel cost = $67 Fuel cost = $44 Total Spirit = $111 Fuel Ownership Maintenance Other Labor
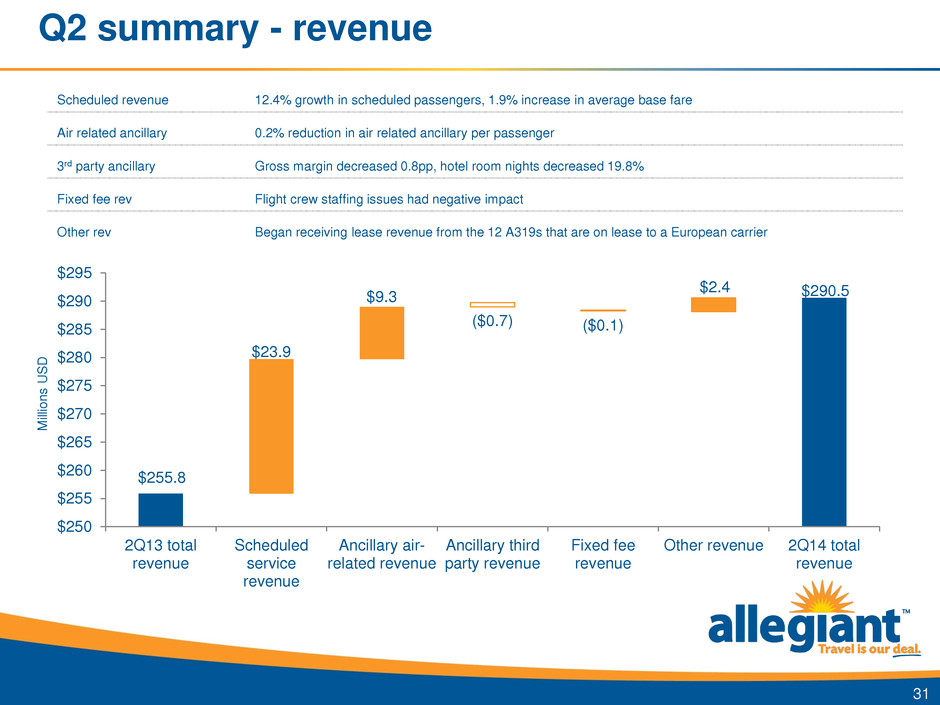
Q2 summary - revenue 31 $255.8 $290.5 $23.9 $9.3 ($0.7) ($0.1) $2.4 $250 $255 $260 $265 $270 $275 $280 $285 $290 $295 2Q13 total revenue Scheduled service revenue Ancillary air- related revenue Ancillary third party revenue Fixed fee revenue Other revenue 2Q14 total revenue M ill io n s U S D Scheduled revenue 12.4% growth in scheduled passengers, 1.9% increase in average base fare Air related ancillary 0.2% reduction in air related ancillary per passenger 3rd party ancillary Gross margin decreased 0.8pp, hotel room nights decreased 19.8% Fixed fee rev Flight crew staffing issues had negative impact Other rev Began receiving lease revenue from the 12 A319s that are on lease to a European carrier
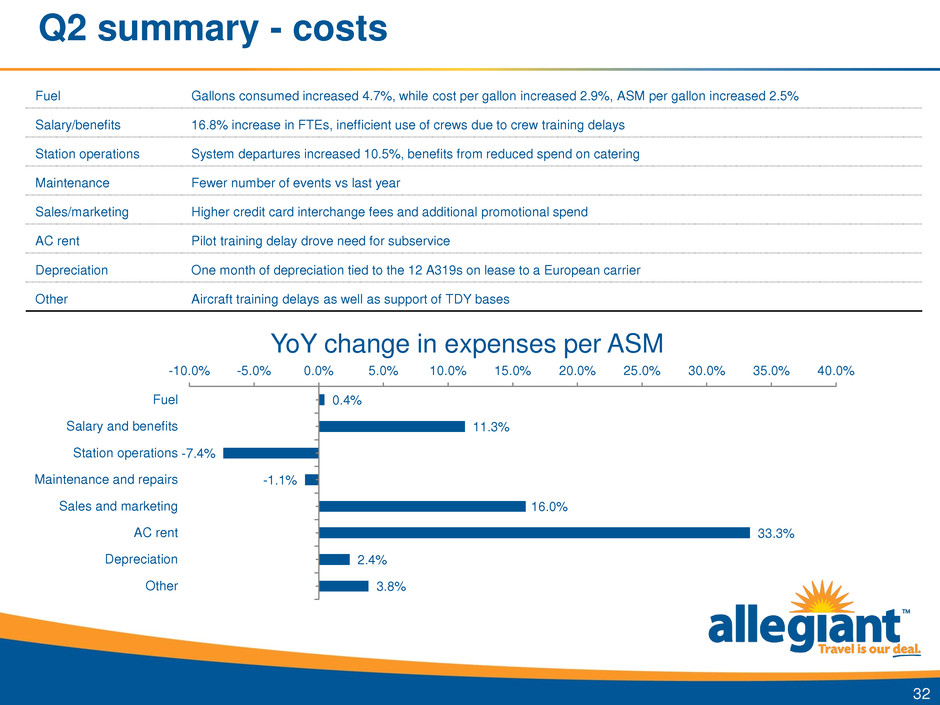
Q2 summary - costs 32 0.4% 11.3% -7.4% -1.1% 16.0% 33.3% 2.4% 3.8% -10.0% -5.0% 0.0% 5.0% 10.0% 15.0% 20.0% 25.0% 30.0% 35.0% 40.0% Fuel Salary and benefits Station operations Maintenance and repairs Sales and marketing AC rent Depreciation Other YoY change in expenses per ASM Fuel Gallons consumed increased 4.7%, while cost per gallon increased 2.9%, ASM per gallon increased 2.5% Salary/benefits 16.8% increase in FTEs, inefficient use of crews due to crew training delays Station operations System departures increased 10.5%, benefits from reduced spend on catering Maintenance Fewer number of events vs last year Sales/marketing Higher credit card interchange fees and additional promotional spend AC rent Pilot training delay drove need for subservice Depreciation One month of depreciation tied to the 12 A319s on lease to a European carrier Other Aircraft training delays as well as support of TDY bases
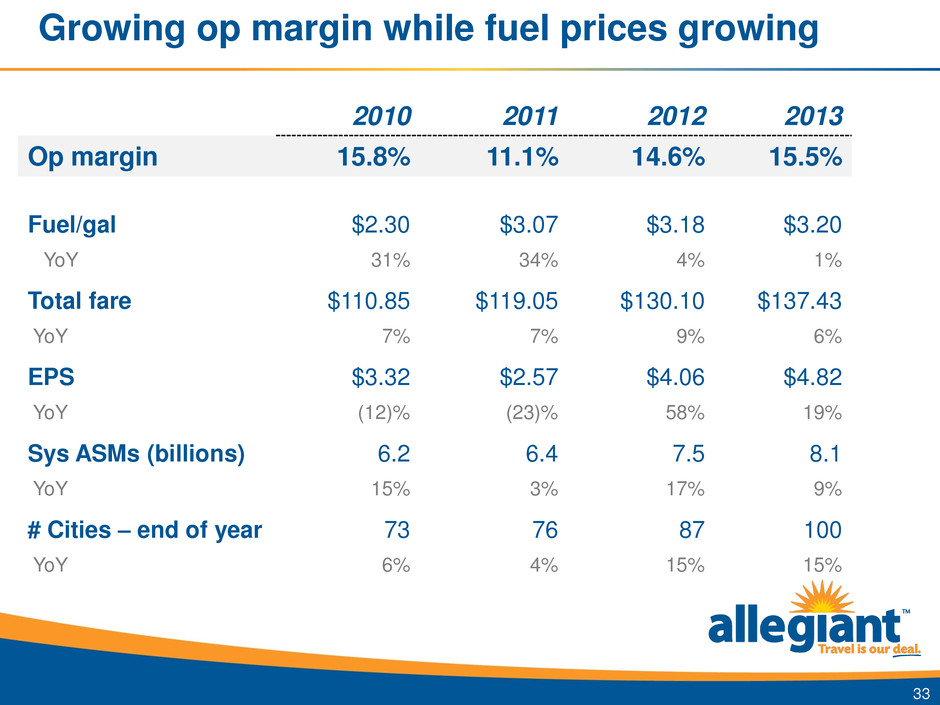
Growing op margin while fuel prices growing 2010 2011 2012 2013 Op margin 15.8% 11.1% 14.6% 15.5% Fuel/gal $2.30 $3.07 $3.18 $3.20 YoY 31% 34% 4% 1% Total fare $110.85 $119.05 $130.10 $137.43 YoY 7% 7% 9% 6% EPS $3.32 $2.57 $4.06 $4.82 YoY (12)% (23)% 58% 19% Sys ASMs (billions) 6.2 6.4 7.5 8.1 YoY 15% 3% 17% 9% # Cities – end of year 73 76 87 100 YoY 6% 4% 15% 15% 33
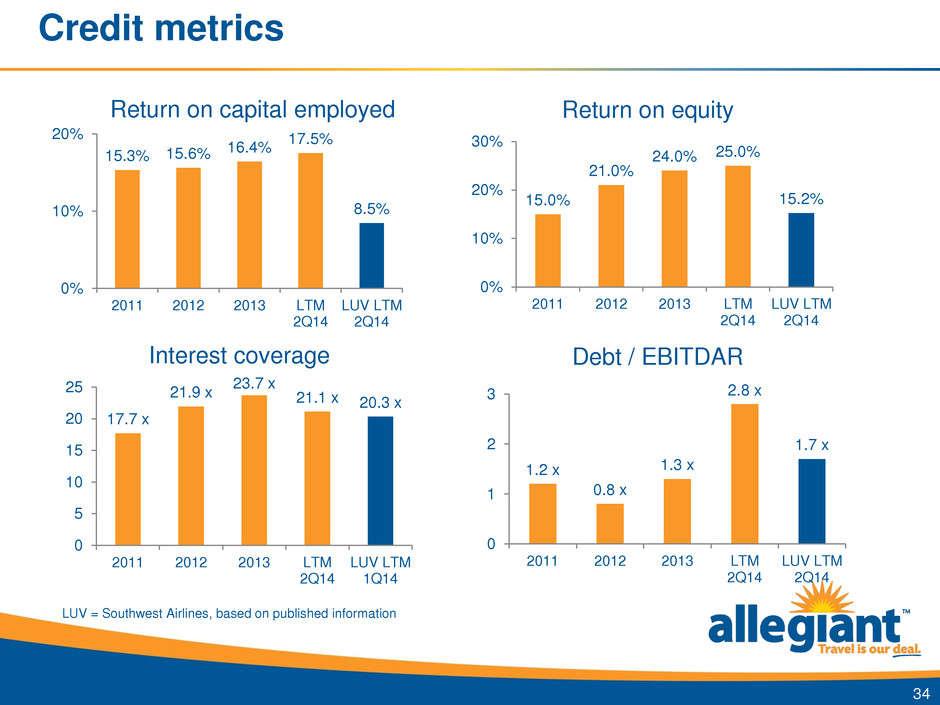
Credit metrics 15.3% 15.6% 16.4% 17.5% 8.5% 0% 10% 20% 2011 2012 2013 LTM 2Q14 LUV LTM 2Q14 34 Return on capital employed 15.0% 21.0% 24.0% 25.0% 15.2% 0% 10% 20% 30% 2011 2012 2013 LTM 2Q14 LUV LTM 2Q14 Return on equity 17.7 x 21.9 x 23.7 x 21.1 x 20.3 x 0 5 10 15 20 25 2011 2012 2013 LTM 2Q14 LUV LTM 1Q14 Interest coverage 1.2 x 0.8 x 1.3 x 2.8 x 1.7 x 0 1 2 3 2011 2012 2013 LTM 2Q14 LUV LTM 2Q14 Debt / EBITDAR LUV = Southwest Airlines, based on published information
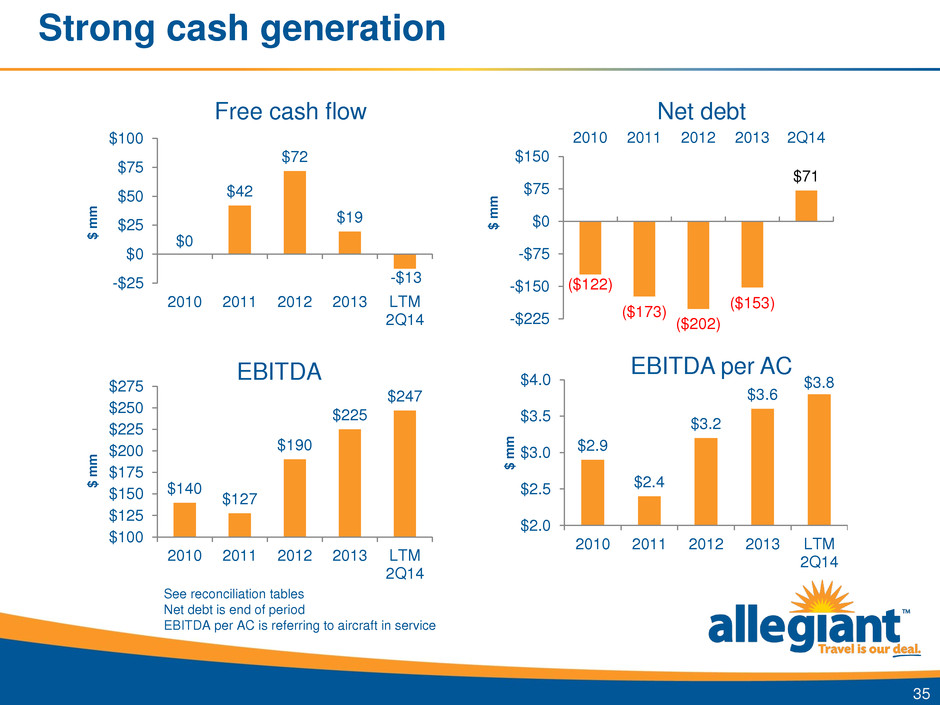
Strong cash generation $140 $127 $190 $225 $247 $100 $125 $150 $175 $200 $225 $250 $275 2010 2011 2012 2013 LTM 2Q14 $ m m 35 EBITDA $2.9 $2.4 $3.2 $3.6 $3.8 $2.0 $2.5 $3.0 $3.5 $4.0 2010 2011 2012 2013 LTM 2Q14 $ m m EBITDA per AC Free cash flow $0 $42 $72 $19 -$13 -$25 $0 $25 $50 $75 $100 2010 2011 2012 2013 LTM 2Q14 $ m m ($122) ($173) ($202) ($153) $71 -$225 -$150 -$75 $0 $75 $150 2010 2011 2012 2013 2Q14 $ m m Net debt See reconciliation tables Net debt is end of period EBITDA per AC is referring to aircraft in service
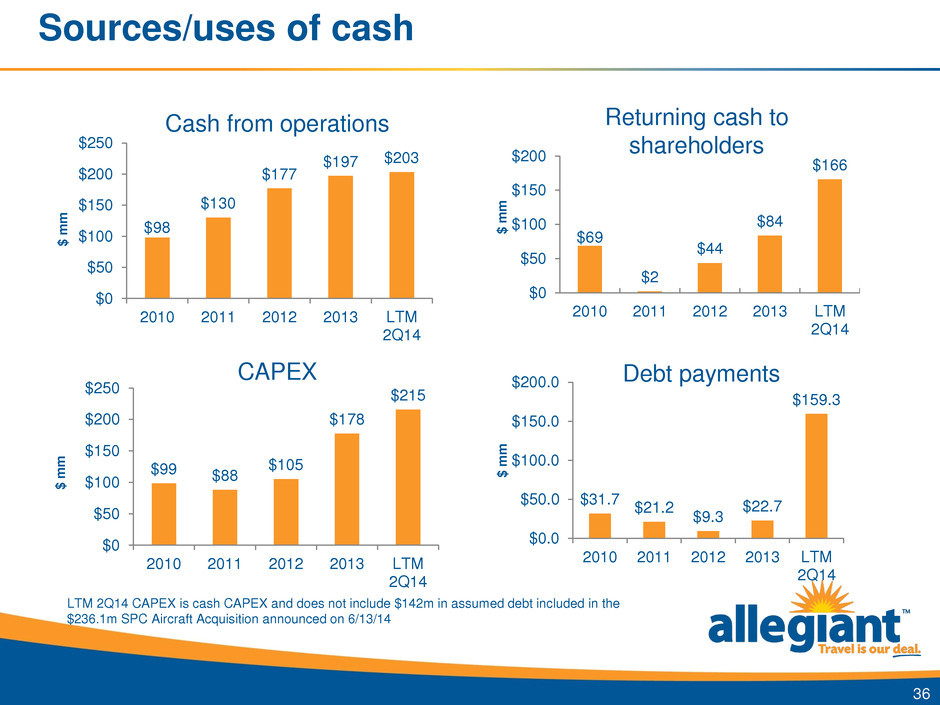
Sources/uses of cash $99 $88 $105 $178 $215 $0 $50 $100 $150 $200 $250 2010 2011 2012 2013 LTM 2Q14 $ m m 36 CAPEX $31.7 $21.2 $9.3 $22.7 $159.3 $0.0 $50.0 $100.0 $150.0 $200.0 2010 2011 2012 2013 LTM 2Q14 $ m m Debt payments Cash from operations $98 $130 $177 $197 $203 $0 $50 $100 $150 $200 $250 2010 2011 2012 2013 LTM 2Q14 $ m m $69 $2 $44 $84 $166 $0 $50 $100 $150 $200 2010 2011 2012 2013 LTM 2Q14 $ m m Returning cash to shareholders LTM 2Q14 CAPEX is cash CAPEX and does not include $142m in assumed debt included in the $236.1m SPC Aircraft Acquisition announced on 6/13/14
