Attached files
| file | filename |
|---|---|
| 8-K - 8-K - PINNACLE WEST CAPITAL CORP | a14-18595_18k.htm |
Exhibit 99.1
|
|
DELIVERING SUPERIOR SHAREHOLDER VALUE Investor Meetings | August 12-13, 2014 |

|
|
FORWARD LOOKING STATEMENTS This presentation contains forward-looking statements based on current expectations, including statements regarding our earnings guidance and financial outlook and goals. These forward-looking statements are often identified by words such as “estimate,” “predict,” “may,” “believe,” “plan,” “expect,” “require,” “intend,” “assume” and similar words. Because actual results may differ materially from expectations, we caution you not to place undue reliance on these statements. A number of factors could cause future results to differ materially from historical results, or from outcomes currently expected or sought by Pinnacle West or APS. These factors include, but are not limited to: our ability to manage capital expenditures and operations and maintenance costs while maintaining reliability and customer service levels; variations in demand for electricity, including those due to weather, the general economy, customer and sales growth (or decline), and the effects of energy conservation measures and distributed generation; power plant and transmission system performance and outages; competition in retail and wholesale power markets; regulatory and judicial decisions, developments and proceedings; new legislation or regulation, including those relating to environmental requirements, nuclear plant operations and potential deregulation of retail electric markets; fuel and water supply availability; our ability to achieve timely and adequate rate recovery of our costs, including returns on debt and equity capital; our ability to meet renewable energy and energy efficiency mandates and recover related costs; risks inherent in the operation of nuclear facilities, including spent fuel disposal uncertainty; current and future economic conditions in Arizona, particularly in real estate markets; the cost of debt and equity capital and the ability to access capital markets when required; environmental and other concerns surrounding coal-fired generation; volatile fuel and purchased power costs; the investment performance of the assets of our nuclear decommissioning trust, pension, and other postretirement benefit plans and the resulting impact on future funding requirements; the liquidity of wholesale power markets and the use of derivative contracts in our business; potential shortfalls in insurance coverage; new accounting requirements or new interpretations of existing requirements; generation, transmission and distribution facility and system conditions and operating costs; the ability to meet the anticipated future need for additional baseload generation and associated transmission facilities in our region; the willingness or ability of our counterparties, power plant participants and power plant land owners to meet contractual or other obligations or extend the rights for continued power plant operations; technological developments affecting the electric industry; and restrictions on dividends or other provisions in our credit agreements and ACC orders. These and other factors are discussed in Risk Factors described in Part I, Item 1A of the Pinnacle West/APS Annual Report on Form 10-K for the fiscal year ended December 31, 2013 and in Part II, Item 1A for the Pinnacle West/APS Quarterly Report on Form 10-Q for the quarter ended June 30, 2014, which you should review carefully before placing any reliance on our financial statements, disclosures or earnings outlook. Neither Pinnacle West nor APS assumes any obligation to update these statements, even if our internal estimates change, except as required by law. Delivering Superior Shareholder Value |

|
|
VALUE PROPOSITION Experienced Management Team Driving Focused Strategy Maintaining focus on core electric utility business Delivering long-term value Creating a sustainable energy future for Arizona and the communities we serve Driving cost management discipline through increased transparency and accountability Leverage to Arizona Economic Recovery Arizona’s long-term growth fundamentals remain largely intact; supportive of more traditional growth patterns 2-3x the national average Executing on Operational Excellence Customer Satisfaction: Top decile in J.D. Power Survey Reliability: Customer outage time continues to trend in top quartile Safety: 2013 was safest year on record, sixth straight year of improvement Palo Verde continues record levels of electricity production Delivering on Achievable Long-Term Targets Consolidated earned ROE of at least 9.5% (9.9% in 2012 and 2013) Rate base growing at 6-7% through 2018 Manageable dividend growth of 4% Strong investment-grade credit ratings |
|
|
PINNACLE WEST: WHO WE ARE We are a vertically integrated, regulated electric utility in the growing southwest U.S. NYSE Ticker PNW Market Cap* $6 Billion Enterprise Value* $9.5 Billion Dividend Yield* 4% Consolidated Assets $13.7 Billion Principal Subsidiary Arizona’s largest and longest-serving electric utility Regulated utility provides stable, regulated earnings and cash flow base for Pinnacle West Service Territory 1.2 million customer accounts (89% residential) 34,646 square miles Peak Demand – ~7,000 MW (All time of 7,236 MW in July 2006) Nearly 6,400 MW of owned or leased capacity (~9,400 MW with long-term contracts); including 29.1% interest in Palo Verde Nuclear Generating Station, the largest in the United States 2013 Retail Sales: 28,088 GWh Operating Revenues: $3.2 Billion Residential 47% 52% Commercial 44% 42% Industrial 8% 6% Other < 1% < 1% * As of July 31, 2014 |

|
|
LEADERSHIP TEAM Our top executives have more than 100 combined years of creating shareholder value in the energy industry Don Brandt Chairman & CEO Mark Schiavoni EVP & Chief Operating Officer Jeff Guldner SVP Customers & Regulation Randy Edington EVP & Chief Nuclear Officer |
|
|
ARIZONA ECONOMIC INDICATORS Nonresidential Building Vacancy – Metro Phoenix Single Family & Multifamily Housing Permits Maricopa County Home Prices – Metro Phoenix Value Relative to Jan ‘05 Vacancy Rate Office Retail Job Growth (Total Nonfarm) - Arizona YoY Change E Q2 Q2 Apr |
|
|
ARIZONA ECONOMY – HOMEBUILDERS AGREE PHOENIX HAS SOLID LONG-TERM OUTLOOK “I am bullish on Phoenix over the long termI believe that going into 2015 we're going to experience a more normal market in Arizona after things get more in balance.” “We remain confident in the long-term growth of the opportunities in Arizona.” “Phoenix is a great place to live, and we're going to see growth there going forward.” “Overall, we remain positive on the Phoenix market and continue to believe it possesses strong market fundamentals.” |
|
|
CUSTOMER GROWTH Annual Growth Customer growth drives 85% of retail sales (excluding impacts of customer conservation, energy efficiency and distributed renewable generation initiatives) Retail customer growth to average about 2.5% annually 2014-2016 |
|
|
RETAIL SALES GROWTH (WEATHER-NORMALIZED) YoY Retail Sales Before Customer Programs Energy Efficiency & Customer Conservation Distributed Generation Weather-normalized retail sales growth about 1% for 2014-2016 after impacts of energy efficiency, customer conservation and distributed renewable generation initiatives (excluding Lost Fixed Cost Recovery) Distributed Generation (DG) Impact DG makes up 0.5% (or less) of the negative impact to retail sales growth as shown in the chart; equates to approximately 60 GWh out of our total retail sales of over 28,000 GWh Average residential rooftop solar system produces 10,000 – 12,000 KWh per year (average metro-Phoenix customer’s usage is nearly 15,000 KWh) |

|
|
Cumulative savings from energy efficiency programs must be equivalent to 22% of annual retail sales by 2020 Annual milestones in place to measure progress toward cumulative 2020 goal 9.5% by 2015 22% by 2020 ARIZONA’S RENEWABLE RESOURCE AND ENERGY EFFICIENCY STANDARDS Portion of retail sales to be supplied by renewable resources 5% by 2015 15% by 2025 Distributed energy component 30% of total requirement Energy Efficiency Requirements Renewable Energy (RES) Requirements APS on track to approximately double 2015 requirement APS on track to meet target |
|
|
OPERATIONAL EXCELLENCE Palo Verde Palo Verde has exceeded 30 million megawatt-hours annual production 9 times – the only U.S. plant to ever do so. Safety 2013 lowest number of recordable injuries in company history. Customer Satisfaction Ranked 5th highest nationally among 54 large investor-owned electric utilities in 2014 J.D. Power residential customer survey. Lowering Outage Time Per Customer Top quartile in industry over past several years. Average Outage Minutes/Year Million Megawatt Hours Rating Industry Average APS 2013 |
|
|
RESOURCE PLANNING* Existing Owned Resources Existing Contracts Resource Planning Requirement Load Requirement Including Reserves MW Coal Nuclear RE + DE EE Composition of Energy Mix by Resource Note: RE = Renewable Energy; DE = Distributed Energy; EE = Energy Efficiency *Data shown is based on 2014 Integrated Resource Plan filed April 1, 2014. |
|
|
CAPITAL EXPENDITURES 80% of capital expenditures are recovered through rate adjustors (40%) and depreciation cash flow (40%) ($ Millions) $931 $1,026 2014 – 2016 as disclosed in Second Quarter 2014 Form 10-Q Distribution Transmission Renewable Generation Environmental Traditional Generation Projected $1,263 |
|
|
On December 30, 2013, APS and Southern California Edison (“SCE”) completed previously announced transaction whereby APS agreed to purchase SCE’s 48% interest in Units 4 and 5 of Four Corners Final purchase price: $182 million Estimated environmental compliance: $350 million, primarily in 2016-2017 APS will continue to operate Four Corners and now has total interest of about 970 MW FOUR CORNERS POWER PLANT APS filed Four Corners-specific revenue requirement on docket 11-0224 APS notified EPA that the Four Corners participants selected the BART alternative requiring APS to retire Units 1-3 by January 1, 2014 and install and operate Selective Catalytic Reduction (“SCR”) control technology on Units 4-5 by July 31, 2018 Next Steps: ACC decision on revenue requirement Hearings began on August 4th (Direct and Rebuttal testimony completed in June and July) ACC Decision expected in Q4 2014 with rates in effect immediately following decision EPA permitting process - construction expected to begin by early 2016 after approval of final EPA permit |
|
|
OCOTILLO POWER PLANT (TEMPE, AZ) Ocotillo modernization project will maintain valley grid reliability and increase APS’s generating capacity by 290 MW Maintains system reliability through retirement of aging steam units Replacement units meet need for increased portfolio responsiveness Aids integration of renewables Estimated project cost of $600M - $700M (2015 – 2018) Expected timeline: Early 2014: Stakeholder engagement and initiate permitting activities July 31, 2014: ACC Certificate of Environmental Compatibility application filed Fall 2014: ACC Siting Committee hearings 2016: Begin construction Q2 2018: Project completion Site Capacity (MW) Current Future (2) Westinghouse 110 MW steam units - constructed 1960 220 Retire (2) Westinghouse 55 MW combustion turbines - constructed 1972/73 110 110 Install (5) GE 102 MW combustion turbines 0 510 Total 330 620 Net site capacity increased by 290 MW |
|
|
10-Year Transmission Plan filed January 2014 (115 kV and above) $496 million of transmission investment 275 miles of new lines Includes Hassayampa-North Gila (HANG2) ~110 miles; 500 kV Construction started March 2013 Estimated in-service mid 2015 Projects to deliver renewable energy approved by ACC Transmission investment diversifies regulatory risk Constructive regulatory treatment FERC formula rates and retail adjustor APS TRANSMISSION Strategic transmission investment is essential to maintain reliability and deliver diversified resources to customers Legend Planned lines Existing lines Proposed Delaney-Colorado River line (PNW) Solar potential area Wind potential area |
|
|
PNW TRANSMISSION BRIGHT CANYON ENERGY Pinnacle West subsidiary formed to pursue new growth opportunities JOINT VENTURE WITH MIDAMERICAN TRANSMISSION Bright Canyon formed TransCanyon, a 50/50 JV with MidAmerican Transmission, to pursue transmission opportunities in the western United States DELANEY-COLORADO RIVER TRANSMISSION LINE New 500kV line between the planned Delaney substation near Palo Verde Generating Station in Arizona and the Colorado River substation, located just west of Blythe, California In July 2014, California ISO Board approved DCR, which initiates a competitive bidding process to begin in August 2014 with a winner selected by mid-2015 (project expected in service in 2020) |
|
|
Community-scale photovoltaic solar plants to be owned by APS Constructive rate recovery through RES until included in base rates 118 MW in commercial operation to date; 150 MW by end of 2014 Commitments to date: 170 MW; $690 million estimated capital investment AZ SUN PROGRAM Owning solar resources makes sense for our customers and the environment and provides earnings growth potential Name Location Capacity Developer Actual or Target COD* Paloma Gila Bend, AZ 17 MW First Solar September 2011 Cotton Center Gila Bend, AZ 17 MW Solon October 2011 Hyder Phase 1 Hyder, AZ 11 MW SunEdison October 2011 Hyder Phase 2 Hyder, AZ 5 MW SunEdison February 2012 Chino Valley Chino Valley, AZ 19 MW SunEdison November 2012 Yuma Foothills Phase 1 Yuma, AZ 17 MW AMEC June 2013 Yuma Foothills Phase 2 Yuma, AZ 18 MW AMEC December 2013 Hyder II Hyder, AZ 14 MW McCarthy December 2013 Gila Bend Gila Bend, AZ 32 MW Black & Veatch August 2014 City of Phoenix Buckeye, AZ 10 MW TBD Mid 2015 Luke Air Force Base Glendale, AZ 10 MW TBD Mid 2015 Total 170 MW As of June 30, 2014 * In-Service or Commercial Operation Date |
|
|
APS-OWNED ROOFTOP SOLAR PROPOSAL APS proposed an option to the ACC to convert 20 MW of AZ Sun into APS-owned residential rooftop solar, equates to approximately 3,000 customers Requesting ACC review within two months (September) to ensure compliance of renewable energy commitments by the end of 2015 Benefits: Provides an alternative for those who cannot afford solar or do not want a lease Participating customers receive monthly credit on their bill through the 20-year life Support and partner with Arizona solar installers TBD APS has track record through the Flagstaff Community Power Project Launched in 2010 1.5 MW of distributed energy from solar panels owned by APS, spread across: 125 residential rooftops Schools Neighborhood-scale solar power plant |
|
|
PNW Consolidated goal to earn at least 9.5% annually CONSOLIDATED FINANCIAL OUTLOOK Earned ROE * Continuing operations Projected Future dividends subject to declaration at Board of Director’s discretion Annual Dividend Growth Approx. 4% Goal |
|
|
2014 KEY DATES Docket # Q1 Q2 Q3 Q4 Key Regulatory Filings Lost Fixed Cost Recovery 11-0224 Jan 15 Transmission Cost Adjustor May 15 Renewable Energy Surcharge Jul 1 10-Year Transmission Plan (Annual) 13-0002 Jan 31 2014 Integrated Resource Plan (Biennial) 13-0070 Apr 1 Net Metering (Decision No. 74202) 13-0248 Quarterly Installation Filings 13-0248 Apr 15 Jul 15 Oct 15 Value and Cost of Distributed Generation 14-0023 May 7 Jun 20 TBD TBD Innovations and Technology Development Docket Workshops – Substantive (a), Response (b) 13-0375 Mar 20 (1a) Apr 25 (1b) May 28 (2a) Jun 25 (2b) Jul 28 (3a) Aug 18 (3b) Four Corners Rate Rider 11-0224 Testimony Jun – Jul; Hearings begin Aug ACC Open Meeting TBD Energy Efficiency workshops – (a) Cost effectiveness, (b) Cost recovery and (c) EE standards/rulemaking 13-0214 Mar 18 (a) Mar 31 (b) Apr 17 (c) ACC Open Meetings (Held Monthly) - Aug: Possible vote to remove requirement that APS file its next rate case in June 2015 Elections - May 28: Nominations Aug 26: Primary Nov 4: General Arizona State Legislature - In Session Jan 13 – Apr 24 (Adjourned) Annual Shareholder Meeting - May 21 |
|
|
KEY RATE DESIGN PRINCIPLES Smarter rates for smarter grid Arizona Public Service, Tucson Electric Power, Residential Utility Consumer Office and Arizona solar developers filed a joint letter with the ACC agreeing on the following rate design principles: Customer-focused Meaningful options Meet lifestyle needs Allow customers to choose among technologies Forward-thinking Maintain reliable service Enable technology innovation Put all technologies on a level playing field Affordable & Fair For all of our 1.2 million customers Transparent Accurately reflect services and products customers use Rate design changes needed to align fixed costs and revenue |

|
|
ARIZONA CORPORATION COMMISSION November 2014 elections will determine two seats; elected to serve four-year term Bob Stump (R)* Chairman Brenda Burns (R) Gary Pierce (R)* Terms To January 2015 Terms To January 2017 Susan Bitter Smith (R) Bob Burns (R) Incumbents New Commissioners * Term limited |
|
|
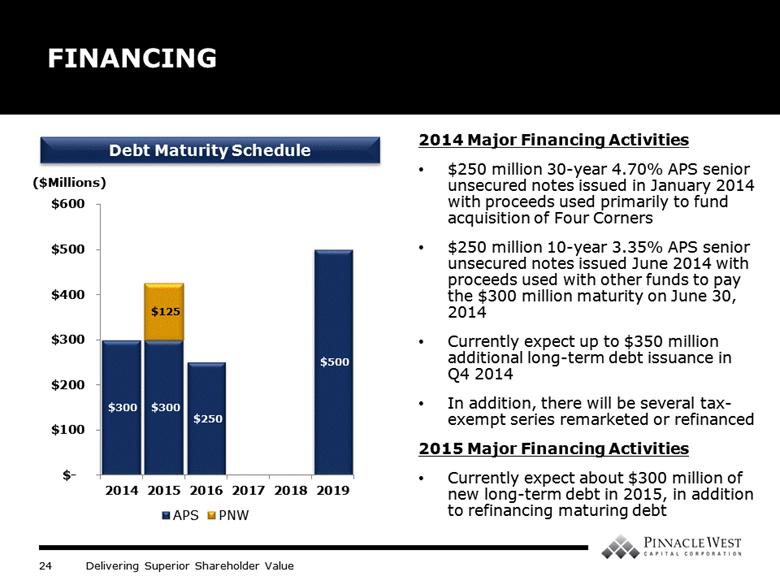
FINANCING ($Millions) Debt Maturity Schedule 2014 Major Financing Activities $250 million 30-year 4.70% APS senior unsecured notes issued in January 2014 with proceeds used primarily to fund acquisition of Four Corners $250 million 10-year 3.35% APS senior unsecured notes issued June 2014 with proceeds used with other funds to pay the $300 million maturity on June 30, 2014 Currently expect up to $350 million additional long-term debt issuance in Q4 2014 In addition, there will be several tax-exempt series remarketed or refinanced 2015 Major Financing Activities Currently expect about $300 million of new long-term debt in 2015, in addition to refinancing maturing debt |
|
|
APPENDIX |
|
|
CREDIT RATINGS APS Parent Corporate Credit Ratings Moody’s A3 Baa1 S&P A- A- Fitch BBB+ BBB+ Senior Unsecured Moody’s A3 - S&P A- - Fitch A- - Outlook Moody’s Stable Stable S&P Stable Stable Fitch Stable Stable We are disclosing credit ratings to enhance understanding of our sources of liquidity and the effects of our ratings on our costs of funds. Investment Grade Credit Ratings |
|
|
OPERATIONS & MAINTENANCE Our goal is to keep consolidated O&M growth at or below retail sales growth levels Note: Pinnacle West O&M for 2009-2014E: $10M, $9M, $8M, $11M, $27M and $15M, respectively. * 2013 includes $9M related to the closure of Four Corners Units 1, 2 and 3 deferred for regulatory recovery in depreciation. **Renewable energy and demand side management expenses are offset by revenue adjustors. $790 - $810 ($ Millions) $788* |
|
|
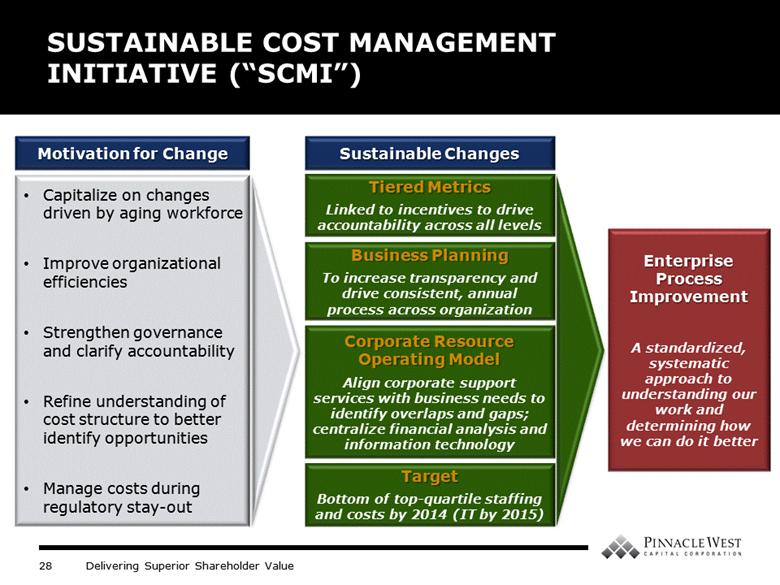
Motivation for Change SUSTAINABLE COST MANAGEMENT INITIATIVE (“SCMI”) Capitalize on changes driven by aging workforce Improve organizational efficiencies Strengthen governance and clarify accountability Refine understanding of cost structure to better identify opportunities Manage costs during regulatory stay-out Sustainable Changes Tiered Metrics Linked to incentives to drive accountability across all levels Business Planning To increase transparency and drive consistent, annual process across organization Corporate Resource Operating Model Align corporate support services with business needs to identify overlaps and gaps; centralize financial analysis and information technology Target Bottom of top-quartile staffing and costs by 2014 (IT by 2015) Enterprise Process Improvement A standardized, systematic approach to understanding our work and determining how we can do it better |
|
|
APS IS A LEADER IN SOLAR We are committed to making Arizona the solar capital of America 3rd of all U.S. utilities for solar energy installed in 2013 (410 MW) 4th for new solar installed in 2013 (368 watts/customer) 4th for overall solar capacity (740 MW) 5th for overall solar capacity per customer (654 watts/customer) APS 2013 Rankings * AZ Sun – Includes 32 MW Gila Bend project; excludes 20 MW of approved projects which are expected online in 2015; includes 4 MW of other APS owned solar * DG includes 15 MW of APS owned DG = Distributed Generation (PV only) PPA 310 MW |
|
|
Customers with rooftop solar systems do not pay for all of the electric services they use (i.e. rooftop customers still need support from the grid 24 hours a day) These unpaid costs are then paid, through higher rates, by non-rooftop solar customers The issue will get bigger over time as applications and installs continue to increase NET METERING Rooftop solar customers still use the grid 24 hours a day TYPICAL GRID INTERACTION FOR ROOFTOP SOLAR |
|
|
As of June 30, 2014, over 26,800 residential grid-tied solar photovoltaic (PV) systems have been installed in APS’s service territory Q2 2014 applications totaled approximately 2,000, in line with Q2 2013 APS anticipates that it will be in compliance with the Renewable Energy Standard (RES) residential DG requirements through mid-2017 and with RES non-residential through 2021 RESIDENTIAL PV APPLICATIONS Residential rooftop solar applications continue to trend higher in 2014 |
|
|
EMERGING TECHNOLOGIES RELY ON THE GRID All of these technologies are dependent on the grid Electric Vehicles Battery Storage Fuel Cells Home Energy Management Microgrids Rooftop Solar Electrical System |
|
|
OPERATIONAL CHALLENGES The grid provides real-time voltage and power needed to start air conditioners and other motors loads Steep ramp rate of backup generation Instant variability Voltage control at distribution level |
|
|
APS 5-YEAR DEPLOYMENT PLAN Substation Health Monitoring Integrated Volt/VAR Control (IVVC) Communicating Fault Indicators (CFI) Synchrophasors (WISP) Supervisory Controlled Switches Advanced Distribution Management System Smart Meters Energy Management System (EMS) Upgrades Strategic Fiber Deploying Over 5,000 Field Devices Investing $170 million 2013 Benefits include over 1,000,000 customer outage minutes avoided |
|
|
Mechanism Adopted / Last Adjusted Description Power Supply Adjustor (“PSA”) April 2005 / February 2014 Recovers variance between actual fuel and purchased power costs and base fuel rate Includes forward-looking, historical and transition components Renewable Energy Surcharge (“RES”) May 2008 / January 2014 Recovers costs related to renewable initiatives Collects projected dollars to meet RES targets Provides incentives to customers to install distributed renewable energy Demand-Side Management Adjustment Clause (“DSMAC”) April 2005 / March 2014 Recovers costs related to energy efficiency and DSM programs above $10 million in base rates Provides performance incentive to APS for net benefits achieved Provides rebates and other incentives to participating customers Environmental Improvement Surcharge (“EIS”) July 2007 / April 2014 Allows recovery of certain carrying costs for government-mandated environmental capital projects Capped at $5 million annually Transmission Cost Adjustor (“TCA”) April 2005 / June 2014 Recovers FERC-approved transmission costs related to retail customers Resets annually as result of FERC Formula Rate process (see below) FERC Formula Rates 2008 / June 2014 Recovers transmission costs based on historical costs per FERC Form 1 and certain projected data Lost Fixed Cost Recovery (“LFCR”) July 2012 / March 2014 Mitigates loss of portion of fixed costs related to ACC-approved energy efficiency and distributed renewable generation programs REGULATORY MECHANISMS We have achieved a more supportive regulatory structure and improvements in cost recovery timing |
|
|
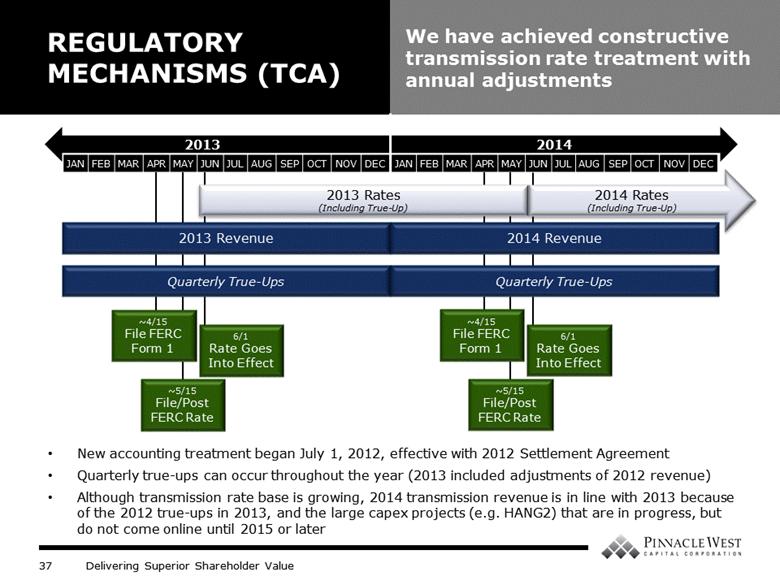
FERC Formula Rates adopted in 2008 Adjusted annually with 10.75% allowed ROE Based on FERC Form 1 and projected closings Update filed each April Annual rate true-up compares projected revenue requirement to actual, with variance incorporated into next annual update Retail portion flows through ACC Transmission Cost Adjustor (TCA) REGULATORY MECHANISMS (TCA) We have achieved constructive transmission rate treatment with annual adjustments As Filed 2014 2013 2012 Annual Rate Increase Rate Effective Date Annual Rate Increase Rate Effective Date Annual Rate Increase Rate Effective Date Retail Portion (TCA) $5 M 6/1/2014 $21 M 6/1/2013 $18 M 8/1/2012 Wholesale Portion $1 M 6/1/2014 $5 M 6/1/2013 $(2) M 6/1/2012 Total Increase (Decrease) $6 M $26 M $16 M Equity Ratio 58% 57% 55% Rate Base (Year-End) $1.3 B $1.2 B $1.2 B Test Year 2013 2012 2011 |
|
|
6/1 Rate Goes Into Effect REGULATORY MECHANISMS (TCA) We have achieved constructive transmission rate treatment with annual adjustments 2013 2014 JAN FEB MAR APR MAY JUN JUL AUG SEP OCT NOV DEC JAN FEB MAR APR MAY JUN JUL AUG SEP OCT NOV DEC 6/1 Rate Goes Into Effect ~5/15 File/Post FERC Rate ~4/15 File FERC Form 1 ~5/15 File/Post FERC Rate ~4/15 File FERC Form 1 New accounting treatment began July 1, 2012, effective with 2012 Settlement Agreement Quarterly true-ups can occur throughout the year (2013 included adjustments of 2012 revenue) Although transmission rate base is growing, 2014 transmission revenue is in line with 2013 because of the 2012 true-ups in 2013, and the large capex projects (e.g. HANG2) that are in progress, but do not come online until 2015 or later 2013 Revenue 2013 Rates (Including True-Up) 2014 Rates (Including True-Up) 2014 Revenue Quarterly True-Ups Quarterly True-Ups |
|
|
Lost Fixed Cost Recovery (LFCR) was implemented as part of the July 2012 settlement Estimated to offset 30-40% of revenues lost due to ACC-mandated energy efficiency (EE) and distributed renewable generation (DG) initiatives Annual filing by January 15th each year with new rates in effect March 1st, based on the EE and DG savings from the preceding calendar year Subject to annual cap of 1% of company’s total revenues Revenue accrued each month as it is earned, creating a regulatory asset since the rates lag REGULATORY MECHANISMS (LFCR) Lost Fixed Cost Recovery 2013 ACC Order 2014 ACC Order Rates Effective March 1, 2013 March 1, 2014 LFCR Rate 0.2% 0.95% Residential rate per lost kWh $0.031 $0.031 Non-residential rate per lost kWh $0.023 $0.023 LFCR Adjustment (Annualized) $5.1 Million $25.4 Million LFCR Revenue (Accrued in prior year) $7.3 Million (1) $22.6 Million (1) Represents six months in 2012. |
|
|
GENERATION PORTFOLIO* Fuel/Plant Location Units Dispatch COD Ownership Interest1 Net Capacity (MW) NUCLEAR 1,146 MW Palo Verde Wintersburg, AZ 1-3 Base 1986-1989 29.1% 1,146 COAL 1,932 MW Cholla Joseph City, AZ 1-3 Base 1962-1980 100 647 Four Corners Farmington, NM 4, 5 Base 1969-1970 63 970 Navajo Page, AZ 1-3 Base 1974-1976 14 315 GAS/OIL COMBINED CYCLE 1,871 MW Redhawk Arlington, AZ 1, 2 Intermediate 2002 100 984 West Phoenix Phoenix, AZ 1-5 Intermediate 1976-2003 100 887 GAS/OIL STEAM TURBINES 220 MW Ocotillo Tempe, AZ 1, 2 Peaking 1960 100 220 GAS/OIL COMBUSTION TURBINES 1,088 MW Sundance Casa Grande, AZ 1-10 Peaking 2002 100 420 Yucca Yuma, AZ 1-6 Peaking 1971-2008 100 243 Saguaro Red Rock, AZ 1-3 Peaking 1972-2002 100 189 West Phoenix Phoenix, AZ 1, 2 Peaking 1972-1973 100 110 Ocotillo Tempe, AZ 1, 2 Peaking 1972-1973 100 110 Douglas Douglas, AZ 1 Peaking 1972 100 16 SOLAR 137 MW Hyder Hyder, AZ - As Available 2011-2012 100 16 Hyder II Hyder, AZ - As Available 2013 100 14 Paloma Gila Bend, AZ - As Available 2011 100 17 Cotton Center Gila Bend, AZ - As Available 2011 100 17 Chino Valley Chino Valley, AZ - As Available 2012 100 19 Yuma Foothills Yuma, AZ - As Available 2013 100 35 Distributed Energy Multiple AZ Facilities - As Available Various 100 15 Various Multiple AZ Facilities - As Available 1996-2006 100 4 Total Generation Capacity 6,394 MW 1 Includes leased generation plants * As disclosed in 2013 Form 10-K |
|
|
PURCHASED POWER CONTRACTS* Fuel/Contract Location Owner/Developer Status1 PPA Signed COD Term (Years) Net Capacity (MW) SOLAR 310 MW Solana Gila Bend, AZ Abengoa IO Feb-2008 2013 30 250 RE Ajo Ajo, AZ Duke Energy Gen Svcs IO Jan-2010 2011 25 5 Sun E AZ 1 Prescott, AZ SunEdison IO Feb-2010 2011 30 10 Saddle Mountain Tonopah, AZ SunEdison IO Jan - 2011 2012 30 15 Badger Tonopah, AZ PSEG IO Jan-2012 2013 30 15 Gillespie Maricopa County, AZ Recurrent Energy IO Jan-2012 2013 30 15 WIND 289 MW Aragonne Mesa Santa Rosa, NM Ingifen Asset Mgmt IO Dec-2005 2006 20 90 High Lonesome Mountainair, NM Foresight / EME IO Feb-2008 2009 30 100 Perrin Ranch Wind Williams, AZ NextEra Energy IO Jul-2010 2012 25 99 GEOTHERMAL 10 MW Salton Sea Imperial County, CA Cal Energy IO Jan-2006 2006 23 10 BIOMASS 14 MW Snowflake Snowflake, AZ Novo Power IO Sep-2005 2008 15 14 BIOGAS 6 MW Glendale Landfill Glendale, AZ Glendale Energy LLC IO Jul-2008 2010 20 3 NW Regional Landfill Surprise, AZ Waste Management IO Dec-2010 2012 20 3 INTER-UTILITY 540 MW PacifiCorp Seasonal Power Exchange - PacifiCorp IO Sep-1990 1991 30 480 Not Disclosed Not Disclosed Not Disclosed IO May-2009 2010 10 60 HEAT RATE OPTIONS 650 MW Call Option - Not Disclosed IO Nov-2005 2007 8-9 500 Call Option - Not Disclosed IO Oct-2005 2007 10 150 CONVENTIONAL TOLLING 1,074 MW CC Tolling Not Disclosed Not Disclosed IO Mar-2006 2007 10 514 CC Tolling Not Disclosed Not Disclosed IO Aug-2007 2010 10 560 DEMAND RESPONSE 25 MW Demand Response Not Disclosed Not Disclosed IO Sep-2008 2010 15 25 WHOLESALE 90 MW Wholesale Contract Not Disclosed Not Disclosed IO Mar-2009 2010 5 90 Total Contracted Capacity 3,008 MW 1 UD = Under Development; UC = Under Construction; IO = In Operation * As disclosed in 2013 Form 10-K |