Attached files
| file | filename |
|---|---|
| 8-K - CURRENT REPORT - BOB EVANS FARMS INC | d774351d8k.htm |
| EX-99.2 - PRESS RELEASE - BOB EVANS FARMS INC | d774351dex992.htm |
 Transformed and
Ready to Grow
August 2014
Exhibit 99.1 |
 Important Additional Information
2
Bob Evans Farms Inc. (the “Company”), its directors and certain of its
executive officers are participants in the solicitation of proxies in
connection with the Company's 2014 Annual Meeting of Stockholders. The Company has filed a definitive proxy statement and
form of WHITE proxy card with the U.S. Securities and Exchange Commission (the
“SEC”) in connection with such solicitation of proxies from the
Company's stockholders. WE URGE INVESTORS TO READ THE DEFINITIVE PROXY STATEMENT
(INCLUDING ANY AMENDMENTS AND SUPPLEMENTS THERETO) AND ACCOMPANYING WHITE PROXY
CARD CAREFULLY AND IN THEIR ENTIRETY, BECAUSE THEY CONTAIN IMPORTANT
INFORMATION. Information regarding the names of the Company's directors and
executive officers and their respective interests in the Company by
security
holdings
or
otherwise,
is
set
forth
in
the
Company's
proxy
statement
for
its
2014
Annual
Meeting
of
Stockholders,
filed
with
the SEC on July 11, 2014. Stockholders will be able to obtain, free of charge,
copies of the definitive proxy statement (and amendments or supplements
thereto) and accompanying WHITE proxy card, and other documents filed with the SEC at the SEC's
website at www.sec.gov. In addition, copies will also be available at no charge at
the Investors section of the Company's website at
http://investors.bobevans.com/sec.cfm.
This document contains quotes and excerpts from certain previously published
material. Consent of the author and publication has not been sought or
obtained to use the material as proxy soliciting material. |
 Non-GAAP Financial Measures
The Company uses non-GAAP financial measures within this presentation. These
financial measures are used by management to monitor and
evaluate
the
ongoing
performance
of
the
Company.
The
Company
believes
that
the
additional
measures
are
useful
to
investors
for
financial analysis. However, non-GAAP measures are not in accordance with, nor
are they a substitute for, GAAP measures. Reconciliations of non-GAAP
financial measures to the most directly comparable GAAP financial measures are provided in the Appendix to this
presentation.
3 |
 4
I.
Introduction
–
The Fundamental Choice
II.
The Transformation of Bob Evans
III.
Our
Value
Creation
and
Growth
Plan
–
Prudent, Responsible and Focused
IV.
Sandell’s Demands –
Short-Sighted, Unsustainable and Not in the Best
Interests of All Stockholders
V.
Our Leadership –
Independent, Highly Qualified and Open-Minded
VI.
Conclusion –
Bob Evans: The Clear Choice
Appendix |
 I.
Introduction –
The Fundamental Choice |
 Executive Summary: Consider the Facts
6
The Bob Evans Board believes that:
o
We have transformed the business while returning over $800 million to shareholders
since FY07 (including over $250 million in FY14)
o
We have a clear plan for continued, sustainable value creation as we emerge from
this investment and transformation phase
o
Sandell’s
“plan”
of
financial
engineering
has
shifted
a
number
of
times
since
he
entered
the stock last year
o
Sandell’s agenda is not in the best interests of the Company or its
stockholders; it is a misleading attempt to generate short-sighted
profit with no guarantees o
Bob Evans’
current leadership is the right team to lead the Company and maximize
stockholder value
Our proposed Board structure would result in an open-minded Board with diverse, relevant
perspectives and a range of tenure and would include two Sandell nominees
Vote
for
Bob
Evans’
Nominees
on
the
WHITE
Card |
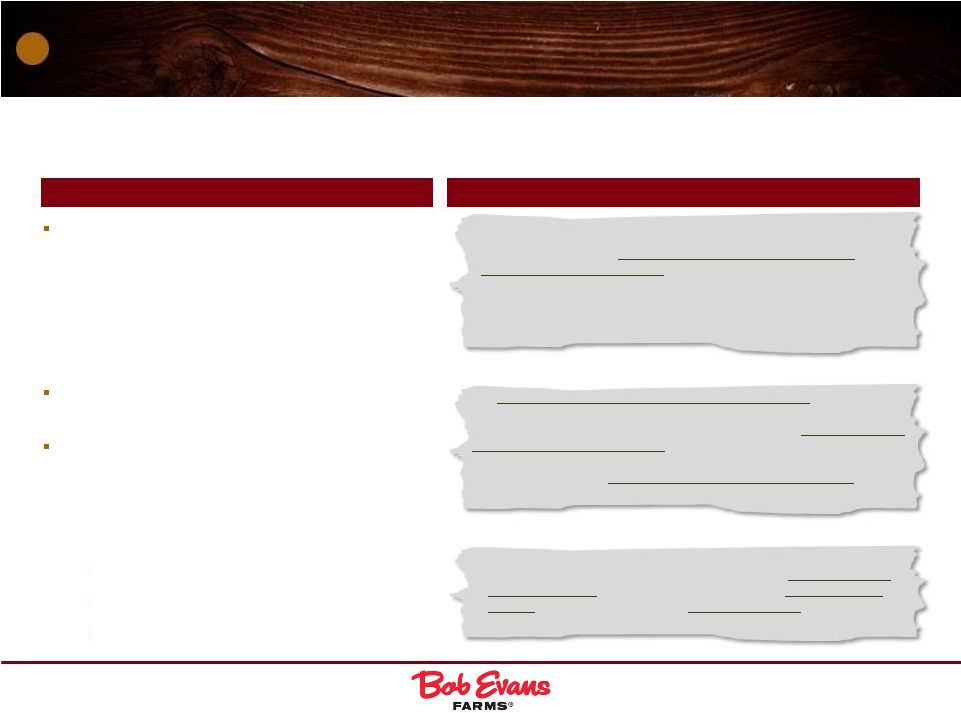
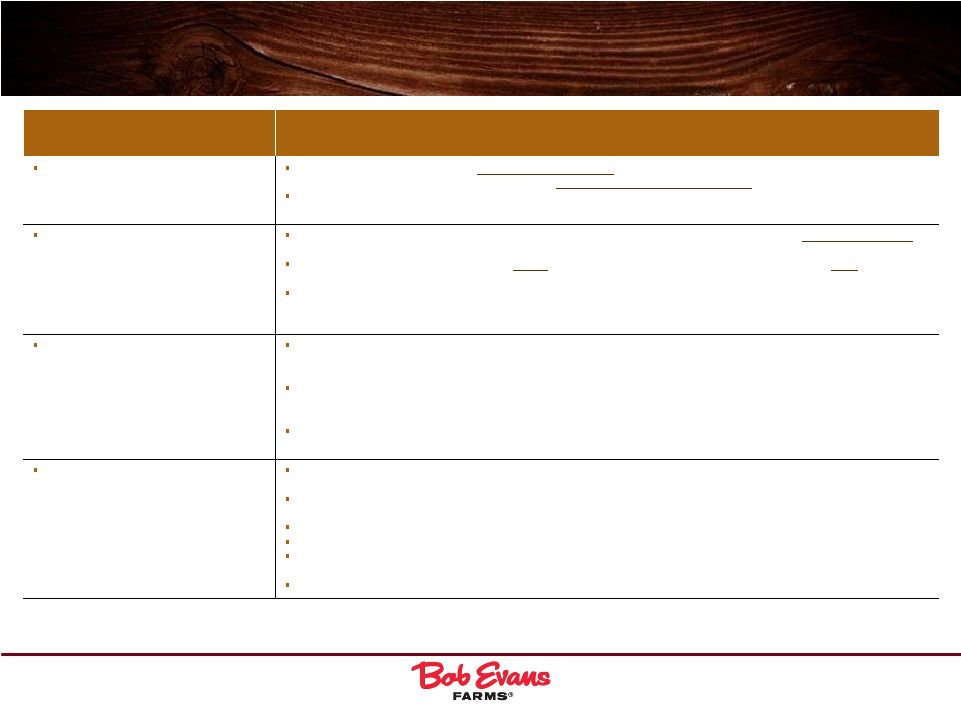
 Proactive Evaluation of the Business
As part of its commitment to drive stockholder value, the Bob Evans Board employs a
rigorous and disciplined process to continually review its business and
either grow, fix or exit assets
7
Bob Evans Restaurants (e.g., Farm Fresh Refresh, carryout
growth, new units and Bob Evans Express)
Bob Evans Foods (e.g., increased retail accounts & SKUs,
acquisition of Kettle Creations)
GROW
Elimination of Bob Evans Foods co-packer model to vertical integration
Sausage optimization
Transportation consolidation
Plant closures/consolidations
FIX
Closed or disposed of over $125 million of assets since
FY06 (e.g., Mimi’s Café)
Selected restaurant closures
Elimination of Direct Store Delivery asset intensive model
EXIT |
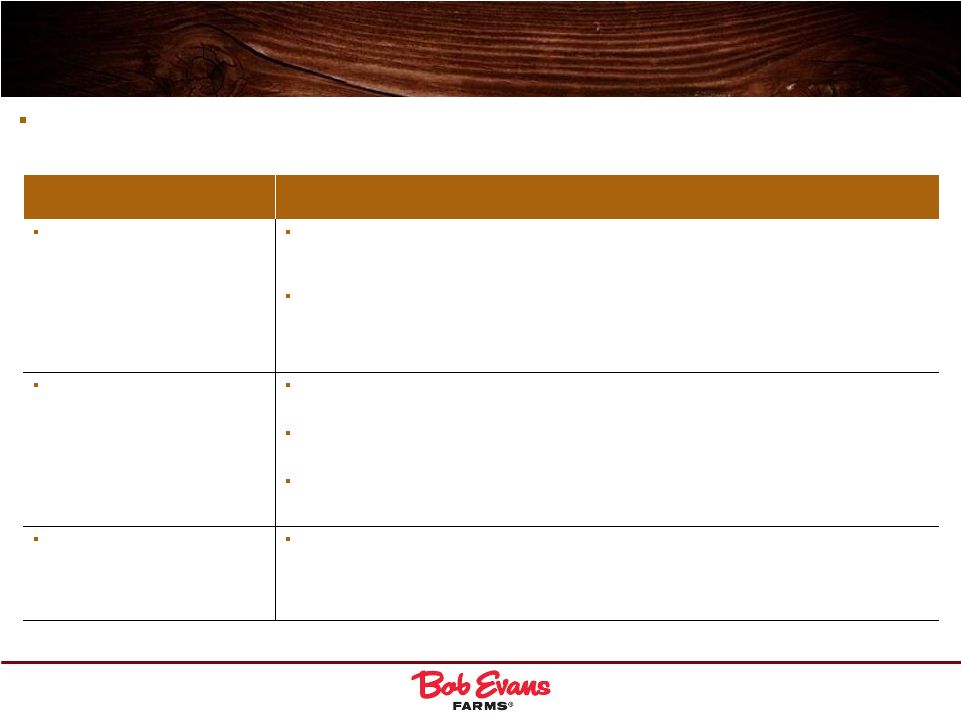
 The
Fundamental Choice 8
Continue to drive profitable growth of existing
businesses
Continue to employ balanced approach to
investment and return of meaningful capital to
stockholders
Regularly and proactively review strategy;
continually engage with stockholders
Sustainable, Disciplined,
Responsible, Open-Minded
Divest Bob Evans Foods now, before reaping
benefits of our transformational investments
Sell real estate, losing strategic control of assets
while burdening Bob Evans with significant and
escalating annual rents and increased leverage
Rapidly effect large leveraged share repurchase
Unsustainable,
Not in the Best Interest of All
Stockholders
The Board structure proposed by Bob Evans would result in a fully independent Board,
except for the CEO; a majority of the independent directors would be new to
the Board since 2012; and 5 of 11 independent directors would be new to the
Board this year, including two Sandell nominees The 2014 annual meeting presents stockholders with
a fundamental choice between what we believe to be two very different approaches:
|
 II.
The Transformation of
Bob Evans |
 Our
Vision 10
Make Our REGIONAL BRANDS
Powerful NATIONAL BRANDS
|
 Overview: Regional Brands, National Potential
11
Leading full-service Midwest-based restaurant
chain
561 restaurants, 19 states
Quality, home-style food and friendly service
All three day parts served (32% Breakfast, 38%
Lunch, 30% Dinner)
13% of sales are off-premise
Adjusted EBITDA (FY14): $106mm
FY14 AUV of $1.71mm
Vertically integrated side dish and sausage
manufacturing
Refrigerated side dishes
Breakfast convenience items (refrigerated and
frozen)
Pork sausage
Distributed through retail, BER restaurants and
external food service
Adjusted EBITDA (FY14): $28mm
Founded in 1948
Ticker: BOBE
Market capitalization: ~$1.1bn
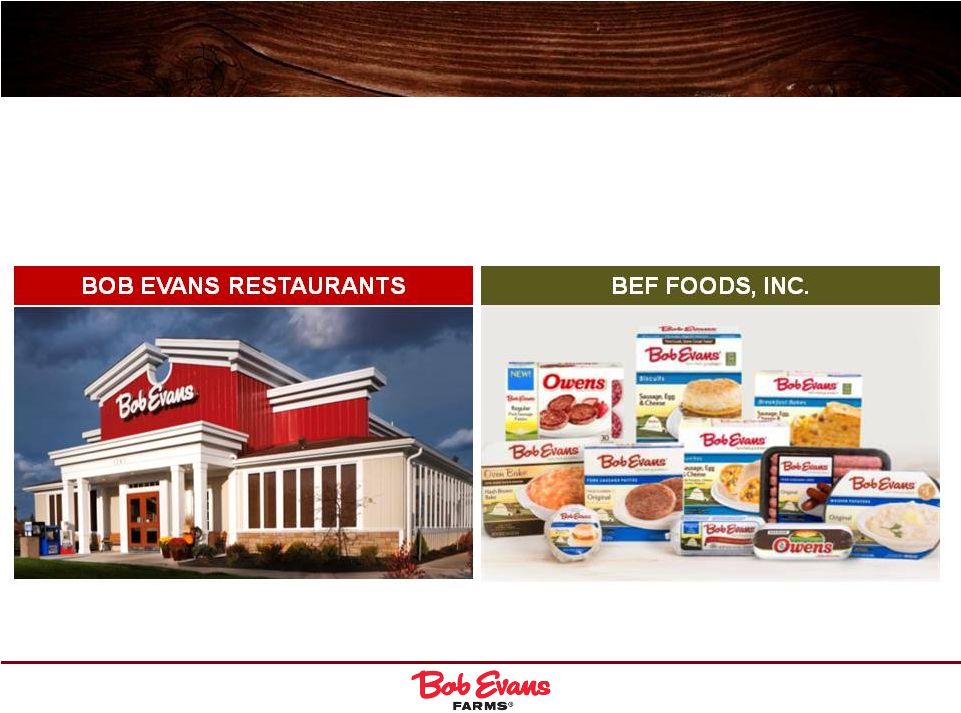
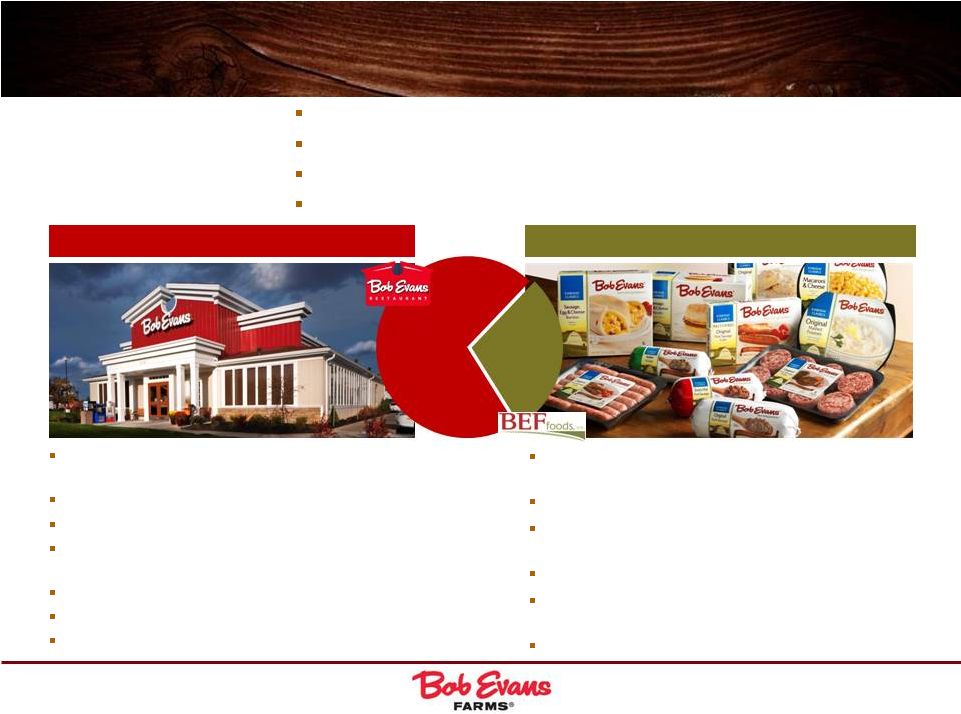
Two synergistic business segments
Bob Evans Restaurants (“BER”)
Bob Evans Foods (“BEF”)
Rev:
$957mm
(72%)
Rev:
$372mm
(28%) |
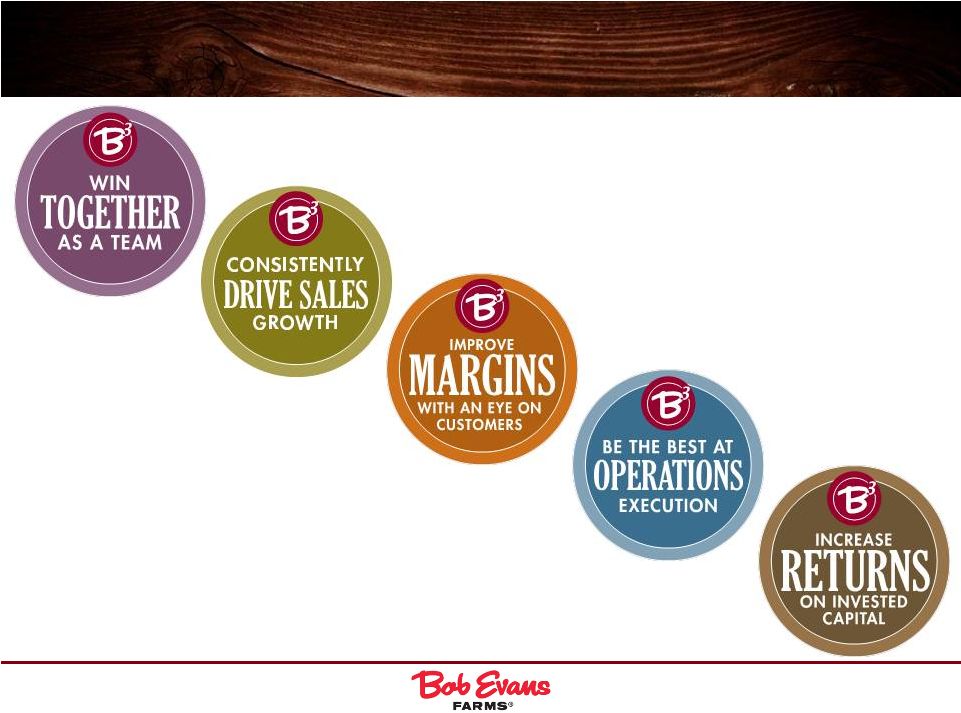 Our
Guiding Principles 12 |
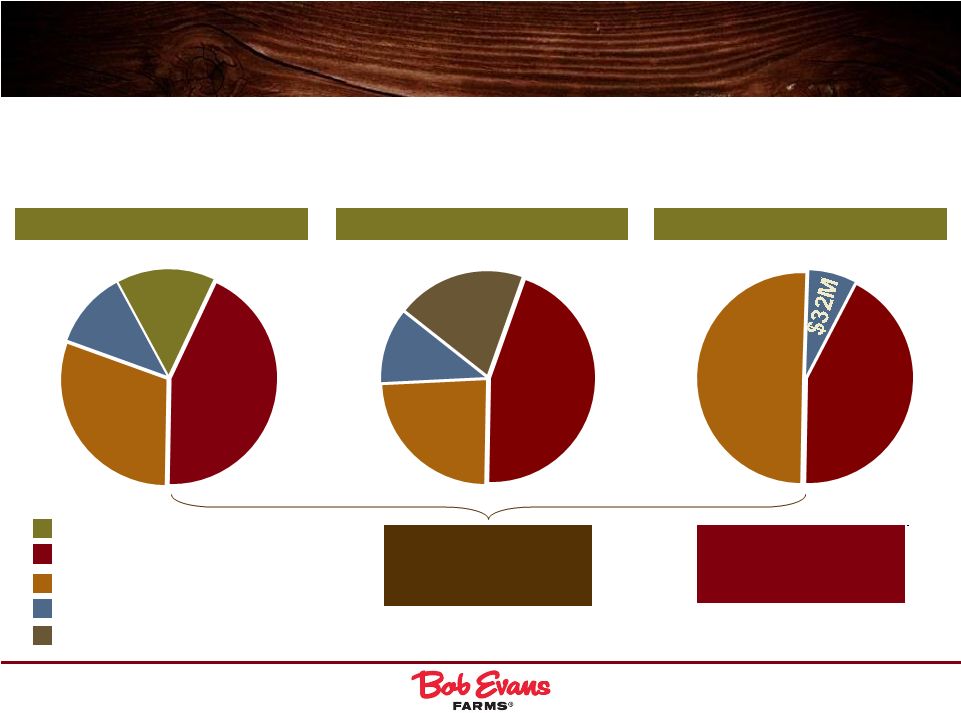 13
A Track Record of Balanced Capital Allocation
Fiscal 2013
Fiscal 2014
Fiscal 2007-2012
FY15 Capex expected to
be $85 to $90 million, in-
line with historical average
Bob Evans has returned meaningful capital to stockholders in a prudent, consistent
fashion Debt Repayment
Capex
Share Repurchases
Dividends
Acquisition
Over $800 million returned
to stockholders through
share repurchases and
dividends since FY07
$52M
$30M
$118M
$63M
$191M
$225M
$339M
$485M
$167M
$
$130M |
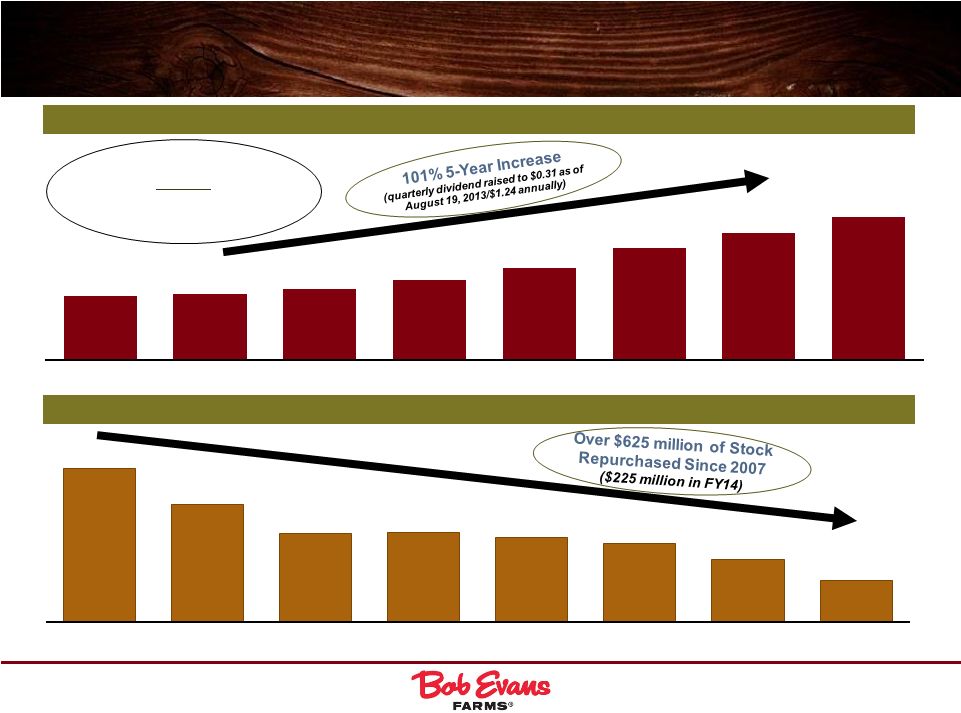 14
Track Record of Meaningful Dividends and
Share Repurchase
Trailing 12-month yield
(8/8/14):
BOBE: 2.6%
S&P 500: 1.9%
36,484
33,315
30,744
30,890
30,422
29,925
28,488
26,704
FY 2007
FY 2008
FY 2009
FY 2010
FY 2011
FY 2012
FY 2013
FY 2014
$0.54
$0.56
$0.60
$0.68
$0.78
$0.95
$1.075
$1.205
FY 2007
FY 2008
FY 2009
FY 2010
FY 2011
FY 2012
FY 2013
FY 2014
Annual Dividend Per Share has Doubled Since FY08
Weighted Average Diluted Shares Decreased by 27% since FY07 (000’s)
|
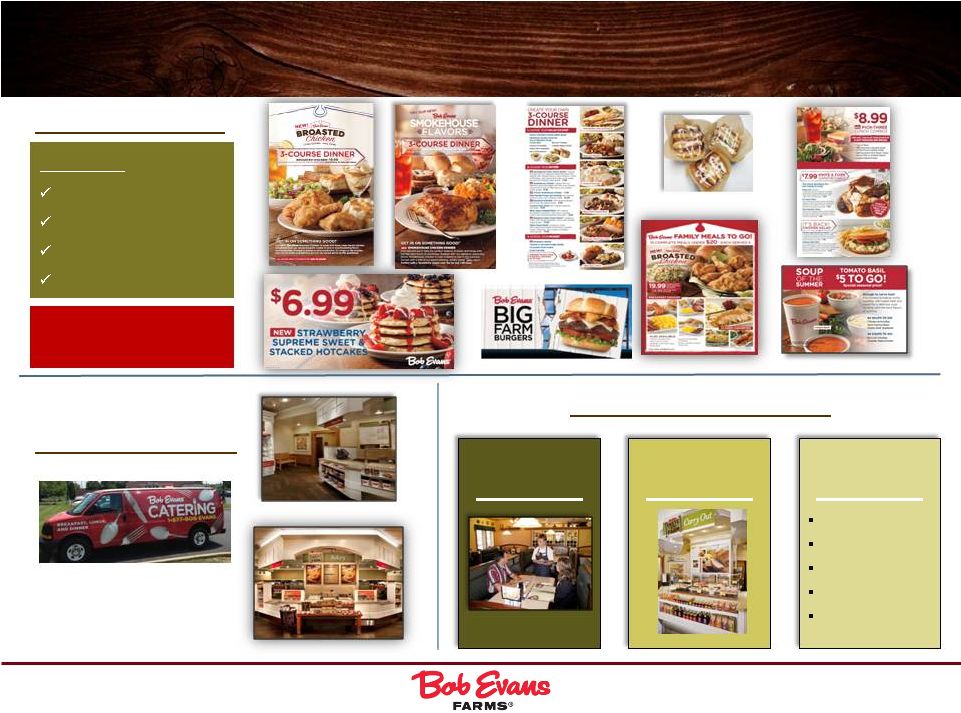
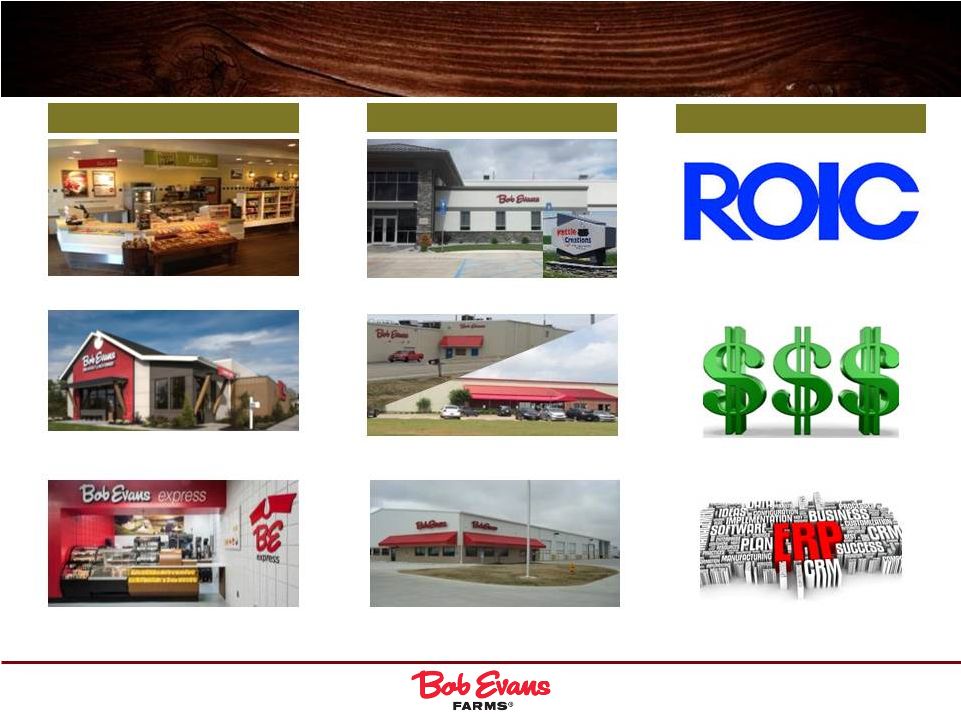
 BER:
Remodeled and Ready to Grow 15
Recently completed Farm Fresh Refresh
o
First comprehensive remodeling program in brand
history
o
76% maintenance capex and 24% growth capex
o
Refreshed restaurants have consistently
outperformed non-refreshed restaurants
We are confident BER has exciting growth potential:
o
New sales layer growth (e.g., carryout, Broasted
platform and five-dollar soups to go)
o
Leveraging our regional strength to catalyze new
unit growth
o
Developing the compelling new Bob Evans Express
("BEX") license/franchise format
Farm Fresh Refresh Transformation
Exciting New Restaurant Design
Compelling New BEX Growth Format
Restaurant
Locations
as
of
4/25/14 |
 16
The Company recently completed a multi-year renovation program of all its
units Farm
Fresh
Stores
–
Incremental
SSS
(Year-One Stores vs. Non-Refreshed Stores)
Farm Fresh Refresh Driving Sales
Dining Room &
Lobby
Restrooms
Bakery,
Catering &
Carryout
Exterior,
Signage,
& Landscaping
CapEx Summary
(76% maintenance capital, 24% growth capital)
Average Capital Investment per
Remodeled Restaurant: ~$225K
(1) Nation’s Restaurant News, Consumer Picks, March 24, 2014.
44%
10%
22%
4.3%
4.8%
2.6%
3.6%
4.5%
4.0%
2.2%
2.8%
2.7%
3.4%
3.6%
FY12
Q1
FY12
Q2
FY12
Q3
FY12
Q4
FY13
Q1
FY13
Q2
FY13
Q3
FY13
Q4
FY14
Q1
FY14
Q2
FY14
Q3
24%
Refreshed stores consistently outperformed the non-refreshed stores over the
last three years According to WD Partners and Nation’s Restaurant News,
Bob Evans has made significant progress in areas of food quality, value,
service, menu variety and atmosphere, and took top position
in
the
“cleanliness”
category
1 |
 17
Industry Traffic has Been Soft Across Dayparts
and Segments, Particularly in Midscale
Source: CREST®
AMJ ’14, The NPD Group, Inc..
Distribution
of
Traffic
and
Trend
by
Segment
and
Daypart
–
Qtr.
Ending
June
‘14
-4%
Morning Meal
YoY
-4%
-5%
-1%
-4%
-1%
-1%
+3%
Lunch
Supper
Late Night
YoY
YoY
NA
NA
NA
NA
23%
25%
4%
33%
35%
33%
26%
38%
59%
18%
2%
4%
QSR
Midscale
Casual Dining
BER is considered Midscale
according to the NPD Group |
 Leveraging a Remodeled Base: Product and Operational Innovation to
Drive Positive Same-Store Sales in FY'15 and Beyond
18
Menu Innovation
New Sales Layers
Carryout
Catering
Operational Innovation
Labor Management
Carryout Service
Enhancements
New Kitchen
Technology &
Equipment
Objectives:
Bakery
All Initiatives
Rigorously Tested
KDS (kitchen
displays)
Clamshell grill
Broaster
Batch holding
Drive traffic
Increase avg. check
Leverage off-premise
Enhance margins |
 19
Farm Fresh Refresh Will Catalyze Further Growth
in Carryout Sales
Off-Premise Sales Mix and Growth % by Year
Family Meals to Go
Bakery
Catering/Carryout
Carryout sales have demonstrated consistent growth trajectory since 2006
+8.6%
+5.3%
+8.5%
+3.9%
+0.6%
+15.4%
+12.9%
+7.9%
+2.4%
6.5%
7.0%
7.5%
8.0%
8.5%
9.0%
9.5%
10.0%
10.5%
11.0%
11.5%
12.0%
12.5%
2006
2007
2008
2009
2010
2011
2012
2013
2014
Off-Premise Sales Mix
Growth % by Year
As a result of FFR, 100%
of BER units now have
carryout capabilities |
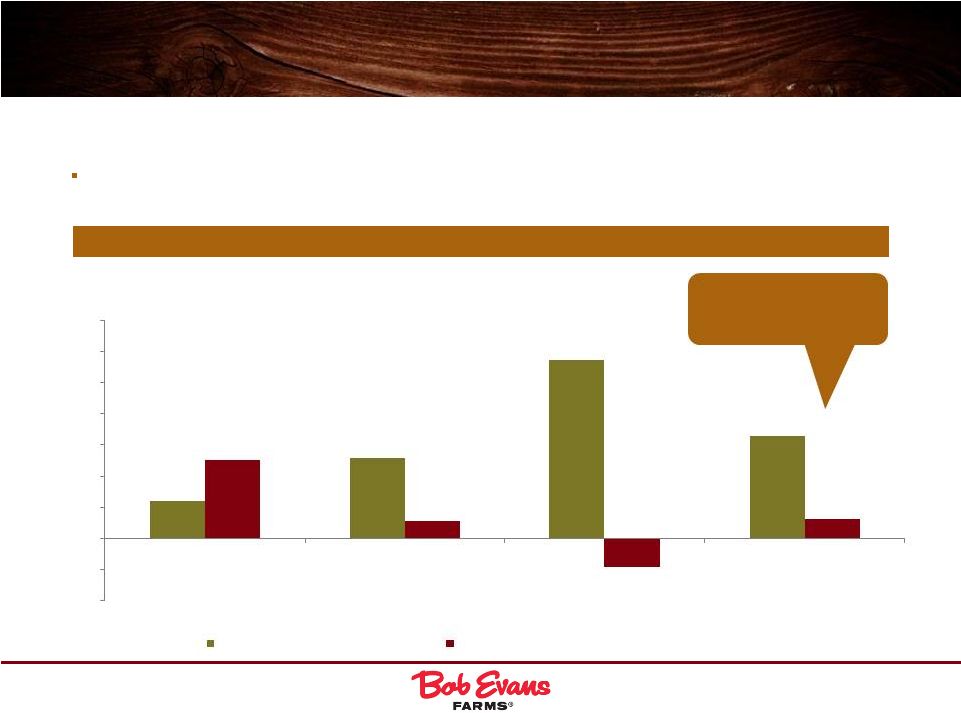 20
Broasted Chicken has Reversed Dinner and Lunch
Sales and Traffic Declines in its Test Markets
Change in Same-Store Sales Since Mid-March Launch of Broasted in
Cincinnati Total sales improvement
vs. the balance is +2.65%
Broasted chicken is now the number one top seller in its test markets and already
accounts for 12% of sales mix (as compared to the previous top seller
Rise-and-Shine which accounts for 7% of sales) 1.20%
2.58%
5.72%
3.29%
2.52%
0.55%
-0.92%
0.64%
-2.00%
-1.00%
0.00%
1.00%
2.00%
3.00%
4.00%
5.00%
6.00%
7.00%
Breakfast
Lunch
Dinner
Total
Cincinnati Test Restaurants (32)
BER Stores Excl. Cincinnati Test Restaurants (529)
Bob Evans menu is subject to continuous consumer testing, review and revision with
particular focus on increasing differentiation across users and platforms
|
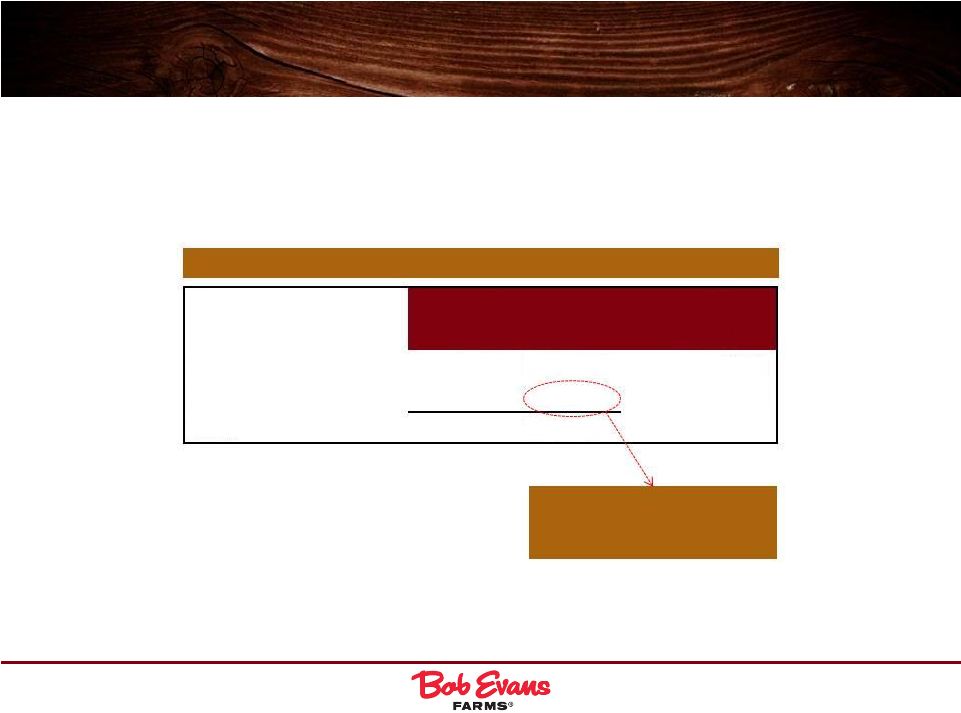 21
Broasted Chicken is Fueling Incremental
Carryout Sales in its Test Markets
Broasted meals accounted for 56% of carryout sales increase
Cincinnati
D.M.A.
(April
17
th
–
July
27
th
)
1
Broasted accounts for
~$227K or 56% of total
increase in carryout sales
(1)
Media
launch
began
in
April
17
th
,
2014
Dine-In Sales
$122,526
Carryout Sales
407,710
Total
$530,236
Sales
Variance ($)
% of
Total
23%
77% |
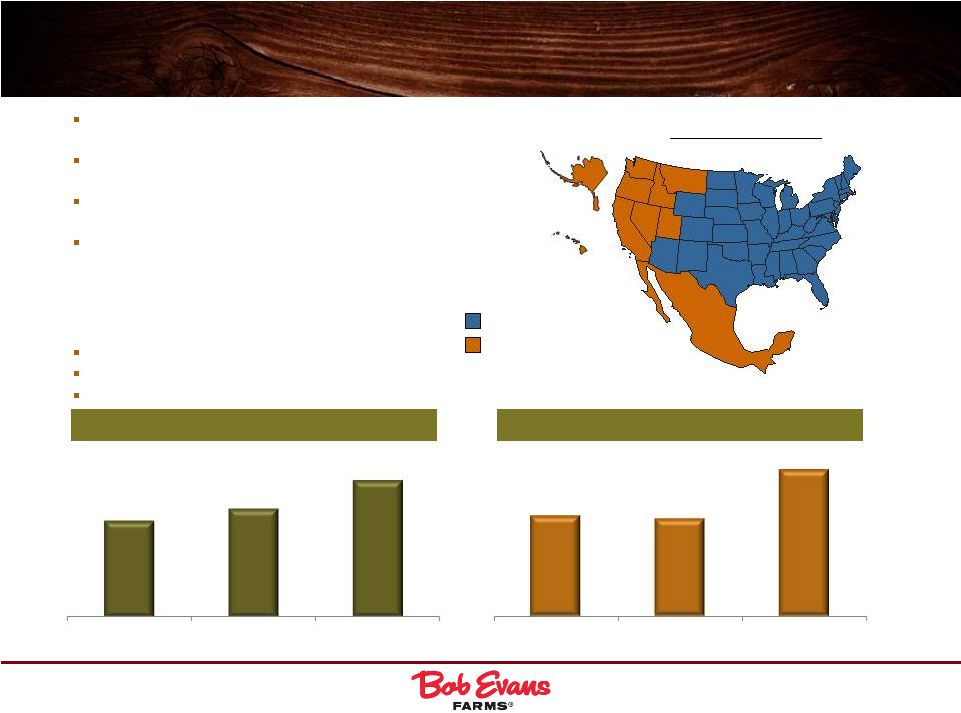 BEF:
Restructured and Ready to Grow 22
Restructured to streamline and focus on more
profitable businesses
100% vertically integrated cost structure with
Kettle Creations acquisition
Mitigated over $66mm in sow cost inflation
since 2009
Four key lines of business
o
Refrigerated Sides (41% of sales)
o
Food Service (26%)
o
Sausage (24%)
o
Frozen/Other (9%)
Broad customer base
Sold at 30,000+ retail locations
Distributed in 50 states and Mexico
Number of Retail Stores
Average SKUs Per Store
Distribution
Presence
* Subsequently reduced SKU count & improved overall profitability
Bob Evans Growth Opportunity Markets
Bob Evans Core Markets
11.6
11.3
17.0
2010*
2014
2018 (Goal)
28,407
31,687
40,000
2010
2014
2018 (Goal) |
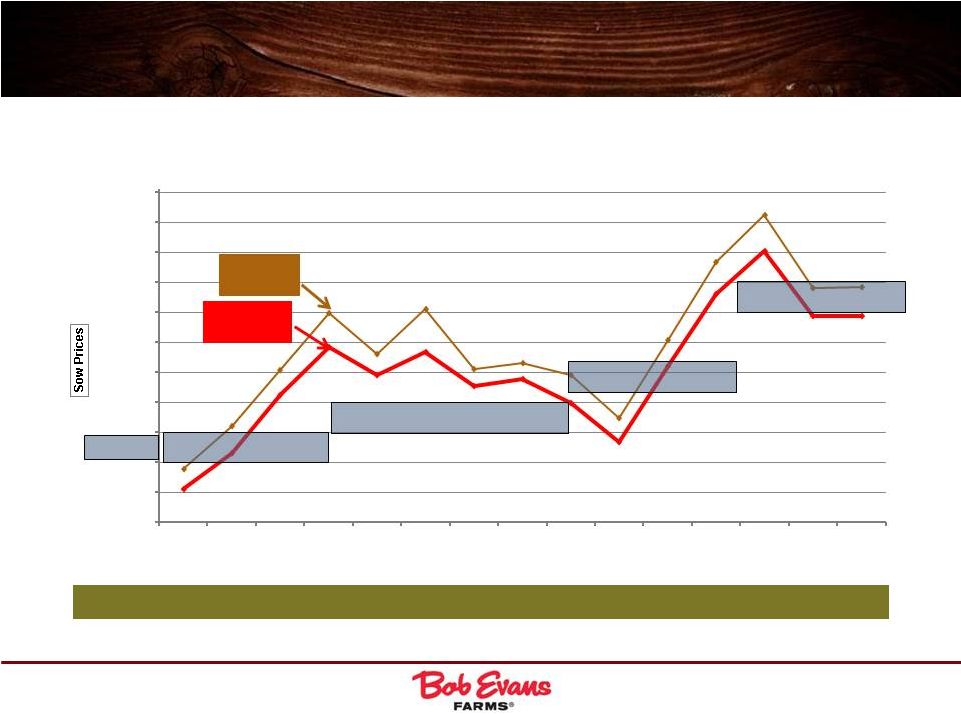 The
Run-Up in FY14 Sow Costs Made it Difficult to Guide Our Profit
Forecasts 23
The increase of sow costs, largely driven by unforeseen PED virus outbreaks, has been
the main reason we have reduced our guidance
Note: USDA data reflects top of trading range
$65-$70/cwt
(issued 8/19/13)
$60-$65/cwt
(issued 6/4/13)
$72-$77/cwt
(issued 1/21/14)
BOBE
Guidance
USDA
Cost
Bob Evans
Cost
There is no effective sow cost hedging mechanism in the U.S.
$88-$90/cwt
(issued 7/8/14)
$55.50
$61.57
$71.27
$79.14
$74.49
$78.42
$72.68
$73.93
$69.90
$63.46
$76.10
$88.02
$95.17
$84.39
$84.44
$58.94
$66.13
$75.35
$84.93
$77.96
$85.59
$75.62
$76.58
$74.50
$67.32
$80.44
$93.39
$101.16
$89.02
$89.18
$50.00
$55.00
$60.00
$65.00
$75.00
$80.00
$85.00
$90.00
$95.00
$100.00
$105.00
May
FY' 14
Jun
FY' 14
Jul
FY' 14
Aug
FY' 14
Sep
FY' 14
Oct
FY' 14
Nov
FY' 14
Dec
FY' 14
Jan
FY' 14
Feb
FY' 14
Mar
FY' 14
Apr
FY' 14
May
FY' 15
Jun
FY' 15
Jul
FY' 15
$70.00 |
 24
Significant Intersegment Synergies
Brand and Advertising Synergies (e.g., TV, Print and In-Store)
Product Innovation Between BEF and BER (e.g., Mashed Potatoes)
Supply Chain Savings by Joint Procurement (e.g., Poultry)
Brand Credibility Leads to External Food Service Expansion
Margin Enhancement at BER and BEF as a Result of G&A Leverage
Restaurant Operational Efficiencies via In-Sourcing Strategy
We believe that the combination of BER and BEF offers
significant intersegment synergies, including: |
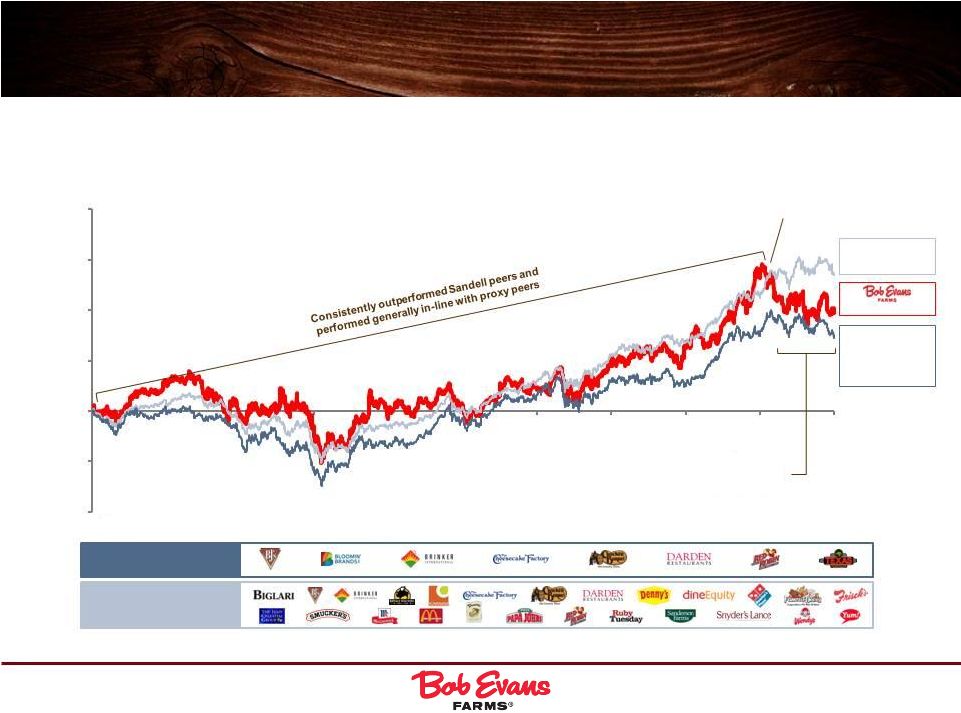 Consistent Value Creation
25
Source: FactSet as of 8/8/14.
Note: Appointment of Steve Davis as CEO announced on
5/2/06. Since Steve Davis was hired as CEO in May 2006, Bob Evans has
consistently outperformed Sandell’s designated Family and Casual Dining
Peers and performed generally in-line with Bob Evans’
proxy peers, until Fall of 2013
Sandell Family
& Casual
Dining Peers:
+76%
+102%
Proxy Peers:
+136%
Record sow costs and
unusually severe Midwest snow
storms impacted Q3 & Q4 EPS
October 2013
(100%)
(50%)
0%
50%
100%
150%
200%
Sandell Family & Casual
Dining Peers
Proxy Peers
May-06
Feb-07
Dec-07
Oct-08
Aug-09
Jun-10
Apr-11
Feb-12
Dec-12
Oct-13
Aug-14 |
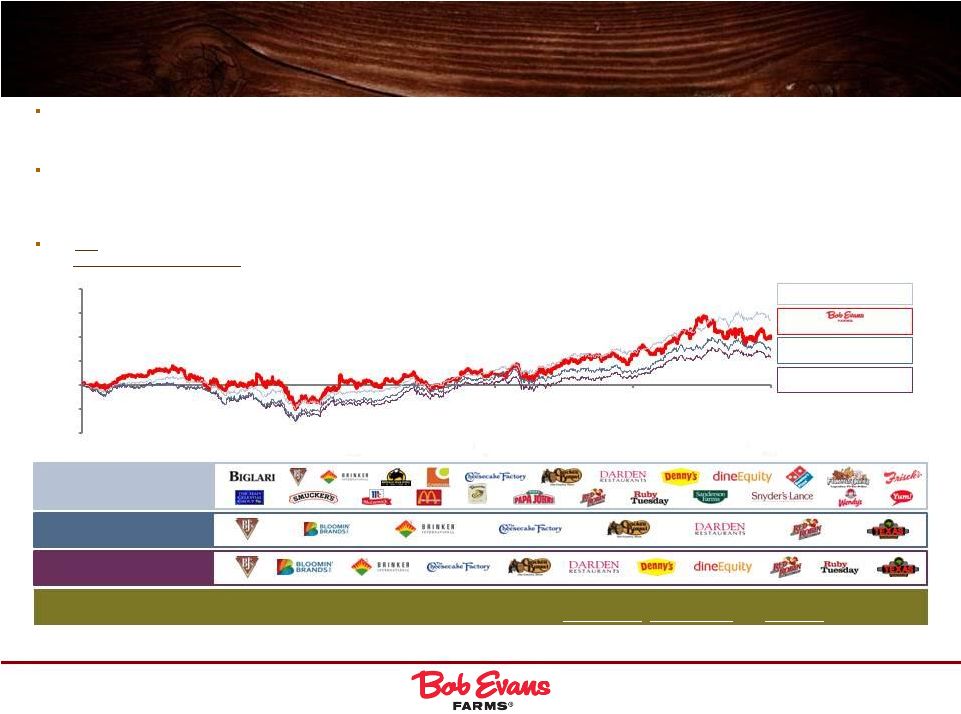 Sandell Manipulates the Data to Try to Justify His
Flawed Agenda
26
Sandell
has
repeatedly
shifted
his
“peer
group”
to
blatantly exclude underperforming peers
o
Sandell’s
three
presentations
–
filed
with
the
SEC
on
September
24,
2013,
December
9,
2013
and
April
24,
2014
–
compare
Bob
Evans’
stock
performance
against
three
different,
cherry-picked
peer
groups
1
In
Sandell’s
July
2014
presentation,
Sandell
omits
Denny’s,
DineEquity
and
Ruby
Tuesday’s
from
his
latest
set
of
Bob
Evans’
peers. A
reasonable list of family and casual dining peers would be expected to include each
of these three companies o
Indeed,
Sandell’s
December
2013
presentation
stated
that
Denny’s
and
DineEquity
are
two
of
Bob
Evans’
“more
relevant
family
dining
peers”
The
fact
remains
that
–
whether
these
three
missing
peers
are
included
in
the
Sandell-constructed
peer
group
or
excluded
–
Bob
Evans
has
consistently
outperformed
Sandell’s
selected
peer
group
since
Steve
Davis
became
CEO
in
May
2006
through
August
8,
2014
Source: FactSet as of 8/8/14.
(1)
Sandell’s
presentations,
filed
on
Schedule
14A
with
the
SEC
on
September
24,
2013,
December
9,
2013
and
April
24,
2014,
compare
the
Company’s
stock
performance
against
as
few
as
three
and
as
many
as
eight
different
companies,
and
each
of
the
following
has
been
both
excluded
at
least
once
and
included
at
least
once:
BJRI,
BLMN,
CAKE,
DENN,
DIN,
DRI,
EAT,
RRGB,
TXRH.
Sandell Family & Casual
Dining Peers: +76%
Proxy Peers: +136%
Sandell Peer Group Plus
DENN, DIN and RT: +60%
Sandell’s
ever-shifting
economic
demands
and
curiously
“evolving”
peer
groups
aside,
Bob
Evans
is
focused
on
enhancing
performance
and
executing
on
our
value-creating
initiatives
under
the
leadership
of
an
independent,
open-minded
and
refreshed
Board
+102%
Proxy Peers
Sandell Family & Casual Dining
Peers
Sandell Peer Group Plus
DENN, DIN and RT
(100%)
(50%)
0%
50%
100%
150%
200%
May-06
Dec-07
Aug-09
Apr-11
Dec-12
Aug-14 |
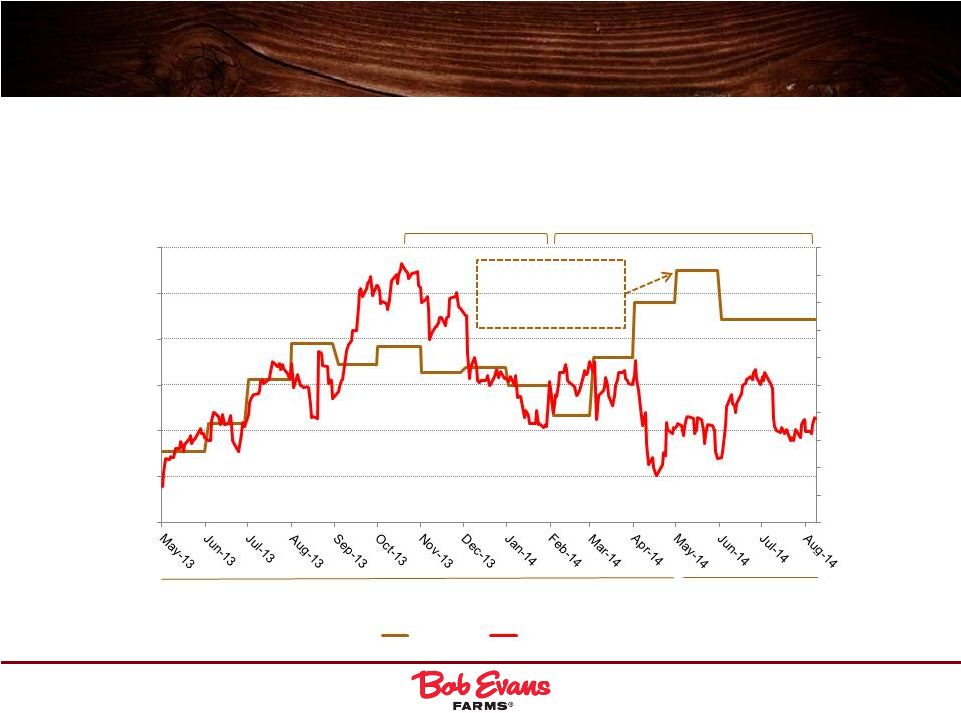 Record Sow Costs and Severe Weather Have Been the Primary
Factors Adversely Impacting Our Stock Price Since Last Fall
27
Since hitting nearly $60/share, the Company’s stock has been adversely impacted
by both severe weather and record sow costs
FY14
FY15
Source: FactSet, USDA data.
May-14: Sow costs hit
record highs;
increased by ~50%
since Feb-14
$40.00
$50.00
$60.00
$70.00
$80.00
$90.00
$100.00
$/CWT
Sow Costs
Stock Price
$42.00
$44.00
$46.00
$48.00
$50.00
$52.00
$54.00
$56.00
$58.00
$60.00
Stock Price
$40.00
Unusually severe winter
weather disproportionately
impacted BER
Dramatic rise in sow costs
to record levels |
 Setting the Record Straight: Total Shareholder
Return
28
Sandell’s Misleading Claims/
Overstated Criticisms
1
The Facts
Sandell claims that Bob Evans’
stockholders have “suffered
years of woeful under-
performance”
Sandell’s
own
analysis
illustrates
that
the
Company
outperformed
the
S&P
500
by over 10% over
the
last
10
years
and
performed
generally
in-line
with
his
“Family
and
Casual
Dining”
peers (Bob
Evans meaningfully outperformed RRGB & CAKE, performed in-line with BJRI
& EAT and underperformed DRI & CBRL) over the same time period
In fact, Sandell’s own relative performance graphs for each of the 1-year,
3-year, 5-year and 10-year periods illustrate that Bob Evans
performed generally in-line with Sandell’s peer set until late 2013
Sandell claims that Bob Evans’
“exposure to the weather was not
unique”
Bob
Evans
has
the
most
Midwest
exposure
of
any
sizable
family
or
casual dining chain
Analysts
appreciate
this
fact:
“CBRL
only
has
~21%
of
units
in
Midwest,
vs.
~61%
for
BOBE,
who
revealed
stores
outside
the
Midwest
had
positive
comps
(e.g.
Florida).”
–
Oppenheimer,
January
22, 2014
Sandell claims that the Company
“cherry-picked”
dates to measure
shareholder return
Measuring
performance
since
Steve
Davis
began
as
CEO
in
May
2006
is
the most
relevant time
period to evaluate the Board and management
From
May
1,
2006
to
August
8,
2014,
the
Company
has
meaningfully
outperformed Sandell’s own
“Family
and
Casual
Dining”
peer group by ~26%
Sandell NOW claims that DIN,
DENN and RT are not comparable
to Bob Evans
As recently as December 9, 2013, Sandell expressly included DIN and DENN in
Sandell's "peer group"
Each of DIN, DENN and RT are widely considered to be notable family/casual
competitors to Bob Evans
If
DIN,
DENN
and
RT
were
justly
included
in
Sandell’s
“peer
group”,
Bob
Evans’
outperformance
from
May
1,
2006
to
August
8,
2014
would
be
even
more
pronounced
(~42%)
(1)
Sandell presentation, filed with the SEC August 4, 2014.
|
 III.
Our Value Creation and Growth
Plan –
Prudent, Responsible
and Focused |
 30
Our Plan: Transformed and Poised for Growth
Bob Evans Restaurants
Farm Fresh Refresh Completed
Up to 8 New Restaurants in FY15
10-12 Annually Thereafter
10-20 BEX to be
Licensed/Franchised Annually
Capital and Resource Allocation
Enterprise Resource Planning
Margin Innovation
Bob Evans Foods
Side Dish Vertical Integration
Sausage Network Optimization
Transportation Consolidation
Corporate |
 31
Significant Asset Closures/Dispositions:
Over $125 Million of Asset Dispositions Since FY06
Asset
Consolidation
Sausage operations
(five facilities into two)
Ready-to-eat
operations
(four facilities into one)
Business
Closure
76 restaurants closed
Headquarters
closures
Owens HQ (Texas)
Mimi’s Café
(California)
Business
Reengineering
Direct-store-delivery to
warehouse conversion
Springfield, OH
transportation center
(four facilities into one)
Business
Sold/Divested
Mimi’s Cafe
Springfield, Ohio
distribution center
The Board does not hesitate to re-evaluate strategic decisions;
every business asset is subject to a review every quarter
|
 ERP
Investment 32
SKU Level Cost and
Profit Insights
SKU Reduction and
Maximization
Segment Level Cost
Analysis
Trade Spending
Optimization and
Analytics
Platform for Growth
Speed to Market with
New Functionality
Compliance
Elimination of
Manual Processes
Integrated Systems
Complexity
Elimination
Plug-N-Play with
Future Integrations
(Complex
Transactions)
Cost Insights and
Analysis
Categorized
Spending
Online Auction
Integration
Contract
Administration,
Tracking and
Enforcement
Payroll Co-Sourcing
Employee and
Benefits Tracking
Employee
Optimization and
Productivity
Taxes and Fixed
Asset Accounting
Quarterly and Annual
Close Process
Electronic Audit
Evidence
Accounts Payable
and Receivable
Tracking
Integration with COS
and COL Systems
Spending and Cost
Analytics
Enterprise Resource Planning (ERP) Investment
Significantly Enhances Our Capabilities
“Mgmt.
maintained
its
outlook
for
300-350
bps
of
margin
expansion
in
the
coming
years,
which
we
expect
to
show
up
in
BEF
more
quickly,
due
to
the
aforementioned
plant
closures.
Central
to
further
improvement
is
the
Company’s
current
ERP
implementation,
including
a
labor
management
tool
that
is
showing
a
60-70
bps
drop
in
labor
costs,
as
well
as
future
savings
around
insourcing,
supply
chain
and
food
waste.
”
-
Stephens, 1/22/2014
BEF Business
Insights
IT
Systems
Supply
Chain
Payroll
and HR
Financial
Controls |
 Our
Long-Term Goal and Strategic Pillars 33
PROFITABLY
GROW &
CONTINUE
TO TRANSFORM
OUR CORE
BUSINESS
DRIVE
STOCKHOLDER
VALUE WITH
DISCIPLINED
CAPITAL
ALLOCATION
SELECTIVELY
INVEST IN
HIGH R.O.I.C.
GROWTH
OPPORTUNITIES
(Internal &
External)
10 –
12% Long-Term
EPS Growth Goal |
 Our
Long-Term Goals 34
Operating Margin
Operating Margin
7.8%
11.2 -
11.7%
Net Sales
3.0% -
3.5%
Annual Growth
Initiatives
Up to 8 new restaurants in
FY15; 10-12 restaurants
thereafter
Same-store sales and new
restaurants expected to
contribute equally to net
sales growth (~1.50% to
1.75% each)
Rollout of BEX units
6.0% -
7.0%
Refrigerated side dish and
food service products to
drive growth
Expand points of
distribution (~32k in FY14
to ~40k by FY18)
Increase average SKU
count per point of
distribution (~11.3 in FY14
to ~17.0 FY18)
FY13-FY18 Improvement
Initiatives
Sales forecasting/labor
management
Food cost optimization
Menu management
Back-of-the-house
optimization
8.8%
11.8 -
12.3%
Side dish vertical
integration
Implement lean
manufacturing w/ side
dish production
Transformational
consolidation
8.4%
11.5 -
12.0%
Corporate
Refinancing/interest reduction
ERP implementation |
 Analysts Appreciate the Company's Strategy
35
“In
our
opinion,
Bob
Evans
Farms
will
experience
impressive
margin
expansion
in
F2015
and
F2016.
Bob
Evans
remains
our
favorite
small-cap
pick
in
the
family
and
casual
dining
space,
owing
primarily
to
the
significant
margin
growth
we
foresee.
Management has outlined $34 million in estimated F2014 costs that are not expected
to impact F2015 results. These include more than $10 million in additional
costs due directly to this year’s harsh winter weather, $7 million in restaurant remodel costs, $6 million in Mimi’s
Café
carryover
costs
and
more
than
$4
million
due
to
a
supplier
dispute,
among
others.
We
forecast
190
basis
points
of
operating
margin
expansion
in
F2014-F2016
to
8.5%
on
increased
in-sourcing
of
food
products
at
the
restaurants,
continued
supply
chain
and
back-of-the-house
optimization,
implementation
of
new
labor
management
software,
personnel
reductions
and
food
plant
closures.
By
our
model,
the
margin
expansion
will
fuel
impressive
41%
EPS
growth
during
the
period.”
-
Sidoti & Co., 6/11/14
“BOBE provides a unique combination of restaurants (70% of profits) and a
faster growing grocery products business (30%). We believe both
segments
hold
catalysts
to
accelerate
sales,
elevate
margins
and
drive
better
than
expected
EPS
growth.
We
are
particularly
excited
for
next
fiscal
year
(F15)
as
the
model
butterflies
out
of
"transformative"
events
into
a
cleaner
platform
for
improving
earnings
power
and
lower
capital
expenditures.”
-
Oppenheimer, 7/9/14
“Mgmt.
is
estimating
that
sales
rebound
in
FY15,
to
a
growth
rate
of
~13%,
and that operating profit jumps to ~$37 mil. from $12.9 mil. in
FY14. The Company is looking for margin improvement primarily from improved plant
efficiencies, in addition to the realization of expected cost reductions
related to plant network closures. Additionally, mgmt. expects a newly implemented price increase on sausage
to
help
mitigate
higher
sow
costs
(guidance
incorporates
sows
of
$80-$90 per hundredweight). Despite some NT headwinds, we
continue
to
view
BEF
as
the
most
attractive
asset
within
BOBE
and
look
for
improvements
on
the
top
and
bottom
lines
in
FY15.
”
-
Stephens, 7/10/14
“The
company’s
most-recent
woes
are
linked
to
outside
pressures
such
as
high
pork
prices
and
poor
weather,
said
Keybanc
analyst
Christopher
O’Cull
and
Stephens
Inc.
analyst
Will
Slabaugh.
“It’s
tough
to
place
that
entirely
on
management’s
shoulders,”
Slabaugh
said,
“which
won’t
help
Sandell’s
argument.”
-
The Columbus Dispatch, 7/13/14 |
 IV.
Sandell’s
Demands –
Short-Sighted,
Unsustainable
and
Not
in
the
Best
Interests
of
All
Stockholders |
 Sandell Asset Management
37
Selected Background
Overview
Founded by Thomas Sandell in 1998
Thomas Sandell previously worked as co-head of Risk
Arbitrage at Bear Stearns and head of equity research
at Group Delphi
Sandell Asset Management reportedly managed
approximately $7.5 billion in assets at its peak; as of
2013, the fund managed approximately $1.0 billion
Sandell Asset Management paid more than $8 million
to settle a 2007 enforcement action in which the SEC
found that Sandell's asset management company
willfully violated anti-fraud provisions of the federal
securities laws and censured both the management
company and Sandell personally.
Source:
Sandell Asset Management Website.
Source:
Financial Times, 12/11/13; Sandell Asset Management Corp. Form ADV, filed with the
SEC for the year
ending
12/31/13;
In
re:
Sandell
Asset
Management.
SEC
Release
no.
33-8857
(October
10,
2007). |
 38
Sandell’s Shifting Demands for Financial
Engineering
Spin-off at 10x+
EBITDA or sell for
low-teens multiple
of EBITDA
Spin-off, or sell
for 11x FY14
EBITDA or
$558mm
Sell, or sell 19.9%
via IPO followed
by spin-off or
split-off, or split-
off at 11x FY15
EBITDA and
exchange for Bob
Evans shares at
$63/share
Sell 19.9% via
IPO followed by
spin-off or split-off
of remaining
80.1%, or split-off
at 10.5x FY15
EBITDA and
exchange for Bob
Evans shares at
$60/share and
retire 10mm
shares
Analyze /
implement
optimal structure
and evaluate
overtures
Sale or spin-off of
BEF by end of
CY14
Explore /
implement
Strategic review
100% for
~$720mm
100% for
~$720mm
~56% for
~$400mm
~56% for
~$400mm
50% for
~$450mm
43% for
undisclosed
amount within 90
days
Explore /
implement
“Top down”
analysis
Use after-tax
proceeds of
~$1.0bn from sale
of BEF and sale-
leaseback to
repurchase
~19mm shares at
$55/share
Use ~$800mm of
after-tax proceeds
from sale of BEF
and sale-
leaseback to
repurchase
~14mm shares at
$58/share
Use proceeds of
$400mm from
sale-leaseback
and $175mm of
incremental debt
to implement
$575mm self-
tender at
$63/share
Use proceeds of
~$400mm from
sale-leaseback
and $175mm of
incremental debt
to repurchase
~9.6mm shares at
$60/share
Use proceeds of
~$450mm from
sale-leaseback to
repurchase
~9.1mm shares at
$50/share
Use proceeds
from sale-
leaseback to
repurchase
$350mm of stock
within 90 days
Explore /
implement
??
>$72
$73-$84
$80-$90,
depending on
assumptions
$81
~$76 -
~$91
NA
NA
NA
SANDELL’S
ASSERTED
PRO FORMA
SHARE PRICE
SEPARATE
BEF
SALE-
LEASEBACK
OF
OWNED
RESTAURANTS
ONE-TIME
SELF-TENDER AUGUST 5, 2013
SEPTEMBER 24, 2013
NOVEMBER 11, 2013
DECEMBER 9, 2013
APRIL 24, 2014
JUNE 10, 2014
JULY 2, 2014
JULY 28, 2014
Quickly reverted
back to financial
engineering;
subsequently
cloaked by more
vague generalities |
 39
Sandell Remains Focused on a Flawed Agenda for
Short-Sighted Financial Engineering
After pushing specific financial engineering for nearly a year, Sandell suddenly
seeks to distance himself from his own economic agenda by scrubbing from his
latest presentation any mention of the flawed plans he has aggressively
insisted the Company immediately implement Sandell now claims that the
upcoming Annual Meeting “is NOT about any specific transaction”.
Notwithstanding this recent claim, stockholders should consider that:
o
As
recently
as
June
2014,
in
response
to
Bob
Evans’
offers
to
settle
the
proxy
contest,
Sandell
showed
his
true
colors
by
demanding
that
the
Company
implement
1)
a
sale
or
spin-off
of
BEF
by
the
end
of
CY14,
2)
a
sale-leaseback
of
nearly
half
of
the
Company’s
real
estate
within
90
days
and
3)
a
$350
million
share
repurchase
within
90
days
o
In
an
interview
in
July
2014,
Sandell
asserted
that
his
nominees,
if
elected
“will
take
immediate
steps
to
implement
a
comprehensive
plan
that
contemplates
operational,
financial
and
strategic
changes”
1
While the Bob Evans Board welcomes ideas from stockholders, customers and employees,
Sandell’s hastily prepared operational suggestions are of limited utility
since they either lack substance or already are being implemented by the
Company THOUGH SANDELL TRIES TO DOWNPLAY HIS SHORT-SIGHTED AGENDA OF
FINANCIAL ENGINEERING, THE BOARD URGES STOCKHOLDERS NOT TO BE MISLED
(1)
The Activist Report, July 2014. |
 Your
Board Believes Sandell’s Demands are Short- Sighted, Unsustainable and
NOT in Your Best Interests 40
Though Sandell’s specific proposals have continuously changed over the past
year, he has repeatedly demanded the following financial engineering
Divest BEF now, before reaping benefits of our transformational investments
Sell real estate, losing strategic control of assets while burdening Bob Evans
with significant and escalating annual rents and increased leverage
Rapidly effect large leveraged share repurchase
Leveraged Share
Repurchase
Sale-Leaseback
of Real Estate
Separate
BEF
1
2
3 |
 BEF:
A Powerful Growth Engine 41
In
our
view,
Bob
Evans
is
uniquely
poised
to
reap
the
rewards
of
its
recently
completed,
multi-year investment in BEF, including:
o
Optimized network that creates significant runway for growth
o
Numerous synergies between the two segments
We have identified a variety of factors that would cause meaningful value erosion in
a separation:
o
Recurring dis-synergies
o
Ongoing incremental stand-alone costs
o
One-time separation costs
o
Significant tax expense in a conventional sale
BEF is an important component of the Company’s long-term growth plan and
your Board believes that an immediate disposition does not maximize
stockholder value 1
Your
Board
has
determined
that
separating
the
businesses
at
this
time
is
not
in
the
best
interest of stockholders. As part of its commitment to drive shareholder value, the
Bob Evans Board regularly evaluates the optimal strategy with respect to ALL
its assets |
 42
Real Estate: A Strategic Asset
Increased rent expense
o
Reduced EBITDA and free cash flow
o
Treated as debt by rating agencies
o
Reduced incremental debt capacity
o
Future rent escalators
Higher cost relative to other forms of
available financing
Strategic and financial implications
o
Requires renegotiations of existing
debt/breakage costs
o
Significant tax expense
o
Loss of control
o
Reduced flexibility
o
Potential
impact
on
“OpCo”
multiple
Factors Overlooked by Sandell
2
Others are Also Skeptical of Sale-Leaseback
Based on our analysis, we believe that Sandell’s rationale for a
sale-leaseback of the Company’s real estate assets is flawed
“With regard to a potential sale leaseback, we agree with the
Company’s view that it would present one of (if not the most)
expensive forms of financing
in today’s low-rate environment.
Therefore, should mgmt. decide to place further leverage on the
Company, we would prefer it be bank debt with a rate in the historically
low range of roughly 2%.”
-
Stephens, 7/18/14
“It’s more expensive for us to monetize our real estate
than it would be
for us to look at the credit markets…[the value of real estate] is
significantly
higher
than
the
book
value
of
our
land…the
tax
hit
we
would
take in addition to the cap rate
that we would experience by doing that,
it just makes a whole lot more sense for us to go tap into 4% or
5%
money
than
it
would
to
spend
more
to
monetize
the
real
estate.”
-
Guy Constant, Brinker CFO, 1/22/2013
“We’ve examined various options to extract value from owned real
estate,
and
ultimately
concluded,
when
factoring
in
taxes
and
other
transaction
costs,
that
such
alternatives
produce
minimal
benefit
relative
to
current
bank
and
bond
financing
markets.”
-
Sandra Cochran, Cracker Barrel CEO, 11/21/2011 |
 43
Leveraged Repurchase
3
In the summer of 2013, the Company announced it would increase its buyback program
by $150 million and announced a 3.0x target leverage level going forward;
ultimately, the Company repurchased a total of $225 million of stock in
FY14 37% of total share count repurchased
Stock repurchased at a 13% premium (based on
$50 repurchase price and $44.21 prevailing
market price)
Argues “intrinsic value”
of Bob Evans’
shares
is $76-$91
Examples of Sandell Assumptions
(1)
The Company’s Proven Track Record of
Balanced Capital Allocation
Over $625 million of stock repurchase since FY07
o
Share count reduced by 27%
Over $190 million of dividends since FY07
o
Annual dividend doubled over last five years to
$1.24/share
Total return of capital and leverage in-line with or
better than other casual dining operators
Going forward, objective is to maintain 3.0x
leverage and return excess cash to stockholders
Your Board does not expect stockholders would (or
should) sell shares into a repurchase program at
$50 if they are really “worth”
$76-$91
(1) Based on Sandell’s April 24, 2014 White Paper.
Sandell’s share repurchase demands are based on what we perceive to be unrealistic
assumptions; Bob Evans has consistently and responsibly returned over $800 million of
capital to its stockholders since FY07
|
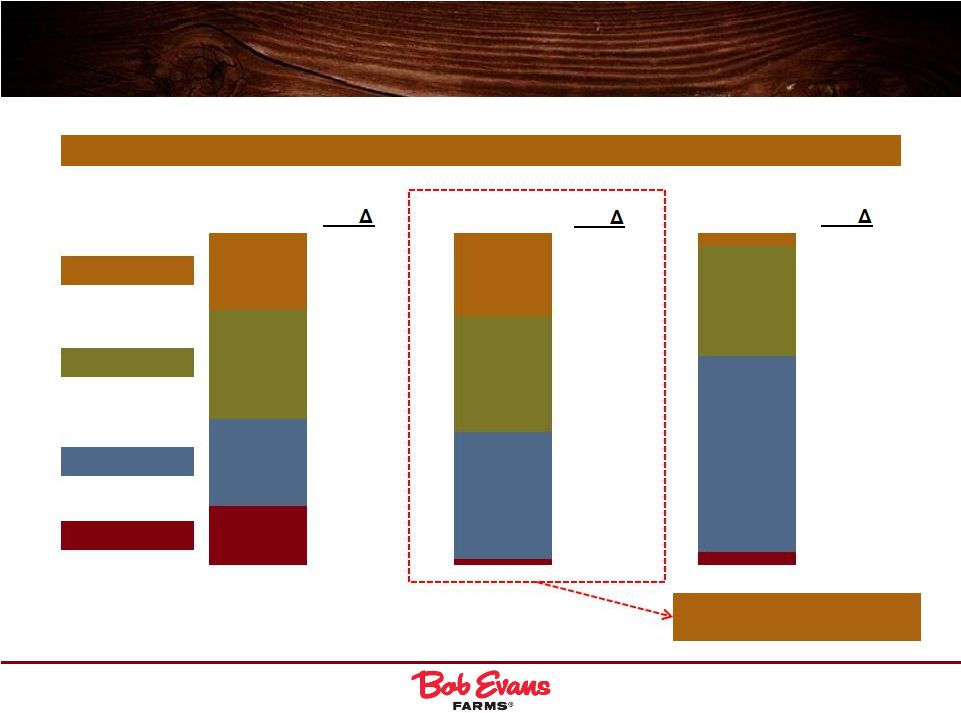
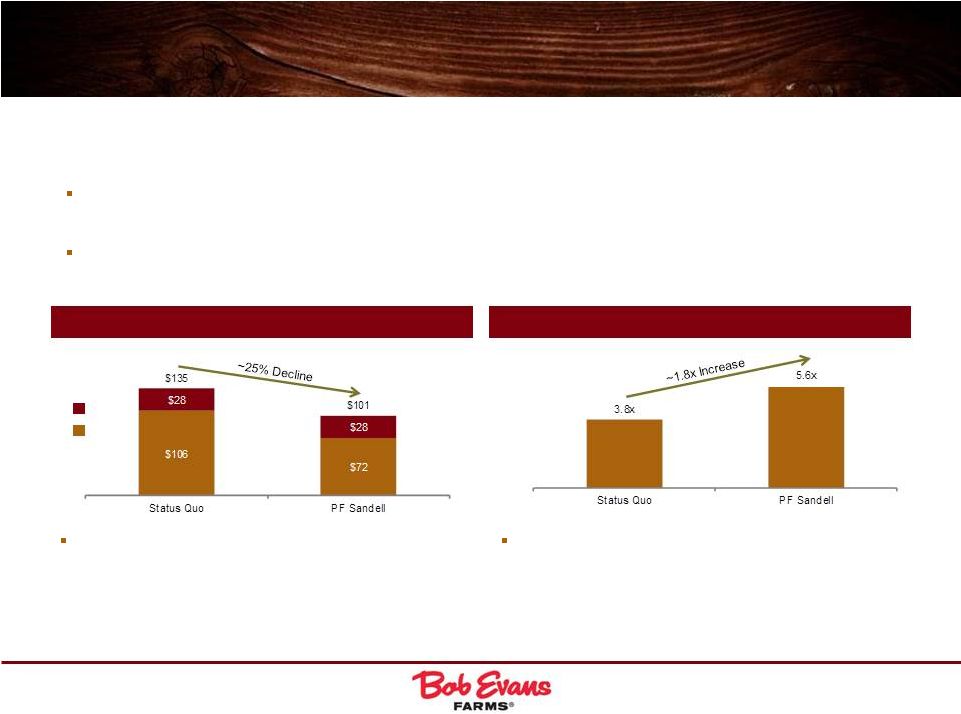 44
We Believe the Sandell Agenda Would Put the
Company at Undue Risk
For example, if the Company were to undertake a sale-leaseback and share
repurchase as proposed by Sandell, it would lead to an untenable amount of
leverage FY14 Adj. EBITDA
Incremental $34 million of rent expense
Adj. Net Leverage
(2)
~$425 million of status quo net debt at end of FY14
BEF
BER
Note:
Proposal based on Sandell’s White Paper on April 24, 2014.
(1) Proceeds net of estimated tax expense.
(2)
Enter into sale-leaseback for 50% of BER sites assuming highest proposed
valuation of real estate (~$380mm of net proceeds
(1)
)
Use all net proceeds from the sale-leaseback to repurchase shares
Per Moody’s, Adj. Net Leverage defined as (Net Debt plus annual rent expense
capitalized at 8.0x) / EBITDAR. |
 45
While Sandell Makes Generic and Non-Substantive
Operational Suggestions, our Board Takes Action
In an attempt to argue its nominees have a plan for improving operating
performance, Sandell presents generic, “low hanging fruit”
platitudes which appear attractive on their face but lack
substance or are already being implemented. A few examples are below:
(1)
Sandell presentation, filed with the SEC July 28, 2014
Sandell “Suggestion”
1
Bob Evans Action
“Revise Brand Position and
Improve Customer
Experience”
”Simplify and Enhance
Menu”
“Optimize Marketing
Effectiveness”
“Improve Restaurant
Margins”
“Future Franchise
Opportunities”
The Board is taking steps to leverage the core aspects of the Bob Evans brand
while constantly reviewing optimal positioning. The Bob Evans menu is
subject to continuous consumer testing, review and revision with particular focus on increasing differentiation
across users and platforms and seeking opportunities to strengthen connections
with less frequent buyers, and also to permit innovation and “back of
house” efficiency.
The Company, in conjunction with our consultants, regularly reviews our marketing
programs to ensure that our message resonates
with
consumers.
We
employ
a
disciplined
and
creative
approach
across
all
mediums
–
social,
TV,
radio,
print
and local –
and continue to make progress on digital marketing initiatives.
The Board meets regularly with BER management to work towards improving
operational restaurant efficiency and deploy successfully tested
methods. The Board continuously analyzes ways to leverage the Bob Evans
brand into new growth markets on a capital efficient, high-ROI
basis.
For
example,
our
“Get
in
on
Something
Good”
campaign
is
designed
to
fully
leverage
natural
synergies
between
BEF
and BER and
is being rolled out nationally in packaging and marketing communications after
successful market testing. For
example,
BER
managers
have
been
tasked
with
maintaining
a
“balance
scorecard”
to
improve
food
expense
tracking and
accountability, and the Company recently rolled out sophisticated scheduling
software to ensure the appropriate balance of staffing and guest
satisfaction. For
example,
the
Bob
Evans
Express
franchising/licensing
model
is
being
tested
in
new
markets
and
we
expect
that,
if
results
are
successful
across
different
types
of
test
venues,
we
will
continue
the
rollout
schedule.
For
example,
the
recently
completed
Farm
Fresh
Refresh
–
the
first
comprehensive
remodeling
program
in
brand
history
–
modernized the customer experience while highlighting elements of the
Company’s farm heritage, utilizing consumer and consultant feedback
and survey data. Independent analysts have noted significant benefits in the areas of cleanliness, food
quality, value, service, menu variety and atmosphere.
For
example,
the
new
Broasted
platform
delivers
a
differentiated,
quality
product
versus
fried
chicken
and
has
delivered
significant sales turnaround in our test markets. Broasted Chicken is an exclusive
(10 year term), trademarked cooking platform
that
will
meaningfully
differentiate
the
Company
from
its
family
dining
peers. |
 46
Setting the Record Straight: Margins
Sandell
makes
a
number
of
claims
about
Bob
Evans
that
we
believe
are
false
or
misleading.
For
example
–
a
non-exhaustive
list
of
Sandell’s
misleading
claims:
We urge investors to consider the facts and not be misled
Sandell’s Claim
1
The Facts
Considering The Facts
Sandell claims that our SG&A
expenses are very high relative
to his selected peers
Sandell does not adjust Bob Evans’
SG&A for BEF
transportation costs; our restaurant peers do not bear similar
expenses (see page 68 for further detail).
Using a normalized, apples-to-apples comparison, our SG&A
expenses as a percent of revenue are more in line with the peer
average
–
and
we
remain
focused
on
reducing
expenses
further.
Sandell claims that our
EBITDAR margins are very low
relative to his selected peers
Sandell only looks at FY14, a year in which our sales were
disproportionately impacted by severe weather, and our
margins were impacted by record sow costs and extraordinary
expenses.
Comparing our results and margins in years prior to FY14
demonstrates that we operate more closely in line with the peers
–
and initiatives are underway to further improve performance.
Sandell claims that our
“revenue-per-corporate
employee”
is very low relative
to his selected peers
Sandell uses outdated headcount figures for Bob Evans and at
least one peer, and includes non-corporate employees working
out of our headquarters. (We believe that “revenue-per-
corporate employee”
is a performance metric unique to
Sandell.)
Using correct figures (260 Bob Evans corporate and shared
services employees), our FY14 revenue-per-corporate employee
($5.1 million) is better than Sandell’s peer average.
Sandell claims that our
corporate headquarters are
wasteful
Sandell ignores the condition and constraints of the old
corporate headquarters, the significant municipal tax incentives
received in connection with the relocation and the savings from
consolidating three disparate headquarters from our legacy
businesses.
We had outgrown our old facilities and our analysis indicated that
the new space would be less expensive in the long run. Sandell
overstates the tax incentive amount we could have realized from
Columbus, and overstates the true, net cost of the corporate
headquarters by more than 50%.
(1)
Sandell presentation, filed with the SEC July 28, 2014
|
 47
G&A Reconciliation
(1)
For additional information, see the Company’s 4Q Fiscal 2014 earnings release
dated July 8, 2014. (2)
Included in BER reported SG&A.
(3)
Included in BEF reported SG&A.
In order to properly analyze the Company's G&A expense, it is important to
consider the Company's relatively unique business model and significant
non-recurring charges We believe the items in BER and BEF adjustments
noted below are generally not included in SG&A
FY14 SG&A
$ in thousands
Non-GAAP SG&A
(1)
% of Sales
BER
$79,804
BEF
64,783
Total SG&A
$144,587
10.9%
BER
Adjustments
(2)
Manager in Training Wages
$5,052
BEF
Adjustments
(3)
BEF Transportation
17,109
Advertising & Marketing
6,372
Corporate
Adjustments
Activist Shareholder Response
2,884
Internal Processes & Controls
2,988
Total Adjustments
$34,405
Total Adjusted BOBE SG&A
$110,182
8.3% |
 V.
Our
Leadership
–
Independent,
Highly Qualified and Open-Minded |
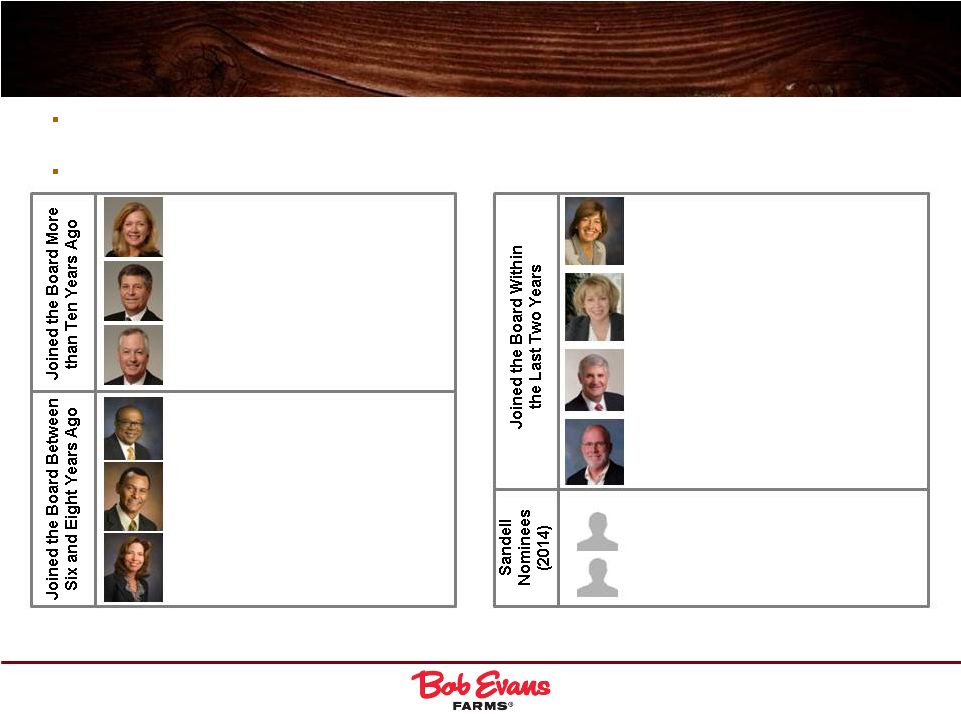 49
Bob Evans’
Proposal for a Fresh,
Independent Board
11 of
12
are
independent
(all
but
CEO),
at
least
six
are
current
or
former
CEOs
and
at
least
eight
have other public company board service
A majority of the independent directors would have been added within the last two
years Note:
Board
composition
following
2014
annual
meeting
of
stockholders
assuming
all
ten
Bob
Evans
nominees
and
two
of
Sandell’s
nominees
are
elected.
Since
the
Board
has
nominated
a slate of ten directors for the available twelve seats at the annual meeting, the
Board expects that at least two nominees who were not nominated by the Board will be elected at the
annual
meeting.
Selected
experience
noted;
please
refer
to
the
appendix
and
Bob
Evans’
proxy
statement
for
additional
background.
Mary Kay Haben
Former President-North America of the Wm. Wrigley Jr. Company;
Former Group Vice President and Managing Director North America of
the Wm. Wrigley Jr. Company; Former Executive of Kraft Foods Inc.
Board Member of Equity Residential and The Hershey Company
Kathleen S. Lane
Former EVP and CIO of TJX Companies, Inc.; Former Group CIO at
National Grid Plc.; Former SVP and CIO of Gillette Company (Procter
& Gamble)
Board Member of Earthlink Holdings Corp.
Larry S. McWilliams
Co-CEO of Compass Marketing; Former CEO at Keystone Foods
LLC; Former SVP at Campbell Soup Company
Board Member of Armstrong World Industries
Kevin M. Sheehan
President and CEO of Norwegian Cruise Line; Former CFO of
Norwegian Cruise Line; Former CFO of Cendant Corporation
Board Member of Norwegian Cruise Line and New Media Investment
Group, Inc.
Sandell Nominee
Sandell Nominee
Steven A. Davis, Chairman and CEO
Former President, Long John Silver’s and A&W All-American Food
Restaurants (Yum! Brands); Former SVP, Concept Development,
Pizza Hut, Inc. (Yum! Brands)
Board Member of Walgreen Co. and Marathon Petroleum Corp.
Michael J. Gasser, Lead Independent Director
Executive Chairman of the Board of Greif Inc.; Former CEO and
Chairman of the Board of Greif, Inc.
Board Member of Greif, Inc.
E.W. (Bill) Ingram III
CEO of White Castle System, Inc.; Former President of
White Castle System, Inc.
Cheryl L. Krueger
CEO of Krueger + Co., LLC; Former President and CEO and
Founder of Cheryl & Co., Inc.
Paul S. Williams
Managing Director, Major, Lindsey and Africa; Former Chief Legal
Officer and Executive Vice President, Cardinal Health, Inc.
Board Member of State Auto Financial Corp. and Compass
Minerals International, Inc.
Eileen A. Mallesch
Former SVP and CFO at Nationwide Property & Casualty Insurance;
Former SVP and CFO at Genworth Life Insurance; Former VP and
CFO at General Electric Financial Employer Services Group
Board Member of State Auto Financial Corp.
–
Director since 1993
–
Director since 1997
–
Director since 1998
–
Director since 2006
–
Director since 2007
–
Director since 2008
–
Director since 2012
–
Director since 2014
–
Director since 2014
–
Director since 2014 |
 50
Committed to Transparency and Fresh Thinking
Investor
friendly
–
receptive
to
feedback;
regularly
meets
and
engages
with
stockholders
Added four new independent, highly qualified directors in the last two years
o
Followed a well-planned strategy of Board succession with the assistance of
independent experts and search firms, most recently:
In late 2012/early 2013, as part of our regular process, we reviewed and updated
our skills matrix with an
independent
search
firm
to
identify
board
expertise
necessary
to
continue
driving
stockholder
value
Subsequently, we instructed the independent search firm to seek director
candidates with specific skills and expertise identified as desirable as a
result of the skills matrix analysis, and commenced evaluating and
interviewing candidates In
Spring
2014,
we
added
three
highly
qualified
directors
to
the
Board
with
invaluable
experience in
hospitality and entertainment, packaged foods and digital marketing
Sandell’s
claim
that
the
addition
of
these
directors
was
a
“knee-jerk”
response
accomplished
in
24
hours
after he made his nominations is preposterous
Overseen the steps we believe are necessary to create sustainable stockholder value
(e.g., disposed of over $125 million of assets since FY06)
o
Business acquisitions (e.g., Kettle Creations) and dispositions (e.g., Mimi’s
Café) o
Restaurant closures
o
Plant closures/consolidations
o
Real estate sales and disposals
o
Business transformations
DSD to warehouse conversion
Distribution center sale
Bob Evans has consistently demonstrated its commitment to transparency and
fresh, independent thinking |
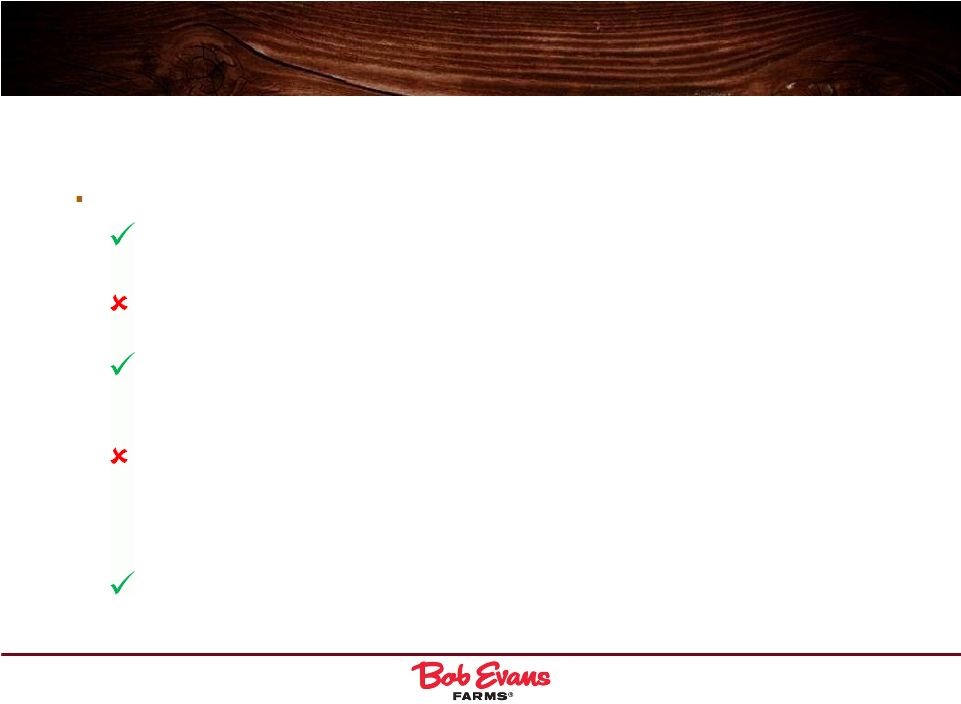
 51
Bob Evans is Committed to Corporate
Governance Best Practices
All independent directors (except CEO)
Annual
director
elections
–
no
classified
board
Majority vote election standard with a director resignation policy
Entirely
independent
nominating,
audit,
finance
and
compensation
committees
A lead independent director empowered with robust responsibilities
Strong stock ownership guidelines for directors
Board and committee-level self-evaluations for board effectiveness
No authorization to issue blank check preferred stock without stockholder
approval |
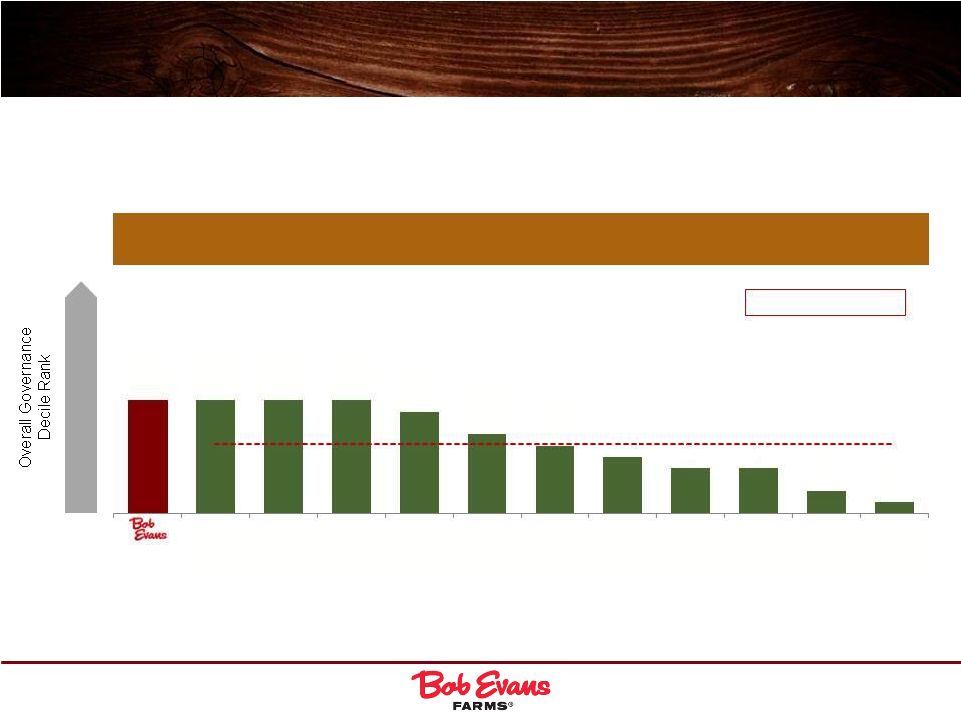 52
Bob Evans’
Governance Compares Favorably
with Sandell’s Peer Group
ISS Overall Governance QuickScore Versus
Sandell Family & Casual Dining Peers Plus DENN, DIN and RT¹
1
2
3
4
5
6
7
8
9
10
Mean ex. BOBE: 4.8
Institutional Shareholder Services (“ISS”) has awarded Bob Evans the
highest possible corporate governance score
1
1
1
1
2
4
5
6
7
7
9
10
EAT
DENN
RRGB
BJRI
CBRL
DIN
TXRH
CAKE
RT
BLMN
DRI
Note: QuickScore indicates decile rank relative to index or region. A decile score of 1 indicates
lower governance risk, while a 10 indicates higher governance risk. (1) Source: ISS
QuickScore 2.0 as of August 1, 2014 from Yahoo Finance. |
 53
Sandell
has
rebuffed
several
attempts
by
the
Board
to
settle
the
proxy
contest
In January 2014, the Board attempted to settle the contest by offering Sandell the
opportunity to consult with the Board in the addition of new independent
directors Sandell refused, and in April 2014 the Board subsequently added
three new independent, highly qualified directors identified by an
independent search firm In June 2014, the Board attempted to settle the
contest by offering to add two of Sandell's nominees to the Board and the
Finance Committee, and have the Finance Committee review Sandell's economic
proposals Sandell replied at the time that he would only accept less than
"majority representation" on the Board if, among other things, the
Board committed to divest BEF by the end of 2014 and execute a
sale-leaseback of nearly half of BER’s real estate within 90 days, and use
the
proceeds
to
repurchase
$350
million
of
Bob
Evans’
stock
within
90
days.
Sandell
also
demanded up to $2 million in reimbursement of expenses
The Board expressly left the door open for productive conversations, but was not
prepared to adopt the full Sandell economic agenda as a condition of
settlement Open to Constructive Dialogue
Bob Evans has attempted to engage in constructive dialogue with Sandell on
numerous occasions |
 54
Open to Constructive Dialogue (cont’d)
The Board remains committed to maintaining a dynamic,
independent and highly qualified Board
Bob Evans is and has been willing to settle the proxy contest with the addition
of an appropriate number of open-minded, independent directors
Following Bob Evans' disclosure of its repeated attempts to settle, Sandell contacted the
Board with an "exploding" offer that would have required the Board to add five of his
nominees, selected by Sandell in his sole discretion, to the Board Sandell demanded that two-thirds of
the Board, and all of the Finance Committee be composed of either new directors or directors
with only minimal experience - a turnover of two-thirds of the Board in the span of
less than three months The Board
then proposed a settlement that would have resulted in one-quarter of the Board and
one-third of the Finance Committee being composed of Sandell's nominees, and half of the
Board and half of the Finance Committee being composed of independent directors who joined the
Board in 2014 Sandell, rather than
engage in constructive dialogue, chose to issue an inflammatory press release in response to
our proposal |
 55
Would Sandell’s Slate Make Their Own Independent
Decisions
in
the
Best
Interest
of
All
Stockholders?
None of Sandell’s nominees agreed to the Board’s good-faith effort to
meet to evaluate their candidacy in accordance with the Company’s best
practices o
Immediately after the period for stockholder nominations, the Board reached out to
Sandell’s nominees in a good- faith effort to arrange meetings
between the nominees and certain of the Board’s independent directors to evaluate
their candidacy and independence
o
Sandell issued a press release asserting that Bob Evans was attempting to
interfere with the election process o
In the wake of that press release, only one of Sandell’s nominees responded
to the Board’s invitation to meet (he declined)
Bob Evans is concerned that election of all, or even a large bloc, of the Sandell
nominees may result in advocacy for Sandell’s interests over the
interests of all stockholders
o
Sandell is willing to undergo a costly and disruptive proxy contest rather than
engaging constructively with Bob Evans, and these nominees appear to
support Sandell’s efforts in doing so Each of Sandell's nominees is
contractually prohibited from publicly expressing any opinion on Bob Evans,
including on Sandell’s economic proposals, without Sandell's prior
permission o
Several of Sandell’s nominees have met with analysts and investors to discuss
Sandell’s plan, notwithstanding their inability to speak freely about
the Company and their refusal to meet with the Board’s independent directors
o
While
certain
of
his
nominees
have
told
analysts
that
they
are
not
committed
to
any
strategy
(1)
,
Sandell
asserts
–
directly to the contrary –
that if elected, his nominees “will take immediate steps to implement a
comprehensive plan
that
contemplates
operational,
financial
and
strategic
changes”
(2)
Sandell is compensating the nominees for their participation on Sandell’s slate,
and has agreed to reimburse the nominees for legal liability and expenses
arising out of their participation in the solicitation (1)
Miller Tabak & Co., May 14, 2014.
(2)
The Activist Report, July 2014.
Bob
Evans
seeks
a
resolution
that
would
include
some
of
the
Sandell
nominees
along
with
Bob Evans’
slate of highly qualified, independent directors |
 56
Sandell’s Misleading Claims/
Overstated Criticisms
¹
The Facts
Sandell claims that “All eight of
Sandell’s nominees are completely
independent of Sandell Asset
Management”
Each
of
Sandell's
nominees
is
contractually
prohibited
from
publicly
expressing
any
opinion
on
Bob
Evans,
including
on
Sandell’s
economic
proposals,
without
Sandell's
prior
permission
None of Sandell’s nominees agreed to the Board’s good-faith effort to
meet to evaluate their candidacy in accordance with corporate governance best
practices Sandell claims that Mimi’s Café
is an
example of “failed Board
stewardship of the highest order”
Sandell repeatedly refers to Mimi’s Cafe, a business that was acquired in 2004
and was sold months before Sandell
began
to
buy
Bob
Evans’
stock
Steve
Davis
was
appointed
CEO
and
seven
of
the
Company’s
10
nominees
joined
the
Board
after
Mimi’s
was
acquired
Following the Board's decision to divest Mimi’s, the Company's stock gained
~20% in value between announcement to explore strategic alternatives for
Mimi’s (11/19/12) and the announcement of the sale agreement
(1/28/13) Sandell claims that average director
tenure is in excess of 14 years
Sandell presents old, stale and inaccurate portraits of your Board's composition; he
overstates current director tenure by a factor of ~80%, criticizes retired
directors and pretends the three newest independent directors do not
exist Sandell’s calculations of director tenure include Gordon Gee, who
has not been a director for months, and Larry Corbin and Robert Lucas, who
are not standing for reelection, but curiously ignores Kathy Lane, Larry
McWilliams
and
Kevin
Sheehan,
who
each
joined
the
Board
in
April
2014
and
are
standing
for
reelection
Bob Evans’
nominees would have an average tenure of less than eight years,
which is below the average
tenure of 8.6 years for S&P boards
Sandell claims that Bob Evans’
Board is not committed to
“transparency and fresh,
independent thinking”
Bob Evans makes a practice of being available to investors, engaging in regular and
frequent communication and participating at most of the major consumer and
restaurant conferences As a result of our comprehensive investor outreach and
road shows, we have been able to increase research coverage from one to six
analysts over the past eight years The Board remains committed to maintaining
a dynamic, independent and highly qualified Board Bob Evans has attempted to
engage in constructive dialogue with Sandell on numerous occasions Bob Evans
is and has been willing to settle the proxy contest with the addition of an appropriate number of
open-minded, independent directors
Sandell has rebuffed several attempts by the Board to settle the
proxy contest
(1)
Sandell presentation, filed with the SEC August 4, 2014.
Setting the Record Straight: Governance |
 57
Sandell has Misled Investors From the Beginning
Sandell’s Misleading Claims/
Overstated Criticisms
The Facts
On May 30, 2014, Sandell claimed
that “at no point in our almost
year-long dialogue with the
Company has the Board shown
the slightest inclination toward
reaching an amicable resolution
with us”
In January 2013, the Board attempted to resolve the pending contest, and avoid the
significant time and expense of a proxy fight, by offering Sandell the
opportunity to consult with the Board in the identification and selection of
new independent candidates to be added to the Board prior to the Annual
Meeting. Sandell refused this offer Following Sandell’s nominations, the
Board publicly announced on April 28, 2014 that it would consider
the
candidates
in
connection
with
the
Board’s
nominations
for
election
–
when
Bob
Evans then sought to arrange meetings between Sandell’s nominees in a good
faith attempt to evaluate their candidacy, Sandell issued a press release
alleging that Bob Evans was attempting to “subvert”
the election process
On May 28, 2014, Sandell claimed
that the Board’s addition of three
new, highly-qualified and
independent directors to the
Board was a “knee-jerk
reactionary step”
in response to
Sandell’s nominations
In late 2012/early 2013, as part of our regular process, we reviewed and updated our
skills matrix with an independent search firm to identify board expertise
necessary to continue driving stockholder value
Subsequently, we instructed the independent search firm to seek director candidates
with specific skills and expertise identified as desirable as a result of the
skills matrix analysis, and commenced evaluating and interviewing candidates
As a result of this process, we added three highly qualified directors to the
Board with invaluable experience in hospitality and entertainment, packaged
foods and digital marketing/informational technology
On April 24, 2014, Sandell
claimed that the Board amended
the Company’s Bylaws to
enhance stockholder voice “only
after”
Sandell filed a lawsuit
The corporate governance changes announced by the Board in January to further
enfranchise stockholders went well beyond the changes sought by Sandell in
its lawsuit Throughout his year-long campaign, Sandell has regularly
distorted the truth, overstated his claims and made unfounded allegations, a
few of which are highlighted below |
 VI.
Conclusion –
Bob Evans: The Clear Choice |
 We
Believe We are the Right Team for Bob Evans and its Stockholders
59
We have transformed the business while returning over $800 million to shareholders
since FY07 (including over $250 million in FY14):
o
Divested Mimi's Café
o
Invested in BER restaurants (Farm Fresh Refresh program)
o
Consolidated and vertically integrated BEF operations
o
Investing in systems
We are confident that we have a clear plan for continued, sustainable value creation
as we emerge from this investment and transformation phase:
o
Profitably grow our core businesses
o
Selectively invest in high ROIC growth opportunities
o
Employ balanced approach to investment and return of meaningful capital to
stockholders Sandell’s
“plan”
of
financial
engineering
has
shifted
a
number
of
times
since
he
entered
the
stock
last
year:
o
Immediate divestiture of BEF
o
A sale-leaseback of a significant portion of BER’s owned real
estate o
Rapid, large share repurchase
Our Board has unanimously determined that Sandell’s agenda is not in the best
interests of the Company or its stockholders and that it is an attempt to
generate short-term profit: o
His proposals would result in increased leverage and would put the Company at
undue risk o
Bob Evans has attempted to engage in constructive, good faith discussions with
Sandell We are confident that Bob Evans’
current leadership is the right team to lead the Company and maximize stockholder
value:
o
Clear vision and concrete plan
o
Highly qualified Board, open-minded and engaged with stockholders
o
Committed to fresh, independent thinking of all investors and new perspective on
the Board o
Our proposed Board structure would result in an open-minded Board with diverse
perspectives and a range of tenure and would include two Sandell
nominees |
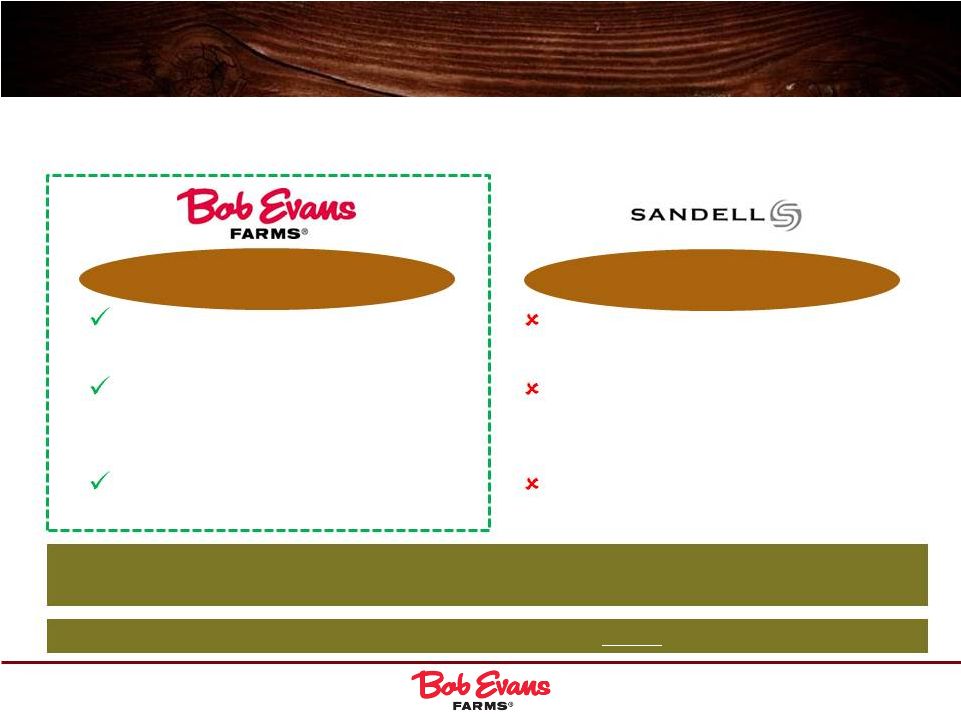 The
Choice is Clear 60
Vote
for
Bob
Evans’
Nominees
on
the
WHITE
Card
Continue to drive profitable growth of existing
businesses
Continue to employ balanced approach to
investment and return of meaningful capital to
stockholders
Regularly and proactively review strategy;
continually engage with stockholders
Divest Bob Evans Foods now, before reaping
benefits of our transformational investments
Sell real estate, losing strategic control of assets
while burdening Bob Evans with significant and
escalating annual rents and increased leverage
Rapidly effect large leveraged share repurchase
Sustainable, Disciplined,
Responsible, Open-Minded
Unsustainable,
Not in the Best Interest of All
Stockholders
The Board structure proposed by Bob Evans would result in a fully independent Board,
except for the CEO; a majority of the independent directors would be new to
the Board since 2012; and 5 of 11 independent directors would be new to the
Board this year, including two Sandell nominees Stockholders have a clear choice between what we
believe are two very different approaches for Bob Evans’ future: |
 Appendix |
 62
Bob Evans’
Highly Qualified Director Nominees
Kevin
M.
Sheehan,
60,
Independent
Director
–
Director
since
2014
Experience:
o
President and Chief Executive Officer of Norwegian Cruise Line, since 2010.
o
Chief Executive Officer of Norwegian Cruise Line since 2008, Chief Financial
Officer of Norwegian Cruise Line 2007 to 2010. o
Consultant to Cerberus Capital Management LP from 2006 to 2007, Clayton Dubilier
& Rice from 2005 to 2006. o
Distinguished visiting Professor of Accounting, Finance and Economics at Adelphi
University in New York. o
Chairman and Chief Executive Officer of Cendant Corporation’s Vehicle
Services Division, a global car and truck rental company,
with
global
responsibility
for
both
the
Avis
and
Budget
brands,
from
2003
to
2005.
o
Chief Financial Officer of Cendant Corporation from 2001 to 2003.
Other
Public
Company
Boards:
Norwegian
Cruise
Line;
New
Media
Investment
Group,
Inc.
Mr. Sheehan has significant experience in a senior management capacity for large
corporations. Larry
S.
McWilliams,
58,
Independent
Director
–
Director
since
2014
Experience:
o
Co-CEO of Compass Marketing since 2012, a marketing advisory firm to Fortune
500 consumer package companies. o
Chief Executive Officer at Keystone Foods LLC, a supplier of proteins and
distribution services to the McDonalds system, from 2011 to 2012.
o
Senior Vice President at Campbell Soup Company from 2001 to 2011.
o
President at Campbell International, responsible for Campbell’s business in
Europe, Latin America and Asia Pacific, from 2005 to 2010.
o
President of Campbell USA from 2004 to 2005.
o
President of Campbell Soup North America from 2003 to 2004.
o
Chief Customer Officer from 2001 to 2003.
o
General and Sale management positions at Coca-Cola Company from 1995 to
2001. o
Sales
positions
at
The
Pillsbury
Company
and
Bristol
Myers
Squibb
from
1983
to
1995.
Other
Public
Company
Boards:
Armstrong
World
Industries.
Mr. McWilliams was nominated to serve as a director because of his extensive
experience in food manufacturing, food marketing, food retailing, customer
and executive management as well as his knowledge of food proteins and restaurant
operations. |
 63
Bob Evans’
Highly Qualified Director
Nominees (cont’d)
Kathleen
S.
Lane,
57,
Independent
Director
–
Director
since
2014
Experience:
o
Executive
Vice
President
and
Chief
Information
Officer
of
TJX
Companies,
Inc.,
a
specialty
multi-national
apparel
retailer with leading retail brands such as T-J-Maxx, Marshalls, and
HomeGoods, from 2008 to 2013. o
Group Chief Information Officer at National Grid Plc., an international
electricity and gas utility, from 2006 to 2008. o
Senior Vice President and Chief Information Officer of Gillette Company (Procter
& Gamble) from 2002 to 2006. o
General Manager eBusiness & IT at General Electric Oil & Gas; SVP/CIO
General Electric Vendor Financial Services from 1998 to 2002.
o
IT Director at Pepsi-Cola International from 1997 to 1998.
o
IT
analyst
to
Technical
Section
Manager
at
Procter
&
Gamble
from
1984
to
1997.
Other
Public
Company
Boards:
Earthlink
Holdings
Corp.
Ms. Lane has 30 years of IT experience, including chief information officer roles
in the consumer products, financial services, utilities and retail
industries. Mary
Kay
Haben,
58,
Independent
Director
–
Director
since
2012
Experience:
o
President-North America of the Wm. Wrigley Jr. Company, a leading
confectionary company, from 2008 to 2011. o
Group Vice President and Managing Director North America of the Wm. Wrigley Jr.
Company from 2007 to 2008. o
Executive of Kraft Foods Inc. from 1979 to 2007.
Other
Public
Company
Boards:
Equity
Residential;
The
Hershey
Company.
Ms. Haben has been nominated to serve as a director because of her substantial
experience as a brand builder and consumer products business leader,
experience in marketing efforts in emerging social media, marketing innovation and
brand positioning, as well as acquisitions and productivity initiatives.
|
 64
Bob Evans’
Highly Qualified Director
Nominees (cont’d)
Eileen
A.
Mallesch,
58,
Independent
Director
–
Director
since
2008
Experience:
o
Senior Vice President and Chief Financial Officer at Nationwide Property &
Casualty Insurance, a $16 billion property & casualty insurance company
(Nationwide Insurance), from 2005 to 2009. o
Senior Vice President and Chief Financial Officer at Genworth Life Insurance from
2003 to 2005. o
Vice President and Chief Financial Officer at General Electric Financial Employer
Services Group from 2000 to 2003. Other
Public
Company
Boards:
State
Auto
Financial
Corp.
Ms.
Mallesch
was
nominated
to
serve
as
a
director
because
of
her
extensive
knowledge
and
significant
experience
in
the
areas
of
auditing,
finance,
enterprise
risk
management,
taxation
and
mergers
and
acquisitions;
she
is
also
a
certified
public
accountant and NACD Fellow (National Association of Corporate Directors).
Paul
S.
Williams,
54,
Independent
Director
–
Director
since
2007
Experience:
o
Managing Director, Major, Lindsey and Africa, a legal executive search firm since
2005. o
Chief Legal Officer and Executive Vice President, Cardinal Health, Inc., a
healthcare services provider from 2001 to 2005. Other
Public
Company
Boards:
State
Auto
Financial
Corp.;
Compass
Minerals
International,
Inc.
Mr.
Williams
was
nominated
to
serve
as
a
director
because
of
his
experience
as
a
lawyer
and
as
the
Chief
Legal
Officer
of
Cardinal
Health,
Inc.,
a
publicly
traded
company,
as
well
as
his
knowledge
of
mergers
and
acquisitions,
legal
and
regulatory
matters. |
 65
E.W.
(Bill)
Ingram
III,
63,
Independent
Director
–
Director
since
1998
Bob Evans’
Highly Qualified Director
Nominees (cont’d)
Mr. Ingram has been nominated to serve as a director because of his extensive
knowledge and significant experience in the areas of restaurant operations,
real estate, food service and production, as well as auditing and finance.
o
Chief Executive Officer of White Castle System, Inc., a quick-service
hamburger chain since 1972. o
President of White Castle System, Inc. from 1972 to 2013.
Experience:
Other
Public
Company
Boards:
Walgreen
Co.;
Marathon
Petroleum
Corp.
Mr. Davis was nominated to serve as a director because of his position as our
Chief Executive Officer and his significant experience in operating
restaurants. o
Chairman of the Board of Bob Evans Farms, Inc. since September 2006.
o
Chief Executive Officer of Bob Evans Farms, Inc. since May 2006.
o
President, Long John Silver’s and A&W All-American Food Restaurants
(Yum! Brands) from 2002 to 2006. o
Senior Vice President, Concept Development, Pizza Hut, Inc. (Yum! Brands) from
2000 to 2002. o
Director of Marketing, the All American Gourmet Brand, a division of Kraft General
Foods, from 1984 to 1993. Experience:
Steven A. Davis, 56, Chairman & CEO – Director since 2006 |
 66
Cheryl
L.
Krueger,
62,
Independent
Director
–
Director
since
1993
Bob Evans’
Highly Qualified Director
Nominees (cont’d)
Michael
J.
Gasser,
63,
Lead
Independent
Director
–
Director
since
1997
Experience:
o
Executive
Chairman
of
the
Board
of
Greif
Inc.,
a
manufacturer
of
shipping
containers
and
containerboard,
since
2012.
o
Chief
Executive
Officer
and
Chairman
of
the
Board
of
Greif,
Inc.
from
1994
to
2012.
Other
Public
Company
Boards:
Greif,
Inc.
Mr. Gasser has been nominated to serve as a director because of his extensive
knowledge and significant global experience and perspective in the areas of
auditing, finance, manufacturing, enterprise risk management, strategic planning, taxation
and mergers and acquisitions.
o
Chief Executive Officer of Krueger + Co., LLC, a strategic business consulting
firm since 2009. o
President and Chief Executive Officer and Founder of Cheryl & Co., Inc., a
manufacturer and retailer of gourmet foods and gifts, from 1981 to
2009. Experience:
Ms. Krueger was nominated to serve as a director because of her extensive
knowledge and significant experience in the areas of marketing and
branding, retail sales, business operations, on-line marketing and sales, manufacturing, as well as
auditing and finance. |
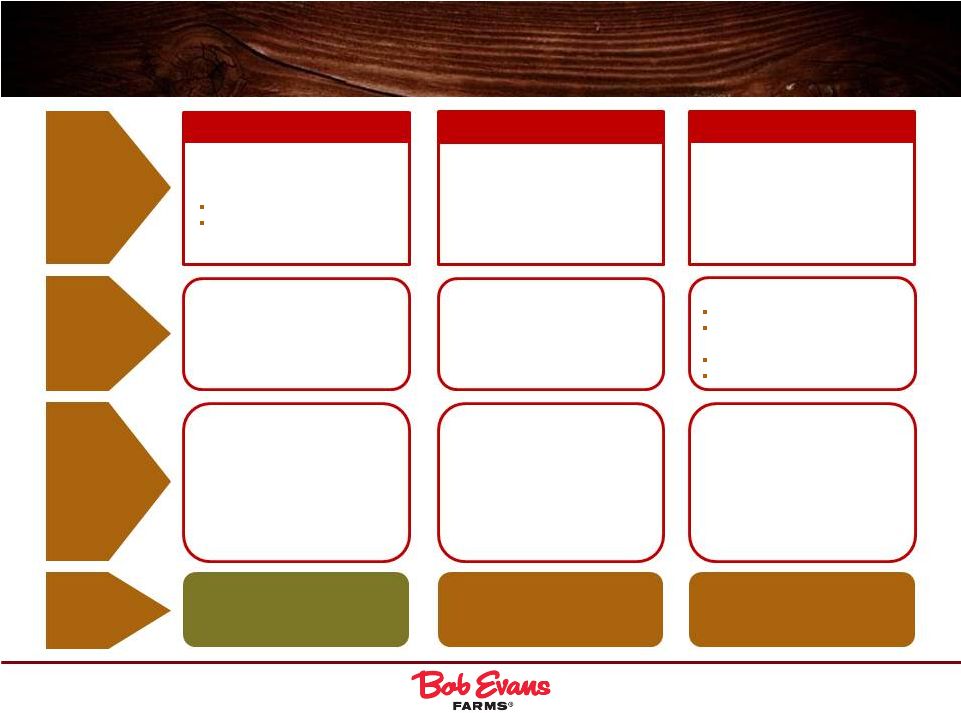 Taxes
67
Substantial Progress Made Remediating Material
Weaknesses
Complex Transactions
Errors concerning complex or
infrequent transactions -
Mimi’s Café
disposition
Fixed Assets
Remediation
Testing in Process
Remediation
Testing in Process
Strengthening –
Strengthening –
Strengthening –
Material
Weakness
Remediation
Focal Points
Remediation
Outcomes
Year End
Status
Remediated &
Tested
Impairment
Worthless stock deduction
•
Open reconciling items for
cost basis and accumulated
depreciation
•
Incorrect asset valuation due
to depreciation errors
•
Failure to capitalize assets
timely and per policy
•
Unreconciled deferred fixed
asset and current stock
compensation accounts
•
Prior year errors relating to
current and deferred tax
accounts
•
Quality & training of finance
staff
•
Review process
•
Effective key controls
Quality of personnel
Manual vs. automated
processes
Effective key controls
Reconciliation processes
•
Quality & training of
finance staff
•
Reconciliation processes
•
Monitoring and review
•
Effective key controls
•
New personnel hired in key
tax, accounting and
financial reporting roles
•
Strengthened policies &
procedures
•
Accounting research memo
process expanded
•
Enhanced disclosure
committee
•
New personnel leading
fixed assets
•
New key controls
implemented (operating
effectiveness to be tested)
•
Improved reconciliation
processes
•
New Tax Director and Manager
•
Implemented tax software and
rebuilt tax FA ledger
•
Key controls implemented
•
Improved reconciliation
processes |
 68
Historical SG&A Reconciliation
Sandell’s analysis of SG&A as % of revenue does not include key
adjustments; the majority of Sandell’s peers do not include advertising
and marketing expense in SG&A (1)
FY10 has 53 weeks.
FY09
FY10
(1)
FY11
FY12
FY13
FY14
Net Sales
1,750,512
1,726,904
1,676,906
1,654,413
1,608,909
1,328,552
SG&A
152,952
139,419
146,098
144,342
153,672
144,587
% of Sales
8.7%
8.1%
8.7%
8.7%
9.6%
10.9%
BEF Transportation in SG&A
10,232
10,561
10,034
12,548
11,426
17,109
BEF Advertising
7,580
9,338
8,638
8,370
9,863
4,344
BEF Marketing
0
0
829
1,339
1,925
2,028
BER MIT Wages
4,555
4,442
5,288
5,647
5,911
5,052
Advisory Costs
2,884
Internal Processes & Controls
2,988
Total Adjustments
22,367
24,341
24,789
27,905
29,125
34,405
Adjusted SG&A
130,585
115,078
121,309
116,437
124,547
110,182
% of Sales
7.5%
6.7%
7.2%
7.0%
7.7%
8.3% |
 69
FY15 Guidance Bridge
Guidance Issued on 3/4/14
2015 EPS Guidance
EPS
$2.80 -
$3.30
Same Store Sales Growth of 3.0% to 3.5%
Sow Costs $70 per hundred weight
Adjustments to Early Guidance
Sow Costs $85 per hundred weight
($0.41)
Same Store Sales Growth of 1.5% to 2.0%
(0.28)
Advisory Costs
(0.16)
Incremental ERP Costs
(0.08)
Internal Control Remediation
(0.03)
Other
0.06
Total
($0.90)
Revised Guidance
Normalized EPS
EPS
$1.90 -
$2.20 |
 70
Reconciliation of Adjusted EBITDA (Non-GAAP)
to Reported Operating Income (GAAP)
April 25, 2014
($ in thousands)
BER
BEF
GAAP Segments as Reported
Net Sales
$956,579
$371,973
Cost of Sales
244,871
204,199
Operating Wages and Fringe Benefits
360,646
40,609
Other Operating Expenses
164,901
33,733
Selling, General and Administrative
85,775
68,857
Depreciation and Amortization
63,872
15,584
Intangible Impairment
9,380
3,000
Loss on Sale of Mimi's Café
0
0
Operating Income (Loss)
$27,134
$5,991
Operating Income (Loss) as a % of Sales
2.8%
1.6%
Non-GAAP Adjustments
Net Sales
$0
$0
Cost of Sales
0
0
Operating Wages and Fringe Benefits
0
49
Other Operating Expenses
0
107
Selling, General and Administrative
(5,971)
(4,074)
Depreciation and Amortization
51
0
Intangible Impairment
(9,380)
(3,000)
Loss on Sale of Mimi's Café
0
0
Operating Income (Loss)
$15,300
$6,918
April 25, 2014
($ in thousands)
BER
BEF
Non-GAAP Segments as Reported
Net Sales
$956,579
$371,973
Cost of Sales
244,871
204,199
Operating Wages and Fringe Benefits
360,646
40,658
Other Operating Expenses
164,901
33,840
Selling, General and Administrative
79,804
64,783
Depreciation and Amortization
63,923
15,584
Intangible Impairment
0
0
Loss on Sale of Mimi's Café
0
0
Operating Income (Loss)
$42,434
$12,909
Operating Income (Loss) as a % of Sales
4.4%
3.5%
Depreciation & Amortization
63,923
15,584
EBITDA
$106,357
$28,493
EBITDA as a % of Sales
11.1%
7.7% |