Attached files
| file | filename |
|---|---|
| 8-K - FORM 8-K - ROYAL GOLD INC | v386064_8k.htm |
| EX-99.1 - EXHIBIT 99.1 - ROYAL GOLD INC | v386064_ex99-1.htm |

Fourth Quarter and Year End Fiscal 2014 Results August 7, 2014 Exhibit 99.2

Today’s Speakers August 7, 2014 2 Tony Jensen President and CEO Stefan Wenger CFO and Treasurer Bill Zisch VP Operations
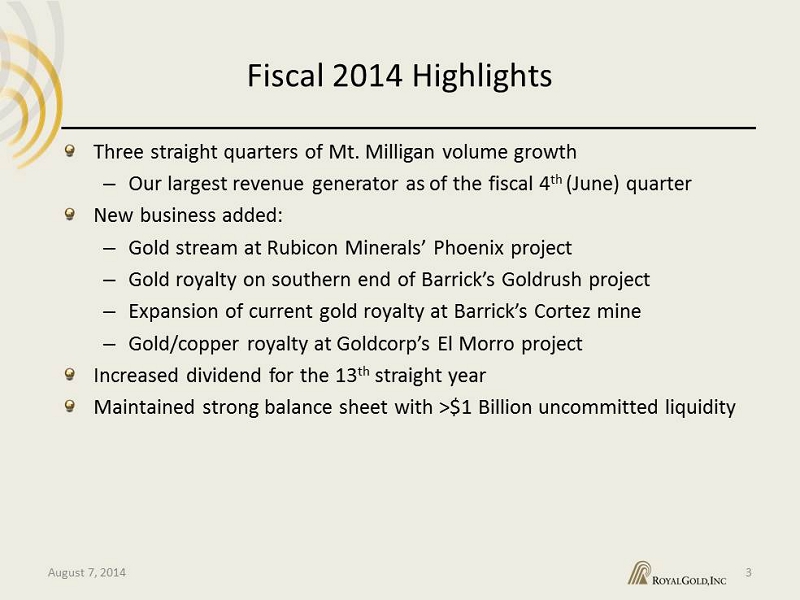
Fiscal 2014 Highlights 3 Three straight quarters of Mt . Milligan volume growth – Our largest revenue generator as of the fiscal 4 th (June) quarter New business added: – Gold stream at Rubicon Minerals’ Phoenix project – Gold royalty on southern end of Barrick’s Goldrush project – Expansion of current gold royalty at Barrick’s Cortez mine – Gold/copper royalty at Goldcorp’s El Morro project Increased dividend for the 13 th straight year Maintained strong balance sheet with >$1 Billion uncommitted liquidity August 7, 2014

Cautionary Statement This presentation contains certain forward-looking statements within the meaning of the Private Securities Litigation Reform Act of 1995 . Such forward - looking statements involve known and unknown risks, uncertainties, and other factors that could cause actual results to differ materially from the projections and estimates contained herein and include, but are not limited to : the production estimates from the operators of the Company’s properties ; the ramp - up, and deliveries from the Mt . Milligan mine ; that the Company expects DD&A rates of $ 400 to $ 450 per ounce for fiscal 2015 ; that the Company expects the conditions precedent to its $ 45 million in remaining payments to Rubicon Minerals to be satisfied ; and statements regarding projected steady or increasing production and estimates of timing of commencement of production from operators of properties where we have royalty interests, including operator estimates . Factors that could cause actual results to differ materially from these forward-looking statements include, among others : the risks inherent in construction, development and operation of mining properties, including those specific to a new mine being developed and operated by a base metals company ; changes in gold and other metals prices ; decisions and activities of the Company’s management ; unexpected operating costs ; decisions and activities of the operators of the Company’s royalty and stream properties ; unanticipated grade, geological, metallurgical, processing or other problems at the properties ; inaccuracies in technical reports and reserve estimates ; revisions by operators of reserves, mineralization or production estimates ; changes in project parameters as plans of the operators are refined ; the results of current or planned exploration activities ; discontinuance of exploration activities by operators ; economic and market conditions ; operations on lands subject to First Nations jurisdiction in Canada ; the ability of operators to bring non-producing and not - yet - in development projects into production and operate in accordance with feasibility studies ; errors in calculating royalty payments, or payments not made in accordance with royalty agreement provisions ; title defects to royalty properties ; future financial needs of the Company ; the impact of future acquisitions and royalty financing transactions ; adverse changes in applicable laws and regulations, including applicable tax laws and regulations ; litigation ; and risks associated with conducting business in foreign countries, including application of foreign laws to contract and other disputes, environmental laws, enforcement and uncertain political and economic environments . These risks and other factors are discussed in more detail in the Company’s public filings with the Securities and Exchange Commission . Statements made herein are as of the date hereof and should not be relied upon as of any subsequent date . The Company’s past performance is not necessarily indicative of its future performance . The Company disclaims any obligation to update any forward-looking statements . The Company and its affiliates, agents, directors and employees accept no liability whatsoever for any loss or damage of any kind arising out of the use of all or any part of this material . Endnotes located on page 13. 4 August 7, 2014

Strong Near Term Growth 5 0 10 20 30 40 Dec 2013 Quarter - Actual Mar 2014 Quarter - Actual June 2014 Quarter - Actual Full Projected Quarterly Run Rate Estimated Mt Milligan Payable Gold Ounces in Thousands to Royal Gold What Mt. Milligan will deliver on a quarterly basis 1 What Mt. Milligan will contribute to our total GEO’s 2 Other Mt Milligan 100,000 200,000 300,000 FY2014 Future Run Rate August 7, 2014
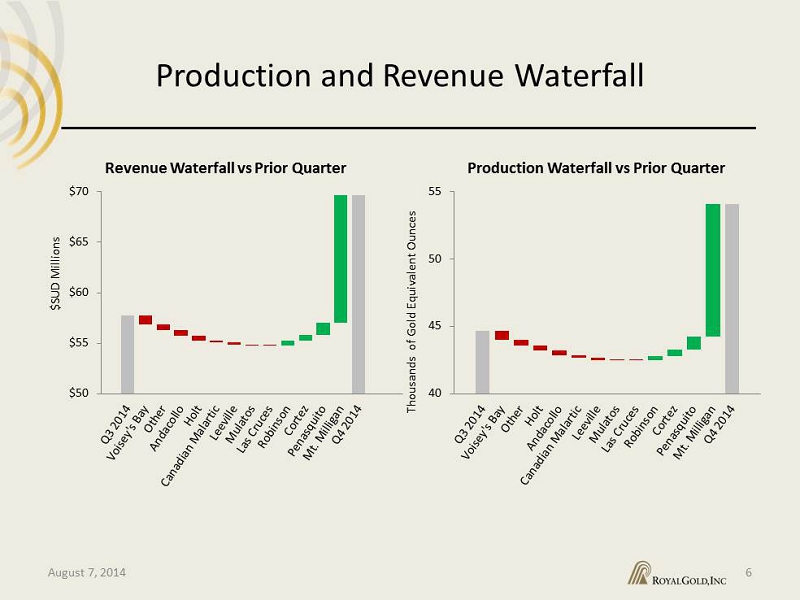
Production and Revenue Waterfall 6 Thousands of Gold Equivalent Ounces August 7, 2014 $50 $55 $60 $65 $70 $SUD Millions Revenue Waterfall vs Prior Quarter 40 45 50 55 Production Waterfall vs Prior Quarter
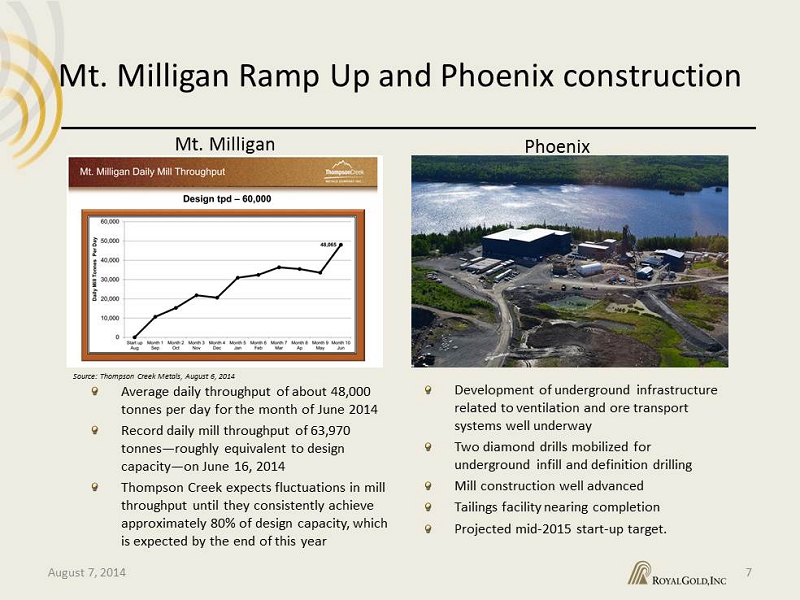
M t . Milligan Ramp Up and Phoenix construction August 7, 2014 7 A verage daily throughput of about 48,000 tonnes per day for the month of June 2014 Record daily mill throughput of 63,970 tonnes — roughly equivalent to design capacity — on June 16, 2014 Thompson Creek expects fluctuations in mill throughput until they consistently achieve approximately 80% of design capacity, which is expected by the end of this year Development of underground infrastructure related to ventilation and ore transport systems well underway Two diamond drills mobilized for underground infill and definition drilling Mill construction well advanced Tailings facility nearing completion Projected mid - 2015 start - up target . Mt. Milligan Phoenix Source: Thompson Creek Metals, August 6, 2014

CY 2014 Estimated Production Subject to our Interest and CYTD Actuals 8 August 7, 2014 Reported Production through June 30, 2014 (2) Gold Silver Base Metals Gold Silver Base Metals Royalty/Stream (oz.) (oz.) (lbs.) (oz.) (oz.) (lbs.) Andacollo (3) 38,500 - - 20,500 - - Canadian Malartic 344,000 - - 214,900 - - Cortez GSR1 125,000 - - 21,000 - - Cortez GSR2 151,000 - - 60,400 - - Cortez GSR3 276,000 - - 81,400 - - Cortez NVR1 228,000 - - 69,400 - - Holt 66,000 - - 33,200 - - Las Cruces Copper - - 152-159 million - - 82.7 million Mt. Milligan (3) 185,000-195,000 75,300 - - Mulatos 150,000-170,000 - - 68,000 - - Peñasquito 530,000-560,000 22-25 million 286,900 14.9 million Lead (3) 135-145 million - 88.6 million Zinc (3) 315-325 million 167.1 million Robinson (3,4) N/A N/A 9,700 Copper N/A 29.8 million Voisey's Bay (3,4) Copper N/A 19.4 million Nickel (5) N/A 66.8 million Calendar 2014 Operator’s Production Estimate (1)
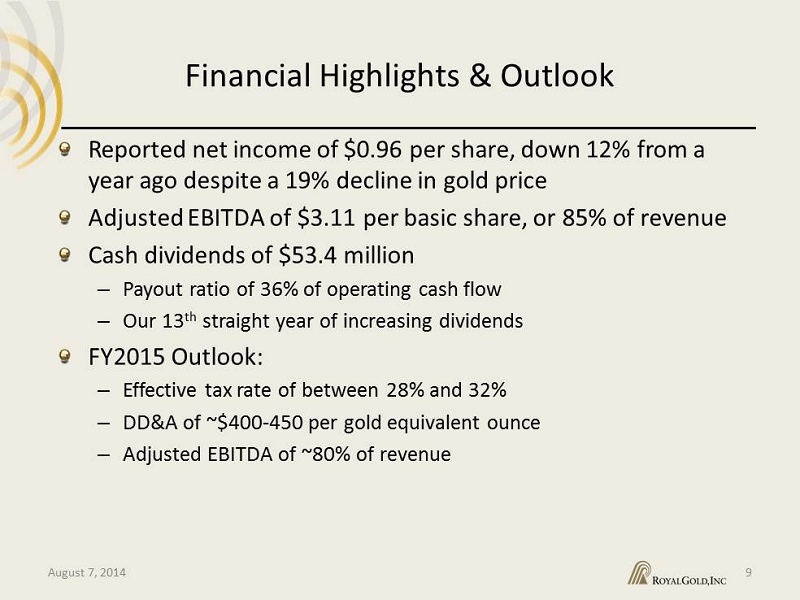
Financial Highlights & Outlook 9 Reported net income of $0.96 per share, down 12% from a year ago despite a 19% decline in gold price Adjusted EBITDA of $3.11 per basic share, or 85% of revenue Cash dividends of $53.4 million – Payout ratio of 36% of operating cash flow – Our 13 th straight year of increasing dividends FY2015 Outlook: – Effective tax rate of between 28% and 32% – DD&A of ~$400 - 450 per gold equivalent ounce – Adjusted EBITDA of ~80% of revenue August 7, 2014

Financial Strength 10 Strong Balance Sheet and Cash Flow in an Attractive Market $0 $200 $400 $600 $800 $1,000 $1,200 $1,400 Liquidity at 6/30/2014 Debt and Commitments LTM Operating Cash Flow $USD Millions * Includes Commitments for Goldrush ($7M), Phoenix ($45M) and Tulsequah Chief ($45M) $ 4 50M Undrawn Credit $714M Working Capital $370M convertible debt 2019 @2.875% $ 147M August 7, 2014 *

Next Phase of Growth Underway 11 Mt. Milligan ramping up and generating returns for shareholders Over $1 billion uncommitted Quality interests added at Phoenix, Goldrush and Cortez Attractive market environment where royalty and stream products offer a compelling cost of capital August 7, 2014

Endnotes

Endnotes 13 August 7, 2014 PAGE 5 STRONG NEAR TERM GROWTH 1. Full run rate Mt . Milligan Gold Deliveries considers estimated production of 262 , 000 ounces of gold annually during the first six years ; 195 , 000 ounces of gold thereafter, per Thompson Creek’s National Instrument 43 - 101 technical report filed on SEDAR, under Thompson Creek’s profile, on October 13 , 2011 . Royal Gold’s stream is 52 . 25 % of payable gold, multiplied by a 97 % payable factor . In the December 2013 quarter we received 2 , 149 ounces of physical gold from Mt . Milligan . In the March 2014 quarter Royal Gold received 4 , 780 ounces of physical gold . In the June 2014 quarter we received 21 , 900 ounces of gold and sold 14 , 400 ounces, and had 7 , 800 ounces in inventory at June 30 , 2014 that are not shown on the chart . 2. Gold equivalent ounces for fiscal 2014 were calculated by dividing actual revenue by the average gold price of $ 1 , 292 for fiscal 2014 . Gold equivalent ounces for the future period were calculated by dividing future estimated revenue by the spot price of approximately $ 1 , 300 on July 31 , 2014 . Net gold equivalent ounces at Mt . Milligan are based upon operator’s estimated annual production rate of 262 , 000 ounces of gold for the first six years, as reported by the operator, using a gold price of $ 1 , 300 per ounce for conversion purposes of the delivery payment . The future run rate is based on Royal Gold’s current entity model ( dated July 31 , 2014 ) estimate for fiscal year 2016 . This future estimate is subject to risks described in the Company’s cautionary statement as well as in the Company’s Annual Report on Form 10 - K . PAGE 8 CY 2014 Operator Production Estimates and CYTD Actuals 1. There can be no assurance that production estimates received from our operators will be achieved . Please refer to our cautionary language regarding forward - looking statements and risk factors in our Fiscal 2014 10 - K 2. Reported production relates to the amount of metal sales, subject to our royalty interests, for the period January 1 , 2014 through June 30 , 2014 , as reported to us by the operators of the mines . For our streaming interest at Mt . Milligan, reported production represents payable gold shipped, subject to our stream interest, during the January 1 , 2014 through June 30 , 2014 period . 3. The operator’s production estimate shown represents ounces of payable gold production . RGLD Gold’s anticipated gold deliveries associated with the payable gold production are derived by applying our streaming interest of 52 . 25 % . RGLD Gold’s deliveries are also subject to Thompson Creek’s shipping and settlement schedules, which are not known by RGLD Gold until after each shipment . 4. The operator did not release public production guidance for calendar 2014 . 5. Vale will transition the Voisey’s Bay nickel concentrate processing from its Sudbury and Thompson smelters to its new Long Harbour hydrometallurgical plant . The Company is discussing with Vale the calculation of the royalty when Long Harbour begins treatment of these nickel concentrates .
Appendix A: Property Portfolio

Financially Robust 15 Diverse Portfolio of Assets August 7, 2014

1660 Wynkoop Street Denver, CO 80202 - 1132 303.573.1660 info @royalgold.com www.royalgold.com