Attached files
| file | filename |
|---|---|
| 8-K - CURRENT REPORT - Naugatuck Valley Financial Corp | v385099_8k.htm |
Exhibit 99.1
PRESS RELEASE

Naugatuck Valley Financial Corporation Announces Their Second Quarter Results
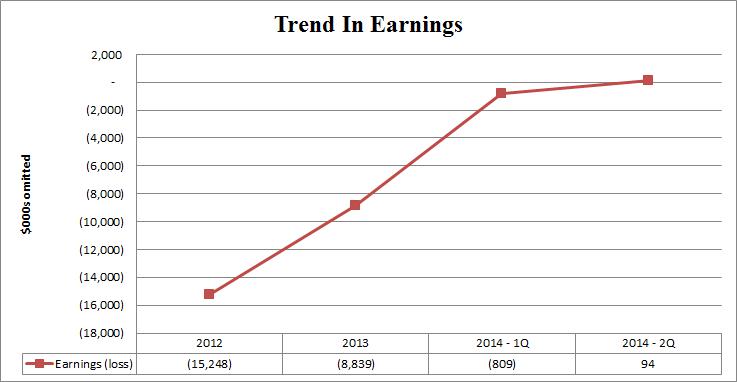
Naugatuck, CT, August 7, 2014. Naugatuck Valley Financial Corporation (the “Company”) (NASDAQ Global Market: “NVSL”), the parent company of Naugatuck Valley Savings and Loan (the “Bank”), announced today the Company earned $94 thousand, or $0.01 per diluted share, for the quarter ended June 30, 2014 compared to a net loss of $4.8 million, or ($0.72) per diluted share, for the quarter ended June 30, 2013. Furthermore, the Company also announced that the Bank has completed the sale of $11.4 million in primarily classified loans in three separate transactions with investors over the past fifty days. These sales have further reduced the Bank’s level of nonperforming assets and continued the improvement in the Bank’s asset quality metrics.
“Strengthening the Bank’s balance sheet through improvements in its asset quality and returning to profitability have been the top priorities of this management team since the second quarter of 2013,” said William C. Calderara, President and Chief Executive Officer. “Under this leadership team, we have made significant improvement in asset quality, liquidity and cost of funds and returned the Bank to profitability during the past fourteen months. These loan sale transactions were a key step in further reducing our risk profile giving us an even stronger foundation to continue to build our Bank to better serve the customers and our market.”
The sold loans had a book balance of $10.4 million including $10.2 million in adversely classified loans, of which $4.7 million were nonaccrual loans. Net proceeds amounted to $8.7 million, or approximately 83% of the book balance of these loans. The improvement in the Bank’s asset quality resulting from these loan sales is represented in the following key ratios:
| At June 30, 2014 (1) | At March 31, 2014 | |||||||
| Nonperforming assets to total assets | 1.19% | 2.31% | ||||||
| Adversely classified loans to total loans | 2.15% | 5.12% |
| (1) | Includes impact of loans sold in July 2014 which were held for sale at June 30, 2014. |
In the current quarter, these loan sales resulted in a loss on sale of $1.9 million which was more than offset by the impact of a $2.5 million credit to provision for loan losses brought about by the reduction in nonperforming loans through sale, and the significant improvement in the Bank’s loan portfolio at June 30, 2014. During the same quarter in 2013, the Bank had loan sales of $20.8 million with net charge-offs of $5.1 million attributable to those loan sales. The $4.8 million net loss incurred in 2Q 2013 was largely due to the $3.6 million provision for loan losses during that quarter.
For the six months ended June 30, 2014, the Company incurred a net loss of $715 thousand compared to a net loss of $5.4 million for the same period in 2013. Loss per diluted share for the six months ended June 30, 2014 was ($0.11) compared to ($0.81) for the same period in 2013.
Operating Highlights
The Company’s operating results for the second quarter of 2014, when compared to the same period of 2013, were influenced by the following:
| · | Provision for loan losses decreased by $6.0 million, or 170%, as asset quality improvements resulted in a $2.5 million credit provision in 2Q 2014 while $7.1 million in net charge-offs in 2Q 2013 drove the 2Q 2013 provision of $3.6 million. |
| · | Noninterest income decreased by $278 thousand, or 30%, primarily on 64% less mortgage banking income driven by significantly lower mortgage origination and loan sale volumes during the 2014 quarter. |
| · | Noninterest expenses increased by $819 thousand, or 13%, primarily due to the $1.9 million loss on loan sales during the 2014 quarter, which was a $1.2 million increase over the 2013 quarter for that expense category. |
Net Interest Income
Net interest income for the quarter ended June 30, 2014 decreased $43 thousand, or 1%, to $4.3 million which remained relatively unchanged compared to the quarter ended June 30, 2013. While the Company’s average balance of earning assets for the quarter ended June 30, 2014 decreased by $9.0 million, or 2%, compared with the prior year comparable quarter, the net interest margin increased to 3.49% for the quarter ended June 30, 2014 compared with 3.46% for the same quarter in 2013. The improvement in net interest margin was the result of the decrease in the cost of funds of 19 basis points exceeding the decrease in the average yield on earning assets of 13 basis points. The decrease in the cost of funds was primarily the result of continued repricing of the Company’s deposits, which drove the cost of deposits down by 13 basis points. In addition, the average cost of the Company’s FHLB advances for the second quarter of 2014 decreased by 124 basis points to 1.36% from 2.60% for the quarter ended June 30, 2013 as a result of management’s restructuring its FHLB advances in the third quarter of 2013 and new FHLB advances borrowed at lower market rates. The reduction in the average yield on earning assets was attributable to the shift in the earning asset mix as the average balance of loans and overnight balances held at the Federal Reserve Bank of Boston decreased by $50.5 million, or 12%, and $17.3 million, or 78%, respectively, and the average balance of investment securities increased by $58.9 million, or 129%. While the average balance of interest bearing liabilities only increased by $0.4 million for the second quarter of 2014 compared to the same quarter in 2013, the $12.8 million, or 3%, decrease in the average balance of interest bearing deposits was exceeded by the $13.3 million, or 28%, increase in borrowings.
Credit Quality
The provision for loan losses for the three months ended June 30, 2014 was ($2.5) million compared to $3.6 million for the same quarter in 2013. As stated above, the decrease in the provision was the result of significant improvements in the inherent credit risk exposure in the Bank’s loan portfolio brought about by loan sales and diligent workout efforts over the past year. In comparing relative loss experience, the Bank’s net charge-offs for the three and six month periods ended June 30, 2014 decreased to $85 thousand and $111 thousand, respectively, compared to $7.1 million and $7.6 million for the three and six month periods ended June 30, 2013, respectively.
Nonperforming loans decreased $5.0 million, or 48%, to $5.5 million, or 1.50% of loans, at June 30, 2014 from $10.6 million, or 2.86% of loans, at March 31, 2014 and decreased $7.8 million, or 59%, from $13.4 million, or 3.61% of loans, at December 31, 2013. Nonperforming assets of $6.1 million at June 30, 2014 decreased $5.6 million from $11.7 million, or 2.31% of total assets, at March 31, 2014 and decreased $9.1 million from $15.2 million, or 3.13% of total assets, at December 31, 2013. Adversely classified loans (i.e. loans classified substandard or doubtful) decreased $11.0 million, or 58%, from $18.9 million, or 5.12% of total loans, at March 31, 2014 and decreased $8.4 million, or 51%, from $16.4 million, or 4.42% of total loans, at December 31, 2013. The decreases in these asset quality metrics were primarily attributable to $4.7 million in nonaccrual loans and $10.2 million in adversely classified loans sold during June and July 2014.
At June 30, 2014, the Bank’s allowance for loan losses represented 1.97% of loans as compared to 2.67% of loans at December 31, 2013.
Noninterest Income
Noninterest income for the quarter ended June 30, 2014 was $658 thousand compared to $936 thousand for the same quarter in 2013, a decrease of $278 thousand, or 30%. Mortgage banking income, which includes the gains associated with the sales of one-to-four family fixed rate mortgage loans in the secondary market and income derived from the servicing of mortgage loans for others, decreased by $253 thousand, or 64%, due to significantly lower volume of mortgage loans sold during the 2014 quarter.
Noninterest Expense
Noninterest expense was $7.3 million for the quarter ended June 30, 2014 compared to $6.5 million for the quarter ended June 30, 2013, an increase of $819 thousand, or 13%. The year-over-year increase was primarily attributable to the increase in expenses and loss relating to loan sales of $1.2 million ($1.9 million in the 2014 quarter compared with $765 thousand in the 2013 quarter). Partially offsetting this increase, professional fees decreased by $314 thousand, or 49%, primarily due to management’s efforts in reducing its risk profile and its cost control efforts.
Selected Balance Sheet Data
Total assets at June 30, 2014 of $512.1 million increased from $486.8 million at December 31, 2013, an increase of $25.3 million, or 5%. Loans held for sale increased by $4.0 million, most of which was attributable to loan sales in process at June 30, 2014. Loans receivable, gross decreased by $845 thousand, or less than 1%, primarily due to the reduction from loan sales in the second quarter of 2014 offsetting new loan production. Investment securities available for sale increased $36.6 million, or 74%, during the six months ended June 30, 2014 as management grew the investment portfolio to increase the Bank’s net interest income.
Total liabilities at June 30, 2014 of $453.4 million increased $24.9 million, or 6%, from $428.5 million at December 31, 2013 primarily due to the $28.8 million increase in FHLB advances utilized to fund the increase in the Bank’s investment portfolio. During this six month period, deposits decreased $4.4 million, or 1%, as noninterest bearing transaction accounts decreased by $2.7 million, or 4%, and interest bearing deposits, primarily certificates of deposit, decreased by $2.2 million, or less than 1%.
Total stockholders’ equity was $58.7 million at June 30, 2014 compared to $58.2 million at December 31, 2013. The increase in stockholders’ equity was due to the net loss of $715 thousand for the six month period ended June 30, 2014 being more than offset by an increase in accumulated other comprehensive income of $1.1 million attributable to an increase in unrealized gain on available-for-sale investment securities during this period.
About Naugatuck Valley Savings and Loan
Naugatuck Valley Savings and Loan is headquartered in Naugatuck, Connecticut with eight other branches in Southwest Connecticut. The Bank is a community-oriented financial institution dedicated to serving the financial service needs of consumers and businesses within its market area.
Forward- Looking Statements
Certain statements in this press release that are not historical facts may constitute “forward-looking statements” within the meaning of the federal securities laws. These statements are based on the Company’s current expectations regarding its business strategies, intended results and future performance. Forward-looking statements are preceded by terms such as “expects”, “believes”, “anticipates”, “intends” and similar expressions.
Management’s ability to predict results or the effect of future plans or strategies is inherently uncertain. Factors which could affect actual results include interest rate trends, the general economic climate in the market area in which the Company operates, as well as nationwide, the Company’s ability to control costs and expenses, competitive products and pricing, loan delinquency rates and changes in federal and state legislation and regulation. Additional factors, risks and uncertainties that may affect our results are discussed in the Company’s Annual Report on Form 10-K and updated by the Company’s Quarterly Reports on Form 10-Q and other filings submitted to the Securities and Exchange Commission. These factors, risks and uncertainties should be considered in evaluating the forward-looking statements and undue reliance should not be placed on such statements. Forward-looking statements speak only as of the date on which they are made. The Company does not undertake any obligation to update any forward-looking statement to reflect circumstances or events that occur after the date the forward-looking statements are made.
Contact: Naugatuck Valley Financial Corporation
William Calderara or James Hastings
1-203-720-5000
| June 30, | December 31, | |||||||
| 2014 | 2013 | |||||||
| (In thousands) | ||||||||
| ASSETS | ||||||||
| Cash and due from depository institutions | $ | 8,699 | $ | 26,330 | ||||
| Investment in federal funds | 18 | 44 | ||||||
| Cash and cash equivalents | 8,717 | 26,374 | ||||||
| Investment securities available-for-sale, at fair value | 86,386 | 49,771 | ||||||
| Investment securities held-to-maturity, at amortized cost | 15,480 | 18,149 | ||||||
| Loans held for sale | 5,052 | 1,079 | ||||||
| Loans receivable, net | 362,324 | 360,568 | ||||||
| Accrued income receivable | 1,712 | 1,494 | ||||||
| Foreclosed real estate and repossessed assets, net | 536 | 1,846 | ||||||
| Premises and equipment, net | 9,390 | 9,364 | ||||||
| Bank owned life insurance | 10,261 | 10,132 | ||||||
| Federal Home Loan Bank of Boston (“FHLB”) stock, at cost | 5,210 | 5,444 | ||||||
| Other assets | 6,996 | 2,560 | ||||||
| Total assets | $ | 512,064 | $ | 486,781 | ||||
| LIABILITIES AND STOCKHOLDERS' EQUITY | ||||||||
| Liabilities | ||||||||
| Deposits | $ | 385,980 | $ | 390,847 | ||||
| FHLB advances | 54,164 | 25,293 | ||||||
| Other borrowed funds | 3,967 | 4,173 | ||||||
| Mortgagors' escrow accounts | 4,630 | 4,392 | ||||||
| Other liabilities | 4,673 | 3,842 | ||||||
| Total liabilities | 453,414 | 428,547 | ||||||
| Commitments and contingencies | ||||||||
| Stockholders' equity | ||||||||
| Preferred stock, $.01 par value; 1,000,000 shares authorized; | ||||||||
| no shares issued or outstanding | — | — | ||||||
| Common stock, $.01 par value; 25,000,000 shares authorized; | ||||||||
| 7,002,366 shares issued; 7,002,208 shares outstanding at | ||||||||
| June 30, 2014 and December 31, 2013, respectively | 70 | 70 | ||||||
| Paid-in capital | 58,759 | 58,757 | ||||||
| Retained earnings | 1,607 | 2,322 | ||||||
| Unearned employee stock ownership plan ("ESOP") shares (326,751 shares at | ||||||||
| June 30, 2014 and December 31, 2013) | (2,824 | ) | (2,824 | ) | ||||
| Treasury Stock, at cost (158 shares at June 30, 2014 and | ||||||||
| December 31, 2013) | (1 | ) | (1 | ) | ||||
| Accumulated other comprehensive income (loss) | 1,039 | (90 | ) | |||||
| Total stockholders' equity | 58,650 | 58,234 | ||||||
| Total liabilities and stockholders' equity | $ | 512,064 | $ | 486,781 | ||||
| Three Months Ended | Six Months Ended | |||||||||||||||
| June 30, | June 30, | |||||||||||||||
| (In thousands, except share data) | 2014 | 2013 | 2014 | 2013 | ||||||||||||
| Interest and fees on loans | $ | 4,200 | $ | 5,021 | $ | 8,412 | $ | 10,072 | ||||||||
| Interest and dividends on investments and deposits | 856 | 292 | 1,518 | 612 | ||||||||||||
| Total interest income | 5,056 | 5,313 | 9,930 | 10,684 | ||||||||||||
| Interest expense | ||||||||||||||||
| Interest on deposits | 598 | 752 | 1,203 | 1,538 | ||||||||||||
| Interest on borrowed funds | 189 | 249 | 342 | 543 | ||||||||||||
| Total interest expense | 787 | 1,001 | 1,545 | 2,081 | ||||||||||||
| Net interest income | 4,269 | 4,312 | 8,385 | 8,603 | ||||||||||||
| Provision for loan losses | (2,483 | ) | 3,550 | (2,483 | ) | 3,850 | ||||||||||
| Net interest income after provision for loan losses | 6,752 | 762 | 10,868 | 4,753 | ||||||||||||
| Noninterest income | ||||||||||||||||
| Service charge income | 176 | 182 | 350 | 360 | ||||||||||||
| Fees for other services | 138 | 180 | 232 | 290 | ||||||||||||
| Mortgage banking income | 140 | 393 | 276 | 895 | ||||||||||||
| Income from bank owned life insurance | 63 | 70 | 129 | 140 | ||||||||||||
| Net gain on sale of investments | 34 | (4 | ) | 193 | (4 | ) | ||||||||||
| Income from investment advisory services, net | 74 | 87 | 168 | 139 | ||||||||||||
| Other income | 33 | 28 | 63 | 53 | ||||||||||||
| Total noninterest income | 658 | 936 | 1,411 | 1,873 | ||||||||||||
| Noninterest expense | ||||||||||||||||
| Compensation, taxes and benefits | 2,973 | 2,896 | 5,989 | 5,573 | ||||||||||||
| Occupancy | 582 | 456 | 1,124 | 946 | ||||||||||||
| Professional fees | 323 | 637 | 842 | 1,296 | ||||||||||||
| FDIC insurance premiums | 270 | 249 | 531 | 454 | ||||||||||||
| Insurance | 117 | 124 | 262 | 282 | ||||||||||||
| Computer processing | 327 | 315 | 697 | 631 | ||||||||||||
| Expenses on foreclosed real estate, net | 168 | 202 | 378 | 559 | ||||||||||||
| Writedowns on foreclosed real estate | 11 | 49 | 38 | 60 | ||||||||||||
| Directors compensation | 70 | 77 | 172 | 211 | ||||||||||||
| Advertising | 118 | 108 | 213 | 195 | ||||||||||||
| Supplies | 60 | 48 | 129 | 109 | ||||||||||||
| Expenses and loss related to sale of loans | 1,940 | 765 | 1,940 | 765 | ||||||||||||
| Other expenses | 357 | 571 | 679 | 935 | ||||||||||||
| Total noninterest expense | 7,316 | 6,497 | 12,994 | 12,016 | ||||||||||||
| Income (loss) before provision (benefit) for income taxes | 94 | (4,799 | ) | (715 | ) | (5,390 | ) | |||||||||
| Provision (benefit) for income taxes | — | — | — | — | ||||||||||||
| Net income (loss) | $ | 94 | $ | (4,799 | ) | $ | (715 | ) | $ | (5,390 | ) | |||||
| Earnings (loss) per common share - basic and diluted (1) | $ | 0.01 | $ | (0.72 | ) | $ | (0.11 | ) | $ | (0.81 | ) | |||||
| (1) | Based on the following weighted average number of shares: |
| Basic | 6,675,457 | 6,610,729 | 6,675,457 | 6,610,729 | ||||||||||||
| Diluted | 6,716,556 | 6,610,729 | 6,675,457 | 6,610,729 |
| For the Three Months | For the Six Months | |||||||||||||||
| SELECTED PERFORMANCE RATIOS: (1) | Ended June 30, | Ended June 30, | ||||||||||||||
| 2014 | 2013 | 2014 | 2013 | |||||||||||||
| Return on average assets | 0.07% | N/M% | (0.29)% | N/M% | ||||||||||||
| Return on average equity | 0.65 | N/M | (2.48) | N/M | ||||||||||||
| Interest rate spread | 3.43 | 3.37 | 3.46 | 3.35 | ||||||||||||
| Net interest margin | 3.49 | 3.46 | 3.52 | 3.44 | ||||||||||||
| ASSET QUALITY RATIOS: | At June 30, | At March 31, | At December 31, | |||||||||
| 2014 | 2014 | 2013 | ||||||||||
| (Unaudited) | ||||||||||||
| (Dollars in thousands) | ||||||||||||
| Allowance for loan losses | $ | 7,297 | $ | 9,865 | $ | 9,891 | ||||||
| Allowance for loan losses as a percent of total loans | 1.97 | % | 2.67 | % | 2.67 | % | ||||||
| Allowance for loan losses as a percent of | ||||||||||||
| nonperforming loans | 131.52 | % | 93.15 | % | 73.91 | % | ||||||
| Nonperforming loans (3) | $ | 5,548 | $ | 10,590 | $ | 13,383 | ||||||
| Nonperforming loans as a percent of total loans | 1.50 | % | 2.86 | % | 3.61 | % | ||||||
| Nonperforming assets (2)(3) | $ | 6,084 | $ | 11,704 | $ | 15,229 | ||||||
| Nonperforming assets as a percent of total assets | 1.19 | % | 2.31 | % | 3.13 | % | ||||||
| (1) | All applicable ratios reflect annualized figures. |
| (2) | Nonperforming assets consist of nonperforming loans and foreclosed real estate. |
| (3) | Excludes loans held for sale at June 30, 2014 which were subsequently sold in July 2014. |
N/M - Not meaningful