Attached files
| file | filename |
|---|---|
| EX-99.1 - EX-99.1 - KINDRED HEALTHCARE, INC | d772078dex991.htm |
| EX-99.2 - EX-99.2 - KINDRED HEALTHCARE, INC | d772078dex992.htm |
| 8-K - 8-K - KINDRED HEALTHCARE, INC | d772078d8k.htm |
 Kindred
Healthcare Second Quarter Investor Update
August 6, 2014
Exhibit 99.3 |
 2
Forward-Looking Statements
This
presentation
includes
forward-looking
statements
within
the
meaning
of
Section
27A
of
the
Securities
Act
of
1933,
as
amended,
and
Section
21E
of
the
Securities
Exchange
Act
of
1934,
as
amended.
All
statements
regarding
the
potential
acquisition
of
Gentiva
Health
Services,
Inc.
(“Gentiva”)
(NASDAQ:GTIV)
(including
financing
of
the
proposed
transaction
and
the
benefits,
results,
effects
and
timing
of
such
transaction),
and
the
Company’s
expected
future
financial
position,
results
of
operations,
cash
flows,
financing
plans,
business
strategy,
budgets,
capital
expenditures,
competitive
positions,
growth
opportunities,
plans
and
objectives
of
management
and
statements
containing
the
words
such
as
“anticipate,”
“approximate,”
“believe,”
“plan,”
“estimate,”
“expect,”
“project,”
“could,”
“should,”
“will,”
“intend,”
“may,”
“potential”
and
other
similar
expressions,
are
forward-looking
statements.
Statements
in
this
presentation
concerning
the
Company’s
business
outlook
or
future
economic
performance,
anticipated
profitability,
revenues,
expenses
or
other
financial
items,
and
product
or
services
line
growth,
together
with
other
statements
that
are
not
historical
facts,
are
forward-looking
statements
that
are
estimates
reflecting
the
best
judgment
of
the
Company
based
upon
currently
available
information.
Such
forward-looking
statements
are
inherently
uncertain,
and
stockholders
and
other
potential
investors
must
recognize
that
actual
results
may
differ
materially
from
the
Company’s
expectations
as
a
result
of
a
variety
of
factors,
including,
without
limitation,
those
discussed
below.
Such
forward-looking
statements
are
based
upon
management’s
current
expectations
and
include
known
and
unknown
risks,
uncertainties
and
other
factors,
many
of
which
the
Company
is
unable
to
predict
or
control,
that
may
cause
the
Company’s
actual
results,
performance
or
plans
to
differ
materially
from
any
future
results,
performance
or
plans
expressed
or
implied
by
such
forward-looking
statements.
These
statements
involve
risks,
uncertainties
and
other
factors
discussed
below
and
detailed
from
time
to
time
in
Kindred’s
filings
with
the
Securities
and
Exchange
Commission.
In
addition
to
the
factors
set
forth
above,
other
factors
that
may
affect
the
Company’s
plans,
results
or
stock
price
include,
without
limitation,
(a)
the
impact
of
healthcare
reform,
which
will
initiate
significant
changes
to
the
United
States
healthcare
system,
including
potential
material
changes
to
the
delivery
of
healthcare
services
and
the
reimbursement
paid
for
such
services
by
the
government
or
other
third
party
payors,
including
reforms
resulting
from
the
Patient
Protection
and
Affordable
Care
Act
and
the
Healthcare
Education
and
Reconciliation
Act
(collectively,
the
“ACA”)
or
future
deficit
reduction
measures
adopted
at
the
federal
or
state
level.
Healthcare
reform
is
affecting
each
of
the
Company’s
businesses
in
some
manner.
Potential
future
efforts
in
the
U.S.
Congress
to
repeal,
amend,
modify
or
retract
funding
for
various
aspects
of
the
ACA
create
additional
uncertainty
about
the
ultimate
impact
of
the
ACA
on
the
Company
and
the
healthcare
industry.
Due
to
the
substantial
regulatory
changes
that
will
need
to
be
implemented
by
the
Centers
for
Medicare
and
Medicaid
Services
(“CMS”)
and
others,
and
the
numerous
processes
required
to
implement
these
reforms,
the
Company
cannot
predict
which
healthcare
initiatives
will
be
implemented
at
the
federal
or
state
level,
the
timing
of
any
such
reforms,
or
the
effect
such
reforms
or
any
other
future
legislation
or
regulation
will
have
on
the
Company’s
business,
financial
position,
results
of
operations
and
liquidity,
(b)
the
Company’s
ability
to
adjust
to
the
new
patient
criteria
for
long-term
acute
care
(“LTAC”)
hospitals
under
the
Pathway
for
SGR
Reform
Act
of
2013,
which
will
reduce
the
population
of
patients
eligible
for
the
Company’s
hospital
services
and
change
the
basis
upon
which
the
Company
is
paid,
(c)
the
impact
of
the
final
rules
issued
by
CMS
on
August
1,
2012
which,
among
other
things,
will
reduce
Medicare
reimbursement
to
the
Company’s
transitional
care
(“TC”)
hospitals
in
2013
and
beyond
by
imposing
a
budget
neutrality
adjustment
and
modifying
the
short-stay
outlier
rules,
(d)
the
impact
of
the
final
rules
issued
by
CMS
on
July
29,
2011
which
significantly
reduced
Medicare
reimbursement
to
the
Company’s
nursing
centers
and
changed
payments
for
the
provision
of
group
therapy
services
effective
October
1,
2011,
(e)
the
impact
of
the
Budget
Control
Act
of
2011
(as
amended
by
the
American
Taxpayer
Relief
Act
of
2012
(the
“Taxpayer
Relief
Act”))
which
instituted
an
automatic
2%
reduction
on
each
claim
submitted
to
Medicare
beginning
April
1,
2013,
(f)
the
costs
of
defending
and
insuring
against
alleged
professional
liability
and
other
claims
and
investigations
(including
those
related
to
pending
investigations
and
whistleblower
and
wage
and
hour
class
action
lawsuits
against
the
Company)
and
the
Company’s
ability
to
predict
the
estimated
costs
and
reserves
related
to
such
claims
and
investigations,
including
the
impact
of
differences
in
actuarial
assumptions
and
estimates
compared
to
eventual
outcomes,
(g)
the
impact
of
the
Taxpayer
Relief
Act
which,
among
other
things,
reduces
Medicare
payments
by
an
additional
25%
for
subsequent
procedures
when
multiple
therapy
services
are
provided
on
the
same
day.
At
this
time,
the
Company
believes
that
the
rules
related
to
multiple
therapy
services
will
reduce
its
Medicare
revenues
by
$25
million
to
$30
million
on
an
annual
basis,
(h)
changes
in
the
reimbursement
rates
or
the
methods
or
timing
of
payment
from
third
party
payors,
including
commercial
payors
and
the
Medicare
and
Medicaid
programs,
changes
arising
from
and
related
to
the
Medicare
prospective
payment
system
for
LTAC
hospitals,
including
potential
changes
in
the
Medicare
payment
rules,
the
Medicare
Prescription
Drug,
Improvement,
and
Modernization
Act
of
2003,
and
changes
in
Medicare
and
Medicaid
reimbursement
for
the
Company’s
TC
hospitals,
nursing
centers,
inpatient
rehabilitation
hospitals
and
home
health
and
hospice
operations,
and
the
expiration
of
the
Medicare
Part
B
therapy
cap
exception
process,
(i)
the
effects
of
additional
legislative
changes
and
government
regulations,
interpretation
of
regulations
and
changes
in
the
nature
and
enforcement
of
regulations
governing
the
healthcare
industry,
(j)
the
ability
of
the
Company’s
hospitals
and
nursing
centers
to
adjust
to
medical
necessity
reviews,
(k)
the
impact
of
the
Company’s
significant
level
of
indebtedness
on
its
funding
costs,
operating
flexibility
and
ability
to
fund
ongoing
operations,
development
capital
expenditures
or
other
strategic
acquisitions
with
additional
borrowings,
(l)
the
Company’s
ability
to
successfully
redeploy
its
capital
and
proceeds
of
asset
sales
in
pursuit
of
its
business
strategy
and
pursue
its
development
activities,
including
through
acquisitions,
and
successfully
integrate
new
operations,
including
the
realization
of
anticipated
revenues,
economies
of
scale,
cost
savings
and
productivity
gains
associated
with
such
operations,
as
and
when
planned,
including
the
potential
impact
of
unanticipated
issues,
expenses
and
liabilities
associated
with
those
activities,
(m)
the
Company’s
ability
to
pay
a
dividend
as,
when
and
if
declared
by
the
Board
of
Directors,
in
compliance
with
applicable
laws
and
the
Company’s
debt
and
other
contractual
arrangements,
(n)
the
failure
of
the
Company’s
facilities
to
meet
applicable
licensure
and
certification
requirements,
(o)
the
further
consolidation
and
cost
containment
efforts
of
managed
care
organizations
and
other
third
party
payors,
(p)
the
Company’s
ability
to
meet
its
rental
and
debt
service
obligations,
(q)
the
Company’s
ability
to
operate
pursuant
to
the
terms
of
its
debt
obligations,
and
comply
with
its
covenants
thereunder,
and
the
Company’s
ability
to
operate
pursuant
to
its
master
lease
agreements
with
Ventas,
Inc.
(NYSE:VTR),
(r)
the
condition
of
the
financial
markets,
including
volatility
and
weakness
in
the
equity,
capital
and
credit
markets,
which
could
limit
the
availability
and
terms
of
debt
and
equity
financing
sources
to
fund
the
requirements
of
the
Company’s
businesses,
or
which
could
negatively
impact
the
Company’s
investment
portfolio,
(s)
the
Company’s
ability
to
control
costs,
particularly
labor
and
employee
benefit
costs,
(t)
the
Company’s
ability
to
successfully
reduce
(by
divestiture
of
operations
or
otherwise)
its
exposure
to
professional
liability
and
other
claims,
(u)
the
Company’s
obligations
under
various
laws
to
self-
report
suspected
violations
of
law
by
the
Company
to
various
government
agencies,
including
any
associated
obligation
to
refund
overpayments
to
government
payors,
fines
and
other
sanctions,
(v)
national,
regional
and
industry-
specific
economic,
financial,
business
and
political
conditions,
including
their
effect
on
the
availability
and
cost
of
labor,
credit,
materials
and
other
services,
(w)
increased
operating
costs
due
to
shortages
in
qualified
nurses,
therapists
and
other
healthcare
personnel,
(x)
the
Company’s
ability
to
attract
and
retain
key
executives
and
other
healthcare
personnel,
(y)
the
Company’s
ability
to
successfully
dispose
of
unprofitable
facilities,
(z)
events
or
circumstances
which
could
result
in
the
impairment
of
an
asset
or
other
charges,
such
as
the
impact
of
the
Medicare
reimbursement
regulations
that
resulted
in
the
Company
recording
significant
impairment
charges
in
the
last
three
fiscal
years,
(aa)
changes
in
generally
accepted
accounting
principles
or
practices
(“GAAP”),
and
changes
in
tax
accounting
or
tax
laws
(or
authoritative
interpretations
relating
to
any
of
these
matters),
(bb)
the
Company’s
ability
to
maintain
an
effective
system
of
internal
control
over
financial
reporting,
(cc)
the
Company’s
ability
to
realize
the
anticipated
operating
and
financial
synergies
from
the
potential
acquisition
of
Gentiva,
(dd)
the
uncertainties
as
to
whether
Gentiva
or
any
other
companies
that
the
Company
may
acquire
will
have
the
accretive
effect
on
the
Company’s
earnings
or
cash
flows
that
are
expected,
and
(ee)
the
outcome
of
the
potential
acquisition
of
Gentiva,
including
the
Company’s
ability
to
realize
the
strategic
rationale
behind
the
Gentiva
acquisition.
Many
of
these
factors
are
beyond
the
Company’s
control.
The
Company
cautions
investors
that
any
forward-looking
statements
made
by
the
Company
are
not
guarantees
of
future
performance.
The
Company
disclaims
any
obligation
to
update
any
such
factors
or
to
announce
publicly
the
results
of
any
revisions
to
any
of
the
forward-looking
statements
to
reflect
future
events
or
developments.
In
addition
to
the
results
provided
in
accordance
with
GAAP,
the
Company
has
provided
information
in
this
presentation
to
compute
certain
non-GAAP
measurements
for
specified
periods
before
certain
charges
or
on
a
core
basis.
A
reconciliation
of
the
non-GAAP
measurements
to
the
GAAP
measurements
is
included
in
this
presentation
and
on
our
website
at
www.kindredhealthcare.com
under
the
heading
“Investors.”
2 |
 Kindred
Healthcare’s Second Quarter – Success and Opportunity
Continued Progress on Employee Engagement, Quality Assurance,
Clinical Outcomes and Patient Satisfaction Measures Across The Enterprise
Strong Second Quarter and First Half of the Year
Financial Results
Continued Progress Advancing Integrated Care Market Strategy and
Development of Care Management Capabilities
Completed Business Segment Repositioning, Refinancing and Successful
Equity Offering
Management Team, Balance Sheet and Industry Leading Infrastructure
Positioned for Growth!
Excited for the Opportunities in the Acquisition Pipeline
3 |
 4
Strong Second Quarter –
Continuing Operations
(1)
($ in millions, except statistics)
Actual
Prior Year
% change
Revenues
$1,276
$1,191
+7%
Operating expenses
1,098
1,025
Operating income
178
166
+7
Margin
13.9%
14.0%
Net income
19
15
Diluted EPS
$0.34
$0.27
+26
Diluted EPS - Reported
($0.48)
$0.25
(1) Before certain disclosed items reconciled in the Appendix.
•
Key Q2 operating metrics:
Strong revenue and operating income growth, both up 7%
Improving hospital volumes, nursing center and Kindred at Home growth, lower interest costs
and solid cost controls across the organization drove year-over-year
results Results exclude debt refinancing, severance, reorganization and transaction
costs in both periods •
Recent common stock equity offering of 9.7 million shares generated $221 million in net proceeds
used to repay the Company’s revolving credit facility
•
Refinancing of the Company’s existing secured and unsecured debt on April 9 lowers
borrowing costs, extends debt maturities and reduces interest rate risk
|
 5
Core Operating Margins
Annualized
impact
of
Medicare
cuts
($
in
millions):
--Sequestration
(effective
April
1,
2013)……………………………………………………………………………..
$45
--LTAC
Budget
Neutrality
(cumulative
impact
for
first
two
years
of
three-year
phase-in).……$35
--Rehab
Services
(effective
October
1,
2012
and
April
1,
2013)……………........................………$21 Total
$101
Margin Expansion Across Enterprise Reflects Full Recovery from Reimbursement Cuts
|
 6
2014 Earnings Guidance
(1)
Adjusted to exclude new discontinued operations
($ millions, except statistics)
Low
High
Low
High
Revenue
$5,100
$5,100
$5,200
$5,200
EBITDAR
707
724
715
732
Rent
330
330
335
335
EBITDA
377
394
380
397
D&A
161
161
163
163
EBIT
216
233
217
234
Interest , net
98
98
98
98
Pretax
118
135
119
136
Taxes
45
52
46
53
Net income
73
83
73
83
Noncontrolling interest
(15)
(15)
(15)
(15)
Income to Kindred
$58
$68
$58
$68
Shares
58.3
58.3
53.2
53.2
Diluted EPS
$0.96
$1.14
$1.05
$1.25
As of August 6, 2014
As of June 16, 2014
(1)
2014
earnings
guidance
reaffirmed
with
dilution
impact
of
Q2
equity
offering.
The earnings guidance excludes the effect of reimbursement changes, debt refinancing costs,
severance, retirement, retention and restructuring costs, litigation costs,
transaction costs, any further acquisitions or divestitures, any impairment charges, and any repurchases of common stock. |
 7
Post-Refinancing
Pre-Refinancing
Weighted Avg. Maturity: ~4.3 years
Upsized term loan to
$1 billion
Unstacked maturity
cliff in 2018
Reduced coupon on
ABL and Term Loan by
50bps and 25bps,
respectively
Reduced coupon on
unsecured notes by
1.875%
Increased duration of
notes by 3.0 years
Comments
$777.2
$750.0
$550.0
$1,527
$0
$500
$1,000
$1,500
$2,000
$2,500
2014
2015
2016
2017
2018
2019
2020
2021
2022
Term Loan
ABL
Unsecured
Weighted Avg. Maturity: ~7.3 years
$1,000.0
$750.0
$500.0
$0
$500
$1,000
$1,500
$2,000
$2,500
2014
2015
2016
2017
2018
2019
2020
2021
2022
Term Loan
ABL
Unsecured
Recapitalization Benefits
Funded Debt:
Equity Offering:
•
Completed an oversubscribed equity offering
•
$221M net proceeds
•
Increased shares outstanding from 54.8 million to 64.6 million
–
growth of 18%
($millions)
12/31/2013
Coupon
Maturity
ABL ($750mm)
$256.1
L+275 bps
Jun-18
Term Loan B
$777.2
L+275 bps
Jun-18
Unsecured
$550.0
8.25%
Jun-19
($millions)
6/30/2014
Coupon
Maturity
ABL ($750mm)
$43.6
L+225 bps
April-19
Term Loan B
$993.1
L+300 bps
April-21
Unsecured
$500.0
6.375%
April-22 |
 Rehab / LTAC
/ Skilled Nursing 8
Kindred’s Current Capital Structure and Leverage Ratio Are
Positioned Strongly Against Peers and Set for Growth!
Total Adjusted Debt / 2014 EBITDAR
Senior Living
Home Health
Median: 5.5x
7.3x
6.8x
6.5x
6.2x
6.2x
5.5x
5.2x
3.3x
3.3x
3.0x
3.0x
PF BKD
GTIV
FVE
SKH
AMED
SEM
KND
HLS
AFAM
ENSG
LHCG
Current Kindred adjusted debt/ LTM EBITDAR 5.2x with goal of 4.5x and
operating range of 4.5x to 5.5x
Source: CitiBank |
 Hospital
Division $2.5 billion Revenues
(1)
$518 million Operating Income
(2)
Transitional Care Hospitals (certified as LTAC hospitals)
•
97 Transitional Care Hospitals
(3)
•
7,145 licensed beds
(3)
Inpatient Rehabilitation Hospitals (IRFs)
•
5 IRFs
(3)
•
215 licensed beds
(3)
(1)
Revenues for the twelve months ended June 30, 2014 (divisional revenues before intercompany
eliminations). (2)
Operating income for the twelve months ended June 30, 2014.
(3)
As of June 30, 2014.
(4)
Before certain disclosed items reconciled in the Appendix.
•
Continued clinical success with low rates of
rehospitalizations and reduced employee
turnover with improved teammate engagement
•
Strong results with same-store admissions
increase of 3% and only 1% growth in core
operating costs per patient day; operating
income margin improvement to 21.7%
from 21.3%
(4)
9 |
 •
2,237 sites of service served through
23,058 therapists
(3)
•
Including 104 hospital-based acute
rehabilitation units
(3)
•
Therapists continue to deliver outstanding
clinical results and patient functional
improvement across sites of service
•
Sequential core operating income and margin
improvements for second quarter in a row
•
Added 57 net new skilled nursing rehabilitation
sites during first half of 2014
•
In October 2013, acquired TherEX which provides
on-site, hospital-based rehabilitation services in
11 states
$1.3 billion Revenues
(1)
$121 million Operating Income
(2)
(1)
Revenues for the twelve months ended June 30, 2014 (divisional revenues before intercompany
eliminations). (2)
Operating income for the twelve months ended June 30, 2014.
(3)
As of June 30, 2014.
10
Total Sites of Service
Productivity |
 Nursing Center
Division 47 Transitional Care Centers
(Sub-Acute facilities
licensed as SNFs)
(3)
13 Nursing and Rehabilitation Centers
(with Transitional Care Units)
(3)
12
Hospital-Based
Sub-Acute
Units
(3)
38
Skilled
Nursing
Centers
(Traditional
SNFs)
(3)
•
Reduced nurse turnover and
improved retention rates for all
teammates
•
Nursing center division core
operating income increased 11%
(4)
primarily due to growth in
revenues. Operating margins
significantly improved due to
improving reimbursement rates
and ongoing cost control initiatives
•
Admissions up 1% compared to
prior year
•
Declines in average length of stay
(ALOS) continue to weigh on
average daily census (ADC)
•
Divested of 55 of 59 nursing
centers leased from Ventas as of
August 1, 2014
$1.1 billion Revenues
(1)
$143 million Operating Income
(2)
(1)
Revenues for the twelve months ended June 30, 2014 (divisional revenues before intercompany
eliminations). (2)
Operating income for the twelve months ended June 30, 2014.
(3)
As of June 30, 2014.
(4)
Before certain disclosed items reconciled in the Appendix.
11
Nursing Center Operating Income Margin
(4) |
 •
Patient satisfaction for Home Health and Hospice remain
high with Home Health outcome measures outperforming
national benchmarks
•
Care Management division delivered 66% revenue growth
and doubled core operating income compared to prior year
•
Operating 202 sites of service in 13 states
•
Focus on integration efforts has improved margin from 7.5%
in Q2 2013 to 9.0%
(2)
in Q2 2014
•
Acquired
Silver
State
Accountable
Care
Organization
in
June
2014
•
Opportunities to expand Kindred Home Based Primary Care in
deal pipeline
12
•
202 sites of service in 13 states
•
69 in Kindred’s Integrated Care Markets
•
5,000
caregivers serving 16,100
patients on a daily basis
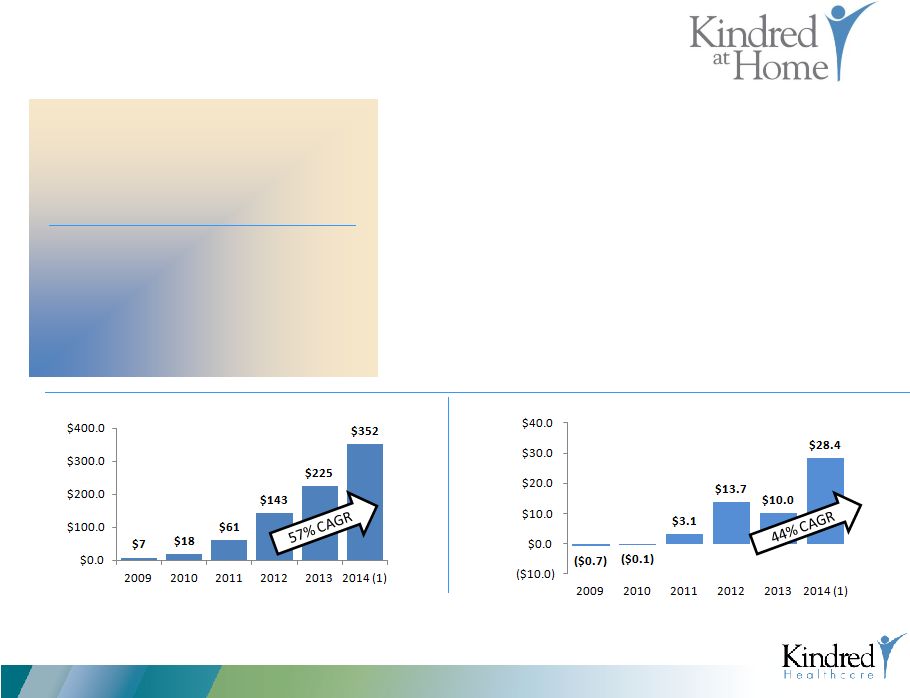
Care Management
Division/Kindred At Home $352
million Pro Forma Annualized
Revenues
(1
)
Care Management Division and
(1)
Annualized based upon revenues and operating income for the three months ended June 30,
2014 (2)
Before certain disclosed items reconciled in the Appendix.
Revenue
Operating Income |
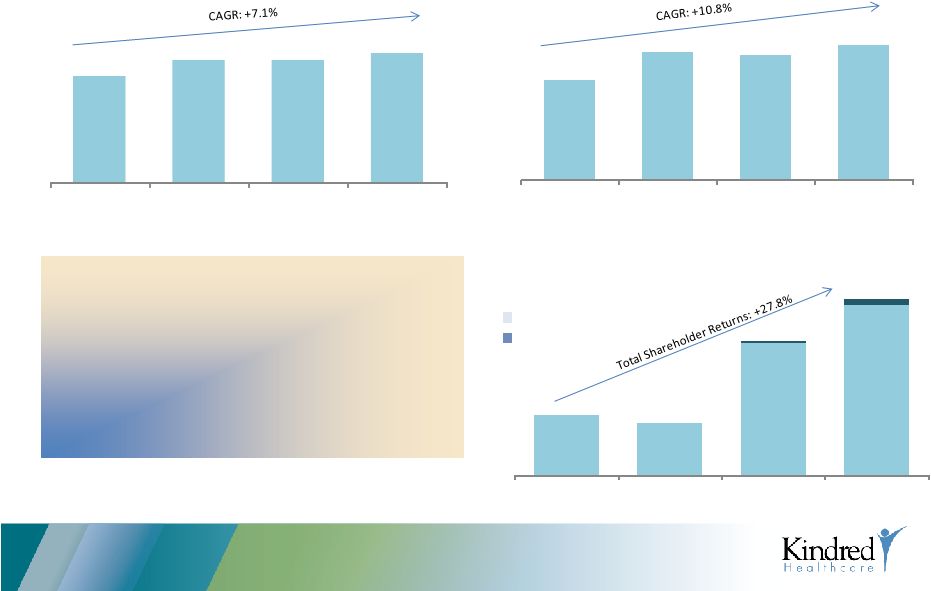 Delivered Attractive Financial Performances
13
(1)
Before certain disclosed items as reconciled in the Appendix
(2)
Reimbursement cuts totaled $70 million
(3)
Reflects midpoint of Company’s August 6, 2014 earnings guidance
Core Operating Margin
(1)
:
12.7%
13.9%
13.6%
14.0%
Share Price & Dividends
($ in millions)
Closing Share Price
Cumulative
Dividends
12/30/2011
12/31/2012
12/31/2013
8/5/2014
Despite sequential years of significant
reimbursement cuts and a whole-sale
restructuring of the Company’s business and
capital structure, the Company has delivered on
its promise to its patients, customers,
teammates and shareholders!
$4.2
$4.8
$4.8
$5.1
2011
2012
2013
2014
Revenue
($ in billions)
$529
$679
$658
$715
2011
2012
2013
2014
Core Operating Income
($ in millions)
(2)
$11.77
$10.82
$19.74
$23.99
$0.24
$0.60
(3) |
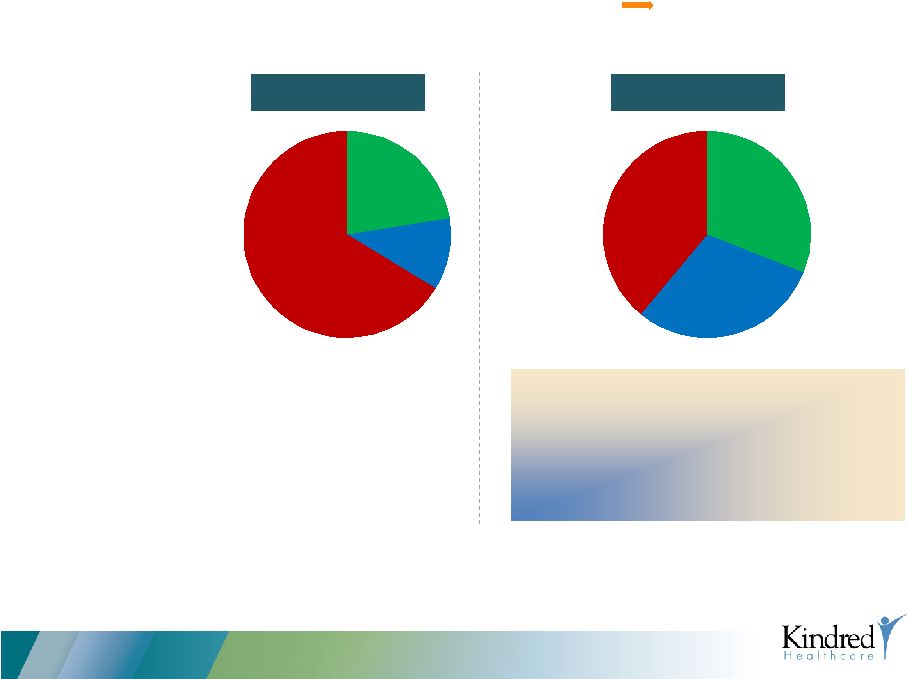
 Revenue
Mix1
(1)
Revenue before intercompany eliminations for 12 months ended 2010 and in line with full year
guidance for 2014. (2)
Before certain disclosed items as reconciled in the Appendix.
Yesterday –
2010
14
Profitability
EBITDA Margin
(2)
Revenue
Repositioning and Recapitalization Complete Growth Phase Begins
Today –
2014
0.0%
1.0%
2.0%
3.0%
4.0%
5.0%
6.0%
7.0%
8.0%
$0.0
$1.0
$2.0
$3.0
$4.0
$5.0
$6.0
KND is successfully shifting its business to faster growing businesses, improving margins,
profitability and operating cash flows |
 Equity
22.4%
Funded
Debt
11.3%
Capitalized
Leases
66.3%
Capital
Structure
(1)
15
Equity
31.0%
Funded
Debt
30.0%
Capitalized
Leases
39.0%
(1)
Leases capitalized using 6x rent; Equity represents market cap and Funded Debt
calculated as of 6/30/14 and 12/31/10 for 2010.
Repositioning and Recapitalization Complete Growth Phase Begins
Yesterday –
2010
Today –
2014
•
VTR Round I reduces capitalized lease exposure
by >$342M
•
VTR Round II reduces capitalized lease exposure
by >$360M
•
Add on equity offering completed in June 2014 |
 16
Track Record of Accretive M&A Growth
2012
2013
2014
2011
Date: Dec 2013/
Feb. 2014
Paid: $83.0mm
Date: Dec. 2013
Paid: $95.0mm
Date: Dec. 2012
Paid: $2.0mm
Date: Aug. 2012
Paid: $71.0mm
Date: Sept. 2011
Paid: $51.0mm
Date: April 2011
Paid: Undisclosed
Date: Sept. 2013
Paid: $14.0mm
Date: June 2011
Paid: $1.3bn
Date: Oct. 2011
Paid: Undisclosed
Homecare
Advantage
Real Estate of 9 SNFs
(Previously Leased from HCP)
Synergy Home
Health Care, Inc.
Date: Oct. 2013
Paid: Undisclosed
All Heart Home Health
and Hospice &
Western Reserve
Date: Spring/Summer 2013
Paid: Undisclosed
Mercy Continuing Care Hospital &
Qstaff Home Health &
Caring Hearts Home Health
Date: Jun. 2013
Paid: Undisclosed
Arrowhead
Home Health
Date: Jul. 2012
Paid: Undisclosed
Illinois Family
Kindred has a history of thoughtful, disciplined growth, and successfully integrating
acquisitions and achieving synergies. Current acquisition opportunities build on this
track record of success. |
 Demonstrated
Development Success by Line of Business 17
Footnotes:
-
Purchase multiple is calculated by investment amount (i.e. required cash at closing or capital
committed for de novo project) divided by trailing twelve month EBITDA as of 6/30/14.
-
KND Multiple derived using enterprise value and trailing twelve months EBITDA as of second
quarter 2014. -
Acquired revenue represents the trailing twelve month results ended 6/30/14.
$303
Home
Health &
Hospice
$250
LTAC
$13
Subacute
$56
IRF
Post RehabCare Acquisition, KND
has acquired $622 million in
revenues across our service lines
Acquisition Summary
($millions)
Advancing the Strategic Plan:
•
Successfully
divested
approx.
122
nursing
homes
and
15
hospitals
through
Ventas
non-renewals
and
other
transactions
while
deploying
approx.
$533M
of
capital
since
the
RehabCare
acquisition
to
grow
our
Integrated
Care
Markets
and
Care
Management
Division
Acquired Revenues
by Service Line:
Subacute
IRF
Home
Health
LTAC
Revenues
$13
$56
$303
$250
EBITDA Margin
15%
12%
11%
21%
Revenues
$622
EBITDA Margin
15%
Purchase Price
533
$
Post-Acquisition Purchase Multiple
5.6x
EPS / $10M
$0.010
Total Development |
 18
Lower
Higher
What Are Our Development Priorities?
•
Home Health & Hospice
•
Rehab
•
Home Based Primary Care
•
ALF platform
Assets across all business lines that
in-fill our integrated care markets
and enable our “Continue-the-Care”
strategy.
Core assets at reasonable value that
enhance the execution of the
Integrated Care Market strategy
while driving earnings.
While prioritization of initiatives is important for focusing efforts, Kindred is
positioned to execute across the prioritization spectrum.
Preference
Higher
Lower
Key Considerations:
•
Does it advance our “Continue the Care”
strategy
•
Does it offer strong returns within the asset class
•
Does it build out our integrated care markets
•
Does it lead to population health and risk taking
•
Does it meet our financial criteria
Priorities: |
 19
Hospitals (LTACs and
IRFs
Rehab Services
Transitional Care
Centers (Sub-Acute)
Home Care and Hospice
Assisted Living
Communities
Care Management
Services
Robust Pipeline of Growth Opportunities
•
Since 2011, Kindred has invested
in over $1.1 billion in acquisitions
that have created significant
value
•
Kindred continues to be the
buyer of choice for high quality
assets within the post-acute
sector
•
Kindred has a robust pipeline of
potential acquisition
opportunities and continues to
be poised for growth
Each Kindred business line has numerous opportunities for organic and
transactional growth. |
 *
*
* |
 Appendix
21
*
*
*
*
*
*
*
*
* |
 Explanation of
Non-GAAP Measures The enclosed presentation includes financial measures referred to
as operating income, or earnings before interest, income taxes, depreciation,
amortization and rent. The Company’s management uses operating income as a meaningful
measure of operational performance in addition to other measures. The Company uses
operating income to assess the relative performance of its operating divisions as well as the employees that operate these
businesses. In addition, the Company believes this measurement is important because securities
analysts and investors use this measurement to compare the
Company’s
performance
to
other
companies
in
the
healthcare
industry.
The
Company
believes
that
income
(loss)
from
continuing
operations
is
the
most comparable GAAP measure. Readers of the Company’s financial information should
consider income (loss) from continuing operations as an important measure of the
Company’s financial performance because it provides the most complete measure of its performance.
Operating income should be
considered in addition to, not as a substitute for, or superior to, financial measures based
upon GAAP as an indicator of operating performance. A reconciliation of operating
income to income (loss) from continuing operations is provided in the enclosed Appendix.
In addition to the results provided in accordance with GAAP, the
Company provides information in the enclosed presentation to compute certain non-GAAP
measurements
for
the
twelve
months
ended
June
30,
2014
and
three
months
ended
June
30,
2014
and
2013
before
certain
charges
or
on
a
core
basis.
The
charges that were excluded from core operating results are denoted in the tables in the
enclosed Appendix. The use of these non-GAAP measurements are not intended to
replace the presentation of the Company's financial results in accordance with GAAP. The
Company
believes
that
the
presentation
of
core
operating
results
provides
additional
information
to
investors
to
facilitate
the
comparison
between
periods
by excluding certain charges for the twelve months ended June 30, 2014 and three months ended
June 30, 2014 and 2013 that the Company believes are not representative of its ongoing
operations due to the materiality and nature of the charges. The Company's core operating results also represent a key
performance measure for the purpose of evaluating performance internally.
22 |
 Reconciliation
of Non-GAAP Measures ($ in thousands)
23
Twelve
2013 Quarters
2014 Quarters
months ended
First
Second
Third
Fourth
First
Second
June 30, 2014
Revenues:
Hospital division
657,814
$
606,604
$
594,154
$
606,988
$
646,458
$
632,156
$
2,479,756
$
Nursing center division
270,205
264,847
265,696
270,080
277,902
280,255
1,093,933
Rehabilitation division:
Skilled nursing rehabilitation services
258,750
249,647
245,330
243,280
254,255
253,989
996,854
Hospital rehabilitation services
74,523
69,777
68,296
74,017
73,964
75,324
291,601
333,273
319,424
313,626
317,297
328,219
329,313
1,288,455
Care management division
51,621
53,039
53,801
66,466
87,704
87,986
295,957
1,312,913
1,243,914
1,227,277
1,260,831
1,340,283
1,329,710
5,158,101
Eliminations:
Skilled nursing rehabilitation services
(28,657)
(28,660)
(28,151)
(28,157)
(29,646)
(30,031)
(115,985)
Hospital rehabilitation services
(23,609)
(23,223)
(22,520)
(22,123)
(23,233)
(22,855)
(90,731)
Nursing centers
(1,213)
(1,001)
(1,161)
(875)
(662)
(860)
(3,558)
(53,479)
(52,884)
(51,832)
(51,155)
(53,541)
(53,746)
(210,274)
1,259,434
$
1,191,030
$
1,175,445
$
1,209,676
$
1,286,742
$
1,275,964
$
4,947,827
$
Income (loss) from continuing operations:
Operating income (loss):
Hospital division
147,493
$
129,366
$
112,483
$
126,788
$
145,395
$
132,878
$
517,544
$
Nursing center division
29,145
36,018
31,505
35,585
38,471
36,880
(b)
142,441
Rehabilitation division:
Skilled nursing rehabilitation services
13,239
21,623
(7,209)
14,260
18,328
19,982
(b)
45,361
Hospital rehabilitation services
18,132
19,573
18,215
18,005
19,820
20,084
(b)
76,124
31,371
41,196
11,006
32,265
38,148
40,066
121,485
Care management division
2,786
3,961
1,085
2,131
4,697
7,065
(b)
14,978
Corporate:
Overhead
(45,585)
(43,196)
(39,157)
(48,557)
(44,050)
(48,365)
(b)
(180,129)
Insurance subsidiary
(509)
(384)
(482)
(539)
(406)
(443)
(1,870)
(46,094)
(43,580)
(39,639)
(49,096)
(44,456)
(48,808)
(181,999)
Impairment charges
(187)
(438)
(441)
(76,127)
-
-
(76,568)
Transaction costs
(944)
(108)
(613)
(447)
(683)
(4,496)
(6,239)
Operating income
163,570
166,415
115,386
71,099
181,572
163,585
531,642
Rent
(76,519)
(77,324)
(76,762)
(80,921)
(81,048)
(80,209)
(c)
(318,940)
Depreciation and amortization
(41,598)
(38,554)
(36,507)
(37,547)
(39,337)
(39,442)
(152,833)
Interest, net
(28,074)
(27,600)
(24,389)
(23,900)
(25,616)
(78,081)
(d)
(151,986)
Income (loss) from continuing operations
before income taxes
17,379
22,937
(22,272)
(71,269)
35,571
(34,147)
(92,117)
Provision (benefit) for income taxes
6,505
9,208
(6,510)
(20,522)
13,585
(13,082)
(26,529)
10,874
$
13,729
$
(15,762)
$
(50,747)
$
21,986
$
(21,065)
$
(65,588)
$
|
 Reconciliation
of Non-GAAP Measures (continued)
($ in thousands)
24
Three months ended
June 30,
2014
2013
Detail of charges:
Severance and other restructuring costs
($4,950)
$0
Litigation costs
(4,600)
-
Transaction costs
(4,496)
(108)
Lease cancellation charges (rent expense)
(247)
-
Debt refinancing charges (interest expense)
(56,643)
(1,365)
(70,936)
(1,473)
Income tax benefit
26,295
544
Charges net of income taxes
(44,641)
(929)
Allocation to participating unvested restricted stockholders
-
31
Available to common stockholders
($44,641)
($898)
Weighted average diluted shares outstanding
53,714
52,284
Diluted loss per common share related to charges
($0.83)
($0.02)
Reconciliation of operating income before charges:
Operating income before charges
$177,631
$166,523
Detail of charges excluded from core operating results:
Severance and other restructuring costs
(4,950)
-
Litigation costs
(4,600)
-
Transaction costs
(4,496)
(108)
(14,046)
(108)
Reported operating income
$163,585
$166,415
Reconciliation of income from continuing operations before charges:
Amounts attributable to Kindred stockholders:
Income from continuing operations before charges
$18,748
$14,542
Charges net of income taxes
(44,641)
(929)
Reported income (loss) from continuing operations
($25,893)
$13,613
Reconciliation of diluted income per common share from continuing operations
before charges:
Diluted income per common share before charges (a)
$0.34
$0.27
Charges net of income taxes
(0.83)
(0.02)
Other
0.01
-
Reported diluted income (loss) per common share from
continuing operations ($0.48)
$0.25
Weighted average diluted shares used to compute income per common share
from continuing operations before charges
53,792
52,284
Reconciliation of effective income tax rate before charges:
Effective income tax rate before charges
35.9%
40.0%
Impact of charges on effective income tax rate
2.4%
0.1%
Reported effective income tax rate
38.3%
40.1%
(a)
For purposes of computing diluted earnings per common share before charges, income from
continuing operations before charges was reduced by $0.6 million and $0.5 million for
the three months ended June 30, 2014 and 2013, respectively, for the allocation of
income to participating unvested restricted stockholders. |
 Reconciliation
of Non-GAAP Measures (continued)
($ in thousands)
25
Three months ended June 30, 2014
Charges
Severance
Before
and other
Debt
Transaction
As
charges
restructuring
Litigation
refinancing
costs
Total
reported
Income (loss) from continuing operations:
Operating income (loss):
Hospital division
137,478
$
-
$
(4,600)
$
-
$
-
$
(4,600)
$
132,878
$
Nursing center division
40,085
(3,205)
-
-
-
(3,205)
36,880
Rehabilitation division:
Skilled nursing rehabilitation services
20,158
(176)
-
-
-
(176)
19,982
Hospital rehabilitation services
20,254
(170)
-
-
-
(170)
20,084
40,412
(346)
-
-
-
(346)
40,066
Care management division
7,908
(843)
-
-
-
(843)
7,065
Corporate:
Overhead
(47,809)
(556)
-
-
-
(556)
(48,365)
Insurance subsidiary
(443)
-
-
-
-
-
(443)
(48,252)
(556)
-
-
-
(556)
(48,808)
Transaction costs
-
-
-
-
(4,496)
(4,496)
(4,496)
Operating income
177,631
(4,950)
(4,600)
-
(4,496)
(14,046)
163,585
Rent
(79,962)
(247)
-
-
-
(247)
(80,209)
Depreciation and amortization
(39,442)
-
-
-
-
-
(39,442)
Interest, net
(21,438)
-
-
(56,643)
(56,643)
(78,081)
Income (loss) from continuing operations
before income taxes
36,789
(5,197)
(4,600)
(56,643)
(4,496)
(70,936)
(34,147)
Provision (benefit) for income taxes
13,213
(1,985)
(1,757)
(21,639)
(914)
(26,295)
(13,082)
23,576
$
(3,212)
$
(2,843)
$
(35,004)
$
(3,582)
$
(44,641)
$
(21,065)
$ |
 Reconciliation
of Non-GAAP Measures (continued)
($ in thousands)
26
Three months ended June 30, 2013
Charges
Before
Debt
Transaction
As
charges
refinancing
costs
Total
reported
Income from continuing operations:
Operating income (loss):
Hospital division
129,366
$
-
$
-
$
-
$
129,366
$
Nursing center division
36,018
-
-
-
36,018
Rehabilitation division:
Skilled nursing rehabilitation services
21,623
-
-
-
21,623
Hospital rehabilitation services
19,573
-
-
-
19,573
41,196
-
-
-
41,196
Care management division
3,961
-
-
-
3,961
Corporate:
Overhead
(43,196)
-
-
-
(43,196)
Insurance subsidiary
(384)
-
-
-
(384)
(43,580)
-
-
-
(43,580)
Impairment charges
(438)
-
-
-
(438)
Transaction costs
-
-
(108)
(108)
(108)
Operating income
166,523
-
(108)
(108)
166,415
Rent
(77,324)
-
-
-
(77,324)
Depreciation and amortization
(38,554)
-
-
-
(38,554)
Interest, net
(26,235)
(1,365)
-
(1,365)
(27,600)
Income from continuing operations
before income taxes
24,410
(1,365)
(108)
(1,473)
22,937
Provision for income taxes
9,752
(504)
(40)
(544)
9,208
14,658
$
(861)
$
(68)
$
(929)
$
13,729
$ |
 Reconciliation
of Non-GAAP Measures (continued)
($ in thousands)
27
2013
2012
2011
Reconciliation of operating income before charges:
Operating income before charges
$657,914
$679,471
$528,879
Detail of charges excluded from core operating results:
One-time bonus costs
(19,842)
-
-
Severance and other restructuring costs
(12,558)
(8,730)
(18,259)
Litigation costs
(30,850)
(5,000)
-
Impairment charges
(76,082)
(107,899)
(73,554)
Transaction costs
(2,112)
(2,231)
(33,937)
(141,444)
(123,860)
(125,750)
Reported operating income
$516,470
$555,611
$403,129 |
 Second Quarter
Investor Update August 6, 2014 |