Attached files
| file | filename |
|---|---|
| EX-99.1 - EARNINGS RELEASE - ION GEOPHYSICAL CORP | ex991earningsrelease2q-14.htm |
| 8-K - 8-K - ION GEOPHYSICAL CORP | a8k-q22014earnings.htm |

ION Earnings Call – Q2 2014 Earnings Call Presentation August 7, 2014

Corporate Participants and Contact Information CONTACT INFORMATION If you have technical problems during the call, please contact DENNARD–LASCAR Associates at 713 529 6600. If you would like to view a replay of today's call, it will be available via webcast in the Investor Relations section of the Company's website at www.iongeo.com for approximately 12 months. BRIAN HANSON President and Chief Executive Officer MIKE MORRISON Vice President Corporate Finance 2

Forward-Looking Statements The information included herein contains forward-looking statements within the meaning of Section 27A of the Securities Act of 1933 and Section 21E of the Securities Exchange Act of 1934. Actual results may vary fundamentally from those described in these forward-looking statements. All forward-looking statements reflect numerous assumptions and involve a number of risks and uncertainties. These risks and uncertainties include risk factors that are disclosed by ION from time to time in its filings with the Securities and Exchange Commission. 3

ION Q2 2014 Overview 4 • Revenues $121M, up slightly from 2013 • OceanGeo revenues on Trinidad project • Record 2Q Software sales • Solutions down, impacted by reduced exploration spending • Reported EPS $0.01 including a gain on sale Source product line of $0.04

Ocean Bottom Services Segment Q2 OceanGeo Highlights 5 Increased ownership to 100% OceanGeo Q2 revenues $26M ION now has holistic OBS offering Trinidad survey completed – on time, on budget, no incidents Second project awarded offshore West Africa – strategic region for OceanGeo ION Seabed Systems Seismic Data Acquisition GXT Data Processing & Imaging ION Reservoir Services Research & Development ION Multi-Client Business

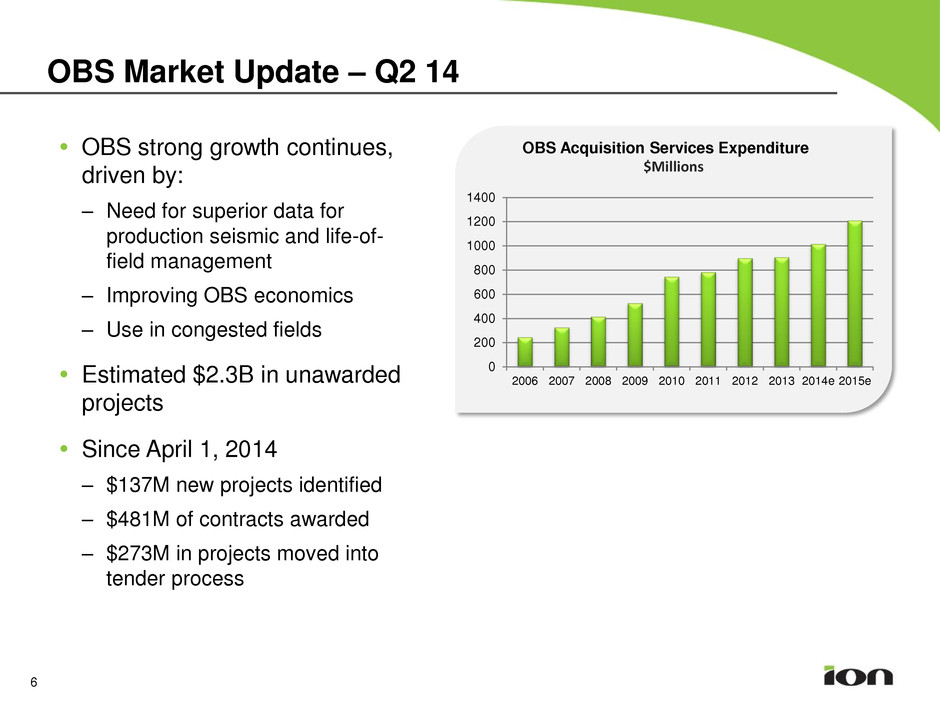
OBS Market Update – Q2 14 6 OBS strong growth continues, driven by: – Need for superior data for production seismic and life-of- field management – Improving OBS economics – Use in congested fields Estimated $2.3B in unawarded projects Since April 1, 2014 – $137M new projects identified – $481M of contracts awarded – $273M in projects moved into tender process $Millions 0 200 400 600 800 1000 1200 1400 2006 2007 2008 2009 2010 2011 2012 2013 2014e 2015e OBS Acquisition Services Expenditure

7 Solutions Segment Q2 GeoVentures Highlights Q2 revenues $63M, down 29% Y/Y Good traction on new programs on Australia Northwest Shelf, offshore East Africa and Ireland Maintaining high standards for underwriting Seeing improvement in new venture pipeline Revising guidance for FY new venture investment to $70 – 90M

Solutions Segment Q2 Data Processing Highlights 8 1H 14 revenues up 3% Y/Y Expect data processing business to remain soft for remainder of year Estimated 2H data processing revenues to be flat Y/Y Solid uptake of Full Waveform Inversion technology After Full Waveform Inversion technology Before Full Waveform Inversion technology

Software and Systems Segments Q2 Highlights Software Segment Record Q2 revenues, up 25% Y/Y Strong Orca® and Gator ® licensing Penetrating Tier 2 contractor base Systems Segment Q2 revenues $22M, down slightly Y/Y Sold marine source product line, monetizing non-strategic assets Systems division focusing on performance of Calypso® OBS system 9 Gator II OceanGeo instrument room

0.00 (0.03) $(0.04) $(0.03) $(0.02) $(0.01) $- $0.01 $0.02 $0.03 Adjusted Diluted EPS Q2 13 Q2 14 10 ION Q2 14 Highlights - 50 100 150 Q2 13 Q2 14 Software Systems Solutions Revenue $M 10 15 20 25 30 35 40 Q2 13 Adjusted EBITDA $M Q2 14 Ocean Bottom 6% 3% 0% 5% 10% 15% Op. Margin % Q2 13 Q2 14 • Revenues up slightly Y/Y • Solutions down 29% • Software up 25% • Systems down 6% • OceanGeo revenues from Trinidad project • Operating Margin down to 3% • Decline in data processing revenue • Adjusted EBITDA up 6% • Gain on sale of source product line • EPS of $0.01 including gain on sale of Source product line; $(0.03) adjusted EPS

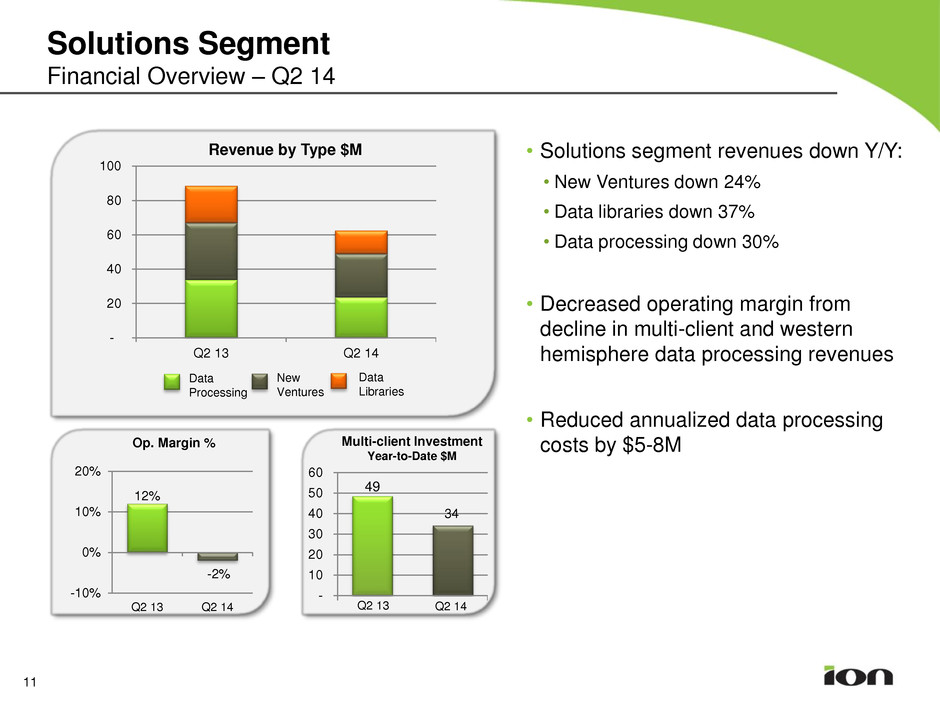
Solutions Segment Financial Overview – Q2 14 11 - 20 40 60 80 100 Q2 13 Q2 14 Revenue by Type $M Data Processing Data Libraries New Ventures Multi-client Investment Year-to-Date $M 49 34 - 10 20 30 40 50 60 • Solutions segment revenues down Y/Y: • New Ventures down 24% • Data libraries down 37% • Data processing down 30% • Decreased operating margin from decline in multi-client and western hemisphere data processing revenues • Reduced annualized data processing costs by $5-8M 12% -2% -10% 0% 10% 20% Q2 13 Q2 14 Op. Margin % Q2 13 Q2 14

Software Segment Financial Overview – Q2 14 - 2 4 6 8 10 12 Q2 13 Q2 14 Services Software Systems 12 Revenue by Type $M 59% 53% 0% 20% 40% 60% 80% Q2 13 Q2 14 Op. Margin % Software segment revenues up 25% Y/Y Record Q2 revenues Increased Orca and Gator licensing revenues Increased R&D investment in development of new oil company software solutions such as NarwhalTM

Systems Segment Financial Overview – Q2 14 - 5 10 15 20 25 30 35 Q2 13 Q2 14 Towed Streamer Equipment OBC Other 13 Revenue by Type $M 6% 16% 0% 2% 4% 6% 8% 10% 12% 14% 16% 18% Q2 13 Q2 14 Op. Margin % Systems segment revenues down 6% Y/Y Reduced new marine positioning sales reflects overcapacity in marine contractor market Partially offset by increase in repair and replacement Increased operating margins as a result of lower cost structure

Ocean Bottom Services Segment Financial Overview – Q2 14 Revenues of $26M on Trinidad project (completed end of May) Operating profit of $6M, or 25% operating margin Began acquisition of survey offshore West Africa in July Actively pursuing Q4 and 2015 projects Increased ownership to 100% in July 14 - 5 10 15 20 25 30 Revenue Op Profit Q2 14 ($M)

INOVA Geophysical Financial Overview – Q2 14 3% -90% -100% -80% -60% -40% -20% 0% 20% Q2 13 Q2 14 Q2 Op. Margin % 15 - 10 20 30 40 50 60 70 Q2 13 Q2 14 Q2 Revenues $M Q2 2014 – In ION Q3 14 Results • Estimated revenues of $10 to $12M with operating loss of $(11) to $(12M) • No significant revenues from BGP • Low sales activity over all product ranges ION to share in 49% of INOVA’s results. Q1 2014 – In ION Q2 14 Results • Revenues of $27M, net loss of $(4M) • BGP purchases of ~8% of revenues ($2m) • Continued Hawk sales (20K channels) plus 10 Univib sales 0 5 10 15 20 25 30 Q1 13 Q1 14 Q1 Revenues $M -39% -10% -50% -40% -30% -20% -10% 0% Q1 13 Q1 14 Q1 Op. Margin %

16 SUMMARIZED CASH FLOW $ Thousands Q2 13 Q2 14 Cash from operations 23,542$ 19,082$ Working capital (29,756) (5,026) Multi-client investment (19,821) (11,964) PP&E Capital Expenditures (5,189) (2,546) Net proceeds from sale of Source product line - 14,394 Free Cash Flow (31,224) 13,940 Notes issuance (net) / Pay down of revolver 71,019 (50,000) Other Investing & Financing 3,131 (3,467) Net change in Cash 42,926 (39,527) Cash & Cash Equiv. (Beg. of Period) 66,575 197,306 Cash & Cash Equiv. (End of Period) 109,501$ 157,779$ Financial Overview Cash Flow

0 100 200 300 400 500 600 700 Q1 14 Q2 14 0 100 200 300 400 500 600 700 Financial Overview Balance Sheet as of June 30, 2014 Capital Employed $M Capital Book Value $M Cash Net Fixed Assets Multi-Client Data Library Goodwill & Equity in INOVA * Net Debt = Debt less Cash $243M $197M Other Working Capital 17 Q1 14 Q2 14 $44M $33M $191M Equity LT Debt Net Debt* $246M $158M $241M

Summary 18 Continued softness in exploration spending into foreseeable future Broadening of customer base for multi-client programs somewhat offsetting pause in spending by IOCs Managing the business for extended slowdown through 2015 Good traction on key 2D programs Actively participating in 3D market Full Waveform Inversion technology garnering significant interest Fully committed to the growing OBS market through OceanGeo Diversifying ION portfolio across the E&P lifecycle with OBS solution

19 Q&A

20
