Attached files
| file | filename |
|---|---|
| 8-K - FORM 8-K - Higher One Holdings, Inc. | form8k.htm |
| EX-99.1 - PRESS RELEASE - Higher One Holdings, Inc. | ex99_1.htm |
Exhibit 99.2
©2014 Higher One Holdings, Inc. All Rights Reserved. Q2’14 Earnings Results August 7, 2014
©2014 Higher One Holdings, Inc. All Rights Reserved. * This presentation contains statements that constitute “forward-looking statements” within the meaning of the Private Securities Litigation Reform Act of 1995. Management’s projections and expectations are subject to a number of risks and uncertainties that could cause actual performance to differ materially from that predicted or implied. Forward-looking statements may be identified by the use of words such as “expect,” “anticipate,” “believe,” “estimate,” “potential,” “should” or similar words intended to identify information that is not historical in nature. Forward-looking statements contained herein include, among others, statements concerning bank partners, the regulatory environment, banking fees, litigation, sales, and the expected benefits of acquisitions, and such statements are based on the current beliefs and expectations of Higher One management, as applicable, and are subject to known and unknown risks and uncertainties. There are a number of risks and uncertainties that could cause actual results to differ materially from those contemplated by the forward-looking statements. These statements speak only as of the date they are made, and the company does not intend to update or otherwise revise the forward-looking information to reflect actual results of operations, changes in financial condition, changes in estimates, expectations or assumptions, changes in general economic or industry conditions or other circumstances arising and/or existing since the preparation of this presentation or to reflect the occurrence of any unanticipated events. The forward-looking statements in this presentation do not include the potential impact of any acquisitions or divestitures that may be announced and/or completed after the date hereof. For further information regarding the risks associated with Higher One’s business, please refer to Higher One’s filings with the Securities and Exchange Commission, including Annual Reports on Form 10-K for the most recent fiscal year end, Quarterly Reports on Form 10-Q and Current Reports on Form 8-K. Forward-Looking Statements
©2014 Higher One Holdings, Inc. All Rights Reserved. * Q2 2014 Highlights Gross revenue approximately 14% higher due to growth in Payment Transaction and Higher Ed revenueAdjusted EPS of 5 centsNon-refund deposit growth of 14%
©2014 Higher One Holdings, Inc. All Rights Reserved. * Sales Refund Management sales of 36,000 SSE in quarterRetention rate exceeds 98%Refund Management sales from Campus Solutions in 2nd Quarter of 12,000 SSETotal Campus Solutions sales, from close of acquisition through June, of 466,000 SSE
©2014 Higher One Holdings, Inc. All Rights Reserved. * Product Development Enhanced Refund ManagementBetter value for students through improved OneAccount:Enhanced bill payIntegrated money management toolsFinancial literacy woven into customer experience
©2014 Higher One Holdings, Inc. All Rights Reserved. * Regulatory Update In discussions with Federal Reserve regarding potential restitutionRecorded allowance of $8.75 million for restitutionPotential exposure of $35 million for Federal Reserve bank partner customersAdditional potential exposure of $35 million for FDIC bank partner customersUncertain of timing
©2014 Higher One Holdings, Inc. All Rights Reserved. * Department of Education Rulemaking 2014 ED rulemaking – concluded with no consensusDept. of Ed. rules must be final by Nov. 1 to be in effect for July 2015Our goal is to create an even stronger, low cost banking option for students, with simplified fee structures
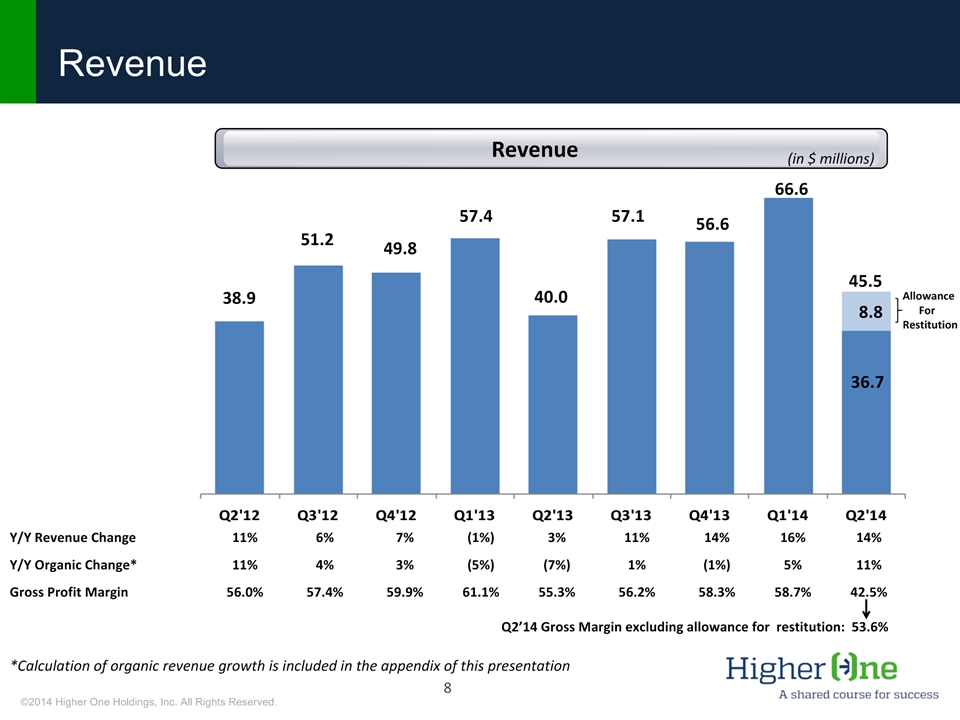
©2014 Higher One Holdings, Inc. All Rights Reserved. * Revenue (in $ millions) Y/Y Revenue Change 11% 6% 7% (1%) 3% 11% 14% 16% 14% Y/Y Organic Change* 11% 4% 3% (5%) (7%) 1% (1%) 5% 11% Gross Profit Margin 56.0% 57.4% 59.9% 61.1% 55.3% 56.2% 58.3% 58.7% 42.5% 49.8 40.0 57.1 56.6 38.9 51.2 57.4 66.6 45.5 8.8 36.7 Allowance For Restitution Q2’14 Gross Margin excluding allowance for restitution: 53.6% *Calculation of organic revenue growth is included in the appendix of this presentation
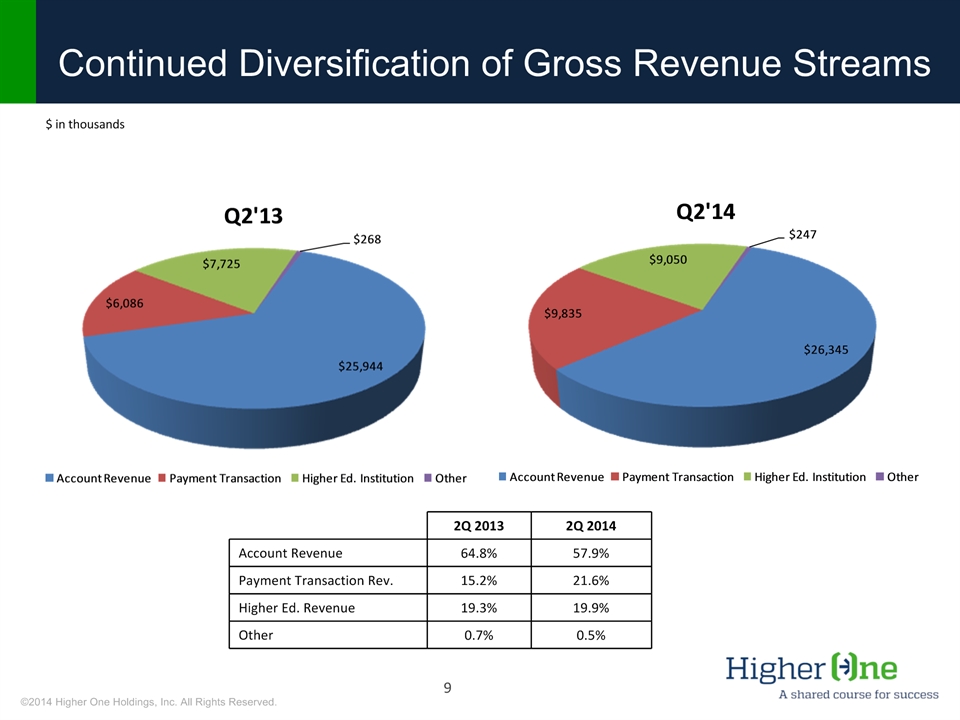
©2014 Higher One Holdings, Inc. All Rights Reserved. * Continued Diversification of Gross Revenue Streams $ in thousands 2Q 2013 2Q 2014 Account Revenue 64.8% 57.9% Payment Transaction Rev. 15.2% 21.6% Higher Ed. Revenue 19.3% 19.9% Other 0.7% 0.5%
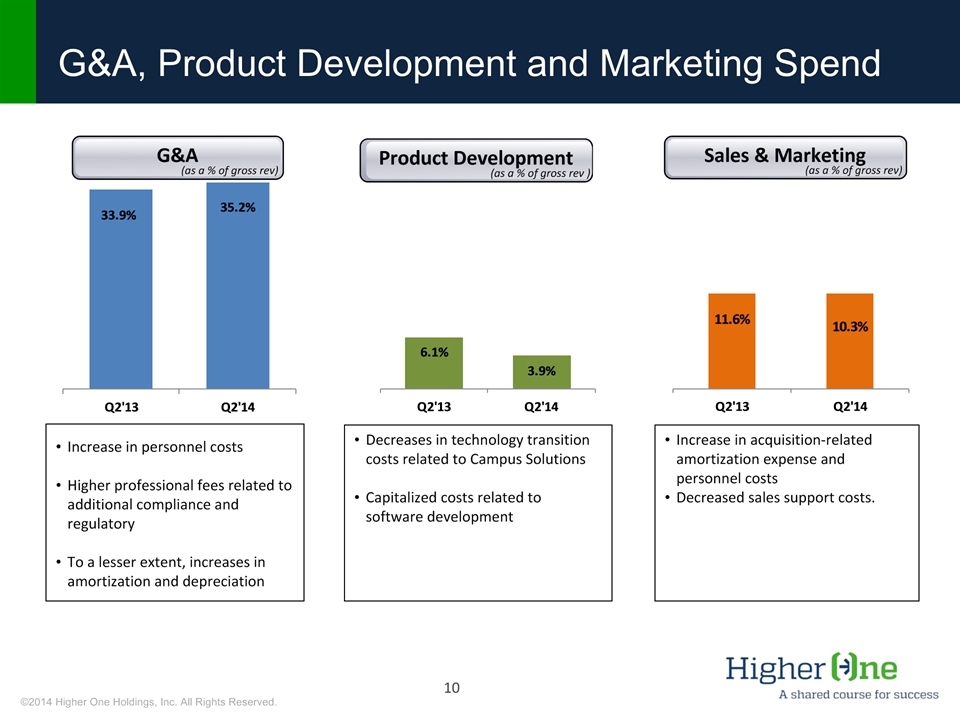
©2014 Higher One Holdings, Inc. All Rights Reserved. * G&A, Product Development and Marketing Spend Increase in personnel costsHigher professional fees related to additional compliance and regulatoryTo a lesser extent, increases in amortization and depreciation Decreases in technology transition costs related to Campus SolutionsCapitalized costs related to software development Increase in acquisition-related amortization expense and personnel costsDecreased sales support costs. (as a % of gross rev) (as a % of gross rev ) (as a % of gross rev)
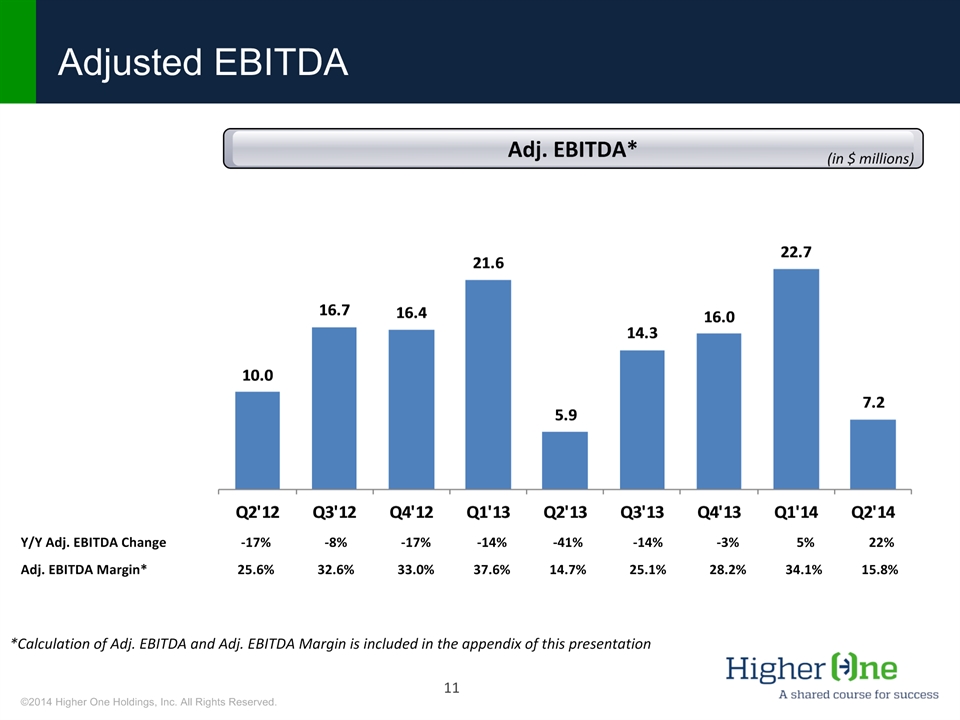
©2014 Higher One Holdings, Inc. All Rights Reserved. * Adjusted EBITDA *Calculation of Adj. EBITDA and Adj. EBITDA Margin is included in the appendix of this presentation (in $ millions) Y/Y Adj. EBITDA Change -17% -8% -17% -14% -41% -14% -3% 5% 22% Adj. EBITDA Margin* 25.6% 32.6% 33.0% 37.6% 14.7% 25.1% 28.2% 34.1% 15.8%
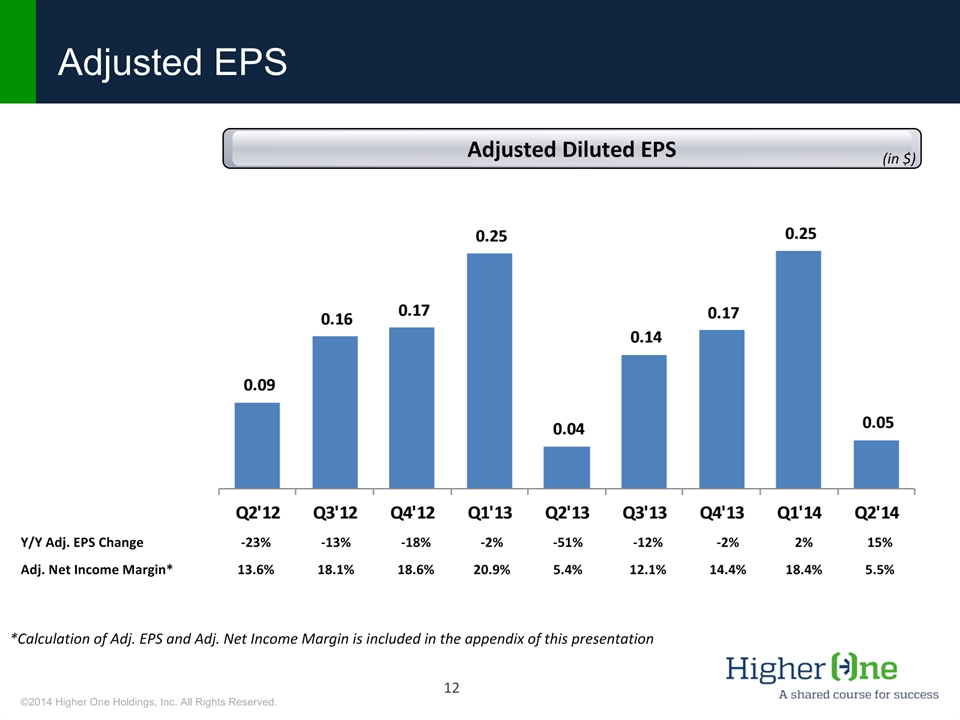
©2014 Higher One Holdings, Inc. All Rights Reserved. * Adjusted EPS *Calculation of Adj. EPS and Adj. Net Income Margin is included in the appendix of this presentation (in $) Y/Y Adj. EPS Change -23% -13% -18% -2% -51% -12% -2% 2% 15% Adj. Net Income Margin* 13.6% 18.1% 18.6% 20.9% 5.4% 12.1% 14.4% 18.4% 5.5%
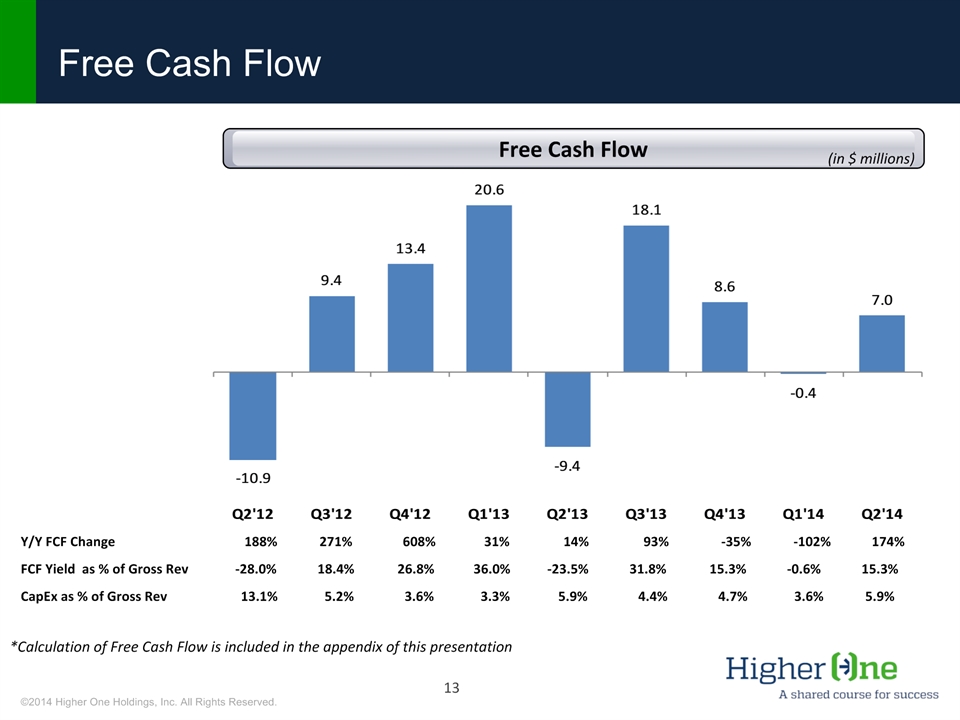
©2014 Higher One Holdings, Inc. All Rights Reserved. * Free Cash Flow *Calculation of Free Cash Flow is included in the appendix of this presentation (in $ millions) Y/Y FCF Change 188% 271% 608% 31% 14% 93% -35% -102% 174% FCF Yield as % of Gross Rev -28.0% 18.4% 26.8% 36.0% -23.5% 31.8% 15.3% -0.6% 15.3% CapEx as % of Gross Rev 13.1% 5.2% 3.6% 3.3% 5.9% 4.4% 4.7% 3.6% 5.9%
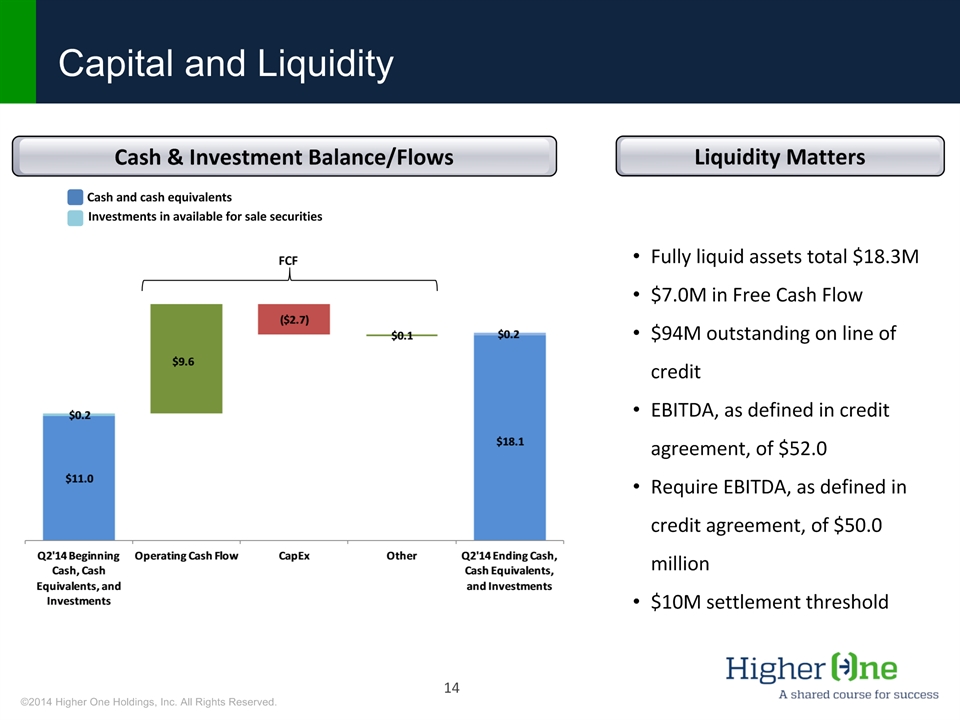
©2014 Higher One Holdings, Inc. All Rights Reserved. * Cash & Investment Balance/Flows Liquidity Matters Cash and cash equivalents Investments in available for sale securities Fully liquid assets total $18.3M$7.0M in Free Cash Flow$94M outstanding on line of creditEBITDA, as defined in credit agreement, of $52.0Require EBITDA, as defined in credit agreement, of $50.0 million$10M settlement threshold Capital and Liquidity FCF
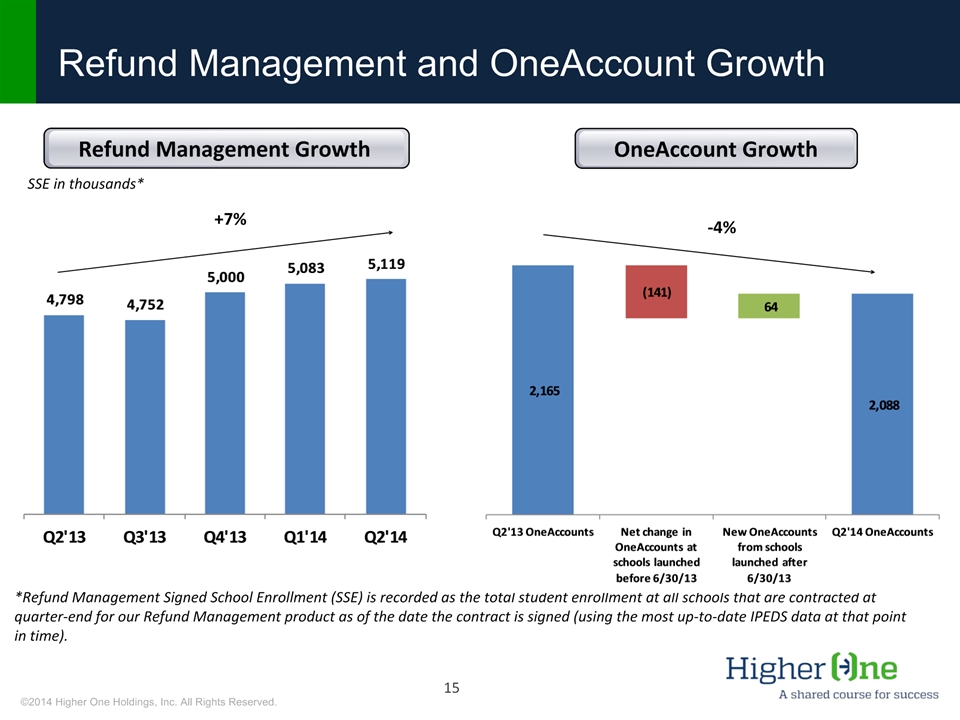
©2014 Higher One Holdings, Inc. All Rights Reserved. * *Refund Management Signed School Enrollment (SSE) is recorded as the total student enrollment at all schools that are contracted at quarter-end for our Refund Management product as of the date the contract is signed (using the most up-to-date IPEDS data at that point in time). +7% Refund Management and OneAccount Growth SSE in thousands* -4% OneAccount Growth Refund Management Growth
©2014 Higher One Holdings, Inc. All Rights Reserved. * Q & A
©2014 Higher One Holdings, Inc. All Rights Reserved. * Appendix
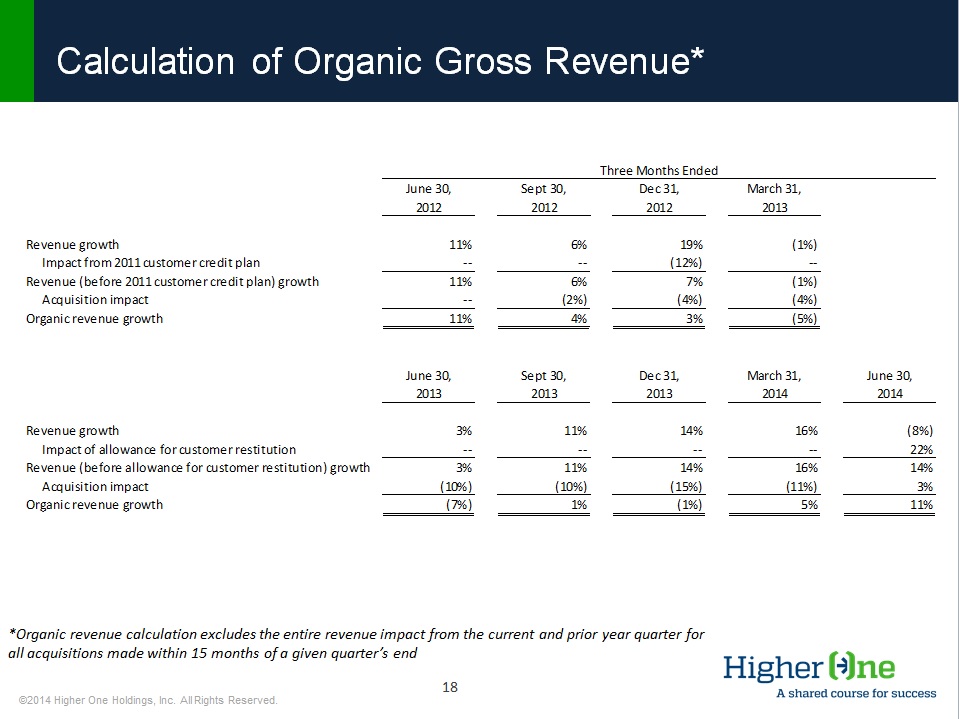
©2014 Higher One Holdings, Inc. All Rights Reserved. * Calculation of Organic Gross Revenue* *Organic revenue calculation excludes the entire revenue impact from the current and prior year quarter for all acquisitions made within 15 months of a given quarter’s end
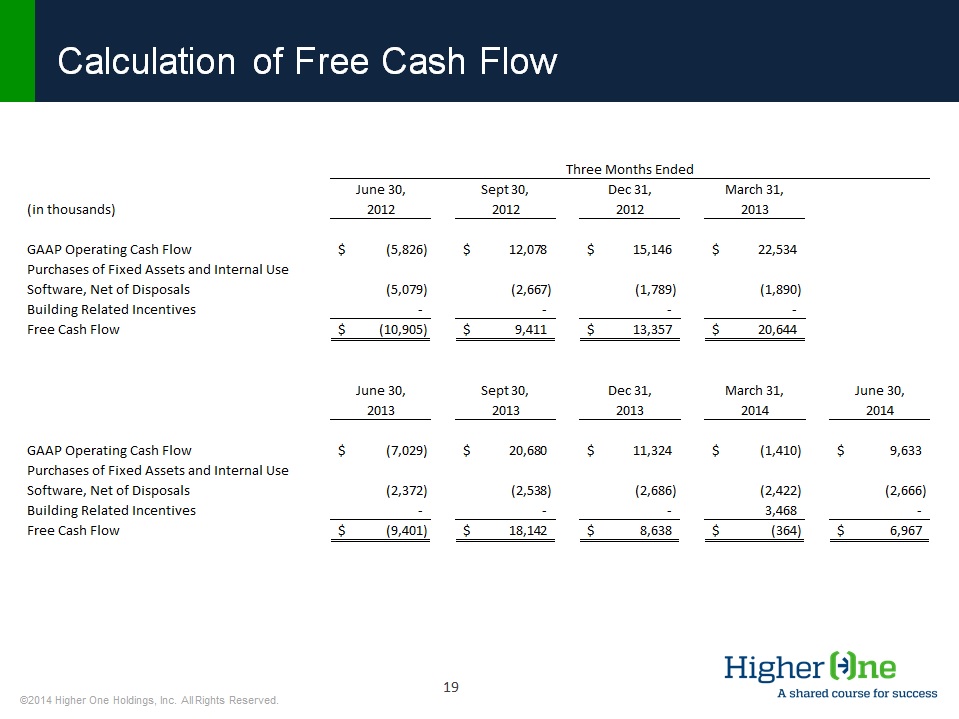
©2014 Higher One Holdings, Inc. All Rights Reserved. * Calculation of Free Cash Flow
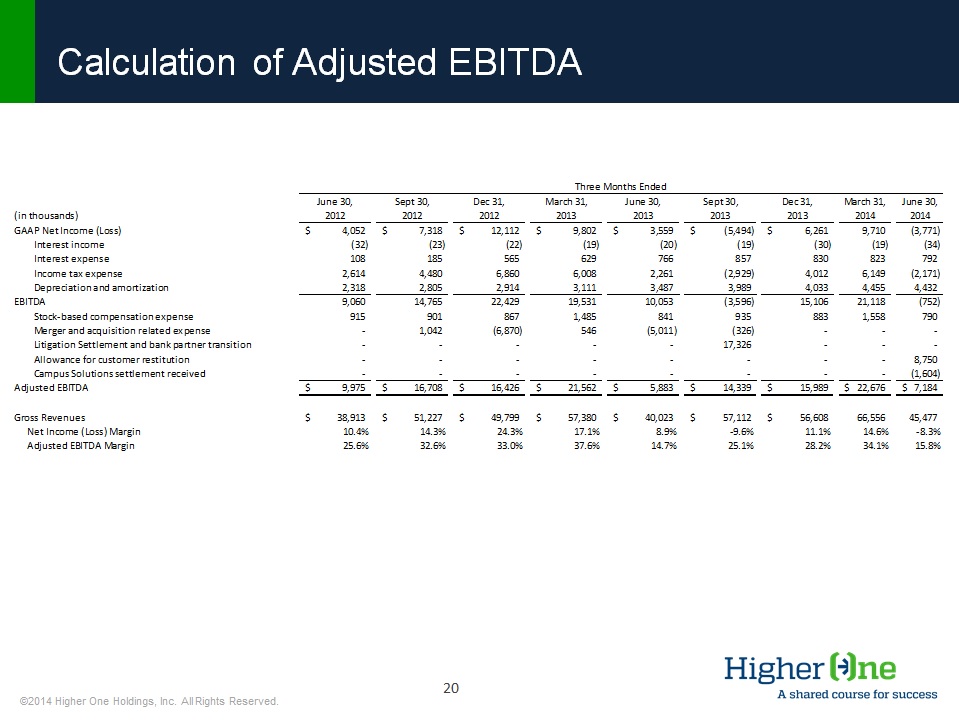
©2014 Higher One Holdings, Inc. All Rights Reserved. * Calculation of Adjusted EBITDA
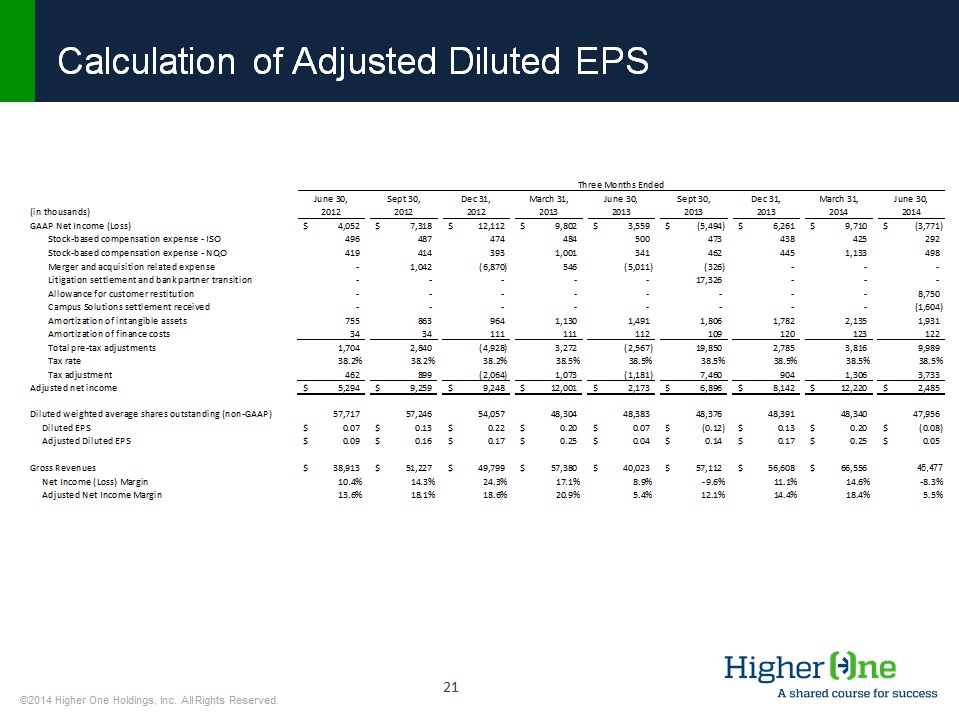
©2014 Higher One Holdings, Inc. All Rights Reserved. * Calculation of Adjusted Diluted EPS