Attached files
| file | filename |
|---|---|
| EX-32.1 - EX-32.1 - HARMAN INTERNATIONAL INDUSTRIES INC /DE/ | d753112dex321.htm |
| EX-21.1 - EX-21.1 - HARMAN INTERNATIONAL INDUSTRIES INC /DE/ | d753112dex211.htm |
| EX-31.1 - EX-31.1 - HARMAN INTERNATIONAL INDUSTRIES INC /DE/ | d753112dex311.htm |
| EX-23.1 - EX-23.1 - HARMAN INTERNATIONAL INDUSTRIES INC /DE/ | d753112dex231.htm |
| EX-31.2 - EX-31.2 - HARMAN INTERNATIONAL INDUSTRIES INC /DE/ | d753112dex312.htm |
| EXCEL - IDEA: XBRL DOCUMENT - HARMAN INTERNATIONAL INDUSTRIES INC /DE/ | Financial_Report.xls |
Table of Contents
UNITED STATES
SECURITIES AND EXCHANGE COMMISSION
Washington, D.C. 20549
FORM 10-K
(Mark One)
| x | ANNUAL REPORT PURSUANT TO SECTION 13 OR 15(d) OF THE SECURITIES EXCHANGE ACT OF 1934 |
For the fiscal year ended June 30, 2014
or
| ¨ | TRANSITION REPORT PURSUANT TO SECTION 13 OR 15(d) OF THE SECURITIES EXCHANGE ACT OF 1934 |
For the transition period from to
Commission File Number 001-09764
Harman International Industries, Incorporated
(Exact Name of Registrant as Specified in Its Charter)

| Delaware | 11-2534306 | |
| (State or other jurisdiction of incorporation or organization) |
(I.R.S. Employer Identification No.) | |
| 400 Atlantic Street, Suite 1500 Stamford, CT |
06901 | |
| (Address of Principal Executive Offices) | (Zip Code) | |
Registrant’s telephone number, including area code (203) 328-3500
Securities registered pursuant to Section 12(b) of the Act:
| Title of Each Class |
Name of Each Exchange on Which Registered | |
| Common Stock, par value $.01 per share | New York Stock Exchange |
Securities registered pursuant to Section 12(g) of the Act: None
Indicate by check mark if the registrant is a well-known seasoned issuer, as defined in Rule 405 of the Securities Act. Yes x No ¨
Indicate by check mark if the registrant is not required to file reports pursuant to Section 13 or Section 15(d) of the Act. Yes ¨ No x
Indicate by check mark whether the registrant (1) has filed all reports required to be filed by Section 13 or 15(d) of the Securities Exchange Act of 1934 during the preceding 12 months (or for such shorter period that the registrant was required to file such reports), and (2) has been subject to such filing requirements for the past 90 days. Yes x No ¨
Indicate by check mark whether the registrant has submitted electronically and posted on its corporate Web site, if any, every Interactive Data File required to be submitted and posted pursuant to Rule 405 of Regulation S-T (§ 232.405 of this chapter) during the preceding 12 months (or for such shorter period that the registrant was required to submit and post such files). Yes x No ¨
Indicate by check mark if disclosure of delinquent filers pursuant to Item 405 of Regulation S-K (§ 229.405 of this chapter) is not contained herein, and will not be contained, to the best of registrant’s knowledge, in definitive proxy or information statements incorporated by reference in Part III of this Form 10-K or any amendment to this Form 10-K. ¨
Indicate by check mark whether the registrant is a large accelerated filer, an accelerated filer, a non-accelerated filer, or a smaller reporting company. See the definitions of “large accelerated filer,” “accelerated filer” and “smaller reporting company” in Rule 12b-2 of the Exchange Act. (Check one)
| Large accelerated filer | x | Accelerated filer | ¨ | |||
| Non-accelerated filer | ¨ (Do not check if a smaller reporting company) | Smaller reporting company | ¨ |
Indicate by check mark whether the registrant is a shell company (as defined in Rule 12b-2 of the Act). Yes ¨ No x
The aggregate market value of the voting common stock held by non-affiliates of the registrant as of December 31, 2013 (the last business day of the registrant’s most recently completed second fiscal quarter) was $5,521,472,168 based upon the closing price of the shares on the New York Stock Exchange on that date.
Indicate the number of shares outstanding of each of the registrant’s classes of common stock, as of the latest practicable date: 68,103,877 shares of common stock, par value $.01 per share, as of July 31, 2014.
DOCUMENTS INCORPORATED BY REFERENCE
Portions of the registrant’s definitive Proxy Statement to be delivered to shareholders in connection with the 2014 Annual Meeting of Stockholders are incorporated by reference into Part III.
Table of Contents
The page numbers in this Table of Contents reflect actual page numbers, not EDGAR page tag numbers.
References to “Harman,” “Company,” “we,” “us” and “our” in this Form 10-K refer to Harman International Industries, Incorporated and its subsidiaries unless the context requires otherwise.
Harman, the Harman logo, and Harman products and brand names referred to herein are either the trademarks or the registered trademarks of Harman. All other trademarks are the property of their respective owners.
i
Table of Contents
This report contains forward-looking statements within the meaning of Section 27A of the Securities Act of 1933, as amended, and Section 21E of the Securities Exchange Act of 1934, as amended. You should not place undue reliance on these statements. Forward-looking statements include information concerning possible or assumed future results of operations, cash flows, capital expenditures, the outcome of pending legal proceedings and claims, goals and objectives for future operations, including descriptions of our business strategies and purchase commitments from customers. These statements are typically identified by words such as “believe,” “anticipate,” “expect,” “plan,” “intend,” “estimate,” “should,” “will” and similar expressions. We base these statements on particular assumptions that we have made in light of our industry experience, as well as our perception of historical trends, current conditions, expected future developments and other factors that we believe are appropriate under the circumstances. As you read and consider the information in this report, you should understand that these statements are not guarantees of performance or results. They involve risks, uncertainties and assumptions. In light of these risks, uncertainties and assumptions, we cannot assure you that the results and events contemplated by the forward-looking statements contained in, or incorporated by reference into, this report will in fact transpire.
You should carefully consider the risks described below and the other information in this report because they identify important factors that could cause actual results to differ materially from those predicted in any such forward-looking statements. Our operating results may fluctuate significantly and may not meet our expectations or those of securities analysts or investors. The price of our stock would likely decline if this occurs. Factors that may cause fluctuations in our operating results include, but are not limited to, the following:
| • | our ability to maintain profitability in our infotainment segment if there are delays in our product launches which may give rise to significant penalties and increased engineering expense; |
| • | the loss of one or more significant customers, or the loss of a significant platform with an automotive customer; |
| • | fluctuations in currency exchange rates, particularly with respect to the value of the U.S. Dollar and the Euro; |
| • | our ability to successfully implement our global footprint initiative, including achieving cost reductions and other benefits in connection with the restructuring of our manufacturing, engineering, procurement and administrative organizations; |
| • | fluctuations in the price and supply of raw materials including, without limitation, petroleum, copper, steel, aluminum, synthetic resins, rare metals and rare-earth minerals, or shortages of materials, parts and components; |
| • | the inability of our suppliers to deliver products at the scheduled rate and disruptions arising in connection therewith; |
| • | our ability to maintain a competitive technological advantage through innovation and leading product designs; and |
| • | our failure to maintain the value of our brands and implementing a sufficient brand protection program. |
Although we believe that these forward-looking statements are based on reasonable assumptions, you should be aware that many factors could affect our actual results of operations and could cause actual results to differ materially from those expressed in the forward-looking statements. As a result, the foregoing factors should not be construed as exhaustive and should be read together with the other cautionary statements included in this and other reports we file with the Securities and Exchange Commission. For additional information regarding certain factors that may cause our actual results to differ from those expected or anticipated see the information under the caption “Risk Factors” which is located in Item 1A of Part I of this report. We undertake no obligation to publicly update or revise any forward-looking statement (except as required by law). This report
1
Table of Contents
also makes reference to our awarded business, which represents the estimated future lifetime net sales for all customers. Our future awarded business does not represent firm customer orders. We report our awarded business primarily based on written award letters from our customers. To validate these awards, we use various assumptions including global vehicle production forecasts, customer take rates for our products, revisions to product life cycle estimates and the impact of annual price reductions and exchange rates, among other factors. These assumptions are updated and reported externally on an annual basis. We update our estimated awarded business quarterly by adding the value of new awards received and subtracting sales recorded during the quarter. These quarterly updates do not include any assumptions for increased take rates, revisions to product life cycle, or any other factors.
Market, ranking and other data
In this report, we refer to information regarding market data obtained from internal sources, market research, publicly available information and industry publications. Estimates are inherently uncertain, involve risks and uncertainties and are subject to change based on various factors, including those discussed under the caption “Risk Factors” which is located in Item 1A of Part I of this report.
2
Table of Contents
| Item 1. | Business |
Our Company
We believe we are a worldwide leader in the development, manufacture and marketing of high quality, high-fidelity audio products, lighting solutions and electronic systems. We also believe we are a leader in digitally integrated audio and infotainment systems for the automotive industry. We have developed, both internally and through a series of strategic acquisitions, a broad range of product offerings sold under renowned brand names in our principal markets. Our Aha®, AKG®, AMX®, Becker®, BSS®, Crown®, dbx®, DigiTech®, Harman/Kardon®, Infinity®, JBL®, JBL Professional, Lexicon®, Logic 7®, Mark Levinson®, Martin®, Revel®, Selenium®, Soundcraft®, Studer® and yurbuds® Powered by JBL brand names are well known worldwide for premium quality and performance.
Infotainment
Our Infotainment segment designs, manufactures and markets infotainment systems for vehicle applications to be installed primarily as original equipment by automotive manufacturers. Our infotainment systems are a combination of information and entertainment components that may include or control GPS navigation, traffic information, bluetooth, voice-activated telephone, texting and climate control, multi-seat entertainment, digital media compatibility, wireless Internet access, hard disk recording and MP3 playback. We also have a connected radio platform which targets the entry-level segment and provides the ability to add smart-phone connectivity, turn-by-turn navigation and voice prompts. Our infotainment systems also integrate driver safety capabilities such as lane guidance, traffic sign recognition, pre-crash emergency braking, adaptive cruise control and night vision. Global customers for our infotainment systems include Audi/Volkswagen, BMW, Fiat Chrysler Automobiles, Toyota/Lexus, Porsche, Daimler, General Motors, PSA Peugeot Citroën, Hyundai, Kia, Geely, Mazda, Yamaha, Suzuki, Scion, Jaguar Land Rover and Ssangyong. We also produce a Harman/Kardon branded infotainment system for Harley-Davidson touring motorcycles.
Lifestyle
Our Lifestyle segment designs, manufactures and markets automotive audio systems for vehicle applications to be installed primarily as original equipment by automotive manufacturers, as well as a wide range of mid-to high-end loudspeaker and electronics for home, multimedia and mobile applications. Our Lifestyle products are marketed worldwide under brand names including AKG, Harman/Kardon, Infinity, JBL, Logic 7, Mark Levinson, Lexicon, Revel, Selenium and yurbuds Powered by JBL. Global customers for our premium audio systems include Toyota/Lexus, Daimler, Hyundai, Kia, BMW, Subaru, Fiat Chrysler Automobiles, General Motors, Chang’an, Geely, SAIC, Brilliance, Great Wall, Dongfeng and Ford. Home applications include dedicated home audio and theater systems, as well as distributed systems that provide multi-zone high-quality audio and video. Multimedia applications comprise a wide-range of innovative accessories such as ear buds, noise cancelling headphones, twist-lockTM ear phones designed for intense workouts and wireless earbuds that enhance the sound of portable electronic devices. We created a new technology called Clari-FiTM that restores the audio quality of compressed digital music and which will be used in several of our Lifestyle products. Clari-Fi is also an integral part of the new HTC One M8 Harman/Kardon edition smartphone launched by Sprint in North America in fiscal year 2014. Our branded home audio products for multimedia applications are primarily designed to enhance sound for Apple’s iPad®, iPod® and iPhone® products, as well as other MP3 players. We provide transducers and built-in speakers for leading notebook computers, such as Dell, Toshiba and Acer. Additionally, we provide an extensive line of audio systems for personal computers that are recognized for their award winning design and high fidelity. Aftermarket mobile products include speakers, amplifiers and digital signal processors that deliver high-quality in-car audio. Our home audio products are sold in specialty audio stores and our Harman stores, mass-market retail stores such as Apple, Best Buy, Target, Media Markt and Fnac, through online retailers such as Amazon.com and through our website www.harmanaudio.com.
3
Table of Contents
Professional
Our Professional segment designs, manufactures and markets an extensive range of loudspeakers, power amplifiers, digital signal processors, microphones, headphones, mixing consoles, lighting systems, video and control solutions and information delivery systems used by audio professionals in concert halls, stadiums, airports, houses of worship and public spaces. We design products for recording, broadcast, cinema and music reproduction applications. We also provide high-quality products to the sound reinforcement, music instrument support and broadcast and recording segments of the professional audio market. Our Professional products are used in prestigious venues and at important events such as the GRAMMY® Awards, the Emmy Awards, Super Bowl XLVII®, the Oscars®, the MTV Video Music Awards, the Country Music Awards®, Dodger Stadium in Los Angeles and Lincoln Center in New York.
Our Professional segment also offers complete systems solutions for professional installations and users around the world. Our products can be linked by our HiQnet® network protocol, which provides a central digital network for audio professionals to control different aspects of a complex system.
Our Professional segment offers solutions that simplify the way people interact with technology and solves the complexity of managing this technology with scalable systems. These products span control and automation, system-wide switching and audio/video signal distribution, as well as digital signage and technology management. They are used worldwide in conference rooms, homes, classrooms, network operation/command centers, hotels, entertainment venues and broadcast facilities.
We believe that we are well equipped to provide turnkey systems solutions for professional audio, lighting, video and control applications that offer the customer improved performance, reliability, ease of installation and use, as well as reduced cost. Our Professional segment products are marketed globally under a number of brand names, including AKG, AMX, BSS, Crown, DigiTech, dbx, JBL Professional, Lexicon, Martin, Selenium, Soundcraft and Studer.
Other
Our Other segment primarily includes compensation, benefits and occupancy costs for corporate employees, net of reporting segment allocations, expenses associated with new technology innovation and our corporate brand identity campaign.
Acquisitions
On June 17, 2014 (the “yurbuds Acquisition Date”), we acquired certain assets and liabilities of Verto Medical Solutions LLC, d/b/a/ yurbuds and its wholly-owned subsidiary (“yurbuds”), a manufacturer of sports headphones. The operating results of yurbuds are included in our Consolidated Statements of Income from the yurbuds Acquisition Date within our Lifestyle segment.
On June 13, 2014 (the “AMX Acquisition Date”), we acquired all of the outstanding shares of AMX LLC and AMX Holding Corporation (collectively “AMX”), a provider of enterprise control and audio/video switching and distributing solutions. The operating results of AMX are included in our Consolidated Statements of Income from the AMX Acquisition Date within our Professional segment.
On October 17, 2013 (the “Duran Acquisition Date”), we acquired all of the outstanding shares of Duran Audio BV (“Duran”), a developer of professional audio products. The operating results of Duran are included in our Consolidated Statements of Income from the Duran Acquisition Date within our Professional segment.
4
Table of Contents
Results of Operations
Our results of operations depend on our sales of audio products and electronic systems in the infotainment, automotive audio, home audio and professional markets. Our products are sold worldwide, the largest markets of which are the United States and Germany. Significant portions of our net sales are denominated in Euros.
Our Strengths
World-class brand portfolio
We believe that our brands and the innovative technologies they represent, many of which Harman pioneered, have helped establish our Company as a leader in the primary markets we serve. We have successfully leveraged our brands across our Infotainment, Lifestyle and Professional segments, which promotes brand reinforcement and recognition across the markets we serve.
Innovation and technological expertise
We believe that our technological innovation, the quality of our products and our reputation for on-time delivery have resulted in Harman being awarded a substantial amount of Infotainment and Lifestyle business. As of June 30, 2014, we have a cumulative estimated $20.5 billion of future awarded Infotainment and Lifestyle automotive business, which represents the estimated future lifetime net sales for all customers. This amount does not represent firm customer orders. We report our awarded business primarily based on written award letters from our customers. To validate these awards, we use various assumptions including global vehicle production forecasts, customer take rates for our products, revisions to product life cycle estimates and the impact of annual price reductions and exchange rates, among other factors. These assumptions are updated and reported externally on an annual basis. We update our estimated awarded business quarterly by adding the value of new awards received and subtracting sales recorded during the quarter. These quarterly updates do not include any assumptions for increased take rates, revisions to product life cycle, or any other factors.
Our management uses the amount of our future awarded business for short-term and long-term budgeting and forecasting, development of earnings guidance and for planning future corporate investment and other activities, such as capital expenditures and restructuring. Our future awarded business is also an input used to approximate our enterprise value. We believe our investors utilize this information for a number of reasons, including to evaluate our future financial performance over time, to model our financial results of operations, to understand the risks inherent in our current operating plan, and as an input to approximate our enterprise value. However, our estimates of future awarded automotive business are forward-looking statements and may not actually be achieved. See the risk factor “We may not realize sales represented by awarded business” in Item 1A “Risk Factors” of Part I of this report.
Seasoned management team with extensive global experience
Our senior management team possesses substantial experience leading technology-oriented companies, promoting profitable growth through continuous value-added innovation and providing guidance, leadership and cost-discipline through challenging economic conditions.
Our Growth Strategy
Continued growth through innovation
We are focused on the next generation of products that will blend advances in wireless networking, streaming audio, hands-free connectivity, driver assistance, safety systems and more. We believe our advanced software capabilities and acoustic expertise will work together to define emerging standards across all of our segments.
5
Table of Contents
We believe we can grow our business with automotive manufacturers through an increase in the number of models offering our audio and infotainment systems, increases in per-vehicle content through the provision of integrated infotainment and premium branded audio systems, higher penetration levels of high-level audio and infotainment systems within existing models, and by providing systems that will continue to integrate advanced driver assistance and safety measures as they evolve.
We have developed advanced solutions of the connected car with our next-generation scalable infotainment platform based on innovative system architecture that offers rapid development of connected car apps and advanced safety measures. We believe this solution provides a foundation to support the future of autonomous driving. We have started integrating smart apps like Apple CarPlayTM and Google Automotive LinkTM in our infotainment systems.
We have developed a new mid-range infotainment system that we believe will deliver industry-leading performance at an affordable price that will allow us to penetrate the emerging mid-range automotive market. We also are developing, through our GreenEdgeTM initiative, environmentally friendly technologies to reduce power consumption and product weight, a growing area of opportunity for environmentally conscious customers. We have partnered with Lotus Engineering (UK) to develop active noise management applications for both conventional and hybrid/electric cars. We believe that this technology will be an important component for conventional, hybrid and electric vehicles in the future.
We believe our innovative networking and control technologies will provide us with significant growth opportunities across all of our segments. Our HiQnet technology simplifies the interaction of our products and provides users with an incentive to purchase complete HiQnet compatible systems. We are also playing a leading role in developing the Ethernet AV standard, which we believe will be the basis for the next-generation of infotainment and professional technology. This technology will allow higher audio and video bandwidth and transport capabilities, and we believe it will open up significant new market opportunities.
We have developed a new technology called Clari-Fi, which leverages our expertise in music recording, signal processing and psychoacoustics to restore the sound in an MP3 file that is forfeited during the compression process. Clari-Fi has been launched in our JBL product line and in our Harman/Kardon product line in the new HTC One M8 Harman/Kardon edition smartphone sold by Sprint and we will continue to incorporate this technology into other products.
We have opened up retail stores that sell our home and multimedia products in New York, Beijing, Seoul, Shanghai and Moscow to expand our home and multimedia sales base.
Continued growth through acquisitions
In June 2014 we acquired yurbuds, a developer of in-the-ear and behind-the-ear sports headphones that are ergonomically and functionally designed specifically for athletes. We intend to integrate these new headphones into our existing portfolio of home and multimedia products within our Lifestyle segment.
In June 2014, we also acquired AMX, a provider of enterprise control and automation systems, as well as audio/video switching and distribution solutions. We intend on integrating these solutions into our Professional segment offerings servicing audio, lighting, video and information technology professionals.
In October 2013, we acquired Duran, a developer of professional audio products. This acquisition provides us with access to innovative electro-acoustic and software-based directivity control technologies including the AXYS Intellivox® line of steerable columns. We have integrated these products and core technologies into our Professional segment’s audio product line.
6
Table of Contents
Expansion into emerging markets
We believe significant opportunities exist to grow our business in all three of our business segments in emerging markets such as Brazil, Russia, India and China (“BRIC”). We have dedicated country managers and staff in these markets. We also are repositioning our research and development and production capabilities, and are developing distribution channels to be able to meet the demand for our products in these markets. We expect our market share to continue to grow significantly in the BRIC countries.
Products
Infotainment
We believe that we are a leader in the development and manufacture of high-quality, digitally-integrated infotainment systems for automobiles. In recent years, the automotive industry experienced increased demand for information and entertainment in automotive vehicles. We have developed leading technical competencies to address this demand. In fiscal year 2014, we supplied infotainment systems for vehicles manufactured by Audi/Volkswagen, BMW, Fiat Chrysler Automobiles, Toyota/Lexus, Porsche, Daimler, General Motors, PSA Peugeot Citroën, Hyundai, Kia, Geely, Mazda, Yamaha, Suzuki, Scion, Jaguar Land Rover and Ssangyong.
Lifestyle
We believe that we are a leader in the development and manufacture of high-quality, high-fidelity, digitally-integrated premium branded audio systems for automobiles. We continue to leverage our expertise in the design and manufacture of premium branded audio systems, as well as our reputation for quality associated with our brand names. As a result of our well-established relationships with automobile manufacturers, our engineers are engaged early in the vehicle design process to develop systems that optimize acoustic performance and minimize weight and space requirements. Our Infinity branded car audio systems are offered by Hyundai and Kia in select markets. Daimler, BMW, General Motors, Subaru and Chrysler provide Harman/Kardon branded audio systems in their vehicles. Our premium Mark Levinson digital audio system is offered by Lexus. Lexicon branded audio systems are offered as an option in Rolls Royce and certain Hyundai vehicles. Toyota, PSA Peugeot Citroën and Fiat offer our JBL branded audio systems. Hyundai and Kia also offer our JBL branded audio systems in the South Korean market. Our JBL Professional branded audio system is offered in Ferrari’s new F12 model. We also have an exclusive license with Bowers & Wilkins to develop, manufacture, sell and service premium automotive audio systems under the Bowers & Wilkins brand name.
We manufacture loudspeakers under the Harman/Kardon, Infinity, JBL and Revel brand names for the home audio market. These loudspeaker lines include models designed for two-channel stereo and multi-channel surround sound applications for the home in a wide range of performance choices, including floor standing, bookshelf, powered, low frequency, in-wall, wireless and all-weather, as well as in styles and finishes ranging from high gloss lacquers to genuine wood veneers. The JBL, Infinity and Selenium product lines also include car loudspeakers, subwoofers, amplifiers and digital signal processors sold in the car aftermarket. The JBL and Infinity products also include marine speakers.
We also offer a broad range of home audio electronics under the Harman/Kardon, Lexicon and Mark Levinson brand names. Our Harman/Kardon home electronics line includes audio/video receivers featuring Dolby Digital®, DTS® and Logic 7 DTS surround sound processing capabilities and multi-channel amplifiers, DVD players, Blu-ray players and CD players. We design high-end home audio electronics, including amplifiers, digital signal processors, multi format digital media players and transports and surround sound processors that we market under the renowned Mark Levinson and Lexicon brands.
In the multimedia market, we offer branded iPad, iPod and iPhone docking devices such as JBL On Stage™, JBL On Beat™, JBL On Beat Xtreme™, Harman/Kardon Go +Play™, computer-embedded audio, portable wireless speakers such as the Harman/Kardon Onyx Studio™, the JBL Clip™, the JBL Flip™, the JBL Charge™
7
Table of Contents
and the JBL Pulse™ and PC-related devices such as the JBL Creature™ II and Harman/Kardon Soundsticks® III. We also offer a variety of headphone devices under the JBL, Harman/Kardon, AKG and yurbuds Powered by JBL brand names. Our products add greater functionality for computers, cellular telephones and electronic devices.
Professional
Our professional products include loudspeakers, electronic equipment, video and control solutions and lighting solutions that are marketed under what we believe are some of the most respected brand names in the industry.
The professional market is increasingly moving to digital technology and we believe that we are a leader in this market. Our Professional segment derives value from our ability to share research and development, engineering talent, technical expertise and other digital resources among our business units. Loudspeakers, amplifiers, signal processing, mixing, microphones, headphones, lighting and video and control equipment each have substantial digital engineering resources and work together to achieve common goals.
Our professional loudspeakers are well known for high quality and superior sound. JBL Professional branded products include studio monitors, loudspeaker systems, powered loudspeakers, sound reinforcement systems, cinema systems, surround sound systems, industrial loudspeakers and electro-acoustic software-based directivity control steerable speaker columns. Our Selenium branded products include line arrays, screen and portable systems and related technologies for public sound reinforcement.
Our professional electronic audio products are recognized for high quality and reliability. We market these products on a worldwide basis under various trademarks, including AKG, BSS, Crown, dbx, DigiTech, Lexicon, Soundcraft and Studer.
We believe the integration of loudspeakers and electronics enhances our ability to provide complete systems solutions to the professional audio market. As such, we produce professional microphones and headphones under the AKG brand name, amplifiers under the Crown brand name, sound mixing consoles under the Soundcraft and Studer brand names, and signal processing products, equalizers, and special effects devices under the Lexicon, DigiTech, BSS and dbx brand names.
With our HiQnet network protocol we can configure, connect and control a complete professional sound system from microphone to speaker on one unified digital network. This system provides enhanced productivity and facilitates real-time problem diagnosis and correction from a central location.
Our professional video and control solutions include enterprise automation and control systems, as well as audio/video switching and distributing solutions under the AMX brand name. In addition, our IDX information delivery system provides seamless audio and visual information delivery solutions in a highly flexible and scalable manner.
We provide full lighting solutions for the entertainment, architectural and commercial sectors under the Martin brand name.
Manufacturing
We believe that our manufacturing capabilities are essential to maintaining and improving product quality and performance. Our manufacturing facilities are located in North America, Europe, Asia and South America. Our facilities have been designed to emphasize worker safety and compliance with environmental, health and safety regulations.
8
Table of Contents
Our European manufacturing facilities for our Infotainment segment are located in Germany and Hungary. We also have manufacturing facilities in the U.S., Mexico and China. These facilities are used to manufacture infotainment systems.
Our European manufacturing facilities for our Lifestyle segment are located in Germany, France and Hungary. These facilities are used to manufacture automotive audio systems. Our North American manufacturing facilities are located in Mexico for automotive audio components and Kentucky for automotive electronics. We also manufacture automotive audio and electronic components in China. Our Lifestyle segment primarily uses original design manufacturers and outsources the manufacture of its home audio products to generate cost efficiencies, deliver products faster, and better serve our customers. These manufacturers are primarily based in China. We also have a facility in Brazil that produces aftermarket automotive audio products.
In North America, our principal Professional segment’s manufacturing facilities are located in Mexico for loudspeakers, in Indiana for electronic products including amplifiers and effects devices, and in Washington for video and control products. Our Professional segment’s electronics manufacturing in Europe includes mixing consoles in the United Kingdom, lighting solutions in Denmark and microphones and headphones in Austria. Our Professional segment’s electronics manufacturing in Brazil includes electronic loudspeakers, amplifiers and other components. Our Professional segment’s manufacturing in China includes audio electronics and loudspeakers.
Suppliers
Although most components essential to our business are generally available from multiple suppliers, a number of components are currently obtained from limited sources. We use rare earth minerals in our products, specifically rare earth neodymium magnets. We also use externally sourced microchips in many of our products. Several independent suppliers manufacture loudspeakers and electronic products for us. The loss of any one of these suppliers could have a material adverse impact on our consolidated results of operations or consolidated financial condition.
Distribution Channels
Infotainment
We primarily sell our infotainment systems directly to automobile manufacturers in the U.S., Europe, India, Japan, China and South Korea, where they are installed as original equipment.
Lifestyle
We primarily sell our Lifestyle automotive audio systems directly to automobile manufacturers in the U.S., Europe, India, Japan, China and South Korea, where they are installed as original equipment. In both our foreign and domestic markets, we sell our Lifestyle home audio products to dealers who sell directly to the end user and to distributors who resell our products to retailers. We market our products as one brand to the ultimate consumer who chooses what brand of sound system to purchase for their home or their automobile. Our goal is to make Harman brands the preferred brand in both home and automotive audio applications.
Home, multimedia and mobile aftermarket products are offered through audio specialty stores, discount stores, department stores, mail order firms, online retailers and our website www.harmanaudio.com. Automotive and computer manufacturers also offer our branded audio products as options. We concentrate primarily on the higher quality, higher priced segments of the audio market and compete based upon the strength of our brand names, the quality of our products, our ability to provide integrated systems and our comprehensive marketing, engineering and manufacturing resources.
9
Table of Contents
Professional
In the U.S. we primarily sell our audio products to dealers via manufacturer’s representatives. Outside the U.S. we sell primarily to distributors. Manufacturer’s representatives are paid sales agents and distributors buy and hold the inventory and sell directly to dealers in their markets. Both manufacturer’s representatives and distributors have a defined geographic region. In the broadcast and recording market, we primarily solicit business directly with the end users. We also sell our professional products in retail stores and direct to customers over the Internet. For lighting solutions, we sell directly to the end user in the U.S. and most of Europe. In other countries, our lighting solutions are sold through a distributor network. These distributors deal with either end users or other dealers within their own markets. Our video and control solutions are primarily sold through third parties including dealers, consultants, architects and systems integrators in the United States and through a distributor network in other countries.
Trademarks and Patents
We market our products under numerous brand names that are protected by both pending and registered trademarks around the world. Our trademark registrations cover use of trademark rights in connection with various products, such as loudspeakers, speaker systems, speaker system components and other electrical and electronic devices. We have registered or taken other protective measures for many of these trademarks in substantially all major industrialized countries. As of June 30, 2014, we had 2,200 trademark registrations and 371 pending trademark applications around the world.
We have a history of innovation and, with more than 3,643 patents and 2,014 pending patent applications, at June 30, 2014, covering various audio, infotainment and software technologies and products, we continue to take our technology and products into new areas. While we consider our patents on the whole to be important, we do not consider any single patent, any group of related patents or any single license essential to our operations in the aggregate. The expiration of the patents individually and in the aggregate would not have a material adverse effect on our financial condition or results of operations.
Seasonality
We experience seasonal fluctuations in sales and earnings. Historically, our first fiscal quarter ending September 30th is generally the weakest due to automotive model year changeovers and the summer holidays in Europe. Sales of our Lifestyle home audio products are generally significantly higher in the second quarter of our fiscal year, due to increased demand for these products during the holiday buying season. Our sales and earnings also vary due to the timing of the release of new products, customer acceptance of our products, product offerings by our competitors and general economic conditions.
Key Customers/Industry Concentration
We are subject to various risks related to our dependence on key customers. Net sales to BMW, Fiat Chrysler Automobiles, Audi/Volkswagen and Toyota/Lexus accounted for 16 percent, 13 percent, 12 percent and 8 percent, respectively, of our total consolidated net sales for the fiscal year ended June 30, 2014. Accounts receivable, net due from BMW, Fiat Chrysler Automobiles, Audi/Volkswagen and Toyota/Lexus accounted for 11 percent, 13 percent, 7 percent and 4 percent, respectively, of total consolidated accounts receivable, net at June 30, 2014. We anticipate that BMW, Fiat Chrysler Automobiles, Audi/Volkswagen and Toyota/Lexus will continue to account for a significant portion of our net sales and accounts receivable, net for the foreseeable future.
For the fiscal year ended June 30, 2014, approximately 69 percent of our net sales were to automobile manufacturers. Our automotive customers are not contractually obligated to any long-term purchase of our products. The loss of BMW, Fiat Chrysler Automobiles, Audi/Volkswagen and Toyota/Lexus, or any of our other significant automotive customers would have a material adverse effect on our consolidated net sales, results of operations and financial condition.
10
Table of Contents
Backlog Orders
We manufacture our infotainment and automotive audio systems on a just-in-time basis. We maintain sufficient inventories of finished goods to promptly meet customer orders for our Lifestyle home audio and Professional segment customers. As a result, we do not consider the level of backlog to be an important indication of our future performance. Our backlog was approximately $30.7 million at June 30, 2014. We expect to deliver these products within the next 12 months.
Warranty Liabilities
We warrant our products to be free from defects in materials and workmanship for periods ranging from six months to six years from the date of purchase, depending on the business segment and product. Our dealers and warranty service providers normally perform warranty service in field locations and regional service centers, using parts and replacement finished goods we supply on an exchange basis. Our dealers and warranty service providers also install updates we provide to correct defects covered by our warranties. Estimated warranty liabilities are based upon past experience with similar types of products, the technological complexity of certain products, replacement cost and other factors. If estimates of warranty provisions are no longer adequate based on our analysis of current activity, incremental provisions are recorded as warranty expense in our Consolidated Statement of Income. We take these factors into consideration when assessing the adequacy of our warranty provision for periods still open to claim.
Competition
The industries that we serve are fragmented and competitive and include numerous manufacturers offering products that vary widely in price, quality and distribution methods.
Infotainment
In the infotainment market, we compete with Alpine, Bosch, Panasonic, Continental, Visteon, Mitsubishi Electronics, Aisin Seiki, Delphi and Denso in the sale of infotainment systems to automotive manufacturers. We believe our competitive position is enhanced by our technical expertise in designing and integrating navigation, speech recognition and human-machine interfaces into complete infotainment systems uniquely adapted to the specific requirements of each automobile model.
Lifestyle
In the automotive audio market, we compete with Bose, Pioneer ASK, Foster Electric, Bang & Olufsen, Delphi and Panasonic in the sale of audio systems to automotive manufacturers. We believe our competitive position is enhanced by our technical expertise in designing and integrating audio systems uniquely adapted to the specific requirements of each automobile model. In the automobile after-market category we compete against speaker/amplifier brands such as Rockford Fosgate, Polk Audio and MTX and full range brands such as Alpine, Kenwood, Pioneer and Sony.
In the home audio market, principal competitors in the loudspeaker market include Bose, Klipsch, Polk Audio, Bowers & Wilkins, Delphi, Sonos and Boston Acoustics. Competition in the home audio and home electronics market remains intense and is dominated by large Asian manufacturers such as Yamaha, Sony, Denon, Onkyo, Pioneer and Marantz. We also compete in the luxury electronics market with our Mark Levinson and Lexicon brands. Our principal competitors in this high-end market include Krell, McIntosh, Audio Research, Meridian, Linn, Bang & Olufsen and Classe.
In the multimedia market, we supply Apple stores and other retailers with JBL and Harman/Kardon speaker systems that serve Apple’s iPad, iPod and iPhone products as well as other MP3 players. Our principal competitors for these products are Bose, Altec Lansing, Klipsch, iHome, Bowers & Wilkins and Phillips. We also offer Harman/Kardon and JBL speaker systems to personal computer retailers. In this market, our principal competitors are Creative
11
Table of Contents
Labs, Altec Lansing, Logitech, Klipsch and Cyber Acoustics. We sell headphones online and through various retailers. Our principal competitors for these products are Beats, Pioneer, Sony, Bowers & Wilkins, Apple, Skullcandy and Bose. The home audio and multimedia markets are characterized by the short life cycle of products and a need for continuous design and development efforts. Our competitive strategy is to compete in the higher-quality segments of this market and to continue to emphasize our ability to provide system solutions to customers, including a combination of loudspeakers, electronics products, integrated surround sound and home theater systems.
Professional
The market for professional sound systems is highly competitive. We believe that we have historically held a leading market position in the professional loudspeaker market and have complemented our professional loudspeaker line by adding digital professional electronic products, broadcast and recording equipment, lighting solutions and video and control solutions. We compete by utilizing our ability to provide systems solutions to meet the complete audio requirements of our professional customers. With our HiQnet networking protocol software, our professional brand products can communicate and operate together. We offer products for most professional audio applications.
Our principal competitors in the sound reinforcement market include Telex, Electro Voice, Mackie, QSC, Meyer Sound Laboratories, Sennheiser, Peavey, Shure, Audio Technica and Yamaha. Principal competitors in the recording and broadcast markets include Yamaha, Sennheiser, Loud Technologies, Inc., Lawo, Harris Corporation, DigiDesign/M-Audio, Genelec, KRK, TC Electronics, Stagetec and Sony. In the music instrument market, competitors for our products include Yamaha, Peavey, QSC, Shure, Sennheiser, Line 6, Dunlop, Zoom, Audio Technica and Roland. Our competitors in the industrial and architectural sound market include Siemens, Peavey and Tannoy. Our competitors in the lighting market include Barco, Chauvet Lighting, Clay Paky, Elation, JB Lighting, Robe Lighting and Vari-Lite. Our competitors in video and control solutions include Leviton, Extron, Control4, Simtrol and Crestron.
Environmental Regulation
We are subject to various Federal, state, local and international environmental laws and regulations, including those governing the use, discharge and disposal of hazardous materials and, increasingly, the recycling of our products and their packaging.
In Europe, we are subject to the European Union’s (“EU”) Directive on the Restriction of Use of Certain Hazardous Substances in Electrical and Electronics Equipment (“EU RoHS”). This directive restricts the placement into the EU market of electrical and electronic equipment containing certain hazardous materials, including lead, mercury, cadmium and chromium. We are also subject to the EU Waste Electrical and Electronic Equipment Directive, which regulates the collection, recovery and recycling of waste from certain electronic products.
The EU has also enacted the Registration, Evaluation, Authorization and Restriction of Chemicals (“REACH”) regulation. REACH requires manufacturers and importers of articles to register the substances contained in the articles if the substances are intended to be released under normal or reasonably foreseeable conditions of use. Because the substances contained in our products are not intended to be released under normal or reasonably foreseeable conditions of use, we do not believe we or the importers of our products have an obligation under REACH to register those substances.
Certain of our Lifestyle products will require submission of energy-use profiles in accordance with the EU Energy Using Products Directive. We are modifying the design and energy-use profiles of our products to comply with applicable laws and regulations. Additionally, the U.S. Department of Energy has promulgated a regulation pertaining to external power supplies and compliance with the energy efficiency standards that were established under the Energy Independence and Security Act of 2007. We will address these requirements as necessary. Our products may also become subject to further energy efficiency requirements if and when required under U.S. federal climate change legislation.
12
Table of Contents
In China, we are subject to China’s law on Management Methods on the Control of Pollution Caused by Electronic Information Products (“China RoHS”), which is substantially similar to the EU RoHS. The China RoHS requires the disclosure and marking of certain substances, including lead, mercury, cadmium and chromium in certain electronic products.
We believe that our facilities are in substantial compliance with current laws and regulations. We expect further laws similar to the EU RoHS and China RoHS, and those governing product and packaging recycling, to be introduced in other jurisdictions, many or most of which could impose additional costs, including fees to cover recycling costs. The need for and cost of our compliance with such legislation cannot yet be determined but it could be substantial.
Research and Development
We believe that continued investment in product research and development is critical to our success. Net expenditures for research and development were $343.8 million, $285.3 million and $331.9 million for the fiscal years ended June 30, 2014, 2013 and 2012, respectively. We expect to continue to devote significant resources to research and development to sustain our competitive position.
Number of Employees
At June 30, 2014, we had approximately14,202 full-time employees, including 5,599 employees located in North America and 8,603 employees located outside of North America.
Foreign Operations
Information about our foreign operations is set forth in Note 18—Business Segment Data in the Notes to the Consolidated Financial Statements located in Item 8 of Part II of this report.
Corporate Information
We were incorporated in the state of Delaware in 1980. Our principal executive offices are located at 400 Atlantic Street, Suite 1500, Stamford, Connecticut 06901. Our telephone number is (203) 328-3500.
Subsequent Events
Dividend Declaration
On August 7, 2014, we declared a cash dividend of $0.33 per share for the quarter ended June 30, 2014. The quarterly dividend will be paid on September 2, 2014 to each stockholder of record as of the close of business on August 18, 2014.
Website Information
Our corporate website is located at www.harman.com. We make available free of charge on our investor relations website under “SEC Filings” our Annual Reports on Form 10-K, Quarterly Reports on Form 10-Q, Current Reports on Form 8-K, and any amendments to those reports, as soon as reasonably practicable after we electronically file or furnish such materials to the U.S. Securities and Exchange Commission (“SEC”). Our website also provides access to reports filed by our directors, executive officers and certain significant stockholders pursuant to Section 16 of the Securities Exchange Act of 1934, as amended (the “Exchange Act”). In addition, our Corporate Governance Guidelines, Codes of Ethics and Business Conduct, and the charters for the three committees of our Board of Directors are available on our website. The information on our website is not incorporated by reference into this report. In addition, the SEC maintains a website, www.sec.gov, that contains reports, proxy and information statements and other information that we file electronically with the SEC.
13
Table of Contents
| Item 1A. | Risk Factors |
In addition to the other information included in this report, you should carefully consider the risk factors described below.
Decreased demand and pricing pressure from our customers in the automotive industry or bankruptcy of a significant automotive customer could have a material adverse effect on our liquidity, financial condition and results of operations.
For the fiscal year ended June 30, 2014, approximately 69 percent of our sales were to automobile manufacturers. As a result, our financial performance depends, in large part, on conditions in the automotive industry, which is highly dependent on general economic conditions and periodically has experienced significant difficulty. As a result, we have experienced, and may continue to experience, reductions in orders from our original equipment manufacturer customers. If one or more of our significant automotive customers experiences, or continues to experience, increased financial difficulty, including bankruptcy, as a result of a prolonged economic downturn or otherwise, this would have a further adverse effect on our business due to further decreased demand, the potential inability of these companies to make full payment on amounts owed to us, or both. As part of the bankruptcy process, our pre-petition receivables may not be realized, customer manufacturing sites may be closed or contracts voided. The bankruptcy of a major customer could have a material adverse effect on our liquidity, financial condition and results of operations.
In addition, our customer supply agreements generally provide for reductions in pricing of our products over the period of production. Pricing pressures may intensify as a result of cost cutting initiatives of our customers. If we are unable to generate sufficient production cost savings in the future to offset future price reductions, our results of operations may be adversely affected.
A decrease in consumer discretionary spending would likely reduce our sales.
Our sales are dependent on discretionary spending by consumers, which could be materially adversely impacted by economic conditions affecting disposable consumer income and retail sales. In addition, our sales of audio, electronic and infotainment products to automotive customers are dependent on the overall success of the automotive industry, and of premium automobiles in particular, as well as the willingness of automobile purchasers to pay for the option of a premium branded automotive audio system or a multi-function digital infotainment system. Global demand for, and production of, premium vehicles, including certain vehicle models that incorporate our products, could decline in a difficult economic environment. This decline could have a negative impact on our results of operations.
We have significant operations in Europe which may be adversely impacted by the continued economic challenges in Europe.
The global economic recession that began in 2008 resulted in significantly lower demand and decreased profitability across all of our segments and major markets. While North America and Asia have shown an improved, but somewhat uneven recovery, Europe remains stagnant with continued economic and financial challenges. Recent events in Europe have elevated concerns that macroeconomic conditions will worsen and economic recovery will be delayed. If weak economic conditions persist or worsen, there could be a number of negative effects on our business, including our customers or potential customers reducing or delaying orders, the insolvency of one or more of our key suppliers, which could result in production delays, and our customers being unable to obtain credit. Approximately 31 percent of our sales in fiscal year 2014 were made to end consumers in Europe. Should conditions worsen in these markets, customer demand for our products may deteriorate which would have a negative impact on our results of operations.
14
Table of Contents
A significant portion of our sales are denominated in Euros, which sales may be adversely impacted by the eurozone crisis.
Approximately 43 percent of our sales in fiscal year 2014 were denominated in Euros. Certain eurozone countries in which we operate have received financial aid packages from the European Union in the form of loans and restructuring of their sovereign debt and have introduced comprehensive fiscal austerity measures. If dissolution and replacement of the Euro currency and the potential reintroduction of individual European Union currencies should occur as a result of the continued eurozone crisis, it could have a negative impact on our results of operations and could expose us to increased foreign exchange risk.
The macro economic environment may adversely affect consumer spending patterns and the availability and cost of credit.
Our ability to make scheduled payments or to refinance our obligations with respect to indebtedness will depend on our operating and financial performance, which in turn is subject to prevailing economic conditions. Disruptions in the financial markets, including the bankruptcy and restructuring of major financial institutions, may adversely impact the availability and cost of credit in the future. The historical disruptions in the financial markets that occurred within the past five years continue to have an adverse effect on the global economy, which has negatively impacted consumer spending patterns. This may result in reductions in sales of our products, longer sales cycles, slower adoption of new technologies and increased price competition. There can be no assurances that government responses to the disruptions in the financial markets will restore consumer confidence, stabilize the markets or increase liquidity and the availability of credit.
We may not realize sales represented by awarded business.
Our current estimate of $20.5 billion of awarded business at June 30, 2014 in our Infotainment and Lifestyle segments is calculated using certain assumptions from our customers, including projected future sales volumes with respect to the applicable platforms. Orders from our customers with respect to these platforms are not made pursuant to contractual obligations and our customers can terminate arrangements with us at any time without penalty. Therefore, our actual platform sales volumes, and thus the ultimate amount of revenue that we derive from such platforms, are not committed. If actual production orders from our customers are not consistent with the projections we use in calculating the amount of our awarded business, we could realize substantially less revenue over the life of these projects than the currently projected estimate.
The demand for our infotainment products may be eroded by replacement technologies becoming available on mobile handsets and tablets.
Sales of our infotainment products represented more than half of our net sales in fiscal year 2014. GPS/navigation technologies are increasingly being incorporated into devices such as mobile handsets and tablets. Mobile handsets are frequently GPS-enabled and many companies are now offering navigation software for such devices. In future years, if automakers choose to replace embedded infotainment systems with mobile handset devices, the acceptance of this technology by consumers may negatively impact the demand for our infotainment products. If we do not continue to innovate to develop new and compelling products that capitalize upon new technologies, this could have a material adverse impact on our results of operations.
Failure to maintain relationships with our largest customers and failure by our customers to continue to purchase expected quantities of our products due to changes in market conditions would have an adverse effect on our operations.
We anticipate that our automotive customers, including BMW, Chrysler Fiat Automobiles, Audi/Volkswagen and Toyota/Lexus will continue to account for a significant portion of our sales for the foreseeable future. However, none of BMW, Chrysler Fiat Automobiles, Audi/Volkswagen and Toyota/Lexus or any of our
15
Table of Contents
other automotive customers is obligated to any long-term purchases of our products. The loss of sales to BMW, Chrysler Fiat Automobiles, Audi/Volkswagen and Toyota/Lexus, or to any of our other significant automotive customers would have a material adverse effect on our consolidated net sales, results of operations and financial condition.
The loss of business with respect to, or the lack of commercial success of, a vehicle model for which we are a significant supplier could adversely affect our financial performance.
Although we receive award letters or contracts from our automotive customers, these award letters or contracts generally provide for the supply of a customer’s requirements for a particular vehicle model, rather than for the purchase of a specific quantity of products. The loss of business with respect to, or the lack of commercial success of, a vehicle model for which we are a significant supplier could reduce our sales and thereby adversely affect our financial condition, operating results and cash flows.
Strategic decisions by our customers to expand dual sourcing arrangements could have an adverse effect on our operations.
Automakers customarily maintain dual sourcing arrangements and we cannot assure you that our customers will not further expand dual sourcing arrangements in the future, which could have a material adverse effect on our consolidated net sales, results of operations and financial condition.
Failure to deliver products on time to our automotive customers could adversely affect our financial results.
We have products in various stages of development for our automotive customers. If we do not complete our development efforts in time to meet our customers’ vehicle production requirements, we could be subject to monetary penalties and damage our customer relationships, which could have a material adverse effect on our consolidated sales, results of operations and financial condition.
We have invested substantial resources in markets where we expect growth and we may be unable to timely alter our strategies should such expectations not be realized.
Our future growth is dependent on our making the right investments at the right time to support product development and manufacturing capacity in areas where we can support our customer base. We have identified certain regions, including China, Brazil, Russia and India, as key markets likely to experience substantial growth, and accordingly have made and expect to continue to make substantial investments, both directly and through participation in partnerships and joint ventures, in manufacturing operations, technical centers and other infrastructure to support anticipated growth in these regions. If we are unable to deepen existing and develop additional customer relationships in these regions, we may not only fail to realize expected rates of return on our existing investments, but we may incur losses on such investments and be unable to timely redeploy the invested capital to take advantage of other markets, potentially resulting in lost market share to our competitors. Our results of operations and financial condition will also suffer if these regions do not grow as quickly as we anticipate.
Natural disasters, geo-political events and the failure of our information technology and communication systems could adversely affect our financial performance.
The availability of our products and services depends on the continuing operation of our information technology and communications systems. The occurrence of one or more natural disasters, such as hurricanes, cyclones, typhoons, floods, earthquakes, and tsunamis, geo-political events, such as civil unrest or terrorist attacks, or power loss, telecommunications failures, computer viruses, computer denial of service attacks, or other attempts to harm our systems, in a country in which we operate or in which our suppliers are located, could adversely affect our operations and financial performance. Such events could result in physical damage to, or the
16
Table of Contents
complete loss of, one or more of our properties, the lack of an adequate work force in a market, the inability of customers to reach or have transportation to our channel partners directly affected by such events, the evacuation of the populace from areas in which our channel partners are located, changes in the purchasing patterns of consumers and in consumers’ disposable income, the temporary or long-term disruption in the supply of materials and products from some local and overseas suppliers, the disruption in the transport of goods from overseas, the disruption or delay in the delivery of goods to our facilities within a country in which we are operating, the reduction in the availability of our products in stores, the disruption of utility services to our facilities, the disruption of our information technology, including databases containing sensitive information, and disruption in our communications with our facilities and our customers and suppliers. If we failed to implement and maintain a comprehensive disaster recovery program and any of the foregoing events occurs, such events and their impacts could otherwise disrupt and have a material adverse effect on our consolidated net sales, results of operations and financial condition.
We depend on our suppliers for key production materials and any disruption in the supply of such materials could interrupt product manufacturing and increase product costs.
Many of our suppliers have in the past, and could in the future decrease their manufacturing capacity and inventory levels. If these steps are taken by our suppliers, it could make us more vulnerable to disruptions in the supply chain. In the near term, an increase in our demand for parts may place an undue strain on our suppliers. Additionally, the supply of raw materials including, without limitation, petroleum, copper, steel, aluminum, synthetic resins, rare metals and rare earth minerals, such as neodymium used in the production of loudspeakers, has been and could continue to be significantly constrained, which is likely to result in continued elevated price levels. Furthermore, the Dodd-Frank Wall Street Reform and Consumer Protection Act included disclosure requirements regarding the use of “conflict” minerals mined from the Democratic Republic of Congo and adjoining countries (“DRC”) and procedures regarding a manufacturer’s efforts to prevent the sourcing of such “conflict” minerals. These rules could limit the number of suppliers who can provide us DRC “conflict free” components and parts, and we may not be able to obtain DRC conflict free products or supplies in sufficient quantities or at competitive prices for our operations. We may also face challenges with our customers and suppliers if we are unable to sufficiently verify that the metals used in our products are conflict free. As a result, we may not be able to obtain the materials necessary to manufacture our products, which could force us to cease production or search for alternative supply sources, possibly at a higher cost. Such disruptions may have a material adverse effect on our business, financial condition, results of operations and cash flows.
We may lose market share if we are unable to compete successfully against our current and future competitors.
The audio and video product markets that we serve are fragmented, highly competitive, rapidly changing and characterized by intense price competition. Many manufacturers, large and small, domestic and foreign, offer audio and video systems that vary widely in price and quality and are marketed through a variety of channels, including audio and video specialty stores, discount stores, department stores, mail order firms and the Internet. Some of our competitors have financial and other resources greater than ours. We cannot assure you that we will continue to compete effectively against existing or new competitors that may enter our markets. We also compete indirectly with automobile manufacturers that may improve the quality of original equipment audio and electronic systems, reducing demand for our aftermarket mobile audio products, or change the designs of their cars to make installation of our aftermarket products more difficult or expensive.
If we do not continue to develop, introduce and achieve market acceptance of new and enhanced products, our sales may decrease.
Our business is based on the demand for premium audio and video products. In order to increase sales in current markets and gain entry into new markets, we must innovate to maintain and improve existing products, while successfully developing and introducing distinctive new and enhanced products that anticipate changing
17
Table of Contents
consumer preferences and capitalize upon emerging technologies. We may experience difficulties that delay or prevent the development, introduction or market acceptance of new or enhanced products. Furthermore, we may be unable to detect and correct defects in some of our products before we ship them. Delays or defects in new product introduction may result in loss of sales or delays in market acceptance. Even after introduction, our new or enhanced products may not satisfy consumer preferences and product failures may cause consumers to reject our products. As a result, these products may not achieve market acceptance and our brand image could suffer. In addition, our competitors may introduce superior designs or business strategies, impairing our distinctive image and our products’ desirability, which may cause consumers to defer or forego purchases of our products.
Our success depends substantially on the value of our brands and our implementation of a sufficient brand protection program.
Our success is dependent in large part upon our ability to maintain and enhance the value of our brands, and our customers’ connection to our brands. Brand value can be severely damaged even by isolated incidents, particularly if the incidents receive considerable negative publicity or result in litigation. Some of these incidents may relate to our growth strategies, our development efforts in domestic and foreign markets, or the ordinary course of our business. Other incidents may arise from events that are or may be beyond our ability to control and may damage our brands, such as counterfeit and knock-off products, litigation and claims, and illegal activity targeted at us or others. Consumer demand for our products and our brands’ value could diminish significantly if any such incidents or other matters erode consumer confidence in us or our products, and if we do not implement a brand protection program that sufficiently addresses the issue of counterfeit and knock-off products, among other things, either of which would likely result in lower net sales and, ultimately, lower income, which in turn could materially and adversely affect our business and results of operations.
Covenants in our existing debt agreements restrict our operations.
Our existing credit agreement contains provisions that limit our operating and financing activities. The credit agreement also contains certain negative covenants that limit, among other things, our ability to pay dividends, permit certain of our subsidiaries to incur debt, incur liens, make fundamental changes, sell assets, undertake transactions with affiliates and undertake sale and leaseback transactions. The facilities are subject to acceleration upon certain specified events of default, including failure to make timely payments, breaches of representations or covenants, or a change of control, as such term is defined in the credit agreement. Because of the restrictions in our credit agreement, we may have difficulty securing additional financing in the form of additional indebtedness. In addition, our credit agreement contains other and more restrictive covenants, including financial covenants that require us to achieve specified financial and operating results and maintain compliance with specified financial ratios. We may have to curtail some of our operations to maintain compliance with these covenants. A violation of any of these covenants could result in a default under our credit agreement, which could permit the lenders to accelerate the repayment of any borrowings outstanding at that time, and the lenders under the credit agreement could act on the guarantee granted in connection with the facilities. A default or acceleration under our credit agreement would result in increased capital costs and could adversely affect our ability to operate our business and our results of operations and financial condition.
Currency fluctuations may reduce profits on our foreign sales or increase our costs, either of which could adversely affect our financial results.
A significant amount of our assets and operations are located, and the majority of our revenue is derived from sales outside the United States. Consequently, we are subject to fluctuations in foreign currency exchange rates, especially the Euro. Translation losses resulting from currency fluctuations may adversely affect the profits from our foreign operations and have a negative impact on our financial results. In addition, we purchase certain foreign-made products. Although we hedge a portion of our foreign currency exposure and, due to the multiple currencies involved in our business, foreign currency positions partially offset and are netted against one another to reduce exposure, we cannot assure you that fluctuations in foreign currency exchange rates will not make these
18
Table of Contents
products more expensive to purchase. Increases in our cost of purchasing these products could negatively impact our financial results if we are not able to pass those increased costs on to our customers.
Our operations could be harmed by factors including political instability and changes in regulations that govern international transactions.
The risks inherent in international trade may reduce our international sales and harm our business and the businesses of our distributors and suppliers. These risks include:
| • | changes in tariff regulations; |
| • | political instability, war, terrorism and other political risks; |
| • | establishing and maintaining relationships with local distributors and dealers; |
| • | lengthy shipping times and accounts receivable payment cycles; |
| • | import and export licensing requirements; |
| • | compliance with foreign laws and regulations, including unexpected changes in taxation and regulatory requirements; |
| • | greater difficulty in safeguarding intellectual property rights than in the United States; and |
| • | difficulty in staffing and managing geographically diverse operations. |
These and other risks may, among other things, increase the relative price of our products compared to those manufactured in other countries, reducing the demand for our products.
We may be adversely affected by future laws or regulations.
We are subject to various U.S. Federal, state and local, and non-U.S. laws and regulations. We cannot predict the substance or impact of pending or future legislation or regulations, or the application thereof. The introduction of new laws or regulations or changes in existing laws or regulations, or the interpretations thereof, could increase the cost of doing business for us or our customers or suppliers or restrict our actions and adversely affect our financial condition, operating results and cash flows. An example of such changing regulation is the recent adoption by the SEC of annual disclosure and reporting requirements for those SEC reporting companies who manufacture or contract to manufacture products that contain conflict minerals, and such minerals are necessary to the production or functionality of such product. Each reporting company is required to conduct a reasonable country of origin inquiry to determine whether such minerals were mined from the DRC. These new requirements required due diligence efforts in fiscal year 2014, and the initial disclosure requirements were filed in June 2014. There are historical and continued future costs associated with complying with these disclosure requirements, including for diligence to determine the sources of conflict minerals, if any, in our products.
Our business could be adversely affected by a strike or work stoppage at one of our manufacturing plants or at a facility of one of our significant customers or at a common carrier or major shipping location.
Workers at certain of our facilities and those of our automotive customers are unionized and may incur work stoppages or strikes. A work stoppage at our facilities or those of our automotive customers, or at a common carrier or major shipping location, could have a material adverse effect on our net sales, results of operations and financial condition. The risk of issues of this type at our facilities may be exacerbated by the implementation of our current or future cost reduction initiatives, which may involve significant staff reductions and facility relocations.
19
Table of Contents
Obligations to correct product defects covered by our warranties could adversely affect our financial results.
We warrant our products to be free from defects in materials and workmanship for periods ranging from six months to six years. Costs to correct product defects may exceed our estimates and adversely affect our results of operations and financial condition.
If we are unable to enforce or defend our ownership and use of our intellectual property rights, our business may decline.
Our future success will depend, in substantial part, on our intellectual property. We seek to protect our intellectual property rights, but our actions may not adequately protect the rights covered by our patents, patent applications, trademarks and other proprietary rights, and prosecution of our claims could be time consuming and costly. In addition, the intellectual property laws of some foreign countries do not protect our proprietary rights as do the laws of the United States. Despite our efforts to protect our proprietary information, third parties may obtain, disclose or use our proprietary information without our authorization, which could adversely affect our business. From time to time, third parties have alleged that we infringe their proprietary rights. These claims or similar future claims could subject us to significant liability for damages, result in the invalidation of our proprietary rights, limit our ability to use infringing intellectual property or force us to license third-party technology rather than dispute the merits of any infringement claim. Even if we prevail, any associated litigation could be time consuming and expensive and could result in the diversion of our time and resources.
We are engaged in ongoing litigation and may be the subject of additional litigation that may result in payments to third parties, which could harm our business and financial results.
We are currently involved in litigation arising out of or relating to the events leading up to the termination of the proposed acquisition of our Company in October 2007 and certain earnings guidance provided by us. In addition, similar litigation has been and may be initiated against us and others based on the alleged activities and disclosures at issue in the pending litigation. We cannot predict the outcome of any such proceeding or the likelihood that further proceedings will be instituted against us. In the event that there is an adverse ruling in any legal proceeding, we may be required to make payments to third parties that could harm our business or cash flows or financial results. Furthermore, regardless of the merits of any claim, the continued maintenance of these legal proceedings may result in substantial legal expense and could also result in the diversion of our management’s time and attention away from our business.
We have deferred tax assets in our consolidated financial statements.
Our consolidated financial statements include net deferred tax assets of $270.7 million as of June 30, 2014, which relate to temporary differences between the assets and liabilities in the consolidated financial statements and the assets and liabilities in the calculation of taxable income. The valuation of deferred tax assets is based on various projections for future taxable income reversing taxable temporary differences and tax planning strategies. Thus, when actual taxable income differs from projections, it may become necessary to adjust the valuation of our deferred tax assets, which would impact our results of operations and financial condition.
Harman International Industries, Incorporated is a holding company with virtually no operations of its own and therefore our cash flow and ability to service debt is dependent upon distributions from our subsidiaries.
Our ability to service our debt and pay dividends is dependent upon the operating earnings of our subsidiaries. The distribution of those earnings, or advances or other distributions of funds by those subsidiaries to Harman International Industries, Incorporated, all of which could be subject to statutory or contractual restrictions, are contingent upon the subsidiaries’ earnings and are subject to various business considerations.
20
Table of Contents
Our success depends upon our ability to attract and retain key employees and the succession of senior management.
Our success largely depends on the performance of our management team and other key employees. If we are unable to attract and retain talented, highly qualified senior management and other key people, our future operations could be adversely affected. In addition, if we are unable to effectively provide for the succession of senior management, including our chief executive officer, our business may be materially adversely affected. While we follow a disciplined, ongoing succession planning process and have succession plans in place for senior management and other key executives, these do not guarantee that the services of qualified senior executives will continue to be available to us at particular moments in time.
Any acquisitions we make could disrupt our business and materially harm our financial condition, results of operations and cash flows.
We may, from time to time, consider acquisitions of complementary companies, products or technologies. Acquisitions involve numerous risks, including difficulties in the integration of the acquired businesses, the diversion of our management’s attention from other business concerns, the assumption of unknown liabilities, undisclosed risks impacting the target and potential adverse effects on existing business relationships with our current customers and suppliers. In addition, any acquisitions could involve the incurrence of substantial additional indebtedness or dilution to our stockholders. We cannot assure you that we will be able to successfully integrate any acquisitions that we undertake or that such acquisitions will perform as planned or prove to be beneficial to our operations and cash flows. Any such failure could materially harm our financial condition, results of operations and cash flows.
Increased IT security requirements, vulnerabilities, threats and more sophisticated and targeted computer crime could pose a risk to our systems, networks, products, solutions, services and data.
Increased global IT security requirements, vulnerabilities, threats and more sophisticated and targeted computer crime pose a risk to the security of our systems and networks and the confidentiality, availability and integrity of our data. Despite our efforts to protect data or information, our facilities and systems and those of our third-party service providers may be vulnerable to security breaches, theft, misplaced or lost data, programming and/or human errors that could potentially lead to the compromising of sensitive, confidential or personal data or information, improper use of our systems, software solutions or networks, unauthorized access, use, disclosure, modification or destruction of information, defective products, production downtimes and operational disruptions, which in turn could adversely affect our reputation, competitiveness and results of operations.
Privacy concerns relating to our products and services could damage our reputation and deter current and potential users from using our products and services.
As we develop new products, we may gain access to sensitive, confidential or personal data or information in certain of our businesses that is subject to privacy and security laws, regulations and customer-imposed controls. Concerns about our practices with regard to the collection, use, disclosure, or security of personal information or other privacy related matters, even if unfounded, could damage our reputation and adversely affect our operating results.
Furthermore, regulatory authorities around the world are considering a number of legislative and regulatory proposals concerning data protection. In addition, the interpretation and application of consumer and data protection laws in the U.S., Europe and elsewhere are often uncertain and in flux. It is possible that these laws may be interpreted and applied in a manner that is inconsistent with our data practices. If so, in addition to the possibility of fines, this could result in an order requiring that we change our data practices, which could have an adverse effect on our business and results of operations. Complying with these various laws could cause us to incur substantial costs.
21
Table of Contents
| Item 1B. | Unresolved Staff Comments |
None.
| Item 2. | Properties |
Our corporate headquarters are located at 400 Atlantic Street, Suite 1500, Stamford, Connecticut 06901. Certain information regarding our principal facilities are described in the table below.
| Location |
Segments | Size (Sq. Ft.) |
Owned or Leased |
Percentage Utilization |
||||||||||
| Ittersbach, Germany |
Infotainment Lifestyle |
565,000 | Owned | 100 | % | |||||||||
| Nova Santa Rita, Brazil |
Professional Lifestyle |
432,000 | Owned | 100 | % | |||||||||
| Dandong, China |
Lifestyle Professional |
323,000 | Leased | 38 | % | |||||||||
| Moreno Valley, California |
Lifestyle Professional |
301,000 | Leased | 100 | % | |||||||||
| Fontana, California |
Lifestyle | 266,950 | Leased | 100 | % | |||||||||
| Northridge, California |
Lifestyle Professional |
238,000 | Leased | 68 | % | |||||||||
| Straubing, Germany |
Infotainment Lifestyle |
235,000 | Owned | 100 | % | |||||||||
| Elkhart, Indiana |
Professional | 223,000 | Owned | 90 | % | |||||||||
| Szekesfehervar, Hungary |
Infotainment Lifestyle |
222,000 | Owned | 100 | % | |||||||||
| Chateau du Loir, France |
Lifestyle | 221,000 | Owned | 75 | % | |||||||||
| Tijuana, Mexico |
Professional Lifestyle |
194,000 | Leased | 100 | % | |||||||||
| Queretaro, Mexico |
Infotainment Lifestyle |
188,000 | Leased | 100 | % | |||||||||
| Franklin, Kentucky |
Infotainment Lifestyle |
152,000 | Owned | 100 | % | |||||||||
| Suzhou, China |
Infotainment Lifestyle |
145,000 | Owned | 100 | % | |||||||||
| Frederikshaven, Denmark |
Professional | 136,000 | Leased | 100 | % | |||||||||
| Manaus, Brazil |
Infotainment | 130,000 | Owned | 100 | % | |||||||||
| Richardson, Texas |
Professional | 129,000 | Owned | 100 | % | |||||||||
| Novi, Michigan |
Infotainment Lifestyle |
121,000 | Leased | 100 | % | |||||||||
| Juarez, Mexico |
Lifestyle | 109,000 | Leased | 100 | % | |||||||||
| Farmington Hills, Michigan |
Infotainment Lifestyle |
106,000 | Leased | 100 | % | |||||||||
We also own or lease other facilities that are not considered principal properties. We believe that our facilities are suitable and adequate for our present needs and that suitable additional or substitute facilities will be available, if required.
22
Table of Contents
| Item 3. | Legal Proceedings |
At June 30, 2014, we were subject to legal claims and litigation arising in the ordinary course of business, including the matters described below. The outcome of these legal actions cannot be predicted with certainty; however, management, based upon advice from legal counsel, believes such actions are either without merit or will not have a material adverse effect on our financial condition, results of operations or cash flows.
In re Harman International Industries, Inc. Securities Litigation
On October 1, 2007, a purported class action lawsuit was filed by Cheolan Kim (the “Kim Plaintiff”) against Harman and certain of our officers in the United States District Court for the District of Columbia (the “Court”) seeking compensatory damages and costs on behalf of all persons who purchased our common stock between April 26, 2007 and September 24, 2007 (the “Class Period”). The original complaint alleged claims for violations of Sections 10(b) and 20(a) of the Securities Exchange Act of 1934, as amended (the “Exchange Act”) and Rule 10b-5 promulgated thereunder.
The complaint alleged that the defendants omitted to disclose material adverse facts about Harman’s financial condition and business prospects. The complaint contended that had these facts not been concealed at the time the merger agreement with Kohlberg, Kravis, Roberts & Co. and Goldman Sachs Capital Partners was entered into, there would not have been a merger agreement, or it would have been at a much lower price, and the price of our common stock therefore would not have been artificially inflated during the Class Period. The Kim Plaintiff alleged that, following the reports that the proposed merger was not going to be completed, the price of our common stock declined, causing the plaintiff class significant losses.
On November 30, 2007, the Boca Raton General Employees’ Pension Plan filed a purported class action lawsuit against Harman and certain of our officers in the Court seeking compensatory damages and costs on behalf of all persons who purchased our common stock between April 26, 2007 and September 24, 2007. The allegations in the Boca Raton complaint are essentially identical to the allegations in the original Kim complaint, and like the original Kim complaint, the Boca Raton complaint alleges claims for violations of Sections 10(b) and 20(a) of the Exchange Act and Rule 10b-5 promulgated thereunder.
On January 16, 2008, the Kim Plaintiff filed an amended complaint. The amended complaint, which extended the Class Period through January 11, 2008, contended that, in addition to the violations alleged in the original complaint, Harman also violated Sections 10(b) and 20(a) of the Exchange Act and Rule 10b-5 promulgated thereunder by “knowingly failing to disclose “significant problems” relating to its PND sales forecasts, production, pricing, and inventory” prior to January 14, 2008. The amended complaint claimed that when “Defendants revealed for the first time on January 14, 2008 that shifts in PND sales would adversely impact earnings per share by more than $1.00 per share in fiscal 2008,” that led to a further decline in our share value and additional losses to the plaintiff class.
On February 15, 2008, the Court ordered the consolidation of the Kim action with the Boca Raton action, the administrative closing of the Boca Raton action, and designated the short caption of the consolidated action as In re Harman International Industries, Inc. Securities Litigation, civil action no. 1:07-cv-01757 (RWR). That same day, the Court appointed the Arkansas Public Retirement System as lead plaintiff (“Lead Plaintiff”) and approved the law firm Cohen, Milstein, Hausfeld and Toll, P.L.L.C. to serve as lead counsel.
On March 24, 2008, the Court ordered, for pretrial management purposes only, the consolidation of Patrick Russell v. Harman International Industries, Incorporated, et al. with In re Harman International Industries, Inc. Securities Litigation.
On May 2, 2008, Lead Plaintiff filed a consolidated class action complaint (the “Consolidated Complaint”). The Consolidated Complaint, which extended the Class Period through February 5, 2008,
23
Table of Contents
contended that Harman and certain of our officers and directors violated Sections 10(b) and 20(a) of the Exchange Act and Rule 10b-5 promulgated thereunder, by issuing false and misleading disclosures regarding our financial condition in fiscal year 2007 and fiscal year 2008. In particular, the Consolidated Complaint alleged that defendants knowingly or recklessly failed to disclose material adverse facts about MyGIG radios, personal navigation devices and our capital expenditures. The Consolidated Complaint alleged that when Harman’s true financial condition became known to the market, the price of our common stock declined significantly, causing losses to the plaintiff class.
On July 3, 2008, defendants moved to dismiss the Consolidated Complaint in its entirety. Lead Plaintiff opposed the defendants’ motion to dismiss on September 2, 2008, and defendants filed a reply in further support of their motion to dismiss on October 2, 2008.
On April 12, 2012, In re Harman International Industries, Inc. Securities Litigation, civil action no. 1:07-cv-01757 (D.D.C.) was reassigned to Judge Rudolph Contreras while Patrick Russell v. Harman International Industries, Incorporated, et al. remained before Judge Richard W. Roberts.
On September 5, 2012, the Court heard oral arguments on defendants’ motion to dismiss. At the request of the Court, on September 24, 2012, each side submitted a supplemental briefing on defendants’ motion to dismiss. On January 17, 2014, the Court granted a motion to dismiss, without prejudice, the In re Harman International Industries, Inc. Securities Litigation. The Lead Plaintiff has filed a notice of appeal but no briefing schedule has been set.
Patrick Russell v. Harman International Industries, Incorporated, et al.
Patrick Russell (the “Russell Plaintiff”) filed a complaint on December 7, 2007 in the United States District Court for the District of Columbia and an amended purported putative class action complaint on June 2, 2008 against Harman and certain of our officers and directors alleging violations of Employee Retirement Income Security Act of 1974 (“ERISA”) and seeking, on behalf of all participants in and beneficiaries of the Harman International Industries Retirement Savings Plan (the “Savings Plan”), compensatory damages for losses to the Savings Plan as well as injunctive relief, imposition of a constructive trust, restitution, and other monetary relief. The amended complaint alleged that from April 26, 2007 to the present defendants failed to prudently and loyally manage the Savings Plan’s assets, thereby breaching their fiduciary duties in violation of ERISA by causing the Savings Plan to invest in our common stock notwithstanding that the stock allegedly was “no longer a prudent investment for the Participants’ retirement savings.” The amended complaint further claimed that, during the Class Period, defendants failed to monitor the Savings Plan’s fiduciaries, failed to provide the Savings Plan’s fiduciaries with, and to disclose to the Savings Plan’s participants, adverse facts regarding Harman and our businesses and prospects. The Russell Plaintiff also contended that defendants breached their duties to avoid conflicts of interest and to serve the interests of participants in and beneficiaries of the Savings Plan with undivided loyalty. As a result of these alleged fiduciary breaches, the amended complaint asserted that the Savings Plan had “suffered substantial losses, resulting in the depletion of millions of dollars of the retirement savings and anticipated retirement income of the Savings Plan’s Participants.”
On March 24, 2008, the Court ordered, for pretrial management purposes only, the consolidation of Patrick Russell v. Harman International Industries, Incorporated, et al. with In re Harman International Industries, Inc. Securities Litigation. Defendants moved to dismiss the complaint in its entirety on August 5, 2008. The Russell Plaintiff opposed the defendants’ motion to dismiss on September 19, 2008, and defendants filed a reply in further support of their motion to dismiss on October 20, 2008. On May 22, 2013, the District Court dismissed the complaint in its entirety. The Russell Plaintiff has filed a notice of appeal but no briefing schedule has been set.
24
Table of Contents
| Item 4. | Mine Safety Disclosures |
None.
Executive Officers of the Registrant
Executive officers are appointed by our Board of Directors and hold office at the pleasure of the Board until the next annual meeting of shareholders or until their successors are appointed and qualified. Each of our current executive officers is identified below together with information about each officer’s age, position and employment history for the last five years.
| Name |
Position |
Age | ||||
| Dinesh C. Paliwal |
Chairman, President and Chief Executive Officer | 56 | ||||
| Herbert K. Parker |
Executive Vice President and Chief Financial Officer | 56 | ||||
| Blake Augsburger |
Executive Vice President, President—Professional Division and Country Manager, North America | 51 | ||||
| Sachin Lawande |
Executive Vice President and President—Infotainment Division | 47 | ||||
| Michael Mauser |
Executive Vice President and President—Lifestyle Division | 51 | ||||
| Dr. I.P. Park |
Executive Vice President and Chief Technology Officer | 51 | ||||
| Ralph Santana |
Executive Vice President and Chief Marketing Officer | 46 | ||||
| David Slump |
Executive Vice President and President, Services | 46 | ||||
| John Stacey |
Executive Vice President and Chief Human Resources Officer | 49 | ||||
| Todd A. Suko |
Executive Vice President and General Counsel | 47 | ||||
Dinesh C. Paliwal became Chairman, President and Chief Executive Officer of Harman on July 1, 2008. Mr. Paliwal joined our Company on July 1, 2007 as President, Chief Executive Officer and Vice Chairman and was elected a director on August 13, 2007. Prior to joining our Company, Mr. Paliwal served as President of Global Markets and Technology of ABB Ltd. from January 2006 until June 2007 and as President and CEO of ABB North America from January 2004 until June 2007.
Herbert K. Parker joined our Company in June 2008 as Executive Vice President and Chief Financial Officer. From August 15, 2008 until October 1, 2008, Mr. Parker also served as our principal accounting officer. Prior to joining our Company, he served as Chief Financial Officer of ABB North America from January 2006 to May 2008.
Blake Augsburger joined our Company in 2001 as the President of Crown International. In 2006, Mr. Augsburger was promoted to Executive Vice President and President-Professional Division. Mr. Augsburger also serves as Country Manager for North America.
Sachin Lawande joined our Company in 2001, and has served as our Executive Vice President and President, Infotainment Division since July 1, 2013. From July 1, 2011 through June 30, 2013, Mr. Lawande served as Co-President, Lifestyle and Infotainment Divisions. From January 2009 to February 2012, he served as our Chief Technology Officer. From April 2010 to June 30, 2011, Mr. Lawande served as Co-President—Automotive Division. From 2008 to January 2009, Mr. Lawande served as Harman’s Chief Innovation Officer, where he was responsible for guiding software strategy and key development partnerships and was instrumental in launching an offshore development center in India as part of Harman’s strategy for optimizing its global footprint. Michael Mauser joined our Company in 1997, and has served as Executive Vice President and President—Lifestyle Division since July 1, 2013. From July 1, 2011 through June 30, 2013,
25
Table of Contents
Mr. Mauser served as Co-President, Infotainment and Lifestyle Divisions. From April 2010 through June 30, 2011, Mr. Mauser served as Executive Vice President and Co-President—Automotive Division. From May 2005 until April 2010, Mr. Mauser served as Senior Vice President, Finance and Chief Financial Officer of our Automotive Division.
Dr. I.P. Park joined our Company in February 2012 as Executive Vice President and Chief Technology Officer. Prior to joining our Company, he served as Vice President of Intelligent Computing Laboratory at Samsung Electronics, from September 2006 through December 2011. While at Samsung, Dr. Park headed advanced software R&D teams responsible for developing Samsung’s future software technologies, and he provided leadership in core software research, standardization and open source activities.
Ralph Santana joined our Company in April 2013 as Executive Vice President and Chief Marketing Officer. Prior to joining our Company, he served as Senior Vice President and Chief Marketing Officer for Samsung North America from 2010 to 2012. Prior to Samsung, Mr. Santana’s experience included a 16 year career at PepsiCo where he held a variety of positions that spanned multiple international and domestic leadership roles in marketing, most recently as Vice President of Colas.
David Slump has served as our Executive Vice President and President, Services since July 1, 2013. Mr. Slump served as our Executive Vice President, Corporate Development from July 1, 2011 through June 30, 2013. From January 2009 through June 30, 2011, he served as President—Consumer Division. From January 2009 to May 2010, he also served as our Vice President, Corporate Development. Prior to joining our Company, from 2008 to January 2009, Mr. Slump served as Senior Vice President for Landis + Gyr Holdings, a leader in the energy management industry, where he directed the company’s global brand strategy and evaluated portfolio and architecture investments.
John Stacey joined our Company in February 2008 as Executive Vice President and Chief Human Resources Officer. Prior to joining our Company, he was Vice President, People for InBev North America, InBev Central and Eastern Europe from 2005 through January 2008.
Todd A. Suko joined our Company in October 2008 as Executive Vice President and General Counsel. From October 2008 through December 2011 he also served as Secretary. Prior to joining our Company Mr. Suko served as Vice President, General Counsel and Secretary for UAP Holding Corp. and United Agri Products from 2001 to September 2008. Mr. Suko is a member of the bar in Washington, DC and Virginia and is a Commander in the United States Navy Reserve.
26
Table of Contents
| Item 5. | Market for Registrant’s Common Equity, Related Stockholder Matters and Issuer Purchases of Equity Securities |
The following graph compares changes in cumulative total returns (assuming reinvestment of cash dividends) on shares of the common stock for the five-year period ending on June 30, 2014 against the S&P Composite-500 Stock Index and the S&P Consumer Discretionary Index. The stock price performance graph assumes an initial investment of $100 at the market close on June 30, 2009. Dates on the chart represent the last trading day of the indicated fiscal year. The stock price performance shown on the graph below is not necessarily indicative of future performance of the shares of common stock.
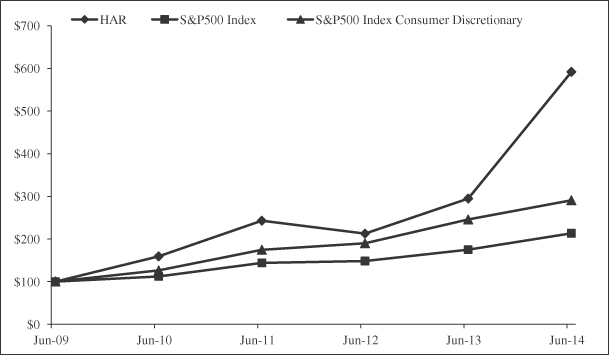
Our common stock is listed on the New York Stock Exchange and is reported on the New York Stock Exchange Composite Tape under the symbol HAR. As of July 31, 2014, there were approximately 89 record holders of our common stock.
The table below sets forth the reported high and low sales prices for our common stock, as reported on the New York Stock Exchange, for each quarterly period for fiscal years ended June 30, 2014 and 2013.
| Years Ended June 30, | ||||||||||||||||
| 2014 | 2013 | |||||||||||||||
| Market Price |
High | Low | High | Low | ||||||||||||
| First quarter ended September 30 |
$ | 70.92 | $ | 53.37 | $ | 49.38 | $ | 36.99 | ||||||||
| Second quarter ended December 31 |
84.50 | 65.19 | 47.24 | 37.35 | ||||||||||||
| Third quarter ended March 31 |
110.90 | 80.20 | 50.25 | 41.95 | ||||||||||||
| Fourth quarter ended June 30 |
112.01 | 99.98 | 54.20 | 41.38 | ||||||||||||
During fiscal year 2014, we declared and paid cash dividends of $1.20 per share, with dividends of $0.30 declared in each quarter. During fiscal year 2013, we declared and paid cash dividends of $0.60 per share, with
27
Table of Contents
dividends of $0.15 declared in each quarter. During fiscal year 2012, we declared and paid cash dividends of $0.30 per share, with dividends of $0.075 declared in each quarter.
On October 26, 2011, our Board of Directors authorized the repurchase of up to $200 million of our common stock (the “Buyback Program”). The Buyback Program allowed us to purchase shares of our common stock in accordance with applicable securities laws on the open market, or through privately negotiated transactions. We entered into an agreement with an external broker that provided the structure under which the program was facilitated, which expired on October 25, 2012. The Buyback Program was set to expire on October 26, 2012, but on October 23, 2012 our Board of Directors approved an extension of the Buyback Program through October 25, 2013. On June 19, 2013 we entered into a new agreement with an external broker which expired on October 25, 2013 (the “10b5-1 Plan”). On June 26, 2013, our Board of Directors authorized the repurchase of up to an additional $200 million of our common stock (the “New Buyback Program”) which expired on June 26, 2014. On August 26, 2013 we amended the 10b5-1 Plan to incorporate both board authorizations up until each of their respective expiration dates (the “Amended 10b5-1 Plan”). The Amended 10b5-1 Plan expired on June 25, 2014. During the fiscal year ended June 30, 2014, we repurchased 1,327,693 shares at a cost of $90.8 million for a total cumulative buyback of 4,719,968 shares at a cost of $220.1 million under the Buyback Program and the New Buyback Program.
The Buyback Program and the New Buyback Program have expired and therefore no additional shares may be repurchased under such programs. We will determine the timing and the amount of any future buyback programs based on an evaluation of market conditions, share price and other factors.
For a description of limitations on repurchases of shares and on the payment of dividends, see “Management’s Discussion and Analysis of Financial Condition and Results of Operations” located in Item 7 of Part II of this report.
28
Table of Contents
| Item 6. | Selected Financial Data |
The following table presents selected historical financial data derived from the audited Consolidated Financial Statements for each of the five fiscal years presented. The information should be read in conjunction with “Management’s Discussion and Analysis of Financial Condition and Results of Operations” located in Item 7 of Part II of this report, and the audited Consolidated Financial Statements and the Notes to the Consolidated Financial Statements located in Item 8 of Part II of this report.
| (In thousands except per share data) |
2014(1) (2) | 2013(1) (2) | 2012(1) (2) (3) | 2011(1) (2) | 2010(1) (2) (4) | |||||||||||||||
| Net sales |
$ | 5,348,483 | $ | 4,297,842 | $ | 4,364,078 | $ | 3,772,345 | $ | 3,364,428 | ||||||||||
| Operating income |
$ | 329,727 | $ | 201,251 | $ | 300,246 | $ | 190,051 | $ | 85,555 | ||||||||||
| Net income from continuing operations attributable to Harman International Industries, Incorporated |
$ | 234,579 | $ | 142,407 | $ | 329,541 | $ | 135,916 | $ | 35,178 | ||||||||||
| Income from discontinued operations, net of income taxes |
$ | 0 | $ | 0 | $ | 0 | $ | 0 | $ | 123,591 | ||||||||||
| Net income |
$ | 234,579 | $ | 142,407 | $ | 329,541 | $ | 135,916 | $ | 164,058 | ||||||||||
| Net income attributable to Harman International Industries, Incorporated |
$ | 234,692 | $ | 142,407 | $ | 329,541 | $ | 135,916 | $ | 158,769 | ||||||||||
| Earnings per share from continuing operations attributable to Harman International Industries, Incorporated: |
||||||||||||||||||||
| Basic |
$ | 3.40 | $ | 2.06 | $ | 4.62 | $ | 1.91 | $ | 0.50 | ||||||||||
| Diluted |
$ | 3.36 | $ | 2.04 | $ | 4.57 | $ | 1.90 | $ | 0.50 | ||||||||||
| Earnings per share from discontinued operations: |
||||||||||||||||||||
| Basic |
$ | 0.00 | $ | 0.00 | $ | 0.00 | $ | 0.00 | $ | 1.76 | ||||||||||
| Diluted |
$ | 0.00 | $ | 0.00 | $ | 0.00 | $ | 0.00 | $ | 1.75 | ||||||||||
| Earnings per share: |
||||||||||||||||||||
| Basic |
$ | 3.40 | $ | 2.06 | $ | 4.62 | $ | 1.91 | $ | 2.26 | ||||||||||
| Diluted |
$ | 3.36 | $ | 2.04 | $ | 4.57 | $ | 1.90 | $ | 2.25 | ||||||||||
| Weighted average shares outstanding: |
||||||||||||||||||||
| Basic |
69,073 | 68,990 | 71,297 | 70,992 | 70,350 | |||||||||||||||
| Diluted |
69,889 | 69,736 | 72,083 | 71,635 | 70,595 | |||||||||||||||
| Total assets |
$ | 4,125,590 | $ | 3,235,685 | $ | 3,169,464 | $ | 3,058,495 | $ | 2,556,215 | ||||||||||
| Total debt |
$ | 555,768 | $ | 289,973 | $ | 395,688 | $ | 381,014 | $ | 377,837 | ||||||||||
| Total equity |
$ | 1,793,021 | $ | 1,644,871 | $ | 1,529,611 | $ | 1,423,658 | $ | 1,134,892 | ||||||||||
| Dividends per share |
$ | 1.20 | $ | 0.60 | $ | 0.30 | $ | 0.05 | $ | 0.00 | ||||||||||
| (1) | The results of operations for all acquired companies are included in our Consolidated Statements of Income starting from the date of the respective acquisition. Refer to Note 2—Acquisitions in the Notes to the Consolidated Financial Statements for more information on acquisitions in fiscal years 2014, 2013 and 2012. On February 10, 2011, we acquired all of the issued and outstanding shares of 3dB Research Limited (“3dB”) and on September 13, 2010, we acquired Aha Mobile, Inc. (“Aha”). On June 1, 2010, we acquired Eletrônica Selenium S/A (now known as Harman do Brasil Indústria Eletrônica e Participações Ltda.) (“Selenium”). |
| (2) | Includes restructuring expenses of $84.2 million, $83.1 million, $9.1 million $20.6 million and $17.9 million in fiscal years 2014, 2013, 2012, 2011 and 2010, respectively. |
| (3) | Net income includes a non-cash benefit of $124.2 million related to a reduction of our deferred tax valuation allowance on certain of our net U.S. deferred tax assets. |
| (4) | Net income includes a goodwill impairment charge of $12.3 million. |
29
Table of Contents
| Item 7. | Management’s Discussion and Analysis of Financial Condition and Results of Operations |
The following discussion should be read in conjunction with the information presented in other sections of this Annual Report on Form 10-K, including “Item 1. Business,” “Item 6. Selected Financial Data,” and “Item 8. Financial Statements and Supplementary Data.” This discussion contains forward-looking statements which are based on our current expectations and experience and our perception of historical trends, current market conditions, including customer acceptance of our new products, current economic data, expected future developments, including foreign currency exchange rates, and other factors that we believe are appropriate under the circumstances. These statements involve risks and uncertainties that could cause actual results to differ materially from those suggested in the forward-looking statements. See “Risk Factors” included in Item 1A of Part I of this report. Unless otherwise indicated, “Harman,” “Company,” “we,” “our,” and “us” are used interchangeably to refer to Harman International Industries, Incorporated and its consolidated subsidiaries. All amounts are in thousands unless otherwise indicated.
Executive Overview
We believe we are a worldwide leader in the development, manufacture and marketing of high quality, high-fidelity audio products, lighting solutions and electronic systems, as well as digitally integrated audio and infotainment systems for the automotive industry. We have developed a broad range of product offerings which we sell in our principal markets under our renowned brand names, including Aha®, AKG®, AMX®, Becker®, BSS®, Crown®, dbx®, DigiTech®, Harman/Kardon®, Infinity®, JBL®, JBL Professional, Lexicon®, Logic 7®, Mark Levinson®, Martin®, Revel®, Selenium®, Soundcraft®, Studer® and yurbuds® Powered by JBL. We have built these brands by developing our engineering, manufacturing and marketing competencies, and have employed these resources to establish our Company as a leader in the markets we serve.
We report our business on the basis of four segments. Our Infotainment, Lifestyle and Professional segments are based on our strategic approach to the markets and customers we serve. Our fourth segment, Other, primarily includes compensation, benefit and occupancy costs for corporate employees, net of allocations and expenses associated with new technology innovation and our corporate brand identity campaign.
We believe that innovation is an important element to gaining market acceptance of our products and strengthening our market position. We have a history of leveraging our continuous technological innovation across all of the markets we serve. We have a well-deserved reputation for delivering premium audio and infotainment solutions across a full spectrum of applications. We believe that our technological innovation, the quality of our products and our reputation for on-time delivery have resulted in Harman being awarded a substantial amount of Infotainment and Lifestyle business. As of June 30, 2014, we have a cumulative estimated $20.5 billion of future awarded Infotainment and Lifestyle automotive business, which represents the estimated future lifetime net sales for all customers. This amount does not represent firm customer orders. We report our awarded business primarily based on award letters from our customers. To validate these awards, we use various assumptions, which we update annually, including global vehicle production forecasts, customer take rates for our products, revisions to product life cycle estimates and the impact of annual price reductions and exchange rates, among other factors. These assumptions are updated and reported externally on an annual basis. We update our estimated awarded business quarterly by adding the value of new awards received and subtracting sales recorded during the quarter. These quarterly updates do not include any assumptions for increased take rates, revisions to product life cycle, or any other factors. We believe our currently awarded automotive business will position us well for follow-on and new business with these existing customers.
Our management uses the amount of our future awarded business for short- and long-term budgeting and forecasting, development of earnings guidance and for planning future corporate investment and other activities, such as capital expenditures and restructuring. Our future awarded business is also an input used to approximate our enterprise value. We believe our investors utilize this information for a number of reasons, including evaluating our future financial performance over time, to model our financial results of operations, to understand
30
Table of Contents
the risks inherent in our current operating plan, and as an input to approximate our enterprise value. However, our estimates of future awarded automotive business are forward-looking statements and may not actually be achieved. See the risk factor “We may not realize sales represented by awarded business” in Item 1A “Risk Factors” of Part I of this report.
Our products are sold worldwide, with the largest markets located in the United States and Germany. In the United States, our primary manufacturing facilities are located in Kentucky, Indiana and Washington. Outside of the United States, we have manufacturing facilities in Austria, Brazil, China, Denmark, Hungary, France, Germany, Mexico, the Netherlands and the United Kingdom.
Our sales and earnings may vary due to the production schedules and model year changeovers of our automotive customers, the holiday buying season for home audio products, customer acceptance of our products, the timing of new product introductions, product offerings by our competitors, fluctuations in the timing of contractual agreements for customer reimbursements for research, development and engineering expenses (“RD&E”) and general economic conditions. Since most of our businesses operate using local currencies, our reported sales and earnings may also fluctuate due to fluctuations in foreign currency exchange rates, especially with respect to the value of the Euro and the U.S. Dollar.
We believe significant opportunities exist to grow our business in all three of our business segments in emerging markets such as Brazil, Russia, India and China (“BRIC”). During the fiscal year ended June 30, 2014, sales increased in these emerging markets to $721.8 million, an increase of $172.1 million, or 31.3 percent, over the prior fiscal year.
We continue to roll out our global marketing campaign featuring some of the world’s most prominent artists and celebrities such as Maroon 5, Linkin Park, Mariano Rivera and Tim McGraw, in order to increase brand awareness and support growth and market share gains across our entire business.
Critical Accounting Policies
The methods, estimates and judgments we use in applying our accounting policies, in conformity with generally accepted accounting principles in the United States (“GAAP”), have a significant impact on the results we report in our consolidated financial statements. We base our estimates on historical experience and on various other assumptions that we believe to be reasonable under the circumstances. The estimates affect the carrying values of assets and liabilities. Actual results may differ from these estimates under different assumptions or conditions. Our accounting policies are more fully described in Note 1 – Summary of Significant Accounting Policies in the Notes to the Consolidated Financial Statements located in Item 8 of Part II of this report. However, we believe the following policies merit discussion due to their higher degree of judgment, estimation, or complexity.
Revenue Recognition
Revenue is generally recognized at the time of product shipment or delivery, depending on when the passage of title to goods transfers to unaffiliated customers and when all of the following have occurred: a firm sales agreement is in place, pricing is fixed or determinable and collection is reasonably assured. Sales are reported net of estimated returns, discounts, rebates and incentives. Substantially all of our revenue transactions involve the delivery of a physical product. Royalty income, which is not material, is recorded when earned based upon contract terms with licensees which provide for royalties.
We enter into incentive agreements with certain automotive customers which relate to a specific program award. These incentives are generally based on fixed payments paid by us to the automotive manufacturer, and are generally deferred, if certain criteria are met. The deferability criteria include the existence of legally enforceable rights, management’s ability and intent to enforce the recoverability clauses and the ability to
31
Table of Contents
generate future earnings from the agreement in excess of the deferred amounts. Capitalized amounts are amortized, generally as a reduction to revenue, over the related program award term based on our estimate of future volumes. Our estimates are reviewed regularly and the cumulative impact of a revision in estimates is recorded in the period such revisions become probable and estimable.
Allowance for Doubtful Accounts
Our products are sold to customers in many different markets and geographic locations. Methodologies for estimating bad debt reserves include specific reserves for known collectability issues and percentages applied to aged receivables based on historical experience. We must make judgments and estimates regarding accounts receivable that may become uncollectible. These estimates affect our bad debt reserve and results of operations. We base these estimates on many factors including historical collection rates, the financial stability and size of our customers as well as the markets they serve and our analysis of aged accounts receivable. Our judgments and estimates regarding collectability of accounts receivable have an impact on our consolidated financial statements.
Inventories
Inventories are stated at the lower of cost or market. Cost is determined principally by the first-in, first-out method. We establish reserves for our inventory which require us to analyze the aging and forecasted demand for our inventories, to forecast future product sales prices, pricing trends and margins, and to make judgments and estimates regarding obsolete, damaged or excess inventory. Markdown percentages are determined based on our estimate of future demand and selling prices for our products. Future sales prices are determined based on current and forecasted market expectations, as well as terms that have been established for future orders under automotive platform arrangements. Our inventory reserves primarily relate to our raw materials and finished goods. We calculate inventory reserves on raw materials by reviewing the levels of raw materials on-hand and comparing this to estimates of historical consumption and future demand in order to assess whether we have excess materials on-hand. If it is determined that excess materials are in inventory, an appropriate inventory reserve is established. Inventory reserves on finished goods are primarily determined through inventory turnover measures. Products showing low turnover rates are assigned a percentage reserve based on future estimates of sales volumes and margins. We make adjustments to our inventory reserves based on the identification of specific situations and increase our inventory reserves accordingly. As changes in future economic or industry conditions occur, we revise the estimates that were used to calculate our inventory reserves.
If actual conditions are less favorable than those we have projected, we may need to increase our reserves for excess and obsolete inventories. Any increases in our reserves will adversely impact our results of operations. Such reserves are not reduced until the product is sold.
At June 30, 2014 and 2013 our inventory reserves were $87.7 million and $65.5 million, respectively. The primary reason for the increase in our inventory reserves is due to our acquisitions of Martin Professional A/S (“Martin”), AMX LLC and AMX Holding Corporation (collectively “AMX”) and Verto Medical Solutions, LLC, d/b/a yurbuds and its wholly-owned subsidiary (“yurbuds”) and foreign currency translation. Refer to Note 4—Inventories in the Notes to the Consolidated Financial Statements for more information.
Goodwill
We assess goodwill for potential impairments annually each April 30th, or during the year if an event or other circumstance indicates that we may not be able to recover the carrying amount of the asset. Application of the goodwill impairment test requires judgment, including the identification of reporting units, assignment of assets and liabilities to reporting units, assignment of goodwill to reporting units, and determination of the fair value of each reporting unit. We estimate the fair value of each reporting unit using a discounted cash flow methodology. This requires us to use significant judgment, including estimation of future cash flows, which is dependent on internal forecasts, estimation of the long-term rate of growth for our business, the useful life over which cash flows will occur, determination of our weighted average cost of capital, and relevant market data.
32
Table of Contents
In evaluating goodwill for impairment, we may first assess qualitative factors to determine whether it is more likely than not (that is, a likelihood of more than 50 percent) that the fair value of a reporting unit is less than its carrying amount. If we conclude that it is not more likely than not that the fair value of a reporting unit is less than its carrying value, then no further testing of the goodwill assigned to the reporting unit is required. However, if we conclude that it is more likely than not that the fair value of a reporting unit is less than its carrying value, then we perform a two-step goodwill impairment test to identify potential goodwill impairment and measure the amount of goodwill impairment to be recognized, if any. In fiscal years 2014 and 2013, we did not elect to first assess the qualitative factors in evaluating our goodwill for impairment; therefore, we proceeded with our quantitative goodwill impairment test.
The first step compares the fair value of each reporting unit to its carrying value, with fair value of each reporting unit determined using established valuation techniques, specifically the market and income approaches. If the results of the first step indicate that the fair value of a reporting unit is less than its carrying value, the second step of this test is conducted wherein the amount of any impairment is determined by comparing the implied fair value of goodwill in a reporting unit to the recorded amount of goodwill for that reporting unit. The implied fair value of goodwill is calculated as the excess of fair value of the reporting unit over the amounts assigned to its assets and liabilities. Should the fair values of the goodwill so calculated be less than the carrying value, an impairment is recognized. We did not record any impairment charges for goodwill in fiscal years 2014, 2013 and 2012.
Other Intangible Assets
Other intangible assets primarily consist of customer relationships, tradenames, non-compete agreements, technology, patents and software and are amortized over periods ranging from less than one year to 17 years and are included in Other assets in our Consolidated Financial Statements. Other intangible assets are amortized on a straight-line basis over their estimated economic lives. We believe that the straight-line method of amortization reflects an appropriate allocation of the cost of the intangible assets to earnings in proportion to the amount of economic benefits obtained annually by our Company. We also have indefinite-lived intangible assets of $80.1 million, primarily consisting of tradenames, which we assess for potential impairments annually, or during the year if an event or other circumstance indicates that we may not be able to recover the carrying amount of the asset. We did not record any impairment charges for other intangible assets in fiscal years 2014, 2013 and 2012. Refer to Note 8—Goodwill and Intangible Assets, Net in the Notes to the Consolidated Financial Statements for more information.
Impairment of Long-Lived Assets
We review the recoverability of our long-lived assets, including buildings, equipment and other definite-lived intangible assets, when events or changes in circumstances occur that indicate that the carrying value of the asset may not be recoverable. The assessment of possible impairment is based on our ability to recover the carrying value of the asset from the expected future cash flows (undiscounted and without interest charges) of the related operations. If these cash flows are less than the carrying value of such asset, an impairment loss is recognized for the difference between estimated fair value and carrying value. Our primary measure of fair value is based on discounted cash flows. We will continue to monitor the need for impairment tests, which could result in additional impairment charges. We recognized $0.7 million, $0.7 million and $0.6 million in impairment charges related to facilities that were held-for-sale in the fiscal years ended June 30, 2014, 2013 and 2012 respectively.
Pre-Production and Development Costs
We incur pre-production and development costs related to infotainment systems that we develop for automobile manufacturers pursuant to long-term supply arrangements. Portions of these costs are reimbursable under separate agreements and are recorded as unbilled costs in our Consolidated Balance Sheets in Other current
33
Table of Contents
assets and Other assets, once an agreement is signed. We believe that the terms of our supply contracts and our established relationships with these automobile manufacturers reasonably assure that we will collect the reimbursable portions of these contracts.
Accrued Warranties
We warrant our products to be free from defects in materials and workmanship for periods ranging from six months to six years from the date of purchase, depending on the business segment and product. Our dealers and warranty service providers normally perform warranty service in field locations and regional service centers, using parts and replacement finished goods we supply on an exchange basis. Our dealers and warranty service providers also install updates we provide to correct defects covered by our warranties. Estimated warranty liabilities are based upon past experience with similar types of products, the technological complexity of certain products, replacement cost and other factors. If estimates of warranty provisions are no longer adequate based on our analysis of current activity, incremental provisions are recorded as warranty expense in our Consolidated Statement of Income. We take these factors into consideration when assessing the adequacy of our warranty provision for periods still open to claim. Refer to Note 6—Accrued Warranties in the Notes to the Consolidated Financial Statements for more information.
Income Taxes and Tax Valuation Allowances
We record the estimated future tax effects of temporary differences between the tax basis of assets and liabilities and amounts reported in our Consolidated Balance Sheets, as well as operating loss and tax credit carryforwards. We evaluate all available positive and negative evidence in each tax jurisdiction regarding the recoverability of any asset recorded in our Consolidated Balance Sheets and provide valuation allowances to reduce our deferred tax assets to an amount we believe is more likely than not to be realized. We regularly review our deferred tax assets for recoverability considering historical profitability, our ability to project future taxable income, the expected timing of the reversals of existing temporary differences and tax planning strategies. If we continue to operate at a loss in certain jurisdictions or are unable to generate sufficient future taxable income within the defined lives of such assets, we could be required to increase our valuation allowance against all or a significant portion of our deferred tax assets. This increase in valuation allowance could result in substantial increases in our effective tax rate and could have a material adverse impact on our operating results. Conversely, if and when our operations in some jurisdictions become sufficiently profitable before what we have estimated in our current forecasts, we would be required to reduce all or a portion of our current valuation allowance and such reversal would result in an increase in our earnings in such period. Adjustments to our valuation allowance, through charges to income tax (benefit) expense, were $(1.3) million, $2.9 million and $(124.2) million for the fiscal years ending June 30, 2014, 2013 and 2012, respectively. Refer to Note 13—Income Taxes in the Notes to the Consolidated Financial Statements for more information.
The calculation of our tax liabilities involves evaluating uncertainties in the application of complex tax regulations. We recognize liabilities for unrecognized tax positions in the U.S. and other tax jurisdictions based on our estimate of whether and the extent to which additional taxes will be due. If payment of these amounts ultimately proves to be unnecessary, the reversal of the liabilities would result in additional tax benefits recognized in the period in which we determine the liabilities are no longer necessary. If our estimate of tax liabilities proves to be less than the ultimate assessment, a further charge to expense would result. We recognize interest and penalties related to income tax matters in income tax expense.
Severance and Exit Costs
We recognize liabilities for severance and exit costs based upon the nature of the liability incurred. For involuntary separation programs that are conducted according to the guidelines of our written involuntary separation plan or according to the provisions of collective bargaining agreements or statutes, we recognize the liability when it is probable and reasonably estimable. For one-time termination benefits, such as additional
34
Table of Contents
severance pay, and other exit costs, such as lease and other contract termination costs, the liability is measured and originally recognized at fair value in the period in which the liability is incurred, with subsequent changes recognized in earnings in the period of change. Refer to Note 16—Restructuring in the Notes to the Consolidated Financial Statements for more information.
Share-Based Compensation
Share-based compensation expense is recognized based on the estimated fair value of stock options and similar equity instruments awarded to employees. Refer to Note 14—Shareholders’ Equity and Share-Based Compensation in the Notes to the Consolidated Financial Statements for more information.
Results of Operations
Net Sales
Fiscal year 2014 net sales were $5.348 billion compared to $4.298 billion, an increase of 24.4 percent or an increase of 22.0 percent excluding foreign currency translation. Net sales increased in all of our segments. The increase was primarily due to new scalable infotainment business, the acquisition of Martin, higher automotive production volumes and take rates, a large order from a mobile telecommunications customer, accelerated sales of new products launched earlier in the year in the home and multimedia business, improved economic conditions in Europe and favorable foreign currency translation of $84.5 million. Refer to Note 2—Acquisitions in the Notes to the Consolidated Financial Statements for more information on the acquisition of Martin.
Fiscal year 2013 net sales were $4.298 billion compared to $4.364 billion, a decrease of 1.5 percent or an increase of 0.6 percent excluding foreign currency translation. Net sales decreased in our Infotainment segment and increased in our Lifestyle and Professional segments. The decrease in our Infotainment segment was primarily due to the recession in Europe which significantly impacted automotive production. In addition, prior year sales were exceptionally robust due to the inability of a competitor to supply its customers as a result of the Japanese earthquake and tsunami in fiscal year 2011. The increase in our Lifestyle segment was due to sales growth in home and multimedia products, partially offset by lower automotive audio sales due to the recession in Europe and lower surcharges to certain automotive audio customers to recover increased costs of rare earth minerals. The increase in our Professional segment was primarily due to the acquisition of Martin in February 2013, partially offset by the recession in Europe and delays in capital projects in the U.S. and China. Refer to Note 2—Acquisitions in the Notes to the Consolidated Financial Statements for more information on the acquisition of Martin. Foreign currency translation had an unfavorable impact of $92.8 million when compared to the prior fiscal year.
A summary of our net sales, by business segment, is presented below:
| Year Ended June 30, | ||||||||||||||||||||||||
| 2014 | Percentage | 2013 | Percentage | 2012 | Percentage | |||||||||||||||||||
| Infotainment |
$ | 2,838,904 | 53.1 | % | $ | 2,283,247 | 53.1 | % | $ | 2,401,562 | 55.0 | % | ||||||||||||
| Lifestyle |
1,656,094 | 31.0 | % | 1,338,355 | 31.1 | % | 1,330,798 | 30.5 | % | |||||||||||||||
| Professional |
853,144 | 15.9 | % | 672,805 | 15.7 | % | 630,731 | 14.5 | % | |||||||||||||||
| Other |
341 | 0.0 | % | 3,435 | 0.1 | % | 987 | 0.0 | % | |||||||||||||||
|
|
|
|
|
|
|
|||||||||||||||||||
| Total |
$ | 5,348,483 | 100.0 | % | $ | 4,297,842 | 100.0 | % | $ | 4,364,078 | 100.0 | % | ||||||||||||
|
|
|
|
|
|
|
|||||||||||||||||||
Infotainment—Infotainment net sales increased $555.7 million, or 24.3 percent, in fiscal year 2014 compared to the prior fiscal year, and increased 20.5 percent excluding foreign currency translation. The increase in net sales was driven by higher automotive production volumes, increases in new scalable infotainment systems and higher take rates, the expansion of recent production launches across car lines, improved economic conditions in Europe and favorable foreign currency translation of $73.6 million.
35
Table of Contents
Infotainment net sales decreased $118.3 million, or 4.9 percent, in fiscal year 2013 compared to the prior fiscal year, and decreased 2.5 percent excluding foreign currency translation. The decrease in net sales was primarily the result of lower European automotive production due to lower demand in Western Europe, including Germany, and unfavorable foreign currency translation of $60.2 million. In addition, prior year sales were exceptionally robust due to the inability of a competitor to supply its customers as a result of the Japanese earthquake and tsunami in fiscal year 2011.
Lifestyle—Lifestyle net sales increased $317.7 million, or 23.7 percent, in fiscal year 2014 compared to the prior fiscal year, and increased 22.4 percent excluding foreign currency translation. The increase in net sales was driven by accelerated sales of new products launched earlier in the year in the home and multimedia business, higher automotive audio sales as a result of higher automotive production volumes and increased take rates, a large order from a mobile telecommunications customer, improved economic conditions in Europe and favorable foreign currency translation of $14.5 million.
Lifestyle net sales increased $7.6 million, or 0.6 percent, in fiscal year 2013 compared to the prior fiscal year, and increased 2.5 percent excluding foreign currency translation. The increase in net sales was driven by sales growth in home and multimedia products, partially offset by lower car audio sales due to lower European automotive production as a result of lower demand in Western Europe, including Germany, lower surcharges to certain automotive audio customers to recover increased costs on rare earth minerals and unfavorable foreign currency translation of $24.9 million.
Professional—Professional net sales increased $180.3 million, or 26.8 percent, in fiscal year 2014 compared to the prior fiscal year, and increased 27.5 percent excluding foreign currency translation. The increase in net sales was driven by the Martin acquisition, increased demand for audio products, improved economic conditions in Europe, partially offset by unfavorable foreign currency translation of $3.5 million.
Professional net sales increased $42.1 million, or 6.7 percent, in fiscal year 2013 compared to the prior fiscal year, and increased 8.0 percent excluding foreign currency translation. The increase in net sales was primarily due to $55.9 million of sales from the acquisition of Martin in February 2013, partially offset by delays in capital projects in the U.S. and China, the recession in Europe and unfavorable foreign currency translation of $7.6 million.
Gross Profit
Gross profit as a percentage of net sales increased 1.5 percentage points to 27.2 percent in fiscal year 2014 compared to the prior fiscal year. Gross profit as a percentage of net sales increased in all of our segments. The increase in gross profit as a percentage of net sales in our Infotainment and Lifestyle segments was primarily due to improved leverage of fixed costs over a higher net sales base, lower costs due to productivity initiatives and footprint migration initiatives and an increased mix of scalable infotainment systems. The increase in gross profit as a percentage of net sales in our Lifestyle and Professional segments was due to a decrease in duties, fees and interest related to compliance with U.S. Customs and Border Protection regulations. Refer to Note 19—Commitments and Contingencies in the Notes to the Consolidated Financial Statements for more information. These increases in our Lifestyle segment were partially offset by unfavorable product mix due to a higher proportion of net sales coming from home and multimedia sales.
Gross profit as a percentage of net sales decreased 1.4 percentage points to 25.7 percent in fiscal year 2013 compared to the prior fiscal year. The decrease in overall gross profit as a percentage of net sales was primarily in our Infotainment segment, due to reduced leverage of fixed costs on lower sales and unfavorable product mix related to the higher margin competitive substitution business related to the Japanese earthquake and tsunami recognized in the prior year and in our Lifestyle and Professional segments due to an increase in duties, fees and interest related to compliance with U.S. Customs and Border Protection regulations, partially offset by improved mitigation of rare earth mineral cost impacts and productivity gains.
36
Table of Contents
A summary of our gross profit by business segment is presented below:
| Year Ended June 30, | ||||||||||||||||||||||||
| 2014 | Percentage of Net Sales |
2013 | Percentage of Net Sales |
2012 | Percentage of Net Sales |
|||||||||||||||||||
| Infotainment |
$ | 634,959 | 22.4 | % | $ | 481,960 | 21.1 | % | $ | 557,349 | 23.2 | % | ||||||||||||
| Lifestyle |
498,277 | 30.1 | % | 371,006 | 27.7 | % | 393,268 | 29.6 | % | |||||||||||||||
| Professional |
323,089 | 37.9 | % | 249,799 | 37.1 | % | 231,822 | 36.8 | % | |||||||||||||||
| Other |
342 | * | 1,355 | * | 1,707 | * | ||||||||||||||||||
|
|
|
|
|
|
|
|||||||||||||||||||
| Total |
$ | 1,456,667 | 27.2 | % | $ | 1,104,120 | 25.7 | % | $ | 1,184,146 | 27.1 | % | ||||||||||||
|
|
|
|
|
|
|
|||||||||||||||||||
| * | Not meaningful. |
Infotainment—Gross profit as a percentage of net sales increased 1.3 percentage points to 22.4 percent in fiscal year 2014 compared to the prior fiscal year. The increase in gross profit as a percentage of net sales was primarily due to improved leverage of fixed costs over a higher net sales base, lower costs due to productivity and footprint migration initiatives and an increased mix of scalable infotainment systems.
Gross profit as a percentage of net sales decreased 2.1 percentage points to 21.1 percent in fiscal year 2013 compared to the prior fiscal year. The decrease in gross profit as a percentage of net sales was primarily due to reduced leverage of fixed costs on lower sales, unfavorable product mix, such as the higher margin competitive substitution business recognized in the prior year, and higher warranty expense.
Lifestyle—Gross profit as a percentage of net sales increased 2.4 percentage points to 30.1 percent in fiscal year 2014 compared to the prior fiscal year. The increase in gross profit as a percentage of net sales was due to improved leverage of fixed costs over a higher net sales base, lower costs due to productivity and footprint migration initiatives and a decrease in duties, fees and interest related to compliance with U.S. Customs and Border Protection regulations, partially offset by unfavorable product mix due to a higher proportion of net sales coming from home and multimedia sales versus the higher margin automotive audio business.
Gross profit as a percentage of net sales decreased 1.9 percentage points to 27.7 percent in fiscal year 2013 compared to the prior fiscal year. The decrease in gross profit as a percentage of net sales was due to an increase in duties, fees and interest related to compliance with U.S. Customs and Border Protection regulations and product mix, partially offset by improved mitigation of rare earth mineral cost impacts.
Professional—Gross profit as a percentage of net sales increased 0.8 percentage points to 37.9 percent in fiscal year 2014 compared to the prior fiscal year. The increase in gross profit as a percentage of net sales was primarily due to favorable product mix, lower restructuring expenses, lower manufacturing expenses resulting from cost saving initiatives and a decrease in duties, fees and interest related to compliance with U.S. Customs and Border Protection regulations.
Gross profit as a percentage of net sales increased 0.3 percentage points to 37.1 percent in fiscal year 2013 compared to the prior fiscal year. The increase in gross profit as a percentage of net sales was primarily due to profitability of new product introductions, improved mitigation of rare earth neodymium magnet costs, a key component in speakers and productivity gains, partially offset by an increase in duties, fees and interest related to compliance with U.S. Customs and Border Protection regulations and higher restructuring expenses.
Selling, General and Administrative Expenses
Selling, general and administrative expenses (“SG&A”) were $1.127 billion in fiscal year 2014 compared to $902.9 million in the prior fiscal year, an increase of $224.1 million. As a percentage of net sales, SG&A
37
Table of Contents
increased 0.1 percentage points in fiscal year 2014 compared to the prior fiscal year. The increase in SG&A was primarily in support of increased net sales, a reduction of $22.1 million in contingent consideration in the prior year related to the acquisition of MWM Acoustics, LLC (“MWM”), higher marketing costs related to our brand-awareness campaign, higher amortization expense related to intangible assets acquired in recent acquisitions and unfavorable foreign currency translation of $15.5 million, partially offset by cost saving initiatives. RD&E increased $58.5 million to $343.8 million, or 6.4 percent of net sales in fiscal year 2014, compared to $285.3 million, or 6.6 percent of net sales in the prior fiscal year, primarily due to lower customer reimbursements, higher gross spending and unfavorable foreign currency translation of $7.5 million.
SG&A were $902.9 million in fiscal year 2013 compared to $883.9 million in the prior fiscal year, an increase of $19.0 million. As a percentage of net sales, SG&A increased 0.7 percentage points in fiscal year 2013 compared to the prior fiscal year. The increase in SG&A was primarily due to higher restructuring expenses of $69.4 million, higher expenses related to the acquisition of Martin and higher corporate marketing expenses, partially offset by lower RD&E, favorable foreign currency translation of $17.5 million and a $22.1 million reduction in our contingent consideration liability related to the acquisition of MWM. RD&E decreased $46.6 million to $285.3 million, or 6.6 percent of net sales in fiscal year 2013, compared to $331.9 million, or 7.6 percent of net sales in the prior fiscal year, primarily due to higher customer reimbursements and favorable foreign currency translation of $8.0 million, partially offset by higher gross spending.
We continued to incur costs relating to our restructuring programs, which were designed to address our global footprint, cost structure, technology portfolio, human resources and internal processes. We recorded restructuring charges in SG&A of $76.4 million, $75.2 million and $6.0 million in fiscal years 2014, 2013 and 2012, respectively. Restructuring is further described under the caption “Restructuring” later in this discussion.
A summary of our SG&A by business segment is presented below:
| Year Ended June 30, | ||||||||||||||||||||||||
| 2014 | Percentage of Net Sales |
2013 | Percentage of Net Sales |
2012 | Percentage of Net Sales |
|||||||||||||||||||
| Infotainment |
$ | 439,556 | 15.5 | % | $ | 391,161 | 17.1 | % | $ | 376,820 | 15.7 | % | ||||||||||||
| Lifestyle |
327,759 | 19.8 | % | 233,529 | 17.4 | % | 241,778 | 18.2 | % | |||||||||||||||
| Professional |
209,032 | 24.5 | % | 163,990 | 24.4 | % | 158,825 | 25.2 | % | |||||||||||||||
| Other |
150,593 | * | 114,189 | * | 106,477 | * | ||||||||||||||||||
|
|
|
|
|
|
|
|||||||||||||||||||
| Total |
$ | 1,126,940 | 21.1 | % | $ | 902,869 | 21.0 | % | $ | 883,900 | 20.3 | % | ||||||||||||
|
|
|
|
|
|
|
|||||||||||||||||||
| * | Not meaningful. |
Infotainment—SG&A increased $48.4 million to $439.6 million in fiscal year 2014 compared to the prior fiscal year. The increase in SG&A was primarily in support of increased net sales, higher RD&E, higher amortization expense and unfavorable foreign currency translation of $12.4 million. As a percentage of net sales, SG&A decreased 1.6 percentage points to 15.5 percent in fiscal year 2014 compared to the prior fiscal year. RD&E increased $43.2 million to $228.1 million, or 8.0 percent of net sales in fiscal year 2014, compared to $184.9 million, or 8.1 percent of net sales in the prior fiscal year, primarily due to higher gross spending, lower customer reimbursements, and unfavorable foreign currency translation of $6.0 million.
SG&A increased $14.4 million to $391.2 million in fiscal year 2013 compared to the prior fiscal year. The increase in SG&A was primarily due to an increase of $61.6 million of restructuring expenses and an overall increase in other general and administrative expenses, partially offset by lower RD&E and favorable foreign currency translation of $10.9 million. As a percentage of net sales, SG&A increased 1.4 percentage points to 17.1 percent in fiscal year 2013 compared to the prior fiscal year. RD&E decreased $46.1 million to $184.9 million, or 8.1 percent of net sales in fiscal year 2013, compared to $231.0 million, or 9.6 percent of net sales in the prior
38
Table of Contents
fiscal year, primarily due to higher customer reimbursements and favorable foreign currency translation of $7.0 million, partially offset by higher gross spending of $13.7 million.
Lifestyle—SG&A increased $94.2 million to $327.8 million in fiscal year 2014, compared to the prior fiscal year. The increase in SG&A was primarily in support of increased net sales, a reduction of $22.1 million in contingent consideration in the prior year related to the acquisition of MWM, higher marketing costs related to our brand-awareness campaign and unfavorable foreign currency translation of $2.8 million, partially offset by lower restructuring costs. As a percentage of net sales, SG&A increased 2.4 percentage points to 19.8 percent in fiscal year 2014 compared to the prior fiscal year. RD&E increased $5.7 million to $65.4 million, or 3.9 percent of net sales in fiscal year 2014 compared to $59.7 million, or 4.5 percent of net sales in the prior fiscal year, primarily due to higher gross spending to support new product introductions.
SG&A decreased $8.2 million to $233.5 million in fiscal year 2013, compared to the prior fiscal year, primarily due to a $22.1 million reduction in our contingent consideration liability related to the acquisition of MWM and favorable foreign currency translation of $4.7 million, partially offset by higher selling expenses, higher restructuring expenses of $16.0 million and the non-recurring $4.0 million Japanese earthquake and tsunami related business interruption insurance settlement received in the prior year. As a percentage of net sales, SG&A decreased 0.8 percentage points to 17.4 percent in fiscal year 2013 compared to the prior fiscal year. RD&E increased $0.3 million to $59.7 million, or 4.5 percent of net sales in fiscal year 2013 compared to $59.4 million, or 4.5 percent of net sales in the prior fiscal year.
Professional—SG&A increased $45.0 million to $209.0 million in fiscal year 2014, compared to the prior fiscal year. The increase in SG&A was primarily due to the inclusion of Martin in fiscal year 2014 and higher amortization expense related to intangible assets acquired in the Martin, Duran Audio BV (“Duran”) and AMX acquisitions. As a percentage of net sales, SG&A increased 0.1 percentage point to 27.5 percent in fiscal year 2014 compared to the prior fiscal year. RD&E increased $6.4 million to $38.0 million, or 4.5 percent of net sales in fiscal year 2014 compared to $31.6 million, or 4.7 percent of net sales in the prior fiscal year, primarily due to the inclusion of Martin and Duran and unfavorable foreign currency of $0.8 million.
SG&A increased $5.2 million to $164.0 million in fiscal year 2013, compared to the prior fiscal year, primarily due to higher expenses related to the acquisition of Martin of $18.2 million, partially offset by lower restructuring expenses of $8.4 million and favorable foreign currency translation of $1.8 million. As a percentage of net sales, SG&A decreased 0.8 percentage points to 24.4 percent in fiscal year 2013 compared to the prior fiscal year. RD&E decreased $0.8 million to $31.6 million, or 4.7 percent of net sales in fiscal year 2013 compared to $32.4 million, or 5.1 percent of net sales in the prior fiscal year, primarily due to productivity improvements.
Other—Other SG&A primarily includes compensation, benefit and occupancy costs for our corporate employees and expenses associated with new technology innovation and our corporate brand identity campaign. Other SG&A increased $36.4 million to $150.6 million in fiscal year 2014 compared to the prior fiscal year, primarily due to higher marketing expenses related to our global brand awareness campaign, increased stock compensation expense, higher RD&E and higher incentive expense for bonuses.
Other SG&A increased $7.7 million to $114.2 million in fiscal year 2013 compared to the prior fiscal year, primarily due to higher marketing expenses related to our global brand awareness campaign, partially offset by lower incentive expense for bonuses.
Restructuring
Our restructuring program that is designed to improve our global footprint, cost structure, technology portfolio, human resources and internal processes continues. During fiscal years 2014, 2013 and 2012, we continued to refine existing programs and launched significant new programs focused on achieving further
39
Table of Contents
productivity improvements to: (i) optimize certain research and development and supply chain functions; (ii) outsource certain manufacturing capabilities; (iii) divest or sublease facilities no longer needed to support current operations and (iv) relocate certain functions to best cost countries.
A summary and components of our restructuring initiatives are presented below and include accruals for new programs as well as revisions to estimates, both increases and decreases, to programs accrued in prior periods:
| Severance Related Costs |
Third Party Contractor Termination Costs |
Facility Closure and Other Related Costs(3) |
Asset Impairments(1) |
Total | ||||||||||||||||
| Liability, June 30, 2011 |
$ | 31,762 | $ | 0 | $ | 7,860 | $ | 0 | $ | 39,622 | ||||||||||
| Expense(2) |
(1,008 | ) | 315 | 7,146 | 2,696 | 9,149 | ||||||||||||||
| Accumulated depreciation offset |
0 | 0 | 0 | (2,696 | ) | (2,696 | ) | |||||||||||||
| Payments |
(8,434 | ) | (298 | ) | (4,169 | ) | 0 | (12,901 | ) | |||||||||||
| Foreign currency translation |
(2,382 | ) | 0 | 2 | 0 | (2,380 | ) | |||||||||||||
|
|
|
|
|
|
|
|
|
|
|
|||||||||||
| Liability, June 30, 2012 |
$ | 19,938 | $ | 17 | $ | 10,839 | $ | 0 | $ | 30,794 | ||||||||||
|
|
|
|
|
|
|
|
|
|
|
|||||||||||
| Expense(2) |
21,297 | 1,076 | 55,405 | 5,337 | 83,115 | |||||||||||||||
| Accumulated depreciation offset |
0 | 0 | 0 | (5,337 | ) | (5,337 | ) | |||||||||||||
| Payments |
(18,151 | ) | (72 | ) | (38,939 | ) | 0 | (57,162 | ) | |||||||||||
| Reclassified Liabilities(3) |
0 | 0 | 6,889 | 0 | 6,889 | |||||||||||||||
| Foreign currency translation |
479 | (7 | ) | (346 | ) | 0 | 126 | |||||||||||||
|
|
|
|
|
|
|
|
|
|
|
|||||||||||
| Liability, June 30, 2013 |
$ | 23,563 | $ | 1,014 | $ | 33,848 | $ | 0 | $ | 58,425 | ||||||||||
|
|
|
|
|
|
|
|
|
|
|
|||||||||||
| Expense(2) |
65,870 | 5,793 | 5,581 | 6,959 | 84,203 | |||||||||||||||
| Accumulated depreciation offset |
0 | 0 | 0 | (6,959 | ) | (6,959 | ) | |||||||||||||
| Payments |
(36,699 | ) | (6,856 | ) | (10,522 | ) | 0 | (54,077 | ) | |||||||||||
| Foreign currency translation |
1,423 | 49 | 1,355 | 0 | 2,827 | |||||||||||||||
|
|
|
|
|
|
|
|
|
|
|
|||||||||||
| Liability, June 30, 2014 |
$ | 54,157 | $ | 0 | $ | 30,262 | $ | 0 | $ | 84,419 | ||||||||||
|
|
|
|
|
|
|
|
|
|
|
|||||||||||
| (1) | Credits related to restructuring charges for accelerated depreciation and inventory provisions are recorded against the related assets in Property, plant & equipment, net or Inventories in our Consolidated Balance Sheets and do not impact the restructuring liability. |
| (2) | Restructuring expenses noted above are primarily in SG&A in our Consolidated Statements of Income. Asset impairments, which consist of accelerated depreciation and inventory provisions, are primarily in Cost of sales in our Consolidated Statements of Income. |
| (3) | Certain contractual indemnification payments resulting from the transfer of a manufacturing facility to a third party were recorded as restructuring expenses in fiscal year 2013 and are classified within Facility Closure and Other Related Costs. Certain pre-existing liabilities related to this transferred facility were offset and reduced the restructuring expenses recorded as part of this transaction. These offsets are shown as Reclassified liabilities as noted above. See Note 3—Transfer of Ownership of Manufacturing Facility for more information. |
Restructuring liabilities are recorded in Accrued liabilities and Other non-current liabilities in our Consolidated Balance Sheets.
40
Table of Contents
Restructuring expenses by reporting business segment are presented below:
| Year Ended June 30, | ||||||||||||
| 2014 | 2013 | 2012 | ||||||||||
| Infotainment |
$ | 47,147 | $ | 58,878 | $ | (1,458 | ) | |||||
| Lifestyle |
23,645 | 16,260 | 169 | |||||||||
| Professional |
6,335 | 2,640 | 8,459 | |||||||||
| Other |
117 | 0 | (717 | ) | ||||||||
|
|
|
|
|
|
|
|||||||
| Total |
77,244 | 77,778 | 6,453 | |||||||||
| Asset impairments |
6,959 | 5,337 | 2,696 | |||||||||
|
|
|
|
|
|
|
|||||||
| Total |
$ | 84,203 | $ | 83,115 | $ | 9,149 | ||||||
|
|
|
|
|
|
|
|||||||
Goodwill
In September 2011, we adopted Accounting Standards Update (“ASU”) 2011-08, under which an entity may first assess qualitative factors in determining whether it is “more likely than not” that the fair value of a reporting unit is less than its carrying amount as a basis for determining whether it is necessary to perform the two-step goodwill impairment test. Adoption of this guidance had no impact on our financial condition or results of operations as no events came to our attention indicating that the fair values of our reporting units might be less than their carrying values. In fiscal years 2014 and 2013, we did not elect to first assess the qualitative factors in evaluating our goodwill for impairment; therefore, we proceeded with our quantitative goodwill impairment test.
We test for impairment at the reporting unit level on an annual basis as of April 30th of every year and between annual tests if an event occurs or circumstances change that would more likely than not reduce the fair value of the reporting unit below its carrying value. Refer to Note 1—Summary of Significant Accounting Policies in the Notes to the Consolidated Financial Statements for more information on how we test goodwill for impairment. The annual goodwill impairment tests conducted as of April 30, 2014 and 2013 indicated that the fair value of each reporting unit was substantially in excess of its carrying value and, as such, no impairments were deemed to exist. Our accumulated amount of goodwill impairment recorded in prior fiscal years is $330.0 million.
Goodwill was $541.0 million at June 30, 2014 compared with $234.3 million at June 30, 2013. The increase in goodwill in the fiscal year ended June 30, 2014 versus the prior fiscal year was primarily related to goodwill associated with the following: $244.3 million in conjunction with the acquisition of AMX, $30.1 million in conjunction with the acquisition of yurbuds, $15.1 million in connection with the acquisition of Duran, $8.1 million with regard to innovative Systems GmbH (“IS”), $4.9 million in connection with the acquisition of Martin and $0.1 million in connection with the acquisition of iOnRoad Technologies Ltd. (“iOnRoad”).
Goodwill was $234.3 million at June 30, 2013 compared with $180.8 million at June 30, 2012. The increase in goodwill in the fiscal year ended June 30, 2013 versus the prior fiscal year was primarily related to goodwill associated with the following: $56.7 million in connection with the acquisition of Martin, $2.0 million in connection with the acquisition of iOnRoad and $0.6 million in connection with the acquisition of Interchain Solution Private Limited offset to a certain extent by foreign currency translation.
The contingent purchase price associated with the acquisition of IS is calculated pursuant to the terms of an agreement between the parties. Certain terms of the agreement are currently subject to a dispute between the parties and the matter has been submitted to arbitration. On November 5, 2013, the arbitration panel reached a partial judgment on some of the disputed matters covering the period from February 2009 through January 2012 awarding €16.3 million to the IS sellers. We contested the enforcement of the partial award. In July 2014, the partial award was upheld. During the fiscal year ended June 30, 2014, we recorded approximately $8.1 million of additional contingent purchase price to accrue for this partial award. Until such time as the other disputed matters are resolved, we cannot calculate the contingent purchase price related to these other disputed matters.
41
Table of Contents
The changes in the carrying amount of goodwill by business segment for the fiscal years ended June 30, 2014 and 2013 were as follows:
| Infotainment | Lifestyle | Professional | Total | |||||||||||||
| Balance, June 30, 2012 |
$ | 5,856 | $ | 109,945 | $ | 65,010 | $ | 180,811 | ||||||||
| Acquisitions and adjustments(1) |
2,618 | 12 | 56,650 | 59,280 | ||||||||||||
| Other adjustments(2) |
102 | (2,519 | ) | (3,332 | ) | (5,749 | ) | |||||||||
|
|
|
|
|
|
|
|
|
|||||||||
| Balance, June 30, 2013 |
$ | 8,576 | $ | 107,438 | $ | 118,328 | $ | 234,342 | ||||||||
| Acquisitions and adjustments(1) |
143 | 30,118 | 264,308 | 294,569 | ||||||||||||
| Contingent purchase price consideration associated with the acquisition of IS |
8,052 | 0 | 0 | 8,052 | ||||||||||||
| Other adjustments(2) |
309 | 394 | 3,286 | 3,989 | ||||||||||||
|
|
|
|
|
|
|
|
|
|||||||||
| Balance, June 30, 2014 |
$ | 17,080 | $ | 137,950 | $ | 385,922 | $ | 540,952 | ||||||||
|
|
|
|
|
|
|
|
|
|||||||||
| (1) | Refer to Note 2—Acquisitions in the Notes to the Consolidated Financial Statements for more information. |
| (2) | The other adjustments to goodwill primarily consist of foreign currency translation adjustments. |
Operating Income
Fiscal year 2014 operating income was $329.7 million, or 6.2 percent of net sales. This represents an increase of 1.5 percentage points compared to the prior fiscal year. The increase in operating income was primarily due to higher gross profit due to increased net sales in fiscal year 2014, partially offset by higher SG&A in support of increased net sales and the inclusion of Martin and Duran, a reduction of $22.1 million in contingent consideration in the prior year related to the acquisition of MWM and higher marketing costs related to our brand-awareness campaign.
Fiscal year 2013 operating income was $201.3 million, or 4.7 percent of net sales. This represents a decrease of 2.2 percentage points compared to the prior fiscal year. The decrease in operating income was primarily due to lower net sales and gross profit, higher restructuring charges of $74.0 million, and an increase in duties, fees and interest related to compliance with U.S. Customs and Border Protection partially offset by a $22.1 million reduction in our contingent consideration related to the acquisition of MWM compared to the prior fiscal year.
A summary of our operating income (loss) by business segment is presented below:
| Year Ended June 30, | ||||||||||||||||||||||||
| 2014 | Percentage of Net Sales |
2013 | Percentage of Net Sales |
2012 | Percentage of Net Sales |
|||||||||||||||||||
| Infotainment |
$ | 195,403 | 6.9 | % | $ | 90,799 | 4.0 | % | $ | 180,529 | 7.5 | % | ||||||||||||
| Lifestyle |
170,517 | 10.3 | % | 137,477 | 10.3 | % | 151,490 | 11.4 | % | |||||||||||||||
| Professional |
114,057 | 13.4 | % | 85,810 | 12.8 | % | 72,997 | 11.6 | % | |||||||||||||||
| Other |
(150,250 | ) | * | (112,835 | ) | * | (104,770 | ) | * | |||||||||||||||
|
|
|
|
|
|
|
|||||||||||||||||||
| Total |
$ | 329,727 | 6.2 | % | $ | 201,251 | 4.7 | % | $ | 300,246 | 6.9 | % | ||||||||||||
|
|
|
|
|
|
|
|||||||||||||||||||
| * | Not meaningful. |
Interest Expense, Net
Interest expense is reported net of interest income in our Consolidated Statements of Income. Interest expense, net was $8.0 million, $12.9 million and $20.1 million for the fiscal years ended June 30, 2014, 2013 and 2012, respectively. Gross interest expense was $10.1 million, $15.3 million and $27.0 million for the fiscal years
42
Table of Contents
ended June 30, 2014, 2013 and 2012, respectively. The non-cash portion of interest expense was $2.2 million, $8.5 million and $19.1 million for the fiscal years ended June 30, 2014, 2013 and 2012, respectively. The cash portion of gross interest expense was $7.9 million, $6.8 million and $7.9 million for the fiscal years ended June 30, 2014, 2013 and 2012, respectively. Interest income was $2.1 million, $2.4 million and $6.9 million for the fiscal years ended June 30, 2014, 2013 and 2012, respectively.
Non-cash interest expense for the fiscal year ended June 30, 2014 relates to the amortization of debt issuance costs on the Multi-Currency Credit Agreement entered into on October 10, 2012, (the “New Credit Agreement”). Non-cash interest expense for the fiscal year ended June 30, 2013 relates to the amortization of debt issuance costs on the New Credit Agreement, amortization of the debt discount and debt issuance costs on the $400.0 million of 1.25 percent convertible senior notes entered into on October 15, 2012 (the “Convertible Senior Notes”) and amortization of debt issuance costs on the Multi-Currency Credit Agreement, entered into on December 1, 2010, as amended on December 15, 2011 and July 2, 2012 (the “Credit Agreement”). Non-cash interest expense for the fiscal year ended June 30, 2012 relates to amortization of the debt discount and debt issuance costs on the Convertible Senior Notes and amortization of debt issuance costs on the Credit Agreement.
Cash interest expense in the fiscal year ended June 30, 2014 primarily relates to interest on the New Credit Agreement and our short-term borrowings. Cash interest expense in the fiscal year ended June 30, 2013 primarily relates to interest on the New Credit Agreement, the Convertible Senior Notes, the Credit Agreement and our short-term borrowings. Cash interest expense in the fiscal year ended June 30, 2012 primarily relates to interest on the Convertible Senior Notes, the Credit Agreement and our short-term borrowings.
Interest income primarily relates to interest earned on our cash and cash equivalents, short-term investment balances and the variances from year to year are due to fluctuations in those balances and changes in interest rates.
The decrease in interest expense, net in fiscal year 2014 compared with the prior fiscal year and in fiscal year 2013 compared with the prior fiscal year is primarily due to lower non-cash interest expense.
Foreign Exchange Losses, Net
Foreign currency exchange gains and losses resulting from the remeasurement of certain foreign currency denominated monetary assets and liabilities are included in Foreign exchange losses, net in our Consolidated Statements of Income. Effective July 1, 2011, we changed the functional currency of two of our foreign subsidiaries to the U.S. Dollar to reflect a change in the currency in which such subsidiaries primarily generate and expend cash. In addition, we recognized approximately $1.4 million as Foreign exchange losses, net in our Consolidated Statements of Income in fiscal year 2012, due to the revaluation of certain derivative instruments held at these subsidiaries because we did not meet the requisite documentation requirements to attain hedge accounting treatment. As of January 1, 2012, the documentation was amended to achieve hedge accounting treatment going forward. During the fiscal year ended June 30, 2014, we changed our election to now include forward points in our effectiveness assessment. Prior to this change, the changes in fair value for these contracts were calculated on a spot to spot rate basis and forward points were included in Foreign exchange losses, net in our Consolidated Statements of Income. Effective September 30, 2013, the changes in fair value for these contracts are calculated on a forward to forward rate basis. These changes in fair value are reported in Accumulated other comprehensive income and are reclassified to either Cost of sales or SG&A, depending on the nature of the underlying asset or liability that is being hedged, in our Consolidated Statements of Income, in the period or periods during which the underlying transaction occurs. Refer to Note 10—Derivatives in the Notes to the Consolidated Financial Statements for more information.
Miscellaneous, Net
We recorded miscellaneous expenses, net, of $8.4 million, $11.8 million and $5.8 million in fiscal years 2014, 2013 and 2012, respectively. Miscellaneous, net primarily consisted of bank charges and $2.1 million of
43
Table of Contents
interest expense related to a disputed claim in fiscal year 2014. Miscellaneous, net primarily consisted of a loss on available-for-sale securities and bank charges in fiscal year 2013. Miscellaneous, net primarily consisted of bank charges in fiscal year 2012. Bank charges were $6.2 million, $5.1 million and $5.7 million in fiscal years 2014, 2013 and 2012, respectively.
Income Taxes
Our fiscal year 2014, 2013 and 2012 effective tax rates were an expense of 23.6 percent and 18.2 percent and a benefit of 26.2 percent, respectively. The effective tax rate was lower than the U.S. Federal statutory rate of 35 percent due to income mix, U.S. federal income tax credits and rate differentials between the U.S. and foreign jurisdictions. In addition, the fiscal year 2012 tax benefit was primarily due to the reversal of a portion of the U.S. valuation allowance. Refer to Note 13 – Income Taxes in the Notes to the Consolidated Financial Statements for more information.
Liquidity and Capital Resources
We primarily finance our working capital requirements through cash generated by operations, borrowings under the New Credit Agreement and trade credit. Cash and cash equivalents were $581.3 million at June 30, 2014 compared to $454.3 million at June 30, 2013. During the fiscal year ended June 30, 2014, our cash and cash equivalents balance increased $127.0 million. The increase in cash was driven by cash provided by operating activities, largely driven by net income and $300.0 million of borrowings under our revolving credit facility (the “New Revolving Credit Facility”), partially offset by acquisitions of $423.0 million, net of cash received, capital expenditures, repurchases of common stock, dividends to shareholders, the funding of the irrevocable trust related to our Supplemental Executive Retirement Plan (“SERP”) and the repayment of $30.0 million of debt under our term loan facility. Refer to Note 17—Retirement Benefits in the Notes to the Consolidated Financial Statements for more information related to the SERP. We also used cash to make investments in our manufacturing facilities, fund product development and meet the working capital needs of our business segments.
We believe that our existing cash and cash equivalents of $581.3 million at June 30, 2014, together with our expected future operating cash flows, and our availability of $445.4 million under the New Credit Agreement, will be sufficient to cover our working capital needs, debt service, capital expenditures, including major investments related to manufacturing and research facilities in emerging markets, acquisitions, purchase commitments, restructuring projects and quarterly dividends for at least the next 12 months.
Our ability to maintain positive liquidity going forward depends on our ability to continue to generate cash from operations and maintain access to the financial markets, both of which are subject to general economic, financial, competitive, legislative, regulatory and other market factors beyond our control. We earn a significant amount of our operating income outside the U.S., the majority of which is deemed to be permanently reinvested in foreign jurisdictions. For at least the next 12 months, we have sufficient cash in the U.S., availability under our New Credit Agreement and forecasted domestic cash flow to sustain our operating activities and cash commitments for investing and financing activities, such as quarterly dividends and repayment of debt. In addition, we expect existing foreign cash and cash equivalents and cash flows from operations to continue to be sufficient to fund our foreign operating activities and cash commitments for investing activities, such as material capital expenditures, for at least the next 12 months. As of June 30, 2014, Cash and cash equivalents of $235.9 million, were held in the U.S. and Cash and cash equivalents of $345.4 million were held by us in foreign jurisdictions. As of June 30, 2013, Cash and cash equivalents and Short-term investments of $226.9 million and $10.0 million, respectively, were held by us in the U.S. and Cash and cash equivalents of $227.4 million were held by us in foreign jurisdictions. Below is a more detailed discussion of our cash flow activities during fiscal year 2014.
44
Table of Contents
Operating Activities
For the fiscal year ended June 30, 2014, our net cash provided by operating activities was $592.1 million, compared to $42.1 million in the prior fiscal year. The increase in operating cash flows compared to the prior fiscal year was primarily due to lower payments for accounts payable and accrued liabilities and higher net income. At June 30, 2014, working capital, excluding cash, short-term investments, and short-term debt, was $431.3 million, compared with $582.2 million at June 30, 2013. The decrease was primarily due to higher accounts payable and accrued liabilities, partially offset by higher accounts receivable and inventory balances.
Investing Activities
Net cash used in investing activities was $612.1 million for the fiscal year ended June 30, 2014, compared to $10.7 million used in investing activities in the prior fiscal year. The increase in net cash used in investing activities compared to the prior fiscal year was primarily due to more acquisitions, higher capital expenditures and the funding of the irrevocable trust, as well as higher net maturities of short-term investments in the prior year. Capital expenditures for the year ended June 30, 2014 were $157.1 million, in support of new Infotainment and Lifestyle awards, compared to $101.7 million in the prior fiscal year. We expect that capital expenditures as a percentage of sales in fiscal year 2015 will remain in line with fiscal year 2014 levels.
Financing Activities
Net cash provided by financing activities was $136.6 million in the fiscal year ended June 30, 2014, compared to $203.4 million used in financing activities in the prior fiscal year. The increase in cash provided by financing activities was primarily due to lower repayments of long-term debt, partially offset by higher repurchases of common stock and higher dividends to shareholders.
Our total debt, including short-term borrowings, at June 30, 2014 was $558.8 million, primarily comprised of outstanding borrowings under the New Credit Agreement of $555.0 million. Also included in total debt at June 30, 2014 is short-term debt and long-term borrowings of $3.8 million.
Our total debt, including short-term borrowings, at June 30, 2013 was $289.9 million, primarily comprised of outstanding borrowings under the New Credit Agreement of $285.0 million. Also included in total debt at June 30, 2013 is short-term debt and long-term borrowings of $5.0 million.
New Credit Agreement
On October 10, 2012, we and our wholly-owned subsidiary Harman Holding GmbH & Co. KG (“Harman KG”), entered into the New Credit Agreement with a group of banks. The New Credit Agreement provides for (i) a five-year unsecured multi-currency revolving credit facility (the “New Revolving Credit Facility”) in the amount of $750.0 million (the “Aggregate Revolving Commitment”) with availability in currencies other than the United States Dollar of up to $550.0 million and (ii) a five-year unsecured United States Dollar term loan facility (the “Term Facility” and collectively with the New Revolving Credit Facility, the “Facilities”) in the amount of $300.0 million (the “Aggregate Term Commitment” and collectively with the Aggregate Revolving Commitment, the “Aggregate Commitment”). Up to $60.0 million of the Aggregate Revolving Commitment is available for letters of credit. Subject to certain conditions set forth in the New Credit Agreement, the Aggregate Commitment may be increased by up to $250.0 million. We may select interest rates for the Facilities equal to (i) LIBOR plus an applicable margin or (ii) a base rate plus an applicable margin, which in each case is determined based on our credit rating. We pay a facility fee on the Aggregate Revolving Commitment, whether drawn or undrawn, which is determined based on our credit rating. Any proceeds from borrowings under the Facilities may be used for general corporate purposes.
The New Credit Agreement includes certain financial condition covenants, including covenants that do not permit us to allow (i) our ratio of consolidated EBITDA to consolidated cash interest expense to be less than
45
Table of Contents
3.5:1.0 or (ii) our ratio of consolidated total debt to consolidated EBITDA to exceed 3.5:1.0, or following certain acquisitions, 4.0:1.0, each calculated as of the end of the applicable fiscal quarter on a rolling four-quarter basis. The terms “consolidated EBITDA,” “consolidated cash interest expense,” and “consolidated total debt” are defined in the New Credit Agreement.
The New Credit Agreement also contains certain negative covenants that limit, among other things, our ability to pay dividends, permit certain of our subsidiaries to incur debt, incur liens, make fundamental changes, sell assets, undertake transactions with affiliates or undertake sale and leaseback transactions. The Facilities are subject to acceleration upon certain specified events of default, including failure to make timely payments, breaches of representations or covenants or a change of control, as such term is defined in the New Credit Agreement.
On October 10, 2012, in connection with the execution of the New Credit Agreement, we, Harman KG, and certain of our subsidiaries, entered into a guarantee agreement (the “New Guarantee Agreement”), that provides that the obligations under the New Credit Agreement are guaranteed by us and each of the subsidiary guarantors named therein.
Upon the signing of the New Credit Agreement, we voluntarily terminated the Credit Agreement, as well as the guarantee and collateral agreement entered into in connection with the Credit Agreement. There were no outstanding borrowings under the Credit Agreement as of October 10, 2012, and no early termination penalties were incurred by us as a result of the termination of the Credit Agreement. All of the approximately $8.7 million of letters of credit that were previously outstanding under the Credit Agreement were deemed to be issued and outstanding under the New Credit Agreement.
On October 10, 2012, we borrowed $300.0 million under the Term Facility to finance, in part, the repayment of all the outstanding $400.0 million principal amount of Convertible Senior Notes and accrued and unpaid interest thereon. See “Convertible Senior Notes” below for additional information. In June 2014, we borrowed $300.0 million under the New Revolving Credit Facility in order to finance the acquisition of AMX and yurbuds. Refer to Note 2—Acquisitions in the Notes to the Consolidated Financial Statements for more information.
At June 30, 2014, there was $300.0 million of outstanding borrowings and approximately $4.6 million of outstanding letters of credit under the New Revolving Credit Facility and $255.0 million of outstanding borrowings under the Term Facility, of which $35.6 million is included in our Consolidated Balance Sheet as Current portion of long-term debt and $219.4 million is classified as Long-term debt. At June 30, 2014, unused available credit under the New Revolving Credit Facility was $445.4 million. In connection with the New Credit Agreement, we incurred $6.1 million of fees and other expenses which are included within Other assets in our Consolidated Balance Sheet at June 30, 2014. These costs will be amortized over the term of the New Credit Agreement to Interest expense, net in our Consolidated Statements of Income on a straight-line basis. In addition, during the year ended June 30, 2013, we wrote off $1.1 million of debt issuance costs, to Interest expense, net, associated with the Credit Agreement, which represented the portion of these costs that were attributed to the Credit Agreement.
Convertible Senior Notes
On October 15, 2012, the maturity date for the $400.0 million of 1.25 percent convertible senior notes, due October 15, 2012, we repaid all of the outstanding $400.0 million principal amount of Convertible Senior Notes and accrued and unpaid interest thereon held by affiliates of Kohlberg Kravis Roberts & Co. and Goldman Sachs Capital Partners and other investors. The repayment of principal was funded by $300.0 million of borrowings under the Term Facility and $100.0 million of cash on hand.
46
Table of Contents
At June 30, 2014, long-term debt maturing in each of the next five fiscal years and thereafter is as follows:
| 2015 |
$ | 35,625 | ||
| 2016 |
43,157 | |||
| 2017 |
135,000 | |||
| 2018 |
341,250 | |||
| 2019 |
0 | |||
| Thereafter |
0 | |||
|
|
|
|||
| Total |
$ | 555,032 | ||
|
|
|
If we do not meet the forecast in our budgets, we could violate our debt covenants and, absent a waiver from our lenders or an amendment to the New Credit Agreement, we could be in default under the New Credit Agreement. As a result, our debt under the New Credit Agreement could become due, which would have a material adverse effect on our financial condition and results of operations. As of June 30, 2014, we were in compliance with all the financial covenants of the New Credit Agreement and we believe we will be in compliance for the next 12 months.
Credit Rating
On September 6, 2012, Standard & Poor’s Ratings Services (“S&P”) raised our corporate credit rating to the investment grade BBB–from BB+, citing improved margins and lower business risk. S&P also raised the issue rating on our senior unsecured notes to BB+ from BB. On October 11, 2012, Moody’s Investors Services raised our credit rating to Baa3 from Ba1, elevating us to investment-grade status, with the assignment of the Baa3 rating to the Facilities. We expect that the increase in our credit rating will enable us to continue to obtain credit in the future.
Dividends
On June 26, 2014, we announced that our annual cash dividend would increase by 10 percent in fiscal year 2015 to $1.32 per share. The dividends will be paid in quarterly increments of $0.33 per share, effective July 1, 2014. On August 7, 2014, we declared a cash dividend of $0.33 per share for the quarter ended June 30, 2014. The quarterly dividend will be paid on September 2, 2014 to each stockholder of record as of the close of business on August 18, 2014.
Off-Balance Sheet Arrangements
We utilize off-balance sheet arrangements in our operations when we enter into operating leases for land, buildings and equipment in the normal course of business, which are not included in our Consolidated Balance Sheets. In addition, we had outstanding letters of credit of $4.6 million and $6.8 million at June 30, 2014 and 2013, respectively, which were not included in our Consolidated Balance Sheets.
47
Table of Contents
Contractual Obligations
We have obligations and commitments to make future payments under various agreements and for uncertain tax positions. The following table details our obligations by due date:
| Year Ending June 30, | ||||||||||||||||||||||||||||
| 2015 | 2016 | 2017 | 2018 | 2019 | Thereafter | Total | ||||||||||||||||||||||
| Short term borrowings(1) |
$ | 3,736 | $ | 0 | $ | 0 | $ | 0 | $ | 0 | $ | 0 | $ | 3,736 | ||||||||||||||
| Long-term debt(1) |
35,625 | 43,157 | 135,000 | 341,250 | 0 | 0 | 555,032 | |||||||||||||||||||||
| Firm commitments for capital expenditures |
38,126 | 0 | 0 | 0 | 0 | 0 | 38,126 | |||||||||||||||||||||
| Purchase obligations(2) |
249,906 | 0 | 0 | 0 | 0 | 0 | 249,906 | |||||||||||||||||||||
| Non-cancelable operating leases(3) |
30,882 | 29,993 | 21,911 | 20,372 | 17,033 | 41,985 | 162,176 | |||||||||||||||||||||
| Pension obligations(4) |
9,902 | 9,676 | 10,052 | 10,327 | 9,388 | 54,378 | 103,723 | |||||||||||||||||||||
| Uncertain tax positions(5) |
44,209 | 0 | 0 | 0 | 0 | 0 | 44,209 | |||||||||||||||||||||
|
|
|
|
|
|
|
|
|
|
|
|
|
|
|
|||||||||||||||
| Total contractual cash obligations |
$ | 412,386 | $ | 82,826 | $ | 166,963 | $ | 371,949 | $ | 26,421 | $ | 96,363 | $ | 1,156,908 | ||||||||||||||
|
|
|
|
|
|
|
|
|
|
|
|
|
|
|
|||||||||||||||
| (1) | Refer to Note 9—Debt in the Notes to the Consolidated Financial Statements for more information and for interest payments associated with our short-term borrowings, current portion of long-term debt and long-term debt. |
| (2) | Includes amounts committed under enforceable agreements for purchase of goods and services with defined terms as to quantity, price and timing of delivery. |
| (3) | Refer to Note 12—Leases in the Notes to the Consolidated Financial Statements for more information. |
| (4) | Refer to Note 17—Retirement Benefits in the Notes to the Consolidated Financial Statements for more information. |
| (5) | Refer to Note 13—Income Taxes in the Notes to the Consolidated Financial Statements. All uncertain tax positions are included in fiscal year 2015 as timing of such payments cannot be estimated. |
Share Buyback Program
On October 26, 2011, our Board of Directors authorized the repurchase of up to $200 million of our common stock (the “Buyback Program”). The Buyback Program allowed us to purchase shares of our common stock in accordance with applicable securities laws on the open market, or through privately negotiated transactions. We entered into an agreement with an external broker that provided the structure under which the program was facilitated, which expired on October 25, 2012. The Buyback Program was set to expire on October 26, 2012, but on October 23, 2012 our Board of Directors approved an extension of the Buyback Program through October 25, 2013. On June 19, 2013 we entered into a new agreement with an external broker which expired on October 25, 2013 (the “10b5-1 Plan”). On June 26, 2013, our Board of Directors authorized the repurchase of up to an additional $200 million of our common stock (the “New Buyback Program”) which expired on June 26, 2014. On August 26, 2013 we amended the 10b5-1 Plan to incorporate both board authorizations up until each of their respective expiration dates (the “Amended 10b5-1 Plan”). The Amended 10b5-1 Plan expired on June 25, 2014. During the fiscal year ended June 30, 2014, we repurchased 1,327,693 shares at a cost of $90.8 million for a total cumulative buyback of 4,719,968 shares at a cost of $220.1 million under the Buyback Program and the New Buyback Program.
The Buyback Program and the New Buyback Program have expired and therefore no additional shares may be repurchased under such programs. We will determine the timing and the amount of any future buyback programs based on an evaluation of market conditions, share price and other factors.
48
Table of Contents
Equity
Total equity at June 30, 2014 was $1.793 billion compared with $1.645 billion at June 30, 2013. The increase is primarily due to higher net income, favorable foreign currency translation and stock option exercises, partially offset by repurchases of common stock, dividends to shareholders and unrealized losses on hedging. There were 1,327,693 shares of our common stock repurchased during the fiscal year ended June 30, 2014 at a total cost of $90.8 million.
Total equity at June 30, 2013 was $1.645 billion compared with $1.529 billion at June 30, 2012. The increase is primarily due to higher net income. There were 145,866 shares of our common stock repurchased during the fiscal year ended June 30, 2013 at a total cost of $5.4 million.
Business Outlook
Our future outlook is largely dependent upon changes in global economic conditions, which are showing signs of stabilization. We see signs of increased consumer discretionary spending, the lifting of delays in capital expenditure projects and increased automotive production rates, which we expect will result in improved demand for our products. We believe that these stabilized economic conditions will remain in place for at least the next four quarters. We remain committed to our investment plans in the areas of RD&E and marketing. We also remain committed to pursuing incremental productivity and restructuring programs, which are expected to provide an accelerated rate of earnings growth in future years. Capital expenditures as a percentage of sales are expected to remain in line with fiscal year 2014 levels.
Recently Issued Accounting Standards
Revenue Recognition: In May 2014, the Financial Accounting Standards Board (“FASB”) issued ASU No. 2014-09, “Revenue from Contracts with Customers (Topic 606),” which amends the guidance for revenue recognition to replace numerous, industry-specific requirements and converges areas under this topic with those of the International Financial Reporting Standards. The new guidance implements a five-step process for customer contract revenue recognition that focuses on transfer of control, as opposed to transfer of risk and rewards. The new guidance also requires enhanced disclosures regarding the nature, amount, timing and uncertainty of revenues and cash flows from contracts with customers. Other major provisions include the capitalization and amortization of certain contract costs, ensuring the time value of money is considered in the transaction price, and allowing estimates of variable consideration to be recognized before contingencies are resolved in certain circumstances. The new guidance is effective for fiscal years and interim periods within those years beginning after December 15, 2016. Early adoption is prohibited. We expect to adopt the provisions of this new guidance on July 1, 2017. Entities can transition to the standard either retrospectively or as a cumulative-effect adjustment as of the date of adoption. We are currently assessing the impact the adoption of the new provisions will have on our financial condition and results of operations.
Discontinued Operations: In April 2014, the FASB issued ASU 2014-08, “Reporting Discontinued Operations and Disclosures of Disposals of Components of an Entity,” which changes the criteria for determining which disposals can be presented as discontinued operations and modifies disclosure requirements. Under the new guidance, a discontinued operation is defined as a disposal of a component or group of components that is disposed of or is classified as held-for-sale and represents a strategic shift that has or will have a major effect on an entity’s operations and financial results. The standard states that a strategic shift could include a disposal of (i) a major geographical area of operations, (ii) a major line of business, (iii) a major equity method investment, or (iv) other major parts of an entity. The new guidance also requires several new disclosures. This new guidance is effective for fiscal years and interim periods within those years beginning after December 15, 2014. Early adoption is permitted. We expect to adopt the provisions of this new guidance on July 1, 2015. We do not expect the adoption of the new provisions to have a material impact on our financial condition or results of operations.
49
Table of Contents
Income Taxes: In July 2013, the FASB issued ASU 2013-11, “Presentation of an Unrecognized Tax Benefit When a Net Operating Loss Carryforward, a Similar Tax Loss, or a Tax Credit Carryforward Exists.” The new guidance requires that unrecognized tax benefits be presented on a net basis with the deferred tax assets for such carryforwards. This new guidance is effective for fiscal years and interim periods within those years beginning after December 15, 2013. We expect to adopt the provisions of this new guidance on July 1, 2014. We do not expect the adoption of the new provisions to have a material impact on our financial condition or results of operations.
| Item 7A. | Quantitative and Qualitative Disclosures About Market Risk |
We are required to include information about potential effects of changes in interest rates and currency exchange rates in our periodic reports filed with the United States Securities and Exchange Commission.
Interest Rate Sensitivity/Risk
At June 30, 2014, interest on approximately 99 percent of our borrowings was determined on a variable rate basis. The interest rates on the balance of our debt are subject to changes in U.S. and European short-term interest rates. To assess exposure to interest rate changes, we have performed a sensitivity analysis assuming a hypothetical 100 basis point increase or decrease in interest rates across all outstanding debt and investments. Our analysis indicates that the effect on fiscal year 2014 income before income taxes of such an increase and decrease in interest rates would be approximately $0.2 million.
Foreign Currency Risk
We maintain significant operations in Germany, Hungary, China, the Netherlands, Denmark, France, Brazil, the United Kingdom, Japan and Austria. As a result, we are subject to market risks arising from changes in these foreign currency exchange rates, principally the change in the value of the Euro versus the U.S. Dollar. Refer to Note 10—Derivatives in the Notes to the Consolidated Financial Statements for additional discussion on our financial risk management.
Our subsidiaries purchase products and raw materials and sell our products in various currencies. As a result, we may be exposed to cost changes relative to local currencies in these markets. To mitigate these transactional risks, we enter into foreign exchange contracts. Also, foreign currency positions are partially offsetting and are netted against one another to reduce exposure. We presently estimate the effect on projected fiscal year 2015 income before income taxes, based upon a recent estimate of foreign exchange transactional exposure, of a uniform strengthening or uniform weakening of the transaction currency rates of 10 percent, would be to increase or decrease income before income taxes by approximately $44.1 million. As of June 30, 2014, we had hedged a portion of our estimated foreign currency transactions using foreign exchange contracts, including forwards.
We presently estimate the effect on projected fiscal year 2015 income before income taxes, based upon a recent estimate of foreign exchange translation exposure (translating the operating performance of our foreign subsidiaries into U.S. Dollars), of a uniform strengthening or weakening of the U.S. Dollar by 10 percent, would be to increase or decrease income before income taxes by approximately $22.4 million.
Changes in currency exchange rates, principally the change in the value of the Euro compared to the U.S. dollar, have an impact on our reported results when the financial statements of foreign subsidiaries are translated into U.S. dollars. Over half our sales are denominated in Euros. The average exchange rate for the Euro versus the U.S. dollar for the fiscal year ended June 30, 2014 increased 4.9 percent from the prior fiscal year.
50
Table of Contents
Competitive conditions in the markets in which we operate may limit our ability to increase prices in the event of adverse changes in currency exchange rates. For example, certain products made in Europe are sold in the U.S. Sales of these products are affected by the value of the U.S. Dollar relative to the Euro. Any weakening of the U.S. Dollar could depress the demand for these European manufactured products in the U.S. and reduce sales. However, due to the multiple currencies involved in our business and the netting effect of various simultaneous transactions, our foreign currency positions are partially offsetting. In addition, our foreign currency hedging program is designed to limit our exposure.
Actual gains and losses in the future may differ materially from the hypothetical gains and losses discussed above based on changes in the timing and amount of interest rate and foreign currency exchange rate movements and our actual exposure and hedging transactions.
51
Table of Contents
| Item 8. | Financial Statements and Supplementary Data |
Management’s Report on Internal Control over Financial Reporting
The management of Harman International Industries, Incorporated is responsible for establishing and maintaining adequate internal control over financial reporting. Our internal control system was designed to provide reasonable assurance to our management and Board of Directors regarding the preparation and the fair presentation of published financial statements. All internal control systems, no matter how well designed, have inherent limitations. Therefore, even those systems determined to be effective can provide only reasonable assurance with respect to financial statement preparation and presentation.
We assessed the effectiveness of our internal control over financial reporting as of June 30, 2014. In making this assessment, we used the framework set forth by the Committee of Sponsoring Organizations of the Treadway Commission in “Internal Control—Integrated Framework of 1992.” Our assessment included an evaluation of such elements as the design and operating effectiveness of key financial reporting controls, process documentation, accounting policies, overall control environment and information systems control environment. As a result of the acquisitions in June 2014 of AMX LLC and AMX Holding Corporation and certain assets and liabilities of Verto Medical Solutions, LLC d/b/a yurbuds and its wholly-owned subsidiary (collectively the “Acquired Businesses”), we have begun to integrate certain business processes and systems of the Acquired Businesses. In reliance on interpretive guidance issued by the Securities and Exchange Commission’s staff, management has chosen to exclude from its assessment of the effectiveness of our internal control over financial reporting as of June 30, 2014, the Acquired Businesses internal control over financial reporting associated with total assets representing three percent of consolidated assets, and total revenues representing less than one percent of consolidated revenues, included in our consolidated financial statements as of and for the year ended June 30, 2014. Based on our assessment, we have concluded that, as of June 30, 2014, our internal control over financial reporting was effective.
The effectiveness of our internal control over financial reporting, as of June 30, 2014, has been audited by KPMG LLP (“KPMG”), an independent registered public accounting firm. KPMG’s report on our internal control over financial reporting is included herein.
| /S/ DINESH C. PALIWAL |
| Dinesh C. Paliwal Chairman, President and Chief Executive Officer |
| /S/ HERBERT K. PARKER |
| Herbert K. Parker Executive Vice President and Chief Financial Officer |
August 7, 2014
52
Table of Contents
Report of Independent Registered Public Accounting Firm
The Board of Directors and Shareholders
Harman International Industries, Incorporated:
We have audited Harman International Industries, Incorporated and subsidiaries’ (the “Company”) internal control over financial reporting as of June 30, 2014, based on criteria established in Internal Control—Integrated Framework (1992) issued by the Committee of Sponsoring Organizations of the Treadway Commission. Harman International Industries, Incorporated’s management is responsible for maintaining effective internal control over financial reporting and for its assessment of the effectiveness of internal control over financial reporting, included in the accompanying Management’s Report on Internal Control over Financial Reporting. Our responsibility is to express an opinion on the Company’s internal control over financial reporting based on our audit.
We conducted our audit in accordance with the standards of the Public Company Accounting Oversight Board (United States). Those standards require that we plan and perform the audit to obtain reasonable assurance about whether effective internal control over financial reporting was maintained in all material respects. Our audit included obtaining an understanding of internal control over financial reporting, assessing the risk that a material weakness exists, and testing and evaluating the design and operating effectiveness of internal control based on the assessed risk. Our audit also included performing such other procedures as we considered necessary in the circumstances. We believe that our audit provides a reasonable basis for our opinion.
A company’s internal control over financial reporting is a process designed to provide reasonable assurance regarding the reliability of financial reporting and the preparation of financial statements for external purposes in accordance with generally accepted accounting principles. A company’s internal control over financial reporting includes those policies and procedures that (1) pertain to the maintenance of records that, in reasonable detail, accurately and fairly reflect the transactions and dispositions of the assets of the company; (2) provide reasonable assurance that transactions are recorded as necessary to permit preparation of financial statements in accordance with generally accepted accounting principles, and that receipts and expenditures of the company are being made only in accordance with authorizations of management and directors of the company; and (3) provide reasonable assurance regarding prevention or timely detection of unauthorized acquisition, use, or disposition of the company’s assets that could have a material effect on the financial statements.
Because of its inherent limitations, internal control over financial reporting may not prevent or detect misstatements. Also, projections of any evaluation of effectiveness to future periods are subject to the risk that controls may become inadequate because of changes in conditions, or that the degree of compliance with the policies or procedures may deteriorate.
In our opinion, the Company maintained, in all material respects, effective internal control over financial reporting as of June 30, 2014, based on criteria established in Internal Control—Integrated Framework (1992) issued by the Committee of Sponsoring Organizations of the Treadway Commission.
The Company acquired AMX LLC and AMX Holding Corporation and certain assets and liabilities of Verto Medical Solutions, LLC d/b/a yurbuds and its wholly-owned subsidiary (collectively the “Acquired Businesses”) during the fiscal year ended June 30, 2014, and management excluded from its assessment of the effectiveness of the Company’s internal control over financial reporting as of June 30, 2014, the Acquired Businesses’ internal control over financial reporting associated with total assets representing three percent of consolidated assets, and total revenues representing less than one percent of consolidated revenues, included in the consolidated financial statements of the Company as of and for the year ended June 30, 2014. Our audit of internal control over financial reporting of the Company also excluded an evaluation of the internal control over financial reporting of the Acquired Businesses.
We also have audited, in accordance with the standards of the Public Company Accounting Oversight Board (United States), the consolidated balance sheets of Harman International Industries, Incorporated and subsidiaries as of June 30, 2014 and 2013, and the related consolidated statements of income, comprehensive income, shareholders’ equity and cash flows for each of the years in the three-year period ended June 30, 2014, and our report dated August 7, 2014 expressed an unqualified opinion on those consolidated financial statements.
| /s/ KPMG LLP |
| Stamford, Connecticut |
| August 7, 2014 |
53
Table of Contents
Report of Independent Registered Public Accounting Firm
The Board of Directors and Shareholders
Harman International Industries, Incorporated:
We have audited the accompanying consolidated balance sheets of Harman International Industries, Incorporated and subsidiaries (the “Company”) as of June 30, 2014 and 2013, and the related consolidated statements of income, comprehensive income, shareholders’ equity and cash flows for each of the years in the three-year period ended June 30, 2014. In connection with our audits of the consolidated financial statements, we also have audited the related financial statement schedule II – Valuation and Qualifying Accounts and Reserves for each of the years in the three-year period ended June 30, 2014. These consolidated financial statements and financial statement schedule are the responsibility of the Company’s management. Our responsibility is to express an opinion on these consolidated financial statements and financial statement schedule based on our audits.
We conducted our audits in accordance with the standards of the Public Company Accounting Oversight Board (United States). Those standards require that we plan and perform the audit to obtain reasonable assurance about whether the financial statements are free of material misstatement. An audit includes examining, on a test basis, evidence supporting the amounts and disclosures in the financial statements. An audit also includes assessing the accounting principles used and significant estimates made by management, as well as evaluating the overall financial statement presentation. We believe that our audits provide a reasonable basis for our opinion.
In our opinion, the consolidated financial statements referred to above present fairly, in all material respects, the financial position of Harman International Industries, Incorporated and subsidiaries as of June 30, 2014 and 2013, and the results of their operations and their cash flows for each of the years in the three-year period ended June 30, 2014, in conformity with U.S. generally accepted accounting principles. Also in our opinion, the related financial statement schedule, when considered in relation to the basic consolidated financial statements taken as a whole, presents fairly, in all material respects, the information set forth therein.
We also have audited, in accordance with the standards of the Public Company Accounting Oversight Board (United States), Harman International Industries, Incorporated’s internal control over financial reporting as of June 30, 2014, based on criteria established in Internal Control—Integrated Framework (1992) issued by the Committee of Sponsoring Organizations of the Treadway Commission, and our report dated August 7, 2014 expressed an unqualified opinion on the effectiveness of the Company’s internal control over financial reporting.
| /s/ KPMG LLP |
| Stamford, Connecticut August 7, 2014 |
54
Table of Contents
HARMAN INTERNATIONAL INDUSTRIES, INCORPORATED AND SUBSIDIARIES
| June 30, | ||||||||
| (in thousands) |
2014 | 2013 | ||||||
| Assets |
||||||||
| Current assets |
||||||||
| Cash and cash equivalents |
$ | 581,312 | $ | 454,258 | ||||
| Short-term investments |
0 | 10,008 | ||||||
| Receivables, net |
894,579 | 722,711 | ||||||
| Inventories |
662,128 | 549,831 | ||||||
| Other current assets |
320,852 | 352,244 | ||||||
|
|
|
|
|
|||||
| Total current assets |
2,458,871 | 2,089,052 | ||||||
| Property, plant and equipment, net |
509,856 | 425,182 | ||||||
| Goodwill |
540,952 | 234,342 | ||||||
| Deferred tax assets, long-term, net |
170,558 | 260,749 | ||||||
| Other assets |
445,353 | 226,360 | ||||||
|
|
|
|
|
|||||
| Total assets |
$ | 4,125,590 | $ | 3,235,685 | ||||
|
|
|
|
|
|||||
| Liabilities and Equity |
||||||||
| Current liabilities |
||||||||
| Current portion of long-term debt |
$ | 35,625 | $ | 30,000 | ||||
| Short-term debt |
3,736 | 4,930 | ||||||
| Accounts payable |
697,553 | 498,055 | ||||||
| Accrued liabilities |
566,722 | 402,704 | ||||||
| Accrued warranties |
155,472 | 128,411 | ||||||
| Income taxes payable |
26,544 | 13,414 | ||||||
|
|
|
|
|
|||||
| Total current liabilities |
1,485,652 | 1,077,514 | ||||||
| Borrowings under revolving credit facility |
300,000 | 0 | ||||||
| Long-term debt |
219,407 | 255,043 | ||||||
| Pension liability |
186,352 | 167,687 | ||||||
| Other non-current liabilities |
141,158 | 90,570 | ||||||
|
|
|
|
|
|||||
| Total liabilities |
2,332,569 | 1,590,814 | ||||||
|
|
|
|
|
|||||
| Commitments and contingencies |
— | — | ||||||
| Preferred stock |
0 | 0 | ||||||
| Common stock |
984 | 970 | ||||||
| Additional paid-in capital |
1,040,254 | 971,748 | ||||||
| Accumulated other comprehensive income |
39,799 | 21,800 | ||||||
| Retained earnings |
1,979,234 | 1,827,267 | ||||||
| Less: Common stock held in treasury |
(1,267,693 | ) | (1,176,914 | ) | ||||
|
|
|
|
|
|||||
| Total Harman International Industries, Incorporated shareholders’ equity |
1,792,578 | 1,644,871 | ||||||
|
|
|
|
|
|||||
| Noncontrolling interest |
443 | 0 | ||||||
|
|
|
|
|
|||||
| Total equity |
1,793,021 | 1,644,871 | ||||||
|
|
|
|
|
|||||
| Total liabilities and equity |
$ | 4,125,590 | $ | 3,235,685 | ||||
|
|
|
|
|
|||||
See accompanying Notes to the Consolidated Financial Statements.
55
Table of Contents
HARMAN INTERNATIONAL INDUSTRIES, INCORPORATED AND SUBSIDIARIES
CONSOLIDATED STATEMENTS OF INCOME
| Year Ended June 30, | ||||||||||||
| (in thousands, except earnings per share data) |
2014 | 2013 | 2012 | |||||||||
| Net sales |
$ | 5,348,483 | $ | 4,297,842 | $ | 4,364,078 | ||||||
| Cost of sales |
3,891,816 | 3,193,722 | 3,179,932 | |||||||||
|
|
|
|
|
|
|
|||||||
| Gross profit |
1,456,667 | 1,104,120 | 1,184,146 | |||||||||
| Selling, general and administrative expenses |
1,126,940 | 902,869 | 883,900 | |||||||||
|
|
|
|
|
|
|
|||||||
| Operating income |
329,727 | 201,251 | 300,246 | |||||||||
| Other expenses: |
||||||||||||
| Interest expense, net |
8,026 | 12,868 | 20,126 | |||||||||
| Foreign exchange losses, net |
5,935 | 2,313 | 13,152 | |||||||||
| Miscellaneous, net |
8,371 | 11,800 | 5,815 | |||||||||
|
|
|
|
|
|
|
|||||||
| Income before income taxes |
307,395 | 174,270 | 261,153 | |||||||||
| Income tax expense (benefit), net |
72,610 | 31,729 | (68,388 | ) | ||||||||
| Equity in loss of unconsolidated subsidiaries |
206 | 134 | 0 | |||||||||
|
|
|
|
|
|
|
|||||||
| Net income |
234,579 | 142,407 | 329,541 | |||||||||
| Net loss attributable to noncontrolling interest |
(113 | ) | 0 | 0 | ||||||||
|
|
|
|
|
|
|
|||||||
| Net income attributable to Harman International Industries, Incorporated |
$ | 234,692 | $ | 142,407 | $ | 329,541 | ||||||
|
|
|
|
|
|
|
|||||||
| Earnings per share: |
||||||||||||
| Basic |
$ | 3.40 | $ | 2.06 | $ | 4.62 | ||||||
|
|
|
|
|
|
|
|||||||
| Diluted |
$ | 3.36 | $ | 2.04 | $ | 4.57 | ||||||
|
|
|
|
|
|
|
|||||||
| Weighted Average Shares Outstanding: |
||||||||||||
| Basic |
69,073 | 68,990 | 71,297 | |||||||||
|
|
|
|
|
|
|
|||||||
| Diluted |
69,889 | 69,736 | 72,083 | |||||||||
|
|
|
|
|
|
|
|||||||
See accompanying Notes to the Consolidated Financial Statements.
56
Table of Contents
HARMAN INTERNATIONAL INDUSTRIES, INCORPORATED AND SUBSIDIARIES
CONSOLIDATED STATEMENTS OF COMPREHENSIVE INCOME
| Year Ended June 30, | ||||||||||||
| (in thousands) |
2014 | 2013 | 2012 | |||||||||
| Net income |
$ | 234,579 | $ | 142,407 | $ | 329,541 | ||||||
|
|
|
|
|
|
|
|||||||
| Other comprehensive income (loss) (1): |
||||||||||||
| Foreign currency translation |
44,881 | 5,379 | (136,240 | ) | ||||||||
| Unrealized (losses) gains on hedging derivatives |
(28,370 | ) | (26,993 | ) | 68,541 | |||||||
| Pension liability adjustment |
(7,666 | ) | 3,119 | (29,399 | ) | |||||||
| Unrealized gains (losses) on available for sale securities |
287 | 4,376 | (120 | ) | ||||||||
|
|
|
|
|
|
|
|||||||
| Other comprehensive income (loss) before taxes, attributable to Harman International Industries, Incorporated |
9,132 | (14,119 | ) | (97,218 | ) | |||||||
| Income tax (benefit) expense |
(8,867 | ) | (6,210 | ) | 9,806 | |||||||
|
|
|
|
|
|
|
|||||||
| Other comprehensive income (loss), net of taxes |
17,999 | (7,909 | ) | (107,024 | ) | |||||||
|
|
|
|
|
|
|
|||||||
| Comprehensive income, net of taxes |
252,578 | 134,498 | 222,517 | |||||||||
|
|
|
|
|
|
|
|||||||
| Net loss attributable to noncontrolling interest |
(113 | ) | 0 | 0 | ||||||||
|
|
|
|
|
|
|
|||||||
| Comprehensive income, net of taxes attributable to Harman International Industries, Incorporated |
$ | 252,691 | $ | 134,498 | $ | 222,517 | ||||||
|
|
|
|
|
|
|
|||||||
| (1) | Refer to Note 15—Other Comprehensive Income (Loss) for more information. |
See accompanying Notes to the Consolidated Financial Statements.
57
Table of Contents
HARMAN INTERNATIONAL INDUSTRIES, INCORPORATED AND SUBSIDIARIES
CONSOLIDATED STATEMENTS OF CASH FLOWS
| Year Ended June 30, | ||||||||||||
| (in thousands) |
2014 | 2013 | 2012 | |||||||||
| Cash flows from operating activities: |
||||||||||||
| Net income |
$ | 234,579 | $ | 142,407 | $ | 329,541 | ||||||
| Adjustments to reconcile net income to net cash provided by operating activities, net of acquired businesses: |
||||||||||||
| Depreciation and amortization |
132,328 | 128,168 | 122,225 | |||||||||
| Deferred income taxes |
31,040 | 7,583 | (99,306 | ) | ||||||||
| Loss (gain) on disposition of assets |
1,137 | (1,131 | ) | 1,377 | ||||||||
| Share-based compensation |
28,588 | 17,593 | 17,370 | |||||||||
| Excess tax benefit from share-based compensation |
(2,309 | ) | 0 | 0 | ||||||||
| Non-cash interest expense |
2,180 | 8,500 | 19,149 | |||||||||
| Non-cash reduction in contingent liabilities |
0 | (22,100 | ) | 0 | ||||||||
| Changes in operating assets and liabilities, net of acquired businesses: |
||||||||||||
| (Increase) decrease in: |
||||||||||||
| Receivables, net |
(114,354 | ) | (114,847 | ) | (50,709 | ) | ||||||
| Inventories |
(67,400 | ) | (72,810 | ) | (36,725 | ) | ||||||
| Other current assets |
10,391 | (46,695 | ) | (84,866 | ) | |||||||
| Pre-production and development costs |
7,821 | (23,708 | ) | (18,624 | ) | |||||||
| Increase (decrease) in: |
||||||||||||
| Accounts payable |
147,994 | (23,394 | ) | 62,046 | ||||||||
| Accrued warranties |
21,061 | 28,723 | (10,348 | ) | ||||||||
| Accrued other liabilities |
127,950 | 12,558 | 2,914 | |||||||||
| Income taxes payable |
12,609 | (3,026 | ) | 3,596 | ||||||||
| Net change in derivative assets and liabilities |
18,121 | (562 | ) | (5,740 | ) | |||||||
| Other operating activities |
404 | 4,877 | 16,607 | |||||||||
|
|
|
|
|
|
|
|||||||
| Net cash provided by operating activities |
592,140 | 42,136 | 268,507 | |||||||||
|
|
|
|
|
|
|
|||||||
| Cash flows from investing activities: |
||||||||||||
| Acquisitions, net of cash received |
(422,953 | ) | (104,735 | ) | (70,535 | ) | ||||||
| Capital expenditures |
(157,141 | ) | (101,682 | ) | (112,536 | ) | ||||||
| Purchases of short-term investments |
0 | (73,761 | ) | (559,283 | ) | |||||||
| Maturities of short-term investments |
10,008 | 267,278 | 673,591 | |||||||||
| Proceeds from asset dispositions |
0 | 3,944 | 2,865 | |||||||||
| Purchase of investments for irrevocable trust |
(42,400 | ) | 0 | 0 | ||||||||
| Other items, net |
434 | (1,735 | ) | 1,247 | ||||||||
|
|
|
|
|
|
|
|||||||
| Net cash used in investing activities |
(612,052 | ) | (10,691 | ) | (64,651 | ) | ||||||
|
|
|
|
|
|
|
|||||||
| Cash flows from financing activities: |
||||||||||||
| Decrease in short-term borrowings |
(1,162 | ) | (36,590 | ) | (1,308 | ) | ||||||
| Borrowings under new credit agreement |
300,000 | 300,000 | 0 | |||||||||
| Repayments of long-term debt |
(30,000 | ) | (424,079 | ) | 0 | |||||||
| Debt issuance costs |
0 | (6,094 | ) | 0 | ||||||||
| Cash dividends to shareholders |
(83,053 | ) | (41,449 | ) | (21,161 | ) | ||||||
| Repurchase of common stock |
(90,779 | ) | (5,398 | ) | (123,946 | ) | ||||||
| Share-based payment arrangements, net of shares received |
38,672 | 13,939 | 11,342 | |||||||||
| Excess tax benefit from share-based compensation |
2,309 | 0 | 0 | |||||||||
| Other items, net |
617 | (3,740 | ) | (12,573 | ) | |||||||
|
|
|
|
|
|
|
|||||||
| Net cash provided by (used in) financing activities |
136,604 | (203,411 | ) | (147,646 | ) | |||||||
|
|
|
|
|
|
|
|||||||
| Effect of exchange rate changes on cash |
10,362 | 8,868 | (42,746 | ) | ||||||||
|
|
|
|
|
|
|
|||||||
| Net increase (decrease) in cash and cash equivalents |
127,054 | (163,098 | ) | 13,464 | ||||||||
| Cash and cash equivalents at beginning of period |
454,258 | 617,356 | 603,892 | |||||||||
|
|
|
|
|
|
|
|||||||
| Cash and cash equivalents at end of period |
$ | 581,312 | $ | 454,258 | $ | 617,356 | ||||||
|
|
|
|
|
|
|
|||||||
| Supplemental Disclosure of Cash Flow Information: |
||||||||||||
| Accrued and contingent acquisition-related liabilities |
$ | 7,279 | $ | 288 | $ | 28,017 | ||||||
See accompanying Notes to the Consolidated Financial Statements.
58
Table of Contents
HARMAN INTERNATIONAL INDUSTRIES, INCORPORATED AND SUBSIDIARIES
CONSOLIDATED STATEMENTS OF SHAREHOLDERS’ EQUITY
| Years Ended June 30, 2014, 2013 and 2012 | ||||||||||||||||||||||||||||||||||||
| Common Stock | Additional Paid-in Capital |
Accumulated Other Comprehensive Income (Loss) |
Retained Earnings |
Treasury Stock |
Total Harman International Industries, Incorporated Shareholders’ Equity |
Non Controlling Interest |
Total Equity |
|||||||||||||||||||||||||||||
| ($ in thousands, except per share data) |
Number of Shares |
$.01 Par Value |
||||||||||||||||||||||||||||||||||
| Balance, June 30, 2011 |
69,920,251 | $ | 956 | $ | 915,433 | $ | 136,733 | $ | 1,418,106 | $ | (1,047,570 | ) | $ | 1,423,658 | $ | 0 | $ | 1,423,658 | ||||||||||||||||||
| Net income |
0 | 0 | 0 | 0 | 329,541 | 0 | 329,541 | 0 | 329,541 | |||||||||||||||||||||||||||
| Other comprehensive income, net of tax |
(107,024 | ) | (107,024 | ) | 0 | (107,024 | ) | |||||||||||||||||||||||||||||
| Restricted stock unit vesting |
189,525 | 0 | 0 | 0 | 0 | 0 | 0 | 0 | 0 | |||||||||||||||||||||||||||
| Share-based payment arrangements, net of shares received |
422,949 | 5 | 11,342 | 0 | 0 | 0 | 11,347 | 0 | 11,347 | |||||||||||||||||||||||||||
| Share-based compensation, net |
0 | 0 | 17,196 | 0 | 0 | 0 | 17,196 | 0 | 17,196 | |||||||||||||||||||||||||||
| Dividends ($0.30 per share)(1) |
0 | 0 | 0 | 0 | (21,161 | ) | 0 | (21,161 | ) | 0 | (21,161 | ) | ||||||||||||||||||||||||
| Treasury stock repurchases |
(3,246,409 | ) | 0 | 0 | 0 | 0 | (123,946 | ) | (123,946 | ) | 0 | (123,946 | ) | |||||||||||||||||||||||
|
|
|
|
|
|
|
|
|
|
|
|
|
|
|
|
|
|
|
|||||||||||||||||||
| Balance, June 30, 2012 |
67,286,316 | $ | 961 | $ | 943,971 | $ | 29,709 | $ | 1,726,486 | $ | (1,171,516 | ) | $ | 1,529,611 | $ | 0 | $ | 1,529,611 | ||||||||||||||||||
| Net income |
0 | 0 | 0 | 0 | 142,407 | 0 | 142,407 | 0 | 142,407 | |||||||||||||||||||||||||||
| Other comprehensive income, net of tax |
(7,909 | ) | (7,909 | ) | (7,909 | ) | ||||||||||||||||||||||||||||||
| Restricted stock unit vesting |
303,615 | 0 | 0 | 0 | 0 | 0 | 0 | 0 | 0 | |||||||||||||||||||||||||||
| Share-based payment arrangements, net of shares received |
608,415 | 9 | 13,930 | 0 | 0 | 0 | 13,939 | 0 | 13,939 | |||||||||||||||||||||||||||
| Share-based compensation, net |
0 | 0 | 13,847 | 0 | 0 | 0 | 13,847 | 0 | 13,847 | |||||||||||||||||||||||||||
| Dividends ($0.60 per share)(1) |
0 | 0 | 0 | 0 | (41,626 | ) | 0 | (41,626 | ) | 0 | (41,626 | ) | ||||||||||||||||||||||||
| Treasury stock repurchases |
(145,866 | ) | 0 | 0 | 0 | 0 | (5,398 | ) | (5,398 | ) | 0 | (5,398 | ) | |||||||||||||||||||||||
|
|
|
|
|
|
|
|
|
|
|
|
|
|
|
|
|
|
|
|||||||||||||||||||
| Balance, June 30, 2013 |
68,052,480 | $ | 970 | $ | 971,748 | $ | 21,800 | $ | 1,827,267 | $ | (1,176,914 | ) | $ | 1,644,871 | $ | 0 | $ | 1,644,871 | ||||||||||||||||||
| Net income |
0 | 0 | 0 | 0 | 234,692 | 0 | 234,692 | (113 | ) | 234,579 | ||||||||||||||||||||||||||
| Other comprehensive income, net of tax |
17,999 | 17,999 | 17,999 | |||||||||||||||||||||||||||||||||
| Restricted stock unit vesting |
333,018 | 0 | 0 | 0 | 0 | 0 | 0 | 0 | ||||||||||||||||||||||||||||
| Share-based payment arrangements, net of shares received |
1,030,452 | 14 | 37,609 | 0 | 0 | 0 | 37,623 | 0 | 37,623 | |||||||||||||||||||||||||||
| Share-based compensation, net |
0 | 0 | 28,588 | 0 | 0 | 0 | 28,588 | 0 | 28,588 | |||||||||||||||||||||||||||
| Dividends ($1.20 per share)(1) |
0 | 0 | 0 | 0 | (82,725 | ) | 0 | (82,725 | ) | 0 | (82,725 | ) | ||||||||||||||||||||||||
| Excess tax benefit from share-based compensation |
0 | 0 | 2,309 | 0 | 0 | 0 | 2,309 | 0 | 2,309 | |||||||||||||||||||||||||||
| Treasury stock repurchases |
(1,327,693 | ) | 0 | 0 | 0 | 0 | (90,779 | ) | (90,779 | ) | 0 | (90,779 | ) | |||||||||||||||||||||||
| Acquisition of noncontrolling interest |
0 | 0 | 0 | 0 | 0 | 0 | 0 | 556 | 556 | |||||||||||||||||||||||||||
|
|
|
|
|
|
|
|
|
|
|
|
|
|
|
|
|
|
|
|||||||||||||||||||
| Balance, June 30, 2014 |
68,088,257 | $ | 984 | $ | 1,040,254 | $ | 39,799 | $ | 1,979,234 | $ | (1,267,693 | ) | $ | 1,792,578 | $ | 443 | $ | 1,793,021 | ||||||||||||||||||
|
|
|
|
|
|
|
|
|
|
|
|
|
|
|
|
|
|
|
|||||||||||||||||||
| (1) | Cash dividends declared on common stock were $0.30 in all four quarters of fiscal year 2014, $0.15 in all four quarters of fiscal year 2013 and $0.075 in all four quarters of fiscal year 2012. |
See accompanying Notes to the Consolidated Financial Statements.
59
Table of Contents
Harman International Industries, Incorporated and Subsidiaries
Notes to the Consolidated Financial Statements
(Dollars in thousands, except per share data and unless otherwise indicated)
Note 1—Summary of Significant Accounting Policies
References to “we,” “us,” “our,” “Company” and “Harman” refer to Harman International Industries, Incorporated and its consolidated subsidiaries unless the context specifically indicates otherwise.
Description of Business: We believe we are a worldwide leader in the development, manufacture and marketing of high quality, high-fidelity audio products, lighting solutions and electronic systems, as well as digitally integrated audio and infotainment systems for the automotive industry. We have developed, both internally and through a series of strategic acquisitions, a broad range of product offerings sold under renowned brand names in our principal markets. Our Aha®, AKG®, AMX®, Becker®, BSS®, Crown®, dbx®, DigiTech®, Harman/Kardon®, Infinity®, JBL®, JBL Professional, Lexicon®, Logic 7®, Mark Levinson®, Martin®, Revel®, Selenium®, Soundcraft®, Studer® and yurbuds® Powered by JBL brand names are well known worldwide for premium quality and performance.
Principles of Consolidation: The consolidated financial statements include the accounts of Harman International Industries, Incorporated and our controlled subsidiary companies. All significant intercompany accounts and transactions have been eliminated. Operating results of acquired businesses are included in the Consolidated Statements of Income from the date of acquisition.
We consolidate variable interest entities if we are deemed to be the primary beneficiary of the entity. Operating results for variable interest entities in which we are determined to be the primary beneficiary are included in the Consolidated Statements of Income from the date such determination is made.
Reclassifications: Where necessary, information for prior fiscal years has been reclassified to conform to the fiscal year 2014 financial statement presentation.
Use of Estimates: The preparation of financial statements in conformity with generally accepted accounting principles in the United States of America (“GAAP”) requires that we make estimates and assumptions that affect the reported amount of assets and liabilities, as well as the disclosure of contingent assets and liabilities at the date of the financial statements, and the reported amount of revenues and expenses during the reporting period. Significant estimates are used for, but not limited to: (i) inventory valuation; (ii) goodwill and other asset impairments; (iii) restructuring and related charges; (iv) the evaluation of the recoverability of pre-production and development contract costs; (v) warranty liabilities; (vi) allowance for doubtful accounts; (vii) contingency and litigation reserves; (viii) income tax reserves and valuation allowances; (ix) accounting for business combinations; (x) sales discounts and sales allowances; (xi) pension, post-retirement and other employee benefits; and (xii) losses on infotainment supply arrangements. Various assumptions go into the determination of these estimates. The process of determining significant estimates requires consideration of factors such as historical experience, current and expected economic conditions, and actuarial methods. We reevaluate these significant factors and make changes and adjustments where facts and circumstances indicate that changes are necessary. The accounting estimates used in the preparation of our consolidated financial statements will change as new events occur, as more experience is acquired, as additional information is obtained and as our operating environment changes. Actual results could differ from those estimates and the differences could have a material impact on our consolidated financial statements.
Changes in Estimates: In the ordinary course of accounting for items discussed above, we make changes in estimates as appropriate, and as we become aware of circumstances affecting those estimates. Such changes and refinements in estimation methodologies are reflected in reported results of operations in the period in which the changes are made and, if material, their effects are disclosed in these Notes to the Consolidated Financial Statements.
60
Table of Contents
Revenue Recognition: Revenue is generally recognized at the time of product shipment or delivery, depending on when the passage of title to goods transfers to unaffiliated customers and when all of the following have occurred: a firm sales agreement is in place, pricing is fixed or determinable and collection is reasonably assured. Sales are reported net of estimated returns, discounts, rebates and incentives. Substantially all of our revenue transactions involve the delivery of a physical product. Royalty income, which is not material, is recorded when earned based upon contract terms with licensees which provide for royalties.
We enter into incentive agreements with certain automotive customers which relate to a specific program award. These incentives are generally based on fixed payments paid by us to the automotive manufacturer, and are generally deferred, if certain criteria are met. The deferability criteria include the existence of legally enforceable rights, management’s ability and intent to enforce the recoverability clauses and the ability to generate future earnings from the agreement in excess of the deferred amounts. Capitalized amounts are amortized, generally as a reduction to revenue, over the related program award term based on our estimate of future volumes. Our estimates are reviewed regularly and the cumulative impact of a revision in estimates is recorded in the period such revisions become probable and estimable.
Sales Discounts: We offer product discounts and sales incentives including prompt payment discounts, volume incentive programs, rebates and dealer order incentives. We report revenues net of discounts and other sales incentives.
Cost of Sales: Cost of sales includes material, labor and overhead for products manufactured by us and cost of goods produced for us on a contract basis. Expenses incurred for manufacturing depreciation and engineering, warehousing, shipping and handling, sales commissions, warranty and customer service are also included in cost of sales.
Allowance for Doubtful Accounts: We reserve an estimated amount for accounts receivable that may not be collected. Methodologies for estimating the allowance for doubtful accounts are primarily based on specific identification of uncollectible accounts. Historical collection rates and customer credit worthiness are considered in determining specific reserves. At June 30, 2014 and 2013, we had $9.6 million and $11.2 million, respectively, reserved for possible uncollectible accounts receivable. As with many estimates, management must make judgments about potential actions by third parties in establishing and evaluating our allowance for doubtful accounts.
Infotainment Supply Arrangements: We have arrangements with our infotainment customers to provide products that meet predetermined technical specifications and delivery dates. In the event we do not satisfy the performance obligations under these arrangements, we may be required to indemnify the customer. We accrue for any loss that we expect to incur under these arrangements when the loss is probable and can be reasonably estimated.
Accrued Warranties: We warrant our products to be free from defects in materials and workmanship for periods ranging from six months to six years from the date of purchase, depending on the business segment and product. Our dealers and warranty service providers normally perform warranty service in field locations and regional service centers, using parts and replacement finished goods we supply on an exchange basis. Our dealers and warranty service providers also install updates we provide to correct defects covered by our warranties. Estimated warranty liabilities are based upon past experience with similar types of products, the technological complexity of certain products, replacement cost and other factors. If estimates of warranty provisions are no longer adequate based on our analysis of current activity, incremental provisions are recorded as warranty expense in our Consolidated Statement of Income. We take these factors into consideration when assessing the adequacy of our warranty provision for periods still open to claim. Refer to Note 6—Accrued Warranties for more information.
Selling, General and Administrative Expenses: Selling, general and administrative expenses (“SG&A”) include non-manufacturing salaries and benefits, share-based compensation expense, occupancy costs,
61
Table of Contents
professional fees, research, development & engineering expenses (“RD&E”), amortization of intangibles, advertising and marketing costs and other operating expenses.
Advertising Expenses: We expense advertising costs as incurred. When production costs are incurred for future advertising, these costs are recorded as an asset and subsequently expensed when the advertisement is first put into service.
RD&E: RD&E are expensed as incurred. RD&E, net of customer reimbursements, were $343.8 million, $285.3 million and $331.9 million for the fiscal years ending June 30, 2014, 2013 and 2012, respectively.
Interest Expense, net: Interest expense, net, includes interest expense and amortization of debt issuance costs and original issue discount on debt securities, net of interest income. There was no amortization of original issue discount on debt securities in fiscal year 2014 since we had repaid the $400.0 million of 1.25 percent convertible senior notes on October 15, 2012 (the “Convertible Senior Notes”).
Foreign exchange losses, net: Foreign exchange losses, net includes gains and losses from forward points on certain derivative foreign currency forward contracts that are excluded from hedge effectiveness testing. It also includes gains and losses resulting from the remeasurement of certain foreign currency denominated monetary assets and liabilities.
Cash and Cash Equivalents: Cash and cash equivalents include cash on hand, money-market funds and investments with original maturities of three months or less.
Restricted Cash and Investments: We have a deferred compensation arrangement with certain foreign employees which requires us to maintain cash on hand. At June 30, 2014 and 2013, such restricted cash amounts were $7.8 million and $10.4 million, respectively, and were included in Other assets in our Consolidated Balance Sheets.
Short-Term Investments: Short-term investments consist of investments in commercial paper, short-term deposits, government bonds, time deposits and treasury bills with original maturities of greater than three months and less than one year.
Inventories: Inventories are stated at the lower of cost or market. Cost is determined principally by the first-in, first-out method. We establish reserves for our inventory which requires us to analyze the aging and forecasted demand for our inventories, to forecast future product sales prices, pricing trends and margins, and to make judgments and estimates regarding obsolete, damaged or excess inventory. Markdown percentages are determined based on our estimate of future demand and selling prices for our products. Future sales prices are determined based on current and forecasted market expectations, as well as terms that have been established for future orders under automotive platform arrangements. Our inventory reserves primarily relate to our raw materials and finished goods. We calculate inventory reserves on raw materials by reviewing the levels of raw materials on-hand and comparing this to estimates of historical consumption and future demand in order to assess whether we have excess materials on-hand. If it is determined that excess materials are in inventory, an appropriate inventory reserve is established. Inventory reserves on finished goods are primarily determined through inventory turnover measures. Products showing low turnover rates are assigned a percentage reserve based on future estimates of sales volumes and margins. We make adjustments to our inventory reserves based on the identification of specific situations and increase our inventory reserves accordingly. As changes in future economic or industry conditions occur, we revise the estimates that were used to calculate our inventory reserves. Refer to Note 4—Inventories for more information.
Property, Plant and Equipment, net: Property, plant and equipment, net is stated at cost. Depreciation and amortization of property, plant and equipment, net is computed primarily using the straight-line method over the asset’s useful life. Refer to Note 5—Property, Plant and Equipment, net for more information.
62
Table of Contents
Goodwill: We assess goodwill for potential impairments annually each April 30th, or during the year if an event or other circumstance indicates that we may not be able to recover the carrying amount of the asset. Application of the goodwill impairment test requires judgment, including the identification of reporting units, assignment of assets and liabilities to reporting units, assignment of goodwill to reporting units, and determination of the fair value of each reporting unit. We estimate the fair value of each reporting unit using a discounted cash flow methodology. This requires us to use significant judgment, including estimation of future cash flows, which is dependent on internal forecasts, estimation of the long-term rate of growth for our business, the useful life over which cash flows will occur, determination of our weighted average cost of capital, and relevant market data.
In evaluating goodwill for impairment, we first may assess qualitative factors to determine whether it is more likely than not (that is, a likelihood of more than 50 percent) that the fair value of a reporting unit is less than its carrying amount. If we conclude that it is not more likely than not that the fair value of a reporting unit is less than its carrying value, then no further testing of the goodwill assigned to the reporting unit is required. However, if we conclude that it is more likely than not that the fair value of a reporting unit is less than its carrying value, then we perform a two-step goodwill impairment test to identify potential goodwill impairment and measure the amount of goodwill impairment to be recognized, if any. In fiscal years 2014 and 2013, we did not elect to first assess the qualitative factors in evaluating our goodwill for impairment; therefore, we proceeded with our quantitative goodwill impairment test.
The first step compares the fair value of each reporting unit to its carrying value, with fair value of each reporting unit determined using established valuation techniques, specifically the market and income approaches. If the results of the first step indicate that the fair value of a reporting unit is less than its carrying value, the second step of this test is conducted wherein the amount of any impairment is determined by comparing the implied fair value of goodwill in a reporting unit to the recorded amount of goodwill for that reporting unit. The implied fair value of goodwill is calculated as the excess of fair value of the reporting unit over the amounts assigned to its assets and liabilities. Should the fair values of the goodwill so calculated be less than the carrying value, an impairment is recognized. We did not record any impairment charges for goodwill in fiscal years 2014, 2013 and 2012. Refer to Note 8—Goodwill and Intangible Assets, Net for more information.
Other Intangible Assets: Other intangible assets primarily consist of customer relationships, tradenames, non-compete agreements, technology, patents and software and are amortized over periods ranging from less than one year to 17 years and are included in Other assets in our Consolidated Balance Sheets. Other intangible assets are amortized on a straight-line basis over their estimated economic lives. We believe that the straight-line method of amortization reflects an appropriate allocation of the cost of the intangible assets to earnings in proportion to the amount of economic benefits obtained annually by our Company. We also have indefinite-lived intangible assets of $80.1 million, primarily consisting of tradenames, which we assess for potential impairments annually, or during the year if an event or other circumstance indicates that we may not be able to recover the carrying amount of the asset. We did not record any impairment charges for other intangible assets in fiscal years 2014, 2013 and 2012. Refer to Note 8—Goodwill and Intangible Assets, Net for more information.
Impairment of Long-Lived Assets: We review the recoverability of our long-lived assets, including buildings, equipment and other definite-lived intangible assets, when events or changes in circumstances occur that indicate that the carrying value of the asset may not be recoverable. The assessment of possible impairment is based on our ability to recover the carrying value of the asset from the expected future cash flows (undiscounted and without interest charges) of the related operations. If these cash flows are less than the carrying value of such asset, an impairment loss is recognized for the difference between estimated fair value and carrying value. Our primary measure of fair value is based on discounted cash flows. We will continue to monitor the need for impairment tests, which could result in additional impairment charges. We recognized $0.7 million, $0.7 million and $0.6 million in impairment charges related to facilities that were held-for-sale in the fiscal years ended June 30, 2014, 2013 and 2012, respectively.
63
Table of Contents
Pre-Production and Development Costs: We incur pre-production and development costs related to infotainment systems that we develop for automobile manufacturers pursuant to long-term supply arrangements. Portions of these costs are reimbursable under separate agreements and are recorded as unbilled costs in our Consolidated Balance Sheets in Other current assets and Other assets, once an agreement is signed.
At June 30, 2014 and 2013, unbilled costs were $75.1 million and $79.0 million, respectively, related to pre-production costs. At June 30, 2014 and 2013 unbilled costs reimbursable in the next 12 months totaled $25.3 million and $25.0 million, respectively, and were recorded in other current assets in our Consolidated Balance Sheets. Unbilled costs reimbursable in subsequent years at June 30, 2014 and 2013 totaled $49.8 million and $54.0 million, respectively, and were recorded in Other assets in our Consolidated Balance Sheets. At June 30, 2014 and 2013, we had fixed assets of $20.0 million and $16.9 million, respectively, for molds, dies and other tools included in our Consolidated Balance Sheets, which our customers will eventually purchase and own pursuant to long-term supply arrangements.
Income Taxes: Deferred income tax assets or liabilities are computed based on the temporary differences between the financial statement and income tax basis of assets and liabilities using the statutory marginal income tax rate in effect for the years in which the differences are expected to reverse. Deferred income tax expenses or credits are based on the changes in the deferred income tax assets or liabilities from period to period. We record a valuation allowance to reduce our deferred tax assets to the amount that we believe is more likely than not to be realized. In determining the need for, and the amount of a valuation allowance, we consider our ability to forecast earnings, future taxable income, carryback losses, if any, and we consider feasible tax planning strategies. We believe the estimate of our income tax assets, liabilities and expenses are “critical accounting estimates” because if the actual income tax assets, liabilities and expenses differ from our estimates the outcome could have a material impact on our results of operations. Adjustments to our valuation allowance, through charges to income tax expense (benefit) were $(1.3) million, $2.9 million and $(124.2) million for the fiscal years ending June 30, 2014, 2013 and 2012, respectively.
The calculation of our tax liabilities involves evaluating uncertainties in the application of complex tax regulations. We recognize liabilities for uncertain tax positions in the U.S. and other tax jurisdictions based on our estimate of whether and the extent to which additional taxes will be due. If payment of these amounts ultimately proves to be unnecessary, the reversal of the liabilities would result in additional tax benefits recognized in the period in which we determine the liabilities are no longer necessary. If our estimate of tax liabilities proves to be less than the ultimate assessment, a further charge to expense would result. We recognize interest and penalties related to income tax matters in income tax expense. Refer to Note 13—Income Taxes, for more information.
Retirement Benefits: We provide postretirement benefits to certain employees. Employees in the United States are covered by a defined contribution plan. Our contributions to this plan are based on a percentage of employee contributions. These plans are funded on a current basis. We also have a Supplemental Executive Retirement Plan (“SERP”) in the United States that provides retirement, death and termination benefits, as defined in the plan, to certain key executives designated by our Board of Directors.
Certain employees outside the United States are covered by non-contributory defined benefit plans. The defined benefit plans are funded in conformity with applicable government regulations. Generally, benefits are based on age, years of service, and the level of compensation during the final years of service. Refer to Note 17—Retirement Benefits for more information.
Foreign Currency Translation: The financial statements of subsidiaries located outside of the United States generally are measured using the local currency as the functional currency. Assets, including goodwill, and liabilities of these subsidiaries are translated at the rates of exchange at the balance sheet date. The resulting translation adjustments are included in accumulated other comprehensive income (“AOCI”) in our Consolidated Balance Sheets. Income, expense and cash flow items are translated at average monthly exchange rates. Gains and losses from foreign currency transactions of these subsidiaries are included in net income in our Consolidated Statements of Income.
64
Table of Contents
Derivative Financial Instruments: We are exposed to market risks from changes in foreign currency exchange rates and interest rates which could affect our operating results, financial condition and cash flows. We manage our exposure to these risks through our regular operating and financial activities and when appropriate, through the use of derivative financial instruments. These derivatives are utilized to hedge economic exposures, as well as to reduce earnings and cash flow volatility resulting from shifts in market rates. We enter into limited types of derivative contracts, including foreign currency spot and forward contracts and an interest rate swap, to manage foreign currency and interest rate exposures. Our primary foreign currency exposure is the Euro. The fair market value of all our derivative contracts change with fluctuations in interest rates and currency rates, and are designed so that changes in their values are offset by changes in the values of the underlying exposures. Derivative financial instruments are held solely as risk management tools and not for trading or speculative purposes. We do not utilize derivatives that contain leverage features. On the date that we enter into a derivative that qualifies for hedge accounting, the derivative is designated as a hedge of the identified exposure. We document all relationships between hedging instruments and hedged items for which we apply hedge accounting treatment and assess the effectiveness of our hedges at inception and on an ongoing basis.
We record all derivative instruments as either assets or liabilities at fair value in our Consolidated Balance Sheets. Certain of these derivative contracts have been designated as cash flow hedges, whereby gains and losses are reported within AOCI in our Consolidated Balance Sheets, until the underlying transaction occurs, at which point they are reported in earnings as gains or losses in our Consolidated Statements of Income. Certain of our derivatives, for which hedge accounting is not applied, are effective as economic hedges. These derivative contracts are required to be recognized each period at fair value, with gains and losses reported in earnings in our Consolidated Statements of Income and therefore do result in some level of earnings volatility. The level of volatility will vary with the type and amount of derivative hedges outstanding, as well as fluctuations in the currency and interest rate markets during the period. The related cash flow impacts of all our derivative activities are reflected as cash flows from operating activities in our Consolidated Statements of Cash Flows. Refer to Note 10—Derivatives for more information.
Interest Rate Management: We had an interest rate swap agreement to effectively convert the interest on an operating lease from a variable to a fixed rate. At the end of each reporting period, the fair value of the interest rate swap agreement was calculated. The fair value was recorded as an asset or liability. The effective gain or loss was recorded as a debit or credit to AOCI in our Consolidated Balance Sheets and any ineffectiveness was recorded immediately to rent expense in our Consolidated Statements of Income. Upon maturity, any gain or loss within AOCI was reclassified into earnings in the then-current period. The interest rate swap matured on September 30, 2013. Refer to Note 10—Derivatives for more information.
Foreign Currency Management: The fair value of foreign currency related derivatives is included in our Consolidated Balance Sheets in other current assets and accrued liabilities. The earnings impact of cash flow hedges relating to forecasted purchases of inventory in foreign currency is reported in cost of sales to match the underlying transaction being hedged. Unrealized gains and losses on these instruments are deferred in AOCI in our Consolidated Balance Sheets until the underlying transaction is recognized in earnings. The earnings impact of cash flow hedges relating to the variability in cash flows associated with foreign currency denominated assets and liabilities is reported in cost of sales, SG&A or other expense in our Consolidated Statements of Income, depending on the nature of the assets or liabilities being hedged. The amounts deferred in AOCI in our Consolidated Balance Sheets associated with these instruments relate to spot-to-spot foreign currency differentials from the date of designation until the hedged transaction takes place.
Severance and Exit Costs: We recognize liabilities for severance and exit costs based upon the nature of the liability incurred. For involuntary separation programs that are conducted according to the guidelines of our written involuntary separation plan or according to the provisions of collective bargaining agreements or statutes, we recognize the liability when it is probable and reasonably estimable. For one-time termination benefits, such as additional severance pay, and other exit costs, such as lease and other contract termination costs, the liability is measured and originally recognized at fair value in the period in which the liability is incurred, with subsequent changes recognized in the period of change. Refer to Note 16—Restructuring for more information.
65
Table of Contents
Share-Based Compensation: Share-based compensation expense is recognized based on the estimated fair value of stock options and similar equity instruments awarded to employees. Refer to Note 14—Shareholders’ Equity and Share-Based Compensation for more information.
Share Buyback Program: On October 26, 2011, our Board of Directors authorized the repurchase of up to $200 million of our common stock (the “Buyback Program”). On June 26, 2013, our Board of Directors authorized the repurchase of an additional $200 million of our common stock (the “New Buyback Program”) which expired on June 26, 2014. Refer to Note 14—Shareholders’ Equity and Share-Based Compensation for more information.
Treasury Stock: We account for repurchased common stock under the cost method and include such treasury stock as a component of our shareholder’s equity in our Consolidated Balance Sheets. Retirement of treasury stock is recorded as a reduction of common stock and additional paid-in-capital in our Consolidated Balance Sheets at the time such retirement is approved by our Board of Directors. Refer to Note 14— Shareholders’ Equity and Share-Based Compensation for more information on shares of our common stock that were repurchased during the fiscal years ended June 30, 2014 and 2013.
Recently Adopted Accounting Pronouncements
Comprehensive Income: In February 2013, the Financial Accounting Standards Board (“FASB”) issued Accounting Standards Update (“ASU”) 2013-02, “Reporting of Amounts Reclassified Out of Accumulated Other Comprehensive Income,” which amends Accounting Standards Codification 220, “Comprehensive Income.” The new guidance requires the disclosure of amounts reclassified out of accumulated other comprehensive income by component and by net income line item. The disclosure may be provided either parenthetically on the face of the financial statements or in the notes. This new guidance is effective for fiscal years and interim periods within those years beginning after December 15, 2012. We adopted the provisions of this new guidance on July 1, 2013. The adoption of the new provisions did not have a material impact on our financial condition or results of operations.
Intangible Assets: In July 2012, the FASB issued ASU 2012-02, “Testing Indefinite-Lived Intangible Assets for Impairment,” which allows companies to perform a qualitative assessment to determine whether further impairment testing of indefinite-lived intangible assets is necessary, similar in approach to the goodwill impairment test. The new guidance allows an entity the option to first assess qualitatively whether it is more likely than not (that is, a likelihood of more than 50 percent) that an indefinite-lived intangible asset is impaired, thus necessitating that it perform the quantitative impairment test. An entity is not required to calculate the fair value of an indefinite-lived intangible asset and perform the quantitative impairment test unless the entity determines that it is more likely than not that the asset is impaired. The new guidance is effective for annual and interim impairment tests performed for fiscal years beginning after September 15, 2012. Early adoption is permitted for annual and interim impairment tests performed as of a date before July 27, 2012, if the financial statements for the most recent annual or interim period have not yet been issued. We adopted the provisions of this new guidance on July 1, 2013. The adoption of the new provisions did not have a material impact on our financial condition or results of operations.
Balance Sheet: In December 2011, the FASB issued ASU 2011-11, “Balance Sheet (Topic 210), Disclosures about Offsetting Assets and Liabilities,” which requires companies to disclose information about financial instruments that have been offset and related arrangements to enable users of its financial statements to understand the effect of those arrangements on its financial condition. Companies will be required to provide both net (offset amounts) and gross information in the notes to the financial statements for relevant assets and liabilities that are offset. The new guidance is effective retrospectively for fiscal years and interim periods within those fiscal years beginning on or after January 1, 2013. We adopted the provisions of this new guidance on July 1, 2013. The adoption of the new provisions did not have a material impact on our financial condition or results of operations.
66
Table of Contents
Recently Issued Accounting Standards
Revenue Recognition: In May 2014, the FASB issued ASU No. 2014-09, “Revenue from Contracts with Customers (Topic 606),” which amends the guidance for revenue recognition to replace numerous, industry-specific requirements and converges areas under this topic with those of the International Financial Reporting Standards. The new guidance implements a five-step process for customer contract revenue recognition that focuses on transfer of control, as opposed to transfer of risk and rewards. The new guidance also requires enhanced disclosures regarding the nature, amount, timing and uncertainty of revenues and cash flows from contracts with customers. Other major provisions include the capitalization and amortization of certain contract costs, ensuring the time value of money is considered in the transaction price, and allowing estimates of variable consideration to be recognized before contingencies are resolved in certain circumstances. The new guidance is effective for fiscal years and interim periods within those years beginning after December 15, 2016. Early adoption is prohibited. We expect to adopt the provisions of this new guidance on July 1, 2017. Entities can transition to the standard either retrospectively or as a cumulative-effect adjustment as of the date of adoption. We are currently assessing the impact the adoption of the new provisions will have on our financial condition and results of operations.
Income Taxes: In July 2013, the FASB issued ASU 2013-11, “Presentation of an Unrecognized Tax Benefit When a Net Operating Loss Carryforward, a Similar Tax Loss, or a Tax Credit Carryforward Exists.” The new guidance requires that unrecognized tax benefits be presented on a net basis with the deferred tax assets for such carryforwards. This new guidance is effective for fiscal years and interim periods within those years beginning after December 15, 2013. We expect to adopt the provisions of this new guidance on July 1, 2014. We do not expect the adoption of the new provisions to have a material impact on our financial condition or results of operations.
Discontinued Operations: In April 2014, the FASB issued ASU 2014-08, “Reporting Discontinued Operations and Disclosures of Disposals of Components of an Entity,” which changes the criteria for determining which disposals can be presented as discontinued operations and modifies disclosure requirements. Under the new guidance, a discontinued operation is defined as a disposal of a component or group of components that is disposed of or is classified as held-for-sale and represents a strategic shift that has or will have a major effect on an entity’s operations and financial results. The standard states that a strategic shift could include a disposal of (i) a major geographical area of operations, (ii) a major line of business, (iii) a major equity method investment, or (iv) other major parts of an entity. The new guidance also requires several new disclosures. This new guidance is effective for fiscal years and interim periods within those years beginning after December 15, 2014. Early adoption is permitted. We expect to adopt the provisions of this new guidance on July 1, 2015. We do not expect the adoption of the new provisions to have a material impact on our financial condition or results of operations.
Note 2—Acquisitions
yurbuds
On June 17, 2014, (the “yurbuds Acquisition Date”), we acquired certain assets and liabilities of Verto Medical Solutions, LLC d/b/a yurbuds and its wholly-owned subsidiary (“yurbuds”), a manufacturer of sports headphones, for a total purchase price of $37.0 million (the “yurbuds Acquisition”), subject to both a net debt and working capital adjustment (the “yurbuds Adjustments”). The final yurbuds Adjustments are to be determined within 120 days of the yurbuds Acquisition Date. There is an aggregate holdback of $3.7 million and a customer contract holdback of $0.8 million (the “yurbuds Holdback Amounts”) which are payable contingent on the outcome of certain events over the next 18 months. The customer contract holdback was paid on June 30, 2014. On the yurbuds Acquisition Date, based on the estimated closing balance sheet, we paid $32.5 million. The yurbuds Acquisition is also subject to an earn-out of a maximum of $38.0 million, based on our expectations of yurbuds gross profit (“yurbuds Gross Profit”), during the period commencing on July 1, 2014 through June 30, 2017. Our preliminary valuation of the contingent consideration is $6.2 million.
67
Table of Contents
The total cost of the yurbuds Acquisition was allocated on a preliminary basis, subject to final allocation, to the assets acquired and liabilities assumed based on their fair values at the yurbuds Acquisition Date, as follows:
| June 17, 2014 | ||||
| Accounts receivable, net |
$ | 9,431 | ||
| Inventories, net |
7,587 | |||
| Other current assets |
486 | |||
|
|
|
|||
| Current assets |
17,504 | |||
|
|
|
|||
| Property, plant and equipment, net |
2,928 | |||
| Goodwill |
30,120 | |||
| Intangibles |
6,400 | |||
|
|
|
|||
| Total assets |
56,952 | |||
|
|
|
|||
| Accounts payable |
9,234 | |||
| Accrued liabilities |
4,420 | |||
|
|
|
|||
| Total current liabilities |
13,654 | |||
|
|
|
|||
| Total liabilities |
13,654 | |||
|
|
|
|||
| Net assets |
$ | 43,298 | ||
|
|
|
|||
Based on our preliminary valuation, goodwill and intangibles were recorded in connection with the yurbuds Acquisition based on third-party valuations and management’s estimates for those acquired intangible assets. The valuation of the acquired net assets is subject to change as we obtain additional information for our estimates during the measurement period. The primary areas of those purchase price allocations that are not yet finalized relate to identifiable intangible assets, contingent consideration and residual goodwill. Goodwill was calculated as the excess of the consideration transferred over the net assets recognized and represents the future economic benefits arising from other assets acquired that could not be individually identified and separately recognized. Of the $30.1 million of goodwill recognized, none is deductible for tax purposes. Intangible assets included a non-amortized indefinite useful life tradename of $3.3 million and customer relationships of $3.1 million with an approximate useful life of seven years. Expenses of $0.5 million were recognized in connection with this acquisition and are included in SG&A in our Consolidated Statement of Income for the fiscal year ended June 30, 2014. The operating results of yurbuds are included in our consolidated financial statements within our Lifestyle segment. Pro forma financial information has not been provided as the yurbuds acquisition is not material to our results of operations.
AMX LLC
On June 13, 2014, (the “AMX Acquisition Date”), we acquired all of the outstanding shares of AMX LLC and AMX Holding Corporation (collectively “AMX”), a provider of enterprise automation and control and audio/video switching and distribution solutions, for a total purchase price of $365.0 million (the “AMX Acquisition”), subject to both a net debt and working capital adjustment (the “AMX Adjustments”). The final AMX Adjustments are to be determined within 60 business days of the AMX Acquisition Date. There is an indemnification holdback of $25.0 million and a working capital holdback of $2.0 million (the “Holdback Amounts”) which are payable contingent on the outcome of certain events over the next 36 months. On the AMX Acquisition Date, based on the estimated closing balance sheet, we paid $372.9 million which included $27.0 million placed in escrow for the Holdback Amounts and $7.9 million related to the AMX Adjustments.
68
Table of Contents
The total cost of the AMX Acquisition was allocated on a preliminary basis, subject to final allocation, to the assets acquired and liabilities assumed based on their fair values at the AMX Acquisition Date, as follows:
| June 13, 2014 | ||||
| Cash and cash equivalents |
$ | 4,351 | ||
| Accounts receivable, net |
27,203 | |||
| Inventories, net |
30,032 | |||
| Other current assets |
4,538 | |||
|
|
|
|||
| Current assets |
66,124 | |||
| Property, plant and equipment, net |
28,499 | |||
| Goodwill |
244,267 | |||
| Intangibles |
100,730 | |||
| Other noncurrent assets |
454 | |||
|
|
|
|||
| Total assets |
440,074 | |||
|
|
|
|||
| Accounts payable |
11,834 | |||
| Accrued liabilities |
9,698 | |||
|
|
|
|||
| Total current liabilities |
21,532 | |||
| Other noncurrent liabilities |
45,601 | |||
|
|
|
|||
| Total liabilities |
67,133 | |||
|
|
|
|||
| Net assets |
$ | 372,941 | ||
|
|
|
|||
Based on our preliminary valuation, goodwill and intangibles were recorded in connection with the AMX Acquisition based on third-party valuations and management’s estimates for those acquired intangible assets. The valuation of the acquired net assets is subject to change as we obtain additional information for our estimates during the measurement period. The primary areas of those purchase price allocations that are not yet finalized relate to identifiable intangible assets and residual goodwill. Goodwill was calculated as the excess of the consideration transferred over the net assets recognized and represents the future economic benefits arising from other assets acquired that could not be individually identified and separately recognized. Of the $244.3 million of goodwill recognized, none is deductible for tax purposes. Intangible assets include a non-amortized indefinite useful life tradename of $55.7 million, customer relationships of $26.5 million with an approximate useful life of two to nine years, technology of $16.9 million with an approximate useful life of five years, backlog of $1.5 million with an approximate useful life of two months, and a covenant not-to-compete of $0.1 million with an approximate useful life of three years. We also recorded adjustments of $4.7 million to Inventories and $3.0 million to Property, plant and equipment, net in our Consolidated Balance Sheet to adjust the opening balances to fair value. The adjustment to Inventories will be amortized over its estimated useful life of four months through Cost of sales in our Consolidated Statement of Income. The adjustment to Property, plant and equipment, net will be amortized over its estimated useful life of five to 35 years through depreciation expense within Cost of sales or SG&A in our Consolidated Statement of Income. Expenses of $8.1 million were recognized in connection with this acquisition and are included in SG&A in our Consolidated Statements of Income for the fiscal year ended June 30, 2014. The operating results of AMX are included in our Professional segment. Pro forma financial information has not been presented as the AMX acquisition is not material to our results of operations.
Duran Audio BV
On October 17, 2013, (the “Duran Acquisition Date”), we acquired all of the outstanding shares of Duran Audio BV (“Duran”), a developer of professional audio products, for a total purchase price of €18.0 million, or approximately $24.4 million (the “Duran Acquisition”), subject to both a net debt and working capital adjustment (the “Duran Adjustments”). On the Duran Acquisition Date, we paid approximately €0.6 million, or approximately $0.8 million, for the estimated net debt adjustment. Subsequently, we finalized the transaction with an additional payment of €0.5 million, or approximately $0.6 million, for the final Duran Adjustments. The Duran Acquisition is subject to a 12 percent indemnification holdback which is payable contingent on the
69
Table of Contents
outcome of certain events over the next 18 months. The Duran Acquisition is also subject to an earn-out of a maximum of €12.0 million, or approximately $16.4 million, based on our expectations of the Duran gross profit (“Duran Gross Profit”), during the period commencing on the Duran Acquisition Date through June 30, 2020. Our preliminary valuation of the contingent consideration is €0.7 million or approximately $0.9 million.
The total cost of the Duran Acquisition, including the fair value of the contingent consideration, was allocated on a preliminary basis, subject to final allocation, to the assets acquired and liabilities assumed based on their fair values at the Duran Acquisition Date, as follows:
| October 17, 2013 | ||||
| Cash and cash equivalents |
$ | 937 | ||
| Accounts receivable |
1,400 | |||
| Inventories |
2,927 | |||
| Other current assets |
122 | |||
|
|
|
|||
| Current assets |
5,386 | |||
| Property, plant and equipment |
656 | |||
| Goodwill |
15,132 | |||
| Intangibles |
8,545 | |||
|
|
|
|||
| Total assets |
29,719 | |||
|
|
|
|||
| Accounts payable |
334 | |||
| Accrued liabilities |
561 | |||
|
|
|
|||
| Total current liabilities |
895 | |||
| Other noncurrent liabilities |
2,136 | |||
|
|
|
|||
| Total liabilities |
3,031 | |||
|
|
|
|||
| Net assets |
$ | 26,688 | ||
|
|
|
|||
Based on our preliminary valuation, goodwill and intangibles were recorded in connection with the Duran Acquisition based on third-party valuations and management’s estimates for those acquired intangible assets. The valuation of the acquired net assets is subject to change as we obtain additional information for our estimates during the measurement period. The primary areas of those purchase price allocations that are not yet finalized relate to identifiable intangible assets, contingent consideration and residual goodwill. Goodwill was calculated as the excess of the consideration transferred over the net assets recognized and represents the future economic benefits arising from other assets acquired that could not be individually identified and separately recognized. Of the $15.1 million of goodwill recognized, none is deductible for tax purposes. Intangible assets include technology of $2.5 million with approximate useful lives ranging from 26.5 months to 38.5 months, product lines of $4.5 million with approximate useful lives ranging from 62.5 months to 86.5 months, customer relationships of $1.5 million with approximate useful lives ranging from 2.5 months to 26.5 months and a trade name of $0.04 million with an approximate useful life of one year. We also recorded an adjustment of $0.6 million to Inventories to adjust the opening balance to fair value. This fair value adjustment will be amortized over 8.5 months through Cost of Sales. Expenses of $0.4 million were recognized in connection with this acquisition and are included in SG&A in our Consolidated Statements of Income for the year ended June 30, 2014. The operating results of Duran are included in our consolidated financial statements within our Professional segment. Pro forma financial information has not been provided as the Duran Acquisition is not material to our results of operations.
Interchain
On July 31, 2012, we entered into an agreement to purchase certain assets and liabilities of Interchain Solutions Private, Limited (the “Interchain Acquisition”), a technology product company that specializes in developing telematics, fleet management, Android® based in-vehicle infotainment and location-based solutions, for a purchase price of 45 million Indian Rupees, or approximately $0.8 million, of which $0.3 million was paid
70
Table of Contents
on July 31, 2012 and $0.5 million was paid on October 13, 2012, which is the date the transaction closed (the “Interchain Acquisition Date”). The Interchain Acquisition is also subject to a 50 million Indian Rupee earn-out, or approximately $0.9 million, which is payable upon the achievement of certain financial targets in the 12 month periods ending September 1, 2013 and September 2, 2014, which we recorded as $0.2 million and $0.3 million in Accrued liabilities in our Consolidated Balance Sheets at June 30, 2014 and 2013, respectively, based upon management’s estimate of its fair value. The total cost of the Interchain Acquisition including the fair value of the earn-out, was allocated to the assets acquired and liabilities assumed based on their fair values at the Interchain Acquisition Date. Goodwill of $0.6 million and intangibles of $0.4 million were recorded in connection with the acquisition. The operating results of the Interchain Acquisition are included in our Infotainment segment. Pro-forma financial information has not been presented as the Interchain Acquisition is not material to our results of operations.
Martin
On February 28, 2013, (the “Martin Acquisition Date”), we acquired all of the issued and outstanding shares of Martin Professional A/S (“Martin”), a leading provider of dynamic lighting solutions for the entertainment, architectural and commercial sectors, for a purchase price of €110.0 million (the “Martin Acquisition”), subject to both an estimated and final (i) net interest bearing debt adjustment and (ii) a working capital adjustment (the “Adjustments”). The final Adjustments were to be calculated within 45 business days of the Martin Acquisition Date. On the Martin Acquisition Date, an initial purchase price of €70.6 million, or $92.8 million, was paid based on the estimated Adjustments as of such date. The purchase price included the assumption of approximately $50.5 million of debt, the majority of which was paid off during the third quarter of fiscal year 2013. The final purchase price was settled as the calculation of the final Adjustments was completed resulting in a $2.0 million reduction to the purchase price.
The total cost of the Martin Acquisition was allocated to the assets acquired and liabilities assumed based on their fair values at the Martin Acquisition Date, as follows:
| February 28, 2013 | ||||
| Cash and cash equivalents |
$ | 2,140 | ||
| Accounts receivable |
25,392 | |||
| Inventories |
41,104 | |||
| Deferred taxes, current, net |
8,016 | |||
| Other current assets |
5,187 | |||
|
|
|
|||
| Current assets |
81,839 | |||
| Property, plant and equipment |
9,421 | |||
| Goodwill |
61,557 | |||
| Investments in unconsolidated subsidiaries |
1,932 | |||
| Intangibles |
36,299 | |||
| Other noncurrent assets |
1,574 | |||
|
|
|
|||
| Total assets |
192,622 | |||
|
|
|
|||
| Current portion of long-term debt |
2,389 | |||
| Short-term debt |
39,061 | |||
| Accounts payable |
11,401 | |||
| Accrued liabilities |
31,052 | |||
| Income taxes payable |
975 | |||
|
|
|
|||
| Total current liabilities |
84,878 | |||
| Deferred tax liabilities, long-term, net |
7,885 | |||
| Long-term debt |
9,080 | |||
|
|
|
|||
| Total liabilities |
101,843 | |||
|
|
|
|||
| Net assets |
$ | 90,779 | ||
|
|
|
|||
71
Table of Contents
Based on our valuation, goodwill and intangibles were recorded in connection with the acquisition based on third-party valuations and management’s estimates for those acquired intangible assets. Goodwill was calculated as the excess of the consideration transferred over the net assets recognized and represents the future economic benefits arising from other assets acquired that could not be individually identified and separately recognized. Of the $61.6 million of goodwill recognized, none is deductible for tax purposes. Intangible assets included a non-amortized indefinite useful life trade name of $20.1 million, customer relationships of $13.2 million with approximate useful lives ranging from six to seven years, backlog of $2.3 million with a useful life of four months and technology of $0.7 million with an approximate useful life of two years. We also recorded adjustments of $3.7 million and $4.5 million to Inventories and Property, plant and equipment, net, respectively, to adjust the opening balances to fair value. These fair value adjustments will be amortized over their estimated lives of 12 months and four years, respectively, through Cost of sales and depreciation expense within Cost of sales and SG&A, respectively. Expenses of $2.3 million were recognized in connection with this acquisition and were included in SG&A in our Consolidated Statement of Income for the fiscal year ended June 30, 2013. The operating results of Martin are included in our Professional segment. Pro-forma financial information has not been presented as the Martin Acquisition is not material to our results of operations.
iOnRoad Technologies, Ltd.
On April 10, 2013 (the “iOnRoad Acquisition Date”), we acquired all of the outstanding shares of iOnRoad Technologies, Ltd. (“iOnRoad”), a developer of vehicle safety systems also know as Advanced Driver Assistance Systems, for a total purchase price of $8.5 million (the “iOnRoad Acquisition”). The iOnRoad Acquisition is subject to a $1.2 million indemnification holdback which is payable contingent upon the timing of certain events, which are expected to occur within two years subsequent to the iOnRoad Acquisition Date. The total cost of the iOnRoad Acquisition was allocated to the assets acquired and liabilities assumed based on their fair values at the iOnRoad Acquisition Date. Goodwill of $2.2 million, an intangible technology asset of $8.7 million with a useful life of five years and a deferred tax liability of $2.2 million were recorded in connection with the acquisition. The operating results of iOnRoad are included in our Infotainment segment. Pro forma financial information has not been presented as the iOnRoad Acquisition is not material to our results of operations.
MWM Acoustics LLC
On July 22, 2011 (the “MWM Acquisition Date”), we and our wholly-owned subsidiary, Harman Holding Limited (“Harman Holding”), entered into an equity securities purchase agreement with a group of sellers (the “MWM Sellers”), to acquire all of the issued and outstanding equity interests of MWM Acoustics LLC and certain related entities (“MWM Acoustics”), a leading provider of high performance embedded acoustic solutions (the “MWM Acquisition”), for a purchase price of $80.0 million (the “Fixed Purchase Price”), plus a working capital adjustment of $0.1 million which was determined and paid within 60 days of the MWM Acquisition Date. On the MWM Acquisition Date, we and Harman Holding paid the MWM Sellers a total of $72.0 million. The remainder of the Fixed Purchase Price of $8.0 million was paid in December 2012. The MWM Acquisition was subject to a $57.0 million earn-out, which was payable contingent upon the achievement of certain financial targets in the fiscal year ended June 30, 2014. Our valuation of the contingent consideration was originally valued at $22.1 million. These targets were not achieved and the earn-out was reduced to zero during the fiscal year ended June 30, 2013 based on revised management estimates. Refer to Note 11—Fair Value Measurements for more information.
72
Table of Contents
The total cost of the MWM Acquisition, including the fair value of the contingent consideration, was allocated to the assets acquired and liabilities assumed based on their fair values at the MWM Acquisition Date, as follows:
| July 22, 2011 | ||||
| Cash and cash equivalents |
$ | 1,465 | ||
| Accounts receivable |
4,434 | |||
| Inventories |
1,062 | |||
| Other current assets |
42 | |||
|
|
|
|||
| Current assets |
7,003 | |||
| Property, plant and equipment |
273 | |||
| Goodwill |
79,757 | |||
| Intangibles |
20,600 | |||
| Other noncurrent assets |
1,091 | |||
|
|
|
|||
| Total assets |
108,724 | |||
|
|
|
|||
| Accounts payable |
5,187 | |||
| Accrued liabilities |
206 | |||
|
|
|
|||
| Total current liabilities |
5,393 | |||
| Other noncurrent liabilities |
1,125 | |||
|
|
|
|||
| Total liabilities |
6,518 | |||
|
|
|
|||
| Net assets |
$ | 102,206 | ||
|
|
|
|||
Goodwill and intangibles were recorded in connection with the acquisition based on third-party valuations and management’s estimates for those acquired intangible assets. Goodwill was calculated as the excess of the consideration transferred over the net assets recognized and represents the future economic benefits arising from other assets acquired that could not be individually identified and separately recognized. Of the $79.8 million of goodwill recognized, approximately $35.6 million is deductible for tax purposes. Intangible assets included customer relationships of $19.2 million with an approximate useful life of 10 years and technology of $1.4 million with an approximate useful life of four years. Expenses of $0.9 million were recognized in connection with this acquisition and are included in SG&A in our Consolidated Statement of Income for the fiscal year ended June 30, 2012. The operating results of MWM Acoustics, now known as Harman Embedded Audio LLC, are included in our Lifestyle segment. Pro forma financial information has not been presented as the MWM Acquisition is not material to our results of operations.
Note 3—Transfer of Ownership of Manufacturing Facility
On April 10, 2013 (the “Schaidt Agreement Date”), Harman Becker Automotive Systems GmbH (“HBAS”), an indirect wholly-owned subsidiary of Harman, entered into an agreement to transfer the ownership of an automotive manufacturing plant in Germany to a third party, Schaidt KG. Schaidt KG will manufacture and supply products for HBAS based on HBAS’s orders. As consideration for the assumption by Schaidt KG of certain of HBAS’s obligations, HBAS has agreed to pay Schaidt KG €41.1 million, or approximately $53.5 million, plus a bonus of €4.0 million, or approximately $5.2 million, if Schaidt KG meets certain supply obligations, as defined in the agreement. We have determined that the transfer of the manufacturing plant assets cannot be accounted for as a sale since Schaidt KG does not have adequate initial or ongoing investment in the manufacturing plant, and because we will maintain a level of continued involvement such that the risks of ownership have not transferred.
During the fiscal year ended June 30, 2014, approximately €3.2 million, or approximately $4.4 million, of previously accrued indemnification payments were made. During the fiscal year ended June 30, 2014, no further expenses were recognized related to our payment obligations that have been made or which are deemed probable
73
Table of Contents
of being made to Schaidt KG to indemnify them for their assumption of certain of our obligations. During the fiscal year ended June 30, 2013, we recognized a €39.9 million, or approximately $51.9 million expense related to the payment obligations that have been made or which are deemed probable of being made to Schaidt KG to indemnify them for their assumption of certain of our obligations. Approximately €16.7 million, or approximately $23.0 million of accrued indemnification payments are expected to be paid over the next two years and are accrued for in Accrued liabilities or Other non-current liabilities in our Consolidated Balance Sheet at June 30, 2014, based on the expected timing. We have revised our estimated useful life of the transferred manufacturing assets to accelerate the depreciation over the expected term of the manufacturing arrangement. Approximately €4.1 million, or $5.6 million and €1.0 million, or $1.3 million, of accelerated depreciation was recorded during the fiscal years ended June 30, 2014 and 2013, respectively. As a result, the manufacturing plant assets will be included in our consolidated financial statements from the Schaidt Agreement Date forward unless future circumstances warrant a change.
Note 4—Inventories
At June 30, 2014 and 2013, inventories consisted of the following:
| June 30, | ||||||||
| 2014 | 2013 | |||||||
| Finished goods |
$ | 273,756 | $ | 234,770 | ||||
| Work in process |
93,586 | 92,640 | ||||||
| Raw materials |
294,786 | 222,421 | ||||||
|
|
|
|
|
|||||
| Inventories |
$ | 662,128 | $ | 549,831 | ||||
|
|
|
|
|
|||||
At June 30, 2014 and 2013 our inventory reserves were $87.7 million and $65.5 million, respectively.
Note 5—Property, Plant & Equipment, net
At June 30, 2014 and 2013, property, plant and equipment, net consisted of the following:
| Estimated Useful Lives (in Years) |
June 30, | |||||||||
| 2014 | 2013 | |||||||||
| Land |
$ | 11,077 | $ | 6,859 | ||||||
| Buildings and improvements |
1-50 | 296,401 | 247,758 | |||||||
| Machinery and equipment |
3-20 | 1,240,750 | 1,113,228 | |||||||
| Furniture and fixtures |
3-10 | 33,414 | 33,175 | |||||||
|
|
|
|
|
|||||||
| Property, plant and equipment, gross |
1,581,642 | 1,401,020 | ||||||||
| Less accumulated depreciation and amortization |
(1,071,786 | ) | (975,838 | ) | ||||||
|
|
|
|
|
|||||||
| Property, plant and equipment, net |
$ | 509,856 | $ | 425,182 | ||||||
|
|
|
|
|
|||||||
Depreciation expense for the fiscal years ended June 30, 2014, 2013 and 2012 was $119.1 million, $115.6 million and $110.1 million, respectively.
74
Table of Contents
Note 6—Accrued Warranties
At June 30, 2014 and 2013, details of our accrued warranties consisted of the following:
| June 30, | ||||||||
| 2014 | 2013 | |||||||
| Accrued warranties, beginning of year |
$ | 128,411 | $ | 97,289 | ||||
| Warranty expense |
75,445 | 69,404 | ||||||
| Warranty payments (cash or in-kind) |
(57,447 | ) | (43,570 | ) | ||||
| Other(1) |
9,063 | 5,288 | ||||||
|
|
|
|
|
|||||
| Accrued warranties, end of year |
$ | 155,472 | $ | 128,411 | ||||
|
|
|
|
|
|||||
| (1) | Other primarily represents foreign currency translation and an adjustment for the addition of accrued warranties related to the Martin Acquisition, the AMX Acquisition and the yurbuds Acquisition. |
Note 7—Earnings Per Share
We apply the two-class method when computing earnings per share, which requires that net income per share for each class of shares entitled to dividends be calculated assuming all of our net income is distributed as dividends to these shareholders based on their contractual rights.
The following table presents the calculation of basic and diluted earnings per share of common stock outstanding:
| Year Ended June 30, | ||||||||||||||||||||||||
| 2014 | 2013 | 2012 | ||||||||||||||||||||||
| Basic | Diluted | Basic | Diluted | Basic | Diluted | |||||||||||||||||||
| Numerator for Basic and Diluted Earnings per Share: |
||||||||||||||||||||||||
| Net income |
$ | 234,579 | $ | 234,579 | $ | 142,407 | $ | 142,407 | $ | 329,541 | $ | 329,541 | ||||||||||||
| Net loss attributable to noncontrolling interest |
(113 | ) | (113 | ) | 0 | 0 | 0 | 0 | ||||||||||||||||
|
|
|
|
|
|
|
|
|
|
|
|
|
|||||||||||||
| Net income attributable to Harman International Industries, Incorporated |
$ | 234,692 | $ | 234,692 | $ | 142,407 | $ | 142,407 | $ | 329,541 | $ | 329,541 | ||||||||||||
|
|
|
|
|
|
|
|
|
|
|
|
|
|||||||||||||
| Denominator for Basic and Diluted Earnings per Share: |
||||||||||||||||||||||||
| Weighted average shares outstanding |
69,073 | 69,073 | 68,990 | 68,990 | 71,297 | 71,297 | ||||||||||||||||||
| Employee stock options |
0 | 816 | 0 | 746 | 0 | 786 | ||||||||||||||||||
|
|
|
|
|
|
|
|
|
|
|
|
|
|||||||||||||
| Total weighted average shares outstanding |
69,073 | 69,889 | 68,990 | 69,736 | 71,297 | 72,083 | ||||||||||||||||||
|
|
|
|
|
|
|
|
|
|
|
|
|
|||||||||||||
| Earnings per Share: |
||||||||||||||||||||||||
| Earnings per share |
$ | 3.40 | $ | 3.36 | $ | 2.06 | $ | 2.04 | $ | 4.62 | $ | 4.57 | ||||||||||||
|
|
|
|
|
|
|
|
|
|
|
|
|
|||||||||||||
Unvested share-based payment awards that contain non-forfeitable rights to dividends or dividend equivalents (whether paid or unpaid) are considered participating securities, as defined under GAAP, and are included in the computation of earnings per share pursuant to the two-class method.
Certain options were outstanding and not included in the computation of diluted net earnings per share because the assumed exercise of these options would have been antidilutive. Options to purchase 314,635, 1,258,680 and 1,685,144 shares of our common stock for the fiscal year ended June 30, 2014, 2013 and 2012, respectively, were outstanding and not included in the computation of diluted earnings per share because the exercise of these options would have been antidilutive. In addition, 0, 0 and 3,000 restricted shares and restricted
75
Table of Contents
stock units for the fiscal year ended June 30, 2014, 2013 and 2012 were outstanding, respectively, and were excluded from the computation of diluted earnings per share as they also would have been antidilutive.
In October 2012, we repaid the Convertible Senior Notes, and therefore the Convertible Senior Notes had no impact on our calculation of earnings per share for the fiscal years ended June 30, 2014 and 2013. For the fiscal year ended June 30, 2012, the conversion terms of the Convertible Senior Notes would have affected the calculation of diluted earnings per share if the price of our common stock exceeded the conversion price of the Convertible Senior Notes. The initial conversion price of the Convertible Senior Notes was approximately $104 per share, subject to adjustment in specified circumstances as described in the indenture governing the Convertible Senior Notes, as amended (the “Indenture”). Upon conversion, a holder of the Convertible Senior Notes would have received an amount in cash per $1,000 principal amount of Convertible Senior Notes equal to the lesser of $1,000 or the conversion value of the Convertible Senior Notes, determined in the manner set forth in the Indenture. If the conversion value exceeded $1,000, we would have delivered $1,000 in cash and, at our option, cash or common stock or a combination of cash and common stock for the conversion price in excess of $1,000. The conversion option would not have resulted in an adjustment to net income in calculating diluted earnings per share. The dilutive effect of the conversion option was calculated using the treasury stock method. Therefore, conversion settlement shares would have been included in diluted shares outstanding if the price of our common stock exceeded the conversion price of the Convertible Senior Notes. Refer to Note 9—Debt for more information.
Note 8—Goodwill and Intangible Assets, Net
Goodwill
In September 2011, we adopted ASU 2011-08, under which an entity may first assess qualitative factors in determining whether it is “more likely than not” that the fair value of a reporting unit is less than its carrying amount as a basis for determining whether it is necessary to perform the two-step goodwill impairment test. Adoption of this guidance had no impact on our financial condition or results of operations as no events came to our attention indicating that the fair values of our reporting units might be less than their carrying values. In fiscal years 2014 and 2013, we did not elect to first assess the qualitative factors in evaluating our goodwill for impairment; therefore, we proceeded with our quantitative goodwill impairment test.
We test for impairment at the reporting unit level on an annual basis as of April 30th of every year and between annual tests if an event occurs or circumstances change that would more likely than not reduce the fair value of the reporting unit below its carrying value. Refer to Note 1—Summary of Significant Accounting Policies for more information on how we test goodwill for impairment. The annual goodwill impairment tests conducted as of April 30, 2014 and 2013 indicated that the fair value of each reporting unit was substantially in excess of its carrying value and, as such, no impairments were deemed to exist. Our accumulated amount of goodwill impairment recorded in prior fiscal years is $330.0 million.
Goodwill was $541.0 million at June 30, 2014 compared with $234.3 million at June 30, 2013. The increase in goodwill in the fiscal year ended June 30, 2014 versus the prior fiscal year was primarily related to goodwill associated with the following: $244.3 million in conjunction with the acquisition of AMX, $30.1 million in conjunction with the acquisition of yurbuds, $15.1 million in connection with the acquisition of Duran, $8.1 million with regard to innovative Systems GmbH (“IS”), $4.9 million in connection with the acquisition of Martin and $0.1 million in connection with the acquisition of iOnRoad.
Goodwill was $234.3 million at June 30, 2013 compared with $180.8 million at June 30, 2012. The increase in goodwill in the fiscal year ended June 30, 2013 versus the prior fiscal year was primarily related to goodwill associated with the following: $56.7 million in connection with the acquisition of Martin, $2.0 million in connection with the acquisition of iOnRoad and $0.6 million in connection with the acquisition of Interchain offset to a certain extent by foreign currency translation.
76
Table of Contents
The contingent purchase price associated with the acquisition of IS is calculated pursuant to the terms of an agreement between the parties. Certain terms of the agreement are currently subject to a dispute between the parties and the matter has been submitted to arbitration. On November 5, 2013, the arbitration panel reached a partial judgment on some of the disputed matters covering the period from February 2009 through January 2012 awarding €16.3 million to the IS sellers. We contested the enforcement of the partial award. During the fiscal year ended June 30, 2014, we recorded approximately $8.1 million of additional contingent purchase price to accrue for this partial award. In July 2014, the partial award was upheld. Until such time as the other disputed matters are resolved, we cannot calculate the contingent purchase price related to these other disputed matters.
The changes in the carrying amount of goodwill by business segment for the fiscal years ended June 30, 2014 and 2013 were as follows:
| Infotainment | Lifestyle | Professional | Total | |||||||||||||
| Balance, June 30, 2012 |
$ | 5,856 | $ | 109,945 | $ | 65,010 | $ | 180,811 | ||||||||
| Acquisitions and adjustments(1) |
2,618 | 12 | 56,650 | 59,280 | ||||||||||||
| Other adjustments(2) |
102 | (2,519 | ) | (3,332 | ) | (5,749 | ) | |||||||||
|
|
|
|
|
|
|
|
|
|||||||||
| Balance, June 30, 2013 |
$ | 8,576 | $ | 107,438 | $ | 118,328 | $ | 234,342 | ||||||||
| Acquisitions and adjustments(1) |
143 | 30,118 | 264,308 | 294,569 | ||||||||||||
| Contingent purchase price consideration associated with the acquisition of IS |
8,052 | 0 | 0 | 8,052 | ||||||||||||
| Other adjustments(2) |
309 | 394 | 3,286 | 3,989 | ||||||||||||
|
|
|
|
|
|
|
|
|
|||||||||
| Balance, June 30, 2014 |
$ | 17,080 | $ | 137,950 | $ | 385,922 | $ | 540,952 | ||||||||
|
|
|
|
|
|
|
|
|
|||||||||
| (1) | Refer to Note 2—Acquisitions for more information. |
| (2) | The other adjustments to goodwill primarily consist of foreign currency translation adjustments. |
Intangible Assets, Net
Net intangible assets were $182.0 million and $60.1 million at June 30, 2014 and 2013, respectively and were comprised of the following:
| June 30, 2014 | June 30, 2013 | |||||||||||||||||||||||||||
| Weighted Average Amortization |
Gross Carrying Amount |
Accumulated Amortization |
Net Amount |
Gross Carrying Amount |
Accumulated Amortization |
Net Amount |
||||||||||||||||||||||
| Customer relationships |
3 Years | $ | 67,277 | $ | (17,770 | ) | $ | 49,507 | $ | 36,169 | $ | (12,047 | ) | $ | 24,122 | |||||||||||||
| Technology |
3 Years | 39,331 | (8,196 | ) | 31,135 | 14,712 | (4,517 | ) | 10,195 | |||||||||||||||||||
| Patents |
11Years | 11,418 | (7,166 | ) | 4,252 | 7,711 | (6,661 | ) | 1,050 | |||||||||||||||||||
| Tradenames (1) |
5 Years | 88,266 | (7,489 | ) | 80,777 | 29,226 | (6,186 | ) | 23,040 | |||||||||||||||||||
| Non-compete agreement |
3 Years | 2,212 | (2,016 | ) | 196 | 2,082 | (1,932 | ) | 150 | |||||||||||||||||||
| Software |
4 Years | 11,813 | (431 | ) | 11,382 | 0 | 0 | 0 | ||||||||||||||||||||
| Other |
8 Years | 7,463 | (2,682 | ) | 4,781 | 5,173 | (3,615 | ) | 1,558 | |||||||||||||||||||
|
|
|
|
|
|
|
|
|
|
|
|
|
|
|
|||||||||||||||
| Total |
$ | 227,780 | $ | (45,750 | ) | $ | 182,030 | $ | 95,073 | $ | (34,958 | ) | $ | 60,115 | ||||||||||||||
|
|
|
|
|
|
|
|
|
|
|
|
|
|||||||||||||||||
| (1) | Includes $55.7 million, $20.1 million and $3.1 million of indefinite-lived intangible assets related to the acquisition of AMX, Martin and yurbuds, respectively. |
Amortization expense related to intangible assets was $13.2 million, $12.6 million, and $12.2 million for the fiscal years ended June 30, 2014, 2013 and 2012, respectively.
77
Table of Contents
Amortization expense is expected to approximate the following:
| 2015 |
$ | 25,607 | ||
| 2016 |
22,236 | |||
| 2017 |
15,223 | |||
| 2018 |
12,165 | |||
| 2019 |
8,871 | |||
| Thereafter |
19,112 | |||
|
|
|
|||
| Total |
$ | 103,214 | ||
|
|
|
Note 9—Debt
Short Term Borrowings
At June 30, 2014 and 2013, we had $3.7 million and $4.9 million of short-term borrowings outstanding, respectively. At June 30, 2014, we maintained lines of credit of $64.6 million primarily in India, China, Hungary, Brazil and Denmark. At June 30, 2013, we maintained lines of credit of $55.7 million primarily in Denmark, Hungary, the U.S., Austria, Brazil and India.
We classify our debt based on the contractual maturity dates of the underlying debt instruments. We defer costs associated with debt issuance over the applicable term of the debt. These costs are amortized to Interest expense, net in our Consolidated Statements of Income.
New Credit Agreement
On October 10, 2012, we and our wholly-owned subsidiary Harman Holding GmbH & Co. KG (“Harman KG”), entered into a Multi-Currency Credit Agreement (the “New Credit Agreement”) with a group of banks. The New Credit Agreement provides for (i) a five-year unsecured multi-currency revolving credit facility (the “New Revolving Credit Facility”) in the amount of $750.0 million (the “Aggregate Revolving Commitment”) with availability in currencies other than the United States Dollar of up to $550.0 million and (ii) a five-year unsecured United States Dollar term loan facility (the “Term Facility” and collectively with the New Revolving Credit Facility, the “Facilities”) in the amount of $300.0 million (the “Aggregate Term Commitment” and collectively with the Aggregate Revolving Commitment, the “Aggregate Commitment”). Up to $60.0 million of the Aggregate Revolving Commitment is available for letters of credit. Subject to certain conditions set forth in the New Credit Agreement, the Aggregate Commitment may be increased by up to $250.0 million. We may select interest rates for the Facilities equal to (i) LIBOR plus an applicable margin or (ii) a base rate plus an applicable margin, which in each case is determined based on our credit rating. We pay a facility fee on the Aggregate Revolving Commitment, whether drawn or undrawn, which is determined based on our credit rating. Any proceeds from borrowings under the Facilities may be used for general corporate purposes.
The New Credit Agreement includes certain financial condition covenants, including covenants that do not permit us to allow (i) our ratio of consolidated EBITDA to consolidated cash interest expense to be less than 3.5:1.0 or (ii) our ratio of consolidated total debt to consolidated EBITDA to exceed 3.5:1.0, or following certain acquisitions, 4.0:1.0, each calculated as of the end of the applicable fiscal quarter on a rolling four-quarter basis. The terms “consolidated EBITDA,” “consolidated cash interest expense,” and “consolidated total debt” are defined in the New Credit Agreement.
The New Credit Agreement also contains certain negative covenants that limit, among other things, our ability to pay dividends, permit certain of our subsidiaries to incur debt, incur liens, make fundamental changes, sell assets, undertake transactions with affiliates or undertake sale and leaseback transactions. The Facilities are subject to acceleration upon certain specified events of default, including failure to make timely payments, breaches of representations or covenants or a change of control, as such term is defined in the New Credit Agreement.
78
Table of Contents
On October 10, 2012, in connection with the execution of the New Credit Agreement, we, Harman KG, and certain of our subsidiaries, entered into a guarantee agreement (the “New Guarantee Agreement”), that provides that the obligations under the New Credit Agreement are guaranteed by us and each of the subsidiary guarantors named therein.
Upon the signing of the New Credit Agreement, we voluntarily terminated the Multi-Currency Credit Agreement, entered into on December 1, 2010, as amended on December 15, 2011 and July 2, 2012 (the “Credit Agreement”), as well as the guarantee and collateral agreement entered into in connection with the Credit Agreement. There were no outstanding borrowings under the Credit Agreement as of October 10, 2012, and no early termination penalties were incurred by us as a result of the termination of the Credit Agreement. All of the approximately $8.7 million of letters of credit that were previously outstanding under the Credit Agreement were deemed to be issued and outstanding under the New Credit Agreement.
On October 10, 2012, we borrowed $300.0 million under the Term Facility to finance, in part, the repayment of all the outstanding $400.0 million principal amount of Convertible Senior Notes and accrued and unpaid interest thereon. In June 2014, we borrowed $300.0 million under the New Revolving Credit Facility to partially finance our acquisitions of AMX and yurbuds. Refer to Note 2—Acquisitions for more information.
At June 30, 2014, there was $300.0 million of outstanding borrowings and approximately $4.6 million of outstanding letters of credit under the New Revolving Credit Facility and $255.0 million of outstanding borrowings under the Term Facility, of which $35.6 million is included in our Consolidated Balance Sheet as Current portion of long-term debt and $219.4 million is classified as Long-term debt. At June 30, 2014, unused available credit under the New Revolving Credit Facility was $445.4 million. In connection with the New Credit Agreement, we incurred $6.1 million of fees and other expenses which are included within Other assets in our Consolidated Balance Sheet at June 30, 2014. These costs will be amortized over the term of the New Credit Agreement to Interest expense, net in our Consolidated Statements of Income on a straight-line basis. In addition, during the year ended June 30, 2013, we wrote off $1.1 million of debt issuance costs, to Interest expense, net, associated with the Credit Agreement, which represented the portion of these costs that were attributed to the Credit Agreement.
Convertible Senior Notes
On October 15, 2012, the maturity date for the Convertible Senior Notes, we repaid all of the outstanding $400.0 million principal amount of Convertible Senior Notes and accrued and unpaid interest thereon held by affiliates of Kohlberg Kravis Roberts & Co. and Goldman Sachs Capital Partners and other investors. The repayment of principal was funded by $300.0 million of borrowings under the Term Facility and $100.0 million of cash on hand.
Long-Term Debt and Current Portion of Long-Term-Debt
At June 30, 2014 and 2013, long-term debt and current portion of long-term debt consisted of the following:
| Fair Value at June 30, 2014 |
Book Value at June 30, 2014 |
Fair Value at June 30, 2013 |
Book Value at June 30, 2013 |
|||||||||||||
| Borrowings under revolving credit facility |
$ | 300,000 | $ | 300,000 | $ | 0 | $ | 0 | ||||||||
| Term facility |
255,000 | 255,000 | 285,000 | 285,000 | ||||||||||||
| Other obligations |
32 | 32 | 43 | 43 | ||||||||||||
|
|
|
|
|
|
|
|
|
|||||||||
| Total debt |
555,032 | 555,032 | 285,043 | 285,043 | ||||||||||||
| Less: current portion of long-term debt |
(35,625 | ) | (35,625 | ) | (30,000 | ) | (30,000 | ) | ||||||||
|
|
|
|
|
|
|
|
|
|||||||||
| Total long-term debt |
$ | 519,407 | $ | 519,407 | $ | 255,043 | $ | 255,043 | ||||||||
|
|
|
|
|
|
|
|
|
|||||||||
79
Table of Contents
At June 30, 2014, long-term debt maturing in each of the next five fiscal years and thereafter is as follows:
| 2015 |
$ | 35,625 | ||
| 2016 |
43,157 | |||
| 2017 |
135,000 | |||
| 2018 |
341,250 | |||
| 2019 |
0 | |||
| Thereafter |
0 | |||
|
|
|
|||
| Total |
$ | 555,032 | ||
|
|
|
If we do not meet the forecast in our budgets, we could violate our debt covenants and, absent a waiver from our lenders or an amendment to the New Credit Agreement, we could be in default under the New Credit Agreement. As a result, our debt under the New Credit Agreement could become due, which would have a material adverse effect on our financial condition and results of operations. As of June 30, 2014, we were in compliance with all the financial covenants of the New Credit Agreement.
Interest expense is reported net of interest income in our Consolidated Statements of Income. Interest expense, net was $8.0 million, $12.9 million and $20.1 million for the fiscal years ended June 30, 2014, 2013 and 2012, respectively. Gross interest expense was $10.1 million, $15.3 million and $27.0 million for the fiscal years ended June 30, 2014, 2013 and 2012, respectively. The non-cash portion of interest expense was $2.2 million, $8.5 million and $19.1 million for the fiscal years ended June 30, 2014, 2013 and 2012, respectively. The cash portion of gross interest expense was $7.9 million, $6.8 million and $7.9 million for the fiscal years ended June 30, 2014, 2013 and 2012, respectively. Interest income was $2.1 million, $2.4 million and $6.9 million for the fiscal years ended June 30, 2014, 2013 and 2012, respectively.
Non-cash interest expense for the fiscal year ended June 30, 2014 relates to the amortization of debt issuance costs on the New Credit Agreement. Non-cash interest expense for the fiscal year ended June 30, 2013 relates to the amortization of debt issuance costs on the New Credit Agreement, amortization of the debt discount and debt issuance costs on the Convertible Senior Notes and amortization of debt issuance costs on the Credit Agreement. Non-cash interest expense for the fiscal year ended June 30, 2012 relates to amortization of the debt discount and debt issuance costs on the Convertible Senior Notes and amortization of debt issuance costs on the Credit Agreement.
Cash interest expense in the fiscal year ended June 30, 2014 primarily relates to interest on the New Credit Agreement and our short-term borrowings. Cash interest expense in the fiscal year ended June 30, 2013 primarily relates to interest on the New Credit Agreement, the Convertible Senior Notes, the Credit Agreement and our short-term borrowings. Cash interest expense in the fiscal year ended June 30, 2012 primarily relates to interest on the Convertible Senior Notes, the Credit Agreement and our short-term borrowings.
Interest income primarily relates to interest earned on our cash and cash equivalents, short-term investment balances and the variances from year to year are due to fluctuations in those balances and changes in interest rates.
Cash paid for interest, net of cash received was $6.5 million, $6.8 million and $3.1 million in the fiscal years ended June 30, 2014, 2013 and 2012, respectively.
Note 10—Derivatives
We are exposed to market risk from changes in foreign currency exchange rates and interest rates, which could affect our operating results, financial condition and cash flows. We manage our exposure to these risks through our regular operating and financial activities and, when appropriate, through the use of derivative financial instruments. These derivative instruments are utilized to hedge economic exposures, as well as to reduce earnings and cash flow volatility resulting from shifts in market rates. We enter into limited types of derivative contracts, including foreign currency spot and forward and as well as interest rate swap contracts, to manage foreign currency
80
Table of Contents
and interest rate exposures. Our primary foreign currency exposure is the Euro. The fair market values of all our derivative contracts change with fluctuations in interest rates and currency rates and are designed so that any changes in their values are offset by changes in the values of the underlying exposures. Derivative financial instruments are held solely as risk management tools and not for trading or speculative purposes.
We record all derivative instruments as either assets or liabilities at fair value in our Consolidated Balance Sheets. Certain of these derivative contracts have been designated as cash flow hedges, whereby gains and losses are reported within AOCI in our Consolidated Balance Sheets, until the underlying transaction occurs, at which point they are reported in earnings as gains and losses in our Consolidated Statements of Income. Certain of our derivatives, for which hedge accounting is not applied, are effective as economic hedges. These derivative contracts are required to be recognized each period at fair value, with gains and losses reported in earnings in our Consolidated Statements of Income and therefore do result in some level of earnings volatility. The level of volatility will vary with the type and amount of derivative hedges outstanding, as well as fluctuations in the currency and interest rate markets during the period. The related cash flow impacts of all our derivative activities are reflected as cash flows from operating activities.
Derivatives, by their nature, involve varying degrees of market and credit risk. The market risk associated with these instruments resulting from currency exchange and interest rate movements is expected to offset the market risk of the underlying transactions, assets and liabilities being hedged. We do not believe there is significant risk of loss in the event of non-performance by the counterparties associated with these instruments, because these transactions are executed with a diversified group of major financial institutions. Furthermore, our policy is to contract only with counterparties having a minimum investment grade or better credit rating. Credit risk is managed through the continuous monitoring of exposure to such counterparties.
Foreign Exchange Risk Management
We use foreign exchange contracts to hedge the price risk associated with foreign denominated forecasted purchases of materials used in our manufacturing process and to manage currency risk associated with operating costs in certain operating units, including foreign currency denominated intercompany loans and other foreign currency denominated assets. These contracts generally mature within two to five years. The majority of these contracts are designated as cash flow hedges.
At June 30, 2014 and 2013, we had outstanding foreign exchange contracts, primarily forward contracts, which are summarized below:
| June 30, 2014 | June 30, 2013 | |||||||||||||||
| Gross Notional Value |
Fair Value Asset/ (Liability)(1) |
Gross Notional Value |
Fair Value Asset/ (Liability)(1) |
|||||||||||||
| Currency Hedged (Buy/Sell): |
||||||||||||||||
| U.S. Dollar/Euro |
$ | 1,558,950 | $ | (21,418 | ) | $ | 540,264 | $ | 13,900 | |||||||
| Euro/U.S. Dollar |
214,781 | 1,077 | 191,978 | (304 | ) | |||||||||||
| U.S. Dollar/Indian Rupee |
35,000 | (583 | ) | 0 | 0 | |||||||||||
| Euro/Russian Rubles |
8,828 | (141 | ) | 0 | 0 | |||||||||||
| Euro/Brazilian Real |
8,490 | (123 | ) | 0 | 0 | |||||||||||
| U.S. Dollar/Brazilian Real |
5,052 | (95 | ) | 0 | 0 | |||||||||||
| Swiss Franc/U.S. Dollar |
0 | 0 | 40,214 | (596 | ) | |||||||||||
| British Pound/Swiss Franc |
0 | 0 | 12,778 | 91 | ||||||||||||
| Japanese Yen/Euro |
0 | 0 | 16,341 | (55 | ) | |||||||||||
| British Pound/U.S. Dollar |
0 | 0 | 9,128 | (164 | ) | |||||||||||
|
|
|
|
|
|
|
|
|
|||||||||
| Total |
$ | 1,831,101 | $ | (21,283 | ) | $ | 810,703 | $ | 12,872 | |||||||
|
|
|
|
|
|
|
|
|
|||||||||
| (1) | Represents the net receivable/(payable) included in our Consolidated Balance Sheets. |
81
Table of Contents
Cash Flow Hedges
We designate a portion of our foreign exchange contracts as cash flow hedges of foreign currency denominated purchases. As of June 30, 2014 and June 30, 2013, we had $1,467.7 million and $479.8 million of forward contracts maturing through June 2018 and June 2014, respectively. These contracts are recorded at fair value in the accompanying Consolidated Balance Sheets. During the fiscal year ended June 30, 2014, we changed our election to now include forward points in our effectiveness assessment. Prior to this change, the changes in fair value for these contracts were calculated on a spot to spot rate basis. Effective September 30, 2013, the changes in fair value for these contracts are calculated on a forward to forward rate basis. These changes in fair value are reported in AOCI and are reclassified to either Cost of sales or SG&A, depending on the nature of the underlying asset or liability that is being hedged, in our Consolidated Statements of Income, in the period or periods during which the underlying transaction occurs.
Changes in the fair value of the derivatives are highly effective in offsetting changes in the cash flows of the hedged items because the amounts and the maturities of the derivatives approximate those of the forecasted exposures. Any ineffective portion of the derivative is recognized in the current period in our Consolidated Statements of Income, in the same line item in which the foreign currency gain or loss on the underlying hedged transaction was recorded. We recognized $2.0 million of ineffectiveness in our Consolidated Statement of Income in the fiscal year ended June 30, 2014 and less than $0.1 million of ineffectiveness in our Consolidated Statements of Income for each of the fiscal years ended June 30, 2013 and 2012. Prior to September 30, 2013, all components of each derivative’s gain or loss, with the exception of forward points (see below), were included in the assessment of hedge ineffectiveness. Effective September 30, 2013, we changed our election and now include forward points in our effectiveness assessment. At June 30, 2014 and 2013, the fair values of these contracts were a net liability of $19.9 million and a net asset of $11.6 million, respectively. The amount associated with these hedges that is expected to be reclassified from AOCI to earnings within the next 12 months is a loss of $6.9 million.
Prior to September 30, 2013 we elected to exclude forward points from the effectiveness assessment. At the end of the reporting period, we calculated the excluded amount, which is the fair value relating to the change in forward points that is recorded in current earnings as Foreign exchange losses, net in our Consolidated Statements of Income. For the fiscal years ended June 30, 2014, 2013 and 2012, we recognized $0.6 million of net gains, $2.7 million of net gains, and $4.3 million in net losses related to the change in forward points, respectively.
Effective July 1, 2011, we changed the functional currency of two of our foreign subsidiaries to the U.S. Dollar to reflect a change in the currency in which such subsidiaries primarily generate and expend cash. In addition, we recognized approximately $1.4 million as Foreign exchange losses, net in our Consolidated Statements of Income for the fiscal year ended June 30, 2012, due to the revaluation of certain derivative instruments held at these subsidiaries because we did not meet the requisite documentation requirements to attain hedge accounting treatment. As of January 1, 2012, the documentation was amended to achieve hedge accounting treatment going forward.
Economic Hedges
When hedge accounting is not applied to derivative contracts, or after former cash flow hedges have been de-designated as balance sheet hedges, we recognize the gain or loss on the associated contracts directly in current period earnings in our Consolidated Statements of Income as either Foreign exchange losses, net or Cost of sales according to the underlying exposure. As of June 30, 2014 and 2013, we had $363.4 million and $330.9 million, respectively, of forward contracts maturing through December 2014 and October 2013, respectively, in various currencies to hedge foreign currency denominated intercompany loans and other foreign currency denominated assets. At June 30, 2014 and 2013, the fair values of these contracts were net liabilities of $1.4 million and net assets of $1.2 million, respectively. Adjustments to the carrying value of the foreign
82
Table of Contents
currency forward contracts offset the gains and losses on the underlying loans and other foreign denominated assets in Foreign exchange losses, net in our Consolidated Statements of Income.
Interest Rate Risk Management
We had one interest rate swap contract which matured on September 30, 2013 with a notional amount of $19.7 million at June 30, 2013, in order to manage our interest rate exposure and effectively convert interest on an operating lease from a variable rate to a fixed rate. The objective of the swap was to offset changes in rent expenses caused by interest rate fluctuations. The interest rate swap contract was designated as a cash flow hedge. At the end of each reporting period, the discounted fair value of the swap contract was calculated and recorded in AOCI and reclassified to rent expense, within SG&A in our Consolidated Statements of Income, in the then current period. If the hedge was determined to be ineffective, the ineffective portion would have been reclassified from AOCI and recorded as rent expense, within SG&A. We recognized an immaterial amount of ineffectiveness in our Consolidated Statements of Income in each of the fiscal years ended June 30, 2014, 2013 and 2012. All components of the derivative were included in the assessment of the hedges’ effectiveness.
Fair Value of Derivatives
The following tables provide a summary of the fair value amounts of our derivative instruments as of June 30, 2014 and 2013:
| Fair Value | ||||||||||
| Balance Sheet Location | June 30, 2014 |
June 30, 2013 |
||||||||
| Derivatives Designated as Cash Flow Hedges, Gross: |
||||||||||
| Other assets: |
||||||||||
| Foreign exchange contracts |
Other current assets | $ | 1,141 | $ | 11,812 | |||||
| Other liabilities: |
||||||||||
| Foreign exchange contracts |
Accrued liabilities | $ | 20,997 | $ | 169 | |||||
| Interest rate swap |
Accrued liabilities | $ | 0 | $ | 320 | |||||
|
|
|
|
|
|||||||
| Total liabilities |
$ | 20,997 | $ | 489 | ||||||
|
|
|
|
|
|||||||
| Net (liability)/asset for derivatives designated as hedging instruments |
$ | (19,856 | ) | $ | 11,323 | |||||
|
|
|
|
|
|||||||
| Derivatives Designated as Economic Hedges, Gross: |
||||||||||
| Other assets: |
||||||||||
| Foreign exchange contracts |
Other current assets | $ | 1,094 | $ | 3,069 | |||||
| Other liabilities: |
||||||||||
| Foreign exchange contracts |
Accrued liabilities | $ | 2,521 | $ | 1,840 | |||||
|
|
|
|
|
|||||||
| Net (liability)/asset for economic hedges: |
$ | (1,427 | ) | $ | 1,229 | |||||
|
|
|
|
|
|||||||
| Total net derivative (liability)/asset |
$ | (21,283 | ) | $ | 12,552 | |||||
|
|
|
|
|
|||||||
83
Table of Contents
Derivative Activity:
The following tables show derivative activity for derivatives designated as cash flow hedges for the years ended June 30, 2014, 2013 and 2012:
| Derivative |
Location of Derivative Gain/(Loss) Recognized in Income |
Gain/(Loss) Reclassified from AOCI into Income (Effective Portion) |
Gain/(Loss) Recognized in Income on Derivatives (Ineffective Portion) |
Gain/(Loss) from Amounts Excluded from Effectiveness Testing |
||||||||||||||||||||||||||||||||||
| Year Ended June 30, | ||||||||||||||||||||||||||||||||||||||
| 2014 | 2013 | 2012 | 2014 | 2013 | 2012 | 2014 | 2013 | 2012 | ||||||||||||||||||||||||||||||
| Foreign exchange contracts |
Cost of sales | $ | (8,980 | ) | $ | 25,798 | $ | 10,932 | $ | (2,048 | ) | $ | 0 | $ | 0 | $ | 0 | $ | 0 | $ | 2 | |||||||||||||||||
| Foreign exchange contracts |
SG&A | (206 | ) | 833 | 586 | 0 | 0 | 0 | 0 | 0 | 0 | |||||||||||||||||||||||||||
| Foreign exchange contracts |
Foreign exchange losses, net |
0 | 0 | 0 | 0 | 0 | 0 | 588 | 2,721 | (4,258 | ) | |||||||||||||||||||||||||||
| Interest rate swap |
SG&A | (192 | ) | (766 | ) | (624 | ) | (1 | ) | (4 | ) | (7 | ) | 0 | 0 | 0 | ||||||||||||||||||||||
|
|
|
|
|
|
|
|
|
|
|
|
|
|
|
|
|
|
|
|||||||||||||||||||||
| Total cash flow hedges |
$ | (9,378 | ) | $ | 25,865 | $ | 10,894 | $ | (2,049 | ) | $ | (4 | ) | $ | (7 | ) | $ | 588 | $ | 2,721 | $ | (4,256 | ) | |||||||||||||||
|
|
|
|
|
|
|
|
|
|
|
|
|
|
|
|
|
|
|
|||||||||||||||||||||
| Derivative |
Gain/(Loss) Recognized in AOCI (Effective Portion) |
|||||||||||
| Year Ended June 30, | ||||||||||||
| 2014 | 2013 | 2012 | ||||||||||
| Foreign exchange contracts |
$ | (37,714 | ) | $ | (1,089 | ) | $ | 79,819 | ||||
| Interest rate swap |
35 | (76 | ) | (449 | ) | |||||||
|
|
|
|
|
|
|
|||||||
| Total cash flow hedges |
$ | (37,679 | ) | $ | (1,165 | ) | $ | 79,370 | ||||
|
|
|
|
|
|
|
|||||||
The following table summarizes gains and losses from our derivative instruments that are not designated as hedging instruments for the years ended June 30, 2014, 2013 and 2012:
| Derivative |
Location of Derivative Gain/(Loss) |
Year Ended June 30, | ||||||||||||
| 2014 | 2013 | 2012 | ||||||||||||
| Foreign exchange contracts |
Cost of sales | $ | (5,536 | ) | $ | (3,927 | ) | $ | 8,499 | |||||
| Foreign exchange contracts |
Foreign exchange losses, net | $ | 10,882 | $ | 963 | $ | (7,560 | ) | ||||||
Note 11—Fair Value Measurements
Pursuant to the accounting guidance for fair value instruments, fair value is defined as the price we would receive to sell an asset or pay to transfer a liability in an orderly transaction with a market participant at the measurement date. When determining the fair value measurements for assets and liabilities, we consider the principal or most advantageous market in which the asset or liability would transact in and we consider assumptions that market participants would use when pricing the asset or liability.
Fair Value Hierarchy
Under fair value accounting guidance, there is a three-tier fair value hierarchy to prioritize the inputs used in measuring fair value. Observable inputs reflect market data obtained from independent sources, while unobservable inputs reflect our market assumptions.
84
Table of Contents
The hierarchy gives the highest priority to quoted prices in active markets (Level 1) and the lowest priority to unobservable inputs (Level 3). The three levels are defined as follows:
| Level 1: |
Observable inputs, such as unadjusted quoted market prices in active markets for the identical asset or liability. | |
| Level 2: |
Inputs that are observable for the asset or liability, either directly or indirectly through market corroboration, for substantially the full term of the financial instrument. | |
| Level 3: |
Unobservable inputs that reflect the entity’s own assumptions in measuring the asset or liability at fair value. | |
Assets and Liabilities Measured at Fair Value on a Recurring Basis
For assets and liabilities measured at fair value on a recurring basis, fair value is the price we would receive to sell an asset or pay to transfer a liability in an orderly transaction with a market participant at the measurement date. In the absence of active markets for the identical assets and liabilities, such measurements involve developing assumptions based on market observable data, and in the absence of such data, internal information that is consistent with what market participants would use in a hypothetical transaction that occurs at the measurement date.
The following table provides the fair value hierarchy for assets and liabilities measured on a recurring basis.
| Fair Value at June 30, 2014 | Fair Value at June 30, 2013 | |||||||||||||||||||||||
| Description |
Level 1 | Level 2 | Level 3 | Level 1 | Level 2 | Level 3 | ||||||||||||||||||
| Assets/(Liabilities) |
||||||||||||||||||||||||
| Short-term investments |
$ | 0 | $ | 0 | $ | 0 | $ | 10,008 | $ | 0 | $ | 0 | ||||||||||||
| Available-for-sale securities |
2,472 | 0 | 0 | 2,149 | 0 | 0 | ||||||||||||||||||
| Foreign exchange contracts |
0 | (21,283 | ) | 0 | 0 | 12,872 | 0 | |||||||||||||||||
| Interest rate swap |
0 | 0 | 0 | 0 | (320 | ) | 0 | |||||||||||||||||
| Pension assets |
6,641 | 0 | 0 | 6,801 | 0 | 0 | ||||||||||||||||||
| Contingent consideration |
0 | 0 | (7,328 | ) | 0 | 0 | (288 | ) | ||||||||||||||||
|
|
|
|
|
|
|
|
|
|
|
|
|
|||||||||||||
| Net asset/(liability) |
$ | 9,113 | $ | (21,283 | ) | $ | (7,328 | ) | $ | 18,958 | $ | 12,552 | $ | (288 | ) | |||||||||
|
|
|
|
|
|
|
|
|
|
|
|
|
|||||||||||||
| Total Gains (Losses) for the Year Ended June 30, |
||||||||||||
| Description |
2014 | 2013 | 2012 | |||||||||
| (Loss) gain on contingent consideration |
$ | (73 | ) | $ | 22,100 | $ | 0 | |||||
| Loss on available-for-sale securities |
0 | (5,933 | ) | 0 | ||||||||
The following describes the valuation methodologies we use to measure assets and liabilities accounted for at fair value on a recurring basis:
Short-Term Investments and Available-for-Sale Securities: Short-term investments and available-for-sale securities are classified as Level 1 as the fair value was determined from market quotes obtained from financial institutions in active markets.
Foreign Exchange Contracts: We use foreign exchange contracts to hedge market risks relating to possible adverse changes in foreign currency exchange rates. Our foreign exchange contracts were measured at fair value using Level 2 inputs. Such inputs include foreign currency exchange spot and forward rates for similar transactions in actively quoted markets.
85
Table of Contents
Interest Rate Swap: We use an interest rate swap to hedge market risk relating to possible adverse changes in interest rates which matured on September 30, 2013. We elected to use the income approach to value our interest rate swap contract, which uses observable Level 2 inputs at the measurement date and standard valuation techniques to convert future amounts to a single present amount (discounted). Level 2 inputs for the swap contract valuation are limited to quoted prices for similar assets or liabilities in active markets (specifically futures contracts on LIBOR, for the first two years) and inputs other than quoted prices that are observable for the asset or liability (specifically LIBOR cash and swap rates) at commonly quoted intervals, and credit risk. These key inputs, including the LIBOR cash rates for very short-term, futures rates for up to two years, and LIBOR swap rates beyond the derivative maturity are used to construct the swap yield curve and discount the future cash flows to present value at the measurement date. If the interest rate swap contract is a derivative asset, a credit default swap basis available at commonly quoted intervals can be collected from Bloomberg and applied to all cash flows. If the interest rate swap contract is a derivative liability, we are required to reflect potential credit risk to lenders using a borrowing rate specific to our Company. Refer to Note 10—Derivatives, for more information regarding our derivative financial instruments.
Pension Assets: Our pension assets have been valued using Level 1 inputs as quoted prices in an active market exist for these assets. Refer to Note 17—Retirement Benefits for more information.
Contingent Consideration: A portion of our contingent consideration is associated with an earn-out related to our acquisition of yurbuds. We use a discounted cash flow approach (a form of the income approach) in determining the fair value of the contingent consideration. The principal inputs to the approach include our expectations of yurbuds Gross Profit, through June 30, 2017 and a discount rate that begins with our weighted average cost of capital and adjusts for the risks associated with the underlying yurbuds Gross Profit outcome, the functional form of the payout and our credit risk associated with making the payment.
A portion of our contingent consideration is associated with an earn-out related to our acquisition of Duran. We use a probability-weighted discounted cash flow approach (a form of the income approach) in determining the fair value of the contingent consideration. The principal inputs to the approach include our expectations of Duran Gross Profit related to the sale of certain specified products through June 30, 2020 and a discount rate that begins with our weighted average cost of capital and adjusts for the risks associated with the underlying Duran Gross Profit outcome, the functional form of the payout and our credit risk associated with making the payment.
We also have contingent consideration associated with an earn-out related to the acquisition of substantially all of the assets of Interchain. We calculate the contingent consideration based on the probability of actual revenue performance. During the fiscal year ended June 30, 2013, we revised our estimate of the contingent consideration liability related to the acquisition of MWM Acoustics and reduced the liability by $22.1 million to a balance of zero, which was recognized within SG&A in our Consolidated Statements of Income. At June 30, 2014, we prepared our final calculation of the contingent consideration liability and confirmed our expectation that none of the earn-out was achieved.
Given the use of significant inputs that are not observable in the market, our contingent consideration is classified within Level 3 of the fair value hierarchy. Refer to Note 2—Acquisitions for more information.
Assets and Liabilities Measured at Fair Value on a Non-Recurring Basis
Certain assets are measured at fair value on a non-recurring basis. These assets are not measured at fair value on an ongoing basis but are subject to fair value adjustments only in certain circumstances. These assets can include loans and long-lived assets that have been reduced to fair value when they are held for sale, impaired loans that have been reduced based on the fair value of the underlying collateral, cost and equity method investments and long-lived assets that are written down to fair value when they are impaired and the remeasurement of retained investments in formerly consolidated subsidiaries upon a change in control that results in deconsolidation of a subsidiary if we sell a controlling interest and retain a noncontrolling stake in the entity.
86
Table of Contents
Assets that are written down to fair value when impaired and retained investments are not subsequently adjusted to fair value unless further impairment occurs.
The following table provides the carrying value for assets and liabilities measured on a non-recurring basis, all of which are measured under Level 3 of the fair value hierarchy, and the losses recorded during the periods presented.
| Total Losses for the Year Ended, June 30, |
||||||||||||||||||||
| Description of Assets |
June 30, 2014 | June 30, 2013 | 2014 | 2013 | 2012 | |||||||||||||||
| Equity method investments |
$ | 3,578 | $ | 1,660 | $ | 0 | $ | 0 | $ | 0 | ||||||||||
| Goodwill |
540,952 | 234,342 | 0 | 0 | 0 | |||||||||||||||
| Long-lived assets |
691,887 | 485,296 | (687 | ) | (658 | ) | (565 | ) | ||||||||||||
|
|
|
|
|
|
|
|
|
|
|
|||||||||||
| Total |
$ | 1,236,417 | $ | 721,298 | $ | (687 | ) | $ | (658 | ) | $ | (565 | ) | |||||||
|
|
|
|
|
|
|
|
|
|
|
|||||||||||
The following describes the valuation methodologies we use to measure financial and non-financial instruments accounted for at fair value on a non-recurring basis.
Equity Method Investments: Equity method investments are generally valued using a discounted cash flow model, comparative market multiples or a combination of both approaches as appropriate. These investments are generally included in Level 3.
Goodwill: Goodwill is evaluated for impairment annually or more frequently if an event or circumstance indicates that an impairment loss may have been incurred. This asset is included in Level 3. Refer to Note 8— Goodwill and Intangible Assets, Net for more information.
Long-lived Assets: Long-lived assets include Property, plant and equipment, net and intangible assets, and are valued using the best information available, including quoted market prices or market prices for similar assets when available or internal cash flow estimates discounted at an appropriate interest rate or independent appraisals, as appropriate. For real estate, cash flow estimates are based on current market estimates that reflect current and projected lease profiles and available industry information about expected trends in rental, occupancy and capitalization rates. These assets are generally included in Level 3.
Note 12—Leases
At June 30, 2014, we are obligated for the following minimum lease commitments under terms of our operating lease agreements:
| Operating Leases |
||||
| 2015 |
$ | 30,882 | ||
| 2016 |
29,993 | |||
| 2017 |
21,911 | |||
| 2018 |
20,372 | |||
| 2019 |
17,033 | |||
| Thereafter |
41,985 | |||
|
|
|
|||
| Total minimum lease payments |
162,176 | |||
|
|
|
|||
Operating lease expense was $51.2 million, $49.3 million and $40.5 million for each of the fiscal years ended June 30, 2014, 2013 and 2012, respectively.
87
Table of Contents
Note 13—Income Taxes
Income before income taxes for the fiscal years ended June 30, 2014, 2013 and 2012 were as follows:
| Year Ended June 30, | ||||||||||||
| 2014 | 2013 | 2012 | ||||||||||
| Domestic income |
$ | 129,653 | $ | 110,136 | $ | 63,411 | ||||||
| Foreign income |
177,742 | 64,134 | 197,742 | |||||||||
|
|
|
|
|
|
|
|||||||
| Income before income taxes |
$ | 307,395 | $ | 174,270 | $ | 261,153 | ||||||
|
|
|
|
|
|
|
|||||||
Income tax expense (benefit), net for the fiscal years ended June 30, 2014, 2013 and 2012 consisted of the following:
| Year Ended June 30, | ||||||||||||
| 2014 | 2013 | 2012 | ||||||||||
| Current: |
||||||||||||
| Federal |
$ | 13,927 | $ | 6,416 | $ | 1,679 | ||||||
| State |
2,703 | 2,315 | 1,061 | |||||||||
| Foreign |
24,940 | 15,415 | 28,178 | |||||||||
|
|
|
|
|
|
|
|||||||
| Current income tax expense, net |
41,570 | 24,146 | 30,918 | |||||||||
| Deferred: |
||||||||||||
| Federal |
36,371 | 23,186 | (105,823 | ) | ||||||||
| State |
1,581 | (11,703 | ) | (8,553 | ) | |||||||
| Foreign |
(6,912 | ) | (3,900 | ) | 15,070 | |||||||
|
|
|
|
|
|
|
|||||||
| Deferred income tax expense (benefit), net |
31,040 | 7,583 | (99,306 | ) | ||||||||
|
|
|
|
|
|
|
|||||||
| Income tax expense (benefit), net |
$ | 72,610 | $ | 31,729 | $ | (68,388 | ) | |||||
|
|
|
|
|
|
|
|||||||
Cash paid for Federal, state and foreign income taxes were $28.0 million, $24.3 million and $24.3 million during the fiscal years ended June 30, 2014, 2013 and 2012, respectively.
The tax provisions and analysis of effective income tax rates for the fiscal years ended June 30, 2014, 2013 and 2012 consisted of the following:
| Year Ended June 30, | ||||||||||||
| 2014 | 2013 | 2012 | ||||||||||
| Provision for Federal income taxes before credits at statutory rate |
$ | 107,588 | $ | 60,995 | $ | 91,404 | ||||||
| State income taxes |
2,785 | 986 | 2,124 | |||||||||
| Difference between Federal statutory rate and foreign effective rate |
(43,020 | ) | (33,209 | ) | (22,240 | ) | ||||||
| Expenses not deductible for tax purposes and other |
5,236 | 4,000 | 12,444 | |||||||||
| Tax benefit from U.S. production activities |
(3,263 | ) | (3,879 | ) | (3,704 | ) | ||||||
| Change in valuation allowance |
(1,263 | ) | 2,874 | (124,211 | ) | |||||||
| Change in uncertain tax positions |
9,189 | 5,035 | (1,937 | ) | ||||||||
| Difference between Federal and financial tax accounting for equity compensation |
2,169 | 2,053 | 896 | |||||||||
| Federal income tax credits |
(5,515 | ) | (7,592 | ) | (22,144 | ) | ||||||
| Other |
(1,296 | ) | 466 | (1,020 | ) | |||||||
|
|
|
|
|
|
|
|||||||
| Income tax expense (benefit), net |
$ | 72,610 | $ | 31,729 | $ | (68,388 | ) | |||||
|
|
|
|
|
|
|
|||||||
88
Table of Contents
Deferred taxes are recorded based upon differences between the financial statement basis and tax basis of assets and liabilities and available tax loss and credit carryforwards. At June 30, 2014 and 2013, deferred taxes consisted of the following:
| June 30, | ||||||||
| Assets/(Liabilities) |
2014 | 2013 | ||||||
| Federal and state tax credits |
$ | 90,176 | $ | 112,937 | ||||
| Deferred interest and loss carryforwards |
74,845 | 77,522 | ||||||
| Inventory costing differences |
13,935 | 10,076 | ||||||
| Capitalized research and development |
91,644 | 106,935 | ||||||
| Fixed assets |
0 | 9,261 | ||||||
| Amortization of share-based compensation |
13,525 | 15,440 | ||||||
| Pension liability and other |
46,934 | 42,795 | ||||||
| Financial instruments |
4,688 | 0 | ||||||
| Reserves and other |
54,507 | 35,814 | ||||||
|
|
|
|
|
|||||
| Deferred tax assets, gross |
390,254 | 410,780 | ||||||
| Less valuation allowance |
(65,462 | ) | (63,947 | ) | ||||
|
|
|
|
|
|||||
| Deferred tax assets, net of valuation allowance |
324,792 | 346,833 | ||||||
| Fixed assets |
(2,140 | ) | 0 | |||||
| Intangible assets |
(51,922 | ) | (6,843 | ) | ||||
| Financial instruments |
0 | (2,965 | ) | |||||
|
|
|
|
|
|||||
| Deferred tax liability, gross |
(54,062 | ) | (9,808 | ) | ||||
|
|
|
|
|
|||||
| Net deferred tax asset |
$ | 270,730 | $ | 337,025 | ||||
|
|
|
|
|
|||||
The above amounts are classified as current or long-term in the Consolidated Balance Sheets in accordance with the asset or liability to which they relate or, when applicable, based on the expected timing of the reversal. The net current deferred tax assets of $120.0 million and $91.0 million are recorded in Other current assets in the Consolidated Balance Sheets at June 30, 2014 and 2013, respectively. The net current deferred tax liabilities of $1.0 million and $1.9 million are recorded in Other current liabilities in the Consolidated Balance Sheets at June 30, 2014 and 2013, respectively. A net non-current deferred tax liability of $18.8 million and $12.8 million is recorded in Other non-current liabilities in the Consolidated Balance Sheets at June 30, 2014 and 2013, respectively.
The deferred tax assets for the respective periods were assessed for recoverability and, where applicable, a valuation allowance was recorded to reduce the total deferred tax asset to an amount that will, more likely than not, be realized in the future. The net total valuation allowance for the fiscal year ended June 30, 2014 was $65.5 million. At June 30, 2014, the valuation allowance is comprised of $19.7 million recorded against deferred tax assets for foreign deferred interest; $7.0 million recorded against state deferred tax assets and $38.8 million recorded against foreign loss carryforwards. At June 30, 2013, the valuation allowance is comprised of $18.8 million recorded against deferred tax assets for foreign deferred interest; $7.2 million recorded against state deferred tax assets and $37.9 million recorded against foreign loss carryforwards.
During fiscal year 2014 there was a net increase of $1.5 million in the total valuation allowance. We recognized a non-cash tax benefit of $(1.3) million on the Consolidated Statements of Income and $2.8 million was recorded to cumulative translation adjustment within other comprehensive income on the Consolidated Balance Sheet. We have reflected this non-cash tax benefit in the tax provision which has increased net income for fiscal year 2014. If future operating and business conditions were to differ significantly, we would reassess the ability to realize the net deferred tax assets. If it were to become more likely than not that we would not be able to realize the deferred tax assets, then all or a portion of the valuation allowance may need to be re-established, which would result in a charge to tax expense.
89
Table of Contents
In assessing the recoverability of deferred tax assets, we regularly consider whether some portion or all of the deferred tax assets will not be realized based on the recognition threshold and measurement of a tax position. The ultimate realization of deferred tax assets is dependent upon the generation of future taxable income during the periods in which those temporary differences become deductible. We consider the scheduled reversal of deferred tax liabilities, projected future taxable income, tax planning strategies and, if applicable, the expiration of loss carryforwards and credits in making this assessment.
Although realization is not assured, we have concluded that it is more likely than not that the deferred tax assets for which a valuation allowance was determined to be unnecessary, will be realized in the ordinary course of operations based on the available positive and negative evidence including the utilization of taxable temporary differences, projected income from operations and tax planning strategies that could be implemented, if necessary, to prevent a carryforward from expiring. The amount of the net deferred tax assets considered realizable, however, could be reduced in the future if projected income is lower than estimated, or if there are differences in the timing or amount of future reversals of existing taxable or deductible temporary differences.
As of June 30, 2014, the deferred tax assets for tax credit carryforwards are comprised of U.S. foreign tax credits in the amount of $32.5 million with an expiration period between 2016 through 2024; Alternative minimum tax credits of $1.4 million with no expiration and U.S. Federal and state research and experimentation credits in the amount of $41.2 million and $15.1 million, respectively. The U.S. Federal research and experimentation credits expire between 2026 through 2034. Of the state research and experimentation credits, $5.1 million expire between 2015 through 2028 and $10.0 million have no expiration period.
As of June 30, 2014, the deferred tax asset for deferred interest and loss carryforwards are comprised of foreign deferred interest carryforwards of $32.3 million with no expiration period; foreign net operating loss carryforward of $41.4 million with no expiration period and U.S. Federal and state net operating loss carryforwards of $1.1 million with an expiration period of 2014 through 2030.
As of June 30, 2014, we have approximately $894.7 million of unremitted foreign earnings. U.S. deferred taxes have not been provided on all of these earnings because they are intended to be permanently reinvested. Such earnings would be subject to U.S. taxation if repatriated to the U.S. The determination of the amount of unrecognized deferred tax liability associated with the permanently reinvested cumulative undistributed earnings is not practicable.
Our operations are subject to ongoing tax examinations in various jurisdictions. Significant judgment is required in determining our annual tax expense and in evaluating our tax positions. Accordingly, we have established reserves to remove some or all of the tax benefit of any of our tax positions at the time we determine that the positions become uncertain based upon one of the following: (1) the tax position is not more likely than not to be sustained, (2) the tax position is more likely than not to be sustained, but for a lesser amount, or (3) the tax position is more likely than not to be sustained, but not in the financial period in which the tax position was originally taken. For purposes of evaluating whether or not a tax position is uncertain, (1) we presume the tax position will be examined by the relevant taxing authority that has full knowledge of all relevant information, (2) the technical merits of a tax position are derived from authorities such as legislation and statutes, regulations, rulings and case law, and (3) each tax position is evaluated without consideration of the possibility of offset or aggregation with other tax positions taken. We adjust these reserves, including an impact on the related interest and penalties, in light of changing facts and circumstances, such as the progress of a tax audit.
90
Table of Contents
Changes in the total amount of gross unrecognized tax benefits, including penalties, are as follows:
| 2014 | 2013 | |||||||
| Balance, beginning of year |
$ | 35,206 | $ | 34,200 | ||||
| Increases based on tax positions related to the current year |
2,103 | 2,718 | ||||||
| Decreases based on tax positions related to the current year |
(515 | ) | (233 | ) | ||||
| Increases identified during the current year related to prior years |
13,182 | 1,884 | ||||||
| Decreases identified during the current year related to prior years |
(5,445 | ) | 0 | |||||
| Reclassification |
0 | (772 | ) | |||||
| Decreases related to settlement with taxing authorities |
0 | (1,687 | ) | |||||
| Reductions to unrecognized benefits as a result of a lapse of the applicable statute of limitations |
(330 | ) | (430 | ) | ||||
| Foreign currency translation |
8 | (474 | ) | |||||
|
|
|
|
|
|||||
| Balance, end of year |
$ | 44,209 | $ | 35,206 | ||||
|
|
|
|
|
|||||
The unrecognized tax benefits at June 30, 2014 are permanent in nature and, if recognized, would reduce our effective tax rate. We periodically reevaluate the recognition and measurement threshold of our uncertain tax positions based on new or additional evidence such as tax authority administrative pronouncements, rulings and court decisions. The ultimate settlement however, may be materially different from the amount accrued. Our significant jurisdictions are Germany, Brazil, Austria and the U.S. The tax years currently under examination by the German revenue authorities are fiscal years 2005 through 2010. The tax year currently under examination by the Brazilian tax authorities is fiscal year 2008. Austria is not under examination for any tax year. The tax years currently under examination by the United States Internal Revenue Service (“IRS”) are fiscal years 2006, 2007 and 2012. We have received some proposed changes by the German revenue authorities and the IRS. Although the final resolution of the proposed adjustments is uncertain, we believe that the ultimate disposition of these matters will not have a material adverse effect on our consolidated financial position, results of operations and cash flows. While we expect the amount of unrecognized tax benefits to change, we are unable to quantify the change at this time.
Of our unrecognized tax benefits, $14.7 million is included in Other non-current liabilities; $4.3 million is included in Income taxes payable and $25.2 million has reduced our Deferred tax assets, long-term, in our Consolidated Balance Sheet at June 30, 2014.
We recognize interest related to unrecognized tax benefits in Income tax expense (benefit) in our Consolidated Statements of Income. As of June 30, 2014, the amount accrued for interest is $2.3 million.
Note 14—Shareholders’ Equity and Share-Based Compensation
Preferred Stock
As of June 30, 2014 and 2013, we had no shares of preferred stock outstanding. We are authorized to issue 5 million shares of preferred stock, $0.01 par value.
Common Stock
We have 200 million authorized shares of common stock, $0.01 par value. At June 30, 2014 and 2013, we had 98,408,042 and 97,044,572 shares issued; 30,319,785 and 28,992,092 shares in treasury stock and 68,088,257 and 68,052,480 shares outstanding (net of treasury stock), respectively.
91
Table of Contents
Share Buyback Program
On October 26, 2011, our Board of Directors authorized the repurchase of up to $200 million of our common stock under the Buyback Program. The Buyback Program allowed us to purchase shares of our common stock in accordance with applicable securities laws on the open market, or through privately negotiated transactions. We entered into an agreement with an external broker that provided the structure under which the program was facilitated, which expired on October 25, 2012. The Buyback Program was set to expire on October 26, 2012, but on October 23, 2012 our Board of Directors approved an extension of the Buyback Program through October 25, 2013. On June 19, 2013 we entered into a new agreement with an external broker which expired on October 25, 2013 (the “10b5-1 Plan”). On June 26, 2013, our Board of Directors authorized the repurchase of up to an additional $200 million of our common stock under the New Buyback Program which expired on June 26, 2014. On August 26, 2013 we amended the 10b5-1 Plan to incorporate both board authorizations up until each of their respective expiration dates (the “Amended 10b5-1 Plan”). The Amended 10b5-1 Plan expired on June 25, 2014. During the fiscal year ended June 30, 2014, we repurchased 1,327,693 shares at a cost of $90.8 million for a total cumulative buyback of 4,719,968 shares at a cost of $220.1 million under the Buyback Program and the New Buyback Program.
The Buyback Program and the New Buyback Program have expired and therefore no additional shares may be repurchased under such programs. We will determine the timing and the amount of any future buyback programs based on an evaluation of market conditions, share price and other factors.
Share-Based Compensation
On June 30, 2014 we had one share-based plan with shares available for future grants, the 2012 Stock Option and Incentive Plan (the “2012 Plan”), which is described below. The compensation expense for share-based compensation was $28.6 million, $17.6 million and $17.4 million for the fiscal years ended June 30, 2014, 2013 and 2012, respectively. The total income tax benefit recognized in our Consolidated Statements of Income for share-based compensation arrangements was $6.6 million, $4.1 million and $5.6 million for the fiscal years ended June 30, 2014, 2013 and 2012, respectively. Share-based compensation was higher for the fiscal year ended June 30, 2014 compared to the prior fiscal year due to an increase in expense related to performance awards. Share-based compensation expense was flat for the year ended June 30, 2013 compared to the prior fiscal year.
2012 Plan
On December 7, 2011 (the “Effective Date”), our shareholders approved the 2012 Stock Option and Incentive Plan (the “2012 Plan”), which is effective through December 7, 2021. As of the Effective Date, no further grants may be granted under our former plan, the Amended and Restated 2002 Stock Option and Incentive Plan, as amended (the “2002 Plan” and together with the 2012 Plan, the “Plans”). On December 4, 2013, we amended the 2012 Plan to (i) increase the number of shares available under the 2012 Plan for the grant of future awards by 2,869,821 shares to an aggregate amount not to exceed 7,269,821 shares of our common stock and (ii) modified certain share counting provisions related to the definition of a full-value grant from 1.71 to 1.5 (“Full-Value Grant”). The 2012 Plan provides for two types of awards: (i) a Full-Value Grant under which one award shall reduce the shares available for grant under the 2012 Plan by 1.71 shares if granted prior to December 4, 2013 or 1.5 shares if granted on or after December 4, 2013, and (ii) an option or stock appreciation right grant, under which one award shall reduce the shares available for grant under the 2012 Plan by one share. Shares may be issued as original issuances, treasury shares or a combination of both. Option awards are granted with an exercise price equal to the market price of our stock on the date of the grant. The option awards generally vest over three to five years of continuous service commencing one year from the date of the grant and expire after ten years. During the fiscal year ended June 30, 2014, 455,626 options to purchase shares of our common stock, 459,140 stock-settled restricted stock units, 613 cash-settled restricted stock units and 5,515 cash-settled stock appreciation rights were granted under the 2012 Plan. As of June 30, 2014, there were 4,542,735 shares available for grant under the 2012 Plan.
92
Table of Contents
2002 Plan
Prior to the Effective Date, we had one share-based compensation plan with shares available for grants, the 2002 Plan. On December 8, 2010, we amended the 2002 Plan to increase the number of shares available under the 2002 Plan for the grant of stock options, stock appreciation rights, restricted stock and restricted stock units by 1,100,000 to an aggregate amount not to exceed 7,860,000 shares of our common stock. Under the 2002 Plan, shares were permitted to be issued as original issuances, treasury shares or a combination of both. Option awards were granted with an exercise price equal to the market price of our stock on the date of the grant. The option awards granted under the 2002 Plan generally vest over three to five years of continuous service commencing one year from the date of the grant and expire after ten years. During the fiscal year ended June 30, 2014, there were no options to purchase shares of our common stock or restricted stock units granted under the 2002 Plan. At June 30, 2014, there were no shares available for grant under the 2002 Plan.
Restricted Stock Awards
A grant of restricted stock involves the immediate transfer of ownership of a specified number of shares of common stock with a “substantial risk of forfeiture” for a period of at least three years. A participant who receives a restricted stock grant is immediately entitled to voting, dividend and certain other share ownership rights associated with the underlying shares of common stock. At June 30, 2014, no shares of restricted stock were outstanding.
Restricted Stock Units
A grant of restricted stock units involves an agreement by our Company to deliver a specified number of shares of common stock or cash to the participant when the award vests. A participant has no ownership or voting rights associated with the underlying shares of common stock. Our Board of Directors may, at its discretion, authorize the payment of dividend equivalents on the restricted stock units. At June 30, 2014, a total of 1,546,557 restricted stock units were outstanding, all of which were granted under the Plans.
Stock Appreciation Rights
Stock appreciation rights allow the holders to receive 100 percent of the spread between the option price and the fair market value of the shares on the date of exercise. The performance period will not be less than three years. We granted 5,515 and 7,281 stock appreciation rights in fiscal years 2014 and 2013, respectively, under the 2012 Plan. At June 30, 2014, a total of 12,517 stock appreciation rights were outstanding.
Fair Value Determination
The fair value of each option award is estimated on the date of grant using the Black-Scholes option valuation model, which uses the assumptions noted in the following table.
| Year Ended June 30, | ||||||||||||
| 2014 | 2013 | 2012 | ||||||||||
| Expected volatility |
32.7—55.4 | % | 41.8—60.3 | % | 48.8—66.2 | % | ||||||
| Weighted-average volatility |
45.8 | % | 50.0 | % | 59.1 | % | ||||||
| Expected annual dividend |
$ | 1.20 | $ | 0.60 | $ | 0.30 | ||||||
| Expected term (in years) |
2.05—4.66 | 2.32—6.25 | 1.70—5.54 | |||||||||
| Risk-free rate |
0.3—1.8 | % | 0.2—1.0 | % | 0.2—1.0 | % | ||||||
Groups of option holders (directors, executives and non-executives) that have similar historical behavior are considered separately for valuation purposes. Expected volatilities are based on historical closing prices of our common stock over the expected option term.
93
Table of Contents
We use historical data to estimate option exercises and employee terminations within the valuation model. The expected term of options granted is derived using the option valuation model and represents the estimated period of time from the date of grant that the option is expected to remain outstanding. The risk-free rate for periods within the contractual life of the option is based on the U.S. Treasury yield curve in effect at the time of grant. The expected annual dividend was applicable for grants in fiscal years 2014, 2013 and 2012, as dividends were declared in all quarters of fiscal years 2014, 2013 and 2012.
Stock Option Activity
A summary of option activity under our Plans as of and for the fiscal year ended June 30, 2014 is presented below:
| Shares | Weighted Average Exercise Price Per Share |
Weighted Average Remaining Contractual Term (Years) |
Aggregate Intrinsic Value |
|||||||||||||
| Outstanding at June 30, 2013 |
2,124,032 | 57.67 | 6.29 | $ | 21,077 | |||||||||||
| Granted |
455,626 | 66.92 | ||||||||||||||
| Exercised |
(1,030,452 | ) | 50.10 | |||||||||||||
| Forfeited or expired |
(129,608 | ) | 60.10 | |||||||||||||
|
|
|
|||||||||||||||
| Outstanding at June 30, 2014 |
1,419,598 | 65.90 | 6.70 | $ | 62,204 | |||||||||||
|
|
|
|
|
|
|
|
|
|||||||||
| Exercisable at June 30, 2014 |
554,972 | $ | 83.10 | 4.04 | $ | 16,749 | ||||||||||
|
|
|
|
|
|
|
|
|
|||||||||
The weighted-average grant-date fair value of options granted during the fiscal years ended June 30, 2014, 2013 and 2012 was $20.80, $15.87 and $14.30, respectively. The total intrinsic value of options exercised during the fiscal years ended June 30, 2014, 2013 and 2012 was $33.7 million, $8.9 million and $7.0 million, respectively.
Modification of Certain Stock Option Awards
Prior to fiscal year 2011, certain of the award agreements under the 2002 Plan stated that vested options not exercised were forfeited upon termination of employment for any reason other than death or disability. However, such award agreements provided that the Compensation and Option Committee of our Board of Directors (the “Compensation and Option Committee”) could extend the time period to exercise vested options 90 days beyond the employment termination date for certain employees. During each of the fiscal years ended June 30, 2014, 2013 and 2012, the Compensation and Option Committee used this authority. This action represented a modification of the terms or conditions of an equity award and therefore was accounted for as an exchange of the original award for a new award. Incremental share-based compensation cost for the excess of the fair value of the new award over the fair value of the original award was immaterial.
Restricted Stock Units
In the fiscal year ended June 30, 2014, we granted 130,616 restricted stock units with earnings per share (“EPS”) performance conditions, and 130,641 restricted stock units with market conditions under the 2012 Plan. Additionally, both the restricted stock units with EPS performance conditions and the restricted stock units with market conditions, secondarily vest based on the achievement of a return on invested capital (“ROIC”) performance condition, specifically, the achievement of a certain average ROIC level over fiscal years 2014 through 2016. The restricted stock units with EPS performance conditions cliff vest three years from the date of grant based on the achievement of certain cumulative EPS levels from fiscal years 2014 through 2016. The restricted stock units with market conditions cliff vest three years from the date of grant based on a comparison of our total shareholder return (“TSR”) to the TSR of a selected peer group of publicly listed multinational
94
Table of Contents
companies. The grant date fair value of the restricted stock units with market conditions of $6.0 million was calculated using a Monte Carlo simulation model. Compensation expense is recognized ratably over the three-year vesting period based on the grant date fair value and our assessment of the probability that the applicable targets will be met for the performance conditions, which is reassessed each reporting period.
In the fiscal year ended June 30, 2013, we granted 97,733 restricted stock units with EPS performance conditions, 97,733 restricted stock units with ROIC performance conditions and 97,733 restricted stock units with market conditions, under the 2012 Plan. The restricted stock units with EPS performance conditions cliff vest three years from the date of grant based on the achievement of certain cumulative EPS levels from fiscal years 2013 through 2015. The restricted stock units with ROIC conditions cliff vest three years from the date of grant based on the achievement of a certain average ROIC level over fiscal years 2013 through 2015. The restricted stock units with market conditions cliff vest three years from the date of grant based on a comparison of our TSR to the TSR of a selected peer group of publicly listed multinational companies. The grant date fair value of the restricted stock units with market conditions of $3.7 million was calculated using a Monte Carlo simulation model. Compensation expense, for both the restricted stock units with performance conditions and the restricted stock units with market conditions, is recognized ratably over the three-year vesting period based on the grant date fair value and our assessment of the probability that the applicable targets will be met for awards with performance conditions, which is reassessed each reporting period.
In the fiscal year ended June 30, 2012, we granted 118,546 restricted stock units with EPS performance conditions, 118,546 restricted stock units with ROIC performance conditions and 118,546 restricted stock units with market conditions, under the 2002 Plan. The restricted stock units with EPS performance conditions cliff vest three years from the date of grant based on the achievement of certain cumulative EPS levels from fiscal years 2012 through 2014. The restricted stock units with ROIC conditions cliff vest three years from the date of grant based on the achievement of a certain ROIC level in fiscal year 2014. The restricted stock units with market conditions cliff vest three years from the date of grant based on a comparison of our TSR to the TSR of a selected peer group of publicly listed multinational companies. The grant date fair value of the restricted stock units with market conditions of $3.3 million was calculated using a Monte Carlo simulation model. Compensation expense, for both the restricted stock units with performance conditions and the restricted stock units with market conditions, is recognized ratably over the three-year vesting period based on the grant date fair value and our assessment of the probability that the applicable targets will be met, for awards with performance conditions, which is reassessed each reporting period.
We granted 191,721 restricted stock units with EPS performance conditions and 191,715 restricted stock units with market conditions in the fiscal year ended June 30, 2011, under the 2002 Plan. These restricted stock units cliff vested in September 2013. Compensation expense, for both the restricted stock units with performance conditions and the restricted stock units with market conditions, was recognized ratably over the three-year vesting period based on the grant date fair value and our assessment of the probability that the applicable targets would be met, for awards with performance conditions. Approximately 41 percent of the restricted stock units with EPS performance conditions vested and 100 percent of the restricted stock units with market conditions vested based on the actual attainment of certain targets.
In the fiscal years ended June 30, 2014, 2013 and 2012, we also granted 183,343, 232,617 and 281,711, respectively, time vested restricted stock units, without performance or market conditions, that vest three years from the date of grant, and 14,540, 41,037 and 29,790, respectively, time vested restricted stock units, without performance or market conditions that vest ratably over the three-year vesting period under the Plans.
In the fiscal years ended June 30, 2014, 2013 and 2012, we granted 613, 970 and 1,150 cash-settled restricted stock units, respectively, under the 2012 Plan. These restricted stock units are accounted for as liability awards and are recorded at the fair value at the end of the reporting period in accordance with their vesting schedules. During the year ended June 30, 2014, none of these restricted stock units were settled. At June 30, 2014, 2013 and 2012, 2,632, 2,120 and 1,150 cash-settled restricted stock units were outstanding, respectively.
95
Table of Contents
In January and September 2008, we granted 34,608 and 28,344 cash-settled restricted stock units, respectively, outside the 2002 Plan. These restricted stock units are accounted for as liability awards and are recorded at the fair value at the end of the reporting period in accordance with their vesting schedules. During the fiscal years ended June 30, 2014, 2013 and 2012 0, 1,608 and 1,608 of these restricted stock units were settled, respectively, at a cost of $0, $0.1 million and $0.1 million, respectively. At June 30, 2014 and 2013, no cash-settled restricted stock units, granted outside the 2002 Plan were outstanding.
A summary of equity classified restricted stock unit activity as of and for the fiscal year ended June 30, 2014 is presented below:
| Restricted Stock Units |
||||
| Non-vested at June 30, 2013 |
1,750,315 | |||
| Granted |
459,140 | |||
| Vested |
(522,191 | ) | ||
| Forfeited |
(143,339 | ) | ||
|
|
|
|||
| Non-vested at June 30, 2014 |
1,543,925 | |||
|
|
|
|||
At June 30, 2014 the aggregate intrinsic value of equity classified restricted stock units was $165.9 million. As of June 30, 2014, there was $34.5 million of total unrecognized compensation cost related to equity classified restricted stock unit compensation arrangements. The weighted average recognition period was 1.1 years.
Stock Appreciation Rights
A summary of cash-settled stock appreciation rights as of and for the fiscal year ended June 30, 2014 is presented below:
| Shares | ||||
| Non-vested at June 30, 2013 |
12,666 | |||
| Granted |
5,515 | |||
| Vested |
(5,081 | ) | ||
| Forfeited |
(1,069 | ) | ||
|
|
|
|||
| Non-vested at June 30, 2014 |
12,031 | |||
|
|
|
|||
| Exercisable |
486 | |||
|
|
|
|||
These stock appreciation rights are accounted for as liability awards and are recorded at the fair value at the end of the reporting period in accordance with their vesting schedules. The fair value is calculated using the Black-Scholes option valuation model using assumptions consistent with our stock options.
96
Table of Contents
Note 15—Other Comprehensive Income (Loss)
Other comprehensive income (loss) is comprised of the following:
| Year Ended June 30, | ||||||||||||||||||||||||
| 2014 | 2013 | 2012 | ||||||||||||||||||||||
| Pre-Tax | Net of Tax | Pre-Tax | Net of Tax | Pre-Tax | Net of Tax | |||||||||||||||||||
| Foreign currency translation gains (losses) |
$ | 44,881 | $ | 44,881 | $ | 5,379 | $ | 5,379 | $ | (136,240 | ) | $ | (136,240 | ) | ||||||||||
|
|
|
|
|
|
|
|
|
|
|
|
|
|||||||||||||
| Unrealized (losses) gains on hedging derivatives: |
||||||||||||||||||||||||
| Gains (losses) reclassified from AOCI into income (effective portion)(1) |
8,980 | 6,726 | (25,798 | ) | (18,412 | ) | (10,932 | ) | (7,892 | ) | ||||||||||||||
| Gains (losses) reclassified from AOCI into income (effective portion)(2) |
398 | 298 | (67 | ) | (48 | ) | 38 | 27 | ||||||||||||||||
| Gains reclassified from AOCI into income (ineffective portion)(1) |
2,048 | 1,534 | 0 | 0 | 0 | 0 | ||||||||||||||||||
| Gains reclassified from AOCI into income (ineffective portion)(2) |
1 | 0 | 4 | 0 | 7 | 5 | ||||||||||||||||||
| (Losses) gains recognized in AOCI (effective portion) |
(37,679 | ) | (28,220 | ) | (1,165 | ) | (831 | ) | 79,370 | 57,297 | ||||||||||||||
| Other (losses) gains |
(2,118 | ) | (1,586 | ) | 33 | 25 | 58 | 43 | ||||||||||||||||
|
|
|
|
|
|
|
|
|
|
|
|
|
|||||||||||||
| Unrealized (losses) gains on hedging derivatives |
(28,370 | ) | (21,248 | ) | (26,993 | ) | (19,266 | ) | 68,541 | 49,480 | ||||||||||||||
| Pension liability adjustment: |
||||||||||||||||||||||||
| Amortization of prior service cost(3) |
1,001 | 760 | 1,155 | 374 | 1,418 | 972 | ||||||||||||||||||
| Amortization of net loss(3) |
3,038 | 2,305 | 3,873 | 1,253 | 1,793 | 1,229 | ||||||||||||||||||
| Expected return on plan assets(3) |
(259 | ) | (197 | ) | (284 | ) | (92 | ) | (238 | ) | (163 | ) | ||||||||||||
| Actuarial loss |
(10,876 | ) | (8,253 | ) | (2,317 | ) | (750 | ) | (31,484 | ) | (21,573 | ) | ||||||||||||
| Tax rate change(4) |
0 | 0 | 0 | 719 | 0 | 0 | ||||||||||||||||||
| Other (losses) gains(5) |
(570 | ) | (432 | ) | 692 | 224 | (888 | ) | (609 | ) | ||||||||||||||
|
|
|
|
|
|
|
|
|
|
|
|
|
|||||||||||||
| Pension liability adjustment |
(7,666 | ) | (5,817 | ) | 3,119 | 1,728 | (29,399 | ) | (20,144 | ) | ||||||||||||||
| Unrealized gains (losses) on available-for-sale securities |
287 | 183 | 4,376 | 4,250 | (120 | ) | (120 | ) | ||||||||||||||||
|
|
|
|
|
|
|
|
|
|
|
|
|
|||||||||||||
| Other comprehensive income (loss) |
$ | 9,132 | $ | 17,999 | $ | (14,119 | ) | $ | (7,909 | ) | $ | (97,218 | ) | $ | (107,024 | ) | ||||||||
|
|
|
|
|
|
|
|
|
|
|
|
|
|||||||||||||
| (1) | Reclassified to Cost of sales in our Consolidated Statements of Income. Refer to Note 10—Derivatives for more information. |
| (2) | Reclassified to SG&A in our Consolidated Statements of Income. Refer to Note 10—Derivatives for more information. |
| (3) | Reclassified to SG&A in our Consolidated Statements of Income. Refer to Note 17—Retirement Benefits for more information. |
| (4) | Impact on deferred taxes due to tax rate changes in certain jurisdictions. |
| (5) | Primarily represents currency impact on cumulative amount of benefit plan net actuarial losses and prior service credits included in AOCI. |
97
Table of Contents
AOCI: At June 30, 2014 and 2013, AOCI consisted of the following:
| June 30, | ||||||||
| Income/(Loss): |
2014 | 2013 | ||||||
| Cumulative translation adjustment |
$ | 96,154 | $ | 51,273 | ||||
| Pension liability adjustment |
(42,536 | ) | (36,719 | ) | ||||
| Unrealized gains on hedging derivatives |
(14,219 | ) | 7,029 | |||||
| Unrealized gains (losses) on available-for-sale securities |
400 | 217 | ||||||
|
|
|
|
|
|||||
| Total AOCI |
$ | 39,799 | $ | 21,800 | ||||
|
|
|
|
|
|||||
We had approximately $2.5 million and $2.1 million of investments at June 30, 2014 and 2013, respectively, included in Other current assets in our Consolidated Balance Sheets that have been classified as available-for-sale securities. These securities are recorded at fair value with realized gains and losses recorded in income and unrealized gains and losses recorded in AOCI, net of taxes.
Note 16—Restructuring
Our restructuring program that is designed to improve our global footprint, cost structure, technology portfolio, human resources and internal processes continues. During fiscal years 2014, 2013 and 2012, we continued to refine existing programs and launched significant new programs focused on achieving further productivity improvements to: (i) optimize certain research and development and supply chain functions; (ii) outsource certain manufacturing capabilities; (iii) divest or sublease facilities no longer needed to support current operations and (iv) relocate certain functions to best cost countries.
A summary and components of our restructuring initiatives are presented below and include accruals for new programs as well as revisions to estimates, both increases and decreases, to programs accrued in prior periods:
| Severance Related Costs |
Third Party Contractor Termination Costs |
Facility Closure and Other Related Costs(3) |
Asset Impairments(1) |
Total | ||||||||||||||||
| Liability, June 30, 2011 |
$ | 31,762 | $ | 0 | $ | 7,860 | $ | 0 | $ | 39,622 | ||||||||||
| Expense(2) |
(1,008 | ) | 315 | 7,146 | 2,696 | 9,149 | ||||||||||||||
| Accumulated depreciation offset |
0 | 0 | 0 | (2,696 | ) | (2,696 | ) | |||||||||||||
| Payments |
(8,434 | ) | (298 | ) | (4,169 | ) | 0 | (12,901 | ) | |||||||||||
| Foreign currency translation |
(2,382 | ) | 0 | 2 | 0 | (2,380 | ) | |||||||||||||
|
|
|
|
|
|
|
|
|
|
|
|||||||||||
| Liability, June 30, 2012 |
$ | 19,938 | $ | 17 | $ | 10,839 | $ | 0 | $ | 30,794 | ||||||||||
|
|
|
|
|
|
|
|
|
|
|
|||||||||||
| Expense(2) |
21,297 | 1,076 | 55,405 | 5,337 | 83,115 | |||||||||||||||
| Accumulated depreciation offset |
0 | 0 | 0 | (5,337 | ) | (5,337 | ) | |||||||||||||
| Payments |
(18,151 | ) | (72 | ) | (38,939 | ) | 0 | (57,162 | ) | |||||||||||
| Reclassified Liabilities(3) |
0 | 0 | 6,889 | 0 | 6,889 | |||||||||||||||
| Foreign currency translation |
479 | (7 | ) | (346 | ) | 0 | 126 | |||||||||||||
|
|
|
|
|
|
|
|
|
|
|
|||||||||||
| Liability, June 30, 2013 |
$ | 23,563 | $ | 1,014 | $ | 33,848 | $ | 0 | $ | 58,425 | ||||||||||
|
|
|
|
|
|
|
|
|
|
|
|||||||||||
| Expense(2) |
65,870 | 5,793 | 5,581 | 6,959 | 84,203 | |||||||||||||||
| Accumulated depreciation offset |
0 | 0 | 0 | (6,959 | ) | (6,959 | ) | |||||||||||||
| Payments |
(36,699 | ) | (6,856 | ) | (10,522 | ) | 0 | (54,077 | ) | |||||||||||
| Foreign currency translation |
1,423 | 49 | 1,355 | 0 | 2,827 | |||||||||||||||
|
|
|
|
|
|
|
|
|
|
|
|||||||||||
| Liability, June 30, 2014 |
$ | 54,157 | $ | 0 | $ | 30,262 | $ | 0 | $ | 84,419 | ||||||||||
|
|
|
|
|
|
|
|
|
|
|
|||||||||||
| (1) | Credits related to restructuring charges for accelerated depreciation and inventory provisions are recorded against the related assets in Property, plant & equipment, net or Inventories in our Consolidated Balance Sheets and do not impact the restructuring liability. |
98
Table of Contents
| (2) | Restructuring expenses noted above are primarily in SG&A in our Consolidated Statements of Income. Asset impairments, which consist of accelerated depreciation and inventory provisions, are primarily in Cost of sales in our Consolidated Statements of Income. |
| (3) | Certain contractual indemnification payments resulting from the transfer of a manufacturing facility to a third party were recorded as restructuring expenses in fiscal year 2013 and are classified within Facility Closure and Other Related Costs. Certain pre-existing liabilities related to this transferred facility were offset and reduced the restructuring expenses recorded as part of this transaction. These offsets are shown as Reclassified liabilities as noted above. See Note 3—Transfer of Ownership of Manufacturing Facility for more information. |
Restructuring liabilities are recorded in Accrued liabilities and Other non-current liabilities in our Consolidated Balance Sheets.
Restructuring expenses by reporting business segment are presented below:
| Year Ended June 30, | ||||||||||||
| 2014 | 2013 | 2012 | ||||||||||
| Infotainment |
$ | 47,147 | $ | 58,878 | $ | (1,458 | ) | |||||
| Lifestyle |
23,645 | 16,260 | 169 | |||||||||
| Professional |
6,335 | 2,640 | 8,459 | |||||||||
| Other |
117 | 0 | (717 | ) | ||||||||
|
|
|
|
|
|
|
|||||||
| Total |
77,244 | 77,778 | 6,453 | |||||||||
| Asset impairments |
6,959 | 5,337 | 2,696 | |||||||||
|
|
|
|
|
|
|
|||||||
| Total |
$ | 84,203 | $ | 83,115 | $ | 9,149 | ||||||
|
|
|
|
|
|
|
|||||||
Note 17—Retirement Benefits
Plan Descriptions
Retirement savings plan
We provide a Retirement Savings Plan (the “Savings Plan”) for certain employees in the United States. Under the Savings Plan, and subject to certain limitations: (i) employees may contribute up to 50 percent of their pretax compensation; (ii) each business unit will make a safe harbor non-elective contribution in an amount equal to three percent of a participant’s pre-tax compensation; and (iii) each business unit may also make a matching contribution of 50 percent of an employee’s tax-deferred compensation, up to the first six percent of a participant’s pre-tax compensation. Matching contributions vest at a rate of 25 percent for each year of service with the employer, beginning with the second year of service. Expenses related to the Savings Plan for the fiscal years ended June 30, 2014, 2013 and 2012, were $9.3 million, $8.7 million and $7.8 million, respectively.
Pension benefits
We provide defined pension benefits to certain eligible employees. The measurement date used for determining pension benefits is the last day of our fiscal year, June 30th. We have certain business units in Europe, Asia and Latin America that maintain defined benefit pension plans for many of our current and former employees. The coverage provided and the extent to which the retirees’ share in the cost of the program vary by business unit. Generally, plan benefits are based on age, years of service and average compensation during the final years of service. In the United States, we have a SERP that provides retirement, death and termination benefits, as defined in the SERP, to certain key executives designated by our Board of Directors. The majority of our defined benefit plans do not have contractual or statutory provisions which specify minimum funding requirements. We are in compliance with all existing contractual obligations and statutory provisions.
99
Table of Contents
The SERP is an unfunded plan for tax purposes and under the Employee Retirement Income Security Act of 1974 (“ERISA”) all obligations arising under the SERP are payable from our general assets. To assist in the funding of the benefits under the SERP, we maintain assets in an irrevocable trust whereby the use of these assets is restricted to funding our future benefit obligations under the SERP. These assets are not plan assets of the SERP, therefore, in the event of bankruptcy, the assets become unrestricted and the SERP would become a general creditor of our Company. The assets and liabilities, and earnings and expenses, of the irrevocable trust are consolidated in our consolidated financial statements. As of June 30, 2014 and 2013, there were $97.4 million and $54.5 million, respectively, of total assets included in the irrevocable trust of which $58.1 million and $16.3 million, respectively, consist of cash and $39.3 million and $38.2 million, respectively, consist of the cash surrender value of life insurance policies.
During fiscal year 2015, we expect to contribute amounts to the defined benefit pension plans necessary to cover required disbursements. The benefits that we expect to pay in each fiscal year from 2015 to 2019 are $9.9 million, $9.7 million, $10.1 million, $10.3 million and $9.4 million, respectively. The aggregate benefits we expect to pay in the five fiscal years from 2020 to 2024 are $54.4 million.
Plan Assets
For all but one of our Company’s plans, contributions are made from our current operating funds as required in the year of payout. For one foreign plan, we made annual contributions into a fund managed by a trustee who invests such funds, administers the plan and makes payouts to eligible employees as required.
Our primary objective in investing plan assets for this foreign plan is to achieve returns sufficient to meet future benefit obligations with minimal risk and to time the maturities of such investments to meet annual payout needs. Given this, fund assets are invested in a unitized publicly traded fund which invests 100 percent of such investments in government bonds. For purposes of fair value, this investment has been determined to meet the characteristics of a Level 1 investment as quoted prices in an active market exist for these assets. As of June 30, 2014, 100 percent of these assets are invested in this unitized fund. Refer to Note 11—Fair Value Measurements for more information.
Summary Plan Results
The following is a reconciliation of the benefit obligations, plan assets and funded status of the plans as well as the amounts recognized in our Consolidated Balance Sheets as of and for the fiscal years ended June 30, 2014 and 2013:
| Year Ended June 30, | ||||||||
| 2014 | 2013 | |||||||
| Change in benefit obligation: |
||||||||
| Benefit obligation at beginning of year |
$ | 183,372 | $ | 183,249 | ||||
| Benefit obligation of plans not previously reported(1) |
5,075 | 0 | ||||||
| Service cost |
2,507 | 2,169 | ||||||
| Interest cost |
7,201 | 7,085 | ||||||
| Actuarial loss |
11,066 | 2,530 | ||||||
| Effects of settlements and curtailments |
(2,801 | ) | (3,805 | ) | ||||
| Plan amendments |
(613 | ) | 0 | |||||
| Benefits paid |
(8,414 | ) | (9,125 | ) | ||||
| Foreign currency translation |
5,500 | 1,269 | ||||||
|
|
|
|
|
|||||
| Benefit obligation at end of year |
$ | 202,893 | $ | 183,372 | ||||
|
|
|
|
|
|||||
100
Table of Contents
| Year Ended June 30, | ||||||||
| 2014 | 2013 | |||||||
| Change in plan assets: |
||||||||
| Fair value of assets at beginning of year |
$ | 6,801 | $ | 7,011 | ||||
| Actual return on plan assets |
114 | (170 | ) | |||||
| Employer contributions |
10,018 | 12,900 | ||||||
| Benefits paid |
(8,414 | ) | (9,125 | ) | ||||
| Settlement |
(2,676 | ) | (3,593 | ) | ||||
| Foreign currency translation |
798 | (222 | ) | |||||
|
|
|
|
|
|||||
| Fair value of assets at end of year |
$ | 6,641 | $ | 6,801 | ||||
|
|
|
|
|
|||||
| Reconciliation of funded status: |
||||||||
| Funded status |
$ | (196,252 | ) | $ | (176,571 | ) | ||
| Unrecognized prior service cost |
4,978 | 6,463 | ||||||
| Unrecognized net loss |
57,430 | 48,279 | ||||||
|
|
|
|
|
|||||
| Accrued pension cost |
$ | (133,844 | ) | $ | (121,829 | ) | ||
|
|
|
|
|
|||||
| Non-current assets |
$ | 0 | $ | 0 | ||||
| Accrued liabilities |
(9,900 | ) | (8,884 | ) | ||||
| Other non-current liabilities |
(186,352 | ) | (167,687 | ) | ||||
| AOCI |
62,408 | 54,742 | ||||||
|
|
|
|
|
|||||
| Accrued pension cost |
$ | (133,844 | ) | $ | (121,829 | ) | ||
|
|
|
|
|
|||||
| (1) | Certain foreign defined benefit plans were not disclosed in prior years based on the immateriality of amounts involved in these plans. |
Amounts recognized in AOCI for the fiscal years ended June 30, 2014 and 2013 are presented below:
| Year Ended June 30, | ||||||||
| 2014 | 2013 | |||||||
| Amounts recorded in AOCI: |
||||||||
| Prior service cost |
$ | 4,978 | $ | 6,463 | ||||
| Net actuarial loss |
57,430 | 48,279 | ||||||
|
|
|
|
|
|||||
| Total recognized in AOCI, before taxes |
62,408 | 54,742 | ||||||
| Income tax benefit |
(19,872 | ) | (18,023 | ) | ||||
|
|
|
|
|
|||||
| Total recognized in AOCI, net of income taxes |
$ | 42,536 | $ | 36,719 | ||||
|
|
|
|
|
|||||
The estimated amount that will be amortized from AOCI into net periodic benefit cost in fiscal year 2015 is as follows:
| Amounts expected to be recognized in net periodic benefit cost |
||||
| Recognized net actuarial loss |
$ | 3,842 | ||
| Amortization of prior service cost |
973 | |||
|
|
|
|||
| Total |
$ | 4,815 | ||
|
|
|
101
Table of Contents
A comparison of plans’ assets with plans’ projected benefit and accumulated benefit obligations as of June 30, 2014 and 2013 is presented below:
| Obligations Exceed Plan Assets Year Ended June 30, |
Plan Assets Exceed Obligations Year Ended June 30, |
Total All Plans Year Ended June 30, |
||||||||||||||||||||||
| 2014 | 2013 | 2014 | 2013 | 2014 | 2013 | |||||||||||||||||||
| Plans where: |
||||||||||||||||||||||||
| Projected benefit obligation |
$ | 202,893 | $ | 183,372 | $ | 0 | $ | 0 | $ | 202,893 | $ | 183,372 | ||||||||||||
| Accumulated benefit obligation |
190,100 | 172,124 | 0 | 0 | 190,100 | 172,124 | ||||||||||||||||||
| Fair value of plan assets |
6,641 | 6,801 | 0 | 0 | 6,641 | 6,801 | ||||||||||||||||||
The components of net periodic benefit costs for the fiscal years ended June 30, 2014, 2013 and 2012 are presented below:
| Year Ended June 30, | ||||||||||||
| 2014 | 2013 | 2012 | ||||||||||
| Components of net periodic benefit cost: |
||||||||||||
| Service cost |
$ | 2,507 | $ | 2,169 | $ | 1,635 | ||||||
| Interest cost |
7,201 | 7,085 | 8,106 | |||||||||
| Expected return on plan assets |
(259 | ) | (284 | ) | (238 | ) | ||||||
| Amortization of prior service cost |
1,001 | 1,155 | 1,418 | |||||||||
| Amortization of net loss |
3,038 | 3,873 | 1,793 | |||||||||
| Effect of settlements and curtailments |
1,119 | 797 | 83 | |||||||||
|
|
|
|
|
|
|
|||||||
| Net periodic benefit cost |
$ | 14,607 | $ | 14,795 | $ | 12,797 | ||||||
|
|
|
|
|
|
|
|||||||
Plan Assumptions
The assumptions used to determine our benefit obligations and net periodic pension and other postretirement benefit costs are presented below:
| Year Ended June 30, | ||||||||||||
| 2014 | 2013 | 2012 | ||||||||||
| Assumptions: |
||||||||||||
| Weighted average rates used to determine benefit obligations at June 30: |
||||||||||||
| Range of discount rates for pension plans |
1.4%—8.8% | 1.4%—4.4% | 0.6%—5.0% | |||||||||
| Range of rates of compensation increase for pension plans |
0.0%—10.0% | 0.0%—4.0% | 0.0%—4.0% | |||||||||
| Weighted average rates used to determine net periodic benefit cost at June 30: |
||||||||||||
| Range of discount rates for pension plans |
1.4%—4.4% | 0.6%—5.0% | 4.7%—5.9% | |||||||||
| Range of rates of compensation increase for pension plans |
2.0%—4.0% | 0.0%—4.0% | 0.0%—4.0% | |||||||||
We use a globally consistent method of setting the discount rates where yield curves are developed from yields on actual Aa-rated corporate bonds across the full maturity spectrum, referring to ratings provided by Moody’s, Standard & Poor’s, Fitch, and Dominion Bond Rating Service, supplemented with additional yield information where needed. We discount the expected future benefit payments of each plan using the appropriate yield curve based on the currency of payment of benefits, to develop a single-point discount rate matching each plan’s payout structure.
102
Table of Contents
Note 18—Business Segment Data
The accounting principles applied at the operating segment level in determining income from operations are the same as those applied at the consolidated financial statement level. While revenues are specifically identified with our Infotainment segment and the automotive audio portion of our Lifestyle segment, costs, expenses and assets for these businesses are allocated based on relative revenues or other measures of activity that management believes are reasonable.
We design, manufacture and market high-quality, high fidelity audio products and electronic systems for the infotainment, automotive audio, home audio and professional markets. Our chief operating decision maker evaluates performance and allocates resources based on net sales, operating income and working capital in each of the reporting segments.
Infotainment
Our Infotainment segment designs, manufactures and markets infotainment systems for vehicle applications to be installed primarily as original equipment by automotive manufacturers.
Lifestyle
Our Lifestyle segment designs, manufactures and markets automotive audio systems for vehicle applications to be installed primarily as original equipment by automotive manufacturers and a wide range of mid-to high-end audio and consumer electronics for home, multimedia and mobile applications. Our Lifestyle audio products feature some of the world’s most recognized audio brands, including AKG, Harman/Kardon, Infinity, JBL, Lexicon, Logic 7, Mark Levinson, Revel, Selenium and yurbuds Powered by JBL.
Professional
Our Professional segment designs, manufactures and markets an extensive range of loudspeakers, power amplifiers, digital signal processors, microphones, headphones, mixing consoles, lighting systems, video and control solutions and information delivery systems used by audio professionals in concert halls, stadiums, airports, houses of worship and other public spaces. We also provide high-quality products to the sound reinforcement, music instrument support and broadcast and recording segments of the professional audio market. We offer complete systems solutions for professional installations and users around the world. Our Professional products are marketed globally under brand names including AKG, AMX, BSS, Crown, dbx, DigiTech, JBL Professional, Lexicon, Martin, Selenium, Soundcraft and Studer.
Other
Our Other segment includes compensation, benefits and occupancy costs for corporate employees, net of reporting segment allocations, expenses associated with new technology innovation and our corporate brand identity campaign.
103
Table of Contents
The following table presents Net sales, Operating income (loss), Assets, Goodwill, Capital expenditures and Depreciation and amortization by each reporting segment:
| Year Ended June 30, | ||||||||||||
| 2014 | 2013 | 2012 | ||||||||||
| Net sales: |
||||||||||||
| Infotainment |
$ | 2,838,904 | $ | 2,283,247 | $ | 2,401,562 | ||||||
| Lifestyle |
1,656,094 | 1,338,355 | 1,330,798 | |||||||||
| Professional |
853,144 | 672,805 | 630,731 | |||||||||
| Other |
341 | 3,435 | 987 | |||||||||
|
|
|
|
|
|
|
|||||||
| Total |
$ | 5,348,483 | $ | 4,297,842 | $ | 4,364,078 | ||||||
|
|
|
|
|
|
|
|||||||
| Operating income (loss): |
||||||||||||
| Infotainment |
$ | 195,403 | $ | 90,799 | $ | 180,529 | ||||||
| Lifestyle |
170,517 | 137,477 | 151,490 | |||||||||
| Professional |
114,057 | 85,810 | 72,997 | |||||||||
| Other |
(150,250 | ) | (112,835 | ) | (104,770 | ) | ||||||
|
|
|
|
|
|
|
|||||||
| Total |
$ | 329,727 | $ | 201,251 | $ | 300,246 | ||||||
|
|
|
|
|
|
|
|||||||
| Assets: |
||||||||||||
| Infotainment |
$ | 1,191,124 | $ | 1,094,118 | ||||||||
| Lifestyle |
1,561,216 | 1,192,610 | ||||||||||
| Professional |
1,044,233 | 468,910 | ||||||||||
| Other |
329,017 | 480,047 | ||||||||||
|
|
|
|
|
|||||||||
| Total |
$ | 4,125,590 | $ | 3,235,685 | ||||||||
|
|
|
|
|
|||||||||
| Goodwill: |
||||||||||||
| Infotainment |
$ | 17,080 | $ | 8,576 | ||||||||
| Lifestyle |
137,950 | 107,438 | ||||||||||
| Professional |
385,922 | 118,328 | ||||||||||
|
|
|
|
|
|||||||||
| Total |
$ | 540,952 | $ | 234,342 | ||||||||
|
|
|
|
|
|||||||||
| Capital expenditures: |
||||||||||||
| Infotainment |
$ | 91,472 | $ | 54,364 | $ | 66,050 | ||||||
| Lifestyle |
43,042 | 25,587 | 24,467 | |||||||||
| Professional |
12,533 | 11,839 | 10,187 | |||||||||
| Other |
10,094 | 9,892 | 11,832 | |||||||||
|
|
|
|
|
|
|
|||||||
| Total |
$ | 157,141 | $ | 101,682 | $ | 112,536 | ||||||
|
|
|
|
|
|
|
|||||||
| Depreciation and amortization: |
||||||||||||
| Infotainment |
$ | 65,912 | $ | 63,009 | $ | 66,130 | ||||||
| Lifestyle |
34,581 | 36,572 | 33,401 | |||||||||
| Professional |
20,866 | 16,882 | 13,638 | |||||||||
| Other |
10,969 | 11,705 | 9,056 | |||||||||
|
|
|
|
|
|
|
|||||||
| Total |
$ | 132,328 | $ | 128,168 | $ | 122,225 | ||||||
|
|
|
|
|
|
|
|||||||
During fiscal years 2014, 2013 and 2012 we did not record any goodwill impairment charges. Refer to Note 8—Goodwill and Intangible Assets, Net for more information.
104
Table of Contents
The following table presents Net sales and long-lived assets and net assets by geographic area as of and for the years ended June 30, 2014, 2013 and 2012. Net sales are attributable to geographic areas based upon the location of the customer.
| Year Ended June 30, | ||||||||||||
| 2014 | 2013 | 2012 | ||||||||||
| Net sales: |
||||||||||||
| U.S. |
$ | 1,626,814 | $ | 1,181,113 | $ | 966,955 | ||||||
| Germany |
1,722,739 | 1,482,036 | 1,662,432 | |||||||||
| Other Europe |
969,021 | 819,074 | 916,813 | |||||||||
| Other |
1,029,909 | 815,619 | 817,878 | |||||||||
|
|
|
|
|
|
|
|||||||
| Total |
$ | 5,348,483 | $ | 4,297,842 | $ | 4,364,078 | ||||||
|
|
|
|
|
|
|
|||||||
| Long-lived assets: |
||||||||||||
| U.S. |
$ | 339,226 | $ | 169,311 | ||||||||
| Germany |
141,987 | 137,387 | ||||||||||
| Other Europe |
141,481 | 128,457 | ||||||||||
| Other |
69,193 | 50,141 | ||||||||||
|
|
|
|
|
|||||||||
| Total |
$ | 691,887 | $ | 485,296 | ||||||||
|
|
|
|
|
|||||||||
| Net Assets |
||||||||||||
| U.S. |
$ | 124,339 | $ | 148,056 | ||||||||
| Germany |
563,972 | 499,490 | ||||||||||
| Other Europe |
950,027 | 857,487 | ||||||||||
| Other |
154,683 | 139,838 | ||||||||||
|
|
|
|
|
|||||||||
| Total |
$ | 1,793,021 | $ | 1,644,871 | ||||||||
|
|
|
|
|
|||||||||
Note 19—Commitments and Contingencies
At June 30, 2014, we were subject to legal claims and litigation arising in the ordinary course of business, including the matters described below. The outcome of these legal actions cannot be predicted with certainty; however, management, based upon advice from legal counsel, believes such actions are either without merit or will not have a material adverse effect on our financial condition, results of operations or cash flows.
In re Harman International Industries, Inc. Securities Litigation
On October 1, 2007, a purported class action lawsuit was filed by Cheolan Kim (the “Kim Plaintiff”) against Harman and certain of our officers in the United States District Court for the District of Columbia (the “Court”) seeking compensatory damages and costs on behalf of all persons who purchased our common stock between April 26, 2007 and September 24, 2007 (the “Class Period”). The original complaint alleged claims for violations of Sections 10(b) and 20(a) of the Securities Exchange Act of 1934, as amended (the “Exchange Act”) and Rule 10b-5 promulgated thereunder.
The complaint alleged that the defendants omitted to disclose material adverse facts about Harman’s financial condition and business prospects. The complaint contended that had these facts not been concealed at the time the merger agreement with Kohlberg, Kravis, Roberts & Co. and Goldman Sachs Capital Partners was entered into, there would not have been a merger agreement, or it would have been at a much lower price, and the price of our common stock therefore would not have been artificially inflated during the Class Period. The Kim Plaintiff alleged that, following the reports that the proposed merger was not going to be completed, the price of our common stock declined, causing the plaintiff class significant losses.
105
Table of Contents
On November 30, 2007, the Boca Raton General Employees’ Pension Plan filed a purported class action lawsuit against Harman and certain of our officers in the Court seeking compensatory damages and costs on behalf of all persons who purchased our common stock between April 26, 2007 and September 24, 2007. The allegations in the Boca Raton complaint are essentially identical to the allegations in the original Kim complaint, and like the original Kim complaint, the Boca Raton complaint alleges claims for violations of Sections 10(b) and 20(a) of the Exchange Act and Rule 10b-5 promulgated thereunder.
On January 16, 2008, the Kim Plaintiff filed an amended complaint. The amended complaint, which extended the Class Period through January 11, 2008, contended that, in addition to the violations alleged in the original complaint, Harman also violated Sections 10(b) and 20(a) of the Exchange Act and Rule 10b-5 promulgated thereunder by “knowingly failing to disclose “significant problems” relating to its PND sales forecasts, production, pricing, and inventory” prior to January 14, 2008. The amended complaint claimed that when “Defendants revealed for the first time on January 14, 2008 that shifts in PND sales would adversely impact earnings per share by more than $1.00 per share in fiscal 2008,” that led to a further decline in our share value and additional losses to the plaintiff class.
On February 15, 2008, the Court ordered the consolidation of the Kim action with the Boca Raton action, the administrative closing of the Boca Raton action, and designated the short caption of the consolidated action as In re Harman International Industries, Inc. Securities Litigation, civil action no. 1:07-cv-01757 (RWR). That same day, the Court appointed the Arkansas Public Retirement System as lead plaintiff (“Lead Plaintiff”) and approved the law firm Cohen, Milstein, Hausfeld and Toll, P.L.L.C. to serve as lead counsel.
On March 24, 2008, the Court ordered, for pretrial management purposes only, the consolidation of Patrick Russell v. Harman International Industries, Incorporated, et al. with In re Harman International Industries, Inc. Securities Litigation.
On May 2, 2008, Lead Plaintiff filed a consolidated class action complaint (the “Consolidated Complaint”). The Consolidated Complaint, which extended the Class Period through February 5, 2008, contended that Harman and certain of our officers and directors violated Sections 10(b) and 20(a) of the Exchange Act and Rule 10b-5 promulgated thereunder, by issuing false and misleading disclosures regarding our financial condition in fiscal year 2007 and fiscal year 2008. In particular, the Consolidated Complaint alleged that defendants knowingly or recklessly failed to disclose material adverse facts about MyGIG radios, personal navigation devices and our capital expenditures. The Consolidated Complaint alleged that when Harman’s true financial condition became known to the market, the price of our common stock declined significantly, causing losses to the plaintiff class.
On July 3, 2008, defendants moved to dismiss the Consolidated Complaint in its entirety. Lead Plaintiff opposed the defendants’ motion to dismiss on September 2, 2008, and defendants filed a reply in further support of their motion to dismiss on October 2, 2008.
On April 12, 2012, In re Harman International Industries, Inc. Securities Litigation, civil action no. 1:07-cv-01757 (D.D.C.) was reassigned to Judge Rudolph Contreras while Patrick Russell v. Harman International Industries, Incorporated, et al. remained before Judge Richard W. Roberts.
On September 5, 2012, the Court heard oral arguments on defendants’ motion to dismiss. At the request of the Court, on September 24, 2012, each side submitted a supplemental briefing on defendants’ motion to dismiss. On January 17, 2014, the Court granted a motion to dismiss, without prejudice, the In re Harman International Industries, Inc. Securities Litigation. The Lead Plaintiff has filed a notice of appeal but no briefing schedule has been set.
106
Table of Contents
Patrick Russell v. Harman International Industries, Incorporated, et al.
Patrick Russell (the “Russell Plaintiff”) filed a complaint on December 7, 2007 in the United States District Court for the District of Columbia and an amended purported putative class action complaint on June 2, 2008 against Harman and certain of our officers and directors alleging violations of ERISA and seeking, on behalf of all participants in and beneficiaries of the Savings Plan, compensatory damages for losses to the Savings Plan as well as injunctive relief, imposition of a constructive trust, restitution, and other monetary relief. The amended complaint alleged that from April 26, 2007 to the present defendants failed to prudently and loyally manage the Savings Plan’s assets, thereby breaching their fiduciary duties in violation of ERISA by causing the Savings Plan to invest in our common stock notwithstanding that the stock allegedly was “no longer a prudent investment for the Participants’ retirement savings.” The amended complaint further claimed that, during the Class Period, defendants failed to monitor the Savings Plan’s fiduciaries, failed to provide the Savings Plan’s fiduciaries with, and to disclose to the Savings Plan’s participants, adverse facts regarding Harman and our businesses and prospects. The Russell Plaintiff also contended that defendants breached their duties to avoid conflicts of interest and to serve the interests of participants in and beneficiaries of the Savings Plan with undivided loyalty. As a result of these alleged fiduciary breaches, the amended complaint asserted that the Savings Plan had “suffered substantial losses, resulting in the depletion of millions of dollars of the retirement savings and anticipated retirement income of the Savings Plan’s Participants.”
On March 24, 2008, the Court ordered, for pretrial management purposes only, the consolidation of Patrick Russell v. Harman International Industries, Incorporated, et al. with In re Harman International Industries, Inc. Securities Litigation. Defendants moved to dismiss the complaint in its entirety on August 5, 2008. The Russell Plaintiff opposed the defendants’ motion to dismiss on September 19, 2008, and defendants filed a reply in further support of their motion to dismiss on October 20, 2008. On May 22, 2013, the District Court dismissed the complaint in its entirety. The Russell Plaintiff has filed a notice of appeal but no briefing schedule has been set.
Infotainment Supply Arrangements
We have arrangements with our infotainment customers to provide products that meet predetermined technical specifications and delivery dates. In the event that we do not satisfy the performance obligations under these arrangements, we may be required to indemnify the customer. We accrue for any loss that we expect to incur under these arrangements when that loss is probable and can be reasonably estimated. For the year ended June 30, 2014, we recognized gain of $6.1 million relating to losses that we no longer expect to incur. We did not incur any losses under these arrangements in fiscal year 2013. For the fiscal year ended June 30, 2012, we incurred $4.6 million of costs related to delayed delivery of product to an infotainment customer. An inability to meet performance obligations on infotainment platforms to be delivered in future periods could adversely affect our results of operations, cash flows and financial condition in future periods.
Customs NAFTA Preferential Tariff Treatment
We have submitted a prior disclosure (“Prior Disclosure”) related to our compliance with U.S. Customs regulations for our fiscal years 2008 through 2012. As we implement our corrective actions, we have submitted the updates to the Prior Disclosure quantifying our compliance through December 31, 2013. This Prior Disclosure and the related updates address several areas of review including our compliance with (a) the North American Free Trade Agreement (“NAFTA”), (b) classification, (c) quantity, and (d) valuation, as defined by U.S. Customs. As of June 30, 2014 and June 30, 2013, we have estimated that our potential liability including interest related to this Prior Disclosure and the related updates is approximately $18 million and $27 million, respectively, which has been accrued for in our Consolidated Balance Sheets. Approximately $12 million of payments have been remitted during the fiscal year ended June 30, 2014, as discussed in more detail below.
We regularly import goods that qualify for preferential duty claims pursuant to NAFTA. NAFTA requires that an importer have a valid NAFTA Certificate of Origin in its possession at the time it makes a preferential
107
Table of Contents
duty claim. Our evaluation of our compliance with the NAFTA area of review has preliminarily determined that a number of preferential duty claims were made without first obtaining the required NAFTA certificate. U.S. Customs regulations, however, permit discretion to waive this requirement if the imported goods qualify for NAFTA preferential tariff treatment. We were advised in the fourth quarter of fiscal year 2013 that U.S. Customs has changed its internal practice and now intends to restrict the exercise of this discretion in this area. We believe that we will ultimately be able to demonstrate that a substantial amount of the goods imported qualified for NAFTA preferential tariff treatment. We intend to vigorously pursue a waiver of the NAFTA certificate requirement to minimize the duty and interest paid related to these claims, however, there is no assurance that we will prevail in obtaining this waiver. As of June 30, 2014, our current estimate, including interest, of goods imported that do not qualify for NAFTA preferential tariff treatment is approximately $9 million, which, after deducting remitted payments is a component of the accruals referred to above. In October 2013, we submitted our Prior Disclosure supplement relating to our review of our compliance with NAFTA and remitted payment of approximately $6 million in November 2013. In December 2013, we submitted an additional Prior Disclosure supplement addressing other areas of our review and as a result remitted payment of approximately $2 million in January 2014. In June 2014, we submitted our final Prior Disclosure supplement and remitted payment of approximately $4 million. We are now waiting for U.S. Customs regulations to accept our final Prior Disclosure.
Note 20—Related Party Transactions
In December 2009, we entered into a three-year agreement for engineering and software development services with Neusoft Corporation (“Neusoft”), a Shanghai exchange listed technology solutions provider. A member of our Board of Directors is the Chairman and CEO of Neusoft. On April 20, 2010, our subsidiary, IS entered into an asset purchase and business transfer agreement (the “Asset Purchase Agreement”) with Neusoft Technology Solutions GmbH (“Neusoft Technology”), which is a subsidiary of Neusoft, for the sale of certain tangible assets located at IS’s facility in Hamburg, Germany. This transaction closed on June 1, 2010. As part of the Asset Purchase Agreement, IS and Neusoft Technology entered into a five-year agreement for engineering and software development services related to IS’s vehicle navigation business (the “Services Agreement”). Under the terms of the Asset Purchase Agreement, IS transferred at closing certain tangible assets and employment relationships to Neusoft Technology and received consideration of €6.0 million. Our indirect wholly-owned subsidiary, HBAS and Neusoft Europe AG, a subsidiary of Neusoft, are guarantors under the terms of the Asset Purchase Agreement and the Services Agreement.
In the first quarter of fiscal year 2013, we entered into a contract with Neusoft to develop certain software to be integrated into certain infotainment platforms for a customer. In the third quarter of fiscal year 2013, we entered into a separate contract with Neusoft to develop digital map databases. As of June 30, 2014 and 2013, we have paid to Neusoft approximately $11.9 million (€8.7 million) and $7.7 million (€5.8 million), respectively, which we had classified as an Other current asset in our Consolidated Balance Sheets. Upon acceptance of the purchased software, which occurred in the fourth quarter of fiscal year 2014, the asset was reclassified to a capitalized software asset which will be amortized over approximately four years, which is the future revenue stream of the products to which it relates. During the fiscal years ended June 30, 2014, 2013 and 2012, we incurred total expenses of $28.6 million, $41.2 million and $32.6 million, respectively, for engineering and software development services with Neusoft Technology and Neusoft. During the fiscal years ended June 30, 2014, 2013 and 2012, we paid Neusoft and Neusoft Technology approximately $42.5 million, $42.5 million and $33.8 million.
In May 2013, we entered into a joint-venture agreement with Neusoft to establish the Harman Neusoft Automotive Infotech (Dalian) Co. Ltd. (the “Harman Neusoft JV”). The purpose of the Harman Neusoft JV is to develop, manufacture, distribute and sell car aftermarket products including, without limitation, car aftermarket audio speakers, amplifiers and head units with or without navigation and telematics features and to provide relevant technical support and services.
The total investment amount of the Harman Neusoft JV is $10.0 million and the registered capital is $7.0 million. We will contribute 60 percent and Neusoft will contribute 40 percent of the registered capital. The
108
Table of Contents
Harman Neusoft JV was officially approved by the Chinese government in December 2013. We are still in the process of setting up the Harman Neusoft JV’s infrastructure. We and Neusoft began funding our respective share of the registered capital in the fourth quarter of fiscal year 2014. The total amount funded was 20 percent of the registered capital or $1.4 million, with our contribution of $0.8 million or 60 percent and Neusoft’s contribution of $0.6 million or 40 percent. The operating results of the Harman Neusoft JV are included in our consolidated financial statements as a non-controlling interest. The portion of the Harman Neusoft JV that we do not own is eliminated from our consolidated operating results on the line Net income attributable to noncontrolling interest in our Consolidated Statements of Income. The Noncontrolling interest is reported in our Consolidated Balance Sheets within equity, stated separately from Harman’s equity.
Note 21—Significant Customers
Presented below are the percentages of net sales to and net accounts receivable due from customers who represent ten percent or more of our net sales or net accounts receivable as follows:
| Net Sales | Accounts Receivable, Net |
|||||||||||||||
| Year Ended June 30, | June 30, | |||||||||||||||
| 2014 | 2013 | 2014 | 2013 | |||||||||||||
| BMW |
16 | % | 18 | % | 11 | % | 12 | % | ||||||||
| Fiat Chrysler Automobiles |
13 | % | 9 | % | 13 | % | 12 | % | ||||||||
| Audi/Volkswagen |
12 | % | 13 | % | 7 | % | 9 | % | ||||||||
| Toyota/Lexus |
8 | % | 10 | % | 4 | % | 6 | % | ||||||||
| Other customers |
51 | % | 50 | % | 65 | % | 61 | % | ||||||||
|
|
|
|
|
|
|
|
|
|||||||||
| Total |
100 | % | 100 | % | 100 | % | 100 | % | ||||||||
|
|
|
|
|
|
|
|
|
|||||||||
We anticipate that BMW, Fiat Chrysler Automobiles, Audi/Volkswagen and Toyota/Lexus and will continue to account for a significant portion of our net sales and net accounts receivable for the foreseeable future. Our customers are not obligated to any long-term purchase of our products.
Note 22—Quarterly Summary of Operations (unaudited)
The following is a summary of operations by quarter for fiscal years 2014, 2013 and 2012:
| Three Months Ended | ||||||||||||||||||||
| September 30 | December 31 | March 31 | June 30 | Total | ||||||||||||||||
| Fiscal Year 2014 |
||||||||||||||||||||
| Net sales |
$ | 1,171,805 | $ | 1,328,024 | $ | 1,404,235 | $ | 1,444,419 | $ | 5,348,483 | ||||||||||
| Gross profit |
321,649 | 379,450 | 364,773 | 390,795 | 1,456,667 | |||||||||||||||
| Net income |
46,452 | 71,629 | 73,385 | 43,113 | 234,579 | |||||||||||||||
| Net loss attributable to noncontrolling interest |
0 | 0 | 0 | (113 | ) | (113 | ) | |||||||||||||
| Net income attributable to Harman International Industries Incorporated |
46,452 | 71,629 | 73,385 | 43,226 | 234,692 | |||||||||||||||
| Earnings per share: |
||||||||||||||||||||
| Basic |
0.67 | 1.04 | 1.06 | 0.63 | 3.40 | |||||||||||||||
| Diluted |
0.66 | 1.03 | 1.05 | 0.62 | 3.36 | |||||||||||||||
| Fiscal Year 2013 |
||||||||||||||||||||
| Net sales |
$ | 998,193 | $ | 1,055,642 | $ | 1,061,772 | $ | 1,182,235 | $ | 4,297,842 | ||||||||||
| Gross profit |
278,247 | 271,793 | 269,195 | 284,885 | 1,104,120 | |||||||||||||||
| Net income |
54,555 | 47,489 | 34,873 | 5,490 | 142,407 | |||||||||||||||
109
Table of Contents
| Three Months Ended | ||||||||||||||||||||
| September 30 | December 31 | March 31 | June 30 | Total | ||||||||||||||||
| Earnings per share: |
||||||||||||||||||||
| Basic |
0.79 | 0.69 | 0.50 | 0.08 | 2.06 | |||||||||||||||
| Diluted |
0.79 | 0.68 | 0.50 | 0.08 | 2.04 | |||||||||||||||
| Fiscal Year 2012 |
||||||||||||||||||||
| Net sales |
$ | 1,050,603 | $ | 1,127,029 | $ | 1,095,675 | $ | 1,090,771 | $ | 4,364,078 | ||||||||||
| Gross profit |
287,642 | 305,539 | 292,630 | 298,335 | 1,184,146 | |||||||||||||||
| Net income |
48,367 | 59,255 | 172,656 | 49,263 | 329,541 | |||||||||||||||
| Earnings per share: |
||||||||||||||||||||
| Basic |
0.68 | 0.83 | 2.41 | 0.69 | 4.62 | |||||||||||||||
| Diluted |
0.67 | 0.82 | 2.38 | 0.69 | 4.57 | |||||||||||||||
Note 23—Subsequent Events
On August 7, 2014, we declared a cash dividend of $0.33 per share for the quarter ended June 30, 2014. The quarterly dividend will be paid on September 2, 2014 to each stockholder of record as of the close of business on August 18, 2014.
110
Table of Contents
| Item 9. | Changes in and Disagreements with Accountants on Accounting and Financial Disclosure. |
None.
| Item 9A. | Controls and Procedures |
Evaluation of Disclosure Controls and Procedures.
Under the supervision and with the participation of our management, including our Chief Executive Officer and Chief Financial Officer, we have evaluated the effectiveness of our disclosure controls and procedures (as defined in Rules 13a-15(e) and 15d-15(e) promulgated by the Securities and Exchange Commission under the Securities Exchange Act of 1934) as of the end of the period covered by this Annual Report on Form 10-K. Based on that evaluation, our Chief Executive Officer and Chief Financial Officer concluded that our disclosure controls and procedures are effective to provide reasonable assurance that information required to be disclosed in the reports that we file or submit under the Securities Exchange Act of 1934 is recorded, processed, summarized, and reported within the time periods specified in Securities and Exchange Commission rules and forms. We note that the design of any system of controls is based in part upon certain assumptions about the likelihood of future events, and there can be no assurance that any design will succeed in achieving our stated goals under all potential future conditions.
Interpretive guidance issued by the SEC staff permits the exclusion of an evaluation of the effectiveness of a registrant’s disclosure controls and procedures as they relate to the internal control over financial reporting for acquired businesses during the first year following such acquisition. As discussed in Note 2—Acquisitions in the Notes to the Consolidated Financial Statements contained in this Annual Report on Form 10-K, we completed in June 2014 the acquisitions of AMX LLC and AMX Holding Corporation and certain assets and liabilities of Verto Medical Solutions LLC, d/b/a yurbuds and its wholly-owned subsidiary (collectively the “Acquired Businesses”), with total assets representing three percent of consolidated assets, and total revenues representing less than one percent of consolidated revenues included in our consolidated financial statements as of and for the year ended June 30, 2014. Management’s evaluation and conclusion as to the effectiveness of the design and operation of the Company’s disclosure controls and procedures as of the end of the period covered by this Annual Report on Form 10-K excludes any evaluation of the internal control over financial reporting of the Acquired Businesses.
Changes in Internal Control Over Financial Reporting.
As a result of the acquisitions of the Acquired Businesses, we have begun to integrate certain business processes and systems of the Acquired Businesses.
There have been no other changes in our internal control over financial reporting (as defined in Rules 13a-15(f) and 15d-15(f) as promulgated by the Securities and Exchange Commission under the Securities Exchange Act of 1934) during our most recently completed fiscal quarter that has materially affected, or is reasonably likely to materially affect, our internal control over financial reporting.
| Item 9B. | Other Information. |
None.
111
Table of Contents
| Item 10. | Directors, Executive Officers and Corporate Governance. |
The information required by Item 10 of Part III is incorporated by reference to our Proxy Statement for the 2014 Annual Meeting of Stockholders.
| Item 11. | Executive Compensation. |
The information required by Item 11 of Part III is incorporated by reference to our Proxy Statement for the 2014 Annual Meeting of Stockholders.
| Item 12. | Security Ownership of Certain Beneficial Owners and Management and Related Stockholder Matters. |
The information required by Item 12 of Part III is incorporated by reference to our Proxy Statement for the 2014 Annual Meeting of Stockholders.
| Item 13. | Certain Relationships and Related Transactions, and Director Independence. |
The information required by Item 13 of Part III is incorporated by reference to our Proxy Statement for the 2014 Annual Meeting of Stockholders.
| Item 14. | Principal Accounting Fees and Services. |
The information required by Item 14 of Part III is incorporated by reference to our Proxy Statement for the 2014 Annual Meeting of Stockholders.
112
Table of Contents
| Item 15. | Exhibits, Financial Statement Schedules |
We will furnish you, without charge, a copy of any exhibit upon written request. Written requests to obtain any exhibit should be sent to Harman’s Secretary at 400 Atlantic Street, 15th Floor, Stamford, CT 06901.
The following consolidated financial statements are filed as part of this report under “Part II, Item 8—Financial Statements and Supplementary Data”:
| Page | ||||
| Financial Statements: |
||||
| Management’s Report on Internal Control over Financial Reporting |
52 | |||
| Report of Independent Registered Public Accounting Firm on Internal Control over Financial Reporting |
53 | |||
| 54 | ||||
| 55 | ||||
| Consolidated Statements of Income for the years ended June 30, 2014, 2013 and 2012 |
56 | |||
| Consolidated Statements of Comprehensive Income for the years ended June 30, 2014, 2013 and 2012 |
57 | |||
| Consolidated Statements of Cash Flows for the years ended June 30, 2014, 2013 and 2012 |
58 | |||
| Consolidated Statements of Shareholders’ Equity for the years ended 2014, 2013 and 2012 |
59 | |||
| 60 | ||||
| Financial Statement Schedules: |
||||
| 120 | ||||
| (Schedules I, III, IV and V are not applicable and have therefore been omitted.) |
||||
Exhibit Index to 10-K
| Exhibit |
Exhibit Description | |
| 3.1 | Restated Certificate of Incorporation of Harman International Industries, Incorporated, as amended. (Filed as Exhibit 3.1 to the Quarterly Report on Form 10-Q for the quarter ended December 31, 2003 and hereby incorporated by reference). | |
| 3.2 | Certificate of Amendment to the Restated Certificate of Incorporation, filed with the Secretary of State of the State of Delaware on December 12, 2011. (Filed as Exhibit 3.1 to the Current Report on Form 8-K filed with the Commission on December 13, 2011 and hereby incorporated by reference). | |
| 3.3 | By-Laws of Harman International Industries, Incorporated, as amended, dated December 7, 2011. (Filed as Exhibit 3.2 to the Current Report on Form 8-K filed with the Commission on December 13, 2011 and hereby incorporated by reference). | |
| 10.1 | Multi-Currency Credit Agreement by and among Harman International Industries, Incorporated, Harman Holding GmbH & Co. KG, J.P. Morgan Securities LLC, HSBC Securities (USA) Inc., UniCredit Capital Markets LLC and Wells Fargo Securities, LLC, as Joint Lead Arrangers, JP Morgan Chase Bank, N.A., as Administrative Agent, HSBC Securities (USA) Inc., UniCredit Capital Markets LLC and Wells Fargo Securities, LLC, as Syndication Agents, Bank of America, N.A., RBS Citizens, N.A., TD Bank, National Association and The Bank of Tokyo-Mitsubishi UFJ, Ltd., as Documentation Agents, and the other banks and financial institutions party thereto, dated as of October 10, 2012. (Filed as Exhibit 10.1 to the Current Report on Form 8-K filed with the Commission on October 11, 2012 and hereby incorporated by reference). | |
| 10.2 | Guarantee Agreement by and among Harman International Industries, Incorporated, Harman Holding GmbH & Co. KG, the subsidiaries of Harman International Industries, Incorporated identified therein, and JPMorgan Chase Bank, N.A., as Administrative Agent, dated as of October 10, 2012. (Filed as Exhibit 10.2 to the Current Report on Form 8-K filed with the Commission on October 11, 2012 and hereby incorporated by reference). | |
113
Table of Contents
| Exhibit |
Exhibit Description | |
| 10.3 | Harman International Industries, Incorporated 1992 Incentive Plan, as amended and restated. (Filed as Exhibit B to the 1999 Proxy Statement and hereby incorporated by reference).** | |
| 10.4 | Harman International Industries, Incorporated Amended and Restated 2002 Stock Option and Incentive Plan. (Filed as Appendix A to the 2008 Proxy Statement and hereby incorporated by reference).** | |
| 10.5 | Amendment No. 1 to the Amended and Restated 2002 Stock Option and Incentive Plan. (Filed as Exhibit 10.3 to the Quarterly Report on Form 10-Q for the quarter ended December 31, 2010 and hereby incorporated by reference).** | |
| 10.6 | Form of Nonqualified Stock Option Agreement for Non-Officer Directors under the Harman International Industries, Incorporated 2002 Stock Option and Incentive Plan. (Filed as Exhibit 10.11 to the Annual Report on Form 10-K for the fiscal year ended June 30, 2005 and hereby incorporated by reference).** | |
| 10.7 | Form of Incentive Stock Option Agreement for Officers and Key Employees under the Harman International Industries, Incorporated 2002 Stock Option and Incentive Plan. (Filed as Exhibit 10.1 to the Current Report on Form 8-K filed with the Commission on August 22, 2005 and hereby incorporated by reference).** | |
| 10.8 | Form of Nonqualified Stock Option Agreement for Officers and Key Employees under the Harman International Industries, Incorporated 2002 Stock Option and Incentive Plan. (Filed as Exhibit 10.2 to the Current Report on Form 8-K filed with the Commission on August 22, 2005 and hereby incorporated by reference).** | |
| 10.9 | Form of Restricted Stock Agreement for Officers and Key Employees under the Harman International Industries, Incorporated 2002 Stock Option and Incentive Plan. (Filed as Exhibit 10.3 to the Current Report on Form 8-K filed with the Commission on August 22, 2005 and hereby incorporated by reference).** | |
| 10.10 | Form of Nonqualified Stock Option Agreement, related to the Stock Option Award, between Harman International Industries, Incorporated and Dinesh Paliwal. (Filed as Exhibit 10.3 to the Current Report on Form 8-K filed with the Commission on May 9, 2007 and hereby incorporated by reference).** | |
| 10.11 | Form of Restricted Share Unit Agreement, related to the Restricted Share Unit Award, between Harman International Industries, Incorporated and Dinesh Paliwal. (Filed as Exhibit 10.3 to the Current Report on Form 8-K filed with the Commission on December 4, 2007 and hereby incorporated by reference).** | |
| 10.12 | Form of Performance Based Restricted Share Unit Agreement for Officers and Key Employees under the Harman International Industries, Incorporated Amended and Restated 2002 Stock Option and Incentive Plan. (Filed as Exhibit 10.5 to the Quarterly Report on Form 10-Q for the quarter ended December 31, 2008 and hereby incorporated by reference).** | |
| 10.13 | Form of Restricted Share Unit Agreement for Officers and Key Employees under the Harman International Industries, Incorporated Amended and Restated 2002 Stock Option and Incentive Plan. (Filed as Exhibit 10.6 to the Quarterly Report on Form 10-Q for the quarter ended December 31, 2008 and hereby incorporated by reference).** | |
| 10.14 | Form of Restricted Share Unit Agreement for Non-Officer Directors under the Harman International Industries, Incorporated Amended and Restated 2002 Stock Option and Incentive Plan. (Filed as Exhibit 10.7 to the Quarterly Report on Form 10-Q for the quarter ended December 31, 2008 and hereby incorporated by reference).** | |
114
Table of Contents
| Exhibit |
Exhibit Description | |
| 10.15 | Form of Restricted Share Unit Agreement, related to Dinesh Paliwal’s annual equity awards, under the Harman International Industries, Incorporated Amended and Restated 2002 Stock Option and Incentive Plan. (Filed as Exhibit 10.8 to the Quarterly Report on Form 10-Q for the quarter ended December 31, 2008 and hereby incorporated by reference).** | |
| 10.16 | Form of Nonqualified Stock Option Agreement, related to Dinesh Paliwal’s annual equity awards, under the Harman International Industries, Incorporated Amended and Restated 2002 Stock Option and Incentive Plan. (Filed as Exhibit 10.9 to the Quarterly Report on Form 10-Q for the quarter ended December 31, 2008 and hereby incorporated by reference).** | |
| 10.17 | Restricted Share Unit Agreement between Harman International Industries, Incorporated and Dinesh Paliwal, related to a January 2008 award. (Filed as Exhibit 10.10 to the Quarterly Report on Form 10-Q for the quarter ended December 31, 2008 and hereby incorporated by reference).** | |
| 10.18 | Restricted Share Unit Agreement between Harman International Industries, Incorporated and Dinesh Paliwal, related to a September 2008 award under the Harman International Industries, Incorporated Amended and Restated 2002 Stock Option and Incentive Plan. (Filed as Exhibit 10.11 to the Quarterly Report on Form 10-Q for the quarter ended December 31, 2008 and hereby incorporated by reference).** | |
| 10.19 | Restricted Share Unit Agreement between Harman International Industries, Incorporated and Herbert Parker, related to a September 2008 award. (Filed as Exhibit 10.12 to the Quarterly Report on Form 10-Q for the quarter ended December 31, 2008 and hereby incorporated by reference).** | |
| 10.20 | Time-Based Restricted Share Unit Agreement between Harman International Industries, Incorporated and Dinesh Paliwal, related to a September 2009 award under the Amended and Restated Harman International Industries, Incorporated 2002 Stock Option and Incentive Plan (Filed as Exhibit 10.5 to the Current Report on Form 8-K filed with the Commission on September 1, 2009 and hereby incorporated by reference).** | |
| 10.21 | Performance-Based Restricted Share Unit Agreement between Harman International Industries, Incorporated and Dinesh Paliwal, related to a September 2009 award under the Amended and Restated Harman International Industries, Incorporated 2002 Stock Option and Incentive Plan (Filed as Exhibit 10.6 to the Current Report on Form 8-K filed with the Commission on September 1, 2009 and hereby incorporated by reference).** | |
| 10.22 | Harman International Industries, Incorporated Management Incentive Compensation Plan. (Filed as Exhibit 10.2 to the Current Report on Form 8-K filed with the Commission on December 21, 2007 and hereby incorporated by reference).** | |
| 10.23 | Harman International Industries, Incorporated Supplemental Executive Retirement Plan, as amended and restated as of October 1, 1999. (Filed as Exhibit 10.27 to the Annual Report on Form 10-K for the fiscal year ended June 30, 2000 and hereby incorporated by reference).** | |
| 10.24 | Amendment No. 1 to the Harman International Industries, Incorporated Supplemental Executive Retirement Plan, dated September 24, 2002. (Filed as Exhibit 10.5 to the Quarterly Report on Form 10-Q for the quarter ended December 31, 2002 and hereby incorporated by reference).** | |
| 10.25 | Form of Benefit Agreement under the Supplemental Executive Retirement Plan. (Filed as Exhibit 10.14 to the Annual Report on Form 10-K for the fiscal year ended June 30, 2006 and hereby incorporated by reference).** | |
| 10.26 | Harman International Industries, Inc. Deferred Compensation Plan, effective June 1, 1997. (Filed as Exhibit 4 to the Registration Statement on Form S-8 filed with the Commission on June 9, 1997, and hereby incorporated by reference).** | |
115
Table of Contents
| Exhibit |
Exhibit Description | |
| 10.27 | Amendment No. 1 to the Harman International Industries, Inc. Deferred Compensation Plan dated October 1, 1999. (Filed as Exhibit 10.46 to the Annual Report on Form 10-K for the fiscal year ended June 30, 2000 and hereby incorporated by reference).** | |
| 10.28 | Amendment No. 2 to the Harman International Industries, Inc. Deferred Compensation Plan, effective December 16, 2003. (Filed as Exhibit 10.1 to the Quarterly Report on Form 10-Q for the quarter ended December 31, 2003 and hereby incorporated by reference).** | |
| 10.29 | Letter Agreement, dated May 8, 2007, between Harman International Industries, Incorporated and Dinesh Paliwal. (Filed as Exhibit 10.1 to the Current Report on Form 8-K filed with the Commission on May 9, 2007 and hereby incorporated by reference).** | |
| 10.30 | Amendment to Letter Agreement, dated November 29, 2007, between Harman International Industries, Incorporated and Dinesh Paliwal. (Filed as Exhibit 10.2 to the Current Report on Form 8-K filed with the Commission on December 4, 2007 and hereby incorporated by reference).** | |
| 10.31 | Amendment to Letter Agreement, dated December 31, 2008 between Harman International Industries, Incorporated and Dinesh Paliwal. (Filed as Exhibit 10.4 to the Quarterly Report on Form 10-Q for the quarter ended December 31, 2008 and hereby incorporated by reference).** | |
| 10.32 | Amended and Restated Severance Agreement between Harman International Industries, Incorporated and Dinesh Paliwal dated December 31, 2008. (Filed as Exhibit 10.2 to the Quarterly Report on Form 10-Q for the quarter ended December 31, 2008 and hereby incorporated by reference).** | |
| 10.33 | Amendment to Letter Agreement, dated September 1, 2009, between Harman International Industries, Incorporated and Dinesh Paliwal. (Filed as Exhibit 10.4 to the Current Report on Form 8-K filed with the Commission on September 1, 2009 and hereby incorporated by reference).** | |
| 10.34 | Summary of equity awards granted to Mr. Paliwal and Mr. Parker in September 2008. (Filed as Exhibit 10.3 to the Quarterly Report on Form 10-Q for the quarter ended September 30, 2008 and hereby incorporated by reference).** | |
| 10.35 | Letter Agreement, dated May 2, 2008, between Harman International Industries, Incorporated and Herbert Parker. (Filed as Exhibit 10.2 to the Current Report on Form 8-K filed with the Commission on May 6, 2008 and hereby incorporated by reference).** | |
| 10.36 | Employment Agreement, dated January 11, 2008, between Harman International Industries, Incorporated and John Stacey. (Filed as Exhibit 10.3 to the Quarterly Report on Form 10-Q for the quarter ended March 31, 2008 and hereby incorporated by reference).** | |
| 10.37 | Letter Agreement, dated August 8, 2008, between Harman International Industries, Incorporated and Jennifer Peter. (Filed as Exhibit 10.1 to the Current Report on Form 8-K filed with the Commission on August 21, 2008 and hereby incorporated by reference).** | |
| 10.38 | Letter Agreement, dated August 22, 2008, between Harman International Industries, Incorporated and Todd Suko. (Filed as Exhibit 10.1 to the Quarterly Report on Form 10-Q for the quarter ended September 30, 2008 and hereby incorporated by reference).** | |
| 10.39 | Amended and Restated Severance Agreement between Harman International Industries, Incorporated and Herbert Parker dated December 22, 2008. (Filed as Exhibit 10.3 to the Quarterly Report on Form 10-Q for the quarter ended December 31, 2008 and hereby incorporated by reference).** | |
| 10.40 | Letter Agreement, dated January 9, 2009, between Harman International Industries, Incorporated and Sachin Lawande. (Filed as Exhibit 10.13 to the Quarterly Report on Form 10-Q for the quarter ended December 31, 2008 and hereby incorporated by reference).** | |
116
Table of Contents
| Exhibit |
Exhibit Description | |
| 10.41 | Letter Agreement, dated January 9, 2009, between Harman International Industries, Incorporated and David Slump. (Filed as Exhibit 10.14 to the Quarterly Report on Form 10-Q for the quarter ended December 31, 2008 and hereby incorporated by reference).** | |
| 10.42 | Form of Severance Agreement between Harman International Industries, Incorporated and Blake Augsburger, David Karch, Sachin Lawande, David Slump, John Stacey and Todd Suko. (Filed as Exhibit 10.3 to the Quarterly Report on Form 10-Q for the quarter ended March 31, 2009 and hereby incorporated by reference).** | |
| 10.43 | Form of Severance Agreement between Harman International Industries, Incorporated, and each of Herbert Parker, Blake Augsburger, David Karch, Sachin Lawande, David Slump, John Stacey and Todd Suko. (Filed as Exhibit 10.1 to the Current Report on Form 8-K filed with the Commission on April 26, 2010 and hereby incorporated by reference).** | |
| 10.44 | Harman International Industries, Incorporated 2012 Stock Option and Incentive Plan. (Filed as Appendix A to the Proxy Statement dated October 28, 2011 and hereby incorporated by reference).** | |
| 10.45 | Form of Non-Qualified Stock Option Agreement for Officers and Key Employees under the Harman International Industries, Incorporated 2012. (Filed as Exhibit 10.1 to the Current Report on Form 8-K filed with the Commission on April 2, 2012 and hereby incorporated by reference). | |
| 10.46 | Letter Agreement, dated September 15, 2011, between Harman International Industries, Incorporated and I.P. Park. (Filed as Exhibit 10.3 to the Quarterly Report on Form 10-Q for the quarter ended December 31, 2012 and hereby incorporated by reference).** | |
| 10.47 | Form of Severance Agreement between Harman International Industries, Incorporated, and each of Michael Mauser and I.P. Park. (Filed as Exhibit 10.1 to the Current Report on Form 8-K filed with the Commission on September 12, 2012 and hereby incorporated by reference).** | |
| 10.48 | Amendment No. 1 to the Harman International Industries, Incorporated 2012 Stock Option and Incentive Plan. (Filed as Appendix A to the 2013 Proxy Statement and hereby incorporated by reference).** | |
| 10.49 | Severance Agreement between Harman International Industries, Incorporated and Ralph Santana dated March 26, 2014. (Filed as Exhibit 10.1 to the Quarterly Report on Form 10-Q filed with the Commission on May 1, 2014 and hereby incorporated by reference).** | |
| 10.50 | Severance Letter Agreement between Harman International Industries, Incorporated and Ralph Santana dated March 26, 2014. (Filed as Exhibit 10.2 to the Quarterly Report on Form 10-Q filed with the Commission on May 1, 2014 and hereby incorporated by reference).** | |
| 10.51 | Employment Agreement dated March 6, 2013 between Harman International Industries, Incorporated and Ralph Santana. (Filed as Exhibit 10.1 to the Quarterly Report on Form 10-Q filed with the Commission on May 2, 2013 and hereby incorporated by reference).** | |
| 10.52 | Form of Restricted Share Unit Agreement for Non-Officer Directors under the Harman International Industries, Incorporated Amended and Restated 2012 Stock Option and Incentive Plan. (Filed as Exhibit 10.1 to the Current Report on Form 8-K filed with the Commission on June 26, 2013 and hereby incorporated by reference).** | |
| 21.1 | Subsidiaries of Harman International Industries, Incorporated.+ | |
| 23.1 | Consent of KPMG LLP. + | |
| 31.1 | Certification of Dinesh Paliwal filed pursuant to Section 302 of the Sarbanes-Oxley Act of 2002.+ | |
117
Table of Contents
| Exhibit |
Exhibit Description | |
| 31.2 | Certification of Herbert Parker filed pursuant to Section 302 of the Sarbanes-Oxley Act of 2002.+ | |
| 32.1 | Certification of Dinesh Paliwal and Herbert Parker filed pursuant to 18 U.S.C. Section 1350, as adopted pursuant to Section 906 of the Sarbanes-Oxley Act of 2002.+ | |
| 99.1 | Form of Indemnification Letter Agreement with Directors and Executive Officers. (filed as Exhibit 99.1 to the Current Report on Form 8-K filed with the Commission on February 13, 2009 and hereby incorporated by reference) | |
| 101.INS | XBRL Instance Document.* | |
| 101.SCH | XBRL Taxonomy Extension Schema.* | |
| 101.CAL | XBRL Taxonomy Calculation Linkbase.* | |
| 101.DEF | XBRL Taxonomy Definition Linkbase.* | |
| 101.LAB | XBRL Taxonomy Label Linkbase.* | |
| 101.PRE | XBRL Presentation Linkbase.* | |
| * | Submitted electronically herewith. |
| ** | Management contract, compensatory plan or arrangement. |
| + | Filed herewith. |
Attached as Exhibit 101 to this report are the following financial information formatted in XBRL (Extensible Business Reporting Language): (i) Consolidated Balance Sheets at June 30, 2014 and 2013, (ii) Consolidated Statements of Income for the years ended June 30, 2014, 2013 and 2012, (iii) Consolidated Statements of Comprehensive Income for the years ended June 30, 2014, 2013 and 2012, (iv) Consolidated Statements of Cash Flows for the years ended June 30, 2014, 2013 and 2012, (v) Consolidated Statements of Shareholders’ Equity for the years ended June 30, 2014, 2013 and 2012 and (vi) Notes to Consolidated Financial Statements.
118
Table of Contents
Pursuant to the requirements of Section 13 or 15(d) of the Securities Exchange Act of 1934, the registrant has duly caused this report to be signed on its behalf by the undersigned, thereunto duly authorized.
| HARMAN INTERNATIONAL INDUSTRIES, INCORPORATED | ||||||
| Date: August 7, 2014 | By: | /S/ DINESH PALIWAL | ||||
| Dinesh Paliwal | ||||||
| Chairman, President and Chief Executive Officer | ||||||
Pursuant to the requirements of the Securities Exchange Act of 1934, this report has been signed below by the following persons on behalf of the registrant in the capacities indicated below.
| /S/ DINESH PALIWAL Dinesh Paliwal |
Chairman, President and Chief Executive Officer (Principal Executive Officer) |
August 7, 2014 | ||
| /S/ HERBERT PARKER Herbert Parker |
Executive Vice President and Chief Financial Officer (Principal Financial Officer) |
August 7, 2014 | ||
| /S/ JENNIFER PETER Jennifer Peter |
Vice President and Chief Accounting Officer (Principal Accounting Officer) |
August 7, 2014 | ||
| /S/ ADRIANE BROWN Adriane Brown |
Director |
August 7, 2014 | ||
| /S/ JOHN DIERCKSEN John Diercksen |
Director |
August 7, 2014 | ||
| /S/ ANN MCLAUGHLIN KOROLOGOS Ann McLaughlin Korologos |
Director |
August 7, 2014 | ||
| /S/ DR. JIREN LIU Dr. Jiren Liu |
Director |
August 7, 2014 | ||
| /S/ EDWARD MEYER Edward Meyer |
Director |
August 7, 2014 | ||
| /S/ KENNETH REISS Kenneth Reiss |
Director |
August 7, 2014 | ||
| /S/ HELLENE RUNTAGH Hellene Runtagh |
Director |
August 7, 2014 | ||
| /S/ FRANK SKLARSKY Frank Sklarsky |
Director |
August 7, 2014 | ||
|
Gary Steel |
Director |
August 7, 2014 | ||
119
Table of Contents
HARMAN INTERNATIONAL INDUSTRIES, INCORPORATED
Valuation and Qualifying Accounts and Reserves
Year Ended June 30, 2014, 2013 and 2012
(in thousands)
| Classification |
Balance at Beginning of Period |
Charged to Costs and Expenses |
Charged to Other Accounts |
Additions/ (Deductions) |
Balance at End of Period |
|||||||||||||||
| Year ended June 30, 2012 |
||||||||||||||||||||
| Allowance for doubtful accounts |
$ | 6,972 | 3,413 | (501 | ) | (3,929 | ) | $ | 5,955 | |||||||||||
|
|
|
|
|
|
|
|
|
|
|
|||||||||||
| Year ended June 30, 2013(1) |
||||||||||||||||||||
| Allowance for doubtful accounts |
$ | 5,955 | 3,052 | 17 | 2,167 | $ | 11,191 | |||||||||||||
|
|
|
|
|
|
|
|
|
|
|
|||||||||||
| Year ended June 30, 2014(1) |
||||||||||||||||||||
| Allowance for doubtful accounts |
$ | 11,191 | 4,685 | 426 | (6,718 | ) | $ | 9,584 | ||||||||||||
|
|
|
|
|
|
|
|
|
|
|
|||||||||||
| (1) | Includes purchase accounting adjustments related to the acquisition of Martin Professional A/S. |
120
Table of Contents
Harman International Industries, Incorporated
2014 Form 10-K Annual Report
Exhibit Document
The following exhibits are attached hereto. See Part IV of this Annual Report on Form 10-K for a complete list of exhibits.
| Exhibit |
Exhibit Description | |
| 21.1 | Subsidiaries of Harman International Industries, Incorporated. | |
| 23.1 | Consent of KPMG LLP. | |
| 31.1 | Certification of Dinesh Paliwal filed pursuant to Section 302 of the Sarbanes-Oxley Act of 2002. | |
| 31.2 | Certification of Herbert Parker filed pursuant to Section 302 of the Sarbanes-Oxley Act of 2002. | |
| 32.1 | Certification of Dinesh Paliwal and Herbert Parker filed pursuant to 18 U.S.C. Section 1350, as adopted pursuant to Section 906 of the Sarbanes-Oxley Act of 2002. | |
| 101.INS | XBRL Instance Document.* | |
| 101.SCH | XBRL Taxonomy Extension Schema.* | |
| 101.CAL | XBRL Taxonomy Calculation Linkbase.* | |
| 101.DEF | XBRL Taxonomy Definition Linkbase.* | |
| 101.LAB | XBRL Taxonomy Label Linkbase.* | |
| 101.PRE | XBRL Presentation Linkbase.* | |
| * | Submitted electronically herewith. |
Attached as Exhibit 101 to this report are the following financial information formatted in XBRL (Extensible Business Reporting Language): (i) Consolidated Balance Sheets at June 30, 2014 and 2013, (ii) Consolidated Statements of Income for the years ended June 30, 2014, 2013 and 2012, (iii) Consolidated Statements of Comprehensive Income for the years ended June 30, 2014, 2013 and 2012, (iv) Consolidated Statements of Cash Flows for the years ended June 30, 2014, 2013 and 2012, (v) Consolidated Statements of Shareholders’ Equity for the years ended June 30, 2014, 2013 and 2012 and (vi) Notes to Consolidated Financial Statements.