Attached files
| file | filename |
|---|---|
| 8-K - FORM 8-K - FEDERAL HOME LOAN MORTGAGE CORP | d768481d8k.htm |
| EX-99.2 - EXHIBIT 99.2 - FEDERAL HOME LOAN MORTGAGE CORP | d768481dex992.htm |
Exhibit 99.1

|
News Release |
FOR IMMEDIATE RELEASE
August 7, 2014
MEDIA CONTACT: Lisa Gagnon
703-903-3385
INVESTOR CONTACT: Robin Phillips
571-382-4732
FREDDIE MAC REPORTS NET INCOME OF $1.4 BILLION,
COMPREHENSIVE INCOME OF $1.9 BILLION FOR SECOND QUARTER 2014
Company to Return Additional $1.9 Billion to Taxpayers in Third Quarter
Families Helped to Avoid Foreclosure Reaches 1 Million Milestone
Second Quarter 2014 Financial Results
| — | Net income was $1.4 billion – the company’s eleventh consecutive quarter of positive earnings, compared to $4.0 billion in first quarter of 2014 |
| — | Comprehensive income was $1.9 billion, compared to $4.5 billion in first quarter of 2014 |
| — | Second quarter financial results were primarily driven by credit cycle recovery items |
¡ Lower income from legal settlements on private-label securities of $0.4 billion versus $4.5 billion in first quarter
¡ A shift to credit provision income of $0.6 billion from credit provision expense of $0.1 billion in first quarter
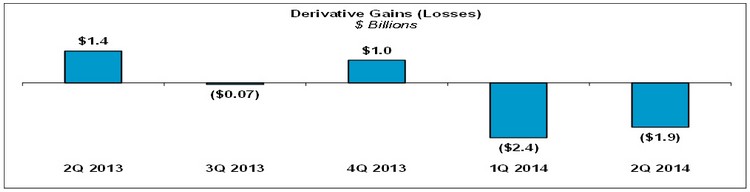
| — | Additionally, results reflect lower derivative losses of $1.9 billion versus $2.4 billion in first quarter |
Treasury Draws and Dividend Payments at June 30, 2014
| — | Based on June 30, 2014 net worth of $4.3 billion, the company’s September 2014 dividend obligation will be $1.9 billion, bringing total cash dividends paid to Treasury to $88.2 billion |
| — | Senior preferred stock held by Treasury remains $72.3 billion, as dividend payments do not reduce prior Treasury draws |
Housing Market Support Since January 1, 2009
| — | Provided $2.3 trillion of liquidity to the mortgage market, including over $116 billion in the first half of 2014 |
¡ 7.9 million refinancings (nearly 275,000 in the first half of 2014)
¡ 2.3 million home purchases (over 251,000 in the first half of 2014)
¡ 1.7 million units of multifamily rental housing (over 114,000 in the first half of 2014)
| — | Helped 1.0 million borrowers to avoid foreclosure (over 64,000 in the first half of 2014) |
Credit Quality at June 30, 2014
| — | Post-2008 book of business continues to grow and now represents 56 percent of single-family credit guarantee portfolio and HARP and other relief refinance loans were an additional 21 percent of that portfolio |
| — | Delinquency rates remained below industry benchmarks: |
¡ Single-family serious delinquency rate was 2.07 percent (compared to 2.79 percent at June 30, 2013)
¡ Multifamily delinquency rate was 0.02 percent
| — | Continued to shift mortgage credit risk to private capital markets through innovative STACR®, ACIS and K-deal offerings, transferring a significant portion of credit risk on nearly $200 billion of mortgages since the start of these efforts through June 30, 2014 |
Freddie Mac Second Quarter 2014 Financial Results
August 7, 2014
Page 2
McLean, VA — Freddie Mac (OTCQB: FMCC) today reported net income of $1.4 billion for the second quarter of 2014, compared to $4.0 billion for the first quarter of 2014. The company also reported comprehensive income of $1.9 billion for the second quarter of 2014, compared to $4.5 billion for the first quarter of 2014.
Summary Financial Results (1)
| Three Months Ended | ||||||||||||||
| ($ Billions) | 3/31/14 | 6/30/14 | Change | |||||||||||
| 1 |
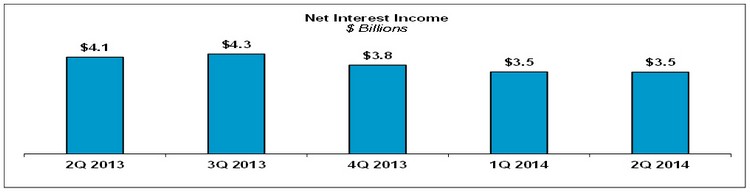
Net interest income | $ | 3.5 | $ | 3.5 | $ | (0.0 | ) | ||||||
| 2 |
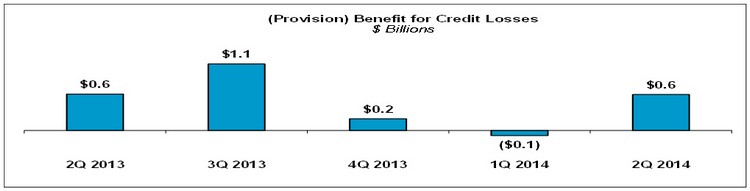
(Provision) benefit for credit losses | (0.1 | ) | 0.6 | 0.7 | |||||||||
| 3 |
Derivative losses | (2.4 | ) | (1.9 | ) | 0.4 | ||||||||
| 4 |
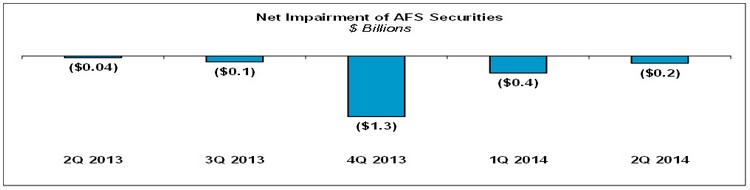
Net impairment | (0.4 | ) | (0.2 | ) | 0.2 | ||||||||
| 5 |
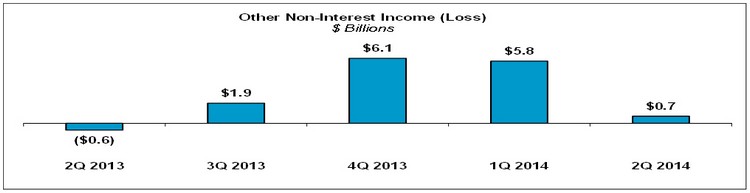
Other non-interest income | 5.8 | 0.7 | (5.1 | ) | |||||||||
| 6 |
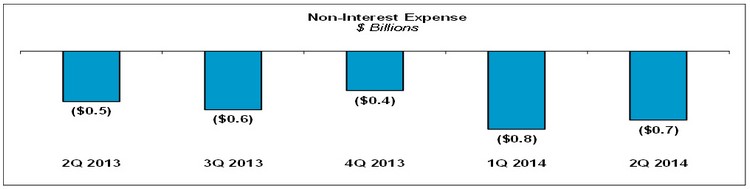
Non-interest expense | (0.8 | ) | (0.7 | ) | 0.1 | ||||||||
|
|
|
|
|
|
|
|||||||||
| 7 |
Pre-tax income | $ | 5.8 | $ | 2.0 | $ | (3.7 | ) | ||||||
| 8 |
Income tax expense | (1.7 | ) | (0.7 | ) | 1.1 | ||||||||
|
|
|
|
|
|
|
|||||||||
| 9 |
Net income | $ | 4.0 | $ | 1.4 | $ | (2.7 | ) | ||||||
| 10 |
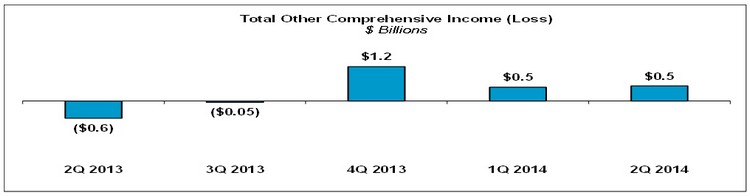
Total other comprehensive income | 0.5 | 0.5 | 0.0 | ||||||||||
|
|
|
|
|
|
|
|||||||||
| 11 |
Comprehensive income | $ | 4.5 | $ | 1.9 | $ | (2.6 | ) | ||||||
|
|
|
|
|
|
|
|||||||||
|
|
|
|
|
|
|
|||||||||
| (1) | Columns and rows may not add due to rounding. See “Appendix - Financial Results Discussion” section for additional information about the company’s financial results for the second quarter of 2014. |
Net Income – Freddie Mac’s net income was $1.4 billion for the second quarter of 2014, down $2.7 billion from the first quarter of 2014. The decrease primarily reflects lower income from legal settlements related to private-label securities (PLS). The impact of lower legal settlements was partially offset by a shift to a benefit for credit losses primarily reflecting improved single-family loss severity and lower losses from derivatives driven by less yield curve flattening in the second quarter compared to the first quarter.
Comprehensive Income – Freddie Mac’s comprehensive income was $1.9 billion for the second quarter of 2014, down $2.6 billion from the first quarter of 2014. The decrease was primarily driven by lower quarterly net income.
Freddie Mac’s earnings may be volatile due to changes in the fair value of the company’s derivative portfolio, which is used to reduce Freddie Mac’s exposure to interest-rate risk. Fair value changes on derivatives are included in earnings, while fair value changes associated with several of the types of assets and liabilities being hedged are not. Therefore, there can be timing mismatches affecting current period earnings, which may not be reflective of the economics of the company’s business. In addition, Freddie Mac’s earnings can vary significantly from quarter to quarter due to changes in the fair value of mortgage securities held by the company, which may fluctuate based on interest rate and mortgage spread movements.
Legal Settlements – Freddie Mac and the Federal Housing Finance Agency (FHFA) continued to reach agreements with a number of institutions to settle litigation related to Freddie Mac’s investment in certain PLS. These settlements contributed $0.4 billion to Freddie Mac’s pre-tax income in the second quarter of 2014, compared to $4.5 billion in the first quarter of 2014. Additionally, Freddie Mac’s settlements of representation
Freddie Mac Second Quarter 2014 Financial Results
August 7, 2014
Page 3
and warranty claims had minimal impact on the company’s pre-tax income in the second quarter of 2014, compared to a benefit of $0.3 billion in the first quarter of 2014.
Sustainability and Variability of Earnings – As Freddie Mac has noted in the past, the level of earnings the company has experienced in recent periods is not sustainable over the long term. During 2013 and through the first quarter of 2014, Freddie Mac reported quarterly comprehensive income ranging from $4.4 billion to $30.4 billion. Freddie Mac’s 2013 financial results included a significant benefit related to the release of the deferred tax asset valuation allowance. As a result, the company no longer maintains a valuation allowance against its net deferred tax asset. Additionally, the company’s 2013 and 2014 financial results included legal settlements of both PLS litigation and representation and warranty claims. Freddie Mac’s financial results in these periods, particularly the level of loan loss provisioning, also benefited significantly from strong home price appreciation, which is moderating. In addition, declines in the size of the company’s mortgage-related investments portfolio, as required by FHFA and the Purchase Agreement with Treasury, will reduce earnings over time. The company’s financial results will also continue to be affected by changes in interest rates, the yield curve, implied volatility, and mortgage spreads (which impact both derivatives and mortgage securities held by Freddie Mac) and therefore can cause significant earnings and net worth variability from period to period.
About Freddie Mac’s Conservatorship
Purchase Agreement with Treasury – Freddie Mac has been operating under conservatorship, with FHFA as Conservator, since September 6, 2008. The support provided by Treasury pursuant to the Purchase Agreement enables the company to maintain access to the debt markets and have adequate liquidity to conduct its normal business operations. Based on Freddie Mac’s net worth of $4.3 billion at June 30, 2014, less the 2014 capital reserve amount of $2.4 billion, the company’s dividend obligation to Treasury in September 2014 will be $1.9 billion. Including the September 2014 dividend obligation, Freddie Mac’s aggregate cash dividends paid to Treasury will total $88.2 billion, $16.8 billion more than cumulative cash draws of $71.3 billion received from Treasury through June 30, 2014. Under the Purchase Agreement, the payment of dividends does not reduce the outstanding liquidation preference. Accordingly, Treasury still maintains a liquidation preference of $72.3 billion on the company’s senior preferred stock as of June 30, 2014.
Treasury Draws and Dividend Payments
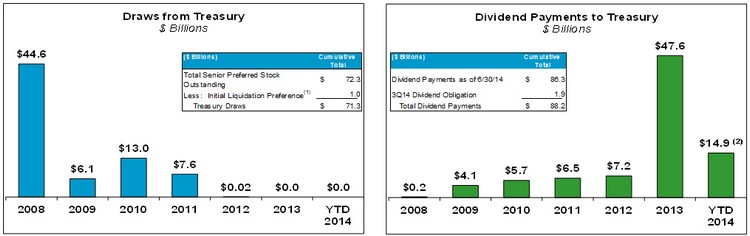
| (1) | The initial $1 billion liquidation preference of senior preferred stock was issued to Treasury in September 2008 as consideration for Treasury’s funding commitment. The company received no cash proceeds as a result of issuing this initial $1 billion liquidation preference of senior preferred stock. |
| (2) | Amount does not include the September 2014 dividend obligation of $1.9 billion. |
Freddie Mac Second Quarter 2014 Financial Results
August 7, 2014
Page 4
In August 2012, the terms governing the company’s dividend obligations on the senior preferred stock were amended. The amended Purchase Agreement does not allow the company to build capital over the long term. Beginning in 2013, the required senior preferred stock dividends each quarter equal the amount, if any, by which the company’s net worth as of the end of the preceding quarter exceeds an applicable capital reserve amount. The applicable capital reserve amount is $2.4 billion for 2014, and will be reduced by $600 million each year thereafter until it reaches zero on January 1, 2018.
The amount of remaining funding available to Freddie Mac under the Purchase Agreement with Treasury is currently $140.5 billion, and will be reduced by any future draws.
Freddie Mac is not permitted to redeem the senior preferred stock prior to the termination of Treasury’s funding commitment under the Purchase Agreement. The limited circumstances under which Treasury’s funding commitment will terminate are described in “BUSINESS — Conservatorship and Related Matters — Treasury Agreements” in the company’s Annual Report on Form 10-K for the year ended December 31, 2013.
Remittance of Guarantee Fees to Treasury – In September 2012, Freddie Mac began remitting proceeds to Treasury from the 10 basis point guarantee fee increase required by the Temporary Payroll Tax Cut Continuation Act of 2011. The cumulative expense related to this increase totals $1.0 billion, including $187 million in the second quarter of 2014.
Housing Market Support
Freddie Mac supports the U.S. housing market by ensuring credit availability for new and refinanced mortgages as well as rental housing. The company also helps struggling homeowners avoid foreclosure and stabilizes communities nationwide. Since the beginning of 2009, Freddie Mac has helped nearly 12 million American families own or rent a home and another 1 million families avoid foreclosure. At the same time, the company is working with FHFA, its customers and the industry to build a stronger housing finance system for the nation.
Number of Families Helped
| (Thousands) | 2009 | 2010 | 2011 | 2012 | 2013 | YTD 6/30/14 |
Cumulative Total |
|||||||||||||||||||||||
| 1 |
Number of families helped to own or rent a home | 2,480 | 2,089 | 1,830 | 2,472 | 2,458 | 639 | 11,968 | ||||||||||||||||||||||
| 2 |
Relief refinance borrowers (includes HARP)(1) | 169 | 533 | 453 | 687 | 611 | 104 | 2,557 | ||||||||||||||||||||||
| 3 |
Other refinance borrowers(1) | 1,595 | 947 | 740 | 996 | 944 | 170 | 5,392 | ||||||||||||||||||||||
| 4 |
Purchase borrowers(1) | 460 | 378 | 326 | 353 | 515 | 251 | 2,283 | ||||||||||||||||||||||
| 5 |
Multifamily rental units | 256 | 231 | 311 | 436 | 388 | 114 | 1,736 | ||||||||||||||||||||||
| 6 |
Number of single families helped to avoid foreclosure(2) | 133 | 275 | 208 | 169 | 168 | 64 | 1,017 | ||||||||||||||||||||||
| 7 |
Loan modifications | 65 | 170 | 109 | 70 | 83 | 35 | 532 | ||||||||||||||||||||||
| 8 |
Repayment plans | 34 | 31 | 33 | 33 | 29 | 14 | 174 | ||||||||||||||||||||||
| 9 |
Forbearance agreements | 15 | 35 | 20 | 13 | 12 | 5 | 100 | ||||||||||||||||||||||
| 10 |
Short sales & deed-in-lieu of foreclosure transactions | 19 | 39 | 46 | 53 | 44 | 10 | 211 | ||||||||||||||||||||||
| 11 |
Total (lines 1+6) | 2,613 | 2,364 | 2,038 | 2,641 | 2,626 | 703 | 12,985 | ||||||||||||||||||||||
| (1) | For the periods presented, a borrower may be counted more than once if the company purchased more than one loan (purchase or refinance mortgage) relating to the same borrower. |
| (2) | These categories are not mutually exclusive and a borrower in one category may also be included within another category in the same period. For the periods presented, a borrower may subsequently go into foreclosure. |
Freddie Mac Second Quarter 2014 Financial Results
August 7, 2014
Page 5
Providing Liquidity – Freddie Mac provides access to financing for new and refinanced mortgages and rental housing. Since the beginning of 2009, the company has provided $2.3 trillion in liquidity to the market through its purchases of loans and issuances of mortgage-related securities, including over $116 billion during the first half of 2014.
Market Liquidity Provided (1)
| ($ Billions) | 2009 | 2010 | 2011 | 2012 | 2013 | YTD 6/30/14 |
Cumulative Total |
|||||||||||||||||||||||
| 1 |
Single-family purchases or issuances(1) | $ | 483 | $ | 390 | $ | 321 | $ | 427 | $ | 423 | $ | 108 | $ | 2,152 | |||||||||||||||
| 2 |
Relief refinance mortgages (includes HARP) | 35 | 106 | 82 | 123 | 99 | 16 | 461 | ||||||||||||||||||||||
| 3 |
Other refinance mortgages | 345 | 200 | 168 | 228 | 210 | 36 | 1,187 | ||||||||||||||||||||||
| 4 |
Purchase mortgages | 94 | 78 | 71 | 76 | 114 | 56 | 489 | ||||||||||||||||||||||
| 5 |
Other(2) | 9 | 6 | - | - | - | - | 15 | ||||||||||||||||||||||
| 6 |
Multifamily loan purchases or guarantees(1)(3) | $ | 17 | $ | 16 | $ | 20 | $ | 29 | $ | 26 | $ | 7 | $ | 115 | |||||||||||||||
| 7 |
Other(4) | $ | 46 | $ | - | $ | 8 | $ | - | $ | 4 | $ | 1 | $ | 59 | |||||||||||||||
| 8 |
Total (lines 1+6+7) | $ | 546 | $ | 406 | $ | 349 | $ | 456 | $ | 453 | $ | 116 | $ | 2,326 | |||||||||||||||
| (1) | Based on unpaid principal balance (UPB) and includes other guarantee commitments. |
| (2) | Includes Ginnie Mae Certificates, HFA initiative-related guarantees, and Other Guarantee Transactions. |
| (3) | Excludes Multifamily issuances of K-deals. |
| (4) | Consists of non-Freddie Mac mortgage-related securities purchased for the company’s mortgage-related investments portfolio. |
Enabling Refinance Activity – Freddie Mac helps borrowers lower their payments and/or improve their mortgage terms by purchasing refinance mortgages. Refinance purchases of $52 billion accounted for 48 percent of the company’s single-family mortgage purchase volume during the first half of 2014. The company estimates that the homeowners who refinanced during the second quarter will reduce their mortgage interest payments by an average of $2,700 during the first 12 months. Since the beginning of 2009, the company has helped 7.9 million homeowners refinance their homes.
Through Freddie Mac’s relief refinance initiative, which includes the Home Affordable Refinance Program (HARP) for loans above 80 percent LTV, the company provided streamlined refinances to over 104,000 borrowers during the first half of 2014. This included approximately 51,000 HARP borrowers who will reduce their mortgage interest payments by an average of about $2,800 during the first 12 months.
Preventing Foreclosures – Freddie Mac helps struggling borrowers retain their homes or otherwise avoid foreclosure. During the first half of 2014, the company completed over 64,000 single-family loan workouts, including over 35,000 loan modifications. This brings the total number of homeowners the company has helped to avoid foreclosure to 1.0 million since the beginning of 2009.
In addition, when foreclosure is unavoidable, Freddie Mac has further helped to stabilize communities by focusing its real estate owned (REO) home sales on owner-occupants, who have made up two–thirds of its purchasers since the beginning of 2009, and by promoting industry-leading standards for property preservation.
Freddie Mac Second Quarter 2014 Financial Results
August 7, 2014
Page 6
Building a Stronger Mortgage Market –Working with FHFA and the industry, Freddie Mac continues to innovate to help develop a stronger, more efficient mortgage market that benefits the nation’s homebuyers, renters and taxpayers. These efforts include shifting risk to the private market through innovative capital market offerings like Structured Agency Credit Risk (STACR) debt notes, Agency Credit Insurance StructureSM (ACIS) transactions and multifamily K-deal securities, strengthening the mortgage market’s infrastructure through the Uniform Mortgage Data Program and the Common Securitization Platform and building a more efficient, customer-focused company. In addition, the company is executing against the objectives set forth by FHFA in the 2014 Conservatorship Scorecard. These support FHFA’s three strategic goals for Freddie Mac: maintain foreclosure prevention activities and credit availability for new and refinanced mortgages, reduce taxpayer risk through increasing the role of private capital in the mortgage market and build a new single-family securitization infrastructure.
Credit Quality
New Single-Family Book – At June 30, 2014, the company’s new single-family book (loans acquired after 2008, excluding HARP and other relief refinance mortgages) accounted for 56 percent of the UPB of Freddie Mac’s single-family credit guarantee portfolio. Since 2008, Freddie Mac has enhanced its credit and underwriting policies, mortgage lenders have delivered fewer loans with higher-risk characteristics, and overall the company has seen positive changes in the underwriting practices of lenders and mortgage insurers. These factors have contributed to the improved credit quality of the company’s new single-family book, including low delinquency rates and credit losses.
Single-Family Credit Guarantee Portfolio – Concentration of Credit Risk
| As of 6/30/14 | YTD 6/30/14 | |||||
| % of Portfolio | Serious Delinquency Rate |
% of Credit Losses | ||||
| New single-family book (1) |
56% | 0.23% | 3% | |||
| HARP and other relief refinance loans |
21 | 0.66% | 7 | |||
| 2005-2008 legacy single-family book |
15 | 7.93% | 81 | |||
| Pre-2005 legacy single-family book |
8 | 3.11% | 9 | |||
| Total |
100% | 2.07% | 100% | |||
| (1) | Loans acquired after 2008. Excludes HARP and other relief refinance loans. |
HARP and Other Relief Refinance Loans – HARP and other relief refinance loans represented 21 percent of the UPB of Freddie Mac’s single-family credit guarantee portfolio at June 30, 2014. HARP loans generally reflect many of the credit risk attributes of the original loans, particularly LTV ratios, and thus generally present higher risk to the company than other refinance loans the company has purchased since 2009. However, in many cases, the borrowers’ payments are reduced through HARP refinancing, thereby strengthening the borrowers’ potential to make their mortgage payments.
2005-2008 Legacy Single-Family Book – Freddie Mac’s 2005-2008 legacy single-family book continues to represent a declining portion of the company’s single-family credit guarantee portfolio. At June 30, 2014, the
Freddie Mac Second Quarter 2014 Financial Results
August 7, 2014
Page 7
2005-2008 legacy single-family book represented 15 percent of the UPB of the company’s single-family credit guarantee portfolio, but accounted for 81 percent of the company’s single-family credit losses during the first half of 2014. The gradual reduction of Freddie Mac’s 2005-2008 legacy single-family book has positively impacted the payment performance of its overall single-family credit guarantee portfolio.
Single-Family Credit Guarantee Portfolio Purchases – LTV Ratios and Credit Scores
| 2009 | 2010 | 2011 | 2012 | 2013 | YTD 6/30/14 | |||||||
| Weighted Average Original LTV Ratio: |
||||||||||||
| Relief refinance (includes HARP) |
80% | 77% | 77% | 97% | 91% | 84% | ||||||
| All other |
66% | 67% | 67% | 68% | 71% | 76% | ||||||
| Total purchases |
67% | 70% | 70% | 76% | 75% | 77% | ||||||
| Weighted Average Credit Score: |
||||||||||||
| Relief refinance (includes HARP) |
738 | 747 | 744 | 740 | 727 | 712 | ||||||
| All other |
757 | 758 | 759 | 762 | 756 | 747 | ||||||
| Total purchases |
756 | 755 | 755 | 756 | 749 | 742 |
Total single-family loans (including relief refinance loans) purchased by Freddie Mac in the first half of 2014 had a weighted average original LTV ratio of 77 percent and a weighted average FICO score of 742. Recent trends in LTV ratios and credit scores reflect, in part, a higher proportion of home purchase loans in the company’s loan acquisition volume and continued purchases of HARP loans.
Single-family serious delinquency rate was 2.07 percent at June 30, 2014, compared to 2.20 percent at March 31, 2014. The company’s single-family serious delinquency rate is substantially below the rate for the entire U.S. mortgage market. According to the Mortgage Bankers Association’s National Delinquency Survey, the serious delinquency rate on first-lien single-family loans in the U.S. mortgage market was 5.04 percent at March 31, 2014, which is the most recent date for which data is available. Beginning in 2010, Freddie Mac’s single-family serious delinquency rate has declined, primarily due to lower volumes of newly delinquent loans and continued loss mitigation and foreclosure activities for loans in the legacy single-family book. However, the delinquency rate has also been affected by delays, including those due to increases in foreclosure process timeframes, general constraints on servicer capacity and court backlogs (in states that require judicial foreclosure process).
Multifamily delinquency rate (based on loans 60 days or more past due or in the process of foreclosure) was 0.02 percent at June 30, 2014, compared to 0.04 percent at March 31, 2014, reflecting continued strong multifamily portfolio performance.
Additional Information
For more information, including that related to Freddie Mac’s financial results, conservatorship and related matters, see the company’s Quarterly Report on Form 10-Q for the quarter ended June 30, 2014, and the company’s Consolidated Financial Statements and Financial Results Supplement. These documents are available on the Investor Relations page of the company’s Web site at www.FreddieMac.com/investors.
Freddie Mac Second Quarter 2014 Financial Results
August 7, 2014
Page 8
Additional information about Freddie Mac and its business is also set forth in the company’s filings with the SEC, which are available on the Investor Relations page of the company’s Web site at www.FreddieMac.com/investors and the SEC’s Web site at www.sec.gov. Freddie Mac encourages all investors and interested members of the public to review these materials for a more complete understanding of the company’s financial results and related disclosures.
* * * *
This press release contains forward-looking statements, which may include statements pertaining to the conservatorship, the company’s current expectations and objectives for its single-family, multifamily and investment businesses, its loan workout initiatives and other efforts, and other programs to assist the U.S. residential mortgage market, liquidity, capital management, economic and market conditions and trends, market share, the effect of legislative and regulatory developments, and new accounting guidance, credit quality of loans the company owns or guarantees, and results of operations and financial condition on a GAAP, Segment Earnings and fair value basis. Forward-looking statements involve known and unknown risks and uncertainties, some of which are beyond the company’s control. Management’s expectations for the company’s future necessarily involve a number of assumptions, judgments and estimates, and various factors, including changes in market conditions, liquidity, mortgage spreads, credit outlook, actions by the U.S. government (including FHFA, Treasury and Congress), and the impacts of legislation or regulations and new or amended accounting guidance, could cause actual results to differ materially from these expectations. These assumptions, judgments, estimates and factors are discussed in the company’s Annual Report on Form 10-K for the year ended December 31, 2013, Quarterly Reports on Form 10-Q for the quarters ended March 31, 2014 and June 30, 2014 and Current Reports on Form 8-K, which are available on the Investor Relations page of the company’s Web site at www.FreddieMac.com/investors and the SEC’s Web site at www.sec.gov. The company undertakes no obligation to update forward-looking statements it makes to reflect events or circumstances after the date of this press release.
Freddie Mac was established by Congress in 1970 to provide liquidity, stability and affordability to the nation’s residential mortgage markets. Freddie Mac supports communities across the nation by providing mortgage capital to lenders. Today Freddie Mac is making home possible for one in four home borrowers and is one of the largest sources of financing for multifamily housing. Additional information is available at FreddieMac.com, Twitter @FreddieMac and Freddie Mac’s blog FreddieMac.com/blog.
# # #
Freddie Mac Second Quarter 2014 Financial Results
August 7, 2014
Page 9
Appendix - Financial Results Discussion
Summary Consolidated Statements of Comprehensive Income (1)
| Three Months Ended | ||||||||||||||
| ($ Billions) | 3/31/14 | 6/30/14 | Change | |||||||||||
| 1 |
Net interest income | $ | 3.5 | $ | 3.5 | $ | (0.0 | ) | ||||||
| 2 |
(Provision) benefit for credit losses | (0.1 | ) | 0.6 | 0.7 | |||||||||
| 3 |
Derivative losses | (2.4 | ) | (1.9 | ) | 0.4 | ||||||||
| 4 |
Net impairments of AFS securities recognized in earnings | (0.4 | ) | (0.2 | ) | 0.2 | ||||||||
| 5 |
Other non-interest income | 5.8 | 0.7 | (5.1 | ) | |||||||||
|
|
|
|
|
|
|
|||||||||
| 6 |
Non-interest income (loss) | 3.1 | (1.4 | ) | (4.5 | ) | ||||||||
| 7 |
Administrative expenses | (0.5 | ) | (0.5 | ) | 0.0 | ||||||||
| 8 |
REO operations expense (income) | (0.1 | ) | 0.1 | 0.1 | |||||||||
| 9 |
Temporary Payroll Tax Cut Continuation Act of 2011 expense | (0.2 | ) | (0.2 | ) | (0.0 | ) | |||||||
| 10 |
Other non-interest income (expense) | (0.1 | ) | (0.1 | ) | (0.0 | ) | |||||||
|
|
|
|
|
|
|
|||||||||
| 11 |
Non-interest expense | (0.8 | ) | (0.7 | ) | 0.1 | ||||||||
| 12 |
Pre-tax income | 5.8 | 2.0 | (3.7 | ) | |||||||||
| 13 |
Income tax expense | (1.7 | ) | (0.7 | ) | 1.1 | ||||||||
|
|
|
|
|
|
|
|||||||||
| 14 |
Net income | $ | 4.0 | $ | 1.4 | $ | (2.7 | ) | ||||||
| 15 |
Total other comprehensive income | 0.5 | 0.5 | 0.0 | ||||||||||
|
|
|
|
|
|
|
|||||||||
| 16 |
Comprehensive income | $ | 4.5 | $ | 1.9 | $ | (2.6 | ) | ||||||
|
|
|
|
|
|
|
|||||||||
|
|
|
|
|
|
|
|||||||||
| (1) | Columns and rows may not add due to rounding. |
Net interest income was $3.5 billion for the second quarter of 2014, relatively unchanged from the first quarter of 2014. Net interest yield was 73 basis points for the second quarter of 2014, up slightly from 72 basis points for the first quarter of 2014.
(Provision) benefit for credit losses was a benefit of $0.6 billion for the second quarter of 2014, compared to provision expense of $0.1 billion for the first quarter of 2014. The shift was mostly driven by lower loss severity primarily due to improved recoveries on distressed property dispositions.
Freddie Mac Second Quarter 2014 Financial Results
August 7, 2014
Page 10
Freddie Mac’s loan loss reserves were $22.8 billion at June 30, 2014, compared to $24.1 billion at March 31, 2014. The company’s loan loss reserve balance is increased by a provision for credit losses (and decreased by a benefit for credit losses) and reduced by charge-offs.
Derivative losses were $1.9 billion for the second quarter of 2014, compared to $2.4 billion for the first quarter of 2014. The decrease was primarily driven by lower losses due to less yield curve flattening compared to the first quarter of 2014.
Net impairment of AFS securities recognized in earnings was $0.2 billion for the second quarter of 2014, down slightly from $0.4 billion for the first quarter of 2014.
Other non-interest income was $0.7 billion for the second quarter of 2014, compared to $5.8 billion for the first quarter of 2014. The decrease was mostly driven by a $4.2 billion decrease in legal settlement proceeds related to PLS.
Freddie Mac Second Quarter 2014 Financial Results
August 7, 2014
Page 11
Non-interest expense was $0.7 billion for the second quarter of 2014, down slightly from $0.8 billion for the first quarter of 2014.
Total other comprehensive income was $0.5 billion for the second quarter of 2014, relatively unchanged from the first quarter of 2014.
Segment Financial Results – Freddie Mac’s operations consist of three reportable segments, which are based on the type of business activities each performs — Single-family Guarantee, Investments and Multifamily. Certain activities that are not part of a reportable segment are included in the All Other category.
Freddie Mac Second Quarter 2014 Financial Results
August 7, 2014
Page 12
Summary of Segment Earnings (Loss) and Comprehensive Income (Loss) (1)
| Three Months Ended | ||||||||||||||
| ($ Billions) | 3/31/14 | 6/30/14 | Change | |||||||||||
| Segment Earnings (loss), net of taxes | ||||||||||||||
| 1 |
Single-family Guarantee | $ | 0.3 | $ | 0.6 | $ | 0.3 | |||||||
| 2 |
Investments | 3.3 | 0.3 | (3.0 | ) | |||||||||
| 3 |
Multifamily | 0.4 | 0.5 | 0.1 | ||||||||||
| 4 |
All Other | - | - | - | ||||||||||
|
|
|
|
|
|
|
|||||||||
| 5 |
Total Segment Earnings (loss), net of taxes | $ | 4.0 | $ | 1.4 | $ | (2.7 | ) | ||||||
|
|
|
|
|
|
|
|||||||||
| Comprehensive income (loss) of segments | ||||||||||||||
| 6 |
Single-family Guarantee | $ | 0.3 | $ | 0.6 | $ | 0.3 | |||||||
| 7 |
Investments | 3.8 | 0.9 | (2.9 | ) | |||||||||
| 8 |
Multifamily | 0.4 | 0.4 | (0.0 | ) | |||||||||
| 9 |
All Other | - | - | - | ||||||||||
|
|
|
|
|
|
|
|||||||||
| 10 |
Comprehensive income (loss) of segments | $ | 4.5 | $ | 1.9 | $ | (2.6 | ) | ||||||
|
|
|
|
|
|
|
|||||||||
|
|
|
|
|
|
|
|||||||||
| (1) | Columns and rows may not add due to rounding. |
Single-family Guarantee segment earnings were $0.6 billion for the second quarter of 2014, compared to $0.3 billion for the first quarter of 2014. The increase was primarily driven by the shift to a benefit for credit losses in the second quarter of 2014 from a provision for credit losses in the first quarter of 2014. Comprehensive income for the Single-family Guarantee segment approximated segment earnings for both the first and second quarter of 2014.
Investments segment earnings were $0.3 billion for the second quarter of 2014, compared to $3.3 billion for the first quarter of 2014. The decrease was primarily driven by lower settlement proceeds related to PLS litigation. Comprehensive income for the Investments segment was $0.9 billion for the second quarter of 2014, compared to $3.8 billion for the first quarter of 2014. The decrease reflects lower quarterly segment earnings.
Multifamily segment earnings were $0.5 billion for the second quarter of 2014, up slightly from $0.4 billion for the first quarter of 2014. Comprehensive income for the Multifamily segment was $0.4 billion for the second quarter of 2014, relatively unchanged from the first quarter of 2014.