Attached files
| file | filename |
|---|---|
| EX-99.1 - EX-99.1 - Rockwood Holdings, Inc. | a14-18384_1ex99d1.htm |
| 8-K - 8-K - Rockwood Holdings, Inc. | a14-18384_18k.htm |
Exhibit 99.2
|
|
August 6, 2014 Second Quarter 2014 Results |
|
|
Forward Looking Statements This press release contains, and management may make, certain "forward-looking statements" within the meaning of the Private Securities Litigation Reform Act of 1995. All statements other than statements of historical facts may be forward-looking statements. Words such as "may,” “will,” “should,” “could,” “likely,” “anticipates," “intends,” "believes," "estimates," "expects," "forecasts," “plans,” “projects,” "predicts" and “outlook” and similar words and expressions are intended to identify forward-looking statements. Examples of our forward-looking statements include, among others, statements relating to our outlook, our future operating results on a segment basis, growth prospects, our future Adjusted EBITDA and free cash flows, our share repurchase plans, our use of cash and our strategic initiatives. Although they reflect Rockwood’s current expectations, they involve a number of known and unknown risks, uncertainties and other factors that could cause actual results to differ materially from those expressed or implied, and are not guarantees of future performance. These risks, uncertainties and other factors include, without limitation, Rockwood’s business strategy; our ability to complete our previously announced divestiture; the prospects of and our outlook for our businesses; changes in general economic conditions in Europe and North America and in other locations in which Rockwood currently does business; competitive pricing or product development activities affecting demand for Rockwood’s products; technological changes affecting production of Rockwood’s materials; fluctuations in interest rates, exchange rates and currency values; availability and pricing of raw materials; governmental and environmental regulations and changes in those regulations; fluctuations in energy prices; changes in the end-use markets in which Rockwood’s products are sold; hazards associated with chemicals manufacturing; Rockwood’s ability to access capital markets; Rockwood’s high level of indebtedness; risks associated with negotiating, consummating and integrating acquisitions; risks associated with competition and the introduction of new competing products, especially from the Asia-Pacific region; risks associated with international sales and operations; risks associated with information security and the risks, uncertainties and other factors discussed under "Risk Factors" and “Management’s Discussion and Analysis of Financial Condition and Results of Operations” in Rockwood's periodic reports filed with or furnished to the Securities and Exchange Commission. |
|
|
Forward Looking Statements (continued) This press release also contains certain forward-looking statements with respect to the financial condition, results of operations and business of Albemarle, Rockwood and the combined businesses of Albemarle and Rockwood and with respect to the transaction and the anticipated consequences and benefits of the transaction, the targeted close date for the transaction, product development, changes in productivity, market trends, price, expected growth and earnings, cash flow generation, costs and cost synergies, portfolio diversification, economic trends and outlook. Such statements involve known and unknown risks, uncertainties, and other factors which may cause the actual results, performance, or achievements of Albemarle or Rockwood to be materially different from future results, performance or achievements expressed or implied by such forward-looking statements. Such factors include, without limitation: the receipt and timing of necessary regulatory approvals; the ability to finance the transaction; the ability to successfully operate and integrate Rockwood’s operations and realize estimated synergies; changes in economic and business conditions; changes in financial and operating performance of major customers and industries and markets served by Albemarle or Rockwood; the timing of orders received from customers; the gain or loss of significant customers; competition from other manufacturers; changes in the demand for products; limitations or prohibitions on the manufacture and sale of products; availability of raw materials; changes in the cost of raw materials and energy; changes in markets in general; changes in laws and government regulation impacting operations or products; the occurrence of claims or litigation; the occurrence of natural disasters; political unrest affecting the global economy; political instability affecting manufacturing operations or joint ventures; changes in accounting standards; changes in the jurisdictional mix of the earnings of Albemarle or Rockwood and changes in tax laws and rates; volatility and substantial uncertainties in the debt and equity markets; technology or intellectual property infringement; and decisions that Albemarle or Rockwood may make in the future. In addition, certain factors that could cause actual results to differ materially from these forward-looking statements are listed from time to time in Albemarle’s SEC reports, including, but not limited to, in the section entitled “Item 1A. Risk Factors” in the Annual Report on Form 10-K filed by Albemarle with the SEC on February 25, 2014. These forward-looking statements speak only as of the date of this press release. Rockwood expressly disclaims any obligation or undertaking to disseminate any updates or revisions to any forward-looking statement contained herein to reflect any change in its expectations with regard thereto or any change in events, conditions or circumstances on which any such statement is based. |
|
|
Agenda Second Quarter 2014 Results from Continuing Operations Summary Appendices |
|
|
Second Quarter 2014 Results from Continuing Operations |
|
|
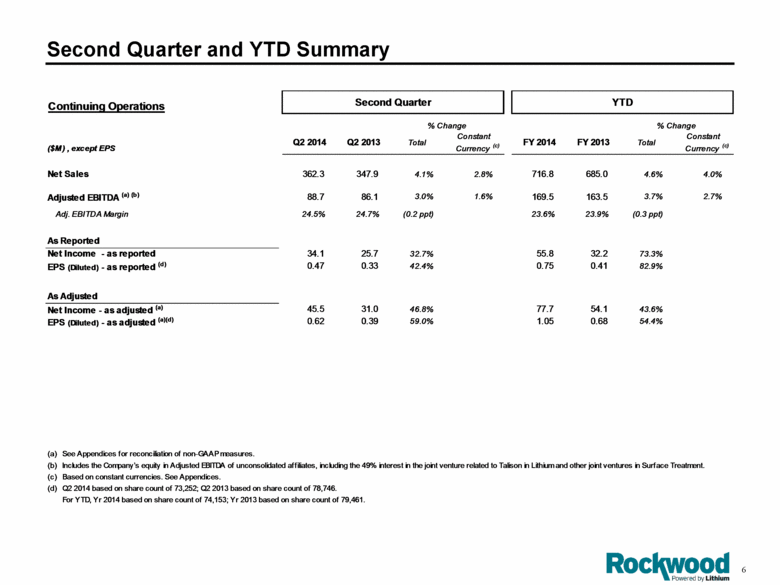
Second Quarter and YTD Summary Continuing Operations Second Quarter YTD % Change % Change ($M) , except EPS Q2 2014 Q2 2013 Total Constant Currency (c) FY 2014 FY 2013 Total Constant Currency (c) Net Sales 362.3 347.9 4.1% 2.8% 716.8 685.0 4.6% Adjusted EBITDA (a) (b) 88.7 86.1 3.0% 1.6% 169.5 163.5 3.7% Adj. EBITDA Margin 24.5% 24.7% (0.2 ppt) 23.6% 23.9% (0.3 ppt) As Reported Net Income - as reported 34.1 25.7 32.7% 55.8 32.2 73.3% EPS (Diluted) - as reported (d) 0.47 0.33 42.4% 0.75 0.41 82.9% As Adjusted Net Income - as adjusted (a) 45.5 31.0 46.8% 77.7 54.14 3.6% EPS (Diluted) - as adjusted (a) (d) 0.62 0.39 59.0% 1.05 0.68 54.4% (a) See Appendices for reconciliation of non-GAAP measures.(b) Includes the Company’s equity in Adjusted EBITDA of unconsolidated affiliates, including the 49% interest in the joint venture related to Talison in Lithium and other joint ventures in Surface Treatment.(c)Based on constant currencies. See Appendices. (d) Q2 2014 based on share count of 73,252; Q2 2013 based on share count of 78,746. For YTD, Yr 2014 based on share count of 74,153; Yr 2013 based on share count of 79,461. |
|
|
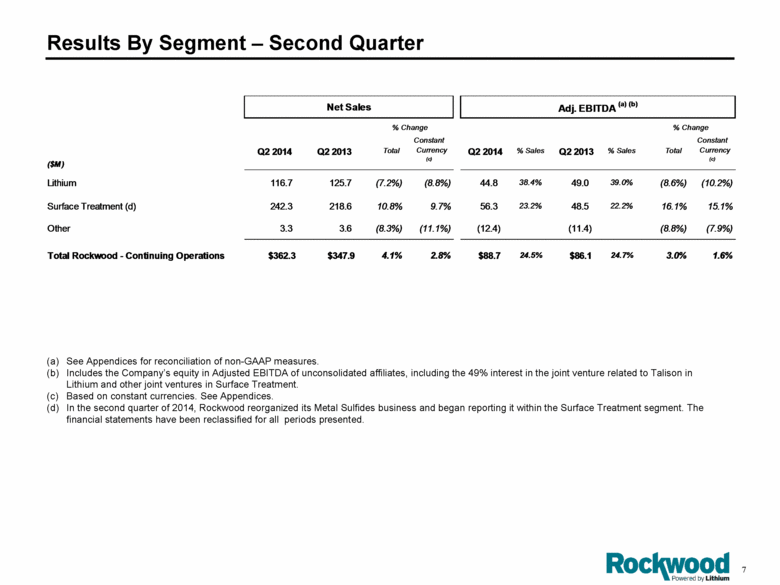
Net Sales Adj. EDITD (a) (b) ($M) Lithium Surface Treatment (d) Other Total Rockwood - Continuing Operations Q2 2014 116.7 24.3 3.3 $362.3 Q2 2013 125.7 218.6 3.6 $347.9 Total (7.2%) 10.8% (8.3%) 4.1% % change Constant Currency (d) (8.8%) 9.7% (11.1%) 2.8% Q2 2014 44.8 56.3 (12.4) $88.7 % Sales 38.4% 23.2% 24.5% Q2 2013 49.0 48.5 (11.4) $86.1 % Sales 39.0% 22.2% 24.7% Total (8.6%) 16.1% (8.8%) 3.0% % Change Constant Currency (d) (10.2%) 15.1% (7.9%) 1.6% Results By Segment – Second Quarter See Appendices for reconciliation of non-GAAP measures. Includes the Company’s equity in Adjusted EBITDA of unconsolidated affiliates, including the 49% interest in the joint venture related to Talison in Lithium and other joint ventures in Surface Treatment. Based on constant currencies. See Appendices. In the second quarter of 2014, Rockwood reorganized its Metal Sulfides business and began reporting it within the Surface Treatment segment. The financial statements have been reclassified for all periods presented. |
|
|
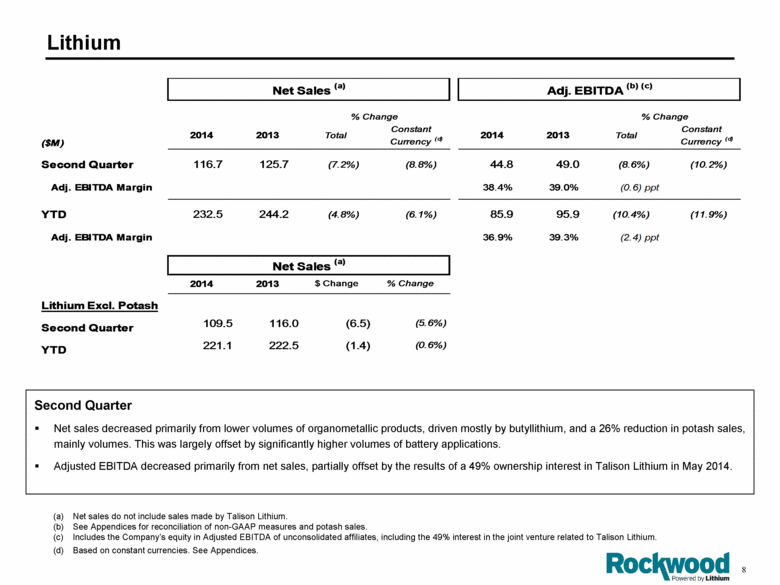
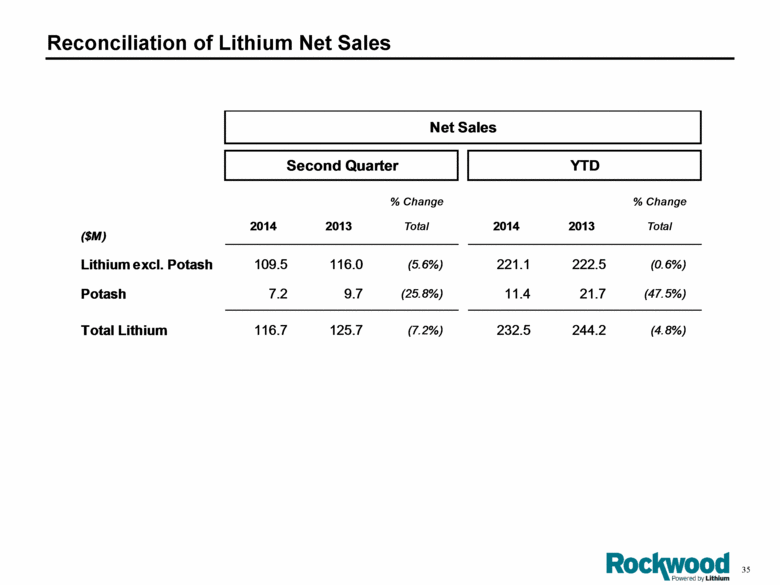
Lithium Second Quarter Net sales decreased primarily from lower volumes of organometallic products, driven mostly by butyllithium, and a 26% reduction in potash sales, mainly volumes. This was largely offset by significantly higher volumes of battery applications. Adjusted EBITDA decreased primarily from net sales, partially offset by the results of a 49% ownership interest in Talison Lithium in May 2014. Net sales do not include sales made by Talison Lithium. See Appendices for reconciliation of non-GAAP measures and potash sales. Includes the Company’s equity in Adjusted EBITDA of unconsolidated affiliates, including the 49% interest in the joint venture related to Talison Lithium. Based on constant currencies. See Appendices. Net Sales (a) Adj. EBITDA (b) (c) % Change % Change ($M) 2014 2013 Total Constant Currency (d) 2014 2013 Total Constant Currency (d) Second Quarter 116.7 125.7 (7.2%) (8.8%) 44.8 49.0 (8.6%) (10.2%) Adj. EBITDA Margin 38.4% 39.0% (0.6) ppt YTD 232.5 244.2 (4.8%) (6.1%) 85.9 95.9 (10.4%) (11.9%) Adj. EBITDA Margin 36.9% 39.3% (2.4) ppt 2014 2013 $ Change % Change Lithium Excl. Potash Second Quarter 109.5 116.0 (6.5) (5.6%) YTD 221.1 222.5 (1.4) (0.6%) Net Sales (a) (a) (b) (c) (d) |
|
|
Surface Treatment Second Quarter Net sales increased primarily due to increased volumes in most markets, particularly driven by higher automotive OEM and automotive components, coil and cold forming, general industry and aerospace applications; the impact of the acquisition of the remaining 50% interest in a previously unconsolidated joint venture in India; and higher selling prices. Adjusted EBITDA increased primarily from higher net sales, partially offset by higher selling, general and administrative costs. Note: In the second quarter of 2014, Rockwood reorganized its Metal Sulfides business and began reporting it within the Surface Treatment segment. The financial statements have been reclassified for all periods presented. See Appendices for reconciliation of non-GAAP measures. Includes the Company’s equity in Adjusted EBITDA of unconsolidated affiliates. Based on constant currencies. See Appendices.
Net sales Adj.EDITDA(a)(b) ($M) 2014 2013 Total %Change Constant Currency (c) 2014 2013 Total %Change Constant Currency (c) Second Quarter 242.3 218.6 10.8% 9.7% 56.3 48.5 16.1% 15.1% Adj.EDITDA Margin 23.2% 22.2% 1.0 ppt YTD 477.9 433.8 10.2% 10.0% 109.7 94.1 16.6% 16.2% Adj. EDITDA Margin 23.0% 21.7% 1.3 ppt and raw material (a) (b) (c) |
|
|
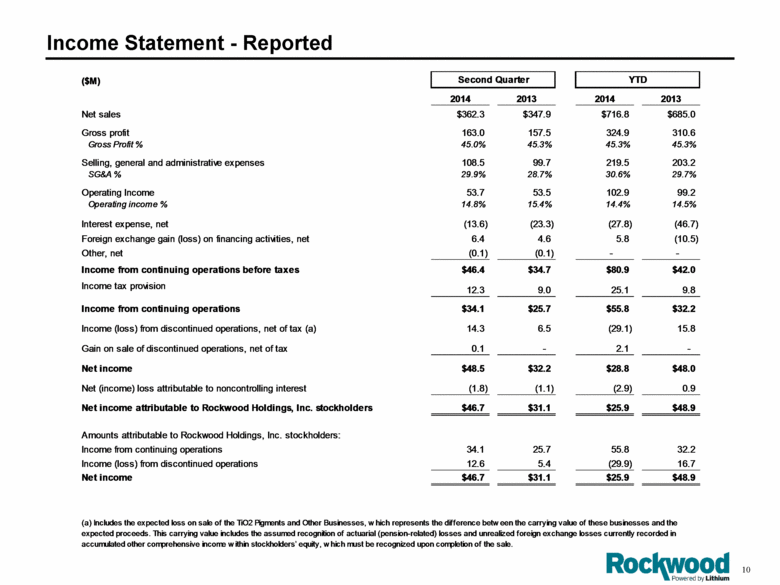
Income Statement - Reported ($M)Second Quarter YTD 2014 2013 2014 2013 Net sales $362.3 $347.9 $716.8 $685.0 Gross profit 163.0 157.5 324.9 310.6 Gross Profit % 45.0% 45.3% 45.3% 45.3% Selling, general and administrative expenses 108.5 99.7 219.5203.2 SG&A % 29.9% 28.7% 30.6% 29.7% Operating Income 53.7 53.5 102.9 99.2 Operating income % 14.8% 15.4% 14.4% 14.5% Interest expense, net(13.6) (23.3) (27.8) (46.7) Foreign exchange gain (loss) on financing activities, net 6.4 4.6 5.8 (10.5) Other, net (0.1) (0.1) - - Income from continuing operations before taxes $46.4 $34.7 $80.9 $42.0 Income tax provision 12.3 9.0 25.1 9.8 Income from continuing operations $34.1 $25.7 $55.8 $32.2 Income (loss) from discontinued operations, net of tax (a)14.3 6.5 (29.1) 15.8 Gain on sale of discontinued operations, net of tax 0.1 - 2.1 - Net income $48.5 $32.2 $28.8 $48.0 Net (income) loss attributable to noncontrolling interest(1.8) (1.1) (2.9) 0.9 Net income attributable to Rockwood Holdings, Inc. stockholders $46.7 $31.1 $25.9 $48.9 Amounts attributable to Rockwood Holdings, Inc. stockholders: Income from continuing operations 34.1 25.7 55.8 32.2 Income (loss) from discontinued operations 12.65.4 (29.9) 16.7 Net income $46.7$31.1$25.9$48.9(a) Includes the expected loss on sale of the TiO2 Pigments and Other Businesses, which represents the difference between the carrying value of these businesses and the expected proceeds. This carrying value includes the assumed recognition of actuarial (pension-related) losses and unrealized foreign exchange losses currently recorded in accumulated other comprehensive income within stockholders’ equity, which must be recognized upon completion of the sale. Amounts attributable to Rockwood Holdings, Inc. stockholders: Income from continuing operations 34.1 25.7 55.8 32.2 Income (loss) from discontinued operations 12.6 5.4 (29.9) 16.7 Net income $46.7 $31.1 $25.9 $48.9 |
|
|
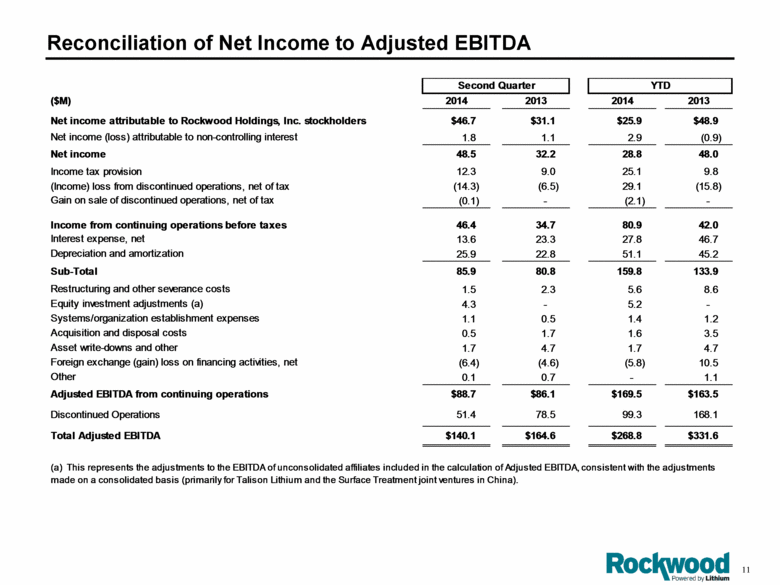
Reconciliation of Net Income to Adjusted EBITDA ($M) 2014 2013 2014 2013 Net income attributable to Rockwood Holdings, Inc. stockholders $46.7 $31.1 $25.9 $48.9 Net income (loss) attributable to non-controlling interest 1.8 1.1 2.9 (0.9) Net income 48.5 32.2 28.8 48.0 Income tax provision 12.3 9.0 25.1 9.8 (Income) loss from discontinued operations, net of tax (14.3) (6.5) 29.1 (15.8) Gain on sale of discontinued operations, net of tax (0.1) - (2.1) - Income from continuing operations before taxes 46.4 34.7 80.9 42.0 Interest expense, net 13.6 23.3 27.8 46.7 Depreciation and amortization 25.9 22.8 51.1 45.2 Sub-Total 85.9 80.8 159.8 133.9 Restructuring and other severance costs 1.5 2.3 5.6 8.6 Equity investment adjustments (a) 4.3 - 5.2 - Systems/organization establishment expenses 1.1 0.5 1.4 1.2 Acquisition and disposal costs 0.5 1.7 1.6 3.5 Asset write-downs and other 1.7 4.7 1.7 4.7 Foreign exchange (gain) loss on financing activities, net (6.4) (4.6) (5.8) 10.5 Other 0.1 0.7 - 1.1 Adjusted EBITDA from continuing operations $88.7 $86.1 $169.5 $163.5 Discontinued Operations 51.4 78.5 99.3 168.1 Total Adjusted EBITDA $140.1 $164.6 $268.8 $331.6 YTD Second Quarter (a) This represents the adjustments to the EBITDA of unconsolidated affiliates included in the calculation of Adjusted EBITDA, consistent with the adjustments made on a consolidated basis (primarily for Talison Lithium and the Surface Treatment joint ventures in China). |
|
|
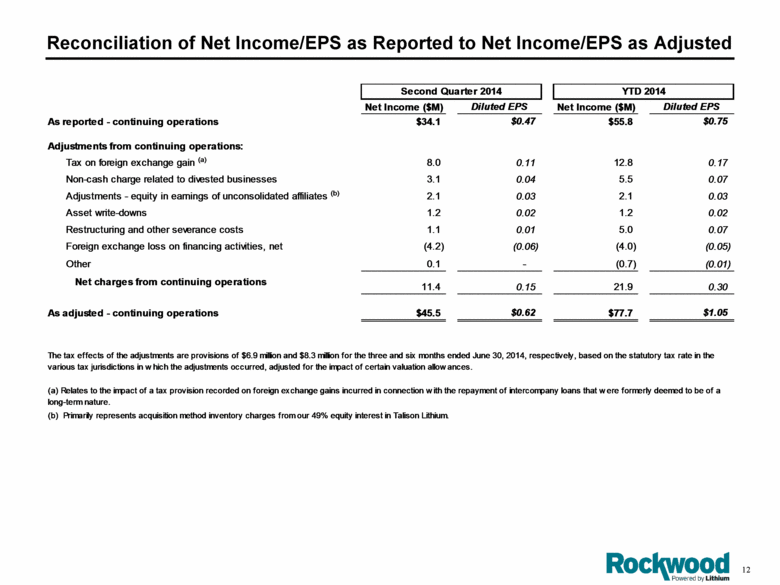
Reconciliation of Net Income/EPS as Reported to Net Income/EPS as Adjusted Net Income ($M) Diluted EPS Net Income ($M) Diluted EPS As reported - continuing operations $34.1 $0.47 $55.8 $0.75 Adjustments from continuing operations: Tax on foreign exchange gain (a) 8.0 0.11 12.8 0.17 Non-cash charge related to divested businesses 3.1 0.04 5.5 0.07 Adjustments - equity in earnings of unconsolidated affiliates (b) 2.1 0.03 2.1 0.03 Asset write-downs 1.2 0.02 1.2 0.02 Restructuring and other severance costs 1.1 0.01 5.0 0.07 Foreign exchange loss on financing activities, net (4.2) (0.06) (4.0) (0.05) Other 0.1 - (0.7) (0.01) Net charges from continuing operations 11.4 0.15 21.9 0.30 As adjusted - continuing operations $45.5 $0.62 $77.7 $1.05 Second Quarter 2014 YTD 2014 (b) Primarily represents acquisition method inventory charges from our 49% equity interest in Talison Lithium. The tax effects of the adjustments are provisions of $6.9 million and $8.3 million for the three and six months ended June 30, 2014, respectively, based on the statutory tax rate in the various tax jurisdictions in which the adjustments occurred, adjusted for the impact of certain valuation allowances. (a) Relates to the impact of a tax provision recorded on foreign exchange gains incurred in connection with the repayment of intercompany loans that were formerly deemed to be of a long-term nature. |
|
|
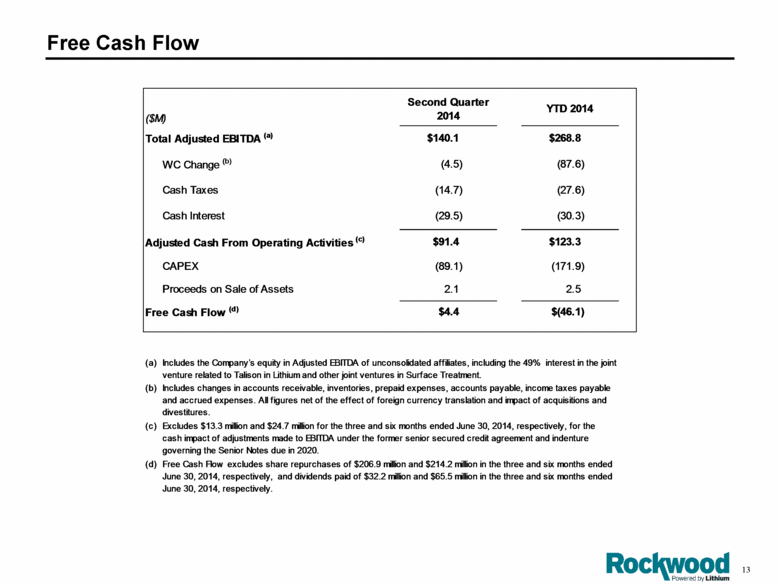
Free Cash Flow ($M)Second Quarter 2014YTD 2014 Total Adjusted EBITDA (a)$140.1 $268.8 WC Change (b)(4.5) (87.6) Cash Taxes(14.7) (27.6) Cash Interest(29.5) (30.3) Adjusted Cash From Operating Activities (c)$91.4 $123.3 CAPEX(89.1) (171.9) Proceeds on Sale of Assets 2.1 2.5 Free Cash Flow (d)$4.4 $(46.1) (a) (b)(c)(d) Includes the Company’s equity in Adjusted EBITDA of unconsolidated affiliates, including the 49% interest in the joint venture related to Talison in Lithium and other joint ventures in Surface Treatment. Includes changes in accounts receivable, inventories, prepaid expenses, accounts payable, income taxes payable and accrued expenses. All figures net of the effect of foreign currency translation and impact of acquisitions and divestitures. Excludes $13.3 million and $24.7 million for the three and six months ended June 30, 2014, respectively, for the cash impact of adjustments made to EBITDA under the former senior secured credit agreement and indenture governing the Senior Notes due in 2020. Free Cash Flow excludes share repurchases of $206.9 million and $214.2 million in the three and six months ended June 30, 2014, respectively, and dividends paid of $32.2 million and $65.5 million in the three and six months ended June 30, 2014, respectively. |
|
|
Summary |
|
|
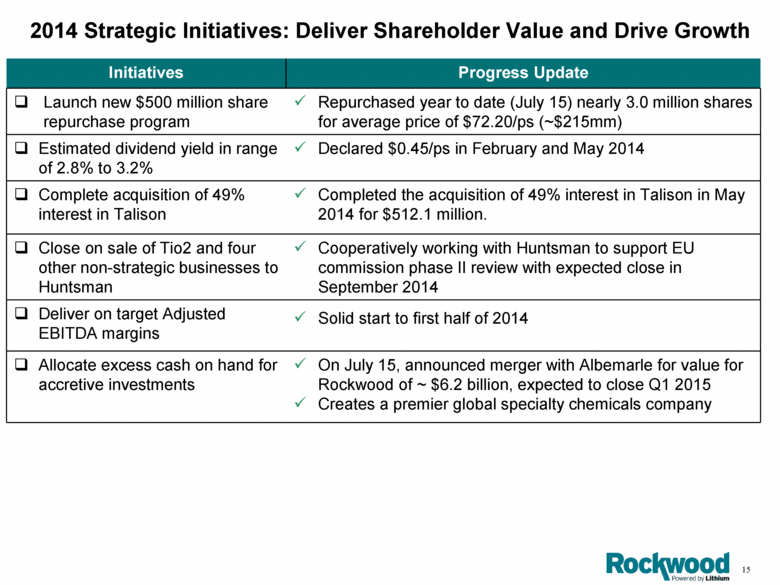
2014 Strategic Initiatives: Deliver Shareholder Value and Drive Growth Initiatives Progress Update Launch new $500 million share repurchase program Repurchased year to date (July 15) nearly 3.0 million shares for average price of $72.20/ps (~$215mm) Estimated dividend yield in range of 2.8% to 3.2% Declared $0.45/ps in February and May 2014 Complete acquisition of 49% interest in Talison Completed the acquisition of 49% interest in Talison in May 2014 for $512.1 million. Close on sale of Tio2 and four other non-strategic businesses to Huntsman Cooperatively working with Huntsman to support EU commission phase II review with expected close in September 2014 Deliver on target Adjusted EBITDA margins Solid start to first half of 2014 Allocate excess cash on hand for accretive investments On July 15, announced merger with Albemarle for value for Rockwood of ~ $6.2 billion, expected to close Q1 2015 Creates a premier global specialty chemicals company |
|
|
Appendices |
|
|
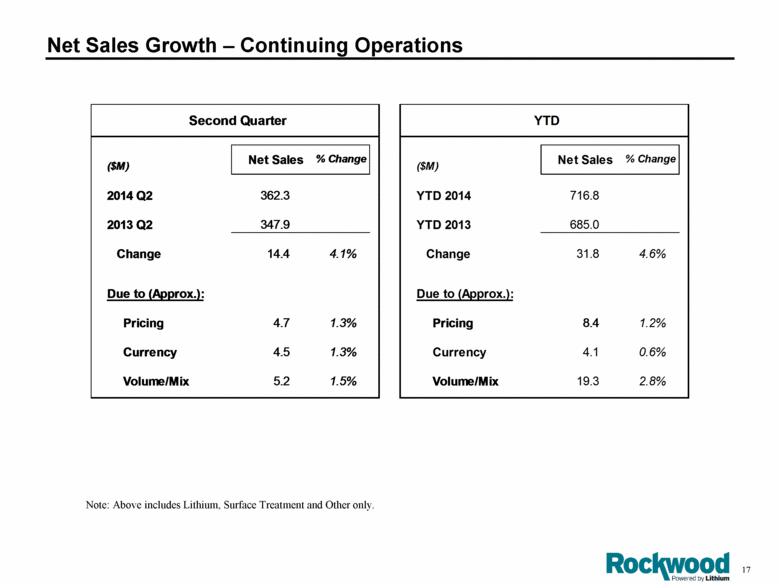
Net Sales Growth – Continuing Operations Note: Above includes Lithium, Surface Treatment and Other only. Second Quarter YTD ($M) Net Sales% Change ($M) Net Sales % Change 2014 Q 2362.3YTD 2014716.82013 Q2347.9YTD 2013685.0 Change 14.4 4.1% Change 31.8 4.6% Due to (Approx.):Due to (Approx.): Pricing 4.7 1.3% Pricing 8.4 1.2% Currency 4.5 1.3% Currency 4.1 0.6% Volume/Mix 5.2 1.5% Volume/Mix 19.3 2.8% |
|
|
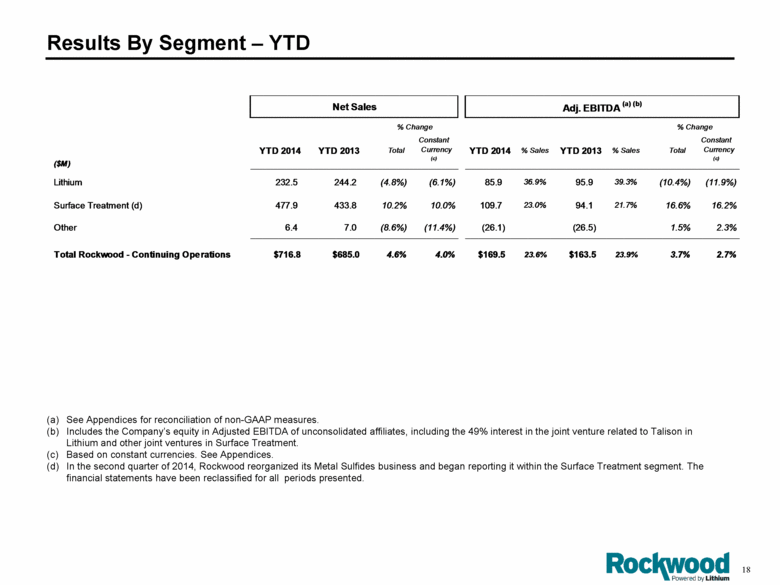
Results By Segment – YTD See Appendices for reconciliation of non-GAAP measures. Includes the Company’s equity in Adjusted EBITDA of unconsolidated affiliates, including the 49% interest in the joint venture related to Talison in Lithium and other joint ventures in Surface Treatment. Based on constant currencies. See Appendices. In the second quarter of 2014, Rockwood reorganized its Metal Sulfides business and began reporting it within the Surface Treatment segment. The financial statements have been reclassified for all periods presented. Net Sales Adj. EBITDA (a) (b)% Change % Change ($M ) YTD 2014 YTD 2013Total Constant Currency (c) YTD 2014 % Sales YTD 2013 % Sales Total Constant Currency (c) Lithium 232.5 244.2 (4.8%) (6.1%) 85.9 36.9% 95.9 39.3% (10.4%) (11.9%) Surface Treatment (d) 477.9 433.8 10.2% 10.0% 109.7 23.0% 94.1 21.7% 16.6% 16.2% Other 6.4 7.0 (8.6%) (11.4%) (26.1) (26.5) 1.5% 2.3% Total Rockwood - Continuing Operations $716.8 $685.0 4.6% 4.0% $169.5 23.6% $163.5 23.9% 3.7% 2.7% (a) (b) (c) (d) |
|
|
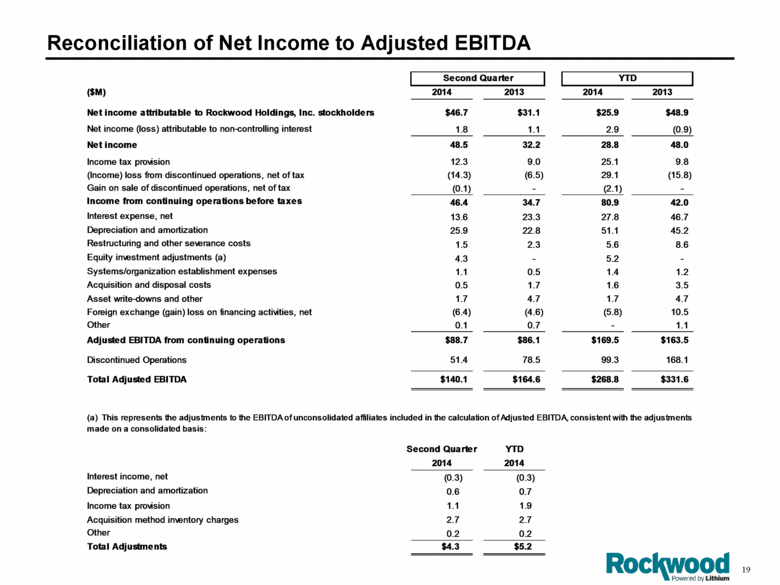
Reconciliation of Net Income to Adjusted EBITDA ($M) 2014 2013 2014 2013 Net income attributable to Rockwood Holdings, Inc. stockholders $46.7 $31.1 $25.9 $48.9 Net income (loss) attributable to non-controlling interest 1.81.1 2.9 (0.9) Net income 48.53 2.22 8.84 8.0 Income tax provision 12.3 9.02 5.1 9.8 (Income) loss from discontinued operations, net of tax(14.3)(6.5)29.1(15.8)Gain on sale of discontinued operations, net of tax(0.1)- (2.1)- Income from continuing operations before taxes 46.4 34.7 80.9 42.0 Interest expense, net 13.6 23.3 27.8 46.7 Depreciation and amortization 25.9 22.8 51.1 45.2 Restructuring and other severance costs 1.5 2.3 5.6 8.6 Equity investment adjustments (a)4.3- 5.2- Systems/organization establishment expenses 1.1 0.5 1.4 1.2 Acquisition and disposal costs 0.5 1.7 1.6 3.5 Asset write-downs and other 1.7 4.7 1.7 4.7 Foreign exchange (gain) loss on financing activities, net(6.4)(4.6)(5.8)10.5 Other 0.10.7- 1.1 Adjusted EBITDA from continuing operations $88.7 $86.1 $169.5 $163.5 Discontinued Operations 51.4 78.5 99.3 16 8.1 Total Adjusted EBITDA $140.1 $164.6 $268.8 $331.6 Second Quarter YTD 2014 2014 Interest income, net(0.3)(0.3)Depreciation and amortization 0.6 0.7 Income tax provision 1.1 1.9 Acquisition method inventory charges 2.7 2.7 Other 0.2 0.2 Total Adjustments $4.3 $5.2 (a) This represents the adjustments to the EBITDA of unconsolidated affiliates included in the calculation of Adjusted EBITDA, consistent with the adjustments made on a consolidated basis: |
|
|
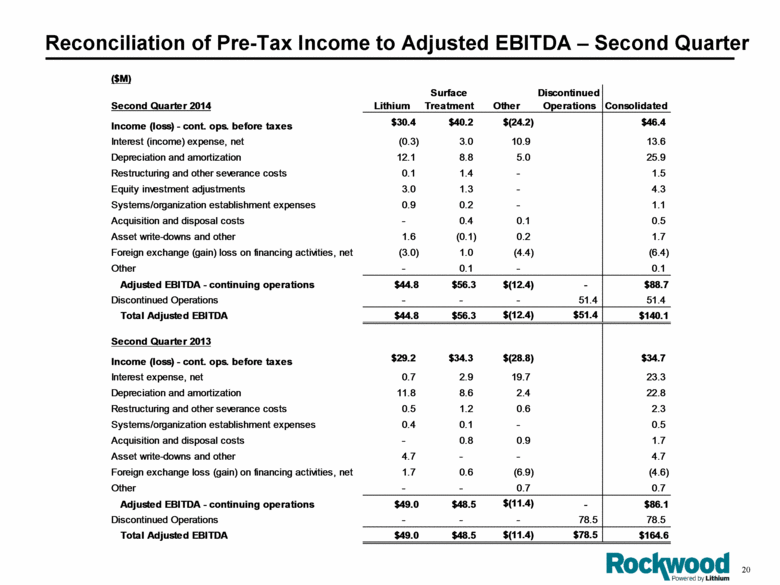
Reconciliation of Pre-Tax Income to Adjusted EBITDA – Second Quarter ($M) Second Quarter 2014 Lithium Surface Treatment Other Discontinued Operations Consolidated Income (loss) - cont. ops. before taxes $30.4 $40.2 $(24.2) $46.4 Interest (income) expense, net (0.3) 3.0 10.9 13.6 Depreciation and amortization 12.1 8.8 5.0 25.9 Restructuring and other severance costs 0.1 1.4 - 1.5 Equity investment adjustments 3.0 1.3 - 4.3 Systems/organization establishment expenses 0.9 0.2 - 1.1 Acquisition and disposal costs - 0.4 0.1 0.5 Asset write-downs and other 1.6 (0.1) 0.2 1.7 Foreign exchange (gain) loss on financing activities, net (3.0) 1.0 (4.4) (6.4) Other - 0.1 - 0.1 Adjusted EBITDA - continuing operations $44.8 $56.3 $(12.4) - $88.7 Discontinued Operations - - - 51.4 51.4 Total Adjusted EBITDA $44.8 $56.3 $(12.4) $51.4 $140.1 Second Quarter 2013 Income (loss) - cont. ops. before taxes $29.2 $34.3 $(28.8) $34.7 Interest expense, net 0.7 2.9 19.7 23.3 Depreciation and amortization 11.8 8.6 2.4 22.8 Restructuring and other severance costs 0.5 1.2 0.6 2.3 Systems/organization establishment expenses 0.4 0.1 - 0.5 Acquisition and disposal costs - 0.8 0.9 1.7 Asset write-downs and other 4.7 - - 4.7 Foreign exchange loss (gain) on financing activities, net 1.7 0.6 (6.9) (4.6) Other - - 0.7 0.7 Adjusted EBITDA - continuing operations $49.0 $48.5 $(11.4) - $86.1 Discontinued Operations - - - 78.5 78.5 Total Adjusted EBITDA $49.0 $48.5 $(11.4) $78.5 $164.6 |
|
|
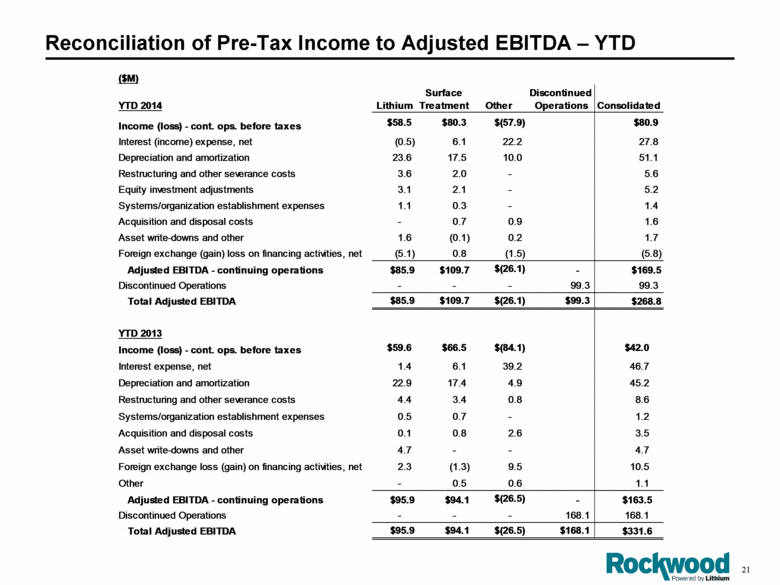
Reconciliation of Pre-Tax Income to Adjusted EBITDA – YTD ($M) YTD 2014 Lithium Surface Treatment Other Discontinued Operations Consolidated Income (loss) - cont. ops. before taxes $58.5 $80.3 $(57.9) $80.9 Interest (income) expense, net (0.5) 6.1 22.2 27.8 Depreciation and amortization 23.6 17.5 10.0 51.1 Restructuring and other severance costs 3.6 2.0 - 5.6 Equity investment adjustments 3.1 2.1 - 5.2 Systems/organization establishment expenses 1.1 0.3 - 1.4 Acquisition and disposal costs - 0.7 0.9 1.6 Asset write-downs and other 1.6 (0.1) 0.2 1.7 Foreign exchange (gain) loss on financing activities, net (5.1) 0.8 (1.5) (5.8) Adjusted EBITDA - continuing operations $85.9 $109.7 $(26.1) - $169.5 Discontinued Operations - - - 99.3 99.3 Total Adjusted EBITDA $85.9 $109.7 $(26.1) $99.3 $268.8 YTD 2013 Income (loss) - cont. ops. before taxes $59.6 $66.5 $(84.1) $42.0 Interest expense, net 1.4 6.1 39.2 46.7 Depreciation and amortization 22.9 17.4 4.9 45.2 Restructuring and other severance costs 4.4 3.4 0.8 8.6 Systems/organization establishment expenses 0.5 0.7 - 1.2 Acquisition and disposal costs 0.1 0.8 2.6 3.5 Asset write-downs and other 4.7 - - 4.7 Foreign exchange loss (gain) on financing activities, net 2.3 (1.3) 9.5 10.5 Other - 0.5 0.6 1.1 Adjusted EBITDA - continuing operations $95.9 $94.1 $(26.5) - $163.5 Discontinued Operations - - - 168.1 168.1 Total Adjusted EBITDA $95.9 $94.1 $(26.5) $168.1 $331.6 |
|
|
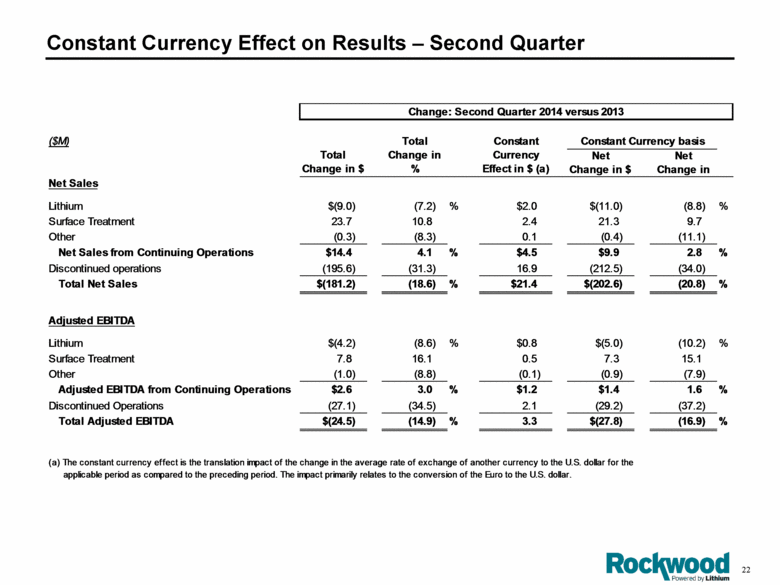
Constant Currency Effect on Results – Second Quarter ($M) Constant Currency basis Net Change in $ Net Change in Net Sales Lithium $(9.0) (7.2) % $2.0 $(11.0) (8.8) % Surface Treatment 23.7 10.8 2.4 21.3 9.7 Other (0.3) (8.3) 0.1 (0.4) (11.1) Net Sales from Continuing Operations $14.4 4.1 % $4.5 $9.9 2.8 % Discontinued operations (195.6) (31.3) 16.9 (212.5) (34.0) Total Net Sales $(181.2) (18.6) % $21.4 $(202.6) (20.8) % Adjusted EBITDA Lithium $(4.2) (8.6) % $0.8 $(5.0) (10.2) % Surface Treatment 7.8 16.1 0.5 7.3 15.1 Other (1.0) (8.8) (0.1) (0.9) (7.9) Adjusted EBITDA from Continuing Operations $2.6 3.0 % $1.2 $1.4 1.6 % Discontinued Operations (27.1) (34.5) 2.1 (29.2) (37.2) Total Adjusted EBITDA $(24.5) (14.9) % 3.3 $(27.8) (16.9) % Change: Second Quarter 2014 versus 2013 (a) The constant currency effect is the translation impact of the change in the average rate of exchange of another currency to the U.S. dollar for the applicable period as comp ared to the preceding period. The impact primarily relates to the conversion of the Euro to the U.S. dollar. Constant Currency Effect in $ (a) Total Change in % Total Change in $ (a) (a) |
|
|
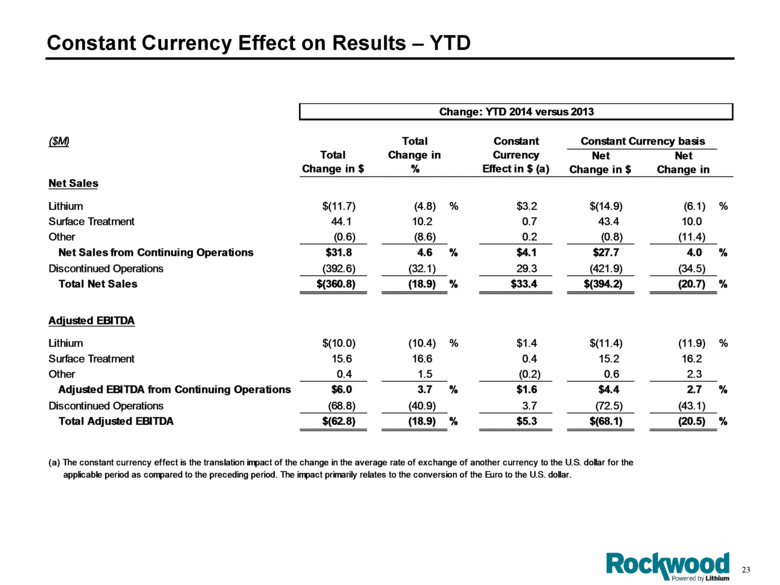
Constant Currency Effect on Results – YTD ($M) Constant Currency basis Net Change in $ Net Change in Net Sales Lithium $(11.7) (4.8) % $3.2 $(14.9) (6.1) % Surface Treatment 44.1 10.2 0.7 43.4 10.0 Other (0.6) (8.6) 0.2 (0.8) (11.4) Net Sales from Continuing Operations $31.8 4.6 % $4.1 $27.7 4.0 % Discontinued Operations (392.6) (32.1) 29.3 (421.9) (34.5) Total Net Sales $(360.8) (18.9) % $33.4 $(394.2) (20.7) % Adjusted EBITDA Lithium $(10.0) (10.4) % $1.4 $(11.4) (11.9) % Surface Treatment 15.6 16.6 0.4 15.2 16.2 Other 0.4 1.5 (0.2) 0.6 2.3 Adjusted EBITDA from Continuing Operations $6.0 3.7 % $1.6 $4.4 2.7 % Discontinued Operations (68.8) (40.9) 3.7 (72.5) (43.1) Total Adjusted EBITDA $(62.8) (18.9) % $5.3 $(68.1) (20.5) % Change: YTD 2014 versus 2013 (a) The constant currency effect is the translation impact of the change in the average rate of exchange of another currency to the U.S. dollar for the applicable period as compared to the preceding period. The impact primarily relates to the conversion of the Euro to the U.S. dollar. Total Change in $ Total Change in % Constant Currency Effect in $ (a) (a) (a) (a) |
|
|
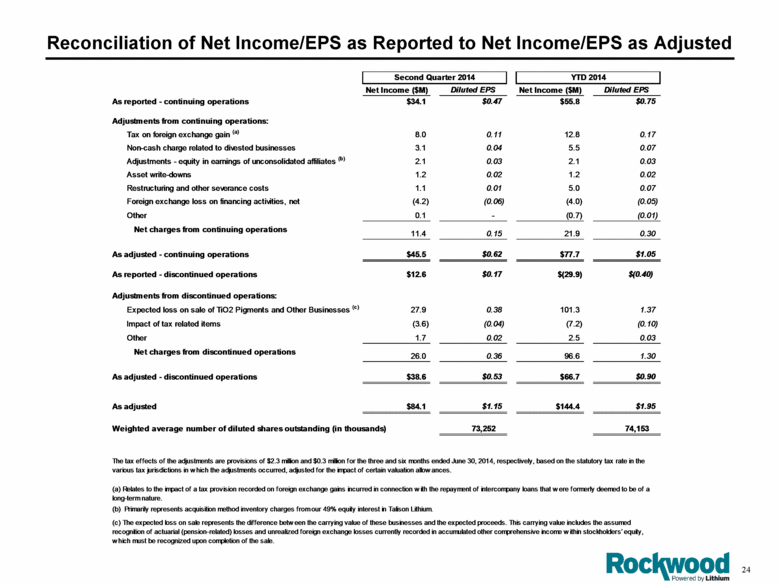
Reconciliation of Net Income/EPS as Reported to Net Income/EPS as Adjusted Net Income ($M) Diluted EPS Net Income ($M) Diluted EPS As reported - continuing operations $34.1 $0.47 $55.8 $0.75 Adjustments from continuing operations: Tax on foreign exchange gain (a) 8.0 0.11 12.8 0.17 Non-cash charge related to divested businesses 3.1 0.04 5.5 0.07 Adjustments - equity in earnings of unconsolidated affiliates (b) 2.1 0.03 2.1 0.03 Asset write-downs 1.2 0.02 1.2 0.02 Restructuring and other severance costs 1.1 0.01 5.0 0.07 Foreign exchange loss on financing activities, net (4.2) (0.06) (4.0) (0.05) Other 0.1 - (0.7) (0.01) Net charges from continuing operations 11.4 0.15 21.9 0.30 As adjusted - continuing operations $45.5 $0.62 $77.7 $1.05 As reported - discontinued operations $12.6 $0.17 $(29.9) $(0.40) Adjustments from discontinued operations: Expected loss on sale of TiO2 Pigments and Other Businesses (c) 27.9 0.38 101.3 1.37 Impact of tax related items (3.6) (0.04) (7.2) (0.10) Other 1.7 0.02 2.5 0.03 Net charges from discontinued operations 26.0 0.36 96.6 1.30 As adjusted - discontinued operations $38.6 $0.53 $66.7 $0.90 As adjusted $84.1 $1.15 $144.4 $1.95 Weighted average number of diluted shares outstanding (in thousands) 73,252 74,153 (a) Relates to the impact of a tax provision recorded on foreign exchange gains incurred in connection with the repayment of intercompany loans that were formerly deemed to be of a long-term nature. The tax effects of the adjustments are provisions of $2.3 million and $0.3 million for the three and six months ended June 30, 2014, respectively, based on the statutory tax rate in the various tax jurisdictions in which the adjustments occurred, adjusted for the impact of certain valuation allowances. Second Quarter 2014 YTD 2014 (b) Primarily represents acquisition method inventory charges from our 49% equity interest in Talison Lithium. (c) The expected loss on sale represents the difference between the carrying value of these businesses and the expected proceeds. This carrying value includes the assumed recognition of actuarial (pension-related) losses and unrealized foreign exchange losses currently recorded in accumulated other comprehensive income within stockholders’ equity, which must be recognized upon completion of the sale. |
|
|
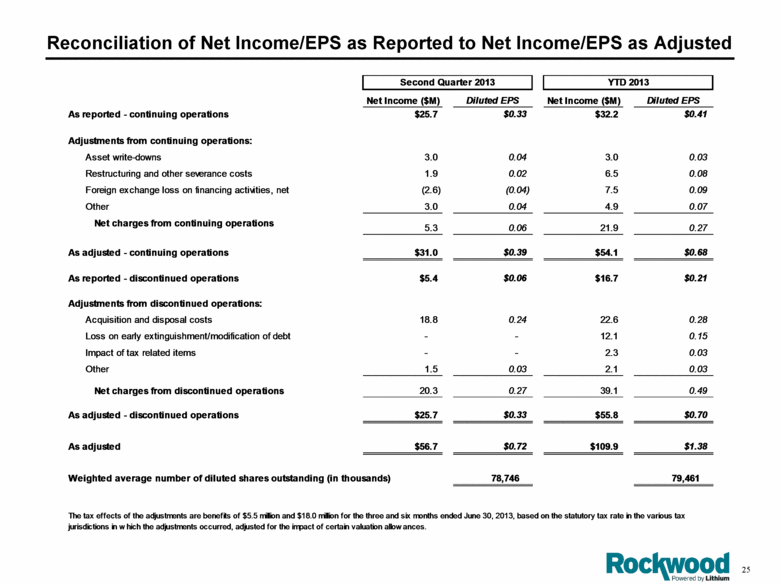
Reconciliation of Net Income/EPS as Reported to Net Income/EPS as Adjusted Net Income ($M)Diluted EPS Net Income ($M)Diluted EPS As reported - continuing operations $25.7 $0.33$32.2 $0.41 Adjustments from continuing operations: Asset write-downs 3.0 0.04 3.0 0.03 Restructuring and other severance costs 1.9 0.02 6.5 0.08 Foreign exchange loss on financing activities, net(2.6)(0.04)7.50.09 Other 3.0 0.0 44.9 0.07 Net charges from continuing operations 5.3 0.0 62 1.9 0.27 As adjusted - continuing operations $31.0 $0.39$54.1 $0.68 As reported - discontinued operations $5.4 $0.06$16.7 $0.21 Adjustments from discontinued operations: Acquisition and disposal costs 18.8 0.24 22.6 0.28 Loss on early extinguishment/modification of debt- - 12.1 0.15 Impact of tax related items- - 2.30.03 Other 1.5 0.03 2.1 0.03 Net charges from discontinued operations 20.3 0.27 39.1 0.49 As adjusted - discontinued operations $25.7 $0.33$55.8 $0.70 As adjusted $56.7 $0.72$109.9 $1.38 Weighted average number of diluted shares outstanding (in thousands)78,746 79,461 The tax effects of the adjustments are benefits of $5.5 million and $18.0 million for the three and six months ended June 30, 2013, based on the statutory tax rate in the various tax jurisdictions in which the adjustments occurred, adjusted for the impact of certain valuation allowances. |
|
|
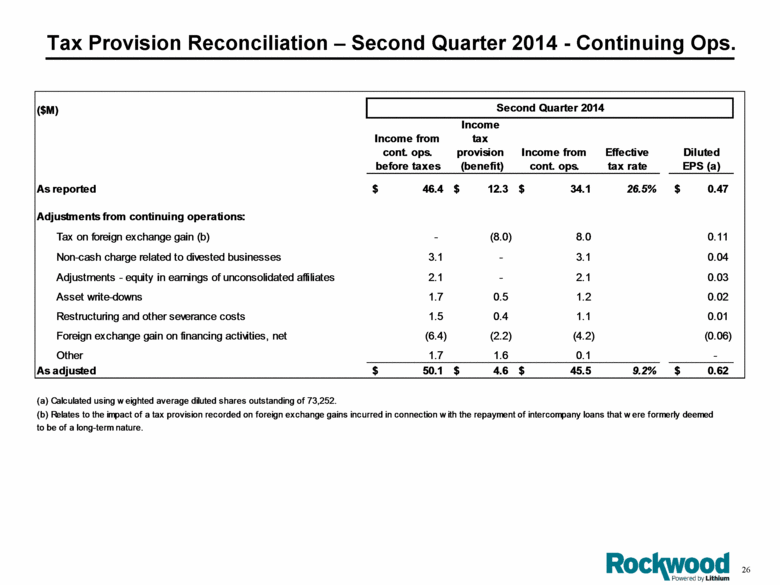
Tax Provision Reconciliation – Second Quarter 2014 - Continuing Ops. ($M) Income from cont. ops. before taxes Income tax provision (benefit)Income from cont. ops. Effective tax rate Diluted EPS (a)As reported 46.4 $ 12.3 $ 34.1 $ 26.5 %0.47 $ Adjustments from continuing operations: Tax on foreign exchange gain (b)- (8.0) 8.0 0.11 Non-cash charge related to divested businesses 3.1 - 3.1 0.04 Adjustments - equity in earnings of unconsolidated affiliates 2.1 - 2.1 0.03 Asset write-downs 1.7 0.5 1.2 0.02 Restructuring and other severance costs 1.5 0.4 1.1 0.01 Foreign exchange gain on financing activities, net(6.4) (2.2) (4.2) (0.06) Other 1.7 1.6 0.1 - As adjusted 50.1$ 4.6$ 45.5$ 9.2%0.62$ (b) Relates to the impact of a tax provision recorded on foreign exchange gains incurred in connection with the repayment of intercompany loans that were formerly deemed to be of a long-term nature. Second Quarter 2014(a) Calculated using weighted average diluted shares outstanding of 73,252. |
|
|
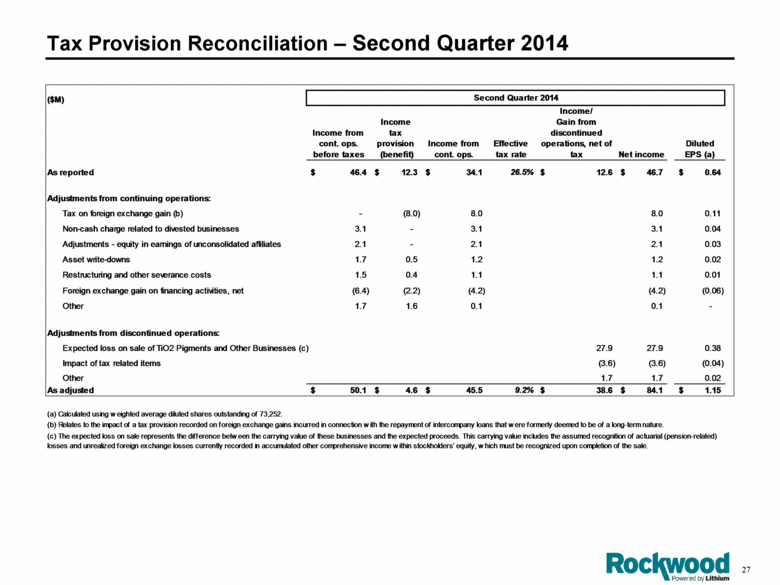
Tax Provision Reconciliation – Second Quarter 2014 ($M) Income from cont. ops. before taxes Income tax provision (benefit) Income from cont. ops. Effective tax rate Income/ Gain from discontinued operations, net of tax Net income Diluted EPS (a) As reported 46.4 $ 12.3 $ 34.1 $ 26.5% 12.6 $ 46.7 $ 0.64 $ Adjustments from continuing operations: Tax on foreign exchange gain (b) - (8.0) 8.0 8.0 0.11 Non-cash charge related to divested businesses 3.1 - 3.1 3.1 0.04 Adjustments - equity in earnings of unconsolidated affiliates 2.1 - 2.1 2.1 0.03 Asset write-downs 1.7 0.5 1.2 1.2 0.02 Restructuring and other severance costs 1.5 0.4 1.1 1.1 0.01 Foreign exchange gain on financing activities, net (6.4) (2.2) (4.2) (4.2) (0.06) Other 1.7 1.6 0.1 0.1 - Adjustments from discontinued operations: Expected loss on sale of TiO2 Pigments and Other Businesses (c) 27.9 27.9 0.38 Impact of tax related items (3.6) (3.6) (0.04) Other 1.7 1.7 0.02 As adjusted 50.1 $ 4.6 $ 45.5 $ 9.2% 38.6 $ 84.1 $ 1.15 $ (b) Relates to the impact of a tax provision recorded on foreign exchange gains incurred in connection with the repayment of intercompany loans that were formerly deemed to be of a long-term nature. Second Quarter 2014 (a) Calculated using weighted average diluted shares outstanding of 73,252. (c) The expected loss on sale represents the difference between the carrying value of these businesses and the expected proceeds. This carrying value includes the assumed recognition of actuarial (pension-related) losses and unrealized foreign exchange losses currently recorded in accumulated other comprehensive income within stockholders’ equity, which must be recognized upon completion of the sale. |
|
|
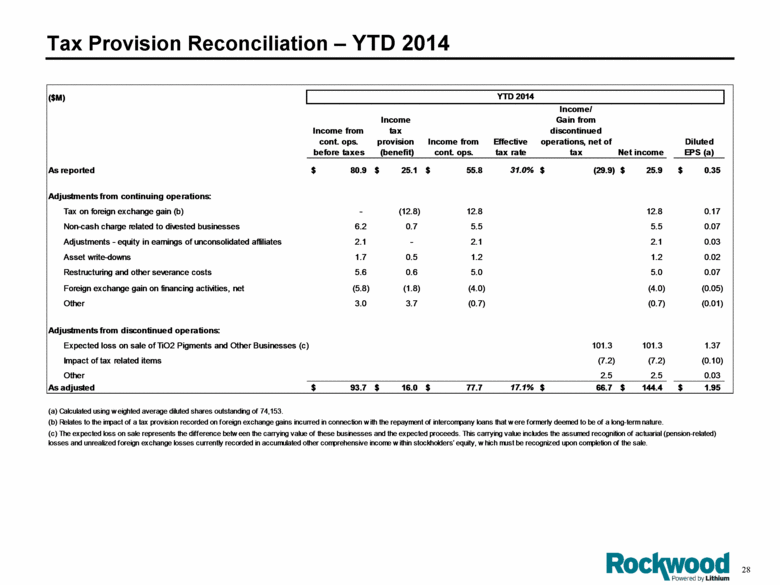
Tax Provision Reconciliation – YTD 2014 ($M) Income from cont. ops. before taxes Income tax provision (benefit) Income from cont. ops. Effective tax rate Income/ Gain from discontinued operations, net of tax Net income Diluted EPS (a) As reported 80.9 $ 25.1 $ 55.8 $ 31.0% (29.9) $ 25.9 $ 0.35 $ Adjustments from continuing operations: Tax on foreign exchange gain (b) - (12.8) 12.8 12.8 0.17 Non-cash charge related to divested businesses 6.2 0.7 5.5 5.5 0.07 Adjustments - equity in earnings of unconsolidated affiliates 2.1 - 2.1 2.1 0.03 Asset write-downs 1.7 0.5 1.2 1.2 0.02 Restructuring and other severance costs 5.6 0.6 5.0 5.0 0.07 Foreign exchange gain on financing activities, net (5.8) (1.8) (4.0) (4.0) (0.05) Other 3.0 3.7 (0.7) (0.7) (0.01) Adjustments from discontinued operations: Expected loss on sale of TiO2 Pigments and Other Businesses (c) 101.3 101.3 1.37 Impact of tax related items (7.2) (7.2) (0.10) Other 2.5 2.5 0.03 As adjusted 93.7 $ 16.0 $ 77.7 $ 17.1% 66.7 $ 144.4 $ 1.95 $ (b) Relates to the impact of a tax provision recorded on foreign exchange gains incurred in connection with the repayment of intercompany loans that were formerly deemed to be of a long-term nature. (c) The expected loss on sale represents the difference between the carrying value of these businesses and the expected proceeds. This carrying value includes the assumed recognition of actuarial (pension-related) losses and unrealized foreign exchange losses currently recorded in accumulated other comprehensive income within stockholders’ equity, which must be recognized upon completion of the sale. YTD 2014 (a) Calculated using weighted average diluted shares outstanding of 74,153. |
|
|
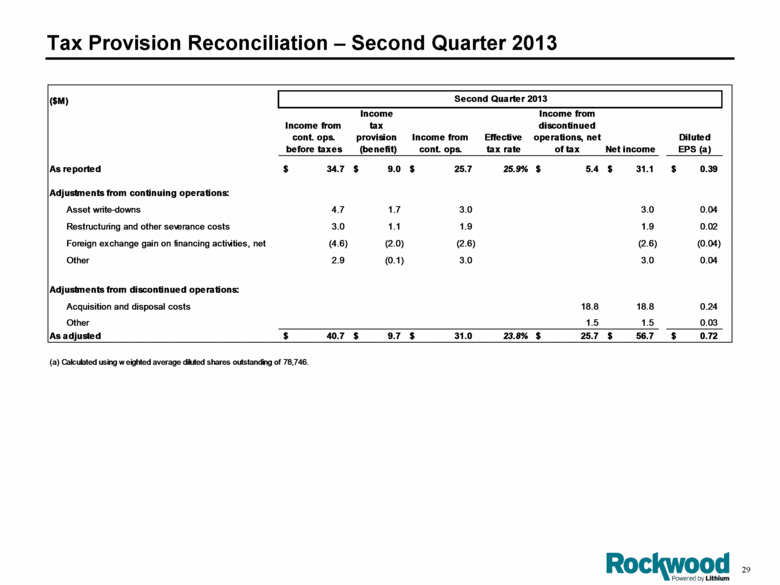
Tax Provision Reconciliation – Second Quarter 2013 ($M)Income from cont. ops. before taxes Income tax provision (benefit)Income from cont. ops. Effective tax rate Income from discontinued operations, net of tax Net income Diluted EPS (a) As reported 34.7$ 9.0$ 25.7$ 25.9%5.4$ 31.1$ 0.39$ Adjustments from continuing operations: Asset write-downs 4.7 1.7 3.0 3.0 0.04 Restructuring and other severance costs 3.0 1.1 1.9 1.9 0.02 Foreign exchange gain on financing activities, net(4.6) (2.0) (2.6) (2.6) (0.04) Other 2.9 (0.1) 3.0 3.0 0.04 Adjustments from discontinued operations: Acquisition and disposal costs 18.8 18.8 0.24 Other 1.5 1.5 0.03 As adjusted 40.7$ 9.7$ 31.0$ 23.8%25.7$ 56.7$ 0.72$ Second Quarter 2013(a) Calculated using weighted average diluted shares outstanding of 78,746. |
|
|
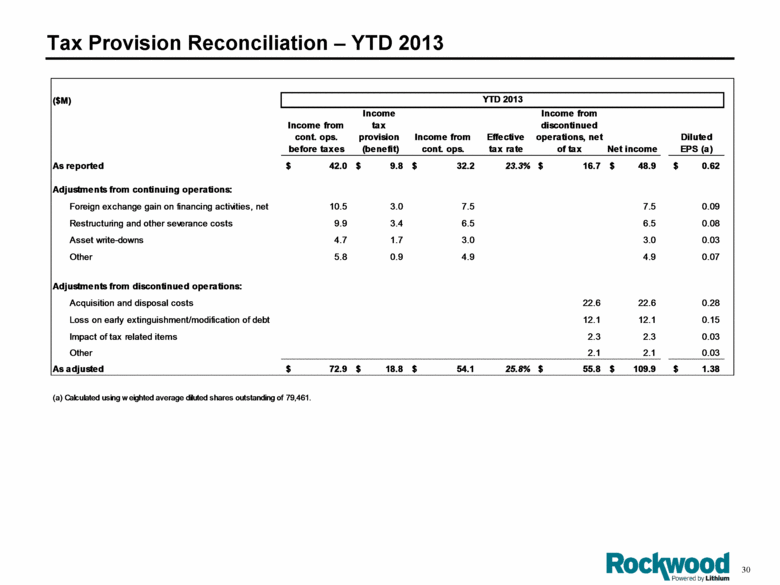
Tax Provision Reconciliation – YTD 2013 ($M)Income from cont. ops. before taxes Income tax provision (benefit)Income from cont. ops. Effective tax rate Income from discontinued operations, net of tax Net income Diluted EPS (a)As reported 42.0$ 9.8$ 32.2$ 23.3%16.7$ 48.9$ 0.62$ Adjustments from continuing operations: Foreign exchange gain on financing activities, net 10.5 3.0 7.5 7.5 0.09 Restructuring and other severance costs 9.9 3.4 6.5 6.5 0.08 Asset write-downs 4.7 1.7 3.0 3.0 0.03 Other 5.8 0.9 4.9 4.9 0.07 Adjustments from discontinued operations: Acquisition and disposal costs 22.6 22.6 0.28 Loss on early extinguishment/modification of debt 12.1 12.1 0.15 Impact of tax related items 2.3 2.3 0.03 Other 2.1 2.1 0.03 As adjusted 72.9$ 18.8$ 54.1$ 25.8%55.8$ 109.9$ 1.38$ (a) Calculated using weighted average diluted shares outstanding of 79,461. |
|
|
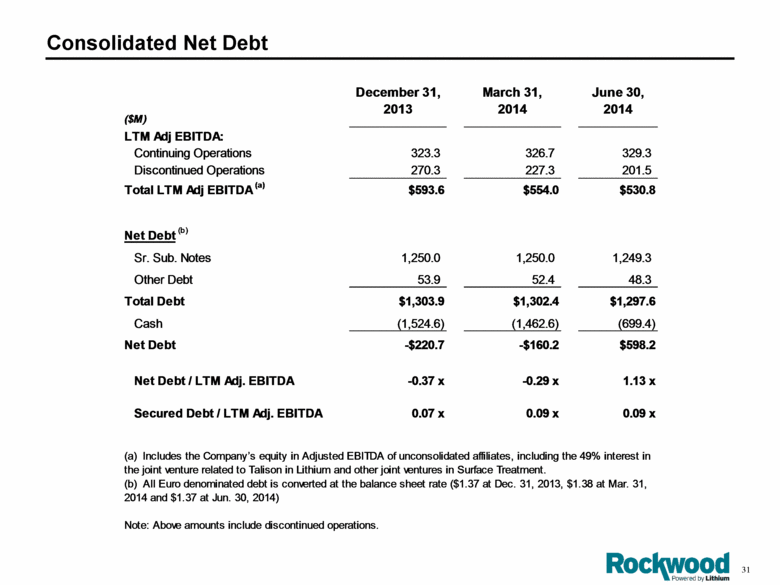
Consolidated Net Debt ($M) December 31, 2013 March 31, 2014 June 30, 2014LTM Adj EBITDA: Continuing Operations 323.3 326.7 329.3 Discontinued Operations 270.3 227.3 201.5 Total LTM Adj EBITDA (a)$593.6$554.0$530.8 Net Debt (b) Sr. Sub. Notes 1,250.0 1,250.0 1,249.3 Other Debt 53.9 52.4 48.3 Total Debt $1,303.9$1,302.4$1,297.6 Cash(1,524.6) (1,462.6) (699.4) Net Debt-$220.7-$160.2$598.2 Net Debt / LTM Adj. EBITDA-0.37 x-0.29 x1.13 x Secured Debt / LTM Adj. EBITDA0.07 x0.09 x 0.09 x Note: Above amounts include discontinued operations.(b) All Euro denominated debt is converted at the balance sheet rate ($1.37 at Dec. 31, 2013, $1.38 at Mar. 31, 2014 and $1.37 at Jun. 30, 2014)(a) Includes the Company’s equity in Adjusted EBITDA of unconsolidated affiliates, including the 49% interest in the joint venture related to Talison in Lithium and other joint ventures in Surface Treatment. |
|
|
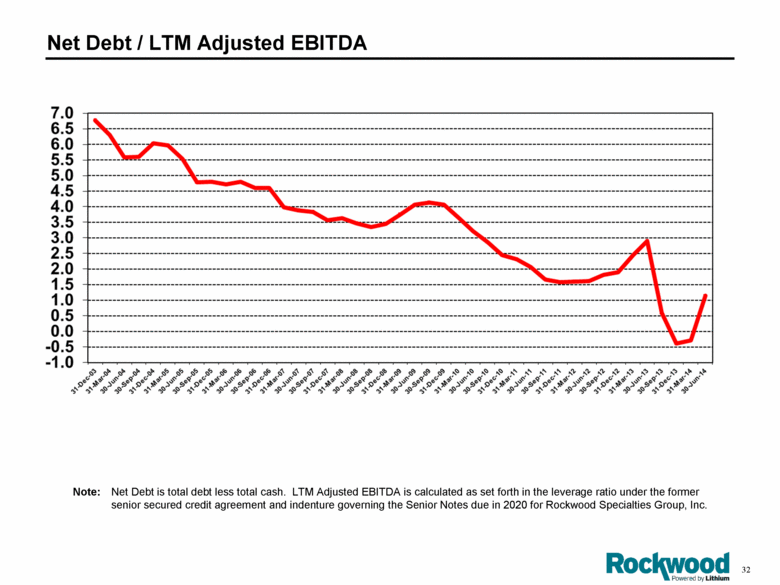
Net Debt / LTM Adjusted EBITDA Note: Net Debt is total debt less total cash. LTM Adjusted EBITDA is calculated as set forth in the leverage ratio under the former senior secured credit agreement and indenture governing the Senior Notes due in 2020 for Rockwood Specialties Group, Inc. |
|
|
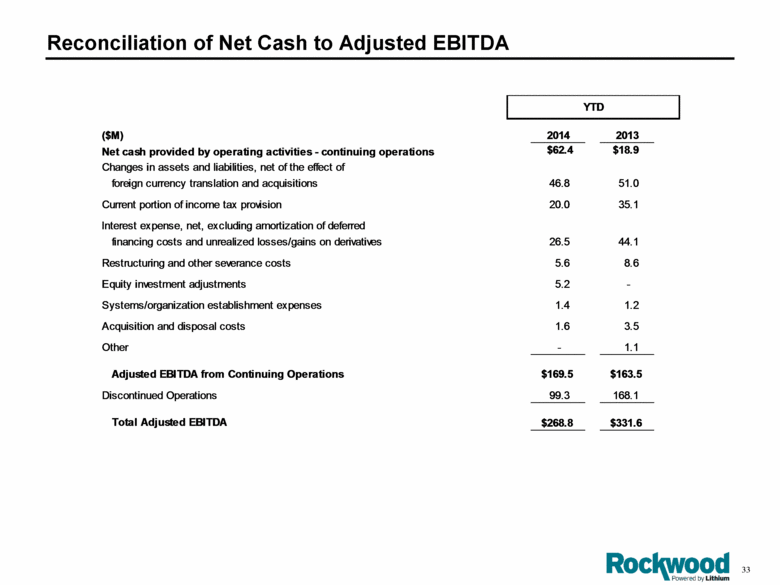
Reconciliation of Net Cash to Adjusted EBITDA YTD ($M) 2014 2013 Net cash provided by operating activities - continuing operations $62.4 $18.9 Changes in assets and liabilities, net of the effect of foreign currency translation and acquisitions 46.8 51.0 Current portion of income tax provision 20.0 35.1 Interest expense, net, excluding amortization of deferred financing costs and unrealized losses/gains on derivatives 26.5 44.1 Restructuring and other severance costs 5.6 8.6 Equity investment adjustments 5.2 - Systems/organization establishment expenses 1.4 1.2 Acquisition and disposal costs 1.6 3.5 Other - 1.1 Adjusted EBITDA from Continuing Operations $169.5 $163.5 Discontinued Operations 99.3 168.1 Total Adjusted EBITDA $268.8 $331.6 |
|
|
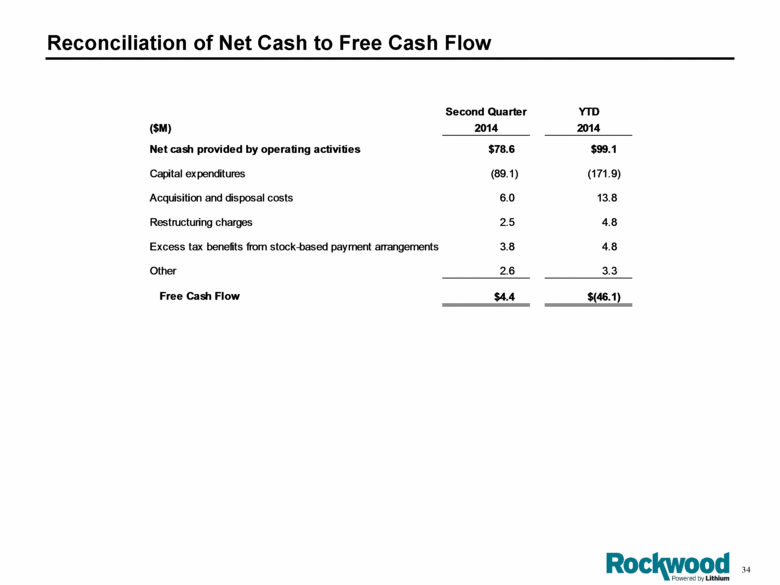
Reconciliation of Net Cash to Free Cash Flow Second Quarter YTD ($M) 2014 2014 Net cash provided by operating activities $78.6 $99.1 Capital expenditures (89.1) (171.9) Acquisition and disposal costs 6.0 13.8 Restructuring charges 2.5 4.8 Excess tax benefits from stock-based payment arrangements 3.8 4.8 Other 2.6 3.3 Free Cash Flow $4.4 $(46.1) |
|
|
Reconciliation of Lithium Net Sales Second Quarter YTD % Change % Change ($M) 2014 2013 Total 2014 2013 Total Lithium excl. Potash 109.5 116.0 (5.6%) 221.1 222.5 (0.6%) Potash 7.2 9.7 (25.8%) 11.4 21.7 (47.5%) Total Lithium 116.7 125.7 (7.2%) 232.5 244.2 (4.8%) Net Sales |
|
|
[LOGO] |

