Attached files
| file | filename |
|---|---|
| 8-K - CURRENT REPORT - NEWBRIDGE BANCORP | v385997_8k.htm |
Exhibit 99.1

NASDAQ: NBBC www.newbridgebank.com INVESTOR PRESENTATION August 2014

FORWARD - LOOKING STATEMENTS Information in this presentation may contain forward - looking statements. Such statements involve known and unknown risks, uncertainties and other factors that may cause actual results to differ materially. Forward - looking statements are often characterized by the use of qualifying words such as “expects,” “anticipates,” “believes,” “estimates,” “plans,” “projects,” or other statements concerning opinions or judgments of the Company and its management about future events. The accuracy of such forward - looking statements could be affected by factors including, but not limited to, the financial success or changing conditions or strategies of the Company’s customers or vendors, fluctuations in interest rates, actions of government regulators, the availability of capital and personnel, or general economic conditions. Additional factors are discussed in the Company’s filings with the SEC, including without limitation, Forms 10 - K, 10 - Q and 8 - K. NewBridge Bancorp undertakes no obligations to revise these statements following the date of this presentation. 2
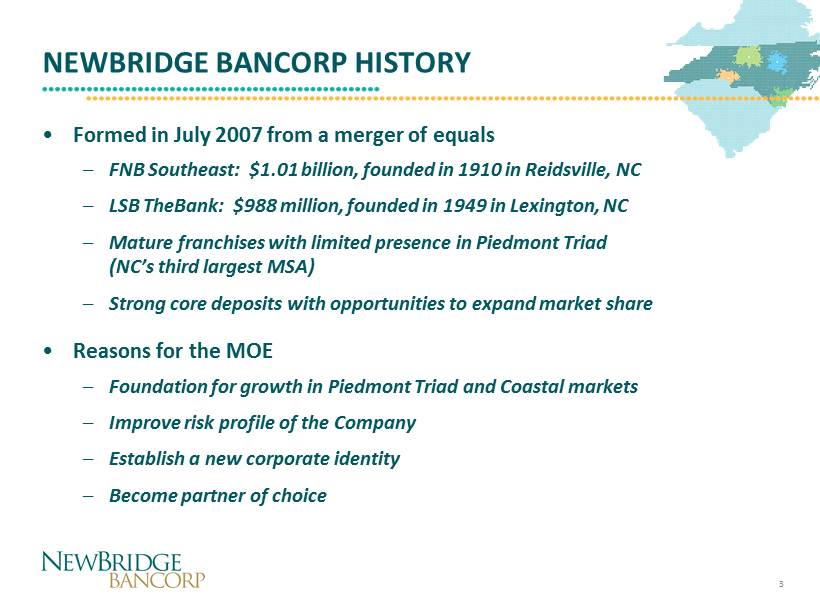
NEWBRIDGE BANCORP HISTORY • Formed in July 2007 from a merger of equals – FNB Southeast: $1.01 billion, founded in 1910 in Reidsville, NC – LSB TheBank : $988 million, founded in 1949 in Lexington, NC – Mature franchises with limited presence in Piedmont Triad (NC’s third largest MSA) – Strong core deposits with opportunities to expand market share • Reasons for the MOE – Foundation for growth in Piedmont Triad and Coastal markets – Improve risk profile of the Company – Establish a new corporate identity – Become partner of choice 3
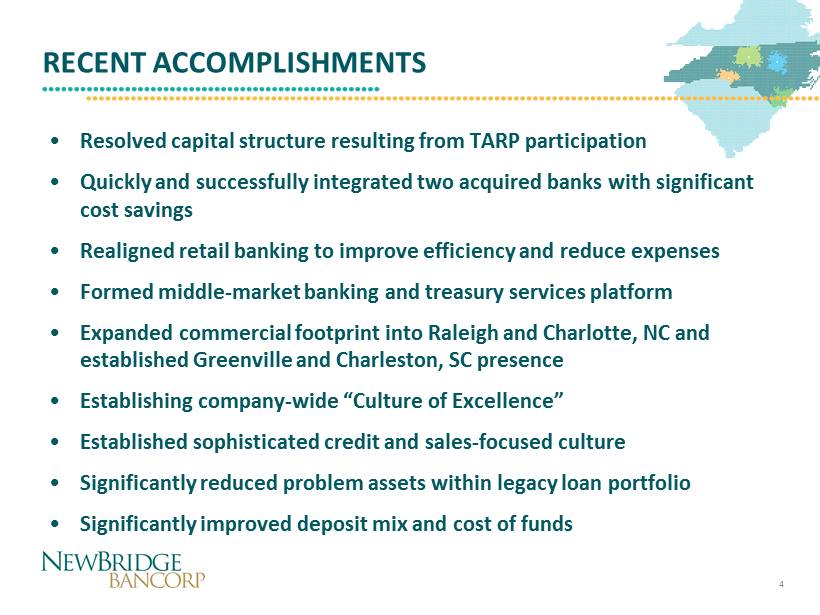
RECENT ACCOMPLISHMENTS • Resolved capital structure resulting from TARP participation • Quickly and successfully integrated two acquired banks with significant cost savings • Realigned retail banking to improve efficiency and reduce expenses • Formed middle - market banking and treasury services platform • Expanded commercial footprint into Raleigh and Charlotte, NC and established Greenville and Charleston , SC presence • Establishing company - wide “Culture of Excellence” • Established sophisticated credit and sales - focused culture • Significantly reduced problem assets within legacy loan portfolio • Significantly improved deposit mix and cost of funds 4

EXECUTING THE STRATEGIC PLAN 2012 2013 2014 November – 2012 Completed $56M Capital Raise & classified asset resolution plan August – 2012 Entered the Charlotte, NC market May – 2013 Executed partial TARP redemption of $37M $4.40 June – 2013 Announced acquisition of Security Savings Bank ($212M in assets) Oct/Nov – 2013 Closed Security Savings transaction & announced acquisition of CapStone Bank ($381M in assets) April – 2014 Closed CapStone Bank transaction, total assets now > $2.4 billion Redeem remaining TARP balance of $15M March – 2014 Issued $15.5 million in subordinated debt at 7.25% Stock Price $5.90 $6.05 $6.35 $7.50 $7.10 $7.35 6 July 2014 Enters Middle - Market Corporate Banking & SC Market 5
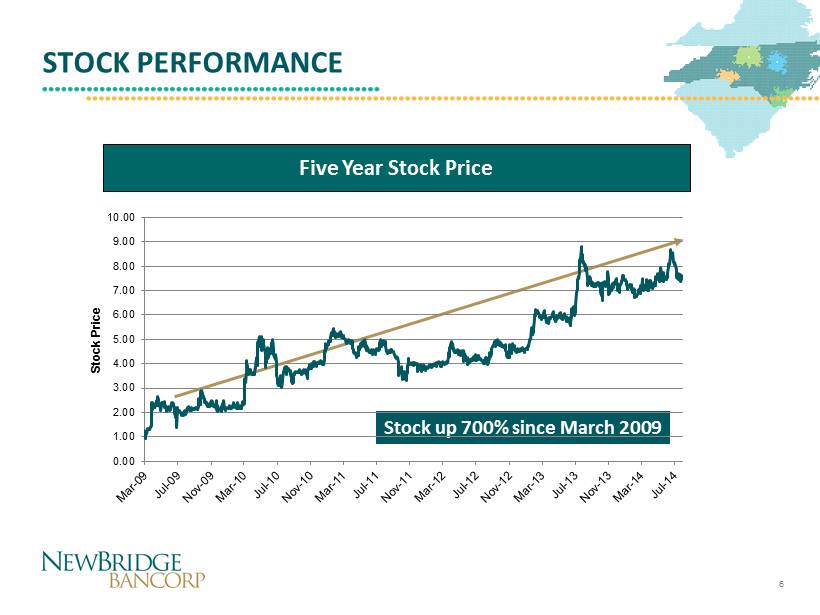
STOCK PERFORMANCE Five Year Stock Price Stock up 700% since March 2009 0.00 1.00 2.00 3.00 4.00 5.00 6.00 7.00 8.00 9.00 10.00 Stock Price 6

NASDAQ: NBBC www.newbridgebank.com GROWTH STRATEGIES
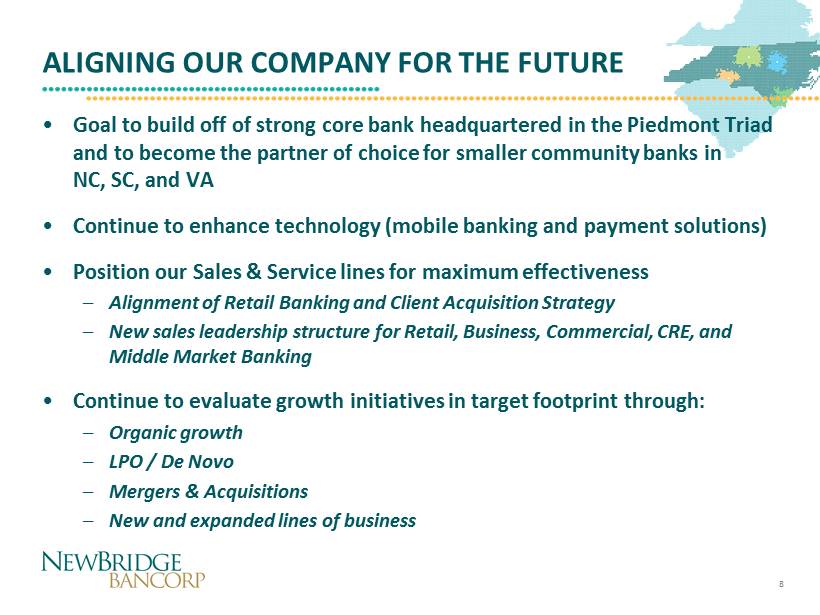
ALIGNING OUR COMPANY FOR THE FUTURE • Goal to build off of strong core bank headquartered in the Piedmont Triad and to become the partner of choice for smaller community banks in NC, SC, and VA • Continue to enhance technology (mobile banking and payment solutions) • Position our Sales & Service lines for maximum effectiveness – Alignment of Retail Banking and Client Acquisition Strategy – New sales leadership structure for Retail, Business, Commercial, CRE, and Middle Market Banking • Continue to evaluate growth initiatives in target footprint through: – Organic growth – LPO / De Novo – Mergers & Acquisitions – New and expanded lines of business 8
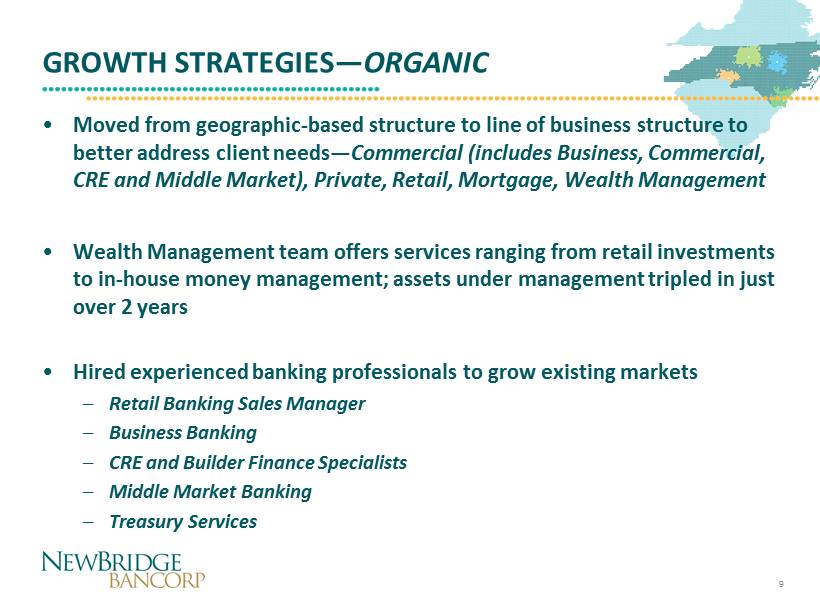
GROWTH STRATEGIES — ORGANIC • Moved from geographic - based structure to l ine of business structure to better address client needs — Commercial (includes Business, Commercial, CRE and Middle Market), Private, Retail, Mortgage, Wealth Management • Wealth Management team offers services ranging from retail investments to in - house money management; assets under management tripled in just over 2 years • Hired experienced banking professionals to grow existing markets – Retail Banking Sales Manager – Business Banking – CRE and Builder Finance Specialists – Middle Market Banking – Treasury Services 9

MIDDLE - MARKET CORPORATE BANKING • Dedicated resources to provide premier financial services to companies generating annual revenue between $25 and $250 million • Serving the Carolinas from offices in Charlotte, NC and Greenville, SC • Hired an experienced, proven six - person commercial banking and treasury services team with decades of large and regional bank experience • Led by veteran Mike McMahan, EVP and Director of Middle - Market Banking Group and Treasury Services • Opportunity to serve companies requiring larger bank capabilities supported by customized banking solutions • Supported by the Bank’s capital strength, lending capability and capacity 10

CREATING VALUE THROUGH M&A Security Savings Bank (Southport, NC) Announced: June 2013 Closed: October 2013 No actual cash or stock outlay Total Assets: $212M Total Loans: $139M Total Deposits: $168M Branches: 6 CapStone Bank (Raleigh, NC) Announced: November 2013 Closed: April 2014 Deal Value: $62M (100% stock) P/TBV: 138% P/EPS: 11.4x (core - 17.0x) Earnback : Less than 2 years Total Assets: $381M Total Loans: $293M Total Deposits: $274M Branches: 4 Future M&A Opportunities ▪ Established acquirer ▪ Improved currency ▪ Integration know - how Disciplined pricing: Immediate earnings accretion TBV Earnback < 4 years IRR > 15% Significant opportunities exist: 192 banks < $1B in NC, SC, VA Attractive metro markets Talented teams available Actively pursuing dialogue with potential targets NewBridge : Merger Partner of Choice 11

GROWTH STRATEGIES — NEW MARKETS Virginia Beach MSA Richmond MSA Columbia MSA Blacksburg & Roanoke MSAs Charleston MSA Greenville & Spartanburg MSAs Wilmington MSAs Source: SNL Financial Piedmont Triad Durham – Chapel Hill MSA Asheville MSA Charlotte MSA Raleigh MSA Sampson County Brunswick County PoulationProj. (2019) Growth Market Actual Growth Rank Charlotte-Concord-Gastonia, NC-SC $2,337,694 6.3% 5 Virginia Beach, VA 1,722,167 3.9 11 Piedmont Triad, NC 1,397,316 3.7 12 Richmond, VA 1,247,586 4.4 10 Raleigh-Cary, NC 1,219,465 8.2 2 Greenville, SC 855,961 4.9 8 Columbia, SC 795,973 4.8 9 Charleston, SC 719,790 8.5 1 Durham-Chapel Hill, NC 530,627 6.1 6 Asheville, NC 442,531 5.2 7 Spartanburg, SC 319,644 3.3 13 Roanoke, VA 313,033 2.7 14 Wilmington, NC 269,287 6.5 4 Blacksburg, VA 180,244 2.5 16 Brunswick, NC 115,095 7.6 3 Sampson, NC 64,250 2.6 15 12

NEWBRIDGE BANCORP AT A GLANCE • Well - positioned community bank with presence in 4 of NC’s largest 5 markets • Further bolstered presence in the Triangle with CapStone Bank merger • Growing footprint in Charlotte • Core Q2 2014 EPS of $0.12 • Cost savings from CapStone Bank and Retail realignment will benefit Q3 2014 • 2015 consensus ROAA 0.92% on earnings of $0.64 per share • Cost of interest bearing deposits of 0.27% for Q2 2014 • 67% core deposits (excluding CDs) • Low level of problem assets with 0.61% NPAs/assets • Strong reserve coverage with over 203% Reserves / NPLs • 7.0% annualized organic loan growth YTD 2014, 12% organic growth in 2013 • Currently trades at 11.9x 2015E EPS and 137% of tangible book value • Potential for meaningful multiple expansion Attractive Franchise Strong core profitability Expanding core deposit base Clean asset quality and strong growth Attractive entry point 13

NASDAQ: NBBC www.newbridgebank.com FY 2013 AND Q2 2014 RECAP

2013: TRANSFORMATIONAL YEAR • Pre - tax earnings (excluding merger - related expenses) approaching $20 million – Loan growth of 23% with organic growth of 12% – Continued credit quality improvement • Capital re - positioned – Converted $56 million of equity raised in 2012 from preferred stock to common stock – Retired the warrant held by Treasury (TARP Capital Purchase Plan) – Redeemed $37 million of the TARP preferred stock • Converted LPOs in Raleigh and Charlotte to full - service offices • Acquired and integrated Security Savings Bank (Brunswick County, 6 offices) • Announced definitive merger agreement with CapStone Bank (Wake and Sampson Counties, 4 offices) 15

RECENT FINANCIAL HIGHLIGHTS 16 Merger completed CPSE SSB 2Q 2014 1Q 2014 2 4Q 2013 3Q 2013 2Q 2013 3 Core earnings per share after tax, one-time items excluded 0.12$ 0.12$ 0.11$ 0.11$ 0.10$ Adjusted pre-tax ROAA 1 1.19% 1.12% 0.91% 1.23% 1.02% Diluted share count 37,383 28,597 28,585 28,573 29,139 Operating Results Total assets 2,429,093$ 2,038,269$ 1,965,232$ 1,802,342$ 1,730,095$ Net interest income 20,255$ 16,636$ 16,913$ 15,796$ 15,410$ Provision for loan losses 600 144 642 33 1,037 Net interest income after provision 19,655 16,492 16,271 15,763 14,373 Net noninterest expense, one-time items excluded 12,492 11,053 11,799 10,372 10,029 Adjusted pre-tax net income 1 7,163$ 5,439$ 4,472$ 5,391$ 4,344$ One time items 1 Excluded one time gains (expense) (5,345)$ (88)$ (2,522)$ 458$ 681$ Improved Loan Quality Nonperforming assets to total assets 0.61% 0.91% 0.86% 0.79% 1.06% Core loan growth annualized 6.1% 7.8% 9.0% 22.3% 10.2% 1 Adjusted to exclude one-time items that include merger costs, security gains and severance expense. 2 Preferred shares were retired in 1Q 2014. 3 Diluted share count 2Q 2013 reflects ending period share count. Improving Shareholder Value Through Quality, Profitability & Growth

ASSET QUALITY • Non - performing assets to total assets at 0.61% at Q2 2014 • Classified Asset Ratio continues to improve and stands at 18% at Q2 2014 • Reserves to non - performing loans remain strong at over 203% 0% 10% 20% 30% 40% 50% 60% 70% 2Q12 3Q12 4Q12 1Q13 2Q13 3Q13 4Q13 1Q14 2Q14 Classified Asset Ratio (%) Integration of Security Savings Bank 17 0 50 100 150 200 250 2Q12 3Q12 4Q12 1Q13 2Q13 3Q13 4Q13 1Q14 2Q14 Reserves / Non - Performing Loans (%)

PROFITABILITY • Net interest margin (NIM) remains under pressure across the industry; NIM averaged 3.89% for 2013 compared to 4.06% in 2012 • Loan yields (new loans and re - priced renewals) continue to decline with increased competition and a changing mix in our loan portfolio • Deposit rates are actively managed; total cost of deposits for Q2 2014 was 27 basis points • Core return on average assets remains strong despite increased margin pressures 0.00 1.00 2.00 3.00 4.00 5.00 6.00 2Q12 3Q12 4Q12 1Q13 2Q13 3Q13 4Q13 1Q14 2Q14 Yield on Loans / Cost of Deposits (%) Loans Deposits 3.40 3.50 3.60 3.70 3.80 3.90 4.00 4.10 4.20 4.30 0.00 0.20 0.40 0.60 0.80 1.00 1.20 1.40 1.60 1.80 2Q12 3Q12 4Q12 1Q13 2Q13 3Q13 4Q13 1Q14 2Q14 N I M R O A A Core ROAA vs. Net Interest Margin (%) Core ROAA NIM 18

EFFICIENCY & EXPENSE CONTROL • Improving efficiency continues to be a focus and measured under 70% 1 for the first half of 2014 • Addition of SSB and CapStone is expected to drive further efficiencies • Initiatives such as recent Retail Banking realignment in 2014 will enhance effectiveness and efficiency • 5% headcount reduction impacting retail branches expected to reduce expense by $1 million annually 1 Excludes merger costs, foreclosed property expense, and amortization of intangibles. 0.00 1.00 2.00 3.00 4.00 5.00 6.00 7.00 2Q12 3Q12 4Q12 1Q13 2Q13 3Q13 4Q13 1Q14 2Q14 Non - Interest Expense / Average Assets (%) Asset Dispositon Plan 60 62 64 66 68 70 72 74 76 2Q12 3Q12 4Q12 1Q13 2Q13 3Q13 4Q13 1Q14 2Q14 Effficiency (%) Integration of Security Savings Bank 19

GROWTH • Organic loan growth of 12% for 2013 and 7 % (annualized) through Q2 2014 • FY14 YTD production is up 27% over FY13; production in FY13 increased 36% over FY12 • Average quarterly loan production (FY13 through Q2 2014) of $104 million • Assets per FTE employee improved throughout 2013 and continues to show further growth with integration of CapStone Bank 750,000 950,000 1,150,000 1,350,000 1,550,000 1,750,000 1,950,000 Loans Oustanding ($000) Classified Loans Non-Classified Loans 0.00 1.00 2.00 3.00 4.00 5.00 6.00 2Q12 3Q12 4Q12 1Q13 2Q13 3Q13 4Q13 1Q14 2Q14 Assets / FTE ($ million) 20
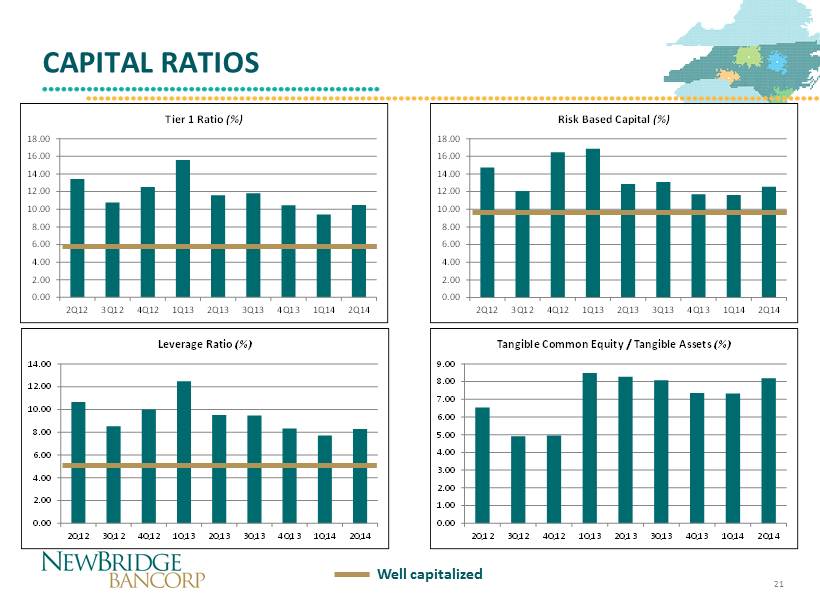
0.00 2.00 4.00 6.00 8.00 10.00 12.00 14.00 2Q12 3Q12 4Q12 1Q13 2Q13 3Q13 4Q13 1Q14 2Q14 Leverage Ratio (%) 0.00 2.00 4.00 6.00 8.00 10.00 12.00 14.00 16.00 18.00 2Q12 3Q12 4Q12 1Q13 2Q13 3Q13 4Q13 1Q14 2Q14 Risk Based Capital (%) 0.00 2.00 4.00 6.00 8.00 10.00 12.00 14.00 16.00 18.00 2Q12 3Q12 4Q12 1Q13 2Q13 3Q13 4Q13 1Q14 2Q14 Tier 1 Ratio (%) CAPITAL RATIOS Well capitalized 0.00 1.00 2.00 3.00 4.00 5.00 6.00 7.00 8.00 9.00 2Q12 3Q12 4Q12 1Q13 2Q13 3Q13 4Q13 1Q14 2Q14 Tangible Common Equity / Tangible Assets (%) 21

ACHIEVING KEY PERFORMANCE METRICS Strategic Positioning Rising Financial Performance Superior Credit Quality • Increased scale – over $2.4 billion in assets • Organic growth of 12% in 2013, loan portfolio of $1.7 billion • Strong deposit franchise – 67% non - CD deposits & cost of deposits < 27bps • Well capitalized – TCE/TA of 8.19% and leverage ratio of 8.29% • Substantially improved asset quality and reduced credit costs • NPA/Assets of 0.61% • Classified assets ratio of 18% • A llowance for credit losses strong exceed 203% of nonperforming loans • ROATCE of 14.6% in 2013 • Strong margin holding at 3.70% • Diversified revenue streams through wealth management and mortgage banking businesses • Improving core efficiency — 68% for Q2 2014 and under 70% for 1H 2014 22 22

WHY INVEST IN NBBC ? P/TBV P/ ’15 E PS NBBC 136% 11.3x BNCN 177% 11.3x FBNC 146% 10.6x PSTB 125% 14.9x SSB 247% 13.1x COB 271% 14.0x HMPR 156% NM HTBI 89% 21.4x YDKN 172% 11.9x Scarcity Value Strong Growth Prospects - Organic (12% in ‘13) & Acquisitive (2 deals in ‘13) Experienced Management with a proven track record of success Premier franchise in attractive markets – 40 branches throughout North Carolina including 4 markets & 11 counties Economies of Scale > $2.4 billion Asset Quality Improvement – NPAs/Assets < 1.0% Core Deposit F ranchise – 67% non - CD deposits, COD of 0.27% Source: SNL Financial, market data as 8/04/14 23
NASDAQ: NBBC www.newbridgebank.com MANAGEMENT TEAM

MANAGEMENT TEAM DEPTH Pressley Ridgill President & Chief Executive Officer Spence Broadhurst Senior Executive Vice President Chief Banking Officer Wes Bud Senior Executive Vice President Chief Credit Officer Robin Hager Senior Executive Vice President Chief Administration Officer Ramsey Hamadi Senior Executive Vice President Chief Financial Officer David Barksdale Senior Executive Vice President Chief Strategy Officer ‒ Commercial Banking ‒ Middle Market Banking ‒ Retail Banking ‒ Private Banking ‒ Wealth Management ‒ Mortgage Banking ‒ Credit Administration ‒ Central Underwriting ‒ Special Assets ‒ Loan Review ‒ Loan Operations ‒ Corporate and Administrative Services ‒ Information Technology ‒ Deposit Operations ‒ Marketing ‒ Training ‒ Vendor Management ‒ Finance/Accounting ‒ Investments ‒ Compliance/Security/BSA ‒ Corporate Secretary ‒ Investor and Shareholder Relations ‒ Mergers/Acquisitions ‒ Strategic Planning 25

PRESSLEY A. RIDGILL • Chief Executive Officer • Joined NewBridge Bank (FNB SE) in 2000 • Previous roles include Chief Operating Officer (2000 - 2005), President (2005 – 2007) • Experience in financial institutions management, expertise in mergers, acquisitions, and corporate restructuring and integration • University of South Carolina, BS in Business Administration, 1973; Masters of Accountancy, 1980 • Graduate School of Banking at Louisiana State University, 1993 • Member of the NC Banking Commission • Board of Directors for Greensboro Economic Development Alliance • Served two terms on the Board of Directors for NC Bankers Association • Former Board Member of United Way of Greater Greensboro; Chair of Toqueville Society, 2012/2013 26
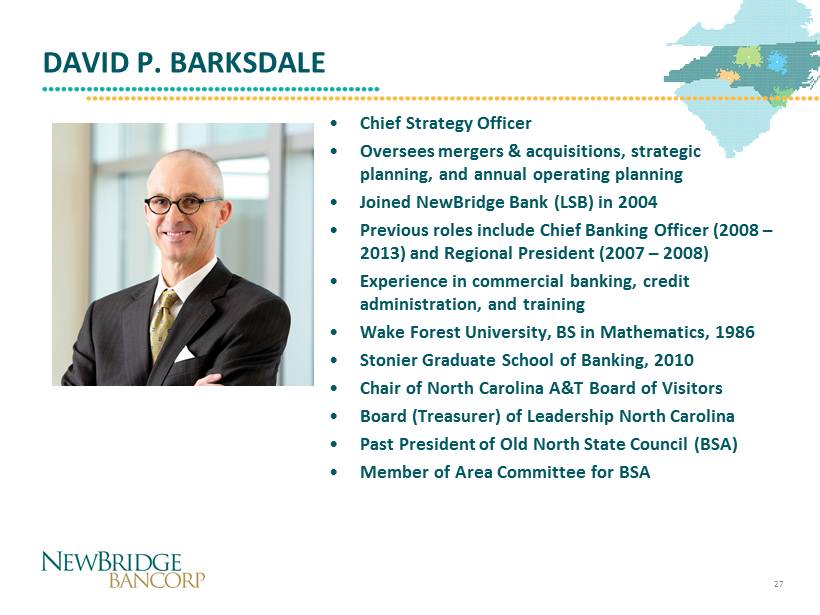
DAVID P. BARKSDALE • Chief Strategy Officer • Oversees mergers & acquisitions, strategic planning, and annual operating planning • Joined NewBridge Bank (LSB) in 2004 • Previous roles include Chief Banking Officer (2008 – 2013) and Regional President (2007 – 2008) • Experience in commercial banking, credit administration, and training • Wake Forest University, BS in Mathematics, 1986 • Stonier Graduate School of Banking, 2010 • Chair of North Carolina A&T Board of Visitors • Board (Treasurer) of Leadership North Carolina • Past President of Old North State Council (BSA) • Member of Area Committee for BSA 27

SPENCE H. BROADHURST • Chief Banking Officer • Oversees commercial banking, private banking, retail banking, mortgage banking and wealth management • Joined NewBridge Bank in 2011 • Previous role as Special Projects Manager (2011 – 2013) • Experience in commercial banking, retail banking, real estate finance and sales leadership • University of North Carolina at Chapel Hill, BS in Industrial Relations and Economics, 1981 • Graduate School of Banking at Louisiana State University, 1989 • Member of the Board of Trustees for North Carolina A&T • Board of Directors for the Greensboro Partnership • Past member of the Board of Directors for the Piedmont Triad Partnership • Mayor of Wilmington from 2003 to 2006 28
WILLIAM W. BUDD , JR . • Chief Credit Officer • Oversees credit administration, central underwriting support, special assets, loan review, and loan operations • Joined NewBridge Bank (FNB SE) in 2007 as Chief Credit Officer • Experience in commercial banking, credit administration, and real estate finance • University of North Carolina at Chapel Hill, BA in Economics, 1985 • Banking School of the South at Louisiana State University, 1998 • Past President of the Burlington Rotary Club • Past Chairman of the United Way of Alamance County Budget/Allocations Committee 29

ROBIN S. HAGER • Chief Administrative Officer • Oversees corporate and administrative services, human resources, information technology, deposit operations, marketing, training, and vendor management • Joined NewBridge Bank (FNB SE) in 2005 • Previous roles include Chief Resource Officer (2008 – 2013), head of Corporate Resources (2007 – 2008) and Retail Bank Administration (2005 – 2007) • Experience in operations, corporate sales and retail bank administration • UNC at Greensboro, BS in Business Administration, 1984 • Stonier Graduate School of Banking , 2011 • Board of the United Way of Greater Greensboro • Board of Advisors for UNC - Greesnboro’s Bryan School of Business • Board of the Women’s Resources Center in Greensboro and the Greensboro Children’s Museum 30

RAMSEY K. HAMADI • Chief Financial Officer • Oversees finance and accounting, investments, compliance/security/BSA, corporate secretary, and investor and shareholder relations • Joined NewBridge Bank in 2009 as CFO • Formerly an examiner with the Federal Reserve Bank of St. Louis and CFO of Pulaski Bank (2001 – 2009) • University of Missouri, St. Louis, BA in English, 1992 • Maryville University, Masters in Business Administration, 1997 • Served in the United States Marine Corps • Finance Committee for the Community Foundation of Greensboro • Audit Committee Chairman for Old North State Council (BSA) • Member of the American Institute of Certified Public Accountants 31

CONTACTS • Pressley A. Ridgill, Chief Executive Officer pressley.ridgill@newbridgebank.com 336.369.0903 • Ramsey K. Hamadi, Chief Financial Officer ramsey.hamadi@newbridgebank.com 336.369.0975 • David P. Barksdale, Chief Strategy Officer david.barksdale@newbridgebank.com 336.369.0939 32