Attached files
| file | filename |
|---|---|
| EX-31.2 - EXHIBIT 31.2 - Measurement Specialties Inc | v384144_ex31-2.htm |
| EX-31.1 - EXHIBIT 31.1 - Measurement Specialties Inc | v384144_ex31-1.htm |
| EX-32.1 - EXHIBIT 32.1 - Measurement Specialties Inc | v384144_ex32-1.htm |
| EXCEL - IDEA: XBRL DOCUMENT - Measurement Specialties Inc | Financial_Report.xls |
UNITED STATES
SECURITIES AND EXCHANGE COMMISSION
WASHINGTON, D.C. 20549
FORM 10-Q
(MARK ONE)
x QUARTERLY REPORT PURSUANT TO SECTION 13 or 15 (d) OF THE SECURITIES
EXCHANGE ACT OF 1934
FOR THE FISCAL QUARTERLY PERIOD ENDED JUNE 30, 2014
OR
o TRANSITION REPORT PURSUANT TO SECTION 13 or 15 (d) OF THE SECURITIES
EXCHANGE ACT OF 1934
COMMISSION FILE NUMBER: 1-11906

MEASUREMENT SPECIALTIES, INC.
(EXACT NAME OF REGISTRANT AS SPECIFIED IN ITS CHARTER)
| New Jersey | 22-2378738 | |
|
(STATE OR OTHER JURISDICTION OF INCORPORATION OR ORGANIZATION) |
(I.R.S. EMPLOYER IDENTIFICATION NO. ) |
1000 LUCAS WAY, HAMPTON, VA 23666
(ADDRESS OF PRINCIPAL EXECUTIVE OFFICES)
(757) 766-1500
(REGISTRANT’S TELEPHONE NUMBER, INCLUDING AREA CODE)
Indicate by check mark whether the registrant (1) has filed all reports required to be filed by Section 13 or 15(d) of the Securities Exchange Act of 1934 during the preceding 12 months (or for such shorter period that the registrant was required to file such reports), and (2) has been subject to such filing requirements for the past 90 days. Yes x No o.
Indicate by check mark whether the registrant has submitted electronically and posted on its corporate Web site, if any, every Interactive Data File required to be submitted and posted pursuant to Rule 405 Regulation S-T during the preceding 12 months (or for such shorter period that the registrant was required to submit and post such files). Yes x No o.
Indicate by check mark whether the registrant is a large accelerated filer, an accelerated filer, a non-accelerated filer, or a smaller reporting company. See definition of “large accelerated filer,” “accelerated filer” and “smaller reporting company” in Rule 12b-2 of the Securities Exchange Act of 1934. (Check one):
| Large accelerated filer o | Accelerated filer x | Non-accelerated filer o | Smaller reporting company o |
| (Do not check if a smaller reporting company) | |||
Indicate by check mark whether the registrant is a shell company (as defined in Rule 12b-2 of the Securities Exchange Act of 1934). Yes o No x.
Indicate the number of shares outstanding of each of the issuer’s classes of stock, as of the latest practicable date: On July 28, 2014, the number of shares outstanding of the Registrant’s common stock was 16,178,248.
MEASUREMENT SPECIALTIES, INC.
FORM 10-Q
TABLE OF CONTENTS
JUNE 30, 2014
| 2 |
MEASUREMENT SPECIALTIES, INC. AND SUBSIDIARIES
CONSOLIDATED CONDENSED STATEMENTS OF OPERATIONS
(UNAUDITED)
| Three months ended June 30, | ||||||||
| (Amounts in thousands, except per share amounts ) | 2014 | 2013 | ||||||
| Net sales | $ | 114,129 | $ | 100,512 | ||||
| Cost of goods sold | 68,401 | 58,618 | ||||||
| Gross profit | 45,728 | 41,894 | ||||||
| Selling, general, and administrative expenses | 40,945 | 29,282 | ||||||
| Operating income | 4,783 | 12,612 | ||||||
| Interest expense, net | 1,095 | 914 | ||||||
| Foreign currency exchange loss | 2,619 | 154 | ||||||
| Equity income in unconsolidated joint venture | (223 | ) | (121 | ) | ||||
| Other income | 74 | (2 | ) | |||||
| Income before income taxes | 1,218 | 11,667 | ||||||
| Income tax expense | 250 | 2,506 | ||||||
| Net income | $ | 968 | $ | 9,161 | ||||
| Earnings per common share | ||||||||
| Net income - Basic | $ | 0.06 | $ | 0.59 | ||||
| Net income - Diluted | $ | 0.06 | $ | 0.56 | ||||
| Weighted average shares outstanding - Basic | 15,956 | 15,632 | ||||||
| Weighted average shares outstanding - Diluted | 16,837 | 16,481 | ||||||
See accompanying notes to consolidated condensed financial statements.
| 3 |
MEASUREMENT SPECIALTIES, INC. AND SUBSIDIARIES
CONSOLIDATED CONDENSED STATEMENTS OF
COMPREHENSIVE INCOME
(UNAUDITED)
| Three months ended June 30, | ||||||||
| (Amounts in thousands) | 2014 | 2013 | ||||||
| Net income | $ | 968 | $ | 9,161 | ||||
| Other comprehensive income, net of income taxes: | ||||||||
| Currency translation adjustments | (1,013 | ) | 1,431 | |||||
| Comprehensive income (loss) | $ | (45 | ) | $ | 10,592 | |||
See accompanying notes to consolidated condensed financial statements.
| 4 |
MEASUREMENT SPECIALTIES, INC. AND SUBSIDIARIES
CONSOLIDATED CONDENSED BALANCE SHEETS
(UNAUDITED)
| (Amounts in thousands) | June 30, 2014 | March 31, 2014 | ||||||
| ASSETS | ||||||||
| Current assets: | ||||||||
| Cash and cash equivalents | $ | 43,996 | $ | 49,964 | ||||
| Accounts receivable trade, net of allowance for doubtful accounts of $997 and $827, respectively | 88,757 | 65,451 | ||||||
| Inventories, net | 95,942 | 68,280 | ||||||
| Deferred income taxes, net | 6,407 | 1,719 | ||||||
| Prepaid expenses and other current assets | 8,685 | 6,097 | ||||||
| Other receivables | 2,723 | 1,407 | ||||||
| Promissory note receivable | 33 | 33 | ||||||
| Income taxes receivable | 1,727 | - | ||||||
| Total current assets | 248,270 | 192,951 | ||||||
| Property, plant and equipment, net | 82,788 | 77,253 | ||||||
| Goodwill | 218,220 | 179,816 | ||||||
| Acquired intangible assets, net | 119,179 | 74,900 | ||||||
| Deferred income taxes, net | 3,601 | 3,940 | ||||||
| Investment in unconsolidated joint venture | 2,109 | 2,520 | ||||||
| Promissory note receivable | 705 | 712 | ||||||
| Other assets | 10,005 | 9,568 | ||||||
| Total assets | $ | 684,877 | $ | 541,660 | ||||
See accompanying notes to consolidated condensed financial statements.
| 5 |
MEASUREMENT SPECIALTIES, INC. AND SUBSIDIARIES
CONSOLIDATED CONDENSED BALANCE SHEETS
(UNAUDITED)
| (Amounts in thousands, except share amounts) | June 30, 2014 | March 31, 2014 | ||||||
| LIABILITIES AND SHAREHOLDERS' EQUITY | ||||||||
| Current liabilities: | ||||||||
| Current portion of long-term debt | $ | 10,000 | $ | 138 | ||||
| Current portion of capital lease obligations | 297 | 239 | ||||||
| Accounts payable | 49,315 | 32,967 | ||||||
| Accrued expenses | 14,524 | 6,337 | ||||||
| Accrued compensation | 17,597 | 17,251 | ||||||
| Income taxes payable | - | 703 | ||||||
| Deferred income taxes, net | 150 | 152 | ||||||
| Restructuring liabilities | 1,140 | 84 | ||||||
| Other current liabilities | 3,810 | 3,481 | ||||||
| Total current liabilities | 96,833 | 61,352 | ||||||
| Revolver | 204,000 | 105,000 | ||||||
| Long-term debt, net of current portion | 10,000 | 20,000 | ||||||
| Capital lease obligations, net of current portion | 243 | 275 | ||||||
| Deferred income taxes, net | 25,603 | 13,025 | ||||||
| Other liabilities | 6,357 | 5,462 | ||||||
| Total liabilities | 343,036 | 205,114 | ||||||
| Equity: | ||||||||
| Serial preferred stock; 221,756 shares authorized; none outstanding | - | - | ||||||
| Common stock, no par; 25,000,000 shares authorized; 16,031,521 shares and 15,934,051 shares issued and outstanding | - | - | ||||||
| Additional paid-in capital | 124,300 | 118,960 | ||||||
| Retained earnings | 201,929 | 200,961 | ||||||
| Accumulated other comprehensive income | 15,612 | 16,625 | ||||||
| Total equity | 341,841 | 336,546 | ||||||
| Total liabilities and shareholders' equity | $ | 684,877 | $ | 541,660 | ||||
See accompanying notes to consolidated condensed financial statements.
| 6 |
MEASUREMENT SPECIALTIES, INC. AND SUBSIDIARIES
CONSOLIDATED CONDENSED STATEMENTS OF SHAREHOLDERS’ EQUITY
FOR THREE MONTHS ENDED JUNE 30, 2014 AND 2013
(UNAUDITED)
| Accumulated | ||||||||||||||||||||
| Shares of | Additional | Other | ||||||||||||||||||
| Common | Paid-in | Retained | Comprehensive | |||||||||||||||||
| (Amounts in thousands, except share amounts) | Stock | Capital | Earnings | Income | Total | |||||||||||||||
| Balance, March 31, 2013 | 15,553,677 | $ | 108,287 | $ | 163,206 | $ | 8,831 | $ | 280,324 | |||||||||||
| Net income | 9,161 | - | 9,161 | |||||||||||||||||
| Currency translation adjustment | - | 1,431 | 1,431 | |||||||||||||||||
| Non-cash equity based compensation | 1,093 | - | - | 1,093 | ||||||||||||||||
| Amounts from exercise of stock options | 137,355 | 3,000 | - | - | 3,000 | |||||||||||||||
| Tax benefit from exercise of stock options | 462 | - | - | 462 | ||||||||||||||||
| Balance, June 30, 2013 | 15,691,032 | $ | 112,842 | $ | 172,367 | $ | 10,262 | $ | 295,471 | |||||||||||
| Balance, March 31, 2014 | 15,934,051 | 118,960 | 200,961 | 16,625 | $ | 336,546 | ||||||||||||||
| Net income | 968 | - | 968 | |||||||||||||||||
| Currency translation adjustment | - | (1,013 | ) | (1,013 | ) | |||||||||||||||
| Non-cash equity based compensation | 2,683 | - | - | 2,683 | ||||||||||||||||
| Amounts from exercise of stock options | 97,470 | 2,201 | - | - | 2,201 | |||||||||||||||
| Tax benefit from exercise of stock options | 456 | - | - | 456 | ||||||||||||||||
| Balance, June 30, 2014 | 16,031,521 | $ | 124,300 | $ | 201,929 | $ | 15,612 | $ | 341,841 | |||||||||||
See accompanying notes to consolidated condensed financial statements.
| 7 |
MEASUREMENT SPECIALTIES, INC. AND SUBSIDIARIES
CONSOLIDATED CONDENSED STATEMENTS OF CASH FLOWS
(UNAUDITED)
| Three monnths ended June 30, | ||||||||
| (Amounts in thousands) | 2014 | 2013 | ||||||
| Cash flows from operating activities: | ||||||||
| Net income | $ | 968 | $ | 9,161 | ||||
| Adjustments to reconcile net income to net cash provided by operating activities: | ||||||||
| Depreciation and amortization | 5,965 | 4,832 | ||||||
| Gain on sale of assets | (264 | ) | ||||||
| Non-cash equity based compensation | 2,683 | 1,093 | ||||||
| Acquisition earn-out adjustment | - | 39 | ||||||
| Deferred income taxes | 907 | 156 | ||||||
| Equity income in unconsolidated joint venture | (223 | ) | (121 | ) | ||||
| Unconsolidated joint venture distributions | 677 | 615 | ||||||
| Net change in operating assets and liabilities, excluding the effects of acquisitions: | ||||||||
| Accounts receivable, trade | 2,651 | (4,324 | ) | |||||
| Inventories | (1,874 | ) | (501 | ) | ||||
| Prepaid expenses, other current assets and other receivables | 1,520 | 224 | ||||||
| Other assets | (363 | ) | (480 | ) | ||||
| Accounts payable | (3,336 | ) | 2,382 | |||||
| Accrued expenses, accrued compensation, restructuring, other current and other liabilities | 42 | 486 | ||||||
| Income taxes receivable and payable | (2,605 | ) | (52 | ) | ||||
| Net cash provided by operating activities | 6,748 | 13,510 | ||||||
| Cash flows from investing activities: | ||||||||
| Purchases of property and equipment | (4,685 | ) | (4,058 | ) | ||||
| Acquisition of business, net of cash acquired, and acquired intangible assets | (110,208 | ) | (51,374 | ) | ||||
| Proceeds from sale of assets, net | 1,063 | - | ||||||
| Net cash used in investing activities | (113,830 | ) | (55,432 | ) | ||||
| Cash flows from financing activities: | ||||||||
| Borrowings from revolver and short-term debt | 99,000 | 50,000 | ||||||
| Repayments of revolver and capital leases | (53 | ) | (7,010 | ) | ||||
| Repayments of long-term debt | (138 | ) | (34 | ) | ||||
| Payment of deferred acquisition payment | - | (1,500 | ) | |||||
| Payment of deferred financing costs | (204 | ) | - | |||||
| Proceeds from exercise of options and employee stock purchase plan | 2,201 | 3,000 | ||||||
| Excess tax benefit from exercise of stock options | 456 | 462 | ||||||
| Net cash provided by financing activities | 101,262 | 44,918 | ||||||
| Net change in cash and cash equivalents | (5,820 | ) | 2,996 | |||||
| Effect of exchange rate changes on cash | (148 | ) | 286 | |||||
| Cash, beginning of year | 49,964 | 36,028 | ||||||
| Cash, end of period | $ | 43,996 | $ | 39,310 | ||||
| Supplemental Cash Flow Information: | ||||||||
| Cash paid or received during the period for: | ||||||||
| Interest paid | $ | (754 | ) | $ | (833 | ) | ||
| Income taxes paid | (2,164 | ) | (1,862 | ) | ||||
| Income taxes refunded | - | 29 | ||||||
See accompanying notes to condensed consolidated financial statements.
| 8 |
MEASUREMENT SPECIALTIES, INC. AND SUBSIDIARIES
NOTES TO CONSOLIDATED CONDENSED FINANCIAL STATEMENTS
FOR THE THREE MONTHS ENDED JUNE 30, 2014 AND 2013
(UNAUDITED)
(Currency amounts in thousands, except share and per share amounts)
1. DESCRIPTION OF BUSINESS
EXPLANATORY NOTE – Merger Agreement with TE Connectivity Ltd: On June 18, 2014, Measurement Specialties, Inc., a New Jersey corporation (the “Company,” “MEAS” or “we”), entered into an Agreement and Plan of Merger (the “Merger Agreement”) with TE Connectivity Ltd., a Swiss corporation (“TE”), and Wolverine-Mars Acquisition, Inc., a Delaware corporation and an indirect wholly owned subsidiary of TE (“Merger Sub”). The Merger Agreement provides for the merger of Merger Sub with and into the Company (the “Merger”), with the Company continuing as the surviving corporation and an indirect wholly-owned subsidiary of TE. Pursuant to the Merger, each share of common stock, no par value per share, of the Company outstanding immediately prior to the effective time of the Merger (other than shares owned by TE or Merger Sub, shares held by any subsidiary of the Company or TE (other than Merger Sub), and shares held by the Company as treasury stock) shall be converted into the right to receive $86.00 in cash, without interest. We currently expect the Merger to be completed in the fall of 2014. However, the Merger is subject to various closing conditions, each of which will need to be satisfied or waived before the Merger can be completed. It is possible that the failure to timely meet those closing conditions or other factors outside of our control could require us to complete the Merger at a later time or prevent us from completing the Merger altogether. The Merger Agreement was filed as an exhibit to a Current Report on Form 8-K filed with the Securities and Exchange Commission on June 18, 2014.
Interim financial statements: The information presented as of June 30, 2014 and for the three months ended June 30, 2014 and 2013 is unaudited, and reflects all adjustments (consisting only of normal recurring adjustments) which Measurement Specialties, Inc. considers necessary for the fair presentation of the Company’s financial position as of June 30, 2014, the results of its operations for the three months ended June 30, 2014 and 2013, and cash flows for the three months ended June 30, 2014 and 2013. The Company’s March 31, 2014 consolidated condensed balance sheet information was derived from the audited consolidated financial statements for the year ended March 31, 2014, which is included as part of the Company’s Annual Report on Form 10-K.
The consolidated condensed financial statements included herein have been prepared in accordance with U.S. generally accepted accounting principles (“U.S. GAAP”) and the instructions to Form 10-Q and Regulation S-X. Accordingly, certain information and footnote disclosures normally included in financial statements prepared in accordance with U.S. generally accepted accounting principles have been condensed or omitted. These consolidated condensed financial statements should be read in conjunction with the Company’s audited consolidated financial statements for the year ended March 31, 2014, which are included as part of the Company’s Annual Report on Form 10-K.
Description of business: Measurement Specialties, Inc. is a global leader in the design, development and manufacture of sensors and sensor-based systems for original equipment manufacturers (“OEM”) and end users, based on a broad portfolio of proprietary technology and typically characterized by the MEAS brand name. We are a global business and we believe we have a high degree of diversity when considering our geographic reach, broad range of products, number of end-use markets and breadth of customer base. The Company is a multi-national corporation with twenty-one manufacturing facilities strategically located in the United States, Asia and Europe, enabling the Company to produce and market globally a wide range of sensors that use advanced technologies to measure precise ranges of physical characteristics. These sensors are used for engine and vehicle, medical, general industrial, consumer and home appliance, military/aerospace, environmental water monitoring, and test and measurement applications. The Company’s products include sensors for measuring a wide range of measurands including differential, gauge, and absolute pressure, static and dynamic force, torque, linear and rotary position, contact and non-contact temperature, linear and angular acceleration, vibration, and impact, optical absorption, humidity and gas concentration, gas or fluid flow rate, density, viscosity, dielectric constant, and other fluid properties, and fluid level.
| 9 |
2. SUMMARY OF SIGNIFICANT ACCOUNTING POLICIES:
Principles of consolidation: The consolidated condensed financial statements include the accounts of the Company and its wholly-owned subsidiaries (the “Subsidiaries”). All significant intercompany balances and transactions have been eliminated in consolidation.
The Company accounts for its 50 percent ownership interest in Nikkiso-THERM (“NT”), a joint venture in Japan and the Company’s one variable interest entity (“VIE”), under the equity method of accounting. Under the equity method of accounting, the Company does not consolidate the VIE but recognizes its proportionate share of the profits and losses of the unconsolidated VIE.
Use of estimates: The preparation of the consolidated condensed financial statements, in accordance with U.S. generally accepted accounting principles, requires management to make estimates and assumptions which affect the reported amounts of assets and liabilities and the disclosure of contingent assets and liabilities at the date of the financial statements and revenues and expenses during the reporting period. Significant items subject to such estimates and assumptions include the useful lives of fixed assets, carrying amount and analysis of recoverability of property, plant and equipment, acquired intangibles, goodwill, deferred tax assets, valuation allowances for receivables, inventories, income tax uncertainties, restructuring accruals, stock based compensation, partial self-insurance liability for health care and other contingencies. Actual results could differ from those estimates.
Recently issued accounting pronouncements: In May 2014, the FASB and the IASB issued a new joint revenue recognition standard that supersedes nearly all US GAAP guidance on revenue recognition. The core principle of the standard is that revenue recognition should depict the transfer of goods or services to customers in an amount that reflects the consideration to which the entity expects to be entitled in exchange for those goods or services. The new standard is effective for the Company for the fiscal year beginning April 1, 2017 and the Company is currently evaluating the impact of this new standard on the Company's financial statements.
3. STOCK BASED COMPENSATION AND PER SHARE INFORMATION
Non-cash equity-based compensation expense for the three months ended June 30, 2014 and 2013 was $2,683 and $1,093, respectively. Non-cash equity-based compensation expense includes the estimated effects of forfeitures, which are adjusted over the requisite service period to the extent actual forfeitures differ or are expected to differ from such estimates. Changes in estimated forfeitures are recognized in the period of change and impact the amount of expense to be recognized in future periods. During the three months ended June 30, 2014, the Company granted 151,915 stock awards under the 2013 Equity Incentive Plan (“2013 Plan”). The estimated fair value of stock awards is based on the price of the Company’s stock on the day granted, and the fair value of stock awards granted during the three months ended June 30, 2014 was approximately $9,672, net of expected forfeitures and is being recognized over the respective vesting periods. During the three months ended June 30, 2014, the Company recognized $833 of expense related to these stock awards.
The Company has six share-based compensation plans for which equity awards are currently outstanding. These plans are administered by the compensation committee of the Board of Directors, which approves grants to individuals eligible to receive awards and determines the number of shares and/or options subject to each award, the terms, conditions, performance measures, and other provisions of the award. The Chief Executive Officer can also grant individual awards up to certain limits as approved by the compensation committee. Awards are generally granted based on the individual’s performance. Terms for stock option awards include pricing based on the closing price of the Company’s common stock on the award date, and generally vest over three to five year requisite service periods using a graded vesting schedule or subject to performance targets established by the compensation committee. Shares issued under stock option plans are newly issued common stock. For additional information related to the six share-based compensation plans under which awards are currently outstanding, readers should refer to Note 12 of the consolidated financial statements in the Company’s Annual Report on Form 10-K for the fiscal year ended March 31, 2014.
| 10 |
The Company uses the Black-Scholes-Merton option pricing model to estimate the fair value of equity-based awards with the following assumptions for the indicated periods.
| Three months ended June 30, 2013 | ||||
| Dividend yield | - | |||
| Expected volatility | 45.2 | % | ||
| Risk free interest rate | 0.4 | % | ||
| Expected term (in years) | 3.0 | |||
| Weighted-average grant-date fair value | $ | 12.68 | ||
The assumptions above are based on multiple factors, including historical exercise patterns of employees with respect to exercise and post-vesting employment termination behaviors, expected future exercise patterns for these employees and the historical volatility of our stock price. The expected term of options granted is derived using company-specific, historical exercise information and represents the period of time that options granted are expected to be outstanding. The risk-free interest rate for periods within the contractual life of the option is based on the U.S. Treasury yield curve in effect at the time of grant. No assumptions for the three months ended June 30, 2014 are presented since no options were granted during this period.
During the three months ended June 30, 2014, a total of 97,470 stock awards and options were exercised yielding $2,201 in cash proceeds and excess tax benefit of $456 recognized as additional paid-in capital. At June 30, 2014, there was $6,972 of unrecognized compensation cost adjusted for estimated forfeitures related to share-based payments, which is expected to be recognized over a weighted-average period of approximately 1.4 years.
Per share information: Basic and diluted per share calculations are based on net income. Basic per share information is computed based on the weighted average common shares outstanding during each period. Diluted per share information additionally considers the shares that may be issued upon exercise or conversion of stock options, less the shares that may be repurchased with the funds received from their exercise. No outstanding awards were excluded from the calculation for the three months ended June 30, 2014. Outstanding awards relating to approximately 29,961 weighted shares were excluded from the calculation for the three months ended June 30, 2013, as the impact of including such awards in the calculation of diluted earnings per share would have had an anti-dilutive effect.
The computation of the basic and diluted net income per common share is as follows:
| Net income (Numerator) | Weighted Average Shares in thousands (Denominator) | Per-Share Amount | ||||||||||
| Three months ended June 30, 2014: | ||||||||||||
| Basic per share information | $ | 968 | 15,956 | $ | 0.06 | |||||||
| Effect of dilutive securities | - | 881 | - | |||||||||
| Diluted per-share information | $ | 968 | 16,837 | $ | 0.06 | |||||||
| Three months ended June 30, 2013: | ||||||||||||
| Basic per share information | $ | 9,161 | 15,632 | $ | 0.59 | |||||||
| Effect of dilutive securities | - | 849 | (0.03 | ) | ||||||||
| Diluted per-share information | $ | 9,161 | 16,481 | $ | 0.56 | |||||||
| 11 |
4. INVENTORIES
Inventories are valued at the lower of cost or market (‘LCM’) using the first-in first-out method. Inventories and inventory reserves for slow-moving, obsolete and lower of cost or market exposures at June 30, 2014 and March 31, 2014 are summarized as follows:
| June 30, 2014 | March 31, 2014 | |||||||
| Raw Materials | $ | 45,488 | $ | 39,902 | ||||
| Work-in-Process | 16,356 | 12,135 | ||||||
| Finished Goods | 39,117 | 21,029 | ||||||
| 100,961 | 73,066 | |||||||
| Inventory Reserves | (5,019 | ) | (4,786 | ) | ||||
| $ | 95,942 | $ | 68,280 | |||||
5. PROPERTY, PLANT AND EQUIPMENT
Property, plant and equipment are stated at cost. Equipment under capital leases is stated at the present value of minimum lease payments. Property, plant and equipment are summarized as follows:
| June 30, 2014 | March 31, 2014 | Useful Life | ||||||||
| Production equipment and tooling | $ | 89,135 | $ | 83,546 | 3-10 years | |||||
| Building and leasehold improvements | 44,203 | 38,066 | 39 to 45 years or lesser of useful life or remaining term of lease | |||||||
| Furniture and equipment | 23,960 | 19,255 | 3-10 years | |||||||
| Construction-in-progress | 5,019 | 9,852 | ||||||||
| Total | 162,317 | 150,719 | ||||||||
| Less: accumulated depreciation and amortization | (79,529 | ) | (73,466 | ) | ||||||
| $ | 82,788 | $ | 77,253 | |||||||
Included in construction in progress at June 30, 2014 was approximately $815 related to the construction of the new facility in Andover, Minnesota. Included in construction in progress at March 31, 2014 was approximately $4,962 related to the construction of the new facility in Chengdu, China. Total depreciation was $3,036 and $2,500 for the three months ended June 30, 2014 and 2013, respectively. Property and equipment included $540 and $514 in capital leases at June 30, 2014 and March 31, 2014, respectively.
6. ACQUISITIONS AND ACQUIRED INTANGIBLE ASSETS
Acquisitions: The Company continually evaluates potential acquisitions that either strategically fit with the Company’s existing portfolio or expand the Company’s portfolio into new and attractive business areas. The Company has completed a number of acquisitions that have been accounted for as purchases and have resulted in the recognition of goodwill in the Company’s financial statements. This goodwill arises because the purchase prices for these businesses reflect a number of factors, including the future earnings and cash flow potential of these businesses, and other factors at which similar businesses have been purchased by other acquirers, the competitive nature of the process by which the Company acquired the business, and the complementary strategic fit and resulting synergies these businesses bring to existing operations.
Goodwill balances presented in the consolidated condensed balance sheets of foreign acquisitions are translated at the exchange rate in effect at each balance sheet date; however, opening balance sheets used to calculate goodwill and acquired intangible assets are based on purchase date exchange rates. The following table shows the roll forward of goodwill reflected in the financial statements for the three months ended June 30, 2014:
| Accumulated goodwill | $ | 183,169 | ||
| Accumulated impairment losses | (3,353 | ) | ||
| Balance April 1, 2014 | 179,816 | |||
| Attributable to acquisitions | 39,969 | |||
| Attributable to divesture | (216 | ) | ||
| Effect of foreign currency translation | (1,349 | ) | ||
| Balance June 30, 2014 | $ | 218,220 |
The following briefly describes the Company’s acquisitions since April 1, 2013.
| 12 |
Spectrum: On April 17, 2013, the Company acquired the capital stock of Spectrum Sensors and Controls, Inc. (“Spectrum”), a leader in the design and manufacture of custom temperature probes, high reliability encoders and inertial sensors, from API Technologies Corp. for approximately $51,408 in cash from a combination of available cash on hand and from borrowings under the Company’s Senior Secured Credit Facility. The purchase price was subsequently decreased by $224 based on final calculations of established working capital levels.
Sensotherm: On August 30, 2013, the Company acquired the capital stock of Sensotherm Temperatursensorik GmbH, a German limited liability company and Secon Kft., a Hungarian limited liability company (together, “Sensotherm"), a leader in the design and manufacture of platinum (Pt) thin film temperature sensors for approximately €4,900 or approximately $6,600 in cash from available cash on hand.
Wema: On May 30, 2014, the Company acquired the capital stock of Wema Group Holdings AS (“Wema”), a company based in Norway and a leader in the design and manufacture of urea quality sensors, for approximately $114,000 in cash paid from a combination of available cash on hand and borrowings under the Company’s Senior Secured Credit Facility. From the acquisition date to June 30, 2014, approximately $10,458 in net sales, approximately $1,234 in net loss and approximately $978 in transaction related costs were recorded as a component of selling, general and administrative expenses related to Wema in the Company’s consolidated condensed financial statements. Due to the recent timing of the Wema acquisition, the accounting for the acquisition is subject to certain adjustments for, among other things, income taxes, valuation of inventories and acquired intangible assets, which will be finalized within the permitted measurement period. The Company’s preliminary accounting for the Wema acquisition is as follows:
| Assets: | ||||
| Cash | $ | 3,665 | ||
| Accounts receivable | 26,748 | |||
| Inventory | 26,801 | |||
| Prepaid and other | 4,389 | |||
| Plant and equipment | 4,323 | |||
| Acquired intangible assets | 48,784 | |||
| Goodwill | 39,969 | |||
| Total assets | 154,679 | |||
| Liabilities: | ||||
| Accounts payable | (21,456 | ) | ||
| Accrued expenses | (10,860 | ) | ||
| Capital lease obligation | (86 | ) | ||
| Income taxes payable | (175 | ) | ||
| Deferred income taxes | (8,229 | ) | ||
| Total liabilities | (40,806 | ) | ||
| Total purchase price and cash paid at close | $ | 113,873 |
Acquired intangible assets: In connection with all acquisitions, the Company acquired certain identifiable intangible assets, including customer relationships, proprietary technology, patents, trade-names, order backlogs and covenants-not-to-compete.
| 13 |
The gross amounts and accumulated amortization, along with the range of amortizable lives, are as follows:
| June 30, 2014 | March 31, 2014 | |||||||||||||||||||||||||||
| Weighted- Average Life in years | Gross Amount | Accumulated Amortization | Net | Gross Amount | Accumulated Amortization | Net | ||||||||||||||||||||||
| Amortizable intangible assets: | ||||||||||||||||||||||||||||
| Customer relationships | 12 | $ | 124,043 | $ | (35,443 | ) | $ | 88,600 | $ | 94,182 | $ | (33,994 | ) | $ | 60,188 | |||||||||||||
| Patents | 15 | 4,135 | (2,420 | ) | 1,715 | 4,158 | (2,370 | ) | 1,788 | |||||||||||||||||||
| Tradenames | 2 | 3,575 | (2,698 | ) | 877 | 2,663 | (2,655 | ) | 8 | |||||||||||||||||||
| Backlog | 1 | 10,318 | (6,456 | ) | 3,862 | 6,131 | (6,111 | ) | 20 | |||||||||||||||||||
| Covenants-not-to-compete | 3 | 1,368 | (1,254 | ) | 114 | 1,371 | (1,238 | ) | 133 | |||||||||||||||||||
| Proprietary technology | 13 | 29,689 | (5,678 | ) | 24,011 | 18,055 | (5,292 | ) | 12,763 | |||||||||||||||||||
| $ | 173,128 | $ | (53,949 | ) | $ | 119,179 | $ | 126,560 | $ | (51,660 | ) | $ | 74,900 | |||||||||||||||
Amortization expense for acquired intangible assets for the three months ended June 30, 2014 and 2013 was $2,830 and $2,346, respectively. Annual amortization expense for the years ending June 30 is estimated as follows:
| Amortization | ||||
| Year | Expense | |||
| 2015 | $ | 15,876 | ||
| 2016 | 11,016 | |||
| 2017 | 10,755 | |||
| 2018 | 10,166 | |||
| 2019 | 8,537 | |||
| Thereafter | 62,829 | |||
| $ | 119,179 | |||
Pro forma Financial Data (Unaudited): The following represents the Company’s pro forma consolidated condensed net sales and net income for the three months ended June 30, 2014 and 2013, based on purchase accounting information assuming Spectrum, Sensotherm and Wema acquisitions occurred as of April 1, 2012, giving effect to purchase accounting adjustments. The pro forma data is for informational purposes only and may not necessarily reflect results of operations had the acquired companies been operated as part of the Company since April 1, 2013.
| Three months ended June 30, | ||||||||
| 2014 | 2013 | |||||||
| Net sales | $ | 134,715 | $ | 126,927 | ||||
| Net income | $ | 1,978 | $ | 7,719 | ||||
| Net income per share: | ||||||||
| Basic | $ | 0.12 | $ | 0.49 | ||||
| Diluted | $ | 0.12 | $ | 0.48 | ||||
7. FAIR VALUE MEASUREMENTS:
Accounting standards define fair value based on an exit price model, establish a framework for measuring fair value where the Company’s assets and liabilities are required to be carried at fair value and provide for certain disclosures related to the valuation methods used within a valuation hierarchy as established within the accounting standards. This hierarchy prioritizes the inputs into three broad levels as follows. Level 1 inputs are quoted prices (unadjusted) in active markets for identical assets or liabilities. Level 2 inputs are quoted prices for similar assets and liabilities in active markets, quoted prices for identical or similar assets in markets that are not active, or other observable characteristics for the asset or liability, including interest rates, yield curves and credit risks, or inputs that are derived principally from or corroborated by observable market data through correlation. Level 3 inputs are unobservable inputs based on the Company’s assumptions. A financial asset or liability’s classification within the hierarchy is determined based on the lowest level input that is significant to the fair value measurement in its entirety. The Company's assessment of the significance of a particular input to the fair value measurement requires judgment, and may affect the valuation of fair value of assets and liabilities and their placement within the fair value hierarchy levels.
| 14 |
A summary of financial assets and liabilities that are measured at fair value on a recurring basis as of June 30, 2014 and March 31, 2014 are as follows:
| June 30, 2014 | Quoted prices in active markets (Level 1) | Significant other observable inputs (Level 2) | Significant unobservable inputs (Level 3) | Total | ||||||||||||
| Liabilities: | ||||||||||||||||
| Foreign currency exchange contracts | - | $ | 382 | - | $ | 382 | ||||||||||
| March 31, 2014 | ||||||||||||||||
| Liabilities: | ||||||||||||||||
| Foreign currency exchange contracts | - | $ | 235 | $ | - | $ | 235 | |||||||||
The foreign currency exchange contracts do not qualify for hedge accounting, and as a result, changes in the fair value of the currency forwards are reflected in the accompanying consolidated condensed statements of operations. The fair value of the Company’s foreign currency contracts was based on Level 2 measurements in the fair value hierarchy. The fair value of the foreign currency contracts is based on forward exchange rates relative to current exchange rates which were obtained from independent financial institutions reflecting market quotes.
There were no transfers between Level 1, Level 2 and Level 3 of the fair value hierarchy during the three months ended June 30, 2014.
Fair Value of Financial Instruments: In addition to the fair value disclosure requirements related to financial instruments carried at fair value, accounting standards require interim disclosures regarding the fair value of all of the Company’s financial instruments. The methods and significant assumptions used to estimate the fair value of financial instruments and any changes in methods or significant assumptions from prior periods are also required to be disclosed.
The fair values and carrying amounts of other financial instruments as of June 30, 2014 and March 31, 2014 are as follows:
| June 30, 2014 | March 31, 2014 | |||||||||||||||
| Carrying Amount | Fair Value | Carrying Amount | Fair Value | |||||||||||||
| Assets: | ||||||||||||||||
| Promissory note receivable | $ | 738 | $ | 738 | $ | 745 | $ | 745 | ||||||||
| Liabilities: | ||||||||||||||||
| Capital leases | 540 | 540 | 514 | 514 | ||||||||||||
| Revolver | 204,000 | 204,000 | 105,000 | 105,000 | ||||||||||||
| Term debt | 20,000 | 20,000 | 20,138 | 20,138 | ||||||||||||
For promissory note receivable, promissory notes payable, capital lease obligations, and long-term debt, the fair value is determined as the present value of expected future cash flows discounted at the current interest rate, which approximates rates currently offered by lending institutions for loans of similar terms and comparable maturities to companies with comparable credit risk. These are considered Level 2 inputs. The fair value of the revolver approximates carrying value due to the variable interest nature of the debt. There were no changes in the methods or significant assumptions to estimate fair value of the Company’s financial instruments from prior periods.
| 15 |
Derivative instruments and risk management: The Company is exposed to market risks from changes in interest rates, commodities, credit and foreign currency exchange rates, which could impact its results of operations and financial condition. The Company attempts to address its exposure to these risks through its normal operating and financing activities. In addition, the Company’s relatively broad-based business activities help to reduce the impact that volatility in any particular area or related areas may have on its operating results as a whole. Readers should refer to Note 6 in the Annual Report for the fiscal year ended March 31, 2014 for additional information related to the Company’s exposures to market risks for interest rates, commodities and credit.
Foreign Currency Exchange Rate Risk: Foreign currency exchange rate risk arises from the Company’s investments in subsidiaries owned and operated in foreign countries, as well as from transactions with customers in countries outside the U.S. and transactions denominated in currencies other than the applicable functional currency.
Although the Company has a U.S. dollar functional currency for reporting purposes, it has manufacturing and operating sites throughout the world and a large portion of its sales are generated in foreign currencies. A substantial portion of the Company’s revenue is priced in U.S. dollars, and most of its costs and expenses are priced in U.S. dollars, with the remaining priced in Chinese RMB, Euros, Swiss francs and Norwegian krone (“NOK”). Sales by subsidiaries operating outside of the United States are translated into U.S. dollars using exchange rates effective during the respective period. As a result, the Company is exposed to movements in the exchange rates of various currencies against the U.S. dollar. Accordingly, the competitiveness of its products relative to products produced locally (in foreign markets) may be affected by the performance of the U.S. dollar compared with that of our foreign customers’ currencies. Refer to Note 11, Segment Information, for details concerning net sales invoiced from our facilities within the U.S. and outside of the U.S., as well as long-lived assets. Therefore, both positive and negative movements in currency exchange rates against the U.S. dollar will continue to affect the reported amount of sales, profit, and assets and liabilities in the Company’s consolidated condensed financial statements.
During the three months ended June 30, 2014, the RMB appreciated approximately 0.7% relative to the U.S. dollar. The RMB appreciated approximately 1.8% and 0.7%, respectively, relative to the U.S. dollar during fiscal 2014 and 2013. The Chinese government no longer pegs the RMB to the U.S. dollar, but established a currency policy letting the RMB trade in a narrow band against a basket of currencies. The Company has more expenses in RMB than sales (i.e., short RMB position), and as such, if the U.S. dollar weakens relative to the RMB, our operating profits will decrease. We continue to consider various alternatives to hedge this exposure, and we are attempting to manage this exposure through, among other things, forward purchase contracts, pricing and monitoring balance sheet exposures for payables and receivables.
The Company uses foreign currency forward exchange contracts in Asia for the purposes of hedging the Company’s short-position exposure to the RMB. At June 30, 2014 , the Company had a number of RMB/U.S. dollar currency contracts with notional amounts totaling $24,200 and exercise dates through June 30, 2015 at average exchange rates of 0.1618 (RMB to U.S. dollar conversion rate). With the RMB/U.S. dollar contracts, for every 10 percent depreciation of the RMB, the Company would be exposed to approximately $2,420 in additional foreign currency exchange losses. Since these derivatives are not designated as hedges for accounting purposes, changes in their fair value are recorded in results of operations, not in other comprehensive income. To manage our exposure to potential foreign currency transaction and translation risks, we may purchase additional foreign currency exchange forward contracts, currency options, or other derivative instruments, provided such instruments may be obtained at suitable prices.
With the acquisition of Wema, the Company increased foreign currency exposures with the addition of the NOK. At June 30, 2014, the Company had approximately $89,000 subject to foreign currency exposures with the U.S. dollar and NOK, since the funding of the acquisition was denominated in U.S. dollars and the resulting inter-company funding was denominated in NOK. With the aforementioned NOK exposures and the depreciation of the NOK relative to the U.S. dollar, the Company incurred foreign currency exchanges losses of approximately $2,400 during the period ended June 30, 2014. Subsequent to June 30, 2014, the Company converted a portion of the borrowings from U.S. dollar to NOK to offset foreign currency exchange gains or losses related to the inter-company funding in NOK.
| 16 |
Fair values of derivative instruments not designated as hedging instruments are as follows:
| June 30, | March 31, | |||||||||
| Financial position: | 2014 | 2014 | Location | |||||||
| Foreign currency contracts - RMB | $ | (382 | ) | $ | (235 | ) | Other assets (liabilities) | |||
The effect of derivative instruments not designated as hedging instruments on the statements of operations for the three months ended June 30, 2014 and 2013 and statements of cash flows for the three months ended June 30, 2014 and 2013 are as follows:
| Three months ended June 30, | ||||||||||
| Results of operations: | 2014 | 2013 | Location | |||||||
| Foreign currency contracts - RMB | $ | 64 | $ | 56 | Foreign currency exchange loss (gain) | |||||
| Total | $ | 64 | $ | 56 | ||||||
| Three months ended June 30, | ||||||||||
| Cash flows from operating activities: | 2014 | 2013 | Location | |||||||
| Foreign currency exchange contracts - RMB | $ | 83 | $ | 90 | Prepaid expenses (Accrued expenses) | |||||
| Total | $ | 83 | $ | 90 | ||||||
8. LONG-TERM DEBT:
Long-term debt and revolver: The Company entered into a Credit Agreement (the "Senior Secured Credit Facility") dated June 1, 2010, among JPMorgan Chase Bank, N.A., as administrative agent and collateral agent (in such capacity, the "Senior Secured Facility Agents"), Bank America, N.A., as syndication agent, HSBC Bank USA, N.A., as document agent, and certain other parties thereto (the "Credit Agreement") to refinance the Amended and Restated Credit Agreement effective as of April 1, 2006 among the Company, General Electric Capital Corporation (“GE”), as agent and a lender, and certain other parties thereto and to provide for the working capital needs of the Company including to effect permitted acquisitions.
On May 7, 2014, the Company entered into Amendment No. 5 to the Credit Agreement which increased the aggregate commitment to $260,000 from $185,000, reset the accordion feature to $75,000 for future expansion and added Wells Fargo Bank, National Association and SunTrust to the group of lenders. On May 7, 2014, the Company entered into a Fifth Amendment to Note Purchase Agreement to provide conformity with the Credit Agreement Amendment since the Note Purchase Agreement is on a pari passu (equal force) basis with the Senior Secured Facility.
The Senior Secured Credit Facility, as amended, consists of a $260,000 revolving credit facility (the "Revolving Credit Facility") with a $75,000 accordion feature enabling expansion of the Revolving Credit Facility to $335,000. The Revolving Credit Facility has a variable interest rate based on the LIBOR, EURIBOR or the ABR Rate (prime based rate) with applicable margins ranging from 1.25% to 2.00% for LIBOR and EURIBOR based loans or 0.25% to 1.00% for ABR Rate loans. The applicable margins may be adjusted quarterly based on a change in the leverage ratio of the Company. The Senior Secured Credit Facility also includes the ability to borrow in currencies other than U.S. dollars, such as the Euro and Swiss Franc, up to $66,000, none of which was utilized at June 30, 2014. Commitment fees on the unused balance of the Revolving Credit Facility range from 0.25% to 0.375% per annum of the average amount of unused balances. The Revolving Credit Facility will expire on November 8, 2016 and all balances outstanding under the Revolving Credit Facility will be due on such date. The Company has provided a security interest in substantially all of the Company's U.S. based assets as collateral for the Senior Secured Credit Facility and private placement of credit facilities entered into by the Company from time to time not to exceed $50,000, including the Prudential Shelf Facility (as defined below). The Senior Secured Credit Facility includes an inter-creditor arrangement with Prudential and is on a pari passu (equal force) basis with the Prudential Shelf Facility.
As of June 30, 2014, the Company utilized the LIBOR based rate for $139,000 of the Revolving Credit Facility. The weighted average interest rate applicable to borrowings under the Revolving Credit Facility was approximately 2.3% at June 30, 2014. As of June 30, 2014, the outstanding borrowings on the Revolving Credit Facility, which is classified as non-current, were $204,000. The Company’s borrowing capacity is limited by financial covenant ratios, including earnings ratios, and as such, our borrowing capacity is subject to change. At June 30, 2014, the Company could have borrowed an additional $56,000 under the Revolving Credit Facility.
| 17 |
On June 1, 2010, the Company entered into a Master Shelf Agreement (the "Prudential Shelf Facility") with Prudential Investment Management, Inc. ("Prudential") whereby Prudential agreed to purchase up to $50,000 of senior secured notes (the "Senior Secured Notes") issued by the Company. Prudential purchased two Senior Secured Notes each for $10,000 and the remaining $30,000 of such Senior Secured Notes may be purchased at the discretion n of Prudential or one or more of its affiliates upon the request of the Company. The Prudential Shelf Facility has a fixed interest rate of 5.70% and 6.15% for each of the two $10,000 Senior Secured Notes issued by the Company and the Senior Secured Notes issued thereunder are due on June 1, 2015 and 2017, respectively. The Prudential Shelf Facility includes specific financial covenants for maximum total leverage ratio and minimum fixed charge coverage ratio consistent with the Senior Secured Credit Facility, as well as customary representations, warranties, covenants and events of default. The Prudential Shelf Facility includes an inter-creditor arrangement with the Senior Secured Facility Agents and is on a pari passu (equal force) basis with the Senior Secured Facility.
The Company was in compliance with its debt covenants at June 30, 2014.
Deferred financing costs: Amortization of deferred financing costs totaled $99 and $86 for the three months ended June 30, 2014 and 2013, respectively. Annual amortization expense of deferred financing costs associated with the refinancing is estimated to be approximately $416.
Chinese credit facility: On November 3, 2009, the Company’s subsidiary in China (“MEAS China”) entered into a two year credit facility agreement (the “China Credit Facility”) with China Merchants Bank Co., Ltd (“CMB”). MEAS China renewed the China Credit Facility and extended the expiration to November 28, 2015. The China Credit Facility permits MEAS China to borrow up to RMB 68,000 (approximately $11,000). Specific covenants include customary limitations, compliance with laws and regulations, use of proceeds for operational purposes, and timely payment of interest and principal. MEAS China has pledged its Shenzhen facility to CMB as collateral. The interest rate will be based on the London Inter-bank Offered Rate (“LIBOR”) plus a LIBOR spread, depending on the term of the loan when drawn. The purpose of the China Credit Facility is primarily to provide additional flexibility in funding operations of MEAS China. At June 30, 2014, MEAS China had not borrowed any amounts under the China Credit Facility.
European credit facility: On July 21, 2010, the Company’s subsidiary in France (“MEAS Europe”) entered into a five year credit facility agreement (the “European Credit Facility”) with La Societe Bordelaise de Credit Industriel et Commercial (“CIC”). The European Credit Facility permits MEAS Europe to borrow up to €2,000 (approximately $2,700). Specific covenants include certain financial covenants for maximum leverage ratio and net debt to equity ratio, as well as customary limitations, compliance with laws and regulations, use of proceeds, and timely payment of interest and principal. MEAS Europe has pledged its Les Clayes-sous-Bois, France facility to CIC as collateral. The interest rate is based on the EURIBOR interest rate plus a spread of 1.8%. The EURIBOR interest rate will vary depending on the term of the loan when drawn. The purpose of the European Credit Facility is primarily to provide additional flexibility in funding operations of MEAS Europe. At June 30, 2014, MEAS Europe had not borrowed any amounts under the European Credit Facility.
Long-term debt and promissory notes: Below is a summary of the long-term debt and promissory notes outstanding at June 30, 2014 and March 31, 2014:
| 18 |
| June 30, | March 31, | |||||||
| 2014 | 2014 | |||||||
| Term notes at 5.70% due in full on June 1, 2015 | $ | 10,000 | $ | 10,000 | ||||
| Term notes at 6.15% due in full on June 1, 2017 | 10,000 | 10,000 | ||||||
| Governmental loans from French agencies at no interest and payable based on R&D expenditures | - | 138 | ||||||
| 20,000 | 20,138 | |||||||
| Less current portion of long-term debt | 10,000 | 138 | ||||||
| $ | 10,000 | $ | 20,000 | |||||
The annual principal payments of long-term debt, promissory notes and revolver as of June 30, 2014 are as follows:
| Years ending June 30, | Term | Other | Subtotal | Revolver | Total | |||||||||||||||
| 2015 | $ | 10,000 | $ | - | $ | 10,000 | $ | - | $ | 10,000 | ||||||||||
| 2016 | - | - | - | - | - | |||||||||||||||
| 2017 | 10,000 | - | 10,000 | 204,000 | 214,000 | |||||||||||||||
| 2018 | - | - | - | - | ||||||||||||||||
| Total | $ | 20,000 | $ | - | $ | 20,000 | $ | 204,000 | $ | 224,000 | ||||||||||
9. RESTRUCTURINGS:
Restructurings:
As part of the Company’s ongoing efforts to review its business for opportunities to reduce operating expenses and leverage core competencies, the Company evaluates and implements various restructurings to, among other things, improve operational efficiencies. The Company has started to implement the restructuring to consolidate its U.S. operations in Dayton, Ohio, St. Marys, Pennsylvania, Shrewsbury, Massachusetts and Ham Lake, Minnesota to a new greenfield facility in Andover, Minnesota, as well as certain restructuring measures in Switzerland and Norway. Costs associated with these restructurings have and will include payments for severance charges, costs for termination of benefits and other related activities, in addition to possible contract terminations. The announcements concerning the U.S. operations were made in February 2014. At June 30, 2014, the liability for estimated severance costs related to U.S. restructurings was approximately $374, and the Company expects restructurings cost to range from $2,500 to $3,000 through calendar 2015. At June 30, 2014, the liability for estimated severance costs related to restructuring in Switzerland was approximately $225, and the Company expects restructurings cost to range from $800 to $1,000 through calendar 2016. At June 30, 2014, the liability for estimated severance costs related to restructuring in Norway was approximately $541, and the Company may incur additional restructuring costs in Norway as it completes its assessment of the Norwegian operation and finalizes its integration plan of Wema entities.
The following details the accrued restructuring reserves and activity at June 30, 2014:
| Balance as of | Balance as of | |||||||||||||||
| April 1, 2014 | Restructuring costs | Payments | June 30, 2014 | |||||||||||||
| Restructuring of U.S. operations | $ | 84 | $ | 331 | $ | (41 | ) | $ | 374 | |||||||
| Restructuring of Swiss operations | - | 225 | - | 225 | ||||||||||||
| Restructuring of Norwegian operations | - | 541 | - | 541 | ||||||||||||
| $ | 84 | $ | 1,097 | $ | (41 | ) | $ | 1,140 | ||||||||
Restructuring provisions are determined based on estimates prepared at the time the restructuring actions are approved by management, and are periodically updated for changes and also include amounts recognized as incurred.
| 19 |
10. COMMITMENTS AND CONTINGENCIES:
Litigation:
Pending Legal Matters
In July 2014, three separate class action lawsuits were filed on behalf of shareholders of the Company against the Company, certain present and former directors of the Company and TE Connectivity Ltd. alleging violations of fiduciary duties in connection with TE’s proposed acquisition of the Company. It is not possible at this time to predict the precise timing or probable outcome of any lawsuits related to the proposed acquisition of the Company by TE and the Company cannot make a reasonable estimate of the possible loss or range of losses at this time.
Other than as set forth above, there are currently no material pending legal proceedings. From time to time, the Company is subject to legal proceedings and claims in the ordinary course of business. The Company currently is not aware of any such legal proceedings or claims that the Company believes will have, individually or in the aggregate, a material adverse effect on the Company’s business, financial condition, or operating results.
11. SEGMENT INFORMATION:
The Company continues to have one reporting segment, a sensor business, under applicable accounting guidelines for segment reporting. For a description of the products and services of the Sensor business, see Note 1. Management continually assesses the Company’s operating structure, and this structure could be modified further based on future circumstances and business conditions.
Geographic information for revenues based on country from which invoiced and long-lived assets based on country of location, which includes property, plant and equipment, but excludes intangible assets and goodwill, net of related depreciation and amortization follows:
| Three months ended June 30, | ||||||||
| 2014 | 2013 | |||||||
| Net Sales: | ||||||||
| United States | $ | 47,077 | $ | 43,121 | ||||
| France | 20,606 | 16,972 | ||||||
| Germany | 7,124 | 4,224 | ||||||
| Ireland | 7,387 | 7,650 | ||||||
| Switzerland | 4,533 | 4,975 | ||||||
| Scotland | - | 2,698 | ||||||
| Norway | 6,783 | - | ||||||
| China | 20,619 | 20,872 | ||||||
| Total: | $ | 114,129 | $ | 100,512 | ||||
| June 30, 2014 | March 31, 2014 | |||||||
| Long Lived Assets: | ||||||||
| United States | $ | 11,979 | $ | 11,138 | ||||
| France | 19,322 | 19,780 | ||||||
| Germany | 4,520 | 4,592 | ||||||
| Ireland | 3,054 | 3,155 | ||||||
| Switzerland | 2,614 | 2,665 | ||||||
| Scotland | - | 70 | ||||||
| Norway | 3,269 | - | ||||||
| China | 37,412 | 35,853 | ||||||
| Thailand | 618 | - | ||||||
| Total: | $ | 82,788 | $ | 77,253 | ||||
Item 2. Management’s Discussion and Analysis of Financial Condition and Results of Operations
(Amounts in thousands, except per share data)
The following discussion and analysis presents our consolidated financial condition at June 30, 2014 and the results of operations for the three months ended June 30, 2014 and 2013. The following discussion should be read together with our Consolidated Condensed Financial Statements and the related notes contained elsewhere in this quarterly report. In addition to the historical information provided below, we have made certain estimates and forward-looking statements that involve risks and uncertainties. Our actual results could differ materially from those anticipated or implied by these estimates and forward-looking statements as a result of certain factors, including those discussed in the Information Related to Forward-Looking Statements on page 21 of this quarterly report.
| 20 |
RECENT DEVELOPMENTS - Merger Agreement with TE Connectivity Ltd: On June 18, 2014, Measurement Specialties, Inc., a New Jersey corporation (the “Company,” “MEAS” or “we”), entered into an Agreement and Plan of Merger (the “Merger Agreement”) with TE Connectivity Ltd., a Swiss corporation (“TE”), and Wolverine-Mars Acquisition, Inc., a Delaware corporation and an indirect wholly owned subsidiary of TE (“Merger Sub”). The Merger Agreement provides for the merger of Merger Sub with and into the Company (the “Merger”), with the Company continuing as the surviving corporation and an indirect wholly-owned subsidiary of TE. Pursuant to the Merger, each share of common stock, no par value per share, of the Company outstanding immediately prior to the effective time of the Merger (other than shares owned by TE or Merger Sub, shares held by any subsidiary of the Company or TE (other than Merger Sub), and shares held by the Company as treasury stock) shall be converted into the right to receive $86.00 in cash, without interest. We currently expect the Merger to be completed in the fall of 2014. The Merger Agreement was filed as an exhibit to a Current Report on Form 8-K filed with the Securities and Exchange Commission on June 18, 2014.
There could be unexpected effects to the Company as a result of the Merger Agreement, including issues out of our control, such as the recent work stoppage and work slowdown at our facility in Shenzhen, China, as disclosed in Current Reports filed on Form 8-K filed on July 7, 2014 and July 14, 2014 and further discussed below.
Information Relating To Forward-Looking Statements
This report includes forward-looking statements within the meaning of Section 21E of the Securities Exchange Act of 1934, as amended. Certain information included or incorporated by reference in this Quarterly Report, in press releases, written statements or other documents filed with or furnished to the Securities and Exchange Commission (“SEC”), or in our communications and discussions through webcasts, phone calls, conference calls and other presentations and meetings, may be deemed to be “forward-looking statements” within the meaning of the federal securities laws. All statements other than statements of historical fact are statements that could be deemed forward-looking statements, including statements regarding: projections of revenue, margins, expenses, tax provisions (or tax benefits), earnings or losses from operations, cash flows, synergies or other financial items; plans, strategies and objectives of management for future operations, including statements relating to potential acquisitions, executive compensation and purchase commitments; developments, performance or industry or market rankings relating to products or services; future economic conditions or performance; future compliance with debt covenants; expectations concerning estimated fair value of acquisition earn-out contingencies; the outcome of outstanding claims or legal proceedings; assumptions underlying any of the foregoing; and any other statements that address activities, events or developments that Measurement Specialties, Inc. (“MEAS,” the “Company,” “we,” “us,” “our”) intends, expects, projects, believes or anticipates will or may occur in the future. Forward-looking statements may be characterized by terminology such as “forecast,” “believe,” “anticipate,” “should,” “would,” “intend,” “plan,” “will,” “expects,” “estimates,” “projects,” “positioned,” “strategy,” and similar expressions. These statements are based on assumptions and assessments made by our management in light of their experience and perception of historical trends, current conditions, expected future developments and other factors they believe to be appropriate.
Any such forward-looking statements are not guarantees of future performance and involve a number of risks and uncertainties, many of which are beyond our control. Actual results, developments and business decisions may differ materially from those envisaged by such forward-looking statements. These forward-looking statements speak only as of the date of the report, press release, statement, document, webcast or oral discussion in which they are made. Factors that might cause actual results to differ materially from the expected results described in or underlying our forward-looking statements include:
| · | Conditions in the general economy, including risks associated with the current financial markets and worldwide economic conditions and demand for products that incorporate our products; |
| 21 |
| · | Competitive factors, such as price pressures and the potential emergence of rival technologies; |
| · | Compliance with export control laws and regulations; |
| · | Fluctuations in foreign currency exchange and interest rates; |
| · | Interruptions in supply chain, distribution systems, suppliers’ operations or the refusal of our suppliers to provide us or our customers with component materials, particularly in light of the current economic conditions, natural or man-made disasters and potential for suppliers to fail; |
| · | Timely development, market acceptance and warranty performance of new products; |
| · | Changes in product mix, costs and yields; |
| · | Uncertainties related to doing business in Europe and China; |
| · | Uncertainties related to restructurings, plant closures and consolidation of operations; |
| · | Legislative initiatives, including tax legislation and other changes in the Company’s tax position; |
| · | Legal proceedings; |
| · | Product liability, warranty and recall claims; |
| · | Compliance with debt covenants, including events beyond our control; |
| · | Issues associated with the definitive acquisition agreement with TE Connectivity Ltd., including the disruption arising from the proposed transaction and its impact on relationships with business partners or governmental entities, customers and employees; |
| · | Adverse developments in industries and other markets served by us; and |
| · | The risk factors listed from time to time in the reports we file with the SEC, including those described below under “Item 1A. Risk Factors” in this Quarterly Report on Form 10-Q. |
This list is not exhaustive. Except as required under federal securities laws and the rules and regulations promulgated by the SEC, we do not intend to update publicly any forward-looking statements after the filing of this Quarterly Report on Form 10-Q, whether as a result of new information, future events, changes in assumptions or otherwise.
| 22 |
Overview
Measurement Specialties, Inc. is a global leader in the design, development and manufacture of sensors and sensor-based systems for OEM and end users, based on a broad portfolio of proprietary technology and typically characterized by the MEAS brand name. We are a global business and we believe we have a high degree of diversity when considering our geographic reach, broad range of products, number of end-use markets and breadth of customer base. The Company is a multi-national corporation with twenty-one manufacturing facilities strategically located in the United States, China, Thailand, France, Ireland, Germany, Norway and Switzerland, enabling the Company to produce and market globally a wide range of sensors that use advanced technologies to measure precise ranges of physical characteristics. These sensors are used for engine and vehicle, medical, general industrial, consumer and home appliance, military/aerospace, environmental water monitoring, and test and measurement applications. The Company’s products include sensors for measuring a wide range of measurands including differential, gauge, and absolute pressure; static and dynamic force; torque; linear and rotary position; contact and non-contact temperature; linear and angular acceleration, vibration, and impact; optical absorption; humidity and gas concentration; gas or fluid flow rate; density, viscosity, dielectric constant, and other fluid properties; and fluid level. The Company’s advanced technologies include piezo-resistive silicon, piezo-electric polymer, ceramic, and single crystal materials, application specific integrated circuits (“ASICs”), state of the art micro-electromechanical systems (“MEMS”) and custom silicon microstructures, bonded foil strain gauges, variable reluctance and electromagnetic force balance systems, fluid filled capacitive sensors, linear and rotational variable differential transformers, anisotropic magneto-resistive devices, electromagnetic sensors, hygroscopic capacitive structures, ultrasonic measurement systems, precision load cells, optical and infrared measurement systems, negative thermal coefficient (“NTC”) ceramic sensors, platinum and nickel resistance temperature detectors (“RTD”) 3-6 DOF (degree of freedom) force/torque structures, complex mechanical resonators, magnetic reed switches, high frequency multipoint pressure and temperature scanning algorithms, and high precision submersible hydrostatic level detection. We compete in growing global market segments driven by demand for products that are smarter, safer, more energy-efficient, and environmentally-friendly. We deliver a strong value proposition to our customers through our willingness to customize sensor solutions, leveraging our innovative portfolio of core technologies and exploiting our low-cost manufacturing model based on our 19 year presence in China.
Executive Summary
Our vision is to be the supplier of choice to OEMs and select end-users for all their physical sensing needs. To that end, MEAS continues to expand our market position as a leading global sensor supplier. Over the past ten fiscal years through fiscal 2014, the Compounded Annual Growth Rate (“CAGR”) of our sales of 16% has exceeded overall market increases. The Company’s historic and expected strong growth in sales reflects the positive returns from our significant investments in research and development for new programs and the approximately $450,000 invested since June 2004 through May 2014 in our 23 acquisitions, expanding our product offerings and geographic reach.
The Company remains focused on creating long-term shareholder value through continued development of innovative technologies and strengthening our market position by expanding customer relationships. We believe we continue to have one of the strongest product development pipelines in the history of the Company, which we expect to lay the foundation for future sales growth. Research and development will continue to play a key role in our efforts to maintain product innovations for new sales and to improve profitability. Our broad range of products and geographic diversity provide the Company with a variety of opportunities to leverage technology, products, manufacturing base and our financial performance. We continue to take measures we believe will result in sales performance in excess of the overall market and generation of positive adjusted earnings before interest, tax, foreign currency exchange gains or losses, depreciation and amortization (“Adjusted EBITDA”). A core tenant of our long-term strategy to increase profitability is to grow the size and scale of the Company in order to improve our leverage of SG&A expenses.
On May 30, 2014, the Company made its largest acquisition to date with the purchase of the capital stock of Wema Group Holdings AS, the global leader in SCR tank level sensors, as well as urea quality sensors, a key market for MEAS along with diesel fuel level sensors. The addition of Wema accelerates the Company’s revenue model and provides strong integration synergy potential. Due to the current operational footprint and associated cost structure of the Wema business, gross margins and associated Adjusted EBITDA are lower than the Company average and will be dilutive to the Company’s consolidated Adjusted EBITDA up to the first two years of integration. Accordingly, we believe we can achieve in excess of 18.5% Adjusted EBITDA Margin (Adjusted EBITDA as a percent of Net Sales) in fiscal 2015 (including 2015 acquisition of Wema) and improve this metric as we grow sales at a higher rate than costs in fiscal 2016 and beyond. Adjusted EBITDA Margin is a non-GAAP financial measure and we direct the reader to the Quarterly Net Sales and Quarterly Adjusted EBITDA table below for an explanation of the calculation of Adjusted EBITDA Margin. We have implemented aggressive actions to position the Company for future growth in sales and profitability. As part of these continued measures to improve profitability, the Company has targeted a number of workforce reductions and facility consolidations. The Company has substantially completed in fiscal 2014 the consolidation of all of the Company’s manufacturing operations in Scotland to other MEAS sites and the Company also fully transitioned from the Juarez, Mexico shared facility with API to our manufacturing sites in China. Additionally, the Company has begun to implement the consolidation of the U.S. operations in Dayton, Ohio, St. Marys, Pennsylvania, Shrewsbury, Massachusetts and Ham Lake, Minnesota to a new greenfield facility in Andover, Minnesota, as well as certain restructuring measures in Switzerland and Norway. The Company expects restructuring charges to range from $2,500 to $3,000 associated with the restructuring of the U.S. operations through calendar 2015. The Company expects to realize annual cost efficiencies beginning in fiscal 2016 as a result of the various restructurings in the U.S. and Europe of approximately $5,000 by fiscal 2016, of which approximately $1,400 relate to the restructuring in Scotland. For a further discussion concerning the restructuring, please refer to Note 9 to the Consolidated Condensed Financial Statements.
| 23 |
Trends
There are a number of trends that we expect to materially affect our future operating results, including changing global economic conditions with the resulting impact on our sales, profitability, and capital spending, changes in foreign currency exchange rates relative to the U.S. dollar, shifts in our taxable income between tax jurisdictions and the resulting impact on our overall effective tax rate, changes in our debt levels and applicable interest rates, and prices of raw materials and other costs, such as labor.
Overall, the Company expects continued solid sales growth in fiscal 2015, despite continued reductions in sales with our largest customer, Sensata, as a result of the long-term in-sourcing arrangement previously disclosed in 2013 Annual Report on Form 10-K. The Company expects to generate sales of approximately $540,000 for fiscal 2015, including $100,000 in sales associated with the 2015 acquisition of Wema.
We remain positive with regard to sales contribution coming from product developments and expect solid contributions over the next several years driven by key development programs, including urea level/quality sensors, digital temperature sensors and new barometric pressure sensors. One key development program in particular relates to increased diesel emission standards. All diesel truck (and eventually passenger car) OEMs are migrating to selective catalytic reduction systems (SCR), which inject urea into the exhaust stream to reduce NOx emissions. We expect OEMs to implement urea quality sensors over the next three years in the U.S. In Europe, to achieve new standards set in Euro 6c in 2016, we believe EU OEMs will integrate urea quality monitoring (as well as push for continuous level in tank) as ways to improve system efficiency and close the monitoring/dosing loop. China is several years behind U.S. and EU emission standards, so requirements for urea quality in China should phase in after 2016.
Additionally, we expect the sensor market will continue to be a growth industry and perform well relative to the overall economy as a result of the increase in sensor content in various products across most end markets in the U.S., Europe and Asia. Sensor content continues to increase at a faster rate than overall product unit growth, as OEMs add “intelligence” in products across most market verticals to promote improved energy efficiency and cleaner technologies, to meet regulatory compliance requirements and to improve user safety and convenience.
The following graph details the Company’s quarterly net sales and Adjusted EBITDA over the previous two years.
| 24 |
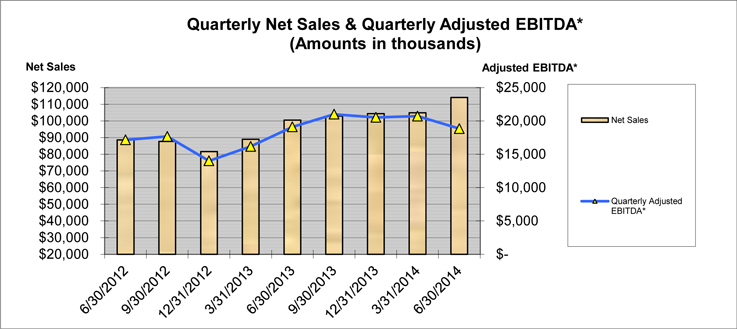
Adjusted EBITDA is a non-GAAP financial measure that is not in accordance with, or an alternative to, measures prepared in accordance with GAAP. The Company believes certain financial measures which meet the definition of non-GAAP financial measures provide important supplemental information. The Company considers Adjusted EBITDA an important financial measure because it provides a financial measure of the quality of the Company’s earnings. Other companies may calculate Adjusted EBITDA differently than we do, which might limit its usefulness as a comparative measure. Adjusted EBITDA is used by management in addition to and in conjunction with the results presented in accordance with GAAP. Additionally, we believe quarterly Adjusted EBITDA provides the current run-rate for trending purposes rather than a trailing twelve month historical amount. The following table details quarterly net sales and also provides a non-GAAP reconciliation of quarterly Adjusted EBITDA to the applicable GAAP financial measures.
| Quarter Ended | Net Sales | Quarterly Adjusted EBITDA* | Quarterly Adjusted EBITDA* Margin | Net income * | Interest | Foreign Currency Exchange Loss (Gain) | Depreciation and Amortization | Income Taxes | Share-based Compensation | Other* | ||||||||||||||||||||||||||||||
| 6/30/2012 | $ | 88,613 | $ | 17,155 | 19 | % | $ | 8,573 | $ | 722 | $ | 39 | $ | 4,388 | $ | 2,566 | $ | 856 | $ | 11 | ||||||||||||||||||||
| 9/30/2012 | $ | 87,758 | $ | 17,671 | 20 | % | $ | 10,406 | $ | 662 | $ | 202 | $ | 4,316 | $ | 3,503 | $ | 1,388 | $ | (2,806 | ) | |||||||||||||||||||
| 12/31/2012 | $ | 81,628 | $ | 14,015 | 17 | % | $ | 6,096 | $ | 688 | $ | (7 | ) | $ | 4,523 | $ | 1,075 | $ | 1,500 | $ | 140 | |||||||||||||||||||
| 3/31/2013 | $ | 88,969 | $ | 16,168 | 18 | % | $ | 9,123 | $ | 621 | $ | (345 | ) | $ | 4,659 | $ | 1,202 | $ | 989 | $ | (81 | ) | ||||||||||||||||||
| 6/30/2013 | $ | 100,512 | $ | 19,105 | 19 | % | $ | 9,161 | $ | 914 | $ | 154 | $ | 4,832 | $ | 2,506 | $ | 1,093 | $ | 445 | ||||||||||||||||||||
| 9/30/2013 | $ | 102,872 | $ | 21,006 | 20 | % | $ | 10,051 | $ | 808 | $ | 444 | $ | 5,109 | $ | 2,909 | $ | 1,977 | $ | (292 | ) | |||||||||||||||||||
| 12/31/2013 | $ | 104,416 | $ | 20,529 | 20 | % | $ | 9,214 | $ | 760 | $ | 102 | $ | 5,316 | $ | 2,105 | $ | 2,267 | $ | 765 | ||||||||||||||||||||
| 3/31/2014 | $ | 104,865 | $ | 20,722 | 20 | % | $ | 9,329 | $ | 731 | $ | 436 | $ | 5,176 | $ | 2,755 | $ | 2,038 | $ | 257 | ||||||||||||||||||||
| 6/30/2014 | $ | 114,129 | $ | 18,849 | 17 | % | $ | 968 | $ | 1,095 | $ | 2,619 | $ | 5,965 | $ | 250 | $ | 2,683 | $ | 5,269 | ||||||||||||||||||||
* - Adjusted EBITDA = Income from Continuing Operations before Interest, Foreign Currency Exchange Loss (Gain), Depreciation and Amortization, Income Taxes, Share-based Compensation and Other. Other represents legal fees incurred related to certain International Traffic in Arms Regulations matters, professional fees related to acquisitions, impairment of asset held for sale, restructuring and fair value adjustments to earn-out contingencies. Adjusted EBITDA Margin = Adjusted EBITDA divided by Net Sales. Adjusted EBITDA Margin is a non-GAAP financial measure that is not in accordance with, or an alternative to, measures prepared in accordance with GAAP. With regard to forward looking measures of Adjusted EBITDA and Adjusted EBITDA Margin, a reconciliation to the applicable GAAP financial measures is not provided because it is not available without unreasonable efforts. For the quarter ended June 30, 2014, included in ‘Other’ were: transaction-related costs and professional fees of $3,946, restructuring costs of $1,097, $195 in costs associated with the China work stoppage and $31 in compensation expense related to a share-based compensation plan in China.
| 25 |
The primary factors that impact our costs of sales include production and sales volumes, product sales mix, foreign currency exchange rates, changes in the price of raw materials, China wage rate increases and the impact of various cost control measures. Although we expect continued pressures on our gross margins given our expectation that costs, including raw material and labor costs, will increase, and we expect the Wema acquisition to have a dilutive effect on consolidated gross margins, we expect an overall improvement in gross margins over the next two years as a result of a number of factors, including product mix, largely due to lower Sensata sales and sales growth of other more profitable product lines, increased leverage of our fixed manufacturing overhead and the benefits from restructurings. We expect our overall gross margins including Wema but excluding costs associated with the restructurings, to range from approximately 39% to 41%, during fiscal 2015, though gross margins for certain quarters could be outside this expected range. As with all manufacturers, our gross margins are sensitive to the overall volume of business (i.e., economies of scale) in that certain costs are fixed. During the quarter ended June 30, 2014, the Company experienced a disruption in China operations due to an employee work stoppage causing a shift of sales from the first quarter to the second quarter, as well as lower productivity and higher unabsorbed overhead costs. Although the Company reached an agreement with China employees and the China operation returned to normal production in July, direct labor variances and unabsorbed overhead costs in the Company’s first and second quarter of fiscal 2015 adversely impact gross margins. The impact of the China work stoppage will primarily impact the Company’s second quarter; however, the impact to the first quarter is estimated at approximately $195.
During the quarter ended June 30, 2014, the RMB appreciated approximately 0.7% and for fiscals 2014 and 2013 the RMB appreciated approximately 2.4% and 0.7%, respectively, relative to the U.S. dollar. There are indications the trend of the RMB appreciating may continue in the near term, though there is no way to predict whether the RMB will appreciate or depreciate, or by how much. We estimate in 2015 for every 10% increase in the value of the RMB relative to the U.S. dollar, our gross profit would decline by approximately $4,034 or less than 1% of gross margin (gross profit divided by projected net sales). Conversely, for every 10% depreciation in the value of the RMB relative to the U.S. dollar, our gross profit would increase by approximately $4,034.
Total selling, general and administrative expenses (“Total SG&A”) as a percentage of net sales were higher in fiscal 2015 as compared to the prior year, mainly reflecting increases in acquisition related expenses and amortization of acquired intangible assets, transaction-related expenses associated with the TE merger, as well as restructuring costs. During the Company’s quarter ending September 30, 2014, the Company will have additional acquisition and TE merger transaction-related expenses and will have additional costs associated with the China work stoppage negotiation. Long-term, the Company plans to continue to control costs and leverage our SG&A expenses by growing sales at a higher rate than SG&A expenses. As a percent of sales, Total SG&A was approximately 35.9% for the quarter ended June 30, 2014, of which $3,946 is tied to acquisition-related expenses. In 2015, we expect an increase in our SG&A expenses as a percentage of net sales mainly due to continued investment in R&D for new programs, increased amortization expense from recent acquisitions, restructuring costs, higher professional fees associated with acquisitions and higher wage and benefit costs, including non-cash equity based compensation and incentive based compensation, as part of the Company’s overall growth.
Included in Total SG&A is amortization expense related to intangible assets acquired in acquisitions. Amortization of acquired intangible assets and deferred financing costs have increased over the past three years mainly due to the acquisitions we have made. Amortization is disproportionately loaded more in the initial years of the acquisition, and therefore amortization expense is higher in the quarters immediately following a transaction, and declines in later years based on how various intangible assets are valued and the differing useful lives for which the respective intangible assets are amortized. For example, backlog is amortized over a period less than 1 year and patents are amortized over a weighted average life of 15 years. Amortization of acquired intangible assets for fiscal 2015 is expected to increase by approximately $6,200, based on preliminary fair value estimates related to the Wema acquisition, as well as assuming no significant changes in foreign currency exchange rates and excluding any additional acquisitions in fiscal 2015.
| 26 |
In addition to margin exposure, the Company also has foreign currency exchange exposures related to balance sheet accounts. When foreign currency exchange rates fluctuate, there is a resulting revaluation of assets and liabilities denominated and accounted for in foreign currencies other than the subsidiary’s functional currency, resulting in foreign currency exchange (“fx”) losses or gains. These fx transaction gains and losses are reflected in our “Foreign Currency Exchange Gain or Loss.” With the acquisition of Wema, the Company has increased foreign currency exposures with the addition of the Norwegian krone (“NOK”). At June 30, 2014, the Company had approximately $89,000 subject to foreign currency exposures with the U.S. dollar and NOK, since the funding of the acquisition was denominated in U.S. dollars and the resulting inter-company funding was denominated in NOK. The NOK has depreciated relative to the U.S. dollar resulting in foreign currency exchanges losses of approximately $2,400. Subsequent to June 30, 2014, the Company implemented a hedging strategy by converting the borrowings from U.S. dollar to NOK to mitigate the foreign currency exposures related to the NOK. The Company does not hedge these U.S. dollar balance sheet exposures with forward contracts or other derivatives because the U.S. dollar is the Company’s reporting and primary functional currency, though the Company does hedge the margin exposure associated with the RMB. The Company uses and may continue to use foreign currency contracts to hedge margin fx exposures. The Company does not hedge all margin fx exposures, but has accepted some exposure to exchange rate movements. The Company does not apply hedge accounting when derivative financial instruments are used to manage these fx exposures. Since the Company does not apply hedge accounting, the changes in the fair value of those derivative financial instruments are reported in earnings in the fx gains or losses caption. We expect the value of the U.S. dollar will continue to fluctuate relative to the RMB, Euro, Swiss franc and British pound. Therefore, both positive and negative movements in currency exchange rates relative to the U.S. dollar will continue to affect the reported amounts of sales, profits, and assets and liabilities in the Company’s consolidated financial statements.
We believe the Company has a relatively low overall effective cash tax rate with the utilization of our NOLs, as well as an overall low effective tax rate due to the low tax rates afforded to the Company in several tax jurisdictions in which we operate, including China, Ireland and Switzerland. Our overall effective tax rate will continue to fluctuate as a result of the shift in earnings among the various taxing jurisdictions in which we operate and their varying tax rates. This is particularly challenging due to the different timing and rates of economic activity around the world. We expect our 2015 overall estimated effective tax rate without discrete tax adjustments to range from approximately 23% to approximately 25%, an increase as compared to the prior year. The increase in the estimated overall effective tax rate mainly reflects a higher proportion of taxable earnings to tax jurisdictions with higher tax rates. The overall estimated effective tax rate is based on expectations and other estimates and involves complex domestic and foreign tax issues, which the Company monitors closely, but are subject to change.
The Company’s subsidiary in China, MEAS China, received approval from the Chinese authorities for High New Technology Enterprise (“HNTE”) status through December 31, 2014. HNTE status decreased the tax rate for MEAS China from 25% to 15%. To qualify for this reduced rate the Company must continue to meet various criteria in regard to its operations related to sales, research and development activity, and intellectual property rights. The Company plans to renew the HNTE status, but if the Company does not continue to receive HNTE status, the Company’s income tax rate in China would increase to 25%.
The Company plans to continue investing in various capital projects in fiscal 2015 to generate higher sales in new and expanded programs, and expects these expenditures to range between 3.5% and 4.5% of sales. This range of expected capital expenditures excludes investments in new greenfield manufacturing facilities in China, U.S., and other such facility investments, such as the purchase of a facility to replace a leased facility or to expand an existing facility. The Company’s investment in the new greenfield manufacturing facility in Chengdu, China is expected to be completed in fiscal 2015. The Chengdu facility is expected to cost approximately $6,000, excluding VAT, of which $5,494 has been incurred to date. The Company’s investment in the new greenfield manufacturing facility in Andover, Minnesota is expected to be completed in fiscal 2015. The Andover facility is expected to range in total cost from approximately $4,000 to $5,000, of which approximately $815 has been incurred to date. During the transition to the new facilities, the Company expects to temporarily increase certain inventory levels.
| 27 |
Results of Operations
Three Months Ended June 30, 2014 Compared To Three Months Ended June 30, 2013
The following table sets forth certain items from operations in our consolidated condensed statements of operations for the three months ended June 30, 2014 and 2013, respectively.
| Three months ended June 30, | ||||||||||||||||
| 2014 | 2013 | Change | Percent Change | |||||||||||||
| Net sales | $ | 114,129 | $ | 100,512 | $ | 13,617 | 13.5 | |||||||||
| Cost of goods sold | 68,401 | 58,618 | 9,783 | 16.7 | ||||||||||||
| Gross profit | 45,728 | 41,894 | 3,834 | 9.2 | ||||||||||||
| Operating expenses: | ||||||||||||||||
| Selling, general, and administrative | 34,236 | 25,647 | 8,589 | 33.5 | ||||||||||||
| Non-cash equity based compensation | 2,683 | 1,093 | 1,590 | 145.5 | ||||||||||||
| Amortization of acquired intangibles and deferred financing costs | 2,929 | 2,332 | 597 | 25.6 | ||||||||||||
| Restructuring costs | 1,097 | 210 | 887 | 422.4 | ||||||||||||
| Total selling, general and administrative expenses | 40,945 | 29,282 | 11,663 | 39.8 | ||||||||||||
| Operating income | 4,783 | 12,612 | (7,829 | ) | (62.1 | ) | ||||||||||
| Interest expense, net | 1,095 | 914 | 181 | 19.8 | ||||||||||||
| Foreign currency exchange loss | 2,619 | 154 | 2,465 | 1,600.6 | ||||||||||||
| Equity income in unconsolidated joint venture | (223 | ) | (121 | ) | (102 | ) | 84.3 | |||||||||
| Other income | 74 | (2 | ) | 76 | (3,800.0 | ) | ||||||||||
| Income before income taxes | 1,218 | 11,667 | (10,449 | ) | (89.6 | ) | ||||||||||
| Income tax expense | 250 | 2,506 | (2,256 | ) | (90.0 | ) | ||||||||||
| Net income | $ | 968 | $ | 9,161 | $ | (8,193 | ) | (89.4 | ) | |||||||
Net sales: For the three months ended June 30, 2014 , net sales totaled a record $114,129, and represented an increase of $13,617 or 13.5% over the corresponding period last year. Organic sales, defined as net sales excluding sales attributed to the Sensotherm and Wema acquisitions of $11,521 for the three months ended June 30, 2014, increased $2,096 or 2.1%. Sales increased in nearly all sensor product lines, except position and piezo, with the largest increases in sales in the humidity, temperature, fluid properties and optical product lines. Sales to Sensata during the three months ended June 30, 2014 did not fluctuate significantly as compared to the corresponding period last year. The overall increase in organic sales is mainly due to new sales from broader product adoptions and new programs. As a result of the China work stoppage, production and shipments were adversely impacted causing a shift of reported net sales of approximately $1,000. It is expected that delayed first quarter customer shipments will be made up during the Company’s second quarter of fiscal 2015.
We expect the sensor market to continue to perform well relative to the overall economy as a result of the increase in sensor content in various products across most end markets in the U.S., Europe and Asia. The sensor business is a growth industry that outpaces overall average global gross domestic product. Sensor content continues to increase at a faster rate than overall product unit growth, as OEMs add “intelligence” in products across most market verticals to promote improved energy efficiency and cleaner technologies, to meet regulatory compliance requirements and to improve user safety and convenience.
Gross margin: Gross margin (gross profit as a percent of net sales) decreased to approximately 40.1% from approximately 41.7% due mainly to the dilutive effect of the Wema acquisition, labor variances and unabsorbed overhead associated with the disruption in production due to the China work stoppage, and product mix. In comparing the three months ended June 30, 2014 to the corresponding period last year, the RMB appreciated approximately 0.7% relative to the U.S. dollar. This translates to an annualized decrease in profits of approximately $282 based on an estimate decrease in our operating income of approximately $4,034 for every 10% appreciation of the RMB against the U.S. dollar.
On a continuing basis, our gross margin may vary due to product mix, sales volume, availability and cost of raw materials, foreign currency exchange rates, and other factors.
| 28 |
Selling, general and administrative: Overall, total selling, general and administrative (“SG&A”) expenses increased $11,663 or 39.8% to $40,945. Organic SG&A costs, which exclude SG&A costs associated with Sensotherm, Wema, transaction-related expenses and restructuring costs, increased $3,102 or 10.8% to $31,939. The increase in Organic SG&A is driven by increases in compensation costs, including the $1,590 increase in non-cash equity based compensation, and mainly reflect higher headcount as part of the Company’s overall growth.
Non-cash equity based compensation: Non-cash equity based compensation increased $1,590 to $2,683. The increase in non-cash equity based compensation is mainly because of the higher estimated fair value of the recent stock awards, which primarily reflects the increase in the Company’s stock price, as well as $214 in share-based compensation costs recognized as part of the retention costs associated with restructurings. Total compensation cost related to share based payments not yet recognized totaled $6,972 at June 30, 2014, which is expected to be recognized over a weighted average period of approximately 1.4 years, excluding the impact of the merger with TE.
Amortization of acquired intangible assets and deferred financing costs: Amortization of acquired intangible assets and deferred financing costs increased $597 to $2,929, as compared to $2,332 the same period last year. The increase in amortization expense is mainly because of the acquisitions of Spectrum, Sensotherm and Wema.
Restructuring costs: As part of the Company’s ongoing efforts to review our business for opportunities to reduce operating expenses and leverage core competencies, the Company continually evaluates various workforce reductions and facility consolidations. The Company started to implement the consolidation of the U.S. operations in Dayton, Ohio, St. Marys, Pennsylvania, Shrewsbury, Massachusetts and Ham Lake, Minnesota to a new greenfield facility in Andover, Minnesota (“U.S. Restructuring”), which was announced to employees in February 2014. These and other such restructurings in Switzerland and Norway (“European Restructurings”), include initiatives designed to centralize certain operating activities and improve capital utilization, and are expected to, among other things, improve operational efficiencies and performance. The U.S. Restructuring costs will include equipment transfers, retention and relocation, severance, termination of benefits and other related activities, in addition to possible contract termination costs, which will be reported in the statement of operations costs. A portion of the retention costs are share-based awards and are reported with non-cash equity based compensation and not included in the reported restructuring costs. U.S. Restructuring costs are expected to be roughly $2,500 to $3,000 and annual savings resulting from U.S. consolidation are expected to be roughly $2,000 to $2,500. We will begin moving production later in calendar year 2014 and expect to complete all transfers and facility closures by the end of calendar year 2015.
At June 30, 2014, the restructuring liabilities were $374 for the U.S. Restructuring and $766 for the European Restructuring. For further details concerning restructurings, please refer to Note 9 to the Consolidated Condensed Financial Statements.
Interest expense, net: Interest expense increased $181 to $1,095 from $914. The increase in interest expense is primarily due to the increase in average outstanding debt, as well as the increase in interest rates. Total average outstanding debt increased to approximately $161,838 for the three months ended June 30, 2014 as compared to $137,052 for the same period last year, mainly reflecting additional borrowing to fund acquisitions. The Company’s weighted average interest rate was approximately 2.6% for the three months ended June 30, 2014, as compared to 2.5% during the same period last year.
Foreign currency exchange gains and losses: Foreign currency exchange gains and losses represent the impact of changes in foreign currency exchange rates with, among other things, the revaluation of balance sheet accounts and foreign currency contracts. When foreign currency exchange rates fluctuate, there is a resulting revaluation of assets and liabilities denominated and accounted for in foreign currencies other than the business’ functional currency. For example, our Irish subsidiary, which uses the Euro as its functional currency, holds cash denominated in foreign currencies, including the U.S. dollar. As the Euro appreciates against the U.S. dollar, the cash balances held in other denominations are devalued when stated in terms of Euro, resulting in a foreign currency exchange loss.
| 29 |
The increase in the foreign currency exchange loss is mainly due to the foreign currency exchange losses recorded with the unfavorable fluctuations of the Norwegian krone (“NOK”) relative to the U.S. dollar, as well as unfavorable fluctuations in the European currencies relative to the U.S. dollar with the Company’s European operations and the fluctuation of the RMB relative to the U.S. dollar with the Company’s operations in China. With the acquisition of Wema, the Company has increased foreign currency exposures with the addition of the NOK. At June 30, 2014, the Company had foreign currency exposures with the U.S. dollar and NOK, since the funding of the acquisition was denominated in U.S. dollars and the resulting inter-company funding was denominated in NOK. The NOK depreciated relative to the U.S. dollar resulting in foreign currency exchanges losses of approximately $2,400 during the period ended June 30, 2014. After June 30, 2014, the Company converted the funding from U.S. dollars to NOK in an effort to mitigate the foreign currency exposures related to the NOK. The Company does not hedge these U.S. dollar exposures with forward contracts or other derivatives because the U.S. dollar is the Company’s reporting and primary functional currency. The Company continues to be impacted by volatility in foreign currency exchange rates, including the impact of the fluctuation of the U.S. dollar relative to the Euro, Swiss franc and British pound, as well as the appreciation of the RMB relative to the U.S. dollar.
Income Taxes: Income tax expense for the three months ended June 30, 2014 decreased $2,256 to $250 from $2,506 for the corresponding period last year. The decrease in income tax expense is primarily due to the generation of lower profits before taxes.
The Company’s overall effective tax rate (income tax expense divided by income before income taxes) for the three months ended June 30, 2014 was approximately 21%, as compared to approximately 22% the same period last year. Income tax expense during interim periods is based on an estimated ETR. The estimated ETR without discrete items for fiscal 2015 is expected to be approximately 23%, as compared to 24% estimated ETR without discrete items for the three months ended June 30, 2013. The overall estimated ETR is based on expectations and other estimates and involves complex domestic and foreign tax issues, which the Company monitors closely and are subject to change.
During the three months ended June 30, 2013, the Company recorded a discrete income tax credit of approximately $156 related to the elimination of the liability previously recorded for an uncertain tax position related to claw-back provision for a tax holiday provided to the Company’s subsidiary in Switzerland.
LIQUIDITY AND CAPITAL RESOURCES
Cash balances totaled $43,996 at June 30, 2014 , a decrease of $5,968 as compared to March 31, 2014, reflecting, among other factors, decrease in cash flows generated from operating activities and higher cash used in investing activities for the Wema acquisition and capital expenditures, which were partially offset by borrowings from the Company’s revolver.
The following compares the primary categories of the consolidated condensed statement of cash flows for the three months ended June 30, 2014 and 2013:
| Three months ended June 30, | ||||||||||||
| 2014 | 2013 | Change | ||||||||||
| Net cash provided by operating activities | $ | 6,748 | $ | 13,510 | $ | (6,762 | ) | |||||
| Net cash used in investing activities | (113,830 | ) | (55,432 | ) | (58,398 | ) | ||||||
| Net cash provided by financing activities | 101,262 | 44,918 | 56,344 | |||||||||
| Effect of exchange rate changes on cash | (148 | ) | 286 | (434 | ) | |||||||
| Net change in cash and cash equivalents | $ | (5,968 | ) | $ | 3,282 | $ | (9,250 | ) | ||||
A key source of the Company’s liquidity is its ability to generate positive operating cash flows. Cash flows provided by operating activities decreased $6,762 to $6,748. The decrease in operating cash flows is mainly due to the $5,470 decrease in net income plus depreciation, amortization and non-cash equity based compensation and the $116 decrease in cash flows from operating working capital (net changes in trade accounts receivable, inventory and accounts payable). In comparing cash flows generated from operating working capital for the three months ended June 30, 2014 to the corresponding period last year, the largest drivers of the decrease in cash flows from operating working capital were the unfavorable trends with trade payables and inventories, partially offset by the favorable fluctuations in trade receivables. The current period net change in accounts receivable was a decrease or source of cash flows of $2,651, as compared to an increase or a use of cash flows of $4,324 last year. The favorable change in the fluctuation in trade receivables during the current period as compared to last year mainly reflects the overall increase in sales and related collections. Operating cash flows from accounts payable fluctuated unfavorably by $5,718, reflecting, among other factors, the timing of payments. The net increase in inventory or use of cash flow for the current and prior periods was $1,874 and $686, respectively. The higher inventory balances are to support the overall growth in sales. Cash outflows for income taxes decreased by $2,553 due to lower profits before taxes.
| 30 |
Net cash used in investing activities for the three months ended June 30, 2014 was $113,830 as compared to $55,432 the corresponding period last year. The increase in cash used in investing activities mainly reflects the higher purchase price and cash outlays for the acquisition of Wema as compared to the purchase price paid for Spectrum and Sensotherm. Capital expenditures primarily consist of the purchase of equipment for the manufacturing of new products and programs, as well as capital additions related to the new manufacturing facilities in China and Andover, Minnesota.
Net cash provided by financing activities for the three months ended June 30, 2014 totaled $101,262, as compared to $44,918 in net cash provided in financing activities the same period last year. The Company’s credit facilities are mainly utilized to fund acquisitions. Additionally, the Company received proceeds from the exercise of stock options and the related excess tax benefit from the exercise of stock options. Proceeds from the exercise of stock options totaled $2,201 and $3,000 for the three months ended June 30, 2014 and 2013, respectively. The increase in proceeds from the exercise of stock options mainly reflects the higher amount of options exercised largely due to the increase in the Company’s stock price.
The effect of exchange rate changes on cash is the translation decrease or increase in cash due to the fluctuation of foreign currency exchange rates. The increase in cash for the current year impact of exchange rate changes is primarily due to the fluctuation of the U.S. dollar relative to the Europe.
Long-term debt: The Company entered into a Credit Agreement (the "Senior Secured Credit Facility") dated June 1, 2010, among JPMorgan Chase Bank, N.A., as administrative agent and collateral agent (in such capacity, the "Senior Secured Facility Agents"), Bank America, N.A., as syndication agent, HSBC Bank USA, N.A., as document agent, and certain other parties thereto (the "Credit Agreement") to refinance the Amended and Restated Credit Agreement effective as of April 1, 2006 among the Company, General Electric Capital Corporation (“GE”), as agent and a lender, and certain other parties thereto and to provide for the working capital needs of the Company including to effect permitted acquisitions. Refer to Note 8 in the Consolidated Condensed Financial Statements for further details regarding long-term debt, including information concerning credit facilities in China and Europe.
LIQUIDITY: Management assesses the Company’s liquidity in terms of available cash, our ability to generate cash and our ability to borrow to fund operating, investing and financing activities. The Company continues to generate cash from operating activities, and the Company remains in a positive financial position with availability under credit facilities. The Company will continue to have cash requirements to support working capital needs, capital expenditures, earn-outs related to acquisitions, and to pay interest and service debt. One of the Company’s known cash requirements is for the payment of $10,000 on June 2, 2015 with the Senior Secured Notes with Prudential. Another of the Company’s known cash requirements is for capital expenditure commitments related to the construction of the new facility Andover, Minnesota. The Company is developing plans to build a new facility in Minnesota with an estimated cost of approximately $4,000 to $5,000. As part of the transition to the new facility, the Company expects to temporarily increase certain inventory levels. Additionally, as part of the Company’s ongoing efforts to review our business for opportunities to reduce operating expenses and leverage core competencies, the Company has substantially completed the consolidation all of the Company’s manufacturing operations in Scotland to other MEAS sites and the Company has started to implement the restructuring to consolidate its U.S. operations in Dayton, Ohio, St. Marys, Pennsylvania, Shrewsbury, Massachusetts and Ham Lake, Minnesota to a new greenfield facility in Andover, Minnesota. Refer to Note 13 to the Consolidated Financial Statements of the Company included in this Annual Report on Form 10-K for further details concerning restructurings. The Company has an active share buy-back plan of which approximately $248 of shares may still be purchased periodically under the publically announced plan. In connection with the Merger Agreement described herein, we will pay Barclays a fee of $1,500 during the next quarter for their delivery of their fairness opinion relating to the pending transaction with TE during the first quarter of fiscal 2015. We believe the Company’s financial position, generation of cash and the existing credit facility, in addition to the potential to refinance or obtain additional financing will be sufficient to meet funding of day-to-day and material short and long-term commitments for the foreseeable future.
| 31 |
At June 30, 2014, we had approximately $43,996 of available cash and approximately $56,000 of borrowing capacity, after considering the limitations set on the Company’s total leverage under the revolving credit facility. This cash balance includes cash of $11,535 in China, which is subject to certain restrictions on the transfer to another country because of currency control regulations. Additionally, the Company had approximately $23,134 of cash in Europe at June 30, 2014. The Company’s cash balances are generated and held in numerous locations throughout the world, including substantial amounts held outside the United States. The Company utilizes a variety of tax planning and financing strategies in an effort to ensure that its worldwide cash is available in the locations in which it is needed. Wherever possible, cash management is centralized and intra-company financing is used to provide working capital to the Company’s operations. Cash balances of approximately $36,937 are held outside the United States and could be repatriated to the United States, but, under current law, would be subject to United States federal income taxes, less applicable foreign tax credits. Repatriation of some foreign balances is restricted or prohibited by local laws. Where local restrictions prevent an efficient intra-company transfer of funds, the Company’s intent is that cash balances would remain in the foreign country and it would meet United States liquidity needs through ongoing cash flows, external borrowings, or both.
ACCUMULATED OTHER COMPREHENSIVE INCOME: Accumulated other comprehensive income primarily consists of foreign currency translation adjustments, which relate to the Company’s European and Asian operations and the effects of changes in the exchange rates of the U.S. dollar relative to the Euro, Chinese RMB, Hong Kong dollar, Japanese Yen, Swiss franc and British pound. Foreign currency translation adjustments are generally not adjusted for income taxes as they relate to indefinite investments in non-U.S. subsidiaries. Accumulated other comprehensive income also includes unrecognized pension costs.
DIVIDENDS: We have not declared cash dividends on our common equity. Additionally, the payment of dividends is restricted under our Senior Secured Credit Facility. We intend to retain earnings to support our growth strategy and we do not anticipate paying cash dividends in the foreseeable future.
At present, there are no material restrictions on the ability of our Hong Kong and European subsidiaries to transfer funds to us in the form of cash dividends, loans, advances, or purchases of materials, products, or services. Chinese laws and regulations, including currency exchange controls, however, restrict distribution and repatriation of dividends by our China subsidiary.
SEASONALITY: As a whole, there is no material seasonality in our sales. However, general economic conditions have an impact on our business and financial results, and certain end-use markets experience certain seasonality. For example, European sales are often lower in summer months and OEM sales are often stronger immediately preceding and following the introduction of new products.
INFLATION: We compete on the basis of product design, features, and value. Accordingly, our prices generally have kept pace with inflation, notwithstanding that inflation in the countries where our subsidiaries are located has been consistently higher than inflation in the United States. We have recently experienced increases in material and labor costs, including the direct impact of changes in foreign currency exchange rates, and as a result, we have had pressure on our margins.
OFF BALANCE SHEET ARRANGEMENTS: We do not have any financial partnerships with unconsolidated entities, such as entities often referred to as structured finance, special purpose entities or variable interest entities which are often established for the purpose of facilitating off-balance sheet arrangements or other contractually narrow or limited purposes. The Company does have an unconsolidated joint venture in Japan, N-T, which is not considered to be a special purpose entity or variable interest entity for the purposes of facilitating off-balance sheet arrangements or such limited purposes. Accordingly, we are not exposed to any financing, liquidity, market or credit risk that could arise if we had such relationships.
| 32 |
The Company has acquired and divested of certain assets, including the acquisition of businesses. In connection with these acquisitions, the Company often provides and receives representations, warranties and/or indemnities to cover various risks and unknown liabilities, such as claims for damages arising out of the use of products or relating to intellectual property matters, commercial disputes, environmental matters or tax matters. The Company cannot estimate the potential liability from such representations, warranties and indemnities because they relate to unknown conditions. However, the Company does not believe that the liabilities relating to these representations, warranties and indemnities will have a material adverse effect on the Company’s financial position, results of operations or liquidity.
AGGREGATE CONTRACTUAL OBLIGATIONS: As of June 30, 2014, the Company’s contractual obligations, including payments due by period, are as follows:
| Payment due by period | ||||||||||||||||||||
| Total | 1 year | 2-3 years | 4-5 years | > 5 years | ||||||||||||||||
| Contractual Obligations: | ||||||||||||||||||||
| Long-term debt obligations | $ | 224,000 | $ | 10,000 | $ | 214,000 | $ | - | $ | - | ||||||||||
| Interest obligation on long-term debt | 17,372 | 5,968 | 11,404 | - | - | |||||||||||||||
| Capital lease obligations | 540 | 297 | 243 | - | - | |||||||||||||||
| Operating lease obligations | 24,283 | 6,325 | 7,940 | 4,633 | 5,385 | |||||||||||||||
| Purchase obligations | 17,317 | 15,545 | 981 | 791 | - | |||||||||||||||
| Health care self-insurance liability | 429 | 429 | - | - | - | |||||||||||||||
| Other long-term obligations* | 8,984 | 4,982 | 1,972 | 630 | 1,400 | |||||||||||||||
| Total | $ | 292,925 | $ | 43,546 | $ | 236,540 | $ | 6,054 | $ | 6,785 | ||||||||||
* Other long-term obligations on the Company’s balance sheet under GAAP primarily consist of obligations under warranty polices, foreign currency contracts, contractual obligations related to the construction of new facilities, pension and tax liabilities. The timing of cash flows associated with these obligations is based upon management’s estimate over the terms of these arrangements and are largely based on historical experience.
The above contractual obligation table excludes certain contractual obligations, such as possible severance payments to certain executives, since these contractual commitments are not accrued as liabilities at June 30, 2014 or are otherwise indeterminable. These contractual obligations are accrued as liabilities when the respective contingencies are determinable.
ITEM 3. QUANTITATIVE AND QUALITATIVE DISCLOSURES ABOUT MARKET RISK
Since March 31, 2014, the Company experienced the following significant change to our market risk:
With the acquisition of Wema, the Company has increased foreign currency exposures with the addition of the NOK. At June 30, 2014, the Company had approximately $89,000 subject to foreign currency exposures with the U.S. dollar and NOK, since the funding of the acquisition was denominated in U.S. dollars and the resulting inter-company funding was denominated in NOK. The NOK as depreciated relative to the U.S. dollar resulting in foreign currency exchanges losses of approximately $2,400. After June 30, 2014, the Company converted the borrowings from U.S dollars to NOK in an effort to mitigate the foreign currency exposures related to the NOK.
| 33 |
ITEM 4. CONTROLS AND PROCEDURES
(Amounts in thousands)
(a) Evaluation of Disclosure Controls and Procedures
The Company’s Chief Executive Officer and Chief Financial Officer with the participation of management evaluated the effectiveness of our disclosure controls and procedures as of June 30, 2013. The term “disclosure controls and procedures,” as defined in Rules 13a-15(e) and 15d-15(e) under the Securities Exchange Act of 1934, as amended (the “Exchange Act”), means controls and other procedures of a company that are designed to ensure that information required to be disclosed by the company in the reports that it files or submits under the Exchange Act is recorded, processed, summarized and reported, within the time periods specified in the SEC’s rules and forms. Disclosure controls and procedures include, without limitation, controls and procedures designed to ensure that information required to be disclosed by a company in the reports that it files or submits under the Exchange Act is accumulated and communicated to the company’s management, including its principal executive and principal financial officers, as appropriate to allow timely decisions regarding required disclosure. Management recognizes that any controls and procedures, no matter how well designed and operated, can provide only reasonable assurance of achieving their objectives and management necessarily applies its judgment in evaluating the cost-benefit relationship of possible controls and procedures. Based on the evaluation of our disclosure controls and procedures as of June 30, 2014, our Chief Executive Officer and Chief Financial Officer concluded that, as of such date, our disclosure controls and procedures were effective.
(b) Changes in Internal Control Over Financial Reporting
During the fiscal quarter ended June 30, 2014, management did not identify any changes in the Company’s internal control over financial reporting that have materially affected, or are reasonably likely to materially affect, the Company’s internal control over financial reporting.
Management’s evaluation of the Company’s internal controls and procedures as of June 30, 2014 excluded the evaluation of internal controls for the Company’s recent acquisition of Wema. Wema, which was acquired on May 30, 2014, represented approximately $157,788 in total assets at June 30, 2014 and $10,458 of net sales for the three months ended June 30, 2014.
Pending Matters: On July 1, 2014, a class action lawsuit was filed in the Superior Court of New Jersey on behalf of shareholders of the Company against the Company, certain present and former directors of the Company and TE Connectivity Ltd. alleging violations of fiduciary duties in connection with TE’s proposed acquisition of the Company. It is not possible at this time to predict the precise timing or probable outcome of any lawsuits related to the proposed acquisition of the Company by TE and the Company cannot make a reasonable estimate of the possible loss or range of losses at this time.
Other than as set forth above, from time to time, the Company is subject to legal proceedings and claims in the ordinary course of business and the Company currently is not aware of any legal proceedings or claims that the Company believes will have, individually or in the aggregate, a material adverse effect on the Company’s business, financial condition, or operating results.
While we attempt to identify, manage and mitigate risks and uncertainties associated with our business to the extent practical under the circumstances, some level of risk and uncertainty will always be present. Item 1A of our Annual Report on Form 10-K for the year ended March 31, 2014 describes some of the risks and uncertainties associated with our business. These risks and uncertainties have the potential to materially affect our results of operations and our financial condition. We do not believe that there have been any material changes to the risk factors previously disclosed in our Annual report on Form 10-K for the year ended March 31, 2014, except as follows:
| 34 |
On June 18, 2014, the Company and TE announced that the companies have signed a definitive merger agreement (the “Merger Agreement”) providing for the acquisition of the Company by TE. The Merger Agreement provides for the merger of Wolverine-Mars Acquisition, Inc., a Delaware corporation and an indirect wholly owned subsidiary of TE (“Merger Sub”)with and into the Company (the “Merger”), with the Company continuing as the surviving corporation and an indirect wholly-owned subsidiary of TE. Pursuant to the Merger, each share of common stock, no par value per share, of the Company outstanding immediately prior to the effective time of the Merger (other than shares owned by TE or Merger Sub, shares held by any subsidiary of the Company or TE (other than Merger Sub), and shares held by the Company as treasury stock) shall be converted into the right to receive $86.00 in cash, without interest. We currently expect the Merger to be completed in the fall of 2014. However, the Merger is subject to various closing conditions, including approval of the Merger by the Company’s shareholders at a special meeting to be held on August 26, 2014, each of which will need to be satisfied or waived before the Merger can be completed. It is possible that the failure to timely meet those closing conditions or other factors outside of our control could require us to complete the Merger at a later time or prevent us from completing the Merger altogether
We cannot predict whether the closing conditions for the Merger set forth in the Merger Agreement will be satisfied, and the transactions contemplated by the Merger Agreement may be delayed or even abandoned before completion if certain events occur. The Merger Agreement may be terminated by us, on the one hand, or TE, on the other hand, under certain circumstances, and termination of the Merger Agreement may require us to pay a termination fee of $22,900 to TE. If the conditions to the transactions set forth in the Merger Agreement are not satisfied or waived pursuant to the Merger Agreement, or if the transactions are not completed for any other reason, (i) the market price of our common stock could significantly decline; (ii) we will remain liable for the significant expenses that we have incurred related to the transaction, including legal and financial advisor fees, and may be required to pay the $22,900 termination fee; (iii) we may experience substantial disruption in our sales, research and development, and operating activities, and the loss of key personnel, customers, suppliers, and other third-party relationships, any of which could materially and adversely affect us and our business, operating results, and financial condition; and (iv) we may have difficulty attracting and retaining key personnel.
Until the closing of the Merger, it is possible that the focus of our management team and employees may be diverted, and that there may be a negative reaction to the tender offer and the Merger on the part of our customers, employees, suppliers, or other third-party relationships. The Merger Agreement also contains certain limitations regarding our business operations prior to completion of the Merger.
See Exhibit Index.
| 35 |
Pursuant to the requirements of the Securities Exchange Act of 1934, the registrant has duly caused this report to be signed on its behalf by the undersigned thereunto duly authorized.
| Measurement Specialties, Inc. | ||
| (Registrant) | ||
| Date: August 6, 2014 | By: | /s/ Frank D. Guidone |
| Frank D. Guidone | ||
| President, Chief Executive Officer | ||
| (Principal Executive Officer) | ||
| Date: August 6, 2014 | By: | /s/ Mark Thomson |
| Mark Thomson | ||
| Chief Financial Officer | ||
| (Principal Financial Officer) | ||
| 36 |
EXHIBIT INDEX
EXHIBIT NUMBER |
DESCRIPTION | ||
| 2.1 | Agreement and Plan of Merger, dated as of June 18, 2014, among TE Connectivity Ltd., Wolverine-Mars Acquisition, Inc. and Measurement Specialties, Inc. (incorporated by reference to Exhibit 2.1 to the registrant’s Current Report on Form 8-K dated June 19, 2014). | ||
| 31.1 | Certification of Frank Guidone required by Rule 13a-14(a) or Rule 15d-14(a) | ||
| 31.2 | Certification of Mark Thomson required by Rule 13a-14(a) or Rule 15d-14(a) | ||
| 32.1 | Certification of Chief Executive Officer and Chief Financial Officer pursuant to 18 U.S.C. Section 1350, as adopted pursuant to Section 906 of the Sarbanes-Oxley Act of 2002. | ||
| 101.INS | XBRL Instance Document (1) | ||
| 101.SCH | XBRL Taxonomy Extension Schema Document (1) | ||
| 101.CAL | XBRL Taxonomy Extension Calculation Linkbase Document (1) | ||
| 101.DEF | XBRL Taxonomy Extension Definition Linkbase Document (1) | ||
| 101.LAB | XBRL Taxonomy Extension Label Linkbase Document (1) | ||
| 101.PRE | XBRL Taxonomy Extension Presentation Linkbase Document (1) | ||
| (1) | Attached as Exhibit 101 to this report are the following documents formatted in XBRL (Extensible Business Reporting Language): (i) Consolidated Condensed Balance Sheets as of June 30, 2014 and March 31, 2014, (ii) Consolidated Condensed Statements of Operations for the three months ended June 30, 2014 and 2013, (iii) Consolidated Condensed Statements of Comprehensive Income for the three months ended June 30, 2014 and 2013, (iv) Consolidated Condensed Statement of Stockholders’ Equity for the three months ended June 30, 2014 and 2013, (v) Consolidated Condensed Statements of Cash Flows for the three months ended June 30, 2014 and 2013, and (vi) Notes to Consolidated Condensed Financial Statements. In accordance with Rule 406T of Regulation S-T, the XBRL related information in Exhibit 101 to this Quarterly Report on Form 10-Q shall not be deemed to be “filed” for purposes of Section 18 of the Securities Exchange Act of 1934 (the “Exchange Act”), or otherwise subject to the liability of that section, and shall not be part of any registration statement or other document filed under the Securities Act of 1933 or the Exchange Act, except as shall be expressly set forth by specific reference in such filing. |
| 37 |