Attached files
| file | filename |
|---|---|
| 8-K - 8-K - MONMOUTH REAL ESTATE INVESTMENT CORP | mreic3rdq2014.htm |
| 1 |
 |
||||||||||||
| Table of Contents | ||||||||||||
| Page | ||||||||||||
| Consolidated Balance Sheets | 3 | |||||||||||
| Consolidated Statements of Income | 4 | |||||||||||
| FFO, Core FFO, AFFO, NOI and EBITDA Reconciliations | 5 | |||||||||||
| Financial Highlights | 6 | |||||||||||
| Net Operating Income (NOI), Same Store NOI and Same Store Cash NOI Reconciliation | 7 | |||||||||||
| Consolidated Statements of Cash Flows | 8 | |||||||||||
| Capital Structure and Leverage Ratios | 9 | |||||||||||
| Debt Maturity | 11 | |||||||||||
| Property Table by Tenant | 12 | |||||||||||
| Property Table by State | 13 | |||||||||||
| Lease Expirations | 14 | |||||||||||
| Recent Acquisitions | 15 | |||||||||||
| Property Table | 16 | |||||||||||
| Definitions | 18 | |||||||||||
| Press Release Dated August 6, 2014 | 19 | |||||||||||
| The statement of operations and supplemental statement of operations provided in this supplemental information package | ||||||||||||
| present funds from operations, core funds from operations, adjusted funds from operations, net operating income (NOI) , same store | ||||||||||||
| NOI, same store cash NOI and EBITDA which are REIT industry financial measures that are not calculated in accordance with | ||||||||||||
| accounting principles generally accepted in the United States. Please see page 18 for a definition of these supplemental | ||||||||||||
| performance measures. Please see the supplemental statement of operations reconciliation for a reconciliation of certain captions | ||||||||||||
| in the supplemental statement of operations reported in this supplemental information package to the statement of operations | ||||||||||||
| as reported in the Company's filings with the SEC on Form 10-Q. | ||||||||||||
| 2 |
Third Quarter FY 2014 Supplemental of Monmouth Real Estate Investment Corp. Page 3 of 21
| 3 |
Third Quarter FY 2014 Supplemental of Monmouth Real Estate Investment Corp. Page 4 of 21
| 4 |
Third Quarter FY 2014 Supplemental of Monmouth Real Estate Investment Corp. Page 5 of 21
| 5 |
Third Quarter FY 2014 Supplemental of Monmouth Real Estate Investment Corp. Page 6 of 21
| 6 |
Third Quarter FY 2014 Supplemental of Monmouth Real Estate Investment Corp. Page 7 of 21
| 7 |
Third Quarter FY 2014 Supplemental of Monmouth Real Estate Investment Corp. Page 8 of 21
| 8 |
Third Quarter FY 2014 Supplemental of Monmouth Real Estate Investment Corp. Page 9 of 21
| 9 |
| Capital Structure and Leverage Ratios (continued) | |||||||||||
| (unaudited) | |||||||||||
| Fiscal Year | |||||||||||
| Three Months Ended | Nine Months Ended | Ended | |||||||||
| 6/30/2014 | 6/30/2013 | 6/30/2014 | 6/30/2013 | 9/30/2013 | |||||||
| Net Income | $5,593,548 | $4,180,546 | $14,640,988 | $17,531,034 | $21,395,246 | ||||||
| plus: Depreciation & Amortization (includes Discontinued Operations) | 4,640,068 | 3,839,206 | 13,660,791 | 11,545,107 | 15,542,937 | ||||||
| plus: Interest Expense | 4,170,104 | 3,764,949 | 12,230,617 | 11,483,255 | 14,956,954 | ||||||
| plus: Acquisition Costs | -0- | 74,137 | 462,864 | 459,999 | 514,699 | ||||||
| less: Gain on Sale of Securities Transactions, net | (907,171) | (1,062,614) | (1,483,245) | (6,976,086) | (7,133,252) | ||||||
| less: Gain on Sale of Investment Property | -0- | -0- | -0- | (345,794) | (345,794) | ||||||
| EBITDA | $13,496,549 | $10,796,224 | $39,512,015 | $33,697,515 | $44,930,790 | ||||||
| Interest Expense | $4,170,104 | $3,764,949 | $12,230,617 | $11,483,255 | $14,956,954 | ||||||
| Preferred Dividends Paid | 2,151,758 | 2,151,758 | 6,455,274 | 6,455,274 | 8,607,032 | ||||||
| Total Fixed Charges | $6,321,862 | $5,916,707 | $18,685,891 | $17,938,529 | $23,563,986 | ||||||
| Interest Coverage | 3.2 x | 2.9 x | 3.2 x | 2.9 x | 3.0 x | ||||||
| Fixed Charge Coverage | 2.1 x | 1.8 x | 2.1 x | 1.9 x | 1.9 x | ||||||
| Net Debt | $262,351,167 | $251,685,611 | $262,351,167 | $251,685,611 | $259,888,870 | ||||||
| Annualized EBITDA | 53,986,196 | 43,184,896 | 52,682,687 | 44,930,020 | 44,930,790 | ||||||
| Net Debt / EBITDA | 4.9 x | 5.8 x | 5.0 x | 5.6 x | 5.8 x | ||||||
| Net Debt + Preferred / EBITDA | 6.9 x | 8.4 x | 7.1 x | 8.1 x | 8.3 x | ||||||
Third Quarter FY 2014 Supplemental of Monmouth Real Estate Investment Corp. Page 10 of 21
| 10 |
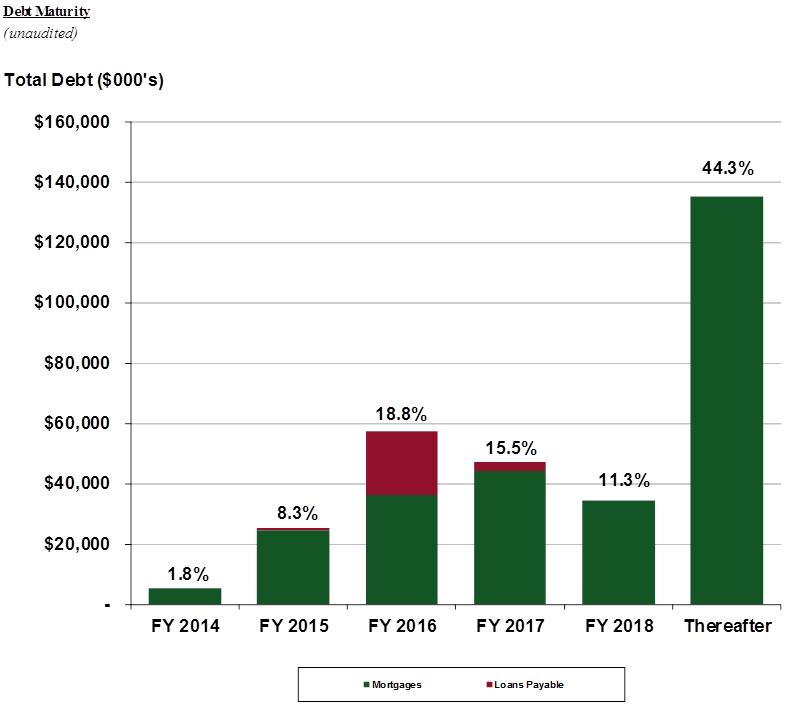
| Loans | % of | ||||||
| Fiscal Year Ended | Mortgages | Payable (1) | Total (1) | Total | |||
| 2014 | $5,386,138 | $-0- | $5,386,138 | 1.8% | |||
| 2015 | 24,412,522 | 1,012,039 | 25,424,561 | 8.3% | |||
| 2016 | 36,132,462 | 21,270,163 | (1) | 57,402,625 | 18.8% | ||
| 2017 | 44,218,226 | 2,917,798 | 47,136,024 | 15.5% | |||
| 2018 | 34,371,670 | -0- | 34,371,670 | 11.3% | |||
| Thereafter | 135,345,346 | -0- | 135,345,346 | 44.3% | |||
| Total as of 6/30/2014 | $279,866,364 | $25,200,000 | $305,066,364 | 100.0% | |||
Notes:
| (1) Includes a $20 million Line of Credit due June 2016, which has a one year extension option. |
Third Quarter FY 2014 Supplemental of Monmouth Real Estate Investment Corp. Page 11 of 21
| 11 |
(A) Does not include $98,559 of vacant land and corporate office leasehold improvements not associated with a specific tenant.
(B) NF&M International and Datatel Resources are located at one property and therefore are counted as one property in the Property Count total.
(C) Includes rental revenue from properties during Fiscal 2014 prior to becoming vacant. Also includes one property consisting of 160,000 square feet in Monroe, NC that was leased to Charlotte Pipe & Foundry
Company for 3 years effective 8/1/14 which increases occupancy to 95.8%.
(D) Includes a 55,037 square foot building expansion in Cocoa, FL that was completed 7/10/14.
Third Quarter FY 2014 Supplemental of Monmouth Real Estate Investment Corp. Page 12 of 21
| 12 |
| (A) | Does not include $98,559 of vacant land and corporate office leasehold improvements not associated with a specific tenant. |
| (B) | Includes a 55,037 square foot building expansion in Cocoa, FL that was completed 7/10/14. |
Third Quarter FY 2014 Supplemental of Monmouth Real Estate Investment Corp. Page 13 of 21
| 13 |
(A) Does not include $98,559 of vacant land and corporate office leasehold improvements not associated with a specific tenant.
(B) Included in 2016 is Datatel Resources and included in 2018 is NF&M International which both occupy one property and therefore are counted as one property in the property count total.
(C) Various tenants at retail shopping center in Somerset, NJ.
(D) Includes a 55,037 square foot building expansion in Cocoa, FL that was completed 7/10/14.
(E) Includes one property consisting of 160,000 square feet in Monroe, NC that was leased to Charlotte Pipe & Foundry Company for 3 years effective 8/1/14.
Third Quarter FY 2014 Supplemental of Monmouth Real Estate Investment Corp. Page 14 of 21
| 14 |
Third Quarter FY 2014 Supplemental of Monmouth Real Estate Investment Corp. Page 15 of 21
| 15 |
Third Quarter FY 2014 Supplemental of Monmouth Real Estate Investment Corp. Page 16 of 21
| 16 |
| Property Table | Rent | ||||||||||||||||
| (unaudited) | Per | ||||||||||||||||
| Fiscal Year | Square | Annual | Sq. Ft. | Lease Exp. | Undepreciated | Mortgage | |||||||||||
| No | Tenant | City (MSA) | State | Acquisition | Occup. | Footage | Rent | Occup. | Term in Years | Cost | Balance | ||||||
| 50 | FedEx Corporation | Bedford Heights (Cleveland) | OH | 2007 | 100.0% | 82,269 | 408,000 | 4.96 | 4.2 | 6,767,782 | 3,069,620 | ||||||
| 51 | FedEx Ground Package System, Inc. | Richfield (Cleveland) | OH | 2006 | 100.0% | 79,485 | 1,121,000 | 14.10 | 10.3 | 15,627,187 | 3,810,666 | ||||||
| 52 | RGH Enterprises, Inc. | Halfmoon (Albany) | NY | 2012 | 100.0% | 75,000 | 584,000 | 7.79 | 7.4 | 5,525,600 | 4,004,613 | ||||||
| 53 | FedEx Ground Package System, Inc. | Huntsville | AL | 2005 | 100.0% | 73,712 | 412,000 | 5.59 | 8.2 | 4,751,741 | 1,220,841 | ||||||
| 54 | FedEx Corporation | Schaumburg (Chicago) | IL | 1997 | 100.0% | 73,500 | 515,000 | 7.01 | 2.8 | 4,967,639 | -0- | ||||||
| 55 | FedEx Corporation | Romulus (Detroit) | MI | 1998 | 100.0% | 71,933 | 370,000 | 5.14 | 6.9 | 4,483,613 | 2,502,178 | ||||||
| 56 | FedEx Ground Package System, Inc. | Denver | CO | 2005 | 100.0% | 69,865 | 564,000 | 8.07 | 4.1 | 6,354,051 | 1,698,361 | ||||||
| 57 | Tampa Bay Grand Prix | Tampa | FL | 2005 | 100.0% | 68,385 | 281,000 | 4.11 | 6.3 | 5,651,066 | 2,289,829 | ||||||
| 58 | FedEx Ground Package System, Inc. | Colorado Springs | CO | 2006 | 100.0% | 68,370 | 644,000 | 9.42 | 4.3 | 7,195,115 | 1,919,471 | ||||||
| 59 | Sherwin-Williams Company | Rockford | IL | 2011 | 100.0% | 66,387 | 473,000 | 7.12 | 9.5 | 5,540,000 | -0- | ||||||
| 60 | Kellogg Sales Company | Kansas City | MO | 2007 | 100.0% | 65,067 | 350,000 | 5.38 | 1.1 | 4,748,374 | 2,545,612 | ||||||
| 61 | Various Tenants at Retail Shopping Center | Somerset | NJ | 1970 | 84.0% | 64,138 | 202,000 | 3.75 | -0- | 1,929,667 | -0- | ||||||
| 62 | FedEx Corporation | Chattanooga | TN | 2007 | 100.0% | 60,637 | 311,000 | 5.13 | 3.3 | 4,971,161 | 2,035,874 | ||||||
| 63 | SoFive Inc. | Carlstadt (New York, NY) | NJ | 2001 | 100.0% | 60,400 | 126,000 | 8.34 | 10.6 | 4,838,592 | 2,218,318 | ||||||
| 64 | FedEx Ground Package System, Inc. | Stewartsville (Rochester) | MN | 2013 | 100.0% | 60,398 | 372,000 | 6.16 | 8.9 | 5,220,000 | 3,126,278 | ||||||
| 65 | United Technologies Corporation | Richmond | VA | 2004 | 100.0% | 60,000 | 308,000 | 5.13 | 1.9 | 4,741,005 | -0- | ||||||
| 66 | Vacant | White Bear Lake (Minneapolis/St. Paul) | MN | 2001 | -0- | 59,425 | -0- | na | -0- | 5,157,126 | -0- | ||||||
| 67 | FedEx Ground Package System, Inc. | Augusta | GA | 2005 | 100.0% | 59,358 | 477,000 | 8.04 | 4.0 | 5,328,873 | 1,209,599 | ||||||
| 68 | Kellogg Sales Company | Newington (Hartford) | CT | 2001 | 100.0% | 54,812 | 332,000 | 6.06 | 2.7 | 3,463,824 | -0- | ||||||
| 69 | Siemens Real Estate | Lebanon (Cincinnati) | OH | 2012 | 100.0% | 51,130 | 462,000 | 9.04 | 4.8 | 4,416,000 | 2,817,185 | ||||||
| 70 | Kellogg Sales Company | Orangeburg (New York) | NY | 1993 | 100.0% | 50,400 | 353,000 | 7.00 | 0.7 | 3,754,866 | -0- | ||||||
| 71 | FedEx Corporation | Charlottesville | VA | 1999 | 100.0% | 48,064 | 329,000 | 6.85 | 3.2 | 4,344,037 | -0- | ||||||
| 72 | Dr Pepper Snapple | Tulsa | OK | 2014 | 100.0% | 46,240 | 253,000 | 5.47 | 9.7 | 3,700,000 | 2,188,278 | ||||||
| 73 | FedEx Ground Package System, Inc. | Corpus Christi | TX | 2012 | 100.0% | 46,253 | 455,000 | 9.84 | 7.2 | 4,764,500 | 2,700,498 | ||||||
| 74 | Coca Cola Enterprises, Inc. | Topeka | KS | 2009 | 100.0% | 40,000 | 332,000 | 8.30 | 7.3 | 3,679,843 | 1,855,835 | ||||||
| 75 | Keystone Automotive | Urbandale (Des Moines) | IA | 1994 | 100.0% | 36,270 | 137,000 | 3.78 | 2.8 | 2,161,895 | -0- | ||||||
| 76 | FedEx Corporation | Richland (Jackson) | MS | 1994 | 100.0% | 36,000 | 121,000 | 3.36 | 9.8 | 1,900,691 | -0- | ||||||
| 77 | FedEx Corporation | Punta Gorda | FL | 2007 | 100.0% | 34,624 | 304,000 | 8.78 | 3.0 | 4,104,915 | 2,251,703 | ||||||
| 78 | FedEx Corporation | Lakeland | FL | 2006 | 100.0% | 32,105 | 155,000 | 4.83 | 3.4 | 1,959,568 | -0- | ||||||
| 79 | FedEx Corporation | Augusta | GA | 2006 | 100.0% | 30,184 | 121,000 | 4.01 | 8.4 | 1,926,932 | -0- | ||||||
| 80 | Graybar Electric Company | Ridgeland (Jackson) | MS | 1993 | 100.0% | 26,340 | 109,000 | 4.14 | 5.1 | 1,850,794 | -0- | ||||||
| 81 | Sherwin-Williams Company | Burr Ridge (Chicago) | IL | 1997 | 100.0% | 12,500 | 160,000 | 12.80 | 7.3 | 1,673,047 | -0- | ||||||
| Rent received from former tenants during fiscal 2014 whose space was re-leased | -0- | -0- | 593,000 | -0- | -0- | -0- | -0- | ||||||||||
| Total as of 6/30/2014 | 94.3% | 10,764,456 | $56,667,000 | $5.56 | 6.8 | (A) $713,819,339 | $279,866,364 | ||||||||||
(A) Does not include $98,559 of vacant land and corporate office leasehold improvements not associated with a specific tenant.
(B) Both tenants occupy one property.
(C) Includes a 55,037 square foot building expansion in Cocoa, FL that was completed 7/10/14.
(D) This property was leased to Charlotte Pipe & Foundry Company for 3 years effective 8/1/14 which increases occupancy to 95.8%.
Third Quarter FY 2014 Supplemental of Monmouth Real Estate Investment Corp. Page 17 of 21
| 17 |
 |
||||||||||
| Definitions | ||||||||||
|
Investors and analysts following the real estate industry utilize funds from operations ("FFO"), core funds from operations ("Core FFO"), net operating income ("NOI"), same store NOI, same store cash NOI, earnings before interest, taxes, depreciation and amortization ("EBITDA") and adjusted funds from operations ("AFFO"), variously defined, as supplemental performance measures. While the Company believes net income available to common stockholders, as defined by accounting principles generally accepted in the United States of America (US GAAP), is the most appropriate measure, it considers NOI, Same Store NOI, Same Store Cash NOI, EBITDA, FFO, Core FFO and AFFO, given their wide use by and relevance to investors and analysts, appropriate supplemental performance measures. FFO, reflecting the assumption that real estate asset values rise or fall with market conditions, principally adjusts for the effects of US GAAP depreciation and amortization of real estate assets. Core FFO reflects the same assumptions as FFO except that is also adjusts for the effects of acquisitions costs. NOI provides a measure of rental operations, and does not factor in depreciation and amortization and non-property specific expenses such as general and administrative expenses. EBITDA provides a tool to further evaluate the ability to incur and service debt and to fund dividends and other cash needs. AFFO provides a tool to further evaluate the ability to fund dividends. In addition, NOI, Same Store NOI, Same Store Cash NOI, EBITDA, FFO, Core FFO and AFFO are commonly used in various ratios, pricing multiples, yields and returns and valuation of calculations used to measure financial position, performance and value. |
||||||||||
| As used herein, the Company calculates FFO, as defined by The National Association of Real Estate Investment Trusts (NAREIT), to be equal to net income (loss) applicable to common shareholders, as defined by US GAAP, excluding extraordinary items as defined under US GAAP, gains or losses from sales of previously depreciated real estate assets, impairment charges related to depreciable real estate assets, plus certain non-cash items such as real estate asset depreciation and amortization. FFO includes gains and losses realized on securities investments. | ||||||||||
| Core FFO is calculated as FFO plus acquisition costs. | ||||||||||
| NOI is calculated as recurring property revenues of the Company, less property expenses such as real estate taxes, repairs and maintenance, property management, utilities, insurance and other expenses. | ||||||||||
| Same Store NOI is the NOI of all properties that are owned during the periods presented and excluding any properties purchased during the periods presented. | ||||||||||
| Same Store Cash NOI is the Same Store NOI adjusted to exclude the effects of the straight line rent GAAP adjustment for the properties included in the Same Store NOI calculation. | ||||||||||
| Same Store Occupancy Percentage is the occupancy percentage of the properties included in the Same Store NOI calculation. | ||||||||||
| EBITDA is calculated as NOI, less general and administrative expenses, less NOI from discontinued operations, plus interest and dividend income. | ||||||||||
| AFFO is calculated as EBITDA, minus lease termination income, minus US GAAP interest expense, minus preferred stock dividends, minus recurring capital expenditures and straight-line rents, plus stock option expense. AFFO excludes realized gains (losses) on securities transactions. | ||||||||||
| NOI, Same Store NOI, Same Store Cash NOI, EBITDA, FFO, Core FFO and AFFO do not represent cash generated from operating activities in accordance with US GAAP and are not necessarily indicative of cash available to fund cash needs, including the repayment of principal on debt and payment of dividends and distributions. NOI, Same Store NOI, Same Store Cash NOI, EBITDA, FFO, Core FFO and AFFO should not be considered as substitutes for net income applicable to common shareholders (calculated in accordance with US GAAP) as a measure of results of operations or cash flows (calculated in accordance with US GAAP) as a measure of liquidity. NOI, Same Store NOI, Same Store Cash NOI, EBITDA, FFO, Core FFO and AFFO as currently calculated by the Company may not be comparable to similarly titled, but variously calculated, measures of other REITs. | ||||||||||
Third Quarter FY 2014 Supplemental of Monmouth Real Estate Investment Corp. Page 18 of 21
| 18 |
FOR IMMEDIATE RELEASE August 6, 2014
Contact: Susan Jordan
732-577-9996
MONMOUTH REAL ESTATE INVESTMENT CORPORATION
REPORTS RESULTS FOR THE THIRD QUARTER ENDED JUNE 30, 2014
FREEHOLD, NJ, August 6, 2014........ Monmouth Real Estate Investment Corporation (NYSE:MNR) reported Core Funds from Operations (Core FFO) of $7,771,000 or $0.15 per diluted share for the three months ended June 30, 2014 as compared to $5,682,000 or $0.13 per diluted share for the three months ended June 30, 2013. Excluding gains realized from the sale of securities during the quarter, Core FFO was $6,864,000 or $0.14 per diluted share for the three months ended June 30, 2014, as compared to $4,619,000 or $0.11 per diluted share for the three months ended June 30, 2013. Adjusted Funds from Operations (AFFO), which excludes gains or losses from the sale of securities and excludes lease termination income, were $0.12 per diluted share for the three months ended June 30, 2014 as compared to $0.11 per diluted share for the three months ended June 30, 2013.
A summary of significant financial information for the three and nine months ended June 30, 2014 and 2013 is as follows:
|
Three Months Ended June 30, | ||||
| 2014 | 2013 | |||
| Rental Revenue | $ | 13,384,000 | $ | 11,712,000 |
| Reimbursement Revenue | $ | 2,356,000 | $ | 2,342,000 |
| Lease Termination Income | $ | 1,183,000 | $ | -0- |
| Net Operating Income (NOI) (1) | $ | 12,877,000 | $ | 11,363,000 |
| Total Expenses | $ | 8,811,000 | $ | 7,846,000 |
| Interest and Dividend Income | $ | 942,000 | $ | 844,000 |
| Gain on Sale of Securities Transactions, net | $ | 907,000 | $ | 1,063,000 |
| Income from Continuing Operations | $ | 5,594,000 | $ | 4,185,000 |
| Income (Loss) from Discontinued Operations | $ | -0- | $ | (5,000) |
| Net Income Attributable to Common Shareholders | $ | 3,442,000 | $ | 2,029,000 |
| Net Income Attributable to Common Shareholders Per Diluted Common Share | $ | 0.07 | $ | 0.05 |
| Core FFO (1) | $ | 7,771,000 | $ | 5,682,000 |
| Core FFO per Diluted Common Share (1) | $ | 0.15 | $ | 0.13 |
| AFFO (1) | $ | 5,924,000 | $ | 4,725,000 |
| AFFO per Diluted Common Share (1) | $ | 0.12 | $ | 0.11 |
| Weighted Avg. Diluted Common Shares Outstanding | 50,760,000 | 42,823,000 | ||
|
Nine Months Ended June 30, | ||||
| 2014 | 2013 | |||
| Rental Revenue | $ | 41,039,000 | $ | 34,760,000 |
| Reimbursement Revenue | $ | 6,707,000 | $ | 5,428,000 |
| Lease Termination Income | $ | 1,183,000 | $ | 691,000 |
| Net Operating Income (NOI) (1) | $ | 39,406,000 | $ | 33,721,000 |
| Total Expenses | $ | 25,883,000 | $ | 21,607,000 |
| Interest and Dividend Income | $ | 2,877,000 | $ | 2,972,000 |
| Gain on Sale of Securities Transactions, net | $ | 1,483,000 | $ | 6,976,000 |
| Income from Continuing Operations | $ | 14,641,000 | $ | 17,239,000 |
| Income from Discontinued Operations | $ | -0- | $ | 292,000 |
| Net Income Attributable to Common Shareholders | $ | 8,186,000 | $ | 11,076,000 |
| Net Income Attributable to Common Shareholders Per Diluted Common Share | $ | 0.17 | $ | 0.26 |
| Core FFO (1) | $ | 21,438,000 | $ | 21,940,000 |
| Core FFO per Diluted Common Share (1) | $ | 0.45 | $ | 0.52 |
| AFFO (1) | $ | 19,080,000 | $ | 14,175,000 |
| AFFO per Diluted Common Share (1) | $ | 0.40 | $ | 0.34 |
| Weighted Avg. Diluted Common Shares Outstanding | 47,634,000 | 41,959,000 | ||
Third Quarter FY 2014 Supplemental of Monmouth Real Estate Investment Corp. Page 19 of 21
| 19 |
A summary of significant balance sheet information as of June 30, 2014 and September 30, 2013 is as follows:
| June 30, 2014 | September 30, 2013 | |||
| Net Real Estate Investments | $ | 611,043,000 | $ | 536,799,000 |
| Securities Available for Sale at Fair Value | $ | 60,642,000 | $ | 45,452,000 |
| Total Assets | $ | 739,392,000 | $ | 617,241,000 |
| Mortgage Notes Payable | $ | 279,866,000 | $ | 250,093,000 |
| Loans Payable | $ | 25,200,000 | $ | 22,200,000 |
| Total Shareholders’ Equity | $ | 423,540,000 | $ | 335,915,000 |
Michael P. Landy, President and CEO, commented on the results for the third quarter of fiscal 2014:
“Monmouth continued to make progress over the recent quarter across several fronts:
| · | AFFO per diluted share for the current quarter increased 9% as compared to the prior year quarter and increased 18% for the nine months ended June 30, 2014 as compared to the nine months ended June 30, 2013. |
| · | As of June 30, 2014, the Company’s occupancy rate was 94.3% and our average lease maturity increased to 6.8 years as compared to 6.2 years a year ago. |
| · | On June 26, 2014, we leased our 60,400 square foot building located in Carlstadt, NJ for 10.5 years at an average rate of $8.34 per square foot as compared to $7.61 per square foot that was paid by the prior tenant representing an increase of 10%. This building was vacant since April 1, 2014. |
| · | On May 28, 2014, the Company completed a common equity offering that generated net proceeds of approximately $65.1 million. |
| · | During the quarter, we grew our acquisition pipeline to eleven new Class A build-to-suit industrial properties, representing approximately 3.5 million square feet, for a total purchase price of approximately $255.7 million. In keeping with our business model, these high quality properties are leased primarily to investment grade tenants pursuant to long-term net leases and are strategically situated at major airports, major transportation hubs, and manufacturing plants that are integral to our tenants’ operations. These new properties are expected to generate annualized rental revenue of approximately $17.6 million and will benefit from an average lease term of approximately 11.4 years. Subject to satisfactory due diligence, we anticipate closing these transactions upon completion of construction and occupancy over the next several quarters. |
| · | In addition to our six recently completed building expansions, we entered into agreements to expand five of our properties by approximately 236,000 square feet pursuant to which we will invest a total of approximately $18.7 million. Upon completion, the expansions will result in a new ten year lease extension for each of these properties and will result in increased annual rent of approximately $1.9 million. |
| · | Subsequent to quarter end, on July 18, 2014, we entered into a three year lease agreement with Charlotte Pipe and Foundry Company for our 160,000 square foot building located in Monroe, NC that was previously vacant. Annual rent commenced on August 1, 2014 at a rate of $560,000 or $3.50 per square foot with 2% increases each year. As a result of leasing our building in Monroe, NC, the Company’s occupancy rate as of August 1, 2014 increased to 95.8%. |
Our gross leasable area has increased by 15% to 10.8 million square feet over the prior year period and is expected to grow to over 14.0 million square feet in fiscal 2015 upon the completion of the acquisitions and expansions mentioned above. Our successful leasing activity has resulted in a very strong current occupancy level of 95.8%. Our recent equity offering provides us with the capital to fund our highly accretive acquisition and expansion pipeline. With 86% of our rental revenue derived from investment grade tenants our earnings quality is among the highest in the REIT sector. We look forward to building on the substantial growth that we have achieved to date by adding high quality properties and tenants to our portfolio while enhancing long-term returns for our shareholders.”
Monmouth Real Estate Investment Corporation will host its Third Quarter 2014 Financial Results Webcast and Conference Call. Senior management will discuss the results, current market conditions and future outlook on Thursday, August 7, 2014 at 10:00 a.m. Eastern Time.
The Company’s third quarter 2014 financial results being released herein will be available on the Company’s website at www.mreic.com in the “Financial Filings” section.
To participate in the Webcast, select the microphone icon in the Webcast section of the Company’s homepage on the Company’s website at www.mreic.com. Interested parties can also participate via conference call by calling toll free 888-317-6016 (domestically) or 412-317-6016 (internationally).
Third Quarter FY 2014 Supplemental of Monmouth Real Estate Investment Corp. Page 20 of 21
| 20 |
The replay of the conference call will be available at 12:00 p.m. Eastern Time on Thursday, August 7, 2014. It will be available until November 30, 2014, and can be accessed by dialing toll free 877-344-7529 (domestically) and 412-317-0088 (internationally) and entering the passcode 10047730. A transcript of the call and the webcast replay will be available at the Company’s website, www.mreic.com.
Monmouth Real Estate Investment Corporation, founded in 1968 and one of the oldest public equity REITs in the U.S., specializes in net-leased industrial properties subject to long-term leases primarily to investment grade tenants. The Company is a fully integrated and self-managed real estate company, whose property portfolio consists of eighty-one properties located in twenty-seven states, containing a total of approximately 10.8 million rentable square feet. In addition, the Company owns a portfolio of REIT securities.
Certain statements included in this press release which are not historical facts may be deemed forward-looking statements within the meaning of the Private Securities Litigation Reform Act of 1995. Any such forward-looking statements are based on the Company’s current expectations and involve various risks and uncertainties. Although the Company believes the expectations reflected in any forward-looking statements are based on reasonable assumptions, the Company can provide no assurance those expectations will be achieved. The risks and uncertainties that could cause actual results or events to differ materially from expectations are contained in the Company’s annual report on Form 10-K and described from time to time in the Company’s other filings with the SEC. The Company undertakes no obligation to publicly update or revise any forward-looking statements whether as a result of new information, future events, or otherwise.
Notes:
(1) Non-US GAAP Information: FFO is defined by the National Association of Real Estate Investment Trusts ("NAREIT") as net income applicable to common shareholders, excluding gains or losses from sales of depreciable assets, plus real estate-related depreciation and amortization. We define Core FFO as FFO plus acquisition costs. We define AFFO as Core FFO excluding lease termination income, gains or losses on securities transactions, stock based compensation expense, amortization of deferred financing and deferred leasing costs, recurring capital expenditures and straight-line rent adjustments. We define NOI as recurring rental and reimbursement revenues less real estate and other operating expenses. FFO, Core FFO and AFFO per diluted common share are defined as FFO, Core FFO and AFFO divided by weighted average diluted common shares outstanding. FFO, Core FFO and AFFO per diluted common share, as well as NOI, should be considered as supplemental measures of operating performance used by real estate investment trusts (REITs). FFO, Core FFO and AFFO per diluted common share exclude historical cost depreciation as an expense and may facilitate the comparison of REITs which have different cost basis. The items excluded from FFO, Core FFO and AFFO per diluted common share are significant components in understanding the Company’s financial performance.
FFO, Core FFO and AFFO per diluted common share (A) do not represent cash flow from operations as defined by accounting principles generally accepted in the United States of America; (B) should not be considered as an alternative to net income as a measure of operating performance or to cash flows from operating, investing and financing activities; and (C) are not alternatives to cash flow as a measure of liquidity. FFO, Core FFO and AFFO per diluted common share, as well as NOI, as calculated by the Company, may not be comparable to similarly titled measures reported by other REITs.
The Company’s FFO and Core FFO for the three and nine months ended June 30, 2014 and 2013 are calculated as follows:
| Three Months Ended | Nine Months Ended | ||||||
| 06/30/2014 | 06/30/2013 | 06/30/2014 | 06/30/2013 | ||||
| Net Income Attributable to Common Shareholders | $3,442,000 | $2,029,000 | $8,186,000 | $11,076,000 | |||
| Depreciation Expense (including Discontinued Operations) | 3,991,000 | 3,194,000 | 11,779,000 | 9,596,000 | |||
| Amortization of Intangible Assets | 338,000 | 385,000 | 1,010,000 | 1,154,000 | |||
| Gain on Sale of Investment Property | -0- | -0- | -0- | (346,000) | |||
| FFO Attributable to Common Shareholders | 7,771,000 | 5,608,000 | 20,975,000 | 21,480,000 | |||
| Acquisition Costs | -0- | 74,000 | 463,000 | 460,000 | |||
| Core FFO Attributable to Common Shareholders | $7,771,000 | $5,682,000 | $21,438,000 | $21,940,000 | |||
The Company’s Core FFO, excluding the net Gain on Securities Transactions for the three and nine months ended June 30, 2014 and 2013 are calculated as follows:
| Three Months Ended | Nine Months Ended | ||||||
| 06/30/2014 | 06/30/2013 | 06/30/2014 | 06/30/2013 | ||||
| Core FFO Attributable to Common Shareholders | $7,771,000 | $5,682,000 | $21,438,000 | $21,940,000 | |||
| Less: Gain on Sale of Securities Transactions, net | 907,000 | 1,063,000 | 1,483,000 | 6,976,000 | |||
|
Core FFO, excluding net Gain on Sale of Securities Transactions Attributable to Common Shareholders |
$6,864,000 | $4,619,000 | $19,955,000 | $14,964,000 | |||
The following are the Cash Flows provided (used) by Operating, Investing and Financing Activities for the nine months ended June 30, 2014 and 2013:
| Nine Months Ended | |||
| 06/30/2014 | 06/30/2013 | ||
| Operating Activities | $28,869,000 | $17,197,000 | |
| Investing Activities | (101,136,000) | (41,059,000) | |
| Financing Activities | 102,578,000 | 12,341,000 | |
# # # # #
Third Quarter FY 2014 Supplemental of Monmouth Real Estate Investment Corp. Page 21 of 21
| 21 |